SECURITIES AND EXCHANGE COMMISSION
Washington, D.C. 20549
FORM 6-K
Report of Foreign Private Issuer
Pursuant to Rule 13a-16 or 15d-16 of the
Securities Exchange Act of 1934
For the month of May 2008
CREDICORP LTD.
(Exact name of registrant as specified in its charter)
Clarendon House
Church Street
Hamilton HM 11 Bermuda
(Address of principal executive office)
Indicate by check mark whether the registrant files or will file annual reports under cover Form 20-F or Form 40-F.
Form 20-F x Form 40-F o
Indicate by check mark whether the registrant by furnishing the information contained in this Form is also thereby furnishing the information to the Commission pursuant to Rule 12g3-2(b) under the Securities Exchange Act of 1934.
Yes o No x
 | ||||
CREDICORP Ltd. Reports First Quarter 2008 Earnings Lima, Peru, May 7, 2008 - Credicorp (NYSE:BAP) announced today its unaudited results for the first quarter of 2008. These results are reported on a consolidated basis in accordance with IFRS in nominal U.S. Dollars. HIGHLIGHTS | ||||
| · | Following a period of strong currency volatility and BCR intervention, Credicorp reported an extraordinary increase of its net income of 89% QoQ and 125% YoY, totaling unprecedented net earnings for the quarter of US$ 178 million. | |||
| · | Such unexpectedly high income includes a significant currency translation gain of US$ 68.7 million which resulted from the accelerated appreciation of the local currency vs. the US Dollar during this 1Q08 combined with a controlled management of Credicorp’s Soles/Dollar positions geared to take advantage of such currency volatility. | |||
| · | Even excluding such translation gain, Credicorp’s results show 43% QoQ earnings growth to US$ 109 million, reflecting the continuing strong growth and income generation of Credicorp’s core businesses. | |||
| · | Loan growth reported by its banking business continued strong, though somewhat inflated by the revaluation of its Soles denominated loans (32% of the loan book), revealing an 8.1% QoQ loan portfolio growth. | |||
| · | Interest income followed this trend with a robust 9.9% QoQ growth. | |||
| · | NIM however, drops slightly from 5.2% to 5.1% and reflects herewith a continued stronger growth of our corporate -thus tighter in margins- dollar loan portfolio on the back of strong investment activity; higher funding costs after the BCR’s intervention to control inflation and currency volatility; and a significantly increased investment portfolio which is very attractive given the tax advantages it generates, but contributes only with tighter nominal margins to NIM calculation. | |||
| · | Non financial income grows a strong 24.6% QoQ, though it includes also a significant extraordinary income from the sale of the group’s VISA shares of close to US$ 13 million on an after tax basis. Still, fee income grows a robust 12.4% QoQ and 34% YoY, revealing the increasing transactional income generation. | |||
| · | Loan portfolio quality continues strong, reaching a PDL/Loans ratio of only 0.8%. Net provisioning increased however 62.7% QoQ to US$ 16.1 million as a result of a change towards a more conservative provisioning policy for our retail portfolio. | |||
| · | BCP’s consolidated numbers reflect a very healthy and dynamic banking environment with core revenues up 7.3% QoQ and 37.8% for the year. Such improved income combined with less than projected operating expenses and the important positive translation effect mentioned above, led to a completely extraordinary 92.3% QoQ higher net income for BCP for 1Q08 which reached US$ 165.8 million, and translates into a contribution to Credicorp of US$ 161.4 million for this 1Q08. | |||
| · | BCP Bolivia, which is consolidated in BCP, continues its consistent growth and reports a contribution 4% higher QoQ and 118% higher YoY, reaching US$ 10.5 million for 1Q08. | |||
| · | ASHC remains a stable and growing business in line with the increasing wealth in the country and reports a contribution improvement of 14% QoQ at US$ 5.7 million. | |||
| · | PPS, though still troubled by its property and casualty business, reports this quarter recovered contribution to Credicorp of US$ 2.34 million, helped by its financial management which generated also an important translation gain. | |||
| · | Finally, Prima AFP reports a significantly higher contribution of US$ 9 million following expected improved business results, but also an extraordinary income from the treatment of deferred tax liabilities which led to the recognition of US$ 2.3 million earnings from previous periods in this 1Q08. | |||
I. Credicorp Ltd.
Overview
Following a period of strong currency volatility (8.41% revaluation of the Sol) and BCR intervention (interest rate and reserve requirement changes), Credicorp reported an extraordinary increase of its net income of 89% QoQ and 125% YoY, totaling unprecedented net earnings for the quarter of US$ 178 million, and resulting in an improved ROAE of 40% for the quarter.
Such unexpectedly high income includes a significant currency translation gain of US$ 68.7 million which resulted from the accelerated appreciation of the local currency vs. the US Dollar during this 1Q08. Such currency fluctuation generated a gain through the impact on the net Soles position on our books (i.e. appreciation of the Soles loan book which represents 32% of the portfolio, and investment portfolio vs. soles denominated liabilities). However, a significant portion of such gain was also generated by the management of such positions at BCP and the different subsidiaries, where our US Dollar position was intentionally diminished in light of the US Dollar devaluation expectations, generating additional translation gains in our IFRS US Dollar accounting. Thus, significantly different results were reported in local currency accounting, where the devaluation of the dollar generated a loss instead. In both cases, the calculated management of the currency position either increased gains or minimized losses. Nevertheless, we should keep in mind the volatile source and nature of these gains, which can be equally reverted with changing market conditions given such a highly volatile moment.
Thus, when excluding such translation gain, Credicorp’s results show 43% QoQ earnings growth, with earnings after minorities for the quarter of US$ 109.3 million, a number closer to our optimistic projections, and thus reflecting the continuing strong growth and income generation of Credicorp’s businesses. However, such 1Q08 income also includes an additional one-off gain generated by the VISA shares IPO which resulted in a bottom line after tax addition of around US$ 13 million.
Aside from these one-off’s, Credicorp’s core banking business reported a strong performance, with total loan growth this last quarter reaching 8.1% QoQ. Though slightly overstated by the revaluation of the Soles loan portfolio, loan growth was fueled, not only by the already expected strong retail segment, but also a continuing strong investment activity which led to high quarterly growth of the corporate US Dollar loan book.
Credicorp Ltd. | Quarter | Change % | ||||||||||||||
| US$ thousands | 1Q08 | 4Q07 | 1Q07 | 1Q08/1Q07 | 1Q08/4Q07 | |||||||||||
| Net interest income | 192,090 | 174,756 | 138,859 | 38.3 | % | 9.9 | % | |||||||||
| Total provisions, net of recoveries | (16,148 | ) | (9,926 | ) | (4,418 | ) | 265.5 | % | 62.7 | % | ||||||
| Non financial income | 152,048 | 122,043 | 111,194 | 36.7 | % | 24.6 | % | |||||||||
| Insurance premiums and claims | 12,298 | 12,222 | 17,363 | -29.2 | % | 0.6 | % | |||||||||
| Operating expenses | (185,532 | ) | (193,327 | ) | (149,810 | ) | 23.8 | % | -4.0 | % | ||||||
Net income before working profit sharing & IT | 154,757 | 105,768 | 113,188 | 36.7 | % | 46.3 | % | |||||||||
| Worker's profit sharing and income taxes | (38,726 | ) | (24,606 | ) | (27,924 | ) | 38.7 | % | 57.4 | % | ||||||
Net income before minority interest &translation result | 116,031 | 81,163 | 85,264 | 36.1 | % | 43.0 | % | |||||||||
| Minority interest | (6,728 | ) | (4,590 | ) | (7,897 | ) | -14.8 | % | 46.6 | % | ||||||
Net income before translation result | 109,303 | 76,573 | 77,368 | 41.3 | % | 42.7 | % | |||||||||
| Translation results | 68,695 | 17,442 | 1,645 | 4075.4 | % | 293.8 | % | |||||||||
Net income attributed to Credicorp | 177,998 | 94,016 | 79,013 | 125.3 | % | 89.3 | % | |||||||||
| Net income/share (US$) | 2.23 | 1.18 | 0.99 | 125.3 | % | 89.3 | % | |||||||||
Total loans | 8,919,841 | 8,250,819 | 6,239,870 | 42.9 | % | 8.1 | % | |||||||||
Deposits and Obligations | 12,929,288 | 11,401,275 | 9,336,519 | 38.5 | % | 13.4 | % | |||||||||
Net Shareholders' Equity | 1,850,680 | 1,676,009 | 1,420,716 | 30.3 | % | 10.4 | % | |||||||||
| Net interest margin | 5.1 | % | 5.2 | % | 5.2 | % | ||||||||||
| Efficiency ratio | 40.2 | % | 46.2 | % | 42.5 | % | ||||||||||
| Return on average shareholders' equity | 40.4 | % | 22.9 | % | 23.5 | % | ||||||||||
| PDL/Total loans | 0.8 | % | 0.7 | % | 1.2 | % | ||||||||||
| Coverage ratio of PDLs | 310.0 | % | 343.7 | % | 251.4 | % | ||||||||||
| Employees | 17,348 | 16,160 | 14,757 | |||||||||||||
NII followed this robust loan growth and reached 9.9% QoQ despite the persistent competition and pressure on rates.
Net interest margin however, drops slightly from 5.2% to 5.1% and reflects herewith (1) a continued stronger growth of our corporate -thus tighter in margins- dollar loan portfolio on the back of strong investment activity, (2) higher funding costs after the BCR’s intervention to control inflation and currency volatility, and (3) a significantly increased investment portfolio of BCR CD’s which became very attractive given their tax advantages, but contributed only tighter nominal margins to this calculation. These developments had an impact not only on our loan book mix, but on our interest earning assets mix, which have developed differently than projected but according to the market opportunities, leading to the extraordinary earnings results reported.
Non Financial income reported 24.6% QoQ growth. However, this number includes the above mentioned significant gain in the sale of Credicorp’s VISA shares (within the Visa IPO) of about US$ 18 million before tax. Nevertheless, a strong fee income growth of 12.4% QoQ reveals further increases in bank transactional activity and fee expansion at the pension fund business.
Though the insurance business reports a good quarterly net premiums growth of 9%, claims in the property and casualty sector remain high this quarter due to the “El Niño” weather phenomenon, which though mild, is however affecting the northern areas of the country with torrential rains. Thus, operating income remained flat and was mainly generated by the more profitable life and health insurance businesses. Furthermore, a timely financial management of its currency positions also contributed some additional currency translation gains helping the overall bottom line and contribution to Credicorp.
On the cost side, total operating costs were down by 4% QoQ resulting in an improved efficiency ratio of 40.2% vs. 46.2% the previous quarter, contrary to expectations. Such development is a reflection of the seasonality in costs, since in 4Q07 these had a significant year-end related increase and thus set a high comparison base for this quarter. Furthermore, projected expense levels for this quarter were not reached due to an expansion process which is not as linear as were projections; and despite the negative (inflating) effect of Soles denominated costs in our US Dollar accounting following the significant revaluation of the Sol. Thus, the YoY growth of 23.8% appears moderate in light of the expansion being experienced by the loan book and income sides of the equation. Having said this, we would like to point out that the expansion plans do continue full speed ahead and are a core part of Credicorp’s business strategy.
2
Another positive development is the continuing strength of portfolio quality, which remains healthy with a PDL/Loans ratio of only 0.8% this 1Q08. Total provisions net of recoveries of US$ 16.1 million (up 62.7%) however, reveal an increase in provisions at BCP in line with loan growth and with a more conservative provisioning policy for our retail portfolio, increasing the internal minimum provisioning requirements in line with a more sophisticated risk assessment methodology. This decision was taken based on a conservative prudent approach and does not follow any deterioration of portfolio quality indicators, which to date remain very healthy.
These developments resulted in improved ratios for the quarter, with ROAE climbing to 40.4% from 22.9% the previous quarter.
Credicorp - the Sum of its Parts
Going through a period of significant volatility can impact results in many different ways. Therefore, we are very pleased to have managed the strong currency volatility of the 1Q08 in favor of Credicorp’s results. It took a series of timely financial decisions regarding our currency positions and investments in the different subsidiaries that led to the strong financial gains related to the currency translation. However, these are the result of the high currency and interest rates volatility and can quickly change according to market conditions.
In fact, BCP reported extraordinarily high income contribution this 1Q08 of US$ 161.4 million, which included an approximate US$ 57 million translation gain, though revealing at the same time significant core business expansion even excluding such translation income and other one-off contributions, confirming this way its expanding earnings generation capacity.
Such income reflected an obviously one time high 57% ROAE for the quarter.
| (US$ Thousands) | 1Q08 | 4Q07 | 1Q07 | 1Q08/1Q07 | 1Q08/4Q07 | 1Q08 | 1Q07 | 1Q08/1Q07 | |||||||||||||||||
| Banco de Crédito BCP(1) | 161,353 | 83,869 | 70,649 | 128 | % | 92 | % | 161,353 | 70,649 | 128 | % | ||||||||||||||
| BCB | 10,476 | 10,065 | 4,804 | 118 | % | 4 | % | 10,476 | 4,804 | 118 | % | ||||||||||||||
| Atlantic | 5,673 | 4,988 | 4,969 | 14 | % | 14 | % | 5,673 | 4,969 | 14 | % | ||||||||||||||
| PPS | 2,342 | 645 | 6,616 | -65 | % | 263 | % | 2,342 | 6,616 | -65 | % | ||||||||||||||
| Grupo Crédito (2) | 9,807 | 3,242 | 1,202 | 716 | % | 202 | % | 9,807 | 1,202 | 716 | % | ||||||||||||||
| Prima | 9,015 | 2,307 | 178 | 4972 | % | 291 | % | 9,015 | 178 | 4972 | % | ||||||||||||||
| Others | 792 | 935 | 1,024 | -23 | % | -15 | % | 792 | 1,024 | -23 | % | ||||||||||||||
| Credicorp and Others (3) | (1,178 | ) | 1,272 | (4,422 | ) | -73 | % | -193 | % | (1,178 | ) | (4,422 | ) | -73 | % | ||||||||||
| Credicorp Ltd. | (1,724 | ) | 787 | (4,678 | ) | -63 | % | -319 | % | (1,724 | ) | (4,678 | ) | -63 | % | ||||||||||
| Otras | 546 | 485 | 256 | 1.13 | 13 | % | 546 | 256 | 113 | % | |||||||||||||||
Net income attributable to Credicorp | 177,998 | 94,016 | 79,013 | 125 | % | 89 | % | 177,998 | 79,013 | 125 | % | ||||||||||||||
| (1) Includes Banco de Crédito de Bolivia. | ||||||||
| (2) Includes Grupo Crédito, Servicorp and Prima AFP | ||||||||
| (3) Includes taxes on BCP's and PPS's dividends, and other expenses at the holding company level. |
BCP Bolivia, which is consolidated within BCP, reported a contribution of US$ 10.5 million for 1Q08, maintaining its high level despite a significant stagnation of investment activity in the country, which will eventually generate a notorious slowdown.
3
ASHC reports a contribution improvement of 14% QoQ reaching US$ 5.7 million for the 1Q08. ASHC’s business is constantly expanding as a result also of the increasing wealth generation in the country, and represents a stable, no-risk investment, for which its ROEA of 16.2% is more than satisfactory.
As explained before, though the insurance business reports a good quarterly net premiums growth of 9%, claims in the property and casualty sector remain high this quarter due to the mild Niño affecting the northern areas of the country with torrential rains. Thus, with the Life and Health businesses doing very well and offering good returns, turning the P&C business into a profitable operation continues being PPS’s main focus, though it is proving to be troublesome. Following this objective, significant efforts are being made to develop the more massive and better predictable retail business and limit exposure to the wholesale insurance P&C business, as well as to improve the financial investment management to achieve better returns overall. This process will take more time than expected. Nevertheless, such positive financial management results which benefited also from translation gains, contributed to improve PPS’s bottom line results despite the casualties of the P&C sector, leading to a US$ 2.34 million contribution to Credicorp, which represented a ROAE of about 11.2%.
Finally, Prima’s business results were better than expected with total quarterly earnings of US$ 9 million. This improved results followed a change in treatments of deferred tax liabilities which had been generating overstated deferred liabilities and consequently understated income, leading to US$ 2.3 million income recognition from periods prior to December 2007, in this 1Q08. Thus, this totally unexpected high earnings contribution to Credicorp represented a ROAE of over 27%, which is certainly not sustainable at such high level given the one-off income recognition from previous periods. Nevertheless, Prima’s business results are better than expected following the cost reduction efforts of last year and business plan. Prima has established a dominant position in the market, capturing important market shares (31.4% of AuM, 33.7% of collections and 47.2% of voluntary contributions to the funds).
II. Banco de Crédito - BCP Consolidated
Overview 1Q08
The earnings evolution seen at Credicorp stems mainly from BCP’s performance which reveals extraordinary and historically unprecedented net earnings for the 1Q08 of US$ 165.8 million. This earnings number includes US$ 57 million of translation gains which resulted, as explained before when discussing Credicorp, from the high currency volatility and careful management of BCP’s US Dollar/Soles positions when reporting under IFRS US Dollar accounting. It is therefore important to keep the volatile source and nature of this income in mind. Excluding this extraordinary income, net earnings for 1Q08 was US$ 108.5 million, still a very strong 53% earnings growth QoQ.
Another boost to BCP earnings results for the quarter was the sale of Visa Inc. shares, which generated additional pre-tax extraordinary income of US$ 17.8 million on a consolidated basis with BCP Bolivia.
4
Core Earnings
Core Revenues | Quarter | Change | ||||||||||||||
US$ 000 | 1Q08 | 4Q07 | 1Q07 | 1Q08/1Q07 | 1Q08/4Q07 | |||||||||||
| Net interest and dividend income | 172,611 | 155,565 | 123,289 | 40.0 | % | 11.0 | % | |||||||||
| Fee income, net | 79,747 | 76,708 | 62,470 | 27.7 | % | 4.0 | % | |||||||||
| Net gain on foreign exchange transactions | 19,971 | 21,497 | 11,937 | 67.3 | % | -7.1 | % | |||||||||
Core Revenues | 272,329 | 253,770 | 197,696 | 37.8 | % | 7.3 | % | |||||||||
Nevertheless, BCP’s business performance, excluding such significant extraordinary and non recurrent income remains as strong as in the previous quarters. In fact, net interest income increased 11% QoQ following a robust loan book growth of 7.5% when looking at quarter end book balances. Fee income also followed the trend of previous quarters showing a 4% quarterly growth, compensating a drop in FX-transaction and resulting in Core Earnings growth of 7.3%. While on the cost side, operating costs dropped 8.9% despite the inflating effect of our Soles costs due to the revaluation in US Dollar accounting for two reasons: (1) the seasonality reflected by the year-end related expense hike of the last 4Q07 which set a high comparison base, and (2) the evolution of BCP’s expansion costs, which are in reality not as linear as projections. Furthermore, such strong income generation also allowed for 53% higher provisions as our provisioning policy was revised and higher provisioning levels set for our growing retail business.
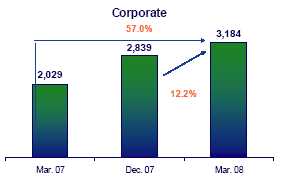
Looking at total loan growth measured by the average daily balances for the quarter (and including the effect of the local currency revaluation which inflates US Dollar results slightly for our local currency book which amounts to 32% of our portfolio) reached a strong 9.8% QoQ growth. But even excluding the revaluation effect, such growth would still be strong at about 8% for the quarter. Contrary to expectations, however, the strongest growing sector contributing to such high 9.8% quarterly loan growth was again this 1Q08 the corporate business fueled by the impressively strong longer term investment activity. Such corporate business reported a 12.2% QoQ loan growth in average balances (approx. 10.5% clean of the revaluation effect), while the retail sector, our typically most dynamic sector reached 11.1% QoQ growth (or 8.5% clean of revaluation effect), with SME, consumer and credit card loans maintaining their strong growth in that order.
But net interest income growth was a result not only of such loan portfolio evolution, but also a very strong increase in the volume of BCP’s investment portfolio, which was up by 45.9% QoQ. Such growth was to an important extent a result of the revaluation in our US Dollar reporting of our mainly Soles denominated investment portfolio, though aslo fueled by the strong inflow of US Dollar into the system lured by the large speculative earnings opportunities offered by investments in Soles through the revaluation of the Soles and interest rate differentials generated by the BCR’s monetary policy. The soles liquidity generated this way in the local financial system was again captured by BCR CD’s, resulting in very attractive investment for financial institutions given their tax shelter. This evolution and revaluation generated a recomposition of our interest earning assets with investment with lower nominal returns (though higher real returns through tax advantages) reporting a greater expansion than our loan portfolio. This impacted our net interest margin (NIM), as did as well our stronger growth of our corporate and less profitable portfolio vis-à-vis our retail book. The result was a contraction of NIM from 5.2% in 4Q07 to 5.1% in 1Q08. Furthermore, the evolution of the funding side contributed to the contraction in NIM, since interest rates on deposits in general increased and the higher reserve requirements and lower remuneration of these impacted our funding cost.
Though slightly higher as of the end of the 1Q08, PDL/ total loans continues at an extremely healthy level of 0.79%, showing no identifiable real signs of any deterioration. Coverage remains strong at 313.2% (though down from 351%).
5
Banco de Crédito and Subsidiaries | Quarter | Change | ||||||||||||||
| US$ 000 | 1Q08 | 4Q07 | 1Q07 | 1Q08/1Q07 | 1Q08/4Q07 | |||||||||||
| Net Financial income | 172,611 | 155,565 | 123,289 | 40.0 | % | 11.0 | % | |||||||||
| Total provisions, net of recoveries | (16,951 | ) | (11,089 | ) | (5,859 | ) | 189.3 | % | 52.9 | % | ||||||
| Non financial income | 124,563 | 103,458 | 86,255 | 44.4 | % | 20.4 | % | |||||||||
| Operating expenses | (138,335 | ) | (151,867 | ) | (108,218 | ) | 27.8 | % | -8.9 | % | ||||||
Net income before Workers' profit sharing and IT | 141,888 | 96,068 | 95,467 | 48.6 | % | 47.7 | % | |||||||||
| Worker's profit sharing and income taxes | (33,365 | ) | (25,123 | ) | (24,121 | ) | 38.3 | % | 32.8 | % | ||||||
Net income before translation result | 108,523 | 70,945 | 71,346 | 52.1 | % | 53.0 | % | |||||||||
| Tranlation results | 57,249 | 15,253 | 1,310 | 4270.2 | % | 275.3 | % | |||||||||
Net income | 165,773 | 86,198 | 72,657 | 128.2 | % | 92.3 | % | |||||||||
| Net income/ share (US$) | 0.129 | 0.067 | 0.057 | 128.1 | % | 92.4 | % | |||||||||
| Total loans | 8,837,689 | 8,224,613 | 6,182,300 | 43.0 | % | 7.5 | % | |||||||||
| Deposits and obligations | 12,938,927 | 11,249,104 | 8,842,654 | 46.3 | % | 15.0 | % | |||||||||
| Shareholders equity | 1,195,587 | 1,132,564 | 881,485 | 35.6 | % | 5.6 | % | |||||||||
| Net financial margin | 5.1 | % | 5.2 | % | 5.2 | % | ||||||||||
| Efficiency ratio | 47.5 | % | 56.9 | % | 49.8 | % | ||||||||||
| Return on average equity | 57.0 | % | 31.7 | % | 31.5 | % | ||||||||||
| PDL/ Total loans | 0.8 | % | 0.7 | % | 1.2 | % | ||||||||||
| Coverage ratio of PDLs | 313.2 | % | 351.8 | % | 252.1 | % | ||||||||||
| Branches | 277 | 273 | 245 | |||||||||||||
| ATMs | 778 | 748 | 691 | |||||||||||||
| Employees | 13,540 | 12,667 | 10,934 | |||||||||||||
Net provisions increased 53% to US$ 16.9 million in 1Q08. This is the result of higher gross provisions due to a more conservative provisioning policy implemented this year, increasing the provision requirements for the retail business. Thus, gross provisions reached US$ 25.9 million, while recoveries were still strong at US$ 8.9 million. The latter includes the recoveries related to a very old problem loan which was finally settled.
The 4.0% fee income growth stems from higher account maintenance fees, transactional fees, credit card fees and operational charges. Though higher fee income was reported, a drop in the average number of monthly transactions from 33.3 million to 32.3 million QoQ is explained by the seasonal all-year high recorded every 4Q of the year due to the holiday season.
FX-transactions gains were 7.1% lower QoQ, mainly because of the high transactional level of the year end in 2007 which set a high base of comparison and despite the currency fluctuation this 1Q08.
Gains on the sale of securities, on the other hand, reported a jump from US$2.7 million in 4Q07 to US$22.7 million. The Visa Inc. IPO explains completely this jump since it resulted in gains for BCP and BCP Bolivia, which reached US$17.9 million.
On the cost side, operating costs dropped 8.9% despite the inflating effect of our Soles denominated costs due to the revaluation in US Dollar accounting for two reasons: (1) the seasonality reflected by the year-end related expense hike of the last 4Q07 which set a high comparison base, and (2) the evolution of BCP’s expansion costs, which are in reality not as linear as projections. Thus, personnel costs and administrative costs dropped 6.1% and 18.1% respectively in the 1Q08, despite, as said before, the revaluation effect of the soles denominated costs.
Finally, as indicated at the beginning, translation results were significantly higher this quarter given the strong revaluation of the Nuevo Sol vis-a-vis the US Dollar which went from S/.2.996 in December 2007 to S/.2.744 by the end of March 2008, i.e. a devaluation of the US Dollar of 8.41%. Furthermore, such devaluation expectations fueled by the monetary policy of the BCR which increased the Soles interest rates and the speculative trade opportunities generated by this evolution, which also attracted significant foreign capital, led to a change in BCP’s decisions related to its US Dollar / Soles positions. Thus, BCP intentionally reduced its US Dollar position significantly, generating an even large gain in US Dollar NIIF accounting.
Month | US$ Averag. net asset position | Nuevos Soles Averag. net asset | Exchange rate | Monthly devaluation | Calculated translation | Translation registered on P&L | |||||||||||||
| Jan-08 | 245,207 | 529,751 | 2.934 | -2.1 | % | 11,194 | 8,145 | ||||||||||||
| Feb-08 | 187,982 | 625,179 | 2.886 | -1.6 | % | 10,398 | 11,055 | ||||||||||||
| Mar-08 | 137,347 | 725,057 | 2.744 | -4.9 | % | 37,521 | 38,049 | ||||||||||||
Translation 1Q08 | 59,114 | 57,249 | |||||||||||||||||
As a consequence of all the above, quarterly ratios for BCP are extremely good at: 47.5% efficiency ratio explained by the lower operating costs reported while income increased, 0.8% PDL/Total loans reflecting excellent portfolio quality with a 313.2% coverage ratio, and an unusual ROAE of 57.0% which includes the translation gains.
6
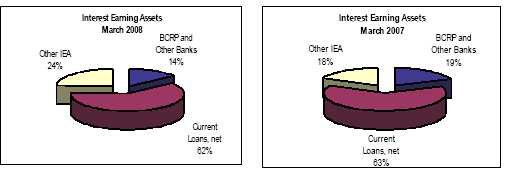
II.1 Interest Earning Assets
Market evolution leads to a change in interest earning assets mix with BCP’s investment portfolio driving growth.
Interest Earning Assets | Quarter | Change | ||||||||||||||
| US$ 000 | 1Q08 | 4Q07 | 1Q07 | 1Q08/1Q07 | 1Q08/4Q07 | |||||||||||
| BCRP and Other Banks | 2,077,660 | 2,255,572 | 1,828,663 | 13.6 | % | -7.9 | % | |||||||||
| Interbank funds | 1,469 | 5,000 | 4,542 | -67.7 | % | -70.6 | % | |||||||||
| Trading Securities | 38,538 | 102,316 | 54,505 | -29.3 | % | -62.3 | % | |||||||||
| Available For Sale Securities | 3,449,781 | 2,364,084 | 1,641,157 | 110.2 | % | 45.9 | % | |||||||||
| Current Loans, net | 8,767,674 | 8,164,334 | 6,109,064 | 43.5 | % | 7.4 | % | |||||||||
Total interest earning assets | 14,335,123 | 12,891,306 | 9,637,930 | 48.7 | % | 11.2 | % | |||||||||
Growth of IEA this first quarter of 2008 reflects an unexpected market evolution resulting from the combination of the BCR monetary policy to control inflation through an increase of the Soles reference rates, the weakness of the US Dollar, the speculative strong inflow of funds into the Peruvian financial system to benefit from such market opportunity and the intervention of the Central Bank in the FX market to control the fall of the US Dollar exchange rate. The result of these forces result in large soles deposits in the system which excess after loan growth was channeled to CB CD’s which provide a very attractive after tax yield (given their tax shelter). Thus, BCP experienced a strong asset expansion of 11.2% as a result of this evolution, but also to a large extent as a result of the revaluation in US Dollar reporting of its already large Soles denominated investment portfolio. Thus, the significant increase of its investment portfolio of over US$1.1 billion, while its net loan growth for the quarter reached about US$600 million resulted in a charge of its interest earnings asset mix.
Loan Portfolio
Loan portfolio continues its expanding trend reaching total net loans of US$ 8,768 million as of the end of the March 2008, revealing a 7.4% QoQ and 43.5% YoY growth. Measured by average daily balances for each quarter, which give a better reflection of reality, similar growth rates are reported reaching 9.8% QoQ and 45.2% YoY. This growth numbers, however, do conceal the revaluation impact on the local currency portfolio, which represents a significant 32% of total loan portfolio. We have calculated an approximate “clean” growth number to estimate the potential distortion generated by such currency fluctuations and reached an approximate 8% QoQ growth of average daily balances for the total portfolio, still a robust quarterly growth.
What is however an unexpected evolution, is the continuation of a very strong investment activity in the corporate market which has turned this sector in the fastest growing for the second consecutive quarter, reaching 12.2% QoQ growth (measuring average balances). The growth within the corporate sector reveals some interesting features: US Dollar loans grew stronger than Soles denominated loans which actually stagnated during this first quarter, a relatively logical evolution given the currency and interest rates development. Further, longer term loans grew significantly more than short term loans, giving again a clear indication of the investment activity in the back of this growth. Though this is certainly good news, given the large volumes involved (US$ 3.2 billion portfolio) in the corporate sector, it impacts our loan mix contrary to our expectations and designed strategy to grow the retail segment more, and thus our strategy to protect our NIM. On the other hand, we are certainly reinforcing our dominant position in this market which allows BCP to capture and/or participate in almost every important investment and has resulted in a further consolidation of its market dominance despite the presence of aggressive international players.
7
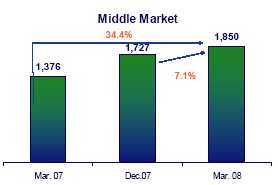
The Middle Market portfolio (US$ 1,8 billion), though last in the growth ranking after the corporate and retail sectors, still reached good quarterly growth numbers at 7.1% QoQ growth.
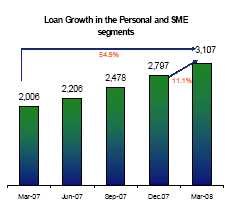
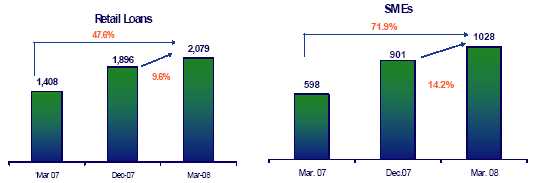
Though the corporate sector outperformed all other again this 1Q08, the retail sector continues being the strong performer on a consistent way. Thus, its portfolio reached US$ 3.1 billion in average monthly balances, reporting consistently outstanding quarterly growth of 11.1% this quarter vs. 12.9% the previous quarter. Star performers within the retail segment continue being Consumer loans and SME lending, which reported 14.4% and 14.2% QoQ growth respectively, while Credit Card loans increased by 11.9% QoQ. Mortgages reported the lowest growth rates within the retail segment, but were still extremely good at 7% QoQ growth.
8
Given the distortion generated by the currency fluctuations and the fact that BCP’s loan portfolio is in both currencies but reported in US Dollars, it is helpful to look at the evolution of the different loan portfolios by currency to see the real growth in each portfolio. The following chart intends to shed some light over such loan growth analysis…
Domestic Currency Loans | Foreign Currency Loans | ||||||||||||||||||||||||||||||
(Nuevos Soles million) | (US$ million) | ||||||||||||||||||||||||||||||
| 1Q07 | 4Q07 | 1Q08 | YoY | QoQ | 1Q07 | 4Q07 | 1Q08 | YoY | QoQ | ||||||||||||||||||||||
| Corporate | 2,059.2 | 2,506.5 | 2,783.7 | 35.2 | % | 11.1 | % | 1,383.4 | 2,002.7 | 2,208.8 | 59.7 | % | 10.3 | % | |||||||||||||||||
| Middle Market | 694.4 | 861.4 | 946.6 | 36.3 | % | 9.9 | % | 1,158.4 | 1,439.5 | 1,518.1 | 31.0 | % | 5.5 | % | |||||||||||||||||
| Retail | 2,218.7 | 3,555.6 | 4,015.6 | 81.0 | % | 12.9 | % | 1,310.3 | 1,610.6 | 1,697.7 | 29.6 | % | 5.4 | % | |||||||||||||||||
SME | 935.0 | 1,270.9 | 1,393.8 | 49.1 | % | 9.7 | % | 304.9 | 476.7 | 539.2 | 76.9 | % | 13.1 | % | |||||||||||||||||
Mortgages | 320.5 | 735.5 | 891.9 | 178.3 | % | 21.3 | % | 792.7 | 866.5 | 876.7 | 10.6 | % | 1.2 | % | |||||||||||||||||
Consumer | 310.4 | 722.3 | 836.7 | 169.5 | % | 15.8 | % | 169.9 | 212.6 | 225.1 | 32.5 | % | 5.9 | % | |||||||||||||||||
Credit Cards | 652.8 | 826.9 | 893.3 | 36.8 | % | 8.0 | % | 42.8 | 54.8 | 56.8 | 32.8 | % | 3.7 | % | |||||||||||||||||
| Consolidated total | 4,993.0 | 6,950.2 | 7,764.2 | 55.5 | % | 11.7 | % | 4,441.9 | 5,625.5 | 5,997.1 | 35.0 | % | 6.6 | % | |||||||||||||||||
* Includes work out unit, other banking and BCP Bolivia | |||||||||||
*Average daily balances for the quarter |
… revealing the following:
| · | The corporate sector grows a strong 10.3% its USD portfolio which represents 60% of its total portfolio. The reported 11.1% growth of its Soles portfolio hides minimal growth in the 1Q08, and a very strong growth of its Soles portfolio within the 4Q07, which when comparing averages led to such number. |
| · | The middle market segment, which has 82% of its portfolio in USD, reports a moderate 5.5% growth of its loan book, which is in line with projections. |
| · | The retail segment in turn, has half its portfolio in each currency and shows a stronger growth in its Soles loan book of 12.9%, while its USD loan book grows at a more moderate 5.4%. |
9
Market Share
BCP’s market share continues leading the market despite the strong competition, characterized by the incursion of new foreign players and the already stronghold position it has. Thus, BCP’s market share of loans placed reached 31.9% as of March 2008, showing a slight decrease in comparison to December 2007 (32.2%). However, there was an increase of 0.4 percentage points in comparison to the second best competitor.
Furthermore, market shares for the corporate and middle market sectors continue revealing BCP’s solid positioning, reaching 48% and 35%, respectively, as of February 2008. These reflect a minor growth in the corporate market and a stable position in the middle market compared to the previous quarter.
Market shares in the retail market had mixed results during this quarter. Consumer loans were down by 0.2% reaching 17.1%, while Credit Cards and SME decreased 0.2% pps and 0.3% pps, respectively, reaching 18.7% and 18.5%. However, mortgages increased 0.4% pps to 40.1% consolidating its strong position.
Dollarization
The de-dollarization process of BCP’s assets this 1Q08 continued with respect to the previous quarter. Thus, in 1Q08 Nuevos Soles conformed 32.5% of total loan portfolio, which represent a slight increase of 0.5% with respect to 4Q07. In addition, the system continues experiencing further de-dollarization of its loans and deposits, reaching a high 41% of loans in Nuevos Soles and 59% in US Dollar as of March 2008. The de-dollarization process is more intense in deposits specially because the local currency appreciation during this quarter. Thus, the share of deposits in nuevos soles was 51% (vs. 39% for Mar. 2007).
II.2 Deposits and Mutual Funds
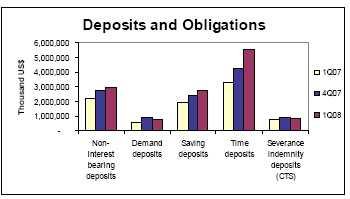
Deposits grew 15% QoQ and 46% YoY, remaining as main funding source to support the strong loan growth
Deposits and Obligations | Quarter ended | Change | ||||||||||||||
| US$ (000) | 1Q08 | 4Q07 | 1Q07 | 1Q08/1Q07 | 1Q08/4Q07 | |||||||||||
| Non-interest bearing deposits | 2,965,756 | 2,729,860 | 2,194,439 | 35.1 | % | 8.6 | % | |||||||||
| Demand deposits | 761,123 | 926,817 | 604,445 | 25.9 | % | -17.9 | % | |||||||||
| Saving deposits | 2,749,983 | 2,381,012 | 1,966,838 | 39.8 | % | 15.5 | % | |||||||||
| Time deposits | 5,543,993 | 4,268,233 | 3,293,110 | 68.4 | % | 29.9 | % | |||||||||
| Severance indemnity deposits (CTS) | 859,630 | 896,283 | 747,065 | 15.1 | % | -4.1 | % | |||||||||
| Interest payable | 58,442 | 46,899 | 36,759 | 59.0 | % | 24.6 | % | |||||||||
Total customer deposits | 12,938,927 | 11,249,104 | 8,842,655 | 46.3 | % | 15.0 | % | |||||||||
| Mutual funds in Perú | 2,088,039 | 1,955,547 | 1,432,924 | 45.7 | % | 6.8 | % | |||||||||
| Mutual funds in Bolivia | 83,890 | 70,919 | 60,201 | 39.3 | % | 18.3 | % | |||||||||
Total customer funds | 12,938,927 | 11,249,104 | 8,842,655 | 46.3 | % | 15.0 | % | |||||||||
The evolution in deposits, especially Nuevos Soles deposits, reflects as well the market environment and significant inflow of capital into the local financial system lured by the speculative opportunity offered by higher Soles rates and US Dollar weakness. This explains the Soles denominated deposits aslo contributed to the high reported deposits growth figures, reaching an overall high 15% deposits’ growth for the quarter.
10
While saving deposits continue expanding at a good rate, demand and CTS deposits, which drop in volumes, reflect the tighter competition for deposits in the market and growing sensitivity of our clients to interest rates earned on their funds. Nevertheless, deposits continue being the prime source of low cost funding since 57% of deposits are either low cost or interest free deposits. The retail segment is also of significant importance since 45% of deposits are generated by BCP’s retail clients.
Market Share
Despite the strong competition for deposits, BCP increased further its market share of deposits to 39.6% by the end of this 1Q08 from 38.8% as of December 2007.
BCP’s leadership is evident in all deposits, being our CTS market share the strongest with 52%, way above our next competitor with 19.6%. In demand deposits BCP holds 48.4% in local currency and 39.7% in US Dollars, while savings deposits reached 36.2% y 42.5% respectively. Finally, in time deposits BCP’s market share reached 25.6% y 39.6% in local and foreign currency.
Through Credifondo, BCP maintains its leadership in the mutual funds’ business with a total of US$ 2,088 million administered funds, up 6.8% QoQ and 45.7% YoY. This represents a market share of 43.7% for the end of March 2008. This increase in market share is noteworthy since it has become a more competitive and sophisticated market.
Another important evolution is the accelerated de-dollarization of deposits, with US Dollar deposits dropping to 61% of the total portfolio, fueled by dollar weakness and higher rates of the Nuevo Sol.
11
II.3 Net Interest Income
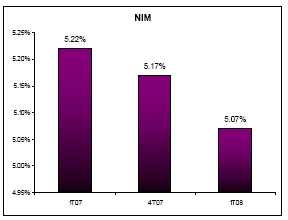
Despite an 11.0% QoQ net interest income growth, the re-composition of interest earning assets and loan portfolio impacted negatively on NIM, dropping to 5.07% for 1Q08.
Net interest income | Quarter | Change | ||||||||||||||
US$ 000 | 1Q08 | 4Q07 | 1Q07 | 1Q08/1Q07 | 1Q08/4Q07 | |||||||||||
Interest income | 296,660 | 272,204 | 195,388 | 51.8 | % | 9.0 | % | |||||||||
| Interest on loans | 213,932 | 201,414 | 148,943 | 43.6 | % | 6.2 | % | |||||||||
| Interest and dividends on investments | 1 | 139 | 8 | -87.5 | % | 100 | ||||||||||
| Interest on deposits with banks | 16,924 | 17,901 | 16,250 | 4.1 | % | -5.5 | % | |||||||||
| Interest on trading securities | 54,527 | 47,069 | 28,545 | 91.0 | % | 15.8 | % | |||||||||
| Other interest income | 11,276 | 5,681 | 1,642 | 586.7 | % | 98.5 | % | |||||||||
Interest expense | 124,049 | 116,640 | 72,099 | 72.1 | % | 6.4 | % | |||||||||
| Interest on deposits | 90,233 | 83,039 | 54,694 | 65.0 | % | 8.7 | % | |||||||||
| Interest on borrowed funds | 15,545 | 14,670 | 5,632 | 176.0 | % | 6.0 | % | |||||||||
| Interest on bonds and subordinated notes | 11,480 | 11,782 | 7,853 | 46.2 | % | -2.6 | % | |||||||||
| Other interest expense | 6,791 | 7,149 | 3,920 | 73.2 | % | -5.0 | % | |||||||||
Net interest income | 172,611 | 155,564 | 123,289 | 40.0 | % | 11.0 | % | |||||||||
| Average interest earning assets | 13,613,215 | 12,031,956 | 9,444,029 | 44.1 | % | 13.1 | % | |||||||||
Net interest margin* | 5.07 | % | 5.17 | % | 5.22 | % | ||||||||||
Interest income increased by a very significant 9% QoQ, as a result of not only the strong loan portfolio growth which generated 6.2% more interest income, but also the significantly larger investment portfolio leading to a 15.8% higher interest income for the quarter. This, combined with a lower interest expense expansion of 6.4% resulted in a total and impressive 11% net interest income quarterly growth.
This is no doubt the result of an unexpected market evolution, since the speculative inflow of large amounts of funds looking to benefit from higher Soles interest rates and the US Dollar weakness together with the revaluation effect on existing assets resulted in the change in BCP's interest earning assets mix that made possible this interest income growth. Excess liquidity was channeled to CBCD’s, which despite carrying a low nominal yield, are extremely attractive on an after tax yield basis given the tax shelter they provide. However, with BCP’s investment portfolio with a lower nominal yield growing significantly more in US Dollar terms (up 45.9%) than its loan portfolio (up 7.4%), and at the same time, its loan portfolio mix also growing more in the corporate sector than in the retail sector as seen before, a drop in a net interest margin (NIM) was unavoidable.
Quarterly growth of interest earning assets | Balance as of | Change | ||||||||||||||||||||
| US$ 000 | Mar 08 | Dec 07 | Sept 07 | Mar 07 | ´Dec 06 | Mar 08/ Mar 07 | Mar 08/ Dec 07 | |||||||||||||||
| BCRP and Other Banks | 2,077,660 | 2,255,572 | 1,740,636 | 1,828,663 | 2,031,936 | 13.6 | % | -7.9 | % | |||||||||||||
| Interbank funds | 1,469 | 5,000 | 1,000 | 4,542 | 25,079 | -67.7 | % | -70.6 | % | |||||||||||||
| Trading Securities | 38,538 | 102,316 | 49,465 | 54,505 | 37,475 | -29.30 | % | -62.3 | % | |||||||||||||
| Available For Sale Securities | 3,449,781 | 2,364,084 | 1,998,309 | 1,641,157 | 1,359,847 | 110.2 | % | 45.9 | % | |||||||||||||
| Current Loans, net | 8,767,674 | 8,164,334 | 7,383,196 | 6,109,064 | 5,795,790 | 43.5 | % | 7.4 | % | |||||||||||||
Total interest earning assets | 14,335,123 | 12,891,306 | 9,637,930 | 9,637,930 | 9,250,127 | 48.7 | % | 11.2 | % | |||||||||||||
| Total average interest earning assets | 13,613,215 | 12,031,956 | 10,970,685 | 9,444,029 | 8,854,003 | |||||||||||||||||
Furthermore, interest rates increases and the impact of the higher reserve requirements on funding costs contributed also to such drop. As a result, NIM fell from 5.17% in 4Q07 to 5.07% in 1Q08.
12
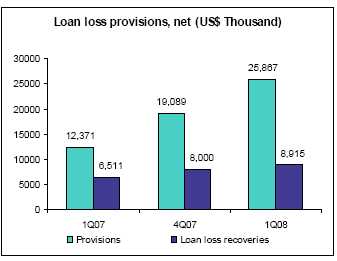
II.4 Loan provisions
Provisions grow following more conservative provisioning policies for the retail portfolio. Portfolio quality ratios remain at excellent levels.
Provisión for loan losses | Quarter ended | Change | ||||||||||||||
| US$ 000 | 1Q08 | 4Q07 | 1Q07 | 1Q08/1Q07 | 1Q08/4Q07 | |||||||||||
| Provisions | (25,867 | ) | (19,089 | ) | (12,371 | ) | 109.1 | % | 35.5 | % | ||||||
| Loan loss recoveries | 8,915 | 8,000 | 6,511 | 36.9 | % | 11.4 | % | |||||||||
Total provisions, net of recoveries | (16,951 | ) | (11,089 | ) | (5,859 | ) | 189.3 | % | 52.9 | % | ||||||
Total loans | 8,837,689 | 8,224,613 | 6,182,300 | 43.0 | % | 7.5 | % | |||||||||
Reserve for loan losses (RLL) | 219,295 | 212,060 | 184,627 | 18.8 | % | 3.4 | % | |||||||||
Bcp's Charge-Off amount | 9,281 | 12,034 | 10,507 | -11.7 | % | -22.9 | % | |||||||||
Past due loans (PDL) | 70,015 | 60,279 | 73,237 | -4.4 | % | 16.2 | % | |||||||||
| PDL/Total loans | 0.79 | % | 0.73 | % | 1.18 | % | ||||||||||
| Coverage | 313.21 | % | 351.80 | % | 252.10 | % | ||||||||||
Gross provisions reached US$ 25.9 million in 1Q08, 35.5% higher QoQ, reflecting not only the increase in the loan book, but also a change in provisioning policy for our retail portfolio, raising the minimum provisions for each of the retail products to levels calculated applying a more sophisticated risk assessment methodology.
Recoveries, on the other hand increased also a strong 11.4% due to the sale of a large and old troubled loan. This transaction represented income from recovery of US$ 1.7 million.
Past due loans in absolute terms reflect an increase of US$ 10 million, though such relatively small movements compared to the loan portfolio size are not unusual and are not an indicator of any portfolio quality deterioration. Thus, PDL/total loans ratio of 0.79% continues being an excellent ratio, as is the 313% coverage ratio for 1Q08.
13
II.5 Non Financial Income
During 1Q08, non financial income was boosted by the extraordinary income generated for financial institutions members of Visa by the Visa IPO.
Non financial income | Quarter | Change | ||||||||||||||
| US$ 000 | 1Q08 | 4Q07 | 1Q07 | 1Q08/1Q07 | 1Q08/4Q07 | |||||||||||
| Fee income | 79,747 | 76,708 | 62,470 | 27.7 | % | 4.0 | % | |||||||||
| Net gain on foreign exchange transactions | 19,971 | 21,497 | 11,937 | 67.3 | % | -7.1 | % | |||||||||
| Net gain on sales of securities | 22,655 | 2,661 | 9,210 | 146.0 | % | 751.4 | % | |||||||||
| Other income | 2,190 | 2,592 | 2,638 | -17.0 | % | -15.5 | % | |||||||||
Total non financial income | 124,563 | 103,458 | 86,255 | 44.4 | % | 20.4 | % | |||||||||
Fee income growth of 4% QoQ comes from increased income from account maintenance fees, credit card fees, transactional fees and charges.
Net gain in FX transactions dropped 7.1% QoQ after having had a significantly higher FX gain in the 4Q07 due to the strong year end activity.
Net gain in the sale of securities reflects an extraordinary jump from US$2.7 million to US$22.7 million this quarter. This responds to the sale of the Visa shares through the IPO of Visa Inc. which resulted in income of US$17.9 million in 1Q08 and thus accounts for most of the income increase.
Even though commissions for banking transactions grow, the average number of monthly transactions drops from 33.3 million to 32.3 million, reflecting a drop of 2.9% QoQ. This is a normal seasonal evolution with transaction volume always peeking during the 4Q of every year.
14
Quarter | Change | |||||||||||||||
N° of Transactions per Channel | Average 1Q08 | Average 4Q07 | Average 1Q07 | 1Q08/ 1Q07 | 1Q08/ 4Q07 | |||||||||||
| Teller | 9,091,066 | 9,371,270 | 8,310,053 | 9.4 | % | -3.0 | % | |||||||||
| ATMS ViaBCP | 5373782 | 5,540,733 | 4,191,183 | 28.2 | % | -3.0 | % | |||||||||
| Balance Inquiries | 2,249,668 | 2,468,491 | 2,022,884 | 11.2 | % | -8.9 | % | |||||||||
| Telephone Banking | 1,108,666 | 1,203,838 | 943,356 | 17.5 | % | -7.9 | % | |||||||||
| Internet Banking ViaBCP | 7,448,052 | 7,284,113 | 5,891,783 | 26.4 | % | 2.3 | % | |||||||||
| Agente BCP | 1,248,203 | 1,092,778 | 497,603 | 150.8 | % | 14.2 | % | |||||||||
| Telecrédito | 2,884,387 | 3,374,932 | 2,532,613 | 13.9 | % | -14.5 | % | |||||||||
| Direct Debit | 341,265 | 346,710 | 281,029 | 21.4 | % | -1.6 | % | |||||||||
| P.O.S. | 2,466,764 | 2,489,588 | 1,983,368 | 24.4 | % | -0.9 | % | |||||||||
| Other ATM network | 173,343 | 168,839 | 139,280 | 24.5 | % | 2.7 | % | |||||||||
| Total transactions | 32,385,197 | 33,341,293 | 26,793,154 | 20.9 | % | -2.9 | % | |||||||||
From the chart above, the evolution of the number of transactions done through the “Agente BCP” is truly noteworthy, reflecting its significance; as well as the evolution of electronic channels vis-à-vis the traditional teller transactions.
Quarter | Change | |||||||||||||||||||||
| Mar-08 | Dec-07 | Sep-07 | Mar-07 | Dec-06 | Mar. 08/ Dec. 07 | Mar. 08/ Mar. 07 | ||||||||||||||||
| Branches | 277 | 273 | 254 | 245 | 237 | 1 | % | 13 | % | |||||||||||||
| ATMs | 778 | 748 | 724 | 691 | 655 | 4 | % | 13 | % | |||||||||||||
| Agentes BCP | 1,358 | 1,221 | 1,017 | 703 | 551 | 11 | % | 93 | % | |||||||||||||
| Total | 2,413 | 2,242 | 1,995 | 1,639 | 1,443 | 8 | % | 47 | % | |||||||||||||
II.6 Operating Costs and Efficiency
The efficiency ratio improved this 1Q08 to 47.5%, with operating expenses dropping 8.9% QoQ after the high year end related cost increase reported in 4Q07 and despite the negative impact of the revaluation of Soles denominated costs.
Operating expenses | Quarter | Change | ||||||||||||||
| US$ 000 | 1Q08 | 4Q07 | 1Q07 | 1Q08/1Q07 | 1Q08/4Q07 | |||||||||||
| Salaries and employees benefits | 70,553 | 75,147 | 51,302 | 37.5 | % | -6.1 | % | |||||||||
| Administrative, general and tax expenses | 48,520 | 59,234 | 37,755 | 28.5 | % | -18.1 | % | |||||||||
| Depreciation and amortizacion | 10,364 | 10,000 | 9,423 | 10.0 | % | 3.6 | % | |||||||||
| Other expenses | 8,898 | 7,485 | 9,738 | -8.6 | % | 18.9 | % | |||||||||
Total operating expenses | 138,335 | 151,867 | 108,218 | 27.8 | % | -8.9 | % | |||||||||
Efficiency Ratio | 47.53 | % | 56.89 | % | 49.81 | % | ||||||||||
Though fixed Soles denominated salaries expense increased approximately 19% this quarter as the number of employees increased to 13,540 from 12,667 by the end of last year driven by the network expansion plans, on a comparative base with the previous quarter, a drop of 6.1% is reported due to the high comparison base set by the seasonally higher year end costs (related to performance compensation) and the unusual provisions for the retirement of a few members of senior management in the 4Q07. The differential between quarters in personnel expenses was in fact stronger than reported since the revaluation effect of the Soles works exacerbating in dollar terms the increased nominal soles payroll. This is more evident in a YoY comparison where a 37.5% growth is observed, which is certainly exacerbated by the Soles revaluation. Nevertheless, despite the 19% nominal payroll increase, this was below expectations and explained by a non linear progression in expenses related to the network expansion, which resulted in less expense growth for the beginning of the year than projected.
15
Administrative expenses on the other side, also reported a significant drop of 18.1% from the previous quarter. Once again, the year end strong increases in expenses in 4Q07, in all sectors such as marketing, systems support, consultancy jobs and transportation, set a high expense level for last quarter, and given the normalized level of expenses and also the mentioned non linear distribution of such, helps explains the drop reported. In fact marketing expenses dropped 58.7% QoQ and systems support expenses were down 24.4%. We would however like to point out, that the network expansion plan and systems support investments are going full speed ahead and will result in expense increases along the year.
Such administrative expense expansion is thus better reflected by the yearly growth reported of a total of 28.5%.
Administrative expenses | Quarter | Change | |||||||||||||||||||||||
| US$ 000 | 1Q08 | % | 4Q07 | % | 1Q07 | % | 1Q08/1Q07 | 1Q08/4Q07 | |||||||||||||||||
| Marketing | 5,032 | 10 | % | 12,180 | 21 | % | 3,785 | 10 | % | 32.9 | % | -58.7 | % | ||||||||||||
| Systems | 6,892 | 14 | % | 9,121 | 15 | % | 6,967 | 18 | % | -1.1 | % | -24.4 | % | ||||||||||||
| Transportation | 4,458 | 9 | % | 4,864 | 8 | % | 3,528 | 9 | % | 26.4 | % | -8.3 | % | ||||||||||||
| Maintenance | 2,444 | 5 | % | 2,319 | 4 | % | 1,605 | 4 | % | 52.3 | % | 5.4 | % | ||||||||||||
| Communications | 2,497 | 5 | % | 2,217 | 4 | % | 1,938 | 5 | % | 28.9 | % | 12.6 | % | ||||||||||||
| Consulting | 2,207 | 5 | % | 3,174 | 5 | % | 1,747 | 5 | % | 26.3 | % | -30.5 | % | ||||||||||||
| Other expenses | 14,195 | 29 | % | 16,483 | 28 | % | 10,057 | 27 | % | 41.2 | % | -13.9 | % | ||||||||||||
| Porperty taxes and others | 5,487 | 11 | % | 4,897 | 8 | % | 4,097 | 11 | % | 33.9 | % | 12.0 | % | ||||||||||||
| Other subsidiaries and eliminations, net | 5,308 | 11 | % | 3,979 | 7 | % | 4,031 | 11 | % | 31.7 | % | 33.4 | % | ||||||||||||
Total administrative expenses | 48,520 | 100 | % | 59,234 | 100 | % | 37,755 | 100 | % | 28.5 | % | -18.1 | % | ||||||||||||
Other expenses increased 18.9% QoQ and are explained by the volatility experienced by our own stock during 1Q08 which was reflected in the coverage levels and provisions related to the Stock Appreciation Rights program.
Thus, a drop in operating costs (excluding others) of 10.4%, while operating income improved 7.3% resulted in a significant recovery of BCP’s efficiency ratio from 56.9% in 4Q07 to 47.5% this 1Q08.
II.7 Shareholders’ Equity and Regulatory Capital
Shareholders' equity | Quarter | Change | ||||||||||||||
| US$ 000 | 1Q08 | 4Q07 | 1Q07 | 1Q08/1Q07 | 1Q08/4Q07 | |||||||||||
| Capital stock | 364,706 | 364,706 | 364,706 | 0.0 | % | 0.0 | % | |||||||||
| Reserves | 388,062 | 282,189 | 282,189 | 37.5 | % | 37.5 | % | |||||||||
| Unrealized Gains and Losses | 90,285 | 57,771 | 65,449 | 37.9 | % | 56.3 | % | |||||||||
| Retained Earnings | 186,761 | 96,245 | 96,484 | 93.6 | % | 94.0 | % | |||||||||
| Income for the year | 165,772 | 331,652 | 72,657 | 128.2 | % | -50.0 | % | |||||||||
Total shareholders' equity | 1,195,587 | 1,132,564 | 881,485 | 35.6 | % | 5.6 | % | |||||||||
| Return on average equity (ROAE) | 56.96 | % | 31.67 | % | 31.50 | % | ||||||||||
Total shareholders’ equity reached US$ 1,195 million as of March 2008, i.e. up 5.6% QoQ. ROAE however, reached un unprecedented level of 56.96% boosted by the impact of the sudden and strong revaluation of the local currency throughout the results of the bank, leading to the extremely high translation gain of over US$ 57 million..
16
At the end of March 2008, the capital adequacy ratio for BCP unconsolidated reached 13.8% (7.3 times), higher than 11.8% (8.4 times) for 4Q07. Therefore, this indicator outperforms the one established by the system (9.1%) and our more conservative internal ratio of 11.5%.
The improved BIS ratio responds to the capitalization of retained earnings for US$ 106 million and the reduction of capital requirements as the risk adjusted capital improved as a result of the reduction of BCP’s US Dollar position and consequent reduction of exposure and risk to currency fluctuations.
On the other hand, Tier I reached US$ 951.9 million. Risk adjusted assets include a significantly reduced US$ 97.9 million market risk, which requires US$ 8.9 million of equity. Total regulatory capital includes US$ 307 million subordinated debt. In addition, US$ 80.8 million of capitalized earnings are included in the present period.
Regulatory Capital and Capital Adequacy Ratios | Quarter ended | Change | ||||||||||||||
| US$ 000 | 1Q08 | 4Q07 | 1Q07 | 1Q08/1Q07 | 1Q08/4Q07 | |||||||||||
| Capital Stock, net | 468,851 | 429,415 | 404,187 | 16.0 | % | 9.2 | % | |||||||||
| Legal and Other capital reserves | 484,105 | 346,418 | 326,066 | 48.5 | % | 39.7 | % | |||||||||
| Generic Contingency loss reserves | 91,469 | 85,005 | 61,130 | 49.6 | % | 7.6 | % | |||||||||
| Subordinated Debt | 307,422 | 294,648 | 137,610 | 123.4 | % | 4.3 | % | |||||||||
| Net income capitalized | 80,816 | 74,019 | - | - | 9.2 | % | ||||||||||
Total | 1,432,663 | 1,229,505 | 928,993 | 54.2 | % | 16.5 | % | |||||||||
| Less: Investment in multilateral organization and banks | (158,279 | ) | (175,762 | ) | (136,336 | ) | 16.1 | % | -9.9 | % | ||||||
Total regulatory capital | 1,274,385 | 1,053,743 | 792,657 | 60.8 | % | 20.9 | % | |||||||||
| Risk-weighted assets (Credit risk) | 9,168,514 | 8,603,291 | 6,218,204 | 47.4 | % | 6.6 | % | |||||||||
Market Risk | 8,893 | 26,714 | 43,093 | -79.4 | % | -66.7 | % | |||||||||
Capital Ratios: | ||||||||||||||||
| Regulatory capital as a percentage of risk-weighted assets | 13.75 | % | 11.84 | % | 11.84 | % | ||||||||||
| Ratio of risk-weihted assets to regularoy capital | 7.27 | 8.44 | 8.44 | |||||||||||||
17
III. Banco de Crédito de Bolivia
Bolivian Financial System
Bolivian Financial System reached US$ 4,719 million in deposits as of March 2008, 32% higher than the US$ 3,585 million registered in the previous year. Total loan volume reached US$ 3,258.2 as of March 2008, +16.6% YoY. In addition, PDL ratio of the loan portfolio reached 5.7% as of March 2008 vs. 5.6% as of December 2007 and 8.8% as of March 2007; while the coverage ratio was 112.2%.
The politically uncertain scenario presented by the country today has resulted in very low levels of investments, which might eventually lead to a downturn in the economy.
Results
In 1Q08, BCP Bolivia reached a net income of US$ 10.4 million, showing a growth of 7.4% QoQ and 116.7% YoY, mainly as a result of increased interest income (11% QoQ and 39.1% YoY), and higher non financial income (24.6% QoQ and 49.8% YoY).
Higher net interest income was a result of higher volumes of loans and investments and higher interest rates on loans. Non financial income increased mainly as a result of higher profits from the sale of securities (694.7% QoQ and 3,220.8% YoY). It is important to mention that this growth was led by the sale of VISA’s shares during March, which represented US$ 1.9 million boosting significantly the gains on sales of securities in the first quarter 2008.
Excluding the extraordinary gains from the sale of this investment, BCB’s net income would have been US$8.5 million for the 1Q08.
A conservative credit risk management strategy led to a PDL ratio of 1.7% (1.7% in 4Q07 and 3.6% in 1Q07) and a coverage ratio of 227.8% (240.1% in 4Q07 and 161.1% in 1Q07). BCP Bolivia’s ROAE was 56.1%, 37.3% higher than December 2007. Thus, these figures show that BCP Bolivia had one of the best loan quality ratios within the Bolivian banking system, which reported ratios of 5.7% and 109.6%, respectively.
Assets and liabilities
As of march 2008, total loans reached US$ 467.6 million, 0.8% higher than US$ 463.8 million as of December 2007 and 20.3% greater YoY. The smaller quarterly growth is the result of the reduction in economic activity, due to political uncertainty in the country. The political evolution and the low economic activity generated an uncertain situation and discourages businessmen from carrying out greater investments. This has been translated into the stagnation of the Bolivian economy, and therefore in a smaller growth of our loan portfolio QoQ.
During 1Q08, Retail Banking revealed the highest growth (8.4% TaT and 25.5% AaA), which has an important impact in BCB’s results, given that it represents 46.4% of BCB’s loan portfolio and generates greater margins, while Corporate and Middle Market Banking represents 48.4%. Both segments represent 94.8% of total loans.
Within the Retail Banking segment, Personal loans and SME grew 9.2% and 8.2%, respectively. Both segments represented 28.4% of total retail loans and showed the greatest QoQ growth. In addition, the mortgage segment, which represented 52.8% of total retail portfolio, grew 0.9% TaT and 6.1% AaA.
18
In terms of liabilities, BCP Bolivia showed an increase in deposits of 5.6% QoQ and 28.3% YoY. Demand deposits grew 7.3% QoQ and 27.2% YoY, saving deposits, 5.5% QoQ and 45.6% YoY, and time deposits increased 4.1% QoQ and 12.6% YoY.
Shareholders’ equity decreased 10.9% QoQ due to dividends distribution. Nevertheless, this reduction was compensated by net income of the quarter. The net shareholders’ equity grew 21.1% YoY.
Finally, BCP Bolivia holds market shares of 14.0% and 14.6% of loans and deposits, respectively, which represent the third place in the Bolivian Banking System.
Banco de Crédito de Bolivia | Quarter | Change % | ||||||||||||||
| US$ millon | 1Q08 | 4Q07 | 1Q07 | 1Q08/1Q07 | 1Q08/4Q07 | |||||||||||
| Total loans | 467.6 | 463.8 | 388.8 | 20.3 | % | 0.8 | % | |||||||||
| Past due loans | 7.9 | 7.8 | 13.7 | -42.3 | % | 2.3 | % | |||||||||
| Loan loss reserves | (18.1 | ) | (18.6 | ) | (22.2 | ) | -18.4 | % | -3.0 | % | ||||||
| Total Assets | 845.0 | 821.9 | 675.3 | 25.1 | % | 2.8 | % | |||||||||
| Deposits | 701.0 | 663.9 | 546.3 | 28.3 | % | 5.6 | % | |||||||||
| Shareholders net equity | 75.8 | 85.1 | 62.6 | 21.1 | % | -10.9 | % | |||||||||
Net income | 10.4 | 9.7 | 4.8 | 116.7 | % | 7.4 | % | |||||||||
| PDL/ Total loans | 1.7 | % | 1.7 | % | 3.6 | % | ||||||||||
| Coveage ratio of PDLs | 227.8 | % | 240.1 | % | 161.1 | % | ||||||||||
| ROAE | 56.1 | % | 37.3 | % | 27.6 | % | ||||||||||
| Branches | 61 | 61 | 57 | |||||||||||||
| ATMs | 167 | 157 | 143 | |||||||||||||
| Employees | 1503 | 1441 | 1178 | |||||||||||||
19
IV. Atlantic Security Holding Corporation
ASHC | Quarter | Change % | ||||||||||||||
(US$ Million) | 1Q 2008 | 4Q 2007 | 1Q 2007 | 1Q08 / 1Q07 | 1Q08 / 4Q07 | |||||||||||
| Net interest income | 5.7 | 4.9 | 4.3 | 34.2 | 16.3 | |||||||||||
| Dividend income | 0.0 | 0.2 | 19.1 | -99.7 | -79.1 | |||||||||||
| Fees and commissions from services | 2.1 | 2.2 | 2.0 | 9.3 | -2.1 | |||||||||||
| Net gains on foreign exchange transactions | 0.6 | 0.8 | 0.0 | 4,906.9 | -23.2 | |||||||||||
Core Revenues | 8.5 | 8.2 | 25.3 | -66.3 | 4.7 | |||||||||||
| Total provisions, net of recoveries | -2.0 | -3.1 | -0.3 | -535.5 | 35.7 | |||||||||||
| Net gains from sale of securities | 0.7 | 2.4 | 0.6 | 24.7 | -70.0 | |||||||||||
| Other income | 0.5 | 0.4 | 0.3 | 95.1 | 29.1 | |||||||||||
| Operating expenses | -2.2 | -2.9 | -1.9 | 13.3 | -26.1 | |||||||||||
Net income | 5.7 | 5.0 | 24.0 | -76.3 | 13.7 | |||||||||||
| Net income/share | 0.1 | 0.1 | 0.4 | -76.3 | 13.7 | |||||||||||
| Total loans | 146.4 | 130.1 | 125.4 | 16.8 | 12.5 | |||||||||||
| Total investments available for sale | 824.3 | 853.7 | 801.9 | 2.8 | -3.4 | |||||||||||
| Total asset | 1,490.7 | 1,615.3 | 1,432.2 | 4.1 | -7.7 | |||||||||||
| Total deposits | 1,227.9 | 1,382.9 | 1,197.8 | 2.5 | -11.2 | |||||||||||
| Shareholder's equity | 208.5 | 214.1 | 217.6 | -4.2 | -2.6 | |||||||||||
| Net interest margin | 1.66 | % | 1.34 | % | 1.34 | % | ||||||||||
| Efficiency ratio | 22.0 | % | 26.6 | % | 7.3 | % | ||||||||||
| Return on average equity* | 16.3 | % | 16.5 | % | 17.1 | % | ||||||||||
| PDL / Total loans | 0.00 | 0.00 | 0.00 | |||||||||||||
| Cover ratio | 0.9 | % | 1.0 | % | 1.9 | % | ||||||||||
| BIS ratio | 14.93 | % | 15.07 | % | 16.68 | % | ||||||||||
*Figures of ASB | ||||||||||||||||
Net income for Atlantic Security Holding Corporation (ASHC) of USD 5.7 million reflects an important QoQ increase of 13.7%, though on a yearly comparison a distortion is obvious given that the 1Q07 included the Credicorp dividend, which is being paid this year in April. Excluding that distortion, a yearly growth would also be reported.
Core revenues were up 4.7% for the quarter, and net of the Credicorp dividend, also 16.3% for the year. The driver of this growth is net interest income, which increased 16.3%. This increase in net interest income is reported in the midst of a declining interest rate environment, which led the bank to react with an active management of its cost of funds, through periodical adjustments to interest rates paid on deposits and careful management of its maturity structure, therefore generating wider margins.
Commissions and fees income remain stable, and net gains on foreign exchange transactions reflect gains from the appreciation against the US Dollar of foreign currency positions maintained by the bank, mainly Peruvian Nuevos Soles.
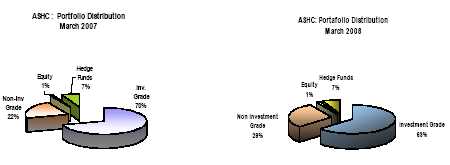
Net provisions reported in 1Q08 of US$ 2.0 million were lower in 35.7% when compared to those reported in 4Q07. These respond to the necessary recognition of an adverse market effect on the Bank’s proprietary investment portfolio; triggered by the current financial markets’ turmoil. Nevertheless, the investment portfolio maintains a significant concentration of 63% in investment grade securities indicating a high credit quality exposure. We estimate that reserves will remain within the same levels reported for 1QT08 in the following quarter.
Realized gains on the sale of securities show a volatile performance, though we estimate these will remain constant or below current 1Q08 figures for the following months.
20
Net interest margin presents an increase from 1.34% to 1.66% during this 1Q08 mainly due to a reduction of interests on deposits, which were aligned to the reductions observed in the LIBOR rate.
Efficiency ratio presented a slight reduction from 26.6% in 4Q07 to 22.0% this 1Q08. This improvement is a result of the slightly increased net income. The 1Q07 efficiency ratio reported of 7.3% is totally distorted again by the extraordinary Cerdicorp dividend income in that period. Net of that distortion, the ratio is 26%, i.e. similar to ratios reported during the last quarters.
Total asset levels decreased by 7.7% on QoQ due to outgoing customers’ deposits and their migration to structured products managed off-balance sheet for customers motivated by higher yields.
Interest Earning Assets
Interest earning assets reached US$ 1.358 MM, as shown in the table below. This figure dropped 8.1% on a QoQ basis, while an increase of 6.1% YoY is observed. This follows the migration mentioned above of deposits to off-balance sheet investment opportunities and outgoing funds from customers’ accounts during this 1QT08.
The share of investment-grade securities in the investment portfolio is 63%, emphasizing ASB’s prudent investment policy of concentrating its portfolio in high credit quality, high liquidity securities.
INTEREST EARNING ASSETS* | Quarter | % Change | ||||||||||||||
(US$ Million) | 1Q 2008 | 4Q 2007 | 1Q 2007 | 1Q08/ 1Q07 | 1Q08/ 4Q07 | |||||||||||
| Due from banks | 437 | 548 | 402 | 8.7 | % | -20.2 | % | |||||||||
| Loans | 146 | 130 | 125 | 16.8 | % | 12.5 | % | |||||||||
| Investments | 774 | 799 | 752 | 2.9 | % | -3.2 | % | |||||||||
Total interest-earning assets | 1,358 | 1,478 | 1,280 | 6.1 | % | -8.1 | % | |||||||||
| (*) Excludes investments in equities and mutual funds. |
21
Asset Management Business
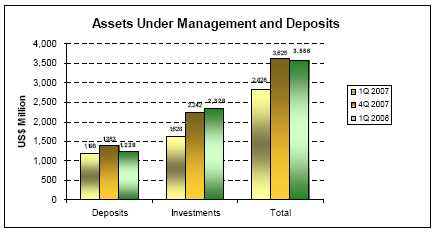
In the Asset Management business we include customers’ deposits, and investments such as proprietary mutual funds and securities custody. The total of these funds dropped by 1.9% QoQ and 25.9% YoY. Such drop is basically explained by the market valuation of the portfolio, since the outgoing funds from our deposits were completely captured by our asset management products. Thus, total funds under management shows a valuation of 3,556 million vs. US$3,625 million in 4Q07. The management of third party funds in off-balance sheet accounts continues to be the focus of our new business development of ASHC.
22
V. PRIMA AFP
Market Developments
During 1Q08, competition in the Private Pension Fund System slightly decreased in comparison to the previous quarter. Thus, the level of transfers dropped to an average of 24 thousand per month in 1Q08 from an average of 27 thousand per month in 4Q07. Reduction in sales force has not affected significantly new affiliations, which increased from an average level of 18 thousand to 21 thousand during 1Q08.
In terms of funds under management (FuM), there was an increase with respect to December 2007 of 9.3%, mainly due to the strong domestic currency appreciation, reaching a total of US$ 22.3 billion. Market behavior affected voluntary contributions, which showed a decreasing trend.
Financially, companies have shown a positive evolution in terms of earnings and expenses, supported by the strong local currency appreciation. It is important to mention that this development took place despite the double accrued earnings effect in the first month of the year.
Private Pension Fund System: Main Indicators
At the end of period: | 1Q08 | 4Q07 | 1Q07 | |||||||
| Affiliates (thousand) | 4,156 | 4,101 | 3,939 | |||||||
| % Change (1) | 1.3 | % | 1.3 | % | 1.5 | % | ||||
| Sales force | 2,031 | 2,340 | 5,179 | |||||||
| Assets under management (US$ mm) | 22,279 | 20,371 | 16,763 | |||||||
| % Change (1) | 9.4 | % | 0.4 | % | 16.5 | % | ||||
| Income (US$ mm) | 68.0 | 51.4 | 51.5 | |||||||
| Operating Expenses (US$ mm) | 44.1 | 43.9 | 44.5 | |||||||
| Operating income (US$ mm) | 23.9 | 7.5 | 7.0 | |||||||
| Net Income (US$ mm) | 15.7 | -0.5 | 22.0 | |||||||
(1) Quarter variation.
In local Peruvian accounting, legal reserves are included in the income statement as opposed to the IFRS.
There is no information for results adjusted to international financial reporting standards for the Total System.
The first and third quarter include double collection
Prima AFP
During 1Q08, Prima AFP maintained a good performance in terms of commercial and investment activities. In commercial terms, Prima AFP reduced the number of affiliates as a consequence of more transfers to other pension funds, potentially a consequence of being the leader in the reduction of the sale force. However, despite the reduced sale force, Prima AFP continued increasing its volumes of funds as a result of its increased sales force productivity and the quality of its contributors’ portfolio.
Prima AFP maintained its leadership in the market in terms of collections and voluntary contributions. Likewise, in comparison to the previous quarter position, Prima’s market share was superior despite the reduction in volume of voluntary contributions as a consequence of the market volatility.
23
PRIMA 1Q08 | System 1Q08 | % Share 1Q08 | PRIMA 4Q07 | % Share 4Q07 | ||||||||||||
| Affiliates (1) | 1,029,814 | 4,156,077 | 24.8 | % | 1,023,482 | 25.0 | % | |||||||||
| New affiliations (2) | 11,130 | 62,583 | 17.8 | % | 10,707 | 19.8 | % | |||||||||
| Funds under management US$ mm (1) | 6,989 | 22,279 | 31.4 | % | 6,403 | 31.4 | % | |||||||||
| Collections US$ mm (3) | 153 | 443 | 34.4 | % | 124 | 33.7 | % | |||||||||
| Voluntary contributions US$ mm (4) | 163 | 339 | 48.1 | % | 168 | 47.2 | % | |||||||||
| RAM US$ mm (5) | 352 | 1,080 | 32.6 | % | 308 | 32.1 | % | |||||||||
(1) Source: Superintendencia de Banca y Seguros
(2) At the end of period.
(3) Accumulated to the Quarter. Include voluntary contributions
(4) Stock level at the end of period
(5)Monthly remuneration retained, earnings base calculation estimated by PRIMA on average earnings during the last 4 months excluding double collection effect, special collections and voluntary contributions fees.
Commercial Results
During 1Q08, Prima AFP developed its business in a relatively stable competition framework.
The client base increased by near 14,000 in-coming transfers and 11,000 new affiliations, which compensated 17,000 transfers away, and resulted in a positive net effect in the period. In addition, Prima’s sales force productivity is higher than the system’s in terms of average funds transferred to the company.
Prima’s funds under management reached US$ 6,989 million, which represented 31.4% of the system as of March 2008, similar to level shown in December 2007.
Investments
In terms of investments, international market volatility, mainly characterized by the uncertainty of the United States economy, affected domestic market and the corresponding profitability of funds under management, during this first quarter. Nonetheless, thanks to profitability achieved in previous quarters, during the period March 2008/ March 2007 Prima AFP obtained good performance levels of 6.70%, 12.16% and 17.86%, for funds number 1, 2, and 3, respectively. Thus, Prima reached position N°2 in funds number 1 and 3 and the third position in fund number 2. However, it is important to mention that results in a 24 month basis were 31.18%, 56.8% and 139.96% in funds N°1, 2 and 3, respectively, showing a leadership in all these funds and consistency and solid results in a long term basis.
Mar-08 | % | Dec-07 | % | ||||||||||
| Fund 1 | 349 | 5.0 | % | 277 | 4.3 | % | |||||||
| Fund 2 | 4,519 | 64.7 | % | 4,154 | 64.9 | % | |||||||
| Fund 3 | 2,121 | 30.4 | % | 1,973 | 30.8 | % | |||||||
| Total | 6,989 | 100.0 | % | 6,403 | 100.0 | % | |||||||
Source: Superintendencia de Banca y Seguros
According to the PF rules, the Central Reserve Bank of Peru raised the limit to foreign investment to 20%; while the Superintendencia de Banca Seguros listed new investment securities allowing more investment opportunities for the pension fund system.
Financial Results
During the 1Q08, Prima AFP recalculated the total amount of its deferred income tax and working profit sharing liability, resulting in a favorable adjustment of US$ 2.3 million corresponding to the year 2007. Excluding such adjustment from 2008, the real net income for Prima in 1Q08 is US$6.7 million.
24
Income:
During the first quarter of 2008, the total earnings of the company reached US$ 19.1 million, a figure higher than that expected as a result of higher income base and the domestic currency appreciation effect.
According to estimates based on income and administration fees for every company, during the first quarter, Prima AFP had the highest average income base of the system (32.6%).
PRIMA 1Q07 | Total System 1Q08 | PRIMA % Share | ||||||||
| Income (1) | 6.11 | 22.04 | 27.7 | % | ||||||
| Administration Fees | 1.5 | % | n.a. | |||||||
| RAM estimated base (2) | 352 | 1,080 | 32.6 | % | ||||||
Prima AFP estimates. in accordance to local public information, (CONASEV)
(1) Income excluding special management for collections from voluntary payments
(2) RAM: Monthly Accumulated Salary
Expenses:
In terms of expenses, the exchange rate effect was partially offset by a permanent cost control effort. Thus, sales personnel expenses were below budget and partially compensated extraordinary incentives adjustments related to administrative personnel, resulting in a higher operating margin than expected. Operating expenses were higher when compared to the previous quarter (US$ 11.6 million vs. US$ 9.9 million), mainly as a result of extraordinary incentives to administrative personnel and since in 4Q07 higher variable deferred expenses related to portfolio transfers, according to IFRS, were registered.
Likewise, financial results include expenses related to the amortization of assets identified in the merger operation. Including the amortization and depreciation for investments in properties and systems, total expense in D&A was US$ 2.1 million for the period.
The “other income and expenses” line, includes the extraordinary result explained by the gains obtained from exchange rate differences and the reduction of financial expenses after prepayments of banking debt.
Thus, following such changes in income, expenses and charges mentioned above, Prima reported net income of US$ 9.0 million (includes deferred adjustment of US$2.2 million in 2007), 300% higher than its budget.
Total assets level remains relatively stable reaching US$ 254.3 million, as well as liabilities (US$ 116.5 million) and equity (US$ 137.7 million).
PRIMA AFP: Main financial indicators (US$ Thousand)
1Q08 | 4Q07 | Change % | ||||||||
| Income | 19,053 | 14,413 | 32 | % | ||||||
| General Expenses | (10,038 | ) | (12,105 | ) | -17 | % | ||||
| Net Income / Loss | 9,015 | 2,308 | 291 | % | ||||||
| Total Assets | 254,311 | 246,095 | 3 | % | ||||||
| Total Liabilities | 116,534 | 116,485 | 0 | % | ||||||
| Equity | 137,777 | 129,610 | 6 | % | ||||||
IFRS
25
VI. EL PACIFICO PERUANO SUIZA Y SUBSIDIARIAS
VI.1 PACIFICO GRUPO
Results for the quarter
Total premiums of Pacífico Grupo, which include Property & Casualty (PPS), Life (PV) and Health (EPS), amounted to US$ 137.5 million in 1Q08, representing an improvement of 7.2% QoQ and 30.6% YoY. This important growth explains the increase in reserves which were adjusted from US$ 10.9 million to US$ 18.6 million.
Total premiums growth was fueled by a 12% QoQ (45% for the year) increase in Life insurance premiums, followed by a 7% quarterly growth (34% for the year) of Health insurance premiums. The P&C premiums grew with respect to the 1Q07 a more moderate 22%, however, it is noteworthy that the personal lines (personal injuries, medical assistance, automobiles and SOAT) represent now 44% of the P&C business following the strategy to increase the retail business in an effort to stabilize earnings and achieve better predictability of casualties. Thus growth is concentrated in automobiles, medical assistance and SOAT. Thus, the re-composition of the risk portfolio favoring the retail segment which offers more retention, diversification and predictability of risk is progressing successfully.
Quarter | Change | |||||||||||||||
US$ MM | 1Q08 | 4Q07 | 1Q07 | 1Q08 / 4Q07 | 1Q08 / 1Q07 | |||||||||||
| Total Gross Premiums | 137.5 | 128.2 | 105.3 | 7.2 | % | 30.6 | % | |||||||||
| Retained Premiums | 110.2 | 104.2 | 82.9 | 5.8 | % | 32.9 | % | |||||||||
| Reserve Adjustments | 18.6 | 20.1 | 10.9 | -7.4 | % | 70.8 | % | |||||||||
| Net Premiums Earned | 91.6 | 84.1 | 72.0 | 8.9 | % | 27.1 | % | |||||||||
Underwriting result for 1Q08 amounted to US$ 0.5 million, similar to the amount obtained in 4Q07 but significantly lower than 1Q07 results of US$ 8.8 million. This was the consequence of increased casualties in the health, automotive and technical lines (in the last two segments given the torrential rains that generated significant losses in the north of the country), as well as an increase in life annuity claims.
The financial income achieved this 1Q08 was significant at US$ 18.2 million, though US$ 3.5 million lower than a year ago since at that time an extraordinary income of US$5.5 million from the sale of Brady bonds was recorded at Pacifico Vida following portfolio decisions related to sovereign debt. On the other hand, given the strong revaluation of the local currency, translation results were higher reaching US$ 5.6 million. It should be noted that part of these results respond to the implementation of investment policies which looked to maximize returns for the company through a fine tuned management of the currency positions, synthetic financial instruments and others.
Net results after minority interests reached in 1Q08 improved from 4Q07, reaching US$ 3.1 million from US$ 0.9 million. However, this result was not as high as a year ago which recorded a US$ 8.7 million net income, due mainly to increased casualties and despite a reduction the operating costs to net premiums earned ratio from 34.3% to 21.9% and to capital gains mentioned before.
26
Adjustments for | Total | ||||||||||||||||||
US$ Thousand | Net Earnings | Consolidation and | Contribution to | ||||||||||||||||
Period | PPS | PV | EPS | PGA | Minorities | BAP | |||||||||||||
1Q07 | 1,883 | 6,147 | 705 | 8,735 | (2,119 | ) | 6,616 | ||||||||||||
2Q07 | 2,263 | 3,931 | 585 | 6,779 | (1,645 | ) | 5,134 | ||||||||||||
3Q07 | (6,615 | ) | 2,108 | 598 | (3,908 | ) | 948 | (2,960 | ) | ||||||||||
4Q07 | (3,266 | ) | 3,351 | 768 | 853 | (208 | ) | 645.0 | |||||||||||
1Q08 | (121 | ) | 2,544 | 797 | 3,093 | (750 | ) | 2,343 | |||||||||||
VI.2 PACIFICO SEGUROS GENERALES (PPS)
Total premiums in 1Q08 amounted to US$ 66 million, up 2.5% QoQ and 22% YoY. The yearly increase was mainly due to the automobile, technical, dishonesty, theft and SOAT lines.
Furthermore, the strategy to develop the retail products of P&C business in an attempt to diversify risk better and reduce the volatility of income continues having encouraging results. This is however a gradual process that might take more time than hoped, since reducing our participation in the wholesale business, without sacrificing market share is a lengthy process given the volume of retail business necessary to compensate such move. Nevertheless, the premium volumes for automobiles and SOAT (the compulsory third party liability insurance) grew 96% and 117% each when compared with the previous year, while the market grew only 39% in cars and dropped 4% for SOAT. These are certainly encouraging developments.
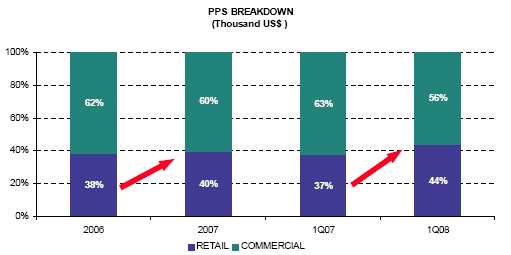
During 1Q08, net claims amounted to US$ 31 million revealing an improvement to 81.4% net earned loss ratio (NEL) ratio from 89.2% reached in 4Q08, but still worse in terms of claims than the 68.7% for 1Q08. The still high level of claims were generated in the automobiles, technical and medical assistance sectors, and are the result of a couple of events: (1) during 1Q08, the northern sector of the country was affected by the “El Niño” phenomenon, which though mild in comparison to other times, still generated significant losses in the agricultural sector, infrastructure and transportation, thus directly affecting the automobiles business. Such casualties might continue still some time. And (2) the financial turmoil and currency volatility which led to the strong revaluation of the Soles, affects the business sectors working with Soles denominated costs inflating those, which is certainly the case of the medical assistance sector.
27
Thus, the increase in claims in the automobiles business results from the increased business volume, more theft of luxury cars and mainly road accidents with heavy trucks and busses due to the torrential rains in the north of the country. Likewise, the increase in the medical assistance sector results from the volume growth, higher reserves and increased costs from the soles denominated costs when translated into our reporting currency, the US Dollar.
As a consequence of the above, technical result during the quarter reached US$ 1.1 million vs. a negative result of US$ -2.8 for 4Q07 and significantly higher US$ 5.0 million for 1Q07.
Operating costs (salaries and administrative costs) reached US$ 9.6 million for 1Q08, reflecting well control of these with only a 1% QoQ increase and 11.5% increase over 1Q07. Furthermore, when comparing operating costs as a percentage of premiums earned, in 1Q08 a 25.1% is reached vs. 25.5% the previous quarter and 30.5% the previous year. Nevertheless, further efforts are being made to continue reducing this ratio.
Net results for the period reached an almost break-even of US$ -121 thousand, reflecting an improvement from the losses of the last quarter, but still showing the signs of high casualties and market turmoil. In terms of market share, PPS reached 33.4% market share in P&C as of March 2008, revealing its improving trend when compared to 31.9% in March 2007.
VI.3 PACIFICO VIDA
Total premiums for the quarter amounted to US$ 44.0 million, up 12% QoQ and 45% YoY, driven in both cases by the growth of individual life and disability and survivor insurance. This growth is the result of the increase in sales force and the introduction to the market of new products, as well as the consolidation of Prima AFP in the pension fund business.
Pacífico Vida
(US$ thousand)
Products | Total Premiums | Change (US$) | Change (%) | |||||||||||||||||||
1Q08 | 4Q07 | 1Q07 | 1Q08 / 1Q07 | 1Q08 / 4Q07 | 1Q08 / 1Q07 | 1Q08 / 4Q07 | ||||||||||||||||
| Individual annuity | 11,988 | 11,027 | 6,930 | (4,097 | ) | (5,058 | ) | -37 | % | -42 | % | |||||||||||
| Individual life | 9,668 | 9,258 | 7,424 | (1,834 | ) | (2,244 | ) | -20 | % | -23 | % | |||||||||||
| Disability & survivor (Pension) | 8,914 | 7,401 | 6,459 | (942 | ) | (2,455 | ) | -13 | % | -28 | % | |||||||||||
| Credit life | 4,199 | 3,238 | 2,030 | (1,208 | ) | (2,169 | ) | -37 | % | -52 | % | |||||||||||
| Group life | 2,636 | 3,057 | 2,451 | (606 | ) | (185 | ) | -20 | % | -7 | % | |||||||||||
| Group life (Law) | 2,312 | 1,538 | 1,856 | 318 | (456 | ) | 21 | % | -20 | % | ||||||||||||
| Limited workers compensation | 2,155 | 1,841 | 1,591 | (250 | ) | (564 | ) | -14 | % | -26 | % | |||||||||||
| Personal accidents | 2,130 | 2,008 | 1,611 | (397 | ) | (519 | ) | -20 | % | -24 | % | |||||||||||
TOTAL | 44,002 | 39,368 | 30,352 | (9,016 | ) | (13,650 | ) | -23 | % | -31 | % | |||||||||||
Claims in 1Q08 reached US$ 20.2 million, US$ 2.3 million higher than in 4Q07 and US$ 5.4 million higher than 1Q07 as a result of the impact of the currency revaluation on the disability and survivor insurance, the business expansion, which requires greater reserves, and the increase in USD value of Soles denominated liabilities.
Technical result of 1Q08 reached a loss of US$ -1.9 million, as a result of the net claims performance explained above.
28
Salaries and administrative expenses were US$ 7.5 million, reflecting a 25% QoQ expansion and 42% on a yearly basis. This increase responds to an investment made to develop a better sales network for the medium term future.
Net earnings after minority interests reached US$ 2.5 million this 1Q08, and thus compares negatively to the previous quarter and year. Though the main reason for this was explained before when looking at technical results and net claims, a portion of these lower results is also explained by an accounting imbalance generated by the effect of inflation on the adjustments made on the asset and liability sides related to the annuity business.
The higher number in sales force and the introduction to the market of new products led to an increase in market share in the Life segment. As of March 2008, it was 28%, revealing a 2% increase of market share compared to a year ago.
VI.4 PACIFICO SALUD (EPS)
Total contributions for 1Q08 reached US$ 28.4 million, up 7% QoQ and 33.5% YoY. This growth was fueled mainly by the contributions of health programs.
Total claims in 1Q08 reached US$ 25.5 million, vs. US$ 21.8 million in 4Q07 and US$ 17.0 million in 1Q07. The NEL ratio increase from 81.3% in 1Q07 to 91.0% in 1Q08 due to higher reserves for claims as a consequence of the growth in claims from last quarter.
Technical results reached US$ 0.9 million, significantly lower than the US$ 3.3 an 3.1 million reached in the 4Q07 and 1Q07 respectively, and largely explained by the greater reserves for claims mentioned.
Operating expenses totaled US$ 2.8 million, showing a 12% increase as a result of a change in policy and inclusion into the EPS of medical personnel previously working under advisory contracts and/or on PPS’s payroll.
Thus, net earnings for 1Q08 reached US$ 0.8 million, similar to the previous quarter and the previous year. In terms of market share, Pacifico maintained its leadership with a commanding 54.3%.
29
VII. ECONOMIC OUTLOOK
Economic Activity
Peru’s economy grew 11.9% in February, more than expected but also the consequence of a longer month. In the last twelve months Peru’s economy expanded 9.2%, driven on the expenditure side, by lively private investment, and by production industries, including construction and non primary manufacturing, responding to greater consumer demand. Mining has likewise recovered significantly in recent months. Construction grew 18.7% from March 2007 to March 2008, reflecting dynamic growth in home, office, commercial and industrial building, and works commissioned by regional governments. Non-primary manufacturing grew 13.0% over the same period, accounted for by larger production of both capital and consumer goods, though throughputs, in particular construction industry-related, evidenced also major advancement. On the contrary, primary manufacturing seems to move at a much slower pace (0.7%). The outlook for the coming months is bright sustained by lively domestic demand, though a slow down might occur in 2008 after continued increases in the legal reserve rates, in both soles and dollars, aimed at pushing market lending rates up, in particular dollar denominated.
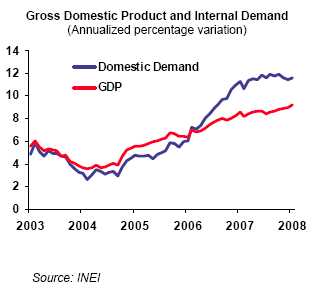
External Sector
The trade balance recorded a US$8.33 billion surplus in the last 12 months, or US$26 million less than the surplus at the end of 2007, as a result of yearly adjusted 45% growth in imports, mainly inputs and consumer goods, higher prices of oil crude and foodstuffs, including wheat, soybean and maize, that more than offset the 27.9% expansion of exports. From March 2007 to February 2008, exports reached US$29.127 billion, with conventional exports growing slightly less (26.7%) than non conventional foreign sales (32.1%). Imports of inputs grew 51.1% while purchases of foreign consumer goods expanded 43%. Imports of capital goods advanced less than average imports (37.7%). After discounting for the price effect, imports grew 34.1% yearly adjusted (31.8% at the end of 2007), reflecting internal demand’s still very lively progress. Last but not least, foreign currency reserves continued to rise and by March had reached an unprecedented US$33,576 million (US$27,689 million at the end of 2007).
30
Exports and imports
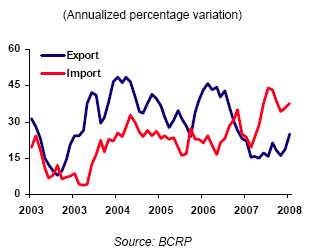
Prices and Exchange rate
Cumulative inflation in Metropolitan Lima over the 12 months ending in March 2008 reached 5.5%, above the Central Bank’s 2%± 1% inflation target and the highest since inflation targeting was introduced in 2002. Price hikes in recent months mainly stem from rises in foodstuffs. Once increases in food prices are removed, inflation reaches a bare 2.3%. Nonetheless, food prices are not escalating only as a consequence of external pressure, and conspicuously so in products with a significant foreign component -─e.g. poultry, edible oil and wheat flour─, but also because of rising prices of locally produced goods, like fruits and vegetables. The Central Bank has moved to introduce moderate increases to its benchmark rate, 25 base points so far this year, but also tried to impact market rates by increasing the mandatory legal reserve for local and foreign currency deposits. By introducing a marginal reserve rate of 120% on deposits in Nuevo sol local currency for non residents, it has also discouraged the massive inflow of short term capitals that had increased during the first quarter this year. As a consequence, the exchange rate reacted in recent days by experiencing some volatility though it fell back to under S/.2.80 to the USD. The March closing exchange rate reached a low S/.2.75, evidencing an annual appreciation of 13.7% (12.0% to April 23). Though the Central Bank’s dollar purchases have slowed down in recent weeks, from April 2007 to March 2008, it bought US$16.2 billion (US$10.3 billion at the end of 2007).
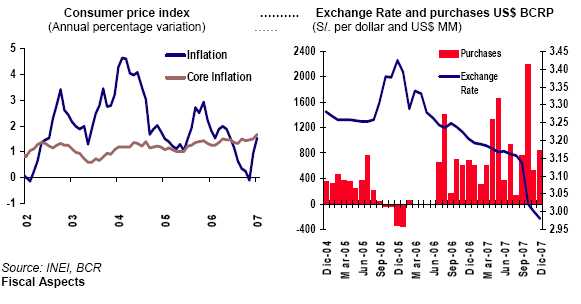
31
Fiscal Aspects
Central government’s tax collection, Income Tax back payments not included, grew 18.4% in real terms compared to one year before, and experienced 17.1% first-quarter-to-first-quarter growth. If income tax back payments are then added, central government’s tax receipts increased a hefty 8.9% in March. The surge took place despite two tariff cuts in force since October. Meanwhile, local demand continues to move at a lively pace. The fiscal landscape however must take account of expanding government spending and investment. Last year, a significant portion of the surplus (3.2% of GDP) resulted from cash savings by regional governments that may be spent this year.
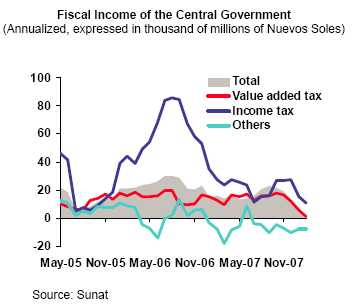
Banking System
Central Bank data to March shows dollar denominated loans in banking companies grew 46.6% annually (40.7% at the end of 2007). Part of the increase however is a consequence of a stronger Nuevo sol in recent months. In Nuevos soles, bank loans grew 26.4% while by end 2007 they had increased 30.9%. Meanwhile, consumer loans grew the fastest annually (55.6% in February and 47.3% at end 2007), although commercial loans also experienced some advance (from 32.2% to 32.6%). Home loans dropped from 16.3% in December to 13.9% in February.
32
Deposits continued to rise and grew 25.7% in soles since February last year (24.2% at the end of 2007). Greater growth was noticed in time deposits, up 30.1%, though demand deposits also moved quickly, or at 25.8% also above average. Savings deposits grew in February at an annual 14.4%.
The banking system’s de-dollarization has speeded up so far this year, in particular dollar denominated deposits that at the end of 2007 made up 59.3% of the total, but fell to 51.9% by February. This trend is accounted for by the patterns followed by term deposits where dollar denominated liabilities fell from 65.7% to 54.7%, although smaller demand dollar denominated deposits were also noticed (a fall from 48.3% to 45.6%) as well as in savings deposits (from 56.7% to 52.2%). Dollar denominated loans have dropped to 60.5% of the total, down from 61.8% at the end of 2007, in particular because of behavior in the micro companies segment, where dollarization fell from 23.6% to 20.9% and in home loans where dollar denominated loans slipped from 80.2% to 78.1%. Over the same period dollar denominated commercial loans increased slightly, from 72.8% to 73.2%.
Interest rates have been stable or rising slightly in recent months, in line with the Central Bank’s objective to gradually slow down the growth of credit and overheating the economy. Rates charged by banks in local currency (TAMN) closed March at 23.9%, compared to 22.3% at the end of 2007, while the corresponding rate in dollars remained relatively stable and reached 10.3% at the end of the third quarter, compared to 10.5% at the end of 2007. The borrowing rates in Nuevos soles (TIPMN) and in dollars (TIPEX) closed March at 3.3% and 2.6% respectively, slightly above the 3.3% and 2.5% at the end of 2006
Main Financial Indicators
2005 | 2006 | 2007 | ||||||||||||||||||||||||||||||||
Year | IQ | IIQ | IIIQ | IVQ | Year | IQ | IIQ | Year (F) | ||||||||||||||||||||||||||
| GDP (US$ MM) | 79,341 | 20,352 | 24,203 | 23,469 | 25,049 | 93,377 | 24,247 | 27,910 | 27,046 | 30,014 | 109,217 | |||||||||||||||||||||||
| Real GDP (var. %) | 6.4 | 7.6 | 6.1 | 8.7 | 8.5 | 8.0 | 7.5 | 8.5 | 8.9 | 9.7 | 9.0 | |||||||||||||||||||||||
| GDP per-cápita (US$) | 2,928 | 3,004 | 3,572 | 3,464 | 3,534 | 3,294 | 3,510 | 4,029 | 3,892 | 4,307 | 3,935 | |||||||||||||||||||||||
| Domestic demand (var. %) | 5.5 | 10.7 | 7.2 | 10.6 | 12.5 | 10.4 | 10.4 | 10.9 | 13.0 | 11.3 | 11.6 | |||||||||||||||||||||||
| Consumption (var. %) | 4.4 | 5.3 | 5.4 | 6.4 | 7.4 | 6.6 | 7.4 | 8.1 | 8.0 | 8.9 | 8.3 | |||||||||||||||||||||||
| Private Investment (var. %) | 13.6 | 22.2 | 16.5 | 16.7 | 31.5 | 26.3 | 17.2 | 22.5 | 27.9 | 22.6 | 22.7 | |||||||||||||||||||||||
| CPI (annual change, %) | 1.5 | 2.5 | 1.8 | 2.0 | 1.5 | 1.1 | 0.3 | 1.6 | 2.8 | 3.9 | 3.9 | |||||||||||||||||||||||
| Exchange rate, eop (S/ . per US$) | 3.43 | 3.36 | 3.26 | 3.25 | 3.20 | 3.20 | 3.19 | 3.17 | 3.09 | 3.00 | 3.00 | |||||||||||||||||||||||
| Devaluation (annual change, %) | 4.5 | 2.9 | 0.2 | -2.8 | -6.8 | -6.8 | -5.1 | -2.8 | -5.0 | -6.1 | -6.1 | |||||||||||||||||||||||
| Exchange rate, average (S/ . per US$) | 3.30 | 3.34 | 3.29 | 3.24 | 3.22 | 3.27 | 3.19 | 3.17 | 3.14 | 2.98 | 3.12 | |||||||||||||||||||||||
| Non-Financial Public Sector (% of GDP) | -0.3 | 3.9 | 5.7 | 1.4 | -2.6 | 2.1 | 4.8 | 8.0 | 2.1 | -2.4 | 3.2 | |||||||||||||||||||||||
| Central government current revenues (% of GD | 15.7 | 17.8 | 18.4 | 16.6 | 16.2 | 17.3 | 17.3 | 20.1 | 17.4 | 16.9 | 17.9 | |||||||||||||||||||||||
| Tax Income (% of GDP) | 13.6 | 15.2 | 16.3 | 14.2 | 14.0 | 14.9 | 15.0 | 17.4 | 14.9 | 14.5 | 15.4 | |||||||||||||||||||||||
| Non Tax Income (% of GDP) | 2.1 | 2.6 | 2.1 | 2.4 | 2.1 | 2.4 | 2.3 | 2.8 | 2.5 | 2.5 | 2.5 | |||||||||||||||||||||||
| Current expenditures (% of GDP) | 12.8 | 11.8 | 10.7 | 12.5 | 13.6 | 12.2 | 11.7 | 14.0 | 11.4 | 12.9 | 12.5 | |||||||||||||||||||||||
| Capital expenditures (% of GDP) | 1.9 | 0.8 | 1.3 | 2.4 | 3.2 | 2.0 | 0.8 | 1.3 | 2.2 | 4.1 | 2.2 | |||||||||||||||||||||||
| Trade Balance (US$ MM) | 5,260 | 1,245 | 2,162 | 2,828 | 2,529 | 8,853 | 1,421 | 2,244 | 2,300 | 2,273 | 8,357 | |||||||||||||||||||||||
| Exports (US$ MM) | 17,336 | 4,631 | 5,799 | 6,503 | 6,709 | 23,750 | 5,647 | 6,741 | 7,594 | 7,874 | 27,956 | |||||||||||||||||||||||
| Imports (US$ MM) | 12,076 | -3,386 | -3,637 | -3,675 | 4,180 | 14,897 | -4,225 | 4,497 | 5,294 | 5,601 | 19,599 | |||||||||||||||||||||||
| Current Account Balance (US$ MM) | 1,105 | -227 | 401 | 1,199 | 957 | 2,456 | -83 | 370 | 502 | 549 | 1,516 | |||||||||||||||||||||||
| Current Account Balance (% of GDP) | 1.4 | -1.1 | 1.7 | 5.1 | 3.8 | 2.6 | -0.3 | 1.3 | 1.9 | 1.8 | 1.4 | |||||||||||||||||||||||
33
Company Description:
Credicorp Ltd. (NYSE: BAP) is the leading financial services holding company in Peru. It primarily operates via its four principal Subsidiaries: Banco de Credito del Peru (BCP), Atlantic Security Holding Corporation (ASHC), El Pacífico-Peruano Suiza Compañía de Seguros y Reaseguros (PPS) and Grupo Credito. Credicorp is engaged principally in commercial banking (including trade finance, corporate finance and leasing services), insurance (including commercial property, transportation and marine hull, automobile, life, health and pension fund underwriting insurance) and investment banking (including brokerage services, asset management, trust, custody and securitization services, trading and investment). BCP is the Company's primary subsidiary.
Safe Harbor for forward-looking statements:
This material includes “forward-looking statements” within the meaning of Section 21E of the Securities Exchange Act of 1934. All statement other than statements of historical information provided herein are forward-looking and may contain information about financial results, economic conditions, trends and known uncertainties.
The Company cautions readers that actual results could differ materially from those expected by the Company, depending on the outcome of certain factors, including, without limitation: (1) adverse changes in the Peruvian economy with respect to the rates of inflation, economic growth, currency devaluation, and other factors, (2) adverse changes in the Peruvian political situation, including, without limitation, the reversal of market-oriented reforms and economic recovery measures, or the failure of such measures and reforms to achieve their goals, and (3) adverse changes in the markets in which the Company operates, including increased competition, decreased demand for financial services, and other factors. Readers are cautioned not to place undue reliance on these forward-looking statements, which speak only as of the date hereof.
The Company undertakes no obligation to release publicly the result of any revisions to these forward-looking statements which may be made to reflect events or circumstances after the date hereof, including, without limitation, changes in the Company’s business strategy or planned capital expenditures, or to reflect the occurrence of unanticipated events.
34
CREDICORP LTD. AND SUBSIDIARIES | ||||||||||||||||
CONSOLIDATED BALANCE SHEETS | ||||||||||||||||
(In US$ thousands, IFRS) | ||||||||||||||||
As of | ||||||||||||||||
March 2008 | December 2007 | March 2007 | Mar 08/ Mar 07 | Mar 08/ Dec 07 | ||||||||||||
Assets | ||||||||||||||||
Cash and due from banks | ||||||||||||||||
| Non-interest bearing | 585,618 | 620,918 | 544,933 | 7.5 | % | -5.7 | % | |||||||||
| Interest bearing | 2,195,174 | 2,452,947 | 1,950,342 | 12.6 | % | -10.5 | % | |||||||||
| Total cash and due from banks | 2,780,792 | 3,073,865 | 2,495,276 | 11.4 | % | -9.5 | % | |||||||||
Marketable securities, net | 41,538 | 50,995 | 61,536 | -32.5 | % | -18.5 | % | |||||||||
Loans | 8,919,841 | 8,250,819 | 6,239,870 | 42.9 | % | 8.1 | % | |||||||||
| Current | 8,848,671 | 8,189,331 | 6,165,394 | 43.5 | % | 8.1 | % | |||||||||
| Past Due | 71,169 | 61,488 | 74,477 | -4.4 | % | 15.7 | % | |||||||||
| Less - Reserve for possible loan losses | (220,617 | ) | (211,319 | ) | (187,211 | ) | 17.8 | % | 4.4 | % | ||||||
Loans, net | 8,699,223 | 8,039,500 | 6,052,659 | 43.7 | % | 8.2 | % | |||||||||
Investments securities available for sale | 6,802,999 | 5,228,641 | 4,029,155 | 68.8 | % | 30.1 | % | |||||||||
Reinsurance assets | 112,457 | 116,141 | 41,735 | 169.5 | % | -3.2 | % | |||||||||
Premiums and other policyholder receivables | 94,406 | 85,495 | 65,321 | 44.5 | % | 10.4 | % | |||||||||
Property, plant and equipment, net | 275,206 | 274,935 | 252,451 | 9.0 | % | 0.1 | % | |||||||||
Due from customers on acceptances | 49,637 | 35,901 | 31,082 | 59.7 | % | 38.3 | % | |||||||||
Other assets | 1,089,004 | 800,425 | 701,840 | 55.2 | % | 36.1 | % | |||||||||
Total Assets | 19,945,264 | 17,705,898 | 13,731,054 | 45.3 | % | 12.6 | % | |||||||||
Liabilities and shareholders' equity | ||||||||||||||||
Deposits and Obligations | ||||||||||||||||
| Non-interest bearing | 2,875,990 | 2,926,308 | 2,293,349 | 25.4 | % | -1.7 | % | |||||||||
| Interest bearing | 10,053,298 | 8,474,967 | 7,043,170 | 42.7 | % | 18.6 | % | |||||||||
| Total deposits and Obligations | 12,929,288 | 11,401,275 | 9,336,519 | 38.5 | % | 13.4 | % | |||||||||
Due to banks and correspondents | 2,439,363 | 2,323,665 | 1,019,200 | 139.3 | % | 5.0 | % | |||||||||
Acceptances outstanding | 49,637 | 35,901 | 31,082 | 59.7 | % | 38.3 | % | |||||||||
Reserves for property and casualty claims | 742,774 | 688,249 | 562,075 | 32.1 | % | 7.9 | % | |||||||||
Reserve for unearned premiums | 127,285 | 127,278 | 88,080 | 44.5 | % | 0.0 | % | |||||||||
Reinsurance payable | 24,444 | 21,914 | 25,856 | -5.5 | % | 11.5 | % | |||||||||
Bonds and subordinated debt | 743,065 | 702,298 | 481,521 | 54.3 | % | 5.8 | % | |||||||||
Other liabilities | 899,350 | 590,045 | 640,988 | 40.3 | % | 52.4 | % | |||||||||
Minority interest | 139,378 | 139,264 | 125,018 | 11.5 | % | 0.1 | % | |||||||||
Total liabilities | 18,094,584 | 16,029,889 | 12,310,338 | 47.0 | % | 12.9 | % | |||||||||
Net Shareholder's equity | 1,850,680 | 1,676,009 | 1,420,716 | 30.3 | % | 10.4 | % | |||||||||
Total liabilities and net shareholder's equity | 19,945,264 | 17,705,898 | 13,731,054 | 45.3 | % | 12.6 | % | |||||||||
Contingent Credits | 6,066,208 | 5,035,068 | 4,061,570 | 49.4 | % | 20.5 | % | |||||||||
35
CREDICORP LTD. AND SUBSIDIARIES
QUARTERLY INCOME STATEMENT
(In US$ thousands, IFRS)
Quarter | Change | Year ended | Change | |||||||||||||||||||||||||
1Q08 | 4Q07 | 1Q07 | 1Q08/ 1Q07 | 1Q08/ 4Q07 | March 2008 | March 2007 | March 08/ March 07 | |||||||||||||||||||||
Interest income and expense | ||||||||||||||||||||||||||||
| Interest and dividend income | 325,264 | 325,969 | 220,847 | 47.3 | % | -0.2 | % | 325,264 | 220,847 | 47.3 | % | |||||||||||||||||
| Interest expense | (133,174 | ) | (151,213 | ) | (81,988 | ) | 62.4 | % | -11.9 | % | (133,174 | ) | (81,988 | ) | 62.4 | % | ||||||||||||
| Net interest and dividend income | 192,090 | 174,756 | 138,859 | 38.3 | % | 9.9 | % | 192,090 | 138,859 | 38.3 | % | |||||||||||||||||
Provision for loan losses | (16,148 | ) | (9,926 | ) | (4,418 | ) | 265.5 | % | 62.7 | % | (16,148 | ) | (4,418 | ) | 265.5 | % | ||||||||||||
Non financial income | ||||||||||||||||||||||||||||
| Fee income | 99,231 | 88,314 | 74,076 | 34.0 | % | 12.4 | % | 99,231 | 74,076 | 34.0 | % | |||||||||||||||||
| Net gain on foreign exchange transactions | 20,606 | 22,316 | 11,956 | 72.4 | % | -7.7 | % | 20,606 | 11,956 | 72.4 | % | |||||||||||||||||
| Net gain on sales of securities | 24,230 | 3,643 | 17,945 | 35.0 | % | 565.0 | % | 24,230 | 17,945 | 35.0 | % | |||||||||||||||||
| Other | 7,982 | 7,769 | 7,217 | 10.6 | % | 2.7 | % | 7,982 | 7,217 | 10.6 | % | |||||||||||||||||
Total fees and income from services, net | 152,048 | 122,043 | 111,194 | 36.7 | % | 24.6 | % | 152,048 | 111,194 | 20.7 | % | |||||||||||||||||
Insurance premiums and claims | ||||||||||||||||||||||||||||
| Net premiums earned | 88,390 | 81,113 | 69,991 | 26.3 | % | 9.0 | % | 88,390 | 69,991 | 26.3 | % | |||||||||||||||||
| Net claims incurred | (19,854 | ) | (20,516 | ) | (13,539 | ) | 46.6 | % | -3.2 | % | (19,854 | ) | (13,539 | ) | 46.6 | % | ||||||||||||
| Increase in cost for life and health policies | (56,237 | ) | (48,374 | ) | (39,089 | ) | 43.9 | % | 16.3 | % | (56,237 | ) | (39,089 | ) | 43.9 | % | ||||||||||||
| Total other operating income, net | 12,298 | 12,222 | 17,363 | -29.2 | % | 0.6 | % | 12,298 | 17,363 | -29.2 | % | |||||||||||||||||
Operating expenses | ||||||||||||||||||||||||||||
| Salaries and employees benefits | (88,724 | ) | (89,585 | ) | (68,978 | ) | 28.6 | % | -1.0 | % | (88,724 | ) | (68,978 | ) | 28.6 | % | ||||||||||||
| Administrative, general and tax expenses | (58,396 | ) | (66,366 | ) | (43,843 | ) | 33.2 | % | -12.0 | % | (58,396 | ) | (43,843 | ) | 33.2 | % | ||||||||||||
| Depreciation and amortization | (13,733 | ) | (13,363 | ) | (12,465 | ) | 10.2 | % | 2.8 | % | (13,733 | ) | (12,465 | ) | 10.2 | % | ||||||||||||
| Merger Expenses | - | - | - | 100.0 | % | 100.0 | % | - | - | 0.0 | % | |||||||||||||||||
| Other | (24,678 | ) | (24,012 | ) | (24,524 | ) | 0.6 | % | 2.8 | % | (24,678 | ) | (24,524 | ) | 0.6 | % | ||||||||||||
| Total operating expenses | (185,532 | ) | (193,327 | ) | (149,810 | ) | 23.8 | % | -4.0 | % | (185,532 | ) | (149,810 | ) | 23.8 | % | ||||||||||||
Net Income before translation results,workers' profit sharing and income taxes | 154,757 | 105,768 | 113,188 | 36.7 | % | 46.3 | % | 154,757 | 113,188 | 36.7 | % | |||||||||||||||||
| Workers’ profit sharing | (5,417 | ) | (2,046 | ) | (3,762 | ) | 44.0 | % | 164.7 | % | ||||||||||||||||||
| Income taxes | (33,309 | ) | (22,559 | ) | (24,162 | ) | 37.9 | % | 47.7 | % | ||||||||||||||||||
| Minority interest | (6,728 | ) | (4,590 | ) | (7,897 | ) | -14.8 | % | 46.6 | % | ||||||||||||||||||
Net income attributed to Credicorp before translation result | 109,303 | 76,573 | 77,368 | 41.3 | % | 42.7 | % | |||||||||||||||||||||
| Translation result | 68,695 | 17,442 | 1,645 | 4075.4 | % | 293.8 | % | 68,695 | 1,645 | 4075.4 | % | |||||||||||||||||
Net income attributed to Credicorp | 177,998 | 94,016 | 79,013 | 125.3 | % | 89.3 | % | 177,998 | 79,013 | 125.3 | % | |||||||||||||||||
36
CREDICORP LTD. AND SUBSISIARIES | ||||||||||||||||
SELECTED FINANCIAL INDICATORS | ||||||||||||||||
Quarter | Year ended | |||||||||||||||
1Q08 | 4Q07 | 1Q07 | Mar 08 | Mar 07 | ||||||||||||
Profitability | ||||||||||||||||
| Net income per common share (US$ per share)(1) | 2.23 | 1.18 | 0.99 | 2.23 | 0.99 | |||||||||||
| Net interest margin on interest earning assets (2) | 5.09 | % | 5.18 | % | 5.15 | % | 5.83 | % | 5.46 | % | ||||||
| Return on average total assets (2)(3) | 3.78 | % | 2.25 | % | 2.55 | % | 1.08 | % | 0.66 | % | ||||||
| Return on average shareholders' equity (2)(3) | 40.38 | % | 22.94 | % | 23.47 | % | 40.91 | % | 22.06 | % | ||||||
| No. of outstanding shares (millions)(4) | 79.76 | 79.76 | 79.76 | 79.76 | 79.76 | |||||||||||
Quality of loan portfolio | ||||||||||||||||
| Past due loans as a percentage of total loans | 0.80 | % | 0.75 | % | 1.19 | % | 0.80 | % | 1.19 | % | ||||||
| Reserves for loan losses as a percentage of | ||||||||||||||||
| total past due loans | 309.99 | % | 343.68 | % | 251.37 | % | 309.99 | % | 251.37 | % | ||||||
| Reserves for loan losses as a percentage of | ||||||||||||||||
| total loans | 2.47 | % | 4.04 | % | 3.00 | % | 2.47 | % | 3.00 | % | ||||||
Operating efficiency | ||||||||||||||||
| Oper. expense as a percent. of total income (5) | 40.18 | % | 46.20 | % | 42.49 | % | 40.18 | % | 42.49 | % | ||||||
| Oper. expense as a percent. of av. tot. assets(2)(3)(5) | 3.42 | % | 4.04 | % | 4.05 | % | 3.92 | % | 4.16 | % | ||||||
Average balances (millions of US$) (3) | ||||||||||||||||
| Interest earning assets | 15,100 | 13,498 | 10,784 | 13,189 | 10,178 | |||||||||||
| Total Assets | 18,826 | 16,744 | 12,370 | 16,411 | 12,053 | |||||||||||
| Net equity | 1,763 | 1,640 | 1,347 | 1,612 | 1,285 | |||||||||||
(1) Based on Net Income attributed to BAP. Number of shares outstanding of 79.8 million in all periods. | ||||||||||||||||
(2) Ratios are annualized. | ||||||||||||||||
(3) Averages are determined as the average of period-beginning and period-ending balances. | ||||||||||||||||
(4) Net of treasury shares. The total number of shares was of 94.38 million. | ||||||||||||||||
(5) Total income includes net interest income, fee income, net gain on foreign exchange transactions and net premiums earned. Operating expense does not include Other expenses. | ||||||||||||||||
(6) For holding's financial institutions. | ||||||||||||||||
(7) Risk-weighted assets include market risk. |
37
BANCO DE CREDITO DEL PERU AND SUBSIDIARIES | ||||||||||||||||
CONSOLIDATED BALANCE SHEET | ||||||||||||||||
(In US$ thousands, IFRS) | ||||||||||||||||
As of | Mar-08/ Mar-07 | Mar-08/ Dec-07 | ||||||||||||||
Mar-08 | Dec-07 | Mar-07 | ||||||||||||||
ASSETS | ||||||||||||||||
Cash and due from banks | 2,640,741 | 2,765,209 | 2,343,833 | 12.7 | % | -4.5 | % | |||||||||
| Cash and BCRP | 2,304,499 | 2,362,339 | 1,834,901 | 25.6 | % | -2.4 | % | |||||||||
| Deposits in other Banks | 330,662 | 393,042 | 500,540 | -33.9 | % | -15.9 | % | |||||||||
| Interbanks | 1,468 | 5,000 | 4,542 | -67.7 | % | -70.6 | % | |||||||||
| Accrued interest on cash and due from banks | 4,111 | 4,828 | 3,850 | 6.8 | % | -14.8 | % | |||||||||
Marketable securities, net | 38,538 | 102,316 | 54,505 | -29.3 | % | -62.3 | % | |||||||||
Loans | ||||||||||||||||
| Current | 8,767,674 | 8,164,334 | 6,109,064 | 43.5 | % | 7.4 | % | |||||||||
| Past Due | 70,015 | 60,279 | 73,237 | -4.4 | % | 16.2 | % | |||||||||
| Less - Reserve for possible loan losses | (219,295 | ) | (212,060 | ) | (184,627 | ) | 18.8 | % | 3.4 | % | ||||||
Loans, net | 8,618,394 | 8,012,553 | 5,997,673 | 43.7 | % | 7.6 | % | |||||||||
Investment securities available for sale | 4,928,259 | 3,377,263 | 2,344,510 | 110.2 | % | 45.9 | % | |||||||||
Property, plant and equipment, net | 217,746 | 217,049 | 192,113 | 13.3 | % | 0.3 | % | |||||||||
Due from customers acceptances | 49,594 | 35,822 | 30,972 | 60.1 | % | 38.4 | % | |||||||||
Other assets | 806,106 | 661,126 | 439,584 | 83.4 | % | 21.9 | % | |||||||||
Total Assets | 17,299,378 | 15,171,338 | 11,403,190 | 51.7 | % | 14.0 | % | |||||||||
LIABILITIES AND SHAREHOLDERS' EQUITY | ||||||||||||||||
Deposits and obligations | 12,938,927 | 11,249,104 | 8,842,654 | 46.3 | % | 15.0 | % | |||||||||
| Demand deposits | 3,726,879 | 3,656,678 | 2,985,931 | 24.8 | % | 1.9 | % | |||||||||
| Saving deposits | 2,749,983 | 2,381,012 | 2,066,269 | 33.1 | % | 15.5 | % | |||||||||
| Time deposits | 5,543,993 | 4,268,233 | 3,021,401 | 83.5 | % | 29.9 | % | |||||||||
| Severance indemnity deposits (CTS) | 859,630 | 896,283 | 733,835 | 17.1 | % | -4.1 | % | |||||||||
| Interest payable | 58,442 | 46,899 | 35,219 | 65.9 | % | 24.6 | % | |||||||||
| Due to banks and correspondents | 1,538,238 | 1,459,359 | 560,691 | 174.3 | % | 5.4 | % | |||||||||
Bonds and subordinated debt | 768,783 | 721,056 | 517,313 | 48.6 | % | 6.6 | % | |||||||||
Acceptances outstanding | 49,594 | 35,822 | 30,972 | 60.1 | % | 38.4 | % | |||||||||
Other liabilities | 808,248 | 573,433 | 570,074 | 41.8 | % | 40.9 | % | |||||||||
Total liabilities | 16,103,791 | 14,038,774 | 10,521,705 | 53.1 | % | 14.7 | % | |||||||||
NET SHAREHOLDERS' EQUITY | 1,195,587 | 1,132,564 | 881,485 | 35.6 | % | 5.6 | % | |||||||||
| Capital stock | 364,706 | 364,706 | 364,706 | 0.0 | % | 0.0 | % | |||||||||
| Reserves | 388,062 | 282,189 | 282,189 | 37.5 | % | 37.5 | % | |||||||||
| Unrealized Gains and Losses | 90,285 | 57,771 | 65,449 | 37.9 | % | 56.3 | % | |||||||||
| Retained Earnings | 186,761 | 96,245 | 96,484 | 93.6 | % | 94.0 | % | |||||||||
| Income for the year | 165,772 | 331,652 | 72,657 | 128.2 | % | -50.0 | % | |||||||||
TOTAL LIABILITIES and NET SHAREHOLDERS' EQUITY | 17,299,378 | 15,171,338 | 11,403,190 | 51.7 | % | 14.0 | % | |||||||||
CONTINGENT CREDITS | 6,071,114 | 5,011,497 | 3,740,352 | 62.3 | % | 21.1 | % | |||||||||
38
BANCO DE CREDITO DEL PERU AND SUBSIDIARIES
QUARTERLY INCOME STATEMENT
(In US$ thousands, IFRS)
Three months ended | Change | |||||||||||||||
1Q08 | 4Q07 | 1Q07 | 1Q08/ 1Q07 | 1Q08/ 4Q07 | ||||||||||||
Interest income and expense | ||||||||||||||||
| Interest and dividend income | 296,660 | 272,204 | 195,388 | 51.8 | % | 9.0 | % | |||||||||
| Interest expense | (124,049 | ) | (116,640 | ) | (72,098 | ) | 72.1 | % | 6.4 | % | ||||||
| Net interest and dividend income | 172,611 | 155,565 | 123,289 | 40.0 | % | 11.0 | % | |||||||||
Provision for loan losses | (16,951 | ) | (11,089 | ) | (5,859 | ) | 189.3 | % | 52.9 | % | ||||||
Non financial income | ||||||||||||||||
| Banking services commissions | 79,747 | 76,708 | 62,470 | 27.7 | % | 4.0 | % | |||||||||
| Net gain on foreign exchange transactions | 19,971 | 21,497 | 11,937 | 67.3 | % | -7.1 | % | |||||||||
| Net gain on sales of securities | 22,655 | 2,661 | 9,210 | 146.0 | % | 751.5 | % | |||||||||
| Other | 2,190 | 2,592 | 2,638 | -17.0 | % | -15.5 | % | |||||||||
| Total fees and income from services, net | 124,563 | 103,458 | 86,255 | 44.4 | % | 20.4 | % | |||||||||
Operating expenses | ||||||||||||||||
| Salaries and employees benefits | (70,553 | ) | (75,147 | ) | (51,302 | ) | 37.5 | % | -6.1 | % | ||||||
| Administrative expenses | (48,520 | ) | (59,234 | ) | (37,755 | ) | 28.5 | % | -18.1 | % | ||||||
| Depreciation and amortization | (10,364 | ) | (10,000 | ) | (9,423 | ) | 10.0 | % | 3.6 | % | ||||||
| Other | (8,898 | ) | (7,485 | ) | (9,738 | ) | -8.6 | % | 18.9 | % | ||||||
| Total operating expenses | (138,335 | ) | (151,867 | ) | (108,218 | ) | 27.8 | % | -8.9 | % | ||||||
Net income before worker´s profit sharing and income taxes | 141,888 | 96,068 | 95,467 | 48.6 | % | 47.7 | % | |||||||||
| Workers’ profit sharing | (5,073 | ) | (1,813 | ) | (3,181 | ) | 59.5 | % | 179.8 | % | ||||||
| Income taxes | (28,292 | ) | (23,310 | ) | (20,940 | ) | 35.1 | % | 21.4 | % | ||||||
Net income before translation results | 108,523 | 70,945 | 71,347 | 52.1 | % | 53.0 | % | |||||||||
| Translation result | 57,249 | 15,253 | 1,310 | 4270.1 | % | 275.3 | % | |||||||||
Net income | 165,772 | 86,198 | 72,657 | 128.2 | % | 92.3 | % | |||||||||
39
BANCO DE CREDITO DEL PERU AND SUBSIDIARIES | ||||||||||||||||
SELECTED FINANCIAL INDICATORS | ||||||||||||||||
Three months ended | Three months ended | |||||||||||||||
1Q08 | 4Q07 | 1Q07 | Mar-08 | Mar-07 | ||||||||||||
| 11 | 10 | 7 | 13 | 14 | ||||||||||||
Profitability | ||||||||||||||||
| Net income per common share (US$ per share)(1) | 0.129 | 0.067 | 0.057 | 0.129 | 0.057 | |||||||||||
| Net interest margin on interest earning assets (2) | 5.07 | % | 5.17 | % | 5.22 | % | 5.87 | % | 5.55 | % | ||||||
| Return on average total assets (2)(3) | 4.08 | % | 2.43 | % | 2.62 | % | 4.75 | % | 2.83 | % | ||||||
| Return on average shareholders' equity (2)(3) | 56.96 | % | 31.67 | % | 31.50 | % | 63.53 | % | 31.87 | % | ||||||
| No. of outstanding shares (millions) | 1,286.53 | 1,286.53 | 1,286.53 | 1,286.53 | 1,286.53 | |||||||||||
Quality of loan portfolio | ||||||||||||||||
| Past due loans as a percentage of total loans | 0.79 | % | 0.73 | % | 1.18 | % | 0.79 | % | 1.18 | % | ||||||
| Reserves for loan losses as a percentage of | ||||||||||||||||
| total past due loans | 313.21 | % | 351.80 | % | 252.10 | % | 313.21 | % | 252.10 | % | ||||||
| Reserves for loan losses as a percentage of | ||||||||||||||||
| total loans | 2.48 | % | 2.58 | % | 2.99 | % | 2.48 | % | 2.99 | % | ||||||
Operating efficiency | ||||||||||||||||
| Oper. expense as a percent. of total income (4) | 47.53 | % | 56.89 | % | 49.81 | % | 47.53 | % | 49.81 | % | ||||||
| Oper. expense as a percent. of av. tot. assets(2)(3)(4) | 3.19 | % | 4.07 | % | 3.55 | % | 3.71 | % | 3.84 | % | ||||||
Capital adequacy | ||||||||||||||||
| Total Regulatory Capital (US$Mn) | 1,274.4 | 1,053.7 | 792.7 | 1,053.7 | 792.7 | |||||||||||
| 'Risk-weighted assets (US$Mn) | 9,168.5 | 8,603.3 | 6,218.2 | 8,603.3 | 6,218.2 | |||||||||||
| Regulatory capital / risk-weighted assets (5) | 13.75 | % | 11.84 | % | 11.84 | % | 13.75 | % | 11.84 | % | ||||||
Average balances (millions of US$) (3) | ||||||||||||||||
| Interest earning assets | 13,613.2 | 12,032.0 | 9,444.0 | 11,761.1 | 8,892.3 | |||||||||||
| Total Assets | 16,235.4 | 14,200.3 | 11,103.2 | 13,965.3 | 10,260.6 | |||||||||||
| Net equity | 1,164.1 | 1,088.8 | 922.7 | 1,043.8 | 912.0 | |||||||||||
(1) Shares outstanding of 1,287 million is used for all periods since shares have been issued only for capitalization of profits and inflation adjustment. |
(2) Ratios are annualized. |
(3) Averages are determined as the average of period-beginning and period-ending balances. |
(4) Total income includes net interest income, fee income and net gain on foreign exchange transactions. Operating expense includes personnel expenses, administrative expenses and depreciation and amortization |
(5) Risk-weighted assets include market risk assets |
40
EL PACIFICO-PERUANO SUIZA AND SUBSIDIARIES | |||||
Chart 8 | |||||
| (in thousand dollars) |
Balance to and for the period | ||||||||||
of three months ending of | ||||||||||
31-Mar-08 | 31-Dec-07 | 31-Mar-07 | ||||||||
1Q08 | 4Q07 | 1Q07 | ||||||||
Results | ||||||||||
| Total premiums | 137,491 | 128,225 | 105,297 | |||||||
| Ceded premiums | 27,294 | 24,050 | 22,355 | |||||||
| Adjustment of reserves | 18,606 | 20,098 | 10,892 | |||||||
Earned net premiums | 91,591 | 84,076 | 72,050 | |||||||
| Direct claims | 97,066 | 97,998 | 56,899 | |||||||
| Ceded claims | 20,975 | 29,108 | 4,271 | |||||||
Net claims | 76,091 | 68,891 | 52,628 | |||||||
| Direct commissions | 10,521 | 9,296 | 7,936 | |||||||
| Commissions Received | 2,443 | 918 | 1,812 | |||||||
Net commissions | 8,078 | 8,378 | 6,124 | |||||||
Net technical expenses | 6,886 | 6,277 | 4,497 | |||||||
Technical results | 535 | 530 | 8,802 | |||||||
Financial income, net | 18,212 | 17,583 | 21,707 | |||||||
| Salaries and benefits | 11,186 | 9,469 | 9,519 | |||||||
| Administrative expenses | 8,913 | 8,430 | 7,977 | |||||||
General Expenses | 20,099 | 17,899 | 17,495 | |||||||
| Other income | 875 | 840 | 523 | |||||||
| Traslation results | 5,924 | 1,779 | 320 | |||||||
| Employee participation and income tax | 795 | (72 | ) | 1,353 | ||||||
Income before Minority Interest | 4,652 | 2,905 | 12,504 | |||||||
| Minority interest | 1,559 | 2,054 | 3,769 | |||||||
Net income | 3,093 | 851 | 8,735 | |||||||
Balance (end of period) | ||||||||||
| Total Assets | 1,257,642 | 1,197,943 | 990,470 | |||||||
| Investment on Securities and Real State (4) | 866,924 | 821,278 | 754,388 | |||||||
| Technical Reserves | 871,313 | 817,510 | 650,968 | |||||||
| Net Equity | 208,946 | 206,103 | 201,777 | |||||||
Ratios | ||||||||||
| Ceded premiums / Total premiums | 19.9 | % | 18.8 | % | 21.2 | % | ||||
| Direct claims / Total premiums | 70.6 | % | 76.4 | % | 54.0 | % | ||||
| Net claims / Earned net premiums | 83.1 | % | 81.9 | % | 73.0 | % | ||||
| Net commissions / Earned net premiums | 8.8 | % | 10.0 | % | 8.5 | % | ||||
| Commissions + technical expenses, net / Earned net premiums | 16.3 | % | 17.4 | % | 14.7 | % | ||||
| Technical results / Total premiums | 0.4 | % | 0.4 | % | 8.4 | % | ||||
| Technical results / Earned net premiums | 0.6 | % | 0.6 | % | 12.2 | % | ||||
| General Expenses / Earned net premiums | 21.9 | % | 21.3 | % | 24.3 | % | ||||
| Net income / Total premiums | 2.2 | % | 0.7 | % | 8.3 | % | ||||
| Return on Equity (1)(2) | 6.1 | % | 1.7 | % | 16.9 | % | ||||
| Return on Total Premiums | 2.2 | % | 0.7 | % | 8.3 | % | ||||
| Net Equity / Total Assets | 16.6 | % | 17.2 | % | 20.4 | % | ||||
| Increase in Thecnical Reserves | 16.9 | % | 19.3 | % | 13.1 | % | ||||
| General expenses / Assets (1)(2) | 6.7 | % | 6.4 | % | 7.5 | % | ||||
Combined Ratio of PPS + PS (3) | 115.6 | % | 118.8 | % | 107.5 | % | ||||
| Net Claims / Earned net premiums | 85.5 | % | 86.1 | % | 73.8 | % | ||||
| General Expenses and Commissions / Earned net premiums | 30.1 | % | 32.7 | % | 33.7 | % | ||||
41
(1) Averages are determined as the average of period-beginning and period-ending balance | ||||||||||
(2) Annualized | ||||||||||
(3) Without consolidated adjustments | ||||||||||
(4) Real State Investment were excluded | ||||||||||
*In order to clarify the following presentation of financial information, we have reclassified the following | ||||||||||
accounts: general expenses, financial income, other income and expenses. | ||||||||||
We have reclassified these accounts for the previous quarters shown in this report for comparisson purposes. | ||||||||||
42
SIGNATURE
Pursuant to the requirements of the Securities Exchange Act of 1934, the registrant has duly caused this report to be signed on its behalf by the undersigned, thereunto duly authorized.
| CREDICORP LTD. | ||
| | | |
| Date: May 7, 2008 | By: | /s/ Guillermo Castillo |
Guillermo Castillo | ||
Authorized Representative | ||