SECURITIES AND EXCHANGE COMMISSION
Washington, D.C. 20549
FORM 6-K
Report of Foreign Private Issuer
Pursuant to Rule 13a-16 or 15d-16 of the
Securities Exchange Act of 1934
For the month of August 2007
CREDICORP LTD.
(Exact name of registrant as specified in its charter)
Clarendon House
Church Street
Hamilton HM 11 Bermuda
(Address of principal executive office)
Indicate by check mark whether the registrant files or will file annual reports under cover Form 20-F or Form 40-F.
Form 20-F x Form 40-F o
Indicate by check mark whether the registrant by furnishing the information contained in this Form is also thereby furnishing the information to the Commission pursuant to Rule 12g3-2(b) under the Securities Exchange Act of 1934.
Yes o No x
 | CREDICORP Ltd. Reports Second Quarter 2008 Earnings Lima, Peru, August 6, 2008 - Credicorp (NYSE:BAP) announced today its unaudited results for the second quarter of 2008. These results are reported on a consolidated basis in accordance with IFRS in nominal U.S. Dollars. HIGHLIGHTS • The continuing strong currency volatility impacted once again Credicorp’s results, though this time a currency translation loss was reported as the USD/Soles exchange rate bounced back, leading to a bottom line net income of US$ 73.7 million. • Focusing on recurrent income and thus excluding such translation gains or losses, Credicorp’s results show an extraordinary 23.7% QoQ earnings growth to US$ 135.2 million vs. US$ 109 million the previous quarter, reflecting the continuing strong growth and income generation of Credicorp’s core businesses. • Such unexpectedly high income volatility is a direct result of the unusually high currency fluctuation experienced locally during this first semester, and the net currency exposure held at each point in time and which is an intrinsic part of our business in a dual currency financial market. Thus, a significant currency translation loss of US$ 61.5 million was reported this 2Q08 while a gain of US$ 68.7 million was reported in 1Q08. • Loan growth reported by the banking business continued strong, revealing a 4.3% QoQ net loan portfolio growth. In fact, retail and SME loan growth is still very strong at 11.4% QoQ growth for the local currency portfolio and 3 % for the USD portfolio. • Interest income was even stronger with a robust 13.4% QoQ growth, led not only by higher interest income from loans, but also strong dividend income. • NIM improves 30 b.p. as the result of higher interest and dividend income at Credicorp’s subsidiaries other than BCP, since NIM at BCP remains flat. • Non financial income shows a QoQ drop mainly related to less gain on the sale of securities which last quarter included large proceeds of the sale of Visa shares. In fact, fee income remained strong and 53% higher FX-transactions’ gains were reached given the strong FX-activity as a result of the high currency exchange volatility. • Loan portfolio quality improved further reaching a PDL/Loans ratio of only 0.75%. Net provisioning also dropped 43% QoQ to US$ 9.2 million given the high coverage ratios and 2.7% QoQ drop in the absolute volume of past due loans. • BCP’s consolidated numbers reflect a very healthy and dynamic banking environment with core revenues up 12% QoQ and 38.1% for the year. Such improved income combined with controlled operating expenses, led to an excellent operating performance with net income, before the currency translation effect reaching US$ 127.9 million, 17.8% higher from the US$ 108.5 million reported in1Q08. • BCP Bolivia, which is consolidated in BCP, continues its consistent growth and reports a strong, though slightly lower contribution of US$ 10 million for 2Q08, 4% lower QoQ and 84% higher YoY. • ASHC remains a stable business and reports also a strong, though 8% lower contribution this quarter of US$ 5.2 million. • PPS, remains troubled by its property and casualty business, which added to higher reserves at its Life and Health businesses and also an important translation loss resulted in a significant loss contribution for this 2Q08 of US$ -7.2 million. • Finally, Prima AFP reports growth of its business and good though lower operating results, but also a translation effect which after having boosted results for 1Q08, led to a loss for 2Q08 of US$ 0.95 million. • Credicorp’s performance is however better reflected by 1H08 results, since the currency translation effects are netted out and neutralized in the course of the semester, leaving the pure commercial results: 58% higher income contribution from BCP, 100% higher income generation at BCP Bolivia, 16% higher income at ASHC, US$ 8 million income contribution from Prima (vs. US$ 1.7 million loss in 1H07), i.e.: earnings generation growth in all businesses except its insurance business which remains today the only problem to solve. This led to the outstanding total net income of US$ 251.6 million for the first half of the year and 28.3% ROAE. |
I. Credicorp Ltd.
Overview
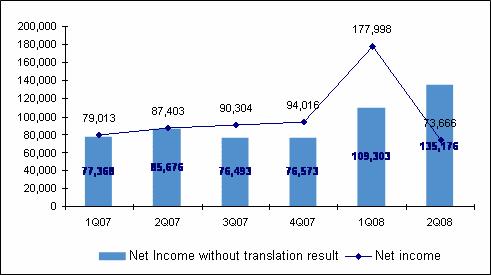
The continuing strong currency volatility experienced in the second quarter impacted once again Credicorp results, though this time a currency translation loss was reported as the USD/Soles exchange rate bounced back, leading to a bottom line net income of US$ 73.7 million compared to US$ 178 million reported for the 1Q08.
Such unexpectedly high income volatility is a direct result of two things: (1) the unusually high currency fluctuation experienced in the local market during this first semester, fueled by the US Dollar weakness in the international markets and some speculative activity based on the strengthening of the local currency, and (2) the natural currency exposure through net balance sheet positions either in Soles or Dollars which is an intrinsic part of our business in a dual currency financial market. Thus, as a result of these two factors, a significant currency translation loss of US$ 61.5 million was reported this 2Q08 while a gain of US$ 68.7 million was reported in 1Q08. Significantly different (basically opposite) results were reported in local currency accounting, where the currency movements generate the contrary effect each time. Therefore, it is very important to understand, that given the dual currency financial market in which we operate, the calculated management of the currency positions is crucial for our business and the decisions are aimed at either increasing gains or minimizing losses, following a consensus view of the currency exchange rate for the future. Nevertheless, we should keep in mind the volatile source and nature of these gains/losses, which can be equally reverted with changing market conditions given the highly uncertain markets.
Therefore, excluding such currency translation gains or losses and focusing on recurrent income, Credicorp’s results show a strong 23.7% QoQ earnings growth to US$ 135.2 million vs. US$ 109 million the previous quarter, reflecting the continuing strong growth and income generation of Credicorp’s core businesses. The following chart isolates such translation results, which reflect an environment with an appreciation trend for the local currency generating gains in US Dollar accounting, and which have only become extremely volatile this year as speculation drove the exchange rate and we took a view on the long term appreciation of the Nuevos Soles.
Credicorp’s excellent core business performance is better appreciated when looking at our accumulated 6 month results, which reflect results clean of the translation impact as they became almost fully neutralized throughout the semester. Thus, net income for 1H08 reached an outstanding US$ 251.7 million, reflecting a 51% higher income from the previous year and a ROAE of 28.3%, outperforming all expectations.
2
Continuing with this approach and excluding such currency translation distortions, Credicorp’s core banking business reported a strong performance, with total loan balances reaching 4.1% QoQ growth. Though slightly understated this time by the devaluation of the Soles loan portfolio, loan growth was fueled mainly by the strong retail segment, while a slowdown of local investment activity led to a flat corporate loan book.
Credicorp Ltd. | Quarter | Change % | ||||||||||||||
| US$ thousands | 2Q08 | 1Q08 | 2Q07 | 2Q08/2Q07 | 2Q08/1Q08 | |||||||||||
| Net Interest income | 216,986 | 191,267 | 159,305 | 36.2 | % | 13.4 | % | |||||||||
| Total provisions, net of recoveries | (9,235 | ) | (16,191 | ) | (6,090 | ) | 51.6 | % | -43.0 | % | ||||||
| Non financial income | 139,967 | 152,144 | 108,026 | 29.6 | % | -8.0 | % | |||||||||
| Insurance premiums and claims | 2,926 | 12,298 | 19,278 | -84.8 | % | -76.2 | % | |||||||||
| Operating expenses | (191,582 | ) | (184,159 | ) | (159,886 | ) | 19.8 | % | 4.0 | % | ||||||
Net income before workers' profit sharing, minority interest and I.T. | 159,062 | 155,359 | 120,633 | 31.9 | % | 2.4 | % | |||||||||
| Worker's profit sharing and income taxes | (23,711 | ) | (39,329 | ) | (28,633 | ) | -17.2 | % | -39.7 | % | ||||||
| Minority Interest | (175 | ) | (6,728 | ) | (6,324 | ) | -97.2 | % | -97.4 | % | ||||||
Net income attributed to BAP before translation result | 135,176 | 109,303 | 85,676 | 57.8 | % | 23.7 | % | |||||||||
| Translation results | (61,510 | ) | 68,695 | 1,728 | -3660.0 | % | -189.5 | % | ||||||||
Net income attributed to Credicorp | 73,666 | 177,998 | 87,403 | -15.7 | % | -58.6 | % | |||||||||
| Net income/share (US$) | 0.92 | 2.23 | 1.10 | -15.7 | % | -58.6 | % | |||||||||
Total loans | 9,288,774 | 8,919,841 | 7,031,734 | 32.1 | % | 4.1 | % | |||||||||
Deposits and Obligations | 12,956,438 | 12,929,288 | 10,152,601 | 27.6 | % | 0.2 | % | |||||||||
| Net Shareholders' Equity | 1,791,066 | 1,850,680 | 1,535,154 | 16.7 | % | -3.2 | % | |||||||||
| Net interest margin* (old methodology) | 5.4 | % | 5.1 | % | 5.5 | % | ||||||||||
| Net interest margin** (new methodology) | 4.8 | % | 4.5 | % | 4.9 | % | ||||||||||
| Efficiency ratio | 37.3 | % | 40.3 | % | 42.2 | % | ||||||||||
| Return on average shareholders' equity | 16.2 | % | 40.4 | % | 26.0 | % | ||||||||||
| PDL/Total loans | 0.7 | % | 0.8 | % | 1.0 | % | ||||||||||
| Coverage ratio of PDLs | 316.3 | % | 310.0 | % | 284.4 | % | ||||||||||
| Employees | 18,169 | 17,275 | ||||||||||||||
| * | The old methodology for the calculation of NIM considered only 70% of the investments available for sale as part of interest earning assets. |
| ** | The new methodology for the calculation of NIM considers 100% of the investments available for sale as interest earning assests. |
NII outperformed this robust loan growth and reached 13.4% QoQ expansion despite the persistent competition and pressure on rates and supported by our expanding interest earning assets through larger investments (incl. Central Bank CD’s and bank deposits).
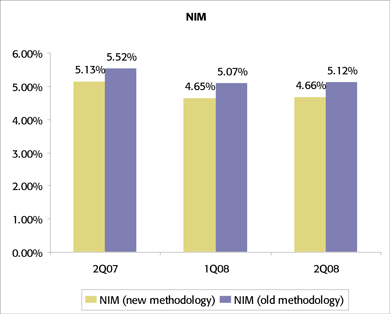
Net interest margin also improves 30 b.p. which stems from a solid though flat net interest margin at BCP, and stronger interest income from other investments at Credicorp. This improvement is reflected by Credicorp’s NIM reaching 5.4% from 5.1% based on the calculation approach used up to date. However, for transparency reasons, we have standardized our NIM calculation methodology, which used to ponder a percentage of interest earnings assets available for sale into the formula, whereas it seemed to be a standard procedure to include ALL interest earning assets into this calculation, which is what we have adopted as of this quarter. Thus the equivalent calculations of NIM result in 4.8% for 2Q08 vs. 4.5% for 1Q08 and 4.9% for 2Q07.
Non Financial income reported an 8% QoQ drop mainly because the previous 1Q08 included relatively large extraordinary one-off gains realized through the sale of Credicorp’s VISA shareholding and also poor results in securities trading. In fact, fee income remained fairly strong though flat, while net gains on FX-transactions was up 53% QoQ given the strong FX-transactional activity fueled by the high volatility of the currency markets.
Though the insurance business reports a good quarterly net premiums growth of 9%, claims in the property and casualty sector continued too high this quarter due to the weather alterations which led to extremely strong torrential rains affecting the northern areas of the country, resulting in 56% higher claims. Life and Health businesses also reported higher provisioning for different though mainly conservative reasons, which led to lower results in the Life business and a loss for the quarter in the Health business. Thus, the insurance business operating income dropped 76%, leading to negative bottom line results.
3
On the cost side, total operating costs were up by a moderate 4% QoQ resulting in an improved efficiency ratio of 37.3% vs. 40.2% the previous quarter and 46.2% at 2007 year end. Such development is a reflection of a good cost control policy and some seasonality in costs. Having said this, we would like to point out that the expansion plans do continue full speed ahead and are a core part of Credicorp’s business strategy, and their impact on costs will be more noticeable in the second half of the year.
Another positive development is the continuing strength of portfolio quality, which remains healthy with a PDL/Loans ratio improving further to 0.75% from 0.8% last 1Q08. Total provisions net of recoveries also lowered to US$ 9.2 million from US$ 16.1 million last quarter, following a drop in the absolute volumes of past due loans and high coverage levels reached. Despite this, we still follow today a more conservative provisioning policy for our retail portfolio, increasing the internal minimum provisioning requirements in line with a more sophisticated risk assessment methodology.
These developments resulted in a somewhat distorted ROAE ratio for the quarter as in the previous quarter: 16.18% for 2Q08, 40.4% for 1Q08 and 22.9% for 4Q07. Adjusting this ROAE excluding the translation impact on income, the numbers would show a more stable evolution: 29.7% for 2Q08, 24.8% for 1Q08 and 23.2% for 2Q07. More importantly, ROAE for the 1H08 reaches this way 28.3%.
Credicorp – the Sum of its Parts
As we have experienced, going through a period of significant volatility can impact results in many different ways. The management of this volatility requires a series of timely financial decisions regarding our currency positions and investments in the different subsidiaries, and is an integral part of our business. Therefore, we are very pleased to see our real performance show once such impact has been fully neutralized, as has happened by the end of the 2Q08.
In fact, BCP reported a significantly depressed income contribution this 2Q08 of US$ 75.98 million, which included an approximate US$ 49.85 million translation loss, though revealing at the same time excellent core business expansion when excluding such translation loss, and confirming this way its expanding earnings generation capacity. This becomes clear when looking at BCP’s 1H08 superb contributions to Credicorp’s earnings of US$ 237.3 million, which reflects real business results given that the currency translation effect gets almost totally neutralized in the 2Q08. These earnings for the 1H08 represent a boost of ROAE to 42.15%, a truly extraordinary number.
| (US$ Thousands) | 2Q08 | 1Q08 | 2Q07 | 2Q08/2Q07 | 2Q08/1Q08 | Jun 08 | Jun 07 | Jun 08/ Jun 07 | |||||||||||||||||
| Banco de Crédito BCP(1) | 75,981 | 161,353 | 79,794 | -5 | % | -53 | % | 237,334 | 150,443 | 58 | % | ||||||||||||||
| BCB | 10,031 | 10,476 | 5,453 | 84 | % | -4 | % | 20,507 | 10,258 | 100 | % | ||||||||||||||
| Atlantic | 5,195 | 5,673 | 4,366 | 19 | % | -8 | % | 10,868 | 9,335 | 16 | % | ||||||||||||||
| PPS | (7,214 | ) | 2,342 | 5,134 | -241 | % | -408 | % | (4,872 | ) | 11,750 | -141 | % | ||||||||||||
| Grupo Crédito (2) | 882 | 9,807 | (585 | ) | -251 | % | -91 | % | 10,689 | 617 | 1632 | % | |||||||||||||
| Prima | (954 | ) | 9,015 | (1,264 | ) | -24 | % | -111 | % | 8,061 | (1,086 | ) | -842 | % | |||||||||||
| Others | 1,836 | 792 | 679 | 171 | % | 132 | % | 2,628 | 1,703 | 54 | % | ||||||||||||||
| Credicorp and Others (3) | (1,178 | ) | (1,178 | ) | (1,307 | ) | -10 | % | 0 | % | (2,355 | ) | (5,729 | ) | -59 | % | |||||||||
| Credicorp Ltd. | (1,723 | ) | (1,724 | ) | (1,765 | ) | -2 | % | 0 | % | (3,446 | ) | (6,443 | ) | -47 | % | |||||||||
| Otras | 545 | 546 | 458 | 0.19 | 0 | % | 1,091 | 714 | 53 | % | |||||||||||||||
Net income attributable to Credicorp | 73,666 | 177,998 | 87,402 | -16 | % | -59 | % | 251,663 | 166,416 | 51 | % | ||||||||||||||
| (1) | Includes Banco de Crédito de Bolivia. |
| (2) | Includes Grupo Crédito, Servicorp and Prima AFP |
| (3) | Includes taxes on BCP's and PPS's dividends, and other expenses at the holding company level. |
BCP Bolivia, which is consolidated within BCP, reported a contribution of US$ 10 million for 2Q08, maintaining its high level despite a significant stagnation of investment activity in the country, which should eventually generate a notorious slowdown, reaching this way a total of US$ 20.5 million contribution for the 1H08.
4
ASHC reports a contribution drop of 8% QoQ reaching US$ 5.2 million for the 2Q08, but on a cumulative basis reports a 16% stronger earnings contribution of US$ 10.9 million for the period. Despite this 2Q08 blip, ASHC’s business is constantly expanding as a result also of the increasing wealth generation in the country, and represents a stable, no-risk investment.
As explained before, though the insurance business reports a good quarterly net premiums growth of 9%, claims in the property and casualty sector continued growing this quarter due to the weather alterations affecting the northern areas of the country with torrential rains. Further, the Life and Health businesses had strong increases in reserves, which added to the translations effects resulted in lower income at the Life business and a loss at the Health business. The combined impact of all these events led to the poor results and loss contribution to Credicorp of US$ -7.2 million for the quarter. This resulted in a US$ -4.9 million loss contribution for the 1H08. Thus, turning the P&C business into a profitable operation continues being PPS’s main focus, though it is proving to be troublesome. Following this objective, significant efforts are being made to develop the more massive and better predictable retail business and limit exposure to the wholesale insurance P&C business, as well as to improve the financial investment management to achieve better returns overall. This process will take more time than expected.
Finally, Prima’s business results were in line with expectations showing good operating profits, but the currency translation effect which improved Prima’s results in 1Q08, depressed its results this 2Q08 leading to a bottom line loss of US$ -0.95 million. Again, the dual currency market, the FX-volatility of the first half of 2008 and our US Dollar reporting generates such translation gains / losses. Net of these, 1H08 results for Prima reflect its performance more accurately, with a US$ 8 million earnings contribution to Credicorp for this 1H08. Prima’s business results are in fact better than expected following the cost reduction efforts of last year and business plan. Prima has established a dominant position in the market, capturing important market shares (31.4% of AuM, 33.7% of collections and 47.2% of voluntary contributions to the funds).
5
II. Banco de Crédito – BCP Consolidated
Summary 2Q08
Consolidated results for BCP this 2Q08 revealed an extraordinarily strong 17.8% QoQ growth of BCP’s net profits before the currency translations effect in 2Q08 reaching US$127.9 million, compared to US$108.5 million in 1Q08, continuing this way its expansion in assets and earnings generation.
However, as explained in the Credicorp section, the strong currency volatility experienced in the last 2 quarters impacted all our businesses’ reported results given our dual currency economy and resulting net currency positions. Thus, while in the first quarter a significant currency translation gain (+US$ 57.2 million) generated by the appreciation of the local currency boosted total net earnings reported in US Dollar IFRS accounting to US$ 165.8 million, this 2Q08 an equally strong currency translation loss (-US$ 49.8 million) was recorded depressing total reported net earnings to US$ 78 million for the quarter.
The excellent business performance of BCP is better revealed by its 1H08 results, since the translation effect is netted out within the semester given the fluctuation of the exchange rate (total currency translation impact for 1H08 of only +US$ 7.4 million). Thus, total net earnings for the first half of the year reached a superb US$ 243.8 million and BCP’s ROAE reached 42.15%, surpassing all expectations.
The continuing growth of BCP’s business is confirmed by the further expansion of total loans (measured as average daily balances for the quarter) which grew 3.3% QoQ. However, this reflects a slow down in loan growth from the 7.8% growth in 1Q08. Nevertheless, this growth differential also includes the impact of the currency fluctuation, which in the 1Q08 inflated loan growth numbers through the revaluation of the Soles and the conversion of the Soles loan portfolio into US Dollars, while in the 2Q08 the contrary effect occurred. It is noteworthy, that this 2Q08, and contrary to the prior quarter, the corporate loan portfolio remained basically unchanged, showing merely a shift from Soles to US Dollar borrowings, whereas the retail segment recovers its growth leading position and grew 6.2% QoQ, with Consumer, SME, mortgages and credit card also showing strong growth in that order.
The overdue/loans ratio remained at a very healthy 0.74%, and did not show any signs of deterioration in any business segment. Past due loans coverage remains at a robust 318.7%, up from last quarter’s 313.2%.
Net provisions fell 39.4% to a net total of US$10.3 million in 2Q08. This change resulted from reversions of gross provisions for Corporate and Middle Market Banking, which compensated stronger provisions in the Retail Banking segment, in particular consumer loans. Stronger Retail segment provisions are not related to a decline in portfolio quality, but rather respond to more conservative policies for that business segment. Likewise, provisions for country risk were also reversed in 2Q08, so gross provisions reached US$16.2 million, while recoveries reached US$6.0 million.
Core Earnings
Core Revenues | Quarter | Change | ||||||||||||||
US$ 000 | 2Q08 | 1Q08 | 2Q07 | 2Q08/2Q07 | 2Q08/1Q08 | |||||||||||
| Net interest and dividend income | 188,359 | 172,611 | 141,146 | 33.4 | % | 9.1 | % | |||||||||
| Fee income, net | 85,228 | 79,747 | 66,986 | 27.2 | % | 6.9 | % | |||||||||
| Net gain on foreign exchange transactions | 31,389 | 19,971 | 12,778 | 145.7 | % | 57.2 | % | |||||||||
Core Revenues | 304,976 | 272,329 | 220,909 | 38.1 | % | 12.0 | % | |||||||||
6
Core revenue generation was robust reaching 12% QoQ. Growth of 2Q08 net interest and dividend income is the main contributor to this and is the result not only from an increased loan portfolio, mainly retail, which resulted in a 7.0% rise in interest income, but also of larger interest from investments, despite their smaller volume in 2Q08 and dividend income. This growth combined with smaller growth of interest expenditure (up by only 5.7%), helped by earnings in rate and currency coverage operations, resulted in an overall excellent growth of net revenues from interests of 9.1% QoQ.
Another element of core earnings, Fee income, continued on its rising trend and grew 6.9% QoQ mainly due to greater earnings from commissions for mortgages, SMEs, personal loans as well as fees on collections and payments. In addition, the volume of transactions, measured as a monthly average increased 9.0% during this quarter, from 32.4 million in 1Q08 to 35.3 million in 2Q08.
Finally, as a result of strong exchange rate volatility in the first half of this year, net earnings from exchange rate operations also increased significantly by 57.2% QoQ, due to the higher volume of monthly average transactions in 2Q08 as the network expanded and the dollar’s volatility increased against the Nuevo Sol, resulting in higher earnings from wider purchase/sale spreads. Altogether, these components resulted in a 12% QoQ total growth of revenues from operations.
Earnings from sales of securities dropped a significant 83.6% during this quarter, from US$22.7 million to US$3.7 million in 2Q08, as a consequence of including windfall earnings from the sale of Visa Intl. shares in 1Q08, the basis for comparison. In addition, volatility in the local and international capital markets was reflected in lower earnings from the sale of securities and higher provisions related to price volatility of securities. This led to a 1.8% QoQ drop in total non-financial revenues.
Banco de Crédito and Subsidiaries | Quarter | Change | ||||||||||||||
| US$ 000 | 2Q08 | 1Q08 | 2Q07 | 2Q08/2Q07 | 2Q08/1Q08 | |||||||||||
| Net interest and dividend income | 188,359 | 172,611 | 141,146 | 33.4 | % | 9.1 | % | |||||||||
| Total provisions, net of recoveries | (10,280 | ) | (16,951 | ) | (6,885 | ) | 49.3 | % | -39.4 | % | ||||||
| Non-financial income | 122,347 | 124,563 | 88,827 | 37.7 | % | -1.8 | % | |||||||||
| Operating expenses | (145,695 | ) | (138,335 | ) | (116,527 | ) | 25.0 | % | 5.3 | % | ||||||
Net incomes before profit sharing and income tax | 154,730 | 141,888 | 106,561 | 45.2 | % | 9.1 | % | |||||||||
| Worker's profit sharing and income taxes | (26,841 | ) | (33,365 | ) | (25,470 | ) | 5.4 | % | -19.6 | % | ||||||
Net income before translation results | 127,889 | 108,523 | 81,091 | 57.7 | % | 17.8 | % | |||||||||
| Tranlation results | (49,850 | ) | 57,249 | 970 | -5239.2 | % | -187.1 | % | ||||||||
Net income | 78,041 | 165,772 | 82,062 | -4.9 | % | -52.9 | % | |||||||||
| Net income/share (US$) | 0.052 | 0.129 | 0.064 | -19.0 | % | -59.9 | % | |||||||||
| Total loans | 9,197,916 | 8,837,689 | 6,989,841 | 31.6 | % | 4.1 | % | |||||||||
| Deposits and obligations | 13,251,408 | 12,938,927 | 9,459,008 | 40.1 | % | 2.4 | % | |||||||||
| Shareholders equity | 1,254,162 | 1,195,587 | 964,164 | 30.1 | % | 4.9 | % | |||||||||
| Net interest margin* (old methodology) | 5.1 | % | 5.1 | % | 5.5 | % | ||||||||||
| Net interest margin** (new methodology) | 4.7 | % | 4.7 | % | 5.1 | % | ||||||||||
| Efficiency ratio | 43.8 | % | 47.5 | % | 49.3 | % | ||||||||||
| Return on average equity | 25.5 | % | 57.0 | % | 35.6 | % | ||||||||||
| PDL/Total loans | 0.7 | % | 0.8 | % | 1.0 | % | ||||||||||
| Coverage ratio of PDLs | 318.7 | % | 313.2 | % | 286.8 | % | ||||||||||
| BIS ratio | 13.5 | % | 13.8 | % | 10.7 | % | ||||||||||
| Branches | 285 | 277 | 249 | |||||||||||||
| ATMs | 801 | 778 | 699 | |||||||||||||
| Agentes BCP | 1,552 | 1,358 | 837 | |||||||||||||
| * | The old methodology for the calculation of NIM considered only 70% of the investments available for sale as part of interest earning assets. |
| ** | The new methodology for the calculation of NIM considers 100% of the investments available for sale as interest earning assests. |
Operating expenses grew 5.3% QoQ, mainly driven by rising personnel and overhead expenditures, which grew 1.9% and 4.4% QoQ, respectively. Both components are intimately related to the cost of an expanding BCP network, not reflected yet as initially planned in the first half this year. Twelve offices have opened to June, to a 285 total, while an additional 63 should open in the second half of 2008.
7
Thus, operating results show a significant improvement reaching a net result, including profit sharing and taxes but before currency translation effects 17.8% higher QoQ, of US$ 127.9 million vs. US$ 108.5 million in 1Q08.
However, as mentioned above, results from currency translation which impacts BCP's net Nuevos Soles position, resulted in a loss in 2Q08 as the local currency devalued, reversing the gains reported in 1Q08 as the currency revalued in that period. Results from translation in 1Q08 revealed a US$.57.2 million profit, while 2Q08 ended in a US$49.9 million loss.
As a consequence of the above results, BCP’s quarterly indicators included an excellent 43.8% efficiency index following larger revenues from operations, excellent portfolio quality with 0.75% delinquencies and 318.7% coverage ratio, and great profitability with 25.5% ROAE, including translation effects. When excluding such effect, BCP’s ROAE for the last periods reaches 41.8% for 2Q08, 37.3% for 1Q08 and 35.15% for 2Q07, which is a better reflection of the improving profitability of BCP’s operations.
II.1 Interest Earning Assets
As a consequence of regulations increasing legal reserves, liquid deposits at BCR rose 24.7%, contributing to the change in composition of interest earning assets in favor of lower yielding assets.
Interest Earning Assets | Quarter | Change | ||||||||||||||
| US$ 000 | 2Q08 | 1Q08 | 2Q07 | 2Q08/2Q07 | 2Q08/1Q08 | |||||||||||
| BCRP and Other Banks | 2,589,828 | 2,077,661 | 1,804,401 | 43.5 | % | 24.7 | % | |||||||||
| Interbank funds | 1,620 | 1,468 | 17,133 | -90.5 | % | 10.3 | % | |||||||||
| Trading Securities | 55,240 | 38,538 | 53,569 | 3.1 | % | 43.3 | % | |||||||||
| Available For Sale Securities | 4,747,724 | 4,928,259 | 2,858,817 | 66.1 | % | -3.7 | % | |||||||||
| Current Loans, net | 9,129,652 | 8,767,674 | 6,923,441 | 31.9 | % | 4.1 | % | |||||||||
Total interest earning assets | 16,524,064 | 15,813,601 | 11,657,361 | 41.7 | % | 4.5 | % | |||||||||
Interest earning assets grew 4.5% QoQ mainly as a result of larger current account deposits in BCRP following the increase in bank’s reserve requirements implemented in April and May. This regulation was one of a series of monetary adjustments implemented during the 1H of the year in order to control inflation and resulted in a 24.7% increase in low yielding bank deposits.
Nevertheless, outstanding loans also showed a great dynamism during the quarter, increasing 4.1%. In addition, there was also a slight reduction in CB CD’s from the previous quarters, as reserve requirements absorbed liquidity. Finally, there was a remarkable increase in trading securities despite the high volatility of capital markets.
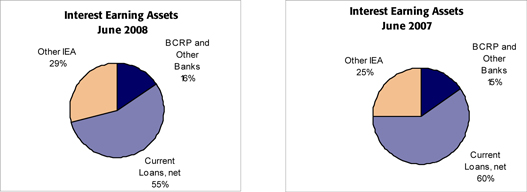
As a result of these movements, a re-composition of IEA in relation to June 2007 worked against our NIM, with our highest yielding assets, loans, dropping its share from 60% to 55% of total IEA. This was initially generated by the increased position in CB CD’s (other IEA) which despite the decrease showed during the 2Q, remained at a high level, because of its attractive after tax yield (given their tax shelter), and was further supported by the increase in bank deposits following the reserve requirements rise.
8
Loan portfolio
The bank’s loan portfolio this quarter continued to grow and reached a total US$ 9.130 million total balance as of June 2008, or 4.1% QoQ and 39.1% YoY growth. Likewise, a study of average daily loans’ growth reveals a 3.3% QoQ and 37.1% YoY growth.
As in the previous quarter, attention must be paid to the impact of the exchange rate which, contrary to 1Q08, depreciated significantly. The dollar’s revaluation depressed the reported growth of soles-denominated loans, which account already for 39% of the total portfolio measured by average outstanding balances for the quarter. Thus, reported figures in US Dollars underscore the strength of the Bank’s growth.
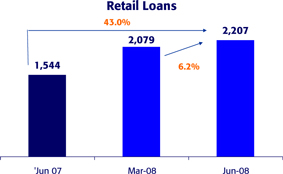
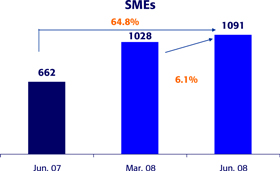
In 2Q08, even including this currency exchange impact on growth numbers, Retail Banking showed the greatest strength by recording a total US$ 3,298 million daily balance and 6.2% QoQ and 49.5% YoY growth, continuing on the consistent expansion trend of recent years. Within Retail Banking, the Consumer segment stands out, after 14% QoQ and 79.2% YoY growth, followed by the SME segment, which expanded 6.1% QoQ and 64.8% YoY. Home and credit card loans grew 3.9% and 2.8% QoQ, and 30.2% and 43.6% YoY, respectively.

9
 |  |
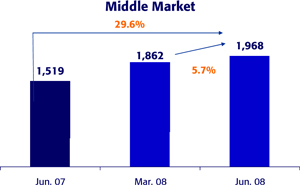
Middle Market Banking also performed strongly this quarter growing at 5.7% QoQ, while annually it expanded 29.6%.
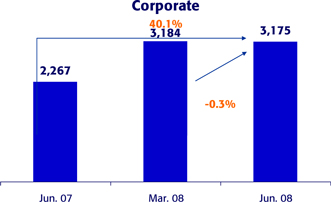
Corporate Banking, on the other hand, performed less strongly than in the previous quarter, reaching US$ 3,174.7 million which represent a slight reduction of -0.3% QoQ. This variation was a consequence of the normalization of portfolio growth after having had unusually high growing periods in a segment where BCP’s has already the highest market share, and a decision to be rigorous in transferring higher funding costs. Consequently, given the strong pressure on rates which characterize this 2Q, we became less competitive.
Furthermore, higher growth in the US$ denominated loan book continued during the quarter, because a market perception of a weaker dollar prevails, despite the reversion that took place in this period, especially in June, and completely offset the drop in the corporate local currency loan book.
10
Given the distortion generated by the currency fluctuations and the fact that BCP’s loan portfolio is in both currencies but reports in US Dollars, it is helpful to look at the evolution of the different loan portfolios by currency to see the real growth in each portfolio. The following chart intends to shed some light over such loan growth analysis…
Domestic Currency Loans | Foreign Currency Loans | ||||||||||||||||||||||||||||||
(Nuevos Soles million) | (US$ million) | ||||||||||||||||||||||||||||||
2Q07 | 1Q08 | 2Q08 | YoY | QoQ | 2Q07 | 1Q08 | 2Q08 | YoY | QoQ | ||||||||||||||||||||||
| Corporate | 2,121.2 | 2,783.7 | 2,363.4 | 11.4 | % | -15.1 | % | 1,598.0 | 2,208.8 | 2,355.3 | 47.4 | % | 6.6 | % | |||||||||||||||||
| Middle Market | 782.1 | 980.3 | 1,100.1 | 40.7 | % | 12.2 | % | 1,272.5 | 1,518.1 | 1,587.2 | 24.7 | % | 4.6 | % | |||||||||||||||||
| Retail | 2,624.5 | 4,015.6 | 4,474.9 | 70.5 | % | 11.4 | % | 1,378.4 | 1,697.7 | 1,747.7 | 26.8 | % | 2.9 | % | |||||||||||||||||
SME | 1,026.8 | 1,393.8 | 1,532.5 | 49.2 | % | 10.0 | % | 338.0 | 539.2 | 559.6 | 65.5 | % | 3.8 | % | |||||||||||||||||
Mortgages | 440.9 | 891.9 | 1,036.6 | 135.1 | % | 16.2 | % | 810.2 | 876.7 | 876.6 | 8.2 | % | 0.0 | % | |||||||||||||||||
Consumer | 465.2 | 836.7 | 983.5 | 111.4 | % | 17.5 | % | 183.3 | 225.1 | 250.8 | 36.8 | % | 11.4 | % | |||||||||||||||||
Credit Cards | 691.5 | 893.3 | 922.3 | 33.4 | % | 3.3 | % | 46.8 | 56.8 | 60.8 | 29.7 | % | 7.0 | % | |||||||||||||||||
| Consolidated total loans* | 5,555.1 | 7,797.9 | 7,962.5 | 43.3 | % | 2.1 | % | 4,826.9 | 5,997.1 | 6,250.7 | 29.5 | % | 4.2 | % | |||||||||||||||||
| * | Includes work out unit, other banking and BCP Bolivia |
| • | The corporate segment grew 6.6% in foreign currency, accounting for 74% of loans for that segment. The 15.1% QoQ drop of the Nuevos Soles-denominated portfolio results from reduced demand for this currency caused by dollar volatility during this quarter and greater demand for dollars. The combined impact on the corporate loan book resulted in a basically flat performance. |
| • | The Middle Market segment, which has 81% of its portfolio in foreign currency loans, grew a moderate 4.6% in this currency, but sustained a strong 12.2% growth in local currency as well, in line with projections. |
| • | The Retail portfolio has approximately 50/50 split between the two currencies, and showed a very strong 11.4% quarterly growth of soles-denominated loans, while dollar loans grew by only 2.9%. |
Market Share
BCP’s market share of loan remains strong despite strong competition characterized by the arrival of new international financial organizations and the already strong bank positioning. Thus, BCP accomplished a 31.5% share to June 2008, slightly below its 32.2% share in December 2007. The drop is accounted for by a rising position of the 3rd and 4th competitors from December 2007 to June 2008.
Furthermore, market shares for the corporate and middle market sectors continue revealing BCP’s solid positioning, reaching 46% and 34%, respectively, as of May 2008. These reflect, however, a minor growth in both segments, as a consequence of the strong competition.
Market shares in the retail market had mixed results during this quarter. Consumer loans were up by 0.8% reaching 17.9%, while Credit Cards and SME decreased 0.1% and 0.7%, respectively, reaching 18.6% and 17.8%. However, mortgages increased 0.1% to 40.2% consolidating its strong position.
Dollarization
The de-dollarization of BCP’s assets continued this 2Q08. The Nuevos Soles component of the total portfolio reached 32.8%, a small 0.3% increase since December 2007. The de-dollarization in the financial system also continued, and reached 41% in domestic currency and 59% in foreign currency last quarter.
11
II.2 Deposits and Mutual Funds
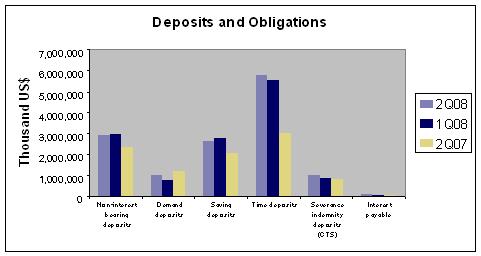
Deposits grew 2.4% QoQ and 40.1% YoY and remain as the main funding source to sustain loan growth. In addition, BCP’s mutual funds grew 10.9% QoQ.
Deposits and Obligations | Quarter ended | Change | ||||||||||||||
| US$ (000) | 2Q08 | 1Q08 | 2Q07 | 2Q08/2Q07 | 2Q08/1Q08 | |||||||||||
| Non-interest bearing deposits | 2,905,401 | 2,965,756 | 2,316,573 | 25.4 | % | -2.0 | % | |||||||||
| Demand deposits | 966,662 | 761,123 | 1,220,352 | -20.8 | % | 27.0 | % | |||||||||
| Saving deposits | 2,603,344 | 2,749,983 | 2,040,264 | 27.6 | % | -5.3 | % | |||||||||
| Time deposits | 5,740,312 | 5,543,993 | 3,012,079 | 90.6 | % | 3.5 | % | |||||||||
| Severance indemnity deposits (CTS) | 969,594 | 859,630 | 836,817 | 15.9 | % | 12.8 | % | |||||||||
| Interest payable | 66,095 | 58,442 | 32,923 | 100.8 | % | 13.1 | % | |||||||||
Total customer deposits | 13,251,408 | 12,938,927 | 9,459,008 | 40.1 | % | 2.4 | % | |||||||||
| Mutual funds in Perú | 2,315,170 | 2,088,039 | 1,776,232 | 30.3 | % | 10.9 | % | |||||||||
| Mutual funds in Bolivia | 88,702 | 83,890 | 64,817 | 36.8 | % | 5.7 | % | |||||||||
Total customer funds | 15,655,279 | 15,110,857 | 11,300,057 | 38.5 | % | 3.6 | % | |||||||||
After an unusual evolution of deposits in 1Q08, in particular for deposits in Nuevos Soles which reflected the significant flow of short term capitals to the financial system; in 2Q08 deposits returned to their normal evolution pattern and grew 2.4% QoQ. Although this is the main source of funds for loans, BCP increased its liabilities abroad by 24.8% QoQ. The increase in June 2008 corresponds mainly to funds granted to BCP from correspondent credit lines with local and foreign financial institutions and short-term funds in order to cover liquidity needs.
Savings deposits continued to shrink, while demand deposits, CTS accounts and time deposits grew, as a result of sharper market competition to raise funds and the customer’s greater sensitivity to interest earned by their deposits. Such growth occurs in a highly volatile capital market where funds continue to migrate towards such passive products. Nonetheless, deposits remain a low-cost source of funds as 57% of such deposits earned low or no interest. In addition, the retail segment is a clearly important source of funds, given that approximately 46% of deposits are originated in this segment.
12
Market Share
Despite strong competition for the public’s deposits, BCP increased its deposits share to 39.7% in June 2008, larger than its 38.8% share to December 2007.
BCP’s leadership is clear for all types of deposits, with its share in CTS deposits as the strongest, at 52.1% and well above our closest competitor’s, whose share reaches 19.8%. Demand deposits reach 46.6% in domestic currency and 39.9% in foreign currency while savings deposits reached 37.3% and 42.4% shares, respectively. Finally, time deposits’ shares in domestic and foreign currency were 24.3% and 43.4%, respectively.
Through its Credifondo subsidiary, BCP remains the leader in the mutual funds business, presently managing a US$ 2,315 million fund, with a 10.9% QoQ growth. This resulted in a 44.6% market share to June 2008, higher than last March’s 43.7%. Such increase is noteworthy given growth of this industry and increasingly customized funds that cater to investors’ goals and profiling. In April, BCP brought to market three new mutual funds in domestic currency for the conservative, balanced and moderate investor profiles.
The currency mix of BCP consolidated deposits reached 51% in foreign currency and 49% in domestic currency, driven by a volatile dollar and, partly, by the migration of the CTS accounts to the domestic currency.
II.3 Net Interest Income
As a result of 9.1% QoQ higher revenue from interest and despite increased legal reserves and the subsequent increase in BCRP liquidity, Net Interest Margin maintained its strong level and remained basically flat in 2Q08.
Net interest income | Quarter | Change | ||||||||||||||
US$ 000 | 2Q08 | 1Q08 | 2Q07 | 2Q08/2Q07 | 2Q08/1Q08 | |||||||||||
Interest income | 319,420 | 296,660 | 220,180 | 45.1 | % | 7.7 | % | |||||||||
| Interest on loans | 228,892 | 213,932 | 164,101 | 39.5 | % | 7.0 | % | |||||||||
| Interest and dividends on investments | 4,323 | 1 | 3,082 | 40.3 | % | 100 | ||||||||||
| Interest on deposits with banks | 15,170 | 16,924 | 15,497 | -2.1 | % | -10.4 | % | |||||||||
| Interest on investment securities | 61,253 | 54,527 | 32,531 | 88.3 | % | 12.3 | % | |||||||||
| Other interest income | 9,781 | 11,276 | 4,970 | 96.8 | % | -13.3 | % | |||||||||
Interest expense | 131,061 | 124,049 | 79,035 | 65.8 | % | 5.7 | % | |||||||||
| Interest on deposits | 98,104 | 90,233 | 57,927 | 69.4 | % | 8.7 | % | |||||||||
| Interest on borrowed funds | 16,782 | 15,545 | 11,220 | 49.6 | % | 8.0 | % | |||||||||
| Interest on bonds and subordinated notes | 13,378 | 11,480 | 8,165 | 63.8 | % | 16.5 | % | |||||||||
| Other interest expense | 2,797 | 6,792 | 1,722 | 62.4 | % | -58.8 | % | |||||||||
Net interest income | 188,359 | 172,611 | 141,146 | 33.4 | % | 9.1 | % | |||||||||
| Average interest earning assets | 16,168,832 | 14,859,043 | 10,999,323 | 47.0 | % | 8.8 | % | |||||||||
Net interest margin* (old methodology) | 5.12 | % | 5.07 | % | 5.52 | % | ||||||||||
Net interest margin(1)** (new methodology) | 4.66 | % | 4.65 | % | 5.13 | % | ||||||||||
* | The old methodology for the calculation of NIM considered only 70% of the investments available for sale as part of interest earning assets. |
| ** | The new methodology for the calculation of NIM considers 100% of the investments available for sale as interest earning assests. |
(1)Annualized
Interest Income grew 7.7% in 2Q08 as a consequence not only of growing loans which resulted in a 7.0% increase in interest, but also due to 12.3% higher interest from investments in securities, despite a smaller investments volume in 2Q08. Combined with more slowly (5.7%) growing expenditures for interests, thanks to earnings on rate and currency hedging operations, net revenues from interests grew 9.1% QoQ.
13
This evolution reveals better lending margins. In fact, loans (average balances) grow 3.3% this quarter, while interest income from loans grows 7% reflecting the stronger loan portfolio growth of the higher yielding retail sector, whereas interest expense grows only 5.7%, which reflects the less sensitivity of our liabilities to increasing interest rates. This would logically lead to improving NIM. However, the rise of legal reserves drove growth of liquid deposits at BCRP to a high 24%, and these earn low nominal rates and have a negative impact on NIM. Therefore, the significantly higher levels of low interest earning deposits (which provide a return of approximately 3% both in domestic and foreign currencies) inflated our average interest earning assets balance with low yielding assets and led to a basically flat NIM.
Furthermore, for transparency reasons, this quarter we have standardized our NIM calculation methodology, which used to exclude a percentage of interest earnings assets available for sale from the formula, whereas it seemed to be a standard procedure in the markets to include ALL interest earning assets into this calculation, which is what we have adopted as of this quarter.
Thus, with net interest income growing 9.1% QoQ, while average interest earning assets expanded 8.8% QoQ, the resulting NIM showed an improvement to 5.12% for 2Q08 from 5.07% the previous quarter, based on the calculation approach used up to date. However the equivalent calculations of Net Interest Margin under the new standardized methodology gives only a slight rise from 4.65% in 1Q08 to 4.66% in 2Q08.
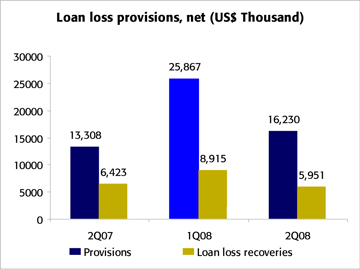
II.4 Loan provisions
Though provisions in the consumer segment increased in line with the new policies, global Gross provisions fell in 2Q08 as such stronger provisions were attenuated by reversions in the wholesale portfolio and country risk. Furthermore, portfolio quality indicators continued improving.
14
Provisión for loan losses | Quarter ended | Change | ||||||||||||||
| US$ 000 | 2Q08 | 1Q08 | 2Q07 | 2Q08/2Q07 | 2Q08/1Q08 | |||||||||||
| Provisions | (16,230 | ) | (25,867 | ) | (13,308 | ) | 22.0 | % | -37.3 | % | ||||||
| Loan loss recoveries | 5,951 | 8,915 | 6,423 | -7.3 | % | -33.3 | % | |||||||||
Total provisions, net of recoveries | (10,280 | ) | (16,951 | ) | (6,885 | ) | 49.3 | % | -39.4 | % | ||||||
Total loans | 9,197,916 | 8,837,689 | 6,989,841 | 31.6 | % | 4.1 | % | |||||||||
Reserve for loan losses (RLL) | 217,569 | 219,295 | 190,413 | 14.3 | % | -0.8 | % | |||||||||
Bcp's Charge-Off amount | 10,513 | 9,281 | 9,896 | 6.2 | % | 13.3 | % | |||||||||
Past due loans (PDL) | 68,264 | 70,015 | 66,400 | 2.8 | % | -2.5 | % | |||||||||
| PDL/Total loans | 0.74 | % | 0.79 | % | 0.95 | % | ||||||||||
| Coverage | 318.72 | % | 313.21 | % | 286.77 | % | ||||||||||
Gross provisions reached US$ 16.2 million in 2Q08, 37.3% lower QoQ, reflecting a reduction of total past due loans, which dropped from US$ 70 million to US$ 68 million by June 20008, and reserves for loan losses, which were also down from US$219.3 million in March 2008 to US$217.6 million. These reductions took place in both Wholesale and Retail Banking. Consequently, BCP’s past due ratio dropped again and reached only 0.74% while the coverage ratio improved further to 318.7% in 2Q08.
Despite continued excellent portfolio quality numbers, the application of a more sophisticated risk evaluation methodology resulted in improved provisioning policies for the retail segment, leading to increased provisioning levels for each segment within this sector. However, on the other hand, country risk provisioning reversals follow improved country performances and were effected this quarter.
In addition, recoveries dropped 33.3% because of reduced revenues from recovery of written off portfolio from previous years as a smaller downgraded portfolio stock is left.
II.5 Non Financial Income
Fee and FX income continued expanding at excellent rates, though in 2Q08, smaller revenues from securities sales (which included the sale of VISA shares in 1Q08) impacted total non financial revenues and resulted in a 1.8% QoQ total drop.
15
Non financial income | Quarter | Change | ||||||||||||||
| US$ 000 | 2Q08 | 1Q08 | 2Q07 | 2Q08/2Q07 | 2Q08/1Q08 | |||||||||||
| Fee income | 85,228 | 79,747 | 66,986 | 27.2 | % | 6.9 | % | |||||||||
| Net gain on foreign exchange transactions | 31,389 | 19,971 | 12,778 | 145.7 | % | 57.2 | % | |||||||||
| Net gain on sales of securities | 3,721 | 22,655 | 7,586 | -50.9 | % | -83.6 | % | |||||||||
| Other income | 2,008 | 2,190 | 1,479 | 35.8 | % | -8.3 | % | |||||||||
Total non financial income | 122,347 | 124,563 | 88,827 | 37.7 | % | -1.8 | % | |||||||||
Growth of 6.9% in fee income resulted mainly from larger revenues from commissions for mortgages, SMEs, personal loans and collections & payment commissions. In addition, the quarter’s monthly average transactions that generate fees grew from 32.4 million transactions to 35.3 million in 2Q08 or a 9.0% QoQ change.
Net gains on FX operations grew also a very strong 57.2%, following a higher volume of average monthly transactions in 2Q08, resulting from a growing network, and greater dollar/sol volatility which also allowed for larger purchase/sale spreads.
Net gain on sale of securities dropped sharply from US$22.7 million in 1Q08 to US$3.7 million in 2Q08. This is accounted for by the fact that 1Q08 included earnings from the sale of Visa Intl. stock, which resulted in a windfall earning amounting to US$17.9 million. In addition, lower earnings were made from the sale of securities, while valuation fluctuations resulted in larger QoQ losses given the unstable markets.
Quarter | Change % | |||||||||||||||
| N° de Transactions per channel | Average 2Q08 | Average 1Q08 | Average 2Q07 | 2Q08/ 2Q07 | 2Q08/ 1Q08 | |||||||||||
| Teller | 9,732,229 | 9,091,066 | 8,541,465 | 13.9 | % | 7.1 | % | |||||||||
| ATMs Via BCP | 5,940,702 | 5,376,097 | 4,745,857 | 25.2 | % | 10.5 | % | |||||||||
| Balance Inquiries | 2,435,836 | 2,249,668 | 2,150,016 | 13.3 | % | 8.3 | % | |||||||||
| Telephone Banking | 1,168,087 | 1,126,113 | 976,654 | 19.6 | % | 3.7 | % | |||||||||
| Internet Banking Via BCP | 8,235,199 | 7,448,052 | 6,441,179 | 27.9 | % | 10.6 | % | |||||||||
| Agente BCP | 1,561,047 | 1,248,203 | 656,986 | 137.6 | % | 25.1 | % | |||||||||
| Telecrédito | 3,134,627 | 2,884,387 | 2,816,308 | 11.3 | % | 8.7 | % | |||||||||
| Direct Debit | 345,684 | 341,265 | 283,255 | 22.0 | % | 1.3 | % | |||||||||
| Points of Sale P.O.S. | 2,568,932 | 2,466,764 | 2,079,573 | 23.5 | % | 4.1 | % | |||||||||
| Other ATMs network | 186,203 | 173,343 | 153,375 | 21.4 | % | 7.4 | % | |||||||||
Total transactions | 35,308,545 | 32,404,959 | 28,844,668 | 22.4 | % | 9.0 | % | |||||||||
The above chart shows the higher monthly average figures for this quarter, particularly at BCP Agent, which is rapidly taking a significant position in business generation. Likewise, electronic channels evolved significantly, compared to the conventional teller channel.
| Balance as of | Change | |||||||||||||||
| Jun-08 | Mar-08 | Jun-07 | Jun. 08 / Jun. 07 | Jun. 08/ Mar. 08 | ||||||||||||
| Branches | 285 | 277 | 249 | 14.5 | % | 2.9 | % | |||||||||
| ATMs | 801 | 778 | 699 | 14.6 | % | 3.0 | % | |||||||||
| Agentes BCP | 1,552 | 1,358 | 837 | 85.4 | % | 14.3 | % | |||||||||
| Total | 2,638 | 2,413 | 1,785 | 47.8 | % | 9.3 | % | |||||||||
II.6 Operating Costs and Efficiency
BCP’s efficiency ratio improved in 2Q08 and reached 43.78%, after 12.0% growth in revenues from operations and only 3.2% QoQ higher operating expenditures (excluding “other expenditures”)
16
Operating expenses | Quarter | Change | ||||||||||||||
| US$ 000 | 2Q08 | 1Q08 | 2Q07 | 2Q08/2Q07 | 2Q08/1Q08 | |||||||||||
| Salaries and employees benefits | 71,871 | 70,553 | 56,865 | 26.4 | % | 1.9 | % | |||||||||
| Administrative, general and tax expenses | 50,669 | 48,520 | 42,631 | 18.9 | % | 4.4 | % | |||||||||
| Depreciation and amortizacion | 10,978 | 10,364 | 9,396 | 16.8 | % | 5.9 | % | |||||||||
| Other expenses | 12,177 | 8,898 | 7,635 | 59.5 | % | 36.9 | % | |||||||||
Total operating expenses | 145,695 | 138,336 | 116,527 | 25.0 | % | 5.3 | % | |||||||||
Efficiency Ratio | 43.78 | % | 47.53 | % | 49.29 | % | ||||||||||
Salaries and employee benefits grew 1.9% resulting from a larger number of workers, mainly to provide for the larger network. In addition, QoQ growth includes the impact of the Dollar revaluation vis-à-vis the local currency in 2Q08. Consequently, increases in personnel expenditures (Soles denominated) are partly attenuated by translation to US Dollar IFRS accounting.
Overhead expenditures rose 4.4% QoQ, mainly as a result of larger marketing (advertising and marketing campaigns), expenses, as well as expenditure on consultants and advisors, maintenance and transportation. Again, these increases were partly mitigated by smaller spending on software, systems and IT. It is worthwhile mentioning that the network expansion plan and investment in IT support are evolving vigorously and will result in larger expenditures on such items in the second half.
Detailed administrative expenses and the corresponding quarterly changes appear below:
Administrative Expenses | Quarter | Change | |||||||||||||||||||||||
| US$ (000) | 2Q08 | % | 1Q08 | % | 2Q07 | % | 2Q08/2Q07 | 2Q08/1Q08 | |||||||||||||||||
| Marketing | 6,683 | 13 | % | 5,032 | 10 | % | 6,985 | 16 | % | -4.3 | % | 32.8 | % | ||||||||||||
| Transportation | 4,834 | 10 | % | 4,458 | 9 | % | 4,008 | 9 | % | 20.6 | % | 8.4 | % | ||||||||||||
| Systems | 3,506 | 7 | % | 6,892 | 14 | % | 3,926 | 9 | % | -10.7 | % | -49.1 | % | ||||||||||||
| Maintenance | 2,660 | 5 | % | 2,444 | 5 | % | 1,880 | 4 | % | 41.5 | % | 8.9 | % | ||||||||||||
| Consulting | 2,485 | 5 | % | 2,207 | 5 | % | 2,525 | 6 | % | -1.6 | % | 12.6 | % | ||||||||||||
| Communications | 2,372 | 5 | % | 2,497 | 5 | % | 1,996 | 5 | % | 18.9 | % | -5.0 | % | ||||||||||||
| Other expenses | 14,682 | 29 | % | 14,195 | 29 | % | 12,337 | 29 | % | 19.0 | % | 3.4 | % | ||||||||||||
| Property taxes and others | 4,876 | 10 | % | 5,487 | 11 | % | 4,512 | 11 | % | 8.0 | % | -11.1 | % | ||||||||||||
| Other subsidiaries and eliminations, net | 8,572 | 17 | % | 5,308 | 11 | % | 4,461 | 10 | % | 92.1 | % | 61.5 | % | ||||||||||||
Total Administrative Expenses | 50,669 | 100 | % | 48,520 | 100 | % | 42,631 | 100 | % | 18.9 | % | 4.4 | % | ||||||||||||
“Other expenditures” increased 36.9% QoQ. This change is mainly accounted for by an increase in provisions related to the Stock Appreciation Rights program, resulting from the appreciation of the Credicorp share value in 2Q08. The stock appreciation was largely offset by a hedging transaction linked to the SAR program, though some reserves are required since the hedge is not perfect .
Thus, the moderate growth in operating costs (excluding others) of 3.2%, while operating income improved 12% resulted in a significant recovery of BCP’s efficiency ratio from 56.9% in 4Q07 to 47.5% in 1Q08, and 43.8% this 2Q08.
17
II.7 Shareholder's Equity and Regulatory Capital
Shareholders' equity | Quarter | Change | ||||||||||||||
| US$ 000 | 2Q08 | 1Q08 | 2Q07 | 2Q08/ 2Q07 | 2Q08/ 1Q08 | |||||||||||
| Capital stock | 439,474 | 364,706 | 364,706 | 20.5 | % | 20.5 | % | |||||||||
| Reserves | 388,062 | 388,062 | 282,189 | 37.5 | % | 0.0 | % | |||||||||
| Unrealized Gains and Losses | 70,819 | 90,285 | 66,066 | 7.2 | % | -21.6 | % | |||||||||
| Retained Earnings | 111,994 | 186,761 | 96,484 | 16.1 | % | -40.0 | % | |||||||||
| Income for the year | 243,814 | 165,772 | 154,719 | 57.6 | % | 47.1 | % | |||||||||
Total shareholders' equity | 1,254,162 | 1,195,587 | 964,164 | 30.1 | % | 4.9 | % | |||||||||
| Return on average equity (ROAE) | 25.49 | % | 56.96 | % | 35.57 | % | ||||||||||
Net equity reached US$ 1.2 billion as of June 2008, or a 4.9% QoQ growth. Also, in 2Q08 ROAE was 25.49%, lower than the 56.96% figure for 1Q08. This wide changes are the consequence of the unusual translation effects in 2Q08, compared to 1Q08.
As of June 2008, the capital adequacy ratio for non consolidated BCP reached 13.5% (7.4 times), slightly below 1Q08’s 13.8% (7.3 multiple). Consequently, this indicator exceeds the system’s (9.1%) and our own even more conservative ceiling (11.5%).
A larger amount of earnings was retained in 2Q08 for capitalization with a view at further strengthening the Bank’s equity. Retained earnings reached US$134 million as of June 2008, reflecting an increase of 66.9% from last March08. In addition, it is worthwhile underscoring the lower market risk equity requirement resulting from smaller foreign currency exposure under the present circumstances and the appreciation of the local currency, which has reduced both exposure to and risk from foreign currency value fluctuations.
In addition, Tier I reached US$ 997.2 million. Risk weighted assets include US$ 38.3 million market risk, requiring a US$ 3.5 million equity. Total regulatory capital includes US$ 292 million of subordinated debt.
Regulatory Capital and Capital Adequacy Ratios | Quarter ended | Change | ||||||||||||||
Jun-08/ | Jun-08/ | |||||||||||||||
US$ (000) | Jun-08 | Mar-08 | Jun-07 | Jun-07 | Mar-08 | |||||||||||
| Capital Stock, net | 508,526 | 468,851 | 406,101 | 25.2 | % | 8.5 | % | |||||||||
| Legal and Other capital reserves | 447,870 | 484,105 | 327,610 | 36.7 | % | -7.5 | % | |||||||||
| Net income capitalized | 134,862 | 80,816 | - | - | 66.9 | % | ||||||||||
| Investment in Subsidiaries and others | 171,869 | 152,839 | 143,135 | 20.1 | % | 12.5 | % | |||||||||
| Goodwill | 8,098 | 5,440 | 5,815 | 39.2 | % | 48.9 | % | |||||||||
| Generic Contingency loss reserves | 95,643 | 91,469 | 69,425 | 37.8 | % | 4.6 | % | |||||||||
| Subordinated Debt | 292,164 | 307,422 | 138,982 | 110.2 | % | -5.0 | % | |||||||||
Total Regulatory Capital | 1,299,099 | 1,274,385 | 793,169 | 63.8 | % | 1.9 | % | |||||||||
| Tier 1 (1) | 997,226 | 951,913 | 656,328 | 51.9 | % | 4.8 | % | |||||||||
| Tier 2 (2) | 301,873 | 322,472 | 136,840 | 120.6 | % | -6.4 | % | |||||||||
| Risk-weighted assets (Credit risk) | 9,598,381 | 9,168,514 | 7,063,276 | 35.9 | % | 4.7 | % | |||||||||
Market Risk | 3,480 | 8,893 | 29,430 | -88.2 | % | -60.9 | % | |||||||||
Capital Ratios | ||||||||||||||||
| Regulatory Capital as a percentage of risk-weighted assets | 13.48 | % | 13.75 | % | 10.74 | % | ||||||||||
| Ratio of risk-weighted assets to Regulatory Assets | 7.42 | 7.27 | 9.31 | |||||||||||||
(1) Tier 1 = Capital + Reserves + Net income capitalized - Goodwill - (0.5 x Investment in Subsidiaries)
(2) Tier 2 = Subordinated Debt + Generic Contingency loss reserves - (0.5 x Investment in Subsidiaries)
18
III. Banco de Crédito de Bolivia
Bolivian Financial System
Total loans of the Bolivian banking system increased from US$ 3,183 million in December 2007 to US$ 3,448 million in June 2008, an increase of 8.3%. Loan quality of the banking system has maintained the improved performance registered during 2007. In 2007, PDL of the banking system reached a level of 5.6%, in March 2008 5.7% and in June 2008 it dropped to 5.2%. In addition, the coverage ratio of the banking system attained a level of 110.7% in June 2008 vs. 109.6% in last March.
With respect to the deposit side of the banking system, it increased from US$ 4,124 million in December 2007 to US$ 4,982 million in June 2008, an increase of 20.8%, which was mainly a response to the attractive inflation adjusted deposits implemented, which are in turn invested in also inflation adjusted deposits at the Central Bank. This growth was distributed in demand deposits, which grew 21.2%, saving deposits with 35.2% and time deposits with 9.5%.
BCP Bolivia - Results
In 2Q08, BCP Bolivia reached a net income of US$ 10.1 million, a slight decrease of 3.0% QoQ and a strong growth of 85.2% YoY, mainly as a result of higher net interest income (5.8% QoQ and 37.5% YoY) and higher non financial income.
The higher growth of NII is the result of higher average loan balances and interest rates, and at the same time, higher returns of the proprietary investment portfolio. Non financial income decreased in 2Q08 mainly because in 1Q08 the sale of VISA shares for approximately US$ 1.9 million boosted this income, so the base for comparison purposes was higher.
The conservative strategy on credit risk management has allowed BCP Bolivia to reach a past due loan ratio of 1.9% (1.7 % in 1Q08 and 2.7% in 2Q07) and coverage of 206.1% (227.8% in 1Q08 and 184.3% in 2Q07). ROAE of our Bolivian subsidiary was 51.5%, lower than 56.1% in March 2008. However, these ratios reveal a better performance than the Bolivian Financial System, which reported a 5.2% in PDL and 110.7% as coverage.
Assets and liabilities
Total loans as of June 2008 reached US$472.1 million, 1.0% higher than US$ 467.6 million corresponding to March 2008 and 10.3% higher YoY. The lower quarterly loan growth is the result of slower economic activity, as a consequence of political instability that reduces the possibility of higher investments. Thus, the economic deceleration is also reflected on the performance of the loan portfolio.
In 2Q08, The Retail Banking registered an increase of 6.3% QoQ and 25.4% YoY, which has an important impact on BCP Bolivia’s results, mainly because this segment represents 48.7% of the total loan portfolio and it is the segment with the highest margins within the Bank, whereas Corporate Banking and Middle Market Banking represent 46.2% of the loan portfolio with lower returns when compared to the Retail sector.
In the Retail segment, products that showed higher quarterly growth rates were SME with 14.2% and Personal loans with 11.0%. Both represented 25.2% of the retail segment. Mortgages, which account for 50.7% of the total loan portfolio, showed a growth rate of 2.0% QoQ and 5.8% YoY.
On the deposit side, BCP Bolivia registered an increase of 9.6% QoQ and 35.5% YoY. During 2Q08, growth of savings deposits with 15.3% QoQ and 49.7% YoY stands out, followed by demand deposits with 8.8% QoQ and 53.4% YoY, and time deposits with 1.5% QoQ and 2.1% YoY.
19
Shareholders’ net equity, shows an increase of 15.3% with respect to last March mainly because of non realized gains (84.6% QoQ) and due to a 97.0% increase of net income during the first half of the year.
Finally, BCP Bolivia has a market share of 13.5% in loans and 14.4% in deposits, positioning it as the fourth bank in loans and third in deposits for the whole banking system. It has also continued consolidating its position in strategic products and services, including the low risk income of non financial earnings. In addition, the bank has implemented the business model of Agente BCP, a plan that has the objective of increasing market penetration in those segments still not attended by the financial system. As of June 2008, BCP Bolivia had 69 Agentes BCP.
Banco de Crédito de Bolivia | Quarter | Change | ||||||||||||||
US$ million | 2Q08 | 1Q08 | 2Q07 | 2Q08/2Q07 | 2Q08/1Q08 | |||||||||||
| Total loans | 472.1 | 467.6 | 428.0 | 10.3 | % | 1.0 | % | |||||||||
| Past due loans | 9.1 | 7.9 | 11.5 | -20.7 | % | 15.4 | % | |||||||||
| Loan loss reserves | -18.8 | -18.1 | -21.2 | -11.4 | % | 3.8 | % | |||||||||
| Total Assets | 905.9 | 845.0 | 710.8 | 27.5 | % | 7.2 | % | |||||||||
| Deposits | 768.0 | 701.0 | 577.0 | 33.1 | % | 9.6 | % | |||||||||
| Shareholders net equity | 87.4 | 75.8 | 68.1 | 28.3 | % | 15.3 | % | |||||||||
Net income | 10.1 | 10.4 | 5.5 | 85.2 | % | -3.0 | % | |||||||||
| PDL / Total loans | 1.9 | % | 1.7 | % | 2.7 | % | ||||||||||
| Coverage ratio of PDLs | 206.1 | % | 227.8 | % | 240.1 | % | ||||||||||
| ROAE | 51.5 | % | 56.1 | % | 29.9 | % | ||||||||||
| Branches | 63 | 61 | 58 | |||||||||||||
| ATMs | 176 | 166 | 143 | |||||||||||||
| Employees | 1535 | 1503 | 1224 | |||||||||||||
20
IV. Atlantic Security Holding Corporation
ASHC | Quarter | Change % | ||||||||||||||
(US$ Million) | 2Q 2008 | 1Q 2008 | 2Q 2007 | 2Q08 / 2Q07 | 2Q08 / 1Q08 | |||||||||||
| Net interest income | 6.3 | 5.7 | 4.8 | 31.8 | 10.2 | |||||||||||
| Dividend income | 22.1 | 0.0 | 0.1 | 18,537.4 | 45,758.1 | |||||||||||
| Fees and commissions from services | 2.1 | 2.1 | 2.3 | -7.5 | 0.6 | |||||||||||
| Net gains on foreign exchange transactions | 0.0 | 0.6 | 0.0 | 41.5 | -92.8 | |||||||||||
Core Revenues | 30.6 | 8.5 | 7.3 | 322.4 | 259.0 | |||||||||||
| Total provisions, net of recoveries | -1.7 | -2.0 | -0.8 | -115.2 | 12.9 | |||||||||||
| Net gains from sale of securities | 0.0 | 0.7 | -0.2 | 118.4 | -94.6 | |||||||||||
| Other income | 0.2 | 0.5 | 0.2 | -3.4 | -59.5 | |||||||||||
| Operating expenses | -2.1 | -2.2 | -2.1 | -2.4 | -4.5 | |||||||||||
Net income | 27.1 | 5.7 | 4.4 | 521.3 | 378.1 | |||||||||||
| Net income/share | 0.5 | 0.1 | 0.1 | 521.3 | 378.1 | |||||||||||
| Total loans | 151.2 | 146.4 | 107.3 | 40.8 | 3.2 | |||||||||||
| Total investments available for sale | 748.1 | 824.3 | 885.6 | -15.5 | -9.2 | |||||||||||
| Total asset | 1,384.0 | 1,490.7 | 1,606.7 | -13.9 | -7.2 | |||||||||||
| Total deposits | 1,139.4 | 1,227.9 | 1,387.0 | -17.9 | -7.2 | |||||||||||
| Shareholder's equity | 198.2 | 208.5 | 201.8 | -1.7 | -4.9 | |||||||||||
| Net interest margin | 2.00 | % | 1.66 | % | 1.37 | % | ||||||||||
| Efficiency ratio | 6.7 | % | 22.0 | % | 29.0 | % | ||||||||||
| Return on average equity | 53.4 | % | 9.4 | % | 8.3 | % | ||||||||||
| PDL / Total loans | 0.00 | 0.00 | 0.00 | |||||||||||||
| Cover ratio | 0.9 | % | 0.9 | % | 1.2 | % | ||||||||||
| BIS ratio | 15.85 | % | 14.93 | % | 13.90 | % | ||||||||||
During this second quarter 2008 Atlantic Security Holding Corporation (ASHC) reported a net income of USD 27.1 million, which includes the dividend from its significant position of Credicorp shares (BAP’s treasury stock), resulting in distorted growth rates. Excluding this income, ASHC’s performance reveals a QoQ net income drop of about 8% to US$ 5.1 million, which reflects still a solid performance.
Thus, total Core Revenues excluding the extraordinary dividend income which is recorded once a year would be about US$ 8.5 million, i.e. flat on a QoQ comparison, though 16% higher on YoY basis.
Net interest income presented increases of 31.82% YoY and 10.2% on QoQ basis. Given the declining interest rate environment, this increase in net interest income reflects a favorable situation for the bank, considering its current short term structure of deposits (which allows quick downwards re-pricing) and medium to long term structure of assets with higher interests locked-in. In addition to this active management of its cost of funds through periodical adjustments to interest rates paid on deposits, a reduction in the migration of customer deposits balances to managed investment products has contributed to widening this income.
As a result of this active management and re-pricing flexibility, net interest margin (NIM) presents an increase from 1.66% to 2.00% during this 2QT08.
Commissions and fee income from asset management business remain stable at US$ 2.1 million reporting a slight increase of 0.6% when compared with 1QT08. When compared with 2QT07, these are however 7.5% lower.
Net gains on foreign exchange transactions increased in more than 41.5% YoY (from US$ 32 thousand to US$ 46 thousand), though quarterly figures drop 92.8% compared to 1QT08. These gains rise from the appreciation of foreign currency positions, mainly Peruvian Nuevos Soles, maintained by the bank against the US Dollar.
Net provisions reported in 2QT08 of US$ 1.7 million were 12.9% lower when compared to those reported in 1QT08, notwithstanding, these are more than 100% higher when compared YoY. These higher reserves in the first 2 quarters of the year are the result of recognizing the adverse market effect on the Bank’s proprietary investment portfolio, triggered by the current financial markets turmoil, mainly in United States where our portfolio is highly concentrated. Even though we have preferred to create these reserves, the investment portfolio maintains a significant concentration of 63% on investment grade securities indicating a high credit quality exposure.
21
Realized gains on securities were only US$ 39 thousands, down from USD 700 thousand in 1Q08, but do reflect an improvement from the figure reported a year ago, which was a loss of US$ 211 thousand.
Efficiency ratio presented an important reduction from 22.0% on 1QT08 to 6.7% in this 2QT08. This is mainly the impact of the dividend income from Credicorp Ltd. Thus, excluding this dividend income, the efficiency ratio would be 23.5%, which is slightly higher than the one reported in 1QT08, but less than the 29.0% reported a year ago.
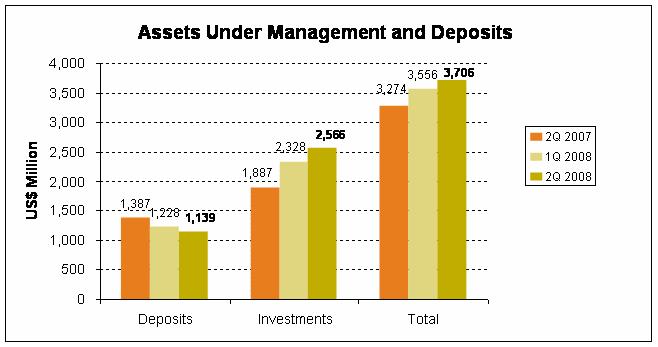
Asset levels decreased by 7.2% on QoQ due to the usage of available cash for outgoing customers’ funds and a migration of customer’ deposits to structured investment products managed off–balance sheet, motivated by higher yields offerings.
Interest Earning Assets
Interest earning assets reached US$ 1.254 MM, as shown in the table below. This figure dropped 7.6% QoQ, while a YoY drop of 15.1% was observed. The variation from 1QT08 is caused by the decrease on available cash, used to meet outgoing funds from customer’s accounts and the reduction of investment portfolio values.
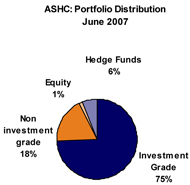
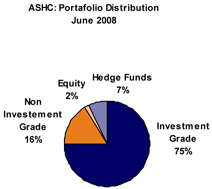
The share of investment-grade securities in the investment portfolio is 75%, emphasizing ASB’s prudent investment policy of concentrating its portfolio in high credit quality investments. Although the size of the portfolio presents a reducing trend, its composition remains on similar levels to those of 2Q 2007.
INTEREST EARNING ASSETS* | Quarter | % Change | ||||||||||||||
(US$ Million) | 2Q 2008 | 1Q 2008 | 2Q 2007 | 2Q08 / 2Q07 | 2Q08 / 1Q08 | |||||||||||
| Due from banks | 405 | 437 | 531 | -23.7 | % | -7.4 | % | |||||||||
| Loans | 151 | 146 | 107 | 40.8 | % | 3.2 | % | |||||||||
| Investments | 698 | 774 | 838 | -16.7 | % | -9.8 | % | |||||||||
Total interest-earning assets | 1,254 | 1,358 | 1,477 | -15.1 | % | -7.6 | % | |||||||||
| (*) Excludes investments in equities and mutual funds. | ||||||||||||||||
 |  |
22
Asset Management Business
Our Asset Management Business includes third party managed funds, customers’ deposits, and investments such as proprietary mutual funds and securities custody. The total of these funds has increased by 4.2% QoQ and 13.2% YoY. The observed increase is a result of the successful migration of customer deposits to managed funds and structured investment products which have increased 36% YoY and 10.2 QoQ As we concluded in the previous quarter, the management of third party funds in off-balance sheet accounts continues to command most new business.
23
V. Prima AFP
V1. Recent evolution of the private pension market
In the 2Q, the private pension market evolved in a stable environment, similar to the 1Q as far as commercial competition is regarded with a total 68,000 transfers and 60,000 new affiliates. The system now has a total 4.2 million members.
Volatility of international markets and its impact on local financial markets affected the behaviour of funds managed by the system which, together with a weaker local currency, resulted in a drop in US Dollar terms of the total managed portfolio to US$21.1 billion or 4.5% less than in the previous period.
Regarding the system’s financial results, it earned US$59.3 million this quarter, or 29% more than one year ago. These earnings are mainly accounted for by the wider base of contributions resulting from the lively local economy and more formal jobs. Likewise, the appreciation of the sol compared to a year ago contributed to the improvement.
After operating expenses totalling US$45.2 million, the system’s earnings from operations reached US$14.1million. After accounting for other revenues and expenses, legal reserves and provisions for taxes and participations, the pension plan management system’s net earnings reached US$11.1million.
Private Pension Fund System: Main Indicators | ||||||||||
At the end of the period: | 2Q08 | 1Q08 | 2Q07 | |||||||
| Affiliates (thousand) | 4,210 | 4,156 | 3,993 | |||||||
| % Change (1) | 1.3 | % | 1.3 | % | 1.4 | % | ||||
| Sales force | 1,930 | 2,031 | 4,199 | |||||||
| Asset under management (US$ mm) | 21,285 | 22,279 | 19,334 | |||||||
| % Change (1) | -4.5 | % | 9.4 | % | 15.3 | % | ||||
| Income (US$ mm) | 59.3 | 68.0 | 45.9 | |||||||
| Operating Expenses (US$ mm) | 45.2 | 44.1 | 46.4 | |||||||
| Operating income (US$ mm) | 14.1 | 23.9 | -0.6 | |||||||
| Net Income (US$ mm) | 11.1 | 15.7 | 19.5 | |||||||
Source: Conasev, SBS: (1) Quarter Variation In local Peruvian accounting, legal reserves are included in the income statement as opposed to the IFRS There is no infomation for results adjusted to international financial reporting standards for the Total System. The first and third quarter include double collection | ||||||||||
V2. Prima AFP
PRIMA’s commercial activity in the second quarter remained stable compared to the first quarter. Although the sales force was slightly smaller, productivity increased in terms of recruitment of new and transfer members. However, because PRIMA’s sales force was smaller than our competitors’ the net effect of transfers among AFP companies was a loss of four thousand members during the period under review.
Nonetheless, during the second quarter PRIMA succeeded in getting the largest contributions and market share for voluntary contributions in May1, for a total of close to 49% of all voluntary contributions to the system.
On the investment front, the volatile international financial markets through its impact on our local markets, affected returns from managed funds which are highly concentrated in local markets, leading to its deteriorated performance. To address this challenge, the company adopted a conservative portfolio approach looking for the best possible mix between local and foreign investments.
24
PRIMA 2Q08 | System 2Q08 | Share 2Q08 % | PRIMA 1Q08 | Share 1Q08 % | ||||||||||||
| Affiliates (1) | 1,035,703 | 4,209,831 | 24.6 | % | 1,029,814 | 24.8 | % | |||||||||
| New affiliations (2) | 10,891 | 60,829 | 17.9 | % | 11,130 | 17.8 | % | |||||||||
| Fund under management US$ mm (1) | 6,637 | 21,285 | 31.2 | % | 6,989 | 31.4 | % | |||||||||
| Collections US$ mm (3) | 128 | 381 | 33.6 | % | 153 | 34.4 | % | |||||||||
| Voluntary Contributions US$ mm (4) | 156 | 320 | 48.9 | % | 163 | 48.1 | % | |||||||||
| RAM US$ mm (5) | 339 | 1,058 | 32.0 | % | 352 | 32.6 | % | |||||||||
| (1) | Source: Superintencia de Banca y Seguros |
| (2) | Accumulated to the Quarter |
| (3) | Accumulated to the Quarter. Include voluntary contributions |
| (4) | Stock level at the end of the period |
| (5) | Monthly remuneration retained, earnings base calculation estimated by PRIMA on average earning during the last 4 months excluding double collection effect, special collections and voluntary contributions fees. |
Commercial results
PRIMA’s commercial activity in the second half continued in a relatively stable environment, as in the previous quarter.
Although new and transfer members this quarter was slightly lower than in the previous period, because of the smaller sales force, strong performance by the sales team translated into high recruitment among high average salary members, and ultimately total Monthly Insurance Compensation recruitment slightly above last quarter’s. Affiliations this quarter totalled 10,900 new members and 13,500 transfers, which offset the 17,500 clients lost. Moreover, the company attracted clients with larger funds, a feature directly related to their compensation level.
PRIMA funds under management totalled US$6,637 million or 31.2% of the entire system to June 2008, reflecting a stable share throughout this year.
Investments
Fluctuations in global markets impacted returns from investments in the period under review. However, it is worthwhile recalling that funds are managed with a long term view and seen from this standpoint, results are very favourable. In the last 24 months the company earned 28.24% yield in fund 1; 56.55% in fund 2, and 115.26% in fund 3, with all three funds ranked first in the market.
The following chart shows each fund’s share of the total portfolio under management to June 2008.
Jun-08 | % | Mar-08 | % | ||||||||||
| Fund 1 | 371 | 5.6 | % | 349 | 5.0 | % | |||||||
| Fund 2 | 4,300 | 64.8 | % | 4,519 | 64.7 | % | |||||||
| Fund 3 | 1,966 | 29.6 | % | 2,121 | 30.4 | % | |||||||
| Total US$ mm | 6,637 | 100.0 | % | 6,989 | 100.0 | % | |||||||
Source: Superintendencia de Banca y Seguros | |||||||||||||
According to the PF rules, the Central Reserve Bank of Peru raised the limit to foreign investment to 20%; while the Superintendencia de Banca Seguros listed new investment securities allowing more investment opportunities for the pension fund system.
25
Financial results
Revenues:
PRIMA’s revenues in 2Q08 totalled US$15.9 million, above estimates and explained by a wider company revenue base that has increased revenues since the beginning of 2008. It is important to remember that, contrary to the 1Q08, in the 2Q08 Prima does not have the positive impact on revenues of the double collections related to the extraordinary Christmas “gratificaciones” (the company’s revenues are typically 60% to 70% higher in the months of January and August following the extraordinary additional month’s salary paid in accordance to Peruvian labour laws in July and December). Thus, discounting that effect, revenues in the 2Q08 are similar to those in the 1Q08, and compared to the 4Q07 (which does not have that extraordinary income either), 2Q08 revenues increased 10%.
Company revenues are related to the compensation of members who pay in monthly into the pension fund system, and according to estimates based on publicly available information about the pension administration companies’ revenues and management fees, in the second quarter PRIMA’s compensation revenue base was the system’s highest, while it retained a robust 32% market share.
Voluntary contributions grew slightly in 2Q08 quarter over quarter as a consequence of higher return rates. However the depreciation of the local currency reduced the dollar denominated balance. Still managing voluntary contributions has been a significant source of company revenues.
PRIMA Jun-08 | Total System Jun-08 | Prima % Share | ||||||||
| Income (1) | 5.08 | 18.69 | 27.2 | % | ||||||
| Administrative Fees | 1.5 | % | n.a. | |||||||
| RAM estimated base (2) | 339 | 1,058 | 32.0 | % | ||||||
PRIMA AFP estimates. In accordance to local public infomation, (CONASEV) (1) Average income from the last four month, excluding special collections and voluntary contribution fees (2) RAM: Monthly Accumulated Salary | ||||||||||
Expenditures:
In the second quarter this year the company kept its focus on containing operating expenses despite some increases in administration personnel costs by US$ 0.5 million. It also deferred some sales expenses which generate expenses by US$ 1.4 million more than in the first quarter.
As a consequence of the above, the quarter’s operating expenses reached a significant US$3.6million, as expected, leading to a net income before translation results of US$ 1.5 million. It is worthwhile recalling these results include expenses related to the amortization of assets identified in the Purchase Price Allocation which, added to the amortization and depreciation for property and IT investments, result in a total US$2.2 million for D&A over the period under review.
Nonetheless, exchange rate volatility implied for this 2Q08 a strong depreciation of the local currency and losses to the company for exchange rate differences, compared to the gains reported in 1Q08 as the local currency appreciated in that period. Therefore, the loss generated this way reached US$ 2.4 million, which contrasted sharply with the US$ 4.6 million gain reported the previous quarter.
26
PRIMA AFP: Main financial indicators (US$ thousand) (1) | ||||||||||
2Q08 | 1Q08 | Change % | ||||||||
| Income | 15,860 | 19,053 | -17 | % | ||||||
| Administrative and sale expenses | (10,066 | ) | (9,209 | ) | 9 | % | ||||
| Depreciation and amortization | (2,185 | ) | (2,138 | ) | 2 | % | ||||
Net operating income | 3,609 | 7,706 | -53 | % | ||||||
| Other income and expenses, net | (1,497 | ) | (828 | ) | 81 | % | ||||
| Workers' protif sharing and Income tax | (612 | ) | (2,526 | ) | -76 | % | ||||
Net income before translation results | 1,500 | 4,352 | -66 | % | ||||||
| Translation results and deferred liabilities | (2,454 | ) | 4,663 | -153 | % | |||||
Net income (losses) | (954 | ) | 9,015 | -111 | % | |||||
| Total Assets | 246,129 | 254,311 | -3 | % | ||||||
| Total Liabilities | 108,286 | 116,534 | -7 | % | ||||||
| Equity | 137,843 | 137,777 | 0 | % | ||||||
| (1) (IFRS) | ||||||||||
As a result of this, net earnings before the currency translation impact, reveal a business performance after provisioning for taxes and profit sharing with closer results in the 2 quarters: US$ 1.5 million earnings for 2Q08 compared better to 1Q08 when considering that the US$ 4.35 million reported includes US$ 2.3 million from the extraordinary income recognition from previous periods as explained last quarter and also the additional seasonal income for 1Q08 explained before.
However, including this currency translation loss, the company’s net result was a US$0.9 million loss.
When looking at 1H08 however, the annual cumulative result was strong with profits reaching US$8.06 million, or 200% above budget.
As a final note, at the end of the second quarter, the company’s assets were worth US$246.1 million, liabilities totalled US$108.3 million and net equity was US$137.8 million.
27
VI. EL PACIFICO PERUANO SUIZA AND SUBSIDIARIES
VI. 1 PACIFICO GROUP
VI. 1.a Second Quarter results
Premium production by Pacifico Insurance Group (PGA) including general property and casualty insurance (PPS), life insurance (PV) and health insurance (EPS)] reached US$ 149.2 million in 2Q08, or 8.5% higher than IQ08 and 27.1% above 2Q07. This significant growth in premium over 2Q07 resulted in larger reserves which grew from US$ 17.4 million to US$ 25.9 million.
Quarter | Change | |||||||||||||||
US$ mm | 2Q08 | 1Q08 | 2Q07 | 2Q08/1Q08 | 2Q08/2Q07 | |||||||||||
| Total Gross Premiums | 149.2 | 137.5 | 117.4 | 8.5 | % | 27.1 | % | |||||||||
| Retained Premiums | 125.2 | 110.2 | 91.4 | 13.6 | % | 37.0 | % | |||||||||
| Reserve Adjustments | 25.9 | 18.6 | 17.4 | 39.4 | % | 49.4 | % | |||||||||
| Net Premiums Earned | 99.3 | 91.6 | 74.0 | 8.4 | % | 34.1 | % | |||||||||
Compared to 1Q08, General P&C Insurance led growth with a larger 16.9% production; life insurance grew 1.8% while contributions to EPS dropped 0.7%.
As in 1Q08, growth in General P&C Insurance resulted principally from larger risk underwriting in the personal lines, which grew 22.5% over 1Q08 and 56.7% compared to 2Q07, in line with a portfolio restructuring policy to accomplish greater fragmentation and atomization of claims.
PPS’s 2Q08 negative -US$ 11.7 million technical result, which is a significant deterioration vs. a small loss in 1Q08 (US$ 0.5 million) and 2Q07’s US$ 7.9 million earnings, is mainly explained by severe claims in the General Insurance (Fire, Technical and Car Segments) because of heavy rains in the first half, since rainfall on the western Andean slopes in Peru’s north was 94%, 68% and 38% higher than the historical averages for February, March and April, respectively.
Medical care was also impacted by more frequent claims and rising health care cost following the revaluation of the local currency in which medical costs are denominated and inflationary pressures.
In addition, claimed Rents for Life Insurance under the annuities, mandatory life insurance and SCTR, also increased, and there was a significant rise in reserves for inflation, related products (VAC) which rose from 3.93% in December 2007 to 5.71% in June 2008, in yearly-adjusted terms.
Quarterly financial revenues totaled US$ 24.2 million, or US$ 6.0 million more than in 1Q08 and US$ 5.7 million above those in 2Q07, principally as a consequence of larger PV investments and earnings realized in the stock exchange on PPS trading portfolio.
General expenses rose 1.9 million over 2Q07 mainly as a consequence of a stronger commercial ride and larger PV sale force. However, seen against 1Q08 a 2.2 % drop was accomplished.
In addition, as a consequence of local currency (sol) depreciation in 2Q08, a US$ 6.5 million translation loss was experienced, resulting from the net active position in soles held by the 3 companies and which amount for S/.223 million. Translation results cumulative to June are accounted for by the Nuevo Sol appreciation from January to April. However, this effect is reverted by the strong local currency depreciation in May and June.
PGA’s net results after minority interests in 2Q08 reached -US$ 9.5 million, a significant deterioration from 1Q08 earnings of US$ 3.1 million and 2Q07, when they reached US$ 6.8 million, resulting principally from increased claims during the period under review and the above mentioned translation effects and despite a lower overhead to net premium ratio than fell from 24.0% to 19.8%, and also from the above mentioned increased financial revenues.
28
To May 2008, Pacífico Insurance Group (PGA) grew 27.1% while the overall market expanded by 23.9%. Such significant growth led to larger market share that rose from 33.3% in May 2007 to 34.2% in May 2008.
| US$ Thousand | Net Earnings* | Ajustment for Consolidation and Minorities | Total Contribution to BAP | ||||||||||||||||
Period | PPS | PV | EPS | PGA | |||||||||||||||
2Q07 | 2,263 | 3,931 | 585 | 6,779 | (1,645 | ) | 5,134 | ||||||||||||
3Q07 | (6,615 | ) | 2,108 | 598 | (3,908 | ) | 948 | (2,960 | ) | ||||||||||
4Q07 | (3,266 | ) | 3,351 | 768 | 853 | (208 | ) | 645 | |||||||||||
1Q08 | (121 | ) | 2,544 | 797 | 3,093 | (750 | ) | 2,343 | |||||||||||
2Q08 | (7,657 | ) | 692 | (2,759 | ) | (9,525 | ) | 2,311 | (7,214 | ) | |||||||||
Var % 2Q08/1Q08 | n.a | -73 | % | -446 | % | -408 | % | n.a | -408 | % | |||||||||
Var % 2Q08/2Q07 | -438 | % | -82 | % | -572 | % | -241 | % | n.a | -241 | % | ||||||||
VI.2 PACIFICO GENERAL P&C INSURANCE (PPS)
Premiums in 2Q08 totaled US$ 77.3 million, 16.9% higher than 1Q08 and 17.1% higher than in 2Q07. Compared to 2Q07, growth resulted principally in the Car, Fire and Healthcare Business lines.
To diversify the risk portfolio and reduce volatility in results, a strategy was pursued to increase sales to individuals; results were encouraging and increased the premium production compared to 1Q08 and 2Q07 in 22.5% and 56.7% respectively.
To June 2008, and compared with a year before, personal insurance line grew 48.7%, while market grew 30.5% principally in the Car and Mandatory Car Accident Insurance (SOAT) business lines which grew 98.9% and 93.1%, while market expanded 58.2% and 6.2% respectively.
To 2Q08, net claims totaled US$ 45.9 million at 105.2% net earned claims (SNG) compared to 81.4% SNG in 1Q08 and 66.1% in 2Q07. This increase resulted mainly from increased claims in fire, healthcare and automobile premiums, with Fire recording the most severe claims. In 2Q08, intense rainfalls and landslides led to significant losses in agriculture, infrastructure and transportation. The following chart and graph show the increase in Peru’s north rainfall compared to 2007 and historical averages for the months of February, March and April.
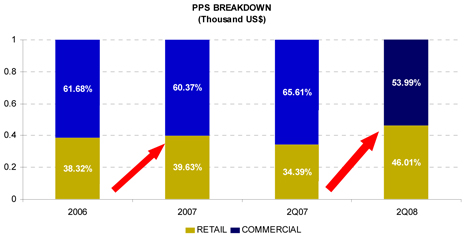
29
Such adverse natural catastrophe has mainly impacted claims in fire and Technical Insurance, further hurting the company’s corporate portfolio, where Peru’s largest companies hold their property insurance.
It is worthwhile mentioning that higher Automobile claims result principally from larger production and increased theft of high market value vehicles, as well as heavy vehicle overturns caused by rain in northern Peru.
Average rain flow in the northern zone of the Pacific Basin (mm), 2006-2008
Change | ||||||||||||||||||||||
Month | Historical Average | 2006 | 2007 | 2008 | 2008/Average | 2008/2007 | Change with respect to the previous month | |||||||||||||||
| January | 81.9 | 102.2 | 107.5 | 93.4 | 14.1 | -13.1 | 150.7 | |||||||||||||||
| February | 145.2 | 221.4 | 35.0 | 282.0 | 94.2 | 705.1 | 202.0 | |||||||||||||||
| March | 176.8 | 264.7 | 239.7 | 298.6 | 68.9 | 24.6 | 5.9 | |||||||||||||||
| April | 124.9 | 102.7 | 126.6 | 172.4 | 38.0 | 36.2 | -42.2 | |||||||||||||||
| May | 43.7 | 15.7 | 40.1 | 32.6 | P/ | -25.5 | -18.9 | -81.1 | ||||||||||||||
| June | 15.0 | 29.8 | 2.4 | |||||||||||||||||||
Source: Chart N°41 - Technical report N°05 May 2008 -Instituto Nacional de Estadística e Informática (INEI)
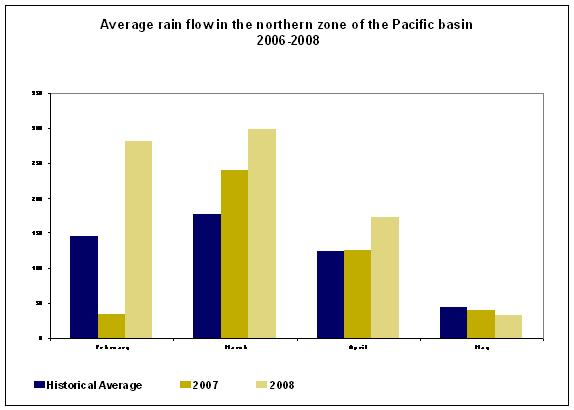
However, since June measures to reduce claims in this line of business became increasingly effective.
In addition, Healthcare Insurance claims which account 30.5% of net company claims grew significantly because of higher local and international healthcare cost and increased reserved resulting from greater expected claims from a portfolio that expanded 16% in the first half.
Technical Results in 2Q08 were de -US$ 9.4 million comparing to positive results in 1Q08 reaching US$ 1.1 million and US$ 4.7 million in 2Q07. This drop resulted principally from the higher claims, described above.
In view of higher claims, the company has introduced a correction plan focusing on three initiatives: i) to reduce exposure to corporate business by increasing reinsurance assignments; ii) correcting healthcare deviations by increasing rates and reducing the related medical costs; and iii) continue strategies underway to contain claims in the automobile business line.
30
Overhead reached US$ 9.8 million in 2Q08, 2.6% higher than in 1Q08 but 2.2% lower than in 2Q07. Comparing overhead as a percent of premiums shows 2Q08 results reached 22.5% of net premium earnings, lower than in 1Q08 and 2Q07, when 25.2% and 30.5% ratios were earned, respectively. Cost reduction strategies are currently deployed to reduce expenditure.
It is worthwhile mentioning than in June the main property and terrorism reinsurance contracts were renewed for July 2008 to June 2009, under favorable cost conditions and lower retention levels, despite discouraging outcomes during the prior period resulting from last August’s earthquake and severe claims in fire and technical insurance lines during the prior quarter.
The local currency’s depreciation in 2Q08 resulted in a translation loss reaching US$ 2mm, compared to profits earned in 1Q08 for US$ 1.7mm.
Net result for the period reached -US$ 7.7 million, lower than 1Q08’s – US$122 thousand and 2Q07’s US$2.3 million.
PPS’s market share in general insurance to June 2008 reached 34.8%, similar to June 2007’s. Strongest growth business lines were vehicles and mandatory car insurance, at 98.9% and 93.1%, respectively.
VI.3 PACIFICO LIFE
Premiums produced during this quarter reached US$ 44.8 million, 1.8% higher than in 1Q08 and 48.4% above 2Q07. Compared to a year ago, strongest performers were annuities, pension funds, individual life and credit life. Slight growth compared to a year ago is accounted for by individual and credit life insurance products.
Pacífico Vida
(US$ thousand)
Total Premiums | Change % | |||||||||||||||
Products | 2Q08 | 1Q08 | 2Q07 | 1Q08 | 2Q07 | |||||||||||
| Individual life | 10,379 | 9,668 | 7,739 | 7.4 | % | 34.1 | % | |||||||||
| Individual annuity | 11,175 | 11,988 | 7,617 | -6.8 | % | 46.7 | % | |||||||||
| Disability & survivor ( Pension) | 8,430 | 8,914 | 5,013 | -5.4 | % | 68.2 | % | |||||||||
| Credit Life | 4,837 | 4,199 | 2,208 | 15.2 | % | 119.1 | % | |||||||||
| Personal accidents | 2,308 | 2,130 | 1,724 | 8.4 | % | 33.9 | % | |||||||||
| Group life (Law) | 2,225 | 2,312 | 1,614 | -3.8 | % | 37.9 | % | |||||||||
| Group life | 2,744 | 2,636 | 2,936 | 4.1 | % | -6.5 | % | |||||||||
| Limited workers compensation | 2,698 | 2,155 | 1,333 | 25.2 | % | 102.4 | % | |||||||||
TOTAL | 44,796 | 44,002 | 30,184 | 1.8 | % | 48.4 | % | |||||||||
Higher inflation has impacted Pacifico Life’s inflation-pegged Nuevos Soles liabilities that to June totaled the equivalent of US$ 190 million out of a total portfolio of about US$600 million. Higher inflation triggers automatic adjustment of related liabilities by creating technical reserves, while the supporting likewise inflation-pegged assets will only be adjusted in the subsequent month pursuant to regulations in force. In June this year, the impact of the above reached approximately US$ 1.5 million.
Claims in 2Q08 reached US$22.4 million, i.e. US$2.2 million more than in 1Q08 and US$9.0 million more than in 2Q07 mainly as a result of pension and annuity products that expanded following increased affiliations and a larger portfolio, respectively.
31
Technical results of –US$3.5 million were lower than in 1Q08 (-US$1.9 million) and in 2Q07 when technical results were zero, due mainly to more numerous claims as already mentioned and greater purchase and sales costs.
Overhead reached US$7.5 million in 2Q08 or 48.8% more than in 2Q07 but no change from the previous quarter. This is again accounted for by the strong marketing effort to significantly expand the sales and distribution network in the medium term.
Net Earnings after minority interest reached US$0.7 million in 2Q08 compared to US$2.5 million in 1Q08 and 2Q07’s US$3.9 million, a consequence of greater cost of the portfolio under management, a negative US$2.3 million translation resulting from depreciation of the local currency, and an inflation-driven regulatory mismatch in adjusting annuity-related assets and liabilities in local currency. The mismatch will be made up for through a book entry next quarter.
A stronger sales force and new product launches increased market share to 27.7% in June, more than three percent point above the June 2007 24.3% share.
VI.4 PACIFICO HEALTH (EPS)
Total members’ contributions in 2Q08 reached US$28.2 million, or 30.4% more than in 2Q07 but slightly below 1Q08’s (-0.7%) , driven principally by contributions to regular health plans.
Claims in 2Q08 reached US$ 25.4 million, compared to US$ 25.5 million in 1Q08 and US$ 17.7 million in 2Q07.
SNG in 2Q08 reached 89.8%, less than 1Q08’s 91.0%, but higher than 2Q07’s 81.5%, a result of a real term increase in health care and related services’ costs, the negative impact of the local currency’s appreciation vis-à-vis the US dollar (since reserves are booked and kept in Nuevos Soles) and larger actuary reserves.
Technical results for this quarter reached US$1.1 million, higher than in 1Q08 (US$0.9 million) but lower than in 2Q07 (US$3.0 million). This reduction is accounted for by higher claims reserves.
Overhead totaled US$ 2.5 million, 10.9% less than in 1Q08 and slightly higher than in 2Q07 (+0.4%).
Translation expenses for this quarter reached US$2.2 million, as a consequence of the local currency’s depreciation and the corresponding impact on soles-denominated transactions, and subsequent technical reserves.
Net quarterly results reached – US$2.8 million, lower than in 1Q08 (US$0.8 million) and in 2Q07 (US$0.6 million). The drop is explained mainly by larger reserves as mentioned above.
Finally, to May 2008, the company’s market share reached 53.3%, less than May 2007’s 54.1%.
32
VII. ECONOMIC OUTLOOK
Economic Activity
Peru’s economy grew 7.3% in May, one of the slowest rates so far this year (only lower than in March). This was the result partially of bank holidays decided by government for the European Union, Latin American and Caribbean EULAC meeting and higher than normal temperatures that impacted products from the farming and, in particular, the fisheries industries. Peru’s economy has expanded 9.8% over the last twelve months, driven on the demand side, by lively private and government investment and by industries linked to domestic demand, including construction and non-primary manufacturing. Construction grew +19.6% from June 2007 to May 2008 supported by projects like the G-1 El Platanal Hydropower Station in Cañete, the Pampa Melchorita liquefaction Plant in Pisco, the Underground Central Bus Station in Paseo de la Republica, in Lima, the Venezuela and Universitaria avenues loop, also in Lima, and others. Meanwhile, the non-primary manufacturing industry advanced +10.6% during the same period driven by larger output of capital and intermediate goods, reflecting a stronger manufacturing industry output as a consequence of gradually sliding tariffs. On the contrary, primary manufacturing growth has slowed down (+7.1%), impacted by a slow oil and by-products processing industry and also slower fishmeal and canned fish processing. Growth prospects for the coming months are encouraging, supported by lively domestic demand, although a gradual slowdown may still occur in 2008, spurred by continuous increases in the Central Reserve Bank’s benchmark rate and steeper legal reserve requirements in both local currency and US dollars as it pushes active market rates up to discourage consumption and, thereby, reduce upward pressures on prices.
Gross Domestic Product and Internal Demand
(Annualized percentage variation)
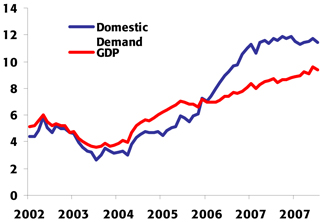
Source: INEI
External Sector
In the last twelve months to May, the trade balance surplus reached US$ 7.8 billion or US$ 535 million lower than the surplus by 2007-end. This smaller amount results from a yearly adjusted 53.5% growth of imports (mainly inputs for industry and consumer goods), in view of higher oil quotations and steeper food prices, including wheat, soy and corn. These more than offset a 30.7% growth of exports. From June 2007 to May 2008, exports reached US$ 31.3 billion, with non-traditional exports growing slightly less (27.5%) than conventional foreign sales (31.6% up). Inputs imports grew 59.5% while capital goods imports expanded 49.4%. Consumer good inputs moved more slowly (only 43.9%). After adjusting for price effects, imports grew at an annually-adjusted 30.1% (31.8% at 2007-closing), reflecting a still powerful domestic demand drive. Finally, notwithstanding changes in monetary policy and dollars sales by Peru’s Central Bank, foreign currency reserves continued to grow and, by June, had reached a new US$ 35.5 billion record (US$ 27.6 billion by year end 2007).
33
Exports and Imports
(Annualized percentage variation)
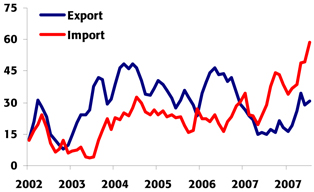
Source: BCRP
Prices and Exchange rate
To June 2008, cumulative inflation in Metropolitan Lima for the twelve months to date reached 5.7%, well above the 2% ± 1% inflation target fixed by the Central Bank, and the highest since the inflation target mechanism was introduced in 2002. Continued prices increases in recent months are mostly a result of higher food prices. Excluding this consumer good groups, inflation would have totaled only 2.0%. Nevertheless, it is worth underscoring food price rises were not only due to external pressures, which did significantly impact products with a high foreign component, such as poultry, vegetable oils or wheat flour, but also were clear in produce from local agriculture, such as fruits and vegetables, and which is a consequence of the worst agricultural campaign since 2003-2004. Against this background, BCR has increased its benchmark rate four-fold already in the last 7 months, each time by 25 base points, while simultaneously trying to push market rates up by requiring higher legal reserves for domestic and foreign currency deposits. BCR has discouraged the mass inflow of short term capital (which spiked in the first quarter this year) by requiring a 120% marginal legal reserve rate on local currency-denominated deposits by non-residents, a seemingly effective measure. However, this step also led to certain exchange rate volatility in recent months as the foreign rate approached S/. 3.00, after which the Central Bank started selling US dollars, pushing the US currency down to about S/. 2.84. The exchange rate closed at S/. 2.965 in June, reflecting an annually-adjusted appreciation of 6.4% (10.0% to July 21). Although in recent weeks the BCR has stayed away from the foreign currency exchange market, interventions from July 2007 to July 2008 reached US$ 13.9 billion (US$ 10.3 billion at the end of 2007).
34
Consumer price index (Annual percentage variation) | Exchange Rate and purchases US$ BCRP (S/. per dollar and US$ MM) | |
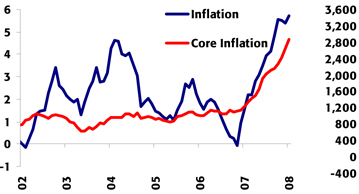 | 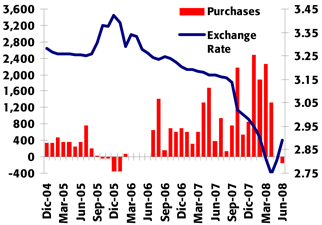 |
Source: INEI, BCR
Fiscal Aspects
The central government’s tax receipts in the first half this year, excluding back income tax revenue, grew 13.9% compared to a year ago, while growth in June reached 12.0%. Tax collection grew despite two tariff reductions since October and a lower excise tax on fuels, as livelier domestic demand continued to drive growth. Public investment jumped both at central and local and regional governments’ levels, which may result in a lower government surplus than in 2007 (3.1% of GDP) despite larger tax collection.
Fiscal Income of the Central Government
(Annualized, expressed in thousand of millions of Nuevos Soles)
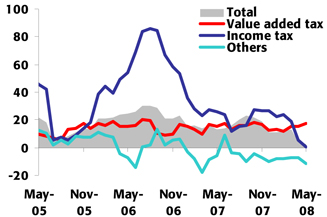
Source: Sunat
35
Banking System
Central Bank data to March shows dollar denominated loans in banking companies grew 46.6% annually (40.7% at the end of 2007). Part of the increase however is a consequence of a stronger Nuevo sol in recent months. In Nuevos Soles, bank loans grew 26.4% while by end 2007 they had increased 30.9%. Meanwhile, consumer loans grew the fastest annually (55.6% in February and 47.3% at end 2007), although commercial loans also experienced some advance (from 32.2% to 32.6%). Home loans dropped from 16.3% in December to 13.9% in February.
Deposits continued to rise and grew 25.7% in soles since February last year (24.2% at the end of 2007). Greater growth was noticed in time deposits, up 30.1%, though demand deposits also moved quickly, or at 25.8% also above average. Savings deposits grew in February at an annual 14.4%.
The banking system’s de-dollarization has speeded up so far this year, in particular dollar denominated deposits that at the end of 2007 made up 59.3% of the total, but fell to 51.9% by February. This trend is accounted for by the patterns followed by term deposits where dollar denominated liabilities fell from 65.7% to 54.7%, although smaller demand dollar denominated deposits were also noticed (a fall from 48.3% to 45.6%) as well as in savings deposits (from 56.7% to 52.2%). Dollar denominated loans have dropped to 60.5% of the total, down from 61.8% at the end of 2007, in particular because of behavior in the micro companies segment, where dollarization fell from 23.6% to 20.9% and in home loans where dollar denominated loans slipped from 80.2% to 78.1%. Over the same period dollar denominated commercial loans increased slightly, from 72.8% to 73.2%.
Interest rates have been stable or rising slightly in recent months, in line with the Central Bank’s objective to gradually slow down the growth of credit and overheating the economy. Rates charged by banks in local currency (TAMN) closed March at 23.9%, compared to 22.3% at the end of 2007, while the corresponding rate in dollars remained relatively stable and reached 10.3% at the end of the third quarter, compared to 10.5% at the end of 2007. The borrowing rates in Nuevos soles (TIPMN) and in dollars (TIPEX) closed March at 3.3% and 2.6% respectively, slightly above the 3.3% and 2.5% at the end of 2006
Main Financial Indicators
2006 | 2007 | 2008 | ||||||||||||||||||||
Year | IQ | IIQ | IIIQ | IVQ | Year | IQ | ||||||||||||||||
| GDP (US$ MM) | 93,377 | 24,223 | 27,930 | 27,024 | 30,042 | 109,219 | 30,304 | |||||||||||||||
| Real GDP (var. %) | 8.0 | 8.5 | 8.1 | 9.0 | 9.8 | 8.9 | 9.5 | |||||||||||||||
| GDP per-cápita (US$) | 3,294 | 3.507 | 4.032 | 3.889 | 4.311 | 3.935 | 4,335 | |||||||||||||||
| Domestic demand (var. %) | 10.4 | 11.2 | 10.5 | 13.1 | 11.3 | 11.5 | 11.0 | |||||||||||||||
| Consumption (var. %) | 6.6 | 8.3 | 8.1 | 8.0 | 8.9 | 8.3 | 8.3 | |||||||||||||||
| Private Investment (var. %) | 26.3 | 17.0 | 22.6 | 27.9 | 23.1 | 22.8 | 23.3 | |||||||||||||||
| CPI (annual change, %) | 1.1 | 0.3 | 1.6 | 2.8 | 3.9 | 3.9 | 5.6 | |||||||||||||||
| Exchange rate, eop (S/. per US$) | 3.20 | 3.18 | 3.17 | 3.09 | 3.00 | 3.00 | 2.75 | |||||||||||||||
| Devaluation (annual change, %) | -6.8 | -5.2 | -2.8 | -5.0 | -6.1 | -6.1 | -13.8 | |||||||||||||||
| Exchange rate, average (S/. per US$) | 3.27 | 3.19 | 3.17 | 3.14 | 2.98 | 3.12 | 2.89 | |||||||||||||||
| Non-Financial Public Sector (% of GDP) | 2.1 | 4.9 | 8.0 | 2.1 | -2.4 | 3.1 | 4.5 | |||||||||||||||
| Central government current revenues (% of GDP | 17.3 | 17.1 | 20.1 | 17.4 | 16.9 | 17.9 | 18.1 | |||||||||||||||
| Tax Income (% of GDP) | 14.9 | 14.7 | 17.3 | 14.9 | 14.4 | 15.4 | 15.4 | |||||||||||||||
| Non Tax Income (% of GDP) | 2.4 | 2.4 | 2.8 | 2.5 | 2.5 | 2.5 | 2.7 | |||||||||||||||
| Current expenditures (% of GDP) | 12.2 | 11.5 | 14.0 | 11.4 | 12.9 | 12.5 | 10.4 | |||||||||||||||
| Capital expenditures (% of GDP) | 2.0 | 0.7 | 1.3 | 2.2 | 4.1 | 2.2 | 1.1 | |||||||||||||||
| Trade Balance (US$ MM) | 8,853 | 1,539 | 2,245 | 2,300 | 2,273 | 8,356 | 1,473 | |||||||||||||||
| Exports (US$ MM) | 23,750 | 5,747 | 6,741 | 7,594 | 7,874 | 27,956 | 7,735 | |||||||||||||||
| Imports (US$ MM) | 14,897 | 4,208 | 4,497 | 5,294 | 5,601 | 19,599 | 6,261 | |||||||||||||||
| Current Account Balance (US$ MM) | 2,456 | 92 | 368 | 500 | 544 | 1,505 | -655 | |||||||||||||||
| Current Account Balance (% of GDP) | 2.6 | 0.4 | 1.3 | 1.9 | 1.8 | 1.4 | -2.2 | |||||||||||||||
36
Company Description:
Credicorp Ltd. (NYSE: BAP) is the leading financial services holding company in Peru. It primarily operates via its four principal Subsidiaries: Banco de Credito del Peru (BCP), Atlantic Security Holding Corporation (ASHC), El Pacífico-Peruano Suiza Compañía de Seguros y Reaseguros (PPS) and Grupo Credito. Credicorp is engaged principally in commercial banking (including trade finance, corporate finance and leasing services), insurance (including commercial property, transportation and marine hull, automobile, life, health and pension fund underwriting insurance) and investment banking (including brokerage services, asset management, trust, custody and securitization services, trading and investment). BCP is the Company's primary subsidiary.
Safe Harbor for forward-looking statements:
This material includes “forward-looking statements” within the meaning of Section 21E of the Securities Exchange Act of 1934. All statement other than statements of historical information provided herein are forward-looking and may contain information about financial results, economic conditions, trends and known uncertainties.
The Company cautions readers that actual results could differ materially from those expected by the Company, depending on the outcome of certain factors, including, without limitation: (1) adverse changes in the Peruvian economy with respect to the rates of inflation, economic growth, currency devaluation, and other factors, (2) adverse changes in the Peruvian political situation, including, without limitation, the reversal of market-oriented reforms and economic recovery measures, or the failure of such measures and reforms to achieve their goals, and (3) adverse changes in the markets in which the Company operates, including increased competition, decreased demand for financial services, and other factors. Readers are cautioned not to place undue reliance on these forward-looking statements, which speak only as of the date hereof.
The Company undertakes no obligation to release publicly the result of any revisions to these forward-looking statements which may be made to reflect events or circumstances after the date hereof, including, without limitation, changes in the Company’s business strategy or planned capital expenditures, or to reflect the occurrence of unanticipated events.
37
CREDICORP LTD. AND SUBSIDIARIES
CONSOLIDATED BALANCE SHEETS
(In US$ thousands, IFRS)
As of | June 08/ | June 08/ | ||||||||||||||
June 2008 | March 2008 | June 2007 | June 07 | March 08 | ||||||||||||
Assets | ||||||||||||||||
Cash and due from banks | ||||||||||||||||
| Non-interest bearing | 535,737 | 585,618 | 516,676 | 3.7 | % | -8.5 | % | |||||||||
| Interest bearing | 2,624,343 | 2,195,174 | 2,041,200 | 28.6 | % | 19.6 | % | |||||||||
| Total cash and due from banks | 3,160,080 | 2,780,792 | 2,557,876 | 23.5 | % | 13.6 | % | |||||||||
Marketable securities, net | 55,240 | 41,538 | 53,569 | 3.1 | % | 33.0 | % | |||||||||
Loans | 9,288,774 | 8,919,841 | 7,031,734 | 32.1 | % | 4.1 | % | |||||||||
| Current | 9,219,561 | 8,848,671 | 6,964,320 | 32.4 | % | 4.2 | % | |||||||||
| Past Due | 69,213 | 71,169 | 67,414 | 2.7 | % | -2.7 | % | |||||||||
| Less - Reserve for possible loan losses | (218,888 | ) | (220,617 | ) | (191,747 | ) | 14.2 | % | -0.8 | % | ||||||
Loans, net | 9,069,886 | 8,699,223 | 6,839,987 | 32.6 | % | 4.3 | % | |||||||||
Investments securities available for sale | 6,514,536 | 6,802,999 | 4,686,444 | 39.0 | % | -4.2 | % | |||||||||
Reinsurance assets | 130,113 | 112,457 | 65,831 | 97.6 | % | 15.7 | % | |||||||||
Premiums and other policyholder receivables | 108,444 | 94,406 | 85,780 | 26.4 | % | 14.9 | % | |||||||||
Property, plant and equipment, net | 292,498 | 275,206 | 256,822 | 13.9 | % | 6.3 | % | |||||||||
Due from customers on acceptances | 52,358 | 49,637 | 46,331 | 13.0 | % | 5.5 | % | |||||||||
Other assets | 1,096,926 | 1,089,004 | 726,776 | 50.9 | % | 0.7 | % | |||||||||
Total Assets | 20,480,080 | 19,945,264 | 15,319,416 | 33.7 | % | 2.7 | % | |||||||||
Liabilities and shareholders' equity | ||||||||||||||||
Deposits and Obligations | ||||||||||||||||
| Non-interest bearing | 2,913,157 | 2,875,990 | 2,339,402 | 24.5 | % | 1.3 | % | |||||||||
| Interest bearing | 10,043,281 | 10,053,298 | 7,813,199 | 28.5 | % | -0.1 | % | |||||||||
| Total deposits and Obligations | 12,956,438 | 12,929,288 | 10,152,601 | 27.6 | % | 0.2 | % | |||||||||
Due to banks and correspondents | 2,955,428 | 2,439,363 | 1,685,689 | 75.3 | % | 21.2 | % | |||||||||
Acceptances outstanding | 52,358 | 49,637 | 46,331 | 13.0 | % | 5.5 | % | |||||||||
Reserves for property and casualty claims | 777,218 | 742,774 | 578,754 | 34.3 | % | 4.6 | % | |||||||||
Reserve for unearned premiums | 142,549 | 127,285 | 112,086 | 27.2 | % | 12.0 | % | |||||||||
Reinsurance payable | 21,410 | 24,444 | 25,024 | -14.4 | % | -12.4 | % | |||||||||
Bonds and subordinated debt | 801,145 | 743,065 | 504,948 | 58.7 | % | 7.8 | % | |||||||||
Other liabilities | 851,884 | 899,350 | 548,719 | 55.2 | % | -5.3 | % | |||||||||
Minority interest | 130,584 | 139,378 | 130,111 | 0.4 | % | -6.3 | % | |||||||||
Total liabilities | 18,689,014 | 18,094,584 | 13,784,262 | 35.6 | % | 3.3 | % | |||||||||
Net Shareholder's equity | 1,791,066 | 1,850,680 | 1,535,154 | 16.7 | % | -3.2 | % | |||||||||
Total liabilities and net shareholder's equity | 20,480,080 | 19,945,264 | 15,319,416 | 33.7 | % | 2.7 | % | |||||||||
Contingent Credits | 7,452,138 | 6,066,208 | 4,393,139 | 69.6 | % | 22.8 | % | |||||||||
38
CREDICORP LTD. AND SUBSIDIARIES
QUARTERLY INCOME STATEMENT
(In US$ thousands, IFRS)
Quarter | Change | Six months ended | Change | ||||||||||||||||||||||
2Q08 | 1Q08 | 2Q07 | 2Q08/ 2Q07 | 2Q08/ 1Q08 | June 2008 | June 2007 | June 08/ June 07 | ||||||||||||||||||
Interest income and expense | �� | ||||||||||||||||||||||||
| Interest and dividend income | 352,539 | 325,264 | 248,976 | 41.6 | % | 8.4 | % | 677,803 | 469,823 | 44.3 | % | ||||||||||||||
| Interest expense | (135,554 | ) | (133,997 | ) | (89,671 | ) | 51.2 | % | 1.2 | % | (269,551 | ) | (171,659 | ) | 57.0 | % | |||||||||
| Net interest and dividend income | 216,986 | 191,267 | 159,305 | 36.2 | % | 13.4 | % | 408,253 | 298,163 | 36.9 | % | ||||||||||||||
Provision for loan losses | (9,235 | ) | (16,191 | ) | (6,090 | ) | 51.6 | % | -43.0 | % | (25,426 | ) | (10,508 | ) | 142.0 | % | |||||||||
Non financial income | |||||||||||||||||||||||||
| Fee income | 96,842 | 99,706 | 76,100 | 27.3 | % | -2.9 | % | 196,548 | 150,176 | 30.9 | % | ||||||||||||||
| Net gain on foreign exchange transactions | 31,435 | 20,606 | 12,796 | 145.7 | % | 52.6 | % | 52,041 | 24,751 | 110.3 | % | ||||||||||||||
| Net gain on sales of securities | 6,006 | 24,310 | 14,644 | -59.0 | % | -75.3 | % | 30,316 | 32,590 | -7.0 | % | ||||||||||||||
| Other | 5,685 | 7,522 | 4,486 | 26.7 | % | -24.4 | % | 13,207 | 11,703 | 12.8 | % | ||||||||||||||
Total non financial income, net | 139,967 | 152,144 | 108,026 | 29.6 | % | -8.0 | % | 292,111 | 219,220 | 33.3 | % | ||||||||||||||
Insurance premiums and claims | |||||||||||||||||||||||||
| Net premiums earned | 96,345 | 88,390 | 71,657 | 34.5 | % | 9.0 | % | 184,734 | 141,647 | 30.4 | % | ||||||||||||||
| Net claims incurred | (30,890 | ) | (19,854 | ) | (14,017 | ) | 120.4 | % | 55.6 | % | (50,745 | ) | (27,556 | ) | 84.2 | % | |||||||||
| Increase in cost for life and health policies | (62,529 | ) | (56,237 | ) | (38,363 | ) | 63.0 | % | 11.2 | % | (118,766 | ) | (77,451 | ) | 53.3 | % | |||||||||
| Total other operating income, net | 2,926 | 12,298 | 19,278 | -84.8 | % | -76.2 | % | 15,224 | 36,641 | -58.5 | % | ||||||||||||||
Operating expenses | |||||||||||||||||||||||||
| Salaries and employees benefits | (90,928 | ) | (88,504 | ) | (74,385 | ) | 22.2 | % | 2.7 | % | (179,431 | ) | (143,364 | ) | 25.2 | % | |||||||||
| Administrative, general and tax expenses | (59,584 | ) | (58,913 | ) | (47,981 | ) | 24.2 | % | 1.1 | % | (118,497 | ) | (91,825 | ) | 29.0 | % | |||||||||
| Depreciation and amortization | (14,371 | ) | (13,733 | ) | (12,488 | ) | 15.1 | % | 4.6 | % | (28,103 | ) | (24,952 | ) | 12.6 | % | |||||||||
| Other | (26,699 | ) | (23,010 | ) | (25,031 | ) | 6.7 | % | 16.0 | % | (49,709 | ) | (49,555 | ) | 0.3 | % | |||||||||
| Total operating expenses | (191,582 | ) | (184,159 | ) | (159,886 | ) | 19.8 | % | 4.0 | % | (375,741 | ) | (309,695 | ) | 21.3 | % | |||||||||
Net Income before workers' profit sharing, income taxes and minority interest | 159,062 | 155,359 | 120,633 | 31.9 | % | 2.4 | % | 314,421 | 233,821 | 34.5 | % | ||||||||||||||
| Workers’ profit sharing | (1,868 | ) | (5,417 | ) | (2,874 | ) | -35.0 | % | -65.5 | % | (7,284 | ) | (6,636 | ) | 9.8 | % | |||||||||
| Income taxes | (21,843 | ) | (33,912 | ) | (25,759 | ) | -15.2 | % | -35.6 | % | (55,755 | ) | (49,921 | ) | 11.7 | % | |||||||||
| Minority interest | (175 | ) | (6,728 | ) | (6,324 | ) | -97.2 | % | -97.4 | % | (6,903 | ) | (14,220 | ) | -51.5 | % | |||||||||
Net income attributed to Credicorp before translation result | 135,176 | 109,303 | 85,676 | 57.8 | % | 23.7 | % | 244,478 | 163,043 | 49.9 | % | ||||||||||||||
| Translation result | (61,510 | ) | 68,695 | 1,728 | -3660.0 | % | -189.5 | % | 7,185 | 3,373 | 113.0 | % | |||||||||||||
Net income attributed to Credicorp | 73,666 | 177,998 | 87,403 | -15.7 | % | -58.6 | % | 251,663 | 166,416 | 51.2 | % |
39
CREDICORP LTD. AND SUBSISIARIES
SELECTED FINANCIAL INDICATORS
Quarter | Year ended | |||||||||||||||
2Q08 | 1Q08 | 2Q07 | June 2008 | June 2007 | ||||||||||||
Profitability | ||||||||||||||||
| Net income per common share (US$ per share)(1) | 0.92 | 2.23 | 1.10 | 3.16 | 2.09 | |||||||||||
| Net interest margin on interest earning assets (2)* (old methodology) | 5.37 | % | 5.07 | % | 5.46 | % | 5.25 | % | 5.48 | % | ||||||
| Net interest margin on interest earning assets (2)** (new methodology) | 4.78 | % | 4.53 | % | 4.91 | % | 4.69 | % | 4.93 | % | ||||||
| Return on average total assets (2)(3) | 1.46 | % | 3.78 | % | 2.83 | % | 1.29 | % | 1.29 | % | ||||||
| Return on average shareholders' equity (2)(3) | 16.18 | % | 40.38 | % | 25.96 | % | 28.30 | % | 22.80 | % | ||||||
| No. of outstanding shares (millions)(4) | 79.8 | 79.8 | 79.8 | 79.8 | 79.8 | |||||||||||
Quality of loan portfolio | ||||||||||||||||
| Past due loans as a percentage of total loans | 0.75 | % | 0.80 | % | 0.96 | % | 0.75 | % | 0.96 | % | ||||||
| Reserves for loan losses as a percentage of | ||||||||||||||||
| total past due loans | 316.26 | % | 309.99 | % | 284.43 | % | 316.26 | % | 284.43 | % | ||||||
| Reserves for loan losses as a percentage of | ||||||||||||||||
| total loans | 2.36 | % | 3.42 | % | 2.73 | % | 2.36 | % | 2.73 | % | ||||||
Operating efficiency | ||||||||||||||||
| Oper. expense as a percent. of total income (5) | 37.34 | % | 40.29 | % | 42.16 | % | 38.74 | % | 42.32 | % | ||||||
| Oper. expense as a percent. of av. tot. assets(2)(3)(5) | 3.26 | % | 3.42 | % | 4.36 | % | 3.34 | % | 4.04 | % | ||||||
Average balances (millions of US$) (3) | ||||||||||||||||
| Interest earning assets | 18,151 | 16,905 | 12,976 | 17,408 | 12,106 | |||||||||||
| Total Assets | 20,213 | 18,826 | 12,370 | 19,519 | 12,882 | |||||||||||
| Net equity | 1,821 | 1,763 | 1,347 | 1,792 | 1,378 | |||||||||||
(1) | Based on Net Income attributed to BAP. Number of shares outstanding of 79.8 million in all periods. |
| (2) | Ratios are annualized. |
| (3) | Averages are determined as the average of period-beginning and period-ending balances. |
| (4) | Net of treasury shares. The total number of shares was of 94.38 million. |
| (5) | Total income includes net interest income, fee income, net gain on foreign exchange transactions and net premiums earned. |
| Operating expense does not include Other expenses. | |
| (6) | For holding's financial institutions. |
| (7) | Risk-weighted assets include market risk. |
| * | The old methodology for the calculation of NIM considered only 70% of the investments available for sale as part of interest earning assets. |
| ** | The new methodology for the calculation of NIM considers 100% of the investments available for sale as interest earning assests. |
40
BANCO DE CREDITO DEL PERU AND SUBSIDIARIES
CONSOLIDATED BALANCE SHEET
(In US$ thousands, IFRS)
As of | Change % | |||||||||||||||
June 08 | March 08 | June 07 | June 08/ June 07 | June 08/ March 08 | ||||||||||||
ASSETS | ||||||||||||||||
Cash and due from banks | 3,093,121 | 2,640,741 | 2,301,566 | 34.4 | % | 17.1 | % | |||||||||
| Cash and BCRP | 2,716,842 | 2,304,499 | 1,848,191 | 47.0 | % | 17.9 | % | |||||||||
| Deposits in other Banks | 367,693 | 330,662 | 431,090 | -14.7 | % | 11.2 | % | |||||||||
| Interbanks | 1,620 | 1,468 | 17,133 | -90.5 | % | 10.3 | % | |||||||||
| Accrued interest on cash and due from banks | 6,967 | 4,111 | 5,151 | 35.2 | % | 69.5 | % | |||||||||
Marketable securities, net | 55,240 | 38,538 | 53,569 | 3.1 | % | 43.3 | % | |||||||||
Loans | ||||||||||||||||
| Current | 9,129,652 | 8,767,674 | 6,923,441 | 31.9 | % | 4.1 | % | |||||||||
| Past Due | 68,264 | 70,015 | 66,400 | 2.8 | % | -2.5 | % | |||||||||
| Less - Reserve for possible loan losses | (217,569 | ) | (219,295 | ) | (190,413 | ) | 14.3 | % | -0.8 | % | ||||||
Loans, net | 8,980,347 | 8,618,394 | 6,799,427 | 32.1 | % | 4.2 | % | |||||||||
Investment securities available for sale | 4,747,724 | 4,928,259 | 2,858,817 | 66.1 | % | -3.7 | % | |||||||||
Property, plant and equipment, net | 232,509 | 217,746 | 197,980 | 17.4 | % | 6.8 | % | |||||||||
Due from customers acceptances | 52,314 | 49,594 | 46,220 | 13.2 | % | 5.5 | % | |||||||||
Other assets | 811,984 | 806,106 | 465,636 | 74.4 | % | 0.7 | % | |||||||||
Total Assets | 17,973,240 | 17,299,378 | 12,723,215 | 41.3 | % | 3.9 | % | |||||||||
LIABILITIES AND SHAREHOLDERS' EQUITY | ||||||||||||||||
Deposits and obligations | 13,251,408 | 12,938,927 | 9,459,008 | 40.1 | % | 2.4 | % | |||||||||
| Demand deposits | 3,872,063 | 3,726,879 | 3,258,797 | 18.8 | % | 3.9 | % | |||||||||
| Saving deposits | 2,603,344 | 2,749,983 | 2,026,729 | 28.5 | % | -5.3 | % | |||||||||
| Time deposits | 5,740,312 | 5,543,993 | 3,317,527 | 73.0 | % | 3.5 | % | |||||||||
| Severance indemnity deposits (CTS) | 969,594 | 859,630 | 820,026 | 18.2 | % | 12.8 | % | |||||||||
| Interest payable | 66,095 | 58,442 | 35,928 | 84.0 | % | 13.1 | % | |||||||||
Due to banks and correspondents | 1,920,428 | 1,538,238 | 1,301,216 | 47.6 | % | 24.8 | % | |||||||||
Bonds and subordinated debt | 832,648 | 768,783 | 537,217 | 55.0 | % | 8.3 | % | |||||||||
Acceptances outstanding | 52,314 | 49,594 | 46,220 | 13.2 | % | 5.5 | % | |||||||||
Other liabilities | 662,279 | 808,248 | 415,391 | 59.4 | % | -18.1 | % | |||||||||
Total liabilities | 16,719,077 | 16,103,791 | 11,759,051 | 42.2 | % | 3.8 | % | |||||||||
NET SHAREHOLDERS' EQUITY | 1,254,162 | 1,195,587 | 964,164 | 30.1 | % | 4.9 | % | |||||||||
| Capital stock | 439,474 | 364,706 | 364,706 | 20.5 | % | 20.5 | % | |||||||||
| Reserves | 388,062 | 388,062 | 282,189 | 37.5 | % | 0.0 | % | |||||||||
| Unrealized Gains and Losses | 70,819 | 90,285 | 66,066 | 7.2 | % | -21.6 | % | |||||||||
| Retained Earnings | 111,994 | 186,761 | 96,484 | 16.1 | % | -40.0 | % | |||||||||
| Income for the year | 243,814 | 165,772 | 154,719 | 57.6 | % | 47.1 | % | |||||||||
TOTAL LIABILITIES and NET SHAREHOLDERS' EQUITY | 17,973,240 | 17,299,378 | 12,723,215 | 41.3 | % | 3.9 | % | |||||||||
CONTINGENT CREDITS | 7,452,651 | 6,071,114 | 4,070,415 | 83.1 | % | 22.8 | % | |||||||||
41
BANCO DE CREDITO DEL PERU AND SUBSIDIARIES
QUARTERLY INCOME STATEMENT
(In US$ thousands, IFRS)
Three months ended | Change | Six month ended | Change | ||||||||||||||||||||||
2Q08 | 1Q08 | 2Q07 | 2Q08/ 2Q07 | 2Q08/ 1Q08 | Jun 08 | Jun 07 | Jun 08/ Jun 07 | ||||||||||||||||||
Interest income and expense | |||||||||||||||||||||||||
| Interest and dividend income | 319,420 | 296,660 | 220,180 | 45.1 | % | 7.7 | % | 616,080 | 415,568 | 48.3 | % | ||||||||||||||
| Interest expense | (131,061 | ) | (124,049 | ) | (79,035 | ) | 65.8 | % | 5.7 | % | (255,109 | ) | (151,133 | ) | 68.8 | % | |||||||||
| Net interest and dividend income | 188,360 | 172,611 | 141,146 | 33.5 | % | 9.1 | % | 360,972 | 264,435 | 36.5 | % | ||||||||||||||
Provision for loan losses | (10,280 | ) | (16,951 | ) | (6,885 | ) | 49.3 | % | -39.4 | % | (27,231 | ) | (12,744 | ) | 113.7 | % | |||||||||
Non financial income | |||||||||||||||||||||||||
| Banking services commissions | 85,228 | 79,747 | 66,986 | 27.2 | % | 6.9 | % | 164,975 | 129,455 | 27.4 | % | ||||||||||||||
| Net gain on foreign exchange transactions | 31,389 | 19,971 | 12,778 | 145.7 | % | 57.2 | % | 51,360 | 24,715 | 107.8 | % | ||||||||||||||
| Net gain on sales of securities | 3,721 | 22,655 | 7,586 | -50.9 | % | -83.6 | % | 26,376 | 16,796 | 57.0 | % | ||||||||||||||
| Other | 2,008 | 2,190 | 1,479 | 35.8 | % | -8.3 | % | 4,198 | 4,117 | 2.0 | % | ||||||||||||||
| Total fees and income from services, net | 122,347 | 124,563 | 88,827 | 37.7 | % | -1.8 | % | 246,909 | 175,083 | 41.0 | % | ||||||||||||||
Operating expenses | |||||||||||||||||||||||||
| Salaries and employees benefits | (71,871 | ) | (70,553 | ) | (56,865 | ) | 26.4 | % | 1.9 | % | (142,424 | ) | (108,167 | ) | 31.7 | % | |||||||||
| Administrative expenses | (50,669 | ) | (48,520 | ) | (42,631 | ) | 18.9 | % | 4.4 | % | (99,189 | ) | (80,386 | ) | 23.4 | % | |||||||||
| Depreciation and amortization | (10,978 | ) | (10,364 | ) | (9,396 | ) | 16.8 | % | 5.9 | % | (21,342 | ) | (18,819 | ) | 13.4 | % | |||||||||
| Other | (12,177 | ) | (8,898 | ) | (7,635 | ) | 59.5 | % | 36.9 | % | (21,076 | ) | (17,373 | ) | 21.3 | % | |||||||||
| Total operating expenses | (145,695 | ) | (138,335 | ) | (116,527 | ) | 25.0 | % | 5.3 | % | (284,030 | ) | (224,744 | ) | 26.4 | % | |||||||||
Net income before workers profit sharing and income taxes | 154,732 | 141,888 | 106,562 | 45.2 | % | 9.1 | % | 296,620 | 202,029 | 46.8 | % | ||||||||||||||
| Workers’ profit sharing | (2,473 | ) | (5,073 | ) | (3,216 | ) | -23.1 | % | -51.3 | % | (7,546 | ) | (6,397 | ) | 18.0 | % | |||||||||
| Income taxes | (24,368 | ) | (28,292 | ) | (22,254 | ) | 9.5 | % | -13.9 | % | (52,660 | ) | (43,194 | ) | 21.9 | % | |||||||||
Net income before translation result | 127,891 | 108,523 | 81,092 | 57.7 | % | 17.8 | % | 236,414 | 152,438 | 55.1 | % | ||||||||||||||
| Translation result | (49,850 | ) | 57,249 | 970 | -5238.0 | % | -187.1 | % | 7,400 | 2,280 | 224.5 | % | |||||||||||||
Net income | 78,041 | 165,772 | 82,062 | -4.9 | % | -52.9 | % | 243,814 | 154,719 | 57.6 | % | ||||||||||||||
42
BANCO DE CREDITO DEL PERU AND SUBSIDIARIES
SELECTED FINANCIAL INDICATORS
Three months ended | Three months ended | |||||||||||||||
2Q08 | 1Q08 | 2Q08 | Jan-08 | Jan-07 | ||||||||||||
Profitability | ||||||||||||||||
| Net income per common share (US$ per share)(1) | 0.052 | 0.129 | 0.064 | 0.162 | 0.120 | |||||||||||
| Net interest margin on interest earning assets (2)* (old methodology) | 5.12 | % | 5.07 | % | 5.52 | % | 5.12 | % | 5.34 | % | ||||||
| Net interest margin on interest earning assets (2)** (new methodology) | 4.66 | % | 4.65 | % | 5.13 | % | 4.68 | % | 4.98 | % | ||||||
| Return on average total assets (2)(3) | 1.77 | % | 4.08 | % | 2.72 | % | 3.06 | % | 2.77 | % | ||||||
| Return on average shareholders' equity (2)(3) | 25.49 | % | 56.96 | % | 35.57 | % | 42.15 | % | 33.45 | % | ||||||
| No. of outstanding shares (millions) | 1,508 | 1,287 | 1,287 | 1,508.29 | 1,286.53 | |||||||||||
Quality of loan portfolio | ||||||||||||||||
| Past due loans as a percentage of total loans | 0.74 | % | 0.79 | % | 0.95 | % | 0.74 | % | 0.95 | % | ||||||
| Reserves for loan losses as a percentage of | ||||||||||||||||
| total past due loans | 318.72 | % | 313.21 | % | 286.77 | % | 318.72 | % | 286.77 | % | ||||||
| Reserves for loan losses as a percentage of | ||||||||||||||||
| total loans | 2.37 | % | 2.48 | % | 2.72 | % | 2.37 | % | 2.72 | % | ||||||
Operating efficiency | ||||||||||||||||
| Oper. expense as a percent. of total income (4) | 43.78 | % | 47.53 | % | 49.29 | % | 45.55 | % | 49.54 | % | ||||||
| Oper. expense as a percent. of av. tot. assets(2)(3)(4) | 3.03 | % | 3.19 | % | 3.61 | % | 3.30 | % | 3.72 | % | ||||||
Capital adequacy | ||||||||||||||||
| Total Regulatory Capital (US$Mn) | 1,299 | 1,274 | 793 | 1,299 | 793 | |||||||||||
| 'Risk-weighted assets (US$Mn) | 9,637 | 9,266 | 7,387 | 9,637 | 7,387 | |||||||||||
| Regulatory capital / risk-weighted assets (5) | 13.48 | % | 13.75 | % | 10.74 | % | 13.48 | % | 10.74 | % | ||||||
Average balances (millions of US$) (3) | ||||||||||||||||
| Interest earning assets | 16,169 | 14,859 | 10,999 | 15,414 | 10,611 | |||||||||||
| Total Assets | 17,636 | 16,235 | 12,063 | 15,918 | 11,162 | |||||||||||
| Net equity | 1,225 | 1,164 | 923 | 1,157 | 925 | |||||||||||
| (1) | Shares outstanding of 1,287 million is used for all periods since shares have been issued only for capitalization of profits and inflation adjustment. |
| (2) | Ratios are annualized. |
| (3) | Averages are determined as the average of period-beginning and period-ending balances. |
| (4) | Total income includes net interest income, fee income and net gain on foreign exchange transactions. |
| Operating expense includes personnel expenses, administrative expenses and depreciation and amortization (5) Risk-weighted assets include market risk assets | |
| * | The old methodology for the calculation of NIM considered only 70% of the investments available for sale as part of interest earning assets. |
| ** | The new methodology for the calculation of NIM considers 100% of the investments available for sale as interest earning assests. |
43
EL PACIFICO-PERUANO SUIZA AND SUBSIDIARIAS
Chart 8
(in Thousand dollars)
Balance to and for the period | Sis month ended | |||||||||||||||
Of three months ending of | ||||||||||||||||
30-Jun-07 | 31-Mar-08 | 30-Jun-08 | Jun-07 | Jun-08 | ||||||||||||
2Q08 | 1Q08 | 2Q07 | ||||||||||||||
Results | ||||||||||||||||
| Total premiums | 149,246 | 137,491 | 117,407 | 221,871 | 286,737 | |||||||||||
| Ceded premiums | 24,021 | 27,294 | 26,021 | 47,540 | 51,315 | |||||||||||
| Ajustment of reserves | 25,936 | 18,606 | 17,366 | 28,260 | 44,542 | |||||||||||
Earned net premiums | 99,289 | 91,591 | 74,020 | 146,070 | 190,880 | |||||||||||
| Direct claims | 109,334 | 97,066 | 61,099 | 117,998 | 206,400 | |||||||||||
| Ceded claims | 15,915 | 20,975 | 8,719 | 12,991 | 36,889 | |||||||||||
Net claims | 93,419 | 76,091 | 52,379 | 105,007 | 169,511 | |||||||||||
| Direct commissions | 11,993 | 10,521 | 9,912 | 17,847 | 22,514 | |||||||||||
| Commissions Received | 2,499 | 2,443 | 1,743 | 3,555 | 4,942 | |||||||||||
Net commissions | 9,494 | 8,078 | 8,168 | 14,292 | 17,572 | |||||||||||
| Technical expenses | 10,612 | 9,343 | 7,145 | 13,753 | 19,955 | |||||||||||
| Technical results | 2,553 | 2,457 | 1,557 | 3,668 | 5,010 | |||||||||||
Net technical expenses | 8,059 | 6,886 | 5,588 | 10,085 | 14,946 | |||||||||||
Technical results | (11,684 | ) | 535 | 7,885 | 16,686 | (11,148 | ) | |||||||||
| Financial Income | 19,629 | 15,402 | 13,794 | 27,115 | 35,031 | |||||||||||
| Gains on sale of Real State and Securities | 4,336 | 2,507 | 4,604 | 12,805 | 6,843 | |||||||||||
| Renting ( net of expenses) | 744 | 728 | 664 | 1,278 | 1,473 | |||||||||||
| (-) Financial expenses | 540 | 425 | 572 | 1,001 | 965 | |||||||||||
Financial income , net | 24,170 | 18,212 | 18,489 | 40,197 | 42,382 | |||||||||||
| Salaries and benefits | 10,427 | 11,186 | 9,409 | 18,927 | 21,613 | |||||||||||
| Administrative expenses | 9,224 | 8,913 | 8,341 | 16,317 | 18,137 | |||||||||||
| Third party services | 3,939 | 4,127 | 3,428 | 7,355 | 8,066 | |||||||||||
| Sundry management expenses | 1,913 | 1,802 | 1,509 | 3,071 | 3,714 | |||||||||||
| Provisions | 1,281 | 1,173 | 882 | 1,863 | 2,454 | |||||||||||
| Taxes | 1,096 | 1,163 | 995 | 1,730 | 2,259 | |||||||||||
| Other expenses | 996 | 648 | 1,527 | 2,298 | 1,644 | |||||||||||
General Expenses | 19,651 | 20,099 | 17,749 | 35,245 | 39,751 | |||||||||||
| Other income | (56 | ) | 875 | 639 | 1,163 | 819 | ||||||||||
| Translation results | (6,502 | ) | 5,924 | 242 | 563 | (578 | ) | |||||||||
| Employee participation and income tax | (4,622 | ) | 795 | 316 | 1,669 | (3,827 | ) | |||||||||
Income before Minority Interest | (9,101 | ) | 4,652 | 9,190 | 21,694 | (4,449 | ) | |||||||||
| Minority interest | 424 | 1,559 | 2,411 | 6,180 | 1,983 | |||||||||||
Net income | (9,525 | ) | 3,093 | 6,779 | 15,514 | (6,432 | ) | |||||||||
Balance (end of period) | ||||||||||||||||
| Total Assets | 1,280,650 | 1,257,642 | 1,044,462 | 1,044,462 | 1,280,650 | |||||||||||
| Investment on Securities and Real State (1) | 852,456 | 866,924 | 778,850 | 778,850 | 852,456 | |||||||||||
| Technical Reserves | 920,279 | 871,313 | 691,212 | 691,212 | 920,279 | |||||||||||
| Net Equity | 185,942 | 208,946 | 212,582 | 212,582 | 185,942 | |||||||||||
Ratios | ||||||||||||||||
| Ceded Premiums / Total Premiums | 16.1 | % | 19.9 | % | 22.2 | % | 21.4 | % | 17.9 | % | ||||||
| Direct claims / Total premiums | 73.3 | % | 70.6 | % | 52.0 | % | 53.2 | % | 72.0 | % | ||||||
| Net claims / Earned net premiums | 94.1 | % | 83.1 | % | 70.8 | % | 71.9 | % | 88.8 | % | ||||||
| Net commissions / Earnend net premiums | 9.6 | % | 8.8 | % | 11.0 | % | 9.8 | % | 9.2 | % | ||||||
| Commissions + technical expenses , net / Earnend net premiums | 17.7 | % | 16.3 | % | 18.6 | % | 16.7 | % | 17.0 | % | ||||||
| technical results / Earned net premiums | -11.8 | % | 0.6 | % | 10.7 | % | 11.4 | % | -5.8 | % | ||||||
| General Expenses / Earned net premiums | 19.8 | % | 21.9 | % | 24.0 | % | 24.1 | % | 20.8 | % | ||||||
| Netr incmoe / Total Premiums | -6.4 | % | 2.2 | % | 5.8 | % | 7.0 | % | -2.2 | % | ||||||
| Return on Equity (2)(3) | -17.9 | % | 6.1 | % | 13.7 | % | 15.1 | % | -6.8 | % | ||||||
| Return on Total Premiums | -6.4 | % | 2.2 | % | 5.8 | % | 7.0 | % | -2.2 | % | ||||||
| Net Equity / Total Assets | 14.5 | % | 16.6 | % | 20.4 | % | 20.4 | % | 14.5 | % | ||||||
| Increase in Technical Reserves | 20.7 | % | 16.9 | % | 19.0 | % | 16.2 | % | 18.9 | % | ||||||
| General Expenses / Assets (2)(3) | 6.3 | % | 6.7 | % | 7.2 | % | 6.9 | % | 6.4 | % | ||||||
Comibined Ratio of PPS + PS (4) | 128.6 | % | 115.6 | % | 109.0 | % | 108.3 | % | 122.4 | % | ||||||
| Net Claims / Earned net premiums | 99.2 | % | 85.5 | % | 72.2 | % | 73.0 | % | 92.6 | % | ||||||
| General Expenses and Commissions / Earned net premiums | 29.4 | % | 30.1 | % | 36.8 | % | 35.3 | % | 29.8 | % | ||||||
| (1) | Real State Investment were excluded |
| (2) | Annualized |
| (3) | Average are determined as the average of period-beggining and period ending |
| (4) | Without consolidated adjustments |
44
SIGNATURE
Pursuant to the requirements of the Securities Exchange Act of 1934, the registrant has duly caused this report to be signed on its behalf by the undersigned, thereunto duly authorized.
Date: August 8, 2008
| CREDICORP LTD. | ||
| By: | /s/ Guillermo Castillo | |
Guillermo Castillo Authorized Representative | ||
FORWARD-LOOKING STATEMENTS
This press release may contain forward-looking statements. These statements are statements that are not historical facts, and are based on management's current view and estimates of future economic circumstances, industry conditions, company performance and financial results. The words "anticipates", "believes", "estimates", "expects", "plans" and similar expressions, as they relate to the company, are intended to identify forward-looking statements. Statements regarding the declaration or payment of dividends, the implementation of principal operating and financing strategies and capital expenditure plans, the direction of future operations and the factors or trends affecting financial condition, liquidity or results of operations are examples of forward-looking statements. Such statements reflect the current views of management and are subject to a number of risks and uncertainties. There is no guarantee that the expected events, trends or results will actually occur. The statements are based on many assumptions and factors, including general economic and market conditions, industry conditions, and operating factors. Any changes in such assumptions or factors could cause actual results to differ materially from current expectations.