Exhibit (c)(v)
CONFIDENTIAL WORKING DRAFT – FOR DISCUSSION PURPOSES ONLY
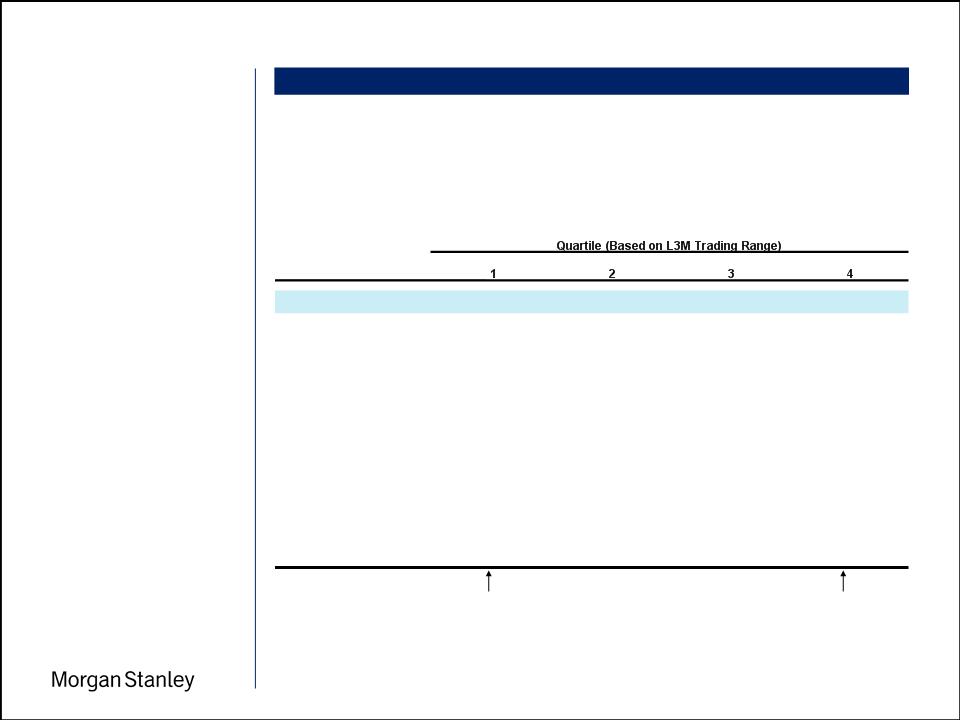
Summary of Implied Transaction Premiums
Implied Transaction Premiums vs. Stock Trading History
Project Celtic
1
• Analysis divides selected
precedents into quartiles based
on where the target’s stock was
trading relative to its trading
range during the 3 months
immediately prior to
announcement
precedents into quartiles based
on where the target’s stock was
trading relative to its trading
range during the 3 months
immediately prior to
announcement
Notes
1. Based on selected deals since 2001; all cash; US targets; minority buy-in value of $25 - $500MM; majority shareholder owned less than 90% of target
2. Final premium statistics exclude Hearst-Argyle transaction, which has not been completed
Minority Buy-in Precedents (1)
Source Public Filings, Press Releases, FactSet
Prior to announcement,
stock price was in bottom
quartile of its 3-month
trading range
stock price was in bottom
quartile of its 3-month
trading range
Prior to announcement,
stock price was in top
quartile of its 3-month
trading range
stock price was in top
quartile of its 3-month
trading range
No. of deals
11
2
4
9
Initial Premium to Prior Day Price:
Median Premium
35.6%
58.6%
28.1%
11.5%
Mean Premium
32.4%
58.6%
38.4%
14.2%
High Premium
60.0%
91.4%
97.5%
38.8%
Low Premium
8.6%
25.8%
0.0%
(7.9%)
Final Premium to Prior Day Price:
(2)
Median Premium
45.5%
29.6%
53.8%
23.9%
Mean Premium
48.3%
29.6%
56.3%
26.1%
High Premium
140.0%
29.6%
97.5%
52.9%
Low Premium
13.2%
29.6%
20.0%
6.7%
CONFIDENTIAL WORKING DRAFT – FOR DISCUSSION PURPOSES ONLY
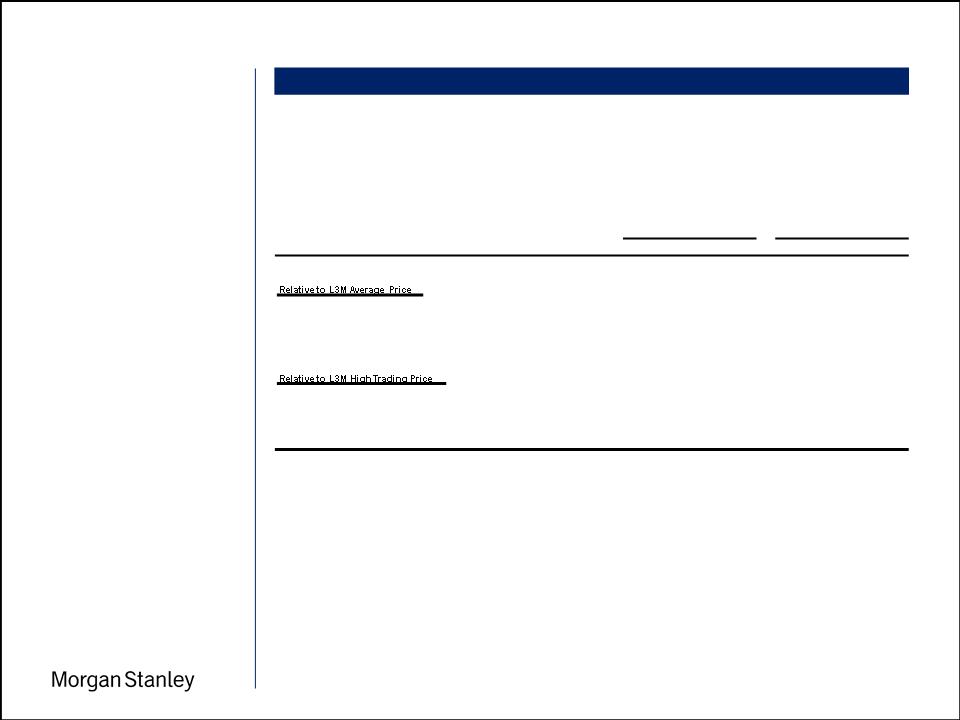
Implied Transaction Premiums vs. Stock Trading History (cont’d)
Project Celtic
2
Note
1. Based on selected deals since 2001; all cash; US targets; minority buy-in value of $25 - $500MM; majority shareholder owned less than 90% of target
Minority Buy-in Precedents (1)
Source Public Filings, Press Releases, FactSet
• Analysis evaluates premiums
paid in precedent transactions
based on where target was
trading relative to its L3M
average trading price and L3M
high trading price at the time a
transaction was announced
paid in precedent transactions
based on where target was
trading relative to its L3M
average trading price and L3M
high trading price at the time a
transaction was announced
Summary of Implied Transaction Premiums
Initial Premium To
Final Premium To
Prior Day
Prior Day Closing Price
Prior Day Closing Price
Trading Price
# of Transactions
Mean
Median
Mean
Median
Target Trading Above L3M Average
13
21.6%
11.5%
35.4%
29.8%
Target Trading Below L3M Average
13
36.4%
35.6%
46.8%
42.8%
Target Trading at 0 - 30% Discount to L3M High
18
21.4%
15.8%
33.4%
29.7%
Target Trading at 30%+ Discount to L3M High
8
46.2%
45.8%
60.2%
45.8%
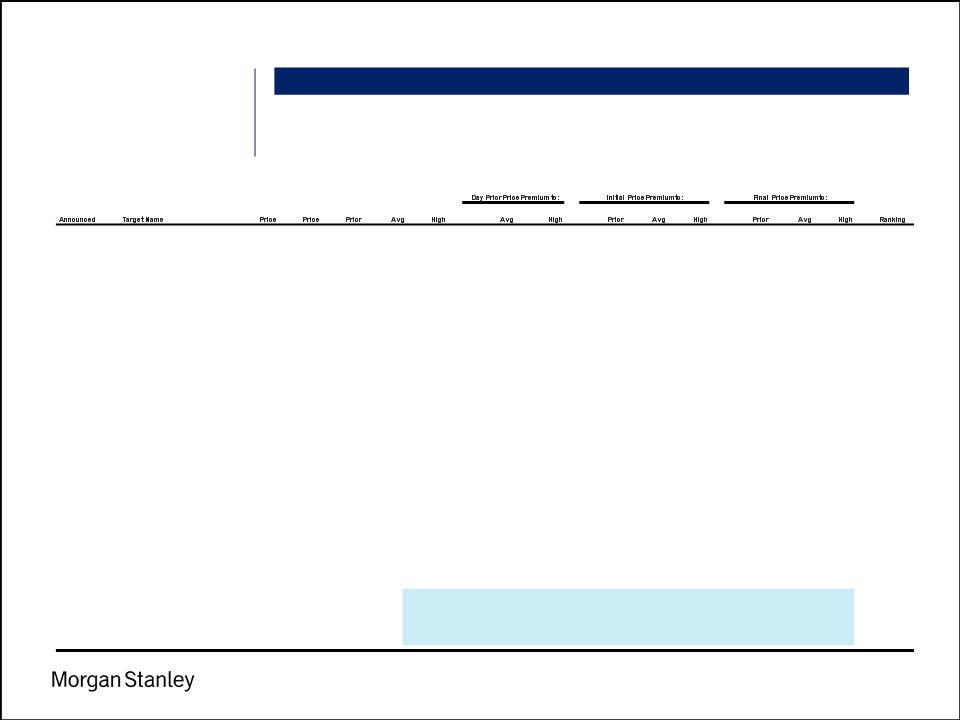
CONFIDENTIAL WORKING DRAFT – FOR DISCUSSION PURPOSES ONLY
Minority Buy-in Precedents (1)
Project Celtic
3
Notes
1. Based on selected deals since 2001; all cash; US targets; minority buy-in value of $25 - $500MM; majority shareholder owned less than 90% of target
2. Ranking based on where target was trading relative to its 3-month trading range immediately prior to announcement
Breakdown of L3M Trading by Quartiles
Initial
Final
Day
L3M
L3M
L3M
L3M
Day
L3M
L3M
Day
L3M
L3M
Quartile
(2)
3/25/09
Hearst-Argyle Television Inc
$4.00
NA
$2.09
3.64
6.56
(42.6%)
(68.1%)
91.4%
9.8%
(39.0%)
NA
NA
NA
2
3/23/09
Cox Radio Inc
3.80
4.80
3.30
5.07
6.66
(34.9%)
(50.5%)
15.2%
(25.0%)
(42.9%)
45.5%
(5.3%)
(27.9%)
1
10/22/07
Waste Industries USA Inc
36.75
38.00
27.11
30.08
35.12
(9.9%)
(22.8%)
35.6%
22.2%
4.6%
40.2%
26.3%
8.2%
1
2/22/07
Great American Finl Res Inc
23.50
24.50
21.64
22.44
23.66
(3.6%)
(8.5%)
8.6%
4.7%
(0.7%)
13.2%
9.2%
3.6%
1
10/9/06
NetRatings Inc
16.00
21.00
14.57
13.90
14.99
4.9%
(2.8%)
9.8%
15.1%
6.7%
44.1%
51.1%
40.1%
3
3/21/06
Erie Family Life Insurance Co
32.00
32.00
30.00
27.84
30.00
7.8%
0.0%
6.7%
15.0%
6.7%
6.7%
15.0%
6.7%
4
9/13/05
CoolSavings Inc
0.80
0.80
0.55
0.67
0.83
(17.9%)
(33.7%)
45.5%
19.5%
(3.6%)
45.5%
19.5%
(3.6%)
1
4/12/04
Edelbrock Corp
14.80
16.75
13.52
12.81
14.00
5.5%
(3.4%)
9.5%
15.5%
5.7%
23.9%
30.7%
19.6%
4
7/24/03
Digex Inc
0.70
1.00
0.76
0.47
0.76
61.3%
0.0%
(7.9%)
48.5%
(7.9%)
31.6%
112.2%
31.6%
4
6/2/03
Ribapharm Inc
5.60
6.25
5.08
4.53
5.21
12.1%
(2.5%)
10.2%
23.6%
7.5%
23.0%
38.0%
20.0%
4
2/18/03
Lexent Inc
1.25
1.50
0.91
0.99
1.16
(8.4%)
(21.6%)
37.4%
25.9%
7.8%
64.8%
51.1%
29.3%
1
1/13/03
Next Level Communications Inc
1.04
1.18
0.91
0.79
1.10
15.8%
(17.4%)
14.4%
32.5%
(5.5%)
29.8%
50.3%
7.3%
4
7/30/02
JCC Holding Co
10.54
10.54
9.00
6.56
9.00
37.2%
0.0%
17.1%
60.7%
17.1%
17.1%
60.7%
17.1%
4
7/9/02
International Specialty Prods
10.00
10.30
7.95
8.31
10.10
(4.3%)
(21.3%)
25.8%
20.4%
(1.0%)
29.6%
24.0%
2.0%
2
3/18/02
Meemic Holdings Inc
29.00
29.00
26.00
22.64
26.00
14.8%
0.0%
11.5%
28.1%
11.5%
11.5%
28.1%
11.5%
4
3/14/02
Konover Property Trust Inc
1.75
2.10
1.75
1.62
1.85
7.9%
(5.4%)
0.0%
7.9%
(5.4%)
20.0%
29.5%
13.5%
3
2/19/02
Travelocity.com Inc
23.00
28.00
19.20
23.75
29.49
(19.2%)
(34.9%)
19.8%
(3.2%)
(22.0%)
45.8%
17.9%
(5.0%)
1
10/10/01
TD Waterhouse Group Inc
9.00
9.50
6.20
8.12
10.24
(23.7%)
(39.5%)
45.2%
10.8%
(12.1%)
53.2%
17.0%
(7.2%)
1
10/1/01
NCH Corp
47.50
52.50
39.19
42.71
44.90
(8.2%)
(12.7%)
21.2%
11.2%
5.8%
34.0%
22.9%
16.9%
1
8/22/01
Homeservices Com Inc
17.00
17.00
12.25
11.43
13.00
7.2%
(5.8%)
38.8%
48.8%
30.8%
38.8%
48.8%
30.8%
4
8/21/01
Spectra Physics Inc
20.00
17.50
13.69
20.33
25.00
(32.7%)
(45.2%)
46.1%
(1.6%)
(20.0%)
27.8%
(13.9%)
(30.0%)
1
8/16/01
Leeds Federal Bankshares Inc
32.00
32.00
16.20
15.97
17.10
1.5%
(5.3%)
97.5%
100.4%
87.1%
97.5%
100.4%
87.1%
3
5/30/01
Bacou USA Inc
28.50
28.50
23.40
25.28
25.85
(7.4%)
(9.5%)
21.8%
12.8%
10.3%
21.8%
12.8%
10.3%
1
5/23/01
Unigraphics Solutions Inc
27.00
32.50
21.25
19.00
23.00
11.8%
(7.6%)
27.1%
42.1%
17.4%
52.9%
71.0%
41.3%
4
5/14/01
Agency.com Ltd
3.00
3.35
2.05
1.81
3.06
13.5%
(33.1%)
46.3%
66.2%
(2.0%)
63.4%
85.5%
9.4%
3
3/26/01
CSFBdirect
4.00
6.00
2.50
3.86
5.25
(35.2%)
(52.4%)
60.0%
3.6%
(23.8%)
140.0%
55.5%
14.3%
1
Mean
(1.8%)
(19.4%)
29.0%
23.7%
1.3%
40.9%
38.3%
13.9%
Median
(1.1%)
(11.1%)
21.5%
17.5%
2.0%
34.0%
29.5%
11.5%
High
61.3%
0.0%
97.5%
100.4%
87.1%
140.0%
112.2%
87.1%
Low
(42.6%)
(68.1%)
(7.9%)
(25.0%)
(42.9%)
6.7%
(13.9%)
(30.0%)