UNITED STATES SECURITIES AND EXCHANGE COMMISSION
WASHINGTON, D.C. 20549
________________
Form 20-F
| | | | | |
| | * | REGISTRATION STATEMENT PURSUANT TO SECTION 12(b) OR (g) OF THE SECURITIES EXCHANGE ACT OF 1934 | | |
| | | OR | | |
| | R | ANNUAL REPORT PURSUANT TO SECTION 13 OR 15(d) OF THE SECURITIES EXCHANGE ACT OF 1934 For the fiscal year ended December 31, 2011 | | |
| | * | TRANSITION REPORT PURSUANT TO SECTION 13 OR 15(d) OF THE SECURITIES EXCHANGE ACT OF 1934 | | |
| | | OR | | |
| | * | SHELL COMPANY REPORT PURSUANT TO SECTION 13 OR 15(d) OF THE SECURITIES EXCHANGE ACT OF 1934 | | |
Date of event requiring this shell company report
Commission file number 1-14406
________________
Perusahaan Perseroan (Persero)
PT Telekomunikasi Indonesia Tbk.
(Exact name of Registrant as specified in its charter)
Telecommunications Indonesia
(a state-owned public limited liability company)
(Translation of Registrant’s name into English)
________________
Republic of Indonesia
(State or other jurisdiction of incorporation or organization)
Jalan Japati, 1
Bandung 40133
Indonesia
(62) (22) 452-7101
(62) (21) 521-5109*
(Address of Registrant’s principal executive offices)
________________
Securities registered or to be registered pursuant to Section 12(b) of the Act. |
| |
Title of Each class | | Name of each exchange on which registered |
American Depositary Shares representing Series B Shares, par value 250 Rupiah per share | | New York Stock Exchange |
Series B Shares, par value 250 Rupiah per share | | New York Stock Exchange** |
| |
Securities registered or to be registered pursuant to Section 12(g) of the Act. None |
Securities for which there is a reporting obligation pursuant to Section 15(d) of the Act. None |
Indicate the number of outstanding shares of each of the issuer’s classes of capital or common stock as of the close of the period covered by the Annual Report: |
Series A Dwiwarna Share, par value 250 Rupiah per share | 1 |
Series B Shares, par value 250 Rupiah per share | 19,669,424,779 |
| |
Indicate by check mark if the registrant is a well-known seasoned issuer, as defined in Rule 405 of the Securities Act. YesR No¨ |
If this report is an annual or transition report, indicate by check mark if the registrant is not required to file reports pursuant to Section 13 or 15(d) of the Securities Exchange Act of 1934. Yes¨ NoR |
Indicate by check mark whether the registrant (1) has filed all reports required to be filed by Section 13 or 15(d) of the Securities Exchange Act of 1934 during the preceding 12 months (or for such shorter period that the Registrant was required to file such reports) and (2) has been subject to such filing requirements for the past 90 days. YesRNo¨ |
Indicate by check mark whether the registrant has submitted electronically and posted on its corporate Web site, if any, every Interactive Data File required to be submitted and posted pursuant to Rule 405 of Regulation S-T during the preceding 12 months (or for such shorter period that the registrant was required to submit and post such files). Yes¨ NoR |
Indicate by check mark whether the registrant is a large accelerated filer, an accelerated filer, or a non-accelerated filer. See definition of “accelerated filer and large accelerated filer” in Rule 12b-2 of the Exchange Act. (Check one): |
Large accelerated filerR | Accelerated filer¨ | Non-accelerated filer¨ |
Indicate by checkmark which basis of accounting the registrant has used to prepare the financial statements included in this filing: U.S. GAAP¨ International Financial Reporting Standards as issued by the International Accounting Standards BoardR Other¨ If “Other” has been checked in response to the previous question, indicate by checkmark which financial statement item the registrant has elected to follow. Item 17¨ Item 18¨ |
If this is an Annual Report, indicate by check mark whether the registrant is a shell company (as defined in Rule 12b-2 of the Exchange Act). Yes¨ NoR |
| | |
* | Investor Relations Unit, Grha Citra Caraka, JI. Gatot Subroto, No. 52, 5th Floor, Jakarta 12710. |
** | The Series B Shares were registered in connection with the registration of American Depositary Shares (“ADRs”). The Series B Shares are not listed for trading on the New York Stock Exchange. |
| |
| | | | | | |
Table of Content
APPENDICES
GLOSSARY
3G
The generic term for third generation mobile telecommunications technology. 3G offers high speed connections to cellular phones and other mobile devices, enabling video conference and other applications requiring broadband connectivity to the internet.
3.5 G
A grouping of disparate mobile telephony and data technologies designed to provide better performance than 3G systems, as an interim step towards deployment of full 4G capability.
ADS
American Depositary Share (also known as an ADR), a certificate traded on a US securities market (such as New York Stock Exchange) representing a number of foreign shares. Each of our ADS represents 40 of our Series B shares.
ADSL
Asymmetric Digital Subscriber Line, a type of digital subscriber line technology, a data communications technology that enables faster data transmission over copper telephone lines than a conventional voice band modem can provide.
AGMS
Annual General Meeting of Shareholders.
APMK
Alat Pembayaran Menggunakan Kartu or payment with card tool, a payment instrument in the form of credit cards, Automated Teller Machine (ATM) and/or debit cards.
ARPU
Average Revenue per User, a measure used primarily by telecommunications and networking companies which states how much money the company makes from the average user. It defined as the total revenue from specified services divided by the number of consumers for those services.
ATM
Asynchronous Transfer Mode, a transfer mode in which the information is organized into cells. It is asynchronous in the sense that the recurrence of cells containing information from an individual user is not necessarily periodic.
Backbone
The main telecommunications network consisting of transmission and switching facilities connecting several network access nodes. The transmission links between nodes and switching facilities include microwave, submarine cable, satellite, optical fiber and other transmission technology.
Bandwidth
The capacity of a communication link.
Bank of Indonesia
The central bank of Indonesia.
Bapepam-LK
Badan Pengawas Pasar Modal dan Lembaga Keuangan, the Indonesian Capital Market and Financial Institution Surpervisory Agency.
BCSC
Business Competition Supervisory Commission or Komisi Pengawas Persaingan Usaha (“KPPU”).
Broadband
A signaling method that includes or handles a relatively wide range (or band) of frequencies.
BSC
Base Station Controller, equipment responsible for radio resource allocation to mobile station, frequency administration and handover between BTSs controlled by the BSC.
BSS
Base Station Sub System, the section of a cellular telephone network responsible for handling traffic and signaling between a mobile phone and the network switching subsystem. A BSS is composed of two parts: the Base Transceiver Station (BTS) and the Base Station Controller (BSC).
BTS
Base Transceiver Station, equipment that transmits and receives radio telephony signals to and from other telecommunication systems.
BWA
Broadband Wireless Access, a technology that provides high-speed wireless internet access or computer networking access over a wide area.
Byru
Indonesia's first mobile satellite GSM service using the ACeS (“ASIA Cellular Satellite”) network and the Garuda-1 satellite.
C Band
A portion of the electromagnetic spectrum in the microwave range of frequencies ranging from 4 - 8 GHz. It was the first frequency band allocated for commercial ground-to-satellite communications. A typical C band satellite uses 3.7 - 4.2 GHz for downlink and 5.925 - 6.425 GHz for uplink.
CBHRM
Competency Based Human Resource Management, human resource management approach that focuses on the skills and talents needed to be able to perform a particular task or job effectively.
CDMA
Code Division Multiple Access, a wide-band spread-spectrum network technology.
Capacity Utilization
The ratio of phone lines in service to local exchange capacity or installed lines.
CMS
Content Management System, a system providing a collection of procedures used to manage work flow in a collaborative environment.
CPE
Customer Premises Equipment, any handset, receiver, set-top box or other equipment used by the consumer of wireless, fixed-line or broadband services, which is the property of the network operator and located on the customer premises.
DCS
Digital Communication System, a mobile cellular system using GSM technology operating in the 1800 MHz frequency band.
Defined Benefit Pension Plan
A type of pension plan in which an employer promises a specified monthly benefit on retirement that is predetermined by a formula based on the employee’s earnings history, tenure of service and age, rather than depending on investment returns. It is considered ‘defined’ in the sense that the formula for computing the employer’s contribution is known in advance.
Defined Contribution Pension Plan
A type of retirement plan in which the amount of the employer’s annual contribution is specified. Individual accounts are set up for participants and benefits are based on the amounts credited to these accounts (through employer contributions and, if applicable, employee contributions) plus any investment earnings on the money in the account. Only employer contributions to the account are guaranteed, not the future benefits. In defined contribution plans, future benefits fluctuate on the basis of investment earnings.
DGPT
Directorate General of Post and Telecommunications, which has been replaced by the DGRE and the DGPIO.
DGPIO
Directorate General of Post and Informatics Operations of the MoCI.
DGRE
Directorate General of Post and Informatics Resources and Equipment of the MoCI.
Dial-Up
Access to the internet using fixed telephone lines or mobile phone.
DINAccess
One of our telecommunication product – Data Communication Service.
DLD
Domestic Long Distance, a long distance call service designed for customers who live in different area but still it locates within one country. In general, customers live spread out in the areas where it has different area code.
Downlink
Radio signal frequency (“RF”) emitted by the satellite to earth station.
DPR
Dewan Perwakilan Rakyat,national parliaments of Indonesia.
DPRD
Dewan Perwakilan Rakyat Daerah,regional parliaments of Indonesia.
DSL
Digital Subscriber Line, a technology that allows combinations of services including voice, data and one way full motion video to be delivered over existing copper feeder distribution and subscriber lines.
DTF
Divisi Telkom Flexi or Telkom Flexi Division, our business unit that manage fixed wireless service under the “Flexi” brand.
DTH
Direct-to-Home satellite broadcasting, the distribution of television signals from high-powered geostationary satellites to small dish antennas and satellite receivers in homes across the country.
Dual Band
The capability of a mobile cellular network and mobile cellular handsets to operate across two frequency bands, for example GSM 900 and GSM 1800.
Duopoly System
A system allowing only two national operators, which in Indonesia’s case are Telkom and Indosat, to provide fixed line telecommunication services including domestic long distance and international long distance.
e-Business
Electronic Business solutions, including electronic payment services, internet data centers and content and application solutions.
e-Commerce
Electronic Commerce, buying and selling of products or services over electronic systems such as the internet and other computer networks.
e-Money
Electronic Money, money or script that is only exchanged electronically.
e-Payment
Electronic Funds Transfer (“EFT”), electronic exchange or transfer of money from one account to another, either within a single financial institution or across multiple institutions, through computer-based systems.
E1 Link
The backbone transmission unit which operates over two separate sets of wires, usually twisted pair cable. E1 link data rate is 2,048 Mbps (full duplex), which is divided into 32 timeslots.
Earth Station
The antenna and associated equipment used to receive or transmit telecommunication signals via satellite.
EDGE
Enhanced Data rates for GSM Evolution a digital mobile phone technology that allows improved data transmission rates as a backward-compatible extension of GSM.
Edutainment
Is abbreviation from Education and Entertainment.
EGMS
Extraordinary General Meeting of Shareholders.
Electronic Data Capture (“EDC”)
Computerized system designed for the collection of clinical data in electronic format for use mainly in human clinical trials.
Enterprise Business Solution (“EBS”)
An enterprise customer consultation for customized corporate TIME solutions, and simulation demos (for e-Payment and VPN over Fixed Network, GSM and Flexi).
Erlang
A unit of measurement of telephone traffic equal to one hour of conversation.
EVDO
Evolution Data Optimize, a standard high speed 3G wireless broadband for CDMA.
Fixed Line
Fixed wireline and fixed wireless.
Fixed Wireless
The local wireless transmission link using a cellular, microwave, or radio technology to connect customers at a fixed location to the local telephone exchange.
Fixed Wireline
A fixed path (wire or cable) linking a subscriber at a fixed location to a local exchange, usually with an individual phone number.
FMB
Flexi Mobile Broadband, our Flexi promotion program that offer EVDO-based internet access.
Frame Relay
A packet-switching protocol (in which messages are divided into packets before they are sent) for connecting devices on a computer network that spans a relatively large geographical area.
FTTx
Fiber To The x, a generic term for any broadband network architecture that uses optical fiber to replace all or part of the usual metal local loop used for last mile telecommunication. The generic term originated as a generalization of several configurations of fiber deployment such as fiber to the home, fiber to the node, fiber to the building etc.
FUP (MB)
Fair Usage Policy, our Flexi promotion program that offer EVDO-based internet access. FUP is designed to ensure that our FMB serve our customer can run faster and reliable when used.
FTA
Free To Air describes television (TV) and radio services broadcast in clear (unencrypted) form, allowing any person with the appropriate receiving equipment to receive the signal and view or listen to the content without requiring a subscription (or other ongoing cost) or one-off fee (e.g. Pay-per-view).
Gateway
A peripheral that bridges a packet based network (IP) and a circuit based network (PSTN).
Gb
A unit of information used, for example, to quantify computer memory or storage capacity.
Gbps
Gigabyte per second in telecommunications, the average number of bits, characters, or blocks per unit time passing between equipment in a data transmission system. This is typically measured in multiples of the unit bit per second or byte per second.
GHz
Gigahertz. The hertz (symbol Hz), the international standard unit of frequency defined as the number of cycles per second of a periodic phenomenon.
GMS
General Meeting of Shareholders, which may be an AGMS or an EGMS.
Government
The Government of the Republic of Indonesia.
GPON
Gigabyte-Passive Optical Network, the most widely deployed type of passive optical network system that bring optical fiber cabling and signals all or most of the way to end users.
GPRS
General Packet Radio Service, a data packet switching technology that allows information to be sent and received across a mobile network and only utilizes the network when there is data to be sent.
GSM
Global System for Mobile Telecommunication, a European standard for digital cellular telephone.
HSPA
Evolved High Speed Packet Access (HSPA+) is defined in 3rdGeneration Partnership Project (“3GPP”) release 7. It introduces a simpler IP-centric architecture for the mobile network bypassing most of the legacy equipment. HSPA+ boosts peak data rates to 42 Mbit/s on the downlink and 22 Mbit/s on the uplink.
IDD
International Direct Dialing, a service that allows a subscriber to make an international call without the assistance or intervention of an operator from any telephone terminal.
IDX
Bursa Efek Indonesia or the Indonesia Stock Exchange.
IME Business
Information, Media and Edutainment Business. Refer to explanation of TIME service.
IMT-2000
International Mobile Telecommunications-2000, specifications by the International Telecommunication Union. Application services include wide-area wireless voice telephone, mobile internet access, video calls and mobile TV, all in a mobile environment.
Installed Lines
Complete lines fully built-out to the distribution point and ready to be connected to subscribers.
INSYNC2014 Master Plan
A Telkom enterprise plan to create an NGN backbone network to support certain of our broadband services.
Intelligent Network
A service-independent telecommunications network where the logic functions are taken out of the switch and placed in computer nodes distributed throughout the network. This provides the means to develop and control services more efficiently allowing new or advanced telephony services to be introduced quickly.
Interconnection
The physical linking of a carrier's network with equipment or facilities not belonging to that network.
IP
Internet Protocol the method or protocol by which data is sent from one computer to another on the internet.
IPTV
Internet Protocol Television, a system through which television services are delivered using the Internet Protocol suite over a packet-switched network such as the internet, instead of being delivered through traditional terrestrial, satellite signal, and cable television formats.
IP Core
A block of logic data that is used in making a field programmable gate array (FPGA) or application-specific integrated circuit (ASIC) for a product.
IP DSLAM
Internet Protocol-Digital Subscriber Line Access Multiplexer, a network device located near the customer’s location that allows telephone lines to make faster connections to the internet by connecting multiple customer Digital Subscriber Lines (DSLs) to a high-speed internet backbone line using multiplexing techniques.
IP VPN
A data communication service using IP Multi Protocol Label Switching (MPLS) and based on any to any connection. This service is connected to the data security systems, L2TP and IPSec. The speed depends on the customer’s needs and ranges from 64 Kbps to 2 Mbps.
ISDN
Integrated Services Digital Network, a network that provides end-to-end digital connectivity and allows simultaneous transmission of voice, data and video and provides high speed internet connectivity.
ISP
Internet Services Provider, an organization that provides access to the internet.
ITeS
IT enabler Services. Refer to explanation of TIME services.
ITO
IT Outsourcing or Managed Application. Refer to the explanation of TIME services.
ITRB
The Indonesian Telecommunications Regulatory Body.
ITU
The International Telecommunications Union.
Kbps
Kilobyte per second, a measure of speed for digital signal transmission expressed in thousands of bits per second.
KSO
Kerjasama Operasi or Joint Operating Scheme, a unique type of build, operate and transfer arrangement formerly used by Telkom in which a consortium of partners invests and operates Telkom facilities in regional divisions. The consortium partners were owned by international operators and private domestic companies or in cases where Telkom has acquired the consortium partner, by Telkom.
KSO Agreement
The agreements, as amended from time to time, governing the operation of the network in the relevant KSO region for the KSO Period. See “KSO Period”.
KSO Period
The period covered by KSO Agreement.
Table of Content
KSO Unit
A regional division of Telkom managed and operated pursuant to the relevant KSO Agreement.
Lambda
Lambda indicates the wavelength of any wave, especially in physics, electronics engineering and mathematics.
LAN
Local Area Network, a network of interconnected workstations that enables network resources sharing and typically covers a limited area (for example, within a building).
Leased Line
A dedicated telecommunications transmissions line linking one fixed point to another, rented from an operator for exclusive uses.
Lines In Service (“LIS”)
Revenue-generating lines connected to subscribers, including payphones, but not including mobile cellular subscribers or lines used internally by us.
Local Call
The call among subscribers in the same numbering area without requiring any prefix number.
Local Exchange Capacity
The aggregate number of lines at a local exchange connected and available for connection to outside plant.
LSE
The London Stock Exchange.
LTE
Long Term Evolution technology, a standard for high-speed wireless data communication for mobile phones and data terminals.
Mbps
Megabyte per second, a measure of speed for digital signal transmission expressed in millions of bits per second.
Metro Ethernet
Bridge or relationship between locations that are apart geographically, this network connects LAN customers at several different locations.
MHz
Megahertz, a unit of measure of frequency equal to one million cycles per second.
Microwave Transmission
A transmission consisting of electromagnetic waves in the radio frequency spectrum above 890 million cycles per second and below 20 billion cycles per second.
Mobile Broadband
Mobile Broadband the marketing term for wireless internet access through a portable modem, mobile phone, USB Wireless Modem or other mobile devices.
MoC
The Ministry of Communication.
MoCI
The Ministry of Communication and Information, to which regulatory responsibility over telecommunication was transferred from the MoC in February 2005.
Modern License
An operational license, contemplated in the Telecommunication Law, which replaces the existing operational license for basic telecommunications services.
Table of Content
MoF
The Ministry of Finance.
MSAN
Multi Service Access Networks represent the third generation of optical access network technology and are single platforms capable of supporting traditional, widely deployed, access technologies and services as well as emerging ones, while simultaneously providing a gateway to a NGN core. MSAN will enable us to provide triple play services that distribute high speed internet access, voice packet services and IPTV services simultaneously through the same infrastructure.
Network Access Point
A public network exchange facility where ISPs connected with one another in peering arrangements.
NGN
Next Generation Network, a general term that refers to a packet-based network able to provide services, including telecommunication services, and able to make use of multiple broadband, quality of service enabled transport technologies and in which service-related functions are independent from underlying transport related technologies. A NGN is intended to be able to, with one network, transport various services (voice, data, and various media such as video) by encapsulating these into packets, similar to how such packet are transmitted on the internet. NGNs are commonly built around the Internet Protocol.
Node b
A BTS for a 3G W-CDMA/UMTS network.
NYSE
The New York Stock Exchange.
OBCE Transformation
Operational, Business and Customer support system and Enterprise relations management, our Strategic Initiatives.
Off-net
Communication between two customers in the different operators.
OLO
Other License Operator, operators other than Telkom.
On-net
Communication between two customers in the same operators.
Optical Fiber
Cables using optical fiber and laser technology through which modulating light beams representing data are transmitted through thin filaments of glass.
Outside Plant
The equipment and facilities used to connect subscriber premises to the local exchange.
Pay TV
Pay Television, premium television, or premium channels subscription-based television services, usually provided by both analog and digital cable and satellite, but also increasingly via digital terrestrial and internet television.
PDN
Paket Data Networkor Data Network Package (“DNP”) a digital communications network which breaks a group data to be transmitted into segments called packets, which are then routed independently.
PKLN
Tim Pinjaman Komersial Luar Negeri or Foreign Commercial Loan Coordinating Team, an inter-agency team of the Government charged with among others, considering requests of Indonesian state-owned enterprises such as Telkom for consent to obtain foreign commercial loans.
POWL
Public Offering Without Listing.
Table of Content
Premium SMS
PremiumShort Message Service, a text messaging service component of phone, web, or mobile communication systems, using standardized communications protocols that allow the exchange of short text messages between fixed line or mobile phone devices.
PSTN
Public Switched Telephone Network, a telephone network operated and maintained by Telkom and the KSO Units for and on behalf of Telkom.
Pulse
The unit in the calculation of telephone charge.
Radio Frequency Spectrum
The part of the electromagnetic spectrum corresponding to radio frequencies – that is, frequencies lower than around 300 GHz (or, equivalently, wavelengths longer than about 1 mm).
RIO
Reference Interconnection Offer, a regulatory term covering all facilities, including interconnection tariffs, technical facilities and administrative issues offered by one telecommunications operator to other telecommunications operator for interconnection access.
RMJ
Regional Metro Junction, a cable network installation service inter cities in one regional (region/province).
Roaming
A general term referring to the extension of connectivity service in a location that is different from the home location where the service was registered.
RUIM card
Removable User Identity Module, a smart card designed to be inserted into a fixed wireless telephone that uniquely identifies a CDMA network subscription and that contains subscriber-related data such as phone numbers, service details and memory for storing messages.
SCCS
Submarine Communications Cable System, a cable laid on the sea bed between land-based stations to carry telecommunication signals across stretches of ocean.
SDP
Service Delivery Platform, a set of components that provide a service delivery architecture (such as service creation, session control and protocols) for a type of service.
SEC
The US Securities and Exchange Commission.
SISKOMDAT
Sistem Komunikasi Data. Refer to Data Communication System on Licencing topic.
Satellite Transponder
Radio relay equipment embedded in a satellite that receives signals from earth and amplifies and transmits the signal back to the earth.
SIM card
Subscriber Identity Module, a “smart” card designed to be inserted into cellular phone that uniquely identifies a GSM network subscription and contains subscriber-related data such as phone numbers, service details and memory for storing messages.
SMS
Short Messaging Service, a technology allowing the exchange of text messages between mobile phones and between fixed wireless phones.
Sarbanes-Oxley Act (“SOA”)
The Sarbanes-Oxley Act of 2002, enacted July 30, 2002, also known as the “Public Company Accounting Reform and Investor Protection Act” and “Corporate and Auditing Accountability and Responsibility Act.”
Table of Content
SOE
State Owned Enterprise a government-owned corporation, state-owned company, state-owned entity, state enterprise, publicly owned corporation, government business enterprise, or parastatal a legal entity created by a government to undertake commercial activities on behalf of an owner government.
Softs Switch
A central device in a telephone network which connects calls from one phone line to another, entirely by means of software running on a computer system. This work was formerly carried out by hardware, with physical switchboards to route the calls.
STM-1
Synchronous Transport Module level-1, the SDH ITU-T fiber optic network transmission standard with a bit rate of 155.52 Mbps. The other standards are STM-4, STM-16 and STM-64.
Switch
A mechanical, electrical or electronic device that opens or closes circuits, completes or breaks an electrical path, or selects paths or circuits, used to route traffic in a telecommunications network.
Tera Router
Tera Router or terabit router on the theory allows the network capacity on a scale of terabits (1 terabit = 1 million gigabits).
TIME
Telecommunication, Information, Multimedia and Edutainment.
TITO
Trade In Trade Off. Refer to Network Development on “Development and Modernization of Broadband Access through the TITO Model” Project.
Trunk Exchange
A switch that has the function of connecting one telephony switch to another telephony switch, which can either be a local or a trunk switch.
TTCS
Telecommunication Traffic Clearing System. Refer to Telecommunication Regulators topic.
UMTS
Universal Mobile Telephone System one of the third generation (3G) mobile systems being developed within the ITU’s IMT-2000 framework.
USO
Universal Service Obligation the service obligation imposed by the Government on all telecommunications services providers for the purpose of providing public services in Indonesia.
VAS
Value Added Services. Refer to the explanation of TIME services.
VoIP
Voice over Internet Protocol a means of sending voice information using the Internet Protocol.
VPN
Virtual Private Network a secure private network connection, built on top of publicly-accessible infrastructure, such as the internet or the public telephone network. VPNs typically employ some combination of encryption, digital certificates, strong user authentication and access control to secure the traffic they carry. These provide connectivity to many machines behind a gateway or firewall.
VPN Frame Relay
A standardized wide area network technology that specifies the physical and logical link layers of digital telecommunications channels using a packet switching methodology.
Table of Content
VSAT
Very Small Aperture Terminal a relatively small antenna, typically 1.5 to 3.0 meters in diameter, placed in the user’s premises and used for two-way communications by satellite.
WAP
Wireless Application Protocol an open and global standard of technology platform that enables mobile users to access and interact with mobile information services such as email, websites, financial information, online banking, information and entertainment (infotainment), games and micro payments.
Wi-MAX
Worldwide Interoperability for Microwave Access a telecommunications technology that provides wireless transmission of data using a variety of transmission modes, from point-to-point links to portable internet access.
Wireless Access Network
Any type of computer network that is not connected by cables of any kind. It is a method by which homes, telecommunications networks and enterprise (business) installations avoid the costly process of introducing cables into a building, or as a connection between various equipment locations.
Wireless Broadband
Technology that provides high-speed wireless internet access or computer networking access over a wide areas.
Table of Content
CERTAIN DEFINITIONS, CONVENTIONS AND GENERAL INFORMATION
Unless the context otherwise requires, references in this Form 20-F to the “Company”, “Telkom”, “we”, “us” and “our” are to PT Telekomunikasi Indonesia Tbk. and its consolidated subsidiaries. All references to “Indonesia” are references to the Republic of Indonesia. All references to the “Government” herein are references to the Government of the Republic of Indonesia. References to “United States” or “US” are to the United States of America. References to “United Kingdom” or “UK”are to the United Kingdom of Great Britain and Northern Ireland. References to “Indonesian Rupiah” or “Rp” are to the lawful currency of Indonesia. References to “US Dollar” or “US$” are to the lawful currency of the United States. Certain figures (including percentages) have been rounded for convenience, and therefore indicated and actual sums, quotients, percentages and ratios may differ.
Our Consolidated Financial Statements as of and for the years ended December 31, 2010 and 2011 included in this Form 20-F have been prepared in accordance with International Financial Reporting Standards (“IFRS”) as issued by the International Accounting Standards Board (“IASB”).
On December 31, 2011, the financial statements of nine of our subsidiaries were consolidated into the Consolidated Financial Statements for the year 2011. The nine companies are PT Telekomunikasi Indonesia International (“Telin”, a wholly-owned subsidiary), PT Dayamitra Telekomunikasi (“Mitratel”, a wholly-owned subsidiary), PT Pramindo Ikat Nusantara (“Pramindo”, a wholly-owned subsidiary), PT Telekomunikasi Selular (“Telkomsel”, in which we own a 65.0% stake), PT Multimedia Nusantara (“Metra”, a wholly-owned subsidiary), PT Infomedia Nusantara (“Infomedia”, wholly-owned through a direct interest and a 49.0% stake owned by Metra), PT Indonusa Telemedia (“Indonusa”, wholly-owned through a direct interest and a 0.46% stake owned by Metra), PT Graha Sarana Duta (“GSD”, in which we own a 99.99% stake), and PT Napsindo Primatel Internasional (“Napsindo”, in which we own a 60% stake). See Note 1d to our Consolidated Financial Statements.
Solely for the convenience of the reader, certain Indonesian Rupiah amounts have been translated into US Dollars at specified rates. Unless otherwise indicated, US Dollars equivalent information for amounts in Indonesian Rupiah is translated at the Indonesian Central Bank Rate for December 30, 2011, the last banking transaction in 2011 which was Rp9,067.5 to US$1.00. The exchange rate of Indonesian Rupiah for US Dollars onMarch 15, 2012 was Rp9,193 to US$1.00. The Federal Reserve Bank of New York does not certify for customs purposes a noon buying rate for cable transfers in Indonesian Rupiah. No representation is made that the Indonesian Rupiah or US Dollar amounts shown herein could have been or could be converted into US Dollar or Indonesian Rupiah, as the case may be, at any particular rate or at all. See “Item 3. Key Information–Selected Financial Data–Exchange Controls” for further information regarding rates of exchange between the Indonesian Rupiah and the US Dollar
FORWARD-LOOKING STATEMENTS
This Form 20-F contains “forward-looking statements” as defined in Section 27A of the Securities Act of 1933, as amended (“Securities Act”) and Section 21E of the US Securities Exchange Act of 1934, as amended (“Exchange Act”) within the meaning of the Private Securities Litigation Reform Act of 1995, including statements regarding our expectations and projections for our future operating performance and business prospects. The words “believe”, “expect”, “anticipate”, “estimate”, “project” and similar words identify forward-looking statements. In addition, all statements other than statements of historical facts included in this Form 20-F are forward-looking statements. Although we believe that the expectations reflected in the forward-looking statements herein are reasonable, we can give no assurance that such expectations will prove to be correct. These forward-looking statements are subject to a number of risks and uncertainties, including changes in the economic, social and political environments in Indonesia. This Form 20-F discloses, under “Item 3. Key Information–Risk Factors” and elsewhere, important factors that could cause actual results to differ materially from our expectations.
PART I
ITEM 1. IDENTITY OF DIRECTORS, SENIOR MANAGEMENT AND ADVISERS
Not applicable.
ITEM 2. OFFER STATISTICS AND EXPECTED TIMETABLE
Not applicable.
ITEM 3. KEY INFORMATION
A. SELECTED FINANCIAL DATA
The following tables present our selected consolidated financial information and operating statistics as of the dates and for each of the periods indicated. The selected financial information as of and for the years ended December 31, 2010 and 2011 presented below is based upon our audited Consolidated Financial Statements prepared in conformity with IFRS as issued by the IASB. The selected financial information as of and for the years ended December 31, 2010 and 2011 should be read in conjunction with, and is qualified in its entirety by reference to, our audited Consolidated Financial Statements, including the notes thereto, and the other information include elsewhere in this Form 20-F. The selected financial information as of and for the years ended December 31, 2007, 2008 and 2009 is based upon our audited Consolidated Financial Statements prepared in conformity with Indonesian Financial Accounting Standards (“IFAS”), with a reconciliation to US GAAP. The selected financial information as of and for the years ended December 31, 2007, 2008 and 2009 should be read in conjunction with, and is qualified in its entirety by reference to, our audited Consolidated Financial Statements, including the notes thereto, and the other information included elsewhere in our previous Form 20-F filed with the SEC onMarch 29,2011. Therefore, financial information for 2011 and 2010 are not comparable with financial information for 2007, 2008 and 2009 and are presented separately.
The audited Consolidated Financial Statements as of and for the years ended December 31, 2007 and 2008 were audited by KAP Haryanto Sahari & Rekan and for the years ended December 31 2009, 2010 and 2011 were audited by KAP Tanudiredja, Wibisana & Rekan, a member firm of the PwC global network (“PwC”).
| | 2010 | | 2011 | | 2011 | |
| | (In billions of Rupiah, except for per share and per ADS amounts) | | (In millions of US$, except for | |
per share and per ADS amounts) |
Consolidated Statements of Comprehensive Income | | | | | | | |
IFRS | | | | | | | |
Revenues | | 68,529 | | 71,238 | | 7,856 | |
Other Income | | 548 | | 666 | | 73 | |
Expenses | | | | | | | |
Operations, maintenance and telecommunication services | | 16,046 | | 16,453 | | 1815 | |
Depreciation and amortization | | 14,580 | | 14,823 | | 1,635 | |
Personnel | | 7,447 | | 8,671 | | 956 | |
Interconnection | | 3,086 | | 3,555 | | 392 | |
Marketing | | 2,525 | | 3,278 | | 362 | |
General and administrative | | 2,537 | | 2,935 | | 324 | |
(Loss) gain on foreign exchange - net | | (43 | ) | 210 | | 23 | |
Share ofloss of associated companies | | 14 | | 10 | | 1 | |
Others – net | | 145 | | 192 | | 21 | |
Total Expenses | | 46,337 | | 50,127 | | 5,529 | |
Profit before finance (Costs)/ Income and Income Tax | | 22,740 | | 21,777 | | 2,400 | |
Finance income | | 452 | | 620 | | 68 | |
Finance costs | | (1,928 | ) | (1,662 | ) | (183 | ) |
Total Finance Costs - Net | | (1,476 | ) | (1,042 | ) | (115 | ) |
Profit before Income Tax | | 21,264 | | 20,735 | | 2,285 | |
Income Tax (Expense) Benefit | | (5,512 | ) | (5,385 | ) | (594 | ) |
Profit for the Year | | 15,752 | | 15,350 | | 1,691 | |
-1-
| | 2010 | | 2011 | | 2011 | |
| | (In billions of Rupiah, except for per share and per ADS amounts) | | (In millions of US$, except for | |
per share and per ADS amounts) |
Other Comprehensive (Expense) Income | | | | | | | |
Foreign currency translation differences | | 2 | | 7 | | 1 | |
Change in fair value of available-for-sale financial assets | | 32 | | 4 | | - | |
Defined benefit plan actuarial losses | | (587 | ) | (1,958 | ) | (216 | ) |
Total Other Comprehensive Expense, net of tax | | (553 | ) | (1,947 | ) | (215 | ) |
Total Comprehensive Income for the Year | | 15,199 | | 13,403 | | 1,476 | |
Profit attributable to: | | | | | | | |
Owners of the Parent | | 11,427 | | 10,848 | | 1,195 | |
Non-controlling interest | | 4,325 | | 4,502 | | 496 | |
Total comprehensive income attributable to: | | | | | | | |
Owners of the Parent | | 10,911 | | 8,969 | | 988 | |
Non-controlling interest | | 4,288 | | 4,434 | | 488 | |
Weighted average number of shares outstanding (in millions) | | 19,669 | | 19,592 | | 19,592 | |
Net income per share(1) | | 580.95 | | 553.70 | | 0.06 | |
Net income per ADS | | 23,238.00 | | 22,148. 00 | | 2.44 | |
(40 Series B shares per ADS) | | | | | | | |
Dividend relating to the period (accrual basis)(2) | | | | | | | |
Dividends declared per share | | 322.59 | | - | | - | |
Dividends declared per ADS | | 12,903.60 | | - | | - | |
Dividend paid in the period (cash basis) | | | | | | | |
Dividends declared per share | | 275.45 | | 308.56 | | 0.03 | |
Dividends declared per ADS | | 11,017.83 | | 12,342.57 | | 1.36 | |
-2-
Table of Content
| | Jan 1, 2010 | | 2010 | | 2011 | | 2011 | |
| | (In billions of Rupiah, except for per share and per ADS amounts) | | (In millions of US$, except for | |
per share and per ADS amounts) |
Consolidated Statements of Financial Position | | | | | | | | | |
IFRS | | | | | | | | | |
Assets | | | | | | | | | |
Cash and cash equivalents | | 7,805 | | 9,120 | | 9,634 | | 1,062 | |
Other current assets | | 1,966 | | 1,735 | | 3,080 | | 340 | |
Trade and other receivables | | 3,996 | | 4,534 | | 5,393 | | 595 | |
Advances and prepaid expenses | | 2,497 | | 3,441 | | 3,294 | | 363 | |
Property, plant and equipment | | 76,179 | | 75,624 | | 74,638 | | 8,231 | |
Intangible assets | | 2,431 | | 1,786 | | 1,791 | | 198 | |
Other non-current assets | | 3,877 | | 4,832 | | 4,892 | | 539 | |
Total Assets | | 98,751 | | 101,072 | | 102,722 | | 11,328 | |
Liabilities | | | | | | | | | |
Trade and other payables | | 10,205 | | 7,787 | | 8,355 | | 921 | |
Taxes payable | | 1,750 | | 736 | | 1,039 | | 115 | |
Unearned income | | 2,947 | | 2,681 | | 2,821 | | 311 | |
Short-term loans and other borrowings | | 7,760 | | 5,360 | | 4,913 | | 542 | |
Other current liabilities | | 4,230 | | 3,909 | | 5,061 | | 558 | |
Deferred tax liabilities | | 3,306 | | 4,047 | | 3,448 | | 380 | |
Long-term loans and other borrowings | | 14,900 | | 16,655 | | 12,958 | | 1,429 | |
Other non-current liabilities | | 3,331 | | 3,359 | | 5,101 | | 563 | |
Total Liabilities | | 48,429 | | 44,534 | | 43,696 | | 4,819 | |
Net Assets (Total Assets - Total Liabilities) | | 50,322 | | 56,538 | | 59,026 | | 6,509 | |
Capital Stock(3) | | 5,040 | | 5,040 | | 5,040 | | 556 | |
Equity attributable to owners of the Parent | | 39,428 | | 44,627 | | 45,711 | | 5,041 | |
Non-controlling interest | | 10,894 | | 11,911 | | 13,315 | | 1,468 | |
Total Liabilities and Equity | | 98,751 | | 101,072 | | 102,722 | | 11,328 | |
Issued and fully paid shares | | 20,159,999,280 | | 20,159,999,280 | | 20,159,999,280 | | 20,159,999,280 | |
(1) Using IFAS results, our profit attributable to owners of the Parent would be Rp11,537 billion and Rp10,965 billion for 2010 and 2011, and our net income per share would be Rp586.54 and Rp559.67 for 2010 and 2011. We distribute dividends based on profit attributable to owners of the Parent and net income per share determined in reliance on IFAS.
(2) In 2010 we paid a cash dividend for 2009 of Rp261.41 per share and interim cash dividend 2010 of Rp26.75 per share. In 2011, we paid a cash dividend for 2010 of Rp308.56 per share.
(3) As of December 31, 2011, issued and paid-up capital consists of one Series A Dwiwarna share having a par value of Rp250 (the “Dwiwarna Share”) and 20,159,999,279 Series B shares having a par value of Rp250 per share (“common stock”) each from an authorized capital stock comprising one Series A Dwiwarna share and 79,999,999,999 Series B shares.
-3-
| | Years Ended December 31, | |
| | 2007* | | 2008* | | 2009* | |
| | (In billions of Rupiah, except for per share and per ADS amounts) | |
Consolidated Income Statement Data | | | | | | | |
Indonesian GAAP | | | | | | | |
Operating Revenue | | 62,683 | | 64,166 | | 67,678 | |
Operating Expenses | | | | | | | |
Depreciation and amortization | | 10,610 | | 12,332 | | 13,975 | |
Personnel | | 8,414 | | 8,979 | | 8,371 | |
Operation, maintenance and telecommunication services | | 9,662 | | 12,301 | | 14,549 | |
General and administration | | 2,583 | | 2,504 | | 2,806 | |
Interconnection | | 3,055 | | 3,263 | | 2,929 | |
Marketing | | 1,769 | | 2,350 | | 2,260 | |
Total Operating Expenses | | 36,093 | | 41,729 | | 44,890 | |
Operating Income | | 26,590 | | 22,437 | | 22,788 | |
Other Income (Expenses) | | | | | | | |
Interest income | | 519 | | 672 | | 462 | |
Equity in net (loss) income of associated companies | | 7 | | 20 | | (30 | ) |
Interest expense | | (1,561 | ) | (1,641 | ) | (2,096 | ) |
Gain (loss) on foreign exchange - net | | (295 | ) | (1,614 | ) | 973 | |
Others - net | | 609 | | 525 | | 350 | |
Other expenses — net | | (721 | ) | (2,038 | ) | (341 | ) |
Income Before Tax | | 25,869 | | 20,399 | | 22,447 | |
Income Tax Expense | | (8,015 | ) | (5,674 | ) | (6,404 | ) |
Income before minority interest in net income of consolidated subsidiaries | | 17,854 | | 14,725 | | 16,043 | |
Minority interest in net income of consolidated subsidiaries, net | | (4,811 | ) | (4,053 | ) | (4,644 | ) |
Net Income | | 13,043 | | 10,672 | | 11,399 | |
Weighted average number of shares outstanding (in millions) | | 19,962 | | 19,749 | | 19,669 | |
Net income per share | | 653.40 | | 540.38 | | 579.52 | |
Net income per ADS | | 26,136.70 | | 21,615.20 | | 23,180.80 | |
US GAAP(1) | | | | | | | |
Net income | | 11,966 | | 10,874 | | 12,092 | |
Operating revenue | | 62,683 | | 64,166 | | 67,677 | |
Net income per share | | 599.42 | | 550.63 | | 614.78 | |
Net income per ADS | | 23,976.80 | | 22,025.34 | | 24,591.25 | |
Dividend relating to the period (accrual basis)(3) | | | | | | | |
Dividends declared per share | | 455.87 | | 296.94 | | 288.06 | |
Dividends declared per ADS | | 18,234.80 | | 11,877.60 | | 11,522.40 | |
Dividend paid in the period (cash basis) | | | | | | | |
Dividends declared per share | | 303.25 | | 407.42 | | 323.59 | |
Dividends declared per ADS | | 12,130.00 | | 16,296.80 | | 12,943.60 | |
-4-
| | Years Ended December 31, | |
| | 2007* | | 2008* | | 2009* | |
| | (In billions of Rupiah, except for per share and per ADS amounts) | |
Consolidated Balance Sheet Data | | | | | | | |
Indonesian GAAP | | | | | | | |
Current assets | | 15,978 | | 14,622 | | 16,095 | |
Non-current assets | | 66,078 | | 76,634 | | 81,836 | |
Total assets | | 82,056 | | 91,256 | | 97,931 | |
Current liabilities(2) | | 21,018 | | 27,218 | | 26,892 | |
Non-current liabilities | | 18,441 | | 20,444 | | 21,544 | |
Total liabilities | | 39,459 | | 47,662 | | 48,436 | |
Minority interest | | 9,305 | | 9,684 | | 10,933 | |
Capital stock | | 5,040 | | 5,040 | | 5,040 | |
Total shareholders’ equity | | 33,292 | | 33,910 | | 38,562 | |
Total liabilities and shareholders’ equity | | 82,056 | | 91,256 | | 97,931 | |
US GAAP | | | | | | | |
Current assets | | 16,893 | | 15,482 | | 18,381 | |
Non-current assets | | 66,960 | | 76,636 | | 83,100 | |
Total assets | | 83,853 | | 92,118 | | 101,481 | |
Current liabilities | | 22,090 | | 27,524 | | 26,931 | |
Non-current liabilities | | 22,623 | | 20,262 | | 22,522 | |
Total liabilities | | 44,713 | | 47,786 | | 49,453 | |
Minority interest in net assets of subsidiaries | | 9,323 | | 9,605 | | 11,067 | |
Total shareholders’ equity | | 29,817 | | 34,727 | | 40,961 | |
Total liabilities and shareholders’ equity | | 83,853 | | 92,118 | | 101,481 | |
* As restated.
(1) US GAAP amounts reflect adjustments resulting from differences in the accounting treatment of voluntary termination benefits, foreign exchange differences capitalized on assets under construction, interest capitalized on assets under construction, revenue-sharing arrangements, employees benefits, equity in net loss (income) of associated companies, amortization of land rights, revenue recognition, amortization of goodwill, finance leases, acquisition of Mitratel, asset retirement obligations, deferred taxes, available-for-sale securities, amendment and restatement of JOS in Regional Division VII and non-controlling interests.
(2) Includes current maturities of long-term debt.
(3) In 2007, we paid a dividend computed as a cash dividend for 2006 of Rp254.80 per share and interim cash dividend 2007 of Rp48.45 per share. In 2008, we paid a dividend computed as a cash dividend and special dividend for 2007 of Rp455.87 per share less the interim cash dividend of Rp48.45 per share paid in November 2007. In 2009, we paid a cash dividend for 2008 of Rp296.94 per share and interim cash dividend 2009 of Rp26.65 per share.
-5-
Exchange Controls
Exchange Rate Information
The following table shows the exchange rate of Indonesian Rupiah to US Dollar based on the middle exchange rates at the end of each month for the periods indicated. The Rupiah middle exchange rate is calculated based on the Bank Indonesia buying and selling rates.
Calendar Year | | at Period End | | Average(1) | | High(2) | | Low(2) | |
| | (Rp Per US$1) | |
2007 | | 9,419 | | 9,136 | | 9,479 | | 8,672 | |
First Quarter | | 9,118 | | 9,099 | | 9,225 | | 8,950 | |
Second Quarter | | 9,054 | | 8,973 | | 9,120 | | 8,672 | |
Third Quarter | | 9,137 | | 9,246 | | 9,479 | | 8,990 | |
Fourth Quarter | | 9,419 | | 9,234 | | 9,434 | | 9,045 | |
2008 | | 10,950 | | 9,680 | | 12,400 | | 9,051 | |
First Quarter | | 9,217 | | 9,260 | | 9,486 | | 9,051 | |
Second Quarter | | 9,225 | | 9,264 | | 9,376 | | 9,179 | |
Third Quarter | | 9,378 | | 9,290 | | 9,470 | | 9,063 | |
Fourth Quarter | | 10,950 | | 11,023 | | 12,400 | | 9,555 | |
2009 | | 9,400 | | 10,398 | | 12,065 | | 9,293 | |
First Quarter | | 11,575 | | 11,631 | | 12,065 | | 10,863 | |
Second Quarter | | 10,225 | | 10,531 | | 11,620 | | 9,985 | |
Third Quarter | | 9,681 | | 10,002 | | 10,255 | | 9,580 | |
Fourth Quarter | | 9,400 | | 9,471 | | 9,685 | | 9,293 | |
2010 | | 8,991 | | 9,085 | | 9,413 | | 8,888 | |
First Quarter | | 9,115 | | 9,261 | | 9,413 | | 9,070 | |
Second Quarter | | 9,083 | | 9,118 | | 9,373 | | 9,001 | |
Third Quarter | | 8,924 | | 9,001 | | 9,094 | | 8,924 | |
Fourth Quarter | | 8,991 | | 8,963 | | 9,050 | | 8,888 | |
2011 | | 9,068 | | 8,779 | | 9,185 | | 8,460 | |
First Quarter | | 8,709 | | 8,899 | | 9,088 | | 8,708 | |
Second Quarter | | 8,597 | | 8,590 | | 8,699 | | 8,506 | |
Third Quarter | | 8,823 | | 8,610 | | 8,988 | | 8,460 | |
Fourth Quarter | | 9,068 | | 9,000 | | 9,185 | | 8,828 | |
September | | 8,823 | | 8,766 | | 8,988 | | 8,539 | |
October | | 8,835 | | 8,895 | | 8,968 | | 8,828 | |
November | | 9,170 | | 9,015 | | 9,185 | | 8,893 | |
December | | 9,068 | | 9,088 | | 9,165 | | 9,015 | |
2012 | | | | | | | | | |
January | | 9,000 | | 9,109 | | 9,210 | | 8,955 | |
February | | 9,085 | | 9,026 | | 9,158 | | 8,892 | |
March (15) | | 9,193 | | 9,154 | | 9,193 | | 9,098 | |
Source: Bank Indonesia
(1) The average of the middle exchange rate announced by Bank Indonesia applicable for the period.
(2) The high and low amounts are determined based upon the daily middle exchange rate announced by Bank Indonesia during the applicable period.
The exchange rates used for translation of monetary assets and liabilities denominated in foreign currencies are the buy and sell rates published by Reuters in 2009, 2010 and 2011. The Reuters buy and sell rates, applied respectively to monetary assets and liabilities, were Rp9,420 and Rp9,430 to US$1 as of December 31, 2009, Rp9,005 and Rp9,015 to US$1 as of December 31, 2010 and Rp9,060 and Rp9,075 to US$1.00 as of December 31, 2011.
The Consolidated Financial Statements are stated in Rupiah. The translations of Rupiah amounts into US Dollar are included solely for the convenience of the readers and have been made using the average of the market buy and sell rates of Rp9,067.5 to US$1.00 published by Reuters on December 31, 2011.
On March 15, 2012, the Reuters bid and ask rates were Rp9,160 and Rp9,175 to US$1.00.
-6-
Foreign Exchange
Indonesia operates a liberal foreign exchange system that permits the free flow of foreign exchange. Capital transactions, including remittances of capital, profits, dividends and interest, are free of exchange controls. A number of regulations, however, have an impact on the exchange system. For example, only banks are authorized to deal in foreign exchange and execute exchange transactions related to the import and export of goods. In addition, Indonesian banks (including branches of foreign banks in Indonesia) are required to report to Bank Indonesia any fund transfers exceeding US$10,000. As a State-Owned Company, and based on the decree of the Head of Foreign Commercial Loan Coordinating Team (“PKLN”), we are required to obtain an approval from PKLN prior to acquiring foreign commercial loans and must submit periodical reports to PKLN during the term of the loans.
For the year 2011, the average rate of Rupiah to the US Dollar was Rp8,779, with the highest and lowest rates being Rp9,185 and Rp8,460, respectively.
B. CAPITALIZATION ANDINDEBTEDNESS
Not applicable.
C. REASON FOR THEOFFER ANDUSE OFPROCEEDS
Not applicable.
D. RISK FACTORS
Risks Related to Indonesia
Political and Social Risks
Current political and social events in Indonesia may adversely affect our business
The Indonesian political landscape has changed as a result of the changed governmental structure and the successful organization of direct general elections for the President, Vice President, heads of local governments, and members of the national and regional parliaments (DPR and DPRD). The successes in the 2004 elections were successfully replicated in 2009, when President Susilo Bambang Yudhoyono was re-elected for a second term. Likewise, at the sub-national level, elections for local government heads were conducted throughout 2011 and 2010 without incident.
Labor issues have come to the fore in Indonesia. In 2003, the Government enacted a new labor law that gave employees greater protections. Occasional efforts to reduce these protections have prompted an upsurge in public protests as workers responded to policies that they deemed unfavorable.
Moreover, Indonesia has experienced social unrest due to separatist activity in Aceh in the past and in Papua currently. The country has also seen inter-ethnic conflict, for example in Kalimantan, as well as inter-religious conflict such as in Maluku and Poso.
With each year, Indonesians are becoming increasingly sophisticated with regard to politics and democracy and more mature in expressing their opinions in public and at addressing ethnic and religious differences. Nevertheless, political and related social developments in Indonesia have been unpredictable in the past. There can be no assurance that social and civil disturbances will not occur in the future and on a wider scale, or that any such disturbances will not, directly or indirectly, materially and adversely affect our business, financial condition, results of operations and prospects.
-7-
Terrorist activities in Indonesia could destabilize Indonesia, which would adversely affect our business, financial condition and results of operations, and the market price of our securities
There have been a number of terrorist incidents in Indonesia, including the May 2005 bombing in Central Sulawesi, the Bali bombing in October 2005 and the bombing at the JW Marriot and Ritz Carlton Hotels in Jakarta in July 2009.
The police have successfully countered some terrorist activities in recent years and arrested several of those suspected of being involved in these incidents. Nevertheless, terrorist incidents may continue and, if serious or widespread, might have a material adverse effect on investment and confidence in, and the performance of, the Indonesian economy and may also have a material adverse effect on our business, financial condition, results of operations and prospects and the market price of our securities.
Although the police have continued to enhance their anti-terrorist capabilities, there can be no assurance that terrorist activities will not occur again in future, or that if such events do occur, they will not have an impact on business or our securities market price in Indonesia capital market.
Macro Economic Risks
Negative changes in global, regional or Indonesian economic activity could adversely affect our business
Changes in the Indonesian, regional and global economies can affect our performance. Two significant events in the past that impacted Indonesia’s economy were the Asian economic crisis of 1997 and the continuing the global economic crisis which started in 2007. The 1997 crisis affected Southeast Asia, including Indonesia, while the current global economic crisis that arose from the subprime mortgage crisis in the US put Indonesia’s economy under pressure, although not as severe as in 1997. For nearly three years, the Euro as a currency came under severe pressure, particularly due to the budget deficits within Portugal, Spain, Greece, Ireland and Italy. The Euro crisis has primarily affected the financial sector and has not had a significant or immediate impact on Indonesia’s economic growth, which is expected by the Government to remain positive in 2012. However, if the crisis becomes protracted, or extends to Asia and Indonesia we can give no assurances that it will not have a material and adverse effect on Indonesia’s economic growth and consequently on our business.
In the past, economic volatility, had a material adverse effect on both the quality and growth of business in Indonesia, among other things by leading to currency depreciation, slowing economic growth, increasing inflation and interest rates, weakening purchasing power and causing social unrest.
During 2011, Indonesia’s economy was relatively stable, as reflected in the stability of the Indonesian Rupiah exchange rate at around Rp9,000 per US$1.00 and the Bank of Indonesia rate at 6.75% per annum for most of 2011, single digit inflation in the last two years and positive economic growth. Nevertheless, there is no guarantee that there will not be a recurrence of economic instability in future, or that, should it occur, it will not have an impact on the performance of our business.
Adverse economic conditions could result in less business activity, less disposable income available to consumers to spend and reduced consumer purchasing power, which may reduce demand for communication services, including our services, which in turn would have an adverse effect on our business, financial condition, results of operations and prospects. There can be no assurance that the recent improvements in economic conditions globally and in the region will continue or that adverse economic conditions will not reoccur.
-8-
Fluctuations in the value of the Indonesian Rupiah may materially and adversely affect us
Our functional currency is the Indonesian Rupiah. One of the most important effects of the Asian economic crisis that affected Indonesia was the depreciation and volatility in the value of the Indonesian Rupiah as measured against other currencies, such as theUS Dollar. From 2007 to 2011, the Indonesian Rupiah perUS Dollar exchange rate ranged from a low of Rp12,400 perUS Dollar to a high of Rp8,460 perUS Dollar. As a result, we recorded a gain of Rp43 billion in 2010 and a loss of Rp210billionin 2011. As of December 31, 2011, the Indonesian Rupiah perUS Dollar exchange rate stood at Rp9,067.5 perUS Dollar.
Although the Indonesian Rupiah’s value was relatively stable in 2011, this trend may reverse should global economic conditions change and the European financial crisis extend to Asia and Indonesia. To the extent the Indonesian Rupiah depreciates further from the exchange rates as of December 31, 2011, our obligations under our accounts payable, procurements payable and our foreign currency-denominated loans payable and bonds payable would increase in Indonesian Rupiah terms. Such depreciation of the Indonesian Rupiah would result in losses on foreign exchange translation, significantly affect our other income and net income and reduce theUS Dollar amounts of dividends received by holders of our ADSs. We can give no assurances that we will be able to control or manage our exchange rate risk successfully in the future or that we will not be adversely affected by our exposure to exchange rate risk.
In addition, while the Indonesian Rupiah has generally been freely convertible and transferable, from time by time, Bank of Indonesia has intervened in the currency exchange markets in furtherance of its policies, either by selling Indonesian Rupiah or by using its foreign currency reserves to purchase Indonesian Rupiah. We can give no assurances that the current floating exchange rate policy of Bank of Indonesia will not be modified or that the Government will take additional action to stabilize, maintain or increase the Indonesian Rupiah’s value, or that any of these actions, if taken, will be successful. Modification of the current floating exchange rate policy could result in significantly higher domestic interest rates, liquidity shortages, capital or exchange controls or the withholding of additional financial assistance by multinational lenders. This could result in a reduction of economic activity, an economic recession, loan defaults or declining subscriber usage of our services, and as a result, we may also face difficulties in funding our capital expenditures and in implementing our business strategy. Any of the foregoing consequences could have a material adverse effect on our business, financial condition, results of operations and prospects.
Downgrades of credit ratings of the Government or Indonesian companies could adversely affect our business
As of this date of the Annual Report, Indonesia’s sovereign foreign currency long-term debt is rated “Baa3” by Moody’s (upgraded from “Ba1” on January 18, 2012) , “BB+” by Standard & Poor’s (upgraded from “bb” on April 8, 2011) and “BBB” by Fitch Ratings (“Fitch”). Indonesia's short-term foreign currency debt is rated “B1/NP” by Moody’s, “B” by Standard & Poor’s and “B” by Fitch.On January 18, 2012, Moody’s upgraded Indonesia’s long-term debt rating to investment grade status.
The likelihood of these agencies reviewing or changing these ratings downwards this year is, based on the information that we have today, low. However we can give no assurances that Moody’s, Standard & Poor’s or, Fitch, will not change or downgrade the credit ratings of Indonesia. Any such downgrade could have an adverse impact on liquidity in the Indonesian financial markets, the ability of the Government and Indonesian companies, including us, to raise additional financing and the interest rates and other commercial terms at which such additional financing is available. Interest rates on our floating rate Rupiah-denominated debt would also likely increase. Such events could have material adverse effects on our business, financial condition, results of operations and prospects.
-9-
Disaster Risks
Indonesia is vulnerable to natural disasters and events beyond our control, which could adversely affect our business and operating results
Many parts of Indonesia, including areas where we operate are prone to natural disasters such as floods, lightning strikes, typhoons, earthquakes, tsunamis, volcanic eruptions, fires droughts, power outages and other events beyond our control. The Indonesian archipelago is one of the most volcanically active regions in the world as it is located in the convergence zone of three major lithospheric plates. It is subject to significant seismic activity that can lead to destructive earthquakes, tsunamis or tidal waves. From time to time, natural disasters have killed, affected or displaced large numbers of people and damaged our equipment. These events have been done in the past, and may in the future, disrupt our business activities, cause damage to equipment and adversely affect our financial performance and profit.
In recent years, several natural disasters have occurred in Indonesia (in addition to the Asian tsunami in 2004), including tsunamis in Pangandaran in West Java in 2006 and 2010, an earthquake in Yogyakarta in Central Java in 2006, a hot mud eruption and subsequent flooding in East Java in 2006 and separate earthquakes in Papua, West Java, Sulawesi and Sumatra in 2009.
The September 2, 2009 earthquake in of West Java caused damage to the Company’s assets. On September 30, 2009 an earthquake in West Sumatra disrupted the provision of telecommunications services in several locations. Although our Crisis Management Team in cooperation with our employees and partners was able to restore services quickly, the earthquake caused severe damage to our assets. There were a number of earthquakes detected in 2010, although none of them presented significant risks to our business in general.
Flash floods and more widespread flooding occur regularly during the rainy season from November to April 2011. Cities, especially Jakarta, are frequently subject to severe localized flooding which can result in major disruption, and occasionally fatalities. Jakarta experienced significant floods in February 2007 as did in Solo Central Java in January. In January 2009, torrential rain caused a dam to burst outside Jakarta, flooding hundreds of homes in a densely populated neighborhood, resulting in the death of approximately 100 people. Landslides regularly occur in rural areas during the wet season.
There are numerous volcanoes in Indonesia, any of which can erupt without warning. In October and November 2010, Mount Merapi in Central Java erupted several times, killing an estimated 140 persons, displacing several hundred thousand others in a 20 km radius, causing billions of dollars of property damage and disrupting air travel. Since April 2008, Mount Soputan in North Sulawesi, Mount Egon on Flores Island, Nusa Tenggara, Mount Ibu in North Maluku and Anak Krakatau in the Sunda Strait have shown significant increased volcanic activity. Mount Sinabung, 60 km (40 miles) southwest of Sumatra's main city Medan, erupted on August 29, 2010 after lying dormant for 400 years. Ash and acrid smoke from the volcano have blanketed villages and crops.
In 2010, our submarine cables forming part of our backbone suffered damage due to a tsunami in West Sumatra and an earthquake in Sumbawa. These were repaired.
Although we have implemented a Business Continuity Plan (“BCP”) and a Disaster Recovery Plan (“DRP”), and test these regularly and we have insured our assets to protect from any losses attributable to natural disasters or other phenomena beyond our control, there is no assurance that the insurance cover will be sufficient to cover the potential losses, that the premium payable for these insurance policies upon renewal will not increase substantially in the future, or that natural disasters would not significantly disrupt our operations. In addition, a significant earthquake, other geological disturbance or weather-related natural disaster in a major Indonesia’s cities could severely disrupt the Indonesian economy and undermine investor confidence. Any of these events could materially and adversely affect our business, financial condition, results of operations and prospects.
There are no assurances that future geological or meteorological occurrences will not have a significant impact on Indonesian and its economy. A significant earthquake, other geological disturbance or weather-related natural disaster in any of Indonesia’s more populated cities and financial centers could severely disrupt the Indonesian economy and undermine investor confidence, thereby materially and adversely affecting our business, financial condition, results of operations and prospects.
-10-
Our operations may be adversely affected by an outbreak of avian influenza, Influenza A (H1N1) virus or other epidemics
During the last three years, large parts of Asia experienced unprecedented outbreaks of avian influenza. As of June 2, 2010, the World Health Organization (“WHO”) had confirmed a total of 262 fatalities in a total number of 433 cases reported to the WHO, which only reports laboratory confirmed cases of avian influenza. Of these, the Indonesian Ministry of Health reported to the WHO 115 fatalities in a total number of 141 cases of avian influenza in Indonesia. In addition, the WHO announced in June 2006 that human-to-human transmission of avian influenza had been confirmed in Sumatra, Indonesia. According to the United Nations Food and Agricultural Organization, avian influenza virus is entrenched in 31 of Indonesia’s 33 provinces, increasing the possibility that the virus may mutate into a deadlier form. No fully effective avian influenza vaccines have been developed and an effective vaccine may not be discovered in time to protect against a potential avian influenza pandemic.
In April 2009, there was an outbreak of the Influenza A (H1N1) virus, which originated in Mexico but has since spread globally, including confirmed reports in Hong Kong, Indonesia, Japan, Malaysia, Singapore and elsewhere in Asia. The Influenza A (H1N1) virus is believed to be highly contagious and may not be easily contained.
An outbreak of avian influenza, Influenza A (H1N1) virus or a similar epidemic, or the measures taken by the Governments of affected countries, including Indonesia, against such an outbreak, could severely disrupt the Indonesian and other economies and undermine investor confidence, thereby materially and adversely affecting our financial condition or results of operations and the market value of its securities. Moreover, our operations could be materially disrupt if our employees remained at home and away from our principal places of business for extended period of time, which would have a material and adverse effect on our financial condition or results of operations and the market value of its securities.
Other Risks
Indonesian Corporate Disclosure Standards differ in significant respects from those applicable in other countries including the United States
As an IDX, NYSE and LSE listed company, we are subject to regulatory and exchange corporate governance and reporting requirements in multiple jurisdictions. There may be less publicly-available information about Indonesian public companies, including us, than is regularly disclosed by public companies in countries with more mature securities markets. As a result, investors may not have access to the same level and type of disclosure as that available in other countries, and comparisons with other companies in other countries may not be possible in all respects.
Our financial results are reported herein in conformity with IFRS; however we report our financial results to Bapepam-LK in conformity with IFAS, which differs in certain significant respects from IFRS, and we distribute dividends based on profit for the year attributable to owners of the parent and net income per share determined in reliance on IFAS
In accordance with regulations of the Capital Markets and Financial Institutions Supervisory Agency (“Bapepam-LK”) and the IDX, we are required to report our financial results to Bapepam-LK in conformity with IFAS. We have provided to Bapepam-LK our Annual Report for the financial year ended December 31, 2011, dated March 30, 2012, which we furnished to the SEC on a Form 6-K dated April 2, 2012, which contains our audited Consolidated Financial Statements for the year ended December 31, 2010 and 2011 and financial information as of and for the years ended December 31, 2007, 2008 and 2009, prepared in conformity with IFAS. IFAS differs in certain significant respects from IFRS, and, as a result, there are differences between our financial results as reported under IFAS and IFRS, including profit for the year attributable to owners of the Parent and net income per share. We distribute dividends based on profit for the year attributable to owners of the Parent and net income per share determined in reliance on IFAS.
Using IFAS results, our profit for the year attributable to owners of the Parent would be Rp11,537 billion and Rp10,965 billion for 2010 and 2011, and our net income per share would be Rp586.54 and Rp559.67 for 2010 and 2011. Dividends declared per share were Rp322.59 for 2010. The dividends per share for the year 2011 will be decided at the 2012 AGMS, scheduled for May 2012.
-11-
We are incorporated in Indonesia, and it may not be possible for investors to effect service of process, or enforce judgments, on us within the United States, or to enforce judgments of a foreign court against us in Indonesia
We are a limited liability company incorporated in Indonesia, operating within the framework of Indonesian laws relating to Indonesian companies with limited liability, and all of our significant assets are located in Indonesia. In addition, our Commissioners and our Directors reside in Indonesia and a substantial portion of the assets of such persons are located outside the United States. As a result, it may be difficult for investors to effect service of process, or enforce judgments on us or such persons within the US, or to enforce against us or such persons in the US, judgments obtained in US courts.
We have been advised by Soewito Suhardiman Eddymurthy Kardono, our Indonesian legal advisor that judgments of US courts, including judgments predicated upon the civil liability provisions of the US federal securities laws or the securities laws of any state within the US, are not enforceable in Indonesian courts, although such judgments could be admissible as non-conclusive evidence in a proceeding on the underlying claim in an Indonesian court. They have also advised that there is doubt as to whether Indonesian courts will enter judgments in original actions brought in Indonesian courts predicated solely upon the civil liability provisions of the US federal securities laws or the securities laws of any state within the US. As a result, the claimant would be required to pursue claims against us or such persons in Indonesian courts.
Our controlling shareholder’s interest may differ from those of our other shareholders
The Government has a controlling stake of 53.2% of our issued and outstanding shares of common stock and the ability to determine the outcome of all actions requiring the approval of the shareholders. The Government also holds our one Dwiwarna share, which has special voting rights and veto rights over certain matters, including the election and removal of our Directors and Commissioners. It may also use its powers as majority shareholder or under the Dwiwarna share to cause us to issue new shares, amend our Articles of Association or bring about actions to merge or dissolve us, increase or decrease our authorized capital or reduce our issued capital, or veto any of these actions. One or more of these may result in the delisting of our securities from certain exchanges. Further, through the MoCI, the Government exercises regulatory power over the Indonesian telecommunications industry.
As of December 31, 2011, the Government had a 14.29% equity stake in PT Indosat Tbk ("Indosat"), our competitor, principally in fixed IDD telecommunications services, and the competitor in cellular services of our majority owned subsidiary, Telkomsel. The Government's stake includes the Series ADwiwarna share which has special voting rights and veto rights over certain strategic matters under Indosat's Articles of Association, including decisions on dissolution, liquidation and bankruptcy, and also permits the Government to nominate one Director to our Board of Directors and one Commissioner to its Board of Commissioners. There may thus be instances where Government interests will conflict with ours. There is no assurance that the Government will not direct opportunities to Indosat or favor Indosat when exercising regulatory power over the Indonesian telecommunications industry. If the Government were to give priority to Indosat’s business over ours or to expand its stake in Indosat, our business, financial condition, and results of operations and prospects could be materially and adversely affected.
-12-
Risks Related to Our Business
Operation Risks
A material failure in the continuing operations of our network, certain key systems, gateways to our network or the networks of other network operators could adversely affect our business, financial condition, results of operations and prospects
We depend to a significant degree on the uninterrupted operation of our network to provide our services. For example, we depend on access to our fixed wireline network (PSTN) for the operation of our fixed-line network and the termination and origination of cellular telephone calls to and from fixed-line telephones, and a significant portion of our cellular and international long-distance call traffic is routed through the PSTN. We also depend on access to a fixed wireless network (CDMA), an internet and broadband network and a cellular network. Our integrated network includes a copper access network, fiber optic access network, BTSs, switching equipment, optical and radio transmission equipment, an IP core network, satellite and application servers.
In addition, we also rely on interconnection to the networks of other telecommunications operators to carry calls and data from our subscribers to the subscribers of operators both within Indonesia and overseas. We also depend on certain technologically sophisticated management information systems and other systems, such as our customer billing system, to enable us to conduct our operations. Our network, including our information systems, IT and infrastructure and the networks of other operators with whom our subscribers interconnect, are vulnerable to damage or interruptions in operation from a variety of sources including earthquake, fire, flood, power loss, equipment failure, network software flaws, transmission cable disruption or similar events.
Although we have a comprehensive BCP and a DRP, that we test and strive to improve we cannot guarantee that the implementation of such plans will be completely or partially successful should any portion of network be severely damaged or interrupted. Any failure that results in an interruption of our operations or of the provision of any service, whether from operational disruption, natural disaster or otherwise, could adversely affect our business, financial condition, results of operations and prospects.
Our networks, particularly our wireline access network, face both potential physical and cybersecurity threats, such as theft, vandalism and acts intended to disrupt operations, which could adversely affect our operating results
Our networks and equipment, particularly our wireline access network, face both potential physical and cybersecurity threats. Physical threats include theft and vandalism of our equipment and organized attacks against key infrastructure intended to disrupt operations. In addition, telecommunications companies worldwide face increasing cybersecurity threats as businesses become increasingly dependent on telecommunications and computer networks and adopt cloud computing technologies. Cybersecurity threats include gaining unauthorized access to our systems or inserting computer viruses or malicious software in our systems to misappropriate consumer data and other sensitive information, corrupt our data or disrupt our operations. Unauthorized access may also be gained through traditional means such as the theft of laptop computers, portable data devices and mobile phones and intelligence gathering on employees with access.
Although we have not experienced a material cyberattack to date, a successful cyberattack may lead us to incur substantial costs to repair damage or restore data, implement substantial organizational changes and training to prevent future similar attacks and lost revenues and litigation costs due to misused sensitive information, and cause substantial reputational damage. We take preventive and remedial measures, including enhanced cooperation with the police, particularly in areas prone to criminal activity and regular upgrades of our data security measures. However, there is no assurance that our physical and cybersecurity measures will be successful. Damage to our network, equipment or data and the need to repair such damage resulting from a physical or cyberattack may materially and adversely affect our business, financial condition and operating results. Our networks, particularly our wireline access network face potential security threats, such as theft or vandalism, which could adversely affect our operating results.
-13-
A revenue leakage might occur due to internal weaknesses or external factors and if this happened it could have an adverse effect on our operating results
A revenue leakage is a generic risk for all telecommunications operators. We may face revenue leakage problems, or problems with collecting all the revenues to which we may be entitled, due to the possibility of weaknesses at the transactional level, delay in transaction processing, dishonest customers or other factors.
We have taken some preventive measures against the possibility of revenue leakage by increasing control functions in all of our existing business process, implementing revenue assurance methods, employing adequate policies and procedures as well as implementing information systems applications to minimize revenue leakages. Nonetheless, there is no assurance that in the future there will be no significant revenue leakages or that any such leakages will not have a material adverse affect on our operating results.
New technologies may adversely affect our ability to remain competitive
The telecommunications industry is characterized by rapid and significant changes in technology. We may face increasing competition due to technologies currently under development or which may be developed in the future. Future development or application of new or alternative technologies, services or standards could require significant changes to our business model, the development of new products, the provision of additional services and substantial new investments by us. New products and services may be expensive to develop and may result in the introduction of additional competitors into the marketplace. We cannot accurately predict how emerging and future technological changes will affect our operations or the competitiveness of our services. Further, we cannot guarantee that we will be able to effectively integrate new technologies into our existing business model.
To maintain and strengthen the growth of our business, we are currently undergoing a transformation to the TIME business. As part of our transformation to a TIME business, we are seeking to develop new businesses through which we also provide content to our telecommunications subscribers. We do not yet have substantial experience as a content provider and, further, we cannot assure you that we will be able to effectively manage the growth of this business.
We cannot assure you that our technologies will not become obsolete, or be subjected to competition from new technologies in the future, or that we will be able to acquire new technologies necessary to compete in changed circumstances on commercially acceptable terms. Our failure to react to rapid technological changes could adversely affect our business, financial condition, results of operations and prospects.
Our satellites have limited operational life they may be damaged or destroyed during in-orbit operation. The loss or reduced performance of our satellites, whether caused by equipment failure or its license being revoked, may adversely affect our financial condition, results of operations and ability to provide certain services
Our Telkom-1 and Telkom-2 satellites have a limited operational life, currently estimated to end in 2015 and 2020, respectively. A number of factors affect the operational lives of satellites, including the quality of their construction, the durability of their systems, subsystems and component parts, on-board fuel reserves, accuracy of their launch into orbit, exposure to micrometeorite storms, or other natural events in space, collision with orbital debris, or the manner in which the satellite is monitored and operated. We currently use satellite transponder capacity on our satellites in connection with many aspects of our business, including direct leasing of such capacity and routing for our international long-distance and cellular services.
Moreover, International Telecommunication Union (“ITU”) regulations specify that a designated satellite slot has been allocated for Indonesia, and the Government has the right to determine which party is licensed to use such slot. While we currently hold a license to use the designated satellite slot, in the event our Telkom-1 and Telkom-2 satellites experience technical problems or failure, the Government may determine that we have failed to optimize the existing slot under our license, which may result in the Government withdrawing our license. We cannot assure you that we will be able to maintain use of the designated satellite slot in a manner deemed satisfactory by the Government.
We are in the process of developing the Telkom-3 satellite, which has a 15-year lifespan and higher transponder capacity, and which is scheduled to be launched in the second quarter 2012. Should we fail to launch Telkom-3 on time or at all, or if it fails leasing transponder capacity from a third party would likely increase our costs of operations and might result in service interruptions.
-14-
We maintain in-orbit insurance on our Telkom-1 and Telkom-2 satellites on terms and conditions consistent with industry practice. If damage or failure renders our satellites unfit for use and we fail to launch Telkom-3, we may elect to cease our satellite operations or lease transponder capacity from a third-party provider rather than launching a new satellite. The termination of our satellite business could increase expenses associated with our provision of other telecommunications services, particularly in the eastern parts of Indonesia which currently rely largely on satellite coverage for telecommunications services, and could adversely affect our business, financial condition and results of operations.
We face a number of risks relating to our internet-related services
We currently provide a range of internet-related services, including dial-up and broadband internet access, and internet-related applications. We face a number of risks in providing these services.
Our network may be vulnerable to unauthorized access, computer viruses, organized cyber security threats and other disruptive problems. See “Our networks, particularly our wireline access network, face both potential physical and cybersecurity threats, such as theft, vandalism and acts intended to disrupt operations, which could adversely affect our operating results.”
In addition, because we provide connections to the internet and host websites for customers and develop internet content and applications, we may be perceived as being associated with the content carried over our network or displayed on websites that we host. We cannot and do not screen all of this content and may face litigation claims due to a perceived association with this content. Based on our experience, these types of claims can be costly to defend, divert management resources and attention, and may damage our reputation.
Financial Risks
We are exposed to interest rate risk
Our debt includes bank borrowings to finance our operations. Where appropriate, we seek to minimize our interest rate risk exposure by entering into interest rate swap contracts to swap floating interest rates for fixed interest rates over the duration of certain of our borrowings. However, our hedging policy may not adequately cover our exposure to interest rate fluctuations and this may result in a large interest expense and an adverse effect on our business, financial condition and results of operations.
We may not be able to successfully manage our foreign currency exchange risk
Changes in exchange rates have affected and may continue to affect our financial condition and results of operations. Most of our debt obligations are denominated in Indonesian Rupiah and a majority of our capital expenditures are denominated inUS Dollars. Most of our revenues are denominated in Indonesian Rupiah and a portion is denominated inUS Dollars (for example from international services). We may also incur additional long-term indebtedness in currencies other than the Indonesian Rupiah, including theUS Dollars, to finance further capital expenditures.
We use a hedging policy to protect our business from extreme currency exchange risk, based on annual net open positions in foreign currency. The implementation of our hedging policy is reviewed monthly to anticipate extreme changes in currency exchange rates.
Although the exchange rate of the Indonesian Rupiah to theUS Dollar was relatively stable in 2011 at the level of Rp9,000 perUS Dollar, we can give no assurance you that we will be able to manage our exchange rate risk successfully in the future or that our business, financial condition or results of operations will not be adversely affected by our exposure to exchange rate risk.
-15-
We may be unable to fund the capital expenditures needed for us to remain competitive in the telecommunications industry in Indonesia
The delivery of telecommunications services is capital intensive. In order to be competitive, we must continually expand, modernize and update our telecommunications infrastructure technology, which involves substantial capital investment. For the years ended December 31, 2009, 2010 and 2011, our actual consolidated capital expenditures totaled Rp19,161 billion, Rp12,651 billion and Rp14,603 billion (US$1,610 million), respectively. During 2012, we intend to allocate Rp18,871 billionto optimize our legacy fixed wireline business, new wave, infrastructure and support programs. Our ability to fund capital expenditures in the future will depend on our future operating performance, which is subject to prevailing economic conditions, levels of interest rates and financial, business and other factors, many of which are beyond our control, and upon our ability to obtain additional external financing. We cannot assure you that additional financing will be available to us on commercially acceptable terms, or at all. In addition, we can only incur additional financing in compliance with the terms of our debt agreements. Accordingly, we cannot assure you that we will have sufficient capital resources to improve or expand our telecommunications infrastructure technology or update our other technology to the extent necessary to remain competitive in the Indonesian telecommunications market. Our failure to do so could have a material adverse effect on our business, financial condition, results of operations and prospects.
Legal and Compliance Risks
If we are found liable for price fixing by the Indonesian Anti-Monopoly Committee and for class action allegations, we may be subject to substantial liability which could lead to a decrease in our revenue and affect our business, reputation and profitability
On November 1, 2007, the Indonesian Supervising Committee for Business Competition (the “KPPU”) issued a preliminary decision regarding an investigation involving us, our majority-owned subsidiary Telkomsel and seven other telecommunication companies based on allegations of price-fixing for SMS services and breach of Article 5 of the Anti-monopoly Law (“Law No. 5 / 1999”). On June 18, 2008, the KPPU determined that the Company, Telkomsel, XL Axiata Tbk (“XL”), PT Bakrie Telecom Tbk (“Bakrie Telecom”), PT Mobile-8 Telecom Tbk (now Smartfren) (“Mobile-8”) and PT Smart Telecom (“Smart Telecom”) had jointly breached Article 5 of Law No. 5/1999. Mobile-8 appealed this ruling to the Central Jakarta District Court, where XL, Indosat, PT Hutchison CP Telecommunication (“Hutchison”), Bakrie Telecom, Smart Telecom, PT Natrindo Telepon Selular (“Natrindo”) and our Company were summoned to appear as additional parties to be bound by the proceedings, while the Company and Telkomsel appealed the KPPU’s ruling to the Bandung District Court and the South Jakarta District Court respectively. On April 11, 2011, the Supreme Court (“SC”) ordered a consolidation of the appeals and appointed the Central Jakarta District Court to handle the appeals. See “Item 8. Financial Information–Consolidated Statements and Other Financial Information–Material Litigation”The Central Jakarta District Court will consider objections against the KPPU decision based on a re-examination of the KPPU decision and case files submitted by KPPU but we cannot assure you that the KPPU decision will be overturned. If the District Court issues a verdict against the Company and/or Telkomsel, we could be subjected to the payment of a fine, the amount of which will be subject to the discretion of the District Court, which could have an adverse effect on our business, reputation and profitability.
Class action lawsuits were filed against Telkomsel and Indosat during 2007 and 2008 in the District Court of Bekasi, the Central Jakarta District Court and the Tangerang District Court, relating to Temasek Holding’s prior cross ownership of shares in Telkomsel and Indosat, alleging price fixing of telecommunications services. The plaintiffs withdrew the lawsuit filed with the District Court of Bekasi. On January 27, 2010, the court dismissed the class action filed with the Central Jakarta District Court on the basis that the plaintiffs did not establish their legal standing and that two members of the plaintiff class did not qualify as class representatives. On May 24, 2010, the court dismissed the class action filed with the Tangerang District Court on the basis that the plaintiffs failed to establish their legal standing as class representatives. There can be no assurances that other subscribers will not file similar cases in the future. If a District Court, in any new class action suit, issues a verdict in favor of such plaintiffs, it could have an adverse effect on our business, reputation and profitability.
-16-
Forward-looking statements may not be accurate
This Annual Report incorporates forward-looking statements that include announcements regarding our current goals and projections of our operational performance and future business prospects. The words “believe”, “expect”, “anticipate”, “estimate”, “project” and similar words identify forward-looking statements. In addition, all statements, other than statements that contain historical facts, are forward-looking statements. While we believe that the expectations contained in these statements are reasonable, we cannot give an assurance that they will be realized. These forward-looking statements are subject to a number of risks and uncertainties, including changes in the economic, social and political situation in Indonesia and other risks described in "Risk Factors". All forward-looking statements, written or verbal, made by us or by persons on behalf of us are deemed to be subject to those risks.
Regulation Risks
We operate in a legal and regulatory environment that is undergoing significant change. These changes may result in increased competition, which may result in reduced margins and operating revenue, among other things. These changes may also directly reduce our margins or reduce the costs of our competitors. These adverse changes resulting from regulation may have a material adverse effect on us
Reforms in Indonesian telecommunications regulation initiated by the Government in 1999 have to a certain extent resulted in the industry’s liberalization including removal of barriers to entry and the promotion of competition. However, in recent years, the volume and complexity of regulatory changes has created an environment of considerable regulatory uncertainty. In addition, as the legal and regulatory environment of the Indonesian telecommunications sector continues to change, competitors, potentially with greater resources than us, may enter the Indonesian telecommunications sector and compete with us in providing telecommunications services. Further, it is impossible to anticipate the regulatory policies that will be applied to new technologies.
We derive substantial revenue from interconnection services because we have the largest network in Indonesia and our competitors must pay tariffs to connect to our network. The Government, through the Ministry of Communication and Information (“MoCI”), has regulated these tariffs since 2007 and presently sets tariffs based on certain specified "costs” reported by ourselves and Telkomsel as dominant service providers, with corresponding cellular network “costs” from Indosat used for comparison. As regulated by the MoCI, interconnection rates have decreased in recent years. The current interconnection rates, effective in 2011, reduced rates by an average of 1.5% to 3.0% compared to the previous rates effective in 2008. See “Item 4. Information on the Company–Regulations–Interconnection.”
To cite another example, in 2008, the Government required telecommunications operators to allow competitors to utilize their towers without discrimination. Our competitors enjoy disproportionately greater potential cost savings than ours under this regulation because we have the largest network and have already spent to build towers in various areas. Further, our competitors gain access to areas they otherwise would have no access to because tower sites in densely populated urban areas are scarce or unavailable while we benefit substantially less because we secured sites in many such areas. See “Item 4. Information on the Company–Regulations–Telecommunications Towers”.
In the future, the Government may announce or implement other regulatory changes which may adversely affect our business or our existing licenses. We cannot assure you that we will be able to compete successfully with other domestic and foreign telecommunications operators, that regulatory changes will not disproportionately reduce our competitors’ costs or disproportionately reduce our revenues, or that regulatory changes, amendments or interpretations of current or future laws and regulations promulgated by the Government will not have a material adverse effect on our business and operating results.
The Government suspension of premium SMS services could adversely affect the revenues from our cellular phone services and result in sanctions against us
Telkomsel, our majority owned subsidiary which operates our cellular phone services, derived substantial revenues from premium SMS services in previous years. These services include the delivery of music and ringtones, smartphone wallpapers and other graphics, voting in contests and polls and content including horoscopes, Qur’an quotes and news alerts. In 2011, the Indonesia Telecommunication Regulatory Body (ITRB) asked telecommunications companies to deactivate premium SMS services and give users a notice of the deactivations with the option to resubscribe. These companies were also asked to cease promoting premium SMS services until further notice, summarize premium SMS service charges for users and return amounts deducted from them for premium SMS services, and report weekly to ITRB regarding action taken. The ITRB based its action on complaints from consumers that they were charged for services for which they were not aware they had or inadvertently subscribed and from which they had substantial difficulty unsubscribing. Other consumers complained that charges were unclear and difficult to monitor, particularly consumers of prepaid services. The ITRB has clarified that it does not intend to prohibit premium SMS services but to effectively reset such services and give consumers the option to deregister from these. MoCI has expressed support for the ITRB’s action.
-17-
Table of Content
The disruption to Telkomsel’s premium SMS services due to the ITRB’s action has resulted in a substantial reduction of our revenues from these services. Similar action by the ITRB or MoCI in the future may likewise reduce or restrict the growth of Telkomsel’s revenues from these services or other related or new products. The ITRB or MoCI may also take more aggressive action that may lead to disruptions in the delivery of Telkomsel’s products or fines or other administrative sanctions. Any of these factors may materially and adversely affect our results of operations and financial condition.
The entry of additional Indonesian telecommunications operators as providers of international direct dialing services could adversely affect our international telecommunications services operating margins, market share and results of operations
Our Company obtained a license and entered the international long-distance service market in 2004, and acquired a significant market share for IDD services by the end of 2006. Indosat, one of our primary competitors, entered this market prior to us and continues to maintain a substantial market share for IDD services.Bakrie Telecom was awarded an IDD license in 2009 to provide international long distance service using the 009 access code, although Bakrie Telecom has not yet obtained an IDD operating license. It is expected that XL Axiata and Axis will be granted IDD licenses in 2012. The operations of incumbents and the entrance of new operators into the international long-distance market, including the VoIP services provided by such operators, continue to pose a significant competitive threat to us. We cannot assure you that such adverse effects will not continue or that such increased competition will not continue to erode our market share or adversely affect our fixed telecommunications services operating margins and results of operations
We face risks related to the opening of new long distance access codes
In an attempt to liberalize DLD services, the Government issued regulations assigning each provider of DLD services a three-digit access code to be dialed by customers making DLD calls. In 2005, the MoCI announced that three-digit access codes for DLD calls will be implemented gradually within five years and that it would assign us the “017” DLD access code for five major cities, including Jakarta, and allow us to progressively extend it to all other area codes. Indosat was assigned “011” as its DLD access code. We were required to open DLD access codes in all remaining areas on September 27, 2011.
We do not believe that any of our competitors presently implement the “01X” DLD access codes. The implementation of any new DLD access codes can potentially increase competition by offering our subscribers more options for DLD services. In addition, the opening of new DLD access codes is expected to result in increased competition and less cooperation among industry incumbents, which may result in reduced margins and revenues, among other things, all of which may have a material adverse effect on us. We cannot assure you that our access codes will remain intact or be successful in increasing our revenues from DLD services.
New regulations for the configuration of BTS towers may delay the setting up of new BTS towers or changes in the placement of existing towers, and may erode our leadership position by requiring us to share our towers with our competitors
In 2008 and 2009, the Government issued regulations relating to the construction, utilization and sharing of BTS towers. Pursuant to the regulations, the construction of BTS towers requires permits from the local Government. The local government has a right to determine the placement of the towers, the location in which the towers can be constructed, and also to determine a license fees to build tower infrastructure. These regulations also obligate us to allow other telecommunication operators to lease space and utilize our telecommunications towers without any discrimination.
These regulations may adversely affect in the allocation, development or expansion plan of our new BTS towers as setting up of our new towers will become more complicated. They may also adversely affect our existing BTS towers if local Governments required any changes in the placement of the existing towers.
The requirement that we share space on our cellular (Telkomsel) towers and our fixed wireless (Telkom Flexi) towers may also disadvantage us by requiring that we allow our competitors to expand quickly, particularly in urban areas where new space for additional towers may be difficult to obtain.
Effective 2011, local Governments are permitted to assess fees of up to 2.0% of the tax assessed value of towers. Although we do not expect the amount of these fees to be material in 2012, there can be no assurance that they will not be substantial in the future.
-18-
Competition Risks Related to Our Fixed Telecommunication Business
We may further lose wireline telephone subscribers and revenues derived from our wireline voice services may continue to decline, which may materially adversely affect our results of operations, financial condition and prospects
We continued to lose wireline telephone subscribers and revenues derived from our wireline voice services continued to decline during the past several years mainly due to the increasing popularity of mobile voice services and other alternative means of communication, such as VoIP. Tariffs for mobile services have declined in recent years which has further accelerated substitution of mobile for wireline voice services. The number of our fixed wireline subscribers decreased by 0.9% at the end of 2010 compared to that at the end of 2009 and increased by 3.6% at the end of 2011. Revenues from our wireline voice services increased by 3.2% in 2010 compared to that in 2009 and decreased by 6.5% in 2011. The percentage of revenues derived from our wireline voice services out of our total revenues continued to decrease, from 16.0% in 2010 to 14.4% in 2011.
We have been taking various measures in order to mitigate the impact of loss of our wireline telephone subscribers and stabilize our revenues from wireline voice services. However, we cannot assure you that we will be successful in mitigating the adverse impact of the substitution of mobile voice services and other alternative means of communication for wireline voice services or in reducing the rate of decline in our revenues generated from wireline voice services. Migration from wireline voice services to mobile services and other alternative means of communication may further intensify in the future, which may affect the financial performance of our wireline voice services and thus materially and adversely affect our results of operations, financial condition and prospects as a whole.
Our fixed wireless business is subject to intense competition
Our fixed wireless telephone business faces competition from an increasing number of operators, including Bakrie Telecom and Indosat, as well as mobile cellular services, SMS, VoIP services and e-mail. In addition, there is currently no new frequency bandwidth available from the Government for the expansion of our fixed wireless telephone business, and in densely populated areas, our current fixed wireless operations use substantially all of the available frequency bandwidth that we have been allocated.
Competition in the cellular and fixed wireless markets has remained intense, with each operator launching increasingly attractive and creative marketing programs. The lower average tariffs due to intense competition in the cellular market has in part lead to declining ARPU for Telkom Flexi, with blended monthly ARPU decreasing from approximately Rp22,000 in 2009, Rp15,000 in 2010, and Rp9,500 in 2011.
We have been taking various measures in order to mitigate the impact of intense competition in our fixed wireless business and the limited capacity of bandwidth. However, we cannot assure you that we will be successful in mitigating the adverse impact. Competition may further intensify in the future, which may affect the financial performance of our fixed wireless services and thus materially and adversely affect our results of operations, financial condition and prospects as a whole.
Our data and internet services are facing increasing competition, and we may experience declining margins from such services as such competitionintensifies
Our data and internet services are facing increase competition from other data and internet operators as well as mobile operators.
Wireless broadband access operators (such as First Media) that received licenses in 2009 for Wi-Max technology began to establish their businesses in the fourth quarter of 2010. Other wireless broadband operators established their businessesin 2012. The increased number of operators will adversely affect our market share and revenues from our Speedy broadband service.
The number of broadband mobile subscribers has increased with the Blackberry’s popularity. The increasing use of mobile broadband services also adversely affects our market share and revenues from our fixed data and internet services.
We have been taking various measures in order to mitigate the impact of intense competition in our data and internet businesses. However, we cannot assure you that we will be successful in mitigating such adverse impact. Competition may further intensify in the future, which may affect the financial performance of our data and internet services and thus materially and adversely affect our results of operations, financial condition and prospects as a whole
-19-
Competition Risks Related to our Cellular Business (Telkomsel)
Competition from existing service providers and new market entrants may adversely affect our cellular services business
The Indonesian cellular services business is highly competitive. Competition among cellular services providers in Indonesia is based on various factors, including pricing, network quality and coverage, the range of services, features offered and customer service. Our cellular services business, operated through our majority-owned subsidiary Telkomsel, competes primarily against Indosat and XL. Several other smaller GSM and CDMA operators also provide cellular services in Indonesia, including Hutchison, Natrindo, Smart Telecom and Bakrie Telecom. In addition to current cellular service providers, the MoCI may license additional cellular service providers in the future, and such new entrants may compete with us.
We believe that competition in the cellular services business will intensify further. New and existing cellular services providers may offer more attractive product and service packages or new technologies or the convergence of various telecommunications services, resulting in higher churn rates, lower ARPU or a reduction of, or slower growth in, our cellular subscriber base.
The competitive landscape in the cellular services business may also be affected by industry consolidation. In March 2010, Smart Telecom and Mobile-8 announced that they had entered into a cooperation agreement to use the same logo and brand under the name “smartfren.” On January 18, 2011, Mobile-8 acquired a significant number of shares in Smart Telecom, and on April 12, 2011 PT Mobile-8 Telecom, Tbk changed its name to PT Smartfren Telecom, Tbk, Other cellular service providers may similarly consolidate in the future.
Competition from providers of new technology, together with new entrants, incumbents, and consolidated providers could adversely affect our competitive position, cellular services business, financial condition, results of operations and prospects.
ITEM 4. INFORMATION ON THE COMPANY
A. HISTORY AND DEVELOPMENT OF THE COMPANY
PT Telekomunikasi Indonesia Tbk., a company with limited liability incorporated under the laws of Indonesia and domiciled in Bandung Municipality, trades under the commercial name "Telkom". Telkom, in its current form, was established (converted from a state agency to a state-owned enterprise) on September 24, 1991 and obtained legal entity status on 19 November 1991 for an indefinite period of time. Our registered office is located at Jalan Japati No. 1, Bandung 40133, Indonesia, and our telephone number is +(62-21) 5215 109. Our agent for service of process in the United States with respect to our ADSs is Puglisi & Associate at 850 Library Avenue, Suite 204, Newark, DE, 19711. Our corporate website may be accessed through the URL www.telkom.co.id. The information found on our corporate website does not form part of this Form 20-F and is not incorporated by reference herein. Information about the legislation under which we operate is provided elsewhere in this Form 20-F. Adescription, including the amount invested, of our principal capital expenditures and divestitures (including interests in other companies), since the beginning of our last three financial years and information concerning our principal capital expenditures is contained elsewhere in this Form 20-F.
-20-
Table of Content
We are a state-owned enterprise that operates in the telecommunications and network services sector in Indonesia. Our history and certain information required by Item 4 of Form 20-F is contained in the chart, below.
A Brief History of Telkom
1856-1882 | | 1906-1965 | | 1974 | | 1980 |
On October 23, 1856, the Dutch colonial government deployed the first electromagnetic telegraph in Indonesia, connecting Batavia (Jakarta) with Buitenzorg (Bogor). | | The Dutch colonial government established a government agency to operate post and telecommunications services in Indonesia. In 1965, the post and telecommunications services were separated and brought under the control of two state companies, PN Pos dan Giro and PN Telekomunikasi. | | PN Telekomunikasi was split into two divisions, PT Industri Telekomunikasi Indonesia (“PT INTI”), which manufactured Telecommunications equipment, and Perusahaan Umum Telekomunikasi (Perumtel), which supplied domestic and international telecommunication services. | | The international telecommunication business was taken over by Indosat |
1991 | | 1995 | | 1999 | | 2001 |
PERUMTEL became PT Telekomunikasi Indonesia or Telkom, and operations were organized into twelve regional units (Witel). These were later reorganized into seven regional divisions: Division I Sumatra, Division II Jakarta and Surrounding Area, Division III West Java, Division IV Central Java and DI Yogyakarta, Division V East Java, Division VI Kalimantan and Division VII Eastern Indonesia. | | Telkomheld its Initial Public Offering on November 14, 1995 on the Jakarta Stock Exchange and the Surabaya Stock Exchange. On May 26, 1995, Telkom established Telkomsel, its cellular business subsidiary. | | The Telecommunications Law (Law No. 36/1999), which went into effect in September 2000, facilitated the entry of new players, intensifying the competition in the telecommunications industry. | | Telkomacquired 35.0% of Indosat’s shares in Telkomsel, making it the majority shareholder with a stake of 77.7%. Indosat then took over 22.5% of Telkom’s shares in Satelindo and 37.7% of its shares in PT Lintasarta Aplikanusa. At the same time, Telkom lost its exclusive right to be the sole fixed line telephone operator in Indonesia. |
2002 | | 2004 | | 2005 | | 2009 |
Telkom divested 12.7% of its shares in Telkomsel to Singapore Telecom Mobile Pte Ltd (“SingTel Mobile”). | | Telkom launched its international direct dial fixed line service. | | The Telkom-2 Satellite was launched to replace all satellite transmission services previously provided by the Palapa B-4 satellite. This brought the total number of satellites launched by Telkom to eight, including the Palapa A-1 satellite. | | Telkom underwent a transformation from an Infocomm company to a TIME player. The new Telkom was introduced to the public with the new corporate logo and tagline, ‘the world in your hand’. |
2010 | | 2011 | | | | |
The JaKaLaDeMa submarine and fiber optic cable project linking Java, Kalimantan, Sulawesi, Denpasar and Mataram was successfully completed in April 2010. | | The reform of our telecommunications infrastructure through the Telkom Nusantara Super Highway project, which unites the archipelago from Sumatra to Papua, and the True Broadband Access project, will enable customers all over Indonesia to access the internet at capacities of 20 - 100 Mbps. | | | | |
B. BUSINESS OVERVIEW
We are a State-Owned Enterprise and the largest telecommunication and network services provider in Indonesia. Serving millions of customers nationwide, we provide a strong portfolio of information and communication services, including fixed wireline and fixed wireless telephone, mobile cellular, network and interconnection services and data and internet services, revenue sharing arrangement directly or through our subsidiaries. For the years ended December 31, 2010 and 2011, our revenues totaled Rp68,529 billion and Rp71,238 billion (US$7,856 million), respectively.
The fixed wireline segment provides local, domestic long distance (“DLD”), international telephone services, and other telecommunications services (including leased lines, telex, transponder, satellite and very small aperture terminal, or VSAT) as well as ancillary services. Our fixed wireless segment provides local and domestic long distance CDMA based services as well as other telecommunications services. Our cellular segment provides mobile cellular telecommunications services. Any operating segment that does not represent more than 10% of our revenues is presented as “others” and such segments include telephone directory production and our building management businesses. In 2011, other than interconnection customers and Government departments and agencies, no single customer accounted for more than 1% of our total revenues. Our business does not experience significant seasonality.
-21-
The execution of our strategic initiatives, which are based on the relationship between our business strategies and business portfolio are described below:
1. Telecommunications Business Portfolio
The Telkom Group’s telecommunications business portfolio comprises Plain Ordinary Telephone Systems (“POTS”), which covers both local and long distance calls, fixed wireless connections consisting of voice, SMS and data network package (“DNP”), cellular voice and SMS services, international direct dialing (“IDD”), broadband services (mobile and fixed), and network and tower services.
a. Fixed Wireline Services
Our fixed wireline services include POTS, VAS fixed wireline, intelligent network (“IN”) services and session initiation protocol (“SIP”) services. After experiencing a decline, in 2011, we successfully improved the performance of this business by launching a number of new programs, such as “Telkom Poin Rejeki Tumpah” reward points and the fixed business improvement program (“FBIP”).
We serve 8.6 million customers, representing a market share of 99.0% of the total fixed wireline market penetration in Indonesia of 4.0% as of December 31, 2011.
b. Broadband and Internet Services
These services are offered through a range of product lines, including TelkomNet instan, FlexiNet, wholesale port, Metro I-net, Astinet, broadband internet under the Speedy and Flash brand names, WiFi hotspots and IP transit. TelkomNet Instan is a premium postpaid internet access service that is accessible in all cities in Indonesia. In 2011 there were 40.2 thousand TelkomNet Instant customers, a decrease of 60.9% from the previous year as these were largely new internet customers who are expected to migrate to our TelkomSpeedy broadband service.
Our broadband internet access is provided through our existing copper cables using ADSL technology. Telkom’s substantial presence in the broadband market in Indonesia is indicated by our 12.9 million customers. Data, internet and IT services contributed33.6% to our total revenue as of December 31, 2011.
In 2011 we launched our Flexi Hotspot service that delivers high speed internet access through a wireless internet connection, supported by our Telkom Hotspot infrastructure. Subscribers can access this service, which is available in Hotspot areas, using any device equipped with a WiFi connection simply by entering their FlexiNet Unlimited or Flexi Mobile Broadband username and password.
We offer low-cost international calls through our premium VoIP service, “TelkomGlobal-01017”, while standard international calls are available through “TelkomSave”. Both services are accessed by dialing a special access prefix. We cooperate with eight global carriers, all of which are wholesalers that allow us access to their international networks. Of these eight carriers, four are for outgoing calls, one is for incoming calls and three are for both outgoing and incoming calls.
In 2011, a total of 358.6 million minutes of outgoing calls (using TelkomSave and TelkomGlobal-01017) and incoming VoIP calls (from our global partners) were used. This represents an increase of 47.4 million minutes, or 15.2% in VoIP calls compared to 2010.
The table below shows information about our VoIP services:
Item | | TelkomGlobal-01017 | | TelkomSave |
Dial | | One Stage | | Two Stages |
Quality/Technology | | Premium VoIP | | Standard VoIP |
c. Cellular Services
In 2011, Telkomsel introduced a number of marketing programs that focused on new features in our cellular services. These programs strengthened our position in Indonesia’s cellular telecommunications industry, with Telkomsel’s customer base growing from94.0million subscribers at the end of 2010 to 107.0million subscribers at the end of 2011, an increase of 13.8% or13.0million subscribers. Telkomsel’s new features in 2011 were as follows:
-22-
Cellular Programs | | Descriptions |
Kartu As Rp0/minutes | | In January 2011, Telkomsel extended the Kartu As promotion of Rp0/minutes for the first 30 seconds. This promotion offers a special tariff of Rp0 for the first 30 seconds and then Rp20 per 60 seconds between 00:00-16:59 for new customers who have activated their starter packs since December 22, 2010. Customers also receive an additional 5,000 SMS to all operators, Facebook and chatting. |
Flash Unlimited | | A Rp50,000 Flash Unlimited broadband package was launched in February 2011. Users who activated their Flash Unlimited starter pack between February 10 and June 30, 2011 were able to access 300-800 MB of data, with a maximum access speed of 384 Kbps, valid for 30 days. |
simPATI Gratis Nelpon Berjam-jam | | A new pulse free package forsimPATI Freedom was launched in March 2011. ThesimPATI Gratis Nelpon Berjam-jam package is for customers who activate their starter packs as of March 10, 2011, and after being charged for one minute (cumulative) to any Telkomsel number, customers can make free calls from 00:00-05:59 and 06:00 – 10:59. |
simPATIDouble TalkMania | | A new version of thesimPATI Double TalkMania program was launched in March 2011. For a daily registration fee of Rp2,000 (01:00-18:00) or Rp3,000 (17:00-24:00), this program offers 50-100 minutes of calls and an additional 100 minutes of calls. The additional 100 minutes are given the day after registration and can be used between 00:00 and 06:00. |
Flash Midnight Sale | | In April 2011, the Flash Midnight Sale promo was launched for Flash,simPATI and Kartu As users, allowing them to choose from unlimited internet access packages worth Rp25,000 and Rp Rp50,000 for usage at night between 00:00 and 05:59 with an access speed of 2 Mbps, valid for 30 days. |
Kartu As Ozone | | The Kartu As Ozone modified the Kartu As Rp0 promotion in April 2011, offering tariff segmentation with same eight regions as before but different four time bands (except Papua and Maluku). A Rp0 tariff is offered for the first 30 seconds and Rp20/minutes thereafter up to 30 minutes in the 00:00-05:59 and 06:00-10:59 time bands (except Sulawesi & East Nusa Tenggara and Papua & Maluku). Different tariff calculation also applies for each region in the 11:00-16:59 and 17:00-23:59 time bands. Special SMS tariffs are also available in the promotion. |
Unlimited Data & BlackBerry Roaming | | Unlimited Data Roaming & Unlimited BlackBerry Roaming Programs were launched in May 2011, offering special tariffs for general packet radio service (“GPRS”) roaming in 38 countries through a cooperation with 54 operators on 5 continents. |
Speedy Flash | | Telkomsel and Telkom jointly launched a Speedy Flash promo package in May 2011, using DSL and HSDPA/UMTS/EDGE/GPRS technology for their internet connections. |
HALOTalk | | TheHALOTalkprogram was launched in June 2011 forkartuHALO postpaid subscribers with a daily charge for on-net calls (ARPU) of less than Rp15,000. At the same time, the Halo Cek (CLS) feature was activated. This program offers price packages ranging from Rp1,000 to Rp15,000 with an additional 10-150 minutes of calls to any Telkomsel number (local & non-local) until 23:59 every day. |
Telkomsel Tap Izy | | Telkomsel’s Tap Izy promo was launched in July 2011 as an innovative T-Cash (mobile payment) service that uses contact-less technology with Radio Frequency Identification (“RFID”) for secure transaction security. By connecting a cellular device equipped with a chip inserted into the SIM card (kartuHALO &simPATI) with a terminal reader device, customers can make transactions securely. The RF-SIM card is available for Rp50.000 at GraPARI outlets. Cash payments or deposits of Rp25,000 to Rp1,000,000 can also be made at GraPARI outlets or Indomaret stores. |
Kartu AsBonus 60 Minutes | | A Rp1,000 promo package was launched in July 2011 for all Kartu As users with a tariff of Rp0 (and Ozone) except for customers in East Nusa Tenggara, Maluku & Papua. This promo also offered 60 minutes of free calls for all Telkomsel’s subscribers. |
Kartu AsExtra Ampuh | | New package with new tariff scheme from Kartu As that launched in August 2011. It offers tariff segmentation with seven zones and is valid for 24 hours. 300 minutes bonus talk is provided after having chargeable calls at Rp25/second (except Sulawesi). Bonus 1,000 SMS to all operators after sending chargeable SMS at Rp150/SMS are also available. |
Kartu AsBonbAStis | | New promotion for Kartu As users with Rp0 tariff scheme that launched in September 2011. Customers will earn cashback usage bonus through pulse after having on-network usage (voice or SMS). |
Telkomsel Skype Go Mobile | | Unlimited data package Skype to Skype Call & Chat service for all Telkomsel’s customers, launched in October 2011. It is available by downloading the official application at http://m.skype.com and registering through *363# or SMS “SKYPE” to 3636. There are 24 types of mobile phone that are enabled for this service. |
simPATI Bonus Surprise | | New promotion in November 2011 for allsimPATIusers with 100 MB internet access and 100 minutes on-network call bonus after having recharge/top-up at minimum Rp10,000. |
Facebook SIM Card | | New prepaid starter pack worth Rp3,000 was launched in December 2011, offering easy access to Facebook from handsets with preloaded bonus at Rp3,000 of pulses, a 10MB data package and free access to http://m.facebook.com. |
Kartu As 30 Hours Bonus Talk | | New promotion for Kartu As users was launched in December 2011, for use within a period of offering bonus conversation to be used within 30 hours (on-network) and thousands of bonus SMS after reach a certain level of accumulated usage. |
simPATI Puas 2 | | ThesimPATI Puas2 promo launched in December 2011 offers an attractive package of calls, SMS and internet access. |
-23-
d. Fixed Wireless Services
This service uses limited mobility CDMA technology. We offer these services under the “Telkom Flexi” and “Flexi” brands. We have created a separate business unit, the Telkom Flexi Division (“DTF”), to manage this segment.
In 2011, we launched several new fixed wireless products and services, which are described below:
Flexi’s Programs | | Descriptions |
Flexi Bebas Bicara | | This program ran from February 2011 to December 2011. Offering free local and long distance calls (Clear Channel & 01017) to other Flexi users in the Jabodetabek-Sekapur-Banten area, it was later extended to other areas in Indonesia. This program offered different program advantages in different areas. |
Flexi Mobile Broadband | | Launched in October 2011, this program offered EVDO based internet access initially in seven cities (Medan, Pekanbaru, Jakarta, Bandung, Denpasar, Banjarmasin and Makassar). It was later extended to Yogyakarta, Surabaya and Malang. |
EVDO Package | Promo | Get | Set | Go |
Speed (up to) | (1,200 KBps) | (300 KBps) | (600 KBps) | (1,200 KBps) |
Daily | Tariff | 2,500 | 2,500 | 5,000 | 8,000 |
| FUP (MB) | 500 | 500 | 750 | 1,000 |
Weekly | Tariff | 15,000 | 15,000 | 30,000 | 45,000 |
| FUP (MB) | 1,000 | 1,000 | 1,600 | 2,000 |
Monthly | Tariff | 50,000 | 50,000 | 80,000 | 120,000 |
| FUP (MB) | 3,000 | 3,000 | 4,000 | 5,000 |
|
Flexi Android | | This program was launched as part of a package joining Flexi and an Android-based smartphone and is used to access Flexi Mobile Broadband. Customers can obtain various program advantages such as Free Flexi Mobile Broadband for one month, and 100 minutes of local F2F Free Voice and long distance 01017 for 30 days with the purchase of a Flexi Android ZTE Blade handset package. |
Flexi Market | | This is an online apps store offering various applications for Android-based Flexi devices. Features include: - Online Application Store offering Applications, Games, Music, Books, and others. - Online Transactions, which enables Flexi users to download or purchase applicationsfrom Flexi Market directly from their Flexi handsets. - �� Direct Billing Capability, which allows Flexi users to pay for the applications they purchase from Flexi Market online by debiting pulses for prepaid customers or billing postpaid customers. - Advertisement Platform, will allows advertisers to advertise on the top banner of a Flexi Market page. - 3rd Party & Community Support, which is open to Content Providers (CPs) and the developer community using the Google Android Interface Programming Application and an easy integration process. - - Download and Sales Statistics, which enables developers and CPs who are members of Flexi Market to track their performance through statistics that can be downloaded online, and to find out and bill the revenues they are entitled to online. |
Going forward, we remain committed to continuing improve the performance of Telkom Flexi to make it the leader in the fixed wireless business, for example by capitalizing on the synergies with our other products and services, entering into strategic partnerships and exploring options for mergers with other fixed wireless operators to grow our market share. We expect these synergies to make an increasing contribution to our revenues.
-24-
e. Interconnection Services
As the leading telecommunications operator in Indonesia, we receive revenue from our competitors that use our network.
Following the implementation of the cost-based interconnection scheme, in December 2006 we entered into new interconnection agreements with other domestic operators. These new agreements address the requirements of Telkom’s RIO.
On February 5, 2008, the Government issued a regulation governing tariff adjustments to the cost-based interconnection regime introduced on January 1, 2007. This regulation required Telkom and Telkomsel, along with 10 other telecommunications operators in Indonesia, to align their interconnection charges with those imposed by the new regime by April 1, 2008. On April 11, 2008, the Government approved RIOs from the dominant operators (those controlling more than 25% of the market), including Telkom and Telkomsel, as the reference for determining cost-based interconnection tariffs.
In a press release issued on December 30, 2010, the Government stipulated that telecommunications operators should apply the results of their interconnection tariff calculations for 2011 effective January 1, 2011 as a reference for the new cost-based interconnection tariffs.
| | For the years ended December 31, | |
| | 2007 | | 2008 | | 2009 | | 2010 | | 2011 | |
| | (millions of minutes) | |
Mobile Cellular Interconnection(1) | | | | | | | | | | | |
Incoming paid minutes | | 4,970.0 | | 6,626.9 | | 5,748.5 | | 4,924.0 | | 4,777.2 | |
Outgoing paid minutes | | 7,251.8 | | 5,879.4 | | 4,622.9 | | 3,973.9 | | 3,462.3 | |
Fixed Line Interconnection(2) | | | | | | | | | | | |
Incoming paid minutes | | 923.5 | | 1,362.3 | | 1,547.8 | | 1,414.9 | | 999.6 | |
Outgoing paid minutes | | 1,437.1 | | 1,988.5 | | 1,910.6 | | 1,502.2 | | 1,097.0 | |
Satellite Phone Interconnection | | | | | | | | | | | |
Incoming paid minutes | | 5.1 | | 3.2 | | 1.8 | | 1.3 | | 0.6 | |
Outgoing paid minutes | | 2.3 | | 1.6 | | 1.0 | | 0.8 | | 0.4 | |
International Interconnection(3) | | | | | | | | | | | |
Incoming paid minutes | | 1,208.5 | | 1,409.8 | | 1,475.4 | | 2,046.7 | | 2,504.1 | |
Outgoing paid minutes | | 162.9 | | 165.5 | | 160.4 | | 161.2 | | 158.3 | |
Total | | | | | | | | | | | |
Incoming paid minutes | | 7,107.2 | | 9,402.1 | | 8,773.6 | | 8,386.8 | | 8,281.6 | |
Outgoing paid minutes | | 8,854.1 | | 8,035.0 | | 6,695.0 | | 5,638.2 | | 4,718.0 | |
(1) Includes interconnection with Telkomsel.
(2) Fixed line interconnection minutes reflect interconnection with the networks of PT Bakrie Telecom (formerly PT Radio Telepon Indonesia or Ratelindo), PT Batam Bintan Telekomunikasi, Indosat and Mobile 8 Phone beginning in 2008.
(3) International interconnection minutes are derived from interconnection with Indosat’s international network and also derived from interconnection with Bakrie Telkom’s international network beginning in 2009, (incoming and outgoing calls using TIC-007).
Paid minutes from Telkomsel for the year 2007 to 2011 are set forth in following table:
| For the years ended December 31 | |
| 2007 | | 2008 | | 2009 | | 2010 | | 2011 | |
| (millions of minutes) | |
Incoming paid minutes | 2,663.2 | | 3,637.6 | | 3,379.6 | | 2,857.1 | | 2,697.4 | |
Outgoing paid minutes | 4,188.0 | | 3,270.6 | | 2,611.9 | | 2,184.5 | | 1,895.0 | |
-25-
f. Network Services
We manage directly the provision of network services for a range of customers that include our business partners, other businesses and other licensed telecommunications operators. We provide satellite transponder leasing, satellite broadcasting, VSAT, audio distribution, and terrestrial and satellite-based leased lines. Our customers can may enter into agreements with periods from several minutes of broadcasting to long-term contracts for one to five years.
We also have other supporting businesses, which include the supply of towers for the installation of BTSs for cellular operators. We manage this business through our subsidiary, Mitratel.
g. Revenue Sharing Arrangements (“RSA”)
We have entered into separate agreements with a number of investors under revenue sharing arrangements to develop fixed line services, public card phones (including their maintenance) and related supporting telecommunications facilities. For further details regarding the revenue-sharing arrangements, see Note 36 to our Consolidated Financial Statement.
2. New Economic Business and Strategic Opportunities Portfolio
We have categorized our Information, Media and Edutainment (“IME”) business portfolio as new economic business (“NEB”) and strategic opportunities, with a range of services. Information includes value added services (“VAS”), managed application & performance (“MAP”), e-Payment and IT enabler Services (“ITeS”). Media includes free to air (“FTA”) and Pay TV services. Edutainment includes ring back tone (“RBT”), SMS content, Portal and other services. We have designated our subsidiary, Metra, as a sub-holding company to focus on developing Telkom’s IME business.
Network Infrastructure
In line with the transformation of our business and infrastructure network, Telkom has improved its infrastructure network to form what we envision as the Telkom One network, which is intended to be a jointly developed network used by various Telkom units, particularly Telkomsel. Our network development using the Telkom One concept aims to result in the more efficient deployment of resources and will allow, for example, Telkomsel to draw on Telkom network resources in regions where it needs greater capacity to meet demand. The aim is also to transform Telkom’s infrastructure into high quality, efficient and cost competitive infrastructure to deliver our TIME services. This infrastructure transformation comprises the following:
a. Service transformation, by prioritizing support for multiplay and convergence services with broadband as the primary driver;
b. Network transformation, which is directed at all IP networks as well as the convergence of Telkom’s infrastructure through the implementation of IP Multimedia Sub System (“IMS”);
c. Operational transformation, to support more efficient operational implementation and is focused on managing the customer experience; and
d. OBCE transformation, by emphasizing the transformation of our information technology and systems.
In April 2010, the JaKaLaDeMa submarine and fiber optic cable project linking Java, Kalimantan, Sulawesi, Denpasar and Mataram was successfully completed.
-26-
Fixed Line Network and Backbone
a. Fixed Wireline Network
Our fixed wireline network consists of a hierarchy of local and trunk telephone exchanges. Subscribers’ telephones are connected to their local exchange by an outside plant, or facilities that include wireline (fiber optic and copper) and local wireless transmission connections and the related distribution facilities.
As of December 31, 2011, we managed 8.6 million fixed wireline connections. However, under our Infrastructure, Service and Operational Master plan (INSYNC2014 2008-2014), we aim to upgrade our legacy network to a NGN which supports new wave services and network operation methods. We also aim to upgrade our network infrastructure to all IP infrastructure. Our target is to provide full NGN service by 2014.
The following table shows data related to our FWL network from 2007 to 2011:
| | As of and for the Year Ended December 31, | |
Operating Statistics | | 2007 | | 2008 | | 2009 | | 2010 | | 2011 | |
Exchange capacity | | 10,732,304 | | 11,038,818 | | 11,094,063 | | 11,237,229 | | 12,180,214 | |
Installed lines | | 9,704,576 | | 9,838,537 | | 10,013,565 | | 10,510,048 | | 11,005,208 | |
Lines in service(1) | | 8,684,888 | | 8,629,783 | | 8,376,793 | | 8,302,818 | | 8,688,526 | |
Subscriber lines | | 8,324,197 | | 8,302,730 | | 8,038,294 | | 7,980,337 | | 8,323,175 | |
Public telephones | | 360,691 | | 327,053 | | 338,499 | | 322,481 | | 278,505 | |
Leased lines in service(2) | | 6,338 | | 6,084 | | 4,273 | | 3,988 | | 3,662 | |
Fixed wireline subscriber pulse production (millions)(3) | | 75,451 | | 62,940 | | 54,186 | | 9,403 | (5) | 8,054 | (5) |
Fault rate(4) | | 3.8 | | 3,5 | | 3.1 | | 2.5 | | 2.2 | |
(1) Lines in service are subscriber lines and public telephone lines, including the lines in service that we operate under revenue-sharing arrangements.
(2) Excludes leased lines for our network and multimedia businesses.
(3) Consists of pulses generated by local and domestic long-distance calls, excluding calls from public pay phones and cellular phones.
(4) Faults per 100 connected lines per month.
(5) In million minutes for year ended December 31, 2010 and 2011.
The following table sets out information relating to our fixed line network in each of our operating area that serves customer segment as of December 31, 2011:
| | | | | Area Jawa Barat | | Area Jawa Tengah | | | | | | Area | | | |
| Area Sumatera | | Area Jakarta | | dan Banten | | & Yogjakarta | | Area Jawa Timur | | Area Kalimantan | | Indonesia Timur | | Total | |
Local exchange capacity | 1,435,014 | | 3,947,821 | | 1,918,052 | | 1,222,573 | | 1,966,263 | | 615,138 | | 1,075,353 | | 12,180,214 | |
Total lines in service | 1,192,960 | | 3,003,752 | | 810,170 | | 827,076 | | 1,494,643 | | 453,657 | | 906,268 | | 8,688,526 | |
Capacity utilization(%)(1) | 83.1 | | 76.1 | | 42.2 | | 67.7 | | 76.0 | | 73.7 | | 84.3 | | 71.3 | |
Installed lines | 1,601,598 | | 3,764,827 | | 877,513 | | 1,066,114 | | 2,037,752 | | 568,979 | | 1,088,425 | | 11,005,208 | |
Utilization rate(%)(1) | 74.5 | | 79.8 | | 92.3 | | 77.6 | | 73.3 | | 79.7 | | 83.3 | | 78.9 | |
Population (millions)(2) | 51.5 | | 20.7 | | 43.9 | | 36.0 | | 37.8 | | 14.1 | | 37.4 | | 241.4 | |
Telkom line penetration(%)(3) | 2.3 | | 14.5 | | 1.8 | | 2.3 | | 4.0 | | 3.2 | | 2.4 | | 3.6 | |
(1) Capacity utilization (lines in use/exchange capacity) and utilization rate (lines in service/installed lines) of FWL.
(2) Index number from Statistics Indonesia (estimated figures).
(3) Telkom’s penetration based on estimated population figures.
-27-
b. Fixed Wireless Network
To support our fixed wireless network, our infrastructure consists of mobile switching centers (“MSC”) that are connected to every other trunk exchange. Each MSC is connected to a base station sub system (“BSS”), which consists of a base station controller (“BSC”) and a base transceiver station (“BTS”). These in turn connect the customers’ handheld devices and fixed wireless terminals to our fixed wireless network.
The number of fixed wireless connections in service has declined from 18.2 million in 2010 to approximately 14.2 million in 2011.
The following table shows data relating to our fixed wireless network since 2007:
| As and for the Year Ended December 31, | |
| 2007 | | 2008 | | 2009 | | 2010 | | 2011 | |
Exchange capacity (MSC)(2) | 12,831,841 | | 15,885,020 | | 23,393,631 | | 24,048,993 | | 33,261,850 | |
Installed lines (BTS)(2) | 9,383,924 | | 19,861,324 | | 27,653,553 | | 27,344,151 | | 27,635,751 | |
Lines in service(1) | 6,362,844 | | 12,725,425 | | 15,139,057 | | 18,161,278 | | 14,237,522 | |
Subscriber lines | 6,335,452 | | 12,698,827 | | 15,115,892 | | 18,142,955 | | 14,221,413 | |
Public telephones | 27,392 | | 26,598 | | 23,165 | | 18,323 | | 16,109 | |
Fixed wireless subscriber pulse production/minutes production (millions)(3) | 9,144 | | 12,304 | | 14,627 | | 11,768 | | 7,931 | |
(1) Lines in service are subscriber lines and public telephone lines, including the lines in service that we operate under revenue-sharing arrangements.
(2) BTS and MSC capacities in 2007 and 2008 were calculated on the assumption of a traffic allocation per subscriber of 30 mE.
(3) Consists of minutes of usage from local and DLD calls, excluding calls made from public pay phones and mobile cellular phones.
c. Broadband Network (Backbone)
The development of our broadband network was our primary focus in 2011 due to its key role as the infrastructurebackbone of the Telkom as a whole. The backbone of our telecommunications network is made up of transmission, trunk switches and core routers that connect several access nodes. The transmission links between nodes and switching facilities include microwave, submarine cable, satellite, fiber optic cable and other transmission technology.
The following table shows our backbone transmission capacity as of December 31, 2010 and 2011:
| | Capacity (number of Transmission medium circuits) | |
2010 | | E1 | | STM-1 | | STM-4 | | STM-16 | | STM-64 | |
Terrestrial transmission network | | | | | | | | | | | |
Optical fiber cable | | 25,467 | | 319 | | 46 | | 26 | | 121 | |
Microwave | | 4,566 | | 16 | | - | | - | | - | |
Submarine cable | | 2,368 | | 37 | | 7 | | - | | 10 | |
Satellite transmission network | | 666 | | - | | - | | - | | - | |
Total | | 33,067 | | 372 | | 53 | | 26 | | 131 | |
| | Capacity (number of Transmission medium circuits) | |
2011 | | E1 | | STM-1 | | STM-4 | | STM-16 | | STM-64 | |
Terrestrial transmission network | | | | | | | | | | | |
Optical fiber cable | | 23,891 | | 327 | | 49 | | 27 | | 194 | |
Microwave | | 4,456 | | 16 | | - | | - | | - | |
Submarine cable | | 2,245 | | 37 | | 7 | | - | | 14 | |
Satellite transmission network | | 680 | | - | | - | | - | | - | |
Total | | 31,272 | | 380 | | 56 | | 27 | | 208 | |
Note: The backbone transmission unit uses E1, STM1 (equivalent to 63 E1), STM4 (equivalent to 4 STM1), STM16 (equivalent to 4 STM4), and STM64 (equivalent to 4STM16) units. Synchronous Transfer Mode (“STM”) is the unit typically used in backbone transmission networks. Facilitating broadband services requires a high capacity transmission network using nxSTM-1 units. E1 units are used to support legacy services.
-28-
We operate the Telkom-1 and Telkom-2 satellites as well as 205 earth stations, including one satellite master control station. Our Telkom-1 satellite has 36 transponders, including 12 extended C-band transponders and 24 standard C-band transponders, while Telkom-2 has 24 standard C-band transponders. Both satellites are used for the following purposes:
- Network backbone transmission;
- Rural telecommunications services;
- Back-up transmission capacity for national telecommunications networks;
- Satellite broadcasting, VSAT and multimedia services;
- Satellite transponder capacity leasing;
- Satellite-based leased lines; and
- Teleport (earth station uplinking and downlinking service to and from other satellites).
In addition to our two satellites currently in service we lease transponders from other satellite providers, including 11 transponders from GE 23, two transponders from Apstar-1, two transponders from Sinosat and 10 transponders from JCSaT5a.
We provide satellite transponder leasing, satellite broadcasting, VSAT, audio distribution, and terrestrial and satellite-based leased lines. Our customers include businesses and other telecommunications operators. Customers can enter into agreements that cover periods from several minutes to long-term contracts for one to five years. The maximum annual tariff per transponder is US$1.2 million, although in some instances we can offer discounts for long-term customers.
In anticipation of the growth in demand for satellite services and to support our business strategy with regard to providing TIME services, we signed a contract on March 2, 2009 for the procurement of the Telkom-3 Satellite System with a joint stock company, “Academician M.F. Reshetnev” Information Satellite Systems” (ISS Reshetnev) from Russia. With an investment value of some US$200 million, the Telkom-3 satellite will give us an additional capacity of 42 active transponders, which is equivalent to 49 transponders with BW 36 MHz.
The Telkom-3 Satellite is scheduled to be launched in the second quarter of 2012 and will consist of 24 Standard C-band transponders, 8 Extended C-Band transponders and 10 Ku Band transponders. The geographical coverage of the Telkom-3 Satellite will extend to Indonesia and ASEAN (Standard C-Band), Indonesia and Malaysia (Ext. C-Band) and Indonesia (Ku-Band). Of the Telkom-3 Satellite’s 42 transponders, 40-45%, or around 20 transponders, will be for commercial use, with the remainder used to boost capacity for Telkom services.
Cellular Network
Our cellular services, which are operated by our subsidiary, Telkomsel, have the most extensive network coverage of any cellular operator in Indonesia. It currently operates on the GSM/DCS, GPRS, EDGE and 3.5G networks. The GSM/DCS network consists of 7.5 MHz of bandwidth on the 900 MHz frequency and 22.5 MHz of bandwidth on the 1,800 MHz frequency. Both networks operate as a single integrated dual band network. Telkomsel’s 3G network uses 10 MHz of bandwidth on the 2.1 GHz frequency.
As of December 31, 2011, Telkomsel’s digital network was supported by 42,623 BTS with an overall network capacity capable of facilitating the communication needs of 107.0 million customers.
Data and Internet Network
We began operating data network services in 1997 and since then have progressively developed and expanded our network. As of December 31, 2011, our IP-based network covered 2,856 locations with 2,977 router nodes nationwide. We are committed to making continuous improvements in the speed and quality of the IP-based network. This network functions as the transport network for our high quality VPN, VoIP, dial-up and broadband internet services. We now have remote access servers in 117 locations with 167 nodes nationwide which are used for our “Telkom Net Instan” dial-up internet service and corporate dial-up internet services.
We have been providing fixed line-based broadband internet access using ADSL technology since 2004 under the brand name “Speedy”. As of December 31, 2011, we had 1.8 million Speedy customers, representing growth of 8.5% from 1.6 million Speedy customers as of December 31, 2010. Since May 2008, Speedy had a speed of up to 3 Mbps.
Telkomsel also provides a mobile broadband product under the brand name “Flash”. As of December 31, 2011, Telkomsel had 5.5 million Flash customers, representing growth of 45.7% from the 3.8 million customers as of December 31, 2010.
-29-
International Networks
To route outgoing and incoming calls on our IDD service, “IDD-007”, we operate international gateways in Batam, Jakarta and Surabaya, which have reliable links to domestic networks. We have no plans to develop any further gateways at present.
We have been improving our international network infrastructure primarily to meet capacity demands, improve reliability and efficiency and in support of our NGN-based infrastructure transformation. As part of the development of service nodes, we will use softswitches to support international services.
Our international network is supported by a submarine communications cable system (“SCCS”), the Dumai-Malaka cable system (“DMCS”), and the Thailand-Indonesia-Singapore (“TIS”) system, as well as an indefeasible right of use, microwave-based border radio and satellite. To consolidate our international network and expand broadband services with a 40Gbps bandwidth capacity, Telin entered into the AAG cable consortium in April 2007 with an initial investment of US$48 million for the development of the Batam Singapore cable system (“BSCS”) to connect Batam with Singapore. In 2012, the AAG’s capacity will be upgraded to 120 Gbps for the main Singapore-Hongkong-US route. Our long-term plans include enhancing international access to eastern Indonesia as well as diversifying services and capturing business opportunities in South Asia, the Middle East and Europe.
In addition to infrastructure expansion, we have entered into international telecommunications service agreements with a number of overseas operators to facilitate international call interconnections. Moreover, since we do not have agreements with telecommunications operators in all our IDD destinations, we have signed agreements with SingTel, Telekom Malaysia, Verizon, Belgacom, NTT, TIS, France Telecom and other operators under which they act as hubs and route international calls to certain destinations. As of December 31, 2011, we had entered into international telecommunications service agreements with 65 international operators in 26 countries, compared to 33 international operators in 20 countries as of December 31, 2010. We plan to enter into further international telecommunications service agreements with other operators for direct interconnections, targeting operators in the top 20 destinations for our outgoing IDD traffic.
Customer Service
Our customers can access our range of products and services through the following service points:
1. Plasa Telkom
This is a location where customers can access information as well as a range of services including billing, payment, account suspension, promotions and complaints. Currently, our walk-in customer have reached several areas, which comprising of 727 customer service points, including 32 Plasa Telkom that are shared with the GraPARI outlets of our subsidiary, Telkomsel, that provide service to cellular subscribers. As of December 31, 2011, Telkomsel operated a total of 84 GraPARI outlets. Cellular customers are also served by 328 Gerai HALO outlets, which are operated by third parties. Customers can now also make electronic payments using Electronic Data Capture, available through some 150 terminals in our customer service outlets.
Our enterprise customers can access a personalized service through our Telkom Solution Houses (“TSH”), which are located in prestigious malls in Jakarta, Bali and Surabaya. We have also opened nine location of SME Centers in eight cities—Jakarta, Semarang, Surabaya (2), Medan, Bandung, Yogyakarta, Palembang and Makassar—to serve the SME segment. These Centers serve as communication centers, community centers and commerce centers.
2. Call Centers.
Customers can access a range of services and information quickly and easily through our Call Centers simply by dialing “147”. Customers can also speak directly to our call center officers to register complaints or request information about billing, promotions and service features. Telkom Call Centers are located in Medan, Jakarta and Surabaya.
We also provide a toll-free number for enterprise customers, “08001Telkom” (“08001835566”), while SME customers can access our services by dialing “500250”.
For cellular customers, we offer Caroline, or Customer Care Online, which can be reached on the following numbers:
- FromkartuHALO : 111.
- FromsimPATI and Kartu As : 155 (24 hours, free of charge) and 188 (24 hours, payable).
- From a cellphone or fixed phone: national (“08071811811”), Jakarta (“021-21899811”), Bandung (“022-2553811”), Surabaya (“031-8403811”) and Medan (“061-4578811”).
-30-
3. Internet.
Our web-based service can be accessed through our website at www.telkom.co.id.
4. Broadband Learning Centres (“BLC”)
BLC provide education to various user communities such as teachers, students and the general public about computers, the internet, broadband and the most recent telecommunications technologies. To ensure quality education, BLCs collaborate with local professionals in each area.
5. Enterprise and Wholesale Services and Account Manager (“AM”) Teams
Our enterprise and wholesale customer management is organized into 6 segments based on the customer’s line of business:
a. Finance and Banking;
b. Government, Army and Police;
c. Manufacturing;
d. Mining and Construction;
e. Trade and Industrial Park; and
f. Trading and Services
Enterprise customer management is also organized on the basis of revenue contribution, with cluster-1 responsible for customers with revenues contribution of over Rp500 million/month and cluster-2 for customers with revenues contribution of between Rp100 million/month and Rp500 million/month. Enterprise customers are managed by AM from our Enterprise Service Division.
SME customers with revenue contribution less than Rp100 million/month are managed by AM and Tele Account Management, which are based in the Business Service Division. Our SME customers are organized into three categories based on line of business:
a. Public and General Services;
b. Plantation and Manufacturing Services; and
c. Trading and Business Services
SME customer management is further organized by revenue contribution: cluster-3 looks after customers with revenuescontributionof between Rp50 million/month and Rp100 million/month, while cluster-4 is responsible for customers with revenuescontributionof less than Rp50 million/month.
Our wholesale segment customers, namely other licensed operators (“OLO”), are handled by AM from our Carrier and Interconnection Service Division.
6. Service Level Guarantee Program (“SLGP”)
Telkom has established a SLGP for our fixed line, Flexi and Speedy customers. The program offers a guaranteed minimum level of services for customers who wish to install a new line, change of service, completion repairmen of disruption, restore a disconnected line or make a billing complaint, and provides non-cash compensation, such as free subscriptions for a limited period, which are given to customers if the minimum service level is not fulfilled. For the Enterprise, SME and OLO segments, the service level guarantee is provided in accordance with the agreement with the customer.
To measure our progress on customer service, we work with an independent survey institute to determine our Customer Satisfaction Index (“CSI”) and Customer Loyalty Index (“CLI”) using the Top Two Boxes method. In 2011, for our enterprise customer segment we achieved a CSI of 88.92% and a CLI 86.26%, while for wholesale or OLO customer segment we achieved a CSI of 82.68% and a CLI 74.81%.
-31-
Review of the Telecommunications Industry in Indonesia
The telecommunications industry in Indonesia has gained momentum as consumers become increasingly sophisticated in terms of their awareness of IT-based products and services and how they can enhance their lives.
Indonesia’s large population, coupled with the highest economic growth in Southeast Asia, offers unique opportunities for the sustainable growth of the telecommunications industry and for the expansion of the telecommunications market itself. The domestic telecommunications industry nonetheless faces the considerable geographic challenge of developing its infrastructure to be able to meet the demand for accessing the quality of telecommunications services in remote communities.
An influx of new domestic and international players that was made possible by deregulation has consolidated the industry’s position as one of the most strategic sectors for long-term investment. While this has certainly intensified the competition, particularly in the cellular business (whether GSM-based or CDMA-based), the Government, through the MoCI, has endeavored to ensure conditions for the healthy growth of telecommunications operators, to ensure that they ultimately contribute to national economic growth.
Business opportunities in the domestic telecommunications industry abound as the growing cellular business continues to innovate and create ever easier mobile access to the internet for subscribers, which in turn is enhancing prospects in the data communications business. Both of our roadmap and current trends in data telecommunications technology indicate a shift towards the application of HSPA+, WiMax and Long Term Evolution (“LTE”) technologies. These trends also confirm that customer demand for data services is still rising, not only for voice but also for SMS.
By international standards, fixed line and internet penetration in Indonesia is low. However, we believe there are a number of trends that point towards significant growth in the domestic telecommunications industry. These include:
1. Sustained economic growth, which will drive an increase in demand for telecommunications services, including data communications services.
2. The migration to wireless telephone networks. We believe that wireless will become increasingly popular on the back of the ever-broader scope of services offered, as well as the improving quality of wireless networks, increasingly affordable cellular handsets and the expansion of prepaid service features facilitating mobile data access.
3. The growth in the number of telecommunications operators. We anticipate an increasingly competitive and open telecommunications sector in Indonesia as a result of the regulatory reform that eliminated the previous monopoly system.
Regulations
Overview
The framework for the telecommunications industry is comprised of specific laws, government regulations and ministerial decrees enacted and issued from time to time. The current telecommunications policy was first formulated and articulated in the Government’s “Blueprint of the Indonesian Government’s Policy on Telecommunications,” contained in MoC Decree No. KM.72/1999 dated September 17, 1999. This was intended to:
- Increase the sector’s performance in the era of globalization;
- Liberalize the sector with a competitive structure by removing monopolistic controls;
- Increase transparency and predictability of the regulatory framework;
- Create opportunities for national telecommunications operators to form strategic alliances with foreign partners;
- Create business opportunities for small and medium enterprises; and
- Facilitate new job opportunities.
-32-
Table of Content
Telecommunications Law
The telecommunications sector is primarily governed by Law No.36/1999 (“Telecommunications Law”), which became effective on September 8, 2000. The Telecommunications Law sets guidelines for industry reforms, including industry liberalization, facilitation of new entrants and enhanced transparency and competition.
The Telecommunications Law eliminated the concept of “organizing entities,” ending Indosat’s and our special status as organizing entities with responsibility for coordinating domestic and international telecommunications services, respectively, for the industry. To enhance competition, the Telecommunications Law prohibits monopolistic practices and unfair competition among telecommunications operators.
The Telecommunications Law is implemented through numerous Government Regulations and Ministerial Regulations, including Government Regulation No.52/2000 regarding Telecommunications Services, MoCI Regulation No.1/PER/M.KOMINFO/01/2010 dated January 25, 2010 regarding Operation of Telecommunications Networks (“MoCI Regulation No.1/2010”), MoC Decree No.33/2004 regarding Supervision of Healthy Competition in Fixed Network and Basic Telephony Services Operation (“MoC Decree No.33/2004”), MoC Decree No.KM.4/2001 dated January 16, 2001 regarding the Fundamental National Technical Plan 2000 for the Development of National Telecommunications (“National Telecommunications Technical Plan”). The National Telecommunications Technical Plan has been amended several times, most recently by MoCI Regulation No.09/PER/M.KOMINFO/06/2010 dated June 9, 2010. Together with the Telecommunications Law, the National Telecommunications Technical Plan sets out the basic vision for the development of the Indonesian telecommunications regulators.
Telecommunications Regulators
In February 2005, the authority to regulate the telecommunications industry was transferred from the MoC to a newly-established Ministry, the MoCI. The Government, through the MoCI, exercises both regulatory authority and control and implements policies that govern the telecommunications industry in Indonesia. In addition, the MoCI regulates the radio frequency spectrum allocation for all telecommunications operators, each of whom must be licensed by the DGPT, a unit of the MoCI. With effect from January 1, 2011, the DGPT was dissolved and its licensing and regulatory authority over the telecommunications industry was transferred to two newly established Directorate Generals within the MoCI, namely, the Directorate General of Post and Informatics Resources and Equipment (“DGRE”) and the Directorate General of Post and Informatics Operations (“DGPIO”), pursuant to MoCI Regulation No.17/PER/M.KOMINFO/10/2010 dated October 28, 2010. Pursuant to MoCI Regulation No.15/PER/M.KOMINFO/06/2011 dated June 20, 2011, all references to the DGPT in the regulations and decrees of the MoCI and the DGPT are now formally deemed to be references to the DGRE to the extent they concern radio frequency spectrum and telecommunications devices and equipment standardization, and to the DGPIO to the extent they concern post and telecommunications. In particular, the DGRE is responsible for radio frequency allocation and the DGPIO is responsible for telecommunications licensing, numbering, interconnections and competition.
Following the enactment of the Telecommunications Law, the MoC established an independent regulatory body pursuant to MoC Decree No.KM.31/2003 dated July 11, 2003 regarding Establishment of the Indonesian Telecommunications Regulatory Body (“ITRB”). MoC Decree No. KM.31/2003 was later superseded by MoCI Regulation No.36/PER/M.KOMINFO/10/2008 dated October 31, 2008 on the same subject (as lastly amended by MoCI Regulation No.01/PER/M.KOMINFO/02/2011 dated February 7, 2011) (“MoCI Regulation 36/2008”). Pursuant to the MoCI Regulation 36/2008, the ITRB has a role in regulating, monitoring and controlling the telecommunication industry. The ITRB comprises nine persons, six from social elements and three from government elements (the Directors General of the DGPIO and the DGRE and a third government representative appointed by the MoCI, and is headed by the Director General of the DGPIO. The ITRB plays a role complementary to that of the MoCI in licensing, standards, interconnection fees, business competition and disputes resolution, among others.
Prior to February 25, 2009, the ITRB also operated the Telecommunication Traffic Clearing System (“TTCS”), which monitored interconnection matters and settled interconnection fees. Through the TTCS, the ITRB obtained data on the profile of interconnection traffic among operators to ensure transparency in the charging of interconnection fees. Pursuant to MoCI Regulation No.14/PER/M.KOMINFO/02/2009 dated February 25, 2009 regarding Telecommunications Traffic Clearing, responsibility for the clearing and settlement of interconnection fees was transferred from ITRB to telecommunications network providers, which are also required to report their interconnection traffic data to the ITRB. The ITRB’s role is now one of overseeing, rather than implementing, the interconnection clearing and settlement process.
-33-
Table of Content
Classification and Licensing of Telecommunications Providers
In accordance with Government Regulation No.52/2000, the Telecommunications Law organizes telecommunications providers into three categories:
- Telecommunications network providers;
- Telecommunications services providers; and
- Special telecommunications providers.
Licenses issued by MoCI are required for each category of telecommunications provider. MoCI Regulation No.1/2010 and MoC Decree No.KM.21/2001 dated May 31, 2001 regarding the Operation of Telecommunications Services (“MoC Decree No. KM.21/2001”) (as amended by Decree No.KM 30/2004 dated March 11, 2004, MoCI Regulation No.07/P/M.KOMINFO/04/2008 dated April 4, 2008 and MoCI Regulation No.31/PER/M.KOMINFO/09/2008 dated September 9, 2008) are the principal implementing regulations governing licensing.
Together, MoCI Regulation No.1/2010 and MoC Decree No.KM.21/2001 differentiate basic telephony services from other value-added telephony and multimedia services, which are licensed separately. A telecommunications network provider is licensed to own and/or operate a telecommunications network, while a telecommunications services provider is licensed to provide services by leasing network capacity from network providers. Separate special telecommunications licenses are required for providers of private telecommunications services relating to broadcasting and national security interests.
Introduction of Competition in the Indonesian Telecommunications Industry
In 1995, we were granted a monopoly to provide local fixed-line telecommunications services until December 31, 2010, and domestic long distance (“DLD”) services until December 31, 2005. Indosat and Satelindo (which subsequently merged with Indosat) were granted a duopoly for provision of basic international telecommunications services until 2004.
As a consequence of the Telecommunications Law, the Government terminated our exclusive rights and the duopoly rights of Indosat and Satelindo. Otherwise, the Government adopted a duopoly policy to enforce competition between Indosat and us as the comprehensive service and network provider. The market for provision of international direct dialing (“IDD”) services was liberalized in August 2003 with the termination of Indosat’s and Satelindo’s exclusive rights. Indosat began operating fixed line services in 2002 and fixed wireless access and DLD services in 2003 after receiving its DLD services license. We subsequently received an IDD services license and began offering IDD services in 2004 in direct competition with Indosat.
DLD Services
To liberalize DLD services, the Government amended the National Telecommunications Technical Plan pursuant to MoCI Decree No.6/P/M.KOMINFO/5/2005 dated May 17, 2005 (“MoCI Decree No.6/2005”) to assign each provider of DLD services a three-digit access code that would permit their customers to select an alternative DLD services provider by dialing the three-digit access number. MoCI Decree No.6/2005 did not provide for immediate implementation of the three-digit system for DLD calls, but as being the first DLD service provider, must gradually open our network to the three-digit access codes in all coded areas throughout Indonesia by April 1, 2010. We were assigned the “017” DLD access code, while Indosat was assigned “011”. The MoCI thereafter again amended the National Telecommunications Plan as provided in MoCI Decree No.43/P/M.KOMINFO/12/2007 dated December 3, 2007, (“MoCI Decree No.43/2007”), which delayed until September 27, 2011 the date by which we already open our network to the three-digit DLD access codes in all coded areas throughout Indonesia.
Pursuant to MoCI Decree No.43/2007, we were required to open our network to the “01X” three-digit DLD access service in Balikpapan by April 3, 2008, which we did. For a period after April 3, 2008, customers were able to make DLD calls from Balikpapan using Indosat’s “011” DLD access code as a prefix. However, we believe that Indosat no longer provides this service in Balikpapan. As required under MoCI Decree No.43/2007, we also opened our network throughout Indonesia to “01X” DLD three-digit fixed wireline and fixed wireless access for Indosat and other licensed operators beginning on September 27, 2011. However, to date no other telecommunications operators have implemented the “01X” three-digit DLD access service to our network. If other operators do implement “01X” three-digit DLD access service, whether throughout Indonesia or in parts of Indonesia, our customers in Indonesia will be able to select other DLD services providers (if available for that particular area) by dialing their designated three-digit access number and vice versa.
-34-
On December 16, 2008, the MoCI issued an in-principle DLD license to Bakrie Telecom which increasing the number of potential DLD operators to three. As the date of annual report made/published, Bakrie Telecom has not yet obtained a DLD operating license, which requires that it first procure the necessary infrastructure.
The tariffs that we charge our customers for DLD fixed line services are regulated by MoCI Regulation No. PM.15/Per/M.KOMINFO/4/2008 dated April 30, 2008 regarding Tariff Calculation Procedures for Basic Telephony Services on Fixed Wireline Networks (“MoCI Regulation No.15/2008”), which provides that the rates which we may charge for these services are capped in accordance with a cost-based formula that is provided in MoCI Regulation No.15/2008. This regulation also provides that our tariff structure is comprised of a connection fee, monthly charges, usage charges and additional facilities fees. We are required by MoCI Regulation No.15/2008 to report our cap calculated in this manner to the ITRB.
IDD Services
We received our IDD license in May 2004 and began offering IDD fixed line services to customers in June 2004 using the “007” IDD access code. The Indosat IDD access code is “001”. On December 2005, interconnection agreement with Indosat enables Indosat’s network customers to access our IDD services by dialing “007” and our network customers to access Indosat’s IDD services by dialing “001”.
In September 2007, the MoCI issued an in-principle IDD license to Bakrie Telecom, with international access code “009” which increasing the number of potential IDD operators to three. As the date of annual report made/published, Bakrie Telecom has not yet obtained an IDD operating license, which requires that it first procure the necessary infrastructure.
Interconnection fees from international network providers to local network providers are determined based on the interconnection offering document for fixed line local network providers. The tariffs that we charge our customers for IDD fixed line services are regulated by MoCI Regulation No.15/2008 in the same manner as a our DLD fixed line services.
Fixed Wireless
MoC Decree No.KM.35/2004 dated March 11, 2004 regarding Implementation of Fixed Wireless Networks with Limited Mobility (as amended by MoCI Decree No.16/PER/M.KOMINFO/06/2011 dated June 27, 2011) (“MoC Decree No. KM.35/2004”) provides that only fixed network operators holding licenses issued by the MoC and using radio frequency access networks may offer fixed wireless access services. In addition, MoC Decree No.35/2004 states that each fixed wireless access provider must provide basic telephone services. However, a fixed wireless access provider may only provide fixed wireless access services for numbers under its designated area code. Further, fixed wireless access service may not incorporate roaming features. Under an auto migration feature, customers may make and receive calls only on their fixed wireless access phones using a different number with a different area code.
Indosat, Bakrie Telecom and Mobile-8 also hold fixed wireless operating licenses.
The tariffs that we may charge our customers for fixed wireless services are regulated by MoCI Regulation No.15/2008 in the same manner as our DLD and IDD fixed line services.
Cellular
Cellular telephone service is provided in Indonesia on the 1.8 GHz and 2.1 GHz radio frequency spectrum. The MoCI controls the allocation of radio frequency spectrum on the 2.1 GHz radio frequency spectrum in accordance with various regulations, including MoCI Regulation No. 02/PER/M.KOMINFO/1/2006, dated January 13, 2006, regarding the Selection of IMT-2000 Mobile Cellular Network Operators on Radio Frequency Band 2.1 GHz. These regulations provide for the allocation of frequency spectrum by open tender to qualified bidders.
The tariffs that we charge our cellular customers are regulated by MoCI Regulation No.09/PER/M.KOMINFO/04/2008 dated April 7, 2008 regarding Procedures for Determining Tariffs for Telecommunications Services Connected through Mobile Cellular Networks (“MoCI Regulation No.9/2008”), which provides guidelines to determine cellular tariffs based on a network element cost and a retail service activity cost plus margin. Pursuant to MoCI Regulation No.9/2008, the tariffs that we may charge our cellular customers are structured as a basic services tariff, roaming tariff and multimedia tariff. Each of these tariffs is structured as a connection fee, monthly charges, usage charges and additional facilities fees.
-35-
Interconnection
In accordance with the express prohibitions in the Telecommunications Law on activities that may create monopolistic practices and unfair business competition, the Telecommunications Law requires network providers to allow users on one network to access users or services on other networks by paying fees agreed upon by each network operator. Government Regulation No.52/2000 dated July 11, 2000 regarding Telecommunications Operations provides that interconnection charges between two or more network operators must be transparent, mutually agreed on and fair.
On February 8, 2006, MoCI issued Regulation No.8/Per/M.KOMINFO/02/2006 on Interconnection (“MoCI Regulation No.8/2006”), which mandated a cost-based interconnection tariff scheme for all telecommunications network and services operators in replacement of the revenue-sharing scheme then prevailing. Under the new scheme the operator of the network on which calls terminate would determine the interconnection charge in accordance with tariffs based on long-run incremental costs. MoCI Regulation No.8/2006 included the methodology for determining long-run incremental costs. Because of our significant market power, MoCI has directed that Telkom data be used as the model for determining fixed network costs, and Telkomsel data be used for cellular network costs.
MoCI Regulation No.8/2006 mandates that operators submit to the ITRB annually Reference Interconnection Offer (“RIO”) proposals containing proposed interconnection tariffs for the coming year. Operators are required to use the cost-based methodology in preparing RIO proposals, and the ITRB and MoCI are required to use the same methodology in evaluating the RIO proposals and approving interconnection tariffs. The RIO proposals also include call scenarios, traffic routing, point of interconnection, procedure for requesting and providing interconnection, and other matters. RIOs must also disclose the type of interconnection services offered and tariffs charged for each service offered. Interconnection access providers are required to implement a queuing system on a First-in-First-Serve basis. Additionally, the interconnection mechanism must also be transparent and without any discrimination.
Pursuant to MoCI Regulation No.8/2006 and ITRB Letter No.246/BRTI/VIII/2007 dated August 6, 2007, we submitted a RIO proposal to ITRB in October 2007, which covered adjustments for operational, configuration, technical and service offerings. In December 2007, all network operators including ourselves signed new interconnection agreements that replaced all interconnection agreements between network operators, including amendments of all interconnection agreements signed in December 2006. These agreements temporarily served in place of RIOs while the ITRB continued to review the RIO proposals received from ourselves and other operators.
On February 5, 2008, the ITRB required that we and other operators begin implementing the cost-based interconnection tariff regime. On April 11, 2008, pursuant to DGPT Decree No.205/2008, the ITRB and the MoCI approved a RIO from dominant operators (operators controlling more than 25% of the market share), including Telkomsel and ourselves, to replace the previous interconnection agreements. The RIO approved in 2008 was in effect untilJanuary 1, 2011 (or July 1, 2011, in the case of fixed local wireless, when the ITRB approved a new RIO which now continues in effect. In the current RIO, different interconnection rates apply for the first time to fixed wireless and fixed wireline interconnections. The current RIO also reduced average interconnection offering rates by an average of 1.5% to 3.0%. We expect the current RIO to be implemented for one to two years.
Voice over Internet Protocol (“VoIP”)
In January 2007, the Government implemented new interconnection regulations and a five digit access code system for VoIP services pursuant to MoCI Decree No.06/P/M.Kominfo/5/2005. Under the Decree, the prefix for VoIP, which was originally 01X, was changed to 010XY. On April 27, 2011, the MoCI issued Regulation No. 14/PER/M.KOMINFO/04/2011, which imposed quality control standards, to be effective three months thereafter, to which we and other operators must adhere in providing VoIP services.
-36-
Table of Content
Internet Protocol Television (”IPTV”)
In August 2009, MoCI issued Ministerial Decree No.30/PER/M.KOMINFO/8/2009 regarding the undertaking of IPTV services in Indonesia, which regulates our planned IPTV business, which is a subscription-based TV service transmitted through Internet-Protocol network. MoCI updated and replaced this regulation in July 2010 in MoCI Regulation No.11/PER/M.KOMINFO/07/2010 (“MoCI Regulation No.11/2010”). MoCI Regulation No.11/2010 makes clear that IPTV services may be delivered to both television sets and telecommunications devices, while MoCI Regulation No.30/2009 covered only television sets.
MoCI Regulation No.11/2010 provides that IPTV is a convergence of telecommunications, broadcasting, multimedia and electronic transactions. MoCI Regulation No.11/2010 establishes the legal basis for both licensing and providing IPTV services, and includes provisions on rights and obligations, standards, foreign ownership and the use of domestic independent content providers, among others.
Only a consortium comprising at least two Indonesian entities may be licensed as an IPTV provider. The individual consortium members must, in aggregate, hold at least one license as a local fixed network provider, one as an Internet Services Provider (“ISP”) and one as a subscriber broadcast services provider. The consortium may provide IPTV services only in the coverage area for which the consortium holds all three required licenses. MoCI Regulation No.11/2010 further requires that the IPTV services be delivered through a wire network.
We obtained an IPTV license in consortium with PT Indonusa Telemedia (TelkomVision) on April 27, 2011. The operating license covers Jabodetabek, Bandung, Surabaya, Bali and Semarang.
Satellite
The international satellite industry is highly regulated. In addition to being subject to domestic licensing and regulation in Indonesia, such as regulation of the use of orbital slots and radio frequencies, the placement and operation of our satellites are also subject to registration with the Radio Communications Bureau of the International Telecommunications Union.
Consumer Protection
Under the Telecommunications Law, each operator must provide guarantees for consumer protection in relation to quality of services, usage or service fees, compensation and other matters. Customers injured or damaged by negligent operations may file claims against negligent providers. Telecommunications consumer protection regulations provide service standards for telecommunication operators.
USO
All telecommunications network operators and service providers are bound by a USO that requires them to contribute to providing universal telecommunication facilities and infrastructure, which is generally done by way of financial contribution. MoCI Regulation No.32/PER/M.KOMINFO/10/2008 dated October 10, 2008 regarding the USO (as amended by MoCI Regulation No. -03/2010 dated February 1, 2010) (“MoCI Regulation No.32/2008”) provides that USO funds received will be used to fund telephone, SMS and internet access in remote and other areas of Indonesia where it is not economical to provide these services. Pursuant to MoCI Regulation 21/PER/M.KOMINFO/10/2011 dated October 12, 2011 regarding the Information and Communications Technology Fund, a fund known as the ICT Fund will be sourced from USO funds and used to provide financial support for the provision of optical fiber networks, public Wi-Fi internet access service, data recovery center services an development of the domestic ICT industry.
USO payment requirements are calculated as a percentage of our and Telkomsel’s unconsolidated gross revenues less uncollectable receivables from the telecommunication operation (e.g., bad debt expense) and payments received for interconnection expense which belong to other parties. Pursuant toGovernment Regulation No.7/2009 dated January 16, 2009 regarding Tariffs for Non-Tax State Revenue that apply to the Ministry of Communication and Information (“GR No.7/2009”), the current USO tariff rate is 1.25% of gross revenue. We paid USO amounts of Rp835 billion in 2010, and Rp879 billion in 2011.
MoCI Regulation No.32/2008 also provides that the right to provide USO services will be auctioned to the lowest-cost service provider. For example, MoCI Regulation No.48/PER/M.KOMINFO/11/2009, dated November 23, 2009 (as amended by MoCI Regulation No. 19/PER/M.KOMINFO/12/2010 dated December 13, 2010), provides for 11 tenders in which USO funds will be used to establish Internet Service Centers in the capital cities of sub-districts (kecamatan) located within the service area for each tender.
-37-
Telecommunication Regulatory Charges
On January 16, 2009, the Government issued Government Regulation No.7/2009, which sets the types of non-tax state revenues that apply to the MoCI derived from various services, including telecommunications.
We are required to pay right-of-use fees that are calculated with reference to both the BTSs that we use in our network as well as the radio frequency spectrum which we control. The right-of-use fees calculated with reference to our BTSs are payable annually based on a formula that takes into account base prices for both radio frequency spectrum and transmission capacity, as adjusted by fee indices set by the Minister of Communications and Information in consultation with the Minister of Finance. The right-of-use fees calculated with reference to our radio frequency spectrum are determined by tender and comprise both an up-front fee and annual fees.
On December 13, 2010, the Government issued Government Regulation No.76/2010 amending Government Regulation No.7/2009. Pursuant to Government Regulation No.76/2010, we are no longer required to pay right-of-use fees calculated with reference to the BTSs that we deploy in our network, except for BTSs deployed in our backbone, with effect from December 15, 2010. As a result, our right-of-use fees are now calculated principally based on the bandwidth of the radio frequency spectrum that we use.
In addition to radio frequency spectrum right-of-use fees, Government Regulation No.7/2009 requires all telecommunications operators to pay an annual concession license fee, payable in equal quarterly installments, equal to 0.5% of unconsolidated gross revenues less uncollectible receivables from the telecommunication operation (e.g., bad debt expense) and payments received for interconnection expense which belong to other parties.
Pursuant to Law No. 28/2009 regarding Local Taxes and Local Fees, local governments are permitted to impose fees on the sites that we use for telecommunications towers with effect fromSeptember 15, 2011. The fees may not exceed 2% of tax assessed value of the site. Local Goverments currently impose these fees ina numberof approximately 500 local jurisdictions inIndonesia. We expect the number of local jurisdictions imposing these fees to increase in the future.
Telecommunications Towers
On March 17, 2008, the MoCI issued MoCI Regulation No.02/PER/M.KOMINFO/3/2008 regarding Guidelines on Construction and Utilization of Sharing Telecommunication Towers (“Tower Decree”). Under the Tower Decree, the construction of telecommunications towers requires permits from the relevant governmental institution, while the local government determines the placement and locations at which telecommunications towers may be constructed. In addition, telecommunications providers that own telecommunication towers and other tower owners are obligated to allow other telecommunication operators to utilize their telecommunication towers (other than the tower used for its main network), without any discrimination.
Further, on March 30, 2009, several government ministries issued a joint regulation in the form of Minister of Home Affairs Regulation No.18/2009, Minister of Public Works Regulation No.07/PRT/M/2009, MoCI Regulation No.19/PER.M.KOMINFO/03/2009 and Head of the Investment Coordinating Board Regulation No.3/P/2009 regarding Guidelines for the Construction and Shared Use of Telecommunications Towers (“Joint Decree”).
The Joint Decree grants to regents, who head local governments in Indonesia, or to the governor, in the case of DKI Jakarta Province, the authority to license the construction of telecommunications towers. The Joint Decree also provides for construction standards and requires that telecommunications towers generally be made available for shared use by telecommunications service providers. The owner of a telecommunications tower is allowed to collect a fee, which is negotiated with reference to costs associated with investment and operational costs, the return of investment and a profit. Monopolistic practices in the ownership and management of telecommunications towers is prohibited.
In addition to the Joint Regulation and the Tower Decree, several regional authorities have implemented regulations limiting the number and location of telecommunication towers and require operators to share in the utilization of telecommunications towers.
-38-
Competition
Measures following the Telecommunications Law’s adoption in 2001 moved the Indonesian telecommunications sector from a duopoly between Indosat and us to one with multiple competing providers. See “Regulations–Introduction of Competition in the Indonesian Telecommunications Industry”.
Competition Law
The Government currently promotes liberalization, competition and transparency in the telecommunications sector, although it does not prevent providers from attaining and capitalizing upon a dominant market position. However, theGovernment prohibit operators from abusing a dominant position. In March 2004, the MoC issued Decree No.33/2004, which prescribes measures to prohibit such abuse by dominant network and service providers. A provider is considered dominant based on factors such as scope of business, service coverage area and control a particular market. Specifically, Decree No.33/2004 prohibits dumping, predatory pricing, cross-subsidies, mandatory use of a provider’s services (to the exclusion of competitors) and hampering mandatory interconnection (including discrimination against specific providers).
Competition in the telecommunications sector, like all Indonesian business sectors, is also governed more generally by Law No.5/1999 dated March 5, 1999 regarding Prohibition of Monopolistic Practice and Unfair Business Competition (“Competition Law”). The Competition Law bans agreements and activities tending toward unfair business competition, as well as the abuse of a dominant market position. Pursuant to the Competition Law, the Commission for the Supervision of Business Competition (“KPPU”) has been established as Indonesia’s antitrust regulator with the authority to enforce the provisions of the Competition Law.
The Competition Law is implemented by various regulations, including Government Regulation No.57/2010 dated July 20, 2010 regarding Mergers and Acquisitions Potentially Causing Monopolistic Practices or Unfair Business Practices. Government Regulation No.57/2010 permits voluntary consultation with the KPPU prior to a merger or acquisition, resulting in the KPPU’s issuing in a non-binding opinion. Government Regulation No.57/2010 also requires that a mandatory report be made to the KPPU after a merger or acquisition is completed if the transaction exceeds certain asset or sales value thresholds.
Fixed Line, Fixed Wireless and Domestic Long Distance
Our exclusive right to provide domestic fixed line telecommunications services in Indonesia ended following the Telecommunications Law’s implementation in 2001. The MoC issued licenses to Indosat for domestic fixed line services in August 2002 and for DLD telephone services in May 2004. We entered into an interconnection agreement with Indosat dated September 23, 2005 to allow interconnection between our local fixed line services in Jakarta, Surabaya, Batam, Medan, Balikpapan, Denpasar and certain other areas. By 2006, Indosat was able to provide nationwide DLD services through its CDMA-based fixed wireless network, its fixed line network and these interconnection arrangements with us.
In an attempt to liberalize DLD services, the Government required each DLD provider to implement a three-digit access code to be dialed by customers making DLD calls. These regulations were first implemented in Balikpapan in 2008, with Balikpapan residents given the option to make a normal DLD call or to select a three-digit code assigned to Indosat or to us. Under current regulations, this system is to be applied nationally beginning September 27, 2011. See “Regulations–Introduction of Competition in the Indonesian Telecommunications Industry”.
Indosat remains our largest competitor with respect to fixed line and DLD services and we also compete against other fixed line service providers such as PT Bakrie Telecom (formerly Ratelindo) and PT Batam Bintan Telecom. However, traditional fixed line services, have faced and will continue to increasingly face competition from cellular services, particularly as tariffs for these decrease, and from other alternate services such as fixed wireless, SMS, VoIP and e-mail services.
Our CDMA-based fixed wireless phone service, Telkom Flexi, is the largest wireless access network in Indonesia with coverage of 370 cities and offers limited mobility and charges customers at public switch telephone network (“PSTN”) tariff rates that are substantially lower than tariffs for cellular services. In comparison, Indosat launched its code division multiple access service under the brand name “StarOne” in Surabaya and Jakarta in 2004. Bakrie Telecom offers fixed wireless services in more than 30 cities and Mobile-8 was granted a nationwide fixed wireless access license in 2009, increasing competition in the fixed wireless phone sector. In general, the technologies employed by CDMA and fixed wireless access operators are less capital-intensive, allowing these operators to offer more competitive prices than GSM operators. In addition, fixed wireless frequency usage fees for radio station licenses are also lower compared to cellular.
-39-
Cellular
We operate our cellular service business through our majority-owned subsidiary, Telkomsel. As of December 31, 2011, Indonesia’s cellular market is dominated by Telkomsel, Indosat and XL Axiata, which collectively account for82.3% of the full-mobility cellular market. Other providers include Hutchison, Natrindo, Smart Telecom and Bakrie Telecom.
There were approximately249.4million full-mobility cellular subscribers in Indonesia as of December 31, 2011, a 21.1%increase from approximately205.8million as of December 31, 2010. Despite this growth, the cellular penetration rate in Indonesia remains low relative to that of other countries, at approximately105.0% as of December 31, 2011.
The cellular market has been characterized by increasing competition as it grew in recent years. Indonesian cellular providers historically competed on the basis of price, brand, network coverage, network quality and value-added services including data services. In 2007 and 2008, as a result of the shift from revenue-sharing to cost-based interconnection fees, most providers including ourselves increasingly competed on the basis of price and offered significant promotional discounts in an attempt to attract large numbers of subscribers. According to research by A.T. Kearney in 2009, Indonesia’s churn rate, the ratio of subscribers switching to another cellular provider, is among the highest in the world at approximately 11.0% per month. Both prepaid and postpaid Indonesian cellular subscribers are highly price sensitive and the latter enjoy low switching costs due to limited contractual lock-ins. The decrease in prices led to an increase in the number of subscribers and in network traffic, resulting in increased network congestion among operators.
We believe that Telkomsel competes effectively in the Indonesian cellular market on the basis of price, coverage, service quality and value added services.As of December 31, 2011, Telkomsel remained the largest national licensed provider of cellular services in Indonesia, withapproximately107.0million cellular subscribers and amarket share of42.9%of the full-mobility cellular market. The second and the third largest providers were Indosat and XL Axiata, which have a market share of20.7%and18.6% respectively, based on the estimated number of subscribers as of December 31, 2011. In addition to the nationwide GSM operators, a number of smaller regional GSM, analog and CDMA fixed wireless providers operate in Indonesia.
The following table sets out information as of December 31, 2011 for each of the three leading cellular providers with national coverage:
| | Operator | |
| | Telkomsel | | Indosat | | XL Axiata | |
Launch date | | May-1995 | | Nov-1994 | (2) | Oct-1996 | |
2G Licensed frequency bandwidth (GSM 900 & 1800) | | 30 MHz | | 30 MHz | | 15 MHz | |
3G Licensed frequency bandwidth (2.1 GHz) | | 10 MHz | | 10 MHz | | 10 MHz | |
Market share(1) | | 42.9% | | 20.7% | | 18.6% | |
Subscribers(1) | | 107.0million | | 51.7million | | 46.4million | |
(1) Internal estimate, dated December 31, 2011 based on various statistics compiled by us.
(2) In November 2003, Indosat and Satelindo merged and Indosat took over Satelindo’s cellular operations.
Hutchison and Natrindo also provide cellular services in Indonesia and in 2011 were each awarded an additional 5 MHz of spectrum on the 3G licensed frequency bandwidth (2.1 GHz). This additional spectrum increased their respective total allocated frequency spectrum to 10 MHz each. We expect to compete with Indosat and XL Axiata to obtain one of two additional blocks of 5 MHz 3G licensed frequency bandwidth (2.1 GHz) which we anticipate the Government to allocate in 2012.
In March 2010, Smart Telecom and Mobile-8 announced that they entered into a cooperation agreement to use the same logo and brand under the name “smartfren.” Other cellular service providers may similarly consolidate in the future.
In January 2012, Bakrie Telecom was allocated cellular telephone access numbers and is expected to be issued an operating license in the near future. We understand that Bakrie Telecom, which has historically operated a fixed wireless network, will deploy technology which switches from the fixed wireless access to cellular access outside of the base service area. We expect that our cellular telecommunications business will in the future face increasing competition from fixed wireless and broadband wireless telecommunications service providers offering similar mobility in their services.
-40-
IDD
We acquired a commercial IDD license in May 2004 and in June 2004 we began delivering full IDD services for our fixed wireline subscribers. We were awarded this license following the early termination by the DGPT in August 2001 of Indosat’s exclusive right to operate IDD services.
We conducted extensive preparations to offer IDD services prior to receiving our license in 2004. Our initial preparations included upgrading switching facilities to establish International Gateway capabilities in Batam, Jakarta and Surabaya. Two microwave links, connecting Batam-Singapore and Batam-Pangerang (Malaysia), were built to facilitate connections with overseas operators. In 2003, together with SingTel Mobile and CAT, we developed the TIS submarine cable system connecting Batam, Singapore and Thailand.We completed the deployment of a new submarine optical cable to connect Dumai (Indonesia) with Melaka (Malaysia) in December 2004, pursuant to an agreement with Telekom Malaysia Berhad. Our international cable was extended by purchasing bandwidth capacity to connect with Hong Kong, the United States and other countries. In December 2004 we completed the ground segment to connect to the Intelsat Satellite. The BSCS (Batam Singapore Cable System) network began operating in May 2009, while the AAG network began operating in October 2009. On January 25, 2008, Telkom transferred its international operations, including IDD, to one of our subsidiaries, Telin.
After Telkomsel, our largest consumer base for IDD services are users of XL Axiata. We anticipate that XL Axiata and another telecommunications company, Axis, may receive their own IDD operating licenses in 2012, which may have a material adverse effect on our IDD revenues.
The IDD service business faces increasing competition from alternate means of long distance communication, particularly VoIP.
VoIP
We formally launched our VoIP services in September 2002. VoIP uses data communications to transfer voice traffic over the internet, which usually provides substantial cost savings to subscribers. A number of other companies, including XL Axiata, Indosat, Atlasat, Gaharu, PT Satria Widya Prima, Primedia Armoekadata and Jasnita Telekomindo also provide licensed VoIP services in Indonesia. Other unlicensed operators also provide VoIP services that may be accessed through websites or through software that allows computer-to-computer voice communications through the internet.
VoIP operators compete primarily on the basis of price and service quality. VoIP operators, including us, have begun to offer budget calls and other products aimed at price sensitive users such as prepaid calling cards, which are expected to result in greater competition among VoIP operators and IDD service providers. We currently offer our primary VoIP service Telkom Global-01017 and its lower-cost alternative Telkom Save. Telkom Save offers discounted rates for certain countries to which there is heavy traffic from Indonesia while offering regular VoIP tariff rates for other countries. We offer a competing service called Telkom Global 01017.
Satellite
Competition in the satellite business in the Asia-Pacific region continues to intensify, particularly in terms of coverage, products and price. Because the domestic satellite industry is not strictly regulated, it operates in practice on an “open-sky” policy, which has opened the door to competition between Indonesian and foreign satellite operators.
TheAsia-Pacific region continues to needsatellites for bothtelecommunicationsandbroadcasting infrastructure, as indicated by the following factors:
- The number of regional and global operators directing their satellite services to the Asia-Pacific region;
- High market demand for GSM trunking;
- Continued growth in the Direct To Home (“DTH”) market; and
- The value of satellite services in disaster recovery.
-41-
The regionaland globalsatellite operators currently operating in theAsia-Pacific region are:
- Intelsat/PanAmsat (USA)
- SES Global (Luxembourg)/SES New Skies (Netherlands)
- Telesat (Canada)/Loral Skynet (USA)
- RSCC (Russia)
- Eutelsat (France)APT Satellite (Hong Kong)
- AsiaSat (Hong Kong)
- SCC (Japan)
- JSAT (Japan)
- MEASAT (Malaysia)
- Insat (India)
- MCI – Media Citra Indostar (Indonesia)
- Indosat (Indonesia)
- VinaSat (Vietnam)
- SingTel/Optus (Singapore)
- Telkom (Indonesia)
- ChinaSat (China)
- SinoSat (China)
- KoreaSat (Korea)
- Mabuhay (Philippines)
- Thaicom (Thailand)
- ABS (Hong Kong)
- ProtoStar (Singapore)
TheMobile Satellite Service (MSS) operators are as follows:
- Inmarsat (UK)
- Aces – Asia Cellular Satellite (Indonesia)
- Thuraya Satellite (UAE)
- Iridium (USA)
- Globalstar (USA)
- MBCO (Japan)
- Tu Media (Korea)
- CMBSAT (China)
Globalsatelliteoperators with higher capacity can take advantage of economies of scale to offer lower prices without affecting their financial performance. This will result in a market premium subsidy in very competitive markets. However,national operators can seek regulatory protection in the form ofentry barriers such aslanding rights imposed by governments on foreignsatellites.
The Government of Indonesiahas issued a new regulation onsatelliteoperation. MoCI RegulationNo.37/P/M.KOMINFO/12/2006 dated December 6, 2006requires overseassatellite operators to obtain alanding right license, with the following criteria:
- Foreignsatellite operators must coordinate withdomestic satellite operators to ensure that there is not disruption ofIndonesia’s satelliteand terrestrialsystems.
- Countries that operate theirsatellites inIndonesiamust allowIndonesian satellite operators to operate in their countries.
Generally, a provider’s cost of service depends on power and coverage. Our satellite operations primarily consist of leasing transponders to broadcasters and telecommunications operators of VSAT, cellular and IDD services and ISPs and providing earth station satellite uplinking and downlinking service to domestic and international users. We face competition from foreign and domestic service providers and compete most closely in Indonesia with Indosat and PT Pasifik Satelit Nusantara (“Pasifik Satelit Nusantara”). Other private satellites serving the broadcast market within the coverage area of the Telkom-1 and Telkom-2 satellites include AsiaSat-2, AsiaSat-4, AsiaSat-3S, Apstar-2R, Apstar-5, Apstar-6, ThaiCom 3, Measat-2, Measat-3, Measat-3a, PanAmSat-4 and PanAmSat-7. Measat Sdn. Bhd which operates the Measat satellites, APT Satellite, which operates the Apstar satellites and Shin Satellite PCL which operates the ThaiCom satellites. They also compete directly with us in the Asian regional market.
-42-
Moreover, with the increasing popularity of Direct-To-Home television (“DTH”), there is increasing competition in the satellite business as new and more powerful regional satellites are launched. DTH is the reception of satellite programs with a personal dish in an individual home. National broadcasters are seeking DTH licenses to provide nationwide broadcast services in Indonesia. DTH television will enable broadcasters to distribute their program content without utilizing our telecommunication network support, thereby entirely bypassing our telecommunications services. In addition, because of the growing popularity of DTH, we face the possible loss of customers because DTH uses a satellite platform that we do not provide.
BTS
We operate48.341 base transceiver stations, towers, located throughout Indonesia. Through our subsidiary, PT Dayamitra Telekomunikasi we lease out space to other operators to place their telecommunications equipment on these towers, for which we receive a fee. Our principal competitors in this business are XL Axiata, Indosat, Bakrie Telecom and PT Tower Bersama.
Others
Deregulation in the Indonesian telecommunications sector has encouraged competition in the multimedia, internet, and data communications services businesses. The diversification of businesses has gained momentum, with the result that competition is now intense, particularly in terms of price, range of services offered, quality and network coverage, as well as customer service quality.
Licensing
To provide national telecommunications services, Telkom has a number of product and service licenses that are consistent with the applicable laws, regulations or decisions.
Following the issuance of MoCI Regulation No.01/PER/M.KOMINFO/01/2010 dated January 25, 2010 concerning the Provision of Telecommunication Network, Telkom is required to adjust the telecommunications services which it holds to the provisions of the MoCI Regulation, particularly in regards to telecommunication network services. Telkom has secured new licenses that have been adjusted as required of which are as follows:
Fixed Network and Basic Telephony Services
Based on the report submitted by Telkom concerning the operation of fixed network and as part of the adjustment to MoCI Decree No.01, Telkom had its licenses adjusted in 2010 for the operation of local fixed network, direct long distance, international call and closed fixed network, explained as follows:
- MoCI Decree No.381/KEP/M.KOMINFO/10/2010 dated October28,2010 on the License of Operating Local Fixed Network and Basic Telephony Services of PT Telekomunikasi Indonesia, Tbk.;
- MoCI Decree No.382/KEP/M.KOMINFO/10/2010 dated October28,2010 on the License of Operating Fixed Network of Direct Long Distance and Basic Telephony of PT Telekomunikasi Indonesia, Tbk.;
- MoCI Decree No.383/KEP/M.KOMINFO/10/2010 dated October28,2010 on the License of Operating Fixed Network of International Call and Basic Telephony Services of PT Telekomunikasi Indonesia, Tbk.; and
- MoCI Decree No.398/KEP/M.KOMINFO/11/2010 datedNovember 12,2010 on the License of Operating Closed Fixed Network of PT Telekomunikasi Indonesia, Tbk.
Following the issuance of MoCI Decrees No.381, 382 and 383, our previous licenses for operating a fixed network and basic telephony services previously owned by Telkom based on MoC Decree No.KP.162 Year 2004 dated 13 May 2004 ceased to be in effect. The licenses do not have a set expiry date, but are evaluated every five years.
-43-
Cellular
Telkomsel holds licenses to operate a nationwide GSM mobile cellular telephone network using 7.5 MHz of radio frequency bandwidth in the 900 MHz band and using 22.5 MHz of radio frequency bandwidth in the 1,800 MHz band. Telkomsel also holds licenses from the Indonesian Investment Coordinating Board that permit Telkomsel to develop cellular services with national coverage, including the expansion of its network capacity. In addition, Telkomsel holds permits and licenses from and registrations with certain regional governments and/or governmental agencies, primarily in connection with its operations in such regions, the properties it owns and/or the construction and use of its BTS.
In February 2006, the Government held a tender for three 2.1 GHz spectrum licenses, each with a bandwidth of 5 MHz, to be used in conjunction with the new licenses to operate a nationwide 3G cellular telecommunication network. One of the licenses went to Telkomsel. Telkomsel obtained a 3G license on a 2.1 GHz band for a ten-year period as set out regulated in MoCI Decree No.19/KEP/M.KOMINFO/2/2006 dated February14, 2006. The license will be extended after being evaluated by the MoCI. Telkomsel started its commercial 3G service in September 2006.
Based onMoCI DecreeNo.101/KEP/M.KOMINFO/10/2006 dated October 11, 2006, Telkomsel had its license renewed by granting Telkomsel rights to provide: (i) mobile telecommunications service with radio frequency bandwidth in 900 MHz and 1,800 MHz; (ii) mobile telecommunications service of IMT-2000 with radio frequency bandwidth in 2.1 GHz (3G) and (iii) basic telecommunications services.The licenses do not have a set expiry date, but it will be evaluated every five year.
International Calls
Telkom commenced its international call service in 2004. Our license for operating a fixed network to provide international call services was adjusted in 2010 to meet in the requirements of MoCI Decree No.01/2010 with the issuance of MoCI Decree No.383/2010. The license does not have a set expiry date, but it will be evaluated in 2015.
Telkom has a license to operate a closed fixed network based on MoCI Decree No.398/2010, which adjust the previous license, to meet the provisions in MoCI Decree No.01/2010. The license allows Telkom to lease the installed closed fixed network to among others telecommunication network and service operators, including providing an international telecommunication transmission facility through a SCCS directly to Indonesia for overseas telecommunication operators.
According to MoCI Decree No.16/PER/M.KOMINFO/9/2005 dated October 6, 2005 concerning Provision of International Telecommunications Transmission Facilities through SCCS, overseas telecommunications operators wishing to provide an international telecommunications transmission facilities through the SCCS directly to Indonesia are required to set up a partnership with a fixed network of international call services or closed fixed network provider. In line with MoCI Decree No.16/2005, the international telecommunication transmission facilities provided through SCCS are served by Telkom on the basis of landing rights attached to Telkom’s license to operate fixed network of international call services. Telkom has also secured landing rights based on the landing right Letter No.006-OS/DJPT.6/HLS/3/2010 dated March 2, 2010 from MoCI.
On March 2, 2010, the MoCI issued Decree No.75/KEP/M.KOMINFO/03/2010 granting Telin a Telkom subsidiary, a license to operate a closed fixed line network which enables Telin to provide international infrastructure services. Separately, Telin secured landing rights in Indonesia from the DGPT to provide international telecommunications transmission facilities through SCCS.
VoIP
Telkom is licensed to provide internet telephony services for public needs as stated in DGPT Decree No.384/KEP/DJPT/KOMINFO/11/2010 dated November29,2010on VoIP services. This license does do not have a set expiry date, but it will be evaluated every five years.
ISP
Telkom is licensed as an Internet Services Provider under DGPIO Decree No.83/KEP/DJPPI/KOMINFO/4/2011 dated April 7, 2011. This license does not have a set expiry date, but it will be evaluated every five year.
-44-
Network Access Point
We hold a license to provide internet interconnection services by referring to DGPT Decree No.275/Dirjen/2006. The term of this license is unlimited, but it will be evaluated every five year.
Broadband Wireless Access (“BWA”)
In July 2009, Telkom won tender for a BWA license and the right to provide BWA services in 12 zones, comprising 7 zones on 3.3 GHz (North Sumatra, South Sumatra, Central Sumatra, West Kalimantan, East Kalimantan, West Java, JABODETABEK and Banten) and 5 zoneson 2.3 GHz (Central Java, East Java, Papua, Maluku, and the northern part of Sulawesi).
In August 2009, the MoCI issued Ministerial Decree No.237/KEP/M.KOMINFO/7/2009 regarding the Appointment of the Winning Bidders for Packet Switched-Based Local Fixed Access Network Operators Using the 2.3 GHz Radio Frequency for Wireless Broadband Services. Because of inadequate implementation by the winning bidders, the MoCI later issued Regulation No.19/PER/M.KOMINFO/09/2011 dated September 14, 2011 (“MoCI Regulation No. 19/2011”), which released operators on the 2.3GHz radio frequency from the obligation to use the particular technology specified in the bid terms for the 2.3 GHz radio frequency, which were set out in MoCI Regulation No.22/PER/M.KOMINF0/04/2009 April 24, 2009 (“MoCI Regulation No. 22/2009”). Pursuant to MoCI Regulation No. 19/2011, operators on the 2.3 GHz radio frequency are now permitted to choose freely their technology in providing BWA on the 2.3 GHz radio frequency, subject to a requirement that they pay an annual usage rights fee for the third through the tenth year of the license period in which a technology divergent from that specified in MoCI Regulation No. 22/2009 is used. On January 9, 2012, MoCI announced that it plans to make available for bidding additional 2.3 GHz radio frequency in the 2300-2360 MHz range for BWA services utilizing neutral technology.
MoCI Regulation No. 19/2011 also stipulates domestic component obligations for telecommunications devices and equipment used in providing BWA on the 2.3 GHz radio frequency. Initial domestic component obligations are 30% for subscriber stations and 40% for base stations, to be increased to 50% within five years.
As a result of the switch to neutral technology under MoCI Regulation No. 19/2011, we lost vendor support for our preferred technology, which is based on fixed BWA technology. Vendors instead preferred to support the mobile BWA technology selected by other operators. Mobile BWA technology competes with Telkomsel. We therefore returned 4 of the 5 zones for 2.3 GHz BWA which we had received. We retained our BWA license and the Maluku zone so we would continue to qualify as a BWA operator on 2.3 GHz and have the right to access the BWA networks maintained by other operators.
Becoming a broadband wireless access operator is in line with the transformation of our business to TIME, which requires us to have infrastructure that is capable of responding to an increasingly complex market and the demand for ever more convergent products and services, whether in the consumer, enterprise or wholesale segments.
Data Communication System (“SISKOMDAT”)
Pursuant to MoC Decree No.KM.30/2004 regarding the Operation of Telecommunications Services, we are required to have a SISKOMDAT operating license. The SISKOMDAT Operating License is required to provide data communications services. We received our SISKOMDAT operating license on June 6, 2011. We had previously used a closed fixed network license for our data communications services.
Pay TV License for Indonusa
Pursuant to Law No.32 of year 2002 regarding Broadcasting and Government Regulation No.52/2005 regarding the Operation of Subscription Broadcasting (the two year license conversion period), PT Indonusa Telemedia, our subsidiary, applied for a Pay-TV Operator license from the Government in 2007. MoCI has issued license for Pay TV Broadcasting to PT Indonusa Telemedia under MoCI Decree No.392/KEP/M.KOMINFO/11/2010 dated November 11, 2010.
PT Indonusa Telemedia obtained an IPTV license covering JABODETABEK, Bali, Bandung, Semarang and Surabaya on April 27, 2011. We launched our commercial IPTV service under the brand name Groovia TV in August 2011.
-45-
Payment Method Using e-Money
Following the implementation of Bank Indonesia’s Regulation No.11/11/PBI/2009 and Circular Letter of Bank Indonesia No.11/10/DASP each dated on May 13, 2009 on the operation of APMK and Bank Indonesia’s Regulation No.11/12/PBI/2009 and Circular Letter of Bank Indonesia No.11/11/DASP each dated May 13, 2009 on e-money, Bank Indonesia has redefined the meaning of “principal” and “acquirer” in operating APMK and e-money business. In light of these regulations, Bank Indonesia confirmed Telkom’s status as an issuer of e-money based on letter of Directorate of Accounting and Payment System of Bank Indonesia No.11/13/DASP dated May 25, 2009. We operate our e-money business under the brand name T-cash and Flexi cash.
Money Transfer Operations
Based on a license from Bank Indonesia No.11/23/Bd/8, dated August 5, 2009, we may operate as a money transfer services provider. Telkom provides a money transfer services product called Delima.
Tariffs And Interconnection Charges
We set our telecommunications tariffs in accordance with government regulations. The Government divides tariffs into two categories: tariffs on the provision of telecommunications services and tariffs on telecommunications networks. Telecommunications operators can determine the prices they charge and compete freely with each other, subject to MOCI regulations. Our business units can also adjust the prices of the services they provide based on specific guidelines from our Board of Directors.
1. Telecommunications
- Fixed Wireline Tariffs
Access and monthly subscription charges
Access charges | | Business (Rp) | | Residential (Rp) | | Social (Rp) | |
Installation | | 175,000 - 450,000 | | 75,000 - 295,000 | | 50,000 - 205,000 | |
Monthly subscription | | 38,400 - 57,600 | | 20,600 - 32,600 | | 12,500 - 18,500 | |
Local usage charges
| | Price per Pulse(Rp) | | Pulse Duration | |
Up to 20 km | | 250 | | 3 minutes (off peak) and 2 minutes (peak) | |
More than 20 km | | 250 | | 2 minutes (off peak) and 1.5 minutes (peak) | |
Domestic long distance (DLD)
| | Price per Minute (Rp) | | Rounding Time Block Duration | |
0-20 km | | 83 - 122 | | 1 minute | |
20-30 km | | 122 - 163 | | 1 minute | |
30-200 km | | 320 - 1,100 | | 6 seconds | |
200-500 km | | 320 - 1,770 | | 6 seconds | |
More than 500 km | | 320 - 2,100 | | 6 seconds | |
-46-
- Fixed Wireless Tariff
We offer both postpaid and prepaid fixed wireless services. Tariffs for fixed wireless services are reported as our fixed line revenues.
- Postpaid (Flexi Classy)
Postpaid subscribers pay a one-time activation charge of Rp7,500 and a monthly charge of Rp30,000, excluding 10% VAT. Subscribers payRp75 per SMS to Flexi (on-net) and Telkom fixed lines, Rp136 from Flexi to other operators and Rp450 from Flexi to international destinations.
Charges for postpaid services are as follows:
| | Price per Unit (Rp) | | Unit Duration | |
Flexi to Flexi | | | | | |
Local | | 49 | | 1 minute | |
DLD | | 300 | | 30 seconds | |
Flexi to PSTN | | | | | |
Local | | 200 | | 1 minute | |
DLD | | 600 | | 30 seconds | |
Flexi to OLO fixed line | | | | | |
Local | | 270 | | 1 minute | |
DLD | | 625 | | 30 seconds | |
Flexi to Mobile | | | | | |
Local | | 550 | | 1 minute | |
DLD | | 625 | | 30 seconds | |
Flexi to Mobile Satellite (Byru) | | 3,850 | | 30 seconds | |
- Prepaid (Telkom Flexi Trendy)
Prepaid wireless subscribers pay Rp100 per SMS from Flexi to Flexi (on-net) and Telkom fixed line, Rp165 per message to other operators and Rp500 per message from Flexi to international destinations. Usage charges, including 10% VAT, are as follows:
| | Price per Unit (Rp) | | Unit Duration | |
Flexi to Flexi | | | | | |
Local | | 55 | | 1 minute | |
DLD | | 375 | | 30 seconds | |
Flexi to PSTN | | | | | |
Local | | 250 | | 1 minute | |
DLD | | 750 | | 30 seconds | |
Flexi to OLO fixed line | | | | | |
Local | | 350 | | 1 minute | |
DLD | | 800 | | 30 seconds | |
Flexi to Mobile | | | | | |
Local | | 780 | | 1 minute | |
DLD | | 800 | | 30 seconds | |
Flexi to Mobile Satellite (Byru) | | 4,235 | | 30 seconds | |
-47-
- IDD Tariffs
Tariffs for IDD calls are set by service providers and subject to specified maximum limits established by the Government. We charge the following IDD tariffs:
| | | Price per Minute (Rp) | | | |
Region | | PSTN/CLASSY | | TRENDY | | Rounding Time Block Duration | |
Group I | Southeast Asia, South Pacific | | 4,550 | | 5,550 | | 6 seconds | |
Group II | North America, South America, Africa, East Asia, West Asia and South Asia | | 5,550 | | 6,550 | | 6 seconds | |
Group III | Europe | | 7,570 | | 8,700 | | 6 seconds | |
Group IV | Middle East | | 8,080 | | 9,290 | | 6 seconds | |
Group V | Special destinations | | 20,200 | | 23,300 | | 6 seconds | |
- VoIP Tariffs
VoIP operators may freely determine charges for VoIP services. We currently offer our primary VoIP service, Telkom Global-01017, and its lower-cost alternative, Telkom Save.
- Cellular Tariffs
- Postpaid Tariffs (kartuHALO)
Telkomsel charges subscribers the following basic usage tariffs in 2011:
| | Price (Rp) | | Rounding Time Block Duration | |
On-net cellular: | | | | | |
Local | | 217 | | 20 seconds | |
DLD | | 213 | | 15 seconds | |
Off-net cellular: | | | | | |
Local | | 250 | | 20 seconds | |
DLD | | 300 | | 15 seconds | |
Off-net PSTN: | | | | | |
Local | | 217 | | 20 seconds | |
DLD | | 300 | | 15 seconds | |
SMS (price per SMS) : | | | | | |
On-net | | 125 | | | |
Off-net | | 150 | | | |
International | | 500 | | | |
-48-
- Prepaid Tariffs
Prepaid customers (simPATI and Kartu As) were charged the following basic usage charges in 2011:
| | Price (Rp) | | Rounding Time Block Duration | |
| | simPATI | | Kartu As | | simPATI | | Kartu As | |
On-net cellular: | | | | | | | | | |
Local | | 750 | | 13 | | per 30 seconds | | per second | |
DLD | | 750 | | 13 | | per 30 seconds | | per second | |
Off-net cellular: | | | | | | | | | |
Local | | 800 | | 13 | | per 30 seconds | | per second | |
DLD | | 1,000 | | 13 | | per 30 seconds | | per second | |
Off-net PSTN: | | | | | | | | | |
Local | | 450 | | 13 | | per 30 seconds | | per second | |
DLD | | | | 13 | | | | per second | |
Zona-1 | | 900 | | | | per 30 seconds | | | |
Zona-2 | | 900 | | | | per 30 seconds | | | |
Zona-3 | | 900 | | | | per 30 seconds | | | |
SMS (price per SMS): | | | | | | | �� | | |
On-net | | 100 | | 99 | | | | | |
Off-net | | 150 | | 99 | | | | | |
International | | 600 | | 1,000 | | | | | |
- Network Tariffs
- Leased Lines
The format, type, rate structure and the tariff formula for network leases are subject to government regulations.
Leased lines are unmanaged terrestrial transmission network services for electronic communications that provide a dedicated connection between two terminal points or points of presence (“POP”) for the customer’s exclusive use by symmetrical transmission channel capacity.The tariffs for leased lines, effective since June 15, 2011, are as follows:
| | Tariff (Rp) | |
Activation | | | |
Subscription charge | | 2,400,000 - 30,000,000 | (1) |
Usage charges: | | | |
Point to Point | | | |
Local (up to 25 km) | | 1,200,000 - 84,300,000 | (2) |
Long distance (more than 25 km) | | 3,900,000 - 1,257,800,000 | (2) |
End to End | | | |
Local (up to 25 km) | | 3,400,000 - 187,800,000 | (2) |
Long distance (more than 25 km) | | 6,100,000 - 1,361,300,000 | (2) |
(1) Price differs by speed
(2) Price differs by speed and region
- Satellite Tariffs
We charge a maximum annual satellite tariff of US$1.20 million per transponder, but we offer discounts for long-term customers and repeat customers.
-49-
- Data Communications Tariffs
- Broadband Access (“Speedy”)
Broadband access is available through a range of Speedy packages. Prepaid Speedy subscribers pay Rp 75/minute; however, selective discounts apply in red zone areas (highly competitive areas)
The following table shows our broadband access tariffs:
Speedy Postpaid Services | | Activation Fee | | Monthly Charge | | Monthly Usage Allowance | | Excess Usage Charge | |
| | (Rp) | | (Rp) | | | | (Rp) | |
Volume Based* | | | | | | | | | |
Limited Home | | 75,000 | | 200,000 | | 1.0Gb | | 175/MB | |
Limited Professional | | 75,000 | | 400,000 | | 3.0Gb | | 175/MB | |
Unlimited Office | | 75,000 | | 750,000 | | Unlimited | | - | |
Unlimited Warnet | | 75,000 | | 1,750,000 | | Unlimited | | - | |
(*) Valid for existing customers before migration to the Speedy multi speed package, but not for new customers.
Speedy Postpaid Services | | Activation Fee | | Monthly Charge | | Link speed | |
| | (Rp) | | (Rp) | | | |
Multispeed** | | | | | | | |
Socialia | | 75,000 | | 195,000 | | Up to 384 Kbps | |
Load | | 75,000 | | 275,000 | | Up to 512 Kbps | |
Familia | | 75,000 | | 455,000 | | Up to 1 Mbps | |
Executive | | 75,000 | | 695,000 | | Up to 2 Mbps | |
Biz | | 75,000 | | 995,000 | | Up to 3 Mbps | |
(**) Valid for new Speedy Package customers and existing customers
Speedy Postpaid Services | | Activation Fee | | Monthly Charge | | Monthly Usage Allowance | | Link Speed | | Excess Usage Charge | |
| | (Rp) | | (Rp) | | | | | | | |
Time Based | | | | | | | | | | | |
Limited 15 hours/month | | 75,000 | | 75,000 | | 15 hours | | Up to 1 Mbps | | 75/minute | |
Limited 50 hours/month | | 75,000 | | 145,000 | | 50 hours | | Up to 1 Mbps | | 25/minute | |
- Flexinet Access
a. Flexi Postpaid
For internet access via PDN or WAP (using #777), Flexi Postpaid subscribers pay Rp200 per minute or Rp3 per Kbps. Internet access via wireless dial-up (using TelkomNet Instan on 0809 89999) is charged, in accordance with TelkomNet Instan’s tariff policy, per 30 seconds.
For Flexinet Unlimited Telkom Flexi Classy data services, subscribers have the option of three service packages: the daily package, which charges Rp2,250/day and is valid for a 24-hour period, the weekly package, which charges Rp13,500/week and is valid for 7 x 24 hours, and the monthly package, which charges Rp45,000/month with a valid period of 30 days (excluding 10% VAT).
-50-
b. Flexi Prepaid
For internet access via PDN, we charge prepaid subscribers Rp220 per minute or Rp5 per Kbps. Prepaid subscribers who use our internet access via wireless dial-up and WAP pay Rp300 per minute and Rp5 per Kbps.
For FlexiNet Unlimited Telkom Flexi Trendy data services there are three service packages: the daily package, sold for Rp 2,500/day and is valid for a 24-hour period, the weekly package at Rp15,000/week which is valid for seven days, and the monthly package sold for Rp50,000/month with a valid period of 30 days (tariffs including 10% VAT).
- Telkom Link
Our Telkom Link data communication services include DINAccess, VPN Frame Relay, VPN IP, VPN Dial, VPN Instan, Transactional Access, Global Datacom, Video Conference, Telkom Metro, and VPN Lite. We set the tariffs for these services on the basis of benefit and profitability for the company, referring to business environment analysis of market prices, the prices offered by our competitors, volume and duration of subscription, level of customer access and/or other economic considerations.
h. Interconnection Tariffs
The MoCI establishes tariffs for interconnection and access, including the amount of interconnection charges to be received by each operator from calls that are relayed through multiple networks. The operators charge for such calls based on fixed rate that are intended to reflect the cost of carrying these.
Interconnection tariffs for fixed line (PSTN) connections:
1. Local origination to OLO is Rp73 to Rp283/minute.
2. Long distance origination to OLO is Rp539 to Rp608/minute.
3. International origination to international OLO is Rp594/minute.
4. Local termination from OLO is Rp73 to Rp283/minute.
5. Long distance termination from OLO is Rp539 to Rp608/minute.
6. International termination from international OLO is Rp594/minute.
7. Local transit service (OLO to fixed wireline to OLO) is Rp67/minute.
8. Long distance transit service (OLO to fixed wireline to OLO) is Rp273/minute.
9. International transit gateway (OLO to fixed wireline to OLO) is Rp290/minute.
Interconnection tariffs for fixed wireless access:
1. Local origination to OLO is Rp73 to Rp271/minute.
2. Long distance origination to OLO is Rp419 to Rp611/minute.
3. International origination to international OLO is Rp610/minute.
4. Local termination from OLO is Rp73 to Rp271/minute.
5. Long distance termination from OLO is Rp419 to Rp611/minute.
6. International termination from international OLO is Rp610/minute.
Interconnection tariffs for cellular connections:
1. Local termination and origination voice service tariff is Rp251/minute.
2. Long distance termination and origination voice service tariff is Rp357 to Rp463/minute.
3. International termination and origination voice service tariff is Rp453/minute.
i. Public Phone Kiosk Tariffs
Kiosk phones are public phones that are operated by third parties. Charges for kiosk phones may be freely determined by providers. We are entitled to retain a maximum of 70% and 92% of the phone kiosk basic traffic for domestic and international calls, respectively.
2. Information, Media and Edutainment Business (“IME”)
In providing IME services, our New Wave business, we work with a number of partners. These collaborations are based on considerations of capability, time to market and idea creation. The tariffs for our IME services are determined by the Service Strategy & Tariff Unit, while we cooperate with our partners to set the selling prices to the end users of the IME services they provide.
-51-
Trademarks, Copyrights And Patents
With a dynamic business portfolio, we are constantly developing product and service innovations. To provide both protection for and recognition of the creativity involved, we have registered a number of intellectual property rights, including trademarks, copyrights and patents, with the Directorate General of Intellectual Property Rights at the Ministry of Law and Human Rights of Indonesia.
The intellectual property rights we have registered include: (i) trademarks for our products and services, corporate logo and name; (ii) copyrights on our corporate name, logo, product and service logos, computer programs, research and songs; and (iii) simple and ordinary patents on technological inventions in the form of telecommunications products, systems and methods.
The following list shows the trademarks and copyrights we registered during 2010-2011:
No | | Trademark | | Application No. | | Application Date | | Registration Date | |
1 | | Telkom Vote | | R002011001826 | | February 21, 2011 | | May 31, 2011 | |
2 | | Andara | | R002011001830 | | February 21, 2011 | | May 31, 2011 | |
3 | | Telkom Save | | R002011001831 | | February 21, 2011 | | May 31, 2011 | |
4 | | Sandi Nada | | R002011001832 | | February 21, 2011 | | May 31, 2011 | |
5 | | Telkom e-Learning | | R002011001833 | | February 21, 2011 | | May 31, 2011 | |
6 | | Telkom Klip | | R002011001834 | | February 21, 2011 | | May 31, 2011 | |
7 | | Telkom Permata | | R002011001817 | | February 21, 2011 | | May 31, 2011 | |
8 | | Trimitra | | R002011001820 | | February 21, 2011 | | May 31, 2011 | |
9 | | Telkom Memo | | R002011001825 | | February 21, 2011 | | May 31, 2011 | |
10 | | Telkomnet | | R002011001837 | | February 21, 2011 | | May 31, 2011 | |
11 | | Telkomnet Instan | | R002011001829 | | February 21, 2011 | | May 31, 2011 | |
12 | | Telkom 108 | | R002011001828 | | February 21, 2011 | | May 31, 2011 | |
13 | | Telkom Indonesia with the tagline “The World in Your Hand” | | J002009036810 | | November 13, 2009 | | June 17, 2011 | |
14 | | Telkom Indonesia | | J002009036809 | | November 13, 2009 | | June 17, 2011 | |
15 | | Speedy Pre Paid | | D002009017071 | | May 25, 2009 | | November 23, 2010 | |
16 | | Flexi Lebih Irit Kan | | J002010020956 | | June 9, 2010 | | October 11, 2011 | |
17 | | Flexi Land | | J002008028409 | | August 6, 2008 | | May 17, 2010 | |
No | | Research/Innovation title | | Application No. | | Application Date | | Registration Date | |
1 | | Computer Program: “Home Monitoring Application” | | C00200904712 | | December 21, 2009 | | June 27, 2011 | |
2 | | Computer Program: “VIPO-Based Information Dissemination System” | | C00200904713 | | December 21, 2009 | | June 27, 2011 | |
3 | | Computer Program: “Activity-Based Pricing (ABP) Data management System and Web-based Price Calculation Simulation” | | C0020094711 | | December 21, 2009 | | June 27, 2011 | |
4 | | Research paper: “Data Packet Security System on the Flexi Network” | | C00200901819 | | May 25, 2009 | | June 14, 2010 | |
5 | | Paper entitled “Telecommunication System Standard Tera Router” | | C00200900098 | | January 13, 2009 | | January 28, 2010 | |
6 | | Paper entitled “Technology Release Tera Router Technology” | | C00200900099 | | January 13, 2009 | | January 28, 2010 | |
-52-
We applied for the following patents in 2010:
No | | Patent Name | | Application No. | | Application Date | |
1 | | Set Top Box (STB) for Internet Access via Television | | P00201000916 | | December 23, 2010 | |
2 | | Budgeted Calls for Prepaid Customers | | P00201000915 | | December 23, 2010 | |
3 | | Information Delivery System via SCA on Radio Transmitters | | P00201000430 | | July 12, 2010 | |
4 | | Home Automation by Internet Access Method | | P00201000373 | | June 9, 2010 | |
5 | | Text Insertion for SMS using Prefix | | P00201000129 | | February 17, 2010 | |
6 | | Interactive Unstructured Supplementary Service Data (USSD) on CDMA System | | P00201000032 | | January 14, 2010 | |
7 | | Voice Chat Room on Mobile Networks | | P00201000032 | | January 14, 2010 | |
Network Development
a. Fixed Line Network Development
In 2011, we strengthened our NGN infrastructure in line with the INSYNC2014 Master Plan to create a Next Generation National Backbone Network to support our “Broadband for Digital Home”, “Broadband for Enterprise” and “Broadband Anywhere” services.
Key developments in our fixed line network development during 2011 were as follows:
Project | | Description | |
Java-Sumatra-Kalimantan (Jasuka) Project | | We continued to expand the capacity of our Jasuka submarine infrastructure backbone to support domestic and international internet. This project also expanded Telkomsel’s capacity. During 2011, 15 lambda (150Gb) of additional capacity was installed for Ring 3, 4 lambda (40Gb) for Ring 1A, and 2 lambda (20Gb) for Ring 2. | |
Mataram-Kupang Palapa Ring Project | | The procurement and installation contract for the Palapa Ring Mataram-Kupang submarine cable system was signed on November 24, 2009. We completed the development of the submarine transport backbone from Mataram to Kupang in November 2011, providing an initial capacity of 40Gb. This will provide a network link between Mataram and Kupang, connecting the islands of Lombok, Sumbawa, Sumba, Flores and Timor. The project has continued to develop a terrestrial cable transport backbone from Kupang to Atambua, which is scheduled for completion in May 2012. | |
Development and Modernization of Broadband Access through the Trade In Trade Off (“TITO”) Model | | In order to develop high capacity broadband access, in 2011 we initiated the Development and Modernization of Broadband Access Program through the TITO (Trade In Trade Off) model. The TITO program replaces our existing copper cables with fiber optic cables and modern technologies such as MSAN, GPON, and FTTx. We are collaborating with PT INTI and PT Len on this program. To date, we have successfully migrated, through the TITO program, 64,352 phone connections of existing customers out of a total installed capacity of 386,598 phone lines, and the remainder will be completed in March 2012. In 2012 we will continue the TITO program by installing 41 exchanges with PT INTIi and 25 exchanges with a second partner, with a total capacity of 2.27 million phone connections. | |
Broadband Access Expansion through the MSAN Platform | | We expanded our MSAN broadband network platform to a total of 313,893 fixed line connections in 2009 and 299,936 connection in 2010. We now have three MSAN platforms providing nationwide coverage. In 2011, the MSAN broadband platform project completed a total of 496,664 SST. | |
-53-
Project | | Description | |
Gigabyte-Passive Optical Network (“GPON”) Development Project | | In 2011, we expanded our GPON to a total of 40,735 Optical Network Terminals (“ONT”), some of which supported node B and Fiber To The Home (“FTTH”) deployment. In 2012, we plan to continue the expansion of our broadband access infrastructure, prioritizing the utilization of GPON technology to expand the implementation of the FTTH network. | |
IMS (IP Multimedia Subsystem) Development | | IMS development is part of our infrastructure transformation, aimed at modernizing our service nodes by providing IP capability, convergence and enabling new application-based services, which will eventually integrate new customers and migration customers. In 2011, we developed infrastructure on a lab scale as a demonstration as well as a service innovation. In 2012 we plan to commercialize this system which will be done on August. | |
Tarakan Sangata Cable System (“TSCS”) Project, Sumatra Bangka Cable System (“SBCS”) | | In 2011, to add capacity and establish a high-reliability transport backbone, we began the installation of submarine transport backbone in Sumatra-Bangka and Tarakan-Sangata. The TSCS and SBCS projects are currently in the development phase, which will be completed at the end of 2012. | |
Telkom-3 Satellite Project | | To defend our market share and grow our revenue from the satellite market, we are currently constructing the Telkom-3 Satellite, which will have 42 active transponders, which is equivalent to 49 transponders with BW 36MHz, with a geographical coverage that extends to Indonesia and ASEAN (Standard C-Band), Indonesia and Malaysia (Ext. C-Band) and Indonesia (Ku-Band). The Telkom-3 Satellite will be launched in mid-2012. | |
Regional DWDM Project | | To meet the growing domestic internet demand in the regional metro segment, in 2011 we installed a total of 22 DWDM transport nodes at the regional metro level in Java. The regional DWDM Project will be completed by the end of 2012. | |
Implementation of the Telkom Cache System | | We initiated the development of our cache system on our internet network to increase the efficiency of international internet bandwidth utilization and to upgrade the performance quality of our Internet services. This development is scheduled for completion in April 2012. | |
To further consolidate our TIME services, we plan to:
- Continue to implement and transform our networks in support of our three visions for broadband implementation: home digital environment, enterprise broadband and broadband anywhere;
- Continue to enhance the capability of the full IP transport network through the following programs: increasing domestic and international internet bandwidth, expanding the Terra IP backbone, expanding IP over Lambda based on 10Gb, 40Gb and eventually 100Gb per lambda, enhancing synergies within the Telkom Group in support of converged and single transport, continuing the development of Metro Ethernet which functions as a single transport metro network to provide IP-based and multiplay services, continuing the implementation of FTTH and GPON, and continuing the migration of our existing copper cables through the trade-in/trade-off mechanism;
- Implement smart core through the converged service IMS program-based platform, implement an integrated customer profile database, and implement service delivery platform for service brokerage and orchestration;
- Expand broadband access coverage to enterprise and residential customers through a range of programs, including Managed Enterprise Services, Managed Smart Customer Premises Equipment (“CPE”), Home Automation, Surveillance, and Home Interconnect.
For more details of our other major commitments and contracts, see Note 37 to our Consolidated Financial Statements.
-54-
b. Fixed Wireless Network Development
The Fixed Wireless Network Divisionbecame an independent, integrated division in 2009, and is now known as the DTF.
In 2011, DTF optimized our existing BTSs and relocated BTSs from areas with low traffic to intercity area to increase utilization. At December 31, 2011, we had 5,718 BTS with a total capacity of 33.3 million Flexi connections.
In 2011, DTF also developed a Flexi mobile broadband service to improve the quality by implementation Evolution Data Optimization (“EVDO”) technology. The EVDO network was established in the following 10 cities: Medan, Pekanbaru, Jakarta, Bandung, Yogyakarta, Surabaya, Malang, Denpasar, Banjarmasin and Makassar. A total of 1,123 EVDO BTS were constructed in 2011 with a total capacity of 281,203. A number of other programs were also introduced to improve our operating cost efficiency, such as initiating the implementation of free cooling and hydrocarbons for greater electricity cost efficiency.
c. Cellular Network Development
GSM-based cellular services operated by our subsidiary, Telkomsel, now reach all municipalities and regencies in Indonesia. In 2011, Telkomsel deployed an additional 6,066 BTS (including 1,736 3.5G nodes) and 73,695 transmitting and receiving exchanges, and expanded its cellular network to reach all districts in Java, Bali, Nusa Tenggara, and Sumatra.
Telkomsel plans to continue installing additional BTS to extend its capacity to districts in Kalimantan, Sulawesi and Eastern Indonesia, to increase capacity in densely populated areas, develop the 3G network, continue developing the fiber optic transmission backbone in major cities in Java, install additional micro cells and transmitting and receiving exchanges, primarily in provinces, continue to improve the quality of its coverage, upgrade switching equipment to enhance network capacity, and expand its smart network used in connection with its products.
d. Data Network Development
In 2011, we continued to improve the quality of our data network by expanding coverage and adding capacity and Telkom added broadband access using IP DSLAM technology to 289,904 telephone lines
The new expansion includes the coverage and capacity of our IP core with the application of Lambda 10 Gbps-based IP and a Tera Router. The Tera Router has been in operation since March 2009 in three cities and six nodes (Jakarta, Batam, Surabaya) as well as a further three internet gateway nodes. In 2010, we extended the Tera Router to eight more cities in 12 nodes (Medan, Pekanbaru, Bandung, Cirebon, Solo, Yogyakarta, Banjarmasin and Makassar). In 2011, we expanded by adding three Tera Router nodes in Medan and Makasar.
In support of our NGN program, we have enhanced our IP Core network to enable it to support our new wave businesses and integrate the NGN core network between our fixed wireline and fixed wireless businesses. To develop the IP Core, we implemented a single platform tera-byte router with fully redundant network architecture. Our IP Core network currently comprises 23 tera router nodes with capacities 467 10GE, 532 GE ports, 12 STM-4, 6 STM-16 ports, and 8 STM-256 ports, also 481 PE routers.
We expanded our Metro Ethernet network with 74 new nodes (located at exchange nodes). As of December 31, 2011, we had 1,010 Metro Ethernet nodes ready to support the bandwidth demands of our broadband services throughout Indonesia. Metro Ethernet is also being utilized as the primary transport for IP DSLAM, MSAN for Speedy broadband, Softswitch, IP VPN and GPON for mobile backhaul, enterprise business solutions and Triple Play services for selected customers. Since 2009, we have also been using Metro Ethernet as the alternative mobile route for almost 1,000 nodes Bs belonging to Telkomsel, in support of the expansion of mobile broadband penetration. This network synergy was further developed to provide backhaul for 1,540 node Bs in 2010, bringing the total to 2,423 node Bs. As of December 31, 2011, the network added 729 nodes and grew to 3,152 nodes.
As of December 31, 2011, we expanded our internet gateway capacity to 115 Gbps. This was done to ensure adequate internet gateway capacity in anticipation of a substantial growth in traffic for both fixed and mobile broadband.
-55-
C. ORGANIZATIONAL STRUCTURE
Information on Subsidiaries and Associated Companies
The following chart illustrates our corporate structure as of December 31, 2011, including our direct and indirect equity ownership in our subsidiaries. A complete list of our subsidiaries and investments in associated companies, and our ownership percentage of each entity, as of December 31, 2011, is set forth below and is contained in Note 1d to our Consolidated Financial Statements included elsewhere in this Form 20-F.
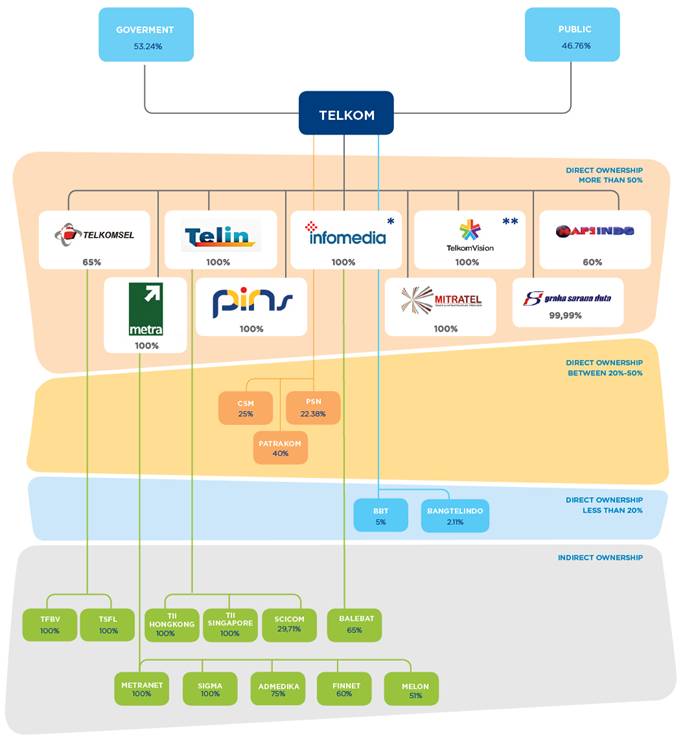
(*)
(*)51% owned by Telkom and 49% owned by Metra(**) 99.54% owned by Telkom and 0.46% owned by Metra
-56-
Direct Ownership (more than 50%)
Company (*) | | Date of Establishment/Acquisition | | Business Segment | | Ownership Percentage (%) | |
PT Telekomunikasi Selular | | May 26, 1995 | | Mobile cellular telephone (GSM) services | | Telkom (65%) | |
PT Multimedia Nusantara | | May 9, 2003 | | Multimedia, Pay-TV, information system services | | Telkom (100%) | |
PT Telekomunikasi Indonesia International | | July 31, 2003 | | Fixed line phone services (KSO-III West Java and Banten), international telecommunications | | Telkom (100%) | |
PT Pramindo Ikat Nusantara | | August 15, 2002 | | Telecommunications services and development | | Telkom (100%) | |
PT Infomedia Nusantara | | September 22, 1999 | | Telephone directory and information services, Call Center | | Telkom (100%) | |
PT Dayamitra Telekomunikasi | | May 17, 2001 | | Fixed line phone services (KSO-VI Kalimantan), supply of telecommunications towers | | Telkom (100%) | |
PT Indonusa Telemedia | | May 7, 1997 | | Multimedia (pay-TV, internet) | | Telkom (100%) | |
PT Graha Sarana Duta | | April 25, 2001 | | Property, contracting, building management and development | | Telkom (99.99%) | |
PT Napsindo Primatel Internasional | | December 29, 1998 | | Network access point | | Telkom (60%) | |
(*) each company is consolidated
PT Telekomunikasi Selular (“Telkomsel”)
Telkomsel, the leading cellular operator in Indonesia, was established on May 26, 1995, provides mobile cellular (GSM) services. Telkomsel is65%ownedby Telkom.
PT Multimedia Nusantara (“Metra”)
Metra, which is positioned as a strategic investment company aimed at supporting the realization of the Telkom’s new wave business, was acquired on May 9, 2003. Metra, whose shares are 100% owned by Telkom, focuses on network construction, development, maintenance and services, and multimedia services (data communications systems, portal and on-line transaction services).
PT Telekomunikasi Indonesia International (“TII” or “Telin”)
Telin provides fixed line telephone services (KSO-III West Java & Banten) and international telecommunications. Acquired on July 31, 2003, Telin is 100% owned by Telkom. Moreover, Telin is responsible for managing Telkom’s overseas business.
PT Pramindo Ikat Nusantara (“Pramindo”)
Pramindo was originally established to operate Joint Operating Schemes (KSO) in Sumatra. Acquired on August 15, 2002, Pramindo is 100% owned by Telkom and provides telecommunications services and development.
PT Infomedia Nusantara (“Infomedia”)
Infomedia was acquired on September 22, 1999 to operate Joint Operating Schemes (KSO) in Sumatra. Infomedia, whose shares are 100% owned by Telkom through a 49% ownership by Metra, has transformed its business from the original three pillars (directory services, contact center services and content services) to Business Process Outsourcing (“BPO”) and Digital Media and Rich Content (“DMRC”).
-57-
PT Dayamitra Telekomunikasi (“Dayamitra” or“Mitratel”)
Mitratel provides fixed line telephone services, supply of telecommunications facilities and infrastructure and telecommunications services. Acquired on May 17, 2001, Mitratel is 100% owned by Telkom, transformed itself by entering the telecommunications infrastructure supply business, which includes supplying telecommunications towers to meet the BTS installment needs of telecommunications operators all over Indonesia.
PT Indonusa Telemedia (“Indonusa”)
Established on May 7, 1997, Indonusa is a multimedia (pay-TV, internet) service provider. Since 2007, Indonusa, which is wholly owned by Telkom through a0.46% stake in Metra, was the first pay-TV operator in Indonesia to launch DTH Prepaid (Prepaid Satellite Pay-TV), under the TelkomVision brand. This service allows customers to purchase and top-up vouchers for their choice of affordably-priced content at any time.
PT Graha Sarana Duta (“GSD”)
GSD provides building management, construction and development services. Acquired on April 25, 2001, GSD is 99.99% owned by Telkom, operates throughout Indonesia and manages the buildings owned by Telkom Group as well as other companies outside Telkom Group.
PT Napsindo Primatel Internasional (“Napsindo”)
Established on December 29, 1998, Napsindo is a network access point provider. Napsindo is 60% owned by Telkom. On January 13, 2006, Napsindo has ceased its operation.
Direct Ownership(between 20% and 50%)
Company | | Date of Establishment/Acquisition | | Business Segment | | Ownership Percentage (%) | |
PT Patra Telekomunikasi Indonesia | | September 28, 1995 | | VSAT services | | Telkom (40%) | |
PT Citra Sari Makmur | | February 14, 1986 | | VSAT and consulting services | | Telkom (25%) | |
PT Pasifik Satelit Nusantara | | July 2, 1991 | | Satellite transponder and satellite-based cellular communications | | Telkom (22.38%) | |
PT Patra Telekomunikasi Indonesia (“Patrakom”)
Established on September 28, 1995, Patrakom provides VSAT services and related facilities to companies in the oil industry. Patrakom is 40% owned by Telkom
PT Citra Sari Makmur (“CSM”)
CSM, which was founded on February 14, 1986, provides telecommunications services related to VSAT applications and other telecommunications technology, as well as consulting services. CSM is 25% owned by Telkom.
PT Pasifik Satelit Nusantara (“PSN”)
Established on July 2, 1991, PSN is 22.38%owned by Telkom. PSN provides satellite transponder leasing.and satellite-based communication service to countries in the Asia Pasific region PSN held its initial public offering of its ordinary shares in June 1996, listing them on the NASDAQ, but was delisted on November 6 2001 in connection with its failure to meet certain NASDAQ National Market Listing conditions.
-58-
Direct Ownership(less than 20%)
Company | | Date of Establishment/Acquisition | | Business Segment | | Ownership Percentage (%) | |
PT Batam Bintan Telekomunikasi | | June 15, 1996 | | Fixed line phone services (Batam and Bintan islands) | | Telkom (5%) | |
PT Pembangunan Telekomunikasi Indonesia | | December 24, 1993 | | Construction and maintenance of telecommunications facilities | | Telkom (2.11%) | |
PT Batam Bintan Telekomunikasi (“BBT”)
BBT was founded on June 15, 1996 and provides fixed line telecommunications services for Batamindo Industrial Park in Batam and Bintan Beach International Resort and Bintan Industrial Park on Bintan Island. Telkom owns 5% of BBT’s shares.
PT Pembangunan Telekomunikasi Indonesia (“Bangtelindo”)
Established on December 24, 1993 Bangtelindo provides telecommunications facilities construction and maintenance services. Bangtelindo’s shares are owned 2.11% by Telkom.
Indirect Ownership
Company | | Date of Establishment/Acquisition | | Business Segment | | Ownership Percentage (%) | |
PT Metranet | | April 17, 2009 | | Multimedia portal services | | Metra (100%) | |
PT Sigma Cipta Caraka | | May 1, 1987 | | IT and Solutions provider | | Metra (100%) | |
PT Telekomunikasi Indonesia International Pte Ltd | | December 6, 2007 | | Telecommunications | | Telin (100%) | |
PT Telkomsel Finance B.V | | February 7, 2005 | | Finance | | Telkomsel (100%) | |
PT Telekomunikasi Indonesia International (Hong Kong) Ltd | | December 8, 2010 | | Telecommunications business | | Telin (100%) | |
PT Administrasi Medika | | February 25, 2010 | | Health insurance administration services | | Metra (75%) | |
PT Balebat Dedikasi Prima | | October 1, 2003 | | Printing | | Infomedia (65%) | |
Telekomunikasi Selular Finance Limited | | April 22, 2002 | | Finance | | Telkomsel (100%) | |
PT Finnet Indonesia | | October 31, 2005 | | Banking and e-payment data communications infrastructure | | Metra (60%) | |
PT Melon Indonesia | | August 16, 2010 | | Value added telephony services and other multimedia services | | Metra (51%) | |
Scicom Bhd | | December 31, 2007 | | Contact center service provider | | Telin (29.71%) | |
PT Metranet (“Metra-Net”)
PT Metranet was established on April 17, 2009, and provides multimedia portal services. Metra-Net’s shares are 100% owned by Metra.
PT Sigma Cipta Caraka (“Sigma”)
Sigma was established on May 1, 1987, and provides IT & Solution services. Telkom now owns 100% of Sigma’s shares since Metra acquired 20% ownership of Sigma in August 2010.
-59-
PT Telekomunikasi Indonesia International Pte Ltd
PT Telekomunikasi Indonesia International Pte Ltd was established as a subsidiary of Telin on December 6, 2007, pursuant to the laws of Singapore. In addition, Telin owned fully 100% shares of PT Telekomunikasi Indonesia International Pte Ltd. Its range of telecommunication services includes but is not limited to internet-based voice and data services, managed data services, call back/call re-origination, pre-paid calling card services and the resale of leased circuit services.
PT Telkomsel Finance B.V (“TFBV”)
TFBV was established in Amsterdam (Netherlands) on February 7, 2005, for the purpose of borrowing, lending and raising funds, including the issuance of bonds, promissory notes and other securities or documentary debt instruments.Telkom owns 65%shares ofTFBVthrough Telkomsel.
PT Telekomunikasi Indonesia International (Hong Kong) Ltd
Telekomunikasi Indonesia International (Hong Kong) Limited was established in Hong Kong on December 8, 2010 and has obtained Unified Carrier Licence (“UCL”) on March 1, 2011 for providing public telecommunications network service, establishing and maintaining telecommunications network, and possessing and using the radio communications installation to provide services. Telkom owns 100% shares of Telin Hong Kong through Telin.
PT Administrasi Medika (“Admedika”)
Admedika, established on February 25, 2010, handles online claims between hospitals and health insurance providers. Telkom owns a 75% stake in Admedika through Metra.
PT Balebat Dedikasi Prima (“Balebat”)
Balebat was acquired on October 1, 2003, and operates in printing service. Telkomholds 65% stake in Balebat through Infomedia.
Telekomunikasi Selular Finance Limited (“TSFL”)
TSFL was established as a subsidiary of Telkomsel in April 22, 2002 and operates in the investment and financial sector. Telkom owns 65%shares of TSFLthrough Telkomsel.
PT Finnet Indonesia (“Finnet”)
Finnet was established on October 31, 2005, as a provider of IT infrastructure, applications and content for information systems and financial transactions for the banking and financial services industry. Metra holds 60% of Finnet’s shares.
PT Melon Indonesia (“Melon”)
Melon is a joint venture company, established on August 16, 2010 by Metra and South Korea Telecom, which own stakes of 51% and 49% respectively. This company, which grew out of Telkom’s expansion into the Media & Edutainment business, provides digital music and related content services for cell phones, personal computers, consumer electronic channels and other digital media.
Scicom (“MSC”) Bhd
Established in 1997, Scicom is a contact centre provider based in Malaysia. Telkom owns a 29.71% stake in Scicom through Telin, making it the majority shareholder.
Organizational Structure
To help transformationof the Company’s into a TIME operator,and ensure a sustainable competitive growth,Telkom reorganized a number of its business units.
a. We changed the name of the IT, Solution & Supply Directorate to the IT, Solution & Strategic Portfolio Directorate following the addition of the Strategic Investment & Corporate Planning functions as a result of the integration of the Strategic Investment & Corporate Planning unit with this Directorate. To enable it to focus on managing IT services as well as the new Strategic Planning & Strategic Portfolio functions, the supply management function, which consists of supply planning & control and supply centers, was transferred to the Compliance & Risk Management Directorate. The reassignment of this function will enable the IT, Solution & Strategic Portfolio Directorate to focus onits core functions.
b. We added the supply management function to the Compliance & Risk Management Directorate in order to align supply management processes with compliance processes andbalance the workloads of each Directorate.
c. We modified the organizational structure of the Internal Audit unit to align it with the demands of end to end audit processes.
d. We merged the Corporate Communications and Corporate Affairs Departments to ensure a more effective and efficient work process.
-60-
-61-
Telkom’s organization structure is as follows:
Directorate | | Function and Authority | |
Finance Directorate | | Focuses on theCompany’sfinancial management, managing financial operations centrally through the Finance, Billing & Collection Center Unit. | |
Human Capital & General Affairs Directorate | | Focuses on managing the Company’s human resources as well as the operational management of human resources centrally through the Human Resources Center Unit, as well as controlling the Learning Center, HR Assessment Center, Management Consulting Center and Community Development Center operational units. | |
IT, Solution & Strategic Portfolio (IT, S&S) Directorate | | Focuses on managingtheIT Strategy & Policy, Service Strategy & Tariffs, and the Strategic Investment & Corporate Planning operational units as well as controlling the Multimedia Division, Information System Center and R&D Center. | |
Compliance & Risk Management Directorate | | Focuses on managing the Risk Management, Legal & Compliance, Business Effectiveness, Security & Safety, and Supply Planning & Controloperational unitsas well as controlling the Supply Center.. | |
Network & Solution Directorate | | Focuses on managing the Infrastructure Planning & Development and Network Operation Policy operational units and controlling infrastructure’s operational through the Infrastructure Telecommunications Division, Access Division, and Maintenance Service Center. | |
Consumer Directorate | | Focuses on managing the consumer business segment and the operational management of the Western Consumer Services Division and Eastern Consumer Services Division as well as the Telkom Flexi Division. | |
Enterprise & Wholesale Directorate | | Focuses on managing theenterprise & wholesale business segment as well as managing the Enterprise Services Division, the Business Services Division and the Carrier & Interconnection Services Division. | |
D. PROPERTY, PLANT AND EQUIPMENT
Our material tangible fixed assets consist principally of our network. A description of these is contained elsewhere in this Form 20-F
Except for ownership rights granted to individuals in Indonesia, reversionary rights to land rests with the Republic of Indonesia, pursuant to Agrarian Law No.5/1960. Land title is designated through land rights, including Right to Build (Hak Guna Bangunanor HGB) and Right of Use (Hak Guna Usahaor HGU). Land title holders enjoy full use of the land for a specified period, subject to renewal and extensions. In most instances, land rights are freely tradable and may be pledged as security under loan agreements.
As of December 31, 2011, we, excluding our subsidiaries, had land use rights to 2,842 properties. We hold registered rights to build (HGB) for most of our properties. Pursuant to Government Regulation No.40/1996, the maximum initial period for the right to build is 30 years, renewable for an additional 20 years. The majority of our property is used to host equipment for our telecommunications operations, including exchanges, transmission stations and microwave radio equipment. None of our properties are mortgaged. We are not aware of any environmental issues that could affect the utilization of our properties.
Insurance
Our material fixed assets, excluding land and underground cooper cable are insured. Our insured fixed assets, which include electronic equipment, machinery and buildings, are insured against risks arising from earthquake, tsunami, eruption, fire, theft, lightning, acts of God and other risks. Our assets are covered under Property All Risk Insurance Policies on a “sum insured basis” and a “first loss basis”. Our insurance policies also include coverage against temporary interruptions of our business. Our Telkom-1 and Telkom-2 satellites are insured separately. Our management believes that our insurance coverage is consistent with industry practice in Indonesia.
ITEM 4A. UNRESOLVED STAFF COMMENTS
Not applicable.
-62-
ITEM 5. OPERATING AND FINANCIAL REVIEW AND PROSPECTS
The following discussion and analysis should be read in conjunction with our Consolidated Financial Statements for the years ended December 31, 2010 and 2011 included elsewhere in this Form 20-F. These Consolidated Financial Statements were prepared in accordance with IFRS as issued by the IASB. These are the Company and its subsidiaries’ first Consolidated Financial Statements prepared in accordance with IFRS and IFRS 1 (First-time Adoption of International Financial Reporting Standards).
An explanation of how the transition to IFRS has affected the consolidated stockholders’ equity, financial performance and cash flows of the Company and its subsidiaries is provided in Note 44 to our Consolidated Financial Statements.
A. OPERATING RESULTS
We are the principal provider of local, domestic and international telecommunications services in Indonesia, as well as the leading provider of mobile cellular services through our majority-owned subsidiary, Telkomsel. Our objective is to become a leading TIME player in the region through the provision of a wide range of communication services. As of December 31, 2011, we had approximately 129.8 million subscribers in service, comprising 8.6 million subscribers on our fixed wireline network, 14.2 million subscribers on our fixed wireless network and though Telkomsel approximately 107.0 million cellular subscribers. We also provide a wide range of other communication services, including telephone network interconnection services, multimedia, data and internet communication-related services, satellite transponder leasing, leased line, intelligent network and related services, cable television and VoIP services.
Our operating results for the two-year period from 2010 through 2011 reflected growth in revenues. This growth was driven by data, internet and information technology services revenues. In addition, Telkomsel’s cellular subscriber base grew 13.8% in 2011.
Our operating results from 2010 to 2011 also reflected an increase in expenses. This increase was mainly driven by personnel and marketing expenses. Personnal expenses increased primarily as a result of our. Early Retirement Program, while marketing expenses grew larger primarily as a result of increase in marketing fee and advertising expenses.
Increase in Data, Internet and Information Technology Services Revenues
Data, internet and information technology services revenues accounted for 33.6% of our consolidated revenues for the year ended December 31, 2011, compared to 28.9% for the year ended December 31, 2010. Revenues from our data, internet and information technology services increased by 20.8% from 2010 to 2011. The increase in data, internet and information technology services revenues in 2011 was primarily due to a 16.0% increase in revenues generated from SMS services and a 27.1% increase in revenues from internet, data communication and information technology services. As part of our transformation into a TIME provider, and our corporate objective of growing our new wave businesses, we seek to continue to increase such revenues.
Stable Cellular Telephone Revenues with Increase in Subscribers and Declining ARPU
Our cellular telephone revenues slightly decreased by 1.8% from 2010 to 2011. Our cellular subscribers increased by 13.8% from 2010 to 2011. Telkomsel's revenues from cellular phone services (usage charges, monthly subscription charges, connection fee charges and features) accounted for 40.1% of our consolidated revenues for the year ended December 31, 2011, compared to 42.5% for the year ended December 31, 2010.
This subscriber growth has been driven by continued growth in demand for mobile cellular services in Indonesia, coupled with our efforts to attract new subscribers and the expansion of our cellular network and capacity. Although the usage behavior of new cellular subscribers may vary depending in part on the pricing packages we offer during a particular period and those offered by our competitors. This condition make operators compete each other to provide the lowest price and cause growth of revenue from cellular not in line with cellular subscribers growth. These factors have contributed to declining ARPU, with blended monthly ARPU decreasing from approximately Rp42,000 in 2010 to approximately Rp39,000 in 2011.
Due to the growth in the cellular market, competition remained intense among cellular operators, particularly in the prepaid market. These cellular operators also compete to a lesser extent with fixed wireless operators, with a growing number of fixed wireless lines in service. See “Item3. Key Information–Risk Factors–Risks Related to Our Business–Competition Risks Related to Our Cellular Business (Telkomsel)”.
-63-
Decrease in Fixed Wireline Telephone Revenues
Our fixed wireline telephone revenues decreased by 6.5% from Rp10,990 billion in 2010 to Rp10,277 billion in 2011.
We believe that fixed wireline telephone revenues have been declining due to the increased usage and declining tariffs of mobile cellular services and fixed wireless services and increased penetration of cellular subscribers in Indonesia. Cellular and fixed wireless services provide increased convenience, and in certain cases where subscribers call other subscribers using the same provider’s network, tariffs can be lower than fixed wireline calls that are made to subscribers of another provider. Although we expect that our fixed line, including fixed wireline services will continue to contribute significantly to our revenues in the upcoming term, we also aware that such trend of declining fixed wireline telephone revenues will continue.
As part of our corporate strategy, we are seeking to optimize our fixed wireline business through various means, including increasing cost competitiveness, developing IDD fixed wireline business and increasing value added services for fixed wireline services. We also seek to increase our fixed wireline penetration rate more quickly by reducing our capital expenditure per line through the use of fixed wireless technology and by upgrading our fixed wireline access network and legacy infrastructure to NGN infrastructure with broadband capability.
Decrease in Fixed Wireless Telephone Revenues
Our fixed wireless revenues decreased by 31.2% from Rp1,950 billion in 2010 to Rp1,342 billion in 2011. This decline occurred despite a significant increase in subscribers during such period, primarily due to lower average tariffs impact from intense competition and a decline in fixed wireless voice revenues.
Our fixed wireless telephone business is facing competition from an increasing number of operators, including PT Indosat and PT Bakrie Telecom, as well as mobile cellular services, SMS, VoIP services and e-mail. Competition in the fixed wireless markets has remained intense, with each operator launching increasingly attractive and creative marketing programs. In addition, our fixed wireless operations face frequency bandwidth constraints as there is currently no new frequency available from the government for expansion, and in densely populated areas, our current fixed wireless operations use substantially all of the available bandwidth that we have been allocated. As a result, we face capacity issues for fixed wireless voice and data and internet services in densely populated areas, which restricts our ability to compete in such areas.
However, we believe there are still opportunities in the market and, in particular, we seek to further grow our fixed wireless data and internet revenues and extend our network to cover new areas. We plan to continue expanding, through selectively, our CDMA-based fixed wireless networks. Compared to fixed wireline networks, CDMA-based networks are generally faster and easier to construct and provide customers with greater flexibility and mobility.
Our fixed wireless service decreased from 18.2 million subscribers in service as of December 31, 2010 to 14.2 million subscribers in service as of December 31, 2011. This reduction was due to the termination by Telkom of selected accounts to improve the credit quality of its subscriber base.
Decrease in Interconnection Revenues
Our interconnection revenues accounted for approximately 4.9% of our consolidated revenues for the year ended December 31, 2011, compared to 5.5% for the year ended December 31, 2010. Revenues from interconnection services decreased by 6.1% from Rp3,735 billion in 2010 to Rp3,509 billion in 2011.
This declining trend in interconnection revenues is primarily due to the implementation of a new interconnection regime. The Government determines interconnection rates that are applicable for all telecommunications network operators in Indonesia. Starting on April 11, 2008, the Government for the first time set interconnection rates based on a new cost-based interconnection regime for all telecommunications network operators. The Government amended interconnection rates under this regime with effect from January 1, 2011 (or July 1, 2011 in the case of fixed local wireless).
Under the new interconnection regime, the interconnection rates that are payable to network operators receiving a call in Indonesia are set by the Government every one to two years based on Reference Interconnection Offers submitted by operators. The Reference Interconnection Offers are based on data reflecting operator costs. As a result of the new cost-based regime, we believe that interconnection rates to which we, including Telkomsel, are entitled have shifted downward. We expect that interconnection rates which the Government sets in the future will continue to trend downward.
-64-
The cost-based interconnection regime also provides transparency in interconnection charges, which allows operators to route calls through the most cost-efficient route through software, thereby reducing interconnection fees. In addition, many mobile cellular operators have in recent years offered aggressive promotions with very low tariffs for calls made to other subscribers of the same operator. As these calls do not transit through our network, we do not receive interconnection revenues for such calls. Such factors have resulted in a decline of interconnection revenues generally for the telecommunications industry in Indonesia.
TELKOM'S REVENUES
The following table sets out our revenues, itemized according to our main products and services, for the two years 2010 through 2011. Each item is expressed as a percentage of total revenues.
| Years Ended December 31, | |
| 2010 | | 2011 | | 2011 | |
| Rp.(billion) | | % | | Rp.(billion) | | % | | US$(million) | |
Telephone | | | | | | | | | | |
Cellular | 29,134 | | 42.5 | | 28,598 | | 40.1 | | 3,154 | |
Fixed Lines | 12,940 | | 18.9 | | 11,619 | | 16.3 | | 1,281 | |
Data, Internet and Information Technology Services | 19,801 | | 28.9 | | 23,924 | | 33.6 | | 2,638 | |
Interconnection | 3,735 | | 5.5 | | 3,509 | | 4.9 | | 387 | |
Network | 1,058 | | 1.5 | | 1,301 | | 1.8 | | 143 | |
Others Telecommunicationsservices | 1,861 | | 2.7 | | 2,287 | | 3.3 | | 253 | |
Total Revenues | 68,529 | | 100.0 | | 71,238 | | 100.0 | | 7,856 | |
Telephone Revenues
Telephone revenues for the two years 2010 through 2011 are set out below, with each item also expressed as a percentage of revenues:
| Years Ended December 31, | |
| 2010 | | 2011 | | 2011 | |
| Rp.(billion) | | % | | Rp.(billion) | | % | | US$(million) | |
Telephone Revenues | | | | | | | | | | |
Cellular | | | | | | | | | | |
Usage charges | 28,024 | | 40.9 | | 27,189 | | 38.1 | | 2,999 | |
Features | 582 | | 0.8 | | 838 | | 1.2 | | 92 | |
Monthly subscription charges | 488 | | 0.7 | | 569 | | 0.8 | | 63 | |
Connection fee charges | 40 | | 0.1 | | 2 | | - | | - | |
| 29,134 | | 42.5 | | 28,598 | | 40.1 | | 3,154 | |
Fixed Lines | | | | | | | | | | |
Usage charges | 9,287 | | 13.6 | | 8,213 | | 11.5 | | 906 | |
Monthly subscription charges | 3,251 | | 4.7 | | 3,004 | | 4.2 | | 331 | |
Installation charges | 179 | | 0.3 | | 135 | | 0.2 | | 15 | |
Others | 223 | | 0.3 | | 267 | | 0.4 | | 29 | |
| 12,940 | | 18.9 | | 11,619 | | 16.3 | | 1,281 | |
Total | 42,074 | | 61.4 | | 40,217 | | 56.4 | | 4,435 | |
-65-
Data, Internet and Information Technology Services Revenues
Data, internet and information technology service revenues for the two years 2010 through 2011 are set out below, with each item also expressed as a percentage of revenues:
| Years Ended December 31, | |
| 2010 | | 2011 | | 2011 | |
| Rp.(billion) | | % | | Rp.(billion) | | % | | US$(million) | |
Data, Internet and Information Technology Service Revenues | | | | | | | | | | |
Short Messaging Service ("SMS") | 11,289 | | 16.5 | | 13,093 | | 18.4 | | 1,444 | |
Internet, data communication and information technology services | 8,297 | | 12.1 | | 10,548 | | 14.8 | | 1,163 | |
VoIP | 197 | | 0.3 | | 245 | | 0.3 | | 27 | |
e-business | 18 | | - | | 38 | | 0.1 | | 4 | |
Total | 19,801 | | 28.9 | | 23,924 | | 33.6 | | 2,638 | |
Interconnection Revenues
Interconnection revenues for the two years 2010 through 2011 are set out below, with each item also expressed as a percentage of revenues:
| Years Ended December 31, | |
| 2010 | | 2011 | | 2011 | |
| Rp.(billion) | | % | | Rp.(billion) | | % | | US$(million) | |
Interconnection Revenues | | | | | | | | | | |
Domestic interconnection and transit | 2,174 | | 3.2 | | 2,071 | | 2.9 | | 228 | |
International interconnection | 1,561 | | 2.3 | | 1,438 | | 2.0 | | 159 | |
International interconnection | 3,735 | | 5.5 | | 3,509 | | 4.9 | | 387 | |
Network Revenues
Network revenues for the two years 2010 through 2011 are set out below, with each item also expressed as a percentage of revenues:
| Years Ended December 31, | |
| 2010 | | 2011 | | 2011 | |
| Rp.(billion) | | % | | Rp.(billion) | | % | | US$(million) | |
Network Revenues | | | | | | | | | | |
Leased lines | 687 | | 1.0 | | 911 | | 1.3 | | 100 | |
Satellite transponder lease | 371 | | 0.5 | | 390 | | 0.5 | | 43 | |
Total | 1,058 | | 1.5 | | 1,301 | | 1.8 | | 143 | |
-66-
Others Telecommunications Services Revenues
Other telecommunications service revenues for the two years 2010 through 2011 are set out below, with each item also expressed as a percentage of revenues:
| Years Ended December 31, | |
| 2010 | | 2011 | | 2011 | |
| Rp.(billion) | | % | | Rp.(billion) | | % | | US$(million) | |
Others Telecommunications Services Revenues | | | | | | | | | | |
Customer Premise Equipment ("CPE") and terminal | 851 | | 1.2 | | 739 | | 1.0 | | 81 | |
USO Compensation | 242 | | 0.4 | | 415 | | 0.6 | | 46 | |
Directory assistance | 322 | | 0.5 | | 349 | | 0.5 | | 38 | |
Pay TV | 159 | | 0.2 | | 259 | | 0.4 | | 29 | |
Sales of modem | 170 | | 0.2 | | 163 | | 0.2 | | 18 | |
Others | 117 | | 0.2 | | 362 | | 0.6 | | 41 | |
Total | 1,861 | | 2.7 | | 2,287 | | 3.3 | | 253 | |
TELKOM'S EXPENSES
The following table sets out our expenses for the two years 2010 through 2011, with each item also expressed as a percentage of expenses:
| Years Ended December 31, | |
| 2010 | | 2011 | | 2011 | |
| Rp.(billion) | | % | | Rp.(billion) | | % | | US$(million) | |
Expenses | | | | | | | | | | |
Operations, maintenance and telecommunication services | 16,046 | | 34.6 | | 16,453 | | 32.8. | | 1,815 | |
Depreciation and amortization | 14,580 | | 31.5 | | 14,823 | | 29.6 | | 1,635 | |
Personnel | 7,447 | | 16.1 | | 8,671 | | 17.3 | | 956 | |
Interconnection | 3,086 | | 6.7 | | 3,555 | | 7.1 | | 392 | |
Marketing | 2,525 | | 5.4 | | 3,278 | | 6.5 | | 362 | |
General and administrative | 2,537 | | 5.5 | | 2,935 | | 5.9 | | 324 | |
Loss (gain) on foreign exchange — net | (43 | ) | (0.1 | ) | 210 | | 0.4 | | 23 | |
Share of loss of associated companies | 14 | | - | | 10 | | - | | 1 | |
Others - net | 145 | | 0.3 | | 192 | | 0.4 | | 21 | |
Total Expenses | 46,337 | | 100.0 | | 50,127 | | 100.0 | | 5,529 | |
-67-
Operations, Maintenance and Telecommunication Services Expenses
Operations, maintenance and telecommunication services expenses for the two years 2010 through 2011 are set out below, with each item also expressed as a percentage of expenses:
| Years Ended December 31, | |
| 2010 | | 2011 | | 2011 | |
| Rp.(billion) | | % | | Rp.(billion) | | % | | US$(million) | |
Operations, Maintenance and Telecommunication Services Expenses | | | | | | | | | | |
Operations and maintenance | 8,836 | | 19.1 | | 9,184 | | 18.2 | | 1,013 | |
Radio frequency usage charges | 2,892 | | 6.2 | | 2,846 | | 5.7 | | 314 | |
Concession fees and Universal Service Obligation charges | 1,177 | | 2.5 | | 1,235 | | 2.5 | | 136 | |
Cost of phone, set top box, SIM and RUIM cards | 1,067 | | 2.3 | | 967 | | 1.9 | | 107 | |
Electricity, gas and water | 841 | | 1.8 | | 836 | | 1.7 | | 92 | |
Insurance | 384 | | 0.8 | | 431 | | 0.9 | | 48 | |
Leased lines and CPE | 215 | | 0.5 | | 406 | | 0.8 | | 45 | |
Vehicles rental and supporting facilities | 283 | | 0.6 | | 291 | | 0.6 | | 32 | |
Cost of IT services | 200 | | 0.4 | | 144 | | 0.3 | | 16 | |
Traveling | 60 | | 0.1 | | 54 | | 0.1 | | 6 | |
Others | 91 | | 0.3 | | 59 | | 0.1 | | 6 | |
Total | 16,046 | | 34.6 | | 16,453 | | 32.8 | | 1,815 | |
Depreciation and Amortization Expenses
Depreciation and amortization expenses for the two years 2010 through 2011 are set out below, with each item also expressed as a percentage of expenses:
| Years Ended December 31, | |
| 2010 | | 2011 | | 2011 | |
| Rp.(billion) | | % | | Rp.(billion) | | % | | US$(million) | |
Depreciation and Amortization Expenses | | | | | | | | | | |
Depreciation | 13,052 | | 28.2 | | 13,660 | | 27.3 | | 1,507 | |
Amortization | 1,528 | | 3.3 | | 600 | | 1.2 | | 66 | |
Impairment | - | | - | | 563 | | 1.1 | | 62 | |
Total | 14,580 | | 31.5 | | 14,823 | | 29.6 | | 1,635 | |
-68-
Personnel Expenses
Personnel expenses for the two years 2010 through 2011 are set out below, with each item also expressed as a percentage of expenses:
| Years Ended December 31, | |
| 2010 | | 2011 | | 2011 | |
| Rp.(billion) | | % | | Rp.(billion) | | % | | US$(million) | |
Personnel Expenses | | | | | | | | | | |
Salaries and related benefits | 2,751 | | 5.9 | | 3,001 | | 6.0 | | 331 | |
Vacation pay, incentives and other benefits | 2,575 | | 5.6 | | 2,814 | | 5.6 | | 310 | |
Employees’ income tax | 796 | | 1.7 | | 1,043 | | 2.1 | | 115 | |
Net periodic pension costs | 624 | | 1.3 | | 629 | | 1.3 | | 69 | |
Early retirements programs | - | | - | | 517 | | 1.0 | | 57 | |
Net periodic post-employment health care benefits costs | 238 | | 0.5 | | 199 | | 0.4 | | 22 | |
Housing | 214 | | 0.5 | | 197 | | 0.4 | | 22 | |
LSA | 78 | | 0.2 | | 96 | | 0.2 | | 11 | |
Insurance | 68 | | 0.2 | | 70 | | 0.1 | | 8 | |
Other post-retirement costs | 61 | | 0.2 | | 53 | | 0.1 | | 6 | |
Other employees’ benefits | 23 | | - | | 30 | | 0.1 | | 3 | |
Others | 19 | | - | | 22 | | - | | 2 | |
Total | 7,447 | | 16.1 | | 8,671 | | 17.3 | | 956 | |
Interconnection Expenses
Interconnection expenses for the two years 2010 through 2011 are set out below, with each item also expressed as a percentage of expenses:
| Years Ended December 31, | |
| 2010 | | 2011 | | 2011 | |
| Rp.(billion) | | % | | Rp.(billion) | | % | | US$(million) | |
Interconnection Expenses | | | | | | | | | | |
Domestic interconnection and transit | 1,980 | | 4.3 | | 2,414 | | 4.8 | | 266 | |
International interconnection | 1,106 | | 2.4 | | 1,141 | | 2.3 | | 126 | |
Total | 3,086 | | 6.7 | | 3,555 | | 7.1 | | 392 | |
-69-
Marketing Expenses
Marketing expenses for the two years 2010 through 2011 are set out below, with each item also expressed as a percentage of expenses:
| Years Ended December 31, | |
| 2010 | | 2011 | | 2011 | |
| Rp.(billion) | | % | | Rp.(billion) | | % | | US$(million) | |
Marketing Expenses | | | | | | | | | | |
Advertising and Promotion | 1,994 | | 4.3 | | 2,743 | | 5.4 | | 303 | |
Customer education | 398 | | 0.9 | | 427 | | 0.8 | | 47 | |
Others | 133 | | 0.2 | | 108 | | 0.3 | | 12 | |
Total | 2,525 | | 5.4 | | 3,278 | | 6.5 | | 362 | |
General and Administrative Expenses
General and administrative expenses for the two years 2010 through 2011 are set out below, with each item also expressed as a percentage of expenses:
| Years Ended December 31, | |
| 2010 | | 2011 | | 2011 | |
| Rp.(billion) | | % | | Rp.(billion) | | % | | US$(million) | |
General and Administrative Expenses | | | | | | | | | | |
Provision for impairment of receivables and inventory obsolescence | 525 | | 1.1 | | 883 | | 1.8 | | 97 | |
Collection expenses | 401 | | 0.9 | | 327 | | 0.7 | | 36 | |
General | 301 | | 0.5 | | 326 | | 0.7 | | 36 | |
Social Contribution | 171 | | 0.4 | | 290 | | 0.6 | | 32 | |
Traveling | 260 | | 0.6 | | 256 | | 0.5 | | 28 | |
Professional fees | 163 | | 0.4 | | 235 | | 0.5 | | 26 | |
Training, education and recruitment | 216 | | 0.5 | | 229 | | 0.5 | | 25 | |
Security and screening | 215 | | 0.5 | | 97 | | 0.1 | | 11 | |
Meetings | 80 | | 0.2 | | 86 | | 0.1 | | 9 | |
Stationery and printing | 64 | | 0.1 | | 53 | | 0.1 | | 6 | |
Vehicle rental | 51 | | 0.1 | | 43 | | 0.1 | | 5 | |
Others | 90 | | 0.2 | | 110 | | 0.2 | | 13 | |
Total | 2,537 | | 5.5 | | 2,935 | | 5.9 | | 324 | |
-70-
Financial Overview
Year ended December 31, 2011 compared to year ended December 31, 2010
A. Revenues
Total revenues increased by Rp2,709 billion, or 4.0%, from Rp68,529 billion in 2010 to Rp71,238 billion in 2011. The increase in revenues in 2011 was primarily due to the increase in revenues from data, internet and information technology services, network and other telecommunications service, partly offset by decreases in revenues from fixed lines, cellular, and interconnection. Revenues from cellular, the largest component of our revenues, recorded a small decrease of Rp536 billion, or 1.8%, in 2011.
1. Telephone Revenues
- Cellular Telephone Revenues
Cellular telephone revenues decreased by Rp536 billion, or 1.8%, from Rp29,134 billion in 2010 to Rp28,598 billion in 2011 primarily due to decreases in usage charges, offset partially by an increase in revenues from features.
Usage charges decreased by Rp835 billion, or 3.0%, from Rp28,024 billion in 2010 to Rp27,189 billion in 2011 due to decrease in local cellular usage. On the other hand, features charges revenues increased by Rp256 billion, or 44.0%, from Rp582 billion in 2010 to Rp838 billion in 2011.
- Fixed Line Telephone Revenues
Fixed line revenues decreased by Rp1,321 billion, or 10.2%, from Rp12,940 billion in 2010 to Rp11,619 billion in 2011. The decrease in fixed line revenues was primarily due to the decrease in usage charges, which decreased by Rp1,074 billion, or 11.6%, from Rp9,287 billion in 2010 to Rp8,213 billion in 2011 due to decreases in local and domestic long distance usage. Further, monthly subscription charge revenues also decreased by Rp247 billion, or 7.6% in 2011. The decreases are due to the decline in the use of fixed line services in favor of newer technologies.
2. Data, Internet and Information Technology Services Revenues
Data, internet and information technology services revenues increased by Rp4,123 billion, or 20.8%, from Rp19,801 billion in 2010 to Rp23,924 billion in 2011. This increase was primarily due to an increase in revenues from internet, data communication and information technology services by Rp2,251 billion, or 27.1%, from Rp8,297 billion in 2010 to Rp10,548 billion in 2011. This increase was due in part to increases in the numbers of our internet subscribers who use Speedy by 8.5% from 1.6 million subscribers in 2010 to 1.8 million subscribers in 2011, and Flash by 45.7%, from 3.8 million subscribers in 2010 to 5.5 million subscribers in 2011. This increase was also due to the increase in data volumes through our VPN network by 18.4%, from 24,237 mbps to 28,702 mbps, and data volumes through our Metro ethernet by 131.0%, from 60,924 mbps to 140,733 mbps. Both contributed to the increased revenues.
SMS revenue also contributed to the increase by Rp1,804 billion, or 16.0%, from Rp11,289 billion in 2010 to Rp13,093 billion in 2011. This increase was due to increased SMS volumes by 13.4% from 199.6 billion messages in 2010 to 226.4 billion messages in 2011.
3. Interconnection Revenues
Interconnection revenues decreased by Rp226 billion, or 6.1%, from Rp3,735 billion in 2010 to Rp3,509 billion in 2011. International interconnection revenues decreased by Rp123 billion, or 7.9%, from Rp1,561 billion in 2010 to Rp1,438 billion in 2011 and domestic interconnection and transit revenues decreased by Rp103 billion, or 4.7%, from Rp2,174 billion in 2010 to Rp2,071 billion in 2011. This was caused in part by a decrease of Rp113 billion, or 6.0%, in cellular interconnection revenues due to the cellular industry’s promotion of reduced rates for calls between subscribers of the same cellular network. Furthermore, government mandated interconnection rates for 2011 were slightly lower than the rates in 2010. In addition, international interconnection revenues also slightly decreased. Both cellular and international interconnection revenues decreased due to the substantial increase in the use of VoIP to make calls, including from mobile phones through VoIP mobile applications.
Interconnection revenues comprised interconnection revenues from Telkom’s fixed line network and interconnection revenues from Telkomsel’s mobile cellular network. Interconnection revenues included incoming international long-distance revenues from our IDD service (TIC-007).
Our total interconnection revenues accounted for 4.9% of our consolidated revenues for the year ended December 31, 2011, compared to 5.5% for the year ended December 31, 2010.
-71-
- Network Revenues
Network revenues increased by Rp243 billion, or 23.0%, from Rp1,058 billion in 2010 to Rp1,301 billion in 2011 mainly due to a substantial increase in our revenues from leased lines services by Rp224 billion, or 32.6%, from Rp687 billion in 2010 to Rp911 billion in 2011. This increase was due to the increased number of capacity leased from 40,451 E1 in 2010 to 118,357 E1 in 2011, as demand increased due to economic growth and partially offset with declining prices for leased lines.
Satellite transponder lease revenues increased by Rp19 billion, or 5.1%, from Rp371 billion in 2010 to Rp390 billion in 2011 due to an increase in capacity leased following increased demand.
- Other Telecommunications Services
In 2011, our revenues from other telecommunications services increased by Rp426 billion, or 22.9%, from Rp1,816 billion in 2010 to Rp2,287 billion in 2011. The increase in other telecommunications services revenues was primarily due to an increase in pay TV by Rp100 billion, or 62.9%, from Rp159 billion in 2010 to Rp259 billion in 2011; USO compensation by Rp173 billion, or 71.5%, from Rp242 billion in 2010 to Rp415 billion in 2011; and other revenues by Rp245 billion, or 209.4%, from Rp117 billion in 2010 to Rp362 billion in 2011.
Revenues from pay TV increased due to substantial increase in the number of subscribers from 212.9 thousands subscribers in 2010 to 1,000 thousands subscribers in 2011 impact from our intensive promotion and lower tariff. Revenues from USO compensation increased due to revenues in 2011 from a USO project to establish internet service centers in various provincial capital cities. Other revenues increased due in part to revenues from fees charged to businesses listing for our directory assistance amounted to Rp349 billion in 2011.
B. Expenses
Total expenses increased by Rp3,790 billion, or 8.2 %, from Rp46,337 billion in 2010 to Rp50,217 billion in 2011. The increase in expenses was attributable primarily due to increases in personnel, marketing expenses and interconnection expenses. These expenses are further explained below.
1. Operations, Maintenance and Telecommunications Services Expenses
Operations, maintenance and telecommunications services expenses increased by Rp407 billion, or 2.5%, from Rp16,046 billion in 2010 to Rp16,453 billion in 2011. The increase in operations, maintenance and telecommunications services expenses was attributable to an increase in maintenance for tower, office building and base station by Rp348 billion, or 3.9%, associated with the expanded capacity of Telkomsel’s transmitting and receiving stations and broadband services.
Other increases in operations, maintenance and telecommunications services expenses included:
- Leased lines and CPE expenses increased by Rp191 billion, or 88.8%, from Rp215 billion in 2010 to Rp406 billion in 2011:
- Concession fees and USO charges increased by Rp58 billion, or 4.9%, from Rp1,177 billion in 2010 to Rp1,235 billion in 2011. This increase followed from increased total revenues by 4.0%; and
- Insurance expenses increased by Rp47 billion, or 12.2%, from Rp384 billion in 2010 to Rp431 billion in 2011. This increase was due to insurance expense of damage sustained by our submarine cables caused by a tsunami in West Sumatra and an earthquake in Sumbawa in 2010.
The above increases were offset by the following:
- The cost of handset phone, set top box, SIM and RUIM cards decreased by Rp100 billion, or 9.4%, from Rp1,067 billion in 2010 to Rp967 billion in 2011. This decrease was caused by the use of less expensive packaging for SIM and RUIM cards;
- The cost of IT services decreased by Rp56 billion, or 28.0%, from Rp200 billion in 2010 to Rp144 billion in 2011. This decrease was resulted from a decrease in the number of software licenses maintained, because of the substitution using Sigma’s services for some software in 2011, and a decrease in software maintenance expenses; and
- Radio frequency usage expenses decreased by Rp46 billion, or 1.6%, from Rp2,892 billion in 2010 to Rp2,846 billion in 2011, due to a new regulation issued on December 13, 2010 under which right-of-use fees paid to the Government for BTSs are no longer calculated in relation to the number of BTSs deployed and are computed based on bandwidth used.
-72-
2. Depreciation and Amortization Expense
Depreciation and amortization expense increased by Rp243 billion, or 1.7%, from Rp14,580 billion in 2010 to Rp14,823 billion in 2011, primarily due to the increased in depreciation expense by Rp608 billion, or 4.7%, from Rp13,052 billion in 2010 to Rp13,660 billion in 2011, resulted from the depreciation of facilities supporting BTSs and switching equipment, offset by decreases in the depreciation of cable networks, data processing equipment and capital leases.
After considering increased competition in the fixed wireless markets that resulted in lower average tariffs, declining active customer and declining ARPU, we conducted an impairment test for the fixed wireless cash generating unit. See “Item 3. Key Information– Risk Factors–Risks Related to Our Business –Competition Risks Related to Our Fixed Telecommunication Business. The impaired fixed wireless related assets were written down to their recoverable value, which was determined to be based on estimated value-in-use (VIU) calculations. In determining value in use, the Company and its subsidiaries apply management judgment in establishing forecast of future operating performance, as well as the selection of growth rates and discount rates.
These judgments are applied based on our understanding of historical information and expectations of future performance. The cash flow projections reflect management’s expectations of revenue, EBITDA growth, and operating cash flows on the basis that the fixed wireless CGU generates positive net cash flows from 2013 and returns to profitability in 2016. Management’s cash flow projection also incorporates expectations for developments in macro economic conditions and market expectations for the Indonesian telecommunications industry. The projection assumes that management will receive appropriate licenses and effectively implement a full mobility initiative that will remove limitations in the existing service which can only be used by customers within a particular area code. Management applied a pre-tax discount rate of 11.4%, derived from the Company’s post-tax weighted average cost of capital and benchmarked to externally available data. The perpetuity growth rate used of 0% assumes that while subscriber numbers may continue to increase after five years, average revenue per user may decline such that only negligible long term growth will be achieved in a competitive market.
The Company determined that assets for the fixed wireless CGU were impaired at December 31, 2011 resulting in an impairment charge of Rp563 billion (2010: Rp nil) recognized in the Consolidated Statement of Comprehensive Income under ‘Depreciation and Amortization’.Changing the key assumptions, including the discount rates or the growth rate assumption in the cash flow projections, could materially affect the value in use calculations. A 1% increase in the discount rate used would result in an increase in impairment loss of approximately Rp907 billion. However the recoverable amount of the fixed wireless CGU is most sensitive to whether management will be able to implement its plans, including the full mobility initiative, such that it generates positive cash flows and returns to profitability as projected. If the performance of the fixed wireless CGU continues to decline or if management’s initiatives are not performing as expected in the next financial year, analysis will be required to assess whether there will be further impairment next year.
There was a decreased in amortization expense of Rp928 billion, or 60.7% that was primarily due to KSO related intangible assets being fully amortized as of December 31, 2010 following expiration of the KSO by that date. In 2011, the related intangible assets have been written-off.
3. Personnel Expenses
Personnel expenses increased by Rp1,224 billion, or 16.4%, from Rp7,447 billion in 2010 to Rp8,671 billion in 2011. The increase in personnel expenses was due in part to increase in the salaries and related benefits by Rp250 billion, or 9.1%, from Rp2,751 billion in 2010 to Rp3,001 billion in 2011. This increase was due to an annual increase in basic salaries of 8.0% to adjust for domestic inflation.
In addition, early retirement program expenses were Rp517 billion in 2011, compared to nil in 2010 when no early retirement programs were offered. Vacation pay, incentives and other benefit expense also contributed to the increase by Rp239 billion, or 9.3%, from Rp2,575 billion in 2010 to Rp2,814 billion in 2011, pimarily due to an increase in incentives.
Employees’ income tax expenses also increased by Rp247 billion, or 31.0%, from Rp796 billion in 2010 to Rp1,043 billion in 2011. This increase followed from the increase in salaries and related benefits.
4. Interconnection Expenses
Interconnection expenses increased by Rp469 billion, or 15.2%, from Rp3,086 billion in 2010 to Rp3,555 billion in 2011. Interconnection expenses increased due to an increase in domestic cellular interconnection and transit (interconnection expenses for calls between Telkomsel subscribers routed through the cellular network of another company) interconnection expenses by Rp434 billion, or 21.9%, which was inline with the increase in Telkomsel’s number of subscribers in 2011 by 13.8%.
Our total interconnection expenses accounted for 7.1% of our consolidated expenses for the year ended December 31, 2011, compared to 6.7% for the year ended December 31, 2010.
5. Marketing Expenses
Marketing expenses increased by Rp753 billion, or 29.8%, from Rp2,525 billion in 2010 to Rp3,278 billion in 2011 primarily due to an increase in advertising and promotion expenses by Rp749 billion, or 37.6%. The increase in advertising and promotion expenses was due changes of Telkomsel's dealer incentive scheme.
-73-
6. General and Administrative Expenses
General and administrative expenses increased by Rp398 billion, or 15.7%, from Rp2,537 billion in 2010 to Rp2,935 billion in 2011 due in part to an increase in the provision for impairment of receivables and inventory obsolescence by Rp358 billion, or 68.2%, from Rp525 billion in 2010 to Rp883 billion in 2011. This increase mainly resulted from current year individual and collective assessment for impairment of receivables..
In addition, social contribution expenses increased by Rp119 billion, or 69.6%, from Rp171 billion in 2010 to Rp290 billion in 2011. This increase resulted from the decision by our shareholders to increase the amount spent on corporate social responsibility from 1.0% of our total comprehensive income in 2010 to 2.0% of our total comprehensive income in 2011, allocated equally between community development and partnership programs.
Professional fees increased by Rp72 billion, or 44.2%, from Rp163 billion in 2010 to Rp235 billion in 2011.
The increases in professional fees, social contribution expenses and provision for impairment of receivables and inventory obsolescence were partially offset by a substantial decrease in security and screening expense of Rp118 billion, or 54.9%, from Rp215 billion in 2010 to Rp97 billion in 2011. This decrease was due to a major optimization exercise pursuant to which the number of security guards used was substantially reduced and guards were sourced from a Telkom subsidiary instead of a third party.
In addition, collection expenses decreased by Rp74 billion, or 18.5%, from Rp401 billion in 2010 to Rp327 billion in 2011.
7. (Loss)/gain on Foreign Exchange – net
(Loss)/gain on foreign exchange - net decreased by Rp253 billion or 588.4% from a gain of Rp43 billion in 2010 to a loss of Rp210 billion in 2011. The decrease is primarily due to the appreciation of the Yen by 5.6% in 2011 which resulted in the increase in cost of debt denominated in Yen, doubled with a smaller loss due to the appreciation of the US Dollars by 0.7% in 2011.
C. Profit and Profit Margin
As a result of the foregoing, profit decreased by Rp963 billion, or 4.2%, from Rp22,740 billion in 2010 to Rp21,777 billion in 2011. Meanwhile, revenues increased by Rp2,709 billion, or 4.0%, our profit margin decreased from 32.9% in 2010 to 30.3% in 2011.
D. Profit before Income Tax and Pre-Tax Margin
As a result of the foregoing, profit before income tax decreased by Rp529 billion, or 2.5%, from Rp21,264 billion in 2010 to Rp20,735 billion in 2011. Pre-tax margin slightly decreased from 30.8% in 2010 to 28.8% in 2011.
E. Income Tax Expense
Income tax expense decreased by Rp127 billion, or 2.3%, from Rp5,512 billion in 2010 to Rp5,385billion in 2011, following the decrease in profit before income tax by 2.5%.
F. Other Comprehensive Income
Defined benefit plan actuarial losses-net of tax increased substantially by Rp1,371 billion from Rp587 billion in 2010 to Rp1,958 billion in 2011. The increase is primarily due to increase in actuarial losses recognized during the year (before tax) by Rp4,410 billion offset by decrease in asset ceiling limitation (before tax) by Rp2,799 billion.
G. Profit for the Year Attributable to Non-controlling Interest
Profit for the year attributable to non-controlling interest increased by Rp177 billion, or 4.1%, from Rp4,325 billion in 2010 to Rp4,502 billion in 2011.
H. Profit for the Year Attributable to Owners of the Parent
Profit for the year attributable to owners of the parent decreased by Rp579 billion, or 5.1%, from Rp11,427 billion in 2010 to Rp10,848 billion in 2011.
I. Equity
Total equity increased by Rp2,488 billion, or 4.4%, from Rp56,538 billion in 2010 to Rp59,026 billion in 2011. The increase in total equity was primarily the result oftotal comprehensive income for the year attributable to owners of the parent Rp13,403 billion in 2011, offset bydividends of Rp8,849 billionand the acquisition cost of treasury stock of Rp2,059 billion. As a result of foregoing, our retained earnings increaseby Rp3,139 billion, or 7.3%, from Rp42,726 billion as of December 31, 2010 to Rp45,865 billion as of December 31, 2011.
Net income per share decrease by Rp27, or 4.7%, from Rp581 in 2010 to Rp554 in 2011.
-74-
Telkom’s Results by Segment
| | Years Ended December 31, | |
| | 2010 | | 2011 | | 2011 | |
| | (Rp billion) | | (Rp billion) | | (US$ million) | |
Fixed Wireline | | | | | | | |
Segment results | | | | | | | |
External revenues | | 21,619 | | 22,072 | | 2,434 | |
Inter-segment revenues | | 5,434 | | 6,549 | | 722 | |
Total segment revenues | | 27,053 | | 28,621 | | 3,156 | |
Segment other income | | 314 | | 310 | | 34 | |
Segment expenses | | (22,392 | ) | (23,604 | ) | (2,603 | ) |
Segment results | | 4,975 | | 5,327 | | 587 | |
Depreciation and amortization | | (4,215 | ) | (3,251 | ) | (359 | ) |
Other non-cash expenses | | (337 | ) | (708 | ) | (78 | ) |
Fixed Wireless | | | | | | | |
Segment results | | | | | | | |
External revenues | | 2,951 | | 2,101 | | 232 | |
Inter-segment revenues | | 174 | | 126 | | 14 | |
Total segment revenues | | 3,125 | | 2,227 | | 246 | |
Segment other income | | 22 | | 11 | | 1 | |
Segment expenses | | (2,877 | ) | (3,671 | ) | (405 | ) |
Segment results | | 270 | | (1,433 | ) | (158 | ) |
Depreciation and amortization | | (731 | ) | (1,309 | ) | (144 | ) |
Other non-cash expenses | | (34 | ) | (19 | ) | (2 | ) |
Cellular | | | | | | | |
Segment results | | | | | | | |
External revenues | | 43,492 | | 46,515 | | 5,130 | |
Inter-segment revenues | | 1,931 | | 2,054 | | 227 | |
Total segment revenues | | 45,423 | | 48,569 | | 5,357 | |
Segment other income | | 220 | | 295 | | 33 | |
Segment expenses | | (28,344 | ) | (31,251 | ) | (3,446 | ) |
Segment results | | 17,299 | | 17,613 | | 1,944 | |
Depreciation and amortization | | (9,600 | ) | (10,218 | ) | (1,127 | ) |
Other non-cash expenses | | (148 | ) | (155 | ) | (17 | ) |
Other | | | | | | | |
Segment results | | | | | | | |
External revenues | | 467 | | 550 | | 61 | |
Inter-segment revenues | | 745 | | 941 | | 104 | |
Total segment revenues | | 1,212 | | 1,491 | | 165 | |
Segment other income | | 52 | | 250 | | 27 | |
Segment expenses | | (1,054 | ) | (1,461 | ) | (161 | ) |
Segment results | | 210 | | 280 | | 31 | |
Depreciation and amortization | | (34 | ) | (45 | ) | (5 | ) |
Other non-cash expenses | | (6 | ) | (1 | ) | (0 | ) |
-75-
Segment Results
Year ended December 31,2011 compared to year ended December 31,2010.
Fixed Wireline Segment
Our fixed wireline segment revenuesincreased by Rp1,568 billion, or5.8%, from Rp27,053 billion in2010 to Rp28,621 billion in2011. The increase in fixed wireline segment revenues was primarily due to an increase in data and internet service revenue by Rp1,134 billion, or 16.8% and an increase in internet connection revenues from broadband access and other telecommunication services by Rp819 billion or 37.9%. The increase was partially offset by a decrease in voice revenue by Rp193 billion, or 2.1% and a decrease in network revenues by Rp160 billion, or 3.6%.
Our fixed wireline segment expensesincreased by Rp1,212billion, or5.4%, from Rp22,392billion in2010 to Rp23,604billion in2011, primarily due to an increase in personnel by Rp845 billion or 17.4% which reflected the impact of the early retirement program, and an increase in operational and maintenance expenses by Rp728 billion or 10.0%. The increase was partially offset by a decrease in interconnection expenses by Rp90 billion, or 2.7%.
Fixed Wireless Segment
Our fixed wireless segment revenues decreased by Rp898 billion, or 28.7 %, from Rp3,125 billion in 2010 to Rp2,227 billion in 2011, primarily due to a decrease in voice revenue by Rp546 billion or 28.4 %, data, internet and information technology service revenue by Rp290 billion or 32.1 %, and an increase in incoming interconnection revenues by Rp62 billion or 20.6% respectively.
Our fixed wireless segment expenses increased by Rp794 billion, or 27.6%, from Rp2,877 billion in 2010 to Rp3,671 billion in 2011, primarily impacte due to the impact of asset impairment by Rp564 billion, an increase in operation and maintenance expenses by Rp158 billion or 10.9%. The increase was partially offset by a decrease in interconnection expenses by Rp31 billion or 13.1%.
Cellular Segment
Our cellular segment revenues increased by Rp3,146 billion, or 6.9%, from Rp45,423 billion in 2010 to Rp48,569 billion in 2011, primarily due to an increase in cellular voice revenues by Rp1,164 billion or 3.7% and data and internet revenues by Rp.1,990 billion or 19.9% respectively.
Our cellular segment expenses increased by Rp2,907 billion, or 10.3%, from Rp28,344 billion in 2010 to Rp31,251 billion in 2011, primarily due to increase in operations, maintenance and telecommunication service expenses by Rp1,082 billion or 4.4%, asset depreciation by Rp600 billion or 6.4%, personnel expenses by Rp270 billion or 16.3%, interconnection expenses by Rp.249 billion or 17.1%, marketing expenses by Rp215 billion or 52.4% and an increase in amortization expenses by Rp138 billion, or 168.5%.
Other Segment
Our other segment revenuesincreased by Rp279.0 billion, or23.0%, from Rp1,212 billion in2010 to Rp1,491 billion in2011, due to an increase in directory assistance, property, others revenues by Rp.149 billion or 21.8% and an increase in call center service revenues by Rp130 billion or 24.6%.
Our other segment expensesincreased by Rp407 billion, or 38.6%, from Rp1,054 billion in 2010 to Rp1,461 billion in 2011, primarily due to an increase in operations and maintenance expenses by Rp252 billion or 39.7% and an increase in personnel expenses by Rp63 billion or 58.6% and an increase in marketing expenses by Rp29 billion, or 20.1%.
-76-
B. LIQUIDITY AND CAPITAL RESOURCES
At December 31, 2011, we had Rp9,634 billion in cash and cash equivalents available. During 2011, cash and cash equivalents increased Rp514 billion. During 2011, the primary source of cash inflows were cash receipts from revenues of Rp71,055 billion. These inflows were offset by cash used to meet the needs of the business including, but not limited to:
- Payment of expenses;
- Funding capital expenditures for infrastructure, including our core or “backbone” network, core Internet Protocol-based network, regional-metro junction, satellites, infrastructure for our new wave businesses including broadband and Metro-E, data communications network, IT applications and content, service nodes and wireline, infrastructure to optimize our legacy fixed wireline and Flexi businesses and support infrastructure such as support equipment and our support center; and
- Payment of debt service requirements relating to existing indebtedness, including two-step loans, current maturity of long term debts and our short-term loans.
In 2012, we expect that our liquidity and capital resources requirements will consist of the following requirements for ongoing working capital; payments for debt service requirements and taxes consist capital expenditures for infrastructure, dividends, payments of contributions to our pension plans and post-retirement health care plan, potential acquisitions to augment Telkom’s businesses and potential early retirement offers to targeted employees.
We expect that our cash inflows for 2012 will come from cash receipts from revenues, new bank loan facilities, if required, vendor financing and drawdowns on our existing bank loan facilities. As of December 31, 2011, Telkom had existing facilities in the amount of Rp3.1 trillion that had not been drawn.
We do not expect to require other funding sources during 2012. Our ability to obtain new credit facilities and to access the Indonesian capital markets will be in part dependent on the health of the global and Indonesian financial and credit markets. We cannot provide any assurance that if we do require such funding we will be able to secure it at all or obtain such financing on terms acceptable to us.
In 2012, we expect the declining trend in fixed wireline telephone revenues to continue, and that future adjustments to interconnection tariffs under the cost-based interconnection regime may result in continued declines in interconnection revenue. However we expect such declines to be at least partially offset by increases in other areas, such as our new wave businesses. See “Operating Results–Financial Overview”.
Net Cash Flows
The following table sets out information concerning our consolidated cash flows, as set out in (and prepared on the same basis as) our Consolidated Financial Statements:
| | Years Ended December 31, | |
| | 2010 (Rp billion) | | 2011 (Rp billion) | | 2011 (USD million) | |
Net cash flows: | | | | | | | |
provided by operating activities | | 27,725 | | 30,461 | | 3,358 | |
used in investing activities | | (16,484 | ) | (14,413 | ) | (1,590 | ) |
used in financing activities | | (9,820 | ) | (15,539 | ) | (1,713 | ) |
Net increase in cash and cash equivalents | | 1,421 | | 509 | | 55 | |
Effect of foreign exchange rate changes on cash and cash equivalents | | (106 | ) | 5 | | 1 | |
Cash and cash equivalents at beginning of year | | 7,805 | | 9,120 | | 1,006 | |
Cash and cash equivalents at end of year | | 9,120 | | 9,634 | | 1,062 | |
-77-
Cash Flows from Operating Activities
Net cash provided by operating activities in 2011 was Rp30,461 billion (US$3.358 million) compared to Rp27,725 billion in 2010. Our higher operating cash flow was primarily due to:
- An increase of Rp2,936 billion, or 4.5%, in cash receipts from customers due to the increased of our revenues;
- A decrease of Rp484 billion, or 5.4%, in cash payments to employees; and
- A decrease of Rp470 billion, or 8.1%, in cash payments of income tax.
The above increase in operating cash flows was partially offset by:
- A decrease of Rp659 billion, or 100.0%, in cash receipt of claim for tax refund as no claim for tax refund accured in 2011; and
- An increase of Rp612 billion, or 158.5%, in payments of cash refund to cutomers.
Cash Flows from Investing Activities
Net cash flows used in investing activities in 2011 was Rp14,413 billion (US$1,590 million) compared to Rp16,484 billion in 2010. This was primarily due to a decrease of Rp1,813 billion, or 12.2%, in cash payments for the acquisition of property, plant and equipment.
Apart from cash on hand and cash in banks, we invest the majority of our excess cash from time to time in time deposits. Since May 14, 2004, we also have been investing a part of our excess cash in Rupiah-based mutual funds and other marketable securities. As of December 31, 2011, available-for-sale financial assets totaling Rp361 billion (US$40 million) in mutual funds and other marketable securities were outstanding.
Cash Flows from Financing Activities
Net cash flows used in financing activities in 2011 was Rp15,539 billion (US$1,713 million) compared to Rp9,820 billion in 2010. This was primarily due to:
- A decrease of Rp4,731 billion, or 56.9%, in cash receipts from the proceeds from loans and other borrowings, resulted from a decrease in cash receipts from the proceeds from two steps loans and bank loans by Rp2,146 billion, or 44,3% doubled with a decrease of Rp2,991 billion in cash receipts from the proceeds from bonds, as no bonds were issued in 2011; and
- An increase of Rp2,059 billion in cash payments for repurchases of shares, as no such purchases were made in 2010.
This was partially offset by a decrease of Rp1,131 billion, or 12.4%, in cash payments for the repayments of loans and other borrowings, primarily due to a decrease of Rp1,382 billion, or 15.9%, in cash payments for the repayments of two steps loans and bank loans.
Repayments of Current Indebtedness
We made net repayments of current indebtedness for borrowed money of Rp9,098 billion in 2010 and Rp7,967 billion (US$879 million) in 2011. Cash outflows in 2011 mainly reflected payments for:
- Two-step loans and long-term bank loans of Rp7,334 billion; and
- Short-term bank loans of Rp272 billion.
Current Assets
Current assets were Rp18,830 billion as of December 31, 2010 and Rp21,401 billion (US$2,360 million) as of December 31, 2011, reflecting anincreaseof Rp2,571 billion, or13.7%. Theincrease in current assets was due in part to:
- A substantial increase of Rp859 billion, or 18.9% in trade and other receivables from Rp4,534 billion as of December 31, 2010 to Rp5,393 billion as of December 31, 2011;
- An increase in assets held for sale of Rp791 billion, or 100.0% when no assets held for sell recorded as of December 31, 2010.
- An increase of Rp514 billion, or 5.6%, in cash and cash equivalents from Rp9,120 billion as of December 31, 2010 to Rp9,634 billion as of December 31, 2011. See “Liquidity and Capital Resources–Net Cash Flows”; and
- An increase of Rp358 billion, or 214,4% in prepaid other taxes from Rp167 billion as of December 31, 2010 to Rp525 billion as of December 31, 2011.
-78-
Trade Receivables
See Note 6 to our Consolidated Financial Statements for details.
Restricted Time Deposits
See Note 12 to our Consolidated Financial Statements for details.
Current Liabilities
Current liabilities were Rp20,473 billion as of December 31, 2010 and Rp22.189 billion (US$2.447 million) as of December 31, 2011, reflecting an increase of Rp1.716 billion, or8.4%. This increase was primarily due to:
- An increase of Rp1,381 billion, or 40.5%, in accrued expenses from Rp3,409 billion as of December 31, 2010 to Rp4,790 billion as of December 31, 2011; and
- An increase of Rp568 billion, or 7.3%, in trade and other payables from Rp7,787 billion as of December 31, 2010 to Rp8,355 billion as of December 31, 2011.
This increase was partially offset by:
- A decrease of Rp447 billion, or 8.3%, in short-term, loan and other borrowings from Rp5,360 billion as of December 31, 2010 to Rp4,913 billion as of December 31, 2011 as based on loan repayment schedule
Current Maturities of Long-term Liabilities
See Note 17 to our Consolidated Financial Statements for details.
Accrued Expenses
See Note 15 to our Consolidated Financial Statements for details.
Working Capital
Net working capital deficit, calculated as the difference between current assets and current liabilities, amounted to Rp1,643 billion as of December 31, 2010 and Rp788 billion (US$87 million) as of December 31, 2011. The decrease in net working capital deficit was primarily due to:
- An increase ofRp859 billion in trade and other receivables;
- An increase ofRp791 billion in assets held for sell;
- An increase ofRp514 billion in cash and cash equivalents.
This increase was partially offset by:
- An increase of Rp1,381 billion in accrued expenses; and
- An increase of Rp568 billion in trade and other payables.
We expect that our working capital deficit will continue to be addressed by various funding sources, including cash from operating activities and bank loans. See “Liquidity and Capital Resources”.
-79-
Capital Structure
Our capital structure as of December 31, 2011 is described as follows:
| | Amount (Rp billion) | | Portion (%) | |
Short Term | | 100 | | 0.2 | |
Long Term | | 17,771 | | 27.9 | |
Debt | | 17,871 | | 28.1 | |
Equity | | 45,711 | | 71.9 | |
Total Invested Capital | | 63,582 | | 100.0 | |
We take a qualitative approach towards our capital structure and debt levels. Under our syndicated loan agreement with BNI and BRI dated June 16, 2009, we are required to maintain a debt to equity ratio of not more than 2.0 and debt service coverage ratio of more than 1.25. As of December 31, 2011, our debt to equity ratio was 0.4 and our debt service coverage ratio was 4.4, indicating our strong ability to meet our debt obligations. Our debt levels are primarily driven by our plans to develop our existing and new strategic businesses. In determining our optimum debt levels, we also consider our debt ratios with reference to regional peers in the telecommunications industry.
Indebtedness
Consolidated total indebtedness as of January 1, 2010, December 31, 2010 and 2011 were as follows:
| | Jan 1 2010 | | Dec 31, 2010 | | Dec 31, 2011 | | Dec 31, 2011 | |
| | (Rp billion) | | (Rp billion) | | (Rp billion) | | (US$ million) | |
Indonesian Rupiah | | 18,970 | | 17,667 | | 14,142 | | 1,560 | |
US Dollar(1) | | 2,513 | | 3,147 | | 2,561 | | 282 | |
Japanese Yen(2) | | 1,177 | | 1,191 | | 1,168 | | 129 | |
Total | | 22,660 | | 22,015 | | 17,871 | | 1,971 | |
(1) The amounts as of January 1, 2010, December 31, 2010 and 2011 translated into Rupiah at Rp9,430, Rp9,015 and Rp9,075 = US$1, respectively, being the Reuters sell rates for US Dollar at each of those dates.
(2) The amounts as of January 1, 2010, December 31, 2010 and 2011 translated into Rupiah at Rp102.2, Rp110.8 and Rp117.0 = Yen 1, respectively, being the Reuters sell rates for Yen at each of those dates.
Of the total indebtedness as of December 31, 2011, Rp4,913 billion, Rp7,200 and Rp2,435 billion were scheduled for repayment in 2012, 2013 to 2014 and 2015 to 2016, respectively.
For further information on our Company’s indebtedness, see Notes 17-18 to our Consolidated Financial Statements.
-80-
Capital Expenditures
In 2011, we incurred capital expenditures of Rp14,603 billion (US$1,610 million), Rp7,056 billion less than the originally budgeted Rp21,659 billion for in our capital expenditure plan. Capital expenditure was primarily devoted to our network modernization programs, information technology programs, expansion of our core network in Telkomsel. The shortfall relative to our budgeted capital expenditures was primarily caused by delays in the Palapa Ring fiber optic backbone project. There were also delays in the trade-in, trade-out (“TITO”) coaxial cable project, involving planned upgrades of certain cables to fiber optic cable.
Our capital expenditures are grouped into the following categories for planning purposes, with each category indicating the linkage with our major revenue and expense streams:
- Optimizing legacy business, which consists of fixed wireless and fixed wireline;
- New wave business, which consists of broadband, IT, application and content and service node;
- Infrastructure, which consists of core transmission network, Metro-Ethernet and Regional Metro Junction (RMJ), core Internet Protocol backbone and satellite;
- Support, which consists of Capex for supporting system and Capex for supporting units.
Of the Rp14,603 billion, Telkom as parent company of Rp4,202 billion (US$463 million), Telkomsel incurred capital expenditures of Rp8,472 billion (US$934 million) and our other subsidiaries incurred capital expenditures of Rp1,929 billion (US$213 million) in 2011 as follows:
| | Years Ended December 31, |
| | 2009 (1) | | 2010 (1) | | 2011 (1) | | 2012 (2) | | 2013 (3) | |
| | (Rp billion) | | (Rp billion) | | (Rp billion) | | (Rp billion) | | (Rp billion) | |
Telkom (Parent Company): | | | | | | | | | | | |
Optimizing Legacy | | 1,913 | | 264 | | 156 | | 129 | | 109 | |
New Wave | | 1,312 | | 1,313 | | 1,875 | | 3,140 | | 2,669 | |
Infrastructure | | 2,208 | | 1,861 | | 1,979 | | 2,155 | | 2,155 | |
Support | | 219 | | 185 | | 192 | | 197 | | 193 | |
Subtotal for Telkom (Parent Company) | | 5,652 | | 3,623 | | 4,202 | | 5,621 | | 5,126 | |
Telkom’s Subsidiaries: | | | | | | | | | | | |
Telkomsel | | 12,673 | | 8,197 | | 8,472 | | 9,900 | | 9,787 | |
Others | | 836 | | 831 | | 1,929 | | 3,350 | | 3,685 | |
Subtotal for Subsidiaries | | 13,509 | | 9,028 | | 10,401 | | 13,250 | | 13,472 | |
Total for Telkom (Consolidated) | | 19,161 | | 12,651 | | 14,603 | | 18,871 | | 18,598 | |
(1)Amounts for 2009, 2010 and 2011 were recognized capital expenditures based on goods received.
(2)Amounts for 2012 are planned capital expenditures included in our budget and are subject to upward or downward adjustment.
(3)Amounts for 2013 are projected capital expenditures for such year, and actual capital expenditures may be significantly different from projected amounts.
Actual future capital expenditures may differ from the amounts indicated above due to various factors, including but not limited to the Indonesian economy, the Rupiah/US Dollar and Rupiah/Euro exchange rates and other applicable foreign exchange rates, the availability of vendor or other financing on terms acceptable to us, technical or other problems in obtaining or installing equipment and whether we enter any new lines of business.
Each year, until 2016, we plan to allocate a maximum of 20% of our total revenues to capital expenditures for infrastructure to support our new wave businesses, which consist of transport, service, access and support nodes, and to develop new services to complement our new wave businesses.
For the year 2012, we have allocated capital expenditures of Rp18,871 billion (US$2,081 million), consisting of Rp5,621 billion for Telkom, Rp9,900 billion for Telkomsel and Rp3,350 billion for our other subsidiaries.
-81-
Critical Accounting Policies, Estimates and Judgments
For a complete discussion of our critical accounting policies, estimates and judgments, see Note 2 to our Consolidated Financial Statements.
New Accounting Standards
See Note 43 to our Consolidated Financial Statements for a discussion of the new standards, amendments to standards and interpretations not yet effective for the year ended December 31, 2011, that are relevant to us and our subsidiaries.
C. RESEARCH AND DEVELOPMENT, PATENTS AND LICENSES, ETC.
In 2011, we made significant investment in order to improve products and services. The investment amount reached around Rp8 billionand Rp13billion (US$1 million), each for the years of2010 and2011. Particularly in 2011, we made special investments in research and development programs aimed at supporting the implementation of Mobile Broadband, Home network, Machine to Machine and Cloud Computing, for aspects, such as business, service & product, as well as telecommunication network infrastructure. In term of business, service & product, the research and development programs included Mobile Application, e-Payment, IPTV, M2M, Telkom SmartHome, Smart City solution, IMS QoS, Product Retirement, Tools dBase Signalling, Integration, TENOSS, and Q0S Differentiation for Internet Service. Then in term of telecommunication network infrastructure, we had conducted research and development programs relating to IPv6, Metro Ethernet, Internet Exchange, DWDM, Femtocell, LTE, WiFi, GPON, NG-PON, IMS, SBC, and Policy Management.
D. TREND INFORMATION
The significant trends, or developments that have had and may have in the future a material impact on our results of operations, financial condition and capital expenditures include:
- increase in data, internet and information technology services revenues;
- stable cellular telephone revenues withincrease insubscribersanddeclining ARPU;
- decrease in fixed wireline telephone revenues;
- decrease in fixed wireless telephone revenues; and
- �� decrease in interconnection revenues.
For a discussion on each of these significant trends, please see the disclosure in “Operating Results” under the sub-headings “Increase in Data, Internet and Information Technology Revenues”,“Stable Cellular Telephone Revenues withIncrease inSubscribersandDeclining ARPU”, “Decrease in Fixed Wireline Telephone Revenues”, “Decrease in Fixed Wireless Telephone Revenues” and “Decrease in Interconnection Revenues” included elsewhere in this Form 20-F.
In addition, we believe that competition among the different mobile cellular operators will continue in 2012. However the level of competition may not be as intense as during certain periods in the past given that tariffs have already decreased significantly and the possibility of a reduction in capital expenditures by other operators.
E. OFF-BALANCE SHEET ARRANGEMENTS
Our contingencies are described in Note 38 to our Consolidated Financial Statements and our commitments are described in Note 37 to our Consolidated Financial Statements and summarized in the table of contractual obligations below. Other than the above, as of December 31, 2011, we had no off-balance sheet arrangements that were reasonably likely to have a current or future material effect on our financial position revenues or expenses, results of operations, liquidity, capital expenditures or capital resources.
-82-
F. TABULAR DISCLOSURE OF CONTRACTUAL OBLIGATIONS
The following table sets forth information on certain of our material contractual obligations as of December 31, 2011.
| | By Payment Due Dates |
Contractual Obligations | | Total | | Less than 1 year | | 1-3 years | | 3-5 years | | More than 5 years | |
| | (Rp billion) | | (Rp billion) | | (Rp billion) | | (Rp billion) | | (Rp billion) | |
Short-Term Loans(1)(6) | | 100 | | 100 | | - | | - | | - | |
Long-Term Debts(2)(6) | | 17,261 | | 4,617 | | 6,959 | | 2,395 | | 3,290 | |
Capital Lease Obligations(3) | | 510 | | 196 | | 241 | | 40 | | 33 | |
Interest on Short-term Loans, Long-term Debts and Capital Lease Obligations(7) | | 132 | | 63 | | 57 | | 10 | | 2 | |
Operating Leases(4) | | 310 | | 87 | | 125 | | 68 | | 30 | |
Unconditional Purchase Obligations(5) | | 9,499 | | 9,499 | | - | | - | | - | |
Total | | 27,812 | | 14,562 | | 7,382 | | 2,513 | | 3,355 | |
(1) Related to liabilities under short-term loans obtained from Bank Ekonomi, Bank CIMB Niaga, and Danamon. See Note 17 to our Consolidated Financial Statements.
(2) See Note 18 to our Consolidated Financial Statements.
(3) Related to the leases of the transmission installation and equipment, vehicles and processing equipment and office equipment for our telecommunication networks for Telkom Flexi.
(4) Related primarily to leases of office.
(5) Capital expenditures committed under the contractual arrangements.
(6) Excludes the related contractually committed interest obligations.
(7) See “Item 3. Key Information–Risk Factors–Risks Related to Our Business–Financial Risks–We are exposed to interest rate risk”.
See Note 37 to our Consolidated Financial Statements for further details on our contractual commitments. In addition to the above contractual obligations, as of December 31, 2011, we had long-term liabilities for pension, post-retirement health care benefits and long service awards. In 2011 we contribute Rp361 billion to our post-retirement health care benefits plan and to our defined benefit pension plan Rp187 billion. See Note 32 to our Consolidated Financial Statements.
G. SAFE HARBOR
All information that is not historical in nature disclosed under “Item 5. Operating and Financial Review and Prospects–Off-Balance Sheet Arrangements and–Tabular Disclosure of Contractual Obligations” is deemed to be a forward-looking statement. See “Item 3 Key Information – Risk Factors – Risk Related to Our Business – Forward Looking – Statements May Not be Accurate”.
-83-
ITEM 6. DIRECTORS, SENIOR MANAGEMENT AND EMPLOYEES
A. DIRECTORS AND SENIOR MANAGEMENT
In accordance with Indonesian law, we have a Board of Commissioners and a Board of Directors. These boards are separate, and no individual may be a member of both boards.
Board of Commissioners
Our Board of Commissioners consists of five members, one of whom is designated the President Commissioner. The members of the Board of Commissioners are elected and dismissed by shareholders’ resolutions at a GMS, provided that one member of the Board of Commissioners shall be nominated by the holder of the one Series A Dwiwarna share. In accordance with the regulations of the Indonesian Capital Market and Financial Institution Supervisory Agency, or Bapepam-LK, and Indonesian Stock Exchange rules, which require 30% of the Board of Commissioners to be independent members, two Commissioners have been designated as Independent Commissioners: Rudiantara and Johnny Swandi Sjam. The principal duty of the Independent Commissioners, in addition to exercising supervision, is to represent the interests of the minority shareholders.
Table of contain
As of December 31, 2011, our Board of Commissioners consisted of five members as listed below:
Name | | Age | | Commissioner Since | | Position | |
Jusman Syafii Djamal | | 57 | | 2011 | | President Commissioner | |
Rudiantara | | 52 | | 2011 | | Independent Commissioner | |
Johnny Swandi Sjam | | 51 | | 2011 | | Independent Commissioner | |
Bobby A.A. Nazief | | 52 | | 2008 | | Commissioner | |
Mahmuddin Yasin | | 57 | | 2007 | | Commissioner | |
Jusman Syafii Djamal was appointed President Commissioner on January 1, 2011. As a Mechanical Engineering graduate of ITB with a degree in Aeronautical Engineering (1983), and a recipient of the Bintang Jasa Nararya of the Republic of Indonesia on August 17, 1995 (the Golden Anniversary of the Independence of the Republic of Indonesia), he was appointed by President of Indonesia Susilo Bambang Yudhoyono on Mei 20, 2010 as a member of the National Innovation Committee (the President’s think tank on innovation policy). He currently also serves as President Commissioner (Independent) of PT Cardig Aero Services, Tbk., President Commissioner (Independent) of PT Toba Bara Sejahtera, Commissioner (Independent) of PT Jasa Angkasa Semesta and Chairman of Matsushita Gobel Foundation. He is also an experienced “National Policy Maker” as Minister of Transportation of the Republic of Indonesia in the First United Indonesia Cabinet (May 2007 – October 2009). He is the author of “Grand Techno Economic Strategy” – A Strategy to Stimulate Productivity (Mizan, 2009). He has experience as a Technical/Engineering Advisor and Auditor, having been appointed by President Susilo Bambang Yudhoyono as a member of the National Team for the Evaluation of Transportation Safety and Security (2007), to identify and evaluate the “root causes” of serious transportation accidents in the air, sea, rail and road sectors. He has gained management experience in the aircraft industry in several strategic positions, including (a) as President Director of PT Dirgantara Indonesia (2000 – 2002), (b) Director of Human Resources at PT IPTN (1999 – 2000), (c) Director of Helicopters, Defense Technology and Satellite (1996 – 1999), (d) Chairman of the PT IPTN Restructuring Program Executive Team (1998 – 2001), and (e) Chief Project Engineer, N250 Development and Design (1989 – 1995). For 20 years he worked as a professional Aerodynamics Engineer specializing in Computational Aerodynamics and Configuration Development. With the late Bambang Pamungkas, he holds an Intellectual Property Right in the form of Patent No.ID 0 021 669 Electronic-based Flight Control Systems on August 15, 2008.
Rudiantara was appointed an Independent Commissioner on January 1, 2011. He has a degree in Statistics from the Faculty of Mathematics and Natural Sciences, Padjadjaran University, as well as an MBA from IPPM, University of Indonesia. He has served in a range of important positions, including as a Director and Commissioner of various cellular telecommunications companies such as Indosat, Telkomsel and XL, and as Vice President Director of PT PLN (Persero), Vice President Director of PT Semen Gresik (Persero), as CEO of PT Bukit Asam Transpacific Railways and PT Rajawali Asia Resources.
-84-
Johnny Swandi Sjam was appointed an Independent Commissioner on January 1, 2011. His educational achievements include a Diploma III in Computer Engineering from the Bandung Institute of Technology (ITB), a Diploma IV in Industrial Management from the Ministry of Trade’s Industrial Management Academy, a degree in Information Management from Gunadarma University and a postgraduate degree in Business Administration & Policy from the University of Indonesia. He has held a number of important positions in Indosat’s subsidiaries, such as Satelindo, Sisindosat and Intikom (1997-2002), before serving as President Director of Satelindo (2002-2003), a Director of Indosat (2005-2007) and as President Director of Indosat (2007-2009) and on the Board of Commissioners of PT INTI (2010-2011). He was also elected as Chairman of the Standing Committee for Telecommunications Infrastructure & Services of the Indonesian Chamber of Commerce and Industry (KADIN).
Bobby A.A. Nazief has been one of Telkom’s Commissioners since September 19, 2008.Holding a PhD in Computer Science from the University of Illinois at Urbana-Champaign, USA, he is also Senior IT Advisor to the Ministry of Finance of Indonesia and a lecturer in the Computer Science Faculty at the University of Indonesia. He was also appointed as Senior IT Advisor to the management of Indonesia’s Supreme Audit Board and Director of the Computer Science Center at the University of Indonesia.
Mahmuddin Yasin has been one of Telkom’s Commissioners since June 29, 2007.He is an Economics graduate from Krisnadwipayana University, Jakarta, and holds a Master of Business Administration from Washington University, St. Louis, USA. He is the Deputy Minister of State for State-Owned Enterprises, having previously served as Deputy Minister for Restructuring and Privatization and Secretary of the Ministry of State-Owned Enterprises and as Vice Chairman of the Indonesian Bank Restructuring Agency (“IBRA”). In the corporate world, he has served in a number of important positions including as President Commissioner of PT Socfin Indonesia (2005-2007), President Commissioner of PT Pupuk Sriwijaya (2004-2008) and Commissioner of PT Indo FarmaTbk (2002). Since 2008 he has been serving as Commissioner of PT Bank Mandiri Tbk.
The term of office for each Commissioner is five years from the date of his election. A Commissioner may be removed prior to the expiration of his term of office at a general meeting of the shareholders. The Board of Commissioners’ office address is Grha Citra Caraka Building, 5th Floor, Jalan Gatot Subroto Kav. 52, Jakarta 12710, Indonesia.
The Board of Commissioners is assisted by a Board Secretary, Yuki Indrayadi, whose main function is to ensure that the Board of Commissioner’s duties are all in accordance with the applicable laws and regulations. Yuki Indrayadi was appointed as the Board of Commissioner Secretary on October 1, 2008. He holds a bachelor’s degree in Industrial Engineering from the Bandung Institute of Technology (ITB), and a Master’s degree and Doctor of Philosophy (Ph.D.) in Engineering from the Katholieke Universiteit Leuven, Belgium, and has extensive experience in capital market and corporate planning.
-85-
Board of Directors
Our Board of Directors is responsible for our overall management and day-to-day operations under the supervision of the Board of Commissioners. The Board of Directors consists of eight members, including one President Director. The members of the Board of Directors are elected and dismissed by shareholders’ resolutions at a general meeting of the shareholders, provided that each candidate shall be nominated by the holder of the one Series A Dwiwarna share.
As December 31, 2011, our Board of Directors consisted of eight members as listed below:
Name | | Age | | Director Since | | Position | |
Rinaldi Firmansyah | | 52 | | 2007 | | President Director (CEO) | |
Arief Yahya | | 51 | | 2005 | | Director of Enterprise and Wholesale | |
Sudiro Asno | | 55 | | 2007 | | Director of Finance (CFO) | |
I. Nyoman G. Wiryanata | | 52 | | 2008 | | Director of Consumer | |
Indra Utoyo | | 50 | | 2007 | | Director of IT Solution and Strategic Portfolio (CIO) | |
Faisal Syam | | 56 | | 2007 | | Director of Human Capital and General Affairs | |
Ermady Dahlan | | 59 | | 2008 | | Director of Network and Solutions (Acting COO) | |
Prasetio | | 51 | | 2007 | | Director of Compliance and Risk Management | |
Rinaldi Firmansyahbecame Telkom’s President Director on February 28, 2007. He began his career at Telkom as Director of Finance from 2004 to 2007. His previous positions include President Director of PT Bahana Securities (2001-2003), Vice President Commissioner of PT Bahana Securities (2003-2004), and Commissioner of PT Semen Padang and Chairman of its Audit Committee (2003). He holds a Bachelor’s degree in Electrical Engineering from ITB, and a Master’s degree in Business Administration from the Indonesian Institute of Management Development, Jakarta. He is also a Chartered Financial Analyst.
Arief Yahya has served as Director of Enterprise and Wholesale since June 24, 2005. He graduated with a Bachelor’s degree in Electrical Engineering from ITB and has a Master’s degree in Telecommunications Engineering from the University of Surrey, UK. He joined Telkom in 1986 and has held several key positions, including Head of Regional Division V (East Java) and Head of Regional Division VI (Kalimantan).
Sudiro Asno has served as Director of Finance / CFO since February 28, 2007. With an Economics degree, majoring in Accountancy from Padjadjaran University, Bandung, he launched his professional career at Telkom in 1985 and held various important positions in the Telkom’s Directorate of Finance before being appointed as Senior General Manager of the Finance Center.
I Nyoman G Wiryanata has served as Director of Consumer since March 1, 2008, having previously served as Director of Network and Solutions since February 28, 2007. He has a Bachelor’s degree in Electrical Engineering from the Surabaya Institute of Technology and a Master’s in Business Administration from the Prasetya Mulya Institute of Management. Since joining Telkom in 1983, he has held a number of important positions, including Executive General Manager of Regional Division I (Sumatra).
Indra Utoyohas served as Director of IT, Solution & Strategic Portfolio / CIO since February 28, 2007. He holds a Bachelor’s degree in Telecommunications Electrical Engineering from ITB and a Master’s degree in Communications and Signal Processing from the Imperial College of Science, Technology and Medicine, University of London, UK. He joined Telkom in 1986 and has held several key positions, including Senior General Manager of the Information System Center.
Faisal Syam has served as Director of Human Capital and General Affairs since February 28, 2007. He holds a Bachelor’s degree in Mathematics from the University of North Sumatra and a Master’s degree in Management from the Bandung School of Management (“STMB”). Since joining Telkom in 1983, he has held a number of key positions, including Senior General Manager of the Human Resource Center.
-86-
Ermady Dahlanhas served as Director of Network and Solutions / COO since March 1, 2008, having previously served as Consumer Director since February 28, 2007. A graduate of the Junior Engineer Joint Training Program at the Bandung Telecommunications Academy (PAMTK – ATN) in 1978, he joined Telkom in 1973. He has also served in various other strategic positions, including as Executive General Manager of Regional Division II (Jakarta).
Prasetiohas served as Director of Compliance and Risk Management since February 28, 2007. He holds a Bachelor’s degree in Economics, majoring in Accountancy, from Airlangga University, as well as a Master’s degree in Business Law from Gadjah Mada University. He has also taken executive courses at various universities, including the State University of New York at Buffalo, the Asian Institute of Management in Manila, Philippines, Kellogg University in Chicago, Illinois and the Wharton School of Management, University of Pennsylvania in the United States. He joined Telkom as Executive Vice President Risk Management, Legal & Compliance in 2006. He began his career at Bank Niaga Tbk in 1984, becoming Vice President-Credit Policy and Administration Group Head in 1999. He then served as Senior Vice President/Chief Credit Officer of IBRA from 1999 to 2001 and served as Vice President Commissioner of Bank Prima Ekspress in the same period. From 2002 to 2004, he worked for Bank Danamon Indonesia Tbk, where his last position was Commercial and SME Banking Director, doubling as Chief Financial Officer. He also served as an Advisor to the President Director of PT Bank BNI Tbk in 2004 and as Chief Financial Officer of PT Merpati Nusantara Airlines in 2005.
Directors are elected and dismissed by shareholders. To be elected, candidates must be nominated by the Government as the holder of the Series A Dwiwarna share. The term of office for each Director is five years from the date of his election, unless the date of expiration of the term of office falls on a day other than a workday, in which case such term of office shall expire on the following workday, subject to the right of shareholders at the AGMS or an EGMS to discharge a Director at any time before the expiration of his term of office.
B. COMPENSATION
Compensation of Commissioners and Directors
Each Commissioner is entitled to remuneration including monthly compensation (honorarium), bonus, and other benefit. A bonus is based on our performance and achievements, which amount is determined by our shareholders at the GMS. Commissioners are also entitled to receive a lump sum benefit once they retire from their position.
Each Director is entitled to a remuneration consisting of a monthly salary and other allowances (including some pension benefits). Directors also receive an annual bonus based on our business performance and achievements, which amount is determined by shareholders at our AGMS. The bonus and incentive are budgeted every year based on recommendations of the Directors and confirmation from Board of Commissioners before being considered by shareholders at an AGMS.
The Nomination and Remuneration Committee is responsible for formulating the Commissioners’ and Directors’ salaries, which is further discussed in a joint meeting of the Board of Directors and Board of Commissioners for approval. The formula review that is agreed is then submitted to the shareholders at the AGMS for consideration and approval.
The procedure for determining remuneration of the Board of Commissioners is as follows:
- The Board of Commissioners requests the Nomination and Remuneration Committee to formulate a proposal for the remuneration of the Board of Commissioners;
- The Nomination and Remuneration Committee requests an independent party to formulate the framework for the remuneration of the Board of Commissioners;
- The Nomination and Remuneration Committee proposes the remuneration to the Board of Commissioners;
- The Board of Commissioners proposes the remuneration for the members of the Board of Commissioners to the GMS; and
- The GMS determines the remuneration for the members of the Board of Commissioners.
Bonus and incentives are budgeted every year based on recommendations of the Board of Directors and confirmation from the Board of Commissioners before being considered by the shareholders at the AGMS. The performance of the Board of Directors and other management is measured through effective performance evaluations, which are conducted comprehensively, systematically and periodically in accordance with a decree of the Board of Commissioners.
The net amount of remuneration paid to our Commissioners and Directors for the year ended December 31, 2011, including basic compensation (honorarium), bonus and other incentives, was Rp104 billion (US$11 million).
-87-
C. BOARD PRACTICES
Our Board of Commissioners acts as our overall supervisory and monitoring body with principal functions including planning and development, operations and budgeting in compliance with our Articles of Association, and to carry out the mandate and resolutions of the AGMS and EGMS. The Board of Commissioners does not have the authority to run or manage Telkom, except in the exceptional situation of all members of the Board of Directors having been suspended for any reason. The Board of Commissioners provides advice and opinions to the AGMS with respect to financial reporting, business development, appointment of auditors, and other important and strategic matters related to corporate actions. The Board of Commissioners also reviews our work plan and budget, keeps abreast of our progress, and, if there is any indication that Telkom is in trouble, immediately requests the Board of Directors to notify the shareholders and provides recommendations on measures for mitigation. Finally, the Board of Commissioners ensures that our corporate governance program is properly applied and maintained according to the applicable regulations.
The Board of Commissioners is obliged to carry out its duties and responsibilities according to our Articles of Association, decisions from the AGMS and EGMS and applicable laws and regulations.
The Board of Commissioners is assisted by a Board of Commissioners Secretary as well as the Audit Committee, Nomination and Remuneration Committee and Planning and Risk Evaluation and Monitoring Committee. As necessary, the Board of Commissioners seeks assistance from professional advisors.
Meetings of the Board of Commissioners are held at least once a month at any time deemed necessary by one or more member of the Board of Commissioners, or at the written request of one or more shareholders holding at least one-tenth of our outstanding shares of common stock. Decisions at Board of Commissioners meetings are taken through a process of deliberation and consensus. If a consensus cannot be reached, decisions are based on a majority vote of the Commissioners in attendance or who are represented at the meeting. In the event of a tie, the proposal in question must be rejected. The quorum for all Board of Commissioners meetings is more than one-half of the total number of Commissioners then represented in person or by proxy granted to another Commissioner at such meeting.
Our Board of Directors is generally responsible for managing our business in accordance with applicable laws, our Articles of Association and the policies and directives issued by the GMS and the Board of Commissioners. The Board of Directors also has the right to act for and on behalf of Telkom inside or outside a court of law, on any matter and for any event, with another party.
Meetings of the Board of Directors may be convened at any time deemed necessary at the request of one or more members of the Board of Directors, at the request of the Board of Directors or upon a written request from one or more shareholders representing one-tenth or more of the total number of outstanding shares of common stock.
Meetings of the Board of Directors are chaired by the President Director. In the event that the President Director is unavailable or absent for any reason, the meeting will be chaired by the Vice President Director or, if he is not present, by a member of the Board of Directors appointed by the meeting.
The decisions of the Board of Directors meetings shall be reached by consensus through deliberation. If this method fails, the decision shall be passed by voting based on the majority votes by Board of Director members cast in the meeting. A quorum is reached at a meeting of the Board of Directors is more than half of the members of the Board of Directors are present or represented legally in the meeting. Each member of the Board of Directors who is present at the meeting shall be entitled to cast one vote (and one vote for each other member of the Board of Directors whom he represents).
Individual Directors are charged with specific responsibilities.
-88-
Audit Committee
The Audit Committee operates under the authority of the Audit Committee Charter, which was stipulated by a Decree of the Board of Commissioners. The Audit Committee Charter is regularly evaluated and, if necessary, amended to ensure compliance with Bapepam-LK and SEC requirements and other relevant regulations. In 2011, we made an amendment to the Audit Committee charter, which was stipulated by Board of Commissioners’ Decree No.11/KEP/DK/2011 dated November 30, 2011 regarding the Charter of the Telkom Group Audit Committee.
The Audit Committee Charter outlines the Audit Committee’s purpose, function and responsibilities. It provides that the Audit Committee is responsible for:
- Overseeing our financial reporting process on behalf of the Board of Commissioners;
- Providing recommendations to the Board of Commissioners regarding the selection of our external auditor, subject to shareholder approval;
- Discussing with our internal and external auditors on the overall scope and plans of their respective audits;
- Discussing our Consolidated Financial Statements and the effectiveness of our internal controls (ICOFR);
- Meeting on a regular basis with our internal and external auditors, without management, to discuss the results of their examinations, their evaluation of our internal controls and the overall quality of our financial reporting; and
- Carrying out additional tasks that are assigned by the Board of Commissioners, especially on financial and accounting related matters as well as other obligations required by the Sarbanes Oxley Act of 2002.
The Audit Committee may engage an independent consultant or other professional advisers to assist in carrying out its functions. In addition, the Audit Committee receives and handles complaints.
Audit Committee Independence
Bapepam-LK Audit Committee Rules require that the Audit Committee consists of at least three members, one of whom must be an Independent Commissioner who serves as chairman, while the other two members must be independent. At least one of these two members must have expert knowledge (in the context of Item 16A of Form 20-F) in the field of accountancy or finance. In order to be considered independent under the prevailing Indonesian rules, the external members of the Audit Committee:
- May not be an executive officer of a public accountant firm that has provided audit or non-audit services to us within the six months prior to his or her appointment as an Audit Committee member;
- May not have been an executive officer of Telkom within the six months prior to his or her appointment as an Audit Committee member;
- May not be affiliated with our majority shareholder;
- May not have a family relationship with any member of the Board of Commissioners or Board of Directors;
- May not own, directly or indirectly, any of our shares and
- May not have any business relationship that relates to our businesses.
Currently, the Audit Committee consists of six members: (i) Rudiantara (Independent Commissioner - Chairman); (ii) Salam (Secretary); (iii) Johnny Swandi Sjam (Independent Commissioner); (vi) Bobby A.A. Nazief (Commissioner); (v) Sahat Pardede and (vi) Agus Yulianto.
-89-
Audit Committee Financial Expert
See “Item 16A. Audit Committee Financial Expert”.
Exemption from US Listing Standards for Audit Committees
See “Item 16D. Exemptions from the Listing Standards for Audit Committees”.
Nomination and Remuneration Committee
Our Nomination and Remuneration Committee was formed based on Board of Commissioner’s decree No.003/KEP/DK/2005 dated April 21, 2005 regarding the Formation of the Nomination and Remuneration Committee.
The objective of the Nomination and Remuneration Committee is to establish, administer and enforce corporate governance principles in the process of nomination for strategic management positions and the determination of the Board of Directors’ remuneration. The duties of the Nomination and Remuneration Committee are to:
- Devise a nomination and selection system for strategic positions within Telkom, referring to corporate governance principles, such as transparency, accountability, responsibility, fairness and independence;
- Assist the Board of Commissioners who engaged with the Directors in selecting candidates for strategic positions in Telkom (i.e. one level under the Directors and similarly for Directors and Commissioners of a consolidated subsidiary that contributes 30% or more of our consolidated revenue, such as Telkomsel). Exclusively for Telkomsel, the Committee’s recommendation would be passed on to the holder of the Series A Dwiwarna share; and
- Formulate a remuneration system for Directors based on fairness and performance.
As of December 31, 2011, the members of our Nomination and Remuneration Committee were Jusman Syafii Djamal (Chairman), Mahmuddin Yasin, Bobby A.A. Nazief, Rudiantara, Johnny Swandi Sjam and Yuki Indrayadi. To maintain independence in the execution of their tasks, members of the Nomination and Remuneration Committee have no relationship, either directly or indirectly, with Telkom.
-90-
D. EMPLOYEES
As of December 31, 2011, the Telkom Group employed a total of 26,023 people, consisting of19,780 Telkom employees and6,243 employees of our subsidiaries. This represents adecline of3.1% from the December 31, 2010 position of 26,847 employees, reflecting the implementation of our multi exit programs that began in 2005.
Employee Profile by Position
The table below shows a breakdown of Telkom Group employees by position:
| | 2011 | |
Position | | Telkom | | Subsidiaries | | Telkom Group | | % | |
Senior Management | | 136 | | 76 | | 212 | | 0.8 | |
Middle Management | | 2,497 | | 1,157 | | 3,654 | | 14.0 | |
Supervisors | | 9,694 | | 2,162 | | 11,856 | | 45.6 | |
Others | | 7,453 | | 2,848 | | 10,301 | | 39.6 | |
Total | | 19,780 | | 6,243 | | 26,023 | | 100.0 | |
Employee Profile by Educational Background
As of December 31, 2011, 27.9% of Telkom’s employees did not have a tertiary education (pre college), compared to 42.1% who had graduated college. This represented that Telkom focus on recruiting more highly educated candidates with the right qualifications to support the Company’s growth.
| | 2011 | |
Level of Education | | Telkom | | Subsidiaries | | Telkom Group | | % | |
Pre College | | 6,695 | | 564 | | 7,259 | | 27.9 | |
Diploma Graduates | | 4,808 | | 944 | | 5,752 | | 22.1 | |
University Graduates | | 6,594 | | 4,351 | | 10,945 | | 42.1 | |
Post Graduates | | 1,683 | | 384 | | 2,067 | | 7.9 | |
Total | | 19,780 | | 6,243 | | 26,023 | | 100.0 | |
Employee Profile by Age
As of December 31, 2011 employees over the age of 45 continued to dominate the workforce at54.6%, followed by employees in the 31 to 45 age group by35.4% and those under 30 age group by10.0%.
| | 2011 | |
Age Group | | Telkom | | Subsidiaries | | Telkom Group | | % | |
<30 | | 913 | | 1,686 | | 2,599 | | 10.0 | |
31 - 45 | | 5,089 | | 4,127 | | 9,216 | | 35.4 | |
>45 | | 13,778 | | 430 | | 14,208 | | 54.6 | |
Total | | 19,780 | | 6,243 | | 26,023 | | 100.0 | |
Pension Programs
1) Ongoing Early Retirement Program
Telkom’s early retirement program was designed to create a more effective and competitive business environment. The program is aligned with our Human Capital Master Plan 2011-2015, which projects a reduction of 2,870 employees. The program is offered on a voluntary basis to employees who meet certain criteria (related to education, age, position and performance). Since it started in 2002 until December 31, 2011, a total of Rp7 trillion was paid out to 13,414 employees under this program.
-91-
2) Defined Benefit Pension Plan
The retirement age for all Telkom employees is 56. Telkom offers two pension programs:
(i) The Defined Benefit Pension Plan for permanent employees who joined the Company before July 1, 2002; and
(ii) The Defined Contribution Pension Plan for all other permanent employees.
Under the defined benefit pension plan, the pension is based on an employee’s length of service and salary level upon retirement, and is transferable to dependents upon the employee’s death. The defined benefit pension plan is managed by Telkom’s Pension Fund and is funded by contributions from us and our employees. Eligible employees contribute 18.0% of their basic salary (prior to March 2003, the employee contribution was 8.4%), while we contribute the remaining amount required to fund the plan. The minimum monthly pension benefit for retired employees is approximately Rp425,000. Our total contributions to the pension fund under defined benefit pension plan amounted to Rp485 billion and Rp187 billion for the years 2010, and 2011, respectively.
3) Defined Contribution Pension Plan
We provide a defined contribution pension plan for permanent employees recruited on or after July 1, 2002. The defined contribution pension plan is managed by the Pension Fund Institution, a Financial Institutions Pension Fund (“FIPF”). Under this plan, employees may choose from plans sponsored by several recognized pension fund institutions. Our annual contribution to the defined contribution pension plan is determined based on a certain percentage of the participating employees’ salaries, and amounted to Rp4 billion, and Rp5 billion for the years 2010, and 2011, respectively. Employees who have served more than a certain number of years are entitled to additional rewards such as retirement housing, a post-retirement cash award, and retirement travel with certain allowances which are determined upon resignation or retirement.
Telkomsel provides a defined benefit pension plan to its employees. Under this plan, employees are entitled to pension benefits based on their latest basic salary or take-home pay and the number of years of service. PT Asuransi Jiwasraya, a state-owned life insurance company, manages the plan under an annuity insurance contract. Until 2004, the employees contributed 5.0% of their monthly salaries to the plan and Telkomsel contributed any remaining amount required to fund the plan. Starting in 2005, the entire contributions are fully made by Telkomsel.
Telkomsel also provides long service awards in the form of cash or leave days to its employees based on their length of service. These awards may be provided at employment anniversary dates or at the time of termination. Some of these awards are at the discretion of management.
Infomedia also provide a defined benefit pension plan to its employees.
Employee Relations Management
Pursuant to Presidential Decree No.83/1998 regarding the Ratification of ILO Convention No.87/1948 regarding Freedom of Association and Protection of the Right to Organize, several Telkom employees established the Telkom Employees Union (SEKAR). As of December 31, 2011, SEKAR represented a total of 18.691 employees, or 94.5% of our total workforce.
In accordance with Law No.13/2003 regarding labor, SEKAR is entitled to represent our employees in the negotiation of the Collective Work Agreement (“CWA”). The current CWA is effective until 2012. We anticipate that negotiations for the fifth next CWA will commence in June 2012.
Telkomsel and Infomedia also have employee unions. The employee union in Telkomsel known as “SEPAKAT” (Serikat Pekerja Karyawan Telkomsel) represents a total of 3,730 employees or 84.0% of Telkomsel’s total workforce.
E. SHARE OWNERSHIP
Each Director and Commissioner on an individual basis beneficially owns less than one percent of our outstanding shares of common stock. Only two Directors beneficially own shares of common stock. As of December 31, 2011, Ermady Dahlan owns 17,604 shares and Indra Utoyo owns 5,508 shares.
Telkom Employee Stock Ownership Program
The main Employee Stock Ownership Program (“ESOP”) includes the buying and selling of ESOP shares and the provisioning of ESOP share dividends. At our initial public offering on November 14, 1995, a total of 116,666,475 shares were issued to 43,218 employees. As of December 31, 2011, 12,682,122 of our shares were owned by 11,040 of our employees and Telkom retirees.
-92-
ITEM 7. MAJOR STOCKHOLDERS AND RELATED PARTY TRANSACTIONS
A. MAJOR SHAREHOLDERS
Shareholder Composition
Our authorized capital consists of one Series A Dwiwarna share and issued and 79,999,999,999 Series B (common stock) shares. Among this authorized shares, 20,159,999,280 of which are issued and fully paid, consists of the series a dwiwarna share and 20,159,999,279 common stock.The Series A Dwiwarna share is owned by the Government and carries special voting rights and the right to veto the appointment or removal of any director or commissioner, the issue of new shares and amendments to our Articles of Association including amendments to merge or dissolve Telkom prior to the expiry of its term of existence, to increase or decrease our authorized capital or to reduce our subscribed capital. The material rights and restrictions placed on the common stock also apply to the Dwiwarna share, except that the Government cannot transfer the Dwiwarna share. The Government’s ownership of the Dwiwarna share gives it effective control over our Company even if it reduces its ownership of our common stock, and its rights with respect to the Dwiwarna share may only be modified by an amendment of our Articles of Association, which the Government may veto. See Notes 20, 21 and 22 to our Consolidated Financial Statement.
Company Shareholders per December 31, 2011
| | Series A Dwiwarna Share | | Series B Shares | | % | |
(Common Stock) |
Government of the Republic of Indonesia | | 1 | | 10,320,470,711 | | 53.24 | |
Public | | | | 9,065,868,608 | | 46.76 | |
Capital Subtotal (issued and outstanding) | | 1 | | 19,386,339,319 | | 100.00 | |
Treasury Stock | | | | 773,659,960 | | - | |
Total | | 1 | | 20,159,999,279 | | 100.00 | |
Shareholders Owning more than 5% and Number of Shares Owned by Directors and Commissioners, as of December 31, 2011
Title of Class | | Person or Group | | Amount Owned | | Percent of Class (%) | |
Series A | | Government | | 1 | | - | |
Series B | | Government | | 10,320,470,711 | | 53.24 | |
Series B | | Board of Directors | | 23,112 | | <0.01 | |
Composition of Telkom Shareholders of Common Stock by Type with Less than 5% Individual Ownership as of December 31, 2011
Group | | Number of Shares of | | Percent (%) of | |
Common Stock Owned | Common Stock Owned |
Foreign | | | | | |
Business | | 7,534,677,378 | | 38.87 | |
Individual | | 5,738,440 | | 0.03 | |
Local | | | | | |
Business Entities | | | | | |
Companies | | 534,553,309 | | 2.76 | |
Mutual Funds | | 302,776,225 | | 1.56 | |
Insurance Companies | | 292,822,540 | | 1.51 | |
Pension Funds | | 168,726,530 | | 0.87 | |
Other Business Entities | | 5,448,004 | | 0.03 | |
Individuals | | 221,126,182 | | 1.14 | |
Total | | 9,065,868,608 | | 46.76 | |
-93-
Relationship with the Government and Government Agencies
Our relationship with the Government is multi-faceted. The Government is our majority and controlling shareholder. It is also our regulator as it adopts, administers and enforces relevant laws that regulate telecommunications sector, sets tariffs and issues licenses. It is also one of our customers and one of our lenders.
As used in this section, the term “Government” includes the Government of Indonesia and its ministries, directly-owned government departments and agencies, but excludes state-owned enterprises.
The Government as Shareholder
The Government is our majority and controlling shareholder and owned 53.2% of our common stock as of December 31, 2011. Its ownership of the Series A Dwiwarna share gives it special voting and veto rights. Under relevant laws, the “ownership” of our common stock and the single outstanding Series A Dwiwarna share is vested in the Ministry of Finance (“MoF”). In turn, and under the authority of the MoF, the Minister of State-Owned Enterprise (“MSOE”) exercises the rights vested in these securities as our “controlling shareholder.”
As our majority shareholder and controlling shareholder, the Government has an interest in our performance, both in terms of the benefits we provide to the nation and our ability to operate on a commercial basis. The material rights and restrictions that apply to our common stock also apply to the Series A Dwiwarna share, except that the Government may not transfer the Series A Dwiwarna share, and has right of veto with regard to: (1) the nomination, appointment and removal of our Directors; (2) the nomination, appointment and removal of our Commissioners; (3) the issuance of new shares and (4) any amendments to our Articles of Association, including with respect to actions to merge or dissolve the Company, increase or reduce our authorized capital, or reduce our subscribed capital.
Accordingly, the Government effectively has control over these matters even if it owns less than a majority share of the outstanding common stock. The Government’s rights with respect to the Series A Dwiwarna share will not expire unless there is a change that requires the amendment of our Articles of Association, which would require the consent of the Government as the holder of Series A Dwiwarna share.
The Government as Regulator
The Government regulates the telecommunications sector through the Ministry of Communications and Informatics (“MoCI”). The MoCI has the authority to issue regulations that implement laws, which are typically broad in scope. Through such decrees the MoCI defines the structure of the industry, determines tariff formulas, establishes our Universal Service Obligations (“USO”), and otherwise controls many factors that could influence our competitive position, operations and financial position. Through the Directorate General of Post and Telecommunications (“DGPT”), the MoCI regulates the allocation of frequencies and sets numbers for fixed telephone lines. We are required to obtain a license from the DGPT for each type of service offered, including for the frequencies we use (as allocated by the MoCI). We and other operators are required to pay frequency usage fees. Telkomsel also holds licenses issued by the MoCI (some of which were previously issued by the Minister of Communications) for the provision of cellular services, and from the Indonesian Investment Coordinating Board in relation to Telkomsel’s investments for the development of cellular phone services with national coverage, including the expansion of network coverage. The Government, through the MoCI as regulator, has the authority to issue new licenses for the establishment of new joint ventures and other new arrangements, particularly in telecommunications.
Certain of these licenses require us to pay a concession fee to operate. We pay concession fees for telecommunications services provided and radio frequency usage charges to the MoCI. Concession fees amounted to Rp342 billion in 2010, and Rp356 billion (US$39 million) in 2011. Concession fees as a percentage of total expenses amounted to 0.7% in 2010 and 2011. Radio frequency usage charges amounted to Rp2,892 billion in 2010, and Rp2,846 billion (US$314 million) in 2011. Radio frequency usage charges as a percentage of total expenses amounted to 6.2% in 2010 and 5.7% in 2011. We paid USO charges to the MoCI amounting to Rp835 billion in 2010, and Rp879 billion (US$97 million) in 2011. USO charges as a percentage of our total expenses came to 1.8% in 2010 and 2011.
-94-
Table of Content
The Government as Lender
In July 1994, the Government arranged a facility under which certain foreign institutions provided us (via the Government), with funds (“sub loan borrowings”) as “two-step loans” for certain expenditures. The sub-loan borrowings are guaranteed by the Government. As of December 31, 2011, we had a total of Rp2,284 billion (US$252 million) in such outstanding two-step loans, including current maturities. We are required to pay the Government interest and repay the principal, which the Government then remits to the respective lenders. As of December 31, 2011, 68.6% of such sub loan borrowings were denominated in foreign currencies, with the remaining 31.4% denominated in Rupiah. In 2011, the annual interest rates charged 7.7% on loans repayable in Rupiah, 4.0% on those denominated in US Dollar and 3.1% for those denominated in Japanese Yen.
The Government as Customer
Certain Government departments and agencies purchase services from us as direct customers, the terms of which are negotiated on a commercial basis. No services are provided for free or on an in-kind basis. We deal with these departments and agencies as separate customers. In 2011, the amount of revenues from Government departments and agencies excluding State-Owned Enterprises, was Rp1,114 billion, which was approximately 1.6% of our consolidated total revenues and did not constitute a material part of our revenues. The Government departments and agencies are treated for tariff purposes with respect to connection charges and monthly charges as “residential”, which tariffs are lower than the business service rates. This does not apply to the tariffs for local, long distance and IDD calls.
It is our policy not to enter into any transactions with affiliates unless the terms are no less favorable to us than they would be with a third party. The MSOE has advised us that it would not cause us to enter into transactions with other entities under its control unless the terms were consistent with our policy as referred to above.
Pursuant to Bapepam-LK regulations, because we are listed on the IDX, any transaction where there is an inherent conflict of interest (as defined below) with another IDX-listed company, must be approved by majority of the holders of our common stock who do not have a conflict of interest in the proposed transaction, unless such conflict of interest existed before listing and was fully disclosed in the offering documents.
Bapepam-LK regulations define a conflict of interest as a conflict between our economic interests and the shareholders’ interests on the one hand, and on the other, the personal economic interests of members of the Board of Commissioners, Board of Directors or other principal shareholders (defined as a holder of 20% or more of our common stock) or their affiliates, either jointly or individually. A conflict of interest also exists if a member of the Board of Commissioners or Board of Directors or a principal shareholder or their respective affiliates is involved in a transaction in which its personal interests may be in conflict with ours. Bapepam-LK has the authority to enforce these rules regarding conflicts of interest and holders of our common stock are also entitled to bring a suit to enforce these.
Under Bapepam-LK regulations, transactions between us and other State-Owned or controlled enterprises may cause a conflict of interest. In such cases, the approval of the disinterested shareholders must be obtained if a conflict of interest arises. We believe that many transactions conducted with State-Owned or controlled enterprises are on an arms-length, commercial basis and do not constitute conflict of interest transactions that would require an independent shareholders vote. Such transactions include our sale of telephone services to State-Owned or controlled enterprises and our purchase of electricity from a State-Owned Enterprise. We expect that from time to time, in connection with the development and growth of our business we would enter into joint ventures, agreements or transactions with such enterprises. Under such circumstances, we may consult Bapepam-LK to determine whether a proposed joint venture, agreement or transaction would require a vote of independent shareholders under Bapepam-LK rules. If Bapepam-LK is of the view that such transaction would not require such a vote, we would proceed without seeking the independent shareholders’ approval. Otherwise, we would seek the requisite approval or abandon the proposed action.
Other
Proportion of Common Stock Held in Indonesia and Abroad
Telkom’s authorized capital consists of 1 Series A Dwiwarna share, which is owned by the Government of the Republic of Indonesia (the Government), and issued and fully paid 79,999,999,999 Series B shares (common stock). As the owner of the Series A Dwiwarna share, the Government has special voting rights as well as the material rights and restrictions placed on the common stock, except that the Government cannot transfer the Dwiwarna share. Moreover the holder of the special rights has right of veto with respect to the appointment and removal of any Directors and Commissioners, the issuance of new shares and amendments to our Articles of Association, including amendment to merge or dissolve the Company prior to the expiry of its term of existence, to increase or decrease our authorized capital or to reduce our subscribed capital.
-95-
As of December 31, 2011, Telkom had 36,314 common stock shareholders, including the Government. This total includes 7,540,415,818 common stock shares owned by 1,322 shareholders outside Indonesia. As of the same date,there were 120 ADS shareholders who owned 73,824,138 ADS (equivalent to 2,952,965,536 common stock shares).
Change in Control
As of the date of this2011 Annual Report, we are not aware of any plans or developments that could result in a change of control over Telkom, including changes that are still at the planning stage.
B. RELATED PARTY TRANSACTIONS
We are party to certain agreements and engage in transactions with certain parties that are related to us, such as joint venture companies, cooperatives and foundations. Such parties include the Government and entities related to or owned or controlled by the Government, such as other State-Owned Enterprises. For further details on our related party transactions, see Note 34 to our Consolidated Financial Statements.
C. INTEREST OF EXPERTS AND COUNSEL
Not applicable.
ITEM 8. FINANCIAL INFORMATION
A. CONSOLIDATED STATEMENTS AND OTHER FINANCIAL INFORMATION
See “Item 17. Financial Statements” for our audited Consolidated Financial Statements filed as part of this Form 20-F.
Material Litigation
In the ordinary course of business, the Company and certain of its subsidiaries have been named as defendants in various legal actions in relation with land disputes, monopolistic practice, unfair business competition and SMS cartel practices and industrial relations. Based on management's estimate of the probable outcomes of these matters, the Company and its subsidiaries have accrued Rp67.2 billion as of December 31, 2011.
The following describes certain proceedings involving us and/or our employees.
- Telkom, Telkomsel and seven other local operators are being investigated by the Commission for the Supervision of Business Competition (“Komisi Pengawasan Persaingan Usaha” or “KPPU”) for allegations of SMS cartel practices. As a result of the investigations, on June 17, 2008, KPPU found that Telkom, Telkomsel and certain other local operators were proven to have violated article 5 of Law No. 5/1999 and gave the Company and Telkomsel a Rp18,000 million penalty and Rp25,000 million penalty, respectively. Mobile-8 (now Smartfren) filed a similar objection with the Central Jakarta District Court, where XL, Indosat, Hutchinson, Bakrie Telecom, Smart Telecom, Natrindo and we were summoned as additional parties to be bound by the court proceedings. The KPPU subsequently requested the Supreme Court to consolidate the three cases into Central Jakarta District Court, which the Court did by letter dated April, 12, 2011. As of the date of this Form 20-F, the Company is not aware that the Central Jakarta District Court has reached any decision in this matter.
Our management believes that there are no such cartel practices involving Telkom that led to a breach of prevailing regulations. Accordingly, Telkom and Telkomsel filed objections to the KPPU’s administrative findings with the Bandung District Court on July 14, 2008 and the South Jakarta District Court on July 11, 2008, respectively.
After various operators filed cases in various district courts, the KPPU subsequently requested the Supreme Court to consolidate the case in the Central Jakarta District Court. This request was granted in a decision letter dated April 12, 2011. As of the issuance date of the Consolidated Financial Statements, the Company and Telkomsel have not received any notification from court.
-96-
We believe that the outcomes of the investigations or court rulings on these cases will not have any material impact on our financial condition. See Note 38 to our Consolidated Financial Statements for further details.
Dividend Policy
The AGMS has the authority to determine the amount of dividends we pay. Our dividend payout ratio for 2011 will be decided at the AGMS scheduled for May 2012.
Dividend Year | | Date of AGMS | | Pay Out Ratio (%)(1) | | Amount of Dividends (Rp million) | | Dividend per Share (Rp) | |
2006 | | June 29, 2007 | | 55 | | 6,053,067 | (2) | | | |
2007 | | June 20, 2008 | | 70 | | 8,999,913 | (3) | | | |
2008 | | June 12, 2009 | | 55 | | 5,840,708 | | | 296.94 | |
2009 | | June 11, 2010 | | 50 | | 5,666,070 | (4) | | 288.06 | |
2010 | | May 19, 2011 | | 55 | | 6,345,350 | (5) | | | |
(1) Represents the percentage of profit attributable to owners of the parent paid to shareholders in dividends.
(2) Including interim cash dividend paid in November 2006 amounting to Rp971,017 million.
(3) Including interim cash dividend paid in December 2007 amounting to Rp965,398 million.
(4) Including interim cash dividend paid in December 2009 amounting to Rp524,190 million.
(5) Including interim cash dividend paid in December 2010 and January 2011 amounting to Rp276,072 million and Rp250,085 million respectively.
Pursuant to our AGMS in June 2011, Telkomsel approved the payment of a cash dividend of Rp8,653.7 billion, which represented 70% of Telkomsel’s net profit in 2010. 35% of this dividend was distribute to SingTel Mobile, Telkomsel’s largest minority shareholder.
In 2009, 2010 and 2011,cash dividends were paid to SingTel Mobile, a minority shareholder of Telkomsel, amounting toRp2,518.2 billion, Rp3,261.3 billion and Rp2,725.6billion.
B. SIGNIFICANT CHANGES
See Note 42 to our Consolidated Financial Statements.
-97-
ITEM 9. THE OFFER AND LISTING
A. OFFER AND LISTING DETAILS
The table below shows the high, low, closing quoted prices and trading volume for our common stock on the IDX during the periods indicated:
| | Price per Share of Common Stock(*) | | Volume (shares) | |
Calendar Year | | High | | Low | | Closing | | | |
| | (in Rupiah) | | | |
2007 | | 12,650 | | 8,900 | | 10,000 | | 5,718,438,000 | |
First Quarter | | 10,350 | | 8,900 | | 9,700 | | 1,250,176,000 | |
Second Quarter | | 10,800 | | 9,400 | | 9,700 | | 1,340,736,500 | |
Third Quarter | | 11,450 | | 9,850 | | 10,850 | | 1,230,125,000 | |
Fourth Quarter | | 12,650 | | 10,000 | | 10,000 | | 1,897,400,500 | |
2008 | | 10,250 | | 5,000 | | 6,900 | | 6,162,126,500 | |
First Quarter | | 10,250 | | 8,400 | | 9,500 | | 1,615,643,500 | |
Second Quarter | | 9,700 | | 7,189 | | 7,200 | | 1,424,645,500 | |
Third Quarter | | 7,878 | | 6,155 | | 7,050 | | 1,663,345,000 | |
Fourth Quarter | | 7,250 | | 5,000 | | 6,900 | | 1,458,492,500 | |
2009 | | 10,350 | | 5,750 | | 9,450 | | 4,174,413,500 | |
First Quarter | | 7,900 | | 5,750 | | 7,550 | | 677,507,000 | |
Second Quarter | | 8,100 | | 6,850 | | 7,500 | | 1,405,779,000 | |
Third Quarter | | 9,450 | | 7,550 | | 8,650 | | 1,232,832,000 | |
Fourth Quarter | | 10,350 | | 7,850 | | 9,450 | | 858,295,500 | |
2010 | | 9,800 | | 6,950 | | 7,950 | | 5,707,850,000 | |
First Quarter | | 9,700 | | 7,950 | | 8,050 | | 1,143,530,500 | |
Second Quarter | | 8,350 | | 6,950 | | 7,700 | | 1,550,508,500 | |
Third Quarter | | 9,450 | | 7,600 | | 9,200 | | 1,186,753,000 | |
Fourth Quarter | | 9,800 | | 7,650 | | 7,950 | | 1,827,058,000 | |
2011 | | 8,050 | | 6,600 | | 7,050 | | 4,441,579,000 | |
First Quarter | | 8,050 | | 6,600 | | 7,350 | | 1,297,346,000 | |
Second Quarter | | 7,850 | | 6,800 | | 7,350 | | 957,638,000 | |
Third Quarter | | 7,900 | | 6,900 | | 7,600 | | 1,261,616,000 | |
Fourth Quarter | | 7,750 | | 6,900 | | 7,050 | | 924,979,000 | |
September | | 7,900 | | 6,900 | | 7,600 | | 447,377,500 | |
October | | 7,750 | | 7,000 | | 7,400 | | 442,462,000 | |
November | | 7,650 | | 7,150 | | 7,350 | | 222,600,500 | |
December | | 7,500 | | 6,900 | | 7,050 | | 259,916,500 | |
2012 | | | | | | | | | |
January | | 7,150 | | 6,800 | | 6,800 | | 344,578,000 | |
February | | 7,100 | | 6,650 | | 7,050 | | 369,165,000 | |
March (15) | | 7,150 | | 6,700 | | 6,800 | | 182,332,000 | |
(*) We conducted a two for one split of our common stock from a nominal value of Rp500 per share to Rp250 per share as resolved by the AGMS on July 30, 2004, effective October 1, 2004. The price per share of the common stock reflects this split for all periods shown.
On December 30, 2011, the last day of trading on the IDX in 2011, the closing price for our common stock wasRp7,050 per share.
-98-
The high, low, closing prices and trading volume for our ADSs on the NYSE and the LSE for the periods indicated are shown in the table below. Trading in ADSs is effected “off exchange” on the LSE. Under LSE rules, off exchange trading means that transactions are carried out on other exchanges and once the transaction has taken place, it is reported to the LSE.
| | Price per ADS (NYSE) | | Volume | | Price per ADS (LSE) | | Volume | |
Calendar Year | | High | | Low | | Closing | | (in ADS) | | High | | Low | | Closing | | (in ADS) | |
| | | | (in US Dollars) | | | | | | | | (in US Dollars) | | | | | |
2007 | | 56.50 | | 37.74 | | 41.57 | | 83,650,348 | | 56.87 | | 38.29 | | 41.33 | | 43,051 | |
First Quarter | | 46.98 | | 37.74 | | 42.69 | | 23,459,831 | | 46.82 | | 39.30 | | 42.91 | | 30,000 | |
Second Quarter | | 47.02 | | 42.70 | | 42.65 | | 16,844,563 | | 47.15 | | 39.60 | | 43.23 | | 10,137 | |
Third Quarter | | 51.61 | | 40.00 | | 48.31 | | 19,900,045 | | 51.60 | | 38.29 | | 48.80 | | 1,729 | |
Fourth Quarter | | 56.50 | | 41.88 | | 41.57 | | 23,445,909 | | 56.87 | | 41.79 | | 41.33 | | 1,185 | |
2008 | | 45.50 | | 17.31 | | 25.01 | | 98,988,347 | | 45.74 | | 16.89 | | 24.62 | | 38,028 | |
First Quarter | | 45.50 | | 37.50 | | 41.50 | | 21,441,196 | | 45.74 | | 36.32 | | 41.99 | | 6,808 | |
Second Quarter | | 42.86 | | 31.50 | | 31.91 | | 22,504,983 | | 41.99 | | 32.03 | | 32.40 | | 120 | |
Third Quarter | | 34.49 | | 26.47 | | 29.47 | | 23,663,355 | | 35.43 | | 26.46 | | 28.49 | | 20,000 | |
Fourth Quarter | | 30.65 | | 17.31 | | 25.01 | | 31,378,813 | | 29.31 | | 16.89 | | 24.62 | | 11,100 | |
2009 | | 41.55 | | 20.19 | | 39.95 | | 67,767,999 | | 40.76 | | 25.67 | | 41.02 | | 3,757 | |
First Quarter | | 26.45 | | 20.19 | | 25.70 | | 16,518,171 | | 27.92 | | 25.67 | | 25.67 | | 3,000 | |
Second Quarter | | 31.25 | | 24.93 | | 29.98 | | 20,038,628 | | 36.91 | | 31.76 | | 31.76 | | 429 | |
Third Quarter | | 35.93 | | 31.38 | | 35.70 | | 18,490,886 | | 37.43 | | 37.16 | | 37.16 | | 270 | |
Fourth Quarter | | 41.55 | | 33.56 | | 39.95 | | 12,720,314 | | 40.76 | | 37.16 | | 41.02 | | 58 | |
2010 | | 43.80 | | 30.33 | | 35.65 | | 69,803,576 | | 42.00 | | 30.76 | | 34.91 | | 19,673 | |
First Quarter | | 41.18 | | 34.62 | | 35.76 | | 15,338,571 | | 41.20 | | 35.41 | | 35.41 | | 1,030 | |
Second Quarter | | 36.89 | | 30.33 | | 34.23 | | 16,873,723 | | 36.16 | | 30.76 | | 34.89 | | 2,392 | |
Third Quarter | | 42.31 | | 33.75 | | 41.29 | | 15,732,144 | | 42.00 | | 34.20 | | 42.00 | | 15,324 | |
Fourth Quarter | | 43.80 | | 34.10 | | 35.65 | | 21,859,138 | | 40.60 | | 34.91 | | 34.91 | | 927 | |
2011 | | 36.96 | | 30.29 | | 30.74 | | 69,279,100 | | 35.89 | | 21.02 | | 30.50 | | 1,406,292 | |
First Quarter | | 36.05 | | 30.51 | | 33.58 | | 17,278,400 | | 35.73 | | 33.39 | | 33.44 | | 697 | |
Second Quarter | | 36.28 | | 32.21 | | 34.50 | | 16,636,000 | | 35.89 | | 35.82 | | 35.88 | | 354,770 | |
Third Quarter | | 36.96 | | 30.29 | | 33.07 | | 20,886,200 | | 35.59 | | 33.58 | | 34.44 | | 87,554 | |
Fourth Quarter | | 34.48 | | 30.62 | | 30.74 | | 14,478,500 | | 21.02 | | 21.02 | | 30.50 | | 963,271 | |
September | | 36.65 | | 30.29 | | 33.07 | | 7,379,100 | | 34.44 | | 34.44 | | 34.44 | | 50,000 | |
October | | 34.48 | | 32.01 | | 33.80 | | 5,563,300 | | 33.56 | | 21.02 | | 33.44 | | 1,420 | |
November | | 34.42 | | 31.66 | | 32.75 | | 3,766,400 | | 33.59 | | 33.59 | | 33.59 | | 5,800 | |
December | | 33.06 | | 30.62 | | 30.74 | | 5,148,800 | | 32.53 | | 30.39 | | 30.50 | | 956,051 | |
2012 | | | | | | | | | | | | | | | | | |
January | | 31.47 | | 30.30 | | 30.65 | | 5,563,480 | | 31.23 | | 30.09 | | 30.48 | | 82,547 | |
February | | 31.57 | | 29.86 | | 30.61 | | 6,473,837 | | 31.26 | | 30.03 | | 31.26 | | 376 | |
March (15) | | 31.69 | | 29.26 | | 29.51 | | 3,643,721 | | 31.35 | | 29.67 | | 29.67 | | 65 | |
On December 30, 2011, the last day of trading on the NYSE and LSE in 2011, the closing price for one Telkom ADS was US$30.74and US$30.50 respectively.
B. PLAN OF DISTRIBUTION
Not applicable.
C. MARKETS
Our common stock is listed and trades on the IDX. Our ADSs are listed and trade on the NYSE and the LSE as ADSs, where one ADS represents 40 shares of common stock. Our shares are Publicly Offered Without Listing (“POWL”) in Japan.
-99-
The Indonesian Stock Market
Indonesia’s stock market, known as the IDX, grew out of the December 1, 2007, merger of two stock exchanges operating in two different locations in Indonesia, the Jakarta Stock Exchange in the capital and the Surabaya Stock Exchange in East Java.
The IDX has 440 issuer and 117 brokerage firms. During 2011, the IDX recorded a trading volume of1,203.6 billion shares. On December 31, 2011, the total market capitalization valued at Rp3,537 trillion.
Trading on the IDX runs from Monday to Thursday, with daily trading divided into two sessions on both the regular market and the negotiated market. The morning session runs from 09.30 to 12.00, while the afternoon session runs from 13.30 to 16.00. The Friday trading sessions run from 09.30 to 11.30 and 14.00 to 16.00. There is only one daily trading session for the cash market: 09.30 to 12.00 from Monday to Thursday, and 09.30 to 11.30 on Fridays.
Trading is divided into three segments: the regular market, negotiated market and the cash market (except for rights issues, which can only be traded on the cash market and the negotiated market for the first session). The regular market is the mechanism for trading stock in standard lots on a continuous auction basis during exchange hours. Trading on the regular and cash markets is typically carried out in lots of 500 shares apiece. The IDX also employs share price movement restrictions.
Auctions on the IDX on regular market and cash market take place according to the price and time priorities. Price priority refers to the giving of priority to buying orders at a higher price or selling orders at a lower price. If buying or selling orders are placed at the same price, priority is given to the earlier placed buying or selling order (time priority).
Trading on the negotiated market is conducted through direct negotiation between (i) IDX members, (ii) clients through one IDX member, (iii) a client and an IDX member, or (iv) an IDX member and the Indonesian Clearing and Guarantee Corporation (“KPEI”).
Transactions on the IDX regular market must be settled no later than the third trading day after the transaction. Transactions on the negotiated market are settled on the basis of the agreement between the selling exchange members and the buying exchange members, on a transaction by transaction basis. Transactions on the IDX cash market must be settled on the day of the transaction and reported to the IDX. If an exchange member defaults on the settlement of a transaction, the securities can be traded by direct negotiation on cash and carry terms. Each exchange member is required to pay a transaction fee as stipulated by the IDX. Any delay in payment of the transaction fee is subject to a fine of 1.0% of the outstanding amount for each day of delay. The IDX may impose sanctions on its members for any violation of exchange rules, which may include fines, written warnings, suspension or revocation of licenses.
IDX is authorized to cancel transactions upon proof of fraud, market manipulation or misuse of insider information. The IDX may also suspend trading if there are indications of fraudulent transactions or artificial inflation of share prices, misleading information, reference to insider information, counterfeit securities or securities blocked from trading, or any other material event.
When conducting share transactions on the IDX, each exchange member is required to pay a transaction cost of 0.018% of the transaction value (for transactions on the regular market and cash market). For the negotiated market, a transaction cost depended on exchange policy. There is a minimum monthly transaction cost of Rp20 million paid as a contribution for the provision of exchange facilities, and this remains in effect for suspended members.
Shareholders or their appointees may request that the issuer or a securities administration bureau appointed by the issuer register their shares in the issuer’s shareholders registry. Shareholders whose the ownership is equivalent to or has changed by 5.0% or more of the issued and fully paid up capital are required to report such ownership to the Capital Market and Financial Institutions Supervisory Board (“Bapepam-LK”), if there is material conditionthat change the ownershipstructure in the companies.
Since the global financial crisis in the last quarter of 2008 that caused a typical share price movements, the IDX has applied a policy of auto rejection, a mechanism whereby share trading can be halted automatically in order to maintain orderly, fair and efficient trading. Following changes made by the IDX in October 2008 and January 2009, the auto rejection trigger levels are now 35% above or below the reference price for stocks in the Rp50 – Rp200 price range, 25% for stocks in the Rp200 to Rp5,000 range, and 20% for stocks priced above Rp5,000.
Trading on the NYSE and LSE
BNY Mellon serves as the Depositary for our ADSs, which are traded on the NYSE and LSE.
-100-
D. SELLING STOCKHOLDERS
Not applicable.
E. DILUTION
Not applicable.
F. EXPENSES OF THE ISSUE
Not applicable.
ITEM 10. ADDITIONAL INFORMATION
A. SHARE CAPITAL
Not applicable.
B. MEMORANDUM AND ARTICLES OF ASSOCIATION
Description of Articles of Association
Our Articles of Association are registered in accordance with the Limited Liability Company Law No.-1 year 1995, and approved by Ministerial Decree No.C2-7468.HT.01.04.TH.97 year 1997. Pursuant to the issuance of the Limited Liability Companies Law (the Company Law) No.-40 year 2007 which revoked Limited Liability Companies Law No.-1 year 1995, we have amended our Articles of Association and they have been approved by the Minister of Law and Human Rights of the Republic of Indonesia pursuant to Decree of the Minister of Justice and Human Rights No.-AHU.46312.AH.01.02 year 2008 dated July 31, 2008 and registered in State Gazette of the Republic of Indonesia No.-84 dated October 17, 2008, Supplement to State Gazette No. 20155.
The Articles of Association were most recently amended to align with Bapepam-LK Rule IX.J.1 regarding the Main Provision of the Articles of Association of Companies that Make an Equity Public Offering and Public Company and Bapepam-LK Rule IX.E.2 regarding Material Transactions and Changes of the Core Business Activities, and to add the Company purposes and objectives, pursuant to AGMS Resolution Deed No.37 dated June 24, 2010 drawn up by Notary Dr. A. Partomuan Pohan S.H., LLM. The amendment of the Articles was accepted by the Minister of Law and Human Rights through letter No.AHU-AH.01.10-18476 dated July 22, 2010 regarding the Receipt of Notification of Amendment of the Company’s Articles of Association and decree of the Minister of Law and Human Rights No.AHU-35876.AH.01.02.Year 2010 dated July 19, 2010 regarding the Approval Amendment of the Company’s Articles of Association and was published in State Gazette of the Republic of Indonesia No.63 dated August 9, 2011 Supplement of the Republic of Indonesia No.23552.
Under Article 3 of the Articles of Association, our business is to provide telecommunications networks and telecommunications and information services, and to optimize the Company’s resources, with due attention to the prevailing laws and regulations. To attain the aforementioned objectives, the Company may undertake business activities that incorporate the following:
Main Business
- To plan, build, deliver, develop, operate, market/sell/lease, and maintain telecommunications and information networks in the broadest sense with respect to provisions of laws and regulations
- To plan, develop, deliver, market/sell, and improve telecommunications and information services in the broadest sense with respect to provisions of laws and regulations
Supporting Business
- To provide payment transaction and remittance services via telecommunications and information networks.
- To carry out activities and other undertakings in respect of optimizing the Company’s resources, among others the utilization of the Company’s property, plant and equipment and movable assets, information system facilities, education and training facilities, and maintenance and repair facilities.
In accordance with the Company Law, we have a Board of Commissioners and a Board of Directors. The two Boards are separate and no individual may be a member of both Boards. Each Director receives a bonus if we surpass certain financial and operating targets, the amounts of which are determined by the shareholders at the AGMS. See “Item 6. Directors, Senior Management and Employees”.
-101-
The Articles state that any transaction involving a conflict of interest between the Company and its Directors, Commissioners and shareholders should be approved by a shareholders meeting, in which approval is required from more than half of the votes of the independent shareholders.
The Board of Directors is responsible for leading and managing the Company in accordance with its objectives and purposes and to control, preserve and manage the assets of the Company.
The Articles do not contain any requirement for the Directors to: (i) retire by a specified age, or (ii) to own any or a specified number of shares of the Company. The rights, preferences and restrictions attaching to each class of the shares of the Company in respect of specified matters are set forth below:
- Dividend rights. Dividends are to be paid based upon our financial condition and in accordance with the resolution of the shareholders in a general meeting, which will also determine the form of and time for payment of the dividend;
- Voting rights. The holder of each voting share is entitled to one vote at a GMS;
- Rights to share in the Company’s profits. See dividend rights;
- Rights to share in any surplus in the event of liquidation. Stockholders are entitled to surplus in the event of liquidation in accordance with their proportion of shareholding, provided the nominal value of the common stock that they hold is fully paid-up;
- Redemption provisions. There are no stock redemption provisions in the Articles. However, based on Article 37 of the Indonesian Company Law, we may buy back up to 10% of our issued and outstanding shares;
- Reserved fund provisions. Retained earnings up to a minimum of 20% of the issued capital of the Company are to be set aside to cover potential losses suffered by the Company. If the amount in the reserved fund exceeds 20% of the issued capital of the Company, a GMS may authorize the Company to utilize such excess funds for the purpose of the Company;
- Liability for further capital calls. Our shareholders may be asked to subscribe for new shares in the Company from time to time. Such rights are to be offered to shareholders prior to being offered to third parties and may be transferred at the option of the shareholder. The Board of Directors is authorized to offer the new shares to third parties in the event that an existing shareholder is unable or unwilling to subscribe for such new shares; and
- Provisions discriminating against any existing or prospective holder of such securities because of such shareholder owning a substantial number of shares. The Articles do not contain any such provision.
In order to change the rights of shareholders, an amendment to the relevant provisions of the Articles would be required. Any amendment to the Articles requires the holder of the Series A Dwiwarna Share and the other shareholders or their authorized proxies jointly representing at least two thirds (2/3) of the total number of votes cast in the meeting.
A GMS may only be convened upon the issuance of the requisite notice by the Company. The notice is to be published in at least two newspapers in Indonesian and one newspaper in English having general circulation within Indonesia. The notice period for convening an AGMS or and EGMS is 14 days (not including the date the notice and the date of summons). The quorum for AGMS or EGMS is shareholders represent more than half of thetotal shares with voting rights issued by the Company, unless otherwise provided in the Articles of Association. In the case of quorum is not reached, then the second call for the meeting can be made without proceed by a notice of meeting will be held at the call. The second meeting is legitimate and entitled to take decisions if attended by shareholders representing at least 1/3 (one per three) of the total shares with legal voting rights. In case the quorum is not reached at the second meeting, the AGM and EGM can be held in the event that quorum is not achieved at the second meeting, a third meeting may be held, with the quorum of attendance to be determined by the Chairman of Bapepam-LK in accordance with the provisions of the laws.
Stockholders may vote by proxy. All resolutions are to be passed by consensus. If consensus cannot be reached, resolutions are passed by simple majority, unless a larger majority is required by the Articles. The Articles do not contain any limitations on the right of any person, to own shares of the Company. Indonesian capital market regulations do not contain any limitation on the right of any person, whether local or foreign, to own shares in a company listed on the Indonesia Stock Exchange.
Any takeover of the Company is required to be approved by the holder of the Series A Dwiwarna Share and a majority constituting at least three fourths of the total number of shares at a GMS that must be attended by the holder of the Series A Dwiwarna Share. There are no other provisions in the Articles that would have the effect of delaying, deferring or preventing a change in control of the Company.
Each Director and Commissioner has an obligation to report to Bapepam-LK with regard to their ownership and any changes in their ownership of the Company, and this obligation also applies to shareholders who have an ownership stake of 5% or more in the paid up capital of the Company. We believe that the Articles are not significantly different from those generally prevailing in Indonesia in respect of public companies listed on the Indonesia Stock Exchange. We also believe that the provisions in the Articles relating to changes in our capital are not more stringent than that required by Indonesian law.
-102-
C. MATERIAL CONTRACTS
In 2011, Telkom and did not enter into any new material contracts nor did we amend any existing material contracts, other than contracts entered into or amended in the ordinary course of business.
D. EXCHANGE CONTROLS
See “Item 3. Key Information–Exchange Controls” included elsewhere in this Form 20-F.
E. TAXATION
The following summary contains a description of the principal Indonesian and US federal tax consequences of the purchase, ownership and disposition of ADSs or shares of common stock. This summary does not purport to be a complete description of all of the tax considerations that may be relevant to a decision to purchase, own or dispose of ADSs or shares of common stock
Investor should consult their tax advisors about the Indonesian and US Federal, state and local tax consequences to them of the purchase, ownership and disposition of ADSs or shares of common stock
Indonesian Taxation
The following is a summary of the principal Indonesian tax consequences of the ownership and disposition of common stockor ADSs to a non-resident individual or non-resident entity that holds common stock or ADSs (a “Non-Indonesian Holder”). A “non-resident individual” is a foreign national individual who is not physically present in Indonesia at the most 183 days within 12 month period, during which period such non-resident individual receives income in respect of the ownership or disposition of common stock or ADSs and a “non-resident entity” is a corporation or a non-corporate body that is established, domiciled or organized under the laws of a jurisdiction other than Indonesia and does not have a fixed place of business or otherwise conducts business or carries out activities through a permanent establishment in Indonesia during an Indonesian tax year in which such non-Indonesian entity receives income in respect of the ownership or disposition of common stockor ADSs. In determining the residency of an individual or entity, consideration will be given to the provisions of any applicable double taxation treaty to which Indonesia is a party.
Dividends
Dividends declared by the Company out of retained earnings and distributed to a Non-Indonesian Holder in respect of common stock or ADSs are subject to Indonesian withholding tax, which, as of the date of this Annual Report is at the rate of 20%, on the amount of the distribution (in the case of cash dividends) or on the shareholders’ proportional share of the value of the distribution. A lower rate provided under double taxation treaties may be applicable provided the recipient is able to comply with the following strict requirements: (i) the recipient of the income is the beneficial owner of the dividends, (ii) the recipient of the income must have submitted a specific form set by the Indonesian Tax Office acting as a Certificate of Residency (the “Certificate of Residence”) that is filled in by the recipient of the income and validated by the competent authority of the country where the recipients are resident and (iii) the recipient of the income does not misuse the tax treaty as set out in the provision on the prevention of misuse the tax treaty. Indonesia has concluded double taxation treaties with a number of countries, including Australia, Belgium, Canada, France, Germany, Japan, Malaysia, the Netherlands, Singapore, Sweden, Switzerland, the United Kingdom and the United States of America. Under the US-Indonesia double taxation treaty, the withholding tax on dividends is generally, in the absence of a 25% voting interest, reduced to 15%.
-103-
Capital Gains
The sale or transfer of common stock through IDX is subject to a final withholding tax at the rate of 0.1% of the value of the transaction. The broker executing the transaction is obligated to withhold such tax. The holding of founder shares or the sale or transfer of founder shares through an IDX may, under current Indonesian tax regulations, be subject to additional 0.5% final income tax.
Subject to the promulgation of implementing regulations, the estimated net income received or accrued from the sale of movable assets in Indonesia, which may include common stock not listed on an IDX or ADSs, by a Non-Indonesian holder (with the exception of the sale of assets under Article 4 paragraph (2) of the Indonesian income tax law) may be subject to Indonesian withholding tax at the rate of 20%. In 1999, the Ministry of Finance issued a decision that stipulates the estimated net income for the sale of shares received by a non-resident taxpayer in a non-public company to be 25% of the sale price, resulting in an effective withholding tax rate of 5% of the sales price. This is a final withholding tax and the obligation to pay lies with the buyer (if it is an Indonesian taxpayer) or the Company (if the buyer is a non-resident taxpayer). Exemption from withholding tax on income from the sale of shares in a non-public company may be available to non-resident sellers of shares depending on the provisions of the relevant double taxation treaties. In order to benefit from the exemption under the relevant double taxation treaty, the non-resident seller must provide a specific form set by the Indonesian Tax Office acting as a Certificate of Residence that is completed by the recipient of the income and validated by the competent authority of the country where the recipients are resident to the buyer or the Company and to the Indonesian Tax Office that has jurisdiction over the buyer or the Company (if the buyer is a non-resident taxpayer).
In cases where a purchaser or Indonesian broker will be required under Indonesian tax laws to withhold tax on payment of the purchase price for common stock or ADSs, that payment may be exempt from Indonesian withholding or other Indonesian income tax under applicable double taxation treaties to which Indonesia is a party (including the US-Indonesia double taxation treaty). However, except for the sale or transfer of shares in a non-public company, the current Indonesian tax regulations do not provide specific procedures for removing the purchaser’s or Indonesian broker’s obligation to withhold tax from the proceeds of such sale. To take advantage of the double taxation treaty relief, Non-Indonesian Holders may have to seek a refund from the Indonesian Tax Office by making a specific application accompanied by a specific form set by the Indonesian Tax Office acting as a Certificate of Residence that is filled in by the recipient of the income and validated by the competent authority of the country where the recipients are resident.
Stamp Duty
Any documents that are prepared in the transactions in common stock in Indonesia, which documents will be used as evidence in Indonesia, are subject to stamp duty of Rp6,000. Generally, the stamp duty is due at the time the document is executed.
Certain US Federal Income Tax Considerations
Pursuant to requirements relating to practice before the Internal Revenue Service, any tax advice in this communication (including any attachments) is not intended to be used and cannot be used, for the purpose of (i) avoiding penalties imposed under the US Internal Revenue Code, or (ii) promoting, marketing, or recommending to another person any tax-related matter.
The following is a summary of certain US federal income tax considerations relating to the acquisition ownership and disposition of ADSs or common stock by US Holders (as defined below) that hold their ADSs or common stock as “capital assets” (generally, property held for investment) under section 1221 of the US Internal Revenue Code (the “Tax Code”). This summary is based upon existing US federal income tax law, which is subject to differing interpretations or change, possibly with retroactive effect.
This summary does not discuss all aspects of US federal income taxation which may be important to particular investors in light of their individual investment circumstances, including investors subject to special tax rules (for example, financial institutions, insurance companies, broker-dealers, partnerships and their partners and tax-exempt organizations (including private foundations)), holders who are not US Holders, investors that will hold ADSs or common stockas part of a straddle, hedge, conversion, constructive sale, or other integrated transaction for US federal income tax purposes, or investors that have a functional currency other than the US Dollar, all of whom may be subject to tax rules that differ significantly from those summarized below. In addition, this summary does not discuss any US federal estate and gift tax considerations, or state, local, or non-US tax considerations. Each holder is urged to consult their tax advisors regarding the US federal, state, local and non-US income and other tax considerations of their investment in the ADSs or common stock
-104-
For purposes of this summary, a “US Holder” is a beneficial owner of ADSs or common stockthat is, for US federal income tax purposes, (i) an individual who is a citizen or resident of the US, (ii) a corporation, or other entity treated as a corporation for US federal income tax purposes, created in, or organized under the laws of, the US or any state or the District of Columbia; (iii) any entity created or organized in or under the laws of any other jurisdiction if treated as a domestic corporation pursuant to the Tax Code; (iv) an estate the income of which is includible in gross income for US federal income tax purposes regardless of its source, or (v) a trust (A) the administration of which is subject to the primary supervision of a US court and which has one or more US persons who have the authority to control all substantial decisions of the trust or (B) that has otherwise elected to be treated as a US person under the Tax Code.
If a partnership (or other entity treated as a “tax transparent” entity for US tax purposes) is the beneficial owner of ADSs or common stock, the tax treatment of a partner in the partnership (or interest holder in the “tax transparent” entity) will generally depend upon the status of the partner (or interest holder) and the activities of the partnership (or “tax transparent” entity). For US federal income tax purposes, US Holders of ADSs will be treated as the beneficial owners of the underlying Common Stock represented by the ADSs.
Threshold PFIC Classification Matters
A non-US corporation, such as the Company, will be treated as a “Passive Foreign Investment Company” (a “PFIC”), for US federal income tax purposes, if 75% or more of its gross income consists of certain types of “passive” income or 50% or more of its assets are passive. Based on the Company’s 2011 income and assets, the Company does not believe that it should be classified as a PFIC for 2011. Because PFIC status is a fact-intensive determination made on an annual basis, no assurance can be given that the Company is not or will not become classified as a PFIC. The discussion below under “Dividends” and “Sale or Other Disposition of ADSs or common stock” is written on the basis that the Company will not be classified as a PFIC for US federal income tax purposes.
Dividends
Any cash distributions paid by the Company out of earnings and profits, as determined under US federal income tax principles, will be subject to tax as dividend income and will be includible in the gross income of a US Holder upon receipt. A non-corporate recipient of dividend income will generally be subject to tax on dividend income from a “qualified foreign corporation” at a maximum US federal tax rate of 15% rather than the marginal tax rates generally applicable to ordinary income provided that certain holding period requirements are met. Note that as from January 1, 2011, dividends from a qualified foreign corporation will be treated as ordinary income with a maximum tax rate of 39.6% for non-corporate recipients of dividends received after the end of 2010. A non-US corporation (other than a PFIC) generally will be considered to be a qualified foreign corporation (i) if it is eligible for the benefits of a comprehensive tax treaty with the US which the Secretary of Treasury of the US determines is satisfactory for purposes of this provision and which includes an exchange of information program or (ii) with respect to any dividend it pays on stock (or ADSs backed by such stock) which is readily tradable on an established securities market in the US. There is currently a tax treaty in effect between the US and Indonesia which the Secretary of Treasury has determined is satisfactory for these purposes and the Company believes it should be eligible for the benefits of the treaty. Additionally, because the ADSs are listed on the NYSE, an established securities market in the US, they are considered readily tradable on that exchange.
The amount of any cash distribution paid in Rupiah should equal the US Dollar value of such Rupiah on the date of receipt of the distribution, regardless of whether the Rupiah are actually converted into US Dollar at that time. Gain or loss, if any, recognized on a subsequent sale, conversion, or other disposition of Rupiah generally will be US source ordinary income or loss. Dividends received on the ADSs or common stock will generally not be eligible for the dividends received deduction allowed to corporations.
Dividends generally will be treated as income from foreign sources for US foreign tax credit purposes. A US Holder may be eligible, subject to a number of complex limitations, to claim a foreign tax credit in respect of any foreign withholding taxes imposed on dividends received on ADSs or common stock. A US Holder who does not elect to claim a foreign tax credit for foreign tax withheld, may instead claim a deduction, for US federal income tax purposes, in respect of such withholdings, but only for a year in which such holder elects to do so for all creditable foreign income taxes.
Sale or Other Disposition of ADSs or Common Stock
A US holder will generally recognize capital gain or loss upon the sale or other disposition of ADSs or common stock in an amount equal to the difference between the amount realized upon the disposition and the holder’s adjusted tax basis in such ADSs or common stock. Any capital gain or loss will be long-term if the ADSs or Common Stock have been held for more than one year and will generally be US source gain or loss for US foreign tax credit purposes. The deductibility of a capital loss is subject to limitations.
-105-
Passive Foreign Investment Company (“PFIC”) Considerations
If the Company were to be classified as a PFIC in any taxable year, a US Holder would be subject to special rules generally intended to reduce or eliminate any benefits from the deferral of US federal income tax that a US Holder could derive from investing in a non-US company that does not distribute all of its earnings on a current basis. In such event, a US Holder may be subject to tax at ordinary income tax rates on (i) any gain recognized on the sale of ADSs or common stock and (ii) any “excess distribution” paid on ADSs or common stock (generally, a distribution in excess of 125% of the average annual distributions paid by us in the three preceding taxable years). In addition, a US Holder will be subject to an interest charge on such gain or excess distribution. Finally, the 15% maximum rate on Company dividends would not apply if the Company becomes classified as a PFIC. Each US Holder is urged to consult its tax advisor regarding the potential tax consequences to such holder if the Company is or becomes classified as a PFIC, as well as certain elections that may be available to mitigate such consequences.
Backup Withholding Tax and Information Reporting Requirements
US backup withholding tax and information reporting requirements generally apply to certain payments to certain non corporate holders of stock. Information reporting generally will apply to payments of dividends on and to proceeds from the sale or redemption of, ordinary shares made within the US or by a US pay or US middleman to a holder of ordinary shares (other than an “exempt recipient,” including a corporation, a payee that is not a US person that provides an appropriate certification and certain other persons). A payor will be required to withhold backup withholding tax from any payments of dividends on, or the proceeds from the sale or redemption of, ADSs or common stock within the US or by a US payor or US middleman to a holder, other than an exempt recipient, if such holder fails to furnish its correct taxpayer identification number or otherwise fails to comply with, or establish an exemption from, such backup withholding tax requirements. The backup withholding tax rate is 25% for years through 2011.
The backup withholding tax is not an additional tax and may be credited against a US holder’s regular US federal income tax liability or, if in excess of such liability, refunded by the Internal Revenue Service (“IRS”) if a timely refund claim is filed with the IRS. Copies of any information returns or tax returns for claims for refund filed by non-US Holders with the IRS may be made available by the IRS, under the provisions of a specific treaty or other agreement providing for information exchange, to the taxing authorities of the country in which a non-US Holder resides.
F. DIVIDENDS AND PAYING AGENTS
Not applicable.
G. STATEMENT BY EXPERTS
Not applicable.
H. DOCUMENTS ON DISPLAY
Any material which is filed as an exhibit to this Annual Report on Form 20-F with the US Securities and Exchange Commission is available for inspection at our offices. See “Item 4. Information on the Company”.
I. SUBSIDIARY INFORMATION
Not applicable.
-106-
ITEM 11. QUANTITATIVE AND QUALITATIVE DISCLOSURE ABOUT MARKET RISK
A. DISCLOSURE ABOUT MARKET RISK
General
We are exposed to market risks that arise from changes in exchange rates, interest rates credit risk and liquidity risk, each of which will have an impact on us. We do not generally hedge our long-term liabilities in foreign currencies but hedge our obligations for the current year. As of December 31, 2011, assets in foreign currencies reached 31.4% against our liabilities denominated in foreign currencies. Our exposure to interest rate risk is managed through a mix of fixed and variable rate liabilities and assets, including short-term fixed rate assets. Our exposure to such market risks fluctuated during 2009, 2010 and 2011 as the Indonesian economy was affected by changes in the US Dollar-Rupiah exchange rate and interest rates themselves. We are not able to predict whether such conditions will continue during 2011 or thereafter.
Exchange Rate Risk
Our exposure to exchange rate fluctuations results primarily from sales, purchases and borrowings transaction that are denominated in foreign currencies. The obligations as well as both account receivables and payables are denominated in primarily US Dollar and Japanese Yen. Increased risk of foreign currency exchange rates on the obligations of the Company and its subsidiaries are expected to be offset partly by time deposits and receivables in foreign currencies with respect to the exchange rate in the future.
The information presented in the following table is based on assumptions of selling and buying rates in US Dollar as well as other currencies, which were quoted by Reuters on December 31, 2011 and applied respectively to monetary assets and liabilities. The buying and selling rates as of December 31, 2011 were Rp9,060 and Rp9,075 to US$1, respectively.
-107-
However, we believe these assumptions and the information described in the following table may be influenced by a number of factors, including a fluctuation and/or depreciation of the Rupiah in the future.
| | Outstanding Balance | | | | | | | | | | | | | | | |
| | as of December 31, 2011 | | Expected Maturity Date | |
| | Foreign Currency | | Rp Equiv. | | | | | | | | | | | | | | | |
| | (million) | | (Rp million) | | 2012 | | 2013 | | 2014 | | 2015 | | 2016 | | There After | | Fair Value | |
| | | | | | (Rp million) | |
ASSETS | | | | | | | | | | | | | | | | | | | |
Cash and Cash Equivalent | | | | | | | | | | | | | | | | | | | |
US Dollar | | 139.03 | | 1,260,347 | | 1,260,347 | | - | | - | | - | | - | | - | | 1,260,347 | |
Euro | | 7.72 | | 70,038 | | 70,038 | | - | | - | | - | | - | | - | | 70,038 | |
Japanese Yen | | 1.18 | | 138 | | 138 | | - | | - | | - | | - | | - | | 138 | |
Singapore Dollar | | 1.04 | | 9,398 | | 9,398 | | - | | - | | - | | - | | - | | 9,398 | |
Malaysian Ringgit | | 0.01 | | 99 | | 99 | | - | | - | | - | | - | | - | | 99 | |
Hongkong Dollar | | 0.04 | | 362 | | 362 | | - | | - | | - | | - | | - | | 362 | |
Available-for-Sale Financial Assets | | | | | | | | | | | | | | | | | | | |
US Dollar | | 6.34 | | 57,418 | | 57,418 | | - | | - | | - | | - | | - | | 57,418 | |
Trade Receivables | | | | | | | | | | | | | | | | | | | |
Related Parties | | | | | | | | | | | | | | | | | | | |
US Dollars | | 4.73 | | 42,862 | | 42,862 | | - | | - | | - | | - | | - | | 42,862 | |
Third Parties | | | | | | | | | | | | | | | | | | | |
US Dollars | | 88.55 | | 802,386 | | 802,386 | | - | | - | | - | | - | | - | | 802,386 | |
Euro | | 0.06 | | 506 | | 506 | | - | | - | | - | | - | | - | | 506 | |
Other Receivables | | | | | | | | | | | | | | | | | | | |
US Dollar | | 24.99 | | 226,626 | | 226,626 | | - | | - | | - | | - | | - | | 226,626 | |
Australian Dollar | | 0.01 | | 91 | | 91 | | - | | - | | - | | - | | - | | 91 | |
Great Britain Pound Sterling | | 0.03 | | 264 | | 264 | | - | | - | | - | | - | | - | | 264 | |
Singapore Dollar | | 0.01 | | 69 | | 69 | | - | | - | | - | | - | | - | | 69 | |
Euro | | 0.01 | | 100 | | 100 | | - | | - | | - | | - | | - | | 100 | |
Other Current Assets | | | | | | | | | | | | | | | | | | | |
US Dollar | | 0.16 | | 1,449 | | 1,449 | | - | | - | | - | | - | | - | | 1,449 | |
Advances and Other Non-current Assets | | | | | | | | | | | | | | | | | | | |
US Dollar | | 10.20 | | 92,458 | | 92,458 | | - | | - | | - | | - | | - | | 92,458 | |
-108-
| | Outstanding Balance as | | | | | | | | | | | | | | | |
| | at December 31, 2011 | | Expected Maturity Date | |
| | Foreign Currency | | Rp Equiv. | | | | | | | | | | | | | | | |
| | (million) | | (Rp million) | | 2012 | | 2013 | | 2014 | | 2015 | | 2016 | | There after | | Fair Value | |
| | | | | | (Rp million) | |
LIABILITIES | | | | | | | | | | | | | | | | | | | |
Trade Payables | | - | | - | | - | | - | | - | | - | | - | | - | | - | |
Related Parties | | | | | | | | | | | | | | | | | | | |
US Dollar | | 0.41 | | 3,736 | | 3,736 | | - | | - | | - | | - | | - | | 3,736 | |
Third Parties | | | | | | | | | | | | | | | | | | | |
US Dollar | | 427.73 | | 3,879,101 | | 3,879,101 | | - | | - | | - | | - | | - | | 3,879,101 | |
Euro | | 1.03 | | 9,337 | | 9,337 | | - | | - | | - | | - | | - | | 9,337 | |
Great Britain Pound Sterling | | 0.09 | | 820 | | 820 | | - | | - | | - | | - | | - | | 820 | |
Japanese Yen | | 0.51 | | 60 | | 60 | | - | | - | | - | | - | | - | | 60 | |
Singapore Dollar | | 0.05 | | 497 | | 497 | | - | | - | | - | | - | | - | | 497 | |
Malaysian Ringgit | | 0.18 | | 1,596 | | 1,596 | | - | | - | | - | | - | | - | | 1,596 | |
Other Payables | | | | | | | | | | | | | | | | | | | |
US Dollar | | 0.52 | | 4,675 | | 4,675 | | - | | - | | - | | - | | - | | 4,675 | |
Accrued Expenses | | | | | | | | | | | | | | | | | | | |
US Dollar | | 54.84 | | 497,345 | | 497,345 | | - | | - | | - | | - | | - | | 497,345 | |
Japanese Yen | | 35.61 | | 4,165 | | 4,165 | | - | | - | | - | | - | | - | | 4,165 | |
Singapore Dollar | | 1.58 | | 14,345 | | 14,345 | | - | | - | | - | | - | | - | | 14,345 | |
Great Britain Pound Sterling | | - | | 11 | | 11 | | - | | - | | - | | - | | - | | 11 | |
Euro | | 0.94 | | 8,546 | | 8,546 | | - | | - | | - | | - | | - | | 8,546 | |
Australian Dollar | | 0.01 | | 53 | | 53 | | - | | - | | - | | - | | - | | 53 | |
Advances from Costumers and Suppliers | | | | | | | | | | | | | | | | | | | |
US Dollar | | 0.86 | | 7,760 | | 7,760 | | - | | - | | - | | - | | - | | 7,760 | |
Current Maturities of Long-term Liabilities | | | | | | | | | | | | | | | | | | | |
US Dollar | | 66.61 | | 604,169 | | 604,169 | | - | | - | | - | | - | | - | | 604,169 | |
Japanese Yen(1) | | 767.90 | | 89,813 | | 89,813 | | - | | - | | - | | - | | - | | 89,813 | |
Notes | | | | | | | | | | | | | | | | | | | |
US Dollar | | 74.75 | | 678,346 | | 351,616 | | 272,402 | | 54,328 | | - | | - | | - | | 678,346 | |
Long-term Liabilities | | | | | | | | | | | | | | | | | | | |
US Dollar | | 140.99 | | 1,278,955 | | - | | 296,836 | | 296,895 | | 242,319 | | 187,193 | | 255,712 | | 1,278,955 | |
Japanese Yen | | 9,214.77 | | 1,077,760 | | - | | 89,813 | | 89,813 | | 89,813 | | 89,813 | | 718,508 | | 1,077,760 | |
(1) Long-term liabilities for the purpose of this table consist of loans denominated in foreign currencies namely, two-step loans, deferred consideration for business combinations and long-term bank loans, which in each case include their current maturities.
-109-
Interest Rate Risk
Our exposure to interest rate fluctuations results primarily from changes to the floating rate applied for long-term debt. This risk relates to loans under the Government on-lending program that has been used to finance our capital expenditures.Interest rate fluctuation is monitored to minimize any negative impact to financial position. Borrowings at variable interest rates expose the Company and its subsidiaries to interest rate risk. To measure market risk fluctuations in interest rates, the Companyand its subsidiariesprimarily use interestrateand maturity profile of the financial assets and liabilities based on changing schedule of the interest rate.
The actual cash flows from our debt are denominated in Rupiah,US Dollar, Euro and Japanese Yen, as appropriate and as indicated in the table. The information presented in the table has been determined based on the following assumptions: (i) fixed interest rates on Rupiah time deposits are based on average interest rates offered for three month placements in effect as of December 31, 2011 by the banks where such deposits were located; (ii) variable interest rates on Rupiah denominated long-term liabilities are calculated as of December 31, 2011 and are based on contractual terms setting interest rates based on average rates for the preceding six months on three month certificates issued by Bank of Indonesia or based on the average three month deposit rate offered by the lenders; (iii) fixed interest rates onUS Dollar deposits are based on average interest rates offered for three month placements by the various lending institutions where such deposits are located as of December 31, 2011 and (iv) the value of marketable securities is based on the value of such securities on December 31, 2011. However, these assumptions may change in the future. These assumptions are different from the rates used in our Consolidated Financial Statements; accordingly, amounts shown in the table may differ from the amounts shown in our Consolidated Financial Statements.
| | Outstanding Balance as of December 31, 2011 | | Expected Maturity Date | |
| | Original Currency | | Rp Equiv. | | | | | | | | | | | | | | | | | |
| | (million) | | (Rp million) | | Rate (%) | | 2012 | | 2013 | | 2014 | | 2015 | | 2016 | | There after | | Fair Value | |
| | | | | | | | (Rp million) | |
ASSETS | | | | | | | | | | | | | | | | | | | | | |
Fixed Rate | | | | | | | | | | | | | | | | | | | | | |
Cash and Cash Equivalents | | | | | | | | | | | | | | | | | | | | | |
Time deposit | | | | | | | | | | | | | | | | | | | | | |
Rupiah | | | | | | | | | | | | | | | | | | | | | |
Principal | | 7,065,069 | | 7,065,069 | | - | | 7,065,069 | | - | | - | | - | | - | | - | | 7,065,069 | |
Interest | | - | | - | | - | | - | | - | | - | | - | | - | | - | | - | |
US Dollar | | | | | | | | | | | | | | | | | | | | | |
Principal | | 113.00 | | 1,022,836 | | - | | 1,022,836 | | - | | - | | - | | - | | - | | 1,022,836 | |
Interest | | - | | - | | - | | - | | - | | - | | - | | - | | - | | - | |
Available-for-Sale Financial Assets | | | | | | | | | | | | | | | | | | | | | |
Rupiah | | 303,710 | | 303,710 | | - | | 303,710 | | - | | - | | - | | - | | - | | 303,710 | |
US Dollar | | 6.34 | | 57.418 | | - | | 57,418 | | - | | - | | - | | - | | - | | 57,418 | |
-110-
| | Outstanding Balance at December 31, 2011 | | Expected Maturity Date | |
| | Original Currency | | Rp Equiv. | | | | | | | | | | | | | | | | | |
| | (million) | | (Rp million) | | Rate (%) | | 2012 | | 2013 | | 2014 | | 2015 | | 2016 | | Thereafter | | Fair Value | |
| | | | | | | | (Rp million) | |
LIABILITIES | | | | | | | | | | | | | | | | | | | | | |
Short-term Bank Loans | | | | | | | | | | | | | | | | | | | | | |
Variable Rate | | | | | | | | | | | | | | | | | | | | | |
Rupiah | | | | | | | | | | | | | | | | | | | | | |
Principal | | 100,461 | | 100,461 | | 6-15.3 | | 100,461 | | - | | - | | - | | - | | - | | 100,461 | |
Interest | | - | | - | | - | | - | | - | | - | | - | | - | | - | | - | |
Long term Liabilities(1) | | | | | | | | | | | | | | | | | | | | | |
Variable Rate | | | | | | | | | | | | | | | | | | | | | |
Rupiah | | | | | | | | | | | | | | | | | | | | | |
Principal | | 10,579,426 | | 10,579,426 | | - | | 3,591,992 | | 3,296,988 | | 2,157,391 | | 966,004 | | 259,840 | | 307,211 | | 10,747,350 | |
Interest | | 1,308,791 | | 1,308,791 | | 9.0-14.0 | | 506,526 | | 415,304 | | 199,797 | | 85,207 | | 31.958 | | 69,999 | | - | |
US Dollar | | | | | | | | | | | | | | | | | | | | | |
Principal | | 205.00 | | 1,857,071 | | - | | 868,822 | | 420,369 | | 202,354 | | 147,812 | | 147,025 | | 70,689 | | 1,807,079 | |
Interest | | 7.00 | | 59,213 | | 1.14-6.67 | | 24,992 | | 16,997 | | 8,288 | | 5,175 | | 2,885 | | 876 | | - | |
Fixed Rate | | | | | | | | | | | | | | | | | | | | | |
Rupiah | | | | | | | | | | | | | | | | | | | | | |
Principal | | 3,000,000 | | 3,000,000 | | - | | - | | - | | - | | 1,005,000 | | - | | 1,995,000 | | 3,181,005 | |
Interest | | 2,071,511 | | 2,071,511 | | - | | 299,970 | | 299,970 | | 299,970 | | 253,070 | | 203,490 | | 715,041 | | - | |
US Dollar | | | | | | | | | | | | | | | | | | | | | |
Principal | | 80.00 | | 725,805 | | - | | 94,522 | | 148,868 | | 148,868 | | 94,508 | | 40,168 | | 198,871 | | 761,610 | |
Interest | | 13.00 | | 117,805 | | - | | 30,749 | | 25,287 | | 18,655 | | 12,023 | | 9,187 | | 21,904 | | - | |
Japanese Yen | | | | | | | | | | | | | | | | | | | | | |
Principal | | 9,983.00 | | 1,167,573 | | - | | 89,813 | | 89,813 | | 89,813 | | 89,813 | | 89,813 | | 718,508 | | 1,203,443 | |
Interest | | 2,090.00 | | 244,454 | | - | | 35,592 | | 32,709 | | 29,925 | | 27,140 | | 24,425 | | 94,663 | | - | |
Finance Lease | | | | | | | | | | | | | | | | | | | | | |
Rupiah�� | | | | | | | | | | | | | | | | | | | | | |
Principal | | 467,688 | | 467,688 | | - | | 179,156 | | 122,912 | | 92,601 | | 23,975 | | 16,445 | | 32,599 | | 467,688 | |
Interest | | 130,896 | | 130,896 | | - | | 62,783 | | 31,813 | | 16,067 | | 8,626 | | 6,048 | | 5,559 | | 130,896 | |
Us Dollar | | | | | | | | | | | | | | | | | | | | | |
Principal | | 42,140.00 | | 42,140 | | - | | 16,734 | | 24,099 | | 1,307 | | - | | - | | - | | 42,140 | |
Interest | | 1,198.00 | | 1,198 | | - | | 846 | | 326 | | 26 | | - | | - | | - | | 1,198 | |
(1) Long-term liabilities consist of loans which are subject to interest; namely two-step loans, bonds and notes, deferred consideration for business combinations and long-term bank loans, which in each case include their maturities.
Credit Risk
The Company and its subsidiaries are exposed to credit risk primarily from trade receivables and other receivables.The credit risk is managed by continuous monitoring outstanding balances and collection of trade and other receivables. Management is confident in its ability to continue to control and sustain minimal exposure of credit risk given that the Company and its subsidiaries have provided sufficientprovision for impairment of receivables to cover incurred loss arising from uncollectible receivables based on existing historical loss.
Liquidity Risk
Liquidity risk arises in situations where the Company and its subsidiaries have difficulties in fulfilling financial liabilities when they become due. Prudent liquidity risk management implies maintaining sufficient cash and cash equivalents in order to fullfil the Company and its subsidiaries’ financial liabilities. The Company and its subsidiaries continuously perform an analysis to monitorfinancial position ratios, among other things, liquidity ratios, debt equity ratios against debt covenant requirements.
-111-
ITEM 12. DESCRIPTION OF SECURITIES OTHER THAN EQUITY SECURITIES
American Depositary Shares
Investors pay a depositary fee directly or through a broker acting on their behalf for the delivery or surrender of ADSs for the purpose of withdrawal. The Depositary also collects fees for making distributions to investors by deducting the fee from the amount distributed or by selling a portion of the distributable property to pay the fee. The Depositary may collect its annual fee for depositary services by making a deduction from the cash distributions or by directly billing investors or by charging the book-entry system accounts of the parties acting on their behalf. The Depositary may refuse to provide fee generating services until its bills for such services are paid.
Costs Related to ADS Issue and Handling
Shareholders depositing or withdrawing ordinary shares or ADS must pay: | | For: | |
US$5 (or less) per 100 ADS (or part of 100 ADS). | | Issuance of ADS, including issuance resulting from a distribution of shares or rights or other property. Cancellation of ADS for the purpose of withdrawal, including in case of termination of the deposit agreement. | |
US$0.02 (or less) per ADS. | | Any cash payment to registered ADS shareholders. | |
A fee equivalent to the fee payable if the securities distributed to shareholders had been shares and those shares had been deposited for the issuance of ADS. | | Delivery of securities by the Depositary to registered ADS shareholders. | |
US$0.02 (or less) per ADS per calendar year. | | Depositary services. | |
Registration or transfer fees. | | Transfer or registration of shares on the share register to or from the name of the Depositary or its agent when shareholders deposit or withdraw ordinary shares. | |
Depositary Fees. | | Telegram, telex and fax transmissions (if provided for in the deposit agreement). Converting foreign currency to US Dollar. | |
Taxes and other duties levied by the government, the Depositary or the custodian upon payment of the ADS or other shares underlying the ADS, such as share transfer tax, stamp duty or income tax. | | As necessary. | |
Any costs incurred by the Depositary or its agent for servicing the securities deposited. | | As necessary. | |
The Depositary has agreed to reimburse us up to US$400,000 per year until 2015 for certain expenses we incur in relation to the administration and maintenance of the ADS facility, including, but not limited to, direct or indirect investor relations expenses and other ADS program-related expenses. The reimbursement will be evaluated and adjusted if the number of ADSs outstanding falls below a stipulated minimum or if they are delisted from the NYSE. We expect to renegotiate the reimbursement amount for subsequent years after 2015. In 2011, we received US$299,217 in reimbursements from the Depositary.
-112-
PART II
ITEM 13. DEFAULTS, DIVIDEND ARREARAGES AND DELINQUENCIES
There are no defaults, dividend arrearages and delinquencies to which this Item applies. But see the information set forth under Note 18 to the Consolidated Financial Statements Report for information on covenant defaults for which waivers have been obtained.
ITEM 14. MATERIAL MODIFICATIONS TO THE RIGHTS OF SECURITY HOLDERS AND USE OF PROCEEDS
Not applicable.
ITEM 15. CONTROLS AND PROCEDURES
Disclosure Controls and Procedures
Under the supervision and with the participation of the Company’s management, including the Company’s President Director, the equivalent Chief Executive Officer (“CEO”) andFinance Director, the equivalent ofChief Financial Officer (“CFO”), management conducted an evaluation of the effectiveness of the Company’s disclosure controls and procedures (as such term is defined in Rules 13a-15(e) and 15(d)-15(e) under the Exchange Act,as of December 31, 2011. Based on this evaluation, the Company’sCEO andCFO have concluded that, as of December 31, 2011, the Company’s disclosure controls and procedures were effective. The Company’s disclosure controls and procedures include without limitation controls and proceduresthat are designed to ensure that information required to be disclosed in reports filed or submitted under the Exchange Act is recorded, processed, summarized and reported within the time periods specified in the SEC’s rules and forms, and that such information is accumulated and communicated to the Company’s management, including theCEO andCFO, as appropriate, to allow timely decisions regarding required disclosure.
Management’s Report on Internal Control over Financial Reporting
Management of the Company is responsible forestablishing and maintaining adequate internal control over financial reporting, as such term is defined in Exchange Act Rules 13a-15(f) and 15(d)-15(f). The Company’s internal control over financial reporting is a process designed by, or under the supervision of, ourCEO andCFO, and effected by ourBoard ofDirectors, management and other personnel, to provide reasonable assurance regarding the reliability of financial reporting and the preparation ofConsolidatedFinancialStatements for external purposes in accordance with Generally Accepted Accounting Principles (GAAP) and includes those policies and procedures that (1) pertain to the maintenance of records that, in reasonable detail, accurately and fairly reflect the transactions and dispositions of the assets of the Company; (2) provide reasonable assurance that transactions are recorded as necessary to permit preparation ofConsolidated FinancialStatements in accordance with GAAP, and that receipts and expenditures of the Company are being made only in accordance with authorizations of management and directors of the Company; and (3) provide reasonable assurance regarding prevention or timely detection of unauthorized acquisition, use or disposition of the Company’s assets that could have a material effect on theConsolidatedFinancialStatements.
Because of its inherent limitations, internal control over financial reporting may not prevent or detect misstatements. Also, projections of any evaluation of effectiveness to future periods are subject to the risk that controls may become inadequate because of changes in conditions, or that the degree of compliance with the policies or procedures may deteriorate
The Company’s management has assessed the effectiveness of the Company’s internal control over financial reporting as of December 31, 2011. In making this assessment the Company’s management used the criteria set forth in Internal Control – Integrated Framework issued by the Committee of SponsoringOrganizations of the TreadwayCommission(“COSO”). Based on this assessment, management has concluded that as of December 31, 2011, the Company’s internal control over financial reporting was effective.
Attestation Reportof the Registered Public Accounting Firm
The effectiveness of the Company’s internal control over financial reporting as of December 31, 2011 has been audited by Kantor Akuntan Publik Tanudiredja, Wibisana & Rekan, an independent registered public accounting firm, as stated in their report which appears on pageF-1 and F-2 herein.
Changes in Internal Control over Financial Reporting
There have been no significant changes in the Company’s internal control over financial reporting during the most recently completed fiscal year that would materially affect or are reasonably likely to materially affect, the Company’s internal control over financial reporting.
The Company is committed tocontinue improvingits internal control processes and will continue to diligently review and monitor its financial reporting controls and procedures in order to ensure compliance with the requirements of the Sarbanes-Oxley Act and the related rules promulgated by COSO. The Company will also continue to devote significant resources to the improvement of its internal control over financial reporting over time.
-113-
ITEM 16A. AUDIT COMMITTEE FINANCIAL EXPERT
The Board of Commissioners has determined that Sahat Pardede, as an independent member of our Audit Committee, qualifies as an Audit Committee Financial Expert in accordance with the requirements of Item 16A of Form 20-F. Mr. Pardede has been a member of our Audit Committee since February 2004. Prior to his appointment as a member of our Audit Committee, Sahat Pardede practiced and is currently practicing, as a Certified Public Accountant in Indonesia and provided auditing services and other financial services to numerous private companies and public institutions. He is a Certified Public Accountant and is also a member of the Indonesian Institute of Certified Public Accountants.
ITEM 16B. CODE OF ETHICS
In compliance with SOX Section 406, our code of ethics applies equally to our Commissioners, our President Director and our Finance Director (positions equivalent to Chief Executive Officer and Chief Financial Officer), Directors and other key officers as well as all of our employees. You may view our code of ethics on our web site at http://www.telkom.co.id/about-telkom/business-ethics. Amendments to or waivers from the code of ethics will similarly be posted on our website.
ITEM 16C. PRINCIPAL ACCOUNTANT FEES AND SERVICES
Our Consolidated Financial Statements for fiscal year 2011 were audited by KAP Tanudiredja, Wibisana & Rekan, a member firm of the PwC global network (“PwC”). The appointment of the independent auditors for fiscal year 2011, was carried out in accordance with the appropriate procedures by taking into account both the independence and qualification of the independent auditors.
Fees and Services of External Auditor
The following table summarizes the aggregate fees billed to us by PwC in 2009, 2010 and 2011, respectively:
| | | Years Ended December 31, | |
| | | 2009 | | 2010 | | 2011 | |
| | | | | (Rp million) | | | |
Audit Fees | | 49,640 | | 41,872 | | 40,503 | ** |
Tax Service Fees* | | 332 | | 398 | | 70 | |
All Others Costs | | 500 | | 400 | | 400 | |
*) | Fees paid for tax compliance services for Telin provided by PwC, excluding VAT of 10%. |
**) | Including Telkomsel and TSFL;MetraandSigma; Dayamitra; Telin and Telin PTE Ltd, excluding VAT of 10%. |
Audit Committee Pre-Approval Policies and Procedures
We have adopted pre-approval policies and procedures under which all non-audit services provided by our independent registered public accounting firm must be pre-approved by our Audit Committee, as set forth in the Audit Committee’s Charter. Pursuant to the charter, permissible non-audit services may be performed by our independent registered public accounting firm provided that: (a) our Board of Directors delivers to the Audit Committee (through the Board of Commissioners) a detailed description of the non-audit service that is to be performed by the independent public accounting firm and (b) the Audit Committee determines whether the proposed non-audit service would affect the independence of our independent public accounting firm or give rise to any conflict of interest.
Pursuant to Section 10(i)(1)(B) of the Exchange Act and Rule 2-01 -(c)(7)(i)(C) under Regulation S-X, Audit Committee Charter may waive the pre-approval requirement for permissible non-audit services where (i) the aggregate amount of the fees for such non-audit services constitutes no more than five percent of the total amount of fees paid by us to our independent registered public accounting firm during the year in which the services are provided, (ii) the proposed services are not regarded as non-audit services at the time the contract to perform the engagement is signed, and (iii) the performance of non-audit services are promptly bought to the attention of and approved prior to the completion of the audit by a member of the Audit Committee who has been delegated pre-approval authority by the full Audit Committee or by the full Audit Committee itself.
-114-
ITEM 16D. EXEMPTIONS FROM THE LISTING STANDARDS FOR AUDIT COMMITTEES
In accordance with Law No. 40 year 2007 regarding Limited Liability Companies, we have a two-tier board structure, consisting of a Board of Commissioners and a Board of Directors. The executive management functions are carried out by the Board of Directors, while the principal statutory duties of the Board of Commissioners are to supervise the policies of the Board of Directors in the operation and management of the Company and to give advice to the Board of Directors.
Bapepam-LK Rule No.IX.1.5 and the IDX’s Listing Rule No. 1A require the Board of Commissioners of an IDX-listed company listed on the IDX (such as Telkom) to establish an Audit Committee, which must consist of at least three members, one of whom must be an Independent Commissioner and serve as chair of the Audit Committee, while the other two members must be independent parties of whom at least one such party must have accounting and/or finance expertise.
The NYSE Listing Standards as required by Rule 10A-3(c)(3) of the Exchange Act require foreign private issuers whose shares are listed on the NYSE to have an Audit Committee comprised of Independent Directors. However, such foreign private issuers may be exempted from the independence requirement if (i) the home country government or stock exchange requires the company to have an Audit Committee; (ii) the Audit Committee is separate from the Board of Directors and includes non-board members as in our case, members from the Board of Commissioners; (iii) the Audit Committee members are not selected by management and no executive officers of the company is a member of the Audit Committee; (iv) the home country government or stock exchange requires the Audit Committee to be independent of the company’s management and (v) the Audit Committee is responsible for appointment, retention and oversight the work of the external auditor.
Our Audit Committee has six members: two Independent Commissioners, one Commissioner, and three external independent members who are not affiliated with our Company.
Not all members of our Audit Committee are Independent Directors as required by Rule 10A-3 of the Exchange Act. We rely on the general exemption pursuant to Rule 10A-3(c)(3) regarding the composition of the Audit Committee. We believe that our reliance on this exemption does not materially and adversely affect the ability of the Audit Committee to act independently. We believe that the intent of the provision in requiring that each member of the Audit Committee be an Independent Director is to ensure that the Audit Committee is independent from influence by management and provides a forum separate from management in which auditors and other interested parties can candidly discuss concerns. The Bapepam-LK Audit Committee Rules require that each member of the Audit Committee be independent. The Bapepam-LK Audit Committee Rules also require that at least two of the members, the external independent members, in effect be independent not only of the management but also of the Board of Commissioners and Board of Directors and the Company as a whole. We therefore believe that the standard established by the Bapepam-LK Audit Committee rules is at least equally effective in ensuring the ability of the Audit Committee to act independently.
We have documented the above exemption, regarding the Annual Written Conformation submitted to the NYSE. However, unlike the NYSE Listing Standards requirements, according to the current provisions for Audit Committees in Indonesia, our Audit Committee does not have direct responsibility for the appointment, compensation and retention of the external auditor. Our Audit Committee may only recommend the appointment of the external auditor to the Board of Commissioners and the Board of Commissioner’s decision must have the approval of the shareholders.
-115-
ITEM 16E. PURCHASES OF EQUITY SECURITIES BY THE ISSUER AND AFFILIATED PURCHASERS
Period (2011) | | Period (2011) | | Total Number of Share Purchased | | Average Price Paid per Share in Rp | | Total Number of Shares Purchased as Part of Publicly Announced Plans | | Maximum Number of Shares that May Yet Be Purchased Under the Plans | |
| | | | | | | | | | | 1,007,999,964 | |
SBB I | | 2006 | | 118,376,500 | | 8,044 | | 118,376,500 | | 889,623,464 | |
SBB II | | 2007 | | 126,364,000 | | 9,689 | | 244,740,500 | | 763,259,464 | |
SBB III | | 2008 | | 245,834,000 | | 8,491 | | 490,574,500 | | 517,425,464 | |
| | | | | - | | - | | - | | - | |
SBB IV | | 2011 | | | | | | | | | |
| | | January | | - | | - | | - | | 645,161,290 | |
| | | February | | - | | - | | - | | 645,161,290 | |
| | | March | | - | | - | | - | | 645,161,290 | |
| | | April | | - | | - | | - | | 645,161,290 | |
| | | May | | 6,000,000 | | 7,637 | | 496,574,500 | | 639,161,290 | |
| | | June | | 35,700,500 | | 7,334 | | 526,275,000 | | 603,460,790 | |
| | | July | | 32,521,000 | | 7,169 | | 523,095,500 | | 570,939,790 | |
| | | August | | 30,613,500 | | 7,300 | | 521,188,000 | | 540,326,290 | |
| | | September | | 37,073,500 | | 7,344 | | 527,648,000 | | 503,252,790 | |
| | | October | | 46,099,000 | | 7,285 | | 536,673,500 | | 457,153,790 | |
| | | November | | 36,331,960 | | 7,435 | | 526,906,460 | | 420,821,830 | |
| | | December | | 58,746,000 | | 7,190 | | 549,320,500 | | 362,075,830 | |
Total | | | | 283,085,460 | | 7,337 | | 773,659,960 | | - | |
We plan to retain, sell or use repurchased stock for other purposes in accordance with Bapepam-LK Regulation No. XI.B.2, Law No. 40/2007 regarding Limited Liability Companies and the resolutions of the AGMS on June 11, 2010, that require the Board of Directors to seek prior approval from the Board of Commissioners to undertake any change or transfer of treasury stock and report its utilization or transfer to the AGMS. Before giving its approval, the Board of Commissioners must consult with the holder of the Series A Dwiwarna share.
ITEM 16F. CHANGE IN REGISTRANT’S CERTIFYING ACCOUNTANT
There were no changes or disagreements with our accountants on any matter of accounting principle, practice or financial disclosure during the last two fiscal years.
ITEM 16G. CORPORATE GOVERNANCE
The following is a summary of significant differences between the corporate governance practices followed by Indonesian companies and those required by NYSE listing standards for domestic US issuers.
Overview of Indonesian Law
Indonesian public companies are required to observe and comply with certain good corporate governance practices. The requirements and the standards for good corporate governance practices for public companies are embodied in the following regulations: Law No. 40 of 2007 on Limited Liability Companies (“Indonesian Company Law”); the Law No. 8 of 1995 on Capital Markets (“Capital Markets Law”); the Law No. 19 of 2003 on State-Owned Enterprises; the Decree of the Minister of State-Owned Enterprises No. KEP-117/M.MBU/2002 on the Implementation of Good Corporate Governance Practice; the Regulations of the Indonesian Capital Markets and Financial Institutions Supervisory Board (“Bapepam-LK Regulations”) and the rules issued by the Indonesian Stock Exchange (“IDX”). In addition to the above, the articles of association of public companies incorporate provisions directing the implementation of good corporate governance practices.
-116-
Similar to the laws of the US, Indonesian laws require public companies to observe and comply with corporate governance standards that are more stringent than those applied to privately-owned companies. In Indonesia, the term “public company” does not necessarily refer to a company whose shares are listed on a securities exchange. Under the Capital Markets Law, a non-listed company may be deemed a public company, and subjected to the laws and regulations governing public companies, if such company meets or exceeds the capital and shareholder requirements applicable to a publicly-listed company.
On November 30, 2004, the National Committee on Governance (“NCG”) was established pursuant to the Decree of the Coordinating Minister for Economic Affairs No. KEP-49/M.EKONOM/1/2004, which was formed to revitalize the former National Committee on Good Corporate Governance established in 1999. The NCG aimed at enhancing comprehension and implementation of good governance in Indonesia and advises the Government on governance issues, both in public and corporate sectors.
The NCG formulated the Code for Good Corporate Governance 2006 (“Code”) which recommended setting more stringent corporate governance standards for Indonesian companies, such as the appointment of Independent Commissioners and nomination and remuneration committees by the Board of Commissioners, as well as increasing the scope of disclosure obligations for Indonesian companies. Although the NCG recommended that the Code be adopted by the Government as a basis for legal reform, as of the date of this Annual Report, the Government has not enacted regulations that fully implement the provisions of the Code.
Composition of Independent Board of Directors and Board of Commissioners
The NYSE listing standards provide that the Board of Directors of a US listed company must consist of a majority of Independent Directors and that certain committees must consist solely of Independent Directors. A Director qualifies as independent only if the board affirmatively determines that the Director has no material relationship with the company, either directly or indirectly.
Unlike companies incorporated in the US, the management of an Indonesian company consists of two organs of equal stature, the Board of Directors and the Board of Commissioners. Generally, the Board of Directors is responsible for the day-to-day business activities of the company and is authorized to act for and on behalf of the company, while the Board of Commissioners has the authority and responsibility to supervise the Board of Directors and is statutorily mandated to provide advice to the Board of Directors by Indonesian Company Law.
With regard to the Board of Commissioners, the Indonesia Company Law requires a public company Board of Commissioners to have at least two members. Although the Indonesia Company Law is silent as to the composition of the Board of Commissioners, Listing Regulation No. 1A in KEP-305/BEJ/07-2004 issued by the IDX states that at least 30% of the members of the Board of Commissioners of a public company must be independent.
The Indonesian Company Law states that the Board of Directors has the authority to manage the daily operation of the company and must have at least two members, each of whom must meet the minimum qualification requirements set forth in the Indonesian Company Law. The Decree of the Minister of State-Owned Enterprises No. KEP-117/M.MBU/2002 which was later amended by Minister of SOEs Regulation No.1 year 2011 states that at least 20% of the members of Board of Directors of State-Owned Enterprises, must be unaffiliated.
Given the difference between the role of the members of the Board of Directors in an Indonesian company and that of their counterparts in a US company, Indonesian law does not require that certain members of the Board of Directors must be independent and neither does it require the creation of certain committees composed entirely of Independent Directors.
Committees
NYSE listing standards require that a US listed company must have an Audit Committee, a nominating/corporate governance committee and a compensation committee. Each of these committees must consist solely of Independent Directors and must have a written charter that addresses certain matters specified in the listing standards.
The Indonesian Company Law does not require Indonesian public companies to form any of the committees described in the NYSE listing standards. However, Bapepam-LK Rule No.IX.1.5 and the IDX’s Listing Rule No. 1A require the Board of Commissioners of an IDX- listed company (such as Telkom) to establish an Audit Committee, which must consist of at least three members, one of whom must be an Independent Commissioner and serve as chair of the Audit Committee, while the other two members must be independent parties of whom at least one such party must have accounting and/or finance expertise. See “Item 6. Directors, Senior Management and Employees–Board Practices” and “Item 16D. Exemptions from the Listing Standards for Audit Committees”.
Disclosure Regarding Corporate Governance
The NYSE listing standards require US companies to adopt, and post on their websites, a set of corporate governance guidelines. The guidelines must address, among other things: director qualification standards, director responsibilities, director access to management and independent advisers, director compensation, director orientation and continuing education, management succession, and an annual performance evaluation itself. In addition, the CEO of a US company must certify to the NYSE annually that he or she is not aware of any violations by the company of the NYSE’s corporate governance listing standards. The certification must be disclosed in our Annual Report to shareholders. Indonesian law does not have disclosure requirements similar to NYSE listing standards. However, the Capital Markets Law generally requires Indonesian public companies to disclose certain types of information to shareholders and to Bapepam—LK, particularly information relating to changes in the public company’s shareholdings and material facts that may affect the decision of shareholders to maintain their share ownership in such public company.
-117-
Code of Business Conduct and Ethics
NYSE listing standards require each US listed company to adopt, and post on its web site, a code of business conduct and ethics for its Directors, officers and employees. There is no similar requirement under Indonesian law. However, companies that are required to file or furnish reports to the SEC, must disclose in their Annual Reports whether they have adopted a code of ethics for their senior financial officers. Although the requirements as to the contents of the code of ethics under SEC rules are not identical to those set forth in the NYSE listing standards, there are significant similarities in which under SEC rules, the code of ethics must be designed to promote: (a) honest and ethical conduct, including the handling of conflicts of interest between personal and professional relationships; (b) full, fair, accurate and timely disclosure in reports and documents filed with or submitted to the SEC; (c) compliance with applicable laws and regulations; (d) prompt internal reporting of violations of the code and (e) accountability for adherence to the code. Furthermore, shareholders must be given access to physical or electronic copies of the code. See “Item 16B. Code of Ethics”.
ITEM 16H. MINE SAFETY DISCLOSURE
Not Applicable
-118-
PART III
ITEM 17. FINANCIAL STATEMENTS
Not applicable.
ITEM 18. FINANCIAL STATEMENTS
See pages F-1 throughF-97
ITEM 19. EXHIBITS
The following exhibits are filed as part of this Form 20-F:
12.1 | | Certification of the Chief Executive Officer pursuant to Rule 13a-14(a) of the Securities Exchange Act of 1934. | |
12.2 | | Certification of the Chief Financial Officer pursuant to Rule 13a-14(a) of the Securities Exchange act of 1934. | |
13.1 | | Certification of the Chief Executive Officer pursuant to Rule 13a-14(b) of the Securities Exchange Act of 1934 and 18 U.S.C. Section 1350, as adopted pursuant to Section 906 of the Sarbanes-Oxley Act of 2002. | |
13.2 | | Certification of the Chief Financial Officer pursuant to Rule 13a-14(b) of the Securities Exchange Act of 1934 and 18 U.S.C. Section 1350, as adopted pursuant to Section 906 of the Sarbanes-Oxley Act of 2002. | |
-119-
SIGNATURES
Pursuant to the requirements of Section 12 of the Securities Exchange Act 1934, as amended, the Registrant hereby certifies that it meets all of the requirements for filing on Form 20-F and that it has duly caused and authorized the undersigned to sign this form 20-F on its behalf.
PERUSAHAAN PERSEROAN (PERSERO)
PT TELEKOMUNIKASI INDONESIA, TBK
Jakarta, March 30, 2012
By: /s/Rinaldi Firmansyah
Rinaldi Firmansyah
President Director/ Chief Executive Officer
-120-
Exhibit 12.1
CERTIFICATION
PURSUANT TO SECTION 302
THE SARBANES-OXLEY ACT OF 2005
I, Rinaldi Firmansyah, President Director (Chief Executive Officer) of Perusahaan Perseroan (Persero) PT Telekomunikasi Indonesia, Tbk (the “Company”), certify that:
1. I have reviewed this Annual Report on Form 20-F of the company’s;
2. Based on my knowledge, this report does not contain any untrue statement of a material fact or omit to state a material fact necessary to make the statements made, in light of the circumstances under which such statements were made, not misleading with respect to the period covered by this Report;
3. Based on my knowledge, the financial statements, and other financial information included in this report, fairly present in all material respects the financial condition, results of operations and cash flows of the company as of, and for, the periods presented in this Report;
4. The company other certifying officer(s) and I are responsible for establishing and maintaining disclosure controls and procedures (as defined in Exchange Act Rules 13a-15(e) and 15d-15(e)) and internal control over financial reporting (as defined in Exchange Act Rules 13a-15(f) and 15(d)-15(f)) for the company and have:
(a) Designed such disclosure controls and procedures, or caused such disclosure control and procedure to be designed under supervision, to ensure that material information relating to the company, including its consolidated subsidiaries, is made known to us by others within those entities, particularly during the period in which this Annual Report is being prepared;
(b) Designed such internal control over financial reporting, or caused such internal control over financial reporting to be designed under our supervision, to provide reasonable assurance regarding the reliability of financial reporting and the preparation of financial statement for external purpose in accordance with generally accepted accounting principles;
(c) Evaluated the effectiveness of the company’s disclosure control and procedures and presented in this report our conclusion about the effectiveness of the disclosure controls and procedures, as of the end of the period covered by this report based on such evaluation; and
(d) Disclosed in this report any change in the company’s internal control over financial reporting that occurred during the period covered by the Annual Report that has materially affected, or reasonably likely to materially affect, the company’s internal control over financial reporting; and
5. The company other certifying officer(s) and I have disclosed, based on our most recent evaluation of internal control over financial reporting, to the company’s auditors and the audit committee of the company’s board of directors:
(a) All significant deficiencies and material weaknesses in the design or operation of internal control over financial reporting which are reasonably likely to adversely affect the company ability to record, process, summarize and report financial information; and
(b) Any fraud, whether or not material, that involves management or other employees who have a significant role in the company's internal control over financial reporting.
Jakarta, March 30, 2012
By: /s/Rinaldi Firmansyah
Rinaldi Firmansyah
President Director/ Chief Executive Officer
Exhibit 12.2
CERTIFICATION
PURSUANT TO SECTION 302
THE SARBANES-OXLEY ACT OF 2005
I, Sudiro Asno, Director of Finance (Chief Financial Officer) of Perusahaan Perseroan (Persero) PT Telekomunikasi Indonesia, Tbk (the “Company”), certify that:
1. I have reviewed this Annual Report on Form 20-F of the company;
2. Based on my knowledge, this report does not contain any untrue statement of a material fact or omit to state a material fact necessary to make the statements made, in light of the circumstances under which such statements were made, not misleading with respect to the period covered by this report;
3. Based on my knowledge, the financial statements, and other financial information included in this report, fairly present in all material respects the financial condition, results of operations and cash flows of the Company as of, and for, the periods presented in this report;
4. The Company other certifying officer(s) and I are responsible for establishing and maintaining disclosure controls and procedures (as defined in Exchange Act Rules 13a-15(e) and 15d-15(e)) and internal control over financial reporting (as defined in Exchange Act Rules 13a-15(f) and 15(d)-15(f)) for the Company and have:
(a) Designed such disclosure controls and procedures, or caused such disclosure control and procedure to be designed under supervision, to ensure that material information relating to the Company, including its consolidated subsidiaries, is made known to us by others within those entities, particularly during the period in which this Annual Report is being prepared;
(b) Designed such internal control over financial reporting, or caused such internal control over financial reporting to be designed under our supervision, to provide reasonable assurance regarding the reliability of financial reporting and the preparation of financial statement for external purpose in accordance with generally accepted accounting principles;
(c) Evaluated the effectiveness of the Company’s disclosure control and procedures and presented in this report our conclusion about the effectiveness of the disclosure controls and procedures, as of the end of the period covered by this report based on such evaluation; and
(d) Disclosed in this report any change in the company’s internal control over financial reporting that occurred during the period covered by the Annual Report that has materially affected, or reasonably likely to materially affect, the company’s internal control over financial reporting; and
5. The Company other certifying officer(s) and I have disclosed, based on our most recent evaluation of internal control over financial reporting, to the company’s auditors and the audit committee of the company’s board of directors:
(a) All significant deficiencies and material weaknesses in the design or operation of internal control over financial reporting which are reasonably likely to adversely affect the company ability to record, process, summarize and report financial information; and
(b) Any fraud, whether or not material, that involves management or other employees who have a significant role in the company's internal control over financial reporting.
Jakarta, March 30, 2012
By: /s/Sudiro Asno
Sudiro Asno
Director of Finance/ Chief Financial Officer
Exhibit 13.1 |
CERTIFICATION PURSUANT TO 18 U.S.C. SECTION 1350, AS ADOPTED PURSUANT TO SECTION 906 OF THE SARBANES-OXLEY ACT OF 2005 |
In connection with the Annual Report of Perusahaan Perseroan (Persero) PT Telekomunikasi Indonesia, Tbk (the “Company”) on Form 20-F for the year ending December 31, 2011 as filed with the Securities and Exchange Commission on the date here of (the “Report”), I, Rinaldi Firmansyah, President Director (Chief Executive Officer) of the Company, certify, pursuant to 18 U.S.C. Section 1350, as adopted pursuant to Section 906 of the Sarbanes-Oxley Act of 2005, that, to my knowledge: |
(1) | The Report fully complies with the requirements of section 13(a) or 15(d) of the Securities Exchange Act of 1934; and |
(2) | The information contained in the Report fairly presents, in all material respects, the financial condition and result of operations of the Company. |
This certification accompanies this Report pursuant to 906 of the Sarbanes-Oxley Act of 2005 and shall not be deemed filed with the Securities and Exchange Commission by the Company as part of the Report or as a separate disclosure document. |
Jakarta, March 30, 2012 |
By: /s/Rinaldi Firmansyah
Rinaldi Firmansyah
President Director/ Chief Executive Officer
Exhibit 13.2 |
CERTIFICATION PURSUANT TO 18 U.S.C. SECTION 1350, AS ADOPTED PURSUANT TO SECTION 906 OF THE SARBANES-OXLEY ACT OF 2005 |
In connection with the Annual Report of Perusahaan Perseroan (Persero) PT Telekomunikasi Indonesia, Tbk (the “Company”) on Form 20-F for the year ending December 31, 2010 as filed with the Securities and Exchange Commission on the date here of (the “Report”), I, Sudiro Asno, Director of Finance (Chief Financial Officer) of the Company, certify, pursuant to 18 U.S.C. Section 1350, as adopted pursuant to Section 906 of the Sarbanes-Oxley Act of 2005, that, to my knowledge: |
| | (1) | The Report fully complies with the requirements of section 13(a) or 15(d) of the Securities Exchange Act of 1934; and |
| | (2) | The information contained in the Report fairly presents, in all material respects, the financial condition and result of operations of the Company. |
This certification accompanies this Report pursuant to 906 of the Sarbanes-Oxley Act of 2005 and shall not be deemed filed with the Securities and Exchange Commission by the Company as part of the Report or as a separate disclosure document. |
Jakarta, March 30, 2012 |
By: /s/Sudiro Asno
Sudiro Asno
Director of Finance/ Chief Financial Officer
PERUSAHAAN PERSEROAN (PERSERO)
P.T. TELEKOMUNIKASI INDONESIA Tbk
AND SUBSIDIARIES
CONSOLIDATED FINANCIAL STATEMENTS
JANUARY 1, 2010, DECEMBER 31, 2010 AND 2011
AND YEARS ENDED
DECEMBER 31, 2010 AND 2011
PERUSAHAAN PERSEROAN (PERSERO)
P.T. TELEKOMUNIKASI INDONESIA Tbk AND SUBSIDIARIES
JANUARY 1, 2010, DECEMBER 31, 2010 AND 2011 AND
YEARS ENDED DECEMBER 31, 2010 AND 2011
TABLE OF CONTENTS

REPORT OF INDEPENDENT REGISTERED PUBLIC ACCOUNTING FIRM
TO THE STOCKHOLDERS OF
PERUSAHAAN PERSEROAN (PERSERO) PT TELEKOMUNIKASI INDONESIA Tbk
In our opinion, the accompanying consolidated statements of financial position and the related consolidated statements of comprehensive income, changes in equity, and cash flows present fairly, in all material respects, the financial position of Perusahaan Perseroan (Persero) PT Telekomunikasi Indonesia Tbk (the “Company”) and its subsidiaries at January 1, 2010, December 31, 2010 and 2011, and the results of their operations and their cash flows for each of the two years in the period ended December 31, 2011in conformity withInternational Financial Reporting Standards as issued by the International Accounting Standards Board.Also in our opinion, the Company maintained, in all material respects, effective internal control over financial reporting as of December 31, 2011, based on criteria established inInternal Control - Integrated Framework issued by the Committee of Sponsoring Organizations of the Treadway Commission (COSO).The Company's management is responsible for these financial statements, for maintaining effective internal control over financial reporting and for its assessment of the effectiveness of internal control over financial reporting, included under the heading “Management’s Report on Internal Control over Financial Reporting” in the accompanying Annual Report. Our responsibility is to express opinions on these financial statements and on the Company's internal control over financial reporting based on our integrated audits.We conducted our audits in accordance with the standards of the Public Company Accounting Oversight Board (United States). Those standards require that we plan and perform the audits to obtain reasonable assurance about whether the financial statements are free of material misstatement and whether effective internal control over financial reporting was maintained in all material respects. Our audits of the financial statements included examining, on a test basis, evidence supporting the amounts and disclosures in the financial statements, assessing the accounting principles used and significant estimates made by management, and evaluating the overall financial statement presentation. Our audit of internal control over financial reporting included obtaining an understanding of internal control over financial reporting, assessing the risk that a material weakness exists, and testing and evaluating the design and operating effectiveness of internal control based on the assessed risk. Our audits also included performing such other procedures as we considered necessary in the circumstances. We believe that our audits provide a reasonable basis for our opinions.
A company’s internal control over financial reporting is a process designed to provide reasonable assurance regarding the reliability of financial reporting and the preparation of financial statements for external purposes in accordance with generally accepted accounting principles. A company’s internal control over financial reporting includes those policies and procedures that (i) pertain to the maintenance of records that, in reasonable detail, accurately and fairly reflect the transactions and dispositions of the assets of the company; (ii) provide reasonable assurance that transactions are recorded as necessary to permit preparation of financial statements in accordance with generally accepted accounting principles, and that receipts and expenditures of the company are being made only in accordance with authorizations of management and directors of the company; and (iii) provide reasonable assurance regarding prevention or timely detection of unauthorized acquisition, use, or disposition of the company’s assets that could have a material effect on the financial statements.

F-1
Because of its inherent limitations, internal control over financial reporting may not prevent or detect misstatements. Also, projections of any evaluation of effectiveness to future periods are subject to the risk that controls may become inadequate because of changes in conditions, or that the degree of compliance with the policies or procedures may deteriorate.
JAKARTA
March 30, 2012
/S/Chrisna A. Wardhana
Chrisna A. Wardhana, CPA
Public Accountant License No. AP.0231
A120330008/DC2/CAW/III/2012
F-2
| | | | January 1, 2010 | | December 31, 2010 | | December 31, 2011 | |
| | Notes | | Rp. | | Rp. | | Rp. | | US$ (Note 3) | |
ASSETS | | | | | | | | | | | |
CURRENT ASSETS | | | | | | | | | | | |
Cash and cash equivalents | | 5 | | 7,805 | | 9,120 | | 9,634 | | 1,062 | |
Available-for-sale financial assets | | 39 | | 360 | | 370 | | 361 | | 40 | |
Trade and other receivables | | 6 | | 3,996 | | 4,534 | | 5,393 | | 595 | |
Inventories | | 7,29 | | 435 | | 515 | | 758 | | 84 | |
Advances and prepaid expenses | | 8 | | 2,497 | | 3,441 | | 3,294 | | 363 | |
Prepaid income taxes | | 31 | | 790 | | 682 | | 633 | | 70 | |
Prepaid other taxes | | 31 | | 256 | | 167 | | 525 | | 58 | |
Assets held for sale | | 9 | | - | | - | | 791 | | 87 | |
Other current assets | | 39 | | 125 | | 1 | | 12 | | 1 | |
Total Current Assets | | | | 16,264 | | 18,830 | | 21,401 | | 2,360 | |
NON-CURRENT ASSETS | | | | | | | | | | | |
Long term investments | | 10 | | 151 | | 254 | | 235 | | 26 | |
Property, plant, and equipment | | 11,36 | | 76,179 | | 75,624 | | 74,638 | | 8,231 | |
Prepaid pension benefit costs | | 32 | | 1,099 | | 1,419 | | 765 | | 84 | |
Advances and other non-current assets | | 12 | | 2,533 | | 3,095 | | 3,817 | | 421 | |
Intangible assets | | 13 | | 2,431 | | 1,786 | | 1,791 | | 198 | |
Deferred tax assets | | 31 | | 94 | | 64 | | 75 | | 8 | |
Total Non-current Assets | | | | 82,487 | | 82,242 | | 81,321 | | 8,968 | |
TOTAL ASSETS | | | | 98,751 | | 101,072 | | 102,722 | | 11,328 | |
LIABILITIES AND EQUITY | | | | | | | | | | | |
CURRENT LIABILITIES | | | | | | | | | | | |
Trade and other payables | | 14,39 | | 10,205 | | 7,787 | | 8,355 | | 921 | |
Current income taxes liabilities | | 31 | | 1,172 | | 463 | | 729 | | 81 | |
Other taxes liabilities | | 31 | | 578 | | 273 | | 310 | | 34 | |
Accrued expenses | | 15,39 | | 4,119 | | 3,409 | | 4,790 | | 528 | |
Unearned income | | 16 | | 2,947 | | 2,681 | | 2,821 | | 311 | |
Advances from customers and suppliers | | | | 111 | | 500 | | 271 | | 30 | |
Short term loans and other borrowings | | 17 | | 7,760 | | 5,360 | | 4,913 | | 542 | |
Total Current Liabilities | | | | 26,892 | | 20,473 | | 22,189 | | 2,447 | |
NON-CURRENT LIABILITIES | | | | | | | | | | | |
Deferred tax liabilities | | 31 | | 3,306 | | 4,047 | | 3,448 | | 380 | |
Unearned income | | | | 393 | | 312 | | 242 | | 27 | |
Long-service awards provisions | | 33 | | 212 | | 242 | | 287 | | 32 | |
Post-employment benefits obligation | | 32 | | 2,726 | | 2,805 | | 4,572 | | 504 | |
Long term loans and other borrowings | | 18 | | 14,900 | | 16,655 | | 12,958 | | 1,429 | |
Total Non-current Liabilities | | | | 21,537 | | 24,061 | | 21,507 | | 2,372 | |
TOTAL LIABILITIES | | | | 48,429 | | 44,534 | | 43,696 | | 4,819 | |
EQUITY | | | | | | | | | | | |
EQUITY ATTRIBUTABLE TO OWNERS OF THE PARENT | | | | | | | | | | | |
Capital stock | | 20 | | 5,040 | | 5,040 | | 5,040 | | 556 | |
Additional paid-in capital | | 21 | | 1,073 | | 1,073 | | 1,073 | | 118 | |
Treasury stock | | 22 | | (4,264 | ) | (4,264 | ) | (6,323 | ) | (697 | ) |
Retained earnings | | | | 37,561 | | 42,726 | | 45,865 | | 5,058 | |
Other reserves | | 23 | | 18 | | 52 | | 56 | | 6 | |
Equity attributable to owners of the Parent | | | | 39,428 | | 44,627 | | 45,711 | | 5,041 | |
NON-CONTROLLING INTEREST | | 19 | | 10,894 | | 11,911 | | 13,315 | | 1,468 | |
TOTAL EQUITY | | | | 50,322 | | 56,538 | | 59,026 | | 6,509 | |
TOTAL LIABILITIES AND EQUITY | | | | 98,751 | | 101,072 | | 102,722 | | 11,328 | |
| | | | | | | | | | | |
See accompanying notes to consolidated financial statements, which form an integral part of the consolidated financial statements. |
F-3
| | | | 2010 | | 2011 | |
| | Notes | | Rp. | | Rp. | | US$ (Note 3) | |
REVENUES | | 25 | | 68,529 | | 71,238 | | 7,856 | |
Other Income | | | | 548 | | 666 | | 73 | |
EXPENSES | | | | | | | | | |
Operations, maintenance and telecommunication services | | 28 | | (16,046 | ) | (16,453 | ) | (1,815 | ) |
Depreciation and amortization | | 11,12,13 | | (14,580 | ) | (14,823 | ) | (1,635 | ) |
Personnel | | 15,27,32,33 | | (7,447 | ) | (8,671 | ) | (956 | ) |
Interconnection | | 30 | | (3,086 | ) | (3,555 | ) | (392 | ) |
Marketing | | | | (2,525 | ) | (3,278 | ) | (362 | ) |
General and administrative | | 7,29 | | (2,537 | ) | (2,935 | ) | (324 | ) |
Gain (loss) on foreign exchange - net | | | | 43 | | (210 | ) | (23 | ) |
Share oflossof associated companies | | 10 | | (14 | ) | (10 | ) | (1 | ) |
Others | | | | (145 | ) | (192 | ) | (21 | ) |
Total Expenses | | | | (46,337 | ) | (50,127 | ) | (5,529 | ) |
PROFIT BEFORE FINANCE (COSTS) / INCOME AND INCOME TAX | | | | 22,740 | | 21,777 | | 2,400 | |
Finance income | | | | 452 | | 620 | | 68 | |
Finance costs | | | | (1,928 | ) | (1,662 | ) | (183 | ) |
Total Finance Costs - Net | | | | (1,476 | ) | (1,042 | ) | (115 | ) |
PROFIT BEFORE INCOME TAX | | | | 21,264 | | 20,735 | | 2,285 | |
INCOME TAX (EXPENSE) BENEFIT | | | | | | | | | |
Current | | 31 | | (4,669 | ) | (5,673 | ) | (626 | ) |
Deferred | | 31 | | (843 | ) | 288 | | 32 | |
| | | | (5,512 | ) | (5,385 | ) | (594 | ) |
PROFIT FOR THE YEAR | | | | 15,752 | | 15,350 | | 1,691 | |
OTHER COMPREHENSIVE (EXPENSE) INCOME | | | | | | | | | |
Foreign currency translation differences | | | | 2 | | 7 | | 1 | |
Change in fair value of available-for-sale financial assets | | | | 32 | | 4 | | - | |
Defined benefit plan actuarial losses | | | | (587 | ) | (1,958 | ) | (216 | ) |
Total Other Comprehensive Expense, net of tax | | | | (553 | ) | (1,947 | ) | (215 | ) |
TOTAL COMPREHENSIVE INCOME FOR THE YEAR | | | | 15,199 | | 13,403 | | 1,476 | |
Profit attributable to : | | | | | | | | | |
Owners of the Parent | | | | 11,427 | | 10,848 | | 1,195 | |
Non-controlling interest | | | | 4,325 | | 4,502 | | 496 | |
| | | | 15,752 | | 15,350 | | 1,691 | |
Total comprehensive incomeattributable to : | | | | | | | | | |
Owners of the Parent | | | | 10,911 | | 8,969 | | 988 | |
Non-controlling interest | | | | 4,288 | | 4,434 | | 488 | |
| | | | 15,199 | | 13,403 | | 1,476 | |
BASIC EARNINGS PER SHARE | | 24 | | | | | | | |
Net income per share | | | | 580.95 | | 553.70 | | 0.06 | |
Net income per ADS (40 Series B shares per ADS) | | | | 23,238.00 | | 22,148.00 | | 2.44 | |
| | | | | | | | | |
| | | | | | | | | |
See accompanying notes to consolidated financial statements, which form an integral part of the consolidated financial statements. |
F-4
| | | | Attributable to equity holders of the Company | | | | | |
| | | | Capital | | Additional | | Treasury | | Retained | | Other | | | | Non- Controlling | | Total | |
Descriptions | | Notes | | Stock | | paid-in capital | | stock | | earnings | | reserves | | Total | | Interest | | Equity | |
| | | | Rp. | | Rp. | | Rp. | | Rp. | | Rp. | | Rp. | | Rp. | | Rp. | |
Balance, January 1, 2010 | | | | 5,040 | | 1,073 | | (4,264 | ) | 37,561 | | 18 | | 39,428 | | 10,894 | | 50,322 | |
Total comprehensive income for the year | | | | | | | | | | | | | | | | | | | |
Profit for the year | | | | - | | - | | - | | 11,427 | | - | | 11,427 | | 4,325 | | 15,752 | |
Other comprehensive income | | | | - | | - | | - | | (550 | ) | 34 | | (516 | ) | (37 | ) | (553 | ) |
Total comprehensive income for the year | | | | - | | - | | - | | 10,877 | | 34 | | 10,911 | | 4,288 | | 15,199 | |
Transactions with owners, recorded directly in equity | | | | | | | | | | | | | | | | | | | |
Contribution by and distributions to owners | | | | | | | | | | | | | | | | | | | |
Cash dividends | | 20 | | - | | - | | - | | (5,142 | ) | - | | (5,142 | ) | (3,224 | ) | (8,366 | ) |
Interim dividends | | | | - | | - | | - | | (526 | ) | - | | (526 | ) | - | | (526 | ) |
Total contributions by and distributions to owners | | | | - | | - | | - | | (5,668 | ) | - | | (5,668 | ) | (3,224 | ) | (8,892 | ) |
Changes in ownership interests in subsidiaries 20% acquisition of Sigma | | | | - | | - | | - | | (44 | ) | - | | (44 | ) | (51 | ) | (95 | ) |
Attributable to NCI arising from acquisition of Ad Medika | | 4 | | - | | - | | - | | - | | - | | - | | 4 | | 4 | |
Total changes in ownership interest in subsidiaries | | | | - | | - | | - | | (44 | ) | - | | (44 | ) | (47 | ) | (91 | ) |
Total transactions with owners | | | | - | | - | | - | | (5,712 | ) | - | | (5,712 | ) | (3,271 | ) | (8,983 | ) |
Balance, December 31, 2010 | | | | 5,040 | | 1,073 | | (4,264 | ) | 42,726 | | 52 | | 44,627 | | 11,911 | | 56,538 | |
Total comprehensive income for the year | | | | | | | | | | | | | | | | | | | |
Profit for the year | | | | - | | - | | - | | 10,848 | | - | | 10,848 | | 4,502 | | 15,350 | |
Other comprehensive income | | | | - | | - | | - | | (1,890 | ) | 11 | | (1,879 | ) | (68 | ) | (1,947 | ) |
Total comprehensive income for the year | | | | - | | - | | - | | 8,958 | | 11 | | 8,969 | | 4,434 | | 13,403 | |
Gains from investments securities | | | | - | | - | | - | | - | | (7 | ) | (7 | ) | - | | (7 | ) |
Transactions with owners recorded directly in equity | | | | | | | | | | | | | | | | | | | |
Cash dividends | | 20 | | - | | - | | - | | (5,819 | ) | - | | (5,819 | ) | (3,030 | ) | (8,849 | ) |
Treasury stock acquired - at cost | | | | - | | - | | (2,059 | ) | - | | - | | (2,059 | ) | - | | (2,059 | ) |
Total transactions with owners | | | | - | | - | | (2,059 | ) | (5,819 | ) | - | | (7,878 | ) | (3,030 | ) | (10,908 | ) |
Balance, December 31, 2011 | | | | 5,040 | | 1,073 | | (6,323 | ) | 45,865 | | 56 | | 45,711 | | 13,315 | | 59,026 | |
| | | | | | | | | | | | | | | | | | | |
| | | | | | | | | | | | | | | | | | | |
See accompanying notes to consolidated financial statements, which form an integral part of the consolidated financial statements. |
F-5
| | | | 2010 | | 2011 | |
| | Note | | Rp. | | Rp. | | US$ (Note 3) | |
CASH FLOWS FROM OPERATING ACTIVITIES | | | | | | | | | |
Cash receipts from: | | | | | | | | | |
Customers | | | | 64,533 | | 67,469 | | 7,441 | |
Other operators | | | | 3,630 | | 3,586 | | 395 | |
Total cash receipts from revenues | | | | 68,163 | | 71,055 | | 7,836 | |
Cash payments for expenses | | | | (25,288 | ) | (25,507 | ) | (2,813 | ) |
Cash payments to employees | | | | (8,993 | ) | (8,509 | ) | (939 | ) |
Advance from (refund to) customers | | | | 386 | | (226 | ) | (25 | ) |
Interest income received | | | | 453 | | 599 | | 65 | |
Interest costs paid | | | | (1,826 | ) | (1,591 | ) | (175 | ) |
Income tax paid | | 31 | | (5,829 | ) | (5,359 | ) | (591 | ) |
Receipt of claim for tax refund | | 31 | | 659 | | - | | - | |
Net cash provided by operating activities | | | | 27,725 | | 30,462 | | 3,358 | |
CASH FLOWS FROM INVESTING ACTIVITIES | | | | | | | | | |
Proceeds from sale of available-for-sale financial assetsand dividends received | | | | 31 | | 59 | | 7 | |
Purchases of available-for-sale financial assets | | | | (6 | ) | (33 | ) | (4 | ) |
Proceeds from sale of property, plant and equipment | | 11 | | 12 | | 56 | | 6 | |
Proceeds from insurance claims | | | | - | | 13 | | 1 | |
Acquisition of property, plant and equipment | | 11 | | (14,918 | ) | (13,105 | ) | (1,446 | ) |
Increase in advances for purchases of property, plant and equipment | | 8, 12 | | (641 | ) | (834 | ) | (92 | ) |
Decrease in advances and other assets | | | | 88 | | 34 | | 4 | |
Payment for acquisition of subsidiary, net of cash acquired | | 4 | | (116 | ) | - | | - | |
Acquisition of intangible assets | | 13 | | (723 | ) | (604 | ) | (66 | ) |
Acquisition of non-controlling interest of subsidiary | | | | (96 | ) | - | | - | |
Acquisition of long-term investments | | 10 | | (115 | ) | - | | - | |
Net cash used in investing activities | | | | (16,484 | ) | (14,414 | ) | (1,590 | ) |
CASH FLOWS FROM FINANCING ACTIVITIES | | | | | | | | | |
Cash dividends paid to the Company’s stockholders | | 20 | | (5,418 | ) | (6,069 | ) | (669 | ) |
Cash dividends paid to non-controlling interests of subsidiaries | | | | (3,624 | ) | (3,033 | ) | (334 | ) |
Proceeds fromloans and other borrowings | | 17, 18 | | 8,320 | | 3,589 | | 396 | |
Repayments ofloans and otherborrowings | | 17, 18 | | (9,098 | ) | (7,967 | ) | (879 | ) |
Payment for repurchase of shares | | 22 | | - | | (2,059 | ) | (227 | ) |
Net cash used in financing activities | | | | (9,820 | ) | (15,539 | ) | (1,713 | ) |
NET INCREASE IN CASH AND CASH EQUIVALENTS | | | | 1,421 | | 509 | | 55 | |
EFFECT OF EXCHANGE RATE CHANGES ON CASH AND CASH EQUIVALENTS | | | | (106 | ) | 5 | | 1 | |
CASH AND CASH EQUIVALENTS AT BEGINNING OF YEAR | | 5 | | 7,805 | | 9,120 | | 1,006 | |
CASH AND CASH EQUIVALENTS AT END OF YEAR | | 5 | | 9,120 | | 9,634 | | 1,062 | |
See accompanying notes to consolidated financial statements, which form an integral part of the consolidated financial statements. |
F-6
Table of Contents |
PERUSAHAAN PERSEROAN (PERSERO) P.T. TELEKOMUNIKASI INDONESIA Tbk AND SUBSIDIARIES NOTES TO CONSOLIDATED FINANCIAL STATEMENTS JANUARY 1, 2010, DECEMBER 31, 2010 AND 2011 AND YEARS ENDED DECEMBER 31, 2010 AND 2011 (Figures in tables are presented in billions of Rupiah, unless otherwise stated) |
1. GENERAL
a. Establishment and general information
Perusahaan Perseroan (Persero) P.T. Telekomunikasi Indonesia Tbk (the “Company”) was originally part of“Post en Telegraafdienst”, which was established in 1884 under the framework of Decree No. 7 dated March 27, 1884 of the Governor General of the Dutch Indies and was published in State Gazette No. 52 dated April 3, 1884.
In 1991, the status of the Company was changed into a state-owned limited liability corporation (“Persero”) based on Government Regulation No. 25/1991.
The Company was established based on notarial deed No. 128 dated September 24, 1991 of Imas Fatimah, S.H. The deed of establishment was approved by the Minister of Justice of the Republic of Indonesia in his Decision Letter No. C2-6870.HT.01.01.Th.1991 dated November 19, 1991, and was published in State Gazette No. 5 dated January 17, 1992, Supplement No. 210. The Articles of Association have been amended several times, the latest amendments were to comply with Badan Pengawas Pasar Modal and Lembaga Keuangan Indonesia (“BAPEPAM-LK”) Regulation No. IX.J.1 of Main Provisions of the Articles of Association of Company that Make an Equity Public Offering and Public Company and BAPEPAM-LK Regulation No. IX.E.2 of Material Transaction and Changes of the Core Business Activities, and to add the Company’s purposes and objectives, based on notarial deed No. 37 dated June 24, 2010 of A. Partomuan Pohan, S.H., LLM. The changes were accepted and approved by the Minister of Justice and Human Rights of the Republic of Indonesia (“MoJHR”) as in his Letter No.AHU-AH.01.10-18476 dated July 22, 2010 and Letter No. AHU-35876.AH.01.02/2010 dated July 19, 2010 and was published in State Gazette of the Republic of Indonesia No. 63 dated August 9, 2011, Supplement of the Republic of Indonesia No. 23552.
In accordance with Article 3 of the Company’s Articles of Association, the scope of its activities is to provide telecommunication network and services, informatics and optimization of the Company’s resources in accordance with prevailing regulations. To achieve this objective, the Company is involved in the following activities:
a. Main business:
i. Planning, building, providing, developing, operating, marketing or selling, leasing and maintaining telecommunications and information networks in accordance with prevailing regulations.
ii. Planning, developing, providing, marketing or selling and improving telecommunications and information services in accordance with prevailing regulations.
b. Supporting business:
i. Providing payment transactions and money transferring services through telecommunications and information networks.
ii. Performing activities and other undertakings in connection with optimization of the Company's resources, which among others includes the utilization of the Company's property, plant and equipment and moving assets, information systems, education and training, and repairs and maintenance facilities.
The Company’s head office is located at Jalan Japati No. 1, Bandung, West Java.
F-7
Table of Contents |
PERUSAHAAN PERSEROAN (PERSERO) P.T. TELEKOMUNIKASI INDONESIA Tbk AND SUBSIDIARIES NOTES TO CONSOLIDATED FINANCIAL STATEMENTS(continued) JANUARY 1, 2010, DECEMBER 31, 2010 AND 2011 AND YEARS ENDED DECEMBER 31, 2010 AND 2011 (Figures in tables are presented in billions of Rupiah, unless otherwise stated) |
1. GENERAL(continued)
a. Establishment and general information(continued)
The Company was granted several telecommunications licenses which are valid for an unlimited period of time as long as the Company complies with prevailing laws and telecommunications regulations and fulfills the obligations stated in those permits. For every license, an evaluation is performed annually and an overall evaluation is performed every 5 (five) years. The Company is obliged to submit reports of services to the Indonesian Directorate General of Post and Telecommunications (“DGPT”) annually. The reports comprise information such as network development progress, service quality standard achievement, total customer, license payment and universal service contribution, while for internet telephone services for public purpose (“ITKP”) there are additional information required such as operational performance, customer segmentation, traffic, and gross revenue.
Details of these licenses are as follows:
| | | | | | Grant date/latest | |
License | | License No. | | Type of services | | renewal date | |
License to operate local fixed line and basic telephone services network | | 381/KEP/ M.KOMINFO/ 10/2010 | | Local fixed line and basic telephone services network | | October 28, 2010 | |
License to operate fixed domestic long distance and basic telephone services network | | 382/KEP/ M.KOMINFO/ 10/2010 | | Fixed domestic long distance and basic telephone services network | | October 28, 2010 | |
License to operate fixed international and basic telephone services network | | 383/KEP/ M.KOMINFO/ 10/2010 | | Fixed international and basic telephone services network | | October 28, 2010 | |
License to operate fixed closed network | | 398/KEP/ M.KOMINFO/ 11/2010 | | Fixed closed network | | November 12, 2010 | |
License to operate internet telephone services for public purpose | | 384/KEP/DJPT/ M.KOMINFO/ 11/2010 | | ITKP | | November 29, 2010 | |
License to operateinternet service provider | | 83/KEP/DJPPI/KOMINFO/ 4/2011 | | Internet serviceprovider | | April 7, 2011 | |
License to operate data communication system services | | 169/KEP/DJPPI/ KOMINFO/ 6/2011 | | Data communication system service | | June 6, 2011 | |
License to operate packet switched based local fixed line network | | 331/KEP/ M.KOMINFO/ 07/2011 | | Packet switched based local fixed line network | | July 27, 2011 | |
F-8
Table of Contents |
PERUSAHAAN PERSEROAN (PERSERO) P.T. TELEKOMUNIKASI INDONESIA Tbk AND SUBSIDIARIES NOTES TO CONSOLIDATED FINANCIAL STATEMENTS(continued) JANUARY 1, 2010, DECEMBER 31, 2010 AND 2011 AND YEARS ENDED DECEMBER 31, 2010 AND 2011 (Figures in tables are presented in billions of Rupiah, unless otherwise stated) |
1. GENERAL(continued)
b. Company’s Board of Commissioners, Directors, Audit Committee, Corporate Secretary and employees
1. Board of Commissioners and Directors
Based on resolutions made at (i) the Extraordinary General Meeting (“EGM”) of Stockholders of the Company dated June 11, 2010 as covered by notarial deed no. 18 of Dr. A. Partomuan Pohan, S.H., LLM., and (ii) the EGM of Stockholders of the Company dated December 17, 2010 as covered by notarial deed no. 33 of the same notary, the composition of the Company’s Board of Commissioners and Directors as of December 31, 2010 and 2011, respectively, were as follows:
| | 2010 | | 2011 | |
President Commissioner | | Tanri Abeng | | Jusman Syafii Djamal | |
Commissioner | | Bobby A.A Nazief | | Bobby A.A Nazief | |
Commissioner | | Mahmuddin Yasin | | Mahmuddin Yasin | |
Independent Commissioner* | | Arif Arryman | | Rudiantara | |
Independent Commissioner | | Petrus Sartono | | Johnny Swandi Sjam | |
President Director | | Rinaldi Firmansyah | | Rinaldi Firmansyah | |
Vice President Director/Chief Operating Officer (“COO”) | | ** (see Note below) | | ** (see Note below) | |
Director of Finance | | Sudiro Asno | | Sudiro Asno | |
Director of Network and Solution | | Ermady Dahlan | | Ermady Dahlan | |
Director of Enterprise and Wholesale | | Arief Yahya | | Arief Yahya | |
Director of Consumer | | I Nyoman Gede Wiryanata | | I Nyoman Gede Wiryanata | |
Director of Compliance and Risk Management | | Prasetio | | Prasetio | |
Director of Information Technology Solution &Strategic Portofolio*** | | Indra Utoyo | | Indra Utoyo | |
Director of Human Capital and General Affairs (“HCGA”) | | Faisal Syam | | Faisal Syam | |
* Arif Arryman passed away on September 7, 2010, the position was vacant as of December 31, 2010, Rudiantara was appointed starting January 1, 2011 for this position.
** COO is held by Director of Network and Solution in 2010 and 2011
*** The change of title is based on Director’s Regulation No.201.04/r.00/PS.150/COP-B0030000/2011 dated November 23, 2011
2. Audit Committee and Corporate Secretary
The composition of the Company’s Audit Committee and Corporate Secretary as of December 31, 2010 and 2011, respectively, were as follows:
| | 2010 | | 2011 | |
Chair | | Petrus Sartono | | Rudiantara | |
Secretary | | Salam | | Salam | |
Member | | Bobby A.A Nazief | | Bobby A.A Nazief | |
Member | | Agus Yulianto | | Agus Yulianto | |
Member | | Sahat Pardede | | Sahat Pardede | |
Member | | - | | Johnny Swandi Sjam | |
Corporate Secretary | | Agus Murdiyatno | | Agus Murdiyatno | |
F-9
Table of Contents |
PERUSAHAAN PERSEROAN (PERSERO) P.T. TELEKOMUNIKASI INDONESIA Tbk AND SUBSIDIARIES NOTES TO CONSOLIDATED FINANCIAL STATEMENTS(continued) JANUARY 1, 2010, DECEMBER 31, 2010 AND 2011 AND YEARS ENDED DECEMBER 31, 2010 AND 2011 (Figures in tables are presented in billions of Rupiah, unless otherwise stated) |
1. GENERAL(continued)
b. Company’s Board of Commissioners, Directors, Audit Committee, Corporate Secretary and employees(continued)
3. Employees
As of December 31, 2010 and 2011, the Company and its subsidiaries had 26,847 and26,023 employees, respectively.
c. Public offering of securities of the Company
The Company’s shares prior to its Initial Public Offering (“IPO”) totalled 8,400,000,000, consisting of 8,399,999,999 Series B shares and 1 Series A Dwiwarna share, and were 100%-owned by the Government of the Republic of Indonesia (the “Government”). On November 14, 1995, 933,333,000 new Series B shares and 233,334,000 Series B shares owned by the Government were offered to public through IPO and listed on the Indonesia Stock Exchange (“IDX”) (previously the Jakarta Stock Exchange and the Surabaya Stock Exchange) and 700,000,000 Series B shares owned by the Government were offered to the public and listed on the New York Stock Exchange (“NYSE”) and the London Stock Exchange (“LSE”), in the form of American Depositary Shares (“ADS”). There are 35,000,000 ADS and each ADS represents 20 Series B shares at that time.
In December 1996, the Government had a block sale of its 388,000,000 Series B shares, and in 1997, had distributed 2,670,300 Series B shares as incentive to the Company’s stockholders who did not sell their shares within one year from the date of the IPO. In May 1999, the Government further sold 898,000,000 Series B shares.
To comply with Law No. 1/1995 of the Limited Liability Companies, at the Annual General Meeting (“AGM”) of Stockholders of the Company on April 16, 1999, the Company’s stockholders resolved to increase the Company’s issued share capital by distribution of 746,666,640 bonus shares through the capitalization of certain additional paid-in capital, which were distributed to the Company’s stockholders in August 1999. On August 16, 2007, the Law No. 1/1995 of the Limited Liability Companies was amended by the issuing of Law No. 40/2007 of the Limited Liability Companies which became effective at the same date. The Law No. 40/2007 has no effect on the public offering of shares of the Company. The Company has complied with Law No. 40/2007.
In December 2001, the Government had another block sale of 1,200,000,000 shares or 11.9% of the total outstanding Series B shares. In July 2002, the Government sold a further 312,000,000 shares or 3.1% of the total outstanding Series B shares.
At the AGM of Stockholders of the Company dated July 30, 2004, as covered by notarial deed No. 26 of A. Partomuan Pohan, S.H., LLM., the Company’s stockholders approved the Company’s 2-for-1 stock split for Series A Dwiwarna and Series B. For Series A Dwiwarna share with par value of Rp.500, it was split into 1 Series A Dwiwarna share with par value of Rp.250 per share and 1 Series B share with par value of Rp.250 per share. The stock split resulted in an increase of the Company’s authorized capital stock from 1 Series A Dwiwarna share and 39,999,999,999 Series B shares to 1 Series A Dwiwarna share and 79,999,999,999 Series B shares, and issued capital stock from 1 Series A Dwiwarna share and 10,079,999,639 Series B shares to 1 Series A Dwiwarna share and 20,159,999,279 Series B shares. After the stock split, each ADS represented 40 Series B shares.
F-10
Table of Contents |
PERUSAHAAN PERSEROAN (PERSERO) P.T. TELEKOMUNIKASI INDONESIA Tbk AND SUBSIDIARIES NOTES TO CONSOLIDATED FINANCIAL STATEMENTS(continued) JANUARY 1, 2010, DECEMBER 31, 2010 AND 2011 AND YEARS ENDED DECEMBER 31, 2010 AND 2011 (Figures in tables are presented in billions of Rupiah, unless otherwise stated) |
1. GENERAL(continued)
c. Public offering of securities of the Company(continued)
During the EGM of Stockholders of the Company on December 21, 2005, AGM of Stockholders of the Company on June 29, 2007, the AGM of Stockholders of the Company on June 20, 2008, and AGM of Stockholders of the Company on May 19, 2011, the Company’s stockholders approved the phase I, II and III plan, respectively, to repurchase the Company’s issued Series B shares (Note 22).
As of December 31, 2011, all of the Company’s Series B shares were listed on the IDXand73,824,138 ADS shares were listed on the NYSE and LSE (Note 20).
As of December 31, 2011, the Company’s outstanding bonds which was second IDR bond and issued on June 25, 2010 with a nominal amount of Rp.1,005 billion for a five-year period and Rp.1,995 billion for a ten-year period for Series A and Series B, respectively, were listed on the IDX (Note 18b).
d. Subsidiaries
As of January 1, 2010, December 31, 2010 and 2011, the Company has consolidated the subsidiaries which it controls as a result of majority ownership (Notes 2b and 2d):
| | | | | | Percentage of effective ownership interest | | Total assets before elimination | |
Subsidiary/place of incorporation | | Nature of business/date of incorporation or acquisition by the Company | | Date of commercial operation | | January 1, 2010 | | December 31,2010 | | December 31,2011 | | January 1,2010 | | December 31,2010 | | December 31,2011 | |
PT Telekomunikasi Selular(“Telkomsel”)Jakarta, Indonesia | | Telecommunication - provides telecommunication facilities and mobile cellular services using Global System for Mobile Communication (“GSM”) technology/ May 26, 1995 | | 1995 | | 65 | | 65 | | 65 | | 59,208 | | 57,292 | | 58,657 | |
PT Dayamitra Telekomunikasi(“Dayamitra”),Jakarta, Indonesia | | Telecommunication/ May 17, 2001 | | 1995 | | 100 | | 100 | | 100 | | 381 | | 434 | | 3,264 | |
PT Telekomunikasi Indonesia International(“TII”),Jakarta, Indonesia | | Telecommunication/ July 31, 2003 | | 1995 | | 100 | | 100 | | 100 | | 1,374 | | 1,757 | | 2,279 | |
PT Multimedia Nusantara(“Metra”), Jakarta, Indonesia | | Multimedia and line telecommunication services/May 9, 2003 | | 1998 | | 100 | | 100 | | 100 | | 1,530 | | 1,868 | | 1,949 | |
PT Pramindo Ikat Nusantara(“Pramindo”),Jakarta, Indonesia | | Telecommunication construction andservices/ August 15, 2002 | | 1995 | | 100 | | 100 | | 100 | | 1,117 | | 1,199 | | 1,838 | |
PT Infomedia Nusantara(“Infomedia”),Jakarta, Indonesia | | Data and information service – provides telecommunication information services and other information services in the form of print and electronic media and call center services/ September 22,1999 | | 1984 | | 100 (including through 49% ownership by Metra) | | 100 (including through 49% ownership by Metra) | | 100 (including through 49% ownership by Metra) | | 576 | | 647 | | 782 | |
PT Indonusa Telemedia(“Indonusa”), Jakarta, Indonesia | | Pay television and content services/ May 7, 1997 | | 1997 | | 100 (including through 1.25 % Ownership by Metra) | | 100 (including through 0.8 % Ownership by Metra) | | 100 (including through 0.46 % Ownership by Metra) | | 202 | | 343 | | 714 | |
F-11
Table of Contents |
PERUSAHAAN PERSEROAN (PERSERO) P.T. TELEKOMUNIKASI INDONESIA Tbk AND SUBSIDIARIES NOTES TO CONSOLIDATED FINANCIAL STATEMENTS(continued) JANUARY 1, 2010, DECEMBER 31, 2010 AND 2011 AND YEARS ENDED DECEMBER 31, 2010 AND 2011 (Figures in tables are presented in billions of Rupiah, unless otherwise stated) |
1. GENERAL(continued)
d. Subsidiaries(continued)
| | | | | | Percentage of effective ownership interest | | Total assets before elimination | |
Subsidiary/place of incorporation | | Nature of business/date of incorporation or acquisition by the Company | | Date of commercial operation | | January 1,2010 | | December 31,2010 | | December 31,2011 | | January 1,2010 | | December 31,2010 | | December 31,2011 | |
PT Graha Sarana Duta(“GSD”), Jakarta, Indonesia | | Leasing of offices and providing building management and maintenance services, civil consultant and developer/ April 25, 2001 | | 1982 | | 100 | | 100 | | 100 | | 177 | | 261 | | 383 | |
PT Napsindo Primatel(“Napsindo”), Jakarta, Indonesia | | Telecommunication - provides Network Access Point (NAP), Voice Over Data (VOD) and other related services/ December 29, 1998 | | 1999; ceased operation on January 13, 2006 | | 60 | | 60 | | 60 | | 5 | | 5 | | 5 | |
(i) Indonusa
On March 8, 2011, based on the Circular Meeting of Stockholders of Indonusaas covered by notarial deed No. 18 of Dr. A. Partomuan Pohan, S.H., LLM., dated March 14, 2011, the Company agreed to the conversion of debt of Rp.175 billion (debt to equity swap) into shares issued and fully paid capital to become Rp.552 billion.
(ii) GSD
On December 27, 2011, GSD established a subsidiary with Yayasan Kesehatan (“Yakes”), an affiliated company of the Company, called PT Telkom Landmark Tower (“TLT”) with 55% ownership. TLT will engage in providing construction and trading, services for property development and management.As of December 31, 2011, the deed of establishment was yet to be approved by the Minister of Justice of the Republic of Indonesia. For the year ended December 31, 2011, TLT had no financial or operational activities.
e. Authorization of the consolidated financial statements
The consolidated financial statements were authorized for issue by the Board of Directors onMarch 30, 2012.
2. SUMMARY OF SIGNIFICANT ACCOUNTING POLICIES
The consolidated financial statements have been prepared in accordance with IFRS as issued by the IASB. These are the Company and its subsidiaries’ first consolidated financial statements prepared in accordance with IFRS and IFRS 1,First-time Adoption of International Financial Reporting Standards has been applied.
An explanation of how the transition to IFRS has affected the consolidated equity, financial performance and cash flows of the Company and its subsidiaries is provided in Note 44.
a. Basis of preparation of financial statements
The consolidated financial statements, except for the consolidated statements of cash flows, are prepared on the accrual basis of accounting. The measurement basis used is historical cost, except for available-for-sale financial assets.
F-12
Table of Contents |
PERUSAHAAN PERSEROAN (PERSERO) P.T. TELEKOMUNIKASI INDONESIA Tbk AND SUBSIDIARIES NOTES TO CONSOLIDATED FINANCIAL STATEMENTS(continued) JANUARY 1, 2010, DECEMBER 31, 2010 AND 2011 AND YEARS ENDED DECEMBER 31, 2010 AND 2011 (Figures in tables are presented in billions of Rupiah, unless otherwise stated) |
2. SUMMARY OF SIGNIFICANT ACCOUNTING POLICIES(continued)
a. Basis of preparation of financial statements(continued)
The consolidated statements of cash flows are prepared using the direct method and present the changes in cash and cash equivalents from operating, investing and financing activities.
Figures in the consolidated financial statements are rounded to and presented in billions of Indonesian Rupiah (“Rp.”), unless otherwise stated.
b. Principles of consolidation
The consolidated financial statements include the assets and liabilities of the Company and its subsidiaries in which the Company, directly or indirectly has ownership of more than half of the voting power and has the ability to govern the financial and operating policies of the entity unless, in exceptional circumstances, it can be clearly demonstrated that such ownership does not constitute control, or the Company has the ability to control the entity, even though the ownership is less than or equal to half of the voting power. Subsidiaries are consolidated from the date on which effective control is obtained and that are no longer consolidated from the date control ceases.
Intercompany balances and transactions have been eliminated in the consolidated financial statements.
c. Transactions with related parties
The Company and its subsidiaries have transactions with related parties. The definition of related parties used is in accordance with International Accounting Standards (“IAS”) 24,Related Party Disclosures. The parties which are considered as a related party are a person or entity that is related to the entity that is preparing its financial statements.
The Company and its subsidiaries have applied the exemption in IAS 24 on disclosing the extent of detail in relation to related party transactions and outstanding balances, including commitments, with government-related entities.
Key management personnel are identified as the persons having authority and responsibility for planning, directing and controlling the activities of the entity, directly or indirectly, including any director (whether executive or otherwise) of the Company and its subsidiaries. The related-party status extends to the key management of the subsidiaries to the extent they direct the operations of subsidiaries with minimal involvement from the Company’s management.
d. Business combinations
The acquisition of businesses are accounted for using the acquisition method of accounting. The consideration transferred is measured at fair value, which is the aggregate of the fair values of the assets transferred, liabilities incurred or assumed and the equity instruments issued in exchange for control of the acquiree. Acquisition related costs are expensed as incurred. The acquirees identifiable assets and liabilities are recognized at their fair value at the acquisition date.
F-13
Table of Contents |
PERUSAHAAN PERSEROAN (PERSERO) P.T. TELEKOMUNIKASI INDONESIA Tbk AND SUBSIDIARIES NOTES TO CONSOLIDATED FINANCIAL STATEMENTS(continued) JANUARY 1, 2010, DECEMBER 31, 2010 AND 2011 AND YEARS ENDED DECEMBER 31, 2010 AND 2011 (Figures in tables are presented in billions of Rupiah, unless otherwise stated) |
2. SUMMARY OF SIGNIFICANT ACCOUNTING POLICIES(continued)
d. Business combinations(continued)
Goodwill arising on acquisition is recognized as an asset and measured at cost representing the excess of the aggregate of the consideration, the amount of any non-controlling interests in the acquiree, and the fair value of the acquirers previously held equity interest in the acquiree (if any) over the net of the fair values of the identifiable assets and liabilities at the date of acquisition.
Non-controlling interests that entitle their holders to a proportionate share of the entity’s net assets in the event of liquidation may be initially measured either at fair value or at the non-controlling interests proportionate share of the recognized amounts of the acquirees identifiable net assets. The choice of measurement basis is made on a transaction by transaction basis.
When the consideration in a business combination includes contingent consideration, it is measured at its acquisition date fair value. Contingent consideration is classified either as equity or a financial liability. Amounts classified as a financial liability are subsequently remeasured to fair value with changes in fair value recognized in profit or loss when adjustments are recorded outside the measurement period. Changes in the fair value of the contingent consideration that qualify as measurement period adjustments are adjusted retrospectively, with corresponding adjustments against goodwill. Measurement period adjustments are adjustments that arise from additional information obtained during the measurement period, which cannot exceed one year from the acquisition date, about facts and circumstances that existed at the acquisition date
For the purpose of impairment testing, assets are grouped at the lowest levels for which there are separately identifiable cash flows, known as cash-generating unit. If the recoverable amount of the cash-generating unit is less than the carrying amount of the unit, the impairment loss is allocated first to reduce the carrying amount of any goodwill allocated to the unit and then to the other assets of the unit pro-rata on the basis of the carrying amount of the asset in the unit. Impairment lossesrecognizedfor goodwill are not reversed in a subsequent period.
Recoverable amount is the higher of fair value less costs to sell and value in use. In assessing the value in use, the estimated future cash flows are discounted to the present value using a pre-tax discount rate that reflects current market assesments of the time value of money and the risks spesific to the asset for which the estimate of future cash flows have not been adjusted.
e. Cash and cash equivalents
Cash and cash equivalents consist of cash on hand and in banks and all unrestricted time deposits with maturities of not more than three months from the date of placement.
f. Investments in associated companies
Investments in companies where the Company has 20% to 50% of the voting rights, and through which the Company exerts significant influence, but not control, over the financial and operating policies are accounted for using the equity method after initially being recognized at cost. Under this method, theCompany recognizes the Company's proportionate share in the income or loss of the associated company from the date that significant influence commences until the date that significant influence ceases. When the Company’s share of loss exceeds the carrying amount of the associated company, the carrying amount is reduced to nil and recognition of further losses is discontinued except to the extent that the Company has incurred legal or constructive obligations or made payments on behalf of the associate.
F-14
Table of Contents |
PERUSAHAAN PERSEROAN (PERSERO) P.T. TELEKOMUNIKASI INDONESIA Tbk AND SUBSIDIARIES NOTES TO CONSOLIDATED FINANCIAL STATEMENTS(continued) JANUARY 1, 2010, DECEMBER 31, 2010 AND 2011 AND YEARS ENDED DECEMBER 31, 2010 AND 2011 (Figures in tables are presented in billions of Rupiah, unless otherwise stated) |
2. SUMMARY OF SIGNIFICANT ACCOUNTING POLICIES(continued)
f. Investments in associated companies(continued)
The Company and its subsidiaries determine at each reporting date whether there is any objective evidence that the investment in the associate is impaired. If in this case, the Company and its subsidiaries calculate the amount of impairment as the difference between the recoverable amount of the associates and its carrying value and recognises the amount adjacent to the share of the profit/(loss) ofassociates company in the consolidated statement of comprehensive income.
These assets are included in long-term investments in the consolidated statement of financial position.
g. Trade and other receivables
Trade and other receivables are recognized initially at fair value and subsequently measured at amortized cost, less provision for impairment. This provision for impairment is made based on management’s evaluation of the collectability of outstanding amounts. Accounts are written off in the period during which they are determined to be uncollectible.
h. Inventories
Inventories consist of components and modules, which are subsequently expensed or transferred to property, plant and equipment upon use. Components and modules represent telephone terminals, cables, transmission installation spare parts and other spare parts. Inventories also include Subscriber Identification Module (“SIM”) cards, Removable User Identity Module (“RUIM”) cards, handsets, set top box, wireless broadband modem and prepaid voucher blanks, which are expensed upon sale.The costs of inventories comprise of the purchase price, import duties, other taxes, transport, handling and other costs directly attributable to the it’s acquisition.Inventories are stated at the lower of cost and net realizable value.Net realizable value is the estimate of selling price less the costs to sell.
Cost is determined using the weighted average method for components, SIM cards, RUIM cards, handsets, set top box, wireless broadband modem andprepaid voucher blanks, and the specific-identification method for modules.
The amount of any write-down of inventories below cost to net realizable value and all losses of inventories shall be recognized as an expense in the period in which the write-down or loss occurs. The amount of any reversal of any write-down of inventories, arising from an increase in net realizable value, shall be recognized as a reduction in the amount of general and administrative expense in the period in which the reversal occurs.
Provision for obsolescence is primarily based on the estimated forecast of future usage of these items.
i. Prepaid expenses
Prepaid expenses are amortized over their future beneficial periods using the straight-line method.
j. Assets held for sale
Assets (or disposal groups) are classified as assets held for sale when their carrying amount is to be recovered principally through a sale transaction rather than through continuing use and a sale is considered highly probable. They are stated at the lower of carrying amount and fair value less costs to sell.
Assets that meet the criteria to be classified as held for sale are reclassified from property, plant and equipment and depreciation on such assets is ceased.
F-15
Table of Contents |
PERUSAHAAN PERSEROAN (PERSERO) P.T. TELEKOMUNIKASI INDONESIA Tbk AND SUBSIDIARIES NOTES TO CONSOLIDATED FINANCIAL STATEMENTS(continued) JANUARY 1, 2010, DECEMBER 31, 2010 AND 2011 AND YEARS ENDED DECEMBER 31, 2010 AND 2011 (Figures in tables are presented in billions of Rupiah, unless otherwise stated) |
2. SUMMARY OF SIGNIFICANT ACCOUNTING POLICIES(continued)
k. Intangible assets
Intangible assets comprised of intangible assets from subsidiaries or business acquisitions, licenses (3G and Broadband Wireless Access) and computer software. Intangible assets shall be recognized if it is probable that the expected future economic benefits that are attributable to each asset will flow to the Company and its subsidiaries and the cost of the asset can be reliably measured.
Intangible assets are stated at cost less accumulated amortization and impairment, if any. Intangible assets are amortized over their useful lives. The Company and its subsidiaries estimate the recoverable value of their intangible assets. When the carrying amount of an asset exceeds its estimated recoverable amount, the asset is written-down to its estimated recoverable amount.
Intangible assets are depreciated using the straight-line method, based on the estimated useful lives of the assets as follows:
| Years |
Licenses | 10 |
Other intangible assets | 2-10 |
l. Property, plant and equipment - direct acquisitions
Property, plant and equipment directly acquired are stated at cost, less accumulated depreciation and impairment losses.
The cost of the assets include: (a) purchase price, (b) any costs directly attributable to bringing the asset to its location and condition and (c) the initial estimate of the costs of dismantling and removing the item and restoring the site on which it is located. Each part of an item of property, plant and equipment with a cost that is significant in relation to the total cost of the item shall be depreciated separately.
Property, plant and equipment are depreciated and amortized using the straight-line method, based on the estimated useful lives of the assets as follows:
| Years |
Land rights | 50 |
Buildings | 20-40 |
Leasehold improvements | 3-7 |
Switching equipment | 5-15 |
Telegraph, telex and data communication equipment | 5-15 |
Transmission installation and equipment | 5-25 |
Satellite, earth station and equipment | 3-20 |
Cable network | 5-25 |
Power supply | 3-10 |
Data processing equipment | 3-10 |
Other telecommunications peripherals | 5 |
Office equipment | 2-5 |
Vehicles | 5-8 |
Customer Premise Equipment (“CPE”) | 10 |
Other equipment | 5 |
| |
Depreciation or amortization method, useful lives and residual value of an asset should be reviewed at least at each financial year-end and adjusted if appropriate. |
F-16
��
Table of Contents |
PERUSAHAAN PERSEROAN (PERSERO) P.T. TELEKOMUNIKASI INDONESIA Tbk AND SUBSIDIARIES NOTES TO CONSOLIDATED FINANCIAL STATEMENTS(continued) JANUARY 1, 2010, DECEMBER 31, 2010 AND 2011 AND YEARS ENDED DECEMBER 31, 2010 AND 2011 (Figures in tables are presented in billions of Rupiah, unless otherwise stated) |
2. SUMMARY OF SIGNIFICANT ACCOUNTING POLICIES(continued)
l. Property, plant and equipment - direct acquisitions(continued)
The Company and its subsidiaries periodically evaluate its property, plant and equipment for impairment, whenever events and circumstances indicate that the carrying amount of the assets may not be recoverable. When the carrying amount of an asset exceeds its estimated recoverable amount, the asset is written-down to its estimated recoverable amount, which is determined based upon the greater of its fair value less cost to sell or value in use.
Spare parts and servicing equipment are carried as inventory and recognized inprofit or lossas consumed. Major spare parts and stand-by equipment that are expected to be used for more than 12 months are recorded as part of property, plant and equipment.
When assets are retired or otherwise disposed of, their cost and the related accumulated depreciation are eliminated from the consolidated statement of financial position, and the resulting gains or losses on the disposal or sale of property, plant and equipment are recognized in the consolidated statement of comprehensive income.
Certain computer hardware can not be used without the availability of certain computer software. In such circumstance, the computer software is recorded as part of the computer hardware. If any computer software is independent from its computer hardware, it is recorded as part of intangible assets.
The cost of maintenance and repairs is charged to the consolidatedstatement of comprehensive incomeas incurred. Significant renewals and betterments are capitalized.
Property under construction is stated at cost until construction is completed, at which time it is reclassified to the specific property, plant and equipment account to which it relates. During the construction period until the property is ready for its intended use or sale, borrowing costs, which include interest expense and foreign currency exchange differences incurred to finance the construction of the asset, are capitalized in proportion to the average amount of accumulated expenditures during the period. Capitalization of borrowing cost ceases when the construction has been completed and the asset is ready for its intended use.
Equipment temporarily unused is reclassified into equipment not used in operation and depreciated over their estimated useful life using straight-line method.
m. Leases
A lease is classified as a finance lease or operating lease based on the substance not the form of the contract. Property, plant and equipment under finance lease is recognized if the lease transfers substantially all the risks and rewards incidental to ownership.
Finance leases are recognized as assets and liabilities in the statement of financial position as the amounts equal to the fair value of the leased assets or, if lower, the present value of the minimum lease payments. Any initial direct costs of the Company and its subsidiaries are added to the amount recognized as an asset.
Minimum lease payments shall be apportioned between the finance charge and the reduction of the outstanding liability. The finance charge shall be allocated to each period during the lease term so as to produce a constant periodic rate of interest on the remaining balance of the liability. Contingent rents shall be charged as expenses in the periods in which they are incurred.
Leased assets are depreciated using the same method with and based on the useful lives as estimated for directly acquired property, plant and equipment. However, if there is no reasonable certainty that the Company and its subsidiaries will obtain ownership by the end of the lease term, the leased assets are fully depreciated over the shorter of the lease term and their economic useful lives.
F-17
Table of Contents |
PERUSAHAAN PERSEROAN (PERSERO) P.T. TELEKOMUNIKASI INDONESIA Tbk AND SUBSIDIARIES NOTES TO CONSOLIDATED FINANCIAL STATEMENTS(continued) JANUARY 1, 2010, DECEMBER 31, 2010 AND 2011 AND YEARS ENDED DECEMBER 31, 2010 AND 2011 (Figures in tables are presented in billions of Rupiah, unless otherwise stated) |
2. SUMMARY OF SIGNIFICANT ACCOUNTING POLICIES(continued)
m. Leases(continued)
Leasing arrangements that do not meet the above criteria are accounted for as operating leases for which payments are charged as an expense on the straight-line basis over the lease period.
n. Deferred charges for land rights
Costs incurred to process and extend land rights held by the Company and its subsidiaries are deferred and amortized using the straight-line method over the term of the land rights.
o. Trade payables
Trade payables are obligations to pay for goods or services that have been acquired in the ordinary course of business from suppliers. Trade payables are classified as current liabilities if payment is due within one year or less (or in the normal operating cycle of the business if longer). If not, they are presented as non-current liabilities.
Trade payables are recognized initially at fair value and subsequently measured at amortized cost using the effective interest method.
p. Borrowings
Borrrowings are recognized initially at fair value, net of transaction costs incurred. Borrowings are subsequently carried at amortized cost; any difference between the proceeds (net of transaction costs) and the redemption value is recognized in the consolidated statement of comprehensive income over the period of the borrowings using the effective interest method.
Fees paid on the establishment of loan facilities are recognized as transaction costs of the loan to the extent that it is probable that some or all of the facility will be drawn down. In this case, the fee is deferred until the draw-down occurs. To the extent there is no evidence that it is probable that some or all of the facility will be drawn down, the fee is capitalized as a pre-payment for liquidity services and amortized over the period of the facility which it relates.
q. Foreign currency translation
The functional currency of the Company and its subsidiaries is the Indonesian Rupiah and the accounting records of the Company and its subsidiaries are maintained in Indonesian Rupiah. Transactions in foreign currencies are translated into Indonesian Rupiah at the rates of exchange prevailing at transaction date. At the consolidated statement of financial position date, monetary assets and monetary liabilities balances denominated in foreign currencies are translated into Indonesian Rupiah based on the buy and sell rates quoted by Reuters prevailing at the consolidated statement of financial position date as follows:
| Exchange rate as of |
| | January 1, 2010 | | December 31,2010 | | December 31, 2011 | |
| | Buy | | Sell | | Buy | | Sell | | Buy | | Sell | |
United States Dollars (“US$”) 1 | | 9,420 | | 9,430 | | 9,005 | | 9,015 | | 9,060 | | 9,075 | |
Euro 1 | | 13,574 | | 13,591 | | 12,011 | | 12,025 | | 11,706 | | 11,727 | |
Yen 1 | | 102.05 | | 102.20 | | 110.68 | | 110.82 | | 116.69 | | 116.96 | |
The resulting foreign exchange gains or losses, realized and unrealized, are credited or charged to the consolidated statement of comprehensive income of the current year, except for foreign exchange differences incurred on borrowings during the construction of qualifying assets which are capitalized to the extent that the borrowings can be attributed to the construction of those qualifying assets (Note 2l).
F-18
Table of Contents |
PERUSAHAAN PERSEROAN (PERSERO) P.T. TELEKOMUNIKASI INDONESIA Tbk AND SUBSIDIARIES NOTES TO CONSOLIDATED FINANCIAL STATEMENTS(continued) JANUARY 1, 2010, DECEMBER 31, 2010 AND 2011 AND YEARS ENDED DECEMBER 31, 2010 AND 2011 (Figures in tables are presented in billions of Rupiah, unless otherwise stated) |
2. SUMMARY OF SIGNIFICANT ACCOUNTING POLICIES(continued)
r. Revenue and expense recognition
i. Fixed line telephone revenues
Revenues from fixed line installationsare deferred including incremental costs and recognized as income over the expected term of the customer relationships. Based on reviews of historical information and customer trends, the Company determined the expected term of the customer relationships in 2011 and 2010 is 10 years, respectively. Revenues from usage charges are recognized as customers incur the charges. Monthly subscription charges are recognized as revenues when incurred by subscribers.
ii. Cellular and fixed wireless telephone revenues
Revenues from postpaid service, which consist of usage and monthly charges, are recognized as follows:
· Airtime and charges for value added services are recognized based on usage by subscribers.
· Monthly subscription charges are recognized as revenues when incurred by subscribers.
Revenues from prepaid card subscribers, which consist of the sale of starter packs (also known as SIM cards in the case of cellular and RUIM in the case of fixed wireless telephone and start-up load vouchers) and pulse reload vouchers, are recognized as follows:
· Sale of SIM and RUIM cards are recognized as revenue upon delivery of the starter packs to distributors, dealers or directly to customers.
· Sale of pulse reload vouchers (either bundled in starter packs or sold as separate items) are recognized initially as unearned income and recognized proportionately as usage revenue based on duration and total of successful calls made and the value added services used by the subscribers or the expiration of the unused stored value of the voucher.
· Unutilized promotional credits are netted against unearned income.
iii. Interconnection revenues
The revenues from network interconnection with other domestic and international telecommunications carriers are recognized monthly on the basis of the actual recorded traffic for the month. Interconnection revenues consist of revenues derives from other operator’s subscriber call to the Company and its subsidiary operator’s subscribers (incoming) and calls between subscribers of other operators through the Company and its subsidiary’s network (transit).
iv. Data, internet and information technology services revenues
Revenues from data communication and internet are recognized based onservice activity and performance which is measured by duration of internet usage or based on the fixed amount of charges depending on the arrangements with customers.
F-19
Table of Contents |
PERUSAHAAN PERSEROAN (PERSERO) P.T. TELEKOMUNIKASI INDONESIA Tbk AND SUBSIDIARIES NOTES TO CONSOLIDATED FINANCIAL STATEMENTS(continued) JANUARY 1, 2010, DECEMBER 31, 2010 AND 2011 AND YEARS ENDED DECEMBER 31, 2010 AND 2011 (Figures in tables are presented in billions of Rupiah, unless otherwise stated) |
2. SUMMARY OF SIGNIFICANT ACCOUNTING POLICIES(continued)
r. Revenue and expense recognition(continued)
iv. Data, internet and information technology services revenues
Revenues from sales, installation and implementation of computer software and hardware, computer data network installation service and installation are recognizedwhen the goods rendered to customers or the installation take place.
Revenue from computer software development service is recognized using the percentage of completion method.
v. Revenues from network
Revenues from network consist of revenues from leased lines and satellite transponder leases which is recognized over the period in which the services are rendered.
vi. Other telecommunication services revenues
Revenues from other telecommunications services consist ofRevenue-Sharing Arrangements (“RSA”), service concession arrangement and sales of other telecommunication services or goods.
The RSA are recorded in a manner similar to finance leases where the property, plant and equipment and obligation under RSA are reflected on the consolidatedstatement of financial position. All revenues generated from the RSA are recorded as a component of revenues, while a portion of the investors’ share of the revenues from the RSA is recorded as finance costs with the balance treated as a reduction of the obligation under RSA.
Revenue relating to construction or upgrade services under a service concession arrangement is recognized based on the stage of completion of the work performed. Operation or service revenue is recognized in the period in which the service is provided. When more than one services are provided in the service concession arrangement, the consideration received is allocated by reference to the relative values of the services.
Revenues from sales of other telecommunication services or goods are recognized upon completion of services and or delivery of goods to customers.
vii. Multiple-element arrangements
Where two or more revenue generating activities or deliverables are sold under a single arrangement, each deliverable that is considered to be a separate unit of accounting is accounted for separately. The total revenue is allocated to each separately identifiable component based on therelativefair value of each component and the appropriate revenue recognition criteria are applied to each component as described above.
viii. Expenses
Expenses are recognized on an accruals basis.
s. Employee benefits
i. Short term employee benefits
All short term employee benefits which consist of salaries and related benefits, vacation pay, incentives and other short term benefits shall be recognized as expense on undiscounted basis when employees have rendered service to the Company and its subsidiaries.
F-20
Table of Contents |
PERUSAHAAN PERSEROAN (PERSERO) P.T. TELEKOMUNIKASI INDONESIA Tbk AND SUBSIDIARIES NOTES TO CONSOLIDATED FINANCIAL STATEMENTS(continued) JANUARY 1, 2010, DECEMBER 31, 2010 AND 2011 AND YEARS ENDED DECEMBER 31, 2010 AND 2011 (Figures in tables are presented in billions of Rupiah, unless otherwise stated) |
2. SUMMARY OF SIGNIFICANT ACCOUNTING POLICIES(continued)
s. Employee benefits(continued)
ii. Pension and post-employment health care benefit plans
The net obligations in respect of the defined pension benefit and post-employment health care benefit plans are calculated at the present value of estimated future benefits that the employees have earned in return for their service in the current and prior periods, less the fair value of plan assets and as adjusted for unrecognized actuarial gains or losses and unrecognized past service cost. The calculation is performed by an independent actuary using the projected unit credit method. The present value of the defined benefit obligation is determined by discounting the estimated future cash outflows using interest rates of government bonds that are denominated in the currency in which the benefits will be paid and that have terms to maturity approximating the terms of the related post-employment benefits obligation. Government bonds are used as there is no deep market for high quality corporate bonds.
According to IAS 19, the amount of prepaid pension costs that can be recognized in statement of financial position is limited to the total of (i) any unrecognized past service costs; and (ii) any reduction in future contribution to the plan.
The Company and its subsidiaries elected the option provided in IAS 19, that allows actuarial gains or losses arising from experience adjustments and changes in actuarial assumptions to be charged or credited to other comprehensive income. Prior service cost is recognized immediately if vested or amortized over the vesting period. All other expenses related to the defined benefits are charged to personnel expenses in profit or loss.
For defined contribution plans, the regular contributions constitute net periodic costs for the year in which they are due and as such are included in staff costs as they become payable.
iii. Long Service Awards (“LSA”) and Long Service Leave (“LSL”)
Employees of Telkomsel are entitled to receive certain cash awardsor certain numbers of days leave benefits based on length of service requirements. LSA are either paid at the time the employees reach certain anniversary dates during employment, or at the time of termination.LSL is either a certain number of days leave benefit or cash, subject to approval by management, provided to employee who has met the requisite number of years of service and with a certain minimum age.
Actuarial gains or losses arising from experience and changes in actuarial assumptions are charged immediately as other comprehensive incometo the consolidated statements of comprehensive income.
The obligation with respect to LSA and LSL is calculated by an independent actuary using the projected unit credit method.
iv. Early retirement benefits
Early retirement benefits are accrued at the time the Company makes a commitment to provide early retirement benefits as a result of an offer made in order to encourage voluntary redundancy. A commitment to a termination arises when, and only when a detailed formal plan for the early retirement cannot be withdrawn.
v. Pre-retirement benefits
Employees of the Company are entitled to a benefit during a pre-retirement period in which they are inactive for 6 months prior to their normal retirement age of 56 years. During the pre-retirement period, the employees still receive benefits provided to active employees, which include, but are not limited to regular salary, health care, annual leave, bonus and other benefits. Benefits provided to employees which enter pre-retirement period are calculated by an independent actuary using the projected unit credit method.
F-21
Table of Contents |
PERUSAHAAN PERSEROAN (PERSERO) P.T. TELEKOMUNIKASI INDONESIA Tbk AND SUBSIDIARIES NOTES TO CONSOLIDATED FINANCIAL STATEMENTS(continued) JANUARY 1, 2010, DECEMBER 31, 2010 AND 2011 AND YEARS ENDED DECEMBER 31, 2010 AND 2011 (Figures in tables are presented in billions of Rupiah, unless otherwise stated) |
2. SUMMARY OF SIGNIFICANT ACCOUNTING POLICIES(continued)
s. Employee benefits(continued)
vi. Other post-employment benefits
Employees are entitled to home leave passage benefits and final housing facility benefits to their retirement age of 56 years. Those benefits are calculated by an independent actuary using the projected unit credit method.
Gains or losses on curtailment are recognized when there is a commitment to make a material reduction in the number of employees covered by a plan or when there is an amendment of a defined benefit plan terms such as that a material element of future services to be provided by current employees will no longer qualify for benefits, or will qualify only for reduced benefits.
Gains or losses on settlement are recognized when there is a transaction that eliminates all further legal or constructive obligation for part or all of the benefits provided under a defined benefit plan.
t. Income tax
Income tax is charged or credited to the consolidated statement of comprehensive income, except to the extent that it relates to items recognized directly in equity, in which case income tax is also charged or credited directly to equity.
The current tax assets and liabilities are measured at the amount expected to be recovered or paid using the tax rates and tax laws that have been enacted at each reporting date. Management periodically evaluates positions taken in tax returns with respect to situations in which applicable tax regulation is subject to interpretation. Where appropriate, it establishes provisions based on the amounts expected to be paid to the tax authorities.
The Company and its subsidiaries recognize deferred tax assets and liabilities for temporary differences between the financial and tax bases of assets and liabilities at each reporting date. The Company and its subsidiaries also recognize deferred tax assets resulting from the recognition of future tax benefits, such as the benefit of tax losses carried forward, to the extent their future realization is probable. Deferred tax assets and liabilities are measured using enacted or substantively enacted tax rates and tax laws at each reporting date which are expected to apply to taxable income in the years in which those temporary differences are expected to be recovered or settled.
Deferred tax assets and liabilities are offset in the consolidated statement of financial position, except if these are for different legal entities, in the same manner the current tax assets and liabilities are presented.
Amendment to taxation obligations are recorded when an assessment is received or if appealed against, when the results of the appeal are determined.
u. Financial Instruments
The Company and its subsidiaries classify financial instruments into financial assets and financial liabilities.Financial assets and liabilities are recognized initially at fair value including transaction costs. They are subsequently measured either at fair value or amortized cost using the effective interest method in accordance with their classification.
F-22
Table of Contents |
PERUSAHAAN PERSEROAN (PERSERO) P.T. TELEKOMUNIKASI INDONESIA Tbk AND SUBSIDIARIES NOTES TO CONSOLIDATED FINANCIAL STATEMENTS(continued) JANUARY 1, 2010, DECEMBER 31, 2010 AND 2011 AND YEARS ENDED DECEMBER 31, 2010 AND 2011 (Figures in tables are presented in billions of Rupiah, unless otherwise stated) |
2. SUMMARY OF SIGNIFICANT ACCOUNTING POLICIES(continued)
u. Financial Instruments(continued)
i. Financial assets
The Company and its subsidiaries classify their financial assets as (i) financial assets at fair value through profit and loss, (ii) loans and receivables, (iii) held-to-maturity financial assets or (iv) available-for-sale financial assets. The classification depends on the purpose for which the financial assets were acquired. Management determines the classification of its financial assets at initial recognition.
The Company’s financial assets include cash and cash equivalents, avalaible-for-sale financial assets, trade and other receivables, other current financial assets and other non-current financial assets.
a. Financial assets at fair value through profit or loss
Financial assets at fair value through profit or loss are financial assets classified as held for trading. A financial asset is classified as held for trading if it is acquired principally for the purpose of selling or repurchasing it in the near term and for which there is evidence of a recent actual pattern of short term profit taking. No financial assets were classified as financial assets at fair value through profit and loss as of January 1, 2010, December 31, 2010 and December 31, 2011.
b. Loans and receivables
Loans and receivables are non-derivative financial assets with fixed or determinable payments that are not quoted in an active market. Loans and receivables consist of, among other things, cash and cash equivalents, trade and other receivables, other current financial assets and other non-current financial assets.
These are initially recognized at fair value including transaction costs and subsequently measured at amortized cost, using the effective interest method.
c. Held-to-maturity financial assets
Held-to-maturity investments are non-derivative financial assets with fixed or determinable payments and fixed maturities that management has the positive intention and ability to hold to maturity, other than:
a) those that the Company upon initial recognition designates as at fair value through profit or loss;
b) those that the Company designates as available for sale; and
c) those that meet the definition of loans and receivables.
No financial assets were classified as held-to-maturity financial assets as of January 1, 2010, December 31, 2010 and December 31,2011.
d. Available-for-sale financial assets
Available-for-sale investments are non-derivative financial assets that are intended to be held for indefinite period of time, which may be sold in response to needs for liquidity or changes in interest rates, exchange rates or that are not classified as loans and receivables, held-to-maturity investments or financial assets at fair value through profit or loss.Available-for-salefinancialassets consist of available-for-sale securities which are recorded as available-for-sale financial assets.
The Company and its subsidiaries use settlement date accounting for regular purchases and sales of financial assets.
F-23
Table of Contents |
PERUSAHAAN PERSEROAN (PERSERO) P.T. TELEKOMUNIKASI INDONESIA Tbk AND SUBSIDIARIES NOTES TO CONSOLIDATED FINANCIAL STATEMENTS(continued) JANUARY 1, 2010, DECEMBER 31, 2010 AND 2011 AND YEARS ENDED DECEMBER 31, 2010 AND 2011 (Figures in tables are presented in billions of Rupiah, unless otherwise stated) |
2. SUMMARY OF SIGNIFICANT ACCOUNTING POLICIES(continued)
u. Financial Instruments(continued)
i. Financial assets(continued)
d. Available-for-sale financial assets (continued)
Investments in available-for-sale securities and trading securities are stated at fair value. Unrealized holding gains or losses on available-for-sale securities are excluded from income of the current year and are reported as a separate component in the equity section until realized. Realized gains or losses from the sale of available-for-sale securities are recognized in the consolidated statements of comprehensiveincome, and are determined on a specific-identification basis. A decline in the fair value of any available-for-sale securities below cost that is deemed to be other-than-temporary and is charged to the consolidated statements of comprehensive income.
Gains or losses arising from changes in fair value of the trading securities are presented in the income statement within other (expenses) income in the period in which they arise.
ii. Financial liabilities
The Company and its subsidiaries classify their financial liabilities as (i) financial liabilities at fair value through profit or loss or (ii) financial liabilities measured at amortized cost.
The Company’s financial liabilities include trade and other payable, accrued expenses and other borrowings.
a. Financial liabilities at fair value through profit or loss
Financial liabilities at fair value through profit or loss are financial liabilities classified as held for trading. A financial liability is classified as held for trading if it is acquired principally for the purpose of selling or repurchasing it in the near term and for which there is evidence of a recent actual pattern of short term profit taking.
No financial liabilities were categorized as held for trading as of January 1, 2010, December 31, 2010 and 2011.
b. Financial liabilities measured at amortized cost
Financial liabilities that are not classified as at fair value through profit and loss fall into this category and are measured at amortized cost. Financial liabilities measured at amortized cost are among other things, trade and other payables, accrued expenses and other borrowings.
iii. Offsetting financial instruments
Financial assets and liabilities are offset and the net amount is reported in the statement of financial position when there is a legally enforceable right to offset the recognized amounts and there is an intention to settle on a net basis, or realise the asset and settle the liability simultaneously.
v. Treasury stock
Reacquired Company’s stock is accounted for at its reacquisition cost and classified as “Treasury Stock” and presented as a deduction to equity. The cost of treasury stock sold is accounted for using the weighted average method. The difference resulting from the cost and the proceeds from the sale of treasury stock is credited to “Additional Paid-in Capital”.
F-24
Table of Contents |
PERUSAHAAN PERSEROAN (PERSERO) P.T. TELEKOMUNIKASI INDONESIA Tbk AND SUBSIDIARIES NOTES TO CONSOLIDATED FINANCIAL STATEMENTS(continued) JANUARY 1, 2010, DECEMBER 31, 2010 AND 2011 AND YEARS ENDED DECEMBER 31, 2010 AND 2011 (Figures in tables are presented in billions of Rupiah, unless otherwise stated) |
2. SUMMARY OF SIGNIFICANT ACCOUNTING POLICIES(continued)
w. Dividends
Dividend distribution to the Company’s stockholders is recognized as liability in the Company’s consolidated financial statements in the period in which the dividends are approved by the Company’s stockholders. For interim dividends, the Company recognized them as liability based on the Board of Director’s decision with the approval from the Board of Commissioners.
x. Earnings per share and earnings per ADS
Basic earnings per share are computed by dividing income for the year attributable to owners of the parent by the weighted average number of shares outstanding during the year. Income per ADS is computed by multiplying basic earnings per share by 40, the number of shares represented by each ADS.
The Company does not have potentially dilutive ordinary shares
y. Segment information
The Company and its subsidiaries' segment information is presented based upon identified operating segments. An operating segment is a component of an entity: a)that engages in business activities from which it may earn revenues and incur expenses (including revenues and expenses relating to transactions with other components of the same entity); b) whose operating results are regularly reviewed by Company and its subsidiaries chief operating decision maker (“CODM”)i.e. Directors to make decisions about resources to be allocated to the segment and assess its performance, and c) for which discrete financial information is available.
z. Critical Accounting Estimates and Judgements
Estimates and judgements are continually evaluated and are based on historical experience and other factors, including expectations of future events that are believed to be reasonable under the circumstances.
The Company and its subsidiaries make estimates and assumptions concerning the future. The resulting accounting estimates will, by definition, seldom equal the related actual results. The estimates and assumptions that have a significant risk of causing a material adjustment to the carrying amounts of assets and liabilities within the next financial year are addressed below.
i. Post-employment benefits
The present value of the post-employment benefits obligations depends on a number of factors that are determined on an actuarial basis using a number of assumptions. The assumptions used in determining the net cost (income) for pensions include the discount rate. Any changes in these assumptions will impact the carrying amount of post-employment benefit obligations.
The Company and its subsidiaries determine the appropriate discount rate at the end of each reporting period. This is the interest rate that should be used to determine the present value of estimated future cash outflows expected to be required to settle the obligations. In determining the appropriate discount rate, the Company and its subsidiaries considers the interest rates of government bonds that are denominated in the currency in which the benefits will be paid and that have terms to maturity approximating the terms of the related post-employment benefit obligation. If there is an improvement in the ratings of such government bonds or a decrease in interest rates as a result of improving economic conditions, there could be a material impact on the discount rate used in determining the post-employment benefit obligations.
Other key assumptions for post-employment benefit obligations are based in part on current market conditions. Additional information is disclosed in Notes 32 and 33.
F-25
Table of Contents |
PERUSAHAAN PERSEROAN (PERSERO) P.T. TELEKOMUNIKASI INDONESIA Tbk AND SUBSIDIARIES NOTES TO CONSOLIDATED FINANCIAL STATEMENTS(continued) JANUARY 1, 2010, DECEMBER 31, 2010 AND 2011 AND YEARS ENDED DECEMBER 31, 2010 AND 2011 (Figures in tables are presented in billions of Rupiah, unless otherwise stated) |
2. SUMMARY OF SIGNIFICANT ACCOUNTING POLICIES(continued)
z. Critical Accounting Estimates and Judgements(continued)
ii. Provision for impairment of receivables
The Company and its subsidiaries assess whether there is objective evidence that trade receivables have been impaired at the end of each reporting period. Provision for impairment of receivables is calculated based on a review of the current status of existing receivables and historical collections experience. Such provisions are adjusted periodically to reflect the actual and anticipated experience.
iii. Income taxes
Significant judgement is required in determining the provision for income taxes. There are many transactions and calculations for which the ultimate tax determination is uncertain. The Company and its subsidiaries recognize liabilities for anticipated tax audit issues based on estimates whether additional taxes will be due. Where the final tax outcome of these matters is different from the amounts that were initially recorded, such differences will impact the current and deferred tax income tax assets and liabilities in the period in which such determination is made.
iv. Impairment of non-financial assets
The Company and its subsidiaries tests annually whether goodwill is impaired. Other non-financial assets are reviewed for impairment whenever events or changes in circumstances indicate that the carrying amount of the asset exceeds its recoverable amount. The recoverable amount of an assets or a cash generating unit is determined based on the higher of its fair value less costs to sell and its value in use, calculated on the basis of management’s assumptions and estimates.
In determining value in use, the Company and its subsidiaries apply management judgment in establishing forecast of future operating performance, as well as the selection of growth rates and discount rates. These judgments are applied based on our understanding of historical information and expectations of future performance. Changing the key assumptions, including the discount rates or the growth rate assumptions in the cash flow projections, could materially affect the value in use calculations.
For the year ended December 31, 2011, the Company recognized Rp. 563 billion (2010: Nil) of impairment loss on property, plant and equipment in relation to the fixed wireless services. A 1% increase in the discount rate used would result in an increase in impairment loss of approximately Rp.907 billion. However the recoverable amount of the fixed wireless CGU is most sensitive to whether management will be able to implement its plans, including the full mobility initiative, such that it generates positive cash flows and returns to profitability as projected. If the performance of the fixed wireless CGU continues to decline or if management’s initiatives are not performing as expected in the next financial year, analysis will be required to assess whether there will be further impairment next year. For details, please refer to Note 11c.
3. TRANSLATION OF RUPIAH INTO UNITED STATES DOLLARS
The consolidated financial statements are stated in Indonesian Rupiah (“Rupiah”). The translations of Indonesian Rupiah amounts into U.S. Dollars are included solely for the convenience of the readers and have been made using the average of the market buy and sell rates of Rp.9,067.5 to US$1 as published by Reuters on December 31, 2011. The convenience translations should not be construed as representations that the Indonesian Rupiah amounts have been, could have been, or could in the future be, converted into United States Dollars at this or any other rate of exchange.
4. acquisitions OF PT ADMINISTRASI MEDIKA (“ad medika”)
On February 25, 2010, Metra entered into Sales Purchase Agreement (“SPA”) with Ad Medika’s stockholders for the share purchase transaction with acquisition cost amounting to Rp.130 billion (including consultant fee).
F-26
Table of Contents |
PERUSAHAAN PERSEROAN (PERSERO) P.T. TELEKOMUNIKASI INDONESIA Tbk AND SUBSIDIARIES NOTES TO CONSOLIDATED FINANCIAL STATEMENTS(continued) JANUARY 1, 2010, DECEMBER 31, 2010 AND 2011 AND YEARS ENDED DECEMBER 31, 2010 AND 2011 (Figures in tables are presented in billions of Rupiah, unless otherwise stated) |
4. acquisitions OF PT ADMINISTRASI MEDIKA (“ad medika”)(continued)
Ad Medika is an electronic health care network company. Ad Medika is the largest health service administration management company in Indonesia. Through the acquisition, the Company began providing services through Insure Net as an initial National e-Health program.
The acquisition of Ad Medika has been accounted for using the purchase method of accounting, where the purchase price was allocated to the fair value of the acquired assets and assumed liabilities. The Company elected to recognize the Non-controlling interest as its proportional share of the acquired net identifiable asstes. The allocation of the acquisition cost was as follows:
| | | | | | Rp. | |
The assets and liabilities arising from the acquisition are as follows: | | | | | | | |
Current assets | | | | | | 26 | |
Property, plant and equipments | | | | | | 17 | |
Intangible assets | | | | | | 46 | |
Current liabilities | | | | | | (22 | ) |
Long-term liabilities | | | | | | (8 | ) |
Deferred tax liabilities | | | | | | (10 | ) |
Fair value of net assets acquired | | | | | | 49 | |
Non-controlling interests | | | | | | (4 | ) |
Goodwill | | | | | | 85 | |
Total purchase consideration | | | | | | 130 | |
Less: | | | | | | | |
Cash and cash equivalents in subsidiary acquired | | | | | | (14 | ) |
Cash outflow from acquisition | | | | | | 116 | |
Metra acquired control of Ad Medika on February 25, 2010 and the valuation was performed by an independent appraisal using thestatement of financial position amount as of February 28, 2010, being the nearest convenientstatement of financial position date. The Company’s consolidated results of operations have included the operating results of Ad Medika since March 1, 2010. The intangible assets acquired included customer contracts and backlog, non contractual customer relationships, trademarks and tradenames, and a non compete agreement (Note 13).
5. CASH AND CASH EQUIVALENTS
| | January 1, 2010 | | December 31, 2010 | | December 31, 2011 | |
Cash on hand | | 7 | | 4 | | 6 | |
Cash in banks | | | | | | | |
Related parties | | | | | | | |
Rupiah | | | | | | | |
PT Bank Mandiri (Persero) Tbk (“Bank Mandiri”) | | 201 | | 439 | | 687 | |
PT Bank Negara Indonesia (Persero) Tbk (“BNI”) | | 146 | | 199 | | 302 | |
PT Bank Rakyat Indonesia (Persero) Tbk (“BRI”) | | 15 | | 7 | | 101 | |
Others | | 7 | | 4 | | 18 | |
| | 369 | | 649 | | 1,108 | |
F-27
Table of Contents |
PERUSAHAAN PERSEROAN (PERSERO) P.T. TELEKOMUNIKASI INDONESIA Tbk AND SUBSIDIARIES NOTES TO CONSOLIDATED FINANCIAL STATEMENTS(continued) JANUARY 1, 2010, DECEMBER 31, 2010 AND 2011 AND YEARS ENDED DECEMBER 31, 2010 AND 2011 (Figures in tables are presented in billions of Rupiah, unless otherwise stated) |
5. CASH AND CASH EQUIVALENTS(continued)
| | January 1, 2010 | | December 31, 2010 | | December 31, 2011 | |
Cash in banks (continued) | | | | | | | |
Related parties (continued) | | | | | | | |
Foreign currencies | | | | | | | |
Bank Mandiri | | 81 | | 169 | | 198 | |
BNI | | 36 | | 57 | | 48 | |
Others | | 1 | | 1 | | 2 | |
| | 118 | | 227 | | 248 | |
Sub-total | | 487 | | 876 | | 1,356 | |
Third parties | | | | | | | |
Rupiah | | | | | | | |
The Royal Bank of Scotland N.V.(previously ABN AMRO Bank) | | 97 | | 99 | | - | |
Others | | 66 | | 99 | | 115 | |
| | 163 | | 198 | | 115 | |
Foreign currencies (each below Rp.50 billion) | | 46 | | 75 | | 69 | |
Sub-total | | 209 | | 273 | | 184 | |
Total cash in bank | | 696 | | 1,149 | | 1,540 | |
Time deposits | | | | | | | |
Related parties | | | | | | | |
Rupiah | | | | | | | |
BRI | | 1,400 | | 2,224 | | 2,620 | |
BNI | | 832 | | 1,428 | | 2,418 | |
Bank Mandiri | | 345 | | 1,556 | | 448 | |
PT Bank Tabungan Negara (Persero) Tbk (“BTN”) | | 270 | | 330 | | 446 | |
PTBank Pembangunan Daerah Jawa Barat dan Banten (“Bank Jabar”) | | 390 | | 496 | | 145 | |
PT Bank Syariah Mandiri (“BSM”) | | 3 | | - | | 77 | |
PT Bank BRI Syariah | | - | | - | | 30 | |
PT Bank Pembangunan Daerah Jawa Timur | | - | | - | | 2 | |
| | 3,240 | | 6,034 | | 6,186 | |
Foreign Currencies | | | | | | | |
BRI | | 557 | | 636 | | 299 | |
BNI | | 1,065 | | 394 | | 7 | |
Bank Mandiri | | - | | 2 | | - | |
| | 1,622 | | 1,032 | | 306 | |
Sub-total | | 4,862 | | 7,066 | | 6,492 | |
F-28
Table of Contents |
PERUSAHAAN PERSEROAN (PERSERO) P.T. TELEKOMUNIKASI INDONESIA Tbk AND SUBSIDIARIES NOTES TO CONSOLIDATED FINANCIAL STATEMENTS(continued) JANUARY 1, 2010, DECEMBER 31, 2010 AND 2011 AND YEARS ENDED DECEMBER 31, 2010 AND 2011 (Figures in tables are presented in billions of Rupiah, unless otherwise stated) |
5. CASH AND CASH EQUIVALENTS(continued)
| | January 1, 2010 | | December 31, 2010 | | December 31, 2011 | |
Third parties | | | | | | | |
Rupiah | | | | | | | |
PT Bank Tabungan Pensiunan Nasional Tbk | | 24 | | 116 | | 190 | |
PT Bank Bukopin Tbk (“Bank Bukopin”) | | 238 | | 174 | | 181 | |
PT Bank Mega Tbk (“Bank Mega”) | | 101 | | 177 | | 180 | |
PT Bank Muamalat Indonesia | | 127 | | 10 | | 95 | |
PT Pan Indonesia Bank Tbk | | 395 | | 95 | | 90 | |
Deutsche Bank AG (“DB”) | | 10 | | - | | 78 | |
PT Bank CIMB Niaga Tbk (”Bank CIMB Niaga”) | | 117 | | 165 | | 11 | |
PT Bank Central Asia Tbk (“BCA”) | | 661 | | - | | - | |
Others | | 86 | | 83 | | 54 | |
| | 1,759 | | 820 | | 879 | |
Foreign currencies | | | | | | | |
PT Bank OCBC NISP Tbk (“OCBC NISP”, merged with PT Bank OCBC Indonesia) | | - | | - | | 641 | |
BCA | | 481 | | 65 | | - | |
Others | | - | | 16 | | 76 | |
| | 481 | | 81 | | 717 | |
Sub-total | | 2,240 | | 901 | | 1,596 | |
Total time deposits | | 7,102 | | 7,967 | | 8,088 | |
Grand Total | | 7,805 | | 9,120 | | 9,634 | |
Interest rates per annum on time deposits are as follows:
| | January 1, 2010 | | December 31, 2010 | | December 31, 2011. | |
Rupiah | | 4.00% - 13.50% | | 4.00% - 9.50% | | 2.85% - 9.25% | |
Foreign currencies | | 0.05% - 4.75% | | 0.05% - 4.00% | | 0.05% - 3.00% | |
The related parties which the Company and its subsidiaries place their funds are state-owned banks. The Company and its subsidiaries placed a majority of their cash and cash equivalents in these banks because they have the most extensive branch network in Indonesia and are considered to be financially sound banks as they are owned by the state.
Refer to Note 34 for details of related party transactions.
F-29
Table of Contents |
PERUSAHAAN PERSEROAN (PERSERO) P.T. TELEKOMUNIKASI INDONESIA Tbk AND SUBSIDIARIES NOTES TO CONSOLIDATED FINANCIAL STATEMENTS(continued) JANUARY 1, 2010, DECEMBER 31, 2010 AND 2011 AND YEARS ENDED DECEMBER 31, 2010 AND 2011 (Figures in tables are presented in billions of Rupiah, unless otherwise stated) |
6. TRADE AND OTHER RECEIVABLES
Trade and other receivables as of January 1, 2010, December 31, 2010 and 2011 consist of:
| | January 1, 2010 | | December 31, 2010 | | December 31, 2011 | |
Trade receivables | | 5,233 | | 5,889 | | 6,790 | |
Less: provision for impairment of receivables | | (1,365 | ) | (1,445 | ) | (1,732 | ) |
| | 3,868 | | 4,444 | | 5,058 | |
Other receivables | | 138 | | 96 | | 340 | |
Less: provision for impairment of receivables | | (10 | ) | (6 | ) | (5 | ) |
| | 128 | | 90 | | 335 | |
Total trade and other receivables | | 3,996 | | 4,534 | | 5,393 | |
Trade receivables arise from services provided to both retail and non-retail customers, with details as follows:
a. By debtor
(i) Related parties
| | January 1, 2010 | | December 31, 2010 | | December 31, 2011 | |
Government Agencies | | 722 | | 859 | | 953 | |
PT Citra Sari Makmur (“CSM”) | | 58 | | 91 | | 86 | |
PT Indonesian Satellite Corporation Tbk (“Indosat”) | | 48 | | 34 | | 36 | |
PT Patra Telekomunikasi Indonesia(“Patrakom”) | | 18 | | 24 | | 31 | |
Others (each below Rp.30 billion) | | 21 | | 23 | | 52 | |
Total | | 867 | | 1,031 | | 1,158 | |
Less: provision for impairment of receivables | | (93 | ) | (151 | ) | (83 | ) |
Net | | 774 | | 880 | | 1,075 | |
Trade receivables from certain related parties are presented net of the Company and its subsidiaries’ liabilities to such parties due to legal right of offset in accordance with agreements with those parties.
(ii) Third parties
| | January 1, 2010 | | December 31, 2010 | | December 31, 2011 | |
Residential and business subscribers | | 3,998 | | 4,481 | | 5,255 | |
Overseas international carriers | | 368 | | 377 | | 377 | |
Total | | 4,366 | | 4,858 | | 5,632 | |
Less: provision for impairment of receivables | | (1,272 | ) | (1,294 | ) | (1,649 | ) |
Net | | 3,094 | | 3,564 | | 3,983 | |
F-30
Table of Contents |
PERUSAHAAN PERSEROAN (PERSERO) P.T. TELEKOMUNIKASI INDONESIA Tbk AND SUBSIDIARIES NOTES TO CONSOLIDATED FINANCIAL STATEMENTS(continued) JANUARY 1, 2010, DECEMBER 31, 2010 AND 2011 AND YEARS ENDED DECEMBER 31, 2010 AND 2011 (Figures in tables are presented in billions of Rupiah, unless otherwise stated) |
6. TRADE AND OTHER RECEIVABLES(continued)
b. By age
(i) Related parties
| | January 1, 2010 | | December 31, 2010 | | December 31, 2011 | |
Up to 6 months | | 586 | | 660 | | 869 | |
7 to 12 months | | 71 | | 157 | | 137 | |
More than 12 months | | 210 | | 214 | | 152 | |
Total | | 867 | | 1,031 | | 1,158 | |
Less: provision for impairment of receivables | | (93 | ) | (151 | ) | (83 | ) |
Net | | 774 | | 880 | | 1,075 | |
(ii) Third parties
Up to 3 months | | 3,032 | | 3,149 | | 3,153 | |
More than 3 months | | 1,334 | | 1,709 | | 2,479 | |
Total | | 4,366 | | 4,858 | | 5,632 | |
Less: provision for impairment of receivables | | (1,272 | ) | (1,294 | ) | (1,649 | ) |
Net | | 3,094 | | 3,564 | | 3,983 | |
(iii) The aging of total trade receivables is detailed below:
| | January 1, 2010 | | December 31, 2010 | | December 31, 2011 | |
| | Gross | | Provision for impairment | | Gross | | Provision for impairment | | Gross | | Provision for impairment | |
Not past due | | 2,756 | | 23 | | 3,102 | | 26 | | 3,024 | | 32 | |
Past due up to 3 months | | 780 | | 195 | | 633 | | 124 | | 887 | | 139 | |
Past due more than 3 to 6 months | | 1,242 | | 721 | | 543 | | 170 | | 981 | | 259 | |
Past due more than 6 months | | 455 | | 426 | | 1,611 | | 1,125 | | 1,898 | | 1,302 | |
| | 5,233 | | 1,365 | | 5,889 | | 1,445 | | 6,790 | | 1,732 | |
The Company and its subsidiaries have provided provision for impairment of receivables based on the collective account of historical impairment rates and individual account of its customers’ credit quality and credit history. The Company and its subsidiaries do not apply a distinction between related party and third party receivables in assessing amounts past due.As at December 31, 2011, the carrying amount of trade receivables of the Company and its subsidiaries considered past due but not impaired amounted to Rp.2,066 billion (2010: Rp.1,368 billion; 2009: Rp.1,135 billion). Management has concluded that receivables past due but not impaired, along with trade receivables that are neither past due nor impaired, are due from customers with good debt history and are expected to be recoverable.
c. By currency
(i) Related parties
| | January 1,2010 | | December 31,2010 | | December 31,2011 | |
Rupiah | | 841 | | 1,003 | | 1,115 | |
U.S Dollars | | 26 | | 28 | | 43 | |
Total | | 867 | | 1,031 | | 1,158 | |
Less: provision for impairment of receivables | | (93 | ) | (151 | ) | (83 | ) |
Net | | 774 | | 880 | | 1,075 | |
F-31
Table of Contents |
PERUSAHAAN PERSEROAN (PERSERO) P.T. TELEKOMUNIKASI INDONESIA Tbk AND SUBSIDIARIES NOTES TO CONSOLIDATED FINANCIAL STATEMENTS(continued) JANUARY 1, 2010, DECEMBER 31, 2010 AND 2011 AND YEARS ENDED DECEMBER 31, 2010 AND 2011 (Figures in tables are presented in billions of Rupiah, unless otherwise stated) |
6. TRADE AND OTHER RECEIVABLES(continued)
c. By currency(continued)
(ii) Third parties
| | January 1,2010 | | December 31,2010 | | December 31,2011 | |
Rupiah | | 3,738 | | 4,144 | | 4,829 | |
U.S.Dollars | | 628 | | 713 | | 802 | |
Euro | | - | | 1 | | 1 | |
Total | | 4,366 | | 4,858 | | 5,632 | |
Less: provision for impairment of receivables | | (1,272 | ) | (1,294 | ) | (1,649 | ) |
Net | | 3,094 | | 3,564 | | 3,983 | |
d. Movements in provision for impairment of receivables
| | December 31,2010 | | December 31,2011 | |
Beginning balance | | 1,365 | | 1,445 | |
Provision recognized during the year (Note 29) | | 510 | | 856 | |
Receivables writen-off | | (430 | ) | (569 | ) |
Ending balance | | 1,445 | | 1,732 | |
Receivables writen-off are write-offs of third party’s trade receivables.
Management believes that the provision for impairment of receivables is adequate to cover losses on uncollectible trade receivables.
Certain trade receivables of the Company’s subsidiaries have been pledged as collateral for lending agreements (Notes17 and18).
Refer to Note 34 for details of related party transactions.
7. INVENTORIES
| | January 1, 2010 | | December 31, 2010 | | December 31, 2011 | |
Modules | | 234 | | 292 | | 297 | |
Components | | 162 | | 159 | | 329 | |
SIM cards, RUIM cards, set top box and prepaid voucher blanks | | 111 | | 147 | | 238 | |
Total | | 507 | | 598 | | 864 | |
Provision for obsolescence | | | | | | | |
Modules | | (65 | ) | (76 | ) | (91 | ) |
Components | | (7 | ) | (7 | ) | (15 | ) |
SIM cards, RUIM cards, set top box and prepaid voucher blanks | | (- | ) | (- | ) | (- | ) |
Total | | (72 | ) | (83 | ) | (106 | ) |
Net | | 435 | | 515 | | 758 | |
F-32
Table of Contents |
PERUSAHAAN PERSEROAN (PERSERO) P.T. TELEKOMUNIKASI INDONESIA Tbk AND SUBSIDIARIES NOTES TO CONSOLIDATED FINANCIAL STATEMENTS(continued) JANUARY 1, 2010, DECEMBER 31, 2010 AND 2011 AND YEARS ENDED DECEMBER 31, 2010 AND 2011 (Figures in tables are presented in billions of Rupiah, unless otherwise stated) |
7. INVENTORIES(continued)
Movements in the provision for impairment are as follows:
| | | | December 31, 2010 | | December 31, 2011 | |
Beginning balance | | | | 72 | | 83 | |
Provision of inventory recognized during the year (Note 29) | | | | 15 | | 27 | |
Inventories write-off | | | | (4 | ) | (4 | ) |
Ending balance | | | | 83 | | 106 | |
The cost of inventories recognized as expense and included in operations, maintenance, andtelecommunication services expenses (Note28) as of December 31, 2010 and 2011 amounted to Rp.1,022 billion and Rp.818 billion, respectively.
Management believes that the provision is adequate to cover losses from declines in inventory value due to obsolescence.
Certain inventories of the Company’s subsidiaries have been pledged as collateral for lending agreements (Notes 17 and 18).
As of December 31, 2010 and 2011, modules and components held by the Company and its subsidiaries have been insured against fire, theft, all industrial risks, loss risk during delivery and other specific risks with the total sum insured as of December 31, 2010 and 2011 is amounting to Rp.144 billion and Rp.235 billion, respectively.
Management believes that the insurance coverage is adequate to cover potential losses of the insured inventories.
8. ADVANCES AND PREPAID EXPENSES
| | January 1, 2010 | | December 31, 2010 | | December 31, 2011 | |
Frequency license | | 1,723 | | 2,394 | | 2,211 | |
Rental | | 381 | | 741 | | 530 | |
Salaries | | 338 | | 142 | | 201 | |
Advances | | 4 | | 66 | | 184 | |
Others (each below Rp.50 billion) | | 51 | | 98 | | 168 | |
Total | | 2,497 | | 3,441 | | 3,294 | |
Refer to Note 34 for details of related party transactions.
9. ASSETS HELD FOR SALE
This account represents the carrying amount of equipment to be exchanged with Nokia Siemens Network Oy with a total agreed price of US$93.4 million. The equipment will be used as a part of the settlement for the exchange of equipment with this Company.
F-33
Table of Contents |
PERUSAHAAN PERSEROAN (PERSERO) P.T. TELEKOMUNIKASI INDONESIA Tbk AND SUBSIDIARIES NOTES TO CONSOLIDATED FINANCIAL STATEMENTS(continued) JANUARY 1, 2010, DECEMBER 31, 2010 AND 2011 AND YEARS ENDED DECEMBER 31, 2010 AND 2011 (Figures in tables are presented in billions of Rupiah, unless otherwise stated) |
10. LONG-TERM INVESTMENTS
| | 2010 | |
| | | | | | | | Share of profit/(loss) of associated companies | | | | | |
Percentage of Ownership | Beginning balance | Addition | Translation adjustment | Ending balance |
Long-term investments in associated companies: | | | | | | | | | | | | | |
Scicoma | | 29.71 | | 50 | | 64 | | (5 | ) | 0 | | 109 | |
PT Melon Indonesia (“ Melon”)c | | 51.00 | | - | | 51 | | - | | - | | 51 | |
Patrakomd | | 40.00 | | 36 | | - | | 4 | | - | | 40 | |
CSMb | | 25.00 | | 44 | | - | | (13 | ) | 2 | | 33 | |
PSNe | | 22.38 | | - | | - | | - | | - | | - | |
| | | | 130 | | 115 | | (14 | ) | 2 | | 233 | |
Other long-term investments | | | | 21 | | - | | - | | - | | 21 | |
Total | | | | 151 | | 115 | | (14 | ) | 2 | | 254 | |
| | 2011 | |
| | Percentage Of | | Beginning | | Share of profit/(loss) of | | Dividend | | Translation | | Ending | |
ownership | balance | associated companies | adjustment | balance |
Long-term investments in associated companies : | | | | | | | | | | | | | |
Scicoma | | 29.71 | | 109 | | (1 | ) | (7 | ) | (0 | ) | 101 | |
CSMb | | 25.00 | | 33 | | (6 | ) | - | | (1 | ) | 26 | |
Melonc | | 51.00 | | 51 | | (7 | ) | - | | - | | 44 | |
Patrakomd | | 40.00 | | 40 | | 4 | | (1 | ) | - | | 43 | |
PSNe | | 22.38 | | - | | - | | - | | - | | - | |
| | | | 233 | | (10 | ) | (8 | ) | (1 | ) | 214 | |
Other long-term investments | | | | 21 | | - | | - | | - | | 21 | |
Total | | | | 254 | | (10 | ) | (8 | ) | (1 | ) | 235 | |
Other long-term investments represent investments in equity securities that do not have a quoted market price in an active market and whose fair value cannot be reliably measured, accordingly are recognized at cost.
a Scicom is engaged in providing call center services in Malaysia.
b CSM is engaged in providing Very Small Aperture Terminal (“VSAT”), network application services and consulting services on telecommunications technology and related facilities.
c Melon is engaged in providing Digital Content Exchange Hub services. As a result of the existence of substantive participating rights held by the other venturer over the significant financial and operating policies of Melon, Metra does not have control over Melon.
d Patrakom is engaged in providing satellite communication system services, related services and facilities to companies in the petroleum industry.
e PSN is engaged in providing satellite transponder leasing and satellite-based communication services in the Asia Pacific region. The Company’s share in losses in PSN has exceeded the carrying amount of its investment since 2001, accordingly, the investment value has been reduced to Rp.nil.
F-34
Table of Contents |
PERUSAHAAN PERSEROAN (PERSERO) P.T. TELEKOMUNIKASI INDONESIA Tbk AND SUBSIDIARIES NOTES TO CONSOLIDATED FINANCIAL STATEMENTS(continued) JANUARY 1, 2010, DECEMBER 31, 2010 AND 2011 AND YEARS ENDED DECEMBER 31, 2010 AND 2011 (Figures in tables are presented in billions of Rupiah, unless otherwise stated) |
11. PROPERTY, PLANT AND EQUIPMENT
| | January 1, | | Acquisition of | | Additions | | Deductions | | Reclassifications | | December 31, | |
2010 | AdMedika | 2010 |
At cost: | | | | | | | | | | | | | |
Landrights | | 782 | | 8 | | 35 | | - | | (8 | ) | 817 | |
Buildings | | 2,978 | | 6 | | 75 | | (1 | ) | 145 | | 3,203 | |
Leasehold improvements | | 527 | | - | | 74 | | - | | - | | 601 | |
Switching equipment | | 29,041 | | - | | 122 | | (30 | ) | 1,076 | | 30,209 | |
Telegraph, telex and data communication equipment | | 21 | | - | | - | | (1 | ) | - | | 20 | |
Transmission installation and equipment | | 67,457 | | - | | 2,125 | | (812 | ) | 5,447 | | 74,217 | |
Satellite, earth station and equipment | | 6,795 | | - | | 41 | | - | | 86 | | 6,922 | |
Cable network | | 24,029 | | - | | 1,166 | | (249 | ) | (7 | ) | 24,939 | |
Power supply | | 7,326 | | - | | 177 | | (16 | ) | 728 | | 8,215 | |
Data processing equipment | | 7,864 | | 1 | | 201 | | (616 | ) | 744 | | 8,194 | |
Other telecommunications peripherals | | 481 | | - | | 17 | | - | | - | | 498 | |
Office equipment | | 824 | | 1 | | 82 | | (228 | ) | (9 | ) | 670 | |
Vehicles | | 171 | | 1 | | 3 | | (9 | ) | - | | 166 | |
CPE assets | | 22 | | - | | - | | - | | - | | 22 | |
Other equipment | | 103 | | - | | 4 | | - | | 1 | | 108 | |
Property under construction: | | | | | | | | | | | | | |
Buildings | | 90 | | - | | 126 | | - | | (158 | ) | 58 | |
Leasehold improvements | | - | | - | | 91 | | - | | - | | 91 | |
Switching equipment | | 49 | | - | | 1,035 | | - | | (1,084 | ) | - | |
Transmission installation and equipment | | 350 | | - | | 5,537 | | - | | (5,598 | ) | 289 | |
Satellite, earth station and equipment | | - | | - | | 69 | | - | | (42 | ) | 27 | |
Cable network | | 3 | | - | | 4 | | - | | (1 | ) | 6 | |
Power supply | | 41 | | - | | 726 | | - | | (727 | ) | 40 | |
Data processing equipment | | 16 | | - | | 777 | | - | | (725 | ) | 68 | |
Total | | 148,970 | | 17 | | 12,487 | | (1,962 | ) | (132 | ) | 159,380 | |
| | January 1, 2010 | | Additions | | Deductions | | Reclassifications | | December 31, 2010 | |
Accumulated depreciation: | | | | | | | | | | | |
Land rights | | 89 | | 16 | | - | | - | | 105 | |
Buildings | | 1,485 | | 97 | | (1 | ) | (5 | ) | 1,576 | |
Leasehold improvements | | 382 | | 61 | | - | | - | | 443 | |
Switching equipment | | 18,456 | | 2,532 | | (30 | ) | (16 | ) | 20,942 | |
Telegraph, telex and data communication equipment | | 17 | | 1 | | (1 | ) | - | | 17 | |
Transmission installation and equipment | | 25,038 | | 6,316 | | (812 | ) | (120 | ) | 30,422 | |
Satellite, earth station and equipment | | 3,137 | | 476 | | - | | 8 | | 3,621 | |
Cable network | | 14,812 | | 1,147 | | (249 | ) | (25 | ) | 15,685 | |
Power supply | | 2,927 | | 921 | | (12 | ) | (2 | ) | 3,834 | |
Data processing equipment | | 5,211 | | 1,369 | | (615 | ) | 25 | | 5,990 | |
Other telecommunications peripherals | | 355 | | 15 | | - | | - | | 370 | |
Office equipment | | 666 | | 72 | | (228 | ) | 2 | | 512 | |
Vehicles | | 124 | | 22 | | (7 | ) | - | | 139 | |
Customer premise equipment (“CPE”) assets | | 5 | | 2 | | - | | - | | 7 | |
Other equipment | | 87 | | 5 | | - | | 1 | | 93 | |
Total | | 72,791 | | 13,052 | | (1,955 | ) | (132 | ) | 83,756 | |
Net Book Value | | 76,179 | | | | | | | | 75,624 | |
F-35
Table of Contents |
PERUSAHAAN PERSEROAN (PERSERO) P.T. TELEKOMUNIKASI INDONESIA Tbk AND SUBSIDIARIES NOTES TO CONSOLIDATED FINANCIAL STATEMENTS(continued) JANUARY 1, 2010, DECEMBER 31, 2010 AND 2011 AND YEARS ENDED DECEMBER 31, 2010 AND 2011 (Figures in tables are presented in billions of Rupiah, unless otherwise stated) |
11. PROPERTY, PLANT AND EQUIPMENT(continued)
| | January 1, 2011 | | Additions | | Deductions | | Reclassifications | | December 31, 2011 | |
At cost: | | | | | | | | | | | |
Land rights | | 817 | | 40 | | (14 | ) | (1 | ) | 842 | |
Buildings | | 3,203 | | 149 | | (66 | ) | 131 | | 3,417 | |
Leasehold improvements | | 601 | | 12 | | (5 | ) | 42 | | 650 | |
Switching equipment | | 30,209 | | 113 | | (5,565 | ) | 794 | | 25,551 | |
Telegraph, telex and data communication equipment | | 20 | | - | | - | | - | | 20 | |
Transmission installation and equipment | | 74,217 | | 2,186 | | (829 | ) | 3,123 | | 78,697 | |
Satellite, earth station and equipment | | 6,922 | | 72 | | - | | 75 | | 7,069 | |
Cable network | | 24,939 | | 1,491 | | (698 | ) | 1,040 | | 26,772 | |
Power supply | | 8,215 | | 466 | | (151 | ) | 755 | | 9,285 | |
Data processing equipment | | 8,194 | | 366 | | (480 | ) | 346 | | 8,426 | |
Other telecommunications peripherals | | 498 | | 6 | | (3 | ) | (27 | ) | 474 | |
Office equipment | | 670 | | 95 | | (59 | ) | 47 | | 753 | |
Vehicles | | 166 | | 3 | | (8 | ) | (29 | ) | 132 | |
Customer premise equipment (“CPE”) assets | | 22 | | - | | - | | - | | 22 | |
Other equipment | | 108 | | 5 | | (1 | ) | - | | 112 | |
Property under construction: | | | | | | | | | | | |
Buildings | | 58 | | 149 | | - | | (67 | ) | 140 | |
Leasehold improvements | | 91 | | 82 | | - | | (170 | ) | 3 | |
Switching equipment | | - | | 1,852 | | - | | (1,782 | ) | 70 | |
Transmission installation and equipment | | 289 | | 6,051 | | - | | (5,513 | ) | 827 | |
Satellite, earth station and equipment | | 27 | | 164 | | - | | (170 | ) | 21 | |
Cable network | | 6 | | 38 | | - | | (2 | ) | 42 | |
Power supply | | 40 | | 704 | | - | | (714 | ) | 30 | |
Data processing equipment | | 68 | | 510 | | - | | (506 | ) | 72 | |
Total | | 159,380 | | 14,554 | | (7,879 | ) | (2,628 | ) | 163,427 | |
| | January 1, 2011 | | Additions | | Impairments | | Deductions | | Reclassifications | | December 31, 2011 | |
Accumulated depreciation and impairment: | | | | | | | | | | | | | |
Land rights | | 105 | | 18 | | - | | (1 | ) | (1 | ) | 121 | |
Buildings | | 1,576 | | 104 | | 2 | | (66 | ) | 55 | | 1,671 | |
Leasehold improvements | | 443 | | 64 | | - | | (5 | ) | - | | 502 | |
Switching equipment | | 20,942 | | 2,701 | | - | | (5,325 | ) | (871 | ) | 17,447 | |
Telegraph, telex and data communication equipment | | 17 | | - | | - | | - | | - | | 17 | |
Transmission installation and equipment | | 30,422 | | 6,706 | | 320 | | (511 | ) | (1,560 | ) | 35,377 | |
Satellite, earth station and equipment | | 3,621 | | 486 | | 176 | | - | | (148 | ) | 4,135 | |
Cable network | | 15,685 | | 1,110 | | 39 | | (698 | ) | 992 | | 17,128 | |
Power supply | | 3,834 | | 1,230 | | 12 | | (144 | ) | (59 | ) | 4,874 | |
Data processing equipment | | 5,990 | | 1,134 | | 13 | | (479 | ) | (252 | ) | 6,406 | |
Other telecommunications peripherals | | 370 | | 13 | | 1 | | (3 | ) | (27 | ) | 354 | |
Office equipment | | 512 | | 68 | | - | | (59 | ) | 10 | | 531 | |
Vehicles | | 139 | | 18 | | - | | (7 | ) | (30 | ) | 120 | |
Customer premise equipment (“CPE”) assets | | 7 | | 2 | | - | | - | | - | | 9 | |
Other equipment | | 93 | | 6 | | - | | (1 | ) | - | | 98 | |
Total | | 83,756 | | 13,660 | | 563 | | (7,299 | ) | (1,891 | ) | 88,789 | |
Net Book Value | | 75,624 | | | | | | | | | | 74,638 | |
F-36
Table of Contents |
PERUSAHAAN PERSEROAN (PERSERO) P.T. TELEKOMUNIKASI INDONESIA Tbk AND SUBSIDIARIES NOTES TO CONSOLIDATED FINANCIAL STATEMENTS(continued) JANUARY 1, 2010, DECEMBER 31, 2010 AND 2011 AND YEARS ENDED DECEMBER 31, 2010 AND 2011 (Figures in tables are presented in billions of Rupiah, unless otherwise stated) |
11. PROPERTY, PLANT AND EQUIPMENT(continued)
a. Gains on disposal or sale ofproperty, plant and equipment
| | 2010 | | 2011 | |
Proceedsfrom sale of property, plant and equipment | | 11 | | 56 | |
Net book value | | (7 | ) | (17 | ) |
Exchange of property, plant and equipment | | - | | 24 | |
Gains on disposal or sale of property, plant and equipment | | 4 | | 63 | |
| | | | | |
b. Kerja Sama Operasi (“KSO”) assets ownership arrangements (i) In accordance with the amended and restated KSO VII agreement withPT Bukaka Singtel International (“BSI”), the ownership rights to the acquired property, plant and equipment in KSO VII were legally retained by BSI until the end of the KSO period which was on December 31, 2010. As of December 31, 2010 the net book value of these property, plant and equipment was Rp.710 billion. As at January 1, 2011, the legal rights on this property, plant and equipment was transferred to Telkom and the property, plant and equipment is now reflected in the balances above. |
(ii) In accordance with the amended and restated KSO IV agreement with PT Mitra Global Telekomunikasi Indonesia(“MGTI”), the ownership rights to the acquired property, plant and equipment in KSO IV were legally retained by MGTI until the end of the KSO period which was on December 31, 2010. As of December 31, 2010 the net book value of these property, plant and equipment was Rp.161 billion. As at January 1, 2011, the legal rights on this property, plant and equipment was transferred to Telkom and the property, plant and equipment is now reflected in the balances above.
- Assets impairment
(i) Asof December 31, 2011, the CGUs that generate cash inflows independently were fixed wireline, fixed wireless, cellular and others. There were indications of impairment in the fixed wireless business segment, including reporting a segment loss of Rp 1,433 billion for the year ended December 31, 2011, which was mainly due to increased competition in the fixed wireless market and that has resulted in lower average tarrifs, declining active costumer and declining average revenue per user (ARPU). TheCompany assessed the recoverable value of the assets in the cash generating unit (CGU) and determined that assets for the fixed wireless CGU were impaired at 31 December 2011 resulting in an impairment charge of Rp. 563 billion being recognized in the consolidated statement of comprehensive income under ‘Depreciation and Amortization’. The recoverable amount has been determined based on value-in-use (VIU) calculations. These calculations used pre-tax cash flow projections approved by management covering a five-year period and with cash flows beyond the five-year period extrapolated using a perpetuity growth rate. The cash flow projections reflect management’s expectations of revenue, EBITDA growth and operating cash flows on the basis that the fixed wireless CGU generates positive net cash flows from 2013 and returns to profitability in 2016. Management’s cash flow projection also incorporates management’s reasonable expectations for developments in macro economic conditions and market expectations for the Indonesian telecommunications industry. The projection assumes that management will receive appropriate licenses and effectively implement a full mobility initiative that will remove limitations in the existing service which can only be used by customers within a particular area code. Management applied a pre-tax discount rate of 11.4%, derived from the company’s post-tax weighted average cost of capital and benchmarked to externally available data. The perpetuity growth rate used of 0% assumes that while subscriber numbers may continue to increase after five years, average revenue per user may decline such that only negligible long term growth will be achieved in a competitive market.
If the performance of the fixed wireless CGU continues to decline or if management’s initiatives are not performing as expected in the next financial year, analysis will be required to assess wether there will be further impairment next year
(ii) As of December 31, 2010 and 2011, there were no events or changes in circumstances that would indicate that the carrying amount of the Company’s fixed wireline business, cellular business and others may not be recoverable.
F-37
Table of Contents |
PERUSAHAAN PERSEROAN (PERSERO) P.T. TELEKOMUNIKASI INDONESIA Tbk AND SUBSIDIARIES NOTES TO CONSOLIDATED FINANCIAL STATEMENTS(continued) JANUARY 1, 2010, DECEMBER 31, 2010 AND 2011 AND YEARS ENDED DECEMBER 31, 2010 AND 2011 (Figures in tables are presented in billions of Rupiah, unless otherwise stated) |
11. PROPERTY, PLANT AND EQUIPMENT(continued)
- Assets impairment(continued)
(iii) As of December 31, 2010 and 2011, the Company operated two satellites, Telkom-1 and Telkom-2 primarily providing backbone transmission links for its network and earth station satellite up-linking and down-linking services to domestic and international users. As of December 31, 2011, there were no events or changes in circumstances that would indicate that the carrying amount of the Company’s satellites may not be recoverable
- Others
(i) Interest capitalized to property under construction amounted to Rp.nil for 2010 and 2011, respectively.
(ii) Foreign exchange loss capitalized as part of property under construction amounted to Rp.nil for 2010 and 2011, respectively.
(iii) In 2010, the useful lives of Company’s office and installation buildings, Submarine Cable Communication System/Fiber Optic Communication System and Antenna and Tower were changed and accounted for prospectively. The impact is a reduction in the amount depreciation expense of Rp.126 billion recognized to the 2010 consolidated statement of comprehensive income (Note 2l).
(iv) In April 2011, Telkomsel decided to replace certain equipment (part of infrastructure) with a cost and net carrying amount of Rp.707 billion and Rp.189 billion, respectively, as part of a modernization program. Accordingly, Telkomsel changed the useful life of such equipment. The impact is an additional depreciation expense of Rp.154 billion charged to the 2011 consolidated statement of comprehensive income. Subsequently, in August 2011 and December 2011, part of the equipment with a cost of Rp.185 billion and Rp.399 billion, respectively, were derecognized. Upon derecognition, the equipment had been fully depreciated.
In 2011, due to the impactof changes in technology, damage and other causes, certain equipment and software (mainly part of infrastructure and supporting facilities) with a cost and a net carrying amount of Rp.4,126 billion and Rp.16 billion, respectively, were derecognized.
(v) In May 2011, the useful life of Telkomsel’s equipment (part of supporting facilities) was changed from 10 years to 6 years to reflect its current economic life. The impact is an additional depreciation expenses of Rp.295 billion charged to the 2011 consolidated statements of comprehensive income.
(vi) Exchange of property, plant and equipment:
· On January 24, 2011 and February 25, 2011, the Company and INTI entered into a purchase order of procurement and installation agreement for the Modernization of the Copper Cable Network through Optimization of Asset Copper Cable Network with Trade In Trade Off (TITO) mode for STO Cengkareng, STO Gandaria and STO Injoko amounting to Rp.96 billion and for STO Semanggi amounting to Rp.44 billion. In 2011, the Company has derecognized the copper cable network asset with a net book value of Rp.0.1 billion and recorded the fiber optic network asset of Rp.57 billion.
F-38
Table of Contents |
PERUSAHAAN PERSEROAN (PERSERO) P.T. TELEKOMUNIKASI INDONESIA Tbk AND SUBSIDIARIES NOTES TO CONSOLIDATED FINANCIAL STATEMENTS(continued) JANUARY 1, 2010, DECEMBER 31, 2010 AND 2011 AND YEARS ENDED DECEMBER 31, 2010 AND 2011 (Figures in tables are presented in billions of Rupiah, unless otherwise stated) |
11. PROPERTY, PLANT AND EQUIPMENT(continued)
- Others(continued)
(vi) Exchange of property, plant and equipment: (continued)
· In 2011, certain equipment (part of infrastructure) of Telkomsel with a cost and net carrying amount of Rp.1,730 billion and Rp.547 billion, respectively, were exchanged with equipment from Nokia Siemens Network Oy and PT Huawei Tech Invesment with the total price of US$63 million.
Certain equipment (part of infrastructure) of Telkomsel with a cost and net carrying amount of Rp.1,736 billion and Rp.791 billion, respectively, are going to be exchanged with the equipment from Nokia Siemens Network Oy and PT Huawei Tech Investment. Accordingly, these were classified to assets held for sale (Note 9)
(vii) The Company and its subsidiaries own several pieces of land located throughout Indonesia with Building Use Rights (“Hak Guna Bangunan” or “HGB”) for a period of18-45years, which will expire between 2012 and 2052. Management believes that there will be no difficulty in obtaining the extension of the land rights when they expire.
(viii) As of December 31, 2011, the Company and its subsidiaries’ property, plant and equipment, except for land, were insured against fire, theft, earthquake and other specified risks. Total cost of assets being insured amounted to Rp.72,188 billion, which was covered by sum insured basis with a maximum loss claim of Rp.1,735 billion, US$38 million, EUR0.36 million and SGD6 million and on first loss basis of Rp7,240 billion including business recovery of Rp.486 billion with the Automatic Reinstatement of Loss Clause. In addition, Telkom-1 and Telkom-2 were insured separately for US$17 million and US$39 million, respectively. Management believes that the insurance coverage is adequate to cover potential losses of the insured assets.
(ix) Certain property, plant and equipment of the Company’s subsidiaries have been pledged as collateral for lending agreements (Note 17 and 18).
12. ADVANCES AND OTHER NON-CURRENT ASSETS
Advances and other non-current assets as of January 1, 2010, December 31, 2010 and 2011 consist of:
| | January 1,2010 | | December 31,2010 | | December 31,2011 | |
Advances for purchase of property, plant and equipment | | 693 | | 1,335 | | 2,017 | |
Prepaid rent - net of current portion (Note 8) | | 987 | | 1,052 | | 1,143 | |
Deferred charges | | 459 | | 447 | | 435 | |
Restricted cash | | 223 | | 102 | | 164 | |
Security deposits | | 37 | | 62 | | 54 | |
Equipment not used in operations - net | | 69 | | 30 | | 1 | |
Others | | 65 | | 67 | | 3 | |
Total | | 2,533 | | 3,095 | | 3,817 | |
Deferred charges represent deferred Revenue-Sharing Arrangements (“RSA”) charges, deferred Indefeasible Right of Use (“IRU”) Agreement charges, and deferred land rights charges. Total deferred charges amortization expense recognized in 2010 and 2011 were amounted to Rp.19 billion and Rp.84 billion, respectively.
F-39
Table of Contents |
PERUSAHAAN PERSEROAN (PERSERO) P.T. TELEKOMUNIKASI INDONESIA Tbk AND SUBSIDIARIES NOTES TO CONSOLIDATED FINANCIAL STATEMENTS(continued) JANUARY 1, 2010, DECEMBER 31, 2010 AND 2011 AND YEARS ENDED DECEMBER 31, 2010 AND 2011 (Figures in tables are presented in billions of Rupiah, unless otherwise stated) |
12. ADVANCES AND OTHER NON-CURRENT ASSETS (continued)
As of December 31, 2010 and 2011 restricted cash represents time deposits with original maturities of more than one year and cash pledged as collateral for bank guarantees for the USO contract (Note 26) and other contracts.
As ofJanuary 1, 2010, restricted cash represented cashreceived from Government relating to compensation for early termination of exclusive rights to be used for the construction of certain infrastructures and time deposits with original maturities of more than one year pledged as collateral for bank guarantees for the USO contracts and other contracts.
Refer to Note 34 for details of related party transactions.
13. INTANGIBLE ASSETS
(i) The changes in the carrying amount of goodwill, license, intangible assets from service concession arrangement and other intangible assets for the years ended January 1, 2010, December 31, 2010 and 2011 are as follows:
| | | | Goodwill | | License | | Other intangible assets | | Total | |
Gross carrying amount: | | | | | | | | | | | |
Balance, January 1, 2010 | | | | 107 | | 806 | | 9,088 | | 10,001 | |
Accumulated amortization: | | | | | | | | | | | |
Balance, January 1, 2010 | | | | (21 | ) | (163 | ) | (7,386 | ) | (7,570 | ) |
Net book value: | | | | | | | | | | | |
As of January 1, 2010 | | | | 86 | | 643 | | 1,702 | | 2,431 | |
| | | | | | | | | | | |
| | | | | | | | | | | |
| | | | Goodwill | | License | | Other intangible assets | | Total | |
Gross carrying amount: | | | | | | | | | | | |
Balance, January 1, 2010 | | | | 107 | | 806 | | 9,088 | | 10,001 | |
Additions - acquired separately: | | | | | | | | | | | |
The Company’s software | | | | - | | - | | 174 | | 174 | |
The subsidiaries’ software | | | | - | | - | | 543 | | 543 | |
The subsidiaries’ license | | | | - | | 6 | | - | | 6 | |
Additions - acquired through business combinations: | | | | | | | | | | | |
Acquisitions of Ad Medika | | | | 85 | | - | | 46 | | 131 | |
Reclassification | | | | - | | - | | 26 | | 26 | |
Balance, December 31, 2010 | | | | 192 | | 812 | | 9,877 | | 10,881 | |
Accumulated amortization: | | | | | | | | | | | |
Balance, January 1, 2010 | | | | (21 | ) | (163 | ) | (7,386 | ) | (7,570 | ) |
Amortization expense during the year | | | | - | | (87 | ) | (1,423 | ) | (1,510 | ) |
Reclassifications | | | | - | | - | | (15 | ) | (15 | ) |
Balance, December 31, 2010 | | | | (21 | ) | (250 | ) | (8,824 | ) | (9,095 | ) |
Net book value: | | | | | | | | | | | |
As of December 31, 2010 | | | | 171 | | 562 | | 1,053 | | 1,786 | |
Weighted-average amortization period | | | | | | 9.38 years | | 6.94 years | | | |
F-40
Table of Contents |
PERUSAHAAN PERSEROAN (PERSERO) P.T. TELEKOMUNIKASI INDONESIA Tbk AND SUBSIDIARIES NOTES TO CONSOLIDATED FINANCIAL STATEMENTS(continued) JANUARY 1, 2010, DECEMBER 31, 2010 AND 2011 AND YEARS ENDED DECEMBER 31, 2010 AND 2011 (Figures in tables are presented in billions of Rupiah, unless otherwise stated) |
13. INTANGIBLE ASSETS (continued)
| | | | Goodwill | | License | | Other intangible assets | | Total | |
Gross carrying amount: | | | | | | | | | | | |
Balance, December 31, 2010 | | | | 192 | | 812 | | 9,877 | | 10,881 | |
Additions - acquired separately: | | | | | | | | | | | |
The Company’s software | | | | - | | - | | 293 | | 293 | |
The subsidiaries’ software | | | | - | | - | | 309 | | 309 | |
The subsidiaries license | | | | - | | 1 | | - | | 1 | |
USO agreement | | | | - | | - | | 1 | | 1 | |
Deduction | | | | - | | - | | (7,603 | ) | (7,603 | ) |
Reclassification | | | | - | | 2 | | (105 | ) | (103 | ) |
Balance, December 31, 2011 | | | | 192 | | 815 | | 2,772 | | 3,779 | |
Accumulated amortization: | | | | | | | | | | | |
Balance, January 1, 2011 | | | | (21 | ) | (250 | ) | (8,824 | ) | (9,095 | ) |
Amortization expense during the year | | | | - | | (87 | ) | (429 | ) | (516 | ) |
Deductions | | | | - | | - | | 7,603 | | 7,603 | |
Reclassifications | | | | - | | (2 | ) | 22 | | 20 | |
Balance, December 31, 2011 | | | | (21 | ) | (339 | ) | (1,628 | ) | (1,988 | ) |
Net book value: | | | | | | | | | | | |
As of December 31, 2011 | | | | 171 | | 476 | | 1,144 | | 1,791 | |
Weighted-average amortization period | | | | - | | 9.39 years | | 6.46 years | | | |
(ii) Goodwill resulted from the acquisition of PT Sigma Cipta Caraka (“Sigma”) in 2008, Indonusa in 2008 and Ad Medika in 2010 (Note 4). Other intangible assets also included the acquisitions of Dayamitra, Pramindo, TII, KSO IV and KSO VII, and represented the rights to operate the business in the KSO areas. In accordance with the expiration of KSO agreement term, the carrying amount and the accumulated amortization of the intangible assets has been derecognized.
(iii) In 2006, Telkomsel was granted the right to operate the 3G license (Note 13.i). Telkomsel is required to pay an up-front fee amounting to Rp.436 billion (Notes34b and 37c.i). The up-front fee is recorded as an intangible asset and amortized using the straight-line method over the term of the right to operate the 3G license (10 years). Amortization commenced in 2006 when the assets attributable to the provision of the related services became available for use.In 2009, Telkomsel obtained an additional 3G license of Rp.320 billion which is recorded as an intangible assets and amortized over 10 years.
Based on management interpretation of the license conditions and the written confirmation from the DGPT, the license may be returned at any time without any financial obligation to pay the remaining outstanding annual BHP fees. Accordingly, Telkomsel recognizes the annual BHP fees as an expense when incurred. Management evaluates its plan to continue to use the license on an annual basis.
(iv) The estimated annual amortization expense relating to other intangible assets from January 1, 2012 is approximately Rp.513 billion.
F-41
Table of Contents |
PERUSAHAAN PERSEROAN (PERSERO) P.T. TELEKOMUNIKASI INDONESIA Tbk AND SUBSIDIARIES NOTES TO CONSOLIDATED FINANCIAL STATEMENTS(continued) JANUARY 1, 2010, DECEMBER 31, 2010 AND 2011 AND YEARS ENDED DECEMBER 31, 2010 AND 2011 (Figures in tables are presented in billions of Rupiah, unless otherwise stated) |
13. INTANGIBLE ASSETS(continued)
(v) The aggregate amount of goodwill allocated to each cash generating unit (CGU) are as follows:
| | January 1, 2010 | | December 31, 2010 | | December 31, 2011 | |
| Sigma | | 93 | | 88 | | 88 | |
| Ad Medika | | - | | 82 | | 82 | |
| Total | | 93 | | 170 | | 170 | |
Metra performed its annual impairment tests of those CGUs based on fair value less cost to sell using discounted cash flow projections. The impairment tests used management approved cash flows projection covering a five-year period, and the following key assumptions.
The key assumptions used in the impairment test are as below:
| | December 31, 2010 | | December 31, 2011 | |
| Sigma | | Ad Medika | | Sigma | | Ad Medika | |
Discount rate | | 13.1% | | - | | 12.5% | | 12.1% | |
Perpetuity growth rate | | 2% | | - | | 2% | | 2% | |
As of December 31, 2010 and 2011, no impairment charge was required for goodwill on acquisition of subsidiaries, with any reasonably possible changes to the key assumptions applied not likely to cause carrying amount of the CGUs to exceed their recoverable amount.
14. TRADE AND OTHER PAYABLES
Trade and other payables as of January 1, 2010, December 31, 2010 and 2011 consist of:
| | January 1, 2010 | | December 31, 2010 | | December 31, 2011 | |
Trade payables | | 9,798 | | 7,511 | | 8,317 | |
Other payables | | 2 | | 21 | | 37 | |
Dividend payables | | 405 | | 255 | | 1 | |
Total trade and other payables | | 10,205 | | 7,787 | | 8,355 | |
Trade payables to related parties and third parties as of January 1, 2010, December 31, 2010 and 2011 consist of:
| | January 1, 2010 | | December 31, 2010 | | December 31, 2011 | |
Related parties | | | | | | | |
Radio frequency usage charges, Concession fees and USO charges | | 1,275 | | 394 | | 409 | |
Purchases of equipment, materials and services | | 214 | | 556 | | 369 | |
Payables to other telecommunications providers | | 270 | | 204 | | 60 | |
Sub-total | | 1,759 | | 1,154 | | 838 | |
Third parties | | | | | | | |
Purchases of equipment, materials and services | | 7,990 | | 6,269 | | 7,429 | |
Payables to other telecommunications providers | | 49 | | 88 | | 50 | |
Sub-total | | 8,039 | | 6,357 | | 7,479 | |
Total | | 9,798 | | 7,511 | | 8,317 | |
F-42
Table of Contents |
PERUSAHAAN PERSEROAN (PERSERO) P.T. TELEKOMUNIKASI INDONESIA Tbk AND SUBSIDIARIES NOTES TO CONSOLIDATED FINANCIAL STATEMENTS(continued) JANUARY 1, 2010, DECEMBER 31, 2010 AND 2011 AND YEARS ENDED DECEMBER 31, 2010 AND 2011 (Figures in tables are presented in billions of Rupiah, unless otherwise stated) |
14. TRADE AND OTHER PAYABLES(continued)
Trade payables by currency are as follows:
| | January 1, 2010 | | December 31, 2010 | | December 31, 2011 | |
Rupiah | | 5,209 | | 4,378 | | 4,422 | |
U.S. Dollars | | 4,332 | | 3,126 | | 3,883 | |
Others (each below Rp.50 billion) | | 257 | | 7 | | 12 | |
Total | | 9,798 | | 7,511 | | 8,317 | |
Refer to Note 34 for details of related party transactions.
15. ACCRUED EXPENSES
| | January 1, 2010 | | December 31, 2010 | | December 31, 2011 | |
Operations, maintenance and telecommunications services | | 1,520 | | 1,774 | | 2,917 | |
Salaries and benefits | | 743 | | 895 | | 900 | |
General, administrative and marketing | | 596 | | 514 | | 805 | |
Early retirement program | | 1,044 | | - | | - | |
Interest and bank charges | | 216 | | 226 | | 168 | |
Total | | 4,119 | | 3,409 | | 4,790 | |
Accruals for early retirement program as of January 1, 2010 arose from the Decision of HCGA Director of the Company No. SK.704/PS940/HRC-60/2009 and No. SK.18.PS940/HRC-60/2010 on Establishment of 2009 Early Retirement Participant dated December 23, 2009 and January 15, 2010, respectively and as communicated to the employees on October 23, 2009. The Company accrued amounted to Rp.1,029 billion on the basis of the number of eligible employees by grade and who were enrolled.
Based on the Decision of Board of Committee of Infomedia No. IN/DEKOM/74000/09012 on early retirement dated December 23, 2009, Infomedia accrued amounted to Rp.15 billion on the basis of the number of eligible employees by grade and who were expected to enroll.
As at December 31, 2010, all amounts related to the early retirement program had been paid
Refer to Note 34 for details of related party transactions.
16. UNEARNED INCOME
| | January 1, 2010 | | December 31, 2010 | | December 31, 2011 | |
Prepaid pulse reload vouchers | | 2,702 | | 2,419 | | 2,526 | |
Other telecommunications services | | 122 | | 131 | | 153 | |
Others (each below Rp.50 billion) | | 123 | | 131 | | 142 | |
Total | | 2,947 | | 2,681 | | 2,821 | |
F-43
Table of Contents |
PERUSAHAAN PERSEROAN (PERSERO) P.T. TELEKOMUNIKASI INDONESIA Tbk AND SUBSIDIARIES NOTES TO CONSOLIDATED FINANCIAL STATEMENTS(continued) JANUARY 1, 2010, DECEMBER 31, 2010 AND 2011 AND YEARS ENDED DECEMBER 31, 2010 AND 2011 (Figures in tables are presented in billions of Rupiah, unless otherwise stated) |
17. SHORT TERM LOANS AND OTHER BORROWINGS
Short term loans and other borrowings consist of short-term bank loans and current maturities portion of long term borrowings. Short term loans and other borrowings as of January 1, 2010, December 31, 2010 and 2011 are as follows:
| | January 1, 2010 | | December 31, 2010 | | December 31, 2011 | |
Short term bank loans | | 44 | | 56 | | 100 | |
Current maturities portion of long term borrowings | | 7,716 | | 5,304 | | 4,813 | |
Total short term loans and other borrowings | | 7,760 | | 5,360 | | 4,913 | |
a. Short term bank loans
Short term bank loans as of January 1, 2010, December 31, 2010 and 2011 are as follows:
| | | | 1 Jan 2010 | | 2010 | | 2011 | |
| | | | Outstanding | | Outstanding | | Outstanding | |
| | | | Original currency | | Rupiah | | Original currency | | Rupiah | | Original currency | | Rupiah | |
Lenders | | Currency | | (in billions) | | equivalent | | (in billions) | | equivalent | | (in billions) | | equivalent | |
Bank CIMB Niaga | | Rp. | | 0 | | 12 | | 0 | | 35 | | 0 | | 45 | |
Bank Danamon | | Rp. | | 0 | | - | | 0 | | - | | 0 | | 40 | |
Others | | Rp. | | 0 | | 32 | | 0 | | 21 | | 0 | | 15 | |
Total | | | | 0 | | 44 | | 0 | | 56 | | 0 | | 100 | |
Refer to Note 34 for details of related party transactions.
Other significant information relating to short-term bank loans as at December 31, 2011 is as follows:
| | | | | | Total Facility | | | | Interest | | Interest | | | |
| | Borrower | | Currency | | (in billions) | | Payment schedule | | Payment period | | Rate per annum | | Security | |
Bank CIMB Niaga | | | | | | | | | | | | | | | |
April 25, 2005 a | | PT Balebat Dedikasi Prima (“Balebat”) | | Rp. | | 12 | | May 29, 2012 | | Monthly | | 11.50% | | Property, plant and equipment (Note11), inventories (Note7), and trade receivables (Note6) | |
April 29, 2008 a | | Balebat | | Rp. | | 5 | | May 29, 2012 | | Monthly | | 11.50% | | Property, plant and equipment (Note11), inventories (Note7), and trade receivables (Note6) | |
May 14, 2010 | | Infomedia | | Rp. | | 28 | | February 16, 2012 | | Monthly | | 11.50% | | Trade receivables (Note6) | |
Bank Danamon | | | | | | | | | | | | | | | |
August 5, 2011 | | Infomedia | | Rp. | | 40 | | February 17, 2012 | | Monthly | | 11.00% | | Trade receivables (Note6) | |
F-44
Table of Contents |
PERUSAHAAN PERSEROAN (PERSERO) P.T. TELEKOMUNIKASI INDONESIA Tbk AND SUBSIDIARIES NOTES TO CONSOLIDATED FINANCIAL STATEMENTS(continued) JANUARY 1, 2010, DECEMBER 31, 2010 AND 2011 AND YEARS ENDED DECEMBER 31, 2010 AND 2011 (Figures in tables are presented in billions of Rupiah, unless otherwise stated) |
17. SHORT TERM LOANS AND OTHER BORROWINGS(continued)
- Short term bank loans
| | | | | | Total Facility | | | | Interest | | Interest | | | |
| | Borrower | | Currency | | (in billions) | | Payment schedule | | Payment period | | Rate per annum | | Security | |
Bank Ekonomi | | | | | | | | | | | | | | | |
June 25, 2009b | | Sigma | | Rp. | | 15 | | July 1, 2012 | | Monthly | | 9.00% - 10.50% | | Trade receivables(Note 6), property, plant and equipment (Note 11) | |
August 7, 2009b | | Sigma | | Rp. | | 35 | | July 1, 2012 | | Monthly | | 9.00% - 10.50% | | Trade receivable (Note 6), property, plant and equipment (Note 11) | |
August 7,2009b | | Sigma | | US$ | | 0.001 | | July 1, 2012 | | Monthly | | 6.00% | | Trade receivables(Note 6), property, plant and equipment (Note 11) | |
The credit facilities obtained by the Company’s subsidiaries are used for working capital purpose.
a Based on the latest amendment on May 25, 2011.
b Based on the latest amendment on November 23, 2011.
- Current maturities portion of long term borrowings
| | Notes | | January 1,2010 | | December 31,2010 | | December 31,2011 | |
Bank loans | | 18c | | 5,826 | | 4,478 | | 3,960 | |
Bonds and notes | | 18b | | 5 | | 127 | | 385 | |
Two-step loans | | 18a | | 424 | | 396 | | 272 | |
Obligations under finance leases | | | | 239 | | 198 | | 196 | |
Deferred consideration for business combinations | | | | 1,222 | | 105 | | - | |
Total | | | | 7,716 | | 5,304 | | 4,813 | |
Deferred consideration represents the Company's obligations to the Selling Stockholders of MGTI in respect of the Company’s acquisition of KSO IV and BSI in respect of the Company’s acquisition of KSO VII. In January 2011, the loan had been fully repaid.
Refer to Note 34 for details of related party transactions.
F-45
Table of Contents |
PERUSAHAAN PERSEROAN (PERSERO) P.T. TELEKOMUNIKASI INDONESIA Tbk AND SUBSIDIARIES NOTES TO CONSOLIDATED FINANCIAL STATEMENTS(continued) JANUARY 1, 2010, DECEMBER 31, 2010 AND 2011 AND YEARS ENDED DECEMBER 31, 2010 AND 2011 (Figures in tables are presented in billions of Rupiah, unless otherwise stated) |
18. LONG TERM LOANS AND OTHER BORROWINGS
Long term loans and other borrowings consist long term bank loans, obligation under finance leases, two step loans, bonds and notes and deferred consideration forbusiness combinations with the amounts as of January 1, 2010, December 31, 2010 and 2011 are as follows:
| | January 1,2010 | | December 31,2010 | | December 31,2011 | |
Bank loans | | 11,087 | | 10,256 | | 7,231 | |
Bonds and notes | | 69 | | 3,249 | | 3,401 | |
Two-step loans | | 3,094 | | 2,741 | | 2,012 | |
Obligations under finance leases | | 542 | | 409 | | 314 | |
Deferred consideration forbusiness combinations | | 108 | | - | | - | |
Long term loans and other borrowings | | 14,900 | | 16,655 | | 12,958 | |
Scheduled principal payment as of December 31, 2011 are as follow :
| | Total | | 2013 | | 2014 | | 2015 | | 2016 | | Later | |
Bank loans | | 7,231 | | 4,155 | | 2,006 | | 722 | | 260 | | 88 | |
Bonds and notes | | 3,401 | | 268 | | 133 | | 1,005 | | 0 | | 1,995 | |
Two-step loans | | 2,012 | | 197 | | 200 | | 202 | | 206 | | 1,207 | |
Obligations under finance leases | | 314 | | 147 | | 94 | | 24 | | 16 | | 33 | |
Total | | 12,958 | | 4,767 | | 2,433 | | 1,953 | | 482 | | 3,323 | |
- Two-step loans
Two-step loans are unsecured loans obtained by the Government, which are then re-loaned to the Company. The loans entered into up to July 1994 were recorded and payable in Rupiah based on the exchange rate at the date of drawdown. Loans entered into after July 1994 are payable in their original currencies and any resulting foreign exchange gain or loss is borne by the Company.
| | | | January 1, 2010 | | December 31, 2010 | | December 31,2011 | |
| | | | Outstanding | | Outstanding | | Outstanding | |
| | | | Original currency | | Rupiah | | Original currency | | Rupiah | | Original currency | | Rupiah | |
Lenders | | Currency | | (in billions) | | equivalent | | (in billions) | | equivalent | | (in billions) | | equivalent | |
Overseas bank | | Yen | | 11.52 | | 1,177 | | 10.75 | | 1,191 | | 9.98 | | 1,167 | |
| | Rp. | | - | | 1,024 | | - | | 857 | | - | | 717 | |
| | US$ | | 0.14 | | 1,317 | | 0.12 | | 1,089 | | 0.04 | | 400 | |
Total | | | | | | 3,518 | | | | 3,137 | | | | 2,284 | |
Current maturities (Note 17b) | | | | | | (424 | ) | | | (396 | ) | | | (272 | ) |
Long-term portion (Note 18) | | | | | | 3,094 | | | | 2,741 | | | | 2,012 | |
F-46
Table of Contents |
PERUSAHAAN PERSEROAN (PERSERO) P.T. TELEKOMUNIKASI INDONESIA Tbk AND SUBSIDIARIES NOTES TO CONSOLIDATED FINANCIAL STATEMENTS(continued) JANUARY 1, 2010, DECEMBER 31, 2010 AND 2011 AND YEARS ENDED DECEMBER 31, 2010 AND 2011 (Figures in tables are presented in billions of Rupiah, unless otherwise stated) |
18. LONG TERM LOANS AND OTHER BORROWINGS(continued)
- Two-step loans (continued)
Lenders | | Currency | | Payment schedule | | Interest Payment period | | Interest Rate per annum | |
Overseas bank | | US$ | | Semi-annually | | Semi-annually | | 4.00% | |
| | Rp. | | Semi-annually | | Semi-annually | | 7.71% | |
| | Yen | | Semi-annually | | Semi-annually | | 3.10% | |
The loans are intended for the development of telecommunications infrastructure and supporting equipment. The loans are payable in semi-annual installments and are due on various dates through 2024.
Since 2008, the Company has used all facilities under the two-step loans program and the drawdown period for the two-step loans has expired.
The Company is required to maintain financial ratios as follows:
a. Projected net revenue to projected debt service ratio should exceed 1.5:1 and 1.2:1 for the two-step loans originating from the World Bank and Asian Development Bank (“ADB”), respectively.
b. Internal financing (earnings before depreciation and finance costs) should exceed 50% and 20% compared to annual average capital expenditures for loans originating from World Bank and ADB, respectively.
As of December 31, 2011, the Company complied with the above mentioned ratios.
Refer to Note 34 for details of related party transactions.
b. Bonds and notes
| | | | January 1, 2010 | | December 31, 2010 | | December 31,2011 | |
| | | | Outstanding | | Outstanding | | Outstanding | |
| | | | Original currency | | Rupiah | | Original currency | | Rupiah | | Original currency | | Rupiah | |
Bonds and notes | | Currency | | (in billions) | | equivalent | | (in billions) | | equivalent | | (in billions) | | equivalent | |
Bonds | | | | | | | | | | | | | | | |
Series A | | Rp. | | - | | - | | - | | 1,005 | | - | | 1,005 | |
Series B | | Rp. | | - | | - | | - | | 1,995 | | - | | 1,995 | |
Medium Term Notes (“MTN”) | | | | | | | | | | | | | | | |
Metra | | Rp. | | - | | 30 | | - | | 47 | | - | | 59 | |
Sigma | | Rp. | | - | | 30 | | - | | 30 | | - | | 30 | |
PT Finnet Indonesia (“Finnet) | | Rp. | | - | | 10 | | - | | 24 | | - | | 18 | |
Promissory Notes | | | | | | | | | | | | | | | |
Huawei Tech | | US$ | | - | | - | | 0.02 | | 211 | | 0.06 | | 545 | |
PT. ZTE Indonesia (“ZTE”) | | US$ | | 0.00 | | 4 | | 0.01 | | 64 | | 0.01 | | 134 | |
Total | | | | | | 74 | | | | 3,376 | | | | 3,786 | |
Current maturities (Note17b) | | | | | | (5 | ) | | | (127 | ) | | | (385 | ) |
Long-term portion (Note18) | | | | | | 69 | | | | 3,249 | | | | 3,401 | |
F-47
Table of Contents |
PERUSAHAAN PERSEROAN (PERSERO) P.T. TELEKOMUNIKASI INDONESIA Tbk AND SUBSIDIARIES NOTES TO CONSOLIDATED FINANCIAL STATEMENTS(continued) JANUARY 1, 2010, DECEMBER 31, 2010 AND 2011 AND YEARS ENDED DECEMBER 31, 2010 AND 2011 (Figures in tables are presented in billions of Rupiah, unless otherwise stated) |
18. LONG TERM LOANS AND OTHER BORROWINGS(continued)
- Bonds and notes (continued)
1. Bonds
| | | | | | | | | | | | Interest | | Interest | |
Bonds | | Principal | | Issuer | | Listed on | | Issuance date | | Maturity date | | Payment method | | Rate per annum | |
Series A | | 1,005 | | The Company | | IDX | | June 25, 2010 | | July 6, 2015 | | Quarterly | | 9.60% | |
Series B | | 1,995 | | The Company | | IDX | | June 25, 2010 | | July 6, 2020 | | Quarterly | | 10.20% | |
Total | | 3,000 | | | | | | | | | | | | | |
The bonds are secured by all assets owned by the Company. The underwriters of the bonds arePT Bahana Securities, PT Danareksa Sekuritas and PT Mandiri Sekuritas, and the trustee is PT CIMB Niaga Tbk.
The Company received the proceeds of the issuance of bonds on July 6, 2010.
The funds received from public offering of bonds net of issuance costs, are to be used for increasing capital expenditure which consisted of: wave broadband (bandwidth, softswitching, datacom, information technology and others), infrastructure (backbone, metro network, regional metro junction, internet protocol, and satellite system), and optimizing legacy and supporting facilities (fixed wireline and wireless).
As of December 31, 2011, the rating for the bonds issued byPT Pemeringkat Efek Indonesia (Pefindo) is idAAA (stable outlook).
Based on indenture trusts agreement, the Company is required to comply with all covenants or restrictions including maintaining financial ratios as follows:
1. Debt to equity ratio should not exceed 2:1.
2. EBITDA tofinance costs ratio should not be less than 5:1.
3. Debt service coverage is 125%
As of December 31, 2011, the Company complied with the above mentioned ratios.
2. MTN
Notes | | Principal | | Issuance date | | Maturity date | | Interest Payment method | |
MTN | | | | | | | | | |
Metra I | | | | | | | | | |
Phase 1 | | 30 | | June 9, 2009 | | June 19, 2012 | | Quarterly | |
Phase 2 | | 20 | | February 1, 2010 | | February 2, 2013 | | Quarterly | |
Metra II | | | | | | | | | |
Phase 1 | | 20 | | December 28, 2011 | | December 28, 2014 | | Quarterly | |
Sigma | | 30 | | November 17, 2009 | | November 17,2014 | | Semi-annually | |
Finnet | | | | | | | | | |
Phase 1 | | 10 | | October 16, 2009 | | November 17, 2012 | | Monthly | |
Phase 2 | | 15 | | March 18, 2010 | | March 24, 2013 | | Monthly | |
| | | | | | | | | |
The Arranger of the Medium Term Notes isPT Bahana Securities, Bank Mega is acting as Trustee, and PT Kustodian Sentral Efek Indonesia (“KSEI”)isacting as Collecting Agent and Custodian. Proceeds from the issuance of MTN among others were used to expand the business and as working capital. |
F-48
Table of Contents |
PERUSAHAAN PERSEROAN (PERSERO) P.T. TELEKOMUNIKASI INDONESIA Tbk AND SUBSIDIARIES NOTES TO CONSOLIDATED FINANCIAL STATEMENTS(continued) JANUARY 1, 2010, DECEMBER 31, 2010 AND 2011 AND YEARS ENDED DECEMBER 31, 2010 AND 2011 (Figures in tables are presented in billions of Rupiah, unless otherwise stated) |
18. LONG TERM LOANS AND OTHER BORROWINGS(continued)
- Bonds and notes (continued)
2. MTN
Metra secures with a minimum value of 40% of the outstanding MTN principal. The maximum value of 60% of the outstanding MTN principal is unsecured and at all times ranked (pari passu) with other unsecured debts of Metra. Metra may buy back all or part of the MTN at any time before the maturity date of the MTN.
The MTN of Sigma and Finnet are not secured by a specific collateral, but secured by all of Sigma and Finnet’s assets. These movable or fixed property, either existing or in the future, are collateral for assets of MTN holders and at all times ranked (pari passu) without any preference with other creditor privileges in accordance with prevailing regulations. Sigma and Finnet may buyback all or part of the MTN at any time before the maturity date of MTN.
Based on the agreements,Metra, Sigma, and Finnet are required to comply with required covenants including maintaining financial ratios. As of December 31, 2011, Metra, Sigma, and Finnet complied with the ratios.
Refer to Note 34 for details of related party transactions.
3. Promissory Notes
| | | | Principal | | | | | | Interest | | Interest | |
Supplier | | Currency | | (in millions) | | Issuance date | | Payment schedule | | Payment method | | Rate per annum | |
PT Huawei Tech Investment (“Huawei Tech”) | | US$ | | 300 | | June 19, 2009 | | Semi-annually | | Semi-annually | | 6 month LIBOR+2.5% | |
(January 11, 2012 - June 23, 2014) |
PT. ZTE Indonesia (“ZTE”) | | US$ | | 100 | | August 20, 2009 | | Semi-annually | | Semi-annually | | 6 month LIBOR+2.5% 6 month LIBOR+1.5% | |
(June 10, 2012 - June 10, 2014) |
| | | | | | | | | | | | | |
Based on Agreement of Frame Supply and Deferred Payment Arrangement between the Company with ZTE and Huawei Tech, the promissory notes issued by the Company to ZTE and Huawei Tech are unsecured supplier financing facilities covering 85% of Hand Over Report (“Berita Acara Serah Terima” or BAST) projects with ZTE and Huawei Tech. |
- Bank Loans
| | | | January 1, 2010 | | December 31, 2010 | | December 31,2011 | |
| | | | Outstanding | | Outstanding | | Outstanding | |
| | | | Original currency | | Rupiah | | Original currency | | Rupiah | | Original currency | | Rupiah | |
Lenders | | Currency | | (in millions) | | equivalent | | (in millions) | | equivalent | | (in millions) | | equivalent | |
Syndication of banks | | Rp. | | - | | 5,100 | | - | | 4,500 | | - | | 3,225 | |
BCA | | Rp. | | - | | 2,600 | | - | | 2,755 | | - | | 2,271 | |
Bank Mandiri | | Rp. | | - | | 3.330 | | - | | 3,075 | | - | | 2,111 | |
BRI | | Rp. | | - | | 2,200 | | - | | 822 | | - | | 1,131 | |
ABN Amro Bank N.V., Stockholm Branch (“AAB Stockholm”) and Standard Chartered Bank | | US$ | | - | | - | | 54.18 | | 487 | | 84,97 | | 771 | |
BNI | | Rp. | | - | | 1,550 | | - | | 1,150 | | - | | 400 | |
Japan Bank for International Cooperation (“JBIC”) | | US$ | | - | | - | | 53.90 | | 486 | | 41,92 | | 381 | |
Industrial and Commercial Bank of China Limited (“ICBC”) | | US$ | | - | | - | | 46.36 | | 417 | | 38,63 | | 350 | |
OCBC NISP | | Rp. | | - | | - | | - | | 622 | | - | | 466 | |
F-49
Table of Contents |
PERUSAHAAN PERSEROAN (PERSERO) P.T. TELEKOMUNIKASI INDONESIA Tbk AND SUBSIDIARIES NOTES TO CONSOLIDATED FINANCIAL STATEMENTS(continued) JANUARY 1, 2010, DECEMBER 31, 2010 AND 2011 AND YEARS ENDED DECEMBER 31, 2010 AND 2011 (Figures in tables are presented in billions of Rupiah, unless otherwise stated) |
18. LONG TERM LOANS AND OTHER BORROWINGS(continued)
| | | | January 1, 2010 | | December 31, 2010 | | December 31,2011 | |
| | | | Outstanding | | Outstanding | | Outstanding | |
| | | | Original currency | | Rupiah | | Original currency | | Rupiah | | Original currency | | Rupiah | |
Lenders | | Currency | | (in millions) | | equivalent | | (in millions) | | equivalent | | (in millions) | | equivalent | |
Bank CIMB Niaga | | Rp. | | - | | 25 | | - | | 24 | | - | | 81 | |
PT Bank Ekonomi Raharja Tbk (“Bank Ekonomi”) | | Rp. | | - | | 74 | | - | | 79 | | - | | 69 | |
US$ | - | - | - | - | 0.40 | 4 |
Bank of China (“BoC”) | | US$ | | - | | - | | 17.68 | | 159 | | - | | - | |
Finnish Export Credit Ltd | | US$ | | - | | - | | 16.58 | | 149 | | - | | - | |
The Export-Import Bank of Korea (“Korea Eximbank”) | | US$ | | 35 | | 333 | | 11.76 | | 106 | | - | | - | |
PT ANZ Panin Bank (“ANZ Panin”) | | Rp. | | - | | 1,000 | | - | | - | | - | | - | |
PT Bank Internasional Indonesia Tbk (“BII”) | | Rp. | | - | | 500 | | - | | - | | - | | - | |
Citibank | | Rp. | | - | | 200 | | - | | - | | - | | - | |
Others (each below Rp.50 billion) | | Rp. | | - | | 1 | | - | | 8 | | - | | 1 | |
Total | | | | | | 16,913 | | | | 14,839 | | | | 11,261 | |
Unamortized debt issue cost | | | | | | - | | | | (105 | ) | | | (70 | ) |
| | | | | | 16,913 | | | | 14,734 | | | | 11,191 | |
Current maturities (Note 17b) | | | | | | (5,826 | ) | | | (4,478 | ) | | | (3,960 | ) |
Long-term portion(Note 18) | | | | | | 11,087 | | | | 10,256 | | | | 7,231 | |
| | | | | | | | | | | | | | | |
Refer to Note 34 for details of related party transactions. |
|
Other significant information relating to bank loans as at December 31, 2011 is as follows: |
|
| | | | | | Total Facility | | | | Interest | | Interest | | | |
| | Borrower | | Currency | | (in billions) | | Payment schedule | | Payment period | | Rate per annum | | Security | |
Syndication of banks | | | | | | | | | | | | | | | |
July 29, 2008a | | The Company | | Rp. | | 2,400 | | Semi-annually | | Quarterly | | 3 months | | None | |
(BNI, BRI and Bank Jabar) | (2010 - 2013) | JIBOR+1.20% |
June 16, 2009a | | The Company | | Rp. | | 2,700 | | Semi-annually | | Quarterly | | 3 months | | None | |
(BNI and BRI) | (2011 - 2014) | JIBOR+2.45% |
BCA | | | | | | | | | | | | | | | |
July 3, 2009b | | Telkomsel | | Rp. | | 2,000 | | Semi-annually | | Quarterly | | 3 months | | None | |
(2010 - 2014) | JIBOR+1.50% |
July 5, 2010b&c | | Telkomsel | | Rp. | | 2,000 | | Semi-annually | | Quarterly | | 3 months | | None | |
(2012 - 2016) | JIBOR+1.20% |
December 16, 2010a | | TII | | Rp. | | 2,00 | | Semi-annually | | Quarterly | | 3 months | | None | |
(2011 - 2015) | JIBOR+1.25% |
Bank Mandiri | | | | | | | | | | | | | | | |
July 3, 2009b | | Telkomsel | | Rp. | | 2,000 | | Semi-annually | | Quarterly | | 3 months | | None | |
(2010 - 2014) | JIBOR+1.50% |
July 5, 2010 b&c | | Telkomsel | | Rp. | | 3,000 | | Semi-annually | | Quarterly | | 3 months | | None | |
(2012 - 2016) | JIBOR+1.20% |
BRI | | | | | | | | | | | | | | | |
October 13, 2010a | | The Company | | Rp. | | 3,000 | | Semi-annually | | Quarterly | | 3 months | | None | |
(2013 - 2015) | JIBOR+1.25% |
July 20, 2011a | | Dayamitra | | Rp. | | 1,000 | | Semi-annually | | Quarterly | | 3 months | | Property plants and Equipments (Note 11) | |
(2011 - 2017) | JIBOR+1.40% |
F-50
Table of Contents |
PERUSAHAAN PERSEROAN (PERSERO) P.T. TELEKOMUNIKASI INDONESIA Tbk AND SUBSIDIARIES NOTES TO CONSOLIDATED FINANCIAL STATEMENTS(continued) JANUARY 1, 2010, DECEMBER 31, 2010 AND 2011 AND YEARS ENDED DECEMBER 31, 2010 AND 2011 (Figures in tables are presented in billions of Rupiah, unless otherwise stated) |
18. LONG TERM LOANS AND OTHER BORROWINGS(continued)
- Bank Loans (continued)
| | | | | | Total Facility | | | | Interest | | Interest | | | |
| | Borrower | | Currency | | (in billions) | | Payment schedule | | Payment period | | Rate per annum | | Security | |
ABN Amro Bank N.V. Stockholm Branch and Standard Chartered Bank | | | | | | | | | | | | | | | |
December 30, 2009b&d | | Telkomsel | | US$ | | 0.3 | | Semi-annually | | Semi-annually | | 6 months | | None | |
(2011 - 2016) | LIBOR+0.82% |
BNI | | | | | | | | | | | | | | | |
October 13, 2010a | | The Company | | Rp | | 1,000 | | Semi-annually | | Quarterly | | 3 months | | None | |
(2013 - 2015) | LIBOR+1.25% |
Japan Bank for International Cooperation (“JBIC”) | | | | | | | | | | | | | | | |
March 26, 2010a&e | | The Company | | US$ | | 0.06 | | Semi-annually | | Semi-annually | | 4.56% and 6 months | | None | |
(2010 - 2015) | LIBOR+0.70% |
Industrial and Commercial Bank of China Limited (“ICBC”) | | | | | | | | | | | | | | | |
December 30, 2009b&f | | Telkomsel | | US$ | | 0.3 | | Semi-annually | | Semi-annually | | 6 months | | None | |
(2011 - 2016) | LIBOR+1.20% |
OCBC NISP | | | | | | | | | | | | | | | |
November 2, 2009b&g | | Telkomsel | | Rp. | | 500 | | Semi-annually | | Quarterly | | 3 months | | None | |
(2010 - 2014) | JIBOR+3.00% |
November 2, 2009b&g | | Telkomsel | | Rp. | | 200 | | Semi-annually | | Quarterly | | 3 months | | None | |
(2010 - 2014) | JIBOR+3.00% |
Bank CIMB Niaga | | | | | | | | | | | | | | | |
March 21, 2007h | | GSD | | Rp. | | 21 | | Quarterly | | Monthly | | 9.75% | | Property,plants and Equipments (Note 11) | |
(2007 - 2015) |
November 23, 2007h | | GSD | | Rp. | | 9 | | Monthly | | Monthly | | 9.75% | | Property,plants and Equipments (Note 11) | |
(2007 - 2012) |
July 28, 2009i | | Balebat | | Rp. | | 3 | | Monthly | | Monthly | | 11.50% | | Property, plants and Equipments (Note 11), inventories (Note 7), and trade receivables (Note 6) | |
(2010-2014) |
May 24, 2010 | | Balebat | | Rp. | | 3 | | Monthly | | Monthly | | 11.50% | | Property, plants and equipments (Note 11), Inventories (Note 7), and trade receivables (Note 6) | |
(2010-2015) |
F-51
Table of Contents |
PERUSAHAAN PERSEROAN (PERSERO) P.T. TELEKOMUNIKASI INDONESIA Tbk AND SUBSIDIARIES NOTES TO CONSOLIDATED FINANCIAL STATEMENTS(continued) JANUARY 1, 2010, DECEMBER 31, 2010 AND 2011 AND YEARS ENDED DECEMBER 31, 2010 AND 2011 (Figures in tables are presented in billions of Rupiah, unless otherwise stated) |
18. LONG TERM LOANS AND OTHER BORROWINGS(continued)
- Bank Loans (continued)
| | | | | | Total Facility | | | | Interest | | Interest | | | |
| | Borrower | | Currency | | (in billions) | | Payment schedule | | Payment period | | Rate per annum | | Security | |
Bank CIMB Niaga (continued) | | | | | | | | | | | | | | | |
March 31, 2011 | | GSD | | Rp. | | 13 | | Monthly | | Monthly | | 9.75% | | Property, plants and equipments (Note 11) and trade receivables (Note 6) | |
(2011 - 2019) |
March 31, 2011 | | GSD | | Rp. | | 24 | | Monthly | | Monthly | | 9.75% | | Property, plants and equipments (Note 11) and trade receivables (Note 6) | |
(2011 - 2019) |
March 31, 2011 | | GSD | | Rp. | | 12 | | Monthly | | Monthly | | 9.75% | | Property, plants and Equipments (Note 11) and trade Receivables (Note 6) | |
(2011 - 2015) |
September 9, 2011 | | GSD | | Rp. | | 11 | | Monthly | | Monthly | | 9.75% | | Property, plants and Equipments (Note 11) and trade Receivables (Note 6) | |
(2011 - 2015) |
September 9, 2011 | | GSD | | Rp. | | 41 | | Monthly | | Monthly | | 9.75% | | Property, plants and Equipments (Note 11) and trade Receivables (Note 6) | |
(2011 - 2021) |
Bank Ekonomi | | | | | | | | | | | | | | | |
December 7, 2006a&j | | Sigma | | Rp. | | 14 | | Monthly | | Monthly | | 9.00% - 10.50% | | Property, plants and Equipments (Note 11) and trade Receivables (Note 6) | |
(2006 - 2012) |
March 9, 2007a&j | | Sigma | | Rp. | | 13 | | Monthly | | Monthly | | 9.00% - 10.50% | | Property, plants and Equipments (Note 11) and trade Receivables (Note 6) | |
(2008 - 2012) |
September 10, 2008a&j | | Sigma | | Rp. | | 33 | | Monthly | | Monthly | | 9.00% - 10.50% | | Property, plants and Equipments (Note 11) and trade Receivables (Note 6) | |
(2009 - 2015) |
August 7, 2009a&j | | Sigma | | Rp. | | 35 | | Monthly some installment | | Monthly | | 9.00% - 10.50% | | Property, plants and Equipments (Note 11) and trade Receivables (Note 6) | |
(2009- 2013) |
F-52
Table of Contents |
PERUSAHAAN PERSEROAN (PERSERO) P.T. TELEKOMUNIKASI INDONESIA Tbk AND SUBSIDIARIES NOTES TO CONSOLIDATED FINANCIAL STATEMENTS(continued) JANUARY 1, 2010, DECEMBER 31, 2010 AND 2011 AND YEARS ENDED DECEMBER 31, 2010 AND 2011 (Figures in tables are presented in billions of Rupiah, unless otherwise stated) |
18. LONG TERM LOANS AND OTHER BORROWINGS(continued)
- Bank Loans (continued)
| | | | | | Total Facility | | | | Interest | | Interest | | | |
| | Borrower | | Currency | | (in billions) | | Payment schedule | | Payment period | | Rate per annum | | Security | |
Bank Ekonomi (continued) | | | | | | | | | | | | | | | |
August 7, 2009a&j | | Sigma | | Rp. | | 20 | | Monthly some installment | | Monthly | | 9.00% - 10.50% | | Property, plants and Equipments (Note 11) and trade Receivables (Note 6), | |
(2009 - 2014) |
February 23, 2011a&j | | Sigma | | Rp. | | 30 | | Monthly | | Monthly | | 9.00% - 10.50% | | Property, plants and Equipments (Note 11) and trade Receivables (Note 6), | |
(2011 - 2015) |
February 23, 2011a&j | | Sigma | | US$ | | 0.002 | | Monthly | | Monthly | | 6.00% | | Property, plants and Equipments (Note 11) and trade Receivables (Note 6), | |
(2011 - 2015) |
| | | | | | | | | | | | | | | |
The credit facilities obtained by the Company and its subsidiaries are used for working capital purpose. aAs stated in the agreements, the Company and its subsidiaries are required to comply with all covenants or restrictions including maintaining financial ratios as follows. As of December 31, 2011, the Company and its subsidiaries has complied with the ratios. bTelkomsel has no collateral for its bank loans, or other credit facilities. The terms of the various agreements with Telkomsel’s lenders and financiers require compliance with a number of pledges and negative pledges as well as financial and other covenants, which include among other things, certain restrictions on the amount of dividends and other profit distributions which could adversely affect the Telkomsel’s capacity to comply with its obligation under the facility. The terms of the relevant agreements also contain default and cross default clauses. As of December 31, 2011, Telkomsel has complied with the above covenants. cPursuant to expiry of availability periods of facilities from BCA and Bank Mandiri, those banks have approved extension of the availability periods to January 2012. The approval from BCA and Bank Mandiri for extension of the availability period was formalized through amendment of loan agreement on July 20 and 21, 2011. dPursuant to the agreements with PT Ericsson Indonesia (“Ericsson Indonesia”) and Ericsson AB (Note 37a.ii), Telkomsel entered into an EKN-Backed Facility Agreement (“facility”) with ABN Amro Bank N.V. Stockholm Branch (as “the original lender”) and Standard Chartered Bank (“SCB”) (as “the original lender” , “the arranger”, “the facility agent” and “the EKN agent”), ABN Amro Bank N.V., Hong Kong (as “the arranger”) for the purchase of Ericsson telecommunication equipment and services. The facilities consist of facility 1, 2 and 3 amounting to US$117 million, US$106 million and US$95 million, respectively. The availability period of Facility 1 expired in July 2010 with no outstanding loan balance and the availability period of facility 2 expired in March 2011. Pursuant to expiry of availability period of Facility 2, EKN agreed to reduce premium of the unused facility by US$3 million through a cash refund. eIn connection with the agreement with NSW-Fujitsu Consortium, the Company entered into a loan agreement with JBIC, the international arm of Japan Finance Corporation for the purchase of NSW-Fujitsu Consortium telecommunication equipment and services. The facilities consist of facility A and��B amounting to US$36 million and US$24 million. fPursuant to the agreements with Huawei International Pte.Ltd. (“Huawei International“) and PT Huawei Tech Investment (“Huawei Tech”) (Note 37a.ii), Telkomsel entered into a Sinosure-Backed Facility Agreement with the ICBC for the purchase of Huawei Tech telecommunication equipment and services. The facilities consist of facility 1 and 2 amounting to US$166 million and US$100 million, respectively, including premium of US$16 million. The availability period of Facility 1 expired in December 2010.Pursuant to expiry of availability period of Facility 1, Telkomsel has requested Sinosure to reduce a portion of premium for the unused facility. In December 2011, Sinosure approved Telkomsel’s plan to repay the remaining loan in January 2012 (Note 42c) and agreed to refund premium portion for the unused facility. Accordingly, the remaining loan is classified as a current portion. |
F-53
Table of Contents |
PERUSAHAAN PERSEROAN (PERSERO) P.T. TELEKOMUNIKASI INDONESIA Tbk AND SUBSIDIARIES NOTES TO CONSOLIDATED FINANCIAL STATEMENTS(continued) JANUARY 1, 2010, DECEMBER 31, 2010 AND 2011 AND YEARS ENDED DECEMBER 31, 2010 AND 2011 (Figures in tables are presented in billions of Rupiah, unless otherwise stated) |
18. LONG TERM LOANS AND OTHER BORROWINGS(continued)
- Bank Loans (continued)
g In December 2011, Telkomsel notified OCBC NISP that Telkomsel plans to repay whole parts of the remaining loan in February 2, 2012 (Note 42d). Accordingly, the remaining loan is classified as a current portion.
h Based on the latest amendment on March 31, 2011.
i Based on the latest amendment on May 24, 2010.
j Based on the latest amendment on November 23, 2011.
19. NON-CONTROLLING INTEREST
| | | | | | | |
| | January 1, 2010 | | December 31, 2010 | | December 31, 2011 | |
Non-controlling interest in net assets of subsidiaries: | | | | | | | |
Telkomsel | | 10,828 | | 11,886 | | 13,275 | |
Metra* | | 59 | | 17 | | 32 | |
Infomedia* | | 7 | | 8 | | 8 | |
Total | | 10,894 | | 11,911 | | 13,315 | |
| | 2010 | | 2011 | |
Non-controlling interest in total comprehensive income of subsidiaries: | | | | | |
Telkomsel | | 4,282 | | 4,417 | |
Metra* | | 5 | | 16 | |
Infomedia* | | 1 | | 1 | |
Total | | 4,288 | | 4,434 | |
*These amounts represent other third parties’ share of ownership in subsidiaries of Metra and Infomedia.
20. CAPITAL STOCK
| | January 1, 2010 | |
Description | | Number of shares | | Percentage of ownership | | Total paid-up capital | |
Series A Dwiwarna share | | | | | | | |
Government | | 1 | | - | | - | |
Series B shares | | | | | | | |
Government | | 10,320,470,711 | | 52.47 | | 2,580 | |
The Bank of New York Mellon Corporation* | | 1,788,730,056 | | 9.09 | | 447 | |
Directors (Note 1b): | | | | | | | |
Ermady Dahlan | | 17,604 | | - | | - | |
Indra Utoyo | | 5,508 | | - | | - | |
Public (individually less than 5%) | | 7,560,200,900 | | 38.44 | | 1,890 | |
Total | | 19,669,424,780 | | 100.00 | | 4,917 | |
Treasury stock (Note 22) | | 490,574,500 | | - | | 123 | |
Total | | 20,159,999,280 | | 100.00 | | 5,040 | |
* The Bank of New York Mellon Corporation serves as the Depositary of registered ADS holders for the Company’s ADSs.
F-54
Table of Contents |
PERUSAHAAN PERSEROAN (PERSERO) P.T. TELEKOMUNIKASI INDONESIA Tbk AND SUBSIDIARIES NOTES TO CONSOLIDATED FINANCIAL STATEMENTS(continued) JANUARY 1, 2010, DECEMBER 31, 2010 AND 2011 AND YEARS ENDED DECEMBER 31, 2010 AND 2011 (Figures in tables are presented in billions of Rupiah, unless otherwise stated) |
20. CAPITAL STOCK(continued)
| | December 31, 2010 | |
Description | | Number of shares | | Percentage of ownership | | Total paid-up capital | |
Series A Dwiwarna share | | | | | | | |
Government | | 1 | | - | | - | |
Series B shares | | | | | | | |
Government | | 10,320,470,711 | | 52.47 | | 2,580 | |
The Bank of New York Mellon Corporation* | | 2,394,970,656 | | 12.18 | | 599 | |
Directors (Note 1b): | | | | | | | |
Ermady Dahlan | | 17,604 | | - | | - | |
Indra Utoyo | | 5,508 | | - | | - | |
Public (individually less than 5%) | | 6,953,960,300 | | 35.35 | | 1,738 | |
Total | | 19,669,424,780 | | 100.00 | | 4,917 | |
Treasury stock (Note 22) | | 490,574,500 | | - | | 123 | |
Total | | 20,159,999,280 | | 100.00 | | 5,040 | |
* The Bank of New York Mellon Corporation serves as the Depositary of registered ADS holders for the Company’s ADSs.
| | December 31, 2011 | |
Description | | Number of shares | | Percentage of ownership | | Total paid-up capital | |
Series A Dwiwarna share | | | | | | | |
Government | | 1 | | - | | - | |
Series B shares | | | | | | | |
Government | | 10,320,470,711 | | 53.24 | | 2,580 | |
The Bank of New York Mellon Corporation* | | 2,952,965,536 | | 15.23 | | 738 | |
Directors (Note 1b): | | | | | | | |
Ermady Dahlan | | 17,604 | | - | | - | |
Indra Utoyo | | 5,508 | | - | | - | |
Public (individually less than 5%) | | 6,112,879,960 | | 31.53 | | 1,529 | |
Total | | 19,386,339,320 | | 100.00 | | 4,847 | |
Treasury stock (Note 22) | | 773,659,960 | | - | | 193 | |
Total | | 20,159,999,280 | | 100.00 | | 5,040 | |
| | | | | | | |
* The Bank of New York Mellon Corporation serves as the Depositary of registered ADS holders for the Company’s ADSs. |
| | | | | | | |
The Company only issued 1 Series A Dwiwarna share which is held by the Government and cannot be transferred to any party, and has a veto in the General Meeting of Stockholders of the Company with respect to election and removal of the Board of Commissioners and Directors, issuance of new shares and to amend the Company’s Articles of Association. Series B shares give the same and equal rights to all the Series B stockholders. Pursuant to the AGM of Stockholders of the Company as stated in notarial deed No. 17 dated June 11, 2010 of A. Partomuan Pohan, S.H., LLM., the stockholders approved the distribution of cash dividends for 2009 amounting to Rp.5,666 billion or Rp.288.06 per share (of which Rp.524 billion or Rp.26.65 per share was distributed as an interim cash dividend in November 2009). Pursuant to the AGM of Stockholders of the Company as stated in notarial deed No. 21 dated May 19, 2011 of A. Partomuan Pohan, S.H., LLM., the stockholders approved the distribution of cash dividends for 2010 amounting to Rp.6,345 billion or Rp.322.59 per share (of which Rp.526 billion or Rp.26.75 per share was distributed as an interim cash dividend in December 2010). |
F-55
Table of Contents |
PERUSAHAAN PERSEROAN (PERSERO) P.T. TELEKOMUNIKASI INDONESIA Tbk AND SUBSIDIARIES NOTES TO CONSOLIDATED FINANCIAL STATEMENTS(continued) JANUARY 1, 2010, DECEMBER 31, 2010 AND 2011 AND YEARS ENDED DECEMBER 31, 2010 AND 2011 (Figures in tables are presented in billions of Rupiah, unless otherwise stated) |
21. ADDITIONAL PAID-IN CAPITAL
Description | | January 1, 2010 | | December 31, 2010 | | December 31, 2011 | |
Proceeds from sale of 933,333,000 shares in excess of par value through IPO in 1995 | | 1,446 | | 1,446 | | 1,446 | |
Capitalization into 746,666,640 Series B shares in 1999 | | (373 | ) | (373 | ) | (373 | ) |
Total | | 1,073 | | 1,073 | | 1,073 | |
22. TREASURY STOCK
Movement in treasury stock as a result of share repurchase is as follow:
| | January1, 2010 | | December 31,2010 | | December 31,2011 | |
| | Number | | % | | Rp. | | Number | | % | | Rp. | | Number | | % | | Rp. | |
of shares | of shares | of shares |
Balance beginning | | 490,574,500 | | 2.43 | | 4,264 | | 490,574,500 | | 2.43 | | 4,264 | | 490,574,500 | | 2.43 | | 4,264 | |
Number of shares acquired | | - | | - | | - | | - | | - | | - | | 283,085,460 | | 1.41 | | 2,059 | |
Balance ending | | 490,574,500 | | 2.43 | | 4,264 | | 490,574,500 | | 2.43 | | 4,264 | | 773,659,960 | | 3.84 | | 6,323 | |
Pursuant to the AGM of Stockholders of the Company dated June 11, 2010, the stockholders approved the changes to the Company’s plan for use of the treasury stock as result of the Share Buy Back I, II and III, as follows: (i) market placement; (ii) cancellation; (iii) equity conversion; and (iv) funding.
23. OTHER RESERVES
Other reserves consist of the translation reserve and fair value reserve. The translation reserve comprises all foreign currency differences arising from the translation of the financial statements of foreign operations (including equity accounted investees) and amounted to Rp.nil, Rp.2 billion, Rp.9 billion as of January 1, 2010, December 31, 2010 and 2011, respectively
The fair value reserve comprises the cumulative net change in the fair value of available-for-sale financial assets until the investments are derecognized or impaired and amounted to Rp.18 billion, Rp.50 billion, Rp.47 billion as of January 1, 2010, December 31, 2010 and 2011, respectively.
24. BASIC EARNINGS PER SHARE
Basic earnings per share is computed by dividingincome for the year attributable to owners of the parent by the weighted average number of shares outstanding during the year, totaling 19,669,424,780 and 19,591,872,544 in 2010 and 2011, respectively.
Basic earning per share amounted to Rp.580.95, and Rp.553.70 (full amount) for the years ended December 31, 2010 and 2011, respectively.
F-56
Table of Contents |
PERUSAHAAN PERSEROAN (PERSERO) P.T. TELEKOMUNIKASI INDONESIA Tbk AND SUBSIDIARIES NOTES TO CONSOLIDATED FINANCIAL STATEMENTS(continued) JANUARY 1, 2010, DECEMBER 31, 2010 AND 2011 AND YEARS ENDED DECEMBER 31, 2010 AND 2011 (Figures in tables are presented in billions of Rupiah, unless otherwise stated) |
25. REVENUES
| | 2010 | | 2011 | |
Telephone Revenues | | | | | |
Cellular | | | | | |
Usage charges | | 28,024 | | 27,189 | |
Features | | 582 | | 838 | |
Monthly subscription charges | | 488 | | 569 | |
Connection fee charges | | 40 | | 2 | |
| | 29,134 | | 28,598 | |
Fixed lines | | | | | |
Usage charges | | 9,287 | | 8,213 | |
Monthly subscription charges | | 3,251 | | 3,004 | |
Installation charges | | 179 | | 135 | |
Others | | 223 | | 267 | |
| | 12,940 | | 11,619 | |
TotalTelephoneRevenues | | 42,074 | | 40,217 | |
Interconnection Revenues | | | | | |
Domestic interconnection and transit | | 2,174 | | 2,071 | |
International interconnection | | 1,561 | | 1,438 | |
Total Interconnection Revenues | | 3,735 | | 3,509 | |
Data,Internet andInformationTechnologyServices Revenues | | | | | |
Short Messaging Services (“SMS”) | | 11,289 | | 13,093 | |
Internet, data communication and information technology services | | 8,297 | | 10,548 | |
Voip | | 197 | | 245 | |
e-Business | | 18 | | 38 | |
Total Data, Internet and Information Technology Services Revenues | | 19,801 | | 23,924 | |
Network Revenues | | | | | |
Leased lines | | 687 | | 911 | |
Satellite transponder lease | | 371 | | 390 | |
Total Network Revenues | | 1,058 | | 1,301 | |
Other Telecommunications Services Revenues | | | | | |
Customer Premise Equipment (“CPE”) and terminal | | 851 | | 739 | |
Directory assistance | | 322 | | 349 | |
Pay TV | | 159 | | 259 | |
USO Compensation | | 242 | | 415 | |
Sales of modem | | 170 | | 163 | |
Others | | 117 | | 362 | |
Total Other Telecommunications Services Revenues | | 1,861 | | 2,287 | |
TOTAL REVENUES | | 68,529 | | 71,238 | |
Refer to Note 34 for details of related party transactions.
F-57
Table of Contents |
PERUSAHAAN PERSEROAN (PERSERO) P.T. TELEKOMUNIKASI INDONESIA Tbk AND SUBSIDIARIES NOTES TO CONSOLIDATED FINANCIAL STATEMENTS(continued) JANUARY 1, 2010, DECEMBER 31, 2010 AND 2011 AND YEARS ENDED DECEMBER 31, 2010 AND 2011 (Figures in tables are presented in billions of Rupiah, unless otherwise stated) |
26. SERVICE CONCESSION ARRANGEMENT
Under Telecommunication Law No. 36 of 1999, all telecommunication network operators and service providers are bound by the Universal Service Obligation (“USO”), which requires the network operators and telecommunication service providers to make a contribution towards providing universal telecommunication facilities and infrastructure in Indonesia.
Based on Government Decree No. 7, dated January 16, 2009 and Decree No. 05/PER/M.KOMINFO/2/2007 dated February 28, 2007, telecommunication operators are required to contribute 1.25% of gross revenues, net of bad debts and/or interconnection charges and/or connection charges to USO development. These contributions are expensed when incurred.
Decree No. 32/PER/M.KOMINFO/10/2008 dated October 10, 2008 stipulates that in providing telecommunications access and services in rural areas (USO Program), the provider is determined through a selection process by Balai Telekomunikasi dan Informatika Perdesaan (“BTIP”), which was established based on Decree No. 35/PER/M.KOMINFO/11/2006 dated November 30, 2006 of the Ministry of Communication and Information Technology. Subsequently, BTIP was replaced by Balai Penyedia dan Pengelola Pembiayaan Telekomunikasi dan Informatika (“BPPPTI”) which was established based on Decree No. 18/PER/M.KOMINFO/11/2010 dated November 19, 2010 of the Ministry of Communication and Information Technology.
As mandated by Decree No. 32/PER/M.KOMINFO/10/2008, the USO program is divided into seven packages covering various areas in Indonesia.
BTIP in its letters dated January 16, 2009 and January 23, 2009, notified Telkomsel that it had been selected as a provider of the USO Program for the 1st, 2nd, 3rd, 6th and 7th Packages with a total price of Rp.1.66 trillion.
Subsequently, in 2010 and 2011, the USO agreements were amended, which amendments cover, among other things, change the price to Rp.1,758 billion and change the term of payment from quarterly to monthly or quarterly.
In January 2010, the Ministry granted Telkomsel operating licenses to provide local fixed-line service under the USO program.
On March 12, 2010, the Company was selected in a tender by the Government through BTIP to provide internet access service centers for USO sub-districts for a total amount of Rp.322 billion, covering Nanggroe Aceh Darussalam, Sumatera Utara, Sulawesi Utara, Gorontalo, Sulawesi Tengah, Sulawesi Barat, Sulawesi Selatan and Sulawesi Tenggara.
On December 23, 2010, the Company was selected in a tender by the Government through BTIP to provide mobile internet access service centers for USO sub-districts for a total amount of Rp.528 billion, covering Jambi, Riau, Kepulauan Riau, Sulawesi Utara, Sulawesi Tengah, Gorontalo, Sulawesi Barat, Sulawesi Tenggara, Kalimantan Tengah, Sulawesi Selatan, Papua, and Irian Jaya Barat.
On December 27, 2011, Telkomsel (on behalf of Konsorsium Telkomsel, a consortium which was established with Dayamitra on December 9, 2011) was selected by BPPPTI as provider of USO Program in the border areas for all packages (package 1 to package 13) and USO Program of “Desa Pinter” or “Desa Punya Internet” for 1, 2 and 3 packages with a total price of Rp.830 billion and Rp.261 billion respectively.
F-58
Table of Contents |
PERUSAHAAN PERSEROAN (PERSERO) P.T. TELEKOMUNIKASI INDONESIA Tbk AND SUBSIDIARIES NOTES TO CONSOLIDATED FINANCIAL STATEMENTS(continued) JANUARY 1, 2010, DECEMBER 31, 2010 AND 2011 AND YEARS ENDED DECEMBER 31, 2010 AND 2011 (Figures in tables are presented in billions of Rupiah, unless otherwise stated) |
26. SERVICE CONCESSION ARRANGEMENT(continued)
The service concession agreements do not contain a renewal option. The standard rights of BTIP to terminate the agreements includewithin 60 days whenTelkomsel failed in delivering substantial performance and in the event of a material breach in the term of the agreements. The standard rights of Telkomsel to terminate the agreements includeafailure of BTIP to make payment under the agreements in maximum 45 days as per the agreed payment schedule.
For the years ended December 31,2011and 2010, the Company and Telkomsel recognized the following amounts :
| | 2010 | | 2011 | |
The Company | | | | | |
Revenue - construction | | - | | 112 | |
Loss - construction | | - | | (16 | ) |
Telkomsel | | | | | |
Revenue - operation of telecommunication service centre | | 244 | | 255 | |
Profit –operation of telecommunication service centre | | 79 | | 105 | |
The revenue recognized in relation to construction represents the fair value of the construction services provided in constructing the telecommunication service centre.
27. PERSONNEL EXPENSES
| | 2010 | | 2011 | |
Salaries and related benefits | | 2,751 | | 3,001 | |
Vacation pay, incentives and other benefits | | 2,575 | | 2,814 | |
Employees’ income tax | | 796 | | 1,043 | |
Net periodic pension costs (Note 32) | | 624 | | 629 | |
Early retirement programs | | - | | 517 | |
Net periodic post-employment health care benefits costs (Note 32) | | 238 | | 199 | |
Housing | | 214 | | 197 | |
LSA (Note 33) | | 78 | | 96 | |
Insurance | | 68 | | 70 | |
Other post-retirement cost (Note 32) | | 61 | | 53 | |
Other employees’ benefits (Note 32) | | 23 | | 30 | |
Others | | 19 | | 22 | |
Total | | 7,447 | | 8,671 | |
F-59
Table of Contents |
PERUSAHAAN PERSEROAN (PERSERO) P.T. TELEKOMUNIKASI INDONESIA Tbk AND SUBSIDIARIES NOTES TO CONSOLIDATED FINANCIAL STATEMENTS(continued) JANUARY 1, 2010, DECEMBER 31, 2010 AND 2011 AND YEARS ENDED DECEMBER 31, 2010 AND 2011 (Figures in tables are presented in billions of Rupiah, unless otherwise stated) |
28.OPERATIONS, MAINTENANCE AND TELECOMMUNICATION SERVICES EXPENSES
| | 2010 | | 2011 | |
Operations and maintenance | | 8,836 | | 9,184 | |
Radio frequency usage charges (Notes34c.iand37) | | 2,892 | | 2,846 | |
Concession fees andUniversal Service Obligation charges (Note 26) | | 1,177 | | 1,235 | |
Cost of phone, set top box, SIM and RUIM cards | | 1,067 | | 967 | |
Electricity, gas and water | | 841 | | 836 | |
Insurance | | 384 | | 431 | |
Leased lines and CPE | | 215 | | 406 | |
Vehicles rental and supporting facilities | | 283 | | 291 | |
Cost of IT services | | 200 | | 144 | |
Traveling | | 60 | | 54 | |
Others | | 91 | | 59 | |
Total | | 16,046 | | 16,453 | |
Refer to Note 34 for details of related party transactions.
29. GENERAL AND ADMINISTRATIVE EXPENSES
| | 2010 | | 2011 | |
Provision for impairment of receivables and inventory obsolescence (Notes 6d and 7) | | 525 | | 883 | |
Collection expenses | | 401 | | 327 | |
General | | 301 | | 326 | |
Social contribution | | 171 | | 290 | |
Traveling | | 260 | | 256 | |
Professional fees | | 163 | | 235 | |
Training, education and recruitment | | 216 | | 229 | |
Security and screening | | 215 | | 97 | |
Meetings | | 80 | | 86 | |
Stationery and printing | | 64 | | 53 | |
Vehicle rental | | 51 | | 43 | |
Others | | 90 | | 110 | |
Total | | 2,537 | | 2,935 | |
Refer to Note 34 for details of related party transactions.
F-60
Table of Contents |
PERUSAHAAN PERSEROAN (PERSERO) P.T. TELEKOMUNIKASI INDONESIA Tbk AND SUBSIDIARIES NOTES TO CONSOLIDATED FINANCIAL STATEMENTS(continued) JANUARY 1, 2010, DECEMBER 31, 2010 AND 2011 AND YEARS ENDED DECEMBER 31, 2010 AND 2011 (Figures in tables are presented in billions of Rupiah, unless otherwise stated) |
30. INTERCONNECTION EXPENSES
| | 2010 | | 2011 | |
Domestic interconnection and transit | | 1,980 | | 2,414 | |
International interconnection | | 1,106 | | 1,141 | |
Total | | 3,086 | | 3,555 | |
Refer to Note34 for details of related party transactions.
31. TAXATION
a. Prepaid income taxes
| | January 1, 2010 | | December 31, 2010 | | December 31, 2011 | |
Corporate income taxes: | | 255 | | - | | - | |
The Company | | 535 | | 682 | | 633 | |
Subsidiaries | | 790 | | 682 | | 633 | |
b. Prepaid other taxes
| | January 1, 2010 | | December 31, 2010 | | December 31, 2011 | |
Other taxes - The Company: | | | | | | | |
VAT | | - | | - | | 43 | |
Other taxes - subsidiaries: | | | | | | | |
VAT | | 253 | | 157 | | 471 | |
Article 23 - Withholding tax on services delivery | | 2 | | 10 | | 11 | |
Article 26 – Witholding tax on non-resident Income tax | | 1 | | - | | - | |
| | 256 | | 167 | | 525 | |
c. Current income tax liabilities
| | January 1, 2010 | | December 31, 2010 | | December 31, 2011 | |
Corporate income taxes - The Company: | | | | | | | |
Article 25 - Installment of corporate income tax | | 46 | | 32 | | 40 | |
Article 29 - Underpayment of corporate income tax | | 27 | | 10 | | 1 | |
Corporate income taxes - subsidiaries: | | | | | | | |
Article 25 - Installment of corporate income tax | | 317 | | 405 | | 6 | |
Article 29 - Underpayment of corporate income tax | | 782 | | 16 | | 682 | |
| | 1,172 | | 463 | | 729 | |
F-61
Table of Contents |
PERUSAHAAN PERSEROAN (PERSERO) P.T. TELEKOMUNIKASI INDONESIA Tbk AND SUBSIDIARIES NOTES TO CONSOLIDATED FINANCIAL STATEMENTS(continued) JANUARY 1, 2010, DECEMBER 31, 2010 AND 2011 AND YEARS ENDED DECEMBER 31, 2010 AND 2011 (Figures in tables are presented in billions of Rupiah, unless otherwise stated) |
31. TAXATION(continued)
d. Other tax liabilities
| | January 1, 2010 | | December 31, 2010 | | December 31, 2011 | |
Other taxes - The Company: | | | | | | | |
Article 4 (2) - Final tax | | 6 | | 7 | | 4 | |
Article 21 - Individual income tax | | 52 | | 67 | | 68 | |
Article 22 - Withholding tax on goods delivery and imports | | 3 | | - | | | |
Article 23 - Withholding tax on services delivery | | 17 | | 11 | | 11 | |
Article 26 - Withholding tax on non-resident income tax | | 35 | | 1 | | 1 | |
VAT | | 171 | | 13 | | - | |
| | 284 | | 99 | | 84 | |
Other taxes - subsidiaries: | | | | | | | |
Article 4 (2) - Final tax | | 16 | | 15 | | 29 | |
Article 21 - Individual income tax | | 28 | | 36 | | 75 | |
Article 23 - Withholding tax on services delivery | | 34 | | 43 | | 25 | |
Article 26 - Withholding tax on non-resident income tax | | 46 | | 18 | | 10 | |
VAT | | 170 | | 62 | | 87 | |
| | 294 | | 174 | | 226 | |
| | 578 | | 273 | | 310 | |
e. The components of income tax expense (benefit) are as follows:
| | 2010 | | 2011 | |
Current | | | | | |
The Company | | 558 | | 777 | |
Subsidiaries | | 4,111 | | 4,896 | |
| | 4,669 | | 5,673 | |
Deferred | | | | | |
The Company | | 640 | | (7 | ) |
Subsidiaries | | 203 | | (281 | ) |
| | 843 | | (288 | ) |
| | 5,512 | | 5,385 | |
F-62
Table of Contents |
PERUSAHAAN PERSEROAN (PERSERO) P.T. TELEKOMUNIKASI INDONESIA Tbk AND SUBSIDIARIES NOTES TO CONSOLIDATED FINANCIAL STATEMENTS(continued) JANUARY 1, 2010, DECEMBER 31, 2010 AND 2011 AND YEARS ENDED DECEMBER 31, 2010 AND 2011 (Figures in tables are presented in billions of Rupiah, unless otherwise stated) |
31. TAXATION(continued)
f. Reconcilliation of income tax expense
The reconciliation between the income tax expense calculated by applying the applicable tax rate of 20% to the consolidated income tax expense as shown the consolidated statement of comprehensive income is as follows:
| | 2010 | | 2011 | |
Consolidated profit before income tax | | 21,264 | | 20,735 | |
Less: Income subject to final tax | | (633 | ) | (462 | ) |
| | 20,631 | | 20,273 | |
Tax calculated at the Company’s applicable statutory tax rate of 20% | | 4,126 | | 4,055 | |
Difference in applicablestatutorytax rate for subsidiaries | | 850 | | 906 | |
Non-deductible expenses | | 369 | | 326 | |
Final income tax expense | | 61 | | 63 | |
Deferred tax liabilities (assets) that cannot be utilized - net | | 106 | | 35 | |
Total consolidated income tax expense | | 5,512 | | 5,385 | |
The computation of the income tax expense for the years ended December 31, 2010 and 2011, are as follows:
| | 2010 | | 2011 | |
Estimated taxable income (tax loss) of the Company | | 2,485 | | 3,568 | |
The Company | | 497 | | 714 | |
Final tax expense - Company | | 61 | | 63 | |
Subsidiaries | | 4,111 | | 4,896 | |
Total income tax expense - current | | 4,669 | | 5,673 | |
F-63
Table of Contents |
PERUSAHAAN PERSEROAN (PERSERO) P.T. TELEKOMUNIKASI INDONESIA Tbk AND SUBSIDIARIES NOTES TO CONSOLIDATED FINANCIAL STATEMENTS(continued) JANUARY 1, 2010, DECEMBER 31, 2010 AND 2011 AND YEARS ENDED DECEMBER 31, 2010 AND 2011 (Figures in tables are presented in billions of Rupiah, unless otherwise stated) |
31. TAXATION(continued)
f. Corporate income tax is computed for each individual company as a separate legal entity.(continued)
| | 2010 | | 2011 | |
Income tax expense (benefit) – deferred – effect of temporary differences at enacted maximum tax rate (25% in 2010 and 2011) | | | | | |
The Company | | | | | |
Amortization of intangible asset, land rights and other | | (252 | ) | (4 | ) |
Depreciation and gain on sales of property, plant and equipment | | 243 | | 36 | |
Provision for impairment of receivables and trade receivables written-off | | (18 | ) | (47 | ) |
Foreign exchange (gain) loss on deferred consideration for business combinations | | - | | - | |
Net periodic post employement benefits costs | | 44 | | (30 | ) |
Accrued expenses and provisions for obsolescence | | 28 | | (4 | ) |
Payments of deferred consideration for business combinations | | 308 | | 27 | |
Accrued early retirement benefits | | 257 | | - | |
Deferred installation fee | | 22 | | 21 | |
Finance lease | | 8 | | (6 | ) |
The Company - Net | | 640 | | (7 | ) |
Telkomsel | | | | | |
Depreciation of fixed assets | | 241 | | (238 | ) |
Account receivables - Government | | (17 | ) | (17 | ) |
Provisions for employment benefits | | (15 | ) | (39 | ) |
Provision for impairment of receivables and trade receivables written-off | | (20 | ) | (14 | ) |
Amortization of license | | 7 | | - | |
Telkomsel - Net | | 196 | | (308 | ) |
Subsidiaries other – net | | 7 | | 27 | |
Net income tax expense – deferred | | 843 | | (288) | |
Income tax expense – net | | 5,512 | | 5,385 | |
The Tax Law No. 36/2008 stipulates a reduction of 5% from the top rate applicable to qualifying companies listed, and for whose stock is traded on, the IDX which meet the prescribed criteria that the public own 40% or more of the total fully paid and traded stocks on the IDX, and such stocks are owned by at least 300 parties,witheach party owning less than 5% of the total paid-up stocks. These requirements must be met by a company for a period of 6 months in one tax year. The Company has met all of the required criteria,therefore, for the purposes of calculating income tax expenses and liabilities for the financial reporting periods of December 31, 2010 and 2011, the Company has deducted its applicable tax rate by 5%.
The Company applied a tax rate of 20% for the fiscal year 2011 and 2010. The subsidiaries applied a tax rate of 25% for the fiscal year 2011 and 2010.
F-64
Table of Contents |
PERUSAHAAN PERSEROAN (PERSERO) P.T. TELEKOMUNIKASI INDONESIA Tbk AND SUBSIDIARIES NOTES TO CONSOLIDATED FINANCIAL STATEMENTS(continued) JANUARY 1, 2010, DECEMBER 31, 2010 AND 2011 AND YEARS ENDED DECEMBER 31, 2010 AND 2011 (Figures in tables are presented in billions of Rupiah, unless otherwise stated) |
31. TAXATION(continued)
- Reconciliation of income tax expense (continued)
The Corporate Income Tax Return (“Surat Pemberitahuan Tahunan” or “Annual SPT”) for the fiscal year 2011 will be reported based on the prevailing regulation. The amount of corporate income tax for the years ended December 31, 2010 was as reported in the Annual SPTs.
- Tax assessment
(i) The Company
Directorate General of Tax (“DGT”) has audited the Company’s corporate income tax overpayment amounting to Rp.255 billion on 2008 fiscal year. On June 16, 2010, DGT issued an Overpaid Tax Assessment Letter (“Surat Ketetapan Pajak Lebih Bayar” or “SKPLB”) on corporate income tax amounting Rp.228 billion. The difference between SKPLB and the Company’s claim for tax refund has been charged to prior year consolidated statement ofcomprehensive income amounting to Rp.27 billion.
The Company received an Underpaid Tax Assessment Letter (“Surat Ketetapan Pajak Kurang Bayar” or “SKPKB”) on VAT amounting to Rp.1.69 billion including a tax penalty of Rp.0.5 billion which has been net off with SKPLB of income taxes. Therefore, the Company received restitution from DGT amounting to Rp.226.5 billion. On July 9, 2010, the Company has received a refund from a claim of SKPLB on 2008 fiscal year corporate income tax.
As of the issuance date of the consolidated financial statements, the audit of withholding income tax for 2008 fiscal year is still in process.
(ii) Telkomsel
On February 25, 2009, the Tax Authorities filed a judicial review to the SC for the Tax Court’s acceptance of Telkomsel’s appeal for a refund of withholding taxes covering the fiscal year 2002, of Rp.115 billion. On April 3, 2009, Telkomsel filed a contra-appeal to the Indonesian Supreme Court (“SC”). As of the issuance date of the consolidated financial statements, it is still in process
Based on the Tax Court’s verdict in March 2010, Telkomsel’s appeal on Value Added Tax for the fiscal years 2004 and 2005 was accepted and Telkomsel subsequently received the refund of Rp.215 billion in June 2010 with an interest of Rp.103 billion. On August 10, 2010, the Tax Authorities filed a judicial review to the SC on the Tax Court’s verdict. On September 24, 2010, Telkomsel filed a contra-appeal to the SC. As of the issuance date of the consolidated financial statements, it is still in process.
As a result of the assessment and tax court verdict, on January 28 and February 12, 2010, Telkomsel received the refund for overpayment of the 2008 Corporate Income Tax of Rp.439 billion and Rp.4.2 billion, respectively.
On April 21, 2010, the Tax Court notified Telkomsel that the Tax Authorities has filed an appeal to the SC on the Tax Court’s verdict of the cancellation of a Tax Collection Letter (STP) for the underpayment of income tax Article 25 for the period of December 2008 of Rp.429 billion (including a penalty of Rp.8 billion). In May 2010, Telkomsel filed a contra-appeal to the SC. As of the issuance date of the consolidated financial statements, the appeal is still in process.
F-65
Table of Contents |
PERUSAHAAN PERSEROAN (PERSERO) P.T. TELEKOMUNIKASI INDONESIA Tbk AND SUBSIDIARIES NOTES TO CONSOLIDATED FINANCIAL STATEMENTS(continued) JANUARY 1, 2010, DECEMBER 31, 2010 AND 2011 AND YEARS ENDED DECEMBER 31, 2010 AND 2011 (Figures in tables are presented in billions of Rupiah, unless otherwise stated) |
31. TAXATION(continued)
g. Tax assessment(continued)
(ii) Telkomsel(continued)
In 2010, Telkomsel was assessed for underpayments of Corporate Income Tax, withholding taxes and Value Added Tax, for the fiscal year 2006 totalling Rp.212 billion (including penalty of Rp.69 billion). On December 23, 2010, Telkomsel filed an objection to the Tax Authorities for underpayments of withholding taxes and Value Added Tax amounting to Rp.116 billion (including a penalty of Rp.38 billion) and recorded it as a claim for tax refund. The accepted portions of Rp.50 billion was previously recognized and charged to 2008 consolidated statement of comprehensive income while the remaining portion of Rp.46 billion were charged to the 2010 consolidated statement of comprehensive income. Subsequently, in September 2011, the Tax Authorities rejected Telkomsel’s objection. In December 2011, Telkomsel filed an appeal to the Tax Court. As of the issuance date of the consolidated financial statements, the appeal is still in process
In October and November, 2010, Telkomsel received STPs for the underpayments of income tax Article 25 for the fiscal year 2010 of Rp.229 billion (including penalty of Rp.11 billion). The STPs were paid in November and December 2010. The principal payment of Rp.218 billion was considered as a prepayment in calculating the 2010 corporate income tax which at the end resulted in an overpayment of Rp.599.87 billion. Through its letters in November 2010, Telkomsel requested the Tax Authorities to cancel the STPs. Subsequently, in April 2011, Telkomsel received STPs from Tax Authorities which revised the above-mentioned STPs issued in October and November 2010 with an additional penalty of Rp.4.3 billion.
On May 5, 2011, the Tax Authorities rejected Telkomsel’s request for cancellation of those STPs. Subsequently, on May 31, 2011, Telkomsel filed an appeal to the Tax Court. The overpayment and penalty are recognized as claims for tax refund as of December 31, 2011. As of the issuance date of the consolidated financial statements, the appeal is still in process.
In August 2011, Telkomsel was assessed for underpayments of withholding taxes and Value Added Tax for the fiscal year 2008 totaling Rp.235 billion. In November 2011, Telkomsel filed an objection to the Tax Authorities for the underpayments of Value Added Tax amounting to Rp.232 billion and recorded it as a claim for tax refund. The remaining portion of Rp.3 billion was charged to the 2011 consolidated statement of comprehensive income. As of the issuance date of the consolidated financial statements, the objection is still in process.
h. Deferred tax assets and liabilities
The details of the Company and subsidiaries' deferred tax assets and liabilities are as follows:
| | | | (Charged) credited to the statements | | Recognized in other | | | |
| | January 1, 2010 | | of income | | comprehensive income | | December 31, 2010 | |
The Company | | | | | | | | | |
Deferred tax assets: | | | | | | | | | |
Deferred consideration for business combinations | | 335 | | (308 | ) | - | | 27 | |
Provision for impairment of receivables | | 269 | | 18 | | - | | 287 | |
Net periodic post employment benefits costs | | 49 | | (45 | ) | 43 | | 47 | |
Accrued expenses and provision for inventory obsolescence | | 54 | | (28 | ) | - | | 26 | |
Early termination expenses | | 257 | | (257 | ) | - | | - | |
Accrued for employee benefits | | 85 | | 1 | | - | | 86 | |
Deferred connection fee | | 128 | | (22 | ) | - | | 106 | |
Total deferred tax assets-The Company | | 1,177 | | (641 | ) | 43 | | 579 | |
F-66
Table of Contents |
PERUSAHAAN PERSEROAN (PERSERO) P.T. TELEKOMUNIKASI INDONESIA Tbk AND SUBSIDIARIES NOTES TO CONSOLIDATED FINANCIAL STATEMENTS(continued) JANUARY 1, 2010, DECEMBER 31, 2010 AND 2011 AND YEARS ENDED DECEMBER 31, 2010 AND 2011 (Figures in tables are presented in billions of Rupiah, unless otherwise stated) |
31. TAXATION(continued)
h. Deferred tax assets and liabilities
The details of the Company and subsidiaries' deferred tax assets and liabilities are as follows:
| | | | | | | | | |
| | January 1, 2010 | | (Charged) credited to the consolidated statementsof income | | Recognized in othercomprehensive income | | December 31, 2010 | |
The Company | | | | | | | | | |
Deferred tax liabilities: | | | | | | | | | |
Difference between accounting and tax property, plant and equipment's net book value | | (1,650 | ) | (243 | ) | - | | (1,893 | ) |
Finance lease | | (31 | ) | (8 | ) | - | | (39 | ) |
Land rights, intangible assets, and others | | (277 | ) | 252 | | - | | (25 | ) |
Total deferred tax liabilities-The Company | | (1,958 | ) | 1 | | - | | (1,957 | ) |
Deferred tax liabilities of the Company - net | | (781 | ) | (640 | ) | 43 | | (1,378 | ) |
Telkomsel | | | | | | | | | |
Deferred tax assets: | | | | | | | | | |
Provision for employee benefits | | 30 | | 20 | | - | | 50 | |
Provision for employee benefits | | 123 | | 15 | | 35 | | 173 | |
Total deferred tax assets - Telkomsel | | 153 | | 35 | | 35 | | 223 | |
Telkomsel | | | | | | | | | |
Deffered tax liabilities: | | | | | | | | | |
Depreciation of fixed assets | | (2,516 | ) | (241 | ) | - | | (2757 | ) |
License amortization | | (41 | ) | (7 | ) | - | | (48 | ) |
Account receivables - Government | | (42 | ) | 17 | | - | | (25 | ) |
Total deferred tax liabilities - Telkomsel | | (2,599 | ) | (231 | ) | - | | (2,830 | ) |
Deferred tax liabilities of Telkomsel - net | | (2,446 | ) | (196 | ) | 35 | | (2,607 | ) |
Deferred tax liabilities of the subsidiaries-net | | (79 | ) | 27 | | (10 | ) | (62 | ) |
Total deferred tax liabilities - net | | (3,306 | ) | (809 | ) | 68 | | (4,047 | ) |
Deferred tax assets of other subsidiaries– net | | | | | | | | | |
Total deffered tax assets - net |
| 94 |
| (34 | ) | 4 | | 64 |
|
| | | | (Charged) credited to the statements | | Recognized in other | | | |
| | December 31, 2010 | | of income | | comprehensive income | | December 31, 2011 | |
The Company | | | | | | | | | |
Deferred tax assets: | | | | | | | | | |
Deferred consideration for business combinations | | 27 | | (27 | ) | - | | - | |
Provision for impairment of receivables | | 287 | | 47 | | - | | 334 | |
Net periodic post-employment benefits costs | | 47 | | 34 | | 253 | | 334 | |
Accrued expenses and provision for obsolescence | | 26 | | 4 | | - | | 30 | |
Accrued for employee benefits | | 86 | | (4 | ) | - | | 82 | |
Deferred connection fee | | 106 | | (21 | ) | - | | 85 | |
Total deferred tax assets – The Company | | 579 | | 33 | | 253 | | 865 | |
The Company | | | | | | | | | |
Deferred tax liabilities: | | | | | | | | | |
Difference between accounting and tax property, plant and equipment's net book value | | (1,893 | ) | (36 | ) | - | | (1,929 | ) |
Finance lease | | (39 | ) | 6 | | - | | (33 | ) |
Land rights, intangible assets, and other | | (25 | ) | 4 | | - | | (21 | ) |
Total deferred tax liabilities – The Company | | (1,957 | ) | (26 | ) | - | | (1,983 | ) |
Total deferred tax liabilities of The Company - net | | (1,378 | ) | 7 | | 253 | | (1,118 | ) |
F-67
Table of Contents |
PERUSAHAAN PERSEROAN (PERSERO) P.T. TELEKOMUNIKASI INDONESIA Tbk AND SUBSIDIARIES NOTES TO CONSOLIDATED FINANCIAL STATEMENTS(continued) JANUARY 1, 2010, DECEMBER 31, 2010 AND 2011 AND YEARS ENDED DECEMBER 31, 2010 AND 2011 (Figures in tables are presented in billions of Rupiah, unless otherwise stated) |
31. TAXATION(continued)
h. Deferred tax assets and liabilities (continued)
| | | | (Charged) credited to the statements | | Recognized in other | | | |
| | December 31, 2010 | | of income | | comprehensive income | | December 31, 2011 | |
Telkomsel | | | | | | | | | |
Deferred tax assets: | | | | | | | | | |
Provision for impairment of receivables | | 50 | | 14 | | - | | 64 | |
Provision for employee benefits | | 173 | | 39 | | 65 | | 277 | |
Total deferred tax assets - Telkomsel | | 223 | | 53 | | 65 | | 341 | |
Telkomsel | | | | | | | | | |
Deferred tax liabilities: | | | | | | | | | |
Depreciation of fixed assets | | (2,757 | ) | 238 | | - | | (2,519 | ) |
License amortization | | (48 | ) | - | | - | | (48 | ) |
Account receivables - Government | | (25 | ) | 17 | | - | | (8 | ) |
Total deferred tax liabilities - Telkomsel | | (2,830) | | 255 | | - | | (2,575 | ) |
Total deferred tax liabilities Telkomsel - net | | (2,607 | ) | 308 | | 65 | | (2,234 | ) |
Deferred tax liabilities of the subsidiaries - net | | (62 | ) | (34 | ) | - | | (96 | ) |
Total deferred tax liabilities - net | | (4,047 | ) | 281 | | 318 | | (3,448 | ) |
| Deferred tax assets of other subsidiaries-net | | | | | | | | | |
Total deferred tax assets - net |
| 64 |
| 7 |
| 4 |
| 75 | |
| Realization of the deferred tax assets is dependent upon future profitable operations. Although realization is not assured, the Company and its subsidiaries believe that it is probable that these deferred tax assets will be realized through reduction of future taxable income. The amount of deferred tax assets is considered realizable, however, could be reduced if actual future taxable income is lower than the estimates. |
| |
i. | Administration On September 23, 2008, the President of the Republic Indonesia and MoJHR has signed and enacted the Tax Law No. 36/2008 concerning the Fourth Amendment of the Tax Law No. 7/1983 of Income Taxes. This regulation stipulates that the corporate tax rate will be a flat rate of 28% in 2009 (previously calculated using progressive tax rates ranging from 10% to 30%) and 25% in 2010. |
| The taxation laws of Indonesia require that the Company and its subsidiaries located within Indonesia submit individual tax returns on the basis of self assessment. Under prevailing regulations the DGT may assess or amend taxes within a certain period. For the fiscal years of 2007 and before, this period is within ten years of the time the tax become due, but not later than 2013, while for the fiscal years of 2008 and onwards, the period is within five years of the time the tax becomes due. |
| No tax audit has been conducted for fiscal years 2003, 2005, 2006, 2007, 2009 and 2010 for the Company. A tax audit has been completed for all other fiscal years. |
| Currently, Telkomsel is under audit by Tax Authorities for an overpayment of its 2010 Corporate Income Tax. |
| The Company received a certificate of tax investigation exemption from DGT for the fiscal year 2007, 2008, 2009 and 2010, which is valid unless the Company files for overpaid Annual SPT then a tax assessment will be performed. |
F-68
Table of Contents |
PERUSAHAAN PERSEROAN (PERSERO) P.T. TELEKOMUNIKASI INDONESIA Tbk AND SUBSIDIARIES NOTES TO CONSOLIDATED FINANCIAL STATEMENTS(continued) JANUARY 1, 2010, DECEMBER 31, 2010 AND 2011 AND YEARS ENDED DECEMBER 31, 2010 AND 2011 (Figures in tables are presented in billions of Rupiah, unless otherwise stated) |
32. POST-EMPLOYMENT BENEFITS
| | January 1, 2010 | | December 31, 2010 | | December 31, 2011 | |
Prepaid pension benefit costs | | | | | | | |
The Company | | 1,099 | | 1,417 | | 765 | |
Infomedia | | 0 | | 2 | | 0 | |
Prepaid pension benefit costs | | 1,099 | | 1,419 | | 765 | |
Post-employment benefit obligation | | | | | | | |
Pension | | | | | | | |
The Company | | 979 | | 1,192 | | 1,668 | |
Telkomsel | | 245 | | 416 | | 779 | |
Pension costs provisions | | 1,224 | | 1,608 | | 2,447 | |
Other post-employment benefits | | 294 | | 374 | | 434 | |
Obligation under Labor Law | | 64 | | 87 | | 130 | |
Post-employment health care benefits | | 1,144 | | 736 | | 1,561 | |
Post-employment benefit obligation | | 2,726 | | 2,805 | | 4,572 | |
| | 2010 | | 2011 | |
Net periodic pension costs | | | | | |
The Company | | 554 | | 524 | |
Telkomsel | | 70 | | 105 | |
Net periodic pension costs | | 624 | | 629 | |
Other post-retirement cost | | 61 | | 53 | |
Obligation under Labor Law | | 23 | | 30 | |
Post-employment health care benefits | | 238 | | 199 | |
- Prepaid pension benefit costs
The Company sponsors a defined pension benefit plan to employees hired with permanent status prior to July 1, 2002. The pension benefits are paid based on the participating employees’ latest basic salary at retirement and the number of years of their service. The plan is managed by Telkom Pension Fund (“Dana Pensiun Telkom” or “Dapen”). The participating employees contribute 18% (before March 2003: 8.4%) of their basic salaries to the plan. The Company’s contributions to the pension fund for the years ended December 31, 2010 and 2011 amounted to Rp.485 billion, and Rp.187 billion respectively.
F-69
Table of Contents |
PERUSAHAAN PERSEROAN (PERSERO) P.T. TELEKOMUNIKASI INDONESIA Tbk AND SUBSIDIARIES NOTES TO CONSOLIDATED FINANCIAL STATEMENTS(continued) JANUARY 1, 2010, DECEMBER 31, 2010 AND 2011 AND YEARS ENDED DECEMBER 31, 2010 AND 2011 (Figures in tables are presented in billions of Rupiah, unless otherwise stated) |
32. POST-EMPLOYMENT BENEFITS(continued)
- Prepaid pension benefit costs (continued)
The following table presents the change in projected benefits obligation, change in plan assets, funded status of the plan and net amount recognized in the Company’s consolidated statement of financial positions as of December 31, 2010 and 2011, for its defined benefit pension plan:
| | 2010 | | 2011 | |
Change in projected benefits obligation | | | | | |
Projected benefits obligation at beginning of year | | 10,131 | | 11,924 | |
Service costs | | 254 | | 307 | |
Interest costs | | 1,003 | | 1,105 | |
Plan participants’ contributions | | 42 | | 44 | |
Actuarial losses | | 1,114 | | 3,391 | |
Expected benefits paid | | (620 | ) | (583 | ) |
Projected benefits obligation at end of year | | 11,924 | | 16,188 | |
Change in plan assets | | | | | |
Fair value of plan assets at beginning of year | | 12,300 | | 15,098 | |
Expected return on plan assets | | 1,287 | | 1,441 | |
Employer’s contributions | | 485 | | 187 | |
Plan participants' contributions | | 42 | | 44 | |
Actuarial gains | | 1,604 | | 410 | |
Expected benefits paid | | (620 | ) | (583 | ) |
Fair value of plan assets at end of year | | 15,098 | | 16,597 | |
Funded status | | 3,174 | | 409 | |
Unrecognized prior service costs | | 495 | | 356 | |
Unrecognized surplus (due to application of asset ceiling limitation) | | (2,252 | ) | - | |
Prepaid pension benefit costs | | 1,417 | | 765 | |
As of December 31, 2010 and 2011, plan assets consisted of :
| | December 31, 2010 | | December 31, 2011 | |
Indonesian equity securities | | 24.34% | | 22.13% | |
Government bonds | | 38.76% | | 39.67% | |
Corporate bonds | | 18.64% | | 17.37% | |
Others | | 18.26% | | 20.83% | |
Total | | 100.00% | | 100.00% | |
Dapen plan assets also include Series B shares issued by the Company with fair value totaling Rp.269 billion and Rp.234 billion representing 1.78% and 1.41% of total assets as of December 31, 2010 and 2011 respectively, and bonds issued by the Company with fair value totaling Rp.156 billion and Rp.156 billion representing 1.03% and 0.94% of total assets as of December 31, 2010 and 2011 respectively.
F-70
Table of Contents |
PERUSAHAAN PERSEROAN (PERSERO) P.T. TELEKOMUNIKASI INDONESIA Tbk AND SUBSIDIARIES NOTES TO CONSOLIDATED FINANCIAL STATEMENTS(continued) JANUARY 1, 2010, DECEMBER 31, 2010 AND 2011 AND YEARS ENDED DECEMBER 31, 2010 AND 2011 (Figures in tables are presented in billions of Rupiah, unless otherwise stated) |
32. POST-EMPLOYMENT BENEFITS(continued)
- Prepaid pension benefit costs (continued)
The expected return is determined based on market expectation for returns over the entire life of the obligation by considering the portfolio mix of the plan assets. The actual return on plan assets wasRp.2,891 billion and Rp.1,851 billion for the year ended December 31, 2010 and 2011, respectively. The Company expects to contribute Rp.186 billion to its defined pension benefit plan during 2012.
The components of net periodic pension costs are as follows:
| | 2010 | | 2011 | |
Service cost | | 254 | | 307 | |
Interest cost | | 1,003 | | 1,105 | |
Expected return on plan assets | | (1,287 | ) | (1,441 | ) |
Amortization of past service cost | | 139 | | 139 | |
Net periodic pension costs | | 109 | | 110 | |
Amount charged to subsidiaries under contractual agreements | | (2 | ) | (2 | ) |
Total net periodic pension costs less amounts charged to subsidiaries | | 107 | | 108 | |
Amounts recognized in other comprehensive income are as follows:
| | 2010 | | 2011 | |
Cumulative amount at beginning of year | | 470 | | 528 | |
Actuarial (gains) losses recognized during the year | | (489 | ) | 2,981 | |
Asset ceiling limitation | | 547 | | (2,252 | ) |
Cumulative amount at end of year | | 528 | | 1,257 | |
The actuarial valuation for the pension and other post-employement benefits was performed based on the measurement date as of December 31, 2010 and 2011, with reports dated March 15, 2011 and March 7, 2012, respectively, by PT Towers Watson Purbajaga (“TWP”), an independent actuary in association with Towers Watson (“TW”). The principal actuarial assumptions used by the independent actuary are applicable to all post-employment benefits plans provided by the Company. With this regard, the principal actuarial assumptions as of December 31, 2010 and 2011, are as follows:
| | December 31, 2010 | | December 31, 2011 | |
Discount rate | | 9.5 % | | 7.25% | |
Expected long-term return on plan assets | | 9.7 % | | 9.25% | |
Rate of compensation increases | | 8 % | | 8% | |
F-71
Table of Contents |
PERUSAHAAN PERSEROAN (PERSERO) P.T. TELEKOMUNIKASI INDONESIA Tbk AND SUBSIDIARIES NOTES TO CONSOLIDATED FINANCIAL STATEMENTS(continued) JANUARY 1, 2010, DECEMBER 31, 2010 AND 2011 AND YEARS ENDED DECEMBER 31, 2010 AND 2011 (Figures in tables are presented in billions of Rupiah, unless otherwise stated) |
32. POST-EMPLOYMENT BENEFITS(continued)
a. Prepaid pension benefit costs(continued)
Historical information | | | | | | | |
| | January 1, 2010 | | December 31, 2010 | | December 31, 2011 | |
Present value of funded defined benefit obligation | | (10,131 | ) | (11,924 | ) | (16,188 | ) |
Fair value of plan assets | | 12,300 | | 15,098 | | 16,597 | |
Surplus in the plan | | 2,169 | | 3,174 | | 409 | |
Experience adjustments arising on plan liabilities | | (318 | ) | (314 | ) | (156 | ) |
Experience adjustments arising on plan assets | | (2,028 | ) | (1,604 | ) | (410 | ) |
b. Pension benefit costs provisions
1. The Company
The Company sponsors unfunded defined benefit pension plans and a defined contribution pension plan.
The defined contribution pension plan is provided to employees hired with permanent status on or after July 1, 2002. The plan is managed by Financial Institutions Pension Fund (“Dana Pensiun Lembaga Keuangan” or “DPLK”). The Company’s contribution to DPLK is determined based on a certain percentage of the participants’ salaries and amounted to Rp.4 billion, and Rp.5 billion for the years ended December 31, 2010 and 2011, respectively.
Since 2007, the Company provided a pension benefit based on uniformulation for both participants prior to and from April 20, 1992 effective for employees retiring beginning February 1, 2009. The change in benefit had increased the Company’s liabilities by Rp.699 billion, which is amortized over 9.9 years until 2016. In 2010, the Company replaced the uniformulation with Manfaat Pensiun Sekaligus (“MPS”). MPS is given to those employees reaching retirement age, death or disabled starting from February 1, 2009. The change in benefit had increased the Company’s liabilities by Rp.435 billion, which is amortized over 8.63 years until 2018.
The Company also provides benefits to employeesduring a pre-retirement period in which they are inactive for 6 months prior to their normal retirement age of 56 years, known as pre-retirement benefits (“Masa Persiapan Pensiun” or “MPP”).During the pre-retirement period, the employees still receive benefits provided to active employees, which include, but are not limited to regular salary, health care, annual leave, bonus and other benefits.
F-72
Table of Contents |
PERUSAHAAN PERSEROAN (PERSERO) P.T. TELEKOMUNIKASI INDONESIA Tbk AND SUBSIDIARIES NOTES TO CONSOLIDATED FINANCIAL STATEMENTS(continued) JANUARY 1, 2010, DECEMBER 31, 2010 AND 2011 AND YEARS ENDED DECEMBER 31, 2010 AND 2011 (Figures in tables are presented in billions of Rupiah, unless otherwise stated) |
32. POST-EMPLOYMENT BENEFITS (continued)
b. Pension benefit costs provisions (continued)
1. The Company (continued)
The following table presents the change in projected benefits obligation of the MPS and MPP for the year ended December 31, 2010 and 2011:
| | 2010 | | 2011 | |
Change in projected benefits obligation | | | | | |
Projected benefits obligation at beginning of year | | 1,622 | | 2,096 | |
Service costs | | 77 | | 89 | |
Interest costs | | 197 | | 194 | |
Actuarial losses | | 61 | | 244 | |
Benefits paid by employer | | (296 | ) | (183 | ) |
Benefits changed | | 435 | | - | |
Projected benefits obligation at end of year | | 2,096 | | 2,440 | |
Unrecognized prior service costs | | (905 | ) | (772 | ) |
Pension benefit costs provisions at end of year | | 1,191 | | 1,668 | |
The components of net periodic pension costs are as follows:
| | 2010 | | 2011 | |
Service costs | | 77 | | 89 | |
Interest costs | | 197 | | 194 | |
Amortization of past service cost | | 173 | | 133 | |
Net periodic pension costs(Note 27) | | 447 | | 416 | |
Actuarial losses recognized in other comprehensive income are as follows:
| | 2010 | | 2011 | |
Cumulative amount at beginning of year | | 414 | | 475 | |
Recognized during the year | | 61 | | 244 | |
Cumulative amount at end of year | | 475 | | 719 | |
Historical information
| | January 1, 2010 | | December 31, 2010 | | December 31, 2011 | |
Present value of unfunded defined benefit obligation | | (1,622 | ) | (2,096 | ) | (2,440 | ) |
Fair value of plan assets | | - | | - | | - | |
Deficit in the plan | | (1,622 | ) | (2,096 | ) | (2,440 | ) |
Experience adjustments arising on plan liabilities | | 309 | | 23 | | (30 | ) |
F-73
Table of Contents |
PERUSAHAAN PERSEROAN (PERSERO) P.T. TELEKOMUNIKASI INDONESIA Tbk AND SUBSIDIARIES NOTES TO CONSOLIDATED FINANCIAL STATEMENTS(continued) JANUARY 1, 2010, DECEMBER 31, 2010 AND 2011 AND YEARS ENDED DECEMBER 31, 2010 AND 2011 (Figures in tables are presented in billions of Rupiah, unless otherwise stated) |
32. POST-EMPLOYMENT BENEFITS (continued)
b. Pension benefit costs provisions (continued)
ii. Telkomsel
Telkomsel provides a defined benefit pension plan to its employees. Under this plan, employees are entitled to pension benefits based on their latest basic salary or take-home pay and the number of years of their service. PT Asuransi Jiwasraya (“Jiwasraya”), a state-owned life insurance company, manages the plan under an annuity insurance contract. Until 2004, the employees contributed 5% of their monthly salaries to the plan and Telkomsel contributed any remaining amount required to fund the plan. Starting 2005, the entire contributions are fully made by Telkomsel.
Telkomsel's contributions to Jiwasraya amounted to Rp.40 billion and Rp.2 billion for December 31, 2010 and 2011, respectively.
The following table presents the change in projected benefits obligation for the year ended December 31, 2010 and 2011:
| | 2010 | | 2011 | |
Change in projected benefits obligation | | | | | |
Projected benefits obligation at beginning of year | | 399 | | 663 | |
Service costs | | 44 | | 67 | |
Interest costs | | 42 | | 59 | |
Actuarial losses | | 191 | | 452 | |
Expected benefits paid | | (13 | ) | (4 | ) |
Projected benefits obligation at end of year | | 663 | | 1,237 | |
Fair value of plan assets at beginning of year | | 154 | | 246 | |
Expected return on plan assets | | 16 | | 22 | |
Employer’s contributions | | 40 | | 2 | |
Actuarial gains | | 49 | | 192 | |
Expected benefits paid | | (13 | ) | (4 | ) |
Fair value of plan assets at end of year | | 246 | | 458 | |
Funded status | | (417 | ) | (779 | ) |
Unrecognized prior service costs | | 1 | | 0 | |
Pension benefits costs provisions | | (416 | ) | (779 | ) |
The components of the net periodic pension costs are as follows:
| | 2010 | | 2011 | |
Service costs | | 44 | | 67 | |
Interest costs | | 42 | | 59 | |
Expected return on plan assets | | (16 | ) | (22 | ) |
Amortization of past service costs | | 0 | | 1 | |
Net periodic pension costs(Note 27) | | 70 | | 105 | |
F-74
Table of Contents |
PERUSAHAAN PERSEROAN (PERSERO) P.T. TELEKOMUNIKASI INDONESIA Tbk AND SUBSIDIARIES NOTES TO CONSOLIDATED FINANCIAL STATEMENTS(continued) JANUARY 1, 2010, DECEMBER 31, 2010 AND 2011 AND YEARS ENDED DECEMBER 31, 2010 AND 2011 (Figures in tables are presented in billions of Rupiah, unless otherwise stated) |
32. POST-EMPLOYMENT BENEFITS(continued)
b. Pension benefit costs provisions (continued)
ii. Telkomsel (continued)
Actuarial (gains) losses recognized in other comprehensive income are as follows:
| | 2010 | | 2011 | |
Cumulative amount at beginning of year | | 132 | | 274 | |
Recognized during the year | | 142 | | 260 | |
Cumulative amount at end of year | | 274 | | 534 | |
The principal actuarial assumptions used by the independent actuary based on the measurement date as of December 31, 2010 and 2011, are as follows:
| | December 31, 2010 | | December 31, 2011 | |
Discount rate | | 9 % | | 6.75 % | |
Expected long-term return on plan assets | | 9 % | | 6.75 % | |
Rate of compensation increases | | 8 % | | 8% | |
Historical information
| | January 1, 2010 | | December 31, 2010 | | December 31, 2011 | |
Present value of funded defined benefit obligation | | (399 | ) | (663 | ) | (1,237 | ) |
Fair value of plan assets | | 154 | | 246 | | 458 | |
Deficit in the plan | | (245 | ) | (417 | ) | (779 | ) |
Experience adjustments arising on plan liabilities | | (17 | ) | 9 | | (44 | ) |
Experience adjustments arising on plan assets | | 25 | | (49 | ) | (192 | ) |
c. Other post-employment benefits
The Company provides other post-employment benefits in the form of cash paid to employees on their retirement. These benefits consist of final housing facility benefits (“Biaya Fasilitas Perumahan Terakhir” or BFPT) and home leave passage benefits (“Biaya Perjalanan Pensiun dan Purnabhakti” or BPP).
F-75
Table of Contents |
PERUSAHAAN PERSEROAN (PERSERO) P.T. TELEKOMUNIKASI INDONESIA Tbk AND SUBSIDIARIES NOTES TO CONSOLIDATED FINANCIAL STATEMENTS(continued) JANUARY 1, 2010, DECEMBER 31, 2010 AND 2011 AND YEARS ENDED DECEMBER 31, 2010 AND 2011 (Figures in tables are presented in billions of Rupiah, unless otherwise stated) |
32. POST-EMPLOYMENT BENEFITS (continued)
c. Other post-employment benefits (continued)
The change of projected benefits obligation of the other post-employment benefits for the year ended December 31, 2010 and 2011, are as follows:
| | 2010 | | 2011 | |
Change in projected benefits obligation | | | | | |
Unfunded projected benefits obligation at beginning of year | | 336 | | 409 | |
Service costs | | 18 | | 9 | |
Interest costs | | 36 | | 37 | |
Actuarial losses | | 53 | | 40 | |
Benefits paid by employer | | (34 | ) | (33 | ) |
Unfunded projected benefits obligation at end of year | | 409 | | 462 | |
Unrecognized prior service costs | | (35 | ) | (28 | ) |
Total other post-employement benefits costs provisions at end of year | | 374 | | 434 | |
The components of the net periodic other post-employement benefits costs for the year ended December 31, 2010 and 2011, are as follows:
| | 2010 | | 2011 | |
Service costs | | 18 | | 9 | |
Interest costs | | 36 | | 37 | |
Amortization of past service costs | | 7 | | 7 | |
Total net periodic other post-employment benefits costs(Note 27) | | 61 | | 53 | |
Actuarial (gains) losses recognized in other comprehensive income are as follows:
| | 2010 | | 2011 | |
Cumulative amount at beginning of year | | (23 | ) | 30 | |
Recognized during the year | | 53 | | 40 | |
Cumulative amount at end of year | | 30 | | 70 | |
Historical information
| | January 1, 2010 | | December 31, 2010 | | December 31, 2011 | |
Present value of unfunded defined benefit obligation | | (336 | ) | (409 | ) | (462 | ) |
Fair value of plan assets | | - | | - | | - | |
Deficit in the plan | | (336 | ) | (409 | ) | (462 | ) |
Experience adjustments arising on plan liabilities | | (1 | ) | 11 | | (13 | ) |
F-76
Table of Contents |
PERUSAHAAN PERSEROAN (PERSERO) P.T. TELEKOMUNIKASI INDONESIA Tbk AND SUBSIDIARIES NOTES TO CONSOLIDATED FINANCIAL STATEMENTS(continued) JANUARY 1, 2010, DECEMBER 31, 2010 AND 2011 AND YEARS ENDED DECEMBER 31, 2010 AND 2011 (Figures in tables are presented in billions of Rupiah, unless otherwise stated) |
32. POST-EMPLOYMENT BENEFITS(continued)
- Obligation under Labor Law
Under Law No. 13/2003 concerning labor regulation, the Company and its subsidiaries are required to provide a minimum pension benefit, if not covered yet by the sponsored pension plans, to their employees upon retirement age. The total related obligation recognized as of January 1, 2010, December 31, 2010 and 2011 amounted to Rp.64 billion, Rp.87 billion and Rp.130 billion, respectively. The related employees’ benefits cost charged to expense amounted to Rp.23 billion and Rp.30 billion for the year ended December 31, 2010 and 2011, respectively (Note 27). The actuarial gains and losses recognized in other comprehensive income amounted to Rp.10 billion and Rp.23 billion for the year ended December 31, 2010 and 2011, respectively.
- Post-employmenthealth care benefits
The Company provides a post-employment health care plan to all of its employees hired before November 1, 1995 who have worked for the Company for 20 years or more when they retire, and to their eligible dependents. The requirement to work for 20 years does not apply to employees who retired prior to June 3, 1995. The employees hired by the Company starting from November 1, 1995 no longer are entitled to this plan. The plan is managed by Yayasan Kesehatan Pegawai Telkom (“Yakes”).
The defined contribution post-employment health care plan is provided to employees hired with permanent status on or after November 1, 1995 or employees with terms of service less than 20 years on the time of retirement. The Company’s contribution amounted to Rp.20 billion and Rp.19 billion for the year ended December 31, 2010 and 2011, respectively.
The following table presents the change in the projected benefits obligation, change in plan assets, funded status of the plan and net amount recognized in the Company’s consolidated statement of financial positions as of December 31, 2010 and 2011:
| | 2010 | | 2011 | |
Change in projected benefits obligation | | | | | |
Projected benefits obligation at beginning of year | | 7,166 | | 8,741 | |
Service costs | | 84 | | 43 | |
Interest costs | | 744 | | 818 | |
Actuarial losses | | 1,035 | | 1,208 | |
Expected post-employment health care paid | | (288 | ) | (263 | ) |
Projected benefits obligation at end of year | | 8,741 | | 10,547 | |
Change in plan assets | | | | | |
Fair value of plan assets at beginning of year | | 6,022 | | 8,005 | |
Expected return on plan assets | | 589 | | 662 | |
Employer’s contributions | | 991 | | 361 | |
Actuarial gains | | 691 | | 222 | |
Expected post-employement health care paid | | (288 | ) | (264 | ) |
Fair value of plan assets at end of year | | 8,005 | | 8,986 | |
Funded status | | (736 | ) | (1,561 | ) |
Post-employment health care benefits costs provisions | | (736 | ) | (1,561 | ) |
F-77
Table of Contents |
PERUSAHAAN PERSEROAN (PERSERO) P.T. TELEKOMUNIKASI INDONESIA Tbk AND SUBSIDIARIES NOTES TO CONSOLIDATED FINANCIAL STATEMENTS(continued) JANUARY 1, 2010, DECEMBER 31, 2010 AND 2011 AND YEARS ENDED DECEMBER 31, 2010 AND 2011 (Figures in tables are presented in billions of Rupiah, unless otherwise stated) |
32. POST-EMPLOYMENT BENEFITS(continued)
- Post-employment health care benefits (continued)
As of December 31, 2010 and 2011, plan assets consisted of :
| | December 31, 2010 | | December 31, 2011 | |
Mutual funds | | 73.43% | | 84.64% | |
Time deposits | | 15.22% | | 8.38% | |
Indonesia equity securities | | 11.09% | | 6.79% | |
Others | | 0.26% | | 0.19% | |
Total assets | | 100.00% | | 100.00% | |
Yakes plan assets also include Series B shares issued by the Company with fair value totaling Rp.34 billion and Rp.24 billion representing 0.43% and 0.27% of total assets as of December 31, 2010 and 2011 respectively.
The expected return is determined based on market expectation for returns over the entire life of the obligation by considering the portfolio mix of the plan assets. The actual return on plan assets was Rp.1,280 billion and Rp.884 billion for the years ended December 31, 2010 and 2011, respectively. The Company expects to contribute Rp.300 billion to its post-employment health care plan during 2012.
The components of net periodic post-employment health care benefits cost are as follows:
| | 2010 | | 2011 | |
Service costs | | 84 | | 43 | |
Interest costs | | 744 | | 818 | |
Expected return on plan assets | | (589 | ) | (662 | ) |
Net periodic post-employment benefits costs | | 239 | | 199 | |
Amounts charged to subsidiaries under contractual agreements | | (1 | ) | (0 | ) |
Total net periodic post-employmenthealth care benefits costs less amounts charged to subsidiaries(Note 27) | | 238 | | 199 | |
Actuarial (gains) and losses recognized in other comprehensive income are as follows:
| | 2010 | | 2011 | |
Cumulative amount at beginning of year | | 60 | | 404 | |
Recognized during the year | | 344 | | 986 | |
Cumulative amount at end of year | | 404 | | 1,390 | |
F-78
Table of Contents |
PERUSAHAAN PERSEROAN (PERSERO) P.T. TELEKOMUNIKASI INDONESIA Tbk AND SUBSIDIARIES NOTES TO CONSOLIDATED FINANCIAL STATEMENTS(continued) JANUARY 1, 2010, DECEMBER 31, 2010 AND 2011 AND YEARS ENDED DECEMBER 31, 2010 AND 2011 (Figures in tables are presented in billions of Rupiah, unless otherwise stated) |
32. POST-EMPLOYMENT BENEFITS(continued)
- Post-employmenthealth care benefits (continued)
The actuarial valuation for the post-employment health care benefits was performed based on the measurement date as of December 31, 2010 and 2011, with reports dated March 15, 2011 and March 7, 2012, respectively, by PT Towers Watson Purbajaga (“TWP”), an independent actuary in association with Towers Watson (“TW”). The principal actuarial assumptions used by the independent actuary as of December 31, 2010 and 2011, are as follows:
| | December 31, 2010 | | December 31, 2011 | |
Discount rate | | 9.5% | | 7.25% | |
Expected long-term return on plan assets | | 8.21% | | 8% | |
Health care costs trend rate assumed for next year | | 8% | | 7% | |
Ultimate health care costs trend rate | | 8% | | 7% | |
Year that the rate reaches the ultimate trend rate | | 2011 | | 2012 | |
A 1% change in assumed future health care costs trend rates would have the following effects:
| | 1% point increase | | 1% point decrease | |
Service costs and interest costs | | 163 | | (130 | ) |
Accumulated post-employment health care benefits obligation | | 2,019 | | (1,617 | ) |
Historical information
| | January 1, 2010 | | December 31, 2010 | | December 31, 2011 | |
Present value of funded defined benefit obligation | | (7,166 | ) | (8,741 | ) | (10,547 | ) |
Fair value of plan assets | | 6,022 | | 8,005 | | 8,986 | |
Deficit in the plan | | (1,144 | ) | (736 | ) | (1,561 | ) |
Experience adjustments arising on plan liabilities | | (722 | ) | (231 | ) | (64 | ) |
Experience adjustments arising on plan assets | | (756 | ) | (691 | ) | (222 | ) |
33. LONG-SERVICE AWARDS (“LSA”)
Telkomsel provides certain cash awards or certain number of days leave benefits to its employees based on the employees’ length of service requirements, including LSA and LSL. LSA are either paid at the time the employees reach the anniversary dates during employment, or at the time of termination. LSL are either certain number of days leave benefit or cash, subject to approval by management, provided to employees who met the requisite number of years of service and with a certain minimum age.
The obligation with respect to these awards was determined based on an actuarial valuation using the Projected Unit Credit method, and amounted to Rp.212 billion, Rp.242 billion and Rp.287 billion as ofJanuary 1, 2010,December 31, 2010 and 2011, respectively. The related benefits costs charged to expense amounted to Rp.78 billion and Rp.96 billion for the year ended December 31, 2010 and 2011, respectively (Note 27).
F-79
Table of Contents |
PERUSAHAAN PERSEROAN (PERSERO) P.T. TELEKOMUNIKASI INDONESIA Tbk AND SUBSIDIARIES NOTES TO CONSOLIDATED FINANCIAL STATEMENTS(continued) JANUARY 1, 2010, DECEMBER 31, 2010 AND 2011 AND YEARS ENDED DECEMBER 31, 2010 AND 2011 (Figures in tables are presented in billions of Rupiah, unless otherwise stated) |
34. RELATED PARTY TRANSACTIONS
In the normal course of business, the Company and its subsidiaries entered into transactions with related parties. It is the Company’s policy that the pricing of these transactions be the same as those of arm’s length-transactions.
a. Nature of relationships and transactions/accounts with related parties
Details of the nature of relationships and transactions/accounts with significant related parties are as follows:
Related parties | | Nature of relationships with related parties | | Nature of transactions/accounts | |
The Government | | Majority stockholder | | Finance costs, andinvestment on financial instruments | |
Government Agencies | | Entity under common control | | Network revenues and operation expenses | |
MoCI | | Entity under common control | | Concession fees, radio frequency usage charges,USO charges and telecommunication servicesrevenue | |
State-owned enterprises | | Entity under common control | | Operation expenses, purchase of property, plant and equipment, construction and installation services, insurance expense, finance expense, finance income, investment on financial instruments | |
Indosat | | Entity under common control | | Interconnection revenues, interconnection expenses, telecommunications facilities usage, operating and maintenance cost leased linesrevenue,satellite transpondersusage revenues and usage of data communication network system expenses and lease revenue | |
PT Aplikanusa Lintasarta (“Lintasarta”) | | Entity under significant influence | | Network revenues, usage of data communication network system expenses, leased lines expenses | |
PT Satelit Palapa Indonesia (“Satelindo”) | | Entity under significant influence | | Network revenues and leased lines expenses, | |
Indosat Mega Media | | Entity under significant influence | | Network revenues | |
PT Sistelindo Mitralintas | | Entity under significant influence | | Network revenues | |
CSM | | Associated company | | Satellite transponders usage revenues, leased lines revenues and transmission lease expenses | |
Patrakom | | Associated company | | Satellite transponders usage revenues, leased lines revenues and transmission lease expenses | |
PSN | | Associated company | | Satellite transponders usage revenues, leased lines revenues, transmission lease expenses, interconnection revenues and interconnection expense | |
PT Industri Telekomunikasi Indonesia ("INTI") | | Entity under common control | | Purchase of property, plant and equipment | |
PT Asuransi Jasa Indonesia (“Jasindo”) | | Entity under common control | | Insurance of property, plant and equipment | |
PT Jaminan Sosial Tenaga Kerja (“Jamsostek”) | | Entity under common control | | Insurance expenses for employees | |
PT Perusahaan Listrik Negara (Persero) (“PLN”) | | Entity under common control | | Electricity expenses | |
PT Pos Indonesia | | Entity under common control | | Cost of SIM cards | |
State-owned banks | | Entity under common control | | Finance income and finance costs | |
BNI | | Entity under common control | | Finance income and finance costs | |
Bank Mandiri | | Entity under common control | | Finance income and finance costs | |
F-80
Table of Contents |
PERUSAHAAN PERSEROAN (PERSERO) P.T. TELEKOMUNIKASI INDONESIA Tbk AND SUBSIDIARIES NOTES TO CONSOLIDATED FINANCIAL STATEMENTS(continued) JANUARY 1, 2010, DECEMBER 31, 2010 AND 2011 AND YEARS ENDED DECEMBER 31, 2010 AND 2011 (Figures in tables are presented in billions of Rupiah, unless otherwise stated) |
34. RELATED PARTY TRANSACTIONS(continued)
a. Nature of relationships and transactions/accounts with related parties(continued)
Related parties | | Nature of relationships with related parties | | Nature of transactions/accounts | |
BRI | | Entity under common control | | Finance income and finance costs | |
BTN | | Entity under common control | | Finance income and finance costs | |
PT Bahana TCW Investment Management (“Bahana”) | | Entity under common control | | Available-for-sale financial assets, bonds and notes | |
Koperasi Pegawai Telkom (“Kopegtel”) | | Entity under significant influence | | Purchase of property, plant and equipment, construction and installation services, leases buildings, leases vehicles, purchases materials and construction services, and utilizes maintenance, cleaning services and RSA revenues | |
PT Sandhy Putra Makmur (“SPM”) | | Entity under significant influence | | Leases buildings, leases vehicles, purchases materials and construction services, and utilizes maintenance and cleaning services | |
Koperasi Pegawai Telkomsel (“Kisel”) | | Entity under significant influence | | Car rental services, printing and distribution of customer bills, collection, other services, distribution of SIM cards and pulse reload vouchers | |
PT Graha Informatika Nusantara (“Gratika”) | | Entity under significant influence | | Leased lines revenues, purchase of property, plant and equipment installation and maintenance expense | |
Directors and commissioners | | Key management personnel | | Honorarium and facilities | |
Yakes | | Entity under significant influence | | Medical expenses | |
b. Transactions with related parties
The following are significant transactions with related parties:
| | 2010 | | 2011 | |
| | Amount | | % of total revenues | | Amount | | % of total revenues | |
REVENUES | | | | | | | | | |
Kisel | | 2,155 | | 3.14 | | 2,347 | | 3.29 | |
Indosat | | 965 | | 1.41 | | 857 | | 1.20 | |
Government agencies | | 242 | | 0.35 | | 415 | | 0.58 | |
Lintasarta | | 103 | | 0.15 | | 93 | | 0.13 | |
Patrakom | | 66 | | 0.10 | | 67 | | 0.09 | |
CSM | | 77 | | 0.11 | | 57 | | 0.08 | |
Others | | 30 | | 0.04 | | 30 | | 0.04 | |
| | 2010 | | 2011 | |
| | Amount | | % of total expenses | | Amount | | % of total expenses | |
EXPENSES | | | | | | | | | |
MoCI | | 4,153 | | 8.96 | | 4,165 | | 8.31 | |
PLN | | 1,623 | | 3.50 | | 1,243 | | 2.48 | |
Kopegtel | | 936 | | 2.02 | | 956 | | 1.91 | |
Indosat | | 910 | | 1.96 | | 814 | | 1.62 | |
Kisel | | 634 | | 1.37 | | 745 | | 1.49 | |
Jasindo | | 359 | | 0.77 | | 401 | | 0.80 | |
PSN | | 181 | | 0.39 | | 170 | | 0.34 | |
Yakes | | 136 | | 0.29 | | 121 | | 0.24 | |
CSM | | 121 | | 0.26 | | 107 | | 0.21 | |
SPM | | 182 | | 0.39 | | 91 | | 0.18 | |
Patrakom | | 74 | | 0.16 | | 77 | | 0.15 | |
PT Pos Indonesia | | 29 | | 0.06 | | 54 | | 0.11 | |
Jamsostek | | 31 | | 0.07 | | 33 | | 0.07 | |
Others (each below Rp.30 billion) | | 72 | | 0.16 | | 47 | | 0.09 | |
F-81
Table of Contents |
PERUSAHAAN PERSEROAN (PERSERO) P.T. TELEKOMUNIKASI INDONESIA Tbk AND SUBSIDIARIES NOTES TO CONSOLIDATED FINANCIAL STATEMENTS(continued) JANUARY 1, 2010, DECEMBER 31, 2010 AND 2011 AND YEARS ENDED DECEMBER 31, 2010 AND 2011 (Figures in tables are presented in billions of Rupiah, unless otherwise stated) |
34. RELATED PARTY TRANSACTIONS(continued)
b. Transactions with related parties (continued)
| | 2010 | | 2011 | |
| | Amount | | % of total finance income | | Amount | | % of total finance income | |
Finance income | | | | | | | | | |
State-owned banks | | 233 | | 51.55 | | 320 | | 51.61 | |
The Government | | 32 | | 7.08 | | 74 | | 11.94 | |
Total | | 265 | | 58.63 | | 394 | | 63.55 | |
| | 2010 | | 2011 | |
| | Amount | | % of total finance costs | | Amount | | % of total finance costs | |
Finance cost | | | | | | | | | |
State-owned banks | | 938 | | 48.65 | | 621 | | 37.36 | |
The Government | | 163 | | 8.45 | | 169 | | 10.17 | |
Total | | 1,101 | | 57.10 | | 790 | | 47.53 | |
| | 2010 | | 2011 | |
| | Amount | | % of total fixed assets purchased | | Amount | | % of total fixed assets purchased | |
PURCHASE OF PROPERTY, PLANT AND EQUIPMENT(Note 11) | | | | | | | | | |
Kopegtel | | 127 | | 1.02 | | 183 | | 1.25 | |
State-owned enterprises | | 140 | | 1.12 | | 116 | | 0.79 | |
SPM | | 7 | | 0.06 | | 18 | | 0.12 | |
Gratika | | 29 | | 0.23 | | 5 | | 0.03 | |
| | January1, 2010 | | December 31,2010 | | December 31,2011 | |
| | Amount | | % of total assets | | Amount | | % of total assets | | Amount | | % of total assets | |
TOTAL PLACEMENTS IN THE FORM OF CURRENT ACCOUNTS, TIME DEPOSITS AND MUTUAL FUNDS(Note 5) | | | | | | | | | | | | | |
State-owned banks | | 6,029 | | 6.11 | | 8,398 | | 8.31 | | 8,265 | | 8.05 | |
F-82
Table of Contents |
PERUSAHAAN PERSEROAN (PERSERO) P.T. TELEKOMUNIKASI INDONESIA Tbk AND SUBSIDIARIES NOTES TO CONSOLIDATED FINANCIAL STATEMENTS(continued) JANUARY 1, 2010, DECEMBER 31, 2010 AND 2011 AND YEARS ENDED DECEMBER 31, 2010 AND 2011 (Figures in tables are presented in billions of Rupiah, unless otherwise stated) |
34. RELATED PARTY TRANSACTIONS(continued)
b. Transactions with related parties (continued)
Presented below are balances of accounts with related parties:
| | January1, 2010 | | December 31,2010 | | December 31,2011 | |
| | Amount | | % of total assets | | Amount | | % of total assets | | Amount | | % of total assets | |
a. | Cash and cash equivalents(Note 5) | | 5,349 | | 5.42 | | 7,942 | | 7.86 | | 7,848 | | 7.64 | |
b. | Available-for-sale financial assets | | | | | | | | | | | | | |
| State-owned enterprise | | 115 | | 0.12 | | 116 | | 0.11 | | 110 | | 0.11 | |
| The Government | | 119 | | 0.12 | | 138 | | 0.14 | | 140 | | 0.14 | |
| Bahana | | 54 | | 0.05 | | 58 | | 0.06 | | 64 | | 0.06 | |
| Total | | 288 | | 0.29 | | 312 | | 0.31 | | 314 | | 0.31 | |
c. | Tradeand otherreceivables – net(Note 6) | | 792 | | 0.80 | | 913 | | 0.90 | | 1,042 | | 1.01 | |
d. | Advances and prepaid expenses(Note 8) | | | | | | | | | | | | | |
| MoCI | | 1,723 | | 1.74 | | 2,393 | | 2.37 | | 2,206 | | 2.15 | |
| Others (each below Rp.30 billion) | | 10 | | 0.01 | | 8 | | 0.01 | | 27 | | 0.03 | |
| | | 1,733 | | 1,75 | | 2,401 | | 2.38 | | 2,233 | | 2.18 | |
e. | Other current assets | | | | | | | | | | | | | |
| BNI | | 109 | | 0.11 | | 1 | | 0.00 | | 1 | | 0.00 | |
| Others | | 16 | | 0.02 | | - | | - | | 4 | | 0.00 | |
| | | 125 | | 0.13 | | 1 | | 0.00 | | 5 | | 0.00 | |
f. | Advances and other non-current assets(Note 12) | | | | | | | | | | | | | |
| Bank Mandiri | | 168 | | 0.17 | | 47 | | 0.05 | | - | | - | |
| BNI | | 98 | | 0.10 | | 94 | | 0.09 | | 92 | | 0.09 | |
| Others | | 1 | | 0.00 | | 1 | | 0.00 | | 5 | | 0.00 | |
| Total | | 267 | | 0.27 | | 142 | | 0.14 | | 97 | | 0.09 | |
| | January1, 2010 | | December 31,2010 | | December 31,2011 | |
| | Amount | | % of totalliabilities | | Amount | | % of totalliabilities | | Amount | | % of totalliabilities | |
g. | Trade payables(Note 14) | | | | | | | | | | | | | |
| MoCI | | 1,275 | | 2.63 | | 394 | | 0.88 | | 409 | | 0.94 | |
| Kopegtel | | 133 | | 0.27 | | 140 | | 0.31 | | 92 | | 0.21 | |
| INTI | | 13 | | 0.03 | | 14 | | 0.03 | | 66 | | 0.15 | |
| Indosat | | 63 | | 0.13 | | 62 | | 0.14 | | 52 | | 0.12 | |
| State-owned enterprises | | 1 | | 0.00 | | 287 | | 0.64 | | 41 | | 0.09 | |
| Yakes | | 38 | | 0.08 | | 61 | | 0.14 | | 35 | | 0.08 | |
| Gratika | | 8 | | 0.02 | | 34 | | 0.08 | | 12 | | 0.03 | |
| Others | | 228 | | 0.47 | | 162 | | 0.36 | | 131 | | 0.30 | |
| Total | | 1,759 | | 3.63 | | 1,154 | | 2.58 | | 838 | | 1.92 | |
F-83
Table of Contents |
PERUSAHAAN PERSEROAN (PERSERO) P.T. TELEKOMUNIKASI INDONESIA Tbk AND SUBSIDIARIES NOTES TO CONSOLIDATED FINANCIAL STATEMENTS(continued) JANUARY 1, 2010, DECEMBER 31, 2010 AND 2011 AND YEARS ENDED DECEMBER 31, 2010 AND 2011 (Figures in tables are presented in billions of Rupiah, unless otherwise stated) |
34. RELATED PARTY TRANSACTIONS(continued)
b. Transactions with related parties (continued)
| | January1, 2010 | | December 31,2010 | | December 31,2011 | |
| | Amount | | % of total liabilities | | Amount | | % of total liabilities | | Amount | | % of total liabilities | |
h. | Accrued expenses(Note 15) | | | | | | | | | | | | | |
| The Government Agencies and state-owned banks | | 369 | | 0.76 | | 65 | | 0.15 | | 72 | | 0.16 | |
i. | Advances from customers and suppliers | | | | | | | | | | | | | |
| The Government | | - | | - | | 170 | | 0.38 | | 151 | | 0.35 | |
j. | Short-term bank loans(Note 17) State-owned bank | | 9 | | 0.02 | | 4 | | 0.01 | | 7 | | 0.02 | |
k. | Two-step loans(Note 18) The Government | | 3,518 | | 7.26 | | 3,137 | | 7.04 | | 2,284 | | 5.23 | |
l. | Bonds and notes | | | | | | | | | | | | | |
| Bahana (Note 18) | | 70 | | 0.14 | | 101 | | 0.23 | | 107 | | 0.24 | |
m. | Long-term bank loans(Note18) | | | | | | | | | | | | | |
| BNI | | 4,450 | | 9.19 | | 3,749 | | 8.42 | | 2,273 | | 5.20 | |
| BRI | | 3,700 | | 7.64 | | 2,197 | | 4.93 | | 2,131 | | 4.88 | |
| Bank Mandiri | | 3,330 | | 6.88 | | 3,073 | | 6.90 | | 2,110 | | 4.83 | |
| Bank Jabar | | 700 | | 1.45 | | 525 | | 1.18 | | 350 | | 0.80 | |
| BTN | | - | | - | | 7 | | 0.02 | | - | | - | |
| Total | | 12,180 | | 25.16 | | 9,551 | | 21.45 | | 6,864 | | 15.71 | |
c. Significant agreements with related parties
i. The Government
The Company obtained two-step loans from the Government (Note 18a).
The Company and its subsidiaries pay concession fees for telecommunications services provided and radio frequency usage charges to the Ministry of Communications and Information of the Republic of Indonesia.
Telkomsel paid an up-front fee for the 3G license amounting to Rp.756 billion and recognized as intangible asset (Note 13).
Starting 2005, the Company and its subsidiaries pay USO charges to the Ministry of Communications and Information of the Republic of Indonesia pursuant to MoCI Regulation No.15/Per/M.KOMINFO/9/2005 of September 30, 2005.
ii. Indosat
The Company has an agreement with Indosat for the provision of international telecommunications services to the public.
The Company has also entered into an interconnection agreement between the Company’s fixed line network (Public Switched Telephone Network or “PSTN”) and Indosat’s GSM mobile cellular telecommunications network in connection with implementation of Indosat Multimedia Mobile services and the settlement of the related interconnection rights and obligations.
F-84
Table of Contents |
PERUSAHAAN PERSEROAN (PERSERO) P.T. TELEKOMUNIKASI INDONESIA Tbk AND SUBSIDIARIES NOTES TO CONSOLIDATED FINANCIAL STATEMENTS(continued) JANUARY 1, 2010, DECEMBER 31, 2010 AND 2011 AND YEARS ENDED DECEMBER 31, 2010 AND 2011 (Figures in tables are presented in billions of Rupiah, unless otherwise stated) |
34. RELATED PARTY TRANSACTIONS(continued)
c. Significant agreements with related parties (continued)
ii. Indosat (continued)
The Company also has an agreement with Indosat for the interconnection of Indosat's GSM mobile cellular telecommunications network with the Company's PSTN, enabling each party’s customers to make domestic calls between Indosat’s GSM mobile network and the Company’s fixed line network and allowing Indosat’s mobile customers to access the Company’s IDD service by dialing “007”.
The Company has been handling customer billings and collections for Indosat. Indosat is gradually taking over the activities and performing its own direct billing and collection. The Company receives compensation from Indosat computed at 1% of the collections made by the Company beginning January 1, 1995, plus the billing process expenses which are fixed at a certain amount per record. On December 11, 2008, the Company and Indosat agreed to implement IDD service charge tariff, the tariff already taken into account the compensation of its billing and collection. The agreement is valid and effective starting on January to December 2011, and can be applied until a new Minutes of Agreement available.
On December 28, 2006, the Company and Indosat signed amendments to the interconnection agreements for the fixed line networks (local, SLJJ and international) and mobile network for the implementation of the cost-based tariff obligations under the MoCI Regulations No. 8/2006.These amendments took effect on January 1, 2007.
Telkomsel also entered into an agreement with Indosat for the provision of international telecommunications services to its GSM mobile cellular customers.
The Company provides leased lines to Indosat and its subsidiaries, namely Indosat Mega Media, Lintasarta and PT Sistelindo Mitralintas. The leased lines can be used by these companies for telephone, telegraph, data, telex, facsimile or other telecommunication services.
iii. Others
The Company has entered into agreements with associated companies, namely CSM, Patrakom, PSN and Gratika for the utilization of the Company's satellite transponders or frequency channels and leased lines.
Telkomsel has an agreement with PSN for the lease of PSN’s transmission link. Based on the agreement, which was made on March 14, 2001, the minimum lease period is 2 years since the operation of the transmission link and is extendable subject to agreement by both parties. The agreement was extended until March 29, 2013.
Koperasi Pegawai Telkomsel (“Kisel”) is a cooperation that was established by Telkomsel’s employees to engage in car rental services, printing and distribution of customer bills, collection and other services principally for the benefit of Telkomsel. Telkomsel also has dealership agreements with Kisel for distribution of SIM cards and pulse reload vouchers.
F-85
Table of Contents |
PERUSAHAAN PERSEROAN (PERSERO) P.T. TELEKOMUNIKASI INDONESIA Tbk AND SUBSIDIARIES NOTES TO CONSOLIDATED FINANCIAL STATEMENTS(continued) JANUARY 1, 2010, DECEMBER 31, 2010 AND 2011 AND YEARS ENDED DECEMBER 31, 2010 AND 2011 (Figures in tables are presented in billions of Rupiah, unless otherwise stated) |
34. RELATED PARTY TRANSACTIONS(continued)
d. Key management personnel remuneration
The Company and its subsidiaries provide honorarium and facilities to support the operational duties of their key management personnel. The total of such benefits amounted to Rp.219 billion and Rp.238 billion for the year ended December 31, 2010 and 2011, representing 0.47% and 0.47% of the total expenses for each year.
35. SEGMENT INFORMATION
The Company and its subsidiaries have three main operating segments in Indonesia namely: fixed wireline, fixed wireless and cellular. The fixed wireline segment provides local, domestic long distance (“Sambungan Langsung Jarak Jauh” or “SLJJ”) and international telephone services, and other telecommunications services (including among others, leased lines, telex, transponder, satellite and Very Small Aperture Terminal (“VSAT”)) as well as ancillary services. The fixed wireless segment provides CDMA-based telecommunication services which offers customers the ability to use a wireless handset with limited mobility (within a local code area). The cellular segment provides basic telecommunication services, particularly mobile cellular telecommunication services. Operating segments that are not monitored separately by chief operating decision maker (“CODM”) are presented as “Others”, comprising of information technology services, telephone directories and building management businesses.
Segment revenues and expenses include transactions between business segments and are accounted for at prices that management believes represent market prices.
| | 2010 | |
| | Fixed wireline | | Fixed wireless | | Cellular | | Others | | Total before elimination | | Elimination | | Total consolidated | |
Segment results | | | | | | | | | | | | | | | |
External revenues | | 21,619 | | 2,951 | | 43,492 | | 467 | | 68,529 | | - | | 68,529 | |
Inter-segment revenues | | 5,434 | | 174 | | 1,931 | | 745 | | 8,284 | | (8,284) | | - | |
Total segment revenues | | 27,053 | | 3,125 | | 45,423 | | 1,212 | | 76,813 | | (8,284) | | 68,529 | |
Other income | | | | | | | | | | | | | | | |
External other income | | 291 | | 22 | | 220 | | 15 | | 548 | | - | | 548 | |
Inter-segment other income | | 23 | | - | | - | | 37 | | 60 | | (60 | ) | - | |
Total segment other income | | 314 | | 22 | | 220 | | 52 | | 608 | | (60 | ) | 548 | |
External expenses | | (18,425 | ) | (2,754 | ) | (24,121 | ) | (1,023 | ) | (46,323 | ) | - | | (46,323 | ) |
Inter-segment expenses | | (3,967 | ) | (123 | ) | (4,223 | ) | (31 | ) | (8,344 | ) | 8,344 | | - | |
Segment expenses | | (22,392 | ) | (2,877 | ) | (28,344 | ) | (1,054 | ) | (54,667 | ) | 8,344 | | (46,323 | ) |
Segment results | | 4,975 | | 270 | | 17,299 | | 210 | | 22,754 | | - | | 22,754 | |
Equity in net (loss) income of associated | | | | | | | | | | | | | | | |
Companies | | | | | | | | | | | | | | (14 | ) |
Finance income | | | | | | | | | | | | | | 452 | |
Finance costs | | | | | | | | | | | | | | (1,928 | ) |
Income tax expense | | | | | | | | | | | | | | (5,512 | ) |
Profit for the year | | | | | | | | | | | | | | 15,752 | |
Foreign currency translation - net of tax | | | | | | | | | | | | | | 2 | |
Change in fair value of available-for-sale financial assets - net of tax | | | | | | | | | | | | | | 32 | |
Defined benefit plan actuarial (gains) losses-net of tax | | | | | | | | | | | | | | (587 | ) |
Total comprehensive income for the year | | | | | | | | | | | | | | 15,199 | |
F-86
Table of Contents |
PERUSAHAAN PERSEROAN (PERSERO) P.T. TELEKOMUNIKASI INDONESIA Tbk AND SUBSIDIARIES NOTES TO CONSOLIDATED FINANCIAL STATEMENTS(continued) JANUARY 1, 2010, DECEMBER 31, 2010 AND 2011 AND YEARS ENDED DECEMBER 31, 2010 AND 2011 (Figures in tables are presented in billions of Rupiah, unless otherwise stated) |
35. SEGMENT INFORMATION(continued)
| | 2010 | |
| | Fixed wireline | | Fixed wireless | | Cellular | | Others | | Total before elimination | | Elimination | | Total consolidated | |
Profit for the year attributable to: | | | | | | | | | | | | | | | |
Owners of the parent | | | | | | | | | | | | | | 11,427 | |
Non-controlling interest | | | | | | | | | | | | | | 4,325 | |
Total comprehensive income attributable to: | | | | | | | | | | | | | | | |
Owners of the parent | | | | | | | | | | | | | | 10,911 | |
Non-controlling interest | | | | | | | | | | | | | | 4,288 | |
Other information | | | | | | | | | | | | | | | |
Segment assets | | 40,017 | | 5,262 | | 57,601 | | 914 | | 103,794 | | (2,976 | ) | 100,818 | |
Investments in associates | | 233 | | - | | 21 | | - | | 254 | | - | | 254 | |
Total consolidated assets | | | | | | | | | | | | | | 101,072 | |
Total consolidated liabilities | | (22,669 | ) | (827 | ) | (23,658 | ) | (356 | ) | (47,510 | ) | 2,976 | | (44,534 | ) |
Capital expenditures | | (4,052 | ) | (147 | ) | (8,198 | ) | (90 | ) | (12,487 | ) | - | | (12,487 | ) |
Depreciation and amortization | | (4,215 | ) | (731 | ) | (9,600 | ) | (34 | ) | (14,580 | ) | - | | (14,580 | ) |
Other non-cash expenses | | (337 | ) | (34 | ) | (148 | ) | (6 | ) | (525 | ) | - | | (525 | ) |
| | 2011 | |
| | Fixed wireline | | Fixed wireless | | Cellular | | Others | | Total before elimination | | Elimination | | Total consolidated | |
Segment results | | | | | | | | | | | | | | | |
External revenues | | 22,072 | | 2,101 | | 46,515 | | 550 | | 71,238 | | - | | 71,238 | |
Inter-segment revenues | | 6,549 | | 126 | | 2,054 | | 941 | | 9,670 | | (9,670 | ) | - | |
Total segment revenues | | 28,621 | | 2,227 | | 48,569 | | 1,491 | | 80,908 | | (9,670 | ) | 71,238 | |
Other income | | | | | | | | | | | | | | | |
External other income | | 293 | | 11 | | 295 | | 67 | | 666 | | - | | 666 | |
Inter-segment other income | | 17 | | - | | - | | 183 | | 200 | | (200 | ) | - | |
Total segment other income | | 310 | | 11 | | 295 | | 250 | | 866 | | (200 | ) | 666 | |
External expenses | | (18,469 | ) | (3,571 | ) | (26,671 | ) | (1,406 | ) | (50,117 | ) | - | | (50,117 | ) |
Inter-segment expenses | | (5,135 | ) | (100 | ) | (4,580 | ) | (55 | ) | (9,870 | ) | 9,870 | | - | |
Segment expenses | | (23,604 | ) | (3,671 | ) | (31,251 | ) | (1,461 | ) | (59,987 | ) | 9,870 | | (50,117 | ) |
Segment result | | 5,327 | | (1,433 | ) | 17,613 | | 280 | | 21,787 | | - | | 21,787 | |
Equity in net (loss) income of associated Companies | | | | | | | | | | | | | | (10 | ) |
Finance income | | | | | | | | | | | | | | 620 | |
Finance costs | | | | | | | | | | | | | | (1,662 | ) |
Income tax expense | | | | | | | | | | | | | | (5,385 | ) |
Profit for the year | | | | | | | | | | | | | | 15,350 | |
Foreign currency translation | | | | | | | | | | | | | | 7 | |
Change in fair value of available-for-sale Financial assets - net of tax | | | | | | | | | | | | | | 4 | |
Defined benefit plan actuarial (gains) losses-net of tax | | | | | | | | | | | | | | (1,958 | ) |
Total comprehensive income for the year | | | | | | | | | | | | | | 13,403 | |
Profit for the year attributable to: | | | | | | | | | | | | | | | |
Owners of the parent | | | | | | | | | | | | | | 10,848 | |
Non-controlling interest | | | | | | | | | | | | | | 4,502 | |
Total comprehensive income attributable to: | | | | | | | | | | | | | | | |
Owners of the parent | | | | | | | | | | | | | | 8,969 | |
Non-controlling interest | | | | | | | | | | | | | | 4,434 | |
Other information | | | | | | | | | | | | | | | |
Segment assets | | 42,682 | | 4,167 | | 58,151 | | 1,171 | | 106,171 | | (4,475 | ) | 101,696 | |
Asset held-for-sale | | - | | - | | 791 | | - | | 791 | | - | | 791 | |
Investments in associates | | 215 | | - | | 20 | | - | | 235 | | - | | 235 | |
Total consolidated assets | | | | | | | | | | | | | | 102,722 | |
F-87
Table of Contents |
PERUSAHAAN PERSEROAN (PERSERO) P.T. TELEKOMUNIKASI INDONESIA Tbk AND SUBSIDIARIES NOTES TO CONSOLIDATED FINANCIAL STATEMENTS(continued) JANUARY 1, 2010, DECEMBER 31, 2010 AND 2011 AND YEARS ENDED DECEMBER 31, 2010 AND 2011 (Figures in tables are presented in billions of Rupiah, unless otherwise stated) |
35. SEGMENT INFORMATION (continued)
| | 2011 | |
| | Fixed wireline | | Fixed wireless | | Cellular | | Others | | Total before elimination | | Elimination | | Total consolidated | |
Total consolidated liabilities | | (25,871 | ) | (778 | ) | (21,033 | ) | (489 | ) | (48,171 | ) | 4,475 | | (43,696 | ) |
Capital expenditures | | (5,756 | ) | (219 | ) | (8,467 | ) | (112 | ) | (14,554 | ) | - | | (14,554 | ) |
Depreciation and amortization | | (3,251 | ) | (1,309 | ) | (10,218 | ) | (45 | ) | (14,823 | ) | - | | (14,823 | ) |
Other non-cash expenses | | (708 | ) | (19 | ) | (155 | ) | (1 | ) | (883 | ) | - | | (883 | ) |
36. REVENUE-SHARING ARRANGEMENTS (“RSA”)
The Company has entered into agreements with several investors under RSA to develop fixed lines, public card-phone booths (including their maintenance), data and internet network and related supporting telecommunications facilities.
As of December 31, 2011, the Company has 10 RSA’s with 8 investors. The RSA’s are located mainly in East Java, Kalimantan, Makassar, Pare-pare, Manado, Denpasar, Mataram and Kupang, with concession periods ranging from 87 to 148 months.
Under the RSA, the investors finance the costs incurred in developing the telecommunications facilities. Upon completion of the construction, the Company manages and operates the facilities and bears the cost of repairs and maintenance during the revenue-sharing periods. The investors legally retain the rights to the property, plant and equipment constructed by them during the RSA periods. At the end of each RSA period, the investors transfer the ownership of the facilities to the Company at a nominal price.
Generally, the revenues earned from the customers in the form of line installation charges are allocated in full to the investors. The revenues from outgoing telephone pulses and monthly subscription charges are shared between the investors and the Company based on certain agreed ratios.
37. COMMITMENTS AND SIGNIFICANT AGREEMENTS
a. Capital expenditures
As of December 31, 2011, capital expenditures committed under the contractual arrangements, principally relating to procurement and installation of switching equipment, transmission equipment and cable network, are as follows:
Currencies | | Amounts in foreign currencies (in millions) | | Equivalent in Rupiah | |
Rupiah | | - | | 4,383 | |
U.S. Dollars | | 564 | | 5,113 | |
Euro | | 0.2 | | 3 | |
Total | | | | 9,499 | |
F-88
Table of Contents |
PERUSAHAAN PERSEROAN (PERSERO) P.T. TELEKOMUNIKASI INDONESIA Tbk AND SUBSIDIARIES NOTES TO CONSOLIDATED FINANCIAL STATEMENTS(continued) JANUARY 1, 2010, DECEMBER 31, 2010 AND 2011 AND YEARS ENDED DECEMBER 31, 2010 AND 2011 (Figures in tables are presented in billions of Rupiah, unless otherwise stated) |
37. COMMITMENTS AND SIGNIFICANT AGREEMENTS(continued)
a. Capital expenditures(continued)
(i) The Company(continued)
The above balance includes the following significant agreements:
Contracting parties | | Date of agreement | | Significant provisions of the agreement | |
Company and G-Pas Consortium | | April 18, 2008 | | Procurement and installation agreement for Outside Plant Fiber Optic 2008 Batch 8 Divre VII | |
Company and ISS Reshetnev | | March 2, 2009 | | Procurement agreement for Telkom-3 Satellite | |
Company and APT Satellite Company Limited | | March 23, 2009 | | 142E Degree Orbital Position Cooperation Agreement | |
Company and Sansaine Huawei Consortium | | May 27, 2009 | | Cooperation agreement for procurement and installation of MSAN ALU and Secondary Access 2008 Batch 3 | |
June 15, 2009 | Cooperation agreement for procurement and installation of MSAN ALU and Secondary Access 2008 Batch 1 |
Company and ZTE Consortium | | June 2, 2009 | | Cooperation agreement for procurement and installation of MSAN ALU and Secondary Access 2008 Batch 2 | |
Company and PT Aldomaru | | June 11, 2009 | | Procurement agreement for Roll Out Infusion PL 2009 | |
Company and PT Dharma Kumala Utama | | July 29, 2009 | | Procurement and installation agreement for Fiber Optic Cable Access & RMJ 2009 in Central Java and East Java Batch 1 | |
Company and PT Sufia Technologies | | July 29, 2009 | | Procurement and installation agreement for Fiber Optic Cable Access & RMJ 2009 in Central Java and East Java Batch 3 | |
Company and Sansaine - Huawei Consortium | | August 3, 2009 | | Procurement and installation agreement for Softswitch and modernization of MSAN Divre I, Divre II, Divre III and Divre IV | |
Company and PT ZTE Indonesia | | September 4, 2009 | | Procurement and installation agreement for Modernization MSAN Softswitch Divre VI and Divre VII | |
Company and Tekken - DMT Consortium | | September 15, 2009 | | Procurement and installation agreement for Fiber Optic Cable Access Divre VI Kalimantan | |
Company and Huawei - Sansaine Consortium | | November 24, 2009 | | Procurement and installation agreement for Palapa Ring Mataram-Kupang Cable System Project (MKCS) | |
Company and NEC - NSN Consortium | | December 16, 2009 | | Procurement and installation agreement for Capacity Expansion Ring Jasuka Backbone 2009 | |
Company and Binainfo Lokatara Consortium | | September 30, 2010 | | Procurement and installation agreement for BRAS System 2010 expansion | |
Company and PT ZTE Indonesia | | October 6, 2010 | | Procurement and installation agreement for G-PON (Gigabit Capable Passive Optical Networks) expansion | |
F-89
Table of Contents |
PERUSAHAAN PERSEROAN (PERSERO) P.T. TELEKOMUNIKASI INDONESIA Tbk AND SUBSIDIARIES NOTES TO CONSOLIDATED FINANCIAL STATEMENTS(continued) JANUARY 1, 2010, DECEMBER 31, 2010 AND 2011 AND YEARS ENDED DECEMBER 31, 2010 AND 2011 (Figures in tables are presented in billions of Rupiah, unless otherwise stated) |
37. COMMITMENTS AND SIGNIFICANT AGREEMENTS(continued)
a. Capital expenditures(continued)
(i) TheCompany(continued)
Contracting parties | | Date of agreement | | Significant provisions of the agreement | |
Company and PT Industri Telekomunikasi Indonesia | | December 30, 2010 | | Procurement and installation agreement for Modernization of Copper Cable Access Network with TI/TO Pattern | |
Company and PT Lintas Teknologi Indonesia | | June 8, 2011 | | Procurement and installation for DWDM Alcatel-Lucent (ALU) | |
Company and PT Datacomm Diangraha | | June 30, 2011 | | Procurement and installation for Metro Ethernet ALU expansion | |
Company and PT Bina Nusantara Perkasa | | December 9, 2011 | | Procurement and installation for Sumatera-Bangka (SBCS) and SKKL Tarakan-Tanjung Selor (TSCS) | |
(ii) Significant agreements - Telkomsel
Contracting parties | | Date of agreement | | Significant provisions of the agreement | |
Telkomsel, PT Ericsson Indonesia, Ericsson AB, PT Nokia Siemens Networks, Nokia Siemens Networks Oy, and Nokia Siemens Network GmbH & Co. KG | | April 17, 2008 | | The combined 2G and 3G CS Core Network Rollout Agreements | |
Telkomsel, PT Ericsson Indonesia, and PT Nokia Siemens Networks | | April17,2008 | | Technical Service Agreement (TSA) forCombined 2G and 3G CS Core Network | |
Telkomsel, PT Ericsson Indonesia, Ericsson AB, PT Nokia Siemens Networks, Nokia Siemens Networks Oy, Huawei International Pte. Ltd., PT Huawei Tech Investment, and PT ZTE Indonesia | | March and June 2009 | | 2G BSS and 3G UTRAN rollout agreement for the provision of2G GSM BSS and 3G UMTS Radio Access Network | |
Telkomsel, PT Trikomsel OKE and PT Mitra Telekomunikasi Selular (MTS) | | July 2009 | | Purchase of iPhone products and provision of cellular network service | |
Telkomsel, PT Packet Systems Indonesia and PT Huawei Tech Investment | | February 3, 2010 | | Maintenance and procurement of equipment and related service agreement for Next Generation Convergence IP RAN Rollout and Technical Support | |
Telkomsel, PT Datacraft Indonesia and PT Huawei Tech Investment | | February 3,2010 | | Maintenance and procurement of equipment and related service agreement for Next Generation Convergence Core Transport Rollout and Technical Support | |
F-90
Table of Contents |
PERUSAHAAN PERSEROAN (PERSERO) P.T. TELEKOMUNIKASI INDONESIA Tbk AND SUBSIDIARIES NOTES TO CONSOLIDATED FINANCIAL STATEMENTS(continued) JANUARY 1, 2010, DECEMBER 31, 2010 AND 2011 AND YEARS ENDED DECEMBER 31, 2010 AND 2011 (Figures in tables are presented in billions of Rupiah, unless otherwise stated) |
37. COMMITMENTS AND SIGNIFICANT AGREEMENTS(continued)
a. Capital expenditures(continued)
(ii) Significant agreements - Telkomsel(continued)
Contracting parties | | Date of agreement | | Significant provisions of the agreement | |
Telkomsel, Amdocs Software Solutions Limited Liability Company and PT Application Solutions | | Februari8,2010 | | Online Charging System (“OCS”) and Service Control Points (“SCP”) System Solution Development Agreement | |
Telkomsel and PT Application Solutions | | February 8, 2010 | | Technical Support Agreement to provide technical support services for the OCS and SCP | |
Telkomsel, PT Nokia Siemens Networks and Nokia Siemens Networks Oy | | January 27, 2011 | | Soft HLR Rollout agreement | |
Telkomsel and PT Nokia Siemens Networks | | January 27, 2011 | | Soft HLR Technical Support Agreement | |
Telkomsel and PT Application Solutions | | July 5, 2011 | | Development and roll out agreement for Customer Relationship Management and Contact Center solutions | |
Telkomsel and Nokia Siemens Networks Oy and Huawei Investment | | July 11, 2011 | | Procurement agreement for equipment | |
Telkomsel andPT Ericsson Indonesia | | December 21, 2011 | | Development and Rollout of Operation Support System (OSS) | |
b. Borrowings and other credit facilities
(i) As of December 31, 2011, the Company has bank guarantee facilities for tender bond, performance bond, maintenance bond, deposit guarantee and advance payment bond for various project of the Company, as follow:
| | | | | | | | Facility utilized | |
Lenders | | Total facility | | End of the period of the facility | | Currency | | Original currency | | Rupiah equivalent | |
(in millions) |
BNI | | 220 | | March 31, 2012 | | Rp. | | - | | 120 | |
| | | | | | US$ | | 0.13 | | 1 | |
BRI | | 100 | | April 26, 2012 | | Rp. | | - | | 79 | |
| | | | | | US$ | | 0.03 | | 0 | |
Bank Mandiri | | 60 | | December 23, | | Rp. | | - | | 46 | |
| | | | 2012 | | US$ | | 0.02 | | 0 | |
Total | | 380 | | | | | | | | 246 | |
| | | | | | | | | | | |
(ii) Telkomsel has a US$3 million bond and bank guarantee and standby letter of credit facilities with SCB, Jakarta. The facilities expire on July 31, 2012. Under these facilities, as of December 31, 2011, Telkomsel has issued a bank guarantee of Rp.20 billion (equivalent to US$2.2 million) for a 3G performance bond (Note 37c.i). The bank guaranteeis validuntil March 24, 2012. |
F-91
Table of Contents |
PERUSAHAAN PERSEROAN (PERSERO) P.T. TELEKOMUNIKASI INDONESIA Tbk AND SUBSIDIARIES NOTES TO CONSOLIDATED FINANCIAL STATEMENTS(continued) JANUARY 1, 2010, DECEMBER 31, 2010 AND 2011 AND YEARS ENDED DECEMBER 31, 2010 AND 2011 (Figures in tables are presented in billions of Rupiah, unless otherwise stated) |
37. COMMITMENTS AND SIGNIFICANT AGREEMENTS(continued)
c. Others
(i) 3G license
With reference to the Decision Letter No. 07/Per/M.KOMINFO/2/2006 and No. 268/KEP/M.KOMINFO/9/2009 of the MoCI, Telkomsel amongst other commitments, is required to:
1. Pay annual BHP fee which is determined based on a certain formula over the license term (10 years).as set forth in the Decision Letter The BHP is payable upon receipt of the notification letter (“Surat Pemberitahuan Pembayaran”) from the DGPT. The BHP fee is payable annually up to the expiry period of the license in 2019. Annual BHP fee for 2011 based on notification letter from the DGPT amounted to Rp.495 billion. Such fees amount for each year varies depending on certain variables set in the formula.
2. Provide roaming access for the existing 3G operators.
3. Contribute to USO development.
4. Construct a 3G network which covers a minimum number of 14 provinces on the sixth year Of holding the 3G license.
5. Issue a performance bond each year amounting to Rp.20 billion or 5% of the annual fee to be paid for the subsequent year, whichever is higher.
(ii) Palapa Ring Consortium
On November 10, 2007, the Company entered into a Construction and Maintenance Agreement (“C&MA”) with 5 other companies for Palapa Ring Consortium. This consortium was formed to build optical fiber network in 32 cities in Eastern Indonesia with total initial investment of Rp.2,070 billion. The Company will obtain 4 lambdas bandwidth of total capacity of 8.44 lambdas from this consortium. In 2008, 2 companies draw back from the consortium, hence the total number of Palapa Ring Consortium’s member become 4 companies including the Company.
On November 22, 2011, based on management letter of Palapa Ring Consortium No. 01/PR-MC/IV/2011, the agreement of Palapa Ring Consortium was terminated. Subsequently, based on management letter of Palapa Ring Consortium No. 02/PR-MC/IV/2011 dated December 28, 2011, the escrow account is closed and the escrow account balance amounted to US$4.6 million has been returned to the Company.
(iii) Radio Frequency Usage
Based on the Decree No. 76 dated December 15, 2010 of Government of the Republic of Indonesia, which amended Decree No. 7 dated January 16, 2009, the annual frequency usage fees with a bandwidth of 800 Megahertz (“MHz”), 900 MHz and 1800 MHz are determined using a formula set forth in the decree. The decree is applicable for 5 years unless further amended.
As an implementation of the above decree, on December 15, 2010, in a Decision letter No. 456A/KEP/M.KOMINFO/12/2010, the MoCI determined that the first year (Y1) annual frequency usage fee of Telkomsel with licenses in 900 MHz band and 1800 MHz band was Rp.716 billion and was paid on December 30, 2010
F-92
Table of Contents |
PERUSAHAAN PERSEROAN (PERSERO) P.T. TELEKOMUNIKASI INDONESIA Tbk AND SUBSIDIARIES NOTES TO CONSOLIDATED FINANCIAL STATEMENTS(continued) JANUARY 1, 2010, DECEMBER 31, 2010 AND 2011 AND YEARS ENDED DECEMBER 31, 2010 AND 2011 (Figures in tables are presented in billions of Rupiah, unless otherwise stated) |
37. COMMITMENTS AND SIGNIFICANT AGREEMENTS(continued)
c. Others(continued)
(iii) Radio Frequency Usage (continued)
Based on the same Decision Letter above and a Decision letter No. 5039/T/DJPT.4/KOMINFO/12/2010 dated December 16, 2010, the MoCI determined that the first year (Y1) annual frequency usage fee of the Company with licenses in 800 MHz band was Rp.52 billion and was paid on December 27, 2010.
Subsequently, based on Decision letter No. 590/KEP/M.KOMINFO/11/2011 dated November 14, 2011, the Company and Telkomsel were considered over paid for Rp.31 billion and Rp.117 billion, respectively, which will be treated as an prepayment for annual frequency usage fee in the second year.
Based on Decision Letter No. 349/KEP/M.KOMINFO/08/2011 and No. 350/KEP/M.KOMINFO/08/2011 dated August 8, 2011, the MoCI determined that the second year (Y2) annual frequency usage fee of the Company and Telkomsel were Rp.142 billion and Rp.1,834 billion, respectively. The fees were paid in December 2011, net of prepayment.
Prior to issuance of the above decree, in accordance with the prevailing laws and telecommunications regulations, the operators were obliged to register their radio stations with the DGPT to obtain frequency usage license, except those stations that use 2.1 GHz frequency bandwidth (Note 37c.i). The frequency usage fees were payable upon receipt of notification letter (“Surat Pemberitahuan Pembayaran”) from DGPT. The fee was determined based on the number of registered carrier (“TX”) for the Company and transceivers (“TRX”) for Telkomsel of the radio stations with a fee ranging from Rp.0.07 million to Rp.17.55 million for each TX and Rp.3.4 million to Rp.15.9 million for each TRX (Note 8).
(iv) Apple, Inc
On January 9 and July 16, 2009, Telkomsel entered into agreements with Apple, Inc for the purchase of iPhone products, marketing it to customers using third parties (PT Trikomsel OKE and PT Mitra Telekomunikasi Selular) and providing cellular network services over a 3 year term. Cumulative minimum iPhone units to be purchased as of December 31, 2009, 2010 and 2011 were 125,000, 300,000 and 500,000 units for each year.
(v) Operating leases
| | Minimum lease payment | |
| | Total | | Less than 1 year | | 1-5 years | | More than 5 years | |
Operating leases | | 310 | | 87 | | 193 | | 30 | |
Operating leases represent non-cancelable office lease agreements of certain subsidiaries.
F-93
Table of Contents |
PERUSAHAAN PERSEROAN (PERSERO) P.T. TELEKOMUNIKASI INDONESIA Tbk AND SUBSIDIARIES NOTES TO CONSOLIDATED FINANCIAL STATEMENTS(continued) JANUARY 1, 2010, DECEMBER 31, 2010 AND 2011 AND YEARS ENDED DECEMBER 31, 2010 AND 2011 (Figures in tables are presented in billions of Rupiah, unless otherwise stated) |
38. CONTINGENCIES
a. In the ordinary course of business, the Company and its subsidiaries have been named as defendants in various legal actions in relation with land disputes, monopolistic practice and unfair business competition and SMS cartel practices. Based on management's estimate of the probable outcomes of these matters, the Company and its subsidiaries have accrued Rp.67 billion as of December 31, 2011.
b. The Company, Telkomsel and seven other local operators are being investigated by The Commission for the Supervision of Business Competition(“Komisi Pengawasan Persaingan Usaha” or “KPPU”) for allegations of SMS cartel practices. As a result of the investigations on June 17, 2008, KPPU found that the Company, Telkomsel and certain other local operators had proven to violate Law No. 5/1999 article 5 and gave the Company and Telkomsel Rp.18 billion penalty and Rp.25 billion penalty, respectively.
Management believes that there are no such cartel practices that led to a breach of prevailing regulations. Accordingly, the Company and Telkomsel have filed an objection with the Bandung District Court and South Jakarta District Court, on July 14, 2008 and July 11, 2008, respectively.
Due to operators filing the case in various courts, subsequently, KPPU requested SC to consolidate the case into Central Jakarta District Court (“CJDC”). Based on SC’s decision letter dated April 12, 2011, SCappointedCJDCto investigate and resolve the case.
As of the issuance date of the consolidated financial statements, the Company and Telkomsel have not received any notification from the court
For the matters and cases stated above, the Company and its subsidiaries do not believe that any subsequent investigation or court decision will have significant financial impact to the Company and its subsidiaries.
39. FINANCIAL RISK MANAGEMENT
1. Financial risk management
The Company and its subsidiaries’ activities exposethem to a variety of financial risks such as market risks (including foreign exchange risk, price risk and interest rate risk), credit risk and liquidity risk. Overall, the Company and subsidiaries’ financial risk management programme is intended for minimizing lossess on the financial assets and financial liabilities arising from fluctuation of foreign currency exchange rates and the fluctuation of interest rates. Management provides written policy for foreign currency risk management mainly through time deposits placements and hedging to cover foreign currency risk exposures for the time range of 3 up to 12 months.
Financial risk management is carried out bythe Treasury Management unit under policies approved by the Board of Directors. The Treasury Management unit identifies, evaluates and hedges financial risks.
a. Foreign exchange risk
The Company and its subsidiaries are exposed to foreign exchange risk on sales, purchases and borrowings transactions that are denominated in foreign currencies. The foreign currencies denominated transactions are primarily inU.S. Dollars and Japanese Yen. The Company and its subsidiaries’ exposure to other foreign exchange rates is not material.
F-94
Table of Contents |
PERUSAHAAN PERSEROAN (PERSERO) P.T. TELEKOMUNIKASI INDONESIA Tbk AND SUBSIDIARIES NOTES TO CONSOLIDATED FINANCIAL STATEMENTS(continued) JANUARY 1, 2010, DECEMBER 31, 2010 AND 2011 AND YEARS ENDED DECEMBER 31, 2010 AND 2011 (Figures in tables are presented in billions of Rupiah, unless otherwise stated) |
39. FINANCIAL RISK MANAGEMENT (continued)
1. Financial risk management
Financial risk management is carried out bythe Treasury Management unit under policies approved by the Board of Directors. The Treasury Management unit identifies, evaluates and hedges financial risks.
a. Foreign exchange risk
The Company and its subsidiaries are exposed to foreign exchange to foreign exchange risk on sales, purchases and borrowings transaction that are denominated in foreign currencies. The foreign currencies denominated transactions are primarily in U.S. Dollars and Japanese Yen. The Company and its subsidiaries' exposure to other foreign exchange rates is not material.
Increasing risks of foreign currency exchange rates on the obligations of the Company and its subsidiaries are expected to be offset by time deposits and receivables in foreign currencies that are equal to at least 25% of the outstanding liabilities.
The following represents the Company anditssubsidiaries’ financial assets andfinancialliabilitiesexposure to foreign currency risk:
| | January 1, 2010 | | December 31, 2010 | | December 31, 2011 | |
| | U.S. | | Japanese | | U.S. | | Japanese | | U.S. | | Japanese | |
| | Dollars | | Yen | | Dollars | | Yen | | Dollars | | Yen | |
| | (inbillion) | | (inbillion) | | (inbillion) | | (inbillion) | | (inbillion) | | (inbillion) | |
Financial assets | | 0.27 | | 0.00 | | 0.23 | | 0.00 | | 0.28 | | 0.00 | |
Financial liabilities | | (0.74 | ) | (11.56 | ) | (0.73 | ) | (10.79 | ) | (0.77 | ) | (10.02 | ) |
Net exposure | | (0.47 | ) | (11.56 | ) | (0.50 | ) | (10.79 | ) | (0.49 | ) | (10.02 | ) |
Sensitivity analysis
A strengthening of theU.S. Dollars and Japanese Yen, as indicated below, against the Rupiah at December 31, 2011 would have decreased equity and profit or loss by the amounts shown below. This analysis is based on foreign currency exchange rate variances that the Company and its subsidiaries considered to be reasonably possible at the reporting date. The analysis assumes that all other variables, in particular interest rates, remain constant.
| | Equity/profit (loss) | |
December 31, 2011 | | | |
U.S. Dollars (1% strengthening) | | (45 | ) |
Japanese Yen (5% strengthening) | | (59 | ) |
A weakening of theU.S. Dollars and Japanese Yen against the Rupiah at December 31, 2011 would have had the equal but opposite effect on the above currencies to the amounts shown above, on the basis that all other variables remain constant.
b. Market price risk The Company and its subsidiaries are exposed to changes in debt and equity market prices related to available-for-sale investments that carried at fair value. Gain and losses arising from changes in the fair value of available-for-sale investments are recognized in equity. The performance of the Company and its subsidiaries’ available-for-sale investments are monitored periodically, together with a regular assesment of their relevance to the Company and its subsidiaries’ long term strategic plans. As at December 31, 2010 and 2011, management considered the price risk for its available-for-sale investment to be immaterial in terms of the possible impact on profit or loss total equity from a reasonably possible change in fair value. |
F-95
Table of Contents |
PERUSAHAAN PERSEROAN (PERSERO) P.T. TELEKOMUNIKASI INDONESIA Tbk AND SUBSIDIARIES NOTES TO CONSOLIDATED FINANCIAL STATEMENTS(continued) JANUARY 1, 2010, DECEMBER 31, 2010 AND 2011 AND YEARS ENDED DECEMBER 31, 2010 AND 2011 (Figures in tables are presented in billions of Rupiah, unless otherwise stated) |
39. FINANCIAL RISK MANAGEMENT (continued)
1. Financial risk management(continued)
c. Interest rate risk
Interest rate fluctuation is monitored to minimize any negative impact to financial position. Borrowings at variable interest rates expose the Company and its subsidiaries to interest rate risk (Notes 17and 18). To measure market risk fluctuations in interest rates, the Companyand its subsidiariesprimarily use interest margin and maturity profile of the financial assets and liabilities based on changing schedule of the interest rate.
At reporting date, the interest rate profile of the Company and its subsidiaries’ interest-bearing borrowings was:
| | January 1, 2010 | | December 31, 2010 | | December 31, 2011 | |
Fixed rate borrowings | | (4,948 | ) | (6,427 | ) | (5,409 | ) |
Variable rate borrowings | | (17,712 | ) | (15,588 | ) | (12,462 | ) |
Sensitivity analysis for variable rate borrowings
At December 31, 2011, a change of 25 basis points in interest rates of variable rate borrowings would have increased (decreased) equity and profit or loss by the amounts Rp.31 billion, respectively. This analysis assumes that all other variables, in particular foreign currency rates, remain constant.
d. Credit risk
The following representsthe maximum exposure to credit risk of the Company and its subsidiaries financial assets:
| | January 1, 2010 | | December 31, 2010 | | December 31, 2011 | |
Cash and cash equivalents | | 7,805 | | 9,120 | | 9,634 | |
Available-for-sale financial assets | | 360 | | 370 | | 361 | |
Trade and other receivables, net | | 3,996 | | 4,534 | | 5,393 | |
Other current assets | | 125 | | 1 | | 12 | |
Long-term investments | | 71 | | 21 | | 21 | |
Advances and other non-current assets | | 260 | | 164 | | 218 | |
Total | | 12,617 | | 14,210 | | 15,639 | |
The Company and its subsidiaries are exposed to credit risk primarily from trade receivables and other receivables.The credit risk is managed by continuous monitoring outstanding balances and collection of trade and other receivables.
F-96
Table of Contents |
PERUSAHAAN PERSEROAN (PERSERO) P.T. TELEKOMUNIKASI INDONESIA Tbk AND SUBSIDIARIES NOTES TO CONSOLIDATED FINANCIAL STATEMENTS(continued) JANUARY 1, 2010, DECEMBER 31, 2010 AND 2011 AND YEARS ENDED DECEMBER 31, 2010 AND 2011 (Figures in tables are presented in billions of Rupiah, unless otherwise stated) |
39. FINANCIAL RISK MANAGEMENT (continued)
1. Financial risk management(continued)
d. Credit risk (continued)
Trade and other receivables do not include any major concentration of credit risk by customer. Each of the top three customers account for less than 1% (2010: less than 1%) of the trade receivables as at December 31, 2011.
Management is confident in its ability to continue to control and sustain minimal exposure of credit risk given that the Company and its subsidiaries have provided sufficientprovision for impairment of receivables to cover incurred loss arising from uncollectible receivables based on existing historical loss.
e. Liquidity risk
Liquidity risk arises in situations where the Company and its subsidiaries have difficulties in fulfilling financial liabilities when they become due.
Prudent liquidity risk management implies maintaining sufficient cash and cash equivalents in order to fullfil the Company and its subsidiaries’ financial liabilities. The Company and its subsidiaries continuously perform an analysis to monitorfinancial position ratios, among other things, liquidity ratios, debt equity ratios against debt covenant requirements.
The following is the maturity analysis of the Company and its subsidiaries financial liabilities:
| | Carrying | | Contractual | | | | | | | | | | 2014 and | |
| | amount | | cash flows | | 2010 | | 2011 | | 2012 | | 2013 | | thereafter | |
January 1, 2010 | | | | | | | | | | | | | | | |
Trade and other payables | | 10,205 | | (10,205 | ) | (10,205 | ) | - | | - | | - | | - | |
Accrued expenses | | 4,119 | | (4,119 | ) | (4,119 | ) | - | | - | | - | | - | |
Loan and other borrowings | | | | | | | | | | | | | | | |
Bank loans | | 16,957 | | (20,243 | ) | (7,297 | ) | (5,081 | ) | (3,318 | ) | (3,041 | ) | (1,506 | ) |
Obligations under finance leases | | 781 | | (1,083 | ) | (356 | ) | (245 | ) | (187 | ) | (129 | ) | (166 | ) |
Two-step loans | | 3,518 | | (4,601 | ) | (625 | ) | (570 | ) | (546 | ) | (446 | ) | (2,414 | ) |
Bonds and notes | | 74 | | (108 | ) | (16 | ) | (19 | ) | (35 | ) | (4 | ) | (34 | ) |
Deferred consideration for business combinations | | 1,330 | | (1,416 | ) | (1,307 | ) | (109 | ) | (- | ) | (- | ) | (- | ) |
Total | | 36,984 | | (41,775 | ) | (23,925 | ) | (6,024 | ) | (4,086 | ) | (3,620 | ) | (4,120 | ) |
| | | | | | | | | | | | | | | |
| | Carrying | | Contractual | | | | | | | | | | 2015 and | |
| | amount | | cash flows | | 2011 | | 2012 | | 2013 | | 2014 | | thereafter | |
December 31, 2010 | | | | | | | | | | | | | | | |
Trade and other payables | | 7,787 | | (7,787 | ) | (7,787 | ) | - | | - | | - | | - | |
Accrued expenses | | 3,409 | | (3,409 | ) | (3,409 | ) | - | | - | | - | | - | |
Loan and other borrowings | | | | | | | | | | | | | | | |
Bank loans | | 14,790 | | (17,326 | ) | (5,466 | ) | (4,335 | ) | (3,872 | ) | (2,481 | ) | (1,172 | ) |
Obligations under finance leases | | 607 | | (809 | ) | (286 | ) | (203 | ) | (142 | ) | (98 | ) | (80 | ) |
Two-step loans | | 3,137 | | (3,943 | ) | (552 | ) | (531 | ) | (434 | ) | (418 | ) | (2,008 | ) |
Bonds and notes | | 3,376 | | (5,785 | ) | (445 | ) | (472 | ) | (363 | ) | (333 | ) | (4,172 | ) |
Deferred consideration for business combinations | | 105 | | (106 | ) | (106 | ) | (- | ) | (- | ) | (- | ) | (- | ) |
Total | | 33,211 | | (39,165 | ) | (18,051 | ) | (5,541 | ) | (4,811 | ) | (3,330 | ) | (7,432 | ) |
F-97
Table of Contents |
PERUSAHAAN PERSEROAN (PERSERO) P.T. TELEKOMUNIKASI INDONESIA Tbk AND SUBSIDIARIES NOTES TO CONSOLIDATED FINANCIAL STATEMENTS(continued) JANUARY 1, 2010, DECEMBER 31, 2010 AND 2011 AND YEARS ENDED DECEMBER 31, 2010 AND 2011 (Figures in tables are presented in billions of Rupiah, unless otherwise stated) |
39. FINANCIAL RISK MANAGEMENT (continued)
1. Financial risk management(continued)
e. Liquidity risk (continued)
| | Carrying | | Contractual | | | | | | | | | | 2016 and | |
| | amount | | cash flows | | 2012 | | 2013 | | 2014 | | 2015 | | thereafter | |
December 31, 2011 | | | | | | | | | | | | | | | |
Trade and other payables | | 8,355 | | (8,355 | ) | (8,355 | ) | - | | - | | - | | - | |
Accrued expenses | | 4,790 | | (4,790 | ) | (4,790 | ) | - | | - | | - | | - | |
Loan and other borrowings | | | | | | | | | | | | | | | |
Bank loans | | 11,291 | | (12,763 | ) | (4,852 | ) | (3,854 | ) | (2,468 | ) | (1,156 | ) | (433 | ) |
Obligations under finance leases | | 510 | | (642 | ) | (259 | ) | (179 | ) | (110 | ) | (33 | ) | (61 | ) |
Two-step loans | | 2,284 | | (2,866 | ) | (374 | ) | (286 | ) | (279 | ) | (272 | ) | (1,655 | ) |
Bonds and notes | | 3,786 | | (5,895 | ) | (708 | ) | (608 | ) | (407 | ) | (1,258 | ) | (2,914 | ) |
Total | | 31,016 | | (35,311 | ) | (19,338 | ) | (4,927 | ) | (3,264 | ) | (2,719 | ) | (5,063 | ) |
2. Fair value of financial assets andfinancialliabilities a. Fair value measurement Fair value is the amount for which an asset could be exchanged, or liability settled, in an arms-length transaction. The Company and its subsidiaries determined the fair value measurement for disclosure purposes of each class of financial assets and financial liabilities based on the following methods and assumptions: (i) The fair values of short-term financial assets and financial liabilities with maturities of one year or less (cash and cash equivalents, trade receivables, other receivables, other current assets, trade payables, other payables, dividend payables, accrued expenses, advance from customers and suppliers, and short term bank loans) are considered toapproximate their carrying amountsas the impact of discounting is not significant (ii) Available-for-sale financial assets are primarily comprised of shares, mutual funds and Corporate and Government bonds. Shares and mutual funds actively traded in an established market are stated at fair value using quoted market price or if unquoted, determined using a valuation technique. Corporate and Government bonds are stated at fair value by reference to prices of similar securities at the reporting date. (iii) The fair values of long-termfinancialliabilities are estimated by discounting the future contractual cash flows of each liability at rates offered to the Company and its subsidiaries for similarliabilities of comparable maturities by the bankers of the Company and its subsidiaries, except for bonds which are based on market prices. The fair value estimates are inherently judgmental and involve various limitations, including: a. Fair values presented do not take into consideration the effect of future currency fluctuations. b. Estimated fair values are not necessarily indicative of the amounts that the Company and its subsidiaries would record upon disposal/termination of the financial assets and financial liabilities. |
F-98
Table of Contents |
PERUSAHAAN PERSEROAN (PERSERO) P.T. TELEKOMUNIKASI INDONESIA Tbk AND SUBSIDIARIES NOTES TO CONSOLIDATED FINANCIAL STATEMENTS(continued) JANUARY 1, 2010, DECEMBER 31, 2010 AND 2011 AND YEARS ENDED DECEMBER 31, 2010 AND 2011 (Figures in tables are presented in billions of Rupiah, unless otherwise stated) |
39. FINANCIAL RISK MANAGEMENT (continued)
2. Fair value of financial assets andfinancialliabilities(continued)
b. Classification and fair value
The following represents the carrying value and estimated fair values of the Company and its subsidiaries' financial assets and financial liabilities based on its classifications:
| | January 1, 2010 | |
| | Trading | | Loans and receivables | | Available for sale | | Other financial liabilities | | Total carrying amount | | Fair value | |
Cash and cash equivalents | | - | | 7,805 | | - | | - | | 7,805 | | 7,805 | |
Available-for-sale financial assets | | - | | - | | 360 | | - | | 360 | | 360 | |
Trade and other receivables, net | | - | | 3,996 | | - | | - | | 3,996 | | 3,996 | |
Other current assets | | - | | 125 | | - | | - | | 125 | | 125 | |
Long-term investments | | - | | - | | 71 | | - | | 71 | | 71 | |
Advances and other non-current assets | | - | | 260 | | - | | - | | 260 | | 260 | |
Total financial assets | | - | | 12,186 | | 431 | | - | | 12,617 | | 12,617 | |
Trade and other payables | | (- | ) | (- | ) | (- | ) | (10,205 | ) | (10,205 | ) | (10,205 | ) |
Accrued expenses | | (- | ) | (- | ) | (- | ) | (4,119 | ) | (4,119 | ) | (4,119 | ) |
Loans and other borrowings | | | | | | | | | | | | | |
Short-term bank loans | | (- | ) | (- | ) | (- | ) | (44 | ) | (44 | ) | (44 | ) |
Obligations under finance leases | | (- | ) | (- | ) | (- | ) | (781 | ) | (781 | ) | (781 | ) |
Two-step loans | | (- | ) | (- | ) | (- | ) | (3,518 | ) | (3,518 | ) | (3,429 | ) |
Bonds and notes | | (- | ) | (- | ) | (- | ) | (74 | ) | (74 | ) | (74 | ) |
Bank loans | | (- | ) | (- | ) | (- | ) | (16,913 | ) | (16,913 | ) | (15,973 | ) |
Deferred consideration for acquisitions | | (- | ) | (- | ) | (- | ) | (1,330 | ) | (1,330 | ) | (1,323 | ) |
Total financial liabilities | | (- | ) | (- | ) | (- | ) | (36,984 | ) | (36,984 | ) | (35,948 | ) |
| | December 31, 2010 | |
| | | | Loans and | | Available | | Other financial | | Total | | | |
| | Trading | | receivables | | for sale | | liabilities | | carrying amount | | Fair value | |
Cash and cash equivalents | | - | | 9,120 | | | | - | | 9,120 | | 9,120 | |
Available-for-sale financial assets | | - | | - | | 370 | | - | | 370 | | 370 | |
Trade and other receivables, net | | - | | 4,534 | | - | | - | | 4,534 | | 4,534 | |
Other current assets | | - | | 1 | | - | | - | | 1 | | 1 | |
Long-term investments | | - | | - | | 21 | | - | | 21 | | 21 | |
Advances and other non-current assets | | - | | 164 | | - | | - | | 164 | | 164 | |
Total financial assets | | - | | 13,819 | | 391 | | - | | 14,210 | | 14,210 | |
| | | | | | | | | | | | | |
| | December 31, 2010 | |
| | Trading | | Loans and receivables | | Available for sale | | Other financial liabilities | | Total carrying amount | | Fair value | |
Trade and other payables | | (- | ) | (- | ) | (- | ) | (7,787 | ) | (7,787 | ) | (7,787 | ) |
Accrued expenses | | (- | ) | (- | ) | (- | ) | (3,409 | ) | (3,409 | ) | (3,409 | ) |
Loans and other borrowings | | | | | | | | | | | | | |
Short-term bank loans | | (- | ) | (- | ) | (- | ) | (56 | ) | (56 | ) | (56 | ) |
Obligations under finance leases | | (- | ) | (- | ) | (- | ) | (607 | ) | (607 | ) | (607 | ) |
Two-step loans | | (- | ) | (- | ) | (- | ) | (3,137 | ) | (3,137 | ) | (3,228 | ) |
Bonds and notes | | (- | ) | (- | ) | (- | ) | (3,376 | ) | (3,376 | ) | (3,511 | ) |
Bank loans | | (- | ) | (- | ) | (- | ) | (14,734 | ) | (14,734 | ) | (14,886 | ) |
Deferred consideration for acquisitions | | (- | ) | (- | ) | (- | ) | (105 | ) | (105 | ) | (105 | ) |
Total financial liabilities | | (- | ) | (- | ) | (- | ) | (33,211 | ) | (33,211 | ) | (33,589 | ) |
F-99
Table of Contents |
PERUSAHAAN PERSEROAN (PERSERO) P.T. TELEKOMUNIKASI INDONESIA Tbk AND SUBSIDIARIES NOTES TO CONSOLIDATED FINANCIAL STATEMENTS(continued) JANUARY 1, 2010, DECEMBER 31, 2010 AND 2011 AND YEARS ENDED DECEMBER 31, 2010 AND 2011 (Figures in tables are presented in billions of Rupiah, unless otherwise stated) |
39. FINANCIAL RISK MANAGEMENT (continued)
2. Fair value of financial assets andfinancialliabilities(continued)
b. Classification and fair value (continued)
| | December 31, 2011 | |
| | Trading | | Loans and receivables | | Availablefor sale | | Other financial liabilities | | Total carrying amount | | Fair value | |
Cash and cash equivalents | | - | | 9,634 | | - | | - | | 9,634 | | 9,634 | |
Available-for-sale financial assets | | - | | | | 361 | | - | | 361 | | 361 | |
Trade and other receivables, net | | - | | 5,393 | | - | | - | | 5,393 | | 5,393 | |
Other current assets | | - | | 12 | | - | | - | | 12 | | 12 | |
Long-term investments | | - | | | | 21 | | - | | 21 | | 21 | |
Advances and other non-current assets | | - | | 218 | | - | | - | | 218 | | 218 | |
Total financial assets | | - | | 15,257 | | 382 | | - | | 15,639 | | 15,639 | |
Trade and other payables | | - | | - | | - | | (8,355 | ) | (8,355 | ) | (8,355 | ) |
Accrued expenses | | - | | - | | - | | (4,790 | ) | (4,790 | ) | (4,790 | ) |
Loans and other borrowings | | | | | | | | | | | | | |
Short-term bank loans | | - | | - | | - | | (100 | ) | (100 | ) | (100 | ) |
Obligations under finance leases | | - | | - | | - | | (510 | ) | (510 | ) | (510 | ) |
Two-step loans | | - | | - | | - | | (2,284 | ) | (2,284 | ) | (2,357 | ) |
Bonds and notes | | - | | - | | - | | (3,786 | ) | (3,786 | ) | (3,974 | ) |
Bank loans | | - | | - | | - | | (11,191 | ) | (11,191 | ) | (11,325 | ) |
Total financial liabilities | | - | | - | | - | | (31,016 | ) | (31,016 | ) | (31,411 | ) |
c. Fair value hierarchy The table below presents the recorded amount of financial assets measured at fair value and limited mutual funds participation unit for debt based securities where the Net Asset Value (NAV) per share of the investments information is not published are described below: |
| | | |
| | January 1, 2010 | |
| | | | Fair value measurement at reporting date using | |
| | Balance | | Quoted prices in active markets for | | Significant other | | Significant | |
identical assets or Liabilities | observable inputs | unobservable Inputs |
(level 1) | (level 2) | (level 3) |
Financial assets | | | | | | | | | |
Available-for-sale securities | | 360 | | 105 | | 255 | | - | |
| | | | | | | | | |
| | | | | | | | | |
| | December 31, 2010 | |
| | | | Quoted prices in active markets for | | Significant other | | Significant | |
| | | | identical assets or Liabilities | | observable inputs | | unobservable Inputs | |
| | Balance | | (level 1) | | (level 2) | | (level 3) | |
Financial assets | | | | | | | | | |
Available-for-sale securities | | 370 | | 58 | | 254 | | 58 | |
| | | | | | | | | |
F-100
Table of Contents |
PERUSAHAAN PERSEROAN (PERSERO) P.T. TELEKOMUNIKASI INDONESIA Tbk AND SUBSIDIARIES NOTES TO CONSOLIDATED FINANCIAL STATEMENTS(continued) JANUARY 1, 2010, DECEMBER 31, 2010 AND 2011 AND YEARS ENDED DECEMBER 31, 2010 AND 2011 (Figures in tables are presented in billions of Rupiah, unless otherwise stated) |
39. FINANCIAL RISK MANAGEMENT (continued)
2. Fair value of financial assets andfinancialliabilities(continued)
c. Fair value hierarchy (continued)
| | December 31, 2011 | |
| | | | Fair value measurement at reporting date using | |
| | | | Quoted prices in active markets for | | Significant other | | Significant | |
| | | | identical assets or Liabilities | | observable inputs | | unobservable Inputs | |
| | Balance | | (level 1) | | (level 2) | | (level 3) | |
Financial assets | | | | | | | | | |
Available-for-sale securities | | 361 | | 46 | | 251 | | 64 | |
| | | | | | | | | |
Available-for-sale financial assets are primarily comprised of shares, mutual funds and Corporate and Government bonds. Corporate and Government bonds are stated at fair value by reference to prices of similar securities at the reporting date. As they are not actively traded in an established market, these securities are classified as level 2. Shares and mutual funds actively traded in an established market are stated at fair value using quoted market price and classified within level 1. The valuation of the mutual funds invested in Corporate and Government bonds require significant management judgment due to the absence of quoted market prices, the inherent lack of liquidity and the long-term nature of such assets. As these investments are subject to restrictions on redemption (such as transfer restrictions and initial lock-up periods) and observable activity for the investments is limited, these investments are therefore classified within level 3 of the fair value hierarchy. Management considers among other assumptions, the valuation and quoted price of the arrangement of the mutual funds. Reconciliations of the beginning and ending balance for items measured at fair value using significant unobservable inputs (level 3) as of December 31, 2010 and 2011 are as follows: |
| | 2010 | | 2011 | |
Mutual funds | | | | | |
Balance at January 1 | | - | | 58 | |
Transfer to (out of) level 3 | | | | | |
Limited mutual funds participation unit for debt based securities | | 58 | | - | |
Purchase | | - | | 16 | |
Included in consolidated statement of comprehensive income | | | | | |
Realized (loss)-recognized in profit or loss | | - | | (0 | ) |
Unrealized (loss)-recognized in other comprehensive income | | - | | (2 | ) |
Redemption | | - | | (8 | ) |
Balance at December 31 | | 58 | | 64 | |
F-101
Table of Contents |
PERUSAHAAN PERSEROAN (PERSERO) P.T. TELEKOMUNIKASI INDONESIA Tbk AND SUBSIDIARIES NOTES TO CONSOLIDATED FINANCIAL STATEMENTS(continued) JANUARY 1, 2010, DECEMBER 31, 2010 AND 2011 AND YEARS ENDED DECEMBER 31, 2010 AND 2011 (Figures in tables are presented in billions of Rupiah, unless otherwise stated) |
40. CAPITAL MANAGEMENT
The capital structure of the Company and its subsidiaries is as follows:
| | Januari 1,2010 | | December 31,2010 | | December 31,2011 | |
| | Amount | | Portion | | Amount | | Portion | | Amount | | Portion | |
Short-term Debts | | 44 | | 0.1% | | 56 | | 0.1% | | 100 | | 0.2% | |
Long-term Debts | | 22,616 | | 36.4% | | 21,959 | | 32.9% | | 17,771 | | 27.9% | |
Total Debts | | 22,660 | | 36.5% | | 22,015 | | 33.0% | | 17,871 | | 28.1% | |
Equity attributable to owners | | 39,428 | | 63.5% | | 44,627 | | 67.0% | | 45,711 | | 71.9% | |
Total | | 62,088 | | 100% | | 66,642 | | 100% | | 63,582 | | 100% | |
The Company’s objectives when managing capital are to safeguard the Company’s ability to continue as a going concern in order to provide returns for stockholders and benefits to other stockholders and to maintain an optimum capital structure to minimize the cost of capital.
Periodically, the Company’s conducts debt valuation to assess possibilities of refinancing existing debts with the new ones which have more efficient cost that will lead to more optimize cost-of-debt. In case of rich idle cash coupled with limited investment opportunities, the Company will consider of buying back its stocks or paying dividend to its stockholders.
In addition to complying with loan covenants, the Company also maintains its capital structure at the level it believes will not risk its credit rating and that is roughly equal with its competitors.
Debt to equity ratio (comparing net interest-bearing-debt to total equity) is a ratio which is monitored by management to evaluate the Company’s capital structure and review the effectiveness of the Company’s debts. The Company monitors its debt levels to ensure the debt to equity ratio complies with or is below the ratio set out in its contractual borrowings and that such ratios are comparable or better than other regional area entities in the telecommunications industry.
The Companies debt to equity ratio as of January 1, 2010, December 31, 2010 and 2011 are as follows:
| | Jan 1, 2010 | | Dec 31,2010 | | Dec 31,2011 | |
Total interest bearing debt | | 22,660 | | 22,015 | | 17,871 | |
Less:Cash and cash equivalent | | (7,805 | ) | (9,120 | ) | (9,634 | ) |
Net debt | | 14,855 | | 12,895 | | 8,237 | |
Total equity attributable to owners | | 39,428 | | 44,627 | | 45,711 | |
Net-Debt to equity ratio | | 37.7% | | 28.9% | | 18.0% | |
As stated in Note 18b, 18c,18d, the Company is required to maintain a certain debt to equity ratio and debt service coverage ratio by the lenders. During the year ended January 1, 2010, December 31, 2010 and 2011, the Company has complied with the externally imposed capital requirements.
F-102
Table of Contents |
PERUSAHAAN PERSEROAN (PERSERO) P.T. TELEKOMUNIKASI INDONESIA Tbk AND SUBSIDIARIES NOTES TO CONSOLIDATED FINANCIAL STATEMENTS(continued) JANUARY 1, 2010, DECEMBER 31, 2010 AND 2011 AND YEARS ENDED DECEMBER 31, 2010 AND 2011 (Figures in tables are presented in billions of Rupiah, unless otherwise stated) |
41. SUPPLEMENTAL CASH FLOW INFORMATION
Certain investing and financing transactions do not require the use of cash and cash equivalents (non cash investing and financing activities) although they affect the capital and asset structure of the Company and its subsidiaries. The non cash investing and financing activities for the years ended December 31, 2010 and 2011 are as follows:
| | 2010 | | 2011 | |
Acquisition of property, plant and equipment through incurrence of payables | | 4,817 | | 4,900 | |
Addition of property, plant and equipment through non-monetary exchange | | - | | 1,226 | |
Reclassification of property, plant and equipment to non-current assets held for sale | | - | | 791 | |
Acquisition of property, plant and equipment through finance leases | | 58 | | 79 | |
42. SUBSEQUENT EVENTS
a. Based on notarial deed No. 2 dated January 3, 2012 of Sjaaf De Carya Siregar, S.H., Infomedia’s stockholders issued 17,142,857 shares which amounted to Rp.9 billion. Metra, a stockholder of Infomedia, bought all the newly issued shares. As a result the Company’s ownership in Infomedia is diluted to 49%.
b. On January 8, 2012, pursuant to the expiry of the agreement with Apple (Note 37c.iv), Telkomsel and Apple agreed to extend the agreement until March 30, 2012. As of the date of the consolidated financial statement, Telkomsel is in the process of obtaining another extension.
c. On January 20, 2012, Telkomsel repaid US$39 million of loans obtained from ICBC (Note18c).
d. On February 2, 2012, Telkomsel repaid Rp.466 billion of loans obtained from OCBC NISP (Note18c).
e. On March 12, 2012, Telkomsel received assessment letters as a result of tax audit for fiscal year 2010 by the Tax Authorities. Based on the letters, Telkomsel overpaid the Corporate Income Tax and underpaid the Value Added Tax amounted to Rp.597.4 billion (Note 37) and Rp.302.7 billion (including a penalty of Rp.73.3 billion), respectively. Telkomsel accepted the overpayment of Corporate Income Tax and Rp.12.1 billion of underpayment of Value Added Tax (including a penalty of Rp.6.3 billion). Considering that the amount is insignificant, the accepted portion was charged to the 2012 consolidated statement of comprehensive income. Telkomsel plans to file an objection to the Tax Authorities for underpayment of Value Added Tax of Rp.290.7 billion (including a penalty of Rp.67 billion).
f. As of March 29, 2012, the Company had repurchased 940,125,460 shares equivalent to 4.66% of the issued and outstanding Series B shares, for a repurchase price of Rp.7,474 billion, including broker and custodian fees (Notes 1c and 22).
F-103
Table of Contents |
PERUSAHAAN PERSEROAN (PERSERO) P.T. TELEKOMUNIKASI INDONESIA Tbk AND SUBSIDIARIES NOTES TO CONSOLIDATED FINANCIAL STATEMENTS(continued) JANUARY 1, 2010, DECEMBER 31, 2010 AND 2011 AND YEARS ENDED DECEMBER 31, 2010 AND 2011 (Figures in tables are presented in billions of Rupiah, unless otherwise stated) |
43. NEW STANDARDS AND INTERPRETATIONS NOT YET ADOPTED
A number of new standards, amendments to standards and interpretations are not yet effective for the year ended 31 December 2011, and have not been applied in preparing these consolidated financial statements:
a. Deferred Tax: Recovery of Underlying Assets (Amendments to IAS 12)
The amendments introduce an exception to the general measurement requirements of IAS 12 Income Taxes in respect of investment properties measured at fair value. The measurement of deferred tax assets and liabilities, in this limited circumstance, is based on a rebuttable presumption that the carrying amount of the investment property will be recovered entirely through sale. The presumption can be rebutted only if the investment property is depreciable and held within a business model whose objective is to consume substantially all of the asset’s economic benefits over the life of the asset.
Amendments to IAS 12 will be effective on January 1, 2012. The Company and its subsidiaries are still evaluating the the possible impact on the issuance of amendment to IAS 12.
b. Presentation of Items of Other Comprehensive Income (Amendments to IAS 1)
The amendments:
· require that an entity present separately the items of other comprehensive income that would be reclassified to profit or loss in the future if certain conditions are met from those that would never be reclassified to profit or loss;
· do not change the existing option to present profit or loss and other comprehensive income in two statements; and
· change the title of the statement of comprehensive income to the statement of profit or loss and other comprehensive income. However, an entity is still allowed to use other titles.
The amendments do not address which items are presented in other comprehensive income or which items need to be reclassified. The requirements of other IFRSs continue to apply in this regard.
Amendments to IAS 1 will be effective on July 1, 2012. The Company and its subsidiaries are still evaluating the the possible impact on the issuance of amendment to IAS 1.
c. IFRS 9 Financial Instruments
i. Standard issued in November 2009 (IFRS 9 (2009))
IFRS 9 (2009) is the first standard issued as part of a wider project to replace IAS 39.
IFRS 9 (2009) retains but simplifies the mixed measurement model and establishes two primary measurement categories for financial assets: amortized cost and fair value. The basis of classification depends on the entity’s business model and the contractual cash flow characteristics of the financial asset. The guidance in IAS 39 on impairment of financial assets and hedge accounting continues to apply.
Prior periods need not be restated if an entity adopts the standard for reporting periods beginning before 1 January 2012. The Company and its subsidiaries are still evaluating the possible impact on the issuance of IFRS 9.
F-104
Table of Contents |
PERUSAHAAN PERSEROAN (PERSERO) P.T. TELEKOMUNIKASI INDONESIA Tbk AND SUBSIDIARIES NOTES TO CONSOLIDATED FINANCIAL STATEMENTS(continued) JANUARY 1, 2010, DECEMBER 31, 2010 AND 2011 AND YEARS ENDED DECEMBER 31, 2010 AND 2011 (Figures in tables are presented in billions of Rupiah, unless otherwise stated) |
43. NEW STANDARDS AND INTERPRETATIONS NOT YET ADOPTED(continued)
c. IFRS 9 Financial Instruments (continued)
ii. Standard issued in October 2010 (IFRS 9 (2010))
IFRS 9 (2010) adds the requirements related to the classification and measurement of financial liabilities, and derecognition of financial assets and liabilities to the version issued inNovember 2009.
It also includes those paragraphs of IAS 39 dealing with how to measure fair value and accounting for derivatives embedded in a contract that contains a host that is not a financial asset, as well as the requirements of IFRIC 9 Reassessment of Embedded Derivatives.
IFRS 9 will be effective on January 1, 2015. The Company and its subsidiaries are still evaluating the possible impact on the issuance of IFRS 9.
d. IFRS 10 Consolidated Financial Statements
IFRS 10 introduces a new approach to determining which investees should be consolidated and provides a single model to be applied in the control analysis for all investees.
An investor controls an investee when:
· it is exposed or has rights to variable returns from its involvement with that investee;
· it has the ability to affect those returns through its power over that investee; and
· there is a link between power and returns.
Control is reassessed as facts and circumstances change.
IFRS 10 supersedes IAS 27 (2008) and SIC-12 Consolidation—Special Purpose Entities. IFRS 10 will be effective on January 1, 2013. The Company and its subsidiaries are still evaluating the possible impact on the issuance of amendment to IFRS 10.
e. IFRS 11 Joint Arrangements
IFRS 11 focuses on the rights and obligations of joint arrangements, rather than the legal form (as is currently the case). It:
· distinguishes joint arrangements between joint operations and joint ventures; and
· always requires the equity method for jointly controlled entities that are now called joint ventures; they are stripped of the free choice of using the equity method or proportionate consolidation.
IFRS 11 supersedes IAS 31 and SIC-13 Jointly Controlled Entities—Non-Monetary Contributionsby Venturers. IFRS 11 will be effective on January 1, 2013. The Company and its subsidiaries are still evaluating the possible impact on the issuance of amendment to IFRS 11.
f. IFRS 12 Disclosure of Interests in Other Entities
IFRS 12 contains the disclosure requirements for entities that have interests in subsidiaries, joint arrangements (i.e. joint operations or joint ventures), associates and/or unconsolidated structured entities, aiming to provide information to enable users to evaluate: · the nature of, and risks associated with, an entity’s interests in other entities; and · the effects of those interests on the entity’s financial position, financial performance and cash flows. IFRS 12 will be effective on January 1, 2013. The Company and its subsidiaries are still evaluating the possible impact on the issuance of IFRS 12. |
F-105
Table of Contents |
PERUSAHAAN PERSEROAN (PERSERO) P.T. TELEKOMUNIKASI INDONESIA Tbk AND SUBSIDIARIES NOTES TO CONSOLIDATED FINANCIAL STATEMENTS(continued) JANUARY 1, 2010, DECEMBER 31, 2010 AND 2011 AND YEARS ENDED DECEMBER 31, 2010 AND 2011 (Figures in tables are presented in billions of Rupiah, unless otherwise stated) |
43. NEW STANDARDS AND INTERPRETATIONS NOT YET ADOPTED(continued)
g. IFRS 13 Fair Value Measurement
IFRS 13 replaces the fair value measurement guidance contained in individual IFRSs with a single source of fair value measurement guidance. It defines fair value, establishes a framework for measuring fair value and sets out disclosure requirements for fair value measurements. It explains how to measure fair value when it is required or permitted by other IFRSs. It does not introduce new requirements to measure assets or liabilities at fair value, nor does it eliminate the practicability exceptions to fair value measurements that currently exist in certain standards.
IFRS 13 will be effective on January 1, 2013. The Company and its subsidiaries are still evaluating the possible impact on the issuance of amendment to IFRS 13.
h. IAS 19 Employee Benefits (amended 2011)
The amended IAS 19 includes the following requirements:
· actuarial gains and losses are recognized immediately in other comprehensive income; this change will remove the corridor method and eliminate the ability for entities to recognize all changes in the defined benefit obligation and in plan assets in profit or loss, which currently is allowed under IAS 19; and
· expected return on plan assets recognized in profit or loss is calculated based on the rate used to discount the defined benefit obligation.
IAS 19 will be effective on January 1, 2013. The Company and its subsidiaries are still evaluating the possible impact on the issuance of amendment to IAS 19.
i IAS 27 Consolidated Financial Statement (2011)
IAS 27 (2011) supersedes IAS 27 (2008). IAS 27 (2011) carried forward the existing accounting and disclosure requirements for separate financial statements, with some minor clarifications.
IAS 27 will be effective on January 1, 2013.
j. IAS 28 Investments in Associates and Joint Venture (2011)
IAS 28 (2011) supersedes IAS 28 (2008). IAS 28 (2011) makes the following amendments:
· IFRS 5 applies to an investment, or a portion of an investment, in an associate or a joint venture that meets the criteria to be classified as held for sale; and
· on cessation of significant influence or joint control, even if an investment in an associate becomes an investment in a joint venture or vice versa, the entity does not remeasure the retained interest.
IAS 28 will be effective on January 1, 2013. The Company and its subsidiaries are still evaluating the possible impact on the issuance of amendment to IAS 28.
k. Disclosure - Transfer of Financial Assets (Amendments to IFRS 7)
The amendments require the Company and its subsidiaries to disclose nature, risk and rewards of ownership of transferred assets to which the Company and its subsidiaries are exposed, and the description and nature of the relationship between the transferred assets and associated liabilities. The amendments also require the Company and its subsidiaries to disclose at each reporting date, each class of transferred financial assets that are not recognized in their entirety. The disclosure is provided to enable users of the financial statements to understand the relationship between transferred financial assets that are not derecognized in their entirety and the associated liabilities and to evaluate the nature and risk associated with the Company and its subsidiaries continuing involvement in derecognized financial assets. Amendments to IFRS 7 will be effective for annual periods beginning on or after July 1, 2011. The Company and its subsidiaries are still evaluating the possible impact on the issuance of amendment to IFRS 7. |
F-106
Table of Contents |
PERUSAHAAN PERSEROAN (PERSERO) P.T. TELEKOMUNIKASI INDONESIA Tbk AND SUBSIDIARIES NOTES TO CONSOLIDATED FINANCIAL STATEMENTS(continued) JANUARY 1, 2010, DECEMBER 31, 2010 AND 2011 AND YEARS ENDED DECEMBER 31, 2010 AND 2011 (Figures in tables are presented in billions of Rupiah, unless otherwise stated) |
43. NEW STANDARDS AND INTERPRETATIONS NOT YET ADOPTED(continued)
l. Severe Hyperinflation and Removal of Fized Dates for First-time Adopters (Amendment to IFRS 1)
The amendments require the Company and its subsidiaries to determine whether their functional currencies are subject to severe hyperinflation before the date of transition to IFRSs. The functional currencies are subject to severe hyperinflation if no reliable general price index available and no exchangeability between the currency and a relatively stable foreign currency exits.
Amandments to IFRS 1 will be effective for annual periods beginning on or after July 1, 2011. The Company and its subsidiaries are still evaluating the possible impact on the issuance of amendment to IFRS 1.
44. EXPLANATION OF TRANSITION TO IFRS
As stated in Note 2, these are the Company’s first consolidated financial statements prepared in accordance with IFRS as issued by IASB.
The accounting policies set out in Note 2 have been applied in preparing the consolidated financial statements as of and forthe year ended December 31, 2011, the comparative information presented in these consolidated financial statements for the year ended December 31, 2010 and in the preparation of an opening IFRS consolidated statement of financial position at January 1, 2010 (the Company’s date of transition).
In preparing its opening IFRS consolidated statement of financial position, the Company has adjusted amounts reported previously in the consolidated financial statements prepared in accordance with Indonesian Financial Accounting Standards (“IFAS”). An explanation of how the transition from IFAS to IFRSs has affected the consolidated equity, financial performance, and cash flows is set out in the following tables and the notes that accompany the tables.
F-107
Table of Contents |
PERUSAHAAN PERSEROAN (PERSERO) P.T. TELEKOMUNIKASI INDONESIA Tbk AND SUBSIDIARIES NOTES TO CONSOLIDATED FINANCIAL STATEMENTS(continued) JANUARY 1, 2010, DECEMBER 31, 2010 AND 2011 AND YEARS ENDED DECEMBER 31, 2010 AND 2011 (Figures in tables are presented in billions of Rupiah, unless otherwise stated) |
44. EXPLANATION OF TRANSITION TO IFRS(continued)
a. IFRSexemption options
1. Exemption for cumulative translation adjustment
The Company and its subsidiaries have elected an exemption provided by IFRS 1 to deem the cumulative translation differences for all foreign operation to be zero at the date of transition to IFRS. Accordingly, the cumulative translation differences that existed at January 1, 2010 in the IFAS consolidated financial statements were reclassify to retained earnings.
The impact arising from the change is summarized as follows:
| | Increase (Decrease) | |
| | January 1, 2010 | | December 31, 2010 | |
Consolidated statement of financial position | | | | | |
Other reserves | | (231 | ) | (231 | ) |
Retained earnings | | 231 | | 231 | |
Adjustment to equity | | - | | - | |
2. Exemption for Employee Benefits
The Company and its subsidiaries have elected an exemption provided by IFRS 1 to recognize all cumulative actuarial gains and losses to retained earnings as of January 1, 2010 (resetting actuarial gains and losses to zero at the date of transition to IFRS).Further, an approach to directly recognize actuarial gains and losses to other comprehensive income has been elected for subsequent recognition. Accordingly, any adjustments to pension asset arising from the calculation of asset ceiling limitations are also recognized to other comprehensive income.
The impact arising from the change is summarized as follows:
| | Increase (Decrease) | |
| | January 1, 2010 | | December 31, 2010 | |
Consolidated statement of comprehensive income | | | | | |
Expenses: | | | | | |
Personnel | | | | (115 | ) |
Other comprehensive income: | | | | | |
Defined benefit plan actuarial losses | | | | (668 | ) |
Adjustments before income tax | | | | (783 | ) |
| | Increase (Decrease) | |
| | January 1, 2010 | | December 31, 2010 | |
Consolidated statement of financial position | | | | | |
Prepaid pension benefit costs | | 890 | | 675 | |
Post-employment benefits obligation | | 93 | | (475 | ) |
Related tax effect | | (81 | ) | 28 | |
Adjustments to equity | | 902 | | 228 | |
F-108
Table of Contents |
PERUSAHAAN PERSEROAN (PERSERO) P.T. TELEKOMUNIKASI INDONESIA Tbk AND SUBSIDIARIES NOTES TO CONSOLIDATED FINANCIAL STATEMENTS(continued) JANUARY 1, 2010, DECEMBER 31, 2010 AND 2011 AND YEARS ENDED DECEMBER 31, 2010 AND 2011 (Figures in tables are presented in billions of Rupiah, unless otherwise stated) |
44. EXPLANATION OF TRANSITION TO IFRS(continued)
a. IFRSexemption options(continued)
3. Exemption for Business Combination
IFRS 1 provides the option to apply IFRS 3, ‘Business Combination’, prospectively from the transaction date or from a specisific date prior to transition date. This provides relief from full retrospective application that would required restatement of all business combination prior to transition date. The Company and its subsidiaries elected to apply IFRS 3 prospectively to business combination occuring after its transition date. Business combination occuring prior to transition date have not been restated.
b. Reconciliation of IFAS to IFRS
IFRS 1 require an entity to reconcile equity, comprehensive income and cash flows for prior periods. The Company’s first-time adoption did not have an impact on the total operating, investing or financing cash flows. The following tables represent the reconciliations from IFAS to IFRS for respective periods noted for consolidated equity, earnings and comprehensive income.
Reconciliation of consolidated equity
Description | | Notes | | January 1, 2010 | | December 31, 2010 | |
Equity previously reported in the consolidated financial statements prepared in accordance with IFAS | | | | 38,561 | | 44,419 | |
IFRS adjustments - increases (decreases): | | | | | | | |
Service concession arrangements | | b1 | | 19 | | (2 | ) |
Employee benefits - actuarial gains and losses | | a2 | | 983 | | 200 | |
Cumulative translation adjustment | | a1 | | - | | - | |
Land right amortization expense | | b2 | | (88 | ) | (104 | ) |
Consolidated financial statements - presentation of non-controlling interest | | | | 10,933 | | 11,996 | |
Total IFRS adjustments for equity | | | | 11,847 | | 12,090 | |
Deferred tax effect on IFRS adjustments | | | | (86 | ) | 29 | |
Total IFRS adjustments for equity, net of deferred tax | | | | 11,761 | | 12,119 | |
Equity prepared in accordance with IFRS | | | | 50,322 | | 56,538 | |
| | | | | | | |
Description | | Notes | | December 31, 2010 | |
Net profit for the year prepared in accordance with IFAS attributable to: | | | | | |
Owners of the Company | | | | 11,537 | |
Non-controlling interest | | | | 4,333 | |
Net profit for the year previously reported in the consolidated financial statements prepared in accordance with IFAS | | | | 15,870 | |
F-109
Table of Contents |
PERUSAHAAN PERSEROAN (PERSERO) P.T. TELEKOMUNIKASI INDONESIA Tbk AND SUBSIDIARIES NOTES TO CONSOLIDATED FINANCIAL STATEMENTS(continued) JANUARY 1, 2010, DECEMBER 31, 2010 AND 2011 AND YEARS ENDED DECEMBER 31, 2010 AND 2011 (Figures in tables are presented in billions of Rupiah, unless otherwise stated) |
44. EXPLANATION OF TRANSITION TO IFRS(continued)
Reconciliation of consolidated statement of comprehensive income
Description | | Notes | | December 31, 2010 | |
IFRS adjustments - increases (decreases): | | | | | |
Service concession arrangements | | b1 | | (21 | ) |
Employee benefits - actuarial gains and losses | | a2 | | (115 | ) |
Cumulative translation adjustment | | a1 | | - | |
Land right amortization expense | | b2 | | (16 | ) |
Total IFRS adjustments for net profit | | | | (152 | ) |
Deferred tax effect on IFRS adjustments | | | | 34 | |
Total IFRS adjustments for net profit, net of deferred tax | | | | (118 | ) |
Net profit for the year prepared in accordance with IFRS | | | | 15,752 | |
Other comprehensive income previously reported in the consolidated financial statements prepared in accordance with IFAS | | | | - | |
IFRS adjustments - increases (decreases): | | | | | |
Cumulative translation adjustment*) | | | | 2 | |
Net change in fair value of available-for-sale financial assets*) | | | | 32 | |
Employee benefits - actuarial gains and losses | | | | (668 | ) |
Total IFRS adjustments for other comprehensive income | | | | (634 | ) |
Deferred tax effect on IFRS adjustments | | | | 81 | |
Total IFRS adjustments for other comprehensive income, net of deferred tax | | | | (553 | ) |
Other comprehensive income for the year prepared in accordance with IFRS | | | | (553 | ) |
Total comprehensive income for the year prepared in accordance with IFRS | | | | 15,199 | |
Net profit for the year attributable to: | | | | | |
Owners of the Company | | | | 11,427 | |
Non-controlling interest | | | | 4,325 | |
Net profit for the year prepared in accordance with IFRS | | | | 15,752 | |
Total comprehensive income for the year attributable to: | | | | | |
Owners of the Company | | | | 10,911 | |
Non-controlling interest | | | | 4,288 | |
Total comprehensive income for the year prepared in accordance with IFRS | | | | 15,199 | |
*) Represents amounts presented directly in equity under IFAS consolidated financial statements as there is no requirement up to December 31, 2010 to present these amounts in other comprehensive income (Note 43.b).
The transition from Indonesia GAAP to IFRS has not had a material impact on the consolidated statements of cash flows.
F-110
Table of Contents |
PERUSAHAAN PERSEROAN (PERSERO) P.T. TELEKOMUNIKASI INDONESIA Tbk AND SUBSIDIARIES NOTES TO CONSOLIDATED FINANCIAL STATEMENTS(continued) JANUARY 1, 2010, DECEMBER 31, 2010 AND 2011 AND YEARS ENDED DECEMBER 31, 2010 AND 2011 (Figures in tables are presented in billions of Rupiah, unless otherwise stated) |
44. EXPLANATION OF TRANSITION TO IFRS(continued)
Notes toreconciliation of IFAS toIFRS
1. Service concession arrangements
As stated in Note 26,the Company andTelkomsel entered into a service concession arrangement withtheIndonesian Government to participate as an operator/service provider for developing, financing, operating and maintaining telecommunication infrastructure that will be used to provide public telecommunication services in certain remote areas.
Prior January 1, 2012, IFASwas silent on how to account for the above arrangement. In these periods, the Company and Telkomsel accounted for this arrangement as an executory contract in its IFAS financial statements. Further, the developed infrastructures assets under this arrangement were accounted for as property, plant and equipment and were depreciated over their estimated useful lives.
Under IFRS, the above arrangement is accounted for as a service concession arrangement within the scope of IFRIC 12,Service Concession Arrangements. Under this interpretation, theCompany and Telkomsel recognized and measured its revenues from the services it perform under the arrangement in accordance with IAS 11,Construction Contracts (for revenues and costs relating to construction and upgrade services) and IAS 18,Revenues (for revenues and costs relating to operation services).
Further, the developed infrastructure assets under this arrangement are not recognized as property, plant and equipment of the operator because the contractual arrangement does not convey the right to control the use of the public service infrastructureassetsto the operator.
The impact arising from the change is summarized as follows:
| | Increase (Decrease) | |
| | January 1, 2010 | | December 31, 2010 | |
Consolidated statement of comprehensive income | | | | | |
Revenues: | | | | | |
Other telecommunication services | | | | (100 | ) |
Expenses: | | | | | |
Depreciation and amortization | | | | 48 | |
Finance income | | | | 32 | |
Adjustments before income tax | | | | (20 | ) |
Consolidated statement of financial position | | | | | |
Trade receivables - related parties | | 169 | | 101 | |
Goodwill and other intangible assets | | 2 | | 2 | |
Property, plant and equipment | | (153 | ) | (104 | ) |
Related tax effect | | (5 | ) | 0 | |
Adjustments to equity | | 13 | | (1 | ) |
F-111
Table of Contents |
PERUSAHAAN PERSEROAN (PERSERO) P.T. TELEKOMUNIKASI INDONESIA Tbk AND SUBSIDIARIES NOTES TO CONSOLIDATED FINANCIAL STATEMENTS(continued) JANUARY 1, 2010, DECEMBER 31, 2010 AND 2011 AND YEARS ENDED DECEMBER 31, 2010 AND 2011 (Figures in tables are presented in billions of Rupiah, unless otherwise stated) |
44. EXPLANATION OF TRANSITION TO IFRS(continued)
Notes toreconciliation of IFAS toIFRS (continued)
2. Land Rights
Under IFAS, land rights are recorded as part of property, plant, and equipments and are notamortized, unless management will not be able to extend or renew the land rights. Costs incurred to process and extend land rights are deferred and amortized using the straight-line method over the term of land rights.
Under IFRS, land rights are accounted for as a finance lease and presented as part of property, plant, and equipment. Land rights are amortized over the lease term. The Company and its subsidiaries recognized land rights amortization expenses of Rp.16 billion and Rp.18 billion as of December 31, 2010 and December 31, 2011, respectively.
The impact arising from the change is summarized as follows:
| | Increase (Decrease) | |
| | January 1, 2010 | | December 31, 2010 | |
Consolidated statement of comprehensive income | | | | | |
Expense: | | | | | |
Depreciation and amortization | | - | | (16 | ) |
Adjustments before income tax | | | | (16 | ) |
Consolidated statement of financial position | | | | | |
Property, plant and equipment | | (88 | ) | (104 | ) |
Adjustments to equity | | (88 | ) | (104 | ) |
F-112