UNITED STATES SECURITIES AND EXCHANGE COMMISSION
WASHINGTON, D.C. 20549
________________
Form 20-F
| |
* | REGISTRATION STATEMENT PURSUANT TO SECTION 12(b) OR (g) OF THE SECURITIES EXCHANGE ACT OF 1934 |
| OR |
R | ANNUAL REPORT PURSUANT TO SECTION 13 OR 15(d) OF THE SECURITIES EXCHANGE ACT OF 1934 For the fiscal year ended December 31, 2012 |
| |
* | TRANSITION REPORT PURSUANT TO SECTION 13 OR 15(d) OF THE SECURITIES EXCHANGE ACT OF 1934 |
| OR |
* | SHELL COMPANY REPORT PURSUANT TO SECTION 13 OR 15(d) OF THE SECURITIES EXCHANGE ACT OF 1934 |
Date of event requiring this shell company report
Commission file number 1-14406
________________
Perusahaan Perseroan (Persero)
PT Telekomunikasi Indonesia Tbk.
(Exact name of Registrant as specified in its charter)
Telecommunications Indonesia
(a state-owned public limited liability company)
(Translation of Registrant’s name into English)
________________
Republic of Indonesia
(Jurisdiction of incorporation or organization)
Jl. Japati No.1,Bandung 40133,Indonesia
(Address of principal executive offices)
Investor Relations Unit
Grha Citra Caraka, Jl. Gatot Subroto No. 52, 5th Floor, Jakarta 12710, Indonesia
(62) (22) 452-7101
(62) (21) 521-5109
(Name, Telephone, E-mail and/or Facsimile number and Address of Company Contact Person)
________________
Securities registered or to be registered pursuant to Section 12(b) of the Act.
|
Title of Each class | | Name of each exchange on which registered |
American Depositary Shares representing Series B Shares, par value 250 Rupiah per share | | New York Stock Exchange |
Series B Shares, par value 250 Rupiah per share | | New York Stock Exchange* |
|
Securities registered or to be registered pursuant to Section 12(g) of the Act. None |
Securities for which there is a reporting obligation pursuant to Section 15(d) of the Act. None |
Indicate the number of outstanding shares of each of the issuer’s classes of capital or common stock as of the close of the period covered by the Annual Report: |
Series A Dwiwarna Share, par value 250 Rupiah per share | 1 |
Series B Shares, par value 250 Rupiah per share | 19,149,068,819 |
|
Indicate by check mark if the registrant is a well-known seasoned issuer, as defined in Rule 405 of the Securities Act. YesR No¨ |
If this report is an annual or transition report, indicate by check mark if the registrant is not required to file reports pursuant to Section 13 or 15(d) of the Securities Exchange Act of 1934. Yes¨ NoR |
Indicate by check mark whether the registrant (1) has filed all reports required to be filed by Section 13 or 15(d) of the Securities Exchange Act of 1934 during the preceding 12 months (or for such shorter period that the Registrant was required to file such reports) and (2) has been subject to such filing requirements for the past 90 days. YesR No¨ |
Indicate by check mark whether the registrant has submitted electronically and posted on its corporate Web site, if any, every Interactive Data File required to be submitted and posted pursuant to Rule 405 of Regulation S-T during the preceding 12 months (or for such shorter period that the registrant was required to submit and post such files). Yes¨ NoR |
Indicate by check mark whether the registrant is a large accelerated filer, an accelerated filer, or a non-accelerated filer. See definition of “accelerated filer and large accelerated filer” in Rule 12b-2 of the Exchange Act. (Check one): |
Large accelerated filerR | Accelerated filer¨ | Non-accelerated filer¨ |
Indicate by checkmark which basis of accounting the registrant has used to prepare the financial statements included in this filing: U.S. GAAP¨ International Financial Reporting Standards as issued by the International Accounting Standards BoardROther¨ If “Other” has been checked in response to the previous question, indicate by checkmark which financial statement item the registrant has elected to follow. Item 17¨ Item 18¨ |
If this is an Annual Report, indicate by check mark whether the registrant is a shell company (as defined in Rule 12b-2 of the Exchange Act). Yes¨ NoR |
| |
| |
* | The Series B Shares were registered in connection with the registration of American Depositary Shares (“ADSs”). The Series B Shares are not listed for trading on the New York Stock Exchange. |
|
| | | | | | | |
DEFINITIONS
3G
The generic term for third generation mobile telecommunications technology. 3G offers high speed connections to cellular phones and other mobile devices, enabling video conference and other applications requiring broadband connectivity to the internet.
3.5G
A grouping of disparate mobile telephony and data technologies designed to provide better performance than 3G systems, as an interim step towards deployment of full 4G capability.
Adjusted EBITDA
Adjusted EBITDA is defined as earnings before interest, tax, depreciation and amortization. Adjusted EBITDA and other related ratios in this Annual Report serve as additional indicators on our performance and liquidity, which is a non GAAP financial measure.
ADS
American Depositary Share (also known as an American Depositary Receipt, or an “ADR”), a certificate traded on a US securities market (such as New York Stock Exchange) representing a number of foreign shares. Each of our ADS represents 40 of our Series B shares.
ADSL
Asymmetric Digital Subscriber Line, a type of digital subscriber line technology, a data communications technology that enables faster data transmission over copper telephone lines than a conventional voice band modem can provide.
APMK
Alat Pembayaran Menggunakan Kartu or card-based payment instruments, a payment instrument in the form of credit cards, Automated Teller Machine (“ATM”) and/or debit cards.
ARPU
Average Revenue per User, a measure used primarily by telecommunications and networking companies which states how much money we make from the average user. It is defined as the total revenue from specified services divided by the number of consumers for those services.
Backbone
The main telecommunications network consisting of transmission and switching facilities connecting several network access nodes. The transmission links between nodes and switching facilities include microwave, submarine cable, satellite, optical fiber and other transmission technology.
Bandwidth
The capacity of a communication link.
Bapepam-LK
Badan Pengawas Pasar Modal dan Lembaga Keuangan, or the Indonesian Capital Market and Financial Institution Surpervisory Agency, the predecessor to the OJK.
Broadband
A signaling method that includes or handles a relatively wide range (or band) of frequencies.
BSC
Base Station Controller, an equipment responsible for radio resource allocation to mobile station, frequency administration and handover between BTSs controlled by the BSC.
BSS
Base Station Subsystem, the section of a cellular telephone network responsible for handling traffic and signaling between a mobile phone and the network switching subsystem. A BSS is composed of two parts: the BTS and the BSC.
BTS
Base Transceiver Station, equipment that transmits and receives radio telephony signals to and from other telecommunication systems.
BWA
Broadband Wireless Access, a technology that provides high speed wireless internet access or computer networking access over a wide area.
- 1 -
TABLE OF CONTENTS
CDMA
Code Division Multiple Access, atransmission technology where each transmission is sent over multiple frequencies and a unique code is assigned to each data or voice transmission, allowing multiple users to share the same frequency spectrum.
CPE
Customer Premises Equipment, any handset, receiver, set-top box or other equipment used by the consumer of wireless, fixedline or broadband services, which is the property of the network operator and located on the customer premises.
DCS
Digital Communication System, a mobile cellular system using GSM technology operating in the 1800 MHz frequency band.
Defined Benefit Pension Plan
A type of pension plan in which an employer promises a specified monthly benefit on retirement that is predetermined by a formula based on the employee’s earnings history, tenure of service and age, rather than depending on investment returns. It is considered ‘defined’ in the sense that the formula for computing the employer’s contribution is known in advance.
Defined Contribution Pension Plan
A type of retirement plan in which the amount of the employer’s annual contribution is specified. Individual accounts are set up for participants and benefits are based on the amounts credited to these accounts (through employer contributions and, if applicable, employee contributions) plus any investment earnings on the money in the account. Only employer contributions to the account are guaranteed, not the future benefits. In defined contribution plans, future benefits fluctuate on the basis of investment earnings.
Dial-Up
Access to the internet using fixed telephone lines or mobile phone.
DLD
Domestic Long Distance, a long distance call service designed for customers who live in different areas but still within one country. These areas normally have different area codes.
Downlink
Radio signal frequency emitted by the satellite to earth station.
DSL
Digital Subscriber Line, a technology that allows combinations of services including voice, data and one way full motion video to be delivered over existing copper feeder distribution and subscriber lines.
DTH
Direct-to-Home satellite broadcasting, the distribution of television signals from high-powered geostationary satellites to small dish antennas and satellite receivers in homes across the country.
Dual Band
The capability of a mobile cellular network and mobile cellular handsets to operate across two frequency bands, for example GSM 900 and GSM 1800.
e-Business
Electronic Business solutions, including electronic payment services, internet data centers and content and application solutions.Refer to “New Economy Business (“NEB”) and Strategic Business Opportunities Portfolio” under Business Overview.
e-Commerce
Electronic Commerce, the buying and selling of products or services over electronic systems such as the internet and other computer networks.
e-Money
Electronic Money, money or script that is only exchanged electronically.
e-Payment
Also known as electronic funds transfer, the electronic exchange or transfer of money from one account to another, either within a single financial institution or across multiple institutions, through computer-based systems.
E1 Link
The backbone transmission unit which operates over two separate sets of wires, usually twisted pair cable. E1 link data rate is 2,048 Mbps (full duplex), which is divided into 32 timeslots.
Earth Station
The antenna and associated equipment used to receive or transmit telecommunication signals via satellite.
EBS
Enterprise Business Solution, an enterprise customer consultation for customized corporate TIMES solutions, and simulation demos (for e-Payment and VPN over Fixed Network, GSM and Flexi).
EDC
Electronic Data Capture, acomputerized system designed for the collection of clinical data in electronic format for use mainly in human clinical trials.
EDGE
Enhanced Data rates for GSM Evolution, a digital mobile phone technology that allows improved data transmission rates as a backward-compatible extension of GSM.
Edutainment
Education and Entertainment.
EVDO
Evolution Data Optimize, a standard high speed 3G wireless broadband for CDMA.
Fixed Line
Fixed wireline and fixed wireless.
Fixed Wireless
The local wireless transmission link using a cellular, microwave, or radio technology to connect customers at a fixed location to the local telephone exchange.
Fixed Wireline
A fixed wire or cable path linking a subscriber at a fixed location to a local exchange, usually with an individual phone number.
FTTx
Fiber to the “x”, a generic term for any broadband network architecture that uses optical fiber to replace all or part of the usual metal local loop used for last mile telecommunication. The generic term originated as a generalization of several configurations of fiber deployment such as fiber to the home, fiber to the node or fiber to the building.
Gateway
A peripheral that bridges a packet based network (IP) and a circuit based network (PSTN).
Gb
Gigabyte, a unit of information used, for example, to quantify computer memory or storage capacity.
Gbps
Gigabyte per second, the average number of bits, characters, or blocks per unit time passing between equipment in a data transmission system. This is typically measured in multiples of the unit bit per second or byte per second.
GHz
Gigahertz. The hertz (symbol Hz), the international standard unit of frequency defined as the number of cycles per second of a periodic phenomenon.
GMS
General Meeting of Shareholders, which may be an Annual General Meeting of Shareholders (“AGMS”) or an Extraordinary General Meeting of Shareholders (“EGMS”).
GPON
Gigabyte-Passive Optical Network, the most widely deployed type of passive optical network system that bring optical fiber cabling and signals all or most of the way to end users.
GPRS
General Packet Radio Service, a data packet switching technology that allows information to be sent and received across a mobile network and only utilizes the network when there is data to be sent.
GSM
Global System for Mobile Telecommunication, a European standard for digital cellular telephone.
Homepass
A connection with access to fixed line voice, IPTV and broadband services.
HSPA+
Evolved High Speed Packet Access is defined in the Third Generation Partnership Project Release 7. It introduces a simpler IP-centric architecture for the mobile network bypassing most of the legacy equipment. HSPA+ boosts peak data rates to 42 Mbit/s on the downlink and 22 Mbit/s on the uplink.
IDD
International Direct Dialing, a service that allows a subscriber to make an international call without the assistance or intervention of an operator from any telephone terminal.
IME
Information, Media and Edutainment.
IMT-2000
International Mobile Telecommunications-2000, a body of specifications provided by the International Telecommunication Union. Application services include wide area wireless voice telephone, mobile internet access, video calls and mobile TV, all in a mobile environment.
Installed Lines
Complete lines fully built-out to the distribution point and ready to be connected to subscribers.
Intelligent Network
A service-independent telecommunications network where the logic functions are taken out of the switch and placed in computer nodes distributed throughout the network. This provides the means to develop and control services more efficiently allowing new or advanced telephony services to be introduced quickly.
Interconnection
The physical linking of a carrier’s network with equipment or facilities not belonging to that network.
IP
Internet Protocol, the method or protocol by which data is sent from one computer to another on the internet.
IP Core
A block of logic data that is used in making a field programmable gate arrayor application-specific integrated circuitfor a product.
IP DSLAM
Internet Protocol-Digital Subscriber Line Access Multiplexer, a network device located near the customer’s location that allows telephone lines to make faster connections to the internet by connecting multiple customer Digital Subscriber Lines (DSLs) to a high-speed internet backbone line using multiplexing techniques.
IP VPN
A data communication service using IP Multi Protocol Label Switching (“MPLS”) and based on any to any connection. This service is connected to the data security systems, L2TP and IPSec. The speed depends on the customer’s needs and ranges from 64 Kbps to 2 Mbps.
IPTV
Internet Protocol Television, a system through which television services are delivered using the Internet Protocol suite over a packet-switched network such as the internet, instead of being delivered through traditional terrestrial, satellite signal, and cable television formats.
ISDN
Integrated Services Digital Network, a network that provides end-to-end digital connectivity and allows simultaneous transmission of voice, data and video and provides high speed internet connectivity.
- 4 -
ISP
Internet Services Provider, an organization that provides access to the internet.
Joint Operating Scheme
Joint Operating Scheme or Kerja Sama Operasi(“KSO”), a unique type of build, operate and transfer arrangement formerly used by us in which a consortium of partners invests and operates our facilities in regional divisions. The consortium partners were owned by international operators and private domestic companies or in cases where we have acquired the consortium partner, by ourselves.
Kbps
Kilobyte per second, a measure of speed for digital signal transmission expressed in thousands of bits per second.
Lambda
Lambda indicates the wavelength of any wave, especially in physics, electronics engineering and mathematics.
LAN
Local AreaNetwork, a network of interconnected workstations that enables network resources sharing and typically covers a limited area (for example, within a building).
Leased Line
A dedicated telecommunications transmissions line linking one fixed point to another, rented from an operator for exclusive uses.
Local Call
The call among subscribers in the same numbering area without requiring any prefix number.
Local Exchange Capacity
The aggregate number of lines at a local exchange connected and available for connection to outside plant.
LTE
Long Term Evolution technology, a standard for high-speed wireless data communication for mobile phones and data terminals.
Mbps
Megabyte per second, a measure of speed for digital signal transmission expressed in millions of bits per second.
Metro Ethernet
Bridge or relationship between locations that are apart geographically, this network connects LAN customers at several different locations.
MHz
Megahertz, a unit of measure of frequency equal to one million cycles per second.
Mobile Broadband
The marketing term for wireless internet access through a portable modem, mobile phone, USB Wireless Modem or other mobile devices.
MoCI
The Ministry of Communication and Information, to which regulatory responsibility over telecommunications was transferred from the Ministry of Communication (“MoC”) in February 2005.
MSAN
Multi Service Access Networks, represent the third generation of optical access network technology and are single platforms capable of supporting traditional, widely deployed, access technologies and services as well as emerging ones, while simultaneously providing a gateway to a NGN core. MSAN will enable us to provide triple play services that distribute high speed internet access, voice packet services and IPTV services simultaneously through the same infrastructure.
Network Access Point
A public network exchange facility where ISPs connected with one another in peering arrangements.
- 5 -
NGN
Next Generation Network, a general term that refers to a packet-based network able to provide services, including telecommunication services, and able to make use of multiple broadband, quality of service enabled transporttechnologies and in which service-related functions are independent from underlying transport related technologies. A NGN is intended to be able to, with one network, transport various services (voice, data, and various media such as video) by encapsulating these into packets, similar to how such packet are transmitted on the internet. NGNs are commonly built around the Internet Protocol.
Node b
A BTS for a 3G W-CDMA/UMTS network.
OBCE
Operational, Business and Customer support system and Enterprise relations management, which is part of our strategic initiatives.
Off-net
Communication between two customers in the different operators.
OJK
Otoritas Jasa Keuangan, or the Indonesian Financial Services Authority, the successor of Bapepam-LK, is an independent institution with authority to regulate and supervise financial services activities in the banking sector, capital market sector as well as non-bank financial industry sector.
OLO
Other Licensed Operators, i.e. operators other than our Company.
On-net
Communication between two customers in the same operators.
Optical Fiber
Cables using optical fiber and laser technology through which modulating light beams representing data are transmitted through thin filaments of glass.
Outside Plant
The equipment and facilities used to connect subscriber premises to the local exchange.
Pay TV
Pay Television, premium television, or premium channels, subscription-based television services, usually provided by both analog and digital cable and satellite, but also increasingly via digital terrestrial and internet television.
PDN
Packet Data Network, a digital communications network which breaks a group data to be transmitted into segments called packets, which are then routed independently.
PKLN
Tim Pinjaman Komersial Luar Negeri,or Foreign Commercial Loan Coordinating Team, an inter-agency team of the Government charged with, among others, considering requests of Indonesian State-Owned Enterprises such as us for consent to obtain foreign commercial loans.
POWL
Public Offering Without Listing.
Premium SMS
PremiumShort Message Service, a text messaging service component of phone, web, or mobile communication systems, using standardized communications protocols that allow the exchange of short text messages between fixed line or mobile phone devices.
PSTN
Public Switched Telephone Network, a telephone network operated and maintained by us and the KSO Units for us and on our behalf.
Pulse
The unit in the calculation of telephone charge.
Radio Frequency Spectrum
The part of the electromagnetic spectrum corresponding to radio frequencies i.e. frequencies lower than around 300 GHz (or, equivalently, wavelengths longer than about 1 mm).
RIO
Reference Interconnection Offer, a regulatory term covering all facilities, including interconnection tariffs, technical facilities and administrative issues offered by one telecommunications operator to other telecommunications operator for interconnection access.
RMJ
Regional Metro Junction, an inter-city cable network installation service in one regional (region/province).
Roaming
A general term referring to the extension of connectivity service in a location that is different from the home location where the service was registered.
RUIM card
Removable User Identity Module, a smart card designed to be inserted into a fixed wireless telephone that uniquely identifies a CDMA network subscription and that contains subscriber-related data such as phone numbers, service details and memory for storing messages.
Satellite Transponder
Radio relay equipment embedded in a satellite that receives signals from earth and amplifies and transmits the signal back to the earth.
SCCS
Submarine Communications Cable System, a cable laid on the sea bed between land-based stations to carry telecommunication signals across stretches of ocean.
SDP
Service Delivery Platform, a set of components that provide a service delivery architecture (such as service creation, session control and protocols) for a type of service.
SIM card
Subscriber Identity Module, a “smart” card designed to be inserted into cellular phone that uniquely identifies a GSM network subscription and contains subscriber-related data such as phone numbers, service details and memory for storing messages.
SME
Small and medium enterprise.
SMS
Short Messaging Service, a technology allowing the exchange of text messages between mobile phones and between fixed wireless phones.
SOE
State-Owned Enterprise, a Government-owned corporation, state-owned company, state-owned entity, state enterprise, publicly owned corporation, Government business enterprise, or parastatal, a legal entity created by a Government to undertake commercial activities on behalf of an owner Government.
Soft Switch
A central device in a telephone network that connects calls from one phone line to another, entirely by means of software running on a computer system. This work was formerly carried out by hardware, with physical switchboards to route the calls.
STM-1
Synchronous Transport Module level-1, the SDH ITU-T fiber optic network transmission standard with a bit rate of 155.52 Mbps. The other standards are STM-4, STM-16 and STM-64.
Switch
A mechanical, electrical or electronic device that opens or closes circuits, completes or breaks an electrical path, or selects paths or circuits, used to route traffic in a telecommunications network.
- 7 -
Terra Router
Terra Router or terabit router on the theory allows the network capacity on a scale of terabits (1 terabit = 1 million gigabits).
TIMES
Telecommunication, Information, Media, Edutainment and Service.
TITO
Trade-In, Trade-Off,a conversion scheme to replace copper with optical cable. Refer to “Development and Modernization of Broadband Access through the TITO Scheme” under Network Development.
Trunk Exchange
A switch that has the function of connecting one telephony switch to another telephony switch, which can either be a local or a trunk switch.
UMTS
Universal Mobile Telephone System, one of the (3G) mobile systems being developed within the ITU’s IMT-2000 framework.
USO
Universal Service Obligation, the service obligation imposed by the Government on all telecommunications services providers for the purpose of providing public services in Indonesia.
VoIP
Voice over Internet Protocol, a means of sending voice information using the IP.
VPN
Virtual Private Network, a secure private network connection, built on top of publicly-accessible infrastructure, such as the internet or the public telephone network. VPNs typically employ some combination of encryption, digital certificates, strong user authentication and access control to secure the traffic they carry. These provide connectivity to many machines behind a gateway or firewall.
VSAT
Very Small Aperture Terminal, a relatively small antenna, typically 1.5 to 3.0 meters in diameter, placed in the user’s premises and used for two-way communications by satellite.
Wi-MAX
Worldwide Interoperability for Microwave Access, a telecommunications technology that provides wireless transmission of data using a variety of transmission modes, from point-to-point links to portable internet access.
Wireless Access Network
Any type of computer network that is not connected by cables of any kind. It is a method by which homes, telecommunications networks and enterprise (business) installations avoid the costly process of introducing cables into a building, or as a connection between various equipment locations.
Wireless Broadband
Technology that provides high speed wireless internet access or computer networking access over a wide area.
- 8 -
CERTAIN DEFINITIONS, CONVENTIONS AND GENERAL INFORMATION
Unless the context otherwise requires, references in this Form 20-F to the “Company”, “Telkom”, “we”, “us”, and “our” are to PT Telekomunikasi Indonesia Tbk. and its consolidated subsidiaries. All references to “Indonesia” are references to the Republic of Indonesia. All references to the “Government” herein are references to the Government of the Republic of Indonesia. References to “United States” or “US” are to the United States of America. References to “United Kingdom” or “UK” are to the United Kingdom of Great Britain and Northern Ireland. References to “Indonesian Rupiah” or “Rp” are to the lawful currency of Indonesia. References to “US Dollar” or “US$” are to the lawful currency of the United States. Certain figures (including percentages) have been rounded for convenience, and therefore indicated and actual sums, quotients, percentages and ratios may differ.
Our consolidated financial statements as of December 31, 2011 and 2012 and for the years ended December 31, 2010, 2011 and 2012 included in this Form 20-F (the “Consolidated Financial Statements”) have been prepared in accordance with International Financial Reporting Standards (“IFRS”) as issued by the International Accounting Standards Board (“IASB”).
On December 31, 2012, the financial statements of nine of our subsidiaries were consolidated into the Consolidated Financial Statements for 2012. The nine companies are PT Telekomunikasi Indonesia International (“Telin”, a wholly-owned subsidiary), PT Dayamitra Telekomunikasi (“Mitratel”, a wholly-owned subsidiary), PT Pramindo Ikat Nusantara (“PINs”, a wholly-owned subsidiary), PT Telekomunikasi Selular (“Telkomsel”, in which we own a 65.0% stake), PT Multimedia Nusantara (“TelkomMetra”, a wholly-owned subsidiary), PT Indonusa Telemedia (“TelkomVision”, wholly-owned through a direct interest and a 0.46% stake owned by TelkomMetra), PT Graha Sarana Duta (“TelkomProperty”, in which we own a 99.99% stake), PT Napsindo Primatel Internasional (“Napsindo”, in which we own a 60% stake) and PT Telkom Akses (“Telkom Akses”, a wholly-owned subsidiary). See Note 1d to our Consolidated Financial Statements.
Solely for the convenience of the reader, certain Indonesian Rupiah amounts have been translated into US Dollars at specified rates. Unless otherwise indicated, US Dollars equivalent information for amounts in Indonesian Rupiah is translated at the Reuters Rate for December 31, 2012 at 04.00PM Jakarta time, which was Rp9,637.5 to US$1.00. The exchange rate of Indonesian Rupiah for US Dollars on March 25, 2013 was Rp9,728 to US$1.00 based on the middle exchange which is calculated based on the Bank Indonesia buying and selling rates. The Federal Reserve Bank of New York does not certify for customs purposes a noon buying rate for cable transfers in Indonesian Rupiah. No representation is made that the Indonesian Rupiah or US Dollar amounts shown herein could have been or could be converted into US Dollar or Indonesian Rupiah, as the case may be, at any particular rate or at all. See Item 3 “Key Information – Selected Financial Data – Exchange Controls” for further information regarding rates of exchange between the Indonesian Rupiah and the US Dollar.
FORWARD-LOOKING STATEMENTS
This Form 20-F contains “forward-looking statements” as defined in Section 27A of the US Securities Act of 1933, as amended (“Securities Act”) and Section 21E of the US Securities Exchange Act of 1934, as amended (“Exchange Act”), within the meaning of the Private Securities Litigation Reform Act of 1995, including statements regarding our expectations and projections for our future operating performance and business prospects. The words “believe”, “expect”, “anticipate”, “estimate”, “project” and similar words identify forward-looking statements. In addition, all statements other than statements of historical facts included in this Form 20-F are forward-looking statements. Although we believe that the expectations reflected in the forward-looking statements herein are reasonable, we can give no assurance that such expectations will prove to be correct. These forward-looking statements are subject to a number of risks and uncertainties, including changes in the economic, social and political environments in Indonesia. This Form 20-F discloses, under Item 3 “Key Information – Risk Factors” and elsewhere, important factors that could cause actual results to differ materially from our expectations.
- 9 -
PART I
ITEM 1.IDENTITY OF DIRECTORS, SENIOR MANAGEMENT AND ADVISERS
Not applicable.
ITEM 2.OFFER STATISTICS AND EXPECTED TIMETABLE
Not applicable.
ITEM 3.KEY INFORMATION
A. SELECTED FINANCIAL DATA
The following tables present our selected consolidated financial information and operating statistics as of the dates and for each of the periods indicated. The selected financial information as of and for the years ended December 31, 2010, 2011 and 2012 presented below is based upon our audited Consolidated Financial Statements prepared in conformity with IFRS as issued by the IASB. The selected financial information as of and for the years ended December 31, 2010, 2011 and 2012 should be read in conjunction with, and is qualified in its entirety by reference to, our audited Consolidated Financial Statements, including the notes thereto, and the other information include elsewhere in this Form 20-F and in our previous Form 20-F filed with the SEC on April 2,2012. The selected financial information as of and for the years ended December 31, 2008 and 2009 is based upon our audited Consolidated Financial Statements prepared in conformity with Indonesian Financial Accounting Standards (“IFAS”), with a reconciliation to US GAAP. The selected financial information as of and for the years ended December 31, 2008 and 2009 should be read in conjunction with, and is qualified in its entirety by reference to, our audited Consolidated Financial Statements, including the notes thereto, and the other information included elsewhere in our previous Form 20-F filed with the SEC onMarch31,2011 and April 8, 2010. Therefore, financial information for 2010, 2011 and 2012 are not comparable with financial information for 2008 and 2009 and are presented separately.
The Public Accountant Firm (“KAP”) Purwantono, Suherman & Surja (a member firm of Ernst & Young Global Limited) was appointed to perform the audit on the Consolidated Financial Statements as of and for the years ended December 31, 2012, at our AGMS on May 11, 2012. Meanwhile, our audited Consolidated Financial Statements as of and for the years ended December 31, 2008 were audited by KAP Haryanto Sahari & Rekan and for the years ended December 31, 2009, 2010 and 2011 were audited by KAP Tanudiredja, Wibisana & Rekan, a member firm of the PwC global network (“PwC”).
| | Years Ended December 31, |
| | 2010 | | 2011 | | 2012 | | 2012 |
| | (Rp billion) | | (Rp billion) | | (Rp billion) | | (US$ million) |
Key Consolidated Statements of Comprehensive Income Data | |
| |
| |
| |
|
IFRS | |
| |
| |
| |
|
Revenues | | 68,529 | | 71,238 | | 77,127 | | 8,003 |
Expenses(1) | | 46,337 | | 50,127 | | 53,935 | | 5,597 |
Adjusted EBITDA | | 37,334 | | 36,610 | | 40,236 | | 4,175 |
Operating Profit | | 22,754 | | 21,787 | | 25,762 | | 2,673 |
Profit before Income Tax | | 21,264 | | 20,735 | | 24,292 | | 2,521 |
Net Income Tax Expense | | (5,512) | | (5,385) | | (5,908) | | (613) |
Profit for the Year | | 15,752 | | 15,350 | | 18,384 | | 1,908 |
Attributable to owners of the parent company | | 11,427 | | 10,848 | | 12,864 | | 1,335 |
Attributable to non-controlling interests | | 4,325 | | 4,502 | | 5,520 | | 573 |
Other Comprehensive Expenses - Net | | (553) | | (1,947) | | (3,005) | | (313) |
Net Comprehensive Income for the Year | | 15,199 | | 13,403 | | 15,379 | | 1,595 |
Attributable to owners of the parent company | | 10,911 | | 8,969 | | 9,834 | | 1,020 |
Attributable to non-controlling interests | | 4,288 | | 4,434 | | 5,545 | | 575 |
Weighted average number of shares outstanding (in millions) | | 19,669 | | 19,592 | | 19,202 | | 19,202 |
Basic and Diluted Earnings per Share (in full amount) | |
| |
| |
| |
|
Net income per share(2) | | 580.95 | | 553.70 | | 669.92 | | 0.07 |
Net income per ADS (40 Series B shares per ADS) | | 23,238.00 | | 22,148.00 | | 26,796.80 | | 2.78 |
Dividend relating to the period (accrual basis, in full amount) | |
| |
| |
| |
|
Dividends declared per share | | 322.59 | | 371.05 | | - | | - |
Dividends declared per ADS | | 12,903.60 | | 14,842.17 | | - | | - |
Dividend paid in the period (cash basis, in full amount)(3) | |
| |
| |
| |
|
Dividends declared per share | | 275.45 | | 308.56 | | 371.47 | | 0.04 |
Dividends declared per ADS | | 11,017.83 | | 12,342.57 | | 14,858.69 | | 1.54 |
(1) Expenses are calculated as the sum of the following expenses: operation, maintenance and telecommunication services, depreciation and amortization, personnel, interconnection, marketing, general and administrative, loss (gain) on foreign exchange, share of loss of associated companies and other expenses. |
(2) Using IFAS results, our profit attributable to owners of the parent company would be Rp11,537 billion, Rp10,965 billion and Rp12,850 billion for 2010, 2011 and 2012, and our net income per share would be Rp586.54, Rp559.67 and Rp669.19 for 2010, 2011 and 2012. We distribute dividends based on profit attributable to owners of the parent company and net income per share determined in reliance on IFAS. |
(3) In 2010, we paid a cash dividend for 2009 of Rp261.41 per share and interim cash dividend 2010 of Rp26.75 per share. In 2011, we paid a cash dividend for 2010 of Rp308.56 per share. In 2012, we paid a cash dividend for 2011 of Rp371.47 per share. |
- 10 -
| Years Ended December 31, |
| 2010 | | 2011 | | 2012 | | 2012 |
| (Rp billion) | | (Rp billion) | | (Rp billion) | | (US$ million) |
Reconciliation of Operating Profit to Adjusted EBITDA |
| |
| |
| |
|
Operating Profit | 22,754 | | 21,787 | | 25,762 | | 2,673 |
Add: | | | | | | | |
Depreciation and amortization expense | 14,580 | | 14,823 | | 14,474 | | 1,502 |
Adjusted EBITDA(1) | 37,334 | | 36,610 | | 40,236 | | 4,175 |
(1) Adjusted EBITDA is defined as earnings before interest, tax, depreciation and amortization. Adjusted EBITDA and other related ratios in this Annual Report serve as additional indicators on our performance and liquidity, which is a non GAAP financial measure. Adjusted EBITDA is presented because our management believes that it is widely used by investors in their analysis of our performance and can assist them in their comparison of our performance with those of other companies in the telecommunications, information and media sector. We also present adjusted EBITDA because it is used by some investors as a way to measure a company’s ability to incur and service debt, make capital expenditures and meet working capital requirements. Companies in the telecommunications, information and media sector have historically reported adjusted EBITDA as a supplement to financial measures in accordance with IFRS or US GAAP. Adjusted EBITDA should not be considered as an alternative to net income as an indicator of our performance, nor should adjusted EBITDA be considered an alternative to cash flows from operating activities as a measure of liquidity or as an alternative to any other measure determined in accordance with IFRS. Unlike net income, adjusted EBITDA does not include depreciation and amortization or financing costs and, therefore, does not reflect current or future capital expenditures or the cost of capital. We compensate for these limitations by using adjusted EBITDA as only one of several comparative tools, together with IFRS-based measurements, to assist in the evaluation of operating performance. Such IFRS-based measurements include profit before income tax, profit for the year, cash flows from operations and cash flow data. We have significant uses of cash flows, including capital expenditures, interest payments, debt principal repayments, taxes and other non-recurring charges, which are not reflected in adjusted EBITDA. Our calculation of adjusted EBITDA may be different from the calculation methods used by other companies and, therefore, comparability may be limited. |
| As of December 31, |
| 2010 | | 2011 | | 2012 | | 2012 |
| (Rp billion) | | (Rp billion) | | (Rp billion) | | (US$ million) |
Key Consolidated Statements of Financial Position Data | | | | | | | |
IFRS | | | | | | | |
Cash and cash equivalents | 9,120 | | 9,634 | | 13,118 | | 1,361 |
Trade and other receivables | 4,534 | | 5,393 | | 5,409 | | 561 |
Advances and prepaid expenses | 3,441 | | 3,294 | | 3,721 | | 386 |
Total Current Assets | 18,830 | | 21,401 | | 27,973 | | 2,901 |
Property and equipment | 75,624 | | 74,638 | | 76,908 | | 7,980 |
Intangible assets | 1,786 | | 1,791 | | 1,443 | | 150 |
Total Non-current Assets | 82,242 | | 81,321 | | 82,238 | | 8,534 |
Total Assets | 101,072 | | 102,722 | | 110,211 | | 11,435 |
Trade and other payables | 7,787 | | 8,355 | | 7,457 | | 774 |
Taxes payable | 736 | | 1,039 | | 1,844 | | 191 |
Accrued expenses | 3,409 | | 4,790 | | 6,163 | | 639 |
Unearned income | 2,681 | | 2,821 | | 2,729 | | 283 |
Short-term loans and other borrowings | 5,360 | | 4,913 | | 5,658 | | 587 |
Total Current Liabilities | 20,473 | | 22,189 | | 24,108 | | 2,501 |
Deferred tax liabilities | 4,047 | | 3,448 | | 2,485 | | 258 |
Pension benefit and other post-employment benefit obligations | 2,805 | | 4,572 | | 7,306 | | 758 |
Long-term loans and other borrowings | 16,655 | | 12,958 | | 13,617 | | 1,413 |
Total Non-current Liabilities | 24,061 | | 21,507 | | 24,089 | | 2,499 |
Total Liabilities | 44,534 | | 43,696 | | 48,197 | | 5,000 |
Capital stock(1) | 5,040 | | 5,040 | | 5,040 | | 523 |
Net Equity Attributable to Owners of the Parent Company | 44,627 | | 45,711 | | 46,700 | | 4,846 |
Non-controlling interests | 11,911 | | 13,315 | | 15,314 | | 1,589 |
Total Equity (Net Assets) | 56,538 | | 59,026 | | 62,014 | | 6,435 |
Net Debt | 12,895 | | 8,237 | | 6,157 | | 639 |
Net Working Capital | (1,643) | | (788) | | 3,865 | | 400 |
Issued and fully paid shares (in shares) | 20,159,999,280 | | 20,159,999,280 | | 20,159,999,280 | | 20,159,999,280 |
(1) As of December 31, 2012, our issued and paid-up capital consists of one Series A Dwiwarna share having a par value of Rp250 (the “Dwiwarna Share”) and 20,159,999,279 Series B shares having a par value of Rp250 per share (“common stock”) each from an authorized capital stock comprising one Series A Dwiwarna share and 79,999,999,999 Series B shares. |
- 11 -
| As ofand Years EndedDecember 31, |
| 2008* | | 2009* |
|
(Rp billion) |
|
(Rp billion) |
Consolidated Income Statement Data |
| |
|
Indonesian GAAP |
| |
|
Operating Revenues | 64,166 | | 67,678 |
Operating Expenses | | | |
Depreciation and amortization | 12,332 | | 13,975 |
Personnel | 8,979 | | 8,371 |
Operations, maintenance and telecommunication services | 12,301 | | 14,549 |
General and administrative | 2,504 | | 2,806 |
Interconnection | 3,263 | | 2,929 |
Marketing | 2,350 | | 2,260 |
Total Operating Expenses | 41,729 | | 44,890 |
Operating Income | 22,437 | | 22,788 |
Other Income (Expenses) | | | |
Interest income | 672 | | 462 |
Equity in net (loss) income of associated companies | 20 | | (30) |
Interest expense | (1,641) | | (2,096) |
Gain (loss) on foreign exchange - net | (1,614) | | 973 |
Others - net | 525 | | 350 |
Other expenses - net | (2,038) | | (341) |
Income Before Tax | 20,399 | | 22,447 |
Income Tax (Expense) Benefit | (5,674) | | (6,404) |
Income Before Non-controlling Interest in Net Income of Consolidated Subsidiaries | 14,725 | | 16,043 |
Non-controlling interest in net income of consolidated subsidiaries, net | (4,053) | | (4,644) |
Net Income | 10,672 | | 11,399 |
Weighted average number of shares outstanding (in millions) | 19,749 | | 19,669 |
Basic and Diluted Earnings per Share (in full amount) | | | |
Net income per share | 540.38 | | 579.52 |
Net income per ADS | 21,615.20 | | 23,180.80 |
US GAAP(1) | | | |
Net income | 10,874 | | 12,092 |
Operating revenues | 64,166 | | 67,677 |
Basic and Diluted Earnings per Share (in full amount) | | | |
Net income per share | 550.63 | | 614.78 |
Net income per ADS | 22,025.34 | | 24,591.25 |
Dividend relating to the period (accrual basis, in full amount) | | | |
Dividends declared per share | 296.94 | | 288.06 |
Dividends declared per ADS | 11,877.60 | | 11,522.40 |
Dividend paid in the period (cash basis, in full amount)(2) | | | |
Dividends declared per share | 407.42 | | 323.59 |
Dividends declared per ADS | 16,296.80 | | 12,943.60 |
Consolidated Balance Sheet Data | | | |
Indonesian GAAP | | | |
Current assets | 14,622 | | 16,095 |
Non-current assets | 76,634 | | 81,836 |
Total assets | 91,256 | | 97,931 |
Current liabilities(3) | 27,218 | | 26,892 |
Non-current liabilities | 20,444 | | 21,544 |
Total liabilities | 47,662 | | 48,436 |
non-controlling interest | 9,684 | | 10,933 |
Capital stock | 5,040 | | 5,040 |
Total stockholders’ equity | 33,910 | | 38,562 |
Total liabilities and stockholders’ equity | 91,256 | | 97,931 |
US GAAP(1) | | | |
Current assets | 15,482 | | 18,381 |
Non-current assets | 76,636 | | 83,100 |
Total assets | 92,118 | | 101,481 |
Current liabilities | 27,524 | | 26,931 |
Non-current liabilities | 20,262 | | 22,522 |
Total liabilities | 47,786 | | 49,453 |
Non-controlling interest in net assets of subsidiaries | 9,605 | | 11,067 |
Total stockholders’ equity | 34,727 | | 40,961 |
Total liabilities and stockholders’ equity | 92,118 | | 101,481 |
| | | |
* As restated. | | | |
(1) US GAAP amounts reflect adjustments resulting from differences in the accounting treatment of voluntary termination benefits, foreign exchange differences capitalized on assets under construction, interest capitalized on assets under construction, revenue-sharing arrangements, employees benefits, equity in net loss (income) of associated companies, amortization of land rights, revenue recognition, amortization of goodwill, finance leases, acquisition of Mitratel, asset retirement obligations, deferred taxes, available-for-sale securities, amendment and restatement of JOS in Regional Division VII and non-controlling interests. |
(2) In 2008, we paid a dividend computed as a cash dividend and special dividend for 2007 of Rp455.87 per share less the interim cash dividend of Rp48.45 per share paid in November 2007. In 2009, we paid a cash dividend for 2008 of Rp296.94 per share and interim cash dividend 2009 of Rp26.65 per share. |
(3) Includes current maturities of long-term debt. |
- 12 -
Exchange Controls
Exchange Rate Information
The following table shows the exchange rate of Indonesian Rupiah to US Dollar based on the middle exchange rate which is calculated based on the Bank Indonesia buying and selling rates for the periods indicated.
| | at Period End | | Average | | Low | | High |
Calendar Year | | (Rp Per US$1) |
2008 (1) | | 10,950 | | 9,757 | | 12,151 | | 9,051 |
2009 (1) | | 9,400 | | 10,356 | | 11,980 | | 9,400 |
2010 (1) | | 8,991 | | 9,078 | | 9,365 | | 8,924 |
2011 (1) | | 9,068 | | 8,773 | | 9,170 | | 8,508 |
2012 | | 9,670 | | 9,380 | | 9,707 | | 8,892 |
September(2) | | 9,588 | | 9,566 | | 9,593 | | 9,450 |
October(2) | | 9,615 | | 9,597 | | 9,615 | | 9,583 |
November(2) | | 9,605 | | 9,628 | | 9,643 | | 9,603 |
December(2) | | 9,670 | | 9,646 | | 9,707 | | 9,598 |
2013 | | 9,667 | | 9,687 | | 9,740 | | 9,634 |
January(2) | | 9,698 | | 9,687 | | 9,740 | | 9,635 |
February(2) | | 9,667 | | 9,687 | | 9,725 | | 9,634 |
March (through March 22)(2) | | 9,743 | | 9,704 | | 9,743 | | 9,678 |
Source: Bank Indonesia |
|
(1) Determined based upon the last day middle exchange rate of each month announced by Bank Indonesia applicable for the period. |
(2) Determined based upon the daily middle exchange rate announced by Bank Indonesia during the applicable period. |
Under the current exchange rate system, the exchange rate of the Indonesian rupiah is determined by the market, reflecting the interaction of supply and demand in the market. However, Bank Indonesia may take measures to maintain a stable exchange rate. For the year 2012, the average rate of Rupiah to the US Dollar was Rp9,380, with the lowest and highest rates being Rp9,707 and Rp8,892, respectively.
The exchange rates used for translation of monetary assets and liabilities denominated in foreign currencies are the buy and sell rates published by Reuters in 2010, 2011 and 2012. The Reuters buy and sell rates, applied respectively to monetary assets and liabilities, were Rp9,005 and Rp9,015 to US$1.00 as of December 31, 2010, Rp9,060 and Rp9,075 to US$1.00 as of December 31, 2011 and Rp9,630 and Rp9,645 to US$1.00 as of December 28, 2012.
The Consolidated Financial Statements are stated in Rupiah. The translations of Rupiah amounts into US Dollar are included solely for the convenience of the readers and have been made using the average of the market buy and sell rates of Rp9,637.5 to US$1.00 published by Reuters on December 28, 2012.
- 13 -
On March 22, 2013, the Reuters bid and ask rates were Rp9,740 and Rp9,745 to US$1.00.
Foreign Exchange Controls
Indonesia operates a liberal foreign exchange system that permits the free flow of foreign exchange. Capital transactions, including remittances of capital, profits, dividends and interest, are free of exchange controls. A number of regulations, however, have an impact on the exchange system. For example, only banks are authorized to deal in foreign exchange and execute exchange transactions related to the import and export of goods. In addition, Indonesian banks (including branches of foreign banks in Indonesia) are required to report to Bank Indonesia any fund transfers exceeding US$10,000. As a State-Owned Company, and based on the decree of the Head of Foreign (“PKLN”), we are required to obtain an approval from PKLN prior to acquiring foreign commercial loans and must submit periodical reports to PKLN during the term of the loans.
B. CAPITALIZATION ANDINDEBTEDNESS
Not applicable.
C. REASON FOR THEOFFER ANDUSE OFPROCEEDS
Not applicable.
D. RISK FACTORS
Risks Related to Indonesia
Political and Social Risks
Current political and social events in Indonesia may adversely affect our business
Since 1998, Indonesia has experienced a process of democratic change, resulting in political and social events that have highlighted the unpredictable nature of Indonesia’s changing political landscape. In 1999, Indonesia conducted its first free elections for parliament and president. Indonesia also has many political parties, without any one party holding a clear majority. Due to these factors, Indonesia has, from time to time, experienced political instability, as well as general social and civil unrest. For example, since 2000, thousands of Indonesians have participated in demonstrations in Jakarta and other Indonesian cities both for and against former President Abdurahman Wahid, former President Megawati, and current President Susilo Bambang Yudhoyono as well as in response to specific issues, including fuel subsidy reductions, privatization of state assets, anti-corruption measures, decentralization and provincial autonomy and the American-led military campaigns in Afghanistan and Iraq. Although these demonstrations were generally peaceful, some turned violent.
Separatist movements and clashes between religious and ethnic groups have also resulted in social and civil unrest in parts of Indonesia, such as Aceh in the past and in Papua currently, where there have been clashes between supporters of those separatist movements and the Indonesian military, including continued activity in Papua, by separatist rebels that has led to violent incidents. There have also been inter-ethnic conflict, for example in Kalimantan, as well as inter-religious conflict such as in Maluku and Poso.
Labor issues have also come to the fore in Indonesia. In 2003, the Government enacted a new labor law that gave employees greater protections. Occasional efforts to reduce these protections have prompted an upsurge in public protests as workers responded to policies that they deemed unfavorable.
There can be no assurance that social and civil disturbances will not occur in the future and on a wider scale, or that any such disturbances will not, directly or indirectly, materially and adversely affect our business, financial condition, results of operations and prospects.
Terrorist activities in Indonesia could destabilize Indonesia, which would adversely affect our business, financial condition and results of operations, and the market price of our securities
There have been a number of terrorist incidents in Indonesia, including the May 2005 bombing in Central Sulawesi, theBali bombings in October 2002 and 2005 and the bombings at the JW Marriot and Ritz-Carlton hotels in Jakarta in July 2009. Although the Government has successfully countered some terrorist activities in recent years and arrested several of those suspected of being involved in these incidents, terrorist incidents may continue and, if serious or widespread, might have a material adverse effect on investment and confidence in, and the performance of, the Indonesian economy and may also have a material adverse effect on our business, financial condition, results of operations and prospects andthe market price of our securities. There can be no assurance that terrorist activities will not occur again in future, or that if such events do occur, they will not have an impact on business or our securities market price in Indonesia capital market.
- 14 -
Macro Economic Risks
Negative changes in global, regional or Indonesian economic activity could adversely affect our business
Changes in the Indonesian, regional and global economies can affect our performance. Two significant events in the past that impacted Indonesia’s economy were the Asian economic crisis of 1997 and the global economic crisis which started in 2008. The 1997 crisis was characterized in Indonesia by, among others, currency depreciation, a significant decline in real gross domestic product, high interest rates, social unrest and extraordinary political developments, while the global economic crisis that arose from the subprime mortgage crisis in the US put Indonesia’s economy under pressure, although not as severely as in 1997. The global financial markets have also experienced volatility as a result of the downgrade of US sovereign debt in 2012 and concerns over the debt crisis in the Eurozone. Uncertainty over the outcome of the Eurozone governments’ financial support programs and worries about sovereign finances generally are ongoing. If the crisis becomes protracted, or extends to Asia and Indonesia, we can provide no assurance that it will not have a material and adverse effect on Indonesia’s economic growth and consequently on our business.
Adverse economic conditions could result in less business activity, less disposable income available for consumers to spend and reduced consumer purchasing power, which may reduce demand for communication services, including our services, which in turn would have an adverse effect on our business, financial condition, results of operations and prospects. There is no assurance that there will not be a recurrence of economic instability in future, or that, should it occur, it will not have an impact on the performance of our business.
Fluctuations in the value of the Indonesian Rupiah may materially and adversely affect us
Our functional currency is the Indonesian Rupiah. One of the most important effects of the Asian economic crisis that affected Indonesia was the depreciation and volatility in the value of the Indonesian Rupiah as measured against other currencies, such as theUS Dollar. From 2008 to 2012, the Indonesian Rupiah perUS Dollar exchange rate ranged from a low of Rp12,400 perUS Dollar to a high of Rp8,460 perUS Dollar. As a result, we recorded losses of Rp210 billion and Rp189 billion in 2011 and 2012, respectively. As of December 28, 2012, the Indonesian Rupiah perUS Dollar exchange rate stood at Rp9,637.5 perUS Dollar.
Although the Indonesian Rupiah’s value was relatively stable in 2012, this trend may change should global economic conditions change and the European financial crisis extend to Asia and Indonesia. To the extent the Indonesian Rupiah depreciates further from the exchange rates as of December 31, 2012, our obligations under our accounts payable, procurements payable and our foreign currency-denominated loans payable would increase in Indonesian Rupiah terms. Such depreciation of the Indonesian Rupiah would result in losses on foreign exchange translation, significantly affect our total expenses and net income and reduce theUS Dollar amounts of dividends received by holders of our ADSs. We can give no assurances that we will be able to control or manage our exchange rate risk successfully in the future or that we will not be adversely affected by our exposure to exchange rate risk.
In addition, while the Indonesian Rupiah has generally been freely convertible and transferable, from time by time, Bank Indonesia has intervened in the currency exchange markets in furtherance of its policies, either by selling Indonesian Rupiah or by using its foreign currency reserves to purchase Indonesian Rupiah. We can give no assurances that the current floating exchange rate policy of Bank Indonesia will not be modified or that the Government will take additional action to stabilize, maintain or increase the Indonesian Rupiah’s value, or that any of these actions, if taken, will be successful. Modification of the current floating exchange rate policy could result in significantly higher domestic interest rates, liquidity shortages, capital or exchange controls or the withholding of additional financial assistance by multinational lenders. This could result in a reduction of economic activity, an economic recession, loan defaults or declining subscriber usage of our services, and as a result, we may also face difficulties in funding our capital expenditures and in implementing our business strategy. Any of the foregoing consequences could have a material adverse effect on our business, financial condition, results of operations and prospects.
Downgrades of credit ratings of the Government or Indonesian companies could adversely affect our business
As of this date of the Annual Report, Indonesia’s sovereign foreign currency long-term debt is rated “Baa3” by Moody’s (upgraded from “Ba1” on January 18, 2012), “BB+” by Standard & Poor’s (upgraded from “bb” on April 8, 2011) and “BBB” by Fitch Ratings (“Fitch”). Indonesia's short-term foreign currency debt is rated “B1/NP” by Moody’s, “B” by Standard & Poor’s and “B” by Fitch. On January 18, 2012, Moody’s upgraded Indonesia’s long-term debt rating to investment grade status.
The likelihood of these agencies reviewing or changing these ratings downwards this year is, based on the information that we have today, low. However, we can give no assurances that Moody’s, Standard & Poor’s or Fitch, will not change or downgrade the credit ratings of Indonesia. Any such downgrade could have an adverse impact on liquidity in the Indonesian financial markets, the ability of the Government and Indonesian companies, including us, to raise additionalfinancing and the interest rates and other commercial terms at which such additional financing is available. Interest rates on our floating rate Rupiah-denominated debt would also likely increase. Such events could have material adverse effects on our business, financial condition, results of operations and prospects.
- 15 -
Disaster Risks
Indonesia is vulnerable to natural disasters and events beyond our control, which could adversely affect our business and operating results
Many parts of Indonesia, including areas where we operate, are prone to natural disasters such as floods, lightning strikes, typhoons, earthquakes, tsunamis, volcanic eruptions, fires, droughts, power outages and other events beyond our control. The Indonesian archipelago is one of the most volcanically active regions in the world as it is located in the convergence zone of three major lithospheric plates. It is subject to significant seismic activity that can lead to destructive earthquakes, tsunamis or tidal waves. From time to time, natural disasters have killed, affected or displaced large numbers of people and damaged our equipment. These events in the past, and may in the future, disrupt our business activities, cause damage to equipment and adversely affect our financial performance and profit.
In recent years, several natural disasters have occurred in Indonesia (in addition to the Asian tsunami in 2004), including tsunamis in Pangandaran in West Java in 2006 and 2010, an earthquake in Yogyakarta in Central Java in 2006, a hot mud eruption and subsequent flooding in Sidoarjo in East Java in 2006 and separate earthquakes in Papua, West Java, Sulawesi and Sumatra in 2009.
On September 2, 2009, an earthquake in West Java caused damage to our assets. On September 30, 2009, an earthquake in West Sumatra disrupted the provision of telecommunications services in several locations. Although our Crisis Management Team in cooperation with our employees and partners was able to restore services quickly, the earthquakecaused severe damage to our assets. There were a number of earthquakes detected in 2010, although none of them presented significant risks to our business in general.
Flash floods and more widespread flooding occur regularly during the rainy season from November to April. Cities, especially Jakarta, are frequently subject to severe localized flooding which can result in major disruption, and occasionally fatalities. Jakarta experienced significant floods in February 2007 as did in Solo in Central Java in January. In January 2009, torrential rain caused a dam to burst outside Jakarta, flooding hundreds of homes in a densely populated neighborhood, resulting in the death of approximately 100 people. Landslides regularly occur in rural areas during the wet season.
There are numerous volcanoes in Indonesia, any of which can erupt without warning. In October and November 2010, Mount Merapi in Central Java erupted several times, killing an estimated 140 persons, displacing several hundred thousand others in a 20 km radius, causing billions of dollars of property damage and disrupting air travel. Since April 2008, Mount Soputan in North Sulawesi, Mount Egon in Flores Island, Nusa Tenggara, Mount Ibu in North Maluku and Anak Krakatau in the Sunda Strait have shown significant increased volcanic activity. Mount Sinabung, 60 km (40 miles) southwest of Sumatra's main city Medan, erupted on August 29, 2010 after lying dormant for 400 years. Ash and acrid smoke from the volcano have blanketed villages and crops.
In 2010, our submarine cables forming part of our backbone suffered damage due to a tsunami in West Sumatra and an earthquake in Sumbawa. These were repaired.
Although we have implemented a Business Continuity Plan (“BCP”) and a Disaster Recovery Plan (“DRP”), and test these regularly and we have insured our assets to protect from any losses attributable to natural disasters or other phenomena beyond our control, there is no assurance that the insurance coverage will be sufficient to cover the potential losses, that the premium payable for these insurance policies upon renewal will not increase substantially in the future,or that natural disasters would not significantly disrupt our operations.
There are no assurances that future geological or meteorological occurrences will not have a significant impact on Indonesian and its economy. A significant earthquake, other geological disturbance or weather-related natural disaster in any of Indonesia’s more populated cities and financial centers could severely disrupt the Indonesian economy and undermine investor confidence, thereby materially and adversely affecting our business, financial condition, results of operations and prospects.
Our operations may be adversely affected by an outbreak of avian influenza, Influenza A (H1N1) virus or other epidemics
An outbreak of avian influenza, Influenza A (H1N1) virus or a similar epidemic, or the measures taken by the Governments of affected countries, including Indonesia, against such an outbreak, could severely disrupt the Indonesian and other economies and undermine investor confidence, thereby materially and adversely affecting our financial condition or results of operations and the market value of its securities. Moreover, our operations could be materially disrupted if our employees remained at home and away from our principal places of business for extended period of time, which would have a material and adverse effect on our financial condition or results of operations and the market value of its securities.
- 16 -
Other Risks
Indonesian Corporate Disclosure Standards differ in significant respects from those applicable in other countries, including the United States
As an IDX, NYSE and LSE listed company, we are subject to regulatory and exchange corporate governance and reporting requirements in multiple jurisdictions. There may be less publicly-available information about Indonesian public companies, including us, than is regularly disclosed by public companies in countries with more mature securities markets. As a result, investors may not have access to the same level and type of disclosure as that available in other countries, and comparisons with other companies in other countries may not be possible in all respects.
Our financial results are reported herein in conformity with IFRS; however, we report our financial results to OJK (the successor to Bapepam-LK) in conformity with IFAS, which differs in certain significant respects from IFRS, and we distribute dividends based on profit for the year attributable to owners of the parent company and net income per share determined in reliance on IFAS
In accordance with regulations of the OJK and the IDX, we are required to report our financial results to OJK in conformity with IFAS. We have provided to OJK our financial result for the financial year ended December 31, 2012 on March 6, 2013, which we furnished to the SEC on a Form 6-K on March 11, 2013, which contains our audited Consolidated Financial Statements as of December 31, 2011 and 2012 and for the years then ended and as of January 1, 2011, prepared in conformity with IFAS. IFAS differs in certain significant respects from IFRS, and, as a result, there aredifferences between our financial results as reported under IFAS and IFRS, including profit for the year attributable to owners of the parent company and net income per share. We distribute dividends based on profit for the year attributable to owners of the parent company and net income per share determined in reliance on IFAS.
Using IFAS results, our profit for the year attributable to owners of the parent company would be Rp10,965 billion and Rp12,850 billion for 2011 and 2012, and our net income per share would be Rp559.67 and Rp669.19 for 2011 and 2012. Dividends declared per share were Rp371.05 for 2011. The dividends per share for the year 2012 will be decided at the 2013 AGMS, scheduled for April 2013.
We are incorporated in Indonesia, and it may not be possible for investors to affect service of process, or enforce judgments, on us within the United States, or to enforce judgments of a foreign court against us in Indonesia
We are a limited liability company incorporated in Indonesia, operating within the framework of Indonesian laws relating to Indonesian companies with limited liability, and all of our significant assets are located in Indonesia. In addition, our Commissioners and our Directors reside in Indonesia and a substantial portion of the assets of such persons are located outside the United States. As a result, it may be difficult for investors to effect service of process, or enforce judgments on us or such persons within the US, or to enforce against us or such persons in the US, judgments obtained in US courts.
We have been advised by Hadiputranto, Hadinoto & Partners our Indonesian legal advisor that judgments of US courts, including judgments predicated upon the civil liability provisions of the US federal securities laws or the securities laws of any state within the US, are not enforceable in Indonesian courts, although such judgments could be admissible as non-conclusive evidence in a proceeding on the underlying claim in an Indonesian court. They have also advised that there is doubt as to whether Indonesian courts will enter judgments in original actions brought in Indonesian courts predicated solely upon the civil liability provisions of the US federal securities laws or the securities laws of any state within the US. As a result, the claimant would be required to pursue claims against us or such persons in Indonesian courts.
Our controlling shareholder’s interest may differ from those of our other shareholders
The Government has a controlling stake of 53.9% of our issued and outstanding shares of common stock and the ability to determine the outcome of all actions requiring the approval of the shareholders. The Government also holds our one Series A Dwiwarna share, which has special voting rights and veto rights over certain matters, including the election and removal of our Directors and Commissioners. It may also use its powers as majority shareholder or under the Dwiwarna share to cause us to issue new shares, amend our Articles of Association or bring about actions to merge or dissolve us, increase or decrease our authorized capital or reduce our issued capital, or veto any of these actions. One or more of these may result in the delisting of our securities from certain exchanges. Further, through the MoCI, the Government exercises regulatory power over the Indonesian telecommunications industry.
As of December 31, 2012, the Government had a 14.29% equity stake in PT Indosat Tbk. ("Indosat"), our competitor, principally in fixed IDD telecommunications services, and the competitor in cellular services of our majority owned subsidiary, Telkomsel. The Government's stake includes the Series ADwiwarna share which has special voting rights and veto rights over certain strategic matters under Indosat's Articles of Association, including decisions on dissolution, liquidation and bankruptcy, and also permits the Government to nominate one Director to its Board of Directors and one Commissioner to its Board of Commissioners. There may thus be instances where Government interests will conflictwith ours. There is no assurance that the Government will not direct opportunities to Indosat or favor Indosat when exercising regulatory power over the Indonesian telecommunications industry. If the Government were to give priority to Indosat’s business over ours or to expand its stake in Indosat, our business, financial condition, and results of operations and prospects could be materially and adversely affected.
- 17 -
Risks Related to Our Business
Operational Risks
A material failure in the continuing operations of our network, certain key systems, gateways to our network or the networks of other network operators could adversely affect our business, financial condition, results of operations and prospects
We depend to a significant degree on the uninterrupted operation of our network to provide our services. For example, we depend on access to our fixed wireline network (“PSTN”) for the operation of our fixed line network and the termination and origination of cellular telephone calls to and from fixed line telephones, and a significant portion of our cellular and international long-distance call traffic is routed through the PSTN. We also depend on access to a fixed wireless network (“CDMA”), an internet and broadband network and a cellular network. Our integrated network includes a copper access network, fiber optic access network, BTSs, switching equipment, optical and radio transmission equipment, an IP core network, satellite and application servers.
In addition, we also rely on interconnection to the networks of other telecommunications operators to carry calls and data from our subscribers to the subscribers of operators both within Indonesia and overseas. We also depend on certain technologically sophisticated management information systems and other systems, such as our customer billing system, to enable us to conduct our operations. Our network, including our information systems, IT and infrastructure and the networks of other operators with whom our subscribers interconnected, are vulnerable to damage or interruptions in operation from a variety of sources including earthquake, fire, flood, power loss, equipment failure, network software flaws, transmission cable disruption or similar events.
Although we have a comprehensive business continuity plan and a recovery plan which we test and strive to improve, we cannot guarantee that the implementation of such plans will be completely or partially successful should any portion of network be severely damaged or interrupted. Any failure that results in an interruption of our operations or of the provision of any service, whether from operational disruption, natural disaster or otherwise, could adversely affect our business, financial condition, results of operations and prospects.
Our networks, particularly our wireline access network, face both potential physical and cyber security threats, such as theft, vandalism and acts intended to disrupt operations, which could adversely affect our operating results
Our networks and equipment, particularly our wireline access network, face both potential physical and cyber security threats. Physical threats include theft and vandalism of our equipment and organized attacks against key infrastructure intended to disrupt operations. In addition, telecommunications companies worldwide face increasing cyber security threats as businesses become increasingly dependent on telecommunications and computer networks and adopt cloud computing technologies. Cyber security threats include gaining unauthorized access to our systems or inserting computer viruses or malicious software in our systems to misappropriate consumer data and other sensitive information, corrupt our data or disrupt our operations. Unauthorized access may also be gained through traditional means such as the theft of laptop computers, portable data devices and mobile phones and intelligence gathering on employees with access.
Although we have not experienced any material successful cyber attacks to date that have affected our operations, a successful cyber attack may lead us to incur substantial costs to repair damage or restore data, implement substantial organizational changes and training to prevent future similar attacks and lost revenues and litigation costs due to misused sensitive information, and cause substantial reputational damage. We take preventive and remedial measures, including enhanced cooperation with the police, particularly in areas prone to criminal activity and regular upgrades of our data security measures. However, there is no assurance that our physical and cyber security measures will be successful. Damage to our network, equipment or data and the need to repair such damage resulting from a physical or cyber attack may materially and adversely affect our business, financial condition and operating results. Our networks, particularly our wireline access network, face potential security threats, such as theft or vandalism, which could adversely affect our operating results.
We face a number of risks relating to our internet-related services
In addition to cyber security threats, because we provide connections to the internet and host websites for customers and develop internet content and applications, we may be perceived as being associated with the content carried over our network or displayed on websites that we host. We cannot and do not screen all of this content and may face litigation claims due to a perceived association with this content. These types of claims can be costly to defend, divert management resources and attention, and may damage our reputation.
- 18 -
A revenue leakage might occur due to internal weaknesses or external factors and if this happened it could have an adverse effect on our operating results
A revenue leakage is a generic risk for all telecommunications operators. We may face revenue leakage problems, or problems with collecting all the revenues to which we may be entitled, due to the possibility of weaknesses at the transactional level, delay in transaction processing, dishonest customers or other factors.
We have taken some preventive measures against the possibility of revenue leakage by increasing control functions in all of our existing business process, implementing revenue assurance methods, employing adequate policies and procedures as well as implementing information systems applications to minimize revenue leakages. Nonetheless, there is no assurance that in the future there will be no significant revenue leakages or that any such leakages will not have a material adverse affect on our operating results.
New technologies may adversely affect our ability to remain competitive
The telecommunications industry is characterized by rapid and significant changes in technology. We may face increasing competition due to technologies currently under development or which may be developed in the future. Future development or application of new or alternative technologies, services or standards could require significant changes to our business model, the development of new products, the provision of additional services and substantial new investments by us. New products and services may be expensive to develop and may result in the introduction of additional competitors into the marketplace. We cannot accurately predict how emerging and future technologicalchanges will affect our operations or the competitiveness of our services. Furthermore, we cannot guarantee that we will be able to effectively integrate new technologies into our existing business model.
To maintain and strengthen the growth of our business, we are currently undergoing a transformation to the TIMES business. As part of our transformation to a TIMES business, we are seeking to develop new businesses through which we also provide content to our telecommunications subscribers. We do not yet have substantial experience as a content provider therefore we cannot assure you that we will be able to effectively manage the growth of this business.
We cannot assure you that our technologies will not become obsolete, or be subjected to competition from new technologies in the future, or that we will be able to acquire new technologies necessary to compete in changed circumstances on commercially acceptable terms. Our failure to react to rapid technological changes could adversely affect our business, financial condition, results of operations and prospects.
Our satellites have limited operational life they may be damaged or destroyed during in-orbit operation or suffer launch delays or failures. The loss or reduced performance of our satellites, whether caused by equipment failure or its license being revoked, may adversely affect our financial condition, results of operations and ability to provide certain services
Our Telkom-1 and Telkom-2 satellites have a limited operational life, currently estimated to end approximately in 2015 and 2020, respectively. A number of factors affect the operational lives of satellites, including the quality of their construction, the durability of their systems, subsystems and component parts, on-board fuel reserves, accuracy of their launch into orbit, exposure to micrometeorite storms, or other natural events in space, collision with orbital debris, or the manner in which the satellite is monitored and operated. We currently use satellite transponder capacity on our satellites in connection with many aspects of our business, including direct leasing of such capacity and routing for our international long-distance and cellular services.
Moreover, International Telecommunication Union (“ITU”) regulations specify that a designated satellite slot has been allocated for Indonesia, and the Government has the right to determine which party is licensed to use such slot. While we currently hold a license to use the designated satellite slot, in the event our Telkom-1 and Telkom-2 satellites experience technical problems or failure, the Government may determine that we have failed to optimize the existing slot under our license, which may result in the Government withdrawing our license. We cannot assure you that we will be able to maintain use of the designated satellite slot in a manner deemed satisfactory by the Government.
In anticipation of the growth in demand for satellite services and to support our business strategy with regard to providing TIME services, we signed a contract in 2009 for the procurement of the Telkom-3 Satellite System. However, due to a launch failure in August 2012, the Telkom-3 satellite ended up in an unusable orbit. Although we had fully insured the cost of the satellite, the loss of the Telkom-3 satellite will require us to lease transponder capacity from a third-party provider to fulfill our commitments to our satellite operations customers, with likely lower margins than we would have received from the use of Telkom-3 had it been successfully launched. In addition, we would also need to commission the development and launch of another satellite to replace our Telkom-1satellite before the end of its anticipated operational lifespan. As it generally requires approximately three years for a satellite to be developed and launched, although the Telkom-1 satellite may still be operational for several years after the end of its currently estimated operational lifespan in 2015, if there is any delay in the development and launch of a replacement satellite, or if the operational life of the Telkom-1 satellite ends before the replacement satellite is successfully launched, or damage or failure renders our existing satellites unfit for use, we would need to lease additional transponder capacity from a third party, which would likely increase our costs of operations. Failure to lease adequate satellite capacity from a third-party provider may also result in service interruptions and/or a cessation of our satelliteoperations. The termination of our satellite business could increase expenses associated with our provision of other telecommunications services, particularly in the eastern parts of Indonesia which currently rely largely on satellite coverage for telecommunications services, and could adversely affect our business, financial condition and results of operations.
- 19 -
Financial Risks
We are exposed to interest rate risk
Our debt includes bank borrowings to finance our operations. Where appropriate, we seek to minimize our interest rate risk exposure by entering into interest rate swap contracts to swap floating interest rates for fixed interest rates over the duration of certain of borrowings. However, our hedging policy may not adequately cover our exposure to interest rate fluctuations and this may result in a large interest expense and an adverse effect on our business, financial condition and results of operations.
We may not be able to successfully manage our foreign currency exchange risk
Changes in exchange rates have affected and may continue to affect our financial condition and results of operations. Most of our debt obligations are denominated in Indonesian Rupiah and a majority of our capital expenditures are denominated inUS Dollars. Most of our revenues are denominated in Indonesian Rupiah and a portion is denominated inUS Dollars (for example from international services). We may also incur additional long-term indebtedness in currencies other than the Indonesian Rupiah, including theUS Dollars, to finance further capital expenditures.
Overall, our financial risk management program aims to minimize losses on the financial assets and financial liabilities arising from fluctuation of foreign currency exchange rates. We have a written policy for foreign currency risk management, which mainly covers time deposits placements and hedging to cover foreign currency risk exposure for periods ranging from three up to twelve months.
We use a hedging policy to protect our business from extreme currency exchange risk, based on annual net open positions in foreign currency. The implementation of our hedging policy is reviewed monthly to anticipate extreme changes in currency exchange rates.
Although the exchange rate of the Indonesian Rupiah to theUS Dollar was relatively stable in2012 at the level of Rp9,000 perUS Dollar, we can give no assurance you that we will be able to manage our exchange rate risk successfully in the future or that our business, financial condition or results of operations will not be adversely affected by our exposure to exchange rate risk.
We may be unable to fund the capital expenditures needed for us to remain competitive in the telecommunications industry in Indonesia
The delivery of telecommunications services is capital intensive. In order to be competitive, we must continually expand, modernize and update our telecommunications infrastructure technology, which involves substantial capital investment. For the years ended December 31, 2010, 2011 and 2012, our actual consolidated capital expenditures totaled Rp12,651 billion, Rp14,603 billion and Rp17,272 billion (US$1,792 million), respectively.Our ability to fund capital expenditures in the future will depend on our future operating performance, which is subject to prevailing economic conditions, levels of interest rates and financial, business and other factors, many of which are beyond our control, and upon our ability to obtain additional external financing. We cannot assure you that additional financing will be available to us on commercially acceptable terms, or at all. In addition, we can only incur additional financing in compliance with the terms of our debt agreements. Accordingly, we cannot assure you that we will have sufficient capital resources to improve or expand our telecommunications infrastructure technology or update our other technology to the extent necessary to remain competitive in the Indonesian telecommunications market. Our failure to do so could have a material adverse effect on our business, financial condition, results of operations and prospects.
Legal and Compliance Risks
If we are found liable for price fixing by the Indonesian Anti-Monopoly Committee and for class action allegations, we may be subject to substantial liability which could lead to a decrease in our revenue and affect our business, reputation and profitability
On November 1, 2007, the Indonesian Supervising Committee for Business Competition (“KPPU”) issued a preliminary decision regarding an investigation involving us, our majority-owned subsidiary Telkomsel and seven othertelecommunication companies based on allegations of price-fixing for SMS services and breach of Article 5 of the Anti-monopoly Law (“Law No.5/1999”). On June 18, 2008, the KPPU determined that our Company, Telkomsel, PT XL Axiata Tbk. (“XL”), PT Bakrie Telecom Tbk. (“Bakrie Telecom”), PT Mobile-8 Telecom Tbk. (now Smartfren) (“Mobile-8”) and PT Smart Telecom (“Smart Telecom”) had jointly breached Article 5 of Law No.5/1999. We and Telkomsel appealed the KPPU’s ruling to the Bandung District Court and the South Jakarta District Court, respectively. On April 11, 2011, the Supreme Court ordered a consolidation of the appeals and appointed the Central Jakarta District Court to handle the appeals.See Item 8 “Financial Information– Consolidated Statements and Other FinancialInformation–Material Litigation”. If the District Court issues a verdict against our Company and/or Telkomsel, we could be subjected to the payment of a fine, the amount of which will be subject to the discretion of the District Court, which could have an adverse effect on our business, reputation and profitability.
- 20 -
Class action lawsuits were filed against Telkomsel and Indosat during 2007 and 2008 in the District Court of Bekasi, the Central Jakarta District Court and the Tangerang District Court, relating to Temasek HoldingS (Private) Limited prior cross ownership of shares in Telkomsel and Indosat, alleging price fixing of telecommunications services. The plaintiffs withdrew the lawsuit filed with the District Court of Bekasi. On January 27, 2010, the court dismissed the class action filed with the Central Jakarta District Court on the basis that the plaintiffs did not establish their legal standing and that two members of the plaintiff class did not qualify as class representatives. On May 24, 2010, the court dismissed the class action filed with the Tangerang District Court on the basis that the plaintiffs failed to establish their legal standing as class representatives.
There can be no assurance that other subscribers, people, or partners will not file similar cases in the future. If a District Court in any new class action suit, issues a verdict in favor of such plaintiff, it could have an adverse effect on our business, reputation and profitability.
Forward-looking statements may not be accurate
This Annual Report incorporates forward-looking statements that include announcements regarding our current goals and projections of our operational performance and future business prospects. The words “believe”, “expect”, “anticipate”, “estimate”, “project” and similar words identify forward-looking statements. In addition, all statements, other than statements that contain historical facts, are forward-looking statements. While we believe that the expectations contained in these statements are reasonable, we cannot give an assurance that they will be realized. These forward-looking statements are subjected to a number of risks and uncertainties, including changes in the economic, social and political situation in Indonesia and other risks described in "Risk Factors". All forward-looking statements, written or verbal, made by us or by persons on behalf of us are deemed to be subject to those risks.
Regulation Risks
We operate in a legal and regulatory environment that is undergoing significant change. These changes may result in increased competition, which may result in reduced margins and operating revenue, among other things. These changes may also directlyreduce our margins or reduce the costs of our competitors. These adverse changes resulting from regulation may have a material adverse effect on us
Reformation in Indonesian telecommunications regulation initiated by the Government in 1999 have, to a certain extent, resulted in the industry’s liberalization, including removal of barriers to entry and the promotion of competition. However, in recent years, the volume and complexity of regulatory changes has created an environment of considerable regulatory uncertainty. In addition, as the legal and regulatory environment of the Indonesian telecommunications sector continues to change, competitors, potentially with greater resources than us, may enter the Indonesian telecommunications sector and compete with us in providing telecommunications services. Furthermore, it is impossible to anticipate the regulatory policies that will be applied to new technologies.
We derive substantial revenue from interconnection services because we have the largest network in Indonesia and our competitors must pay tariffs to connect to our network. As regulated by the MoCI, interconnection rates have decreased in recent years. The current interconnection rates, effective in 2011, reduced rates by an average of 1.5% to 3.0% compared to the previous rates effective in 2008. See Item 4 “Information on the Company– Legal Basis andRegulation–Interconnection”.
To cite another example, in 2008, the Government required telecommunications operators to allow competitors to utilize their towers without discrimination. Our competitors enjoy disproportionately greater potential cost savings than us under this regulation because we have the largest network and have already spent to build towers in various areas. Further, our competitors gain access to areas they otherwise would have no access to because tower sites in densely populated urban areas are scarce or unavailable while we benefit substantially less because we secured sites in many such areas. See Item 4 “Information on the Company– Legal Basis andRegulation–Telecommunications Towers”.
In the future, the Government may announce or implement other regulatory changes which may adversely affect our business or our existing licenses. We cannot assure you that we will be able to compete successfully with other domestic and foreign telecommunications operators, that regulatory changes will not disproportionately reduce our competitors’costs or disproportionately reduce our revenues, or that regulatory changes, amendments or interpretations of current or future laws and regulations promulgated by the Government will not have a material adverse effect on our business and operating results.
The termination of Telkomsel’s premium SMS services has resulted in a substantial reduction of our revenues from these services. Similar action by the Indonesian Telecommunications Regulatory Authority (“ITRA”) or MoCI in the future from similar services or other related or new products may likewise reduce or restrict the growth of our revenues. TheITRA or MoCI may also take more aggressive action that may lead to disruptions in the delivery of Telkomsel’s products or fines or other administrative sanctions. Any of these factors may materially and adversely affect our results of operations and financial condition.
- 21 -
The entry of additional Indonesian telecommunications operators as providers of international direct dialing services could adversely affect our international telecommunications services operating margins, market share and results of operations
We obtained a license and entered the international long-distance service market in 2004, and acquired a significant market share for IDD services by the end of 2006. Indosat, one of our primary competitors, entered this market prior to us and continues to maintain a substantial market share for IDD services.Bakrie Telecom was awarded an IDD license in 2009 to provide international long distance service using the “009” access code, although Bakrie Telecom has not yet obtained an IDD operating license. There is a possibility that other operators will be granted IDD licenses in the future. The operations of incumbents and the entrance of new operators into the international long-distance market, including the VoIP services provided by such operators, continue to pose a significant competitive threat to us. We cannot assure you that such adverse effects will not continue or that such increased competition will not continue to erode our market share or adversely affect our fixed telecommunications services operating margins and results of operations.
We face risks related to the opening of new long distance access codes
In an attempt to liberalize DLD services, the Government issued regulations assigning each provider of DLD services a three-digit access code to be dialed by customers making DLD calls. In 2005, the MoCI announced that three-digit access codes for DLD calls will be implemented gradually within five years and that it would assign us the “017” DLD access code for five major cities, including Jakarta, and allow us to progressively extend it to all other area codes. Indosat was assigned “011” as its DLD access code. We were required to open DLD access codes in all remaining areas on September 27, 2011, by which date our network was ready to be opened up to the three-digit DLD access codes in all coded areas throughout Indonesia.
However, we believe that the cost for operators who have not upgraded their network infrastructure to open their networks to the three-digit access codes to do so is significant. To date, neither of the OLOs have made a request to us to connect their networks to enable their DLD access codes to be accessible, other than with respect to Balikpapan, and as such, we believe that except with respect to Balikpapan, none of the DLD access codes for any of the licensed operators areusable by customers of other operators. However, if they do so in the future, the implementation of any new DLD access codes can potentially increase competition by offering our subscribers more options for DLD services. In addition, the opening of new DLD access codes is expected to result in increased competition and less cooperation among industry incumbents, which may result in reduced margins and revenues, among other things, all of which may have a material adverse effect on us.
New regulations for the configuration of BTS towers may delay the set up of new BTS towers or changes in the placement of existing towers, and may erode our leadership position by requiring us to share our towers with our competitors
In 2008 and 2009, the Government issued regulations relating to the construction, utilization and sharing of BTS towers. Pursuant to the regulations, the construction of BTS towers requires permits from the local government. The local government has a right to determine the placement of the towers, the location in which the towers can be constructed, and also to determine a license fees to build tower infrastructure. These regulations also obligate us to allow other telecommunication operators to lease space and utilize our telecommunications towers without any discrimination.
These regulations may adversely affect in the allocation, development or expansion plan of our new BTS towers as setting up of our new towers will become more complicated. They may also adversely affect our existing BTS towers if local governments required any changes in the placement of the existing towers.
The requirement that we share space on our cellular (Telkomsel) towers and our fixed wireless (Telkom Flexi) towers may also disadvantage us by requiring that we allow our competitors to expand quickly, particularly in urban areas where new space for additional towers may be difficult to obtain.
Effective 2011, local Governments are permitted to assess fees of up to 2.0% of the tax assessed value of towers. Although we do not expect the amount of these fees to be material in 2012, there can be no assurance that they will not be substantial in the future.
Competition Risks Related to Our Fixed Telecommunication Business
We may further lose wireline telephone subscribers and revenues derived from our wireline voice services may continue to decline, which may materially adversely affect our results of operations, financial condition and prospects
We continued to lose wireline telephone subscribers and revenues derived from our wireline voice services continued to decline during the past several years mainly due to the increasing popularity of mobile voice services and other alternative means of communication, such as VoIP. Tariffs for mobile services have declined in recent years which has further accelerated substitution of mobile for wireline voice services. The number of our fixed wireline subscribersincreased by 3.6% at the end of 2011 compared to that at the end of 2010 and increased by 4.0% at the end of 2012. Revenues from our wireline voice services decreased by 6.5% in 2011 compared to that in 2010 and decreased by 8.2% in 2012. The percentage of revenues derived from our wireline voice services out of our total revenues continued to decrease, from 14.4% in 2011 to 12.2% in 2012.
- 22 -
We have been taking various measures in order to mitigate the impact of loss of our wireline telephone subscribers and stabilize our revenues from wireline voice services. However, we cannot assure you that we will be successful in mitigating the adverse impact of the substitution of mobile voice services and other alternative means of communication for wireline voice services or in reducing the rate of decline in our revenues generated from wireline voice services. Migration from wireline voice services to mobile services and other alternative means of communication may further intensify in the future, which may affect the financial performance of our wireline voice services and thus materially and adversely affect our results of operations, financial condition and prospects as a whole.
Our fixed wireless business is subject to intense competition
Our fixed wireless telephone business faces competition from an increasing number of operators, including Bakrie Telecom and Indosat, as well as mobile cellular services, SMS, VoIP services and e-mail.
Competition in the cellular and fixed wireless markets has remained intense, with each operator launching increasingly attractive and creative marketing programs. The lower average tariffs due to intense competition in the cellular market has in part lead to declining ARPU for Telkom Flexi, with blended monthly prepaid and postpaid ARPU decreasing from approximately Rp15,000 in 2010, Rp9,500 in 2011, and Rp8,700 in 2012. In addition, while fixed wireless tariffs were previously generally lower than GSM mobile cellular tariffs, in part due to regulatory changes in December 2010 in how right-of-use fees are calculated, tariff differences between fixed wireless services and GSM mobile cellular services are now generally negligible. As a result, our fixed wireless revenue tend to decline, from Rp1,342 billion as of December 31, 2011 and Rp1,225 billion as of December 31, 2012.
We have been taking various measures in order to mitigate the impact of intense competition in our fixed wireless business and the limited capacity of bandwidth. However, we cannot assure you that we will be successful in mitigating the adverse impact. Competition may further intensify in the future, which may affect the financial performance of our fixed wireless services and thus materially and adversely affect our results of operations, financial condition and prospects as a whole.
Our data and internet services are facing increasing competition, and we may experience declining margins from such services as such competitionintensifies
Our data and internet services are facing increase competition from other data and internet operators as well as mobile operators.
Wireless broadband access operators (such as PT Link Net or "First Media") that received licenses in 2009 for Wi-Max technology began to establish their businesses in the fourth quarter of 2010. Other wireless broadband operators established their businessesin 2012. The increased number of operators will adversely affect our market share and revenues from our Speedy broadband service.
The number of broadband mobile subscribers have increased with the Blackberry’s popularity. The increasing use of mobile broadband services also adversely affects our market share and revenues from our fixed data and internet services.
We have been taking various measures in order to mitigate the impact of intense competition in our data and internet businesses. However, we cannot assure you that we will be successful in mitigating such adverse impact. Competition may further intensify in the future, which may affect the financial performance of our data and internet services and thus materially and adversely affect our results of operations, financial condition and prospects as a whole.
Competition Risks Related to Our Cellular Business (Telkomsel)
Competition from existing service providers and new market entrants may adversely affect our cellular services business
The Indonesian cellular services business is highly competitive. Competition among cellular services providers in Indonesia is based on various factors, including pricing, network quality and coverage, the range of services, features offered and customer service. Our cellular services business, operated through our majority-owned subsidiary, Telkomsel,competes primarily against Indosat and XL. Several other smaller GSM and CDMA operators also provide cellular services in Indonesia, including PT Hutchison CP Telecommunications (“Hutchison”), PT Natrindo Telepon Seluler (“Natrindo” or “AXIS”), Smart Telecom and Bakrie Telecom. In addition to current cellular service providers, the MoCI may license additional cellular service providers in the future, and such new entrants may compete with us.
- 23 -
We believe that competition in the cellular services business will intensify further. New and existing cellular services providers may offer more attractive product and service packages or new technologies or the convergence of varioustelecommunications services, resulting in higher churn rates, lower ARPU or a reduction of, or slower growth in, our cellular subscriber base.
The competitive landscape in the cellular services business may also be affected by industry consolidation. In March 2010, Smart Telecom and Mobile-8 announced that they had entered into a cooperation agreement to use the same logo and brand under the name “Smartfren”. On January 18, 2011, Mobile-8 acquired a significant number of shares in Smart Telecom, and on April 12, 2011 PT Mobile-8 Telecom, Tbk. changed its name to PT Smartfren Telecom, Tbk., Other cellular service providers may similarly consolidate in the future.
Competition from providers of new technology, together with new entrants, incumbents, and consolidated providers could adversely affect our competitive position, cellular services business, financial condition, results of operations and prospects.
ITEM 4.INFORMATION ON THE COMPANY
A. HISTORY AND DEVELOPMENT OF THE COMPANY
We are a limited liability company incorporated under the laws of Indonesia and domiciled in Bandung. We trade under the commercial name “Telkom”. We were converted from a state agency to a State-Owned Enterprise on September 24, 1991 and obtained status as a legal entity on November 19, 1991 for an indefinite period of time. Our registered office is located at Jl. Japati No.1, Bandung 40133, Indonesia, and our telephone number is +(62) (21) 521 5109. Our agent for service of process in the United States with respect to our ADSs is Puglisi & Associate at 850 Library Avenue, Suite 204, Newark, DE, 19711. Our corporate website may be accessed at www.telkom.co.id. The information found on our corporate website does not form part of this Form 20-F and is not incorporated by reference herein. Information about the legislation under which we operate is provided elsewhere in this Form 20-F.A description, including the amount invested, of our principal capital expenditures and divestitures (including interests in other companies), since the beginning of our last three financial years and information concerning our principal capital expenditures is contained elsewhere in this Form 20-F.
A description of our principal capital expenditures and divestitures, since the beginning of the last three financial years to the date of this Annual Report is set forth in Item 5 “Operating and Financial Review and Prospects – Liquidity and Capital Resources – Capital Expenditures”. Information concerning our principal capital expenditures and divestitures currently in progress is also described in Item 5 “Operating and Financial Review and Prospects – Liquidity and Capital Resource – Capital Expenditures”.
Other than information described above, on September 21, 2012, based on notarial deed No. 11 dated September 21, 2012 of N.M. Dipo Nusantara Pua Upa, S.H., MKn. which was approved by the Minister of Law and Human Rights pursuant to Letter No. AHU-50211.AH.01.01/2012 dated September 26, 2012, TelkomMetra, our subsidiary, established a company with Pelindo II, our related party, called PT Integrasi Logistik Cipta Solusi (“ILCS”) in which TelkomMetra has 49% ownership. The amount invested was Rp49 billion.
We are a State-Owned Enterprise that operates in the telecommunications and network services sector in Indonesia. Our history and certain information required by Item 4 of Form 20-F is contained in the chart, below.
A Brief History of Telkom
1856-1882 | | 1906-1965 | | 1974 | | 1980 |
On October 23, 1856, the Dutch colonial government deployed the first electromagnetic telegraph in Indonesia, connecting Batavia (Jakarta) with Buitenzorg (Bogor). | | The Dutch colonial government established a government agency to operate post and telecommunications services in Indonesia. In 1965, the post and telecommunications services were separated and brought under the control of two state companies, PN Pos and Giro and PN Telekomunikasi. | | PN Telekomunikasi was split into two divisions, PT Industri Telekomunikasi Indonesia (“PT INTI”), which manufactured telecommunications equipment, and Perusahaan Umum Telekomunikasi (“Perumtel”), which supplied domestic and international telecommunication services. | | The international telecommunication business was taken over by Indosat. |
- 24 -
1991 | | 1995 | | 1999 | | 2001 |
PERUMTEL became PT Telekomunikasi Indonesia or Telkom, and operations were organized into twelve regional units (“Witel”). These were later reorganized into seven regional divisions: Division I Sumatra, Division II Jakarta and Surrounding Area, Division III West Java, Division IV Central Java and DI Yogyakarta, Division V East Java, Division VI Kalimantan and Division VII Eastern Indonesia. | | We held our Initial Public Offering on November 14, 1995 on the Jakarta Stock Exchange and the Surabaya Stock Exchange. On May 26, 1995, we established Telkomsel, our cellular business subsidiary. | | The Telecommunications Law (Law No. 36/1999), which went into effect in September 2000, facilitated the entry of new players, intensifying the competition in the telecommunications industry. | | We acquired Indosat’s 35% shareholdings in Telkomsel, making us the majority shareholder with a stake of 77.7%. Indosat then took over our 22.5% shareholding in Satelindo and 37.7% share in PT Aplikanusa Lintasarta. At the same time, we lost our exclusive right to be the sole fixed line telephone operator in Indonesia. |
2002 | | 2004 | | 2005 | | 2009 |
We divested 12.7% of our shares in Telkomsel to Singapore Telecom Mobile Pte Ltd. (“SingTel Mobile”). | | We launched our international direct dial fixed line service. | | The Telkom-2 Satellite was launched to replace all satellite transmission services previously provided by the Palapa B-4 satellite. This brought our total number of satellites launched to eight, including the Palapa A-1 satellite. | | We underwent a transformation from an infocom to a TIME company. The new Telkom was introduced to the public with the new corporate logo and tagline, ‘the world in your hand’. |
2010 | | 2011 | | 2012 | | |
The JaKaLaDeMa submarine and fiber optic cable project linking Java, Kalimantan, Sulawesi, Denpasar and Mataram was successfully completed in April 2010. | | We commenced the reform of our telecommunications infrastructure through the Telkom Nusantara Super Highway project, which unites the Indonesian archipelago from Sumatra to Papua, and the True Broadband Access project, which will enable customers all over Indonesia to have broadband access to the internet. | | We sought to achieve widespread broadband penetration throughout Indonesia through the implementation of the Indonesia WiFi program towards the development of Indonesia Digital Network. We sought to improve business value creation by reconfiguring our business portfolios from TIME to TIMES (Telecommunications, Information, Media, Edutainment & Services). Establishment of Telkom Corporate University to develop a globally competitive human capital ('from competence to commerce'). | | |
B. BUSINESS OVERVIEW
We are a State-Owned Enterprise and currently the largest telecommunication service and network provider in Indonesia.We serve millions of customers throughout Indonesia with a complete range of telecommunications services that include fixed line and fixed wireless telephone connections, mobilecellularcommunications, network and interconnection services, as well as internet and data communication services.We also provide services in information, media and edutainment, including cloud-based and server-based managed services, e-Payment and IT enabler services, Pay-TV, as well as e-Commerce and other portal services.We posted revenues of Rp71,238 billion and Rp77,127 billion, respectively, for the years ended December 31, 2011 and 2012.
Fixed line telephone services include local, direct long-distance (“DLD”), and international call services, as well as other telecommunications and supporting services. Fixed wireless servicesinclude local and direct long-distance CDMA-based telephone connections, andcellularservices comprisemobile cellular telecommunication services. In 2012, except for OLOs who use our interconnection services and Telkomsel’s employee cooperative (“Kisel”), none ofour customersaccounted for more than1% ofour total revenues. Our telecommunications-related business may experience certain seasonal effects. Mobile cellular and fixed wireless communications tend to increase around the Ramadhan lunar month and the culmination of theEid festivity, as well as during the December holiday season, whilefixed line communications from homes and offices may decrease when there are fewer working days in the period or a greater number of subscribers are on vacation.
- 25 -
A substantial majority of ourrevenue hasand continuesto come from telecommunications-related services, including data and internet services. As a company that provides Telecommunications, Information, Media, Edutainment and Service (“TIMES”), we continue to encourage innovations in sectors other than telecommunications, and capture synergies among all ofour products, services and solutions ranging from our legacy business to the New Economy Business.Our business portfolio is grouped into the following lines of business:
A. Telecommunications BusinessOur telecommunications business portfolio includes (i) fixed wireline services, (ii) fixed wireless services, (iii) cellular services, (iv) internet and data communication services, (v) network services, (vi) interconnection services, and (vii) ancillary services.
1. Fixed Wireline Services
Our fixed wireline services include plain old telephone services, value-added services, Intelligent Network services and session initiation protocol services. Intelligent Network servicesareIP-based network services thatare connected to our exchange systems and telecommunications network. Session initiation protocol servicesare IP multimedia subsystem (“IMS”)serviceswhich combines wireless and fixed line technologies for voice and data communications.
We succeeded in improving the performance of our fixed wireline business line in 2012 bycontinuing a number of programs, such as“Telkom Poin Rejeki Tumpah”, a point reward program, and our fixed business improvement program.
As of December 31, 2012, we served8.9 million subscribers that represented 100.0% of the total fixed wireline market penetration in Indonesia of 4.0%.
2. Fixed Wireless Services
This service is managed by ourWireless Broadband Division under the trademarks“Telkom Flexi” or“Flexi” and uses limited-mobility CDMA technology.
We have periodically launched a range of fixed wireless telephone products and services that are supported by promotional campaigns. Competition inthis segment has remained intense.This was in part caused by a change in the regulation relating to the calculation of right-of-use tariffs in December 2010, which significantly narrowed the gap between GSM mobile cellular and fixed wireless telephone tariffs. As a result, our fixed wireless subscriber baseexperienced a decline in 2011.However, in 2012, we succeeded in increasing our subscriber base again in part through the expansion of our EVDO services.See “Network Infrastructure – A.Fixed Line Network and Transmission-Fixed Wireless Network”.
We willseekto further improve ourFlexi in the futureandtomaintain ourmarket leadership position inthefixed wireless telephone business.Weintendto achieve thisobjective through a variety of initiatives that includerealizing better synergies withour other lines of products and services with Wireless Broadband Division as manager ofourfixed wireless telephone business, andthe launch ofWiFi products as a complement to Flexi’s telephone business.
3. Cellular Services
We provide mobile communications services using GSM technology and 3.5G frequency throughour subsidiary, Telkomsel. Cellularvoiceservices(which excludes mobile data services),remained the largest contributor to our consolidated revenues in 2012.
We have two types of mobile products and services: postpaid services represented by“kartuHalo” and prepaid services represented by “simPATI” and“Kartu As”.
- KartuHalo is still the most widely used postpaid mobile communication service sinceits introduction in 1995.Atthe end of 2012 the number ofkartuHalosubscribers reached2.1 million,accountingforapproximately 53.4% of the total number of postpaid cellular subscribers in Indonesia;
- simPATIis a prepaidservice that can be purchased at any cellular shop in the form of starter packs and top up vouchers with advanced and complete features offering affordable rate at off-peak prices; and
- Kartu As is Telkomsel’s most recent prepaid service innovation that bills customers based on seconds of talk time. Kartu As targets the young customer segment.
In 2012,we executed a number ofmarketing programsfor cellular servicesto promote salesand enhancing the awareness for Telkomsel’s brands. We believe Telkomsel’s promotional programs havesucceeded strengthening our mobile cellular businessin Indonesia. Our mobile cellularbase increasedfrom107.0 millionsubscribers at the end of 2011 to125.1millionby the end of 2012, a growth of 16.9% or18.1million subscribers.
- 26 -
4. Internetand Data CommunicationServices
We provide a range of products and services in data communication andinternet services as described below:
- Broadband internet the commercialname forour non-cellular based broadband internetserviceis “Speedy”;
- Cellular data communication Telkomsel provides internet and mobile data communications services through its mobile cellular network, with the commercial name “Flash”;
- SMS services for mobile and fixed wireless telephone subscribers;
- “TelkomNet instan” isdial-up internetaccess services;
- WiFi/hotspot is a wireless access solution forintranet and mobileinternetdata services in a particular area by utilizingour and other ISP’s payment facilities, or in bulk using Customer Premises Equipment-based WiFi technology. In 2012,we launched“Indonesia WiFi” to meet the need for WiFi based Internet service at public places such as airports, shopping malls, hospitals, universities/schools, cafes, and other public places, with a target of up to 1 million access pointsby the end of 2013. Indonesia WiFi service was launched with a minimum speed of 10 Mbps speed to accommodate roaming, offloading, retail and others;
- “FlexiNet” is our internet access service that usestheTelkom Flexi fixedwirelessnetwork. In 2011,we introducedour “Flexi Hotspot” service to customers who wish to enjoy high speed internet access through a wireless internet connection that is supported byourTelkom Hotspot infrastructure. These services can be easily accessed from any device that has WiFicapability bytheFlexiNet Unlimited or Flexi Mobile Broadband username and the password in eachhotspot;
- Virtual Private Network (“VPN”) is a private network that uses media such as the internet for secure connection to remote sites;
- “ASTINet” provides internet accessthrough a default internet gateway andourpublic IP address for fixed or dedicated lines for 24 hours a day;
- Voice over Internet Protocol (“VoIP”).We provide affordable international call services throughour premiumVoIPservice package “TelkomGlobal-01017” as well as“TelkomSave” for regular international calls. Both services can be accessed by dialing a special prefix for international calls. To provide these services,we cooperate with eight international wholesale carriers that letus access their global networks.We have cooperation agreements withfour of those carriers for outgoing calls, one carrier for incoming calls, andthree carriers for both outgoing and incoming calls. During 2012,werecorded3.6million minutes of outgoing calls (using TelkomGlobal-01017 and Telkom Save services) and VoIP incoming calls (fromour global partners). These figures indicate an increase of580,000 minutes, or19.3% in VoIP calls compared to 2011;
- ISDN PRA is a digital network to facilitate multimedia telecommunications services, using wider bandwidth as well as inter-terminal digital systems to accommodate high-speed, high-quality and high-capacity voice, data and video communications through a single channel. We also provide ISDN-based internet access;
- DINAccess is a wireless communications service with dedicated access to provide LAN interconnection services and multimedia services at a speed adjustable to customer needs;
- Global Datacom is a data communications service that lets corporate customers connect their headquarters with branch offices or clients across the globe. We work with global partners through Telin, our subsidiary, in providing these services;
- Metro Link is a Metro-network-based connectivity services that accommodates point-to-point, point-to-multipoint and multipoint-to-multipoint communications;
- Metro I-netis a high capacity data network solution based on IP (Internet Protocol) or ethernet that provides flexibility, ease of use and effectiveness as well as quality assurance for corporate and SME customers;
- Port Wholesale port provides wholesale rental of port remote access servers to internet service providers and content service providers and corporate customers for subsequent sale to their customers; and
- Value-added service Datacom provides additional facilities that offer added value to data communications customers.
5. Network Services
We directly managethe provision of network servicesto customers comprising ofour business partners,commercial businesses and OLOs.Our network services include satellite transponder leasing, satellite broadcasting, VSAT, audio distribution, as well as satellite-based and terrestrial-based leased lines.Our network services customersmay enter into short-term dealsfor several minutes ofbroadcastingto longer-term agreements forone to five year periods.
- 27 -
6. Interconnection Services
We also earn revenue from other telecommunications operatorsthat utilize our extensive network infrastructure in Indonesia, both for calls that end at or transit viaournetwork.Similarly,we also pay interconnection fees to other telecommunications operators whenwe use their networks to connect a call fromour customers.
7. Ancillary Services
We have exclusive agreements with some investors underrevenuesharingarrangements to expand fixed line phone services, public card phones, data andinternet networks, and ancillary facilities related to telecommunications.
For more details about the scheme of additional services, please see Note 36 in the Consolidated Financial Statements of the Company.
We alsooperate other supporting and ancilliary businesses, which include the lease and/or supply of BTSsto other cellular operators and the provision of various support facilities. We manage our telecommunications tower business through our subsidiary, Mitratel.
B. New Economy Business (“NEB”) and Strategic Business Opportunities Portfolio
NEB and Strategic Business Opportunities are a part ofour IME portfolio.We have designated our subsidiary,TelkomMetra,as a sub-holding company that focusses onour IME business development.
Our NEBand Strategic Business Opportunitiesportfolio includes:
1. IT Outsourcing or Managed Applicationwhich provides cloud-based and server-based management services and IT consulting services.
2. e-Payment/Payment services,including the following:
- Billing paymentis a service that allows customers to make payments to service or goods providers such as PT PLN (Persero), Telkom, PDAM, PT KAI, and others through collecting agents that include banks, cooperatives, BPR, convenience stores, and others;
- Remittance is money transfer service where neither the money sender nor the recipient need a bank account to complete a transfer, as transfers can be accomplished usingonly a mobile device;
- e-money provides services to customers who wish tomanage money electronically through certain media (mobile, prepaid card, or a virtual account that can be accessed via the Internet) for use in electronic transactions; and
- e-Vouchers or Telkom Voucher is a voucher issued by us that can be used to purchase or recharge any of our services, such as for Kartu As,simPATI, Flexi Trendy, prepaid TelkomVision services and Speedy Hotspot.
3. IT enablerservicesinclude business process outsourcing and knowledge process outsourcing, which consist of:
- Network centric value added services,which include IT-based value-added services for data and phone, security services, and server and storage services for connectivity customers; and
- Integration services, which include integration services for network and hardware associated with CPE, integration services for applications and software, and integration services for computer hardware.
OurMedia and Edutainment business portfolio includes the following:
1. Pay TV is a pay TV service (package or a la carte) available via satellite, cableor IPTVwith premium content such as news, sports, entertainment and others.These services are managed byour subsidiary, PT Indonusa Telemedia, under the “Telkom Vision” brand. Our IPTV commercial service was rolled out in August 2011 with the trademark “Groovia TV” and is currently available in all regions included inourbroadcasting license, which areJabodetabek, Bali, Bandung, Semarang and Surabaya. We had 1.2 million Pay TVsubscribersas of December 31, 2012.
2. UseeTV is anover thetoptelevision service that can be accessed through the Internet.
3. Advertising is a commercial service for products or services of any third party that are presented in digital or print media for promotional purposes, such as newspapers, brochures and billboards.
4. Service Portalfacilitates content aggregation and distribution and e-Commerce. In addition to sales and payments related toour products and services conducted throughour e-Commerce portal,our portal e-store and on-device portal services also accommodate the sale and distribution of content or applications such as games, applications, news, sports news, educational content, music, ring back tones, SMS contentand others, which can be downloaded directly by customer mobile device orinternetusers. Content or applications can be obtained either at a certain priceor free of charge.
Network Infrastructure
To transform our infrastructure into high quality, efficient and cost competitive infrastructure to deliver our TIMES services, we have been developing and improving our network infrastructure towards what we previously termed theTelkom One network, which is intended to be a jointly developed network used by our various units, particularly Telkomsel. We continue to develop our network infrastructure to offer a more efficient and cost-competitiveinfrastructure in line withour transformation into a TIMES provider under our Indonesia Digital Network ("IDN") program, which, among other things, aims by 2013 to reach 15 million homepass nationwide capable of accessing fixed line voice, IPTV, and broadband services. Our IDN program, which began in 2012, is also intended to support the establishmentofthe National Broadband Network, which is part of the Government’sTelecommunicationMaster Plan for the Acceleration and Expansion of Indonesia's Economic Development.
- 28 -
OurIDNprogram involves thefollowing three program developments:
1. id-Access:development of ourcustomer access network infrastructure into ahigh speedbroadband access throughfiber optic and WiFi networks.
2. id-Ring:development of ourtransport network infrastructure into an IP-based andoptical backbone network.
3. id-Convergence (“id-Con”):convergence of thenode service network infrastructure into a multi-service and multi-screenintegrated NGN.
Thedevelopment oftheIDN involves synergiesthroughout our Group, covering all layers of our network infrastructures. In 2012,as a part of our IDN program, wecompleteddeveloping and commencedoperation of (i)fiber to the home and WiFi-basedhigh speed andoptical access network, (ii)terra router andfiber optic-based IP andoptical backbone networks that coverIndonesia’s entire id-Ring; and (iii)an IMS-based convergence service platform and multi-services forourid-Con initiative.We plan to continue developing ourIDN infrastructure, to reach by 2013 a capacity of 15 millionhomepass,1 millionWiFiaccess points, 24terra router andeight IMS nodes supported by 75 kilometers of fiber optic cable network.
A. Fixed Line Network andTransmission
1. Fixed Wireline Network
As of December 31, 2012, we managed 8.9 million fixed wireline connections. However, under ournetwork and infrastructure master plan, we aim to upgrade our legacy network to an NGN which supports new wave services and network operation methods by 2014. Weare in the process of upgrading all of our network infrastructures to IP infrastructure.
The following table shows data related to ourfixed wireline network from 2008 to 2012:
| | As of and for the years ended December 31, |
Operating Statistics | | 2008 | | 2009 | | 2010 | | 2011 | | 2012 |
Exchange capacity | | 11,038,818 | | 11,094,063 | | 11,237,229 | | 12,180,214 | | 13,908,003 |
Installed lines | | 9,838,537 | | 10,013,565 | | 10,510,048 | | 11,005,208 | | 11,109,156 |
Lines in service(1) | | 8,629,783 | | 8,376,793 | | 8,302,818 | | 8,688,526 | | 9,034,010 |
Subscriber lines | | 8,302,730 | | 8,038,294 | | 7,980,337 | | 8,323,175 | | 8,672,332 |
Public telephones | | 327,053 | | 338,499 | | 322,481 | | 278,505 | | 273,929 |
Leased lines in service(2) | | 6,084 | | 4,273 | | 3,988 | | 3,662 | | 3,342 |
Fixed wireline subscriber pulse production (millions minutes)(3) | | 62,940 | (5) | 54,186 | (5) | 9,403 | | 8,054 | | 6,770 |
Fault rate(4) | | 3.5 | | 3.1 | | 2.5 | | 2.2 | | 2.7 |
(1) Lines in service are subscriber lines and public telephone lines, including the lines in service that we operate under revenue-sharing arrangements. |
(2) Excludes leased lines for our network and multimedia businesses. |
(3) Consists of pulses generated by local and domestic long-distance calls, excluding calls from public pay phones and cellular phones. |
(4) Faults per 100 connected lines per month. |
(5) In millions of pulsefor year2009and2008. |
2. Fixed Wireless Network
To support our fixed wireless network, our infrastructure consists of mobile switching centers (“MSC”) that are connected to every other trunk exchange. Each MSC is connected to a base station sub system (“BSS”), which consists of a base station controller (“BSC”) and a base transceiver station (“BTS”). These, in turn, connect the customers’ handheld devices and fixed wireless terminals to our fixed wireless network. The number of fixed wireless connections in service hasincreased from 14.2 million in 2011to approximately 17.9 million in 2012.
- 29 -
The following table shows data relating to our fixed wireless network since 2008:
| | As and for the Year Ended December 31, |
| | 2008 | | 2009 | | 2010 | | 2011 | | 2012 |
Exchange capacity (MSC capacity)(1) | | 15,885,020 | | 23,393,631 | | 24,048,993 | | 33,261,850 | | 32,262,120 |
Installed lines (BTS capacity)(1) | | 19,861,324 | | 27,653,553 | | 27,344,151 | | 27,635,751 | | 27,631,751 |
Lines in service(2) | | 12,725,425 | | 15,139,057 | | 18,161,278 | | 14,237,522 | | 17,869,591 |
Subscriber lines | | 12,698,827 | | 15,115,892 | | 18,142,955 | | 14,221,413 | | 17,868,991 |
Public telephones | | 26,598 | | 23,165 | | 18,323 | | 16,109 | | 600 |
Fixed wireless subscriber pulse production/minutes production (millions)(3) | | 12,304 | | 14,627 | | 11,768 | | 7,931 | | 5,667 |
(1) BTS and MSC capacities in 2008 were calculated on the assumption of a traffic allocation per subscriber of 30 mE. |
(2) Lines in service are subscriber lines and public telephone lines, including the lines in service that we operate under revenue-sharing arrangements. |
(3) Consists of minutes of usage from local and DLD calls, excluding calls made from public pay phones and mobile cellular phones. |
3. Transmission Network
Throughout 2012,we primarilyfocused onthe development ofour broadband network, which serves as the backbone for our network infrastructure as a whole. Our backbone telecommunications network consists of transmission networks, remote switching facilities and core routers, which connect a numberofaccess nodes. The transmission links between nodes and switching facilities comprisea terrestrial transmission network,in particular fiber optic, microwave and submarine cable networks, as well as satellite transmission networks and other transmissiontechnologies.
The following table shows our transmission capacity as of December 31, 2011 and 2012:
| | Capacity (number of Transmission medium circuits) |
Transmission Network | | E1 | | STM-1 | | STM-4 | | STM-16 | | STM-64 | | STM-256 |
As of December 31, | | | | | | | | | | | | |
2011 | | 132,691 | | 671 | | 65 | | 35 | | 184 | | - |
2012 | | 131,546 | | 720 | | 92 | | 55 | | 260 | | 3 |
Note: The backbone transmission unit uses E1, STM1 (equivalent to 63 E1), STM4 (equivalent to 4 STM1), STM16 (equivalent to 4 STM4), STM64 (equivalent to 4 STM16), and STM256 (equivalent to 4 STM64). STM or Synchronous Transfer Mode is the unit typically used in backbone transmission networks. Facilitating broadband services requires high capacity transmission networks using nxSTM-1 units. E1 units are used to support legacy services. |
We operate the Telkom-1 and Telkom-2 satellites as well as 205 earth stations, including one satellite master control station. The Telkom-1 satellite has 36 transponders, including 12 extended C-band transponders and 24 standard C-band transponders, whiletheTelkom-2 satellite has 24 standard C-band transponders.
In addition to the two satellites currently in service,wealso lease transponder capacity from other satellite providers, including 11 transponders fromtheGE 23 satellite, two transpondersfrom the Star-1 satellite, two transpondersfrom the Sinosat satellite, and 10 transpondersfrom the JCSaT5a satellite.
In anticipation of the growth in demands for satellite services as well as in support of our business strategy in the provision of TIMES services, on March 2, 2009, we signed a contract with the Russia-basedcompany, JSCAcademician M.F. Reshetnev Information Satellite Systems, for the procurement ofthe Telkom-3Satellite System.Our Telkom-3satellite suffered a launch failure in August 2012 and is now in unusable orbit. Although we had fully insured the cost of the satellite, the loss of the Telkom-3 satellite will require us to lease transponder capacity from a third-party provider tofulfill our commitments to our satellite operations customers and for our own operations.
B. Cellular Network
Our cellular services, which are operated by our subsidiary, Telkomsel, have the most extensive network coverage of any cellular operators in Indonesia.Telkomsel currently operates on the GSM/DCS, GPRS, EDGE and 3.5G networks. The GSM/DCS network consists of 7.5 MHz of bandwidth on the 900 MHz frequency and 22.5 MHz of bandwidth on the 1,800 MHz frequency. Both networks operate as a single integrated dual band network. Telkomsel’s 3G network uses 10 MHz of bandwidth on the 2.1 GHz frequency.
As of December 31, 2012, Telkomsel’s digital network was supported by 54,297 BTS with an overall network capacity capable of facilitating the communication needs of125.1million customers.
- 30 -
C. Data and Internet Network
To ensure a high level of reliability,we have built hierarchical and dual homing IP/MPLS-basedinternet and data networks.Our IP backbone networkwhich, as of December 31, 2012 consisted of 47 PoP locations with22 terra router nodes, 18 core router nodesand545 PErouter nodes is now capable of serving all of Indonesia.
We also operate anethernet carrier metro service as anaggregator for broadband access traffic connecting to IP Backbone. As of December 31, 2012,1,004 ethernet metro nodeswere in use to supportour 1,536Gbps broadband access services.
We provide fixed line-based broadband internet access using ADSL and fiber optic technology under the brand “Speedy”. As of December 31, 2012,we had capacity for4.7 million homepassand were serving 2.3 million Speedy customers, an increase of 30.9% compared to 1.8 million subscribers registered on December 31, 2011.
Oursubsidiary,Telkomsel, also provides broadband service under the trade name “Flash”. Asof December 31, 2012, Flash had 11.0 million subscribers, a 99.5% increase compared to 5.5 million subscribers registered on December 31, 2011.
D. International Networks
We operate international gateways in Batam, Jakarta, and Surabaya toroute outgoing and incoming calls on our IDD service (“007”). We believe these gateways provide reliable links to domestic networks and we have noplans tofurtherdevelop them at present.
Our international network is supported by submarine communications cable systems (“SCCS”)including the Dumai-Melaka Cable System, and the Thailand-Indonesia-Singapore (“TIS”) system,as well as by indefeasible rights of use,and satellitecapacity.To consolidate our international network and expand domestic broadband services, our subsidiary, Telin, entered into the Asia America Gateway cable consortium inApril 2007 to develop the Batam-Singapore Cable Systemwhich connects Batam with Singapore.Through Telin, we plan in the long-term to enhanceinternationaltelecommunicationaccess toregions in eastern Indonesia, diversify our services and capturebusiness opportunities in South Asia, the Middle East and Europe.
Furthermore,we have entered into international telecommunications service agreements witha number of overseas operators to facilitate international call interconnections. Moreover, since we do not have agreements with telecommunications operators in all our IDD destinations, we have signed agreements with SingTel, Telekom Malaysia, Verizon, Belgacom, NTT, TIS, France Telecom and other telecommunications operators under whichsuch operators act as hubs and routeinternational calls to certain parts of the world. As of December 31, 2012, we had agreements with 78 international telecommunication service operators in 27 countries. We havefocused on entering into more international telecommunications service agreements with other telecommunication operators to provide direct interconnections services in the top 20 most popular calling destinations for IDD outgoing traffic. In addition to connect with the 20 top countries for IDD outgoing calls,we are also connected to 58 other telecommunications operators in various other countries.
Customer Service
We provideour customersa number of value-added services which allow them to conveniently access a wide range ofourproducts and services.
A. Personal Customer Segment
In order to facilitate our individual customers' access to our products and services, we operate a network of Plasa Telkom outlets and Call Centers which are managed by ourConsumer Service Division.
1. Plasa Telkom
Plasa Telkom is a walk-in customer service point at which customers can access information as well as a range of products and services, including billing, payment, account suspension, promotional deals andsubmitcomplaints. In 2012, as part of our cost optimization program, we reduced the number of Plasa Telkom from 727 outlets as of December 31, 2011 to 572 outlets as of December 31, 2012. All Plasa Telkom facilities have been redesigned to provide better service quality, including to accommodate other services withinour Group and thus to increase overall productivity. We are developing, and will shortly launch, the Telkom Store facility in order to improve service coverage to our customers and to compensate for the reduction in Plasa Telkom outlets.
2. Call Centers
Ourcall centers allowcustomers tomake enquiries regarding our products and services, billing, promotional offers and submit complaints from our Call Centers by dialing "147" from any fixed phone line.We operate call centers in Medan, Jakarta and Surabaya.
- 31 -
For cellular subscribers, Telkomsel operatescall centers under the brand “Caroline” which is the abbreviation of “Customer CareOnline”. Caroline isaccessible through the following numbers:
– “133” by kartuHalousers;
– “155” (24 hours, free) and “188” (24 hours, chargeable) by simPATI and Kartu As users; and
– “021-21899811” in Jakarta, “022-2553811” in Bandung, “031-8403811” in Surabaya, “061-4578811” in Medan or “08071811811” in other areas of Indonesia, when accessed through cell phones not operated by us or through fixed telephone lines.
B. Corporate Customers
We categorize our corporate customers intobusiness, enterprise, wholesale and international groups based on a numbers of criteria such as contribution to our revenues, our customers' geographic scope of operations and the type and range of products and services procured from us. As part of our strategy to providestreamlined customer service, we operate account management teams to manage our relationships with our corporate clientswho are supported by the Telkom Solution House, SME Centers and Call Centers, as described below.
1. Account Management
Our Business Service Division caters to business customers, which includeSMEs, local governments, cooperatives, and rural credit banks. Our Business Service Division accounts managers and representatives manage customers directly by conducting site visits and telephonically through our account management call center team.We categorized business customers into three groups based on our customer’s line of business: public and general services, plantation and manufacturing services, and trading and business services.
Our Enterprise Service Division serves enterprise customers including State-Owned Enterprises, national corporations and multinational corporations. Our Enterprise Service Division account managers and respresentatives primarily manage relationships by conducting visits to our clients' offices.We categorize enterprise customers into seven groups based on customer’s line of business, namely communications and media services, financial management services, government and public services, nation welfare services, plantation and manufacturing services, resources and utilities services, and trading and business services.
Our Wholesale Service Division caters to wholesale customers which are categorized into the following carrier service groups:
a. carrier service group 1: handling OLOs, Telkomsel, Hutchison, AXIS, PT Sampoerna Telekomunikasi Indonesia andPTPasifik Satelit Nusantara;
b. carrier service group 2: handling OLOs, Indosat, XL-Axiata, Bakrie Telecom, SmartTelecom,PTBatam Bintan Telecom and PT Indonesia Comnets Plus(ICON+); and
c. carrier service group 3: handling operators within the business scope of ISP, VoIP, closed user group, call center and satellite provider.
Our subsidiary, Telin, caters to international carriers who provide voice and data services into Indonesia. We operate account management teams based in Singapore, Hong Kong and Jakarta, where they are headquartered. In 2012, Telin commenced cellular operations in Timor Leste after obtaining necessary licenses from the country’s regulators.
2. Telkom Solution Houses and SME Centers
We offer special services to our corporate customers through our Telkom Solution Houses located in Jakarta, Denpasar and Surabaya. We also operate SME Centers in Jakarta, Surabaya, Medan, Bandung, Yogyakarta, Palembang, Balikpapan and Makassar. Besides operating as a communications hub, our SME Centers also function as a community and business center.
3. Call Center
We provide“500250” number for business customers and a toll-free number forenterprise customersat “08001Telkom” (“08001835566”).
Service Level Guarantee Program
We offer service level guarantees, whichguarantee a specified minimum level of service to customers in terms of product quality and customer handling.
For individual customers, the program is availablefor fixed line, Flexias well as data and internet subscribers. The service level guarantee is applicable to customersapplying for new connections,a changein type of service,resolution of service disruption,resumption of disconnected serviceand complaints over customer billing. Under this program, we guarantee to provide non-cash compensation such as free subscriptions for a limited period, if we fail to meettheminimum standard.
- 32 -
For our customers in the business and corporate segments, the service level guarantee is provided under a contractagreed between us and the relevant customers. We offer service level guarantees to OLOs and certain wholesale customers who use our SL Digital, IP Transit and Metro-E products. Our guarantee covers the availability of our services and the time taken to install and repair the equipment we provide. We divide service levels guarantees for such customers into five classes of service (Bronze, Silver, Gold, Platinum and Diamond) which represent different levels of price, products and services offered and technical parameters guarantee.
Customer Satisfactionand Loyalty
We routinely engage independent market analysts to conduct surveys and market research on our customers' levels of satisfaction and loyalty. In 2012, we achieved the following levels of Customer Satisfaction Index (“CSI”) and Customer Loyalty Index (“CLI”) using the “top two boxes” and “top three boxes with seven scales” methods:
– Personal customer segment: 81.39% in CSI and 67.07% in CLI;
– Business customer segment: 90.98% in CSI and 84.92% in CLI;
– Enterprise customer segment: 91.35% in CSI and 88.00% in CLI; and
– Wholesale and international customer segment: 83.25% in CSI and 82.85% in CLI.
Sales, Marketing and Distribution
We operate a number of distribution channels for our primary products and services, including ourfixed wireless services, but not including cellular serviceswhich are handled directly by our subsidiary, Telkomsel.
The following are the primary distribution channels for our products and services:
1. Plasa Telkom outlets function as walk-in customer service points, where customers have access to the full range of our products and services;
2. Callcentershandle enquiries regarding our products, services and customer transactions. Our call centers currently do not handle payments. Our call centers also operate our customer care and telemarketing programs;
3. Partnership Stores are extensions of our distribution channels, in cooperation with a variety of third-party marketing outlets such as computer or electronic stores, banks, and others;
4. Feet on Streetare sales agents that conduct direct marketing of our products, particularly forourSpeedy products, through door-to-door sales, open table discussions, exhibitions, product demonstrations, andothersimilar activities;
5. Authorized dealers and retail outlets are sales and distribution outlets for a variety of telecommunication products such as telephone cardsandsubscriptions for Telkom Flexi, starter packs and top-up vouchers. These dealers are non-exclusive, and they receive a discount on all of the products they receive;
6. Account Management Teamswhomanage relationships with our individual and corporate customers;
7. Telkom Solution Housesare places where an enterprise customer can obtain information on a variety of TIMES solutions, products and services, and the latest technology.At these Telkom Solution Houses, we providefree live demonstrations (such as Speedy, Hotspot, PDN, IP-Phone), live demonstrations for commercialproducts (such as video conference), enterprise consultation and ecosystem business solutions for customized TIMES for corporations, and simulated demonstrations (such as e-Payment & VPN over GSM and Flexi);
8. SME Centers function as a communication center supported with advanced office facilities, a community center where our customers can interact, and a commerce center especially for e-Commerce solutions; and
9. Our website which provides customers information on the entire range of our products and services, multimedia as well as telephony, through the official companywebsiteat www.telkom.co.id.
We operate a wide range of marketing schemes to enhance our brand visibility including placing advertisements on print and electronic mass media, conducting direct marketing with customers, operating distribution personnel and special promotional campaigns.
The distribution and marketing ofourcellular products is undertaken by Telkomsel, our subsidiary, using the following distribution channels:
- “GraPARI” customer service centers, which provide customers with access to Telkomsel’s full range of products and services;
- GraPARI service outlet managed by third parties (formerly known as GeraiHalo);
- Authorized dealers that mainly focus on sales of prepaid SIM cards and top-up vouchers;
- Outlets jointly operated by us, Telkomsel and PT Pos Indonesia; and
- Other outlets such as banks.
For kartuHalo, Telkomsel focuses on corporate and professional customers with high usage volumes. Marketing for this segment is undertaken by special corporate account teams, which are also responsible for maintaining long-term relations withourcustomers through efforts to provide solutions suitable to the needs of the corporate customers. ThesimPATI and Kartu As products are designed to appeal towards a much widertargetsegment and particularly to younger customers. Telkomsel uses above and below the line marketing channels to promote its brands, including campaignsaimed at schools andspecial interest groups, placing printadvertisements, billing insertions,point-of-sale presentations, and events promotion and sponsorship.
- 33 -
Telecommunications Industry in Indonesia
We believe that Indonesia’s large population and strong economic growth provide a sustainable platform for robust growth of Indonesia's telecommunications market. In addition, Indonesia's telecommunications industry has grown substantially as consumers become increasingly sophisticated in terms of the products they demand. However, there are significant challenges posed by the limited telecommunications infrastructure in remote parts of Indonesia.
Ever since the Government deregulated Indonesia's telecommunication industry, Indonesia has witnessed an influx of new domestic and international entrants who view Indonesia as a strategic target market. This has intensified competition, especially in the cellular and fixed wireless markets. Furthermore, the Government, through the MoCI, endeavors to sustain the healthy growth of Indonesia's telecommunications industry to ensure that this ultimately benefits Indonesia's overall national economic development.
Business opportunities in the domestic telecommunications industry are expected to increase as the cellular business continues to innovate and provide ever easier and affordable mobile access. We believe that our projections and current trends generally indicate strong growth in the demand for data services and a shift from traditional telecommunication towards HSPA+ and LTE technologies.
By international standards, fixed line and internet penetration in Indonesia is low. However, we believe there are a number of trends that continue to support growth in the domestic telecommunications industry. These include:
1. Sustained economic growth, which is expected to drive an increase in demand for telecommunicationsand dataservices.
2. The migration to wireless telephone networks. We believe that wireless will become increasingly popular on the back of the ever-broader scope of services offered, as well as the improving quality of wireless networks, increasingly affordable and feature rich cellular handsets and smartphonesandthe expansion of prepaid service features facilitating mobile data access.
3. The growth in the number of telecommunications operators. We anticipate an increasingly competitive and open telecommunications sector in Indonesia as a result of the regulatory reform that eliminated the previous monopolyandduopoly systems.
Legal Basis and Regulation
The framework for the telecommunications industry is comprised of specific laws, government regulations, ministerial regulations and ministerial decrees enacted and issued from time to time. The current telecommunications policy was first formulated and articulated in the Government’s “Blueprint of the Indonesian Government’s Policy on Telecommunications”, contained in MoC Decree No.KM.72/1999 dated September 17, 1999 which was intended to:
- increase the telecommunication sector’s performance in the era of globalization;
- liberalize the sector with a competitive structure by removing monopolistic controls;
- increase transparency and predictability of the regulatory framework;
- create opportunities for national telecommunications operators to form strategic alliances with foreign partners;
- create business opportunities for small and medium enterprises; and
- facilitate new job opportunities.
A. Telecommunications Law
The telecommunications sector is primarily governed by Law No.36 of 1999 (“Telecommunications Law”), which became effective on September 8, 2000. The Telecommunications Law sets guidelines for industry reforms, including industry liberalization, facilitation of new entrants and enhanced transparency and competition.
The Telecommunications Law eliminated the concept of “organizing entities”therebyendingour andIndosat’s responsibility for coordinating domestic and international telecommunications services, respectively. To enhance competition, the Telecommunications Law prohibits monopolistic practices and unfair competition among telecommunications operators.
The Telecommunications Lawwas implemented through several Government Regulations, Ministerial Regulations and Ministerial Decrees. The most important ofsuch regulations include:
- Government Regulation No.52/2000 regarding Telecommunications Services;
- MoCI Regulation No.1/PER/M.KOMINFO/01/2010 dated January 25, 2010 regarding Operation of Telecommunications Networks;
- MoC Decree No.KM.21/2001 regarding the Provision of Telecommunications Services thatwas most recently amendedby MoCI Regulation No.31/PER/M.KOMINFO/09/2008 regarding the Third Amendment of Decree of the Minister of Communication No.KM.21/2001 regarding the Provision of Telecommunications Services;
- MoC Decree No.33/2004 regarding Supervision of Healthy Competition in the Provision of Fixed Network and Basic Telephony Services; and
- MoC Decree No.KM.4/2001 dated January 16, 2001 regarding the Determination of Fundamental Technical Plan National 2000 for National Telecommunications Development most recently amended by MoCI Regulation No.09/PER/M.KOMINFO/06/2010 dated June 9, 2010 regarding the sixth amendment of MoCDecree No.KM.4/2001 regarding the Determination of Fundamental Technical Plan National 2000 for National Telecommunications Development.
- 34 -
B. Telecommunications Regulators
In February 2005, the authority to regulate the telecommunications industry was transferred from the MoC to a newly-established Ministry, the MoCI. Pursuant to authorities assigned to him through Telecommunication Law, the Minister of Communication andInformation sets policies, regulates, supervises and controls telecommunications industry in Indonesia. On October 28, 2010,MoCI engaged in certain organizational and administrative reforms that included transferringlicensing andregulatory authority to two newly established general directorates,the Directorate General of Posts and Informatics Resources and Equipment (“DGRE”) and Directorate General of Post and Informatics Operations (“DGPIO”)pursuant toMoCI Regulation No.17/PER/M.KOMINFO/10/2010regarding the Organization and Administration of Ministry of Communication andInformation. Following thereforms,certain adjustments were made through MoCI Regulation No.15/PER/M.KOMINFO/06/2011 dated June 20, 2011regarding title adjustments in a number of Decrees and/or MoCI regulations that regulate Special Materials in Post and Telecommunications and/or in Decrees of the Director General of Posts and Telecommunications, which transfer all substances related tothepostal and telecommunications sectors to the DGPIO including licensing, numbering, interconnection, universal service obligation and business competition. Meanwhile, matters related to radio frequency spectrum and standardization of telecommunications equipments were transferred to the DGRE.
Following the enactment of the Telecommunications Law, the MoC established an independent regulatory body as stipulated in MoC Decree No.KM.31/2003 dated July 11, 2003 regarding the Establishment of the ITRA which was later revokedby MoC Regulation No.KM.36/PER/M.KOMINFO/10/2008 dated October 31, 2008and amendedby MoCI Regulation No.1/PER/M.KOMINFO/02/2011 dated February 7, 2011 (“MoCI Regulation No.36/2008”). Pursuant to MoCI Regulation No.36/2008,theITRAwas assigned the authority to regulate the Indonesian telecommunication industry, including the provision of telecommunication networks and services. TheITRA which is chaired by the Director General of Post and Informatics Operations and comprises of nine members, including sixmembers of the public, andthree members selected from Government institutions (DGRE and Director of DGPIO anda government representative appointed by the Minister of Communication and Information).Other regulatory functions of the ITRA include:
- licensing of telecommunication networks and services;
- implementation of operational and service quality standards;
- governance of interconnection charges;
- regulating telecommunicationequipment standards; and
- settlement of disputes between network operators and service providers.
Finally, oversight authority of the ITRA covers:
- operating performance;
- competition; and
- utilization of telecommunication equipments.
C. Classification and Licensing of Telecommunications Providers
TheTelecommunications Law organized telecommunication services intofollowingthree categories:
- provision of telecommunication networks;
- provision of telecommunication services; and
- provision of special telecommunications services.
Licenses issued by MoCI arerequired for each category of telecommunicationsservices. MoCI Regulation No.1/2010 and MoC Decree No.KM.21/2001 dated May 31, 2001 regarding the Operation of Telecommunications Services,as amendedby MoCI Regulation No.31/PER/M.KOMINFO/09/2008 dated September 9, 2008, are the principal implementing regulations governing licensing.
MoCI Regulation No.1/2010classified network operations into fixed and mobile networks. Fixed network operations are grouped into:
- local fixed network operations;
- fixed domestic long-distance operations;
- fixed international connection operations; and
- fixed closed network operations.
The mobile network operationswere divided into:
- terrestrial mobile network operations;
- mobile cellular network operations; and
- satellite mobile network operations.
MoC Decree No.KM.21/2001categorized the provision of services into basic telephony services, value-added telephony services, and multimedia services. The provision of multimedia services isfurthercategorized intoprovision ofinternet services, network access point services, public internet telephony services, and data communication system services. The provision of network services and of telecommunications services requires separate licenses according to the established categories. Special telecommunications license held forprivate purposes, broadcasting, as well as defense and national security are provided separately.
D. Introduction of Competition in the Indonesian Telecommunications Industry
In 1995, we were granted a monopoly to provide local fixed line telecommunications services until December 31, 2010, and DLD services until December 31, 2005. Indosat and Satelindo (which subsequently merged with Indosat) were granted a duopoly for provision of basic international telecommunications services until 2004.
As a consequence of the Telecommunications Law, the Government terminated our exclusive rights to providedomestic fixed linetelephone and DLD services and Indosat’s and Satelindo’s duopoly rightsto provide basic internationaltelephone services.Instead, the Government adopted a duopoly policy tocreatecompetition between Indosat and us as comprehensive service and network providers. The market for IDD services was liberalized in August 2003 with the termination of Indosat’s and Satelindo’s exclusive rights.In 2012,Indosat began operating fixed line services and, in 2013, fixed wireless access and DLD services. We subsequently receivedour IDD services license and began offering IDD services in 2004 in direct competition with Indosat.
E. DLD Services
To liberalize DLD services, the Government amended the National Telecommunications Technical Plan pursuant to MoCI Decree No.6/P/M.KOMINFO/5/2005 dated May 17, 2005 (“MoCI Decree No.6/2005”) to assign each provider of DLD services a three-digit access code that would permit their customers to select an alternative DLD services provider by dialing the three-digit access number. MoCI Decree No.6/2005 did not provide for immediate implementation of the three-digit system for DLD calls, but as the first DLD service provider, we were required to gradually open our network to the three-digit access codes in all coded areas throughout Indonesia by April 1, 2010. We were assigned the “017” DLD access code, while Indosat was assigned “011”. The MoCI thereafter amended the National Telecommunications Plan as provided in MoCI Decree No.43/P/M.KOMINFO/12/2007 dated December 3, 2007, (“MoCI Decree No.43/2007”), which delayed the deadline for the implementation ofthreedigit access code for DLD calls throughout all the area code in Indonesia until September 27, 2011.
Pursuant to MoCI Decree No.43/2007, we opened our network to the “01X” three-digit DLD access service in Balikpapan by April 3, 2008. Sincethat date, our customersare ableto make DLD calls from Balikpapan by first dialingIndosat’s“011”. As stipulated in MoCI Regulation No.43/2007,we have provided a nation-wide network for three-digit access code for fixed and fixed wireless DLD with “01X” that can be used by Indosator other licensed operator starting September 27, 2011. To date, no other licensed operators have submitted a request to us to connect their networksandenable DLD access. If there isanother operator that provide the “01X” access code,whether nationally or in certain parts of Indonesia,our customers can choose to use such other operatorto makeDLDcalls, whenever available.
On December 16, 2008, the MoCI issued an in-principle DLD license to Bakrie Telecom, increasing the number of potential DLD operators to three.However, as ofthe date offiling of thisannual report, Bakrie Telecom has not yet obtained a DLD operating license whichwouldrequirethem to first procure necessaryDLDinfrastructure.
Our DLD tariffs are regulated by MoCI Regulation No.15/PER/M.KOMINFO/4/2008 dated April 30, 2008 regarding Tariff Calculation Procedures for Basic Telephony Services on Fixed Wireline Networks (“MoCI Regulation No.15/2008”),limits our interconnection tariffsin accordanceto aspecifiedcost-based formula. MoCI Regulation No.15/2008 also provides that our tariff structurebe comprised of a connection fee, monthly charges, usage charges and additional facilities fees. We are required by MoCI Regulation No.15/2008 to report ourcost-based tariff calculation to the ITRA.
F. IDD Services
We received our IDD license in May 2004 and began offering IDD fixed line services to customers in June 2004 using the “007” IDD access code. The Indosat IDD access code is “001”.OurDecember 2005 interconnection agreement with Indosat enables Indosat’s network customers to access our IDD services by dialing “007” and our network customers to access Indosat’s IDD services by dialing “001”.
On February 12, 2009, the MoCI issued a fixed IDD license to Bakrie Telecom, with international access code “009”,which has increased the number of potential IDD operators to three.
Interconnection fees from international network providers to local network providers are determined based on the interconnection offering document for fixed line local network providers.Our fixed lineIDD tariff are regulated by MoCI Regulation No.15/2008 in the same manner as our fixed lineDLDservices.
- 36 -
G. Limited Mobility Wireless Services
MoC Decree No.KM.35/2004 dated March 11, 2004 regarding Implementation of Fixed Wireless Networks with Limited Mobility,as amended by MoCI Decree No.16/PER/M.KOMINFO/06/2011 dated June 27, 2011, (“MoC Decree No.KM.35/2004”) provides that only local fixed network operators holding licenses issued by the MoC may offer limited mobility wireless(or fixed wireless)access services. In addition, MoC Decree No.35/2004 states that each limited mobility wireless access operator must provide basic telephone services. Under anautomatedmigration feature, customersare able to make and receive calls on their fixed limited mobility wireless access phones using a different number with a different area code.
Indosat, Bakrie Telecom and Mobile-8 also hold limited mobility wireless operating licenses.
Our fixed wirelesstariff are regulated by MoCI Regulation No.15/2008 in the same manner as our DLD and IDD fixed line services.
H. Cellular
Cellular telephone service is provided in Indonesia on the 1.8 GHz, 2.1 GHz and 900 MHz radio frequency spectrums, although mobile services on 900 MHz frequency band is currently provided only by Indosat which obtained a license on August 31, 2012.The MoCIregulates the use of theradiofrequency spectrum. Telkomsel obtained frequency allocation for cellular services frequency bands 1.8 GHz and 2.1 GHz. Unlike the 1.8 GHz, the 2.1 GHz frequency band is allocated through a selection process and regulated by:
- Decree of the Minister of Communication and Information No.03/KEP/M.KOMINFO/01/2006 dated January 9, 2006 regarding Business Opportunity in Operation of Third Generation Mobile Cellular Network that has national coverage;
- Regulation of the Minister of Communication and Information No.01/PER/M.KOMINFO/1/2006 dated January 13, 2006 regarding the Operation of 2.1 GHz radio frequency band for IMT-2000 mobile network;
- Regulation of the Minister of Communication and Information No.02/PER/M.KOMINFO/1/2006, dated January 13, 2006 regarding Selection of Operators of IMT-2000 at 2.1 GHz Radio Frequency Band;
- Regulation of the Minister of Communication and Information No.04/PER/M.KOMINFO/1/2006 dated January 30, 2006 regarding the Auction Procedure of 2.1 GHz Radio Frequency Band for IMT – 2000 Mobile Cellular Network Operation;
- Regulation of the Minister of Communication and Information No.07/PER/M.KOMINFO/2/2006 dated February 8, 2006 regarding the Use of 2.1 GHz Radio Frequency Band for Mobile Cellular Network; and
- Decree of the Minister of Communication and Information No.07/KEP/M.KOMINFO/01/2006 regarding the Determination of Auction Document Number for IMT-2000 Operator Selection at 2.1 GHz Radio Frequency Band.
Our cellulartariffs are regulatedunder MoCI Regulation No.09/PER/M.KOMINFO/04/2008 dated April 7, 2008 regarding “Mechanism to Determine Tariff of Telecommunication Services which Connected through Mobile Cellular Network” (“MoCI Regulation No.9/2008”), whichprovided guidelines to determine cellular tariffs with a formula consisting of network element cost and retail servicesactivitiy cost. Pursuant to MoCI Regulation No.9/2008, the cellular tariffsof operating telecommunication services which connected through mobile cellular network consist of basic telephony services tariff, roaming tariff and/or multimedia service tariff.
I. Interconnection
The Telecommunications Lawexpressly prohibits monopolistic and unfair businesspractices andrequires network providers to allow users to accessotherusers orobtainservicesfrom other networks by payinginterconnectionfees agreed upon by each network operator. Government Regulation No.52/2000 dated July 11, 2000 regarding Telecommunications Operations provides that interconnection charges between two or more network operators must be transparent, mutually agreedupon and fair.
On February 8, 2006, the MoCI issued Regulation No.8/PER/M.KOMINFO/02/2006 on Interconnection (“MoCI Regulation No.8/2006”), mandated a cost-based interconnection tariff scheme for all network and services operatorsreplacingthepreviousrevenue-sharing scheme. Under the new scheme, interconnection charges are determined by the network operator onwhich a call terminates based on along-run incremental cost formula provided underMoCI Regulation No.8/2006.
MoCI Regulation No.8/2006requires operators to submit to the ITRA annual RIO proposals containing proposed interconnection tariffs for the coming year. Operators are required to use the cost-based methodology in preparing RIO proposals, and the ITRA and MoCI are required to use the same methodology in evaluating the RIO proposals and approving interconnection tariffs. The RIO proposals also include call scenarios, traffic routing, point of interconnection, procedure for requesting and providing interconnection, and other matters. RIOs must also disclose the type of interconnection services offered and tariffs charged for each service offered. Interconnection accessproviders are required to implement a queuing system on a First-in-First-Serve basis. Additionally,networkinterconnection must beimplemented in atransparent and without discrimination.
- 37 -
Pursuant to MoCI Regulation No.8/2006 and ITRA Letter No.246/BRTI/VIII/2007 dated August 6, 2007, we submitted a RIO proposal totheITRA in October 2007, which covered adjustments for operational, configuration, technical and service offerings. In December 2007,we andallothernetwork operators signed new interconnection agreementsthat superseded previous interconnection agreements betweenus and othernetwork operators which also amended all interconnection agreements signed in December 2006. These agreements temporarily served inlieu of RIOs while the ITRA continued to review the RIO proposals received from ourselves and other operators.
On February 5, 2008, the ITRA required that we and other operators begin implementing the cost-based interconnection tariff regime. On April 11, 2008, pursuant to Directorate General of Post and Telecommunication ("DGPT") Decree No.205/2008, the ITRA and the MoCI approved RIOproposalsfrom all operators to replace previous interconnection agreements. The RIO approved in 2008 waseffective until July 29, 2011 whennewinterconnection chargeswere implemented as stipulatedinITRA Letter No.227/BRTI/XII/2010 dated December 31, 2010 regarding the Implementation of Interconnection Charges in 2011. This is the result of interconnection charges recalculation conducted in 2010 by MoCI that was agreed on by all operators and outlined in a Memorandum of Understanding. In this process,we wereappointed as a default data source for the calculation of fixedwireline andfixedlocalinterconnection tariffs. Our subsidiary, Telkomsel, and Indosat were similary appointed as the default data source for the calculation cellular interconnection tariffs. Meanwhile, Indosat data is positioned as a benchmark for calculating the cost of cellular mobile network interconnection. The results ofthis interconnection chargesreform caused aslightdecrease in interconnection costs.
On December 12, 2011, the ITRA changed the SMS interconnection fee basis from a “Sender Keep All” basis to a cost basis interconnection fee calculation which required certain amendments to RIOs agreed upon in 2011. MoCI Regulation No.8/2006 stipulates that the RIO of telecommunications network operators generating operating revenue that is equaltoor more than 25% of the combined revenues of all telecommunication operators that serve the same respective segment, must obtain ITRA’s approval, necessitating changes inour and Telkomsel’s RIOs which were approved on June 20, 2012.In 2012, we and Telkomsel were confirmed as telecommunication network operators that are capable of posting revenue of 25% or more of total operating revenues of all telecommunication operators combined in the respective segments in 2012, through the Decree of the Director General of PPI No.181A/KEP/DJPPI/KOMINFO/5/2012 dated May 16, 2012. Until this report is published, no recalculation of interconnection fees for 2012 had been done as doing such should have been preceded by an evaluation on interconnection charges in 2011.
J. VoIP
In January 2007, the Government implemented new interconnection regulations and a five-digit access code system for VoIP services pursuant to MoCI Decree No.06/P/M.KOMINFO/5/2005. Under the Decree, the prefix for VoIP, which was originally 01X, was changed to 010XY. On April 27, 2011, the MoCI issued Regulation No.14/PER/M.KOMINFO/04/2011, which imposed quality control standards in relation to VoIP services,which becameeffective three months thereafter, to which we and other operators must adhereto.
K. IPTV
In August 19, 2009, MoCI issued Ministerial Decree No.30/PER/M.KOMINFO/8/2009 regarding the undertaking of IPTV services in Indonesia, in order toaddress the convergence oftelecommunications serviceswith broadcasting and electronic transactions. In July 2010, MoCI replaced this regulation withMoCI Regulation No.11/PER/M.KOMINFO/07/2010 (“MoCI Regulation No.11/2010”) which established the legal basis for the licensing and regulates the provision of IPTV services, including the rights and obligations of IPTV providers, technical standards, foreign ownership requirements and the use of domestic independent content providers.
MoCI Regulation No.11/2010recognizesIPTVas a convergence of telecommunications, broadcasting, multimedia and electronic transactions and provides that only aconsortium comprising at least two Indonesian entities may be licensed as an IPTV provider.Each consortium must together hold licenses as a local fixed network provider,internet services provider and one broadcast services provider.Such consortium mayonlyprovide IPTV services in the areacovered by all three required licenses. MoCI Regulation No.11/2010 further requires that IPTV services be delivered through a wire network.
We obtainedour IPTV license through our subsidiary, PT Indonusa Telemedia, on April 27, 2011.Ouroperating license covers Jabodetabek, Bandung, Surabaya, Bali and Semarang.
L. Satellite
Our international satellite business is highly regulated. In addition to being subject to domestic licensing requirements and regulation for the use of orbital slots and radio frequencies as stipulated in MoCI Regulation No. 13/P/M.KOMINFO/8/2005 dated September 6, 2004 which is partially amended by MoCI Regulation No.37/P/M.KOMINFO/12/2006 dated December 6, 2006 (“MoCI Regulation No.37/2006”), our satellite operations is also regulated by the Radio Communications Bureau of the International Telecommunications Union.
Furthermore, MoCI Regulation No.37/2006 dated December 6, 2006 requires foreign satellite operators to obtain a landing right license to operate in Indonesia which requires such foreign satellite operators to coordinate with domestic satellite operators, including us, to ensure that no Indonesian satellite and terrestrial systems will be disrupted by their operation.
- 38 -
M. Consumer Protection
Under the Telecommunications Law, eachnetwork provider is required to protect consumerrights in relation to, among others, quality of services,tariffs andcompensation. Customers injured or damaged by negligent operations may file claims against negligent providers. Telecommunications consumer protection regulations provide service standards for telecommunication operators.
N. USO
All telecommunications operators, whether network or service providers, are bound by a USOregulationthat requires them to contribute in providing telecommunication facilities and infrastructure in the interest of opening equal access to telecommunications throughout all regions in Indonesia, which is generally done by way of financial contribution. MoCI Regulation No.32/PER/M.KOMINFO/10/2008 dated October 10, 2008 regarding the USO (as amended by MoCI Regulation No.03/PER/M.KOMINFO/02/2010 dated February 1, 2010) (“MoCI Regulation No.32/2008”) provides that USO funds received will be used to fund telephone, SMS and internet access in remote and other areas of Indonesia that have been classified as USO regions where it is not economical to provide these services.
USO payment requirements are calculated as a percentage of our and Telkomsel’s unconsolidated gross revenues less uncollectable receivables from the telecommunication operation (e.g., bad debt expense) and payments received for interconnection expense which belong to other parties. Pursuant toGovernment Regulation No.7/2009 dated January 16, 2009 regarding Tariffs for Non-Tax State Revenue that apply to the Ministry of Communication and Information (“GR No.7/2009”), the current USO tariff rate is 1.25% of gross revenue. We paid USO amounts of Rp879 billion in 2011 and Rp994 billion in 2012.
O. Telecommunication Regulatory Charges
On January 16, 2009, the Government issued Government Regulation No.7/2009, which sets the types of non-tax state revenues that apply to the MoCI derived from various services, including telecommunications.
We are required to pay right-of-use fees related to the radio frequency spectrum that we use. The right-of-use fees with reference to our BTS licensingwerepayable annually based on a formula thattookinto account base prices for both radio frequency spectrum and transmission capacity, as adjusted by fee indices set by the Minister of Communications and Information in consultation with the Minister of Finance. The right-of-use fees calculated with reference to our radio frequency spectrum is determined by tender and comprises of both an upfront fee and radio frequency spectrum (“IPSFR”) annual fees.
On December 13, 2010, the Government issued Government Regulation No.76/2010 amending Government Regulation No.7/2009. Pursuant to Government Regulation No.76/2010, we are no longer required to pay right-of-use fees calculated with reference to the BTSs that we deploy in our network, except for BTSs deployed in our backbone, with effect from December 15, 2010. As a result, our right-of-use fees are now calculated based on the bandwidth of the radio frequency spectrum that we use.
In addition to radio frequency spectrum right-of-use fees, Government Regulation No.7/2009 requires all telecommunications operators to pay an annual license fee for telecommunication operation, which is equal to 0.5% of unconsolidated gross revenues, from which uncollectible receivables from telecommunication operation (e.g., bad debt expense)interconnection payable, and/or connections utilized by other parties may be deducted.
Pursuant to Law No.28/2009 regarding Local Taxes and Local Fees, local governments are permitted to impose fees on the sites that we use for telecommunications towers. The fees may not exceed 2% of the site’s assessed tax value. Currently, there are some 525 local (provincial and regency level)governmentsthrough outIndonesia that may be authorized to impose these fees to increase in the future.
P. Telecommunications Towers
On March 17, 2008, the MoCI issued MoCI Regulation No.02/PER/M.KOMINFO/3/2008 regarding Guidelines on Construction and Utilization of Sharing Telecommunication Towers (“MoCI Regulation No.02/2008”). Under MoCI Regulation No.02/2008, the construction of telecommunications towers requires permits from the relevant governmental institution, while the local government determines the placement and locations at which telecommunications towers may be constructed. In addition, telecommunications providers that own telecommunication towers and other tower owners are obligated to allow other telecommunication operators to utilize their telecommunication towers without any discrimination, with due regards to the technical capacity of the respective tower.
- 39 -
Since the operations of telecommunication towers involves a number of relevant Government bodies, on March 30, 2009, a joint regulation is issued in the forms of Minister of Home Affairs Regulation No.18/2009, Minister of Public Works Regulation No.07/PRT/M/2009, MoCI Regulation No.19/PER.M.KOMINFO/03/2009 and Head of the Investment Coordinating Board Regulation No.3/P/2009 regarding Guidelines for the Construction and Shared Use of Telecommunications Towers (“Joint Decree”).
The Joint Decree regulates that license for telecommunication tower construction is to be issued by regents or mayors, and for Jakarta Province, its Governor. The Joint Decree also provides for tower construction standards and requires that telecommunications towers be made generally available for shared use by telecommunications service providers. The owner of a telecommunications tower is allowed to collect a fee, which is negotiated with reference to costs associated with investment and operational costs, the return of investment and a profit. Monopolistic practices in the ownership and management of telecommunications towers is prohibited.
In addition to the Joint Decree and MoCI Regulation No.02/2008, several regional authorities have implemented regulations limiting the number and location of telecommunication towers and require operators to share in the utilization of telecommunications towers.
Competition
Measures following the Telecommunications Law’s adoption in 2001 moved the Indonesian telecommunications sector from a duopoly between Indosat and us to one with multiple competing providers. See “Legal Basis and Regulation – Introduction of Competition in the Indonesian Telecommunications Industry”.
Competition Law
The Government currently promotes liberalization, competition and transparency in the telecommunications sector. It does not prevent providers from attaining and capitalizing upon a dominant market position. However, the Government does prohibit operators from abusing a dominant position. In March 2004, the MoC issued Decree No.33/2004, which prescribes measures to prohibit such abuse by dominant network and service providers. A provider is considered dominant based on factors such as scope of business, service coverage area and controlofa particular market. Specifically, Decree No.33/2004 prohibits dumping, predatory pricing, cross-subsidies, mandatory use of a provider’s services (to the exclusion of competitors) and hampering mandatory interconnection (including discrimination against specific providers).
Competition in the telecommunications sector, like all Indonesian business sectors, is also governed more generally by Law No.5/1999 dated March 5, 1999 regarding Prohibition of Monopolistic Practice and Unfair Business Competition (“Competition Law”). The Competition Law bans agreements and activities tending toward unfair business competition, as well as the abuse of a dominant market position. Pursuant to the Competition Law, the Commission for the Supervision of Business Competition (“KPPU”) has been established as Indonesia’s antitrust regulator with the authority to enforce the provisions of the Competition Law.
The Competition Law is implemented by various regulations, including Government Regulation No.57/2010 dated July 20, 2010 regarding Mergers and Acquisitions Potentially Causing Monopolistic Practices or Unfair Business Practices. Government Regulation No.57/2010 permits voluntary consultation with the KPPU prior to a merger or acquisition, resulting in the KPPU issuing a non-binding opinion. Government Regulation No.57/2010 also requires that a mandatory report be made to the KPPU after a merger or acquisition is completed if the transaction exceeds certain asset or sales value thresholds.
A. Fixed Line, Fixed Wireless andDLD
Our exclusive right to provide domestic fixed line telecommunications services in Indonesia ended following the Telecommunications Law’s implementation in 2000. The MoC issued licenses to Indosat for domestic fixed line services in August 2002 and for DLD telephone services in May 2004. We entered into an interconnection agreement with Indosat dated September 23, 2005 to allow interconnection between our local fixed line services in Jakarta, Surabaya, Batam, Medan, Balikpapan, Denpasar and certain other areas. By 2006, Indosat was able to provide nationwide DLD services through its CDMA-based fixed wireless network, its fixed line network and these interconnection arrangements with us.
In an attempt to liberalize DLD services, the Government required each DLD provider to implement a three-digit access code to be dialed by customers making DLD calls. These regulations were first implemented in Balikpapan in 2008, with Balikpapan residents given the option to make a normal DLD call or to select a three-digit code assigned to Indosat or to us. Under current regulations, this system is to be applied nationally beginning September 27, 2011. See “Legal Basis and Regulation – Introduction of Competition in the Indonesian Telecommunications Industry”.
Indosat remains our largest competitor with respect to fixed line and DLD services and we also compete against other fixed line service providers such as PT Bakrie Telecom, Tbk. (formerly Ratelindo) and PT Batam Bintan Telecom. However, traditional fixed line services have faced and will continue to increasingly face competition from cellular services, particularly as cellular tariff decrease, and from other alternate services such as fixed wireless, SMS, VoIP and e-mail services.
Telkom Flexi, our fixed wireless network is the largest in Indonesia with coverage of 370 cities offering limited mobility and charging customers based on PSTN tariff that is principally lower than that of GSM. For comparison, Indosat in 2004 launched its CDMA-based fixed wireless phone service under the brand name “StarOne” in Jakarta and Surabaya. Bakrie Telecom offers fixed wireless services in more than 30 cities and Mobile-8 was granted a nationwide fixed wireless access license in 2009. In general, the technologies employed by CDMA and fixed wireless access operators are less capital-intensive, previously allowing these operators to offer more competitive prices than GSM operators.Furthermore, licensing fees for radio stations offixedwireless mobile phone connections is lower thancellular.
B. Cellular
We operate our cellular service business through our majority-owned subsidiary, Telkomsel. As of December 31, 2012, Indonesia’s cellular market is dominated by Telkomsel, Indosat and XL Axiata, which collectively account for83.1% of the full-mobility cellular market. Other providers include Hutchison, Natrindo, Smart Telecom and Bakrie Telecom.
There were approximately276.0 million full-mobility cellular subscribers in Indonesia as of December 31, 2012, a10.7%increase from approximately249.4 million as of December 31, 2011. The cellular penetration rate in Indonesia stood at approximately110% as of December 31, 2012.
We believe that Telkomsel competes effectively in the Indonesian cellular market on the basis of price, coverage, service quality and value added services.As of December 31, 2012, Telkomsel remained the largest national licensed provider of cellular services in Indonesia, withapproximately 125.1million cellular subscribers and amarket share of 45.3%of the full-mobility cellular market. The second and the third largest providers were Indosat and XLAxiata, which have a market share of21.2%and16.6% respectively, based on theestimated number of subscribers as of December 31, 2012. In addition to the nationwide GSM operators, a number ofsmaller regional GSM, analog and CDMA fixed wireless providers operate in Indonesia.
The following table sets out information as of December 31, 2012 for each of the three leading cellular providers with national coverage:
| | Operator |
| | Telkomsel | | Indosat | | XL Axiata |
Launch date | | May-1995 | | Nov-1994(2) | | Oct-1996 |
2G Licensed frequency bandwidth (GSM 900 & 1800) | | 30 MHz | | 30 MHz | | 15 MHz |
3G Licensed frequency bandwidth (2.1 GHz) | | 10 MHz | | 10 MHz | | 5 MHz |
Market share(1) | | 45.3% | | 21.2% | | 16.6% |
Subscribers(1) | | 125.1million | | 58.5million | | 45.8 million |
(1) Internal estimate, dated December 31, 2012 based on various statistics compiled by us. |
(2) In November 2003, Indosat and Satelindo merged and Indosat took over Satelindo’s cellular operations. |
Hutchison and Natrindo also provide cellular services in Indonesia and in 2012 were each awarded an additional 10 MHz of spectrum on the 3G license frequency bandwidth (2.1 GHz). This additional spectrum increased their respective total allocated frequency spectrum to 20 MHz and 25 MHz each.
In accordance with the announcement of MoCI No.19/PIH/KOMINFO/2/2013 dated February 25, 2013, Telkomsel has been selected as one of the companies to be granted an additional 3G license with radio frequency in the 2.1 GHz bandwidth.
C. IDD
We acquired a commercial IDD license in May 2004 and in June 2004 we began delivering full IDD services for our fixed wireline subscribers. We were awarded this license following the early termination by the DGPT in August 2001 of Indosat’s exclusive right to operate IDD services.
We conducted extensive preparations to offer IDD services prior to receiving our license in 2004. Our initial preparations included upgrading switching facilities to establish International Gateway capabilities in Batam, Jakarta and Surabaya. Two microwave links, connecting Batam-Singapore and Batam-Pangerang (Malaysia), were built to facilitate connections with overseas operators. In 2003, together with SingTel Mobile and CAT, we developed the TIS submarine cable system connecting Batam, Singapore and Thailand.We completed the deployment of a newsubmarine optical cable to connect Dumai (Indonesia) with Melaka (Malaysia) in December 2004, pursuant to an agreement with Telekom Malaysia Berhad. Our international cable was extended by purchasing bandwidth capacityto connect with Hong Kong, the United States and other countries. In December 2004, we completed the ground segment to connect to the Intelsat Satellite. The Batam Singapore Cable System network began operating in May 2009, while the Asia America Gateway network began operating in October 2009. On January 25, 2008, we transferred our international operations, including IDD, to our subsidiary, Telin.
Telkomsel now has the largest IDD Service consumer base. IDD faces competition primarily from the rapid broadband services development that has far improved Internet-based voice services likes Skype and Google Talk.
- 41 -
D. VoIP
We formally launched our VoIP services in September 2002. VoIP uses data communications to transfer voice traffic over the internet, which usually provides substantial cost savings to subscribers. A number of other companies, including XL Axiata, Indosat, Atlasat Solusindo Pte, Ltd., PT Gaharu Sejahtera, PT Satria Widya Prima, PT Primedia Armoekadata Internet and PT Jasnita Telekomindo also provide licensed VoIP services in Indonesia. Other unlicensed operators also provide VoIP services that may be accessed through websites or through software that allows voice communications through the internet using computers or smartphones.
VoIP operators compete primarily on the basis of price and service quality. VoIP operators, including us, have begun to offer budget calls and other products aimed at price sensitive users such as prepaid calling cards, which are expected to result in greater competition among VoIP operators and IDD service providers. We currently offer our primary VoIP service “Telkom Global-01017” and the lower-cost alternative “Telkom Save”. Telkom Save offers discounted rates for certain countries to which there is heavy traffic from Indonesia while offering regular VoIP tariff rates for other countries.
E. Satellite
TheAsia-Pacific region and especially Southeast Asia continues to needsatellites for bothtelecommunicationsandbroadcasting-infrastructure,the major factors for this need are as follows:
- High market demand for GSM trunking;
- Continuing growth in theDTH television market; and
- The value of satellite services in disaster recovery.
At the same time, numerous regional and global operators are focusing on satellite operation services in this region, resulting in increasingly tight competition in the satellite business in the region in terms of coverage, product as well as pricing. Southeast Asia is one of the most fragmented markets for satellite operators in the world, with around 17 global as well as regional players competing in the area, including:
1. SES Global (Luxembourg)
2. Eutelsat Asia (France)
3. APT Satellite (Hong Kong)
4. AsiaSat (Hong Kong)
5. JSAT (Japan)
6. MEASAT (Malaysia)
7. MCI – Media Citra Indostar (Indonesia)
8. Indosat (Indonesia)
9. VinaSat (Vietnam)
10. SingTel/Optus (Singapore)
11. Telkom (Indonesia)
12. ChinaSat (China)
13. Mabuhay (Philippines)
14. Thaicom (Thailand)
15. ABS (Hong Kong)
16. ProtoStar (Singapore)
17. Lippo Star (Indonesia)
Generally, large global satellite operators can use economies of scales to offer more competitiveprices without affecting their financial performance. This may result in a market premium subsidy in very competitive markets.
The satellite industryin Indonesia is one of the most competitive in Southeast Asia. This is evident from the shift in market structure since 2003 from monopoly to oligopoly. One of the reasons for this shift in market structure is that the domestic satellite industry is not strictly regulated by the Government of Indonesia. Although Ministerial Regulation No.37/P/M.KOMINFO/12/2006 dated December 6, 2006 issued by the Minister of Communications and Information was intended as an entry barrier for foreign satellite operators, the currently applied “open sky” policy has in fact increased competition amongst domestic and foreign satellite operators. Another factor in the shift inmarket structure is the limited capacity of domestic satellite operators, includingus, which are thus unable to benefit from the fast growing market demands in Indonesia.
- 42 -
Our satellite operations primarily consist of leasing satellite transponders capacity to broadcasters and operators of VSAT, cellular and IDD services and ISPs, as well as providing earth station satellite up linking and down linking services to domestic and international users. We face competition from foreign and domestic service providers and compete most closely in Indonesia with Indosat and Pasifik Satelit Nusantara (“PSN”). Other private satellites serving the broadcasting market within the coverage of the Telkom-1 and Telkom-2 satellites include AsiaSat-2, AsiaSat-4, AsiaSat-3S, Apstar-2R, Apstar-5, Apstar-6, ThaiCom 3, Measat-2, Measat-3, Measat-3a, PanAmSat-4 and PanAmSat-7. Our direct competitors in Asia are MeasatSdn. Bhd, which operates the Measat satellites, APT Satellite which operates the Apstar satellite, and Shin Satellite PCL, which operates the ThaiCom satellite.
Moreover, with the increasing popularity of DTH television, there is increasing competition in the satellite business due to the launch of new and more powerful regional satellites. DTH is the reception of satellite programs with exclusive choices in an individual home. Our domestic broadcasters are tapping into this trend, and have begun to seek DTH licenses national broadcasting services in Indonesia. DTH television will enable broadcasters to distribute their program content without utilizing our telecommunication network, thereby entirely bypassing our telecommunications services. With the growing popularity of DTH, we face the possible loss of customers since DTH uses a satellite platform that we do not provide.
F. BTS
As of December 31, 2012,we operated 60,011BTS located throughout Indonesia. Through our subsidiary, PT Dayamitra Telekomunikasi, we lease out space to other operators to place their telecommunications equipment on these towers, for which we receive a fee. Our principal competitors in this business are XL Axiata, Indosat, Bakrie Telecom and PT Tower Bersama Infrastructure Tbk.
G. Others
Deregulation in the Indonesian telecommunications sector has encouraged competition in the multimedia, internet, and data communications services businesses. The diversification of businesses has gained momentum with the result that competition is now intense, particularly in terms of price, range of services offered, quality and network coverage, as well as customer service quality.
Licensing
To provide national telecommunications services, we have a number of product and service licenses that are consistent with the applicable laws, regulations or decrees.
Following the issuance of MoCI Regulation No.01/PER/M.KOMINFO/01/2010 (“MoCI Decree No.01/2010”) dated January 25, 2010 concerning the Provision of Telecommunication Network, we were required to adjust our telecommunicationslicense to provide telecommunicationsservices. We have secured new licenses that have been adjusted as required of which are as follows:
A. Fixed Network and Basic Telephony Services
Based on the report submitted by us concerning the operation of fixed network and as part of the adjustment to MoCI Decree No.01/2010, we had our licenses adjusted in 2010 for the operation of local fixed network, direct long distance, international call and closed fixed network, explained as follows:
- MoCI Decree No.381/KEP/M.KOMINFO/10/2010 dated October28,2010 on the License of Operating Local Fixed Network and Basic Telephony Services of PT Telekomunikasi Indonesia, Tbk;
- MoCI Decree No.382/KEP/M.KOMINFO/10/2010 dated October28,2010 on the License of Operating Fixed Network of Domestic Long Distance and Basic Telephony of PT Telekomunikasi Indonesia, Tbk;
- MoCI Decree No.383/KEP/M.KOMINFO/10/2010 dated October28,2010 on the License of Operating Fixed Network of International Call and Basic Telephony Services of PT Telekomunikasi Indonesia, Tbk; and
- MoCI Decree No.398/KEP/M.KOMINFO/11/2010 datedNovember 12,2010 on the License of Operating Closed Fixed Network of PT Telekomunikasi Indonesia, Tbk.
Following the issuance of MoCI Decrees No.381, 382 and 383, our previous licenses for operating a fixed network and basic telephony services previously owned by us based on MoC Decree No.KP.162 of 2004 dated May 13, 2004 ceased to be in effect. The licenses do not have a set expiry date, but are evaluated every five years.
B. Cellular
Telkomsel holds licenses to operate a nationwide GSM mobile cellular telephone network using 7.5 MHz of radio frequency bandwidth in the 900 MHz band and using 22.5 MHz of radio frequency bandwidth in the 1,800 MHz band. Telkomsel also holds licenses from the Indonesian Investment Coordinating Board that permit Telkomsel to develop cellular services with national coverage, including the expansion of its network capacity. In addition, Telkomsel holds permits and licenses from and registrations with certain regional governments and/or governmentalagencies, primarily in connection with its operations in such regions, the properties it owns and/or the construction and use of its BTS.
- 43 -
In February 2006, the Government held a tender for three 2.1 GHz spectrum licenses, each with a bandwidth of 5 MHz, to be used in conjunction with the new licenses to operate a nationwide 3G cellular telecommunication network. One of the licenses went to Telkomsel. Telkomsel obtained a 3G license on a 2.1 GHz band for a ten-year period as set out regulated in MoCI Decree No.19/KEP/M.KOMINFO/2/2006 dated February 14, 2006. The license will be extended after being evaluated by the MoCI. Telkomsel started its commercial 3G service in September 2006.
Based onMoCI DecreeNo.101/KEP/M.KOMINFO/10/2006 dated October 11, 2006, Telkomsel had its license renewedand givenrights to provide: (i) mobile telecommunications service with radio frequency bandwidth in 900 MHz and 1,800 MHz; (ii) mobile telecommunications service of IMT-2000 with radio frequency bandwidth in 2.1 GHz (3G) and (iii) basic telecommunications services.The licenses do not have a set expiry date, but it will be evaluated every five years.
C. International Calls
Wecommenced our international call service in 2004. Our license for operating a fixed network to provide international call services was adjusted in 2010 to meet the requirements of MoCI Decree No.01/2010 with the issuance of MoCI Decree No.383/2010. The license does not have a set expiry date, but it will be evaluated in 2015.
We have a license to operate a closed fixed network based on MoCI Decree No.398/KEP/M.KOMINFO/11/2010, which amends the previous license, to meet the provisions in MoCI Decree No.01/2010. The license allows us to lease the installed closed fixed network, to among others, telecommunication network and service operators, including providing an international telecommunication transmission facility through a SCCS directly to Indonesia for overseas telecommunication operators.
According to MoCI Decree No.16/PER/M.KOMINFO/9/2005 dated October 6, 2005 concerning Provision of International Telecommunications Transmission Facilities through SCCS, overseas telecommunications operators wishing to provide an international telecommunications transmission facilities through the SCCS directly to Indonesia are required to set up a partnership with a fixed network of international call services or closed fixed network provider. In line with MoCI Decree No.16/2005, the international telecommunication transmission facilities provided through SCCS are served by us on the basis of landing rights attached to our license to operate fixed network of international call services. We have also secured landing rights based on the landing right Letter No.006-OS/DJPT.6/HLS/3/2010 dated March 2, 2010 from MoCI.
On March 2, 2010, the MoCI issued Decree No.75/KEP/M.KOMINFO/03/2010 granting our subsidiary, Telin, a license to operate a closed fixed line network which enables Telin to provide international infrastructure services. Separately, Telin secured landing rights in Indonesia from the DGPT to provide international telecommunications transmission facilities through SCCS.
D. VoIP
We are licensed to provide internet telephony services for public needs as stated in DGPT Decree No.384/KEP/DJPT/M.KOMINFO/11/2010 dated November29,2010on VoIP services.This license does not have a set expiry date, but it will be evaluated every five years.
Telkomsel also licensed to provide internet telephony services for public needs as stated in DGPT DecreeNo.226/DIRJEN/2009on VoIP services.This license does not have a set expiry date, but it will be evaluated every five years.
E. ISP
We are licensed as an ISP under DGPIO Decree No.83/KEP/DJPPI/KOMINFO/4/2011 dated April 7, 2011. This license does not have a set expiry date, but it will be evaluated every five years.
Telkomsel is also licensed to provide multimedia Internet access services with nation-wide coverage under DGPT Decree No.213/DIRJEN/2010. This license does not have a set expiry date, but will be evaluated annually, with a comprehensive evaluation every five years.
F. Internet Interconnection Service
We hold a license to provide internet interconnection services by referring to DGPT Decree No.275/Dirjen/2006 regarding license for Internet Interconnection Service for PT Telekomunikasi Indonesia Tbk. This license does not have a set expiry date, but it will be evaluated every five years.
G. BWA
In July 2009, we wonatender for a BWA license and the right to provide BWA services in twelve zones, comprising eight zones on 3.3 GHz (North Sumatra, South Sumatra, Central Sumatra, West Kalimantan, EastKalimantan, West Java, JABODETABEK and Banten)andfive zoneson 2.3 GHz (Central Java, East Java, Papua, Maluku, and the northern part of Sulawesi).
- 44 -
In August 2009, the MoCI issued Ministerial Decree No.237/KEP/M.KOMINFO/7/2009 regarding the Appointment of the Winning Bidders for Packet Switched-Based Local Fixed Access Network Operators Using the 2.3 GHz Radio Frequency for Wireless Broadband Services. Because of inadequate implementation by the winning bidders, the MoCI later issued Regulation No.19/PER/M.KOMINFO/09/2011 dated September 14, 2011 (“MoCI Regulation No.19/2011”), which released operators on the 2.3GHz radio frequency from the obligation to use the particular technology specified in the bid terms for the 2.3 GHz radio frequency, which were set out in MoCI Regulation No.22/PER/M.KOMINF0/04/2009 April 24, 2009 (“MoCI Regulation No.22/2009”). Pursuant to MoCI Regulation No.19/2011, operators on the 2.3 GHz radio frequency are now permitted to freely choose their technology in providing BWA on the 2.3 GHz radio frequency, subject to a requirement that they pay an annual usage rights fee for the third through the tenth year of the license period in which a technology divergent from that specified in MoCI Regulation No.22/2009 is used. On January 9, 2012, MoCI announced that it plans to make available for bidding additional 2.3 GHz radio frequency in the 2300-2360 MHz range for BWA services utilizing neutral technology.
MoCI Regulation No.19/2011 also stipulates domestic component obligations for telecommunications devices and equipment used in providing BWA on the 2.3 GHz radio frequency. Initial domestic component obligations are 30% for subscriber stations and 40% for base stations, to be increased to 50% within five years.
As a result of the switch to neutral technology under MoCI Regulation No.19/2011, we lost vendor support for our preferred technology, which is based on fixed BWA technology. Vendors instead preferred to support the mobile BWA technology selected by other operators. Mobile BWA technology competes with Telkomsel. We therefore returned 4 of the 5 zones, which we had received. We retained our BWA license for Maluku zone so we would continue to qualify as a BWA operator on 2.3 GHz and have the right to access the BWA networks maintained by other operators.
Becoming a broadband wireless access operator is in line with the transformation of our business to TIMES, which requires us to have infrastructure that is capable of responding to an increasingly complex market and the demand for ever more convergent products and services, whether in the consumer, enterprise or wholesale segments.
H. Data Communication System (“SISKOMDAT”)
We provide SISKOMDAT services under DGPIO Decree No. 169/KEP/DJPPI/KOMINFO/6/2011 dated June 6, 2011 regarding License for Data Communications Systems Services Operation for PT Telekomunikasi Indonesia Tbk. This license does not have a set expiry date but will be thoroughly evaluated every five years.
I. Payment Method Using e-Money
Following the implementation of Bank Indonesia’s Regulation No.11/11/PBI/2009 and Circular Letter of Bank Indonesia No.11/10/DASP each dated on May 13, 2009 regarding how to use card-based payment instruments (“APMK”) and Bank Indonesia’s Regulation No.11/12/PBI/2009 and Circular Letter of Bank Indonesia No.11/11/DASP each dated May 13, 2009 on e-money, Bank Indonesia has redefined the meaning of “principal” and “acquirer” in operating APMK and e-money business. In light of these regulations, Bank Indonesia confirmed our status as an issuer of e-money based on letter of Directorate of Accounting and Payment System of Bank Indonesia No.11/13/DASP dated May 25, 2009. We operate our e-money business under the brand names “T-cash” and“Flexi cash”.
With the issuance of Bank Indonesia Circular Letter No. 9/9/DASP dated January 19, 2007, Telkomsel is also permitted to conduct APMK activities, with the launch of TelkomselTunai prepaid card.
J. Remittance Service
Based on a license from Bank Indonesia No.11/23/Bd/8, dated August 5, 2009, we may operate as a money transfer services provider. We provide a money transfer services product called Delima.
K. IPTV
On April 27, 2011, we and TelkomVision together obtained a license to operate IPTV services through MoCI Decree No.MCIT.160/KEP/M.KOMINFO/04/2011 regarding the Telkom and TelkomVision IPTV Service Consortium Agreement. We now provide IPTV services in five locations: Greater Jakarta, Bandung, Semarang, Surabaya and Bali, under the brand “Groovia TV”.
L. Construction Services Business License (“IUJK”)
On June 6, 2012, the City Government of Bandung issued a construction services business license to us through IUJK No. 1-3273-858971-2-001772 for Telkom. The IUJK is valid for the execution of construction services throughout the domain of the Republic of Indonesia, comprising architecture, civil, mechanical and electrical works. The IUJK is valid until June 5, 2015.
- 45 -
Telecommunications Services Tariffs
We set our telecommunications tariffs in accordance with government regulations. Under Law No.36/1999 and Government Regulation No.52/2000, tariffs foroperating telecommunications network and/orservices are determined by providers based on the tarifftype, structure and with respect totheprice cap formula set by the Government.
A. Fixedlinetelephonetariffs
The Government has issued a new adjustment tariff formula which is stipulated in the MoCI Decree No.15/PER/M.KOMINFO/4/2008 dated April 30, 2008 concerning “Procedure for TariffDetermination for Basic Telephony Service which Connected through Fixed Line Network”.
Under the Decree,thetariff structure for basic telephony services which is connected through fixed line network consists of the following:
- activation fee
- monthly subscription charges
- usage charges
- additional facilities fee.
B. Mobilecellulartelephonetariffs
On April 7, 2008, the MoCI issued Decree No.09/PER/M.KOMINFO/04/2008(“MoCI Decree 09/2008”) regarding “Mechanism to Determine Tariff of Telecommunication Services which Connected through Mobile Cellular Network” which provides guidelines to determine cellular tariffs with a formula consisting of network element cost and retail services activity cost.
Underthe Decree, the cellular tariffs of operating telecommunication services which connected through mobile cellular networkconsist ofbasic telephony services tariff, roaming tariff and/or multimedia service tariff, withthe following structure:
- activation fee
- monthly subscription charges
- usage charges
- additional facilities fee.
C. Interconnectiontariffs
ITRA, in its letter No.227/BRTI/XII/2010 dated December 31, 2010, decided to implement new interconnection tariffs effective from January 1, 2011 for cellular mobile network, satellite mobile network andfixed local network and effective from July 1, 2011 for fixed wirelesslocal network with a limited mobility.
Based on Director General of Post and Informatics Decree No.201/KEP/DJPPI/KOMINFO/7/2011 dated July 29, 2011, ITRA approvedour revision of RIO regardingthe interconnection tariff.ITRA, in its letter No.262/BRTI/XII/2011 dated December 12, 2011, decided to change the basis for interconnection SMS tariff from Sender Keep All (“SKA”) basis into cost basis (“Non-SKA”) effective from June 1, 2012, for all telecommunication provider operators.
D. Networkleasetariffs
Through the MoCI Decree No. 03/PER/M.KOMINFO/1/2007 dated January 26, 2007 concerning “Network Lease”, the Government regulated the form, type, tariff structure, and tariff formula for services of network lease. Pursuant to the MoCI Decree, the Government released Director General of Post and Telecommunication Decision Letter No. 115 of 2008 dated March 24, 2008 which stated “The Agreement on Network Lease Service Type Document, Network Lease Service Tariff, Available Capacity of Network Lease Service, Quality of Network Lease Service, and Provision Procedure of Network Lease Service in 2008 Owned by Dominant Network Lease Service Provider”, in conformity with our proposal.
E. Tariff forotherservices
The tariffs for satellite lease, telephony services and other multimedia services are determined by the service provider by taking into account the expenditures and market price. The Government only determines the tariff formula for basic telephony services. There is no stipulation for the tariff of other services.
F. IMEtariffs
In providing IME services, our NewEconomy Business, we work with a number of partners. These collaborations are based on considerations of capability,time to market and idea creation. Tariffs for our IME services are determined in agreement with these partners based on the scheme of cooperation between us and each respective partner.
Trademarks, Copyrights, Industrial Designs and Patents
We constantly develop product and service innovations in line with a dynamic business portfolio. To provide both protection for and recognition of the creativity involved, we have registered a number of intellectual property rights,including trademarks, copyrights, industrial design and patents, with the Directorate General of Intellectual Property Rights at the Ministry of Law and Human Rights of the Republic of Indonesia.
- 46 -
The intellectual property rights we have registered include: (i) trademarks for our products and services, corporate logo and name; (ii) copyrights on our corporate name and logo, product and service logos, computer programs, research and songs; and (iii) simple and ordinary patents on technological inventions in the form of telecommunications products, systems and methods.
There were no newtrademarks registered by us in2012.
The following list the copyrights that we registeredin 2012:
No. | | Innovation Title | | Application No. | | Application Date | | Registration Date |
1 | | Computer program “AGENCY (Advance Guideline tool for Engineering of Central frequency)” | | C00201003559 | | October 1, 2010 | | January 18, 2012 |
2 | | Computer program “Advertising Management System (AMS)Application” | | C00201004516 | | December 23, 2010 | | February 3, 2012 |
3 | | Computer program “Flexi Games” | | C00201004515 | | December 23, 2010 | | February 3, 2012 |
4 | | Computer program “Flexi Comic” | | C00201004517 | | December 23, 2010 | | February 3, 2012 |
5 | | Computer program “Language Learning Application for The Deaf I-CHAT (I Can Hear And Talk)” | | C00201003117 | | August 24, 2010 | | February 1, 2012 |
We applied for the following intellectual property rights in 2011 and 2012:
No. | | Innovation Title | | Type of Intellectual Property Rights | | Application No. | | Application Date | | Registration Date |
1 | | Label Kartu Telepon Umum Wireless (tanpa kabel)-Telkom Sobat | | Industrial design | | A00200802007 | | July 8, 2008 | | September 21, 2011 |
2 | | Flexi Market | | Copyrights | | C00201103620 | | September 22, 2011 | | |
3 | | Session Initiation Protocol Client | | Copyrights | | C00201104855 | | December 20, 2011 | | |
4 | | City Info H! Bandung | | Copyrights | | C00201104854 | | December 20, 2011 | | |
5 | | Location Based Social Networking | | Copyrights | | C00201104856 | | December 20, 2011 | | |
6 | | Equipment and Method for Emergency Broadband Access Network (“EBAN”) | | Patents | | P00201200068 | | February 6, 2012 | | |
Network Development
A. Fixed Line Network Development
In 2012,we continued to enhanceour network infrastructure and develop our IDN.Our IDN plans represent our commitment to continue developing and improving the quality, efficiency and cost-structure ofour network infrastructure. In line with our transformation into a TIMES provider, we are focused on delivering: (i)high speedbroadband access through a fiber optic network and through WiFi (which we term “id-Access”), (ii) IP-basedoptical backbone networks (“id-Ring”) and (iii)an integrated NGN forthe provision ofmultipleservices (“id-Con”).
Project | | Description |
Java-Sumatra-Kalimantan Project (“Jasuka”) | | We continue to expandJasuka submarine infrastructure backbone to support internal needs and demand for domestic and international internet services. During 2012, we installed a total additional capacity of seven Lambda (comprising 70 Gb) for Ring 3, which links Batam, Kalimantan, Sumatra and Jakarta. |
Mataram-Kupang Palapa Ring Project | | In 2012, we expanded this project, which provides network link between Mataram and Kupang through interconnections between the islands of Lombok, Sumbawa, Sumba, Flores and Timor by the completion of the Kupang-Atambua landline backbone cable, in December 2012. |
Development and Modernizationof Broadband Access through the TITO Scheme | | In2011, we commenced our broadband access development and modernization program through the application of the TITO method, pursuant to which our existing copper cables are replaced with more modern optical cables that are backed by active device technologies such as MSAN, GPON and FTTx. We work with PT INTI and PT LEN in implementing this TITO program. In 2012, we successfully migrated an additional 342,335 customers to fiber optic access to the TITO program. |
Broadband Access Development with MSAN (Multi Service Access Node) Platform | | As of December 31, 2012, we had expanded our MSAN broadband network platform to have a capacity of 1,433,525 connections. At present, three MSAN platforms are in use to provide coverage throughout Indonesia. In 2012, 550,969 additional MSAN broadband access connections were completed. |
Fiber To The Home Development Project | | We expanded our gigabyte passive optical network in 2012 with 102,465 Optical Network Terminals as part of the deployment of ourfiber to the home development project. In 2013, we plan to continue the expansion of our broadband access infrastructure, prioritizing the utilization of gigabyte passive optical network technology to expand the implementation of the fiber to the home network. |
IMS (IP Multimedia Subsystem) Development | | IMS developmentis part of our infrastructure transformation and is intended to modernize our service nodes by providing IP capability, convergence, and enabling new application-based services that will allow us to integrate new customers and migrate existing customers towards multi-services and multi-screen features. In 2012, four IMS nodes were built and operated commercially, serving 570,000 customers. In 2013, we plan to expand the commercialization of our IMS. |
TSCS (Tarakan Sangata Cable System) and SBCS (Sumatra Bangka Cable System) | | To increase network capacity and build highly reliable transport backbone,we started the construction of the Sumatra-Bangka and Tarakan-Sangata submarine transport systems in 2011. The SBCS project was completed in 2012, while the TSCS project is planned for completion in March 2013. |
Regional DWDM (Dense Wavelength Division Multiplexing) Project | | To meet the substantial growing domestic demand for internet service in the regional metro segment, we expanded the DWDM transport capacity at the regional metro level in Java by adding an additional 44 nodes in 2012. The regional DWDM project was completed in December 2012. |
Implementation of the Telkom Cache System | | Webegan the construction of the Telkom Cache System in 2012 in order to increase efficiency in the usage of our international internet bandwidth as well as to improve the quality of our internet service. We successfully installed the Telkom Cache System at ten locations throughout Indonesia in August 2012. Measurements conducted in August 2012 showed that the implementation of Telkom Cache System can potentially save up to 25% of bandwidth. We plan to expand the Telkom Cache System to 14 new locations during 2013. |
Sulawesi, Maluku, Papua Cable System Project | | In 2012, we began the construction of the Sulawesi, Maluku, Papua Cable System Project in order to expand the scope of our fiber-optic-based submarine transport backbone in eastern Indonesia. This project is expected to provide a maximum capacity of 40 x 100 Gbps and an initial capacity of 1 x 100 Gbps during the first phase. The Maluku-Sulawesi segment of the cable system, which is considered the first phase of this project, is expected to be completed in November 2013, with the entire project planned for completion in March 2014. |
Jakarta-Batam-Singapore Cable System Project | | We continued to improve the capacity and reliability of our network for international broadband internet service through the development of Jakarta-Batam-Singapore cable system with capacities of 1 x 40 Gbps and 9 x 10 Gbps. The Jakarta-Batam segment was completed in December 2012, while the Batam-Singapore segment will be completed in February 2013. |
In an order to strengthen our TIMES services,we plan to:
1. Continue to improveour networks to realizeour vision to providethe digital home environment,improveenterprise broadbandservices and broadband services everywhere in Indonesia.
2. Continue to improve the capability ofthefull-IP data transport network through the following programs:increasing domestic and international internet bandwidth,expanding the Terra IP backbone,expanding IP overlambda with 10 Gbps, 40 Gbps and eventually 100 Gbpsper lambda, facilitating convergence and realizing synergies among our Group’s networks,continuing the development of Metro Ethernet whichfunction asasingle metro transportnetworkto provide IP and multi-play-based services,continuing the developmentof fiber to the home, as well ascontinuing to replace our existing copper cables with fiber optic cables through the trade-in/trade-outmechanism.
3. Implementsmart core through the converged IMS program basedplatform, implementanintegrated customerprofiledatabase, andimplement a service delivery platform as a service brokerage and orchestration.
4. Expand broadbandcoverage toenterprise andresidential customers through a series of programs, including enterprise managed services, managed smart CPE, home automation, surveillance, and home interconnect.
For more details of our other major commitments and agreements, see Note 37 to our Consolidated Financial Statements.
B. Fixed Wireless Network Development
In 2012,weoptimized our existing BTSs and relocated BTSs from areas with low traffic to intercity area to increase utilization. As of December 31, 2012,our fixed wireless network had 5,714 BTSs with a total capacity of 32.3 million Flexi connections. We continue to expand the coverageof our Flexi mobile broadband service by implementing Evolution Data Optimization (“EVDO”) technology, adding a total of 1,157 EVDO BTS with a total capacity of 350,571 connections as of December, 31, 2012. A number of other programs were also introduced to improve our operating cost efficiency, such asupgrading to more efficient cooling systems for our BTSs.
- 48 -
C. Cellular Network Development
GSM-based cellular services operated by our subsidiary, Telkomsel, now cover all cities and regencies in Indonesia. In 2012, Telkomsel deployed an additional 11,674 BTS (including 5,925 3.5G nodes) and 5,373 central tranceiversand expanded its cellular network to reach all sub districts in Java, Bali, Nusa Tenggara, and Sumatra.
D. Data Network Development
In 2012,we continued to improvethequalityof our data network by increasing ourcapacity andnetwork coverage. During the year,we increasedour MSAN-based broadband access to 893,896 homepass and fiber to the home-based broadband access to 95,709 homepass. As ofDecember 31, 2012,we operated broadband access with atotalcapacity of 4,692,015 homepass with broadband access.We also expandedthe capacity and coverage ofourmetro ethernetand expandedthecoverage and capacity of IP Core through the implementation of 10 Gbps and 40 Gbps lambda IP-based network services andtheimplementation ofterra router. In 2012,we added an additional threeterra router nodesbringing the total number of terra router nodesthat we operate to 22 as of December 31, 2012, providing nation-wide coverage in Indonesia.
As part of our IDN program, weimproved our IP Core network used which supports our TIMES businesses and integrated our NGN core network between with our fixedwireline and fixed wireless businesses. Our IP Core was developed through the implementation of a single platformterra-byte router withfully redundant network architecture.AsofDecember 31,2012,our IP core networkconsisted of 40 core router nodes, 545 PE(primary edge)router nodes,560 10GBEthernet ports and 750 GBEthernet ports.
We expanded ourmetro ethernet network by setting up and upgrading 281 nodes. As of December 31, 2012, we operate a total of 1,005 metro ethernet nodes which makes us capable of providing bandwidth services throughout Indonesia. The metro ethernet network is also used as the main linkfor the IP DSLAM, MSAN for Speedy broadband service, softswitch, IP VPN and GPON broadband, whether for mobile backhaul, corporate business solutions or triple play services. By the end of 2012, we added 1,165 node B BTSs, making for a total of 4,317 nodes B BTSs.
As of December 31, 2012,we had expandedour internetgateway capacity to an installed capacity of 106.4 Gbps with 103.8 Gbps utilization in orderto ensure adequate internet gateway capacity in anticipation of the expected rapid growth in fixed and mobile broadband traffic. In 2012,we also cooperated with Akamai, Google and Yahoo to operate acontent distribution network with a capacity of 201 Gbps with 75 Gbps utilization.
Corporate Strategy
In 2012,we continued to adapt to the dynamics of the industry by updating our corporate strategic initiatives with a focus on implementing the TIMES business framework and strengthening our internal consolidation.We believe that these strategic initiatives support the comprehensive transformation of our organization, business portfolio, infrastructure, systems, and corporate culture that webelieve is necessary to realize our vision of becoming a leading TIMES company in the region.
Besides providing a new growth stream, we believe thatour IMES business also help to promote the sustainable growth of our traditional telecommunications business.
Moreover, weseek to promote synergiesamong our telecommunications services and have taken inorganic growth opportunities by expanding into overseas markets such as Singapore (international carrier services), Malaysia (a contact center), Hong Kong (mobile virtual network operator) and Timor Leste (cellular).
Our strategies to achieve our objectives in 2012 consisted of the following:
a. Achieve sustainable competitive growth
b. Transform and empower:
- Transform the legacy business and culture
- Empower business units to drive growth
c. Unlock portfolio value:
- Strengthen our core businesses
- Invest in New Economy Business and, international and strategic opportunities
We plan to achieve these three broad strategies through the following 10 strategic initiatives:
1. Center of Excellence
In order to improve our business performance and implement a new corporate culture we have established the“Telkom Corporate University”, which aims to educate our employees in order to meet international standards in the TIMES industry.
- 49 -
2. Aligning our business structure and portfolio management
To optimize the management of our TIMES business portfolio, we have established guidelines in order to better manage the business interaction between us as parent company and our business units and subsidiaries.
3. Facilitating broadband implementation through service convergence
This strategic initiative aims to establish broadband as a middleware in the digital economy era by functioning as a complement for all industry segments, ultimately leading to the positioning of broadband as the fourth utility after water, electricity and fuel oil.
4. Management of wireless portfolio
A strategic initiative to optimize the value ofour wireless portfolio as the preferred provider of mobile lifestyle services in the region.
5. Integrating our Group’s Ecosystem Solutions
This strategic initiative aims at providing solutions to meet the needs of customers as an ecosystem, with the objective of creating a lock-in system and customer experience management by optimizing internal and external resources with the support of an integrated customer relationship management system.
6. Investing in information technology services
Investing in information technology ("IT") services is a strategic initiative to enter the IT industry and enhance our ability to provide solutions and improve the performance of other industry segments. This strategic initiative also aims at reducing the capability gap as a provider of information and communication technology solutions to the consumer, enterprise and SME customers.
7. Investing in media and edutainment business
As part of the convergence of TIMES businesses, we have a strategic initiative to invest in media and edutainment business, and assume the role of a content aggregator and delivery point.
8. Investing in the wholesale business and strategic international business opportunities
This strategic initiative aims at maximizing our value as the preferred provider of world-class wholesale telecommunication services. This strategy also helps in consolidating our position in the international markets as well as in overseas business expansion with due consideration to investment attractiveness and risks.
9. Maximizing asset value in inter-related businesses
This initiative is directed towards optimizing the non-productive assets within our Group through cooperation with third parties.
10. Integrating our NGN and OBCE initiatives to achieve costs improvements
This strategic initiative represents the transformation of our infrastructure in order to improve efficiency and capability. This initiative is also intended to support the Master Plan for the Acceleration and Expansion of Indonesia's Economic Development as well as to benefit from new business opportunities to deliver multi-play and multi-screen services to customers. It also reflects the transformation of IT into an enabler for implementation of Consolidated Data, Consolidated Billing and Integrated CRM in our Group.
Inorganic growth is part ofour broad strategy of achieving “sustainable competitive growth”.Our inorganic growth strategycomprises a number of factors, including:
- The need to maintain overall growth to compensate the stagnation/decline of our legacy business.
- The need to mitigate risks (e.g. capital and competency risks) as well as to secure rapid synergy formation and value creation.
- Acquisition and alliances of New Economy Business for new revenue generator.
- International business expansion to increase scale and benefits, and to monetize our domestic and international assets.
In 2012,we focused on new economy acquisitions and alliances that offer high revenue growth rates and increased valuation involving our IMES portfolio. Our IMES portfolio also serves as a revenue driver for our telecommunication business portfolio (the “T”in “TIMES”).We undertook a selective process in connection with acquisitions and alliancesafterconsidering of the following factors:
- The creation of optimum synergic value with our existing businesses;
- The potential to increaseour revenues, EBITDA margin and valuation; and
- Income contribution of the prospective entity.
We engaged in a number of corporate actions throughout 2012 with respect to inorganic business development, including:
- Acquisition ofadata center in Sentul to support our Telkom Cloud business;
- 50 -
- Establishment of a company by TelkomMetra with Pelindo II to provide logistical IT solutions for seaports;
- E-health initiatives in support of an integrated healthcare services;
- Development of Mitratel; and
- Organization transformation in support of the development of broadband services.
C. ORGANIZATIONAL STRUCTURE
Information on Subsidiaries and Associated Companies
We have experienced continuous organic and inorganic growth. Organic growth is achieved through expansion of our existing operations and creating synergies between our subsidiaries. Inorganic growth is accomplished through acquisition of companies that we deemed were capable to add strategic value to our entire Group and contributing to the long-term revenue growth and sustainability of business.
The following table illustrates our corporate structure as of December 31, 2012, including our direct and indirect equity ownership in our subsidiaries.
A complete list of our subsidiaries and investments in associated companies, and our ownership percentage of each entity, as of December 31, 2012, is set forth below and is contained in Notes 1d and 10 to our Consolidated Financial Statements included elsewhere in this report.
Direct Subsidiaries
Companies | | Percentage of Ownership Interest | | Nature of Business | | Operational Status | | Description |
PT Telekomunikasi Selular (“Telkomsel”) | | 65% | | Telecommunication | | Operational | | Telkomsel, established on May 26, 1995, provides telecommunication facilities and mobile cellular services. |
PT Multimedia Nusantara (“Metra” or “TelkomMetra”) | | 100% | | Multimedia and line telecommunication services | | Operational | | TelkomMetra, acquired on May 9, 2003, is our NEB holding company. TelkomMetra focuses on network construction, development, maintenance and services, and multimedia services (data communications systems, portal and on-line transaction services). |
PT Telekomunikasi Indonesia International (“TII” or “Telin”) | | 100% | | Telecommunication | | Operational | | Telin provides fixed line telephone services (KSO-III West Java & Banten) and international telecommunications. Acquired on July 31, 2003. Telin is responsible for managing our overseas business. |
PT Pramindo Ikat Nusantara (“Pramindo” or “PINs”) | | 100% | | Telecommunication construction and services | | Operational | | PINs was originally established to operate our KSO in Sumatra. It was acquired on August 15, 2002. |
PT Dayamitra Telekomunikasi (“Dayamitra” or “Mitratel”) | | 100% | | Telecommunication | | Operational | | Mitratel provides fixed line telephone services, supply of telecommunications facilities and infrastructure and telecommunications services. Acquired on May 17, 2001, Mitratel transformed itself by entering the telecommunications infrastructure supply business, which includes supplying telecommunications towers to meet the BTS installment needs of telecommunications operators all over Indonesia. |
PT Indonusa Telemedia (“Indonusa” or “TelkomVision”) | | 100% (including through 0.46% ownership by TelkomMetra) | | Pay television and content services | | Operational | | Established on May 7, 1997, TelkomVision is a multimedia (pay-TV, internet service) service provider. Since 2007, TelkomVision was the first Pay TV operator in Indonesia to launch DTH Prepaid (Prepaid Satellite Pay-TV), under the “TelkomVision” brand. |
PT Graha Sarana Duta (“GSD” or “TelkomProperty”) | | 99.99% | | Leasing of offices and providing building management and maintenance services, civil consultant and developer | | Operational | | Acquired on April 25, 2001, TelkomProperty operates throughout Indonesia and manages buildings owned by us and third parties. |
PT Napsindo Primatel Internasional (“Napsindo”) | | 60% | | Telecommunication | | Ceased operation | | Napsindo provided Network Access Point (“NAP”), Voice Over Data (“VOD”) and other related services. Established on December 29, 1998, Napsindo ceased operation as at January 13, 2006. |
PT Telkom Akses (“Telkom Akses”) | | 100% | | Construction services and trade in the field of telecommunication | | Dormant | | Telkom Akses was established on November 26, 2012. |
- 51 -
Indirect Subsidiaries
Companies | | Percentage of Ownership Interest | | Nature of Business | | Operational Status | | Description |
PT Infomedia Nusantara (“Infomedia”) | | 51% ownership by TelkomMetra and 49% ownership by Company | | Data and information service – provides telecommunication information services and other information services in the form of print and electronic media and call center services | | Operational | | Infomedia was acquired on September 22, 1999 to operate KSO in Sumatra. Infomedia has transformed its business from the original three pillars (directory services, contact center services and content services) to Business Process Outsourcing and Digital Media and Rich Content services. |
PT Sigma Cipta Caraka (“Sigma” or“telkomsigma”) | | 100% ownership by TelkomMetra | | Information technology service – system implementation and integration service, outsourcing and software license maintenance | | Operational | | Telkomsigma was established on May 1, 1987 and provides IT solution services. |
Telekomunikasi Indonesia International Pte. Ltd. (���Telin Singapore”) | | 100% ownership by Telin | | Telecommunication | | Operational | | Telin Singapore was established on December 6, 2007, pursuant to the laws of Singapore. Its range of telecommunication services includes but is not limited to internet-based voice and data services, managed data services, call back/call re-origination, prepaid calling card services and the resale of leased circuit services. |
PT Metra Plasa (“Metra Plasa”) | | 60% ownership by TelkomMetra | | Website development services | | Operational | | TelkomMetra established Metra Plasa with eBay International AG on April 9, 2012. |
PT Administrasi Medika (“Ad Medika”) | | 75% ownership by TelkomMetra | | Health insurance and administration services | | Operational | | Ad Medika, established on February 25, 2010, handles online claims between hospitals and health insurance providers. |
PT Finnet Indonesia (“Finnet”) | | 60% ownership by TelkomMetra | | Banking data and communication | | Operational | | Finnet was established on October 31, 2005, as a provider of IT infrastructure, applications and content for information systems and financial transactions for the banking and financial services industry. |
PT Telkom Landmark Tower (“TLT”) | | 55% ownership by TelkomProperty | | Service for property, development and management | | Operational | | TelkomProperty established TLT with Yayasan Kesehatan (Yakes) Telkom on February 1, 2012. |
Telekomunikasi Indonesia International Ltd. (“Telin Hong Kong”) | | 100% ownership by Telin | | Telecommunication | | Operational | | Telin Hong Kong was established in Hong Kong on December 8, 2010 and has obtained Unified Carrier License on March 1, 2011 for providing public telecommunications network service, establishing and maintaining telecommunications network, and possessing and using the radio communications installation to provide services. |
PT Metranet (“Metra-Net”) | | 100% ownership by TelkomMetra | | Multimedia portal service | | Operational | | Metra-Net was established on April 17, 2009. |
Telkomsel Finance B.V. (“TFBV”) | | 100% ownership by Telkomsel | | Finance | | Operational | | TFBV was established in Amsterdam, the Netherlands on February 7, 2005, for the purpose of borrowing, lending and raising funds, including the issuance of bonds, promissory notes and other securities or documentary debt instruments. |
Aria West International Finance B.V. (“AWI BV”) | | 100% ownership by Telin | | Trade and finance services | | Ceased operation | | AWI BV was established on June 3, 1996 and ceased operation on July 31, 2003. |
Telekomunikasi Selular Finance Limited (“TSFL”) | | 100% ownership by Telkomsel | | Finance | | Operational | | TSFL was established on April 22, 2002 to raise funds for the development of Telkomsel’s business through the issuance of debenture stock, bonds, mortgages or any other securities. |
Telekomunikasi Indonesia International (TL) S.A. (“Telin Timor Leste”) | | 100% ownership by Telin | | Telecommunication | | Operational | | Telin Timor Leste was established on September 11, 2012 to provide telecommunications services in Timor Leste. Telkomcel, its trademark of cellular services, was established on September 17, 2012 to provide mobile telecommunications services that extends across Timor Leste and broadband Internet with 3G on 850 Mhz frequency. |
PT Graha Yasa Selaras (“GYS”) | | 51% ownership by TelkomProperty | | Tourism service | | Dormant | | TelkomProperty established GYS with Yakes Telkom on April 27, 2012 to focus on hospitality services. |
- 52 -
Associated Companies
Companies | | Percentage of Ownership Interest | | Nature of Business | | Operational Status | | Description |
Scicom (“MSC”) Bhd (“Scicom”) | | 29.71% ownership by Telin | | Call center service | | Operational | | Established in 1997, Scicom is a contact centre provider based in Malaysia. |
PT Integrasi Logistik Cipta Solusi (“ILCS”) | | 49% ownership by TelkomMetra | | e-trade logistic services and other related services | | Operational | | TelkomMetra established ILCS with Pelindo II on September 21, 2012 to provide logistical IT solutions for seaports. |
PT Patra Telekomunikasi Indonesia (“Patrakom”) | | 40% | | Satellite communication system services, related services and facilities to companies in the petroleum industry | | Operational | | Patrakom was established on September 28, 1995. |
PT Citra Sari Makmur (“CSM”) | | 25% | | Very Small Aperture Terminal (“VSAT”), network application services and consulting services on telecommunications technology and related facilities | | Operational | | CSM was established on February 14, 1986. |
PT Pasifik Satelit Nusantara (“PSN”) | | 22.38% | | Satellite transponder leasing and satellite-based communication services in the Asia Pacific region | | Operational | | Established on July 2, 1991, PSN held its initial public offering of its ordinary shares in June 1996, listing them on the National Association of Securities Dealers Automated Quotations (“NASDAQ”), but was delisted on November 6, 2001 in connection with its failure to meet certain NASDAQ National Market Listing conditions. |
| | | | | | | | |
| |
| |
| |
| |
|
Joint Venture Companies | |
| |
| |
| |
|
Company | | Percentage of Ownership Interest | | Nature of Business | | Operational Status | | Description |
PT MelonIndonesia (“Melon”) | | 51% ownership by TelkomMetra | | Digital Content Exchange Hub services (“DCEH”) | | Operational | | Melon is a joint venture company between TelkomMetra and South Korea Telecom. Melon was established on August 16, 2010. This company, which grew out of our expansion into the Media & Edutainment business, provides digital music and related content services for cell phones, personal computers, consumer electronic channels and other digital media. |
- 53 -
Telkom’s Subsidiaries Chart
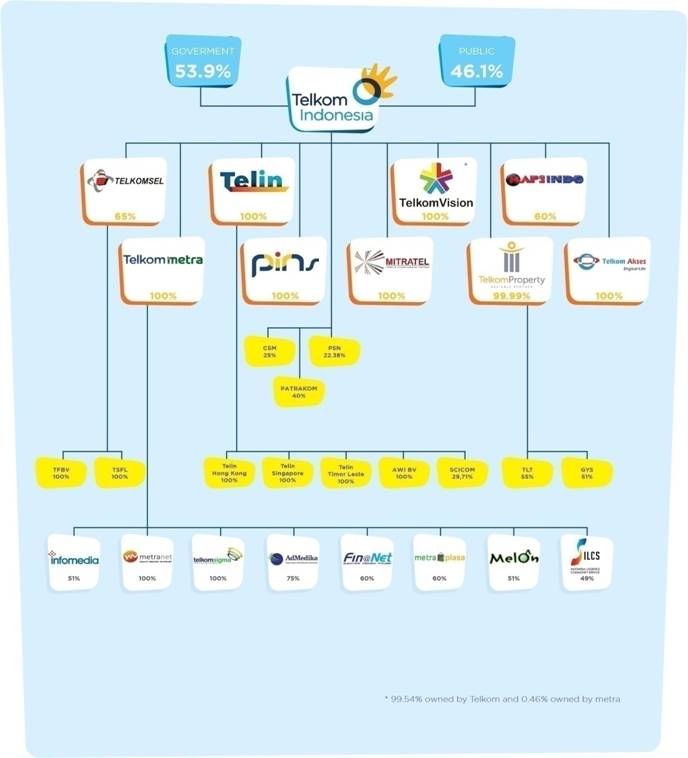
Information on Our Organizational Structure
We have established a grand strategy towards sustainable competitive growth, involving the following objectives:
1. Organic growth to be achieved through the strengthening of our core businesses by focusing on a strategy of customer segmentation, namely consumer, enterprise, wholesale and international services segments, further supported by the installation of 10 million plain old telephone services and 5 million Speedy lines.
2. Inorganic growth to be achieved through a strategy of related diversification involving new business development, management of strategic portfolio, and building synergy between us andour subsidiaries.
- 54 -
We believe that the effective implementation of the above strategieswill require the following:
1. A Director that focuses on the wholesale and international segment.
2. A Director that focuses on business portfolio development.
3. A mechanism or parenting model that will promote synergy between us, as parent company, and our subsidiaries as well as among our subsidiaries.
Accordingly,we initiated a number of changesin 2012involving the division of duties and authorityof the Board of Directors, as follows:
1. Transfer of duties and authority over the wholesale and international business segment,which was formerly under the Director of Enterprise and Wholesale (“EWS”) to the Director of Compliance and Risk Management (“CRM”). This allows the Director of EWS to focus moreon developing the enterprise business segment.
2. Expanding the duties and authority of the Director of CRM to handle the wholesale and international business segment, in addition to the duties and authority as Director of CRM.
3. Realignment of the duties and authority of the Director of IT Solution & Strategic Portfolio (“ITSSP”) to focus more on business portfolio innovation and development, by transferring some of the activities of the ITSSP Directorate, especially those related to management of IT and tariff, to be managed under the Network and Solution (“NWS”) Directorate.
4. Expanding the duties and authority of the Director of NWS to handle the management and utilization of IT as well as service operation & management, to provide better support for established businesses.
In addition,we established anexecutive board to promotesynergies within our Group. Comprising four President Directors ofour subsidiaries, theexecutive board servesinan advisory role related to strategy formulation, planning, policy making and performance monitoring for our cellular business, international business, IME business, and tower business.
Telkom’s Organizational Structure
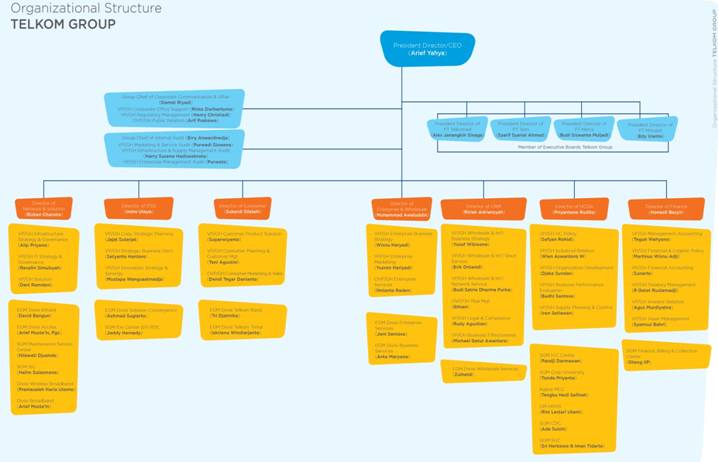
- 55 -
Directorate | | Function and Authority |
Network & Solution Directorate | | Focuses on managing the Infrastructure Strategy & Governance, IT Strategy & Governance, and Solutions, as well as the management of IT utilization and service operations & management in order to support the development of established businesses, and also controlling infrastructure through the Telecommunication Infrastructure Division, Access Division, Maintenance Service Center, Information System Center, Wireless Broadband Division and Broadband Division. |
IT Solution & Strategic Portfolio Directorate | | Focuses on managing the functions of Corporate Strategic Planning, Strategic Business Development, Innovation Strategy & Synergy, as well as controlling the Solution Convergence Division and Innovation & Design Center. |
Consumer Directorate | | Focuses on managing the consumer business segment and the operational management of the Western Consumer Services Division and Eastern Consumer Services Division. |
Enterprise & WholesaleDirectorate | | Focuses on managing the enterprise & wholesale business segment as well as managing the Enterprise Services Division and Business Services Division. |
Compliance & Risk ManagementDirectorate | | Focuses on managing the Risk Management, Legal and Compliance, Business Effectiveness and Security & Safety, and in addition, managing the wholesale and international business segment as well as controlling the Wholesale Services Division. |
Human Capital & General Affairs Directorate | | Focuses on the managing our human resources as well as the operational management of human resources centrally through the Human Capital Center unit, as well as controlling the Corporate University, HR Assessment Center, Management Consulting Center, Community Development Center, and Supply Center operational units. |
Finance Directorate | | Focuses onour financial management, managing financial operations centrally through the Finance, Billing & Collection Centerunit. |
D. PROPERTY, PLANT AND EQUIPMENT
Our property and equipment is used for telecommunication operations, which mainly consist of transmission installation and equipment, cable network and switching equipment. A description of these is contained elsewhere in Note 11 to our Consolidated Financial Statements.
Except for ownership rights granted to individuals in Indonesia, reversionary rights to land rests with the Republic of Indonesia, pursuant to Agrarian Law No.5/1960. Land title is designated through land rights, including Right to Build (Hak Guna Bangunanor HGB) and Right of Use (Hak Guna Usahaor HGU). Land title holders enjoy full use of the land for a specified period, subject to renewal and extensions. In most instances, land rights are freely tradable and may be pledged as security under loan agreements.
We own several pieces of land located throughout Indonesia withright to buildand use for a period of 20-45 years, which will expire between 2012 and 2052.We believe that there will be no difficulty in obtaining the extension of the land rights when they expire.
As of December 31, 2012, we, including our subsidiaries, had land use rights to 2,913 properties. We hold registered rights to buildand usefor most of our properties. Pursuant to Government Regulation No.40/1996, the maximum initial period for the right to build is 30 years, renewable for an additional 20 years. We are not aware of any environmental issues that could affect the utilization of our property and equipment. All assets owned byourCompany and certain subsidiaries have been pledged as collateral for bonds and Medium Term Notes. Certain property and equipment ofour subsidiaries with gross carrying value amounting to Rp2,841 billion as of December 31, 2012 have been pledged as collateral for lending agreements. See Notes 17 and 18 of our Consolidated Financial Statements.
Insurance
Our property and equipment, excluding land, are insured against risks arising from earthquake, tsunami, eruption, fire, theft, lightning, acts of God and other risks. Our assets are covered under Property All Risk Insurance Policies on a sum insured basis and a first loss basis scheme. Our insurance policies also include coverage against temporary interruptions of our
business. Our Telkom-1 and Telkom-2 satellites are insured separately. Our management believes that our insurance coverage is adequate to cover potential losses from the insured risks.
On August 7, 2012, Telkom-3 satellite was launched, but failed to reach a usable orbit. Our Telkom-3 satellite was insured with coverage adequate to cover losses derived from these events. On November 2012, we received our insurance claim from PT Asuransi Jasindo for the launch failure of the Telkom-3 satellite launched inBaikonur, Kazakhstan which amounted to US$185.3 million.
ITEM 4A.UNRESOLVED STAFF COMMENTS
Not applicable.
ITEM 5.OPERATING AND FINANCIAL REVIEW AND PROSPECTS
The following discussion and analysis should be read in conjunction with our Consolidated Financial Statements for the years ended December 31, 2010, 2011 and 2012 included elsewhere in this Form 20-F. These Consolidated Financial Statements were prepared in accordance with IFRS as issued by the IASB.
- 56 -
A. OPERATING RESULTS
We are the principal provider of local, domestic and international telecommunications services in Indonesia, as well as the leading provider of mobile cellular services through our majority-owned subsidiary, Telkomsel. Our objective is to become a leading TIMES player in the region through the provision of a wide range of communication services. As of December 31, 2012, we had approximately 171.1 million subscribers in service, comprising 125.1 million cellular subscribers through Telkomsel, 8.9 million subscribers on our fixed wireline network, 17.9 million subscribers on our fixed wireless network and 19.1 million broadband subscribers. We also provide a wide range of other communication services, including telephone network interconnection services, multimedia, data and internet communication-related services, satellite transponder leasing, leased line, intelligent network and related services, cable television and VoIP services. We intend to continue to cope with market and industry challenges that may arise from time to time by leveraging our customer base, network quality, brand name and strategic execution capabilities.
The Indonesian economy provides a favorable environment for our continued business development. This is reflected in terms of average GDP growth of 5.92%, average inflation of 4.94% and stable average exchange rate between Rp8,773 to Rp10,356 from 2008 to 2012. Though the exposure of our Company and our subsidiaries to foreign exchange rates are not material, we are exposed to foreign exchange risk on sales, purchases and borrowings that are primarily denominated inUS Dollars and Japanese Yen.See Item 11 “Quantitative and Qualitative Disclosure about Market Risk – Exchange Rate Risk”.
Our revenues for the two-year period from 2011 through 2012 reflected growth in revenues. This growth was largely driven by increases in revenues from data, internet and information technology services, which increased by 15.5% driven largely by increased mobile phone data usage and mobile broadband subscriptions, and cellular revenues which increased by 7.5%.
Our operating results from 2011 to 2012 also reflected an increase in expenses. This increase was mainly driven by operation, maintenance and telecommunication services expenses and personnel expenses, which increased primarily as a result of an increase in our network capacities to better serve our customers.
Principal Factors Affecting our Financial Condition and Results of Operations
Increase in Cellular Telephone Revenues with Increase in Subscribers and Declining ARPU
Our cellular telephone revenues increased by 7.5% from 2011 to 2012 due to an increase in the number of our cellular subscribers by 16.9% in 2012. Telkomsel's revenues from cellular phone services (usage charges, monthly subscription charges and features) accounted for 40.1% of our consolidated revenues for the year ended December 31, 2011, compared to 39.8% for the year ended December 31, 2012.
We believe the shape of competition began to shift as a result of the rise in Indonesia's purchasing power which has led to an increase in smart phones purchases, which in turn has increased the demand for data services. This phenomenon is reflected in our declining monthly ARPU from approximately Rp39,000 in 2011 to approximately Rp37,000 in 2012. This decline was offset by increased revenue from data, internet and information technology services.
We believe that the competition has become more rational in Indonesia, however, we still consider it as a major risk to our businesses. See Item 3 “Key Information – Risk Factors – Risks Related to Our Business – Competition Risks Related to Our Cellular Business (Telkomsel)”.
Increase in Data, Internet and Information Technology Services Revenues
Data, internet and information technology services revenues accounted for 33.6% of our consolidated revenues for the year ended December 31,2011, compared to 35.9% for the year ended December 31,2012. Revenues from our data, internet and information technology services increased by 15.5% from2011 to2012. The increase in data, internet and information technology services revenues in2012 was primarily due to a 40.9% increase in revenues from internet, data communication and information technology services, largely driven by increased mobile phone data usage and mobile broadband subscribers. As part of our transformation into a TIMES provider, and our corporate objective of growing our new wave businesses, we seek to continue to increase such revenues.
Decrease in Fixed Lines Telephone Revenues
Our fixed lines telephone revenues decreased by 8.2% from Rp11,619 billion in2011 to Rp10,662 billion in2012 as a result of an 8.2% decrease in fixed wireline revenues and an 8.7% decrease in fixed wireless revenues, partly offset by an increase in other revenues.We believe that fixed lines telephone revenues have been declining due to the increased usage and declining tariffs of mobile cellular services and increased penetration of cellular subscribers in Indonesia. Although we expect that fixed lines telephone will continue to contribute to our revenues in the upcoming term, we also expect that the trend of declining fixed lines telephone revenues will continue.
- 57 -
Cellular and fixed wireless services provide increased convenience, and in certain cases where subscribers call other subscribers using the same provider’s network, tariffs can be lower than fixed wireline calls that are made to subscribers of another provider.
As part of our corporate strategy, we are seeking to optimize our fixed lines telephone business through various means, including increasing cost competitiveness and increasing value added services for fixed lines telephone services. We also seek to increase our fixed wireline penetration rate more quickly by reducing our capital expenditure per line through the use of fixed wireless technology and by upgrading our fixed wireline access network and legacy infrastructure to NGN infrastructure with broadband capability.
We improved performance in our fixed wireline telephone by adding a loyalty points program called “Telkom Poin Rejeki Tumpah”and implementing our fixed business improvement program, while in fixed wireless we made available wireless infrastructure with EVDO service. Our efforts resulted in an increase in fixed wireline subscribers in 2012 of 4.0% to 8.9 million and an increase in fixed wireless subscribers in 2012 by 25.5% to 17.9 million subscribers.
TELKOM'S CONSOLIDATED COMPREHENSIVE INCOME
The following table sets out our Consolidated Comprehensive Income, for 2010 through 2012. Each item is expressed as a percentage of total revenues or expenses.
| Years Ended December 31, |
| 2010 | | | | 2011 | | | | 2012 | |
| | 2012 |
| (Rp billion) | | % | | (Rp billion) | | % | | (Rp billion) | | % | | (US$ million) |
Revenues | | | | | | | | | | | | | |
Telephone | | | | | | | | | | | | | |
Cellular | | | | | | | | | | | | | |
Usage charges | 28,024 | | 40.9 | | 27,189 | | 38.1 | | 29,477 | | 38.2 | | 3,059 |
Monthly subscription charges | 488 | | 0.7 | | 569 | | 0.8 | | 696 | | 0.9 | | 72 |
Features | 582 | | 0.8 | | 838 | | 1.2 | | 558 | | 0.7 | | 58 |
Connection fee charges | 40 | | 0.1 | | 2 | | 0.0 | | - | | - | | - |
Total | 29,134 | | 42.5 | | 28,598 | | 40.1 | | 30,731 | | 39.8 | | 3,189 |
Fixed Lines | | | | | | | | | | | | | |
Usage charges | 9,287 | | 13.6 | | 8,213 | | 11.5 | | 7,323 | | 9.5 | | 760 |
Monthly subscription charges | 3,251 | | 4.7 | | 3,004 | | 4.2 | | 2,805 | | 3.6 | | 291 |
Installation charges | 179 | | 0.3 | | 135 | | 0.2 | | 112 | | 0.1 | | 12 |
Others | 223 | | 0.3 | | 267 | | 0.4 | | 422 | | 0.6 | | 44 |
Total | 12,940 | | 18.9 | | 11,619 | | 16.3 | | 10,662 | | 13.8 | | 1,107 |
Data, Internet and Information Technology Services | | | | | | | | | | | | | |
Internet, data communication and information technology services | 8,297 | | 12.1 | | 10,548 | | 14.8 | | 14,857 | | 19.3 | | 1,542 |
Short Messaging Services ("SMS") | 11,289 | | 16.5 | | 13,093 | | 18.4 | | 12,631 | | 16.4 | | 1,310 |
VoIP | 197 | | 0.3 | | 245 | | 0.3 | | 81 | | 0.1 | | 8 |
e-Business | 18 | | 0.0 | | 38 | | 0.1 | | 55 | | 0.1 | | 6 |
Total | 19,801 | | 28.9 | | 23,924 | | 33.6 | | 27,624 | | 35.9 | | 2,866 |
Interconnection | 3,735 | | 5.5 | | 3,509 | | 4.9 | | 4,273 | | 5.5 | | 443 |
Network | 1,058 | | 1.5 | | 1,301 | | 1.8 | | 1,208 | | 1.6 | | 125 |
Others Telecommunications Services | 1,861 | | 2.7 | | 2,287 | | 3.3 | | 2,629 | | 3.4 | | 273 |
Total Revenues | 68,529 | | 100.0 | | 71,238 | | 100.0 | | 77,127 | | 100.0 | | 8,003 |
- 58 -
TABLE OF CONTENTS
| Years Ended December 31, |
| 2010 | | | | 2011 | | | | 2012 | |
| | 2012 |
| (Rp billion) | | % | | (Rp billion) | | % | | (Rp billion) | | % | | (US$ million) |
Operations, Maintenance and Telecommunication Services Expenses | | | | | | | | | | | | | |
Operations and maintenance | (8,836) | | (19.1) | | (9,184) | | (18.2) | | (9,012) | | (16.7) | | (935) |
Radio frequency usage charges | (2,892) | | (6.2) | | (2,846) | | (5.7) | | (3,002) | | (5.6) | | (312) |
Concession fees and Universal Service Obligation charges | (1,177) | | (2.5) | | (1,235) | | (2.5) | | (1,445) | | (2.7) | | (150) |
Electricity, gas and water | (841) | | (1.8) | | (836) | | (1.7) | | (879) | | (1.6) | | (91) |
Cost of phone, set top box, SIM and RUIM cards | (1,067) | | (2.3) | | (967) | | (1.9) | | (687) | | (1.3) | | (71) |
Insurance | (384) | | (0.8) | | (431) | | (0.9) | | (671) | | (1.2) | | (70) |
Leased lines and CPE | (215) | | (0.5) | | (406) | | (0.8) | | (407) | | (0.8) | | (42) |
Vehicles rental and supporting facilities | (283) | | (0.6) | | (291) | | (0.6) | | (293) | | (0.5) | | (30) |
Cost of IT services | (200) | | (0.4) | | (144) | | (0.3) | | (222) | | (0.4) | | (23) |
Travelling expenses | (60) | | (0.1) | | (54) | | (0.1) | | (57) | | (0.1) | | (6) |
Others | (91) | | (0.3) | | (59) | | (0.1) | | (121) | | (0.2) | | (13) |
Total | (16,046) | | (34.6) | | (16,453) | | (32.8) | | (16,796) | | (31.1) | | (1,743) |
Depreciation and Amortization Expenses | (14,580) | | (31.5) | | (14,823) | | (29.6) | | (14,474) | | (26.8) | | (1,502) |
Personnel Expenses | | | | | | | | | | | | | |
Vacation pay, incentives and other benefits | (2,575) | | (5.6) | | (2,814) | | (5.6) | | (3,400) | | (6.3) | | (353) |
Salaries and related benefits | (2,751) | | (5.9) | | (3,001) | | (6.0) | | (3,257) | | (6.0) | | (338) |
Employees’ income tax | (796) | | (1.7) | | (1,043) | | (2.1) | | (1,022) | | (1.9) | | (106) |
Net periodic pension benefit cost | (624) | | (1.3) | | (629) | | (1.3) | | (715) | | (1.3) | | (74) |
Early retirement program | - | | - | | (517) | | (1.0) | | (699) | | (1.3) | | (73) |
Housing | (214) | | (0.5) | | (197) | | (0.4) | | (200) | | (0.4) | | (21) |
LSA expenses | (78) | | (0.2) | | (96) | | (0.2) | | (121) | | (0.2) | | (12) |
Net periodic post-employment health care benefit cost | (238) | | (0.5) | | (199) | | (0.4) | | (90) | | (0.2) | | (9) |
Insurance | (68) | | (0.2) | | (70) | | (0.1) | | (83) | | (0.2) | | (9) |
Net periodic other post-employment benefit cost | (61) | | (0.1) | | (53) | | (0.1) | | (49) | | (0.1) | | (5) |
Others | (42) | | (0.1) | | (52) | | (0.1) | | (59) | | (0.1) | | (6) |
Total | (7,447) | | (16.1) | | (8,671) | | (17.3) | | (9,695) | | (18.0) | | (1,006) |
Interconnection Expenses | (3,086) | | (6.7) | | (3,555) | | (7.1) | | (4,667) | | (8.7) | | (484) |
Marketing Expenses | (2,525) | | (5.4) | | (3,278) | | (6.5) | | (3,094) | | (5.7) | | (321) |
General and Administrative Expenses | (2,537) | | (5.5) | | (2,935) | | (5.9) | | (3,036) | | (5.6) | | (315) |
(Loss) gain on foreign exchange - net | 43 | | 0.1 | | (210) | | (0.4) | | (189) | | (0.4) | | (20) |
Other expenses | (145) | | (0.3) | | (192) | | (0.4) | | (1,973) | | (3.7) | | (205) |
Total expenses(1) | (46,337) | | (100.0) | | (50,127) | | (100.0) | | (53,935) | | (100.0) | | (5,597) |
Other income | 548 | | | | 666 | | | | 2,559 | | | | 266 |
Operating Profit | 22,754 | | | | 21,787 | | | | 25,762 | | | | 2,673 |
Finance income | 452 | | | | 620 | | | | 596 | | | | 62 |
Finance costs | (1,928) | | | | (1,662) | | | | (2,055) | | | | (213) |
Share of loss of associated companies | (14) | | (0.0) | | (10) | | (0.0) | | (11) | | (0.0) | | (1) |
Profit before Income Tax | 21,264 | | | | 20,735 | | | | 24,292 | | | | 2,521 |
Net Income Tax Expense | (5,512) | | | | (5,385) | | | | (5,908) | | | | (613) |
Profit for the Year | 15,752 | | | | 15,350 | | | | 18,384 | | | | 1,908 |
Other Comprehensive Expenses - Net | (553) | | | | (1,947) | | | | (3,005) | | | | (313) |
Net Comprehensive Income for the Year | 15,199 | | | | 13,403 | | | | 15,379 | | | | 1,595 |
Profit for the year attributable to owners of the parent company | 11,427 | | | | 10,848 | | | | 12,864 | | | | 1,335 |
Net comprehensive income for the year attributable to owners of the parent company | 10,911 | | | | 8,969 | | | | 9,834 | | | | 1,020 |
Basic and Diluted Earnings per Share (in full amount) | | | | | | | | | | | | | |
Net income per share | 580.95 | | | | 553.70 | | | | 669.92 | | | | 0.07 |
Net income per ADS (40 Series B shares per ADS) | 23,238.00 | | | | 22,148.00 | | | | 26,796.80 | | | | 2.78 |
(1) Total expenses includes share of loss of associated companies. |
- 59 -
Financial Overview
Year ended December 31, 2012 compared to year ended December 31, 2011
A. Revenues
Total revenues increased by Rp5,889 billion, or 8.3%, from Rp71,238 billion in 2011 to Rp77,127 billion in 2012. The increase in revenues in 2012 was primarily due to the increase in revenues from celullar telephone, data, internet and information technology services, interconnection and other telecommunications services, partly offset by decreases in revenues from fixed lines telephone and network.
1. Cellular Telephone Revenues
Cellular telephone revenues increased by Rp2,133 billion, or 7.5%, from Rp28,598 billion in 2011 to Rp30,731 billion in 2012 primarily due to increases in usage and monthly subscription charges, partially offset by a decrease in revenues from features.
Usage charges increased by Rp2,288 billion, or 8.4%, from Rp27,189 billion in 2011 to Rp29,477 billion in 2012 due to an increase in minutes of usage of 184.8 billion minutes, or 11.1% and a 16.9% increase in total subscribers. Monthly subscription charges increased by Rp127 billion, or 22.3%, from Rp569 billion in 2011 to Rp696 billion in 2012 due to increase in Flash and Blackberry subscribers of 93.1% with revenue growth of 21.5%. The increase was partly offset by a decrease in revenues from features, which decreased by Rp280 billion, or 33.4%, from Rp838 billion in 2011 to Rp558 billion in 2012 as a result of MoCI Regulation No. 01/PER/M.KOMINFO/01/2009 regarding the provision of premium messaging service and broadcasting short message to many receivers.
2. �� Fixed Lines Telephone Revenues
Fixed lines telephone revenues decreased by Rp957 billion, or 8.2%, from Rp11,619 billion in 2011 to Rp10,662 billion in 2012. The decrease in fixed lines telephone revenues was primarily due to a decrease in usage charges, of Rp890 billion, or 10.8%, from Rp8,213 billion in 2011 to Rp7,323 billion in 2012 which was primarily caused by a decrease in local and domestic long distance usage. Further, monthly subscription charges revenues also decreased by Rp199 billion, or 6.6% in 2012. The decrease in fixed lines telephone revenues was primarily due to shifting usage to cellular telephone services.
3. Data, Internet and Information Technology Services Revenues
Data, internet and information technology services revenues increased by Rp3,700 billion, or 15.5%, from Rp23,924 billion in 2011 to Rp27,624 billion in 2012. This increase was primarily due to an increase in revenues from internet, data communication and information technology services by Rp4,309 billion, or 40.9%, from Rp10,548 billion in 2011 to Rp14,857 billion in 2012, which was in turn largely driven by increases in cellular data communication revenues from increased mobile phone data usage and an increase in Flash mobile broadband subscribers of 99.5%, from 5.5 million subscribers in 2011 to 11.0 million subscribers in 2012. The increase in revenues from internet, data communication and information technology services was also due in part to an increase in Speedy subscribers of 30.9%, from 1.8 million subscribers in 2011 to 2.3 million subscribers in 2012, a 41.9% increase in data volumes through our VPN network, from28,702 mbps in 2011 to 40,748 mbps in 2012, and a 70.8% increase in data volumes through our metro ethernet, from140,733 mbps in 2011 to 240,315 mbps in 2012.
SMS volumes decreased by 47.8% from 226.4 billion messages in 2011 to 118.1 billion messages in 2012, while SMS revenues decreased by a smaller degree, by Rp462 billion, or 3.5%, from Rp13,093 billion in 2011 to Rp12,631 billion in 2012. The decrease in SMS volumes is in line with general increase in usage of internet-based messaging. Revenues declined by a smaller percentage primarily due to the implementation of cost-based interconnection for SMS on June 1, 2012. Prior to June 2012, SMS were sent and received among operators on a "Sender Keep All" basis. Effective June 1, 2012, in line with the cost-based interconnection regime for voice calls, the Government implemented cost-based interconnection for SMS. As Telkomsel historically had more incoming SMS than outgoing SMS, cost-based interconnection for SMS resulted in an overall benefit for Telkomsel’s SMS revenues.
4. Interconnection Revenues
Interconnection revenues comprised interconnection revenues from our fixed line network and interconnection revenues from Telkomsel’s mobile cellular network. Interconnection revenues included incoming international long-distance revenues from our IDD service (TIC-007).
Interconnection revenues increased by Rp764 billion, or 21.8%, from Rp3,509 billion in 2011 to Rp4,273 billion in 2012. This increase was triggered by an increase in domestic interconnection and transit revenues of Rp547 billion, or 26.4%, from Rp2,071 billion in 2011 to Rp2,618 billion in 2012 primarily due to an increase in cellular interconnection revenues of Rp538 billion, or 30.2%, and an increase of Rp217 billion, or 15.1% in international interconnection revenues, due to our promotion rate offers for international calls and the increased number of incoming calls to mobile subscribers.
Our total interconnection revenues accounted for 5.5% of our consolidated revenues for the year ended December 31, 2012, compared to 4.9% for the year ended December 31, 2011.
5. Network Revenues
Network revenues decreased by Rp93 billion, or 7.1%, from Rp1,301 billion in 2011 to Rp1,208 billion in 2012 mainly due to a decrease in our revenues from leased lines services by Rp87 billion, or 9.5%, from Rp911 billion in 2011 to Rp824 billion in 2012. This decrease was due to declining prices for leased lines.
- 60 -
6. Other Telecommunications Services
Revenues from other telecommunications services increased by Rp342 billion, or 15.0%, from Rp2,287 billion in 2011 to Rp2,629 billion in 2012. The increase was primarily due to an increase of Rp307 billion, or 41.5% in CPE and terminal revenue, an increase of Rp182 billion, or 83.1% in lease revenue, and an increase of Rp146 billion, or 56.4% in revenues from pay TV. The increase in pay TV revenues was primarily due to a19% increase in the number of subscribers from1.0million subscribers in 2011 to1.2million subscribers in 2012.
This increase above was partially offset by a decrease in revenues from USO compensation due to a decrease in USO projects to establish internet service centers in various provincial capital cities in 2012 and a decrease in our directory assistance revenues.
B. Other Income
Other income increased by Rp1,893 billion, or 284.2%, from Rp666 billion in 2011 to Rp2,559 billion in 2012. The increase primarily related to insurance compensation received from the insurer amounted to Rp1,772 billion with regards to the insured Telkom-3 Satellite that was built and launched, but failed to reach its orbit on August 7, 2012. See Note 11 to our Consolidated Financial Statements.
C. Expenses
Total expenses increased by Rp3,808 billion, or 7.6%, from Rp50,127 billion in 2011 to Rp53,935 billion in 2012. The increase in expenses was attributable primarily due to increases in operations, maintenance and telecommunication services, personnel and interconnection expenses. These expenses are further explained below:
1. Operations, Maintenance and Telecommunications Services Expenses
Operations, maintenance and telecommunications services expenses increased by Rp343 billion, or 2.1%, from Rp16,453 billion in 2011 to Rp16,796 billion in 2012.
The increase in operations, maintenance and telecommunications services expenses was attributable by the following:
- Insurance expenses increased by Rp240 billion, or 55.7%, from Rp431 billion in 2011 to Rp671 billion in 2012 due to payment of Telkom-3 satellite insurance;
- Concession fees and USO charges increased by Rp210 billion, or 17.0%, from Rp1,235 billion in 2011 to Rp1,445 billion in 2012. This increase was primarily due tothe
increase in our total revenues, which we use to calculate the amountspent on USO projects, by Rp5,889 billion, or 8.3%; and
- Radio frequency usage expenses increased by Rp156 billion, or 5.5%, from Rp2,846 billion in 2011 to Rp3,002 billion in 2012, due to an increase in bandwidth used for
cellular.
The above increases were offset by the following:
- A decrease in the cost of handset phone, set up top box, SIM and RUIM cards of Rp280 billion, or 29.0%, from Rp967 billion in 2011 to Rp687 billion in 2012. This decrease
was caused by the use of less expensive packaging for SIM andRUIM cards;
- A decrease in operations and maintenance of Rp172 billion, or 1.9%, from Rp9,184 billion in 2011 to Rp9,012 billion in 2012 due to a decrease in expenses associated with
increasing the capacity of receiver and transmission stations andTelkomsel’s broadband services.
2. Depreciation and Amortization Expenses
Depreciation and amortizationexpenses decreased by Rp349 billion, or 2.4%, from Rp14,823 billion in 2011 to Rp14,474 billion in 2012, primarily due to lower impairment charge on fixed wireless cash generating unit (“CGU”) by Rp316billion, or56.1% from Rp563 billion in 2011 to Rp247 billion in 2012and the net impact of the change in the estimated useful lives of towers and certain equipment by Rp101 billion, offset by increases in the depreciation of leased assets.
The impairment indicators on our fixed wireless CGU continued to exist in 2012 mainly due to increased competition in the fixed wireless market and that has resulted in lower average tariffs, declining active customers and declining ARPU and we conducted an impairment test to determine if further impairment was necessary. See Item 3 “Key Information – Risk Factors – Risks Related to Our Business – Competition Risks Related to Our Fixed Telecommunication Business”. We assessed the recoverable value of the assets in the CGU and determined that assets for the fixed wireless CGU were impaired amounting to Rp247 billion at December 31, 2012. The recoverable amount was determined based on value-in-use ("VIU") calculations. These calculations used pre-tax cash flow projections approved by management covering a five-year period and with cash flows beyond the five-year period extrapolated using a perpetuity growth rate. The cash flow projections reflect management’s expectations of revenue, EBITDA growth and operating cash flows on the basis that the fixed wireless CGU generates positive net cash flows from 2013. Management’s cash flow projection also incorporates management’s reasonable expectations for developments in macro-economic conditions andmarket expectations for the Indonesian telecommunications industry. As of December 31, 2012, management applied a pre-tax discount rate of 12.3% derived from the Company’s post-tax weighted average cost of capital and benchmarked to externally available data. The perpetuity growth rate used of 0.5% assumes that subscriber numbers may continue to increase after five years, while ARPU may decline such that the long-term growth will not be significant.
- 61 -
A 1% increase in the discount rate used would result in an increase in impairment loss of approximately Rp458 billion. However, the recoverable amount of the fixed wireless CGU is sensitive to whether management will be able to implement its plans, including the cost efficiency plan, such that it generates positive cash flows and returns to profitability as projected. If the performance of the fixed wireless CGU continues to decline or if management’s initiatives are not performing as expected in the next financial year, analysis will be required to assess whether there will be further impairment next year.
In 2012, the useful life of Telkomsel’s towers was changed from 10 years to 20 years for purposes of calculating depreciation to reflect the current expected usage and the physical wear and tear of the towers. The impact is a reduction of depreciation expense by Rp635 billion recognized in the 2012 consolidated statement of comprehensive income. Moreover, Telkomsel decided to replace certain equipment with net carrying amount of Rp1,037 billion, as part of a modernization program. Accordingly, Telkomsel changed the estimated useful lives of such equipment resulting in additional depreciation expense of Rp534 billion that was charged to the 2012 consolidated statement of comprehensive income. The impact of the changes in the estimated useful lives of thetowers and equipment to the profit before income tax is fully discussed in Note 11 to our Consolidated Financial Statements.
3. Personnel Expenses
Personnel expenses increased by Rp1,024 billion, or 11.8%, from Rp8,671 billion in 2011 to Rp9,695 billion in 2012 due in part to an increase in vacation pay, incentives and other benefits by Rp586 billion, or 20.8%, from Rp2,814 billion in 2011 to Rp3,400 billion in 2012, an increase by Rp182 billion or 35.2% in early retirement program expenses from Rp517 billion in 2011 to Rp699 billion in 2012, and an increase in salaries and related benefits by Rp256 billion or 8.5% from Rp3,001 billion in 2011 to Rp3,257 billion in 2012.
4. Interconnection Expenses
Interconnection expenses increased by Rp1,112 billion, or 31.3%, from Rp3,555 billion in 2011 to Rp4,667 billion in 2012 primarily due to an increase of 43.5% in domestic interconnection and transit interconnection expenses and an increase of 5.4% in international interconnection fees.
Our total interconnection expenses accounted for 8.7% of our consolidated expenses for the year ended December 31, 2012, compared to 7.1% for the year ended December 31, 2011.
5. Marketing Expenses
Marketing expenses decreased by Rp184 billion, or 5.6%, from Rp3,278 billion in 2011 to Rp3,094 billion in 2012 primarily due to a decrease in advertising and promotion expenses by Rp249 billion, or 9.1% due to marketing cost optimization.
6. General and Administrative Expenses
General and administrative expenses increased by Rp101 billion, or 3.4%, from Rp2,935 billion in 2011 to Rp3,036 billion in 2012 due in part to anincrease in general expenses by Rp201billion,or 61.7%,from Rp326billion in 2011to Rp527billion in 2012. Theincrease in general expenses was primarily due to vehicle facility reimbursement expenses related to changes of our policy and directors’ severance pay due to the Board of Directors changes in 2012. Provision for impairment of receivables increased by Rp32 billion, or 3.6%, from Rp883 billion in 2011 to Rp915 billion in 2012. This increase primarily resulted from current year individual and collective assessment for impairment of receivables.
The increase in provision for impairment of receivables was partially offset by a decrease in social contribution expenses by Rp161 billion, or 55.5%, from Rp290 billion in 2011 to Rp129 billion in 2012. This decrease resulted from our shareholders’ decision to lower the amount of net profit spent on corporate social responsibility from 2.0% in 2011 to 1.0% in 2012.
Professional fees decreased by Rp48 billion, or 20.4%, while security and screening expense decreased by Rp35 billion, or 36.1%, from Rp97 billion in 2011 to Rp62 billion in 2012.
7. (Loss)gain on Foreign Exchange - net
Loss on foreign exchange - net decreased by Rp21 billion, or 10%, from Rp210 billion in 2011 to Rp189 billion in 2012. The decrease was primarily due to the depreciation of the Japanese Yen by 4.3% wich was partially offset by the appreciation of the US Dollar by 6.3%.
- 62 -
8. Other expenses
Other expenses increased by Rp1,781 billion, or 927.6%, from Rp192 billion in 2011 to Rp1,973 billion in 2012. The increase primarily related to derecognition of the carrying value of the Telkom-3 Satellite, which was built and launched, but failed to reach usable orbit on August 7, 2012, amounting to Rp1,606 billion. See Note 11 to our Consolidated Financial Statements.
D. Operating Profit and Operating Profit Margin
As a result of the foregoing, operating profit increased by Rp3,975 billion, or 18.2%, from Rp21,787 billion in 2011 to Rp25,762 billion in 2012. Operating profit margin increased from 30.6% in 2011 to 33.4% in 2012.
E. Profit before Income Tax and Pre-Tax Margin
As a result of the foregoing, profit before income tax increased by Rp3,557 billion, or 17.2%, from Rp20,735 billion in 2011 to Rp24,292 billion in 2012. Pre-tax margin slightly increased from 29.1% in 2011 to 31.5% in 2012.
F. Income Tax Expense
Income tax expense increased by Rp523 billion, or 9.7%, from Rp5,385 billion in 2011 to Rp5,908 billion in 2012, following the increase in profit before income tax by 17.2%.
G. Other Comprehensive (Expenses) Income
Other comprehensive expenses increased by Rp1,058 billion, or 54.3%, from Rp1,947 billion in 2011 to Rp3,005 billion in 2012 due to the increase in defined benefit plan actuarial losses by Rp1,073 billion, or 54.8%, from Rp1,958 billion in 2011 to Rp3,031 billion in 2012.
H. Comprehensive Income for the year
Comprehensive income for the year increased by Rp1,976 billion, or 14.7%, from Rp13,403 billion in 2011 to Rp15,379 billion in 2012.
I. Profit for the Year Attributable to Non-controlling Interest
Profit for the year attributable to non-controlling interest increased by Rp1,018 billion, or 22.6%, from Rp4,502 billion in 2011 to Rp5,520 billion in 2012.
J. Profit for the Year Attributable to Owners of the Parent Company
Profit for the year attributable to owners of the parent company increased by Rp2,016 billion, or 18.6%, from Rp10,848 billion in 2011 to Rp12,864 billion in 2012.
K. Net Income per Share
Net income per share increased by Rp116, or 21.0%, from Rp554 in 2011 to Rp670 in 2012.
Year ended December 31, 2011 compared to year ended December 31, 2010
A. Revenues
Total revenues increased by Rp2,709 billion, or 4.0%, from Rp68,529 billion in 2010 to Rp71,238 billion in 2011. The increase in revenues in 2011 was primarily due to the increase in revenues from data, internet and information technology services, network and other telecommunications services, partly offset by decreases in revenues from fixed lines, cellular, and interconnection.
1. Telephone Revenues
A. Cellular Telephone Revenues
Cellular telephone revenues decreased by Rp536 billion, or 1.8%, from Rp29,134 billion in 2010 to Rp28,598 billion in 2011 primarily due to decreases in usage charges, offset partially by an increase in revenues from features.
Usage charges decreased by Rp835 billion, or 3.0%, from Rp28,024 billion in 2010 to Rp27,189 billion in 2011 due to decrease in local cellular usage. On the other hand, features revenues increased by Rp256 billion, or 44.0%, from Rp582 billion in 2010 to Rp838 billion in 2011.
B. Fixed Lines Telephone Revenues
Fixed lines telephone revenues decreased by Rp1,321 billion, or 10.2%, from Rp12,940 billion in 2010 to Rp11,619 billion in 2011. The decrease in fixed lines telephone revenues was primarily due to the decrease in usage charges, which decreased by Rp1,074 billion, or 11.6%, from Rp9,287 billion in 2010 to Rp8,213 billion in 2011 due to decreases in local and domestic long distance usage. Further, monthly subscription charges revenues also decreased by Rp247 billion, or 7.6% in 2011. The decreases were primarily due to a decline in the use of fixed line services as consumers favored newer technologies.
- 63 -
2. Data, Internet and Information Technology Services Revenues
Data, internet and information technology services revenues increased by Rp4,123 billion, or 20.8%, from Rp19,801 billion in 2010 to Rp23,924 billion in 2011. This increase was primarily due to an increase in revenues from internet, data communication and information technology services by Rp2,251 billion, or 27.1%, from Rp8,297 billion in 2010 to Rp10,548 billion in 2011. This increase was due in part to an increases in the numbers of our Speedy internet subscribers by 8.5%, from 1.6 million subscribers in 2010 to 1.8 million subscribers in 2011, and an increase in the number of our Flash internet subscribers by 45.7%, from 3.8 million subscribers in 2010 to 5.5 million subscribers in 2011. The increase was also due to the increase in data volumes through our VPN network by 18.4%, from 24,237 mbps in 2010 to 28,702 mbps in 2011, and data volumes through our Metro ethernet by 131.0%, from 60,924 mbps in 2010 to 140,733 mbps in 2011.
SMS revenue also increased by Rp1,804 billion, or 16.0%, from Rp11,289 billion in 2010 to Rp13,093 billion in 2011. This increase was due to an increase in SMS volumes of 13.4% from 199.6 billion messages in 2010 to 226.4 billion messages in 2011.
3. Interconnection Revenues
Interconnection revenues decreased by Rp226 billion, or 6.1%, from Rp3,735 billion in 2010 to Rp3,509 billion in 2011. International interconnection revenues decreased by Rp123 billion, or 7.9%, from Rp1,561 billion in 2010 to Rp1,438 billion in 2011 and domestic interconnection and transit revenues decreased by Rp103 billion, or 4.7%, from Rp2,174 billion in 2010 to Rp2,071 billion in 2011. This was caused in part by a decrease of Rp113 billion, or 6.0%, in cellular interconnection revenues due to the cellular industry’s promotion of reduced rates for calls between subscribers of the same cellular network. Furthermore, government mandated interconnection rates for 2011 were slightly lower than the rates in 2010. In addition, international interconnection revenues also slightly decreased. Both cellular and international interconnection revenues decreased due to the substantial increase in the use of VoIP to make calls, including from mobile phones through VoIP mobile applications.
Interconnection revenues comprised interconnection revenues from our fixed line network and interconnection revenues from Telkomsel’s mobile cellular network. Interconnection revenues included incoming international long-distance revenues from our IDD service (TIC-007).
Our total interconnection revenues accounted for 5.5% of our consolidated revenues for the year ended December 31, 2010, compared to 4.9% for the year ended December 31, 2011.
4. Network Revenues
Network revenues increased by Rp243 billion, or 23.0%, from Rp1,058 billion in 2010 to Rp1,301 billion in 2011 mainly due to a substantial increase in our revenues from leased lines services by Rp224 billion, or 32.6%, from Rp687 billion in 2010 to Rp911 billion in 2011. This increase was due to the increased number of capacity leased from 40,451 E1 in 2010 to 118,357 E1 in 2011, as demand increased due to economic growth and partially offset with declining prices for leased lines.
Satellite transponder lease revenues increased by Rp19 billion, or 5.1%, from Rp371 billion in 2010 to Rp390 billion in 2011 due to an increase in capacity leased resulting from increased demand.
5. Other Telecommunications Services
In 2011, our revenues from other telecommunications services increased by Rp426 billion, or 22.9%, from Rp1,861 billion in 2010 to Rp2,287 billion in 2011. The increase in other telecommunications services revenues was primarily due to an increase in revenues from pay TV by Rp100 billion, or 62.9%, from Rp159 billion in 2010 to Rp259 billion in 2011; an increase in USO compensation by Rp173 billion, or 71.5%, from Rp242 billion in 2010 to Rp415 billion in 2011; and an increase in other revenues by Rp101 billion, or 240.5%, from Rp42 billion in 2010 to Rp143 billion in 2011.
Revenues from pay TV increased due to substantial increase in the number of subscribers from 212,9 thousands subscribers in 2010 to 1,000 thousands subscribers in 2011 resulting from our intensive promotional campaign and lower tariffs. Revenues from USO compensation increased due to revenues in 2011 primarily due to a USO project to establish internet service centers in various provincial capital cities. Other revenues increased due in part to revenues from fees charged to businesses listing for our directory assistance amounted to Rp349 billion in 2011.
B. Expenses
Total expenses increased by Rp3,790 billion, or 8.2%, from Rp46,337 billion in 2010 to Rp50,127 billion in 2011. The increase in expenses was attributable primarily due to increases in personnel, marketing and interconnection expenses. These expenses are further explained below:
- 64 -
1. Operations, Maintenance and Telecommunications Services Expenses
Operations, maintenance and telecommunications services expenses increased by Rp407 billion, or 2.5%, from Rp16,046 billion in 2010 to Rp16,453 billion in 2011. The increase in operations, maintenance and telecommunications services expenses was attributable to an increase in maintenance expense for tower, office building and base station by Rp348 billion, or 3.9%, resulting from with the expanded capacity of Telkomsel’s transmitting and receiving stations and broadband services.
Other increases in operations, maintenance and telecommunications services expenses included:
- Leased lines and CPE expenses increased by Rp191 billion, or 88.8%, from Rp215 billion in 2010 to Rp406 billion in 2011;
- Concession fees and USO charges increased by Rp58 billion, or 4.9%, from Rp1,177 billion in 2010 to Rp1,235 billion in 2011. This increase followed from increased total revenues by 4.0%; and
- Insurance expenses increased by Rp47 billion, or 12.2%, from Rp384 billion in 2010 to Rp431 billion in 2011. This increase was due to insurance expense of damage sustained by our submarine cables caused by a tsunami in West Sumatra and an earthquake in Sumbawa in 2010.
The above increases were partially offset by the following:
- The cost of handset phone, set top box, SIM and RUIM cards decreased by Rp100 billion, or 9.4%, from Rp1,067 billion in 2010 to Rp967 billion in 2011. This decrease was caused by the use of less expensive packaging for SIM and RUIM cards;
- The cost of IT services decreased by Rp56 billion, or 28.0%, from Rp200 billion in 2010 to Rp144 billion in 2011. This decrease was resulted from a decrease in the number of software licenses maintained, because of the substitution using Sigma’s services for some software in 2011, and a decrease in software maintenance expenses; and
- Radio frequency usage expenses decreased by Rp46 billion, or 1.6%, from Rp2,892 billion in 2010 to Rp2,846 billion in 2011, due to a new regulation issued on December 13, 2010 under which right-of-use fees paid to the Government for BTSs are no longer calculated in relation to the number of BTSs deployed and are computed based on bandwidth used.
2. Depreciation and Amortization Expenses
Depreciation and amortizationexpenses increased by Rp243 billion, or 1.7%, from Rp14,580 billion in 2010 to Rp14,823 billion in 2011, primarily due to an increased in depreciation expense of Rp608 billion, or 4.7%, from Rp13,052 billion in 2010 to Rp13,660 billion in 2011, resulting from the depreciation of facilities supporting BTSs and switching equipment, offset by decreases in the depreciation of cable networks, data processing equipment and capital leases.
As increased competition in the fixed wireless market resulted in lower average tariffs, declining active customers and declining ARPU, we conducted an impairment test for the fixed wireless cash generating unit. See Item 3 “Key Information – Risk Factors – Risks Related to Our Business – Competition Risks Related to Our Fixed Telecommunication Business”. We wrote down impaired fixed wireless related assets to their recoverable value, which was determined by our management based on estimated VIU calculations. In determining VIU, our management uses discretion in establishing forecast of future operating performance, as well as in selecting assumed growth rates and discount rates.
These judgments are applied based on our understanding of historical information and expectations of future performance. The cash flow projections reflect management’s expectations of revenue, EBITDA growth, and operating cash flows on the basis that the fixed wireless CGU generates positive net cash flows from 2013 and returns to profitability in 2016. Management’s cash flow projection also incorporates expectations for developments in macro-economic conditions and market expectations for the Indonesian telecommunications industry. The projection assumes that management will receive appropriate licenses and effectively implement a full mobility initiative that will remove limitations in the existing service which can only be used by customers within a particular area code. Management applied a pre-tax discount rate of 11.4%, derived from our post-tax weighted average cost of capital and benchmarked to externally available data. The perpetuity growth rate used of 0% assumes that while subscriber numbers may continue to increase after five years, ARPU may decline such that only negligible long term growth will be achieved in a competitive market.
We recognized an impairment for assets in the fixed wireless CGU as of December 31, 2011 resulting in an impairment charge of Rp563 billion (2010: Rp nil) in the Consolidated Statement of Comprehensive Income under ‘Depreciation and Amortization’. Changing the key assumptions, including the discount rates or the growth rate assumption in the cash flow projections, could materially affect the value in use calculations. A 1% increase in the discount rate used would result in an increase in impairment loss of approximately Rp907 billion. However the recoverable amount of the fixed wireless CGU is most sensitive to whether management will be able to implement its plans, including the full mobility initiative, such that itgenerates positive cash flows and returns to profitability as projected.If the performance of the fixed wireless CGU continues to decline or if management’s initiatives are not performing as expected in the next financial year, analysis will be required to assess whether there will be further impairment next year.
There was a decrease in amortization expense of Rp928 billion, or 60.7% that was primarily due to KSO related intangible assets being fully amortized as of December 31, 2010 following expiration of the KSO by that date. In 2011, the related intangible assets have been written-off.
- 65 -
3. Personnel Expenses
Personnel expenses increased by Rp1,224 billion, or 16.4%, from Rp7,447 billion in 2010 to Rp8,671 billion in 2011. The increase in personnel expenses was due in part to an increase in salaries and related benefits of Rp250 billion, or 9.1%, from Rp2,751 billion in 2010 to Rp3,001 billion in 2011. This increase was due in part to an annual increase in basic salaries of 8.0% to adjust for domestic inflation.
In addition, early retirement program expenses were Rp517 billion in 2011, compared to nil in 2010 when no early retirement programs were offered. Vacation pay, incentives and other benefit expense also contributed tothe increase by Rp239 billion, or 9.3%, from Rp2,575 billion in 2010 to Rp2,814 billion in 2011, primarily due to an increase in incentives.
Employees’ income tax expenses also increased by Rp247 billion, or 31.0%, from Rp796 billion in 2010 to Rp1,043 billion in 2011. This increase followed from the increase in salaries and related benefits.
4. Interconnection Expenses
Interconnection expenses increased by Rp469 billion, or 15.2%, from Rp3,086 billion in 2010 to Rp3,555 billion in 2011. Interconnection expenses increased due to an increase in domestic cellular interconnection and transit (interconnection expenses for calls between Telkomsel subscribers routed through the cellular network of another company) interconnection expenses by Rp434 billion, or 21.9%, which was in line with the increase in Telkomsel’s number of subscribers in 2011 by 13.8%.
Our total interconnection expenses accounted for 7.1% of our consolidated expenses for the year ended December 31, 2011, compared to 6.7% for the year ended December 31, 2010.
5. Marketing Expenses
Marketing expenses increased by Rp753 billion, or 29.8%, from Rp2,525 billion in 2010 to Rp3,278 billion in 2011 primarily due to an increase in advertising and promotion expenses by Rp749 billion, or 37.6%. The increase in advertising and promotion expenses was due to changes of Telkomsel’s dealer incentive scheme.
6. General and Administrative Expenses
General and administrative expenses increased by Rp398 billion, or 15.7%, from Rp2,537 billion in 2010 to Rp2,935 billion in 2011 due in part to an increase in the provision for impairment of receivables by Rp358 billion, or 68.2%, from Rp525 billion in 2010 to Rp883 billion in 2011. This increase mainly resulted from current year individual and collective assessment for impairment of receivables.
In addition, social contribution expenses increased by Rp119 billion, or 69.6%, from Rp171 billion in 2010 to Rp290 billion in 2011. This increase resulted from the decision by our shareholders to increase the amount spent on corporate social responsibility from 1.0% of our total comprehensive income in 2010 to 2.0% of our total comprehensive income in 2011, allocated equally between community development and partnership programs.
Professional fees increased by Rp72 billion, or 44.2%, from Rp163 billion in 2010 to Rp235 billion in 2011.
The increases in professional fees, social contribution expenses and provision for impairment of receivables��were partially offset by a decrease in security and screening expense of Rp118 billion, or 54.9%, from Rp215 billion in 2010 to Rp97 billion in 2011. This decrease was due to a major optimization exercise pursuant to which the number of security guards used was substantially reduced and guards were sourced from a Telkom subsidiary instead of a third party.
In addition, collection expenses decreased by Rp74 billion, or 18.5%, from Rp401 billion in 2010 to Rp327 billion in 2011.
7. (Loss) gain on Foreign Exchange - net
(Loss) gain on foreign exchange - net decreased by Rp253 billion or 588.4% from a gain of Rp43 billion in 2010 to a loss of Rp210 billion in 2011. The decrease is primarily due to the appreciation of the Yen by 5.6% in 2011 which resulted in the increase in cost of debt denominated in Yen, doubled with a smaller loss due to the appreciation of the US Dollars by 0.7% in 2011.
- 66 -
C. Operating Profit and Operating Profit Margin
As a result of the foregoing, operating profit decreased by Rp967 billion, or 4.2%, from Rp22,754 billion in 2010 to Rp21,787 billion in 2011. Meanwhile, revenues increased by Rp2,709 billion, or 4.0% and our operating profit margin decreased from 33.2% in 2010 to 30.6% in 2011.
D. Profit before Income Tax and Pre-Tax Margin
As a result of the foregoing, profit before income tax decreased by Rp529 billion, or 2.5%, from Rp21,264 billion in 2010 to Rp20,735 billion in 2011. Pre-tax margin slightly decreased from 31.0% in 2010 to 29.1% in 2011.
E. Income Tax Expense
Income tax expense decreased by Rp127 billion, or 2.3%, from Rp5,512 billion in 2010 to Rp5,385 billion in 2011, following the decrease in profit before income tax by 2.5%.
F. Other Comprehensive (Expenses) Income
Defined benefit plan actuarial losses-net of tax increased substantially by Rp1,371 billion from Rp587 billion in 2010 to Rp1,958 billion in 2011. The increase was primarily due to an increase in actuarial losses recognized during the year (before tax) of Rp4,410 billion, partially offset by a decrease in asset ceiling limitation (before tax) by Rp2,799 billion.
G. Profit for the Year Attributable to Non-controlling Interest
Profit for the year attributable to non-controlling interest increased by Rp177 billion, or 4.1%, from Rp4,325 billion in 2010 to Rp4,502 billion in 2011.
H. Profit for the Year Attributable to Owners of the Parent Company
Profit for the year attributable to owners of the parent company decreased by Rp579 billion, or 5.1%, from Rp11,427 billion in 2010 to Rp10,848 billion in 2011.
I. Equity
Total equity increased by Rp2,488 billion, or 4.4%, from Rp56,538 billion in 2010 to Rp59,026 billion in 2011. The increase in total equity was primarily the result oftotal comprehensive income for the year attributable to owners of the parent company of Rp13,403 billion in 2011, offset bydividends of Rp8,849 billionand the acquisition cost of treasury stock of Rp2,059 billion. As a result of foregoing, our retained earnings increaseby Rp3,139 billion, or 7.3%, from Rp42,726 billion as of December 31, 2010 to Rp45,865 billion as of December 31, 2011.
J. Net Income per Share
Net income per share decreased by Rp27, or 4.7%, from Rp581 in 2010 to Rp554 in 2011.
Segment Overview
In 2012, management decided to change the way it manages the Company's business portfolios from a product-based approach to a customer-centric approach, as part of the Company’s strategy to provide a one-stop solution to its customers. This resulted in a change in the Company’s organizational structure to accommodate decision-making and performance assessment based on a customer-centric approach. Consequently, the segment financial information presented to the Company's Chief Operational Decision Maker was amended to facilitate decision making on the new segments. The segment information for the year ended December 31, 2011 has been restated to conform with the presentation of segment information for the year ended December 31, 2012. However, the costs of extending the restatement of each individual item of comparative information for the year ended December 31, 2010 were considered to outweigh the benefits of providing a more accurate comparative information. Management considered that the restatement of the 2010 segment information was impracticable. Moreover, management also considered that the presentation of 2010, 2011 and 2012 segment information in the old basis (product-based approach) are not relevant considering that management currently manages its business on a customer-centric approach.
Wehave four main operating segments, namely: corporate, home, personal and others:
– Our corporate segment provides telecommunications services including interconnection, leased lines, satellite, VSAT, contact center, broadband access, information technology services, data and internet services to companies and institutions;
– Our home segment provides fixed wireline telecommunications services, pay TV, data and internet services to home consumers;
– Our personal segment provides mobile cellular and fixed wireless telecommunications services including mobile access and information technology services, data and internet services to individual consumers; and
– Our others segment provides building management services.
For more detailed information regarding our segment information, see Note 35 to our Consolidated Financial Statements. Our segment results for the year 2011 and2012 were as follows:
- 67 -
| Years Ended December 31, |
| 2011 | | 2012 | | 2012 |
| (Rp billion) | | (Rp billion) | | (US$ million) |
Corporate | | | | | |
Segment Results | | | | | |
External revenues | 14,279 | | 15,579 | | 1,616 |
Inter-segment revenues | 5,289 | | 6,468 | | 671 |
Total segment revenues | 19,568 | | 22,047 | | 2,287 |
Segment expenses - net | (15,659) | | (17,976) | | (1,865) |
Segment results | 3,909 | | 4,071 | | 422 |
Depreciation and amortization expenses | (1,890) | | (2,079) | | (216) |
Provision for impairment of receivables | (255) | | (92) | | (10) |
Home | | | | | |
Segment Results | | | | | |
External revenues | 8,171 | | 7,360 | | 764 |
Inter-segment revenues | 1,888 | | 2,223 | | 231 |
Total segment revenues | 10,059 | | 9,583 | | 995 |
Segment expenses - net | (8,322) | | (7,939) | | (824) |
Segment results | 1,737 | | 1,644 | | 171 |
Depreciation and amortization expenses | (1,389) | | (1,168) | | (121) |
Provision for impairment of receivables | (454) | | (505) | | (52) |
Personal | | | | | |
Segment Results | | | | | |
External revenues | 48,733 | | 54,087 | | 5,612 |
Inter-segment revenues | 2,180 | | 2,188 | | 227 |
Total segment revenues | 50,913 | | 56,275 | | 5,839 |
Segment expenses - net | (34,679) | | (36,372) | | (3,774) |
Segment results | 16,234 | | 19,903 | | 2,065 |
Depreciation and amortization expenses | (11,007) | | (10,940) | | (1,135) |
Provision for impairment of receivables | (174) | | (318) | | (33) |
Others | | | | | |
Segment Results | | | | | |
External revenues | 70 | | 117 | | 12 |
Inter-segment revenues | 350 | | 648 | | 67 |
Total segment revenues | 420 | | 765 | | 79 |
Segment expenses | (342) | | (685) | | (71) |
Segment results | 78 | | 80 | | 8 |
Depreciation and amortization expenses | (14) | | (22) | | (2) |
Provision for impairment of receivables | - | | - | | - |
Year ended December 31,2012 compared to year ended December 31,2011.
Corporate Segment
Our corporate segment revenuesincreased by Rp2,479 billion, or12.7%, from Rp19,568 billion in2011 to Rp22,047 billion in2012. The increase in corporate segment revenues was primarily dueto an increase in interconnection revenue of Rp1,632billion, or 40.8%, primarily resulting from an increase in IP transit and outgoing IDD revenues. Data and internet revenues increase of Rp705 billion, or 15.8%, primarily due to an increase in revenues from Metro Ethernet and data, internet and telecommunication service in-line with an increase of 70.8% in Metro Ethernet data volume from 140,733 Mbps in 2011 to 240,315 Mbps in 2012.
Our corporate segment expensesincreased by Rp2,317 billion, or14.8%, from Rp15,659 billion in2011 to Rp17,976 billion in2012, primarily due toincrease in operation and maintenance expense by Rp1,763 billion, or 31.4%, primarily resulting from cooperation expense and operating and maintenance expense for antennae and towers. Personnel expense also increased by Rp459 billion, or 15.1%, from 2011.
Home Segment
Our home segment revenues decreased by Rp476 billion, or 4.7%, from Rp10,059 billion in 2011 to Rp9,583 billion in 2012, primarily due to a decrease in fixed wireline telephone revenues of Rp616 billion, or 10.2%, which resulted from both decreased fixed wireline ARPU and usage due to shifting usage to cellular and fixed wireless telephone services.
Our home segment expenses decreased by Rp383 billion, or 4.6%, from Rp8,322 billion in 2011 to Rp7,939 billion in 2012, primarily due to decrease in operation and maintenance expense by Rp1,352 billion, or 55.3%, which was partially offset by increase in depreciation expense by Rp561 billion, or 46.3%, and personnel expenses by Rp382 billion, or 11.7%.
Personal Segment
Our personal segment revenues increased by Rp5,362 billion, or 10.5%, from Rp50,913 billion in 2011 to Rp56,275 billion in 2012, primarily due to an increase in cellular revenues of Rp4,957 billion, or 15.0% and an increase in interconnection revenue by Rp444 billion, or 14.1% compared to 2011. The increase in cellular revenues was primarily due to an increase in data and internet revenue by Rp2,553 billion in 2012 as compared to 2011, or 49.1%,and an increase in long distance cellular revenue by Rp 1,397 billion in 2012 as compared to 2011, or 20.6%. The increase in interconnection revenue was primarily due to an increase in local cellular revenue.
- 68 -
Our personal segment expenses increased by Rp1,693 billion, or 4.9%, from Rp34,679 billion in 2011 to Rp36,372 billion in 2012, primarily due to an increase in interconnection expenses of Rp196 billion, or 4.2% and an increase in operation and maintenance expenses of Rp1,025 billion, or 7.6%. The increase in operation and maintenance expense was primarily due to an increase in transport expense and an increase in radio frequency expenses. On the other hand, depreciation expenses decreased by Rp1,066 billion or 9.9% due to the changes in the estimated useful lives of towers and certain equipment.
Other Segment
Our other segment revenues increased by Rp345 billion, or 82.1%, from Rp420 billion in 2011 to Rp765 billion in 2012, due to the increase in TelkomProperty’s other telecommunication services of Rp273 billion, or 368%, resulting from the increase in management project of Rp57 billion, or 102.8% and security services of Rp206 billion, or 100%. In addition, lease revenues also increase by Rp71 billion, or 20.5% due to the increase in building lease of Rp24 billion, or 48.7% and building maintenance of Rp 46 billion, or 15.6%.
Our other segment expenses increased by Rp343 billion, or 100.3%, from Rp342 billion in 2011 to Rp685 billion in 2012, primarily due to an increase in operating and maintenance expenses of Rp154 billion, or 37.4%, primarily resulting from an increase in project management expenses, expenses relating to the operation of buildings and land and electricity, gas and water expenses.
B. LIQUIDITY AND CAPITAL RESOURCES
The main source of our corporate liquidity is cash provided by operating activities and long-term debt through the capital markets as well as bank facilities through long-term and short-term loans. We divide our liquidity sources into internal and external liquidity.
To fulfill our obligations we rely primarily on our internal liquidity. As at December 31, 2012, we had Rp13,118 billion in cash and cash equivalents available. In 2012, cash and cash equivalents increased Rp3,484 billion, or 36.2%. In 2012, the primary source of cash inflows were cash receipts from customers of Rp71,910 billion.
We made net repayments of current indebtedness for borrowed money of Rp9,098 billion in 2010, Rp7,967 billion in 2011 and Rp5,843 billion (US$606 million) in 2012. Cash outflows in 2012 reflected payments for:
- Two-step loans and bank loans of Rp4,259 billion;
- Short-term bank loans of Rp654 billion; and
- Obligations under finance leases of Rp418 billion.
Our internal liquidity strength reflected in our current ratio, which we calculate as current assets divided by current liabilities, increased from 96.4% as of December 31, 2011 to 116.0% as of December 31, 2012.
Our primary external sources of liquidity are short and long-term bank loans, two step loans, bonds and notes payable. During the year 2012, we used external liquidity:
- Two-step loans and bank loans of Rp3,936 million; and
- Short-term bank loans of Rp590 million.
In 2013, we expect that our liquidity and capital resources requirements will consist of the following: requirements for ongoing working capital, payments for debt service requirements, taxes, capital expenditures for infrastructure, dividends, payments of contributions to our pension plans and post-retirement health care plan, potential acquisitions to augment our businesses and potential early retirement offers to targeted employees.
We expect that our cash inflows for 2013 will come from cash receipts from revenues, new bank loan facilities, if required, vendor financing and drawdowns on our existing bank loan facilities. As of December 31, 2012, we hadexisting undrawn loan facilities in the amount of approximately Rp3,545 billion which includes the following sources of unused liquidity:
- ABN Amro Bank facility in the amount of Rp1,925 billion;
- Bank CIMB Niaga loan facility in the amount of Rp1,204 billion;
- BRI loan facility in the amount of Rp214 billion;
- BNI loan facility in the amount of Rp200 billion; and
- Syndicated loan facility of BNI, BRI and Bank Mandiri in the amount of Rp2.5 billion.
- 69 -
Net Cash Flows
The following table sets out information concerning our consolidated cash flows, as set out in (and prepared on the same basis as) our Consolidated Financial Statements:
| Years Ended December 31, |
| 2010 | | 2011 | | 2012 | | 2012 |
| (Rp billion) | | (Rp billion) | | (Rp billion) | | (US$ million) |
Net cash flows: | | | | | | | |
provided by operating activities | 27,725 | | 30,462 | | 27,941 | | 2,898 |
used in investing activities | (16,484) | | (14,414) | | (11,311) | | (1,173) |
used in financing activities | (9,820) | | (15,539) | | (13,314) | | (1,381) |
Net increase in cash and cash equivalents | 1,421 | | 509 | | 3,316 | | 344 |
Effect of exchange rate changes on cash and cash equivalents | (106) | | 5 | | 168 | | 17 |
Cash and cash equivalents at beginning of year | 7,805 | | 9,120 | | 9,634 | | 1,000 |
Cash and cash equivalents at end of year | 9,120 | | 9,634 | | 13,118 | | 1,361 |
Year ended December 31, 2012 compared to year ended December 31, 2011
Cash Flows from Operating Activities
Net cash provided by operating activities in 2012 was Rp27,941 billion (US$2,898 million) compared to Rp30,462 billion in 2011. The decrease was primarily due to an increase of Rp8,144 billion, or 31.9%, in cash payments forexpenses. This was partially offset by an increase of Rp4,441 billion, or 6.6%, in cash receipts from customers due to the increase of our revenues.
Cash Flows from Investing Activities
Net cash flows used in investing activities in 2012 was Rp11,311 billion (US$1,173 million) compared to Rp14,414 billion in 2011. This decrease was primarily due to an increase of Rp3,975 billion, or 12,045.5% in purchases of available for sale financial assets and a decrease of Rp4,884 billion, or 37.3%, in cash payments for the acquisition of property and equipment. This was partially offset by an increase of Rp1,862 billion or 14,323.1% in proceeds from insurance claims relating to unsuccessful launch of the Telkom-3 satellite.
Apart from cash on hand and cash in banks, we invest the majority of our excess cash from time to time in time deposits. Since May 14, 2004, we also have been investing a part of our excess cash in Rupiah-based mutual funds and other marketable securities. As of December 31, 2012, other current financial assets totaling Rp4,338 billion (US$450 million) in mutual funds and other marketable securities were outstanding.
Cash Flows from Financing Activities
Net cash flows used in financing activities totaled Rp13,314 billion (US$1,381 million) in 2012 compared to Rp15,539 billion in 2011. This decrease by Rp2,225 billion, or 14.3%, was primarily due to a decrease of Rp3,075 billion, or 41.9%, in repayment of two-step loans and bank loans and a decrease of Rp315 billion, or 15.3% in payments for treasury stock. This was partially offset by an increase of Rp1,058 billion, or 17.4%, in cash dividends paid to our stockholders.
Year ended December 31, 2011 compared to year ended December 31, 2010
Cash Flows from Operating Activities
Net cash provided by operating activities in 2011 was Rp30,462 billion (US$3,358 million) compared to Rp27,725 billion in 2010. Our higher operating cash flow was primarily due to:
- An increase of Rp2,936 billion, or 4.5%, in cash receipts from customers due to the increase of our revenues;
- A decrease of Rp484 billion, or 5.4%, in cash payments to employees; and
- A decrease of Rp470 billion, or 8.1%, in cash payments for income taxes.
The above increase in operating cash flows was partially offset by:
- A decrease of Rp659 billion, or 100.0%, in cash receipts of claim for tax refund as no claim for tax refund occurred in 2011; and
- An increase of Rp612 billion, or 158.5%, in payments of cash refund to customers.
Cash Flows from Investing Activities
Net cash flows used in investing activities in 2011 was Rp14,414 billion (US$1,590 million) compared to Rp16,484 billion in 2010. This was primarily due to a decrease of Rp1,813 billion, or 12.2%, in cash payments for the acquisition of property and equipment.
- 70 -
Apart from cash on hand and cash in banks, we invest the majority of our excess cash from time to time in time deposits. Since May 14, 2004, we also have been investing a part of our excess cash in Rupiah-based mutual funds and other marketable securities. As of December 31, 2011, other current financial assets totaling Rp373 billion (US$41 million) in mutual funds and other marketable securities were outstanding.
Cash Flows from Financing Activities
Net cash flows used in financing activities in 2011 was Rp15,539 billion (US$1,713 million) compared to Rp9,820 billion in 2010. This was primarily due to:
- A decrease of Rp4,731 billion, or 56.9%, in cash receipts from the proceeds from loans and other borrowings, resulted from a decrease in cash receipts from the proceeds from two-step loans and bank loans by Rp2,146 billion, or 44.3% doubled with a decrease of Rp2,991 billion in cash receipts from the proceeds from bonds, as no bonds were issued in 2011; and
- An increase of Rp2,059 billion in cash payments for treasury stock, as no such purchases were made in 2010.
This was partially offset by a decrease of Rp1,131 billion, or 12.4%, in cash payments for the repayments of loans and other borrowings, primarily due to a decrease of Rp1,382 billion, or 15.9%, in cash payments for the repayments of two-step loans and bank loans.
Current Assets
As of December 31,2012, ourcurrent assets wereRp27,973 billion (US$2,901 million) compared to Rp21,401 billionas of December 31, 2011. Theincreasein current assets was mainly due to the increase of Rp3,965billion, or 1,063.0% in other current financial assets and in cash and cash equivalents of Rp3,484billion, or 36.2%.
Thisincreasewas partially offset by:
- A decrease of Rp791billion, or 100.0% in asset held for sale when no assets held for sale recorded as of December 31, 2012; and
- A decrease of Rp581billion, or 91.8% in prepaid income taxes.
Current Liabilities
Current liabilities wereRp24,108 billion (US$2,501 million) as of December 31,2012 and Rp22,189 billionas of December 31,2011. Thisincrease was primarily due to:
- An increase of Rp1,373billion, or 28.7% in accrued expenses, which mainly related to salaries and benefits of Rp591 billion and early retirement program of Rp699 billion; and
- An increase of Rp551 billion, or 75.6% in current income tax liabilities.
Thisincrease was partially offset by adecrease of Rp898 million, or 10.7% in trade and other payables, which mainly related to purchases of equipments, materials and services from third parties.
Working Capital
Net working capital, calculated as the difference between current assets and current liabilities, amounted to a deficit Rp788 billion as of December 31, 2011 and surplus Rp3,865 billion (US$400 million) as of December 31, 2012. The increase in net working capital was primarily due to:
- A substantial increase ofRp3,965 billion in other current financial assets (mainly available-for-sale financial assets);
- An increase ofRp3,484 billion in cash and cash equivalents; and
- A decrease ofRp1,240 billion in trade payables from third parties.
This was partially offset by:
- An increase ofRp1,373 billion in accrued expense;
- An increase ofRp808 billion in current maturities of long-term liabilities; and
- A decrease ofRp791 billion in asset held for sale.
We believe that our working capital is sufficient for our present requirements. We expect that our working capital will continue to be addressed by various funding sources, including cash from operating activities and bank loans. See “Liquidity and Capital Resources”.
Capital Structure
Our capital structure as of December 31, 2012 is described as follows:
| Amount (Rp billion) | | Portion (%) |
Short Term | 37 | | 0.1 |
Long Term | 19,238 | | 29.1 |
Debt | 19,275 | | 29.2 |
Equity | 46,700 | | 70.8 |
Total Invested Capital | 65,975 | | 100.0 |
- 71 -
We take a qualitative approach towards our capital structure and debt levels. Under our syndicated loan agreement with BNI and BRI dated June 16, 2009, we are required to maintain a debt to equity ratio of not more than 2.0 and debt service coverage ratio of more than 1.25. As of December 31, 2012, our debt to equity ratio was 0.4 and our debt service coverage ratio was 4.2, indicating our strong ability to meet our debt obligations. Our debt levels are primarily driven by our plans to develop our existing and new strategic businesses. In determining our optimum debt levels, we also consider our debt ratios with reference to regional peers in the telecommunications industry.
Indebtedness
Consolidated total indebtedness (consisting of long-term liabilities, current maturities of long-term liabilities, short-term bank loans and deferred consideration for business combinations) as of December 31, 2010, 2011 and 2012 were as follows:
| As of December 31, |
| 2010 | | 2011 | | 2012 | | 2012 |
| (Rp billion) | | (Rp billion) | | (Rp billion) | | (US$ million) |
Indonesian Rupiah | 17,667 | | 14,142 | | 16,192 | | 1,680 |
US Dollar(1) | 3,147 | | 2,561 | | 2,052 | | 213 |
Japanese Yen(2) | 1,191 | | 1,168 | | 1,031 | | 107 |
Total | 22,015 | | 17,871 | | 19,275 | | 2,000 |
(1) The amounts as of December 31, 2010, 2011 and 2012 translated into Rupiah at Rp9,015, Rp9,075 and Rp9,645 = US$1, respectively, being the Reuters sell rates for US Dollar at each of those dates. |
(2) The amounts as of December 31, 2010, 2011 and 2012 translated into Rupiah at Rp110.8, Rp117.0 and Rp111.8 = Yen 1, respectively, being the Reuters sell rates for Yen at each of those dates. |
Of our total indebtedness, as of December 31, 2012,Rp5,658 billion,Rp8,116 billion andRp1,758 billion were scheduled for repayment in 2013, 2014 to 2015 and 2016 to 2017, and thereafter, respectively. For further information on our Company’s indebtedness, see Notes 17-18 to our Consolidated Financial Statements.
Capital Expenditures
In 2012, we incurred capital expenditures of Rp17,272billion (US$1,792million), less than the originally budgeted Rp19,863billion.Thisdecreasewas mainly due to the delay of our SCCS development projects.
Our capital expenditures are grouped into the following categories for planning purposes:
- Broadband services, which consist of broadband, IT, application and content and service node;
- Network infrastructure, which consists of core transmission network,metro-ethernet and Regional Metro Junction (“RMJ”),IP backbone and satellite;
- Optimizing legacy, which consists of fixed wireless and fixed wireline; and
- Capex supports.
Of our Rp17,272billion capital expenditure in 2012, Telkom (as parent company) incurred capital expenditures of Rp4,040billion (US$419 million), Telkomsel incurred capital expenditures of Rp10,656billion (US$1,106million) and our other subsidiaries incurred capital expenditures of Rp2,576 billion (US$267million) as follows:
Table of realization of our capital expenditure | | | | | | | |
| Years Ended December 31, |
| 2009 | | 2010 | | 2011 | | 2012 |
| (Rp billion) | | (Rp billion) | | (Rp billion) | | (Rp billion) |
Telkom (Parent Company) | | | | | | | |
Broadband Services | 1,312 | | 1,313 | | 1,875 | | 1,662 |
Network Infrastructure | 2,208 | | 1,861 | | 1,979 | | 2,060 |
Optimizing Legacy | 1,913 | | 264 | | 156 | | 86 |
Support | 219 | | 185 | | 192 | | 232 |
Subtotal for Telkom (Parent Company) | 5,652 | | 3,623 | | 4,202 | | 4,040 |
Subsidiaries | | | | | | | |
Telkomsel | 12,673 | | 8,197 | | 8,472 | | 10,656 |
Others | 836 | | 831 | | 1,929 | | 2,576 |
Subtotal for Subsidiaries | 13,509 | | 9,028 | | 10,401 | | 13,232 |
Total for Telkom Group | 19,161 | | 12,651 | | 14,603 | | 17,272 |
- 72 -
Material Commitments for Capital Expenditures
Purpose of the Commitment
As of December 31, 2012, we had material commitments for capital expenditures under certain contractual arrangements of Rp10,355 billion, principally relating to procurement and installation of switching equipment, transmission equipmentand cable network. These include, among others, broadband access development with MSAN platform, GPON project, metro Ethernet expansion project, Mataram-Kupang Palapa Ring project, Sumatra-Bangka SCCS project, Tarakan-Tanjung Selor SCCS project, Jakarta-Bangka-Batam-Singapura SCCS project and Luwuk-Tutuyan SCCS project.
Our subsidiary, Telkomsel, has material commitments for capital expenditures related, among others, to the construction of combined 2G and 3G core network as well as maintenance and procurement of equipment and related services for Next Generation Convergence, IP RAN Rollout and Technical Support. In addition, TelkomProperty and Mitratel also have material commitment for capital expenditures, each related to construction of Telkom Landmark Tower building and telecommunication towers.
For more detailed discussion regarding our material commitments for capital expenditures, see Note 37a to our Consolidated Financial Statements.
Source of Funds
We have historically funded our capital expenditures primarily with cash generated from operations. In 2013, we have budgeted capital expenditure of approximately Rp27.2 trillion, significantly higher than in 2012. We expect that of the total budgeted increase in capital expenditure for 2013 over 2012, a significant proportion of the increase will be allocated to broadband services, with a portion of the increase allocated to subsidiaries. We expect to still fund a majority of our capital expenditure requirements in 2013 with cash generated from operations, but we may consider alternative funding arrangements as well.
Actual future capital expenditures may differ from the amounts indicated above due to various factors, including but not limited to the Indonesian economy, the Rupiah/US Dollar and Rupiah/Euro exchange rates and other applicable foreign exchange rates, the availability of vendor or other financing on terms acceptable to us, technical or other problems in obtaining or installing equipment and whether we enter any new lines of business.
Critical Accounting Policies, Estimates and Judgments
For a complete discussion of our critical accounting policies, estimates and judgments, see Note 2 to our Consolidated Financial Statements.
New Standards and Interpretations
See Note 43 to our Consolidated Financial Statements for a discussion of the new standards, amendments to standards and interpretations not yet effective for the year ended December 31, 2012and have not been applied in preparing the Consolidated Financial Statements.
C. RESEARCH AND DEVELOPMENT, PATENTS AND LICENSES, ETC.
We routinely make investments in order to improve products and services. The investment amount reached around Rp8 billion, Rp13 billion and Rp13 billion (US$1 million), respectively, in 2010, 2011 and 2012. In 2012, investments were made related to research and development programs in support of the implementation of Mobile Broadband, HomeNetwork, Device, Machine to Machine, and Cloud Computing, in aspects of business, service and product, as well as in telecommunication network infrastructure.
In term of business, service & product, the research and development programs included Mobile Advertising center, Appstore, Smart Home (Home Monitoring, Telemetering, Wireless Sensor Network, Smart Home Over Power Line), Mobile Payment, Data center, E-tourism, Games, Intelligent Car, Map-based Social Media Platform, E-learning Content Enrichment, Telkom Game Center,over the topTV, SmartTV, Speedy Monitoring, Smart Home over Power Line, Smart Device 4GLTE, Business Signalling, TENOSS and TCEM. In terms of telecommunication network infrastructure, we engaged in research and development programs related to NGN, IMS, Service Broker, 100G, QoS Transport Supercore, Any Wire, GPON/10GPON, Wi-Fi, Femtocell, QoS EVDO, GPS and IPv6.
D. TREND INFORMATION
The significant trends, or developments that have had in recent years, and may have in the future, a material impact on our results of operations, financial condition and capital expenditures, include: (i)an increase incellular telephone revenues withincreases insubscribers, minutes of useanddeclining ARPU, (ii) an increase in revenues from data,internet and information technology services revenues, and (iii)adecrease in fixed lines telephone revenues. See “Operating Results”.
We believe favorable external factors, among others, will support our ability to continue to drive revenue growth from data, Internet and information technology services as well as from mobile phone services. Indonesia's economy recorded a relatively robust growth in recent years even with a sluggish global economy. With good economic fundamentals, Indonesia’s national economy is expected to continue to grow steadily over the next couple of years, with a corresponding increase in consumer purchasing power, which in turn is expected to result in higher demand fortelecommunications services, for both basic telecommunications services as well as the more sophisticated value-added services that are part of the increasingly prevalent digital lifestyle in modern societies.
- 73 -
In the longer term, Indonesia’s economy is also expected to enjoy support from Government initiatives such as the Master Plan for the Acceleration and Expansion of Indonesia’s Economic Development, which was launched in 2011. One of the three pillars of such master plan is development of national connectivity, including development of the information and communication technology sector. This is in line with our IDN program and our strategic initiative on the development of our Nusantara Superhighway project (i.e. thePalapa ring project known as id-Ring), an optical-based network of six interconnected rings which links Indonesia’s main island groups, namely the Sumatra ring, the Java ring, the Kalimantan ring, the Sulawesi ring, the Bali and Nusa Tenggara ring and the Maluku and Papua ring. We expect that the development of this extensive telecommunication network connecting all the six major economic corridors will allow us to offer more value-added services, and to reach more customers in a much larger scale, as well as provide opportunities for our products and services in theIMES areas.
Webelieve theshift inconsumer preferences towards a digital lifestylewill be a key factor that we expectwill drive our business next year. We believe this will lead to continuing increase in broadband demand (including mobile broadband), compensatingforthe decline of our legacy business (both fixed wireline and cellular telephone revenue and SMS revenue). Weexpect the increasein demand fordata communications and corporate internet to continue next year as we increase our capacity to cover more small and medium enterprises.
E. OFF-BALANCE SHEET ARRANGEMENTS
Our contingencies are described in Note 38 to our Consolidated Financial Statements and our commitments are described in Note 37 to our Consolidated Financial Statements and summarized in the table of contractual obligations below. Other than the above, as of December 31, 2012, we had no off-balance sheet arrangements that were reasonably likely to have a current or future material effect on our financial position, revenues or expenses, results of operations, liquidity, capital expenditures or capital resources.
F. TABULAR DISCLOSURE OF CONTRACTUAL OBLIGATIONS
The following table sets forth information on certain of our material contractual obligations as of December 31, 2012.
| By Payment Due Dates |
| Total | | Less than 1 year | | 1-3 years | | 3-5 years | | More than 5 years |
Contractual Obligations | (Rp billion) | | (Rp billion) | | (Rp billion) | | (Rp billion) | | (Rp billion) |
Short-Term Loans(1)(6) | 37 | | 37 | | - | | - | | - |
Long-Term Debts(2)(6) | 16,914 | | 5,111 | | 7,450 | | 1,285 | | 3,068 |
Capital Lease Obligations(3) | 2,324 | | 510 | | 666 | | 473 | | 675 |
Interest on Short-term Loans, Long-term Debts and Capital Lease Obligations(7) | 848 | | 142 | | 280 | | 215 | | 211 |
Operating Leases(4) | 13,829 | | 2,017 | | 3,518 | | 3,099 | | 5,195 |
Unconditional Purchase Obligations(5) | 10,355 | | 10,355 | | - | | - | | - |
Total | 44,307 | | 18,172 | | 11,914 | | 5,072 | | 9,149 |
(1) Related to liabilities under short-term loans obtained from Bank Ekonomi and Bank CIMB Niaga. See Note 17 to our Consolidated Financial Statements. |
(2) See Note 18 to our Consolidated Financial Statements. |
(3) Related to the leases of the transmission installation and equipment, vehicles and processing equipment and office equipment for our telecommunication networks for Telkom Flexi and CPE. |
(4) Related primarily to leases of leased line, telecommunication equipment and land and building. |
(5) Capital expenditures committed under contractual arrangements. |
(6) Excludes the related contractually committed interest obligations. |
(7) See Item 3 “Key Information – Risk Factors – Risks Related to Our Business – Financial Risks – We are exposed to interest rate risk”. |
See Note 37 to our Consolidated Financial Statements for further details on our contractual commitments. In addition to the above contractual obligations, as of December 31, 2012, we had long-term liabilities for pension, post-employment health care benefits and long service awards. In 2012 we contributed Rp300 billion to our post-employment health care benefits and to our defined benefit pension plan Rp186 billion. See Note 32 to our Consolidated Financial Statements.
G. SAFE HARBOR
All information that is not historical in nature disclosed under “Off-Balance Sheet Arrangements” and“Tabular Disclosure of Contractual Obligations” is deemed to be a forward-looking statement. See “Forward-Looking Statements".
- 74 -
ITEM 6.DIRECTORS, SENIOR MANAGEMENT AND EMPLOYEES
A. DIRECTORS AND SENIOR MANAGEMENT
In accordance with Indonesian law, we have a Board of Commissioners and a Board of Directors. These boards are separate, and no individual may be a member of both boards. The members of the Board of Commissioners and Board of Directors are elected, and dismissed by shareholders’ resolutions at a GMS. As stated in the Articles of Association, to be elected, candidates must be nominated by the Government as holder of the Series A Dwiwarna share. The term of office for each Commissioner and Director is five years from the date of his/her election, unless the date of expiration of the term of office falls on a day other than a business day, in which case such term of office shall expire on the following business day. Shareholders, through an AGMS or an EGMS, have the right to discharge a Commissioner or Director at any time before the expiration of his/her term of office.
Board of Commissioners
The Board of Commissioners is responsible for supervising and providing advice to the Board of Directors. The Board of Commissioners consists of five members, one of whom is designated the President Commissioner. In accordance with OJK regulations and IDX rules which require 30% of our Board of Commissioners to be independent, the following Commissioners have been designated as our Independent Commissioners: Johnny Swandi Sjam and Virano Gazi Nasution. The principal duty of such Independent Commissioners, in addition to exercising supervision, is to represent the interests of the minority shareholders.
As of December 31, 2012, the Board of Commissioners consisted of five members as listed below:
Name | | Age | | Commissioner Since | | Position |
Jusman Syafii Djamal | | 58 | | 2011 | | President Commissioner |
Hadiyanto | | 50 | | 2012 | | Commissioner |
Parikesit Suprapto | | 61 | | 2012 | | Commissioner |
Johnny Swandi Sjam | | 52 | | 2011 | | Independent Commissioner |
Virano Gazi Nasution | | 44 | | 2012 | | Independent Commissioner |
Jusman Syafii Djamal
Jusman Syafii Djamal has served asourPresident Commissioner since January 1, 2011. Currently, he also serves as President Commissioner (Independent) at PT Cardig Aero Services Tbk, as President Commissioner (Independent) at PT Toba Bara Sejahtera Tbk., asPresidentCommissioner (Independent) at PTMandala Airline Tbk, and as Chairman at Matsushita Gobel Foundation. Since May 20, 2011, he is by appointment of the President of the Republic of Indonesia, a member of the National Innovation Committee (a think tank ofthePresident oftheRepublic Indonesia on Innovation Policy). Previously, Mr. Djamal was the Minister of Transportation for the “Indonesia Bersatu Pertama” cabinet (2007-2009) and concurrently a member of the National Transportation Safety and Security Evaluation Team (2007) founded to evaluate and find the“root causes” of accidents in Shipping/Marine, Railways and Highways transportation. He has vast experience in aircraft industry management due to exposures to a variety of strategic positions; as the President Director of PT Dirgantara Indonesia (2000-2002), as Director of Human Resources of PT IPTN (1999-2000), as Director of Helicopters, Defense Technology and Satellite (1996-1999), as Chairman of PT IPTN’s Restructuring Program Implementation team (1998-2001), and as Chief Project Engineer for N250 Development & Constructional Design (1989-1995). As a professionalaerodynamicsengineer with twenty years of experience in Computational Aerodynamics and Configuration Development, he holds, an Intellectual Property Right Patent No. ID 0 021 669 for electronic-based Flight Control Systems issued on August 15, 2008 together with the late Bambang Pamungkas. He was awarded the Nararya Dedicational Award from the Republic of Indonesia on August 17, 1995.He is co-author of Grand Techno Economic Strategy-Siasat Memicu Produktivitas (Mizan Publishers, 2009). He earned his Bachelor of Mechanical Engineering in Aeronautical Engineering from Institut Teknologi Bandung (1983).
Hadiyanto
Hadiyanto has served asour Commissioner since May 11, 2012. Currently, he also serves as Director General of State Treasury at the Ministry of Finance of the Republic of Indonesia. He has assumed, among other positions, Head of the Legal Bureau, Secretariat General of the Ministry of Finance and was the Alternate Executive Director at the World Bank, Washington D.C., US. He was the President Commissioner of PT Garuda Indonesia Tbk (2007-2012) and President Commissioner of PT Bank Export Indonesia (2007-2009). He holds a Bachelor’s degree in Law from the University ofPadjadjaran, Bandung, a Master of Law Degree (LLM) from Harvard University Law School, USA, and a PhD. in Law from the University of Padjadjaran, Bandung.
- 75 -
Parikesit Suprapto
Parikesit Suprapto has served asour Commissioner since May 11, 2012. Previously he was the Deputy of Business Services at theMinistry of SOE (2010-2012), Deputy Head of Banking and Finance Industry at the Ministry of SOE (2008-2010) and Advisor to the Minister of SOE for Small Business Sector (2006-2008). He was a Commissioner of PT Indosat Tbk. (2011-2012) and a Commissioner of PT Bank Negara Indonesia (Persero) Tbk. He earned a Bachelor’s degree in Corporate Economics from Sekolah Tinggi Manajemen Industri, Jakarta (1980), a Master’s degree in Economic Development from Indiana University, Indiana, USA (1990) and a PhD degree in DevelopmentEconomicsfrom the University of Notre Dame, Indiana, USA (1995).
Johnny Swandi Sjam
Johnny Swandi Sjam has served asourIndependent Commissioner since January 1, 2011. Currently he is also the Chairman of the Standing Committee on Infrastructure and Telecommunications Services at the Indonesian Chamber of Commerce and Industry (“KADIN”). He previously served, among other positions, as a Commissioner at PT Inti Limited (2010-2011), the President Director of PT Indosat Tbk. (2007-2009), the Director of PT Indosat Tbk. (2005-2007), the President Director of Satelindo (2002-2003), and several other important positions at subsidiaries of Indosat like Satelindo, Sisindosat and Intikom (1997-2002). He holds a Diploma III in Computer Engineering from Bandung Institute of Technology, a Diploma IV from Sekolah Tinggi Manajemen Industri of the Department of Industry of Indonesia, a Bachelor’s degree in Informatics Management from Gunadarma University, Jakarta, and a Master’s degree in Business Policy and Administration from the University of Indonesia, Jakarta.
Virano Gazi Nasution
Virano Gazi Nasution has served asourIndependent Commissioner since May 11, 2012. He was previously the Commercial Director of PT Indonesia Comnet Plus, a subsidiary of PT PLN (Persero) (2009-2012), Advisor to the Minister of Communications and Informatics (2008-2009), and the President Director of PT Bakrie Telecom Tbk. (2001-2005). He earned his Master of Science degree in Engineering Economics from Stanford University, USA.
Our Board of Commissioners is assisted by a Board Secretary whose main function is to ensure that while performing their tasks, the Board of Commissioners has complied with our Articles of Association as well as applicable laws and regulations. The Board of Commissioners’ office address is Grha Citra Caraka Building, 5th Floor, Jl. Gatot Subroto Kav.52, Jakarta,12710, Indonesia.
Board of Directors
Our Board of Directors is responsible for our overall management and day-to-day operations under the supervision of the Board of Commissioners. The Board of Directors consists of eight members, including a President Director.
As December 31, 2012, the Board of Directors consisted of eight members as listed below:
Name | | Age | | Director Since | | Position |
Arief Yahya | | 51 | | 2012 | | President Director (CEO) |
Honesti Basyir | | 44 | | 2012 | | Director of Finance (CFO) |
Indra Utoyo | | 51 | | 2007 | | Director of IT Solution & Strategic Portfolio |
Sukardi Silalahi | | 47 | | 2012 | | Director of Consumer |
Muhammad Awaluddin | | 45 | | 2012 | | Director of Enterprise & Wholesale |
Rizkan Chandra | | 44 | | 2012 | | Director of Network & Solution |
Priyantono Rudito | | 43 | | 2012 | | Director of Human Capital & General Affairs |
Ririek Adriansyah | | 49 | | 2012 | | Director of Compliance & Risk Management |
Arief Yahya
Arief Yahya has servedasour President Director since May 11, 2012. Concurrently, he also serves as President Commissioner of Telkomsel, a subsidiary of Telkom. Prior to his appointment as President Director, he led a career with Telkom in various positions, including as Director of Enterprise & Wholesale (2005-2012), Head of Regional Division V East Java (2004-2005) and Head of Regional Division VI Kalimantan (2003-2004). He holds a Bachelor’s degree in Electrical Engineering from Institut Teknologi Bandung (1986) and a Master’s degree in Telematics from University of Surrey, UK (1994).
Honesti Basyir
Honesti Basyirhas served asourDirector of Finance since May 11, 2012. Prior to his appointment as Director of Finance, he has held a number of key positions with Telkom, including Vice President (“VP”)forStrategic Business Development at ITSS Directorate (2012); VP for Strategic Business Development at SICP (2010-2012); Project Controller of Project Management Office (2009-2010) and Assistant Vice President (“AVP”)forBusiness & Finance Analysis (2006-2009). He holds a Bachelor’s degree in Industrial Technology from Institut Teknologi Bandung (1992) and a Master’s degree in Corporate Finance from Sekolah Tinggi Manajemen Bandung (2004).
- 76 -
Indra Utoyo
Indra Utoyohas served asour Director ofIT Solution & Strategic Portfolio (“ITSSP”) since February 28, 2007.He joined Telkomin 1986and has held a variety of positions. Prior to his appointment as Director of ITSSP he served as Director of Information Technology Solution & Supply (2007-2012). He holds a Bachelor’s degree in Electrical Engineering from Institut Teknologi Bandung (1985) and a Master’s degree in Communication & Signal Processing from Imperial College, UK (1994).
Sukardi Silalahi
Sukardi Silalahihas served asour Director of Consumer since May 11, 2012. Hasjoined Telkomin 1991 and, prior to his appointment as Director of Consumer, he servedin a variety of positions, including Executive General Manager (“EGM”) of Eastern Consumer Service Division (2011-2012); Deputy EGM of Western Consumer Service Division (2010-2011); EGM of Regional Division VI Kalimantan (2008-2010) and Deputy EGM of Fixed Wireless Network Division (2007-2008). He holds a Bachelor’s degree in Civil Engineering from Institut Teknologi Bandung (1989).
Muhammad Awaluddin
Muhammad Awaluddin has served asour Director of Enterprise & Wholesale (“EWS”) since May 11, 2012. Concurrently, he also serves as President Commissioner of Infomedia, an indirect subsidiary of Telkom. Prior to his appointment as Director of EWS, he served, among other positions, as President Director of Infomedia (2010-2012); EGM of Access Network Division, Telkom (2010) and EGM of Regional Division I Sumatra, Telkom (2007-2010). He holds a Bachelor’s degree in Electrical Engineering from Universitas Sriwijaya, Palembang (1990) and a Master’s degree in Business Administration from the European University, Antwerp, Belgium (1998).
Rizkan Chandra
Rizkan Chandra has served asour Director of Network & Solution (“NS”) since May 11, 2012. Concurrently, he also serves as CommissionerofTelkomsel,a subsidiary of Telkom,and as Commissioner at Metranet,an indirect subsidiary of Telkom. Prior to his appointment as Director of NS, among other positions, he served as President Director of Sigma,our indirect subsidiary (2010-2012); Senior General Manager (“SGM”) of Telkom Learning Center (2008-2010) and VPforInfrastructure & Service Planning, Telkom (2007-2008). He holds a Bachelor’s degree in Informatics from Institut Teknologi Bandung (1992) and a Master’s degree in Management of Technology fromtheNational University of Singapore (2000).
Priyantono Rudito
Priyantono Ruditohas served asour Director of HumanCapital & General Affairs (“HCGA”) since May 11, 2012. Concurrently, he also serves as Commissioner of Telkomsel, a subsidiary of Telkom.Since he joined Telkomin 1991, he has served in a number of positions, including as VPforCorporate Strategic Planning (2011-2012) and VP for Marketing & Consumer Care (2007-2011). He holds a Bachelor’s degree in Industrial Engineering from Institut Teknologi Bandung
(1991) and a Master’s degree in Business (Marketing)(1997)and a Doctoral degree in Management (2011) fromtheRoyal Melbourne Institute of Technology, Australia.
Ririek Adriansyah
Ririek Adriansyahhas served asourDirector of Compliance & Risk Management (“CRM”) since May 11, 2012. Concurrently, he also serves as President Commissioner of Telin, a subsidiary of Telkom. Hejoined Telkomin 1990 and, prior to his appointment as Director of CRM, served as, among other positions, President Director of Telin, a subsidiary of Telkom (2011-2012); Director of Marketing & Sales, Telin (2010-2011); Director of International Carrier Service, Telin (2008-2010) and Deputy EGM of Infratel Division, Telkom (2004-2008). He holds a Bachelor’s degree in Electrical Engineering from Institut Teknologi Bandung (1989).
B. COMPENSATION
Compensation of Commissioners and Directors
Each Commissioner is entitled to monthly remuneration and benefits. They are also entitled to bonuses based on our business performance and achievements, which amount is determined by shareholders at the GMS. Commissioners are also entitled to a lump sum allowance upon resignation.
Each Director is entitled to a remuneration consisting of a monthly salary and other allowances (including pension benefits). Directors also receive an annual bonus based on our business performance and achievements, which amount is determined by shareholders at the GMS. The bonus and incentive are budgeted every year based on recommendations of the Directors and confirmation from Board of Commissioners before being considered by shareholders at the GMS.
The Nomination and Remuneration Committee is responsible for formulating the Commissioners’ and Directors’ salaries, which is further discussed in a joint meeting of our Board of Directors and Board of Commissioners for approval. The agreed formula is then submitted to the shareholders at the AGMS for consideration and approval.
- 77 -
The procedure for determining remuneration of our Board of Commissioners is as follows:
- The Board of Commissioners requests the Nomination and Remuneration Committee to formulate a proposal for the remuneration of the Board of Commissioners;
- The Nomination and Remuneration Committee requests an independent party to formulate the framework for the remuneration of the Board of Commissioners;
- The Nomination and Remuneration Committee proposes the remuneration framework to the Board of Commissioners;
- The Board of Commissioners proposes the remuneration for the members of the Board of Commissioners to the GMS; and
- The GMS determines the remuneration for the members of the Board of Commissioners.
Bonus and incentives are budgeted every year based on recommendations of the Board of Directors and confirmation from the Board of Commissioners before being considered by the shareholders at the AGMS. The Nomination and Remuneration Committee is responsible for formulating proposed formulae for the salaries of the Board of Directors’ which are further discussed during a joint meeting Board of Directors and Board of Commissioners for approval. The approved formula is then proposed in GMS for final approval. The performance of the Board of Directors and other management is measured through effective performance evaluations, which are conducted comprehensively, systematically and periodically in accordance with a decree of the Board of Commissioners. The criteria used in the assessment on the performance of Board of Directors is based on the balanced scorecard method measuring four main aspects, namely Financial, Customer, Internal Business Process, and Learning and Growth, each comprising three key performance indicators (“KPI”): Shared KPI, Common KPI and Specific KPI. Shared KPIs are the same in name, target, realization and achievement for all the Board of Directors. Common KPIs have the same name and target, but specify different realization and achievement for each of the Directors. Specific KPIs are different for each of the Directors and represent specific programs as the primary duty and priority for each of the Directors and its Directorate.
The net amount of remuneration paid to our Commissioners and Directors for the year ended December 31, 2012, including basic compensation (honorarium), bonus and other incentives, was Rp125 billion (US$13 million). There is no management pension plans or contingent compensation in place.
C. BOARD PRACTICES
Our Board of Commissioners acts as our overall supervisory and monitoring body with principal functions including planning and development, operations and budgeting in compliance with our Articles of Association, and to carry out the mandate and resolutions of the AGMS and EGMS. The Board of Commissioners does not have the authority to run or manage our Company, except in the exceptional situation of all members of the Board of Directors having been suspended for any reason. The Board of Commissioners provides advice and opinions to the AGMS with respect tofinancial reporting, business development, appointment of auditors, and other important and strategic matters related to corporate actions. The Board of Commissioners also reviews our work plan and budget, keeps abreast of our progress, and in case our Company gives an indication of slowing-down, immediately requests the Board of Directors to notify the shareholders and provides recommendations on measures for mitigation. Finally, the Board of Commissioners ensures that our corporate governance program is properly applied and maintained according to the applicable regulations.
The Board of Commissioners is obliged to carry out its duties and responsibilities according to our Articles of Association, decisions from the AGMS and EGMS and applicable laws and regulations.
The Board of Commissioners is assisted by a Board of Commissioners Secretary as well as the Audit Committee, the Nomination and Remuneration Committee and the Planning and Risk Evaluation and Monitoring Committee. As necessary, the Board of Commissioners seeks assistance from professional advisors.
Meetings of the Board of Commissioners are held at least once a month at any time deemed necessary by one or more members of the Board of Commissioners, or at the written request of one or more shareholders holding at least one-tenth of our outstanding shares of common stock. Decisions at Board of Commissioners meetings are taken through a process of deliberation and consensus. If a consensus cannot be reached, decisions are based on a majority vote of the Commissioners in attendance or who are represented at the meeting. In the event of a tie, the proposal in question must be rejected. The quorum for all Board of Commissioners meetings is more than one-half of the total number of Commissioners then represented in person or by proxy granted to another Commissioner at such meeting.
Our Board of Directors is generally responsible for managing our business in accordance with applicable laws, our Articles of Association and the policies and directives issued by the GMS and the Board of Commissioners. The Board of Directors also has the right to act for and on our behalf, inside or outside a court of law, on any matter and for any event, with another party.
Meetings of the Board of Directors may be convened at any time deemed necessary at the request of one or more members of the Board of Directors, at the request of the Board of Directors or upon a written request from one or more shareholders representing one-tenth or more of the total number of outstanding shares of common stock.Meetings of the Board of Directors are chaired by the President Director. In the event that the President Director is unavailable or absent for any reason, the meeting will be chaired by a member of the Board of Directors appointed in the meeting.
- 78 -
The decisions of the Board of Directors meetings shall be reached by consensus through deliberation. If this method fails, the decision shall be passed by voting based on the majority votes by Board of Director members cast in the meeting. A quorum is reached at a meeting where more than half of the members of the Board of Directors are present or represented legally by proxy in the meeting. Each member of the Board of Directors who is present at the meeting shall be entitled to cast one vote (and one vote for each other member of the Board of Directors whom he represents).
Individual Directors are charged with specific responsibilities.
Audit Committee
The Audit Committee operates under the authority of the Audit Committee Charter, which was promulgated by a Decree of the Board of Commissioners. The Audit Committee Charter is regularly evaluated and, if necessary, amended to ensure compliance with OJK and SEC requirements and other relevant regulations. The Audit Committee charter was stipulated by the Board of Commissioners’ Decree No.11/KEP/DK/2011 dated November 30, 2011 regarding the Charter of the Telkom Group Audit Committee. In 2012, no changes were made to regulations related to our Audit Committee that would require us to amend our Audit Committee Charter.
The Audit Committee Charter outlines the Audit Committee’s purpose, function and responsibilities. It provides that the Audit Committee is responsible for:
- Overseeing our financial reporting process on behalf of the Board of Commissioners;
- Providing recommendations to the Board of Commissioners regarding the selection of our external auditor, subject to shareholder approval;
- Discussing with our internal and external auditors on the overall scope and plans of their respective audits;
- Reviewing our Consolidated Financial Statements and the effectiveness of Internal Controls Over Financial Reporting (“ICOFR”);
- Convening regular meetings with internal and external auditors, without the presence of management, to discuss the results of their evaluation and audit of our internal controls as well as the overall quality of our financial reporting; and
- Carrying out additional tasks that are assigned by the Board of Commissioners, especially on financial and accounting related matters as well as other obligations required by the Sarbanes Oxley Act of 2002.
The Audit Committee may engage an independent consultant or other professional advisers to assist in carrying out its functions. In addition, the Audit Committee receives and handles complaints.
Audit Committee Independence
Bapepam-LK Audit Committee Rules require that the Audit Committee consists of at least three members, one of whom must be an Independent Commissioner who serves as chairman, while the other two members must be independent. At least one of these two members must have expert knowledge (in the context of Item 16A of Form 20-F) in the field of accountancy or finance. In order to be considered independent under the prevailing Indonesian rules, the external members of the Audit Committee:
- May not be an executive officer of a public accountant firm that has provided audit or non-audit services to us within the six months prior to his or her appointment as an Audit Committee member;
- May not have been our executive officer within the six months prior to his or her appointment as an Audit Committee member;
- May not be affiliated with our majority shareholder;
- May not have a family relationship with any member of the Board of Commissioners or Board of Directors;
- May not own, directly or indirectly, any of our shares; and
- May not have any business relationship that relates to our businesses.
Currently, the Audit Committee consists of six members: (i) Johnny Swandi Sjam (Independent Commissioner and Chairman); (ii) Salam (Secretary); (iii) Virano Gazi Nasution (Independent Commissioner); (iv) Parikesit Suprapto (Commissioner); (v) Sahat Pardede and (vi) Agus Yulianto.
Audit Committee Financial Expert
See Item 16A “Audit Committee Financial Expert”.
Exemption from US Listing Standards for Audit Committees
See Item 16D “Exemptions from the Listing Standards for Audit Committees”.
- 79 -
Nomination and Remuneration Committee
Our Nomination and Remuneration Committee was formed pursuant to Board of Commissioner’s decree No.003/KEP/DK/2005 dated April 21, 2005 regarding the Establishment of the Nomination and Remuneration Committee.
The objective of the Nomination and Remuneration Committee is to establish, administer and enforce corporate governance principles in the process of nomination for strategic management positions and the determination of the Board of Directors’ remuneration. The duties of the Nomination and Remuneration Committee are to:
- Devise a nomination and selection system for strategic positions within Telkom, referring to corporate governance principles, such as transparency, accountability, responsibility, fairness and independence;
- Assist the Board of Commissioners who engaged with the Directors in selecting candidates for strategic positions in Telkom (i.e. one level under the Directors and similarly for Directors and Commissioners of a consolidated subsidiary that contributes 30% or more of our consolidated revenue, such as Telkomsel). Exclusively for Telkomsel, the Committee’s recommendation would be passed on to the holder of the Series A Dwiwarna share; and
- Formulate a remuneration system for Directors based on fairness and performance.
As of December 31, 2012, the members of our Nomination and Remuneration Committee were Jusman Syafii Djamal (Chairman), Hadiyanto, Parikesit Suprapto, Johnny Swandi Sjam, Virano Gazi Nasution and Yuki Indrayadi. To maintain independence in the execution of their tasks, members of the Nomination and Remuneration Committee have no relationship, either directly or indirectly, with us. There are no service contracts or benefits to be provided for Board of Directors of our Company or subsidiaries upon their termination as Board of Directors.
D. EMPLOYEES
We had a total of 25,683 employees as of December 31, 2012,consisting of19,185Telkom employees and6,498employeesof our subsidiaries. This figure represents a 1.3% reduction compared to the position as of December 31, 2011, reflecting the continued implementation of our multi exit program initiated in 2002which aims to improve efficiency.
The following isour employee profile by position, educational background and age group.
Position | | 2012 |
| Telkom | | Subsidiaries | | Telkom Group | | Percentage (%) |
Senior Management | | 132 | | 255 | | 387 | | 1.5 |
Middle Management | | 2,571 | | 1,048 | | 3,619 | | 14.1 |
Supervisors | | 9,991 | | 1,774 | | 11,765 | | 45.8 |
Others | | 6,491 | | 3,421 | | 9,912 | | 38.6 |
Total | | 19,185 | | 6,498 | | 25,683 | | 100.0 |
As of December 31, 2012, 26.7% of our employees did not have a tertiary education (pre university), compared to 73.3% who had graduated university. This reflects our focus to recruit highly educated candidates with the right qualifications to support our growth.
Level of Education | | 2012 |
| Telkom | | Subsidiaries | | Telkom Group | | Percentage (%) |
Pre University | | 6,349 | | 515 | | 6,864 | | 26.7 |
Diploma Graduates | | 4,619 | | 926 | | 5,545 | | 21.6 |
University Graduates | | 6,506 | | 4,634 | | 11,140 | | 43.4 |
Post Graduates | | 1,711 | | 423 | | 2,134 | | 8.3 |
Total | | 19,185 | | 6,498 | | 25,683 | | 100.0 |
As of December 31, 2012, employees over the age of 45 continued to dominate our workforce, comprising55.4% of our total employees, followed by employees in the 31 to 45 age group which comprised35.4% and those under 30 age group which comprised9.2%.
Age Group | | 2012 |
| Telkom | | Subsidiaries | | Telkom Group | | Percentage (%) |
<30 | | 820 | | 1,538 | | 2,358 | | 9.2 |
31 - 45 | | 4,654 | | 4,429 | | 9,083 | | 35.4 |
>45 | | 13,711 | | 531 | | 14,242 | | 55.4 |
Total | | 19,185 | | 6,498 | | 25,683 | | 100.0 |
- 80 -
Approximately 81% ofouremployeeswere locatedin western Indonesia andapproximately19% ofouremployees were located in eastern Indonesia.
Retirement Program
The retirement age for all our employees is 56.We have two pension schemes, which are (a) Defined Benefit Pension Plan (“DBPP”) tailored for permanent employees who were hired prior to July 1, 2002, and (b) Defined Contribution Pension Plan (“DCPP”) that applies to other permanent employees.
a) Defined Benefit Pension Plan (“DBPP”)
DBPP is calculated for participants based on years of service, salary level at retirement and is transferable to dependent families if the respective employee passes away. Telkom Pension Fund Division administers the program while the main source of pension fund comes from us and employee contributions. Employees participate in the program with 18% of their basic salary (before March 2003, employee contribution rate was 8.4%) while we contribute thebalance. The minimum monthly pension benefit for retired employees is approximately Rp425,000per month. Our contribution to the pension fund reached Rp485 billion, Rp187 billion and Rp186 billion, respectively, for the years ended December 31, 2010, 2011 and 2012.
Telkomsel operates its own DBPP for its employees. With this program, employees are entitled to retirement benefits calculated based on their latest basic salary or take-home pay and years of services. PT Asuransi Jiwasraya (Persero), manages this program after they secured annual insurance contracts. Up to 2004, employees would contribute 5% of their monthly basic salaries to the program, while Telkomsel would contribute the balance. Since 2005, Telkomsel has contributedthe entire amountto the program. In addition, Telkomsel also runs rewards program for employees withmany years of services through which employees receive cash or additional leave. Awards are given to any employee that has spent more than a certain period with Telkomselor upon termination.
Infomedia also has its own DBPP for its employees.
b) Defined Contribution Pension Plan(“DCPP”)
We operate a Defined Contribution Pension Plan for permanent employees who were recruitedon orafter July 1, 2002. DCPP is managed by several appointedfinancial institutions pension fund from which employees can choose. Our contribution to thefinancial institutions pension fund is determined bythe portion taken from participating employee’s basic salary, whichtotalled Rp4 billion, Rp5 billion and Rp5 billion, respectively, for the years ended December 31, 2010, 2011 and 2012.
To create a more effective and competitive business environment, we also have an Early Retirement Program (“ERP”). The program is run in line with the execution of the 2013-2017 Human Capital Master Plan which is expected to release1,548 employees. This program is offered to employees who are deemed to have met certain requirements in terms of education, age, position and performance. From 2002 through December 31, 2012 we allocatedRp7.3 trillion as compensation for14,195 employees who participated in the program. 781of ouremployeescame under the ERP in 2012, which took effect on February 1, 2013.
Management ofEmployee RelationswithManagement
Pursuant to the Presidential Decree No.83/1998 regarding Ratification of ILO Convention No.87/1948regarding Freedom of Association and Protection of the Right Organize, Telkom employees established the Telkom Employees Union (“SEKAR”). As of December 31, 2012, SEKARrepresented a total of 17,931 employees or 93.5% ofour totalworkforce.
Pursuant to Act No.13/2003 regarding Manpowerand Regulation of the Minister of Manpower and Transmigration No.PER.16/2011 concerning Procedures Preparation and Certification of Company Regulations and Preparation and Registration Collective Work Agreement (“CWA”), SEKAR is entitled to represent employees in the negotiation of the CWA with management. During 2012, five CWA V negotiations were made to renew the expired CWA IV. The CWA IV was no longer effective after December 31, 2012. We and SEKAR agreed to extend the CWA IV agreement.
Telkomsel and Infomedia also have employees' unions. Telkomsel’s employees' union, "SEPAKAT", has 3,731 members or representing 82% of Telkomsel’s total employees, while Infomedia’s employees' union "SPIN" consist of 515 employees or 72% of the total number of Infomedia employees.Neither we norour subsidiaries have experienced material labor action.
E. SHARE OWNERSIP
As of February 28, 2013, none of ourDirectors or senior managers beneficially owned more than 1.0% of our outstanding shares of common stock. In addition, no Commissioners beneficially own our shares of common stock. Forinformation regarding share ownership of our directors and senior management, see Item 7 “Major Stockholders and Related Party Transactions – Major Shareholders.”
- 81 -
Employee Stock Ownership Program
The Employee Stock Ownership Program (“ESOP”) is an employee-owner scheme that provides our employee with an ownership interest in our Company. At our initial public offering on November 14, 1995, a total of 116,666,475 shares were issued to 43,218 employees. As of December 31, 2012, 11,311,122 of our shares were owned by 10,591 of our employees and Telkom retirees.
ITEM 7.MAJOR SHAREHOLDERS AND RELATED PARTY TRANSACTIONS
A. MAJOR SHAREHOLDERS
Shareholder Composition
Our authorized capital consists of one Series A Dwiwarna share and 79,999,999,999 Series B (common stock) shares. Among this authorized shares, 20,159,999,280 of which are issued and fully paid, consists of the Series A Dwiwarna share and 20,159,999,279 common stock. The Series A Dwiwarna share is owned by the Government and carries special voting rights and the right to nominate, and to veto the appointment and removal of, any director or commissioner, the issue of new shares and amendments to our Articles of Association including amendments to merge or dissolve us prior to the expiry of its term of existence, to increase or decrease our authorized capital or to reduce our subscribed capital. The material rights and restrictions placed on the common stock also apply to the Dwiwarna share, except that the Government cannot transfer the Dwiwarna share. The Government’s ownership of the Dwiwarna share gives it effective control over our Company even if it reduces its ownership of our common stock, and its rights with respect to the Dwiwarna share may only be modified by an amendment of our Articles of Association, which the Government may veto. See Note 20 to our Consolidated Financial Statement.
Company Shareholders per February 28, 2013 |
| |
| |
|
| Series A Dwiwarna Share | | Series B Shares | | % |
(Common Stock) |
Government | 1 | | 10,320,470,711 | | 53.90 |
Public | | | 8,828,598,108 | | 46.10 |
Capital Subtotal (issued and outstanding) | 1 | | 19,149,068,819 | | 100.00 |
Treasury Stock | | | 1,010,930,460 | | - |
Total | 1 | | 20,159,999,279 | | 100.00 |
Shareholders Owning More Than 5% of Shares (Major Shareholder)
Title of Class | | Person or Group | | Number of Shares | | Percentage of Ownership |
Series A | | Government | | 1 | | - |
Series B | | Government | | 10,320,470,711 | | 53.90 |
During the past three years, the percentage of shares held by Government was 52.5%, 53.2% and 53.9% as of December 31, 2010, 2011 and 2012 respectively.
Shares Owned by Directors or Commissioners
Directors or Commissioners | | Number of Shares | | Percentage of Ownership |
Directors | | | | |
Indra Utoyo | | 5,508 | | <0.01 |
Priyantono Rudito | | 108 | | <0.01 |
Sukardi Silalahi | | 108 | | <0.01 |
Total | | 5,724 | | <0.01 |
- 82 -
Shareholders Owning Less Than 5% of Shares
Group | | Number of Shares of Common Stock Owned | | Percent (%) of Common Stock Owned |
Foreign | | | | |
Business | | 7,553,965,949 | | 39.45 |
Individual | | 3,075,940 | | 0.02 |
Local | | | | |
Business Entities | | | | |
Companies | | 374,286,165 | | 1.95 |
Mutual Funds | | 387,430,676 | | 2.02 |
Insurance Companies | | 279,882,540 | | 1.46 |
Pension Funds | | 136,171,690 | | 0.71 |
Other Business Entities | | 7,188,024 | | 0.04 |
Individuals | | 86,597,124 | | 0.45 |
Total | | 8,828,598,108 | | 46.10 |
Relationship with the Government and Government Agencies
Our relationship with the Government is multi-faceted. The Government is our majority and controlling shareholder. It is also our regulator as it adopts, administers and enforces relevant laws that regulate telecommunications sector, sets tariffs and issues licenses. It is also one of our customers and one of our lenders.
As used in this section, the term “Government” includes the Government of Indonesia and its ministries, directly-owned government departments and agencies, but excludes SOEs.
The Government as Shareholder
The Government is our majority and controlling shareholder and owned 53.9% of our common stock as of December 31, 2012. Its ownership of the Series A Dwiwarna share gives it special voting and veto rights. Under relevant laws, the “ownership” of our common stock and the single outstanding Series A Dwiwarna share is vested in the Ministry of Finance (“MoF”). In turn, and under the authority of the MoF, the Minister of State-Owned Enterprise (“MSOE”) exercises the rights vested in these securities as our “controlling shareholder.”
As our majority shareholder and controlling shareholder, the Government has an interest in our performance, both in terms of the service we provide to the nation and our ability to operate on a commercial basis. The material rights and restrictions that apply to our common stock also apply to the Series A Dwiwarna share, except that the Government may not transfer the Series A Dwiwarna share, and has right of veto with regard to: (1) the nomination, appointment and removal of our Directors; (2) the nomination, appointment and removal of our Commissioners; (3) the issuance of new shares and (4) any amendments to our Articles of Association, including with respect to actions to merge or dissolve our Company, increase or reduce our authorized capital, or reduce our subscribed capital.
Accordingly, the Government effectively has control over these matters even if it owns less than a majority share of the outstanding common stock. The Government’s rights with respect to the Series A Dwiwarna share will not expire unless there is a change that requires the amendment of our Articles of Association, which would require the consent of the Government as the holder of Series A Dwiwarna share.
The Government as Regulator
The Government regulates the telecommunications sector through the MoCI. The MoCI has the authority to issue regulations that implement laws, which are typically broad in scope. Through such decrees the MoCI defines the structure of the industry, determines tariff formulas, establishes our Universal Service Obligations (“USO”), and otherwise controls many factors that could influence our competitive position, operations and financial position. Through the DGPT, the MoCI regulates the allocation of frequencies and sets numbers for fixed telephone lines. We are required to obtain a license from the DGPT for each type of service offered, including for the frequencies we use (as allocated by the MoCI). We and other operators are required to pay frequency usage fees. Telkomsel also holds licenses issued by the MoCI (some of which were previously issued by the Minister of Communications) for the provision of cellular services, and from the Indonesian Investment Coordinating Board in relation to Telkomsel’s investments for the development of cellular phone services with national coverage, including the expansion of network coverage. The Government, through the MoCI as regulator, has the authority to issue new licenses for the establishment of new joint ventures and other new arrangements, particularly in telecommunications.
Certain licenses require us to pay a concession fee to operate. We pay concession fees for telecommunications services provided and radio frequency usage charges to the MoCI. Concession fees amounted to Rp356 billion in 2011, and Rp451 billion (US$47 million) in 2012. Concession fees as a percentage of total expenses amounted to 0.7% in 2011 and 0.8% in 2012. Radio frequency usage charges amounted to Rp2,846 billion in 2011, and Rp3,002 billion (US$312 million) in 2012. Radio frequency usage charges as a percentage of total expenses amounted to 5.7% in 2011 and 5.6% in 2012. We paid USO charges to the MoCI amounting to Rp879 billion in 2011, and Rp994 billion (US$103 million) in 2012. USO charges as a percentage of our total expenses came to 1.8% in 2011 and 1.9% in 2012.
The Government as Lender
In July 1994, the Government arranged a facility under which certain foreign institutions provided us with a two-step loan for certain expenditures (the “sub-loan borrowings”). The sub-loan borrowings were made through the Government and are guaranteed by it. As of December 31, 2012, we had a total of Rp1,987 billion (US$206 million) in such outstanding two-step loans, including current maturities. We are required to pay the Government interest and repay the principal, which the Government then remits to the respective lenders. As of December 31, 2012, 71.1% of such sub-loanborrowings were denominated in foreign currencies, with the remaining 28.9% denominated in Rupiah. In 2012, the annual interest rates charged 6.79% on loans repayable in Rupiah, 4.0% on those denominated in US Dollar and 3.1% for those denominated in Japanese Yen.
- 83 -
The Government as Customer
Certain Government departments and agencies purchase services from us as direct customers, the terms of which are negotiated on a commercial basis. No services are provided for free or on an in-kind basis. We deal with these departments and agencies as separate customers. In 2012, the amount of revenues from Government departments and agencies was Rp237 billion, which was approximately 0.31% of our consolidated revenues and did not constitute a material part of our revenues. The Government departments and agencies are treated for tariff purposes with respect to connection charges and monthly charges as “residential”, which tariffs are lower than the business service rates. This does not apply to the tariffs for local, long distance and IDD calls.
It is our policy not to enter into any transactions with affiliates unless the terms are no less favorable to us than they would be with a third party. The MSOE has advised us that it would not cause us to enter into transactions with other entities under its control unless the terms were consistent with our policy as referred to above.
Pursuant to OJK regulations, because we are listed on the IDX, any transaction where there is an inherent conflict of interest (as defined below) with another IDX-listed company must be approved by majority of the holders of our common stock who do not have a conflict of interest in the proposed transaction, unless such conflict of interest existed before listing and was fully disclosed in the offering documents.
OJK regulations define a conflict of interest as a conflict between our economic interests and the shareholders’ interests on the one hand, and on the other, the personal economic interests of members of the Board of Commissioners, Board of Directors or other principal shareholders (defined as a holder of 20% or more of our common stock) or their affiliates, either jointly or individually. A conflict of interest also exists if a member of the Board of Commissioners or Board of Directors or a principal shareholder or their respective affiliates is involved in a transaction in which its personal interests may be in conflict with ours. OJK has the authority to enforce these rules regarding conflicts of interest and holders of our common stock are also entitled to bring a suit to enforce these.
Under OJK regulations, transactions between us and other State-Owned or controlled enterprises may cause a conflict of interest. In such cases, the approval of the disinterested shareholders must be obtained if a conflict of interest arises. We believe that many transactions conducted with State-Owned or controlled enterprises are on an arms-length, commercial basis and do not constitute conflict of interest that would require an independent shareholders vote. Such transactions include our sale of telephone services to State-Owned or controlled enterprises and our purchase of electricity from a State-Owned Enterprise. We expect that from time to time, in connection with the development and growth of our business we would enter into joint ventures, agreements or transactions with such enterprises. Under such circumstances, we may consult OJK to determine whether a proposed joint venture, agreement or transaction would require a vote of independent shareholders under OJK rules. If OJK is of the view that such transaction would not require such a vote, we would proceed without seeking the independent shareholders’ approval. Otherwise, we would seek the requisite approval or abandon the proposed action.
Proportion of Common Stock Held in Indonesia and Abroad
As of February 28, 2013, we had 28,117 common stock shareholders, including the Government. This total includes 7,557,041,889 common stock shares owned by 1,663 shareholders outside Indonesia. As of the same date, there were 116 ADS shareholders who owned 54,166,949 ADS (1 ADS is equivalent to 40 common stock shares).
Change in Control
As of the date of this Annual Report, we are not aware of any plans or developments that could result in a change of control over us, including changes that are still at the planning stage.
B. RELATED PARTY TRANSACTIONS
We are party to certain agreements and engage in transactions with certain parties that are related to us, such as cooperatives and foundations. Such parties include the Government and entities related to or owned or controlled by the Government, such as other State-Owned Enterprises. For further details on our related party transactions, see Note 34 to our Consolidated Financial Statements.
C. INTEREST OF EXPERTS AND COUNSEL
Not applicable.
- 84 -
TABLE OF CONTENTS
ITEM 8.FINANCIAL INFORMATION
A. CONSOLIDATED STATEMENTS AND OTHER FINANCIAL INFORMATION
See Item 17 “Financial Statements” for our audited Consolidated Financial Statements filed as part of this Form 20-F.
Material Litigation
In the ordinary course of business, we have been named as defendant in various legal actions related to land disputes, monopolistic practice and unfair business competition, and SMS cartel practices. With regard to the legal proceedings described below, we do not believe that subsequent investigations or court decisions regarding those cases will have significant financial impact on us or our Subsidiaries. Based on management's estimates on the probable outcomes of those cases, we have made provisions of Rp53 billion as at December 31, 2012. See Note 38 in our Company’s Consolidated Financial Statements.
The following describes certain current significant legal proceedings involving us, our subsidiaries and members of our Board of Commissioners and Board of Directors:
A. Cases Involving the Company
Case | | Legal Status | | Financial Impact (Rp) |
Commission for the Supervision of Business Competition ("KPPU") | | | | |
| We are the defendant with KPPU as plaintiff in the case of allegation of violation of Article 5 of Law No. 5of1999 on Prohibition of Monopolistic and Unfair Business Competition Practices. | | In appeal at the Central Jakarta District Court | | 18 billion |
B. Cases Involving Subsidiaries
Case | | Legal Status | | Financial Impact (Rp) |
KPPU | | | | |
| Telkomsel is the defendant with KPPU as plaintiff in the case of allegation of violation of Article 5 of LawNo. 5 of 1999 on Prohibition of Monopolistic and Unfair Business Competition Practices. | | In appeal at Central Jakarta District Court | | 25 billion |
Commercial Court | | | | |
| Telkomsel is the defendant with PT Prima Jaya Informatika as plaintiff in the case of bankruptcy appeal filed by the plaintiff over the non-payment of plaintiff receivables by the defendant. | | In a Judicial Review process in Supreme Court since PT Prima filed an appeal on the Supreme Court’s verdict | | 5.3 billion |
C. Cases Involving Members of Board of Commissioners and Board of Directors
In 2012, there were no legal proceedings involving any serving member of the Board of Commissioners and Board of Directors.
Dividend Policy
The AGMS has the authority to determine the amount of dividends we pay. Our dividend payout ratio for 2012 will be decided at the AGMS scheduled for 2013.
Dividend Year | | Date of AGMS | | Pay Out Ratio (%)(1) | | Amount of Dividends (Rp million) | | Dividend per Share (Rp) |
2007 | | June 20, 2008 | | 70 | | 8,999,913 (2) | | 455.87 |
2008 | | June 12, 2009 | | 55 | | 5,840,708 (0) | | 296.94 |
2009 | | June 11, 2010 | | 50 | | 5,666,070 (3) | | 288.06 |
2010 | | May 19, 2011 | | 55 | | 6,345,350 (4) | | 322.59 |
2011 | | May 11, 2012 | | 65 | | 7,127,333 (5) | | 371.05 |
(1) Represents the percentage of profit attributable to owners of the parent paid to shareholders in dividends. |
(2) Including interim cash dividend paid in December 2007 amounting to Rp965,398 million. |
(3) Including interim cash dividend paid in December 2009 amounting to Rp524,190 million. |
(4) Including interim cash dividend paid in December 2010 and January 2011 amounting to Rp276,072 million and Rp250,085 million respectively |
(5)Consists of cash dividend amounting to Rp6,030,820 million and special cash dividend amounting Rp1,096,513 million. |
- 85 -
Telkomsel Dividend
Pursuant to AGMS inApril 2012, Telkomsel approved the payment of a cash dividend of Rp10,259billion, which represented 80% of Telkomsel’s net profit in 2011, Rp3,590 billion of this dividend was distributed to SingTel Mobile, Telkomsel’s largest non-controlling shareholder.
In 2010, 2011, and 2012 cash dividends were paid to SingTel Mobile, a non-controlling shareholder of Telkomsel, amounting to Rp3,261 billion, Rp2,726 billion and Rp3,231 billion.
B. SIGNIFICANT CHANGES
See Note 42 to our Consolidated Financial Statements.
ITEM 9.THE OFFER AND LISTING
A. OFFER AND LISTING DETAILS
The table below shows the high, low, closing quoted prices and trading volume for our common stock on the IDX during the periods indicated:
| | Price per Share of Common Stock(1) | | Volume (shares) | | Outstanding Shares | | Market Capitalization (Rp billion) |
| | | | Low | | | | | |
Calendar Year | | High | | (in Rupiah) | | Closing | | | |
2008 | | 10,250 | | 5,000 | | 6,900 | | 6,162,126,500 | | 19,669,424,780 | | 135,719 |
2009 | | 10,350 | | 5,750 | | 9,450 | | 4,174,413,500 | | 19,669,424,780 | | 185,876 |
2010 | | 9,800 | | 6,950 | | 7,950 | | 5,707,850,000 | | 19,669,424,780 | | 156,372 |
2011 | | 8,050 | �� | 6,600 | | 7,050 | | 4,441,579,000 | | | | |
First Quarter | | 8,050 | | 6,600 | | 7,350 | | 1,297,346,000 | | 19,669,424,780 | | 144,570 |
Second Quarter | | 7,850 | | 6,800 | | 7,350 | | 957,638,000 | | 19,627,724,280 | | 144,264 |
Third Quarter | | 7,900 | | 6,900 | | 7,600 | | 1,261,616,000 | | 19,527,516,280 | | 148,409 |
Fourth Quarter | | 7,750 | | 6,900 | | 7,050 | | 924,979,000 | | 19,386,339,320 | | 136,674 |
2012 | | 9,950 | | 6,650 | | 9,050 | | 4,600,560,500 | | | | |
First Quarter | | 7,150 | | 6,650 | | 7,000 | | 1,039,571,000 | | 19,219,393,820 | | 134,536 |
Second Quarter | | 8,700 | | 7,000 | | 8,150 | | 1,386,964,000 | | 19,184,274,820 | | 156,352 |
Third Quarter | | 9,850 | | 7,950 | | 9,450 | | 1,020,030,500 | | 19,153,568,820 | | 181,001 |
Fourth Quarter | | 9,950 | | 8,650 | | 9,050 | | 1,153,995,000 | | 19,149,068,820 | | 173,299 |
September | | 9,750 | | 9,150 | | 9,450 | | 287,944,500 | | 19,153,568,820 | | 181,001 |
October | | 9,950 | | 9,300 | | 9,750 | | 408,422,500 | | 19,149,068,820 | | 186,703 |
November | | 9,900 | | 8,950 | | 9,000 | | 332,146,000 | | 19,149,068,820 | | 172,342 |
December | | 9,350 | | 8,650 | | 9,050 | | 413,426,500 | | 19,149,068,820 | | 173,299 |
2013 | | | | | | | | | | | | |
January | | 9,800 | | 8,800 | | 9,700 | | 446,610,500 | | 19,149,068,820 | | 185,746 |
February | | 10,950 | | 9,550 | | 10,750 | | 422,448,500 | | 19,149,068,820 | | 205,852 |
(1) We conducted a two for one split of our common stock from a nominal value of Rp500 per share to Rp250 per share as resolved by the AGMS on July 30, 2004, effective October 1, 2004. The price pershare of the common stock reflects this splitfor all periods shown. |
On December 28, 2012, the last day of trading on the IDX in 2012, the closing price for our common stock wasRp9,050 per share.
The high, low, closing prices and trading volume for our ADSs on the NYSE and the LSE for the periods indicated are shown in the table below. Trading in ADSs is effected “off exchange” on the LSE. Under LSE rules, off exchange trading means that transactions are carried out on other exchanges and once the transaction has taken place, it is reported to the LSE.
- 86 -
| | Price per ADS (NYSE) | | Volume (in ADS) | | Price per ADS (LSE) | | Volume (in ADS) |
| | | | Low | | | | | | | Low | | | |
Calendar Year | | High | | (in US Dollars) | | Closing | | | High | | (in US Dollars) | | Closing | |
2008 | | 45.50 | | 17.31 | | 25.01 | | 98,988,347 | | 45.74 | | 16.89 | | 24.62 | | 38,028 |
2009 | | 41.55 | | 20.19 | | 39.95 | | 67,767,999 | | 40.76 | | 25.67 | | 41.02 | | 3,757 |
2010 | | 43.80 | | 30.33 | | 35.65 | | 69,803,576 | | 42.00 | | 30.76 | | 34.91 | | 19,673 |
2011 | | 36.96 | | 30.29 | | 30.74 | | 69,279,100 | | 35.89 | | 21.02 | | 30.50 | | 1,406,292 |
First Quarter | | 36.05 | | 30.51 | | 33.58 | | 17,278,400 | | 35.73 | | 33.39 | | 33.44 | | 697 |
Second Quarter | | 36.28 | | 32.21 | | 34.50 | | 16,636,000 | | 35.89 | | 35.82 | | 35.88 | | 354,770 |
Third Quarter | | 36.96 | | 30.29 | | 33.07 | | 20,886,200 | | 35.59 | | 33.58 | | 34.44 | | 87,554 |
Fourth Quarter | | 34.48 | | 30.62 | | 30.74 | | 14,478,500 | | 21.02 | | 21.02 | | 30.50 | | 963,271 |
2012 | | 41.14 | | 29.26 | | 36.95 | | 88,190,589 | | 40.12 | | 30.24 | | 36.50 | | 746,278 |
First Quarter | | 31.69 | | 29.26 | | 30.36 | | 19,265,880 | | 31.04 | | 30.24 | | 30.95 | | 236,546 |
Second Quarter | | 37.00 | | 30.38 | | 34.83 | | 32,660,280 | | 36.64 | | 30.40 | | 33.70 | | 293,809 |
Third Quarter | | 41.14 | | 34.28 | | 38.93 | | 19,696,121 | | 39.78 | | 34.30 | | 39.10 | | 88,412 |
Fourth Quarter | | 41.00 | | 36.00 | | 36.95 | | 16,568,308 | | 40.12 | | 36.50 | | 36.50 | | 127,511 |
September | | 40.53 | | 37.87 | | 38.93 | | 5,230,487 | | 39.10 | | 39.10 | | 39.10 | | 50,000 |
October | | 41.00 | | 38.77 | | 40.65 | | 7,922,026 | | 40.12 | | 39.07 | | 39.13 | | 125,444 |
November | | 40.58 | | 37.85 | | 38.04 | | 4,922,198 | | 39.45 | | 37.97 | | 38.85 | | 1,907 |
December | | 38.05 | | 36.00 | | 36.95 | | 3,724,084 | | 36.50 | | 36.50 | | 36.50 | | 160 |
2013 | | | | | | | | | | | | | | | | |
January | | 39.89 | | 36.17 | | 39.65 | | 4,652,609 | | 39.00 | | 37.44 | | 39.00 | | 419 |
February | | 44.65 | | 39.41 | | 44.46 | | 4,491,895 | | 39.95 | | 39.84 | | 39.95 | | 2,400 |
On December 31, 2012, the last day of trading on the NYSE and LSE in 2012, the closing price for one Telkom ADS was US$36.95and US$36.50 respectively.
B. PLAN OF DISTRIBUTION
Not applicable.
C. MARKETS
Our common stock is listed and traded on the IDX. Our ADSs are also listed and traded on the NYSE and the LSE as ADSs, where one ADS represents 40 shares of Common Stock. Our shares are also Publicly Offered Without Listing (“POWL”) in Japan.
The Indonesian Stock Market
Indonesia’s stock market, known as the IDX, grew out of the December 1, 2007, as merger of two stock exchanges operating in two different locations in Indonesia, the Jakarta Stock Exchange in the capital and the Surabaya Stock Exchange in East Java.
As at December 31, 2012, the IDX had 459 issuers for equity and 117 active brokerage houses. In 2012, the IDX recorded a trading volume of 117.87 billion shares. As at December 31, 2012, the total market capitalization was valued at Rp4,126.99 trillion (US$428.22 billion).
Trading on the IDX runs from Monday to Thursday, with daily trading divided into two sessions on both the regular market and the negotiated market. The morning session runs from 09.30 to 12.00, while the afternoon session runs from 13.30 to 16.00. The Friday trading sessions run from 09.30 to 11.30 and 14.00 to 16.00. There is only one daily trading session for the cash market: 09.30 to 12.00 from Monday to Thursday, and 09.30 to 11.30 on Fridays.In addition there are also pre-opening session which took place from Monday to Friday 9.10.00 to 9.29.59 for the regular market.
Trading is divided into three segments: the regular market, negotiated market and the cash market (except for rights issues, which can only be traded on the cash market and the negotiated market for the first session). The regular market is the mechanism for trading stock in standard lots on a continuous auction basis during exchange hours. Trading on the regular and cash markets is typically carried out in lots of 500 shares apiece. The IDX also employs share price movement restrictions.
Auctions on the IDX on regular market and cash market take place according to the price and time priorities. Price priority refers to the giving of priority to buying orders at a higher price or selling orders at a lower price. If buying or selling orders are placed at the same price, priority is given to the earlier placed buying or selling order (time priority).
Trading on the negotiated market is conducted through direct negotiation between (i) IDX members, (ii) clients through one IDX member, (iii) a client and an IDX member, or (iv) an IDX member and the PT Kliring Penjaminan Efek Indonesia (“KPEI”). KPEI provides clearing and guarantee services of stock exchange transactions settlement. It also improves efficiency and certainty of transactions settlement in IDX.
Transactions on the IDX regular market must be settled no later than the third trading day after the transaction. Transactions on the negotiated market are settled on the basis of the agreement between the selling exchange members and the buying exchange members, on a transaction by transaction basis. Transactions on the IDX cash market must be settled on the day of the transaction and reported to the IDX. If an exchange member defaults on the settlement of a transaction, the securities can be traded by direct negotiation on cash and carry terms. Each exchange member is required to pay a transaction fee as stipulated by the IDX. Any delay in payment of the transaction fee is subject to a fine of 1% of the outstanding amount foreach day of delay. The IDX may impose sanctions on its members for any violation of exchange rules, which may include fines, written warnings, suspension or revocation of licenses.
- 87 -
When conducting share transactions on the IDX, each exchange member is required to pay a transaction cost of 0.018% of the transaction value (for transactions on the regular market and cash market). For the negotiated market, a transaction cost depended on exchange policy. Aminimum monthly transaction fee of Rp20 million is applied as a contribution for the provision of exchange facilities and continues in effect for members who are suspended or Exchange Member Approval (“SPAB”) revoked.
Since the global financial crisis in the last quarter of 2008 that caused a typical share price movements, the IDX has applied a policy of auto rejection, a mechanism whereby share trading can be halted automatically in order to maintain orderly, fair and efficient trading. Following changes made by the IDX in October 2008 and January 2009, the auto rejection trigger levels are now 35% above or below the reference price for stocks in the Rp50 - Rp200 price range, 25% for stocks in theRp200 to Rp5,000 range, and 20% for stocks priced above Rp5,000.Auto rejection for trading in negotiated market arises when selling offer or buying request reaches of over 2 billion shares.
On November 14, 2012, BEI has published Amendment II-A regarding number of Equity securities trading, which will take effect starting on January 2, 2013.
Trading on the NYSE and LSE
See Item 12 “Description of Securities Other Than Equity Securities”.
D. SELLING STOCKHOLDERS
Not applicable.
E. DILUTION
Not applicable.
F. EXPENSES OF THE ISSUE
Not applicable.
ITEM 10.ADDITIONAL INFORMATION
A. SHARE CAPITAL
Not applicable.
B. MEMORANDUM AND ARTICLES OF ASSOCIATION
Description of Articles of Association
Our Articles of Association are registered in accordance with the Limited Liability Company Law No.1 of 1995, and approved by Ministerial Decree No.C2-7468.HT.01.04.TH.97 of 1997. Pursuant to the issuance of the Company Law No.40 of 2007 which revoked Limited Liability Companies Law No.1 of 1995, we have amended our Articles of Association which was approved by the Minister of Law and Human Rights of the Republic of Indonesia pursuant to Decree of the Minister of Justice and Human Rights No.AHU.46312.AH.01.02 of 2008 dated July 31, 2008 and registered in State Gazette of the Republic of Indonesia No.84 dated October 17, 2008, Supplement to State Gazette No.20155.
The Articles of Association were most recently amended for our flexibility to carry out business activities, the minimum requirement for GMS notification and invitation according to capital market laws and regulations, and editorial changes, pursuant to AGMS notarial deed No.30 dated June 7, 2012 made before Notary Ashoya Ratam, S.H., MKn. Notice of the amendment of articles was accepted by the Minister of Law and Human Rights of the Republic of Indonesia through Letter No. AHU-AH.01.10-34558 on September 24, 2012.
Under Article 3 of the Articles of Association, our business is to provide telecommunications networks and telecommunications and information services, and to optimize our resources, with due attention to the prevailing laws and regulations. To attain the aforementioned objectives, we may undertake business activities that incorporate the following:
- 88 -
1. Main Business
a. To plan, build, deliver, develop, operate, market/sell/lease, and maintain telecommunications and information networks in the broadest sense with respect to provisions of laws and regulations.
b. To plan, develop, deliver, market/sell and improve telecommunications and information services in the broadest sense with respect to provisions of laws and regulations.
2. Supporting Business
a. To provide payment transaction and remittance services via telecommunications and information networks.
b. To carry out activities and other undertakings in respect of optimizing our resources, among others the utilization of our property and equipment and moveable assets, information system facilities, education and training facilities, and maintenance and repair facilities.
In accordance with the Company Law, we have a Board of Commissioners and a Board of Directors. The two Boards are separate and no individual may be a member of both Boards. Each Director receives a bonus if we surpass certain financial and operating targets, the amounts of which are determined by the shareholders at the AGMS.
The Articles state that any transaction involving a conflict of interest between our Company and our Directors, Commissioners and shareholders should be approved by a shareholders meeting, where approval is required from more than half of the votes of the independent shareholders.
The Board of Directors is responsible for leading and managing our Company in accordance with our objectives and purposes and to control, preserve and manage the assets of our Company.
The Articles do not contain any requirement for the Directors to: (i) retire by a specified age, or (ii) to own any or a specified number of shares of our Company. The rights, preferences and restrictions attaching to each class of the shares of our Company in respect of specified matters are set forth below:
- Dividend rights. Dividends are to be paid based upon our financial condition and in accordance with the resolution of the shareholders in a general meeting, which will also determine the form of and time for payment of the dividend;
- Voting rights. The holder of each voting share is entitled to one vote at a GMS;
- Rights to share in our Company’s profits. See dividend rights;
- Rights to share in any surplus in the event of liquidation. Stockholders are entitled to surplus in the event of liquidation in accordance with their proportion of shareholding, provided the nominal value of the common stock that they hold is fully paid-up;
- Redemption provisions. There are no stock redemption provisions in our Articles. However, based on Article 37 of the Company Law, we may buy back up to 10% of our issued and outstanding shares;
- Reserved fund provisions. Retained earnings up to a minimum of 20% of our issued capital are to be set aside to cover potential losses suffered by us. If the amount in the reserved fund exceeds 20% of our issued capital, a GMS may authorize us to utilize such excess fundsfor the purposes of our Company;
- Liability for further capital calls. Our shareholders may be asked to subscribe for new shares in our Company from time to time. Such rights are to be offered to shareholders prior to being offered to third parties and may be transferred at the option of the shareholder. The Board of Directors is authorized to offer the new shares to third parties in the event that an existing shareholder is unable or unwilling to subscribe for such new shares; and
- Provisions discriminating against any existing or prospective holder of such securities because of such shareholder owning a substantial number of shares. The Articles do not contain any such provision.
In order to change the rights of shareholders, an amendment to the relevant provisions of the Articles would be required. Any amendment to the Articles requires the holder of the Series A Dwiwarna Share and the other shareholders or their authorized proxies jointly representing at least two thirds (2/3) of the total number of votes cast in the meeting.
Any GMS may only be convened upon the issuance of the requisite notice by us. In addition, the Board of Directors may issue such notice and convene an EGMS based on a written request by the Board of Commissioners or one or more shareholders holding at least 10% of our shares.The notice is to be published in at least two newspapers in Indonesia having general circulation within Indonesia and other media in accordance with the provisions of Indonesian capital markets rules and regulations.Such announcement/notice of a GMS is required to be given to shareholders at least 14 days (excluding the date of the notice and the date of the invitation) prior to the invitation for the GMS.The invitation for the GMS is also required to be publishedin at least two newspapers in Indonesia having general circulation within Indonesia and other media in accordance with the provisions of Indonesian capital marketsrules and regulationsat least 14 days (excluding the date of the invitation and the date of the meeting) prior to the GMS.The quorum for AGMS or EGMS is shareholdersrepresenting more than half of the total shares with voting rights issued by us.In case the quorum is not reached, then the invitation to the second meeting can be made without prior announcement/notice that a invitation to a meeting will be made.In case the quorum is not reached, then the invitationto the second meeting can be made without prior announcement/notice that a invitation to a meeting will be made.Such invitation to the meeting is required to be served at least seven days prior to the second meeting (not including the date of the invitationto the meeting and the date of the meeting).The second meeting will be valid and may pass binding resolutionsif attended byshareholders representing at least one third of the total shares with validvoting rights.In case the quorum is not reached at the second meeting,a third meeting may be held, at the Company’s request, with the quorum of attendance to be determined by the Chairman of OJK in accordance with the provisions of the laws.
- 89 -
Stockholders may vote by proxy. All resolutions are to be passed by consensus. If consensus cannot be reached, resolutions are passed by simple majority, unless a larger majority is required by the Articles. The Articles do not contain any limitations on the right of any person, to own our sharesor to exercise their right to vote. Indonesian capital market regulations do not contain any limitation on the right of any person, whether local or foreign, to own shares in a company listed on the IDX.
Any takeover of our Company is required to be approved by the holder of the Series A Dwiwarna Share and a majority constituting at least three fourths of the total number of shares at a GMS that must be attended by the holder of the Series A Dwiwarna Share. There are no other provisions in the Articles that would have the effect of delaying, deferring or preventing a change in control of our Company.
Each Director and Commissioner has an obligation to report to OJK with regard to their ownership and any changes in their ownership of our Company, and this obligation also applies to shareholders who have an ownership stake of 5% or more in our paid up capital. We believe that the Articles are not significantly different from those generally prevailing in Indonesia in respect of companies listed on the IDX(other than with respect to provisions and rights relating to the Dwiwarna Share, which are common for SOEs listed on the IDX). We also believe that the provisions in the Articles relating to changes in our capital are not more stringent than that required by Indonesian law.
C. MATERIAL CONTRACTS
In 2012 and 2011, we did not enter into any new material contracts nor did we amend any existing material contracts, other than contracts entered into or amended in the ordinary course of business.
D. EXCHANGE CONTROLS
See Item 3 “Key Information – Exchange Controls” included elsewhere in this Form 20-F.
E. TAXATION
The following summary contains a description of the principal Indonesian and US federal tax consequences of the purchase, ownership and disposition of ADSs or shares of common stock. This summary does not purport to be a complete description of all of the tax considerations that may be relevant to a decision to purchase, own or dispose of ADSs or shares of common stock.
Investors should consult their tax advisors about the Indonesian and US Federal, state and local tax consequences to them of the purchase, ownership and disposition of ADSs or shares of common stock.
a. Indonesian Taxation
The following is a summary of the principal Indonesian tax consequences of the ownership and disposition of common stock or ADSs to a non-resident individual or non-resident entity that holds common stock or ADSs (a “Non-Indonesian Holder”). A “non-resident individual” is a foreign national individual who does not reside or intend to reside in Indonesia and is not physically present in Indonesia at the most 183 days within 12 month period, during which period such non-resident individual receives income in respect of the ownership or disposition of common stock or ADSs and a “non-resident entity” is a corporation or a non-corporate body that is established, domiciled or organized under the laws of a jurisdiction other than Indonesia and does not have a fixed place of business or otherwise conducts business or carries out activities through a permanent establishment in Indonesia during an Indonesian tax year in which such non-resident entity receives income in respect of the ownership or disposition of common stock or ADSs. In determining the residency of an individual or entity, consideration will be given to the provisions of any applicable double taxation treaty to which Indonesia is a party.
1. Dividends
Dividends declared by us out of retained earnings and distributed to a Non-Indonesian Holder in respect of common stock or ADSs are subject to Indonesian withholding tax, which, as of the date of this Annual Report is at the rate of 20%, on the amount of the distribution (in the case of cash dividends) or on the shareholders’ proportional share of the value of the distribution. A lower rate provided under double taxation treaties may be applicable provided the recipient is able to comply with the following strict requirements: (i) the recipient of the income is the beneficial owner of the dividends, (ii) the recipient of the income must have submitted a specific form set by the Indonesian Tax Office acting as a Certificate of Residency (the “Certificate of Residency”) that is filled in by the recipient of the income and validated by the competent authority of the country where the recipients are resident and (iii) the recipient of the income does not misuse the tax treaty as set out in the provision on the prevention of misuse the tax treaty. Indonesia has concluded double taxation treaties with a number of countries, including Australia, Belgium, Canada, France, Germany, Japan, Malaysia, the Netherlands, Singapore, Sweden, Switzerland, the United Kingdom and the United States of America. Under theUS-Indonesia double taxation treaty, the withholding tax on dividends is generally, in the absence of a 25% voting interest, reduced to 15%.
2. Capital Gains
The sale or transfer of common stock through the IDX is subject to a final withholding tax at the rate of 0.1% of the value of the transaction. The broker executing the transaction is obligated to withhold such tax. The holding of founder shares or the sale or transfer of founder shares through an IDX may, under current Indonesian tax regulations, be subject to additional 0.5% final income tax.
Subject to the promulgation of implementing regulations, the estimated net income received or accrued from the sale of movable assets in Indonesia, which may include common stock not listed on an IDX or ADSs, by a Non-Indonesian holder (with the exception of the sale of assets under Article 4 paragraph (2) of the Indonesian income tax law) may be subject to Indonesian withholding tax at the rate of 20%. In 1999, the Ministry of Finance issued a decision that stipulates the estimated net income for the sale of shares received by a non-resident taxpayer in a non-public company to be 25% of the sale price, resulting in an effective withholding tax rate of 5% of the sales price. This is a final withholding tax and the obligation to pay lies with the buyer (if it is an Indonesian taxpayer) or our Company (if the buyer is a non-resident taxpayer). Exemption from withholding tax on income from the sale of shares in a non-public company may be available to non-resident sellers of shares depending on the provisions of the relevant double taxation treaties. In order to benefit from the exemption under the relevant double taxation treaty, the non-resident seller must provide a specific form set by the Indonesian Tax Office acting as a Certificate of Residence that is completed by the recipient of the income and validated by the competent authority of the country where the recipients are resident to the buyer or our Company and to the Indonesian Tax Office that has jurisdiction over the buyer or our Company (if the buyer is a non-resident taxpayer).
In cases where a purchaser or Indonesian broker will be required under Indonesian tax laws to withhold tax on payment of the purchase price for common stock or ADSs through the IDX, theoretically, that payment may be exempt from Indonesian withholding or other Indonesian income tax under applicable double taxation treaties to which Indonesia is a party (including the US-Indonesia double taxation treaty). However, except for the sale or transfer of shares in a non-public company, the current Indonesian tax regulations do not provide specific procedures for removing the purchaser’s or Indonesian broker’s obligation to withhold tax from the proceeds of such sale. To take advantage of the double taxation treaty relief, Non-Indonesian Holders may have to seek a refund from the Indonesian Tax Office through the IDX by making a specific application accompanied by a specific form set by the Indonesian Tax Office acting as a Certificate of Residency that is filled in by the recipient of the income and validated by the competent authority of the country where the recipients are resident.
3. Stamp Duty
Stock transactions in Indonesia are subject to stamp duty. Pursuant to Government Regulation No. 24/2000 on the amendment and the amount of stamp duty rates Imposing Limits Imposed Price Nominal stamp duty, a transaction of up to Rp1,000,000 needs a stamp duty of Rp3,000, while any transaction of more than Rp1,000,000 needs a stamp duty of Rp6,000.
b. Considerations Regarding Certain US Federal Income Tax
Pursuant to requirements relating to practice before the Internal Revenue Service, any tax advice in this communication (including any attachments) is not intended to be used and cannot be used, for the purpose of (i) avoiding penalties imposed under the US Internal Revenue Code, or (ii) promoting, marketing, or recommending to another person any tax-related matter.
The following is a summary of certain US federal income tax considerations relating to the acquisition ownership and disposition of ADSs or common stock by US Holders (as defined below) that hold their ADSs or common stock as “capital assets” (generally, property held for investment) under section 1221 of the US Internal Revenue Code (the “Tax Code”). This summary is based upon existing US federal income tax law, which is subject to differing interpretations or change, possibly with retroactive effect.
This summary does not discuss all aspects of US federal income taxation which may be important to particular investors in light of their individual investment circumstances, including investors subject to special tax rules (for example, financial institutions, insurance companies, broker-dealers, partnerships and their partners, and tax-exempt organizations (including private foundations), holders who are not US Holders, investors that will hold ADSs or common stock as part of a straddle, hedge, conversion, constructive sale, or other integrated transaction for US federal income tax purposes, or investors that have a functional currency other than the US Dollar, all of whom may be subject to tax rules that differ significantly from those summarized below. In addition, this summary does not discuss any US federal estate and gift tax considerations, or state, local, or non-US tax considerations. Each holder isurged to consult their tax advisors regarding the US federal, state, local and non-US income, and other tax considerations of their investment in the ADSs or common stock.
- 91 -
TABLE OF CONTENTS
For purposes of this summary, a “US Holder” is a beneficial owner of ADSs or common stock that is, for US federal income tax purposes, (i) an individual who is a citizen or resident of the US, (ii) a corporation, or other entity treated as a corporation for US federal income tax purposes, created in, or organized under the laws of, the US or any state or the District of Columbia, (iii) any entity created or organized in or under the laws of any other jurisdiction if treated as a domestic corporation pursuant to the Tax Code, (iv) an estate the income of which is includible in gross income for US federal income tax purposes regardless of its source, or (v) a trust (A) the administration of which is subject to the primary supervision of a US court and which has one or more US persons who have the authority tocontrol all substantial decisions of the trust or (B) that has otherwise elected to be treated as a US person under the Tax Code.
If a partnership (or other entity treated as a “tax transparent” entity for US tax purposes) is the beneficial owner of ADSs or common stock, the tax treatment of a partner in the partnership (or interest holder in the “tax transparent” entity) will generally depend upon the status of the partner (or interest holder) and the activities of the partnership (or “tax transparent” entity). For US federal income tax purposes, US Holders of ADSs will be treated as the beneficial owners of the underlying Common Stock represented by the ADSs.
1. Threshold Passive Foreign Investment Company (“PFIC”) Classification Matters
A non-US corporation, such as our Company, will be treated as a PFIC, for US federal income tax purposes, if 75% or more of its gross income consists of certain types of “passive” income or 50% or more of its assets are passive. Based on our 2012 income and assets, we do not believe that we should be classified as a PFIC for 2012. Because PFIC status is a fact-intensive determination made on an annual basis, no assurance can be given that we are not or will not become classified as a PFIC. The discussion below under “Dividends” and “Sale or Other Disposition of ADSs or common stock” is written on the basis that we will not be classified as a PFIC for US federal income tax purposes.
2. Dividends
Any cash distributions paid by us out of earnings and profits, as determined under US federal income tax principles, will be subject to tax as dividend income and will be includible in the gross income of a US Holder upon receipt. A non-corporate recipient of dividend income will generally be subject to tax on dividend income from a “qualified foreign corporation” at a maximum US federal tax rate of 15% rather than the marginal tax rates generally applicable to ordinary income provided that certain holding period requirements are met. Note that as from January 1, 2011, dividends from a qualified foreign corporation are treated as ordinary income with a maximum tax rate of 39.6% for non-corporate recipients of dividends received after the end of 2010. A non-US corporation (other than a PFIC) generally will be considered to be a qualified foreign corporation (i) if it is eligible for the benefits of a comprehensive tax treaty with the US which the Secretary of Treasury of the US determines is satisfactory for purposes of this provision and which includes an exchange of information program or (ii) with respect to any dividend it pays on stock (or ADSs backed by such stock) which is readily tradable on an established securities market in the US. There is currently a tax treaty in effect between the US and Indonesia which the Secretary of Treasury has determined is satisfactory for these purposes and we believe that we should be eligible for the benefits of the treaty. Additionally, because the ADSs are listed on the NYSE, an established securities market in the US, they are considered readily tradable on that exchange.
The amount of any cash distribution paid in Rupiah should equal the US Dollar value of such Rupiah on the date of receipt of the distribution, regardless of whether the Rupiah are actually converted into US Dollar at that time. Gain or loss, if any, recognized on a subsequent sale, conversion, or other disposition of Rupiah generally will be US source ordinary income or loss. Dividends received on the ADSs or common stock will generally not be eligible for the dividends received deduction allowed to corporations.
Dividends generally will be treated as income from foreign sources for US foreign tax credit purposes. A US Holder may be eligible, subject to a number of complex limitations, to claim a foreign tax credit in respect of any foreign withholding taxes imposed on dividends received on ADSs or common stock. A US Holder who does not elect to claim a foreign tax credit for foreign tax withheld, may instead claim a deduction, for US federal income tax purposes, in respect of such withholdings, but only for a year in which such holder elects to do so for all creditable foreign income taxes.
3. Sale or Other Disposition of ADSs or Common Stock
A US holder will generally recognize capital gain or loss upon the sale or other disposition of ADSs or common stock in an amount equal to the difference between the amount realized upon the disposition and the holder’s adjusted tax basis in such ADSs or common stock. Any capital gain or loss will be long-term if the ADSs or Common Stock have been held for more than one year and will generally be US source gain or loss for US foreign tax credit purposes. The deductibility of a capital loss is subject to limitations.
- 92 -
4. PFIC Considerations
If we were to be classified as a PFIC in any taxable year, a US Holder would be subject to special rules generally intended to reduce or eliminate any benefits from the deferral of US federal income tax that a US Holder could derive from investing in a non-US company that does not distribute all of its earnings on a current basis. In such event, a US Holder may be subject to tax at ordinary income tax rates on (i) any gain recognized on the sale of ADSs or common stock and (ii) any “excess distribution” paid on ADSs or common stock (generally, a distribution in excess of 125% of the average annual distributions paid by us in the three preceding taxable years). In addition, a US Holder will be subject to an interest charge on such gain or excess distribution. Finally, the 15% maximum rate on Company dividends would not apply if we become classified as a PFIC.Each US Holder is urged to consult its tax advisor regarding the potential tax consequences to such holder if we are or become classified as a PFIC, as well as certain elections that may be available to mitigate such consequences.
5. Backup Withholding Tax and Information Reporting Requirements
US backup withholding tax and information reporting requirements generally apply to certain payments to certain non corporate holders of stock. Information reporting generally will apply to payments of dividends on and to proceeds from the sale or redemption of, ordinary shares made within the US or by a US payor or US middleman to a holder of ordinary shares (other than an “exempt recipient,” including a corporation, a payee that is not a US person that provides an appropriate certification and certain other persons). A payor will be required to withhold backup withholding tax from any payments of dividends on, or the proceeds from the sale or redemption of, ADSs or common stock within the US or by a US payor or US middleman to a holder, other than an exempt recipient, if such holder fails to furnish its correct taxpayer identification number or otherwise fails to comply with, or establish an exemption from, such backup withholding tax requirements. The backup withholding tax rate is 25% for years through 2012.
The backup withholding tax is not an additional tax and may be credited against a US holder’s regular US federal income tax liability or, if in excess of such liability, refunded by the Internal Revenue Service (“IRS”) if a timely refund claim is filed with the IRS. Copies of any information returns or tax returns for claims for refund filed by non-US Holders with the IRS may be made available by the IRS, under the provisions of a specific treaty or other agreement providing for information exchange, to the taxing authorities of the country in which a non-US Holder resides.
F. DIVIDENDS AND PAYING AGENTS
Not applicable.
G. STATEMENT BY EXPERTS
Not applicable.
H. DOCUMENTS ON DISPLAY
Any material which is filed as an exhibit to this Annual Report on Form 20-F with the US Securities and Exchange Commission is available for inspection at our offices. See Item 4 “Information on the Company”.
I. SUBSIDIARY INFORMATION
Not applicable.
ITEM 11.QUANTITATIVE AND QUALITATIVE DISCLOSURE ABOUT MARKET RISK
General
We are exposed to market risks that arise from changes in exchange rates, interest rates, credit risk and liquidity risk, each of which will have an impact on us. We do not generally hedge our long-term liabilities in foreign currencies but hedge our obligations for the current year. As of December 31, 2012, assets in foreign currencies reached 71.9% against our liabilities denominated in foreign currencies. Our exposure to interest rate risk is managed through a mix of fixed and variable rate liabilities and assets, including short-term fixed rate assets. Our exposure to such market risks fluctuated during 2010, 2011 and 2012 as the Indonesian economy was affected by changes in the US Dollar-Rupiah exchange rate and interest rates themselves. We are not able to predict whether such conditions will continue during 2013 or thereafter.
Exchange Rate Risk
We are exposed to foreign exchange risk on sales, purchases and borrowings that are denominated in foreign currencies, primarily in US Dollar and Japanese Yen. Our exposures to other foreign exchange rates are not material. Increasingrisks of foreign currency exchange rates on our obligations are expected to be offset by time deposits and receivables in foreign currencies that are equal to at least 25% of the outstanding current liabilities. - 93 -
The information presented in the following table is based on assumptions of selling and buying rates in US Dollar as well as other currencies, which were quoted by Reuters on December 31, 2012 and applied respectively to monetary assets and liabilities. The buying and selling rates as of December 31, 2012 were Rp9,630 and Rp9,645 to US$1, respectively.
However, we believe these assumptions and the information described in the following table may be influenced by a number of factors, including a fluctuation and/or depreciation of the Rupiah in the future.
| Outstanding Balance as of December 31, 2012 | | Expected Maturity Date |
| Foreign Currency (million) | | Rp Equiv. (Rp million) | | 2013 | | 2014 | | 2015 | | 2016 | | 2017 | | There After |
| Fair Value |
| | | (Rp million) |
ASSETS | | | | | | | | | | | | | | | | | |
Cash and Cash Equivalents | | | | | | | | | | | | | | | | | |
US Dollar | 413 | | 3,980,579 | | 3,980,579 | | - | | - | | - | | - | | - | | 3,980,579 |
Japanese Yen | 1 | | 148 | | 148 | | - | | - | | - | | - | | - | | 148 |
Others(1) | 6 | | 61,494 | | 61,494 | | - | | - | | - | | - | | - | | 61,494 |
Other Current Financial Assets | | | | | | | | | | | | | | | | | |
US Dollar | 7 | | 69,067 | | 69,067 | | - | | - | | - | | - | | - | | 69,067 |
Trade Receivables | | | | | | | | | | | | | | | | | |
Related Parties | | | | | | | | | | | | | | | | | |
US Dollars | 9 | | 86,932 | | 86,932 | | - | | - | | - | | - | | - | | 86,932 |
Third Parties | | | | | | | | | | | | | | | | | |
US Dollars | 75 | | 721,819 | | 721,819 | | - | | - | | - | | - | | - | | 721,819 |
Others(1) | 0.44 | | 4,251 | | 4,251 | | - | | - | | - | | - | | - | | 4,251 |
Other Receivables | | | | | | | | | | | | | | | | | |
US Dollar | 1 | | 11,563 | | 11,563 | | - | | - | | - | | - | | - | | 11,563 |
Others(1) | 0.06 | | 573 | | 573 | | - | | - | | - | | - | | - | | 573 |
Advances and Other Non-current Assets | | | | | | | | | | | | | | | | | |
US Dollar | 10 | | 95,385 | | - | | 95,385 | | - | | - | | - | | - | | 95,385 |
LIABILITIES | | | | | | | | | | | | | | | | | |
Trade Payables | | | | | | | | | | | | | | | | | |
Related Parties | | | | | | | | | | | | | | | | | |
US Dollar | 1 | | 14,361 | | 14,361 | | - | | - | | - | | - | | - | | 14,361 |
Third Parties | | | | | | | | | | | | | | | | | |
US Dollar | 320 | | 3,096,063 | | 3,096,063 | | - | | - | | - | | - | | - | | 3,096,063 |
Others(1) | 2 | | 23,253 | | 23,253 | | - | | - | | - | | - | | - | | 23,253 |
Other Payables | | | | | | | | | | | | | | | | | |
US Dollar | 0.92 | | 8,858 | | 8,858 | | - | | - | | - | | - | | - | | 8,858 |
Others(1) | 0.13 | | 1,251 | | 1,251 | | - | | - | | - | | - | | - | | 1,251 |
Accrued Expenses | | | | | | | | | | | | | | | | | |
US Dollar | 75 | | 725,784 | | 725,784 | | - | | - | | - | | - | | - | | 725,784 |
Japanese Yen | 33 | | 3,677 | | 3,677 | | - | | - | | - | | - | | - | | 3,677 |
Others(1) | 3 | | 29,152 | | 29,152 | | - | | - | | - | | - | | - | | 29,152 |
Advances from Customers and Suppliers | | | | | | | | | | | | | | | | | |
US Dollar | 0.80 | | 7,669 | | 7,669 | | - | | - | | - | | - | | - | | 7,669 |
Others(1) | 0.20 | | 1,885 | | 1,885 | | - | | - | | - | | - | | - | | 1,885 |
Short term bank loan | | | | | | | | | | | | | | | | | |
US Dollar | 0.42 | | 4,091 | | 4,091 | | - | | - | | - | | - | | - | | 4,091 |
Current Maturities of Long-term Liabilities | | | | | | | | | | | | | | | | | |
US Dollar | 31 | | 297,386 | | 297,386 | | - | | - | | - | | - | | - | | 331,624 |
Japanese Yen | 768 | | 85,882 | | 85,882 | | - | | - | | - | | - | | - | | 115,251 |
Promissory Notes | | | | | | | | | | | | | | | | | |
US Dollar | 68 | | 661,062 | | 432,284 | | 191,726 | | 37,052 | | - | | - | | - | | 667,109 |
Long-term Liabilities(2) | | | | | | | | | | | | | | | | | |
US Dollar | 113 | | 1,090,517 | | - | | 334,658 | | 275,251 | | 189,940 | | 121,997 | | 168,671 | | 1,105,913 |
Japanese Yen | 8,447 | | 944,700 | | - | | 85,882 | | 85,882 | | 85,882 | | 85,882 | | 601,172 | | 957,317 |
(1) Assets and liabilities denominated in other foreign currencies are presented as US Dollars equivalents using the exchange rates prevailing at end of the reporting period. |
(2) Long-term liabilities for the purpose of this table consist of loans denominated in foreign currencies from two-step loans, obligation under finance leases and long-term bank loans. |
Interest Rate Risk
Our exposure to interest rate fluctuations results primarily from changes to the floating rate applied for long-term debt. This risk relates to loans under the Government on-lending program that has been used to finance our capital expenditures.Interest rate fluctuation is monitored to minimize any negative impact to financial position. Borrowings at variable interest rates exposeour Company and subsidiaries to interest rate risk. To measure market risk fluctuations in interest rates,our Companyand our subsidiariesprimarily use interestmargin and maturity profile of the financial assets and liabilities based on changing schedule of the interest rate.
- 94 -
The actual cash flows from our debt are denominated in Rupiah,US Dollar, Euro and Japanese Yen, as appropriate and as indicated in the table. The information presented in the table has been determined based on the following assumptions: (i) fixed interest rates on Rupiah time deposits are based on average interest rates offered for three month placements in effect as of December 31,2012 by the banks where such deposits were located; (ii) variable interest rates on Rupiah denominated long-term liabilities are calculated as of December 31,2012 and are based on contractual terms setting interest rates based on average rates for the preceding six months on three month certificates issued by Bank of Indonesia or based on the average three month deposit rate offered by the lenders; (iii) fixed interest rates onUS Dollar deposits arebased on average interest rates offered for three month placements by the various lending institutions where such deposits are located as of December 31,2012 and (iv) the value of marketable securities is based on the value of such securities on December 31,2012. However, these assumptions may change in the future. These assumptions are different from the rates used in our Consolidated Financial Statements; accordingly, amounts shown in the table may differ from the amounts shown in our Consolidated Financial Statements.
| Outstanding Balance as of December 31, 2012 | | Expected Maturity Date |
| Original Currency (million) | | Rp Equiv. (Rp million) | | Rate (%) | | 2013 | | 2014 | | 2015 | | 2016 | | 2017 | | There after | | Fair Value |
| | | | | | | | | | (Rp million) | | | | | | |
ASSETS | | | | | | | | | | | | | | | | | | | |
Fixed Rate | | | | | | | | | | | | | | | | | | | |
Cash and Cash Equivalents | | | | | | | | | | | | | | | | | | | |
Time deposit | | | | | | | | | | | | | | | | | | | |
Rupiah | 7,547,601 | | 7,547,601 | | 6.25 | | 7,547,601 | | - | | - | | - | | - | | - | | 7,547,601 |
US Dollar | 375 | | 3,620,513 | | 1.76 | | 3,620,513 | | - | | - | | - | | - | | - | | 3,620,513 |
Available-for-Sale | | | | | | | | | | | | | | | | | | | |
Financial Assets | | | | | | | | | | | | | | | | | | | |
Rupiah | 241,565 | | 241,565 | | - | | 241,565 | | - | | - | | - | | - | | - | | 241,565 |
US Dollar | 7 | | 69,067 | | - | | 69,067 | | - | | - | | - | | - | | - | | 69,067 |
LIABILITIES | | | | | | | | | | | | | | | | | | | |
Short-term Bank Loans | | | | | | | | | | | | | | | | | | | |
Variable Rate | | | | | | | | | | | | | | | | | | | |
Rupiah | | | | | | | | | | | | | | | | | | | |
Principal | 33,047 | | 33,047 | | - | | 33,047 | | - | | - | | - | | - | | - | | 33,047 |
Interest | 3,811 | | 3,811 | | 10.92 | | 3,811 | | - | | - | | - | | - | | - | | - |
US Dollar | | | | | | | | | | | | | | | | | | | |
Principal | 0.42 | | 4,091 | | - | | 4,091 | | - | | - | | - | | - | | - | | 4,091 |
Interest | 0.01 | | 75 | | 6 | | 75 | | - | | - | | - | | - | | - | | - |
Long-term Liabilities(1) | | | | | | | | | | | | | | | | | | | |
Variable Rate | | | | | | | | | | | | | | | | | | | |
Rupiah | | | | | | | | | | | | | | | | | | | |
Principal | 10,922,583 | | 10,922,583 | | - | | 4,318,227 | | 3,282,984 | | 2,195,103 | | 493,556 | | 329,643 | | 303,070 | | 11,006,856 |
Interest | 1,409,788 | | 1,409,788 | | 8.11 | | 610,918 | | 400,354 | | 198,627 | | 74,296 | | 40,401 | | 85,192 | | - |
US Dollar | | | | | | | | | | | | | | | | | | | |
Principal | 133 | | 1,290,024 | | - | | 545,429 | | 345,510 | | 194,108 | | 130,190 | | 74,787 | | - | | 1,298,276 |
Interest | 7 | | 79,225 | | 3.16 | | 36,546 | | 22,988 | | 12,665 | | 5,537 | | 1,489 | | - | | - |
Fixed Rate | | | | | | | | | | | | | | | | | | | |
Rupiah | | | | | | | | | | | | | | | | | | | |
Principal | 3,007,800 | | 3,007,800 | | - | | 7,800 | | - | | 1,005,000 | | - | | - | | 1,995,000 | | 3,355,029 |
Interest | 1,772,829 | | 1,772,829 | | 9.28 | | 301,201 | | 308,561 | | 244,620 | | 203,271 | | 204,755 | | 510,421 | | - |
US Dollar | | | | | | | | | | | | | | | | | | | |
Principal | 69 | | 663,312 | | - | | 153,499 | | 155,701 | | 100,059 | | 42,691 | | 42,691 | | 168,671 | | 710,741 |
Interest | 10 | | 92,523 | | 4.14 | | 26,876 | | 19,826 | | 12,777 | | 9,764 | | 8,031 | | 15,249 | | - |
Japanese Yen | | | | | | | | | | | | | | | | | | | |
Principal | 9,215 | | 1,030,582 | | | | 85,882 | | 85,882 | | 85,882 | | 85,882 | | 85,882 | | 601,172 | | 1,072,568 |
Interest | 1,786 | | 199,720 | | 3.10 | | 31,277 | | 28,615 | | 25,952 | | 23,356 | | 20,628 | | 69,892 | | - |
Finance Leases | | | | | | | | | | | | | | | | | | | |
Rupiah | | | | | | | | | | | | | | | | | | | |
Principal | 2,228,341 | | 2,228,341 | | - | | 479,249 | | 370,827 | | 251,432 | | 229,003 | | 222,938 | | 674,892 | | 2,228,341 |
Interest | 848,478 | | 848,478 | | 10.94 | | 142,120 | | 151,843 | | 128,180 | | 108,234 | | 106,800 | | 211,301 | | - |
US Dollar | | | | | | | | | | | | | | | | | | | |
Principal | 10 | | 95,629 | | - | | 30,742 | | 25,173 | | 18,136 | | 17,059 | | 4,519 | | - | | 95,629 |
Interest | - | | - | | - | | - | | - | | - | | - | | - | | - | | - |
(1) Long-term liabilities consist of loans which are subject to interest; namely two-step loans, bonds and notes and long-term bank loans, which in each case include their maturities. |
- 95 -
ITEM 12.DESCRIPTION OF SECURITIES OTHER THAN EQUITY SECURITIES
American Depositary Shares
Bank of New York Mellon (previously “The Bank of New York”) serves as the “Depositary” for our ADSs which are traded on the NYSE and LSE.
Investors pay a depositary fee directly or through a broker acting on their behalf for the delivery or surrender of ADSs for the purpose of withdrawal. The Depositary also collects fees for making distributions to investors by deducting the fee from the amount distributed or by selling a portion of the distributable property to pay the fee. The Depositary may collect its annual fee for depositary services by making a deduction from the cash distributions or by directly billing investors or by charging the book-entry system accounts of the parties acting on their behalf. The Depositary may refuse to provide fee-generating services until its bills for such services are paid.
Costs Related to ADS Issue and Handling
Shareholders depositing or withdrawing ordinary shares or ADS must pay: | | For: |
US$5 (or less) per 100 ADS (or part of 100 ADS). | | Issuance of ADS, including issuance resulting from a distribution of shares or rights or other property. Cancellation of ADS for the purpose of withdrawal, including in case of termination of the deposit agreement. |
US$0.02 (or less) per ADS. | | Any cash payment to registered ADS shareholders. |
A fee equivalent to the fee payable if the securities distributed to shareholders had been shares and those shares had been deposited for the issuance of ADS. | | Delivery of securities by the Depositary to registered ADS shareholders. |
US$0.02 (or less) per ADS per calendar year. | | Depositary services. |
Registration or transfer fees. | | Transfer or registration of shares on the share register to or from the name of the Depositary or its agent when shareholders deposit or withdraw ordinary shares. |
Depositary Fees. | | Telegram, telex and fax transmissions (if provided for in the deposit agreement). Converting foreign currency to US Dollar. |
Taxes and other duties levied by the government, the Depositary or the custodian upon payment of the ADS or other shares underlying the ADS, such as share transfer tax, stamp duty or income tax. | | As necessary. |
Any costs incurred by the Depositary or its agent for servicing the securities deposited. | | As necessary. |
The Depositary has agreed to reimburse us up to US$400,000 per year until 2015 for certain expenses we incur in relation to the administration and maintenance of the ADS facility, including, but not limited to, direct or indirect investor relations expenses and other ADS program-related expenses. The reimbursement will be evaluated and adjusted if the number of ADSs outstanding falls below a stipulated minimum or if they are delisted from the NYSE. We expect to renegotiate the reimbursement amount for subsequent years after 2015. In 2012, we received US$392,092.29 in reimbursements from the Depositary.
- 96 -
PART II
ITEM 13.DEFAULTS, DIVIDEND ARREARAGES AND DELINQUENCIES
There are no defaults, dividend arrearages and delinquencies to which this Item applies.
ITEM 14.MATERIAL MODIFICATIONS TO THE RIGHTS OF SECURITY HOLDERS AND USE OFPROCEEDS
Not applicable.
ITEM 15.CONTROLS AND PROCEDURES
a. Disclosure Controls and Procedures
Under the supervision and with the participation ofour Company’sPresident Director, which is of the same level asChief Executive Officer(“CEO”)andFinance Director, which is of the same level asChief Financial Officer (“CFO”), management conducted an evaluation of the effectiveness of our Company’s disclosure controls and procedures (as such term is defined in Rules 13a-15(e) and 15d-15(e) under the Securities Exchange Act of 1934, as amended (the “Exchange Act”)), as of December 31, 2012. Based on this evaluation, our Company’s CEO and CFO have concluded that, as of December 31,2012,our Company’s disclosure controls and procedures were effective.Our Company’s disclosure controls and procedures include without limitation controls and proceduresthat are designed to ensure that information required to be disclosed in reports filed or submitted under the Exchange Act is recorded, processed, summarized and reported within the time periods specified in the SEC’s rules and forms, and that such information is accumulated and communicated to our Company’s management, including theCEO and CFO, as appropriate, to allow timely decisions regarding required disclosure.
b. Management’s Report on Internal Control over Financial Reporting
Management of our Company is responsible forestablishing and maintaining adequate internal control over financial reporting, as such term is defined in Exchange Act Rules 13a-15(f) and 15d-15(f).Our Company’s internal control over financial reporting is a process designed by, or under the supervision of, ourCEO and CFO, and effected byits Board ofDirectors, management and other personnel, to provide reasonable assurance regarding the reliability of financial reporting and the preparation of consolidated financial statements for external purposes in accordance withIFRS as issued by the IASB and includes those policies and procedures that (1) pertain to the maintenance of records that, in reasonable detail, accurately and fairly reflect the transactions and dispositions of the assets of our Company; (2) provide reasonable assurance that transactions are recorded as necessary to permit preparation ofconsolidated financial statements in accordance withIFRS, and that receipts and expenditures of our Company are being made only in accordance with authorizations of management andDirectors of our Company; and (3) provide reasonable assurance regarding prevention or timely detection of unauthorized acquisition, use or disposition of our Company’s assets that could have a material effect on theConsolidatedFinancialStatements.
Because of its inherent limitations, internal control over financial reporting may not prevent or detectallmisstatements. Also, projections of any evaluation of effectiveness to future periods are subject to the risk that controls may become inadequate because of changes in conditions, or that the degree of compliance with the policies or procedures may deteriorate.
Our Company’s management has assessed the effectiveness of our Company’s internal control over financial reporting as of December 31, 2012. In making this assessment our Company’s management used the criteria set forth in Internal Control – Integrated Framework issued by the Committee of SponsoringOrganizations of the TreadwayCommission(“COSO”). Based on this assessment, management concluded that as of December 31, 2012, our Company’s internal control over financial reporting was effective.
c. Attestation Reportof the Registered Public Accounting Firm
The effectiveness of our Company’s internal control over financial reporting as of December 31, 2012 has been audited by Kantor Akuntan PublikPurwantono, Suherman &Surja, an independent registered public accounting firm, as stated in their report which appears on pages F-3 and F-4 herein.
d. Changes in Internal Control over Financial Reporting
There have been no significant changes in our Company’s internal control over financial reporting during the most recently completed fiscal year that would materially affect or are reasonably likely to materially affect, our Company’s internal control over financial reporting.
- 97 -
ITEM 16A.AUDIT COMMITTEE FINANCIAL EXPERT
The Board of Commissioners has determined that Sahat Pardede, as an independent member of our Audit Committee, qualifies as an Audit Committee Financial Expert in accordance with the requirements of Item 16A of Form 20-F and as an “independent” memberpursuant to the provisions of Rule 10A-3 of the Exchange Act. Mr. Pardede has been a member of our Audit Committee since February 2004. Prior to his appointment as a member of our Audit Committee, Sahat Pardede practiced and is currently practicing, as a Certified Public Accountant in Indonesia and provided auditing services and other financial services to numerous private companies and public institutions. He is a Certified Public Accountant and is also a member of the Indonesian Institute of Certified Public Accountants.
ITEM 16B.CODE OF ETHICS
In compliance withthe Sarbanes-Oxley Act of 2002 Section 406, our code of ethics applies equally to our Commissioners, our President Director and our Finance Director (positions equivalent to Chief Executive Officer, respectively and Chief Financial Officer), Directors and other key officers as well as all of our employees. You may view our code of ethics on our web site at http://www.telkom.co.id/about-telkom/business-ethics. Amendments to or waivers from the code of ethics will be posted on our website as well.
ITEM 16C.PRINCIPAL ACCOUNTANT FEES AND SERVICES
In line with existing procedures and taking into consideration the independence and qualifications of independent auditors, our Annual General Meeting of Shareholders (“AGMS”) on May 11, 2012 appointed the Public Accountant Firm (or "KAP") Purwantono, Suherman & Surja (a member firm of Ernst & Young Global Limited), a registered KAP with OJK, to perform the audit on our Consolidated Financial Statements for the fiscal year ended December 31, 2012 and on the Effectiveness of Internal Control on Financial Reporting as of December 31, 2012. The fee for the audit on the Consolidated Financial Statements for fiscal year 2012 and on the Effectiveness of Internal Control on Financial Reporting as of December 31, 2012 was agreed at Rp26.6 billion (excluding VAT). The audit fee is excluding consent letter issuance fee toKAP Tanudiredja, Wibisana & Rekanamounted to Rp4.4 billion.
KAP Purwantono, Suherman & Surja has been our public accountant firm since 2012.
The independent auditor for our Consolidated Financial Statements for fiscal years 2010 and 2011 was KAP Tanudiredja, Wibisana & Rekan, a member firm of the PwC global network (“PwC”).
KAP Purwantono, Suherman & Surja is also assigned to perform an audit on funds utilization of the Partnership and Community Development Program (“PKBL”) for fiscal year 2012.
Fees and Services of the External Auditor
The following table summarizes the aggregate fees billed to us by KAP Tanudiredja, Wibisana & Rekan in 2010 and 2011 andKAP Purwantono, Suherman & Surjain2012, respectively:
| | | Years Ended December 31, | | |
| 2010(1) | | 2011(1) | | 2012(2) |
| (Rp million) | | (Rp million) | | (Rp million) |
Audit Fees | 41,872 | | 40,503 | | 26,619 |
Audit Related Fees | - | | - | | - |
Tax Service Fees | 398 | | 70 | | - |
All Other Fees | 400 | | 400 | | 326 |
(1)Audited by KAP Tanudiredja, Wibisana & Rekan | | | | | |
(2) Audited by KAP Purwantono, Suherman & Surja | | | | | |
.
Audit Committee Pre-Approval Policies and Procedures
We have adopted pre-approval policies and procedures under which all non-audit services provided by our independent registered public accounting firm must be pre-approved by our Audit Committee, as set forth in the Audit Committee Charter. Pursuant to the charter, permissible non-audit services may be performed by our independent registered public accounting firm provided that: (a) our Board of Directors must deliver to the Audit Committee (through the Board of Commissioners) a detailed description of the non-audit service that is to be performed by the independent public accounting firm; and (b) the AuditCommittee will determine whether the proposed non-audit service will affect the independence of our independent public accounting firm or would give rise to any conflict of interest.
- 98 -
Pursuant to Section 10(i)(1)(B) of the Exchange Act and paragraph (c)(7)(i)(C) of Rule 2-01 of Regulation S-X issued there under, Audit Committee Charter waives the pre-approval requirement for permissible non-audit services where: (i) the aggregate amount of the fees for such non-audit services constitutes no more than five percent of the total amount of fees paid by us to our independent registered public accounting firm during the year in which the services are provided; or (ii) the proposed services are not regarded as non-audit services at the time the contract to perform the engagement is signed. In addition to these two requirements, the performance of non-audit services must be approved prior to the completion of the audit by a member of the Audit Committee who has been delegated pre-approval authority by the full Audit Committee or by the full Audit Committee itself.
ITEM 16D.EXEMPTIONS FROM THE LISTING STANDARDS FOR AUDIT COMMITTEES
NYSE listing standards require that a US listed company must have an Audit Committee, a nominating/corporate governance committee and a compensation committee. Each of these committees must consist solely of Independent Directors and must have a written charter that addresses certain matters specified in the listing standards.
The Indonesian Company Law does not require Indonesian public companies to form any of the committees described in the NYSE listing standards. However, Bapepam-LK Rule No.IX.I.5 and IDX Regulation I-A require the Board of Commissioners of an IDX- listed company (such as our Company) to establish an Audit Committee, which must consist of at least three members, one of whom must be an Independent Commissioner and serve as chair of the Audit Committee, while the other two members must be independent parties of whom at least one such party must have accounting and/or finance expertise.
Our Audit Committee has six members: two Independent Commissioners, one Commissioner, and three external independent members who are not affiliated with our Company.
The NYSE Listing Standards as required by Rule 10A-3(c)(3) of the Exchange Act require foreign private issuers whose shares are listed on the NYSE to have an Audit Committee comprised of Independent Directors. However, such foreign private issuers may be exempted from the independence requirement if (i) the home country government or stock exchange requires the company to have an Audit Committee; (ii) the Audit Committee is separate from the Board of Directors and includes non-board members as in our case, members from the Board of Commissioners; (iii) the Audit Committee members are not selected by management and no executive officers of the company is a member of the Audit Committee; (iv) the home country government or stock exchange requires the Audit Committee to be independent of the company’s management and (v) the Audit Committee is responsible for appointment, retention and oversight the work of the external auditor. We avail ourselves of this exemption and document this on our Section 303A Annual Written Affirmations submitted to the NYSE. However, unlike the NYSE Listing Standards requirements, according to the current provisions for Audit Committees in Indonesia, our Audit Committee does not have direct responsibility for the appointment, compensation and retention of the external auditor. Our Audit Committee may only recommend the appointment of the external auditor to the Board of Commissioners and the Board of Commissioner’s decision must have the approval of the shareholders.
Not all members of our Audit Committee are Independent Directors as required by Rule 10A-3 of the Exchange Act. We rely on the general exemption pursuant to Rule 10A-3(c)(3) regarding the composition of the Audit Committee. We believe that our reliance on this exemption does not materially and adversely affect the ability of the Audit Committee to act independently. We believe that the intent of the provision in requiring that each member of the Audit Committee be an Independent Director is to ensure that the Audit Committee is independent from influence by management and provides a forum separate from management in which auditors and other interested parties can candidly discuss concerns. The Bapepam-LK Audit Committee Rules require each member of the Audit Committee to be independent. The Bapepam-LK Audit Committee Rules also require that at least two of the members, the external independent members, in effect be independent not only of the management but also of the Board of Commissioners and Board of Directors and our Company as a whole. We therefore believe that the standard established by the Bapepam-LK Audit Committee Rules is at least equally effective in ensuring the ability of the Audit Committee to act independently.
- 99 -
ITEM 16E.PURCHASES OF EQUITY SECURITIES BY THE ISSUER AND AFFILIATED PURCHASERS
| Period | | Total Number of Share Purchased | | Average Price Paid per Share in Rp | | Total Number of Shares Purchased as Part of Publicly Announced Plans | | Maximum Number of Shares that May Yet Be Purchased Under the Plans |
| | | | | | | | | 1,007,999,964 |
SBB I | 2006 | | 118,376,500 | | 8,044 | | 118,376,500 | | 889,623,464 |
SBB II | 2007 | | 126,364,000 | | 9,689 | | 244,740,500 | | 763,259,464 |
SBB III | 2008 | | 245,834,000 | | 8,491 | | 490,574,500 | | 517,425,464 |
| | | | | | | | | |
SBB IV | 2011 | | 283,085,460 | | 7,337 | | 773,659,960 | | 645,161,290 |
| 2012 | | | | | | | | 362,075,830 |
| January | | 66,895,000 | | 6,997 | | 840,554,960 | | 295,180,830 |
| February | | 60,052,500 | | 6,905 | | 900,607,460 | | 235,128,330 |
| March | | 39,998,000 | | 6,906 | | 940,605,460 | | 195,130,330 |
| April | | 9,140,000 | | 7,636 | | 949,745,460 | | 185,990,330 |
| May | | 16,859,000 | | 7,687 | | 966,604,460 | | 169,131,330 |
| June | | 9,120,000 | | 7,751 | | 975,724,460 | | 160,011,330 |
| July | | 14,423,500 | | 8,737 | | 990,147,960 | | 145,587,830 |
| August | | 8,902,500 | | 9,026 | | 999,050,460 | | 136,685,330 |
| September | | 7,380,000 | | 9,431 | | 1,006,430,460 | | 129,305,330 |
| October | | 4,500,000 | | 9,548 | | 1,010,930,460 | | 124,805,330 |
| November | | - | | - | | 1,010,930,460 | | 124,805,330 |
| December | | - | | - | | 1,010,930,460 | | 124,805,330 |
| Total | | 520,355,960 | | 7,996 | | 1,010,930,460 | | - |
As of December 31, 2012, we had repurchased 1,010,930,460 common stock shares, equivalent to 5.0% of our issued and outstanding common stock, at an aggregate repurchase price of Rp8,067 billion, excluding broker and custodian fees. Under our repurchase program, we repurchased 118,376,500 shares in 2006, 126,364,000 shares in 2007, 245,834,000 shares in 2008, 283,085,460 shares in 2011 and 237,270,500 shares in 2012. In 2011 and 2012, we repurchased 520,355,960 common stock shares at an aggregate repurchase price Rp3,803 billion.See Note 22 to our Consolidated Financial Statement.
We plan to retain, sell or use repurchased stock for other purposes in accordance with Bapepam-LK Rule No.XI.B.2, Law No.40/2007 regarding Limited Liability Companies and the resolutions of the AGMS on June 11, 2010, that require the Board of Directors to seek prior approval from the Board of Commissioners to undertake any change or transfer of treasury stock and report its utilization or transfer to the AGMS. Before giving its approval, the Board of Commissioners must consult with the holder of the Series A Dwiwarna share.
ITEM 16F.CHANGE IN REGISTRANT’S CERTIFYING ACCOUNTANT
On May 4, 2012, our Board of Commissioners determined not to reappoint KAP Tanudiredja, Wibisana & Rekan, a member firm of the PwC global network (“PwC”), as our independent registered public accounting firm for the 2012 fiscal year. Subsequently, we appointed KAP Purwantono, Suherman & Surja, a member firm of Ernst & Young Global Limited (“Ernst & Young”), as our independent registered public accounting firm for the 2012 fiscal year, subject to the approval of our shareholders. On May 11, 2012, the AGMS approved the engagement of Ernst & Young as our independent registered accounting firm for the year ended December 31, 2012.
PwC audited our Consolidated Financial Statements for the fiscal years ended December 31, 2011 and 2010. For these periods and up to May 11, 2012 there were no disagreements with PwC on any matter of accounting principle or practices, financial statement disclosure, or auditing scope or procedure, which disagreement(s), if not resolved to the satisfaction of PwC, would have caused it to make reference thereto in its report on the Consolidated Financial Statements for such years. During such years, there were no reportable events within the meaning set forth in the instructions to Item 16F of Form 20-F.
The reports of PwC on our Consolidated Financial Statements for the fiscal years ended December 31, 2011 and 2010 did not contain any adverse opinion or disclaimer of opinion and were not qualified or modified as to uncertainty, audit scope or accounting principles.
We have provided PwC with a copy of the foregoing disclosure and requested that PwC provide us with a letter addressed to the SEC stating whether it agrees with the statements made by our Company in response to this item. A copy of such letter, dated March 22, 2013, is filed as Exhibit 15.1 in this Form 20-F.
During the fiscal years ended December 31, 2011 and 2010 and through May 11, 2012, we did not consult with Ernst & Young on (1) the application of accounting principles to a specified transaction, either completed or proposed, or the type of audit opinion that may be rendered on our Consolidated Financial Statements, and Ernst & Young did not provide either a written report or oral advice to our Company that Ernst & Young concluded was an important factor considered by us in reaching a decision as to any accounting, auditing, or financial reporting issue; or (2) the subject of any disagreement, as defined in Item 16F(a)(1)(v) of Form 20-F and the related instructions, or a reportable event within the meaning set forth in Item 16F(a)(1)(v) of Form 20-F.
- 100 -
ITEM 16G.CORPORATE GOVERNANCE
The following is a summary of significant differences between the corporate governance practices followed by Indonesian companies and those required by NYSE listing standards for domestic US issuers.
a. Overview of Indonesian Law
Indonesian public companies are required to observe and comply with certain Good Corporate Governance practices. The requirements and the standards for good corporate governance practices for public companies are embodied in the following regulations: Law No.40/2007 on Limited Liability Companies (“Indonesian Company Law”); Law No.8/1995 on Capital Markets (“Capital Markets Law”); Law No.19/2003 on State-Owned Enterprises; Regulation of the Minister of State-Owned Enterprises No.PER-09/MBU/2012 on Amendment of Regulation of the Minister of State-Owned Enterprises No.PER-01/MBU/2011 on the Implementation of Good Corporate Governance to State-Owned Enterprises; regulations of OJK (“OJK Regulations”) and the rules issued by the IDX. In addition to the above, the articles of association of public companies incorporate provisions directing the implementation of good corporate governance practices.
Similar to the laws of the US, Indonesian laws require public companies to observe and comply with corporate governance standards that are more stringent than those applied to privately-owned companies. In Indonesia, the term “public company” does not necessarily refer to a company whose shares are listed on a securities exchange. Under the Capital Markets Law, a non-listed company may be deemed a public company, and subjected to the laws and regulations governing public companies, if such company meets or exceeds the capital and shareholder requirements applicable to a publicly-listed company.
On November 30, 2004, the National Committee on Governance (“NCG”) was established pursuant to the Decree of the Coordinating Minister for Economic Affairs No.KEP.49/M.EKONOM/1/2004 (“KEP.49”), which was formed to revitalize the former National Committee on Good Corporate Governance established in 1999. The NCG aimed at enhancing comprehension and implementation of good governance in Indonesia and advises the Government on governance issues, both in public and corporate sectors.Furthermore, based on Decree of the Coordinating Minister for Economic Affairs No.KEP-14/M.EKON/03/2008, dated March 18, 2008 (“KEP.14”), KEP.49 was revoked. Therefore, any working results which have been made by the Committee, which was established based on KEP.49, will be delivered and continued by the Committee under KEP.14.
The NCG formulated the Code for Good Corporate Governance 2006 (“Code”) which recommended setting more stringent corporate governance standards for Indonesian companies, such as the appointment of Independent Commissioners and nomination and remuneration committees by the Board of Commissioners, as well as increasing the scope of disclosure obligations for Indonesian companies. Although the NCG recommended that the Code be adopted by the Government as a basis for legal reform, as of the date of this Annual Report, the Government has not enacted regulations that fully implement the provisions of the Code.
b. Composition of Independent Board of Directors and Board of Commissioners
The NYSE listing standards provide that the Board of Directors of a US listed company must consist of a majority of Independent Directors and that certain committees must consist solely of Independent Directors. A Director qualifies as independent only if the board affirmatively determines that the Director has no material relationship with the company, either directly or indirectly.
Unlike companies incorporated in the US, the management of an Indonesian company consists of two organs of equal stature, the Board of Directors and the Board of Commissioners. Generally, the Board of Directors is responsible for the day-to-day business activities of the company and is authorized to act for and on behalf of the company, while the Board of Commissioners has the authority and responsibility to supervise the Board of Directors and is statutorily mandated to provide advice to the Board of Directors by Indonesian Company Law.
- 101 -
With regard to the Board of Commissioners, the Indonesia Company Law requires a public company Board ofCommissioners to have at least two members. Although the Indonesian Company Law is silent as to the composition of the Board of Commissioners, Listing Regulation No.IA in KEP.305/BEJ/07-2004 issued by the IDX(“IDX Regulation I-A”)states that at least 30% of the members of the Board of Commissioners of a public company (such as our Company) must be independent.
The Indonesian Company Law states that the Board of Directors has the authority to manage the daily operation of the company and must have at least two members, each of whom must meet the minimum qualification requirements set forth in the Indonesian Company Law. In addition, based on IDX Regulation I-A, the Board of Directors of the listed company must consist of at least one unaffiliated director.
Given the difference between the role of the members of the Board of Directors in an Indonesian company and that of their counterparts in a US company, Indonesian law does not require that certain members of the Board ofDirectors must be independent and neither does it require the creation of certain committees composed entirely of Independent Directors.
c. Committees
See Item 16D “Exemptions from the Listing Standards for Audit Committees”.
d. Disclosure Regarding Corporate Governance
The NYSE listing standards require US companies to adopt, and post on their websites, a set of corporate governance guidelines. The guidelines must address, among other things: director qualification standards, director responsibilities, director access to management and independent advisers, director compensation, director orientation and continuing education, management succession, and an annual performance evaluation itself. In addition, the CEO of a US company must certify to the NYSE annually that he or she is not aware of any violations by the company of the NYSE’s corporate governance listing standards. The certification must be disclosed in our Annual Report to shareholders. Indonesian law does not have disclosure requirements similar to NYSE listing standards. However, the Capital Markets Law generally requires Indonesian public companies to disclose certain types of information to shareholders and to OJK, particularly information relating to changes in the public company’s shareholdings and material facts that may affect the decision of shareholders to maintain their share ownership in such public company.
e. Code of Business Conduct and Ethics
NYSE listing standards require each US listed company to adopt, and post on its web site, a code of business conduct and ethics for its Directors, officers and employees. There is no similar requirement under Indonesian law. However, companies that are required to file or furnish reports to the SEC must disclose in their Annual Reports whether they have adopted a code of ethics for their senior financial officers. Although the requirements as to the contents of the code of ethics under SEC rules are not identical to those set forth in the NYSE listing standards, there are significant similarities in which under SEC rules, the code of ethics must be designed to promote: (a) honest and ethical conduct, including the handling of conflicts of interest between personal and professional relationships; (b) full, fair, accurate and timely disclosure in reports and documents filed with or submitted to the SEC; (c) compliance with applicable laws and regulations; (d) prompt internal reporting of violations of the code and (e) accountability for adherence to the code. Furthermore, shareholders must be given access to physical or electronic copies of the code.
ITEM 16H.MINE SAFETY DISCLOSURE
Not applicable.
- 102 -
PART III
ITEM 17. FINANCIAL STATEMENTS
We have responded to Item 18 in lieu of this Item.
ITEM 18.FINANCIAL STATEMENTS
See pages F-1throughF-128.
ITEM 19.EXHIBITS
The following exhibits are filed as part of this Form 20-F:
1.1 | Articles of Association (as amended on June 7, 2012). |
8.1 | Please refer to Item 4 “Information on The Company – Organizational Structure” for a list of subsidiaries of the Registrant. |
12.1 | Certification of the Chief Executive Officer pursuant to Rule 13a-14(a) of the Securities Exchange Act of 1934 and 15 U.S.C. Section 7241, as adopted pursuant to Section 302 of the Sarbanes-Oxley Act of 2002. |
12.2 | Certification of the Chief Financial Officer pursuant to Rule 13a-14(a) of the Securities Exchange act of 1934 and 15 U.S.C. Section 7241, as adopted pursuant to Section 302 of the Sarbanes-Oxley Act of 2002. |
13.1 | Certification of the Chief Executive Officer pursuant to Rule 13a-14(b) of the Securities Exchange Act of 1934 and 18 U.S.C. Section 1350, as adopted pursuant to Section 906 of the Sarbanes-Oxley Act of 2002. |
13.2 | Certification of the Chief Financial Officer pursuant to Rule 13a-14(b) of the Securities Exchange Act of 1934 and 18 U.S.C. Section 1350, as adopted pursuant to Section 906 of the Sarbanes-Oxley Act of 2002. |
15.1 | Letter of The Company’s predecessor auditor to the SecuritiesandExchange Commissions dated March22, 2013 in relation to Item 16F. Change in Registrant’s Certifying Accountant. |
- 103 -
TABLE OF CONTENTS
SIGNATURES
Pursuant to the requirements of Section 12 of the Securities Exchange Act 1934, as amended, the Registrant hereby certifies that it meets all of the requirements for filing on Form 20-F and that it has duly caused and authorized the undersigned to sign this Form 20-F on its behalf.
PERUSAHAAN PERSEROAN (PERSERO)
PT TELEKOMUNIKASI INDONESIA TBK
Jakarta, March 26, 2013
By: | /s/ Arief Yahya |
| Arief Yahya President Director / Chief Executive Officer |
Perusahaan Perseroan (Persero)
PT Telekomunikasi Indonesia Tbk
and Subsidiaries
Consolidated financial statements with
report of independent registered public accounting firm
as of December 31, 2011 and 2012 and for the years
ended December 31, 2010, 2011 and 2012
PERUSAHAAN PERSEROAN (PERSERO)
PT TELEKOMUNIKASI INDONESIA Tbk AND SUBSIDIARIES
CONSOLIDATED FINANCIAL STATEMENTS WITH
REPORT OF INDEPENDENT REGISTERED PUBLIC ACCOUNTING FIRM
AS OF DECEMBER 31, 2011 AND 2012 AND FOR THE
YEARS ENDED DECEMBER 31, 2010, 2011 AND 2012

Report of Independent Registered Public Accounting Firm
Report No. RPC-3452/PSS/2013
The Shareholders and the Boards of Commissioners and Directors
Perusahaan Perseroan (Persero) PT Telekomunikasi Indonesia Tbk
We have audited the accompanying consolidated statement of financial position of Perusahaan Perseroan (Persero) PT Telekomunikasi Indonesia Tbk (the “Company”) and its subsidiaries as of December 31, 2012, and the related consolidated statements of comprehensive income, changes in equity and cash flows for the year then ended. These financial statements are the responsibility of the Company’s management. Our responsibility is to expressan opinionon these financial statements based on our audit. The consolidated financial statements of the Company and its subsidiaries as of December 31, 2011 and for the years ended December 31, 2010 and 2011 were audited by other independent registered public accountants whose report dated March 30, 2012 expressed an unqualified opinion on those statements before the restatement of segment reporting disclosures discussed below.
We conducted our audit in accordance with the standards of the Public Company Accounting Oversight Board (United States). Those standards require that we plan and perform the audit to obtain reasonable assurance about whether the financial statements are free of material misstatement. An audit includes examining,on a test basis, evidence supporting the amounts and disclosures in the financial statements. An audit also includes assessing the accounting principles used and significant estimates made by management, as well as evaluating the overall financial statement presentation. We believe that our audit provides a reasonable basis for our opinion.
In our opinion, the 2012 financial statements referred to above present fairly, in all material respects, the consolidated financial position of Perusahaan Perseroan (Persero) PT Telekomunikasi Indonesia Tbk and its subsidiaries as of December 31, 2012, and the consolidated results of their operations and their cash flows for the year then ended, in conformity with International Financial Reporting Standards as issued by the International Accounting Standards Board.
As described in Note 35 to the consolidated financial statements, the Company changed the composition of its reportable segments in 2012, and the comparative amounts for the year ended December 31, 2011 relating to reportable segments have been restated to conform to the reportable segments in 2012. Our audit procedures that were applied to the restated disclosures for comparative 2011 reportable segments included: (i) agreeing the adjusted amounts of each segment (revenues, operating profit and assets) to the underlying records obtained from management, and (ii) testing the mathematical accuracy of the reconciliations of segment amounts to the consolidated financial statements. In our opinion, the restated disclosures of reportable segments for the year ended December 31, 2011, as described in Note 35 to the consolidated financial statements, are appropriate. However, we were not engaged to audit, review, or apply any procedures to the consolidated financial statements of the Company and its subsidiaries as of December 31, 2011 and for the year then ended other than with respect to such adjustments and, accordingly, we do not express an opinion or any other form of assurance on the consolidated financial statements as of December 31, 2011 and for the year then ended taken as a whole.

F - 1

Report of Independent Registered Public Accounting Firm (continued)
Report No. RPC-3452/PSS/2013 (continued)
We also have audited,inaccordance with the standards of the Public Company Accounting Oversight Board (United States), Perusahaan Perseroan (Persero) PT Telekomunikasi Indonesia Tbk and its subsidiaries’ internal control over financial reporting as of December 31, 2012, based on criteria established in Internal Control-Integrated Framework issued by the Committee of Sponsoring Organizations of the Treadway Commission and our report dated March 22, 2013 expressed an unqualified opinion thereon.
/s/ Purwantono, Suherman & Surja
Jakarta, Indonesia
March 22, 2013
F - 2
Report of Independent Registered Public Accounting Firm
Report No. RPC-3453/PSS/2013
The Shareholders and the Boards of Commissioners and Directors
Perusahaan Perseroan (Persero) PT Telekomunikasi Indonesia Tbk
We have audited Perusahaan Perseroan (Persero) PT Telekomunikasi Indonesia Tbk (the “Company”) and its subsidiaries’ internal control over financial reporting as of December 31, 2012, based on criteria established in Internal Control—Integrated Framework issued by the Committee of Sponsoring Organizations of the Treadway Commission (the COSO criteria). The Company’s management is responsible for maintaining effective internal control over financial reporting, and for its assessment of the effectiveness of internal control over financial reporting included in the accompanying Management’s Report on Internal Control over Financial Reporting. Our responsibility is to express an opinion on the Company and its subsidiaries’ internal control over financial reporting based on our audit.
We conducted our audit in accordance with the standards of the Public Company Accounting Oversight Board (United States). Those standards require that we plan and perform the audit to obtain reasonable assurance about whether effective internal control over financial reporting was maintained in all material respects. Our audit included obtaining an understanding of internal control over financial reporting, assessing the risk that a material weakness exists, testing and evaluating the design and operating effectiveness of internal control based on the assessed risk, and performing such other procedures as we considered necessary in the circumstances. We believe that our audit provides a reasonable basis for our opinion.
A company’s internal control over financial reporting is a process designed to provide reasonable assurance regarding the reliability of financial reporting and the preparation of financial statements for external purposes in accordance with International Financial Reporting Standards as issued by the International Accounting Standards Board. A company’s internal control over financial reporting includes those policies and procedures that (1) pertain to the maintenance of records that, in reasonable detail, accurately and fairly reflect the transactions and dispositions of the assets of the company; (2) provide reasonable assurance that transactions are recorded as necessary to permit preparation of financial statements in accordance with International Financial Reporting Standards, and that receipts and expenditures of the company are being made only in accordance with authorizations of management and directors of the company; and (3) provide reasonable assurance regarding prevention or timely detection of unauthorized acquisition, use, or disposition of the company’s assets that could have a material effect on the financial statements. Because of its inherent limitations, internal control over financial reporting may not prevent or detect misstatements. Also, projections of any evaluation of effectiveness to future periods are subject to the risk that controls may become inadequate because of changes in conditions, or that the degree of compliance with the policies or procedures may deteriorate.

Report of Independent Registered Public Accounting Firm (continued)
Report No. RPC-3453/PSS/2013 (continued)
In our opinion, Perusahaan Perseroan (Persero) PT Telekomunikasi Indonesia Tbk and its subsidiaries maintained, in all material respects, effective internal control over financial reporting as of December 31, 2012, based on the COSO criteria.
We also have audited, in accordance with the standards of the Public Company Accounting Oversight Board (United States), the consolidated statement of financial position of Perusahaan Perseroan (Persero) PT Telekomunikasi Indonesia Tbk (the “Company”) and its subsidiaries as of December 31, 2012, and the related consolidated statements of comprehensive income, changes in equity and cash flows for the year then ended and our report dated March 22, 2013 expressed an unqualified opinion thereon.
/s/ Purwantono, Suherman & Surja
Jakarta, Indonesia
March 22, 2013
F - 4
REPORT OF INDEPENDENT REGISTERED PUBLIC ACCOUNTING FIRM
TO THE STOCKHOLDERS OF
PERUSAHAAN PERSEROAN (PERSERO) PT TELEKOMUNIKASI INDONESIA Tbk
In our opinion, the accompanying consolidated statement of financial position and the related consolidated statements of comprehensive income, changes in equity, and cash flows, before the effects of the adjustments to retrospectively reflect the change in the composition of reportable segments described in Note 35, present fairly, in all material respects, the financial position of Perusahaan Perseroan (Persero) PT Telekomunikasi Indonesia Tbk (the “Company”) and its subsidiaries at 31 December 2010 and 2011, and the results of their operations and their cash flows for each of the two years in the period ended 31 December 2011 in conformity with International Financial Reporting Standards as issued by the International Accounting Standards Board (the 2011 and 2010 consolidated financial statements before the effects of the adjustments discussed in Note 35 are not presented herein). These financial statements are the responsibility of the Company's management. Our responsibility is to express an opinion on these financial statements based on our audit. We conducted our audit, before the effects of the adjustments described above, of these statements, in accordance with the standards of the Public Company Accounting Oversight Board (United States). Those standards require that we plan and perform the audit to obtain reasonable assurance about whether the financial statements are free of material misstatement. An audit includes examining, on a test basis, evidence supporting the amounts and disclosures in the financial statements, assessing the accounting principles used and significant estimates made by management, and evaluating the overall financial statement presentation. We believe that our audit provides a reasonable basis for our opinion.
We were not engaged to audit, review, or apply any procedures to the adjustments to retrospectively reflect the change in composition of reportable segments described in Note 35 and accordingly, we do not express an opinion or any other form of assurance about whether such adjustments are appropriate and have been properly applied. Those adjustments were audited by other auditors.
JAKARTA
30 March 2012
/s/Chrisna A. Wardhana, CPA
Public Accountant License No. AP.0231
F - 5
TABLE OF CONTENTS
PERUSAHAAN PERSEROAN (PERSERO)
PT TELEKOMUNIKASI INDONESIA Tbk AND SUBSIDIARIES
CONSOLIDATED STATEMENTS OF FINANCIAL POSITION
December 31, 2011 and 2012
(Figures in tables are presented in billions of rupiah and
millions of U.S. dollar)
| | | 2011 | | 2012 | |
| Notes | | Rp | | Rp | | US$ (Note 3) | |
ASSETS | | | | | | | | |
CURRENT ASSETS | | | | | | | | |
Cash and cash equivalents | 2c,2e,2t,4,34,39 | | 9,634 | | 13,118 | | 1,361 | |
Other current financial assets | 2c,2e,2t,5,34,39 | | 373 | | 4,338 | | 450 | |
Trade and other receivables | 2c,2g,2t,6,34,39 | | 5,393 | | 5,409 | | 561 | |
Inventories | 2h,7 | | 758 | | 579 | | 60 | |
Advances and prepaid expenses | 2c,2i,8,34 | | 3,294 | | 3,721 | | 386 | |
Prepaid income taxes | 2s,31 | | 633 | | 52 | | 5 | |
Prepaid other taxes | 2s,31 | | 525 | | 756 | | 78 | |
Asset held for sale | 2j,9 | | 791 | | - | | - | |
Total Current Assets | | | 21,401 | | 27,973 | | 2,901 | |
NON-CURRENT ASSETS | | | | | | | | |
Long-term investments | 2f,2t,10,39 | | 235 | | 275 | | 29 | |
Property and equipment | 2l,2m,2z,11,36 | | 74,638 | | 76,908 | | 7,980 | |
Prepaid pension benefit cost | 2r,32 | | 765 | | - | | - | |
Advances and other non-current assets | 2c,2i,2t,12,34,36,37,39 | | 3,817 | | 3,510 | | 364 | |
Intangible assets | 2d,2k,13 | | 1,791 | | 1,443 | | 150 | |
Deferred tax assets | 2s,31 | | 75 | | 102 | | 11 | |
Total Non-current Assets | | | 81,321 | | 82,238 | | 8,534 | |
TOTAL ASSETS | | | 102,722 | | 110,211 | | 11,435 | |
LIABILITIES AND EQUITY | | | | | | | | |
CURRENT LIABILITIES | | | | | | | | |
Trade and other payables | 2c,2n,2q,2t,14,34,39 | | 8,355 | | 7,457 | | 774 | |
Current income tax liabilities | 2s,31 | | 729 | | 1,280 | | 133 | |
Other tax liabilities | 2s,31 | | 310 | | 564 | | 58 | |
Accrued expenses | 2c,2q,2t,15,34,39 | | 4,790 | | 6,163 | | 639 | |
Unearned income | 2q,16 | | 2,821 | | 2,729 | | 283 | |
Advances from customers and suppliers | 2c,34 | | 271 | | 257 | | 27 | |
Short-term loans and other borrowings | 2c,2m,2o,2t,11,17,34,39 | | 4,913 | | 5,658 | | 587 | |
Total Current Liabilities | | | 22,189 | | 24,108 | | 2,501 | |
NON-CURRENT LIABILITIES | | | | | | | | |
Deferred tax liabilities | 2s,31 | | 3,448 | | 2,485 | | 258 | |
Other liabilities | 2n,2q | | 242 | | 334 | | 34 | |
Long service awards provisions | 2r,33 | | 287 | | 347 | | 36 | |
Pension benefit and other post-employment benefit obligations | 2c,2r,32,34 | | 4,572 | | 7,306 | | 758 | |
Long-term loans and other borrowings | 2c,2m,2o,2t,11,18,34,39 | | 12,958 | | 13,617 | | 1,413 | |
Total Non-current Liabilities | | | 21,507 | | 24,089 | | 2,499 | |
TOTAL LIABILITIES | | | 43,696 | | 48,197 | | 5,000 | |
EQUITY | | | | | | | | |
Capital stock | 1c,20 | | 5,040 | | 5,040 | | 523 | |
Additional paid-in capital | 2u,21 | | 1,073 | | 1,073 | | 111 | |
Treasury stock | 2u,22 | | (6,323 | ) | (8,067 | ) | (837 | ) |
Retained earnings | 1d,2d,20 | | 45,865 | | 48,572 | | 5,040 | |
Other reserves | 2f,2t,23 | | 56 | | 82 | | 9 | |
Net Equity Attributable to Owners of the Parent Company | | | 45,711 | | 46,700 | | 4,846 | |
Non-controlling interests | 2b,19 | | 13,315 | | 15,314 | | 1,589 | |
TOTAL EQUITY | | | 59,026 | | 62,014 | | 6,435 | |
TOTAL LIABILITIES AND EQUITY | | | 102,722 | | 110,211 | | 11,435 | |
The accompanying notes to the consolidated financial statements form an integral part of these consolidated financial statements taken as a whole.
F - 6
TABLE OF CONTENTS
PERUSAHAAN PERSEROAN (PERSERO)
PT TELEKOMUNIKASI INDONESIA Tbk AND SUBSIDIARIES
CONSOLIDATED STATEMENTS OF COMPREHENSIVE INCOME
Years Ended December 31, 2010, 2011 and 2012
(Figures in tables are presented in billions of rupiah and
millions of U.S. dollar, unlessotherwise stated)
| | | 2010 | | 2011 | | 2012 | |
| Notes | | Rp | | Rp | | Rp | | US$ (Note 3) | |
REVENUES | 2c,2q,25,34 | | 68,529 | | 71,238 | | 77,127 | | 8,003 | |
Operations, maintenance and telecommunication services expenses | 2c,2q,28,34 | | (16,046 | ) | (16,453 | ) | (16,796 | ) | (1,743 | ) |
Depreciation and amortization expenses | 2k,2l,2m,11,12,13 | | (14,580 | ) | (14,823 | ) | (14,474 | ) | (1,502 | ) |
Personnel expenses | 2c,2q,2r,27 | | | | | | | | | |
| 32,33,34 | | (7,447 | ) | (8,671 | ) | (9,695 | ) | (1,006 | ) |
Interconnection expenses | 2c,2q,30,34 | | (3,086 | ) | (3,555 | ) | (4,667 | ) | (484 | ) |
Marketing expenses | 2q | | (2,525 | ) | (3,278 | ) | (3,094 | ) | (321 | ) |
General and administrative expenses | 2c,2q,2s,29,34 | | (2,537 | ) | (2,935 | ) | (3,036 | ) | (315 | ) |
(Loss) gain on foreign exchange - net | 2p | | 43 | | (210 | ) | (189 | ) | (20 | ) |
Other income | 2q,11d | | 548 | | 666 | | 2,559 | | 266 | |
Other expenses | 2q,11d | | (145 | ) | (192 | ) | (1,973 | ) | (205 | ) |
OPERATING PROFIT | | | 22,754 | | 21,787 | | 25,762 | | 2,673 | |
Finance income | 2c,34 | | 452 | | 620 | | 596 | | 62 | |
Finance costs | 2c,2q,34 | | (1,928 | ) | (1,662 | ) | (2,055 | ) | (213 | ) |
Share of loss of associated companies | 2f,10 | | (14 | ) | (10 | ) | (11) | | (1 | ) |
PROFIT BEFORE INCOME TAX | | | 21,264 | | 20,735 | | 24,292 | | 2,521 | |
INCOME TAX (EXPENSE) BENEFIT | 2s,31 | | | | | | | | | |
Current | | | (4,669 | ) | (5,673 | ) | (6,628 | ) | (688 | ) |
Deferred | | | (843 | ) | 288 | | 720 | | 75 | |
Net Income Tax Expense | | | (5,512 | ) | (5,385 | ) | (5,908 | ) | (613 | ) |
PROFIT FOR THE YEAR | | | 15,752 | | 15,350 | | 18,384 | | 1,908 | |
OTHER COMPREHENSIVE (EXPENSES) INCOME | | | | | | | | | | |
Foreign currency translation | 1d,2b,2f | | 2 | | 7 | | 31 | | 3 | |
Change in fair value of available-for-sale financial assets | 2t | | 32 | | 4 | | (5 | ) | (1 | ) |
Defined benefit plan actuarial losses, net of tax | 2r,32 | | (587 | ) | (1,958 | ) | (3,031 | ) | (315 | ) |
Other Comprehensive Expenses - Net | | | (553 | ) | (1,947 | ) | (3,005 | ) | (313 | ) |
NET COMPREHENSIVE INCOME FOR THE YEAR | | | 15,199 | | 13,403 | | 15,379 | | 1,595 | |
Profit for the year attributable to: | | | | | | | | | | |
Owners of the parent company | | | 11,427 | | 10,848 | | 12,864 | | 1,335 | |
Non-controlling interests | | | 4,325 | | 4,502 | | 5,520 | | 573 | |
| | | 15,752 | | 15,350 | | 18,384 | | 1,908 | |
Net comprehensive income for the year attributable to: | | | | | | | | | | |
Owners of the parent company | | | 10,911 | | 8,969 | | 9,834 | | 1,020 | |
Non-controlling interests | 2b,19 | | 4,288 | | 4,434 | | 5,545 | | 575 | |
| | | 15,199 | | 13,403 | | 15,379 | | 1,595 | |
BASIC AND DILUTED EARNINGS PER SHARE(in full amount) | 2w,24 | | | | | | | | | |
Net income per share | | | 580.95 | | 553.70 | | 669.92 | | 0.07 | |
Net income per ADS (40 Series B shares per ADS) | | | 23,238.00 | | 22,148.00 | | 26,796.80 | | 2.78 | |
The accompanying notes to the consolidated financial statements form an integral part of these consolidated financial statements taken as a whole.
F - 7
TABLE OF CONTENTS
PERUSAHAAN PERSEROAN (PERSERO)
PT TELEKOMUNIKASI INDONESIA Tbk AND SUBSIDIARIES
CONSOLIDATED STATEMENTS OF CHANGES IN EQUITY
Years Ended December 31, 2010, 2011 and 2012
(Figures in tables are presented in billions of rupiah)
| | | | Attributable toowners of the parent company | | | | | |
| | | | Capital
stock | | Additionalpaid-in capital | | Treasury
stock | | Retained
earnings | | Other
reserves | | | | Non-controlling
interests | | Total
equity | |
| | | | | | | | | Total | | | |
Descriptions | | Notes | | Rp | | Rp | | Rp | | Rp | | Rp | | Rp | | Rp | | Rp | |
Balance, December 31, 2009 | | | | 5,040 | | 1,073 | | (4,264 | ) | 37,561 | | 18 | | 39,428 | | 10,894 | | 50,322 | |
Net comprehensive income for the year | | 1d,2b | | | | | | | | | | | | | | | | | |
Profit for the year | | | | - | | - | | - | | 11,427 | | - | | 11,427 | | 4,325 | | 15,752 | |
Other comprehensive (expenses) income | | 2f,2t,2r | | - | | - | | - | | (550 | ) | 34 | | (516 | ) | (37 | ) | (553 | ) |
Net comprehensive income for the year | | | | - | | - | | - | | 10,877 | | 34 | | 10,911 | | 4,288 | | 15,199 | |
Transactions with owners recorded directly in equity | | | | | | | | | | | | | | | | | | | |
Distributions to owners | | | | | | | | | | | | | | | | | | | |
Final dividends | | 2v,20 | | - | | - | | - | | (5,142 | ) | - | | (5,142 | ) | (3,224 | ) | (8,366 | ) |
Interim dividends | | 2v,20 | | - | | - | | - | | (526 | ) | - | | (526 | ) | - | | (526 | ) |
Total distributions to owners | | | | - | | - | | - | | (5,668 | ) | - | | (5,668 | ) | (3,224 | ) | (8,892 | ) |
Changes in ownership interests in subsidiaries 20% acquisition of Sigma | | | | - | | - | | - | | (44 | ) | - | | (44 | ) | (51 | ) | (95 | ) |
Attributable tonon-controlling interests arising from acquisition of Ad Medika | | | | - | | - | | - | | - | | - | | - | | 4 | | 4 | |
Total changes in ownership interests in subsidiaries | | | | - | | - | | - | | (44 | ) | - | | (44 | ) | (47 | ) | (91 | ) |
Total transactions with owners | | | | - | | - | | - | | (5,712 | ) | - | | (5,712 | ) | (3,271 | ) | (8,983 | ) |
Balance, December 31, 2010 | | | | 5,040 | | 1,073 | | (4,264 | ) | 42,726 | | 52 | | 44,627 | | 11,911 | | 56,538 | |
The accompanying notes to the consolidated financial statements form an integral part of these consolidated financial statements taken as a whole.
F - 8
TABLE OF CONTENTS
PERUSAHAAN PERSEROAN (PERSERO)
PT TELEKOMUNIKASI INDONESIA Tbk AND SUBSIDIARIES
CONSOLIDATED STATEMENTS OF CHANGES IN EQUITY (continued)
Years Ended December 31, 2010, 2011 and 2012
(Figures in tables are presented in billions of rupiah)
| | | | Attributable toowners of the parent company | | | | | |
| | | | Capital
stock | | Additional
paid-in capital | | Treasury
stock | | Retained
earnings | | Other
reserves | | | | Non-controlling
interests | | Total
equity | |
| | | | | | | | | Total | | | |
Descriptions | | Notes | | Rp | | Rp | | Rp | | Rp | | Rp | | Rp | | Rp | | Rp | |
Balance, December 31, 2010 | | | | 5,040 | | 1,073 | | (4,264 | ) | 42,726 | | 52 | | 44,627 | | 11,911 | | 56,538 | |
Net comprehensive income for the year | | 1d,2b | | | | | | | | | | | | | | | | | |
Profit for the year | | | | - | | - | | - | | 10,848 | | - | | 10,848 | | 4,502 | | 15,350 | |
Other comprehensive (expenses) income | | 2f,2t,2r | | - | | - | | - | | (1,890 | ) | 11 | | (1,879 | ) | (68 | ) | (1,947 | ) |
Net comprehensive income for the year | | | | - | | - | | - | | 8,958 | | 11 | | 8,969 | | 4,434 | | 13,403 | |
Gains from investment securities | | 2t | | - | | - | | - | | - | | (7 | ) | (7 | ) | - | | (7 | ) |
Transactions with owners recorded directly in equity | | | | | | | | | | | | | | | | | | | |
Cash dividends | | 2v,20 | | - | | - | | - | | (5,819 | ) | - | | (5,819 | ) | (3,030 | ) | (8,849 | ) |
Treasury stock acquired - at cost | | 2u | | - | | - | | (2,059 | ) | - | | - | | (2,059 | ) | - | | (2,059 | ) |
Total transactions with owners | | | | - | | - | | (2,059 | ) | (5,819 | ) | - | | (7,878 | ) | (3,030 | ) | (10,908 | ) |
Balance, December 31, 2011 | | | | 5,040 | | 1,073 | | (6,323 | ) | 45,865 | | 56 | | 45,711 | | 13,315 | | 59,026 | |
The accompanying notes to the consolidated financial statements form an integral part of these consolidated financial statements taken as a whole.
F - 9
TABLE OF CONTENTS
PERUSAHAAN PERSEROAN (PERSERO)
PT TELEKOMUNIKASI INDONESIA Tbk AND SUBSIDIARIES
CONSOLIDATED STATEMENTS OF CHANGES IN EQUITY (continued)
Years Ended December 31, 2010, 2011 and 2012
(Figures in tables are presented in billions of rupiah)
| | | | Attributable toowners of the parent company | | | | | |
| | | | Capital
stock | | Additional
paid-in capital | | Treasury
stock | | Retained
earnings | | Other
reserves | | | | Non-controlling
interests | | Total
equity | |
| | | | | | | | | Total | | | |
Descriptions | | Notes | | Rp | | Rp | | Rp | | Rp | | Rp | | Rp | | Rp | | Rp | |
Balance, December 31, 2011 | | | | 5,040 | | 1,073 | | (6,323 | ) | 45,865 | | 56 | | 45,711 | | 13,315 | | 59,026 | |
Netcomprehensive income for the year | | 1d,2b | | | | | | | | | | | | | | | | | |
Profit for the year | | | | - | | - | | - | | 12,864 | | - | | 12,864 | | 5,520 | | 18,384 | |
Other comprehensive(expenses)income | | 2f,2t,2r | | - | | - | | - | | (3,056 | ) | 26 | | (3,030 | ) | 25 | | (3,005 | ) |
Net comprehensive income for the year | | | | - | | - | | - | | 9,808 | | 26 | | 9,834 | | 5,545 | | 15,379 | |
Transactions with owners recorded directlyin equity | | | | | | | | | | | | | | | | | | | |
Distributions to owners | | | | | | | | | | | | | | | | | | | |
Cash dividends | | 2v,20 | | - | | - | | - | | (7,127 | ) | - | | (7,127 | ) | (3,607 | ) | (10,734 | ) |
Treasury stock acquired - at cost | | 2u,22 | | - | | - | | (1,744 | ) | - | | - | | (1,744 | ) | - | | (1,744 | ) |
Totaldistributions to ownersand acquisition of treasury stock | | | | - | | - | | (1,744 | ) | (7,127 | ) | - | | (8,871 | ) | (3,607 | ) | (12,478 | ) |
Establishment of a subsidiary | | 1d | | - | | - | | - | | - | | - | | - | | 32 | | 32 | |
Acquisition of non-controlling interests in subsidiaries | | 1d,2d | | - | | - | | - | | (23 | ) | - | | (23 | ) | (10 | ) | (33 | ) |
Issuance of new shares of a subsidiary | | 1d | | - | | - | | - | | 49 | | - | | 49 | | 39 | | 88 | |
Net changes in ownership interests in subsidiaries | | | | - | | - | | - | | 26 | | - | | 26 | | 61 | | 87 | |
Total transactions with owners | | | | - | | - | | (1,744 | ) | (7,101 | ) | - | | (8,845 | ) | (3,546 | ) | (12,391 | ) |
Balance, December 31, 2012 | | | | 5,040 | | 1,073 | | (8,067 | ) | 48,572 | | 82 | | 46,700 | | 15,314 | | 62,014 | |
The accompanying notes to the consolidated financial statements form an integral part of these consolidated financial statements taken as a whole.
F - 10
TABLE OF CONTENTS
PERUSAHAAN PERSEROAN (PERSERO)
PT TELEKOMUNIKASI INDONESIA Tbk AND SUBSIDIARIES
CONSOLIDATED STATEMENTS OF CASH FLOWS
Years Ended December 31, 2010, 2011 and 2012
(Figures in tables are presented in billions of rupiah and
millions of U.S. dollar)
| Notes | | 2010 | | 2011 | | 2012 | |
| | | Rp | | Rp | | Rp | | US$ (Note 3) | |
CASH FLOWS FROM OPERATING ACTIVITIES | | | | | | | | | | |
Cash receipts from: | | | | | | | | | | |
Customers | | | 64,533 | | 67,469 | | 71,910 | | 7,461 | |
Other operators | | | 3,630 | | 3,586 | | 3,993 | | 414 | |
Total cash receipts from revenues | | | 68,163 | | 71,055 | | 75,903 | | 7,875 | |
Interest income received | | | 453 | | 599 | | 585 | | 61 | |
Cash payments for expenses | | | (25,288 | ) | (25,507 | ) | (33,651 | ) | (3,492 | ) |
Cash payments to employees | | | (8,993 | ) | (8,509 | ) | (8,162 | ) | (847 | ) |
Payments for income taxes | | | (5,829 | ) | (5,359 | ) | (5,586 | ) | (580 | ) |
Payments for interest costs | | | (1,826 | ) | (1,591 | ) | (1,111 | ) | (115 | ) |
Advance receipts from (refund to) customers | | | 386 | | (226 | ) | (37 | ) | (4 | ) |
Receipts of claim for tax refund | | | 659 | | - | | - | | - | |
Net cash provided by operating activities | | | 27,725 | | 30,462 | | 27,941 | | 2,898 | |
CASH FLOWS FROM INVESTING ACTIVITIES | | | | | | | | | | |
Proceeds from insurance claims | 11 | | - | | 13 | | 1,875 | | 195 | |
Proceeds from sale of property and equipment | 11 | | 12 | | 56 | | 360 | | 37 | |
Proceeds from sale of available-for-sale financial assets and dividends received | | | 31 | | 59 | | 53 | | 6 | |
Acquisition of property and equipment | 11 | | (14,918 | ) | (13,105 | ) | (8,221 | ) | (853 | ) |
Placement in time deposits and purchases of available-for-sale financial assets | 5 | | (6 | ) | (33 | ) | (4,008 | ) | (416 | ) |
Increase in advances for purchases of property and equipment | 12 | | (641 | ) | (834 | ) | (487 | ) | (51 | ) |
Acquisition of intangible assets | 13 | | (723 | ) | (604 | ) | (437 | ) | (45 | ) |
Acquisition of data center business | 1d | | - | | - | | (230 | ) | (24 | ) |
(Increase) decrease in advances and other non-current assets | 12 | | 88 | | 34 | | (134 | ) | (14 | ) |
Acquisition of long-term investments | 10 | | (115 | ) | - | | (49 | ) | (5 | ) |
Acquisition of non-controlling interests in subsidiaries | 1d | | (96 | ) | - | | (33 | ) | (3 | ) |
Payment for acquisition of subsidiaries, net of cash acquired | | | (116 | ) | - | | - | | - | |
Net cash used in investing activities | | | (16,484 | ) | (14,414 | ) | (11,311 | ) | (1,173 | ) |
CASH FLOWS FROM FINANCING ACTIVITIES | | | | | | | | | | |
Proceeds from loans and other borrowings | 17,18 | | 8,320 | | 3,589 | | 4,887 | | 507 | |
Capital contribution of non-controlling interests in subsidiaries | 1d | | - | | - | | 120 | | 12 | |
Cash dividends paid to the Company’s stockholders | 20 | | (5,418 | ) | (6,069 | ) | (7,127 | ) | (739 | ) |
Repayments of loans and other borrowings | 11,17,18 | | (9,098 | ) | (7,967 | ) | (5,843 | ) | (606 | ) |
Cash dividends paid to non-controlling interests of subsidiaries | | | (3,624 | ) | (3,033 | ) | (3,607 | ) | (374 | ) |
Payments for treasury stock | 22 | | - | | (2,059 | ) | (1,744 | ) | (181 | ) |
Net cash used in financing activities | | | (9,820 | ) | (15,539 | ) | (13,314 | ) | (1,381 | ) |
NET INCREASE IN CASH AND CASH EQUIVALENTS | | | 1,421 | | 509 | | 3,316 | | 344 | |
EFFECT OF EXCHANGE RATE CHANGES ON CASH AND CASH EQUIVALENTS | | | (106 | ) | 5 | | 168 | | 17 | |
CASH AND CASH EQUIVALENTS AT BEGINNING OF YEAR | 4 | | 7,805 | | 9,120 | | 9,634 | | 1,000 | |
CASH AND CASH EQUIVALENTS AT END OF YEAR | 4 | | 9,120 | | 9,634 | | 13,118 | | 1,361 | |
The accompanying notes to the consolidated financial statements form an integral part of these consolidated financial statements taken as a whole.
F - 11
PERUSAHAAN PERSEROAN (PERSERO)
PT TELEKOMUNIKASI INDONESIA Tbk AND SUBSIDIARIES
NOTES TO THE CONSOLIDATED FINANCIAL STATEMENTS
As of December 31, 2011 and 2012 and
for the years ended December 31, 2010, 2011 and 2012
(Figures in tables are presented in billions of rupiah, unless otherwise stated)
TABLE OF CONTENTS
1. GENERAL
a. Establishment and general information
Perusahaan Perseroan (Persero) PT Telekomunikasi Indonesia Tbk (the “Company”) was originally part of“Post en Telegraafdienst”, which was established and operated commercially in 1884 under the framework of Decree No. 7 dated March 27, 1884 of the Governor General of the Dutch Indies, which was published in State Gazette No. 52 dated April 3, 1884.
In 1991, the status of the Company was changed into a state-owned limited liability corporation (“Persero”) based on Government Regulation No. 25/1991. The ultimate parent of the Company is the Government of the Republic of Indonesia (the “Government”) (Notes 1c and 20).
The Company was established based on notarial deed No. 128 dated September 24, 1991 of Imas Fatimah, S.H. The deed of establishment was approved by the Minister of Justice of the Republic of Indonesia in his Decision Letter No. C2-6870.HT.01.01.Th.1991 dated November 19, 1991, and was published in State Gazette No. 5 dated January 17, 1992, Supplement No. 210. The Articles of Association has been amended several times, the latest amendment of which was, among others, about corporate actions that require written approval of the Board of Commissioners, based on notarial deed No. 30 dated June 7, 2012 of Ashoya Ratam, S.H., MKn. The amendments were accepted and approved by the Ministry of Law and Human Rights of the Republic of Indonesia (“MoLHR”) through its Letter No. AHU-AH.01.10-34558 dated September 24, 2012.
In accordance with Article 3 of the Company’s Articles of Association, the scope of its activities is to provide telecommunication network and services, informatics and optimization of the Company’s resources in accordance with prevailing regulations. To achieve this objective, the Company is involved in the following activities:
a. Main business:
i. Planning, building, providing, developing, operating, marketing or selling, leasing and maintaining telecommunications and information networks in accordance with prevailing regulations.
ii. Planning, developing, providing, marketing or selling and improving telecommunications and information services in accordance with prevailing regulations.
b. Supporting business:
i. Providing payment transactions and money transfer services through telecommunications and information networks.
ii. Performing activities and other undertakings in connection with the optimization of the Company's resources, which, among others, include the utilization of the Company's property and equipment and moveable assets, information systems, education and training, and repairs and maintenance facilities.
The Company’s head office is located at Jalan Japati No. 1, Bandung, West Java.
F - 12
PERUSAHAAN PERSEROAN (PERSERO)
PT TELEKOMUNIKASI INDONESIA Tbk AND SUBSIDIARIES
NOTES TO THE CONSOLIDATED FINANCIAL STATEMENTS
As of December 31, 2011 and 2012 and
for the years ended December 31, 2010, 2011 and 2012
(Figures in tables are presented in billions of rupiah, unless otherwise stated)
1. GENERAL (continued)
a. Establishment and general information (continued)
The Company was granted several telecommunications licenses which are valid for an unlimited period of time as long as the Company complies with prevailing laws and telecommunications regulations and fulfills the obligations stated in those permits. For every license, an evaluation is performed annually and an overall evaluation is performed every 5 (five) years. The Company is obliged to submit reports of services to the Indonesian Directorate General of Post and Informatics (“DGPI”) which replaced the previous Indonesian Directorate General of Post and Telecommunications (“DGPT”). The reports consist of information such as network development progress, service quality standard achievement, total customers, license payment and universal service contribution, while for internet telephone services for public purpose (“ITKP”), there is additional information required such as operational performance, customer segmentation, traffic, and gross revenue.
Details of these licenses are as follows:
License | | License No. | | Type of services | | Grant date/latestrenewal date | |
License to operate local fixed line and basic telephone services network | | 381/KEP/M.KOMINFO/10/2010 | | Local fixed line and basic telephone services network | | October 28, 2010 | |
License to operate fixed domestic long distance and basic telephone services network | | 382/KEP/M.KOMINFO/10/2010 | | Fixed domestic long distance and basic telephone services network | | October 28, 2010 | |
License to operate fixed international and basic telephone services network | | 383/KEP/M.KOMINFO/10/2010 | | Fixed international and basic telephone services network | | October 28, 2010 | |
License to operate fixed closed network | | 398/KEP/M.KOMINFO/11/2010 | | Fixed closed network | | November 12, 2010 | |
License to operate internet telephone services for public purpose | | 384/KEP/DJPT/M.KOMINFO/11/2010 | | ITKP | | November 29, 2010 | |
License to operate internet service provider | | 83/KEP/DJPPI/KOMINFO/4/2011 | | Internet service provider | | April 7, 2011 | |
License to operate data communication system services | | 169/KEP/DJPPI/KOMINFO/6/2011 | | Data communication system services | | June 6, 2011 | |
License to operate packet switched based local fixed line network | | 331/KEP/M.KOMINFO/07/2011 | | Packet switched based local fixed line network | | July 27, 2011 | |
F - 13
PERUSAHAAN PERSEROAN (PERSERO)
PT TELEKOMUNIKASI INDONESIA Tbk AND SUBSIDIARIES
NOTES TO THE CONSOLIDATED FINANCIAL STATEMENTS
As of December 31, 2011 and 2012 and
for the years ended December 31, 2010, 2011 and 2012
(Figures in tables are presented in billions of rupiah, unless otherwise stated)
TABLE OF CONTENTS
1. GENERAL (continued)
b. Company’s Boards of Commissioners and Directors, Audit Committee and Corporate Secretary
1. Boards of Commissioners and Directors
Based on resolutions made at (i) the Extraordinary General Meeting (“EGM”) of Stockholders of the Company dated December 17, 2010 as covered by notarial deed No. 33 of Dr. A. Partomuan Pohan, S.H., LLM., and (ii) the Annual General Meeting (“AGM”) of Stockholders of the Company dated May 11, 2012 as covered by notarial deed No. 14 of Ashoya Ratam, S.H., MKn., the composition of the Company’s Boards of Commissioners and Directors as of December 31, 2011 and 2012, respectively, was as follows:
| | 2011 | | 2012 | |
President Commissioner | | Jusman Syafii Djamal | | Jusman Syafii Djamal | |
Commissioner | | Bobby A.A Nazief | | Parikesit Suprapto | |
Commissioner | | Mahmuddin Yasin | | Hadiyanto | |
Independent Commissioner | | Rudiantara | | Virano Gazi Nasution | |
Independent Commissioner | | Johnny Swandi Sjam | | Johnny Swandi Sjam | |
President Director | | Rinaldi Firmansyah | | Arief Yahya | |
Director of Finance | | Sudiro Asno | | Honesti Basyir | |
Director of Network and Solution | | Ermady Dahlan | | Rizkan Chandra | |
Director of Enterprise and Wholesale | | Arief Yahya | | Muhammad Awaluddin | |
Director of Consumer | | I Nyoman Gede Wiryanata | | Sukardi Silalahi | |
Director of Compliance and Risk Management | | Prasetio | | Ririek Adriansyah | |
Director of Information Technology Solution & Strategic Portfolio | | Indra Utoyo | | Indra Utoyo | |
Director of Human Capital and General Affairs | | Faisal Syam | | Priyantono Rudito | |
2. Audit Committee and Corporate Secretary
The composition of the Company’s Audit Committee and the Corporate Secretary as of December 31, 2011 and 2012, were as follows:
| | 2011 | | 2012 | |
Chairman | | Rudiantara | | Johnny Swandi Sjam | |
Secretary | | Salam | | Salam | |
Member | | Bobby A.A Nazief | | Parikesit Suprapto | |
Member | | Agus Yulianto | | Agus Yulianto | |
Member | | Sahat Pardede | | Sahat Pardede | |
Member | | Johnny Swandi Sjam | | Virano Gazi Nasution | |
Corporate Secretary | | Agus Murdiyatno | | Agus Murdiyatno | |
F - 14
PERUSAHAAN PERSEROAN (PERSERO)
PT TELEKOMUNIKASI INDONESIA Tbk AND SUBSIDIARIES
NOTES TO THE CONSOLIDATED FINANCIAL STATEMENTS
As of December 31, 2011 and 2012 and
for the years ended December 31, 2010, 2011 and 2012
(Figures in tables are presented in billions of rupiah, unless otherwise stated)
TABLE OF CONTENTS
1. GENERAL (continued)
c. Public offering of securities of the Company
The Company’s shares prior to its Initial Public Offering (“IPO”) totalled 8,400,000,000, consisting of 8,399,999,999 Series B shares and 1 Series A Dwiwarna share, and were 100% owned by the Government of the Republic of Indonesia (the “Government”). On November 14, 1995, 933,333,000 new Series B shares and 233,334,000 Series B shares owned by the Government were offered to the public through IPO and listed on the Indonesia Stock Exchange (“IDX”) (previously the Jakarta Stock Exchange and the Surabaya Stock Exchange) and 700,000,000 Series B shares owned by the Government were offered to the public and listed on the New York Stock Exchange (“NYSE”) and the London Stock Exchange (“LSE”), in the form of American Depositary Shares (“ADS”). There were 35,000,000 ADS and each ADS represented 20 Series B shares at that time.
In December 1996, the Government had a block sale of its 388,000,000 Series B shares, and in 1997, distributed 2,670,300 Series B shares as incentive to the Company’s stockholders who did not sell their shares within one year from the date of the IPO. In May 1999, the Government further sold 898,000,000 Series B shares.
To comply with Law No. 1/1995 on Limited Liability Companies, at the AGM of Stockholders of the Company on April 16, 1999, the Company’s stockholders resolved to increase the Company’s issued share capital by the distribution of 746,666,640 bonus shares through the capitalization of certain additional paid-in capital, which were distributed to the Company’s stockholders in August 1999. On August 16, 2007, Law No. 1/1995 on Limited Liability Companies was amended by the issuance of Law No. 40/2007 on Limited Liability Companies which became effective on the same date. Law No. 40/2007 had no effect on the public offering of the shares of the Company. The Company has complied with Law No. 40/2007.
In December 2001, the Government had another block sale of 1,200,000,000 shares or 11.9% of the total outstanding Series B shares. In July 2002, the Government sold a further block of 312,000,000 shares or 3.1% of the total outstanding Series B shares.
At the AGM of Stockholders of the Company held on July 30, 2004, the minutes of which are covered by notarial deed No. 26 of A. Partomuan Pohan, S.H., LLM., the Company’s stockholders approved the Company’s 2-for-1 stock split for Series A Dwiwarna and Series B shares. Series A Dwiwarna share with par value of Rp500 was split into 1 Series A Dwiwarna share with par value of Rp250 per share and 1 Series B share with par value of Rp250 per share. The stock split resulted in the increase of the Company’s authorized capital stock from 1 Series A Dwiwarna share and 39,999,999,999 Series B shares to 1 Series A Dwiwarna share and 79,999,999,999 Series B shares, and issued capital stock from 1 Series A Dwiwarna share and 10,079,999,639 Series B shares to 1 Series A Dwiwarna share and 20,159,999,279 Series B shares. After the stock split, each ADS represented 40 Series B shares.
F - 15
PERUSAHAAN PERSEROAN (PERSERO)
PT TELEKOMUNIKASI INDONESIA Tbk AND SUBSIDIARIES
NOTES TO THE CONSOLIDATED FINANCIAL STATEMENTS
As of December 31, 2011 and 2012 and
for the years ended December 31, 2010, 2011 and 2012
(Figures in tables are presented in billions of rupiah, unless otherwise stated)
TABLE OF CONTENTS
1. GENERAL (continued)
c. Public offering of securities of the Company (continued)
During the EGM of Stockholders of the Company on December 21, 2005, the AGM of Stockholders of the Company on June 29, 2007, the AGM of Stockholders of the Company on June 20, 2008, and the AGM of Stockholders of the Company on May 19, 2011, the Company’s stockholders approved phase I, II, III and IV plan, respectively, to repurchase the Company’s issued Series B shares (Note 22). As of December 31, 2012, all of the Company’s Series B shares were listed on the IDXand 54,942,205 ADS shares were listed on the NYSE and LSE (Note20).
As of December 31, 2012, the Company’s outstanding bonds which were the second rupiah bonds issued on June 25, 2010 with a nominal amount of Rp1,005 billion for a five-year period and Rp1,995 billion for a ten-year period for Series A and Series B, respectively, were listed on the IDX (Note 18b).
d. Subsidiaries
As of December 31, 2011 and 2012, the Company has consolidated the following directly or indirectly owned subsidiaries (Notes 2b and 2d):
(i) Direct subsidiaries:
| | Nature of business/ date of incorporation oracquisition by the | | Date of commercial | | Percentage of ownership interest | | Total assets before elimination | |
Subsidiary/place of incorporation | | Company | | operation | | 2011 | | 2012 | | 2011 | | 2012 | |
PT Telekomunikasi Selular (“Telkomsel”), Jakarta, Indonesia | | Telecommunication -provides telecommunication facilities and mobile cellular services using Global System for Mobile Communication (“GSM”) technology/ May 26, 1995 | | 1995 | | 65 | | 65 | | 58,657 | | 62,843 | |
PT Dayamitra Telekomunikasi (“Dayamitra”), Jakarta, Indonesia | | Telecommunication/ May 17, 2001 | | 1995 | | 100 | | 100 | | 3,264 | | 4,931 | |
PT Multimedia Nusantara (“Metra”), Jakarta, Indonesia | | Multimedia and line telecommunication services/ May 9, 2003 | | 1998 | | 100 | | 100 | | 1,949 | | 3,394 | |
PT Telekomunikasi Indonesia International (“TII”), Jakarta, Indonesia | | Telecommunication/ July 31, 2003 | | 1995 | | 100 | | 100 | | 2,279 | | 2,440 | |
PT Pramindo Ikat Nusantara (“Pramindo”), Jakarta, Indonesia | | Telecommunication construction and services/ August 15, 2002 | | 1995 | | 100 | | 100 | | 1,838 | | 1,202 | |
PT Indonusa Telemedia(“Indonusa”), Jakarta, Indonesia | | Pay television and content services/ May 7, 1997 | | 1997 | | 100 (including 0.46% ownership through Metra) | | 100 (including 0.46% ownership through Metra) | | 714 | | 771 | |
F - 16
PERUSAHAAN PERSEROAN (PERSERO)
PT TELEKOMUNIKASI INDONESIA Tbk AND SUBSIDIARIES
NOTES TO THE CONSOLIDATED FINANCIAL STATEMENTS
As of December 31, 2011 and 2012 and
for the years ended December 31, 2010, 2011 and 2012
(Figures in tables are presented in billions of rupiah, unless otherwise stated)
TABLE OF CONTENTS
1. GENERAL (continued)
d. Subsidiaries (continued)
(i) Direct subsidiaries:(continued)
| | Nature of business / dateof incorporation oracquisition | | Date of commercial | | Percentage of ownership interest | | Total assets before elimination | |
Subsidiary/place of incorporation | | by the Company | | operation | | 2011 | | 2012 | | 2011 | | 2012 | |
PT Graha Sarana Duta (“GSD”), Jakarta, Indonesia | | Leasing of offices and providing building management and maintenance services, civil consultant and developer/ April 25, 2001 | | 1982 | | 99.99 | | 99.99 | | 383 | | 622 | |
PT Napsindo Primatel Internasional (“Napsindo”), Jakarta, Indonesia | | Telecommunication - provides Network Access Point (NAP), Voice Over Data (VOD) and other related services/ December 29, 1998 | | 1999; ceased operations on January 13, 2006 | | 60 | | 60 | | 5 | | 5 | |
PT Telkom Akses (“Telkom Akses”), Jakarta, Indonesia | | Construction services and trade in the the field of telecommunication/ November 26, 2012 | | - | | - | | 100 | | - | | - | |
(ii)Indirect subsidiaries:
| | Nature of business / date of incorporation oracquisition | | Date of commercial | | Percentage of ownership interest | | Total assets before elimination | |
Subsidiary/place of incorporation | | by the Company | | operation | | 2011 | | 2012 | | 2011 | | 2012 | |
PT Sigma Cipta Caraka (“Sigma”), Tangerang,Indonesia | | Information technology service – system implementation and integration service, outsourcing andsoftware license maintenance/ May 1, 1987 | | 1988 | | 100 | | 100 | | 614 | | 1,012 | |
PT Infomedia Nusantara (“Infomedia”), Jakarta, Indonesia | | Data and information service – provides telecommunication information services and other information services in the form of print and electronic media and call center services/ September 22, 1999 | | 1984 | | 100 | | 100 | | 782 | | 982 | |
Telekomunikasi Indonesia International Pte. Ltd., Singapore | | Telecommunication/ December 6, 2007 | | 2008 | | 100 | | 100 | | 431 | | 522 | |
PT Telkom Landmark Tower (“TLT”), Jakarta, Indonesia | | Service for property, development and management/ February 1, 2012 | | 2012 | | - | | 55 | | - | | 150 | |
Telekomunikasi Indonesia International (TL) S.A., Timor Leste | | Telecommunication/ September 11, 2012 | | 2012 | | - | | 100 | | - | | 149 | |
F - 17
0PERUSAHAAN PERSEROAN (PERSERO)
PT TELEKOMUNIKASI INDONESIA Tbk AND SUBSIDIARIES
NOTES TO THE CONSOLIDATED FINANCIAL STATEMENTS
As of December 31, 2011 and 2012 and
for the years ended December 31, 2010, 2011 and 2012
(Figures in tables are presented in billions of rupiah, unless otherwise stated)
TABLE OF CONTENTS
1. GENERAL (continued)
d. Subsidiaries (continued)
(ii) Indirect subsidiaries:(continued)
| | Nature of business/ date of incorporation or acquisition by the | | Date of commercial | | Percentage of ownership interest | | Total assets before elimination | |
Subsidiary/place of incorporation | | Company | | operation | | 2011 | | 2012 | | 2011 | | 2012 | �� |
PT Finnet Indonesia (“Finnet”), Jakarta, Indonesia | | Banking data and communication/ October 31, 2005 | | 2006 | | 60 | | 60 | | 83 | | 113 | |
PT Administrasi Medika (“Ad Medika”), Jakarta, Indonesia | | Health insurance and administration services/ February 25, 2010 | | 2010 | | 75 | | 75 | | 83 | | 95 | |
PT Metra Plasa (“Metra Plasa”), Jakarta, Indonesia | | Website services/ April 9, 2012 | | 2012 | | - | | 60 | | - | | 95 | |
Telekomunikasi Indonesia International Ltd., Hong Kong | | Telecommunication/ December 8, 2010 | | 2010 | | 100 | | 100 | | 56 | | 95 | |
PT Metra-Net (“Metra-Net”), Jakarta, Indonesia | | Multimedia portal service/ April 17, 2009 | | 2009 | | 100 | | 100 | | 41 | | 33 | |
Telkomsel Finance B.V., (“TFBV”), Amsterdam, The Netherlands | | Finance - established in 2005 for the purpose of borrowing, lending and raising funds including issuance of bonds, promissory notes or debts/ February 7, 2005 | | 2005 | | 65 | | 65 | | 8 | | 8 | |
Telekomunikasi Selular Finance Limited (“TSFL”), Mauritius | | Finance - established to raise funds for the development of Telkomsel’s business through the issuance of debenture stock, bonds, mortgages or any other securities/ April 22, 2002 | | 2002 | | 65 | | 65 | | 0 | | 0 | |
Aria West International Finance B.V. (“AWI BV”), The Netherlands | | Established to engage in rendering services in the field of trade and finance services/ June 3, 1996 | | 1996; ceased operations on July 31, 2003 | | 100 | | 100 | | - | | - | |
PT Infomedia Solusi Humanika (“ISH”), Jakarta,Indonesia | | Established to engage in the services of distribution and supply of labor/ October 24, 2012 | | 2012 | | - | | 100 | | - | | - | |
PT Graha Yasa Selaras (“GYS”) | | Tourism service/ April 27, 2012 | | - | | - | | 51 | | - | | 7 | |
F - 18
PERUSAHAAN PERSEROAN (PERSERO)
PT TELEKOMUNIKASI INDONESIA Tbk AND SUBSIDIARIES
NOTES TO THE CONSOLIDATED FINANCIAL STATEMENTS
As of December 31, 2011 and 2012 and
for the years ended December 31, 2010, 2011 and 2012
(Figures in tables are presented in billions of rupiah, unless otherwise stated)
TABLE OF CONTENTS
1. GENERAL (continued)
d. Subsidiaries (continued)
(a) Metra
On April 2, 2012, based on notarial deed No. 03 dated April 2, 2012 of Utiek R. Abdurachman, S.H., MLI., MKn., Metra established PT Metra Plasa (“Metra Plasa”) with authorized capital of Rp50 million with issued and fully paid capital of Rp12.5 million.
On July 20, 2012, based on the Circular Resolution of Stockholders of Metra Plasa, as covered by notarial deed No. 1 of Utiek R. Abdurachman, S.H., MLI., MKn., dated October 1, 2012, Metra Plasa’s stockholders agreed on the following:
i. to increase Metra Plasa’s authorized capital from Rp50 million to Rp60 billion consisting of 6,000,000 shares with nominal value of Rp10,000 per share;
ii. to increase its issued and fully paid capital from Rp12.5 million owned 100% by Metra to Rp15.25 billion by issuing 1,523,750 additional shares with nominal value of Rp10,000 per share;
iii. from the issued new shares, 913,750 shares with total nominal value of Rp9 billion were subscribed by Metra while 610,000 shares with total nominal value of Rp6 billion were subscribed by eBay International AG at a premium totaling Rp78 billion. Metra’s ownership was diluted to 60% with the remaining 40% owned by eBay International AG.
On September 21, 2012, based on notarial deed No. 11 dated September 21, 2012 of N.M. Dipo Nusantara Pua Upa, S.H., MKn. which was approved by the MoLHR in its Letter No. AHU-50211.AH.01.01/2012 dated September 26, 2012, Metra established a company with Pelindo II, a related party of the Company, called PT Integrasi Logistik Cipta Solusi (“ILCS”) with 49% ownership. ILCS will engage in providing E-trade logistics services and other related services.
(b) TII
Based on the Circular Resolution of Stockholders of TII dated September 11, 2012, as covered by notarial deed No. 04 dated October 4, 2012 of Siti Safarijah, S.H., TII’s stockholders agreed to establish a subsidiary in Timor Leste named Telekomunikasi Indonesia International (“TL”) S.A. The subsidiary is currently engaged in providing telecommunication services.
(c) GSD
Based on notarial deed No. 71 of Kartono, S.H. dated December 27, 2011 which was approved by the MoLHR through its Decision Letter No. AHU-05281.AH.01.01/2012 dated February 1, 2012, GSD established a subsidiary, PT Telkom Landmark Tower (“TLT”), with Yayasan Kesehatan (“Yakes”), a related party of the Company, with 55% ownership. TLT is engaged in property development and management.
Based on notarial deed No. 48 dated February 7, 2012 of Sri Ahyani, S.H. which was approved by the MoLHR in its Letter No. AHU-22272.AH.01.01/2012 dated April 27, 2012, GSD established a subsidiary, PT Graha Yasa Selaras (“GYS”), with Yakes, a related party of the Company, with 51% ownership. GYS is engaged in tourism business. For the year ended December 31, 2012, GYS had no financial and operational activities.
F - 19
PERUSAHAAN PERSEROAN (PERSERO)
PT TELEKOMUNIKASI INDONESIA Tbk AND SUBSIDIARIES
NOTES TO THE CONSOLIDATED FINANCIAL STATEMENTS
As of December 31, 2011 and 2012 and
for the years ended December 31, 2010, 2011 and 2012
(Figures in tables are presented in billions of rupiah, unless otherwise stated)
TABLE OF CONTENTS
1. GENERAL (continued)
d. Subsidiaries (continued)
(d) Telkom Akses
On November 26, 2012, based on notarial deed No. 20 dated November 26, 2012 of Siti Safarijah, S.H. which was approved by the MoLHR in its Letter No. AHU-60691.AH.01.01/2012 dated November 28, 2012, the Company established a subsidiary, PT Telkom Akses (“Telkom Akses”), with 100% ownership. Telkom Akses will engage in providing construction services and trade in the field of telecommunication. For the year ended December 31, 2012, Telkom Akses had no financial and operational activities.
(e) Sigma
On June 29, 2012, based on notarial deed No.3 ofUtiek R. Abdurachman, S.H., MLI, MKn. dated August13, 2012, Sigma entered into a Sales Purchase Agreement to purchase 150,000 of PT Sigma Solusi Integrasi’s (“SSI’s”) shares or the equivalent of30% ofSSI’s total ownership, with a transaction value of Rp26 billion from the non-controlling interest. On July 19, 2012, Sigma settled the transaction. The difference between the acquisition cost and the carrying amount of the interest acquired amounting to Rp22 billion was recorded in retained earningspresented under the equity section of the consolidated statements of financial position.
On August 15, 2012, based on notarial deed of Ny. Bomantari Julianto, S.H. dated August 15, 2012, Sigma entered into a Conditional Sales Purchase Agreement with PT Bina Data Mandiri (“BDM”) to purchase a Data Center Business, with a transaction value of Rp230 billion, from BDM. Based on the closing agreement dated November 30, 2012, the identifiable assets arising from the acquisition consisted of land, buildings, machinery and equipment with total fair value amounting to Rp150 billion and intangible assets, which included customer contracts and backlog, with fair value amounting to Rp3 billion. The acquisition resulted in a goodwill amounting to Rp77 billion.
On September 17, 2012, based on notarial deed No. 10 of Utiek R. Abdurachman, SH., MLI., MKn. dated September 17, 2012, Sigma’s stockholders agreed to liquidate its subsidiary, PT Sigma Karya Sempurna (“SKS”), effective from September 17, 2012. The liquidation constitutes a process of internal restructuring of Sigma Group’s business. As of the issuance date of the consolidated financial statements, the District Court’s decision on the liquidation request is still in process.
(f) Infomedia
On October 24, 2012, based on notarial deed No. 15 of Zulkifli Harahap, S.H. dated October 24, 2012 which was approved by the MoLHR through its Decision Letter No. AHU-55715.AH.01.01/2012 dated October 30, 2012, Infomedia established a subsidiary called PT Infomedia Solusi Humanika (“ISH”) with 100% ownership. ISH is engaged in the services of distribution and supply of labor.
F - 20
PERUSAHAAN PERSEROAN (PERSERO)
PT TELEKOMUNIKASI INDONESIA Tbk AND SUBSIDIARIES
NOTES TO THE CONSOLIDATED FINANCIAL STATEMENTS
As of December 31, 2011 and 2012 and
for the years ended December 31, 2010, 2011 and 2012
(Figures in tables are presented in billions of rupiah, unless otherwise stated)
TABLE OF CONTENTS
1. GENERAL (continued)
d. Subsidiaries (continued)
(f) Infomedia (continued)
On December 17, 2012, based on notarial deed No. 231 dated December 17, 2012, of M. Kholid Artha, S.H. Infomedia purchased 3,555 shares of Balebat, a subsidiary of Infomedia, or the equivalent of 31.46% of Balebat’s total ownership, with a transaction value of Rp8.8 billion, from the non-controlling interests. The difference between the acquisition cost and the carrying amount of the interests acquired amounting to Rp1 billion is recorded inretained earningspresented under the equity section of the consolidated statements of financial position.
e. Authorization of the consolidated financial statements
The consolidated financial statements wereprepared and approvedfor issuanceby the Board of Directors onMarch 22, 2013.
2. SUMMARY OF SIGNIFICANT ACCOUNTING POLICIES
The consolidated financial statements of the Company and subsidiaries have been prepared in accordance withInternational Financial Reporting Standards (“IFRS”) as issued by theInternational Accounting Standards Board (“IASB”).
a. Basis of preparation of the financial statements
The consolidated financial statements, except for the consolidated statements of cash flows, are prepared on the accrual basis. The measurement basis used is historical cost, except for certain accounts which are measured using the basis mentioned in the relevant notes herein.
The consolidated statements of cash flows are prepared using the direct method and present the receipts and disbursements of cash and cash equivalents classified into operating, investing and financing activities.
Figures in the consolidated financial statements are presented and rounded to billions of Indonesian rupiah (“Rp”), unless otherwise stated.
b. Principles of consolidation
The consolidated financial statements include the assets and liabilities of the Company and subsidiaries in which the Company, directly or indirectly, has ownership of more than half of the voting power and has the ability to govern the financial and operating policies of the entity unless, in exceptional circumstances, it can be clearly demonstrated that such ownership does not constitute control, or the Company has the ability to control the entity, even though the ownership is less than or equal to half of the voting power. Subsidiaries are consolidated from the date on which effective control is obtained and are no longer consolidated from the date such control ceases.
F - 21
PERUSAHAAN PERSEROAN (PERSERO)
PT TELEKOMUNIKASI INDONESIA Tbk AND SUBSIDIARIES
NOTES TO THE CONSOLIDATED FINANCIAL STATEMENTS
As of December 31, 2011 and 2012 and
for the years ended December 31, 2010, 2011 and 2012
(Figures in tables are presented in billions of rupiah, unless otherwise stated)
TABLE OF CONTENTS
2. SUMMARY OF SIGNIFICANT ACCOUNTING POLICIES
(continued) b. Principles of consolidation (continued)
Non-controlling interests represent the portions of the profit and loss and net assets of the subsidiaries not attributable, directly or indirectly, to the Company. Profit or loss and each component of other comprehensive income(“OCI”)are attributed to the owners of the Company and to the non-controlling interests proportionally in accordance with their respective ownership interests in the subsidiaries. Non-controlling interests are presented under the equity section of the consolidated statements of financial position, separately from the owners of the Company’s equity. In the consolidated statements of compherensive income, total profit or loss and total comprehensive income that can be attributed to the owners of the Company and to the non-controlling interests are presented separately and not presented as income or expense.
Intercompany balances and transactions have been eliminated in the consolidated financial statements.
c. Transactions with related parties
The Company and subsidiaries have transactions with related parties. The definition of related parties used is in accordance with International Accounting Standards (“IAS”) 24,Related Party Disclosures. The party which is considered a related party is a person or entity that is related to the entity that is preparing its financial statements.
Key management personnel are identified as the persons having authority and responsibility for planning, directing and controlling the activities of the entity, directly or indirectly, including any director (whether executive or otherwise) of the Company and subsidiaries. The related party status extends to the key management of the subsidiaries to the extent they direct the operations of subsidiaries with minimal involvement from the Company’s management.
d. Business combinations
Business combination is accounted for using the acquisition method. The consideration transferred is measured at fair value, which is the aggregate of the fair value of the assets transferred, liabilities incurred or assumed and the equity instruments issued in exchange for control of the acquiree. Acquisition-related costs are expensed as incurred. The acquiree’s identifiable assets and liabilities are recognized at their fair values at the acquisition date.
F - 22
PERUSAHAAN PERSEROAN (PERSERO)
PT TELEKOMUNIKASI INDONESIA Tbk AND SUBSIDIARIES
NOTES TO THE CONSOLIDATED FINANCIAL STATEMENTS
As of December 31, 2011 and 2012 and
for the years ended December 31, 2010, 2011 and 2012
(Figures in tables are presented in billions of rupiah, unless otherwise stated)
TABLE OF CONTENTS
2. SUMMARY OF SIGNIFICANT ACCOUNTING POLICIES (continued)
d. Business combinations (continued)
Goodwill arising on acquisition is recognized as an asset and measured at cost representing the excess of the aggregate of the consideration, the amount of any non-controlling interests in the acquiree, and the fair value of the acquirer’s previously held equity interest in the acquiree, if any, over the net of the fair values of the identifiable assets and liabilities at the date of acquisition.
Non-controlling interests that entitle their holders to a proportionate share of the entity’s net assets in the event of liquidation may be initially measured either at fair value or at the non-controlling interest’s proportionate share of the recognized amounts of the acquiree’s identifiable net assets. The choice of the measurement basis is made on a transaction-by-transaction basis.
When the determination of consideration from a business combination includes contingent consideration, it is measured at its fair value on acquisition date. Contingent consideration is classified either as equity or a financial liability. Amounts classified as a financial liability are subsequently remeasured to fair value with changes in fair value recognized in profit or loss when adjustments are recorded outside the measurement period. Changes in the fair value of the contingent consideration that qualify as measurement-period adjustments are adjusted retrospectively, with corresponding adjustments made against goodwill. Measurement-period adjustments are adjustments that arise from additional information obtained during the measurement period, which cannot exceed one year from the acquisition date, about facts and circumstances that existed at the acquisition date.
For the purpose of impairment testing, assets are grouped at the lowest levels for which there are separately identifiable cash flows, known as cash-generating unit. If the recoverable amount of the cash-generating unit is less than the carrying amount of the unit, the impairment loss is allocated to reduce the carrying amount of any goodwill allocated to the unit and then to the other assets of the unit pro-rata on the basis of the carrying amount of the asset in the unit. Impairment losses recognized for goodwillmay not be reversed in the subsequent period.
Recoverable amount is the higher of fair value less costs to sell and value in use. Indetermining the value in use, the estimated future cash flowswhich are expected to be received are discounted to the present value using a pre-tax discount rate that reflects current market assessments of the time value of money and the risks specific to the asset for which the estimates of future cash flows have not been adjusted.
e. Cash and cash equivalents
Cash and cash equivalents consist of cash on hand and in banks and all unrestricted time deposits with an original maturity of three months or less at the time of placement.
Time deposits with maturities of more than three months but not more than one year, are presented as other current financial assets.
F - 23
PERUSAHAAN PERSEROAN (PERSERO)
PT TELEKOMUNIKASI INDONESIA Tbk AND SUBSIDIARIES
NOTES TO THE CONSOLIDATED FINANCIAL STATEMENTS
As of December 31, 2011 and 2012 and
for the years ended December 31, 2010, 2011 and 2012
(Figures in tables are presented in billions of rupiah, unless otherwise stated)
TABLE OF CONTENTS
2. SUMMARY OF SIGNIFICANT ACCOUNTING POLICIES (continued)
f. Investments in associated companies
Investments in companies where the Company or a subsidiary has 20% to 50% of the voting rights, and through which the Company or subsidiary exerts significant influence, but not control, over the financial and operating policies are accounted for using the equity method. Under this method, theCompany or subsidiary recognizes its proportionate share in the income or loss of the associated company from the date that significant influence commences until the date that significant influence ceases. When the Company or subsidiary’s share of loss exceeds the carrying amount of the investment in the associated company, the carrying amount is reduced to nil and recognition of further losses is discontinued except to the extent that the Company or subsidiary has incurred legal or constructive obligations or made payments on behalf of the associated company.
Investment in joint ventures is accounted for by the equity method, whereby the participation in a joint venture is initially recorded at cost and subsequently adjusted for changes in the share of the joint venture’s net assets that occurred after the acquisition.
The Companyor the subsidiary determines at each reporting date whether there is any objective evidence that the investment in the associated company is impaired.If there is, the Companyor the subsidiary calculates and recognizes the amount of impairment as the difference between the recoverable amount of the investment in the associated companyand its carrying value.
The investments are included in long-term investments in the consolidated statements of financial position.
g. Trade and other receivables
Trade and other receivables are recognized initially at fair value and subsequently measured at amortized cost, less provision for impairment. This provision for impairment is made based on management’s evaluation of the collectibility of the outstanding amounts. Receivables are written off in the year they are determined to be uncollectible.
h. Inventories
Inventories consist of components and modules, which are subsequently expensed or transferred to property and equipment upon use. Components and modules represent telephone terminals, cables, transmission installation spare parts and other spare parts. Inventories also include Subscriber Identification Module (“SIM”) cards, Removable User Identity Module (“RUIM”) cards, handsets, set top box, wireless broadband modem and blank prepaid voucher, which are expensed upon sale. The costs of inventories comprise of the purchase price, import duties, other taxes, transport, handling and other costs directly attributable to their acquisition. Inventories are stated at the lower of cost and net realizable value. Net realizable value is the estimate of selling price less the costs to sell.
F - 24
PERUSAHAAN PERSEROAN (PERSERO)
PT TELEKOMUNIKASI INDONESIA Tbk AND SUBSIDIARIES
NOTES TO THE CONSOLIDATED FINANCIAL STATEMENTS
As of December 31, 2011 and 2012 and
for the years ended December 31, 2010, 2011 and 2012
(Figures in tables are presented in billions of rupiah, unless otherwise stated)
TABLE OF CONTENTS
2. SUMMARY OF SIGNIFICANT ACCOUNTING POLICIES (continued)
h. Inventories(continued)
Cost is determined using the weighted average method for components, SIM cards, RUIM cards, handsets, set top box, wireless broadband modem and blank prepaid voucher, and the specific identification method for modules.
The amount of any write-down of inventories below cost to net realizable value and all losses of inventories are recognized as an expense in the year in which the write-down or loss occurs. The amount of any reversal of any write-down of inventories, arising from an increase in net realizable value, is recognized in the year in which the reversal occurs.
Provision for obsolescence is primarily based on the estimated forecast of future usage of these items.
i. Prepaid expenses
Prepaid expenses are amortized over their future beneficial periods using the straight-line method.
j. Assets held for sale
Assets (or disposal groups) are classified as assets held for sale when their carrying amount is to be recovered principally through a sale transaction rather than through continuing use and a sale is considered highly probable. They are stated at the lower of carrying amount and fair value less costs to sell.
Assets that meet the criteria to be classified as held for sale are reclassified from property and equipment and depreciation on such assets ceases.
k. Intangible assets
Intangible assets consist of intangible assets from subsidiaries or business acquisitions, license and computer software. Intangible assets are recognized if it is probable that the expected future economic benefits that are attributable to each asset will flow to the Company or subsidiaries and the cost of the asset can be reliably measured.
Intangible assets are stated at cost less accumulated amortization and impairment, if any. Intangible assets are amortized over their useful lives. The Company and subsidiaries estimate the recoverable value of their intangible assets. When the carrying amount of an asset exceeds its estimated recoverable amount, the asset is written down to its estimated recoverable amount.
Intangible assets are amortized using the straight-line method, based on the estimated useful lives of the assets as follows:
| Years | |
License | 10 | |
Other intangible assets | 2-20 | |
Intangible assets are derecognized when no further economic benefits are expected, either from further use or from disposal. The difference between the carrying amount and the net proceeds received from disposal is recognized in the consolidated statements of comprehensive income.
F - 25
PERUSAHAAN PERSEROAN (PERSERO)
PT TELEKOMUNIKASI INDONESIA Tbk AND SUBSIDIARIES
NOTES TO THE CONSOLIDATED FINANCIAL STATEMENTS
As of December 31, 2011 and 2012 and
for the years ended December 31, 2010, 2011 and 2012
(Figures in tables are presented in billions of rupiah, unless otherwise stated)
TABLE OF CONTENTS
1. SUMMARY OF SIGNIFICANT ACCOUNTING POLICIES (continued)
l. Property and equipment - direct acquisitions
Property and equipment directly acquired are stated at cost, less accumulated depreciation and impairment losses.
The cost of an item of fixed assets includes: (a) purchase price, (b) any costs directly attributable to bringing the asset to its location and condition and (c) the initial estimate of the costs of dismantling and removing the item and restoring the site on which it is located. Each part of an item of property and equipment with a cost that is significant in relation to the total cost of the item is depreciated separately.
Property and equipment are depreciated and amortized using the straight-line method, based on the estimated useful lives of the assets as follows:
| Years | |
Land rights | 50 | |
Buildings | 20-40 | |
Leasehold improvements | 3-7 | |
Switching equipment | 5-15 | |
Telegraph, telex and data communication equipment | 5-15 | |
Transmission installation and equipment | 5-25 | |
Satellite, earth station and equipment | 3-20 | |
Cable network | 5-25 | |
Power supply | 3-10 | |
Data processing equipment | 3-10 | |
Other telecommunications peripherals | 5 | |
Office equipment | 2-5 | |
Vehicles | 5-8 | |
Customer premise equipment | 10 | |
Other equipment | 5 | |
The depreciation method, useful life and residual value of an asset are reviewed at least at each financial year end and adjusted, if appropriate. The residual value of an asset is the estimated amount thatthe Company and subsidiaries would currently obtain from disposal of the asset, after deducting the estimated costs of disposal. If the assetis already of the age and in the condition expected at the end of its useful life, the Company and subsidiaries assign the residual value of Rp1 to the asset.
The Company and subsidiaries periodically evaluate their property and equipment for impairment, whenever events and circumstances indicate that the carrying amount of the assets may not be recoverable. When the carrying amount of an asset exceeds its estimated recoverable amount, the asset is written down to its estimated recoverable amount, which is determined based on the higher of its fair value less cost to sell and its value in use.
Property and equipment acquired in exchange for a non-monetary asset or for a combination of monetary and non-monetary assets are measured at fair values unless (i) the exchange transaction lacks commercial substance or (ii) the fair value of neither the assets received nor the assets given up can be measured reliably.
F - 26
PERUSAHAAN PERSEROAN (PERSERO)
PT TELEKOMUNIKASI INDONESIA Tbk AND SUBSIDIARIES
NOTES TO THE CONSOLIDATED FINANCIAL STATEMENTS
As of December 31, 2011 and 2012 and
for the years ended December 31, 2010, 2011 and 2012
(Figures in tables are presented in billions of rupiah, unless otherwise stated)
TABLE OF CONTENTS
2. SUMMARY OF SIGNIFICANT ACCOUNTING POLICIES (continued)
l. Property and equipment - direct acquisitions(continued)
Spare parts and servicing equipment are carried as inventory and recognized inprofit or lossas these are consumed. Major spare parts and stand-by equipment that are expected to be used for more than 12 months are recorded as part of property and equipment.
When assets are retired or otherwise disposed of, their cost and the related accumulated depreciation are derecognized from the consolidated statements of financial position, and the resulting gains or losses on their disposal or sale are recognized in the consolidated statements of comprehensive income.
Certain computer hardware can not be used without certain computer software. In such a case, the computer software is recorded as part of the computer hardware. If the computer software is independent from its computer hardware, it is recorded as part of intangible assets.
The cost of maintenance and repairs is charged to the consolidatedstatements of comprehensive incomeas this is incurred. Significant renewals and betterments are capitalized.
Property under construction is stated at cost. When the construction is completed, the cost is reclassified to the specific property and equipment account to which it relates. During the construction period until the property is ready for its intended use or sale, borrowing costs, which include interest expense and foreign currency exchange differences incurred on loans obtained to finance the construction of the asset, as long as the asset meets the definition of a qualifying asset, are capitalized in proportion to the average amount of accumulated expenditures during the year. Capitalization of borrowing cost ceases when the construction has been completed and the constructed asset is ready for its intended use.
Equipment temporarily unused is reclassified into equipment not used in operations and depreciated over its estimated useful life using straight-line method.
m. Leases
In determing whether an arrangement is, or contains, a lease, the Company and subsidiaries perform an evaluation over the substance of the arrangement. A lease is classified as a finance lease or operating lease based on the substance, not the form of the contract.Finance lease is recognized if the lease transfers substantially all the risks and rewards incidental to the ownership.
Assets and liabilities under a finance lease are recognized in the consolidated statements of financial position at amounts equal to the fair value of the leased assets or, if lower, the present value of the minimum lease payments. Any initial direct costs of the Company and subsidiaries are added to the amount recognized as an asset.
Minimum lease payments are apportioned between the finance charge and the reduction of the outstanding liability. The finance charge is allocated to each period during the lease term so as to produce a constant periodic rate of interest on the remaining balance of the liability. Contingent rents are charged as expenses in the year in which they are incurred.
Leased assets are depreciated using the same method with, and based on the useful lives as estimated for, directly acquired property and equipment. However, if there is no reasonable certainty that the Company and subsidiaries will obtain ownership by the end of the lease term, the leased assets are fully depreciated over the shorter of the lease terms and their economic useful lives.
Leasing arrangements that do not meet the above criteria are accounted for as operating leases for which payments are charged as an expense on the straight-line basis over the lease period.
F - 27
PERUSAHAAN PERSEROAN (PERSERO)
PT TELEKOMUNIKASI INDONESIA Tbk AND SUBSIDIARIES
NOTES TO THE CONSOLIDATED FINANCIAL STATEMENTS
As of December 31, 2011 and 2012 and
for the years ended December 31, 2010, 2011 and 2012
(Figures in tables are presented in billions of rupiah, unless otherwise stated)
TABLE OF CONTENTS
2. SUMMARY OF SIGNIFICANT ACCOUNTING POLICIES (continued)
n. Trade payables
Trade payables are obligations to pay for goods or services acquired from suppliers in the ordinary course of business. Trade payables are classified as current liabilities if payment is due within one year or less. If not, they are presented as non-current liabilities.
Trade payables are recognized initially at fair value and subsequently measured at amortized cost using the effective interest method.
o. Borrowings
Borrrowings are recognized initially at fair value, net of transaction costs incurred. Borrowings are subsequently carried at amortized cost; any difference between the proceeds (net of transaction costs) and the redemption value is recognized in the consolidated statements of comprehensive income over the period of the borrowings using the effective interest method.
Fees paid onobtaining loan facilities are recognized as transaction costs of the loan to the extent that it is probable that some or all of the facility will be drawn down. In this case, the fee is deferred until the drawdown occurs. To the extent there is no evidence that it is probable that some or all of the facility will be drawn down, the fee is capitalized as a pre-payment for liquidity services and amortized over the period of the facilitytowhichthe fee relates.
p. Foreign currency translation
The functional currency and the recording currency of the Company and subsidiaries is the Indonesian rupiah, except for the functional currency of Telekomunikasi Indonesia International Pte. Ltd., Hong Kong and Telekomunikasi Indonesia International Pte., Singapore whose accounting records are maintained in U.S. dollar. Transactions in foreign currencies are translated into Indonesian rupiah at the rates of exchange prevailing at transaction date. At the consolidated statement of financial position date, monetary assets and monetary liabilities denominated in foreign currencies are translated into Indonesian rupiah based on the buy and sell rates quoted by Reuters and prevailing at the consolidated statement of financial position date, as follows:
|
(in full amount) | |
| 2011 | | 2012 | |
| Buy | | Sell | | Buy | | Sell | |
United States dollar (“US$”) 1 | 9,060 | | 9,075 | | 9,630 | | 9,645 | |
Euro 1 | 11,706 | | 11,727 | | 12,721 | | 12,743 | |
Yen 1 | 116.69 | | 116.96 | | 111.65 | | 111.84 | |
F - 28
PERUSAHAAN PERSEROAN (PERSERO)
PT TELEKOMUNIKASI INDONESIA Tbk AND SUBSIDIARIES
NOTES TO THE CONSOLIDATED FINANCIAL STATEMENTS
As of December 31, 2011 and 2012 and
for the years ended December 31, 2010, 2011 and 2012
(Figures in tables are presented in billions of rupiah, unless otherwise stated)
2. SUMMARY OF SIGNIFICANT ACCOUNTING POLICIES (continued)
p. Foreign currency translation(continued)
The resulting foreign exchange gains or losses, realized and unrealized, are credited or charged to the consolidated statements of comprehensive income, except for foreign exchange differences incurred on borrowings during the construction of qualifying assets which are capitalized to the extent that the borrowings can be attributed to the construction of those qualifying assets (Note 2l).
q. Revenue and expense recognition
i. Fixed line telephone revenues
Revenues from fixed line installationsare deferred including incremental costs and recognized as income over the expected term of the customer relationships. Based on reviews of historical information and customer trends, the Companyhasdetermined the expected term of the customer relationshipsto be 10 years for each of the years presented. Revenues from usage charges are recognized as customers incur the charges. Monthly subscription charges are recognized as revenues when incurred by subscribers.
ii. Cellular and fixed wireless telephone revenues
Revenues from postpaid service, which consist of usage and monthly charges, are recognized as follows:
· Airtime and charges for value added services are recognized based on usage by subscribers.
· Monthly subscription charges are recognized as revenues when incurred by subscribers.
Revenues from prepaid card subscribers, which consist of the sale of starter packs (also known as SIM cards in the case of cellular and RUIM in the case of fixed wireless telephone and start-up load vouchers) and pulse reload vouchers, are recognized as follows:
· Sales of SIM and RUIM cards are recognized as revenue upon delivery of the starter packs to distributors, dealers or directly to customers.
· Sales of pulse reload vouchers (either bundled in starter packs or sold as separate items) are recognized initially as unearned income and recognized proportionately as usage revenue based on duration and total of successful calls made and the value added services used by the subscribers or the expiration of the unused stored value of the voucher.
· Unutilized promotional credits are netted against unearned income.
iii. Interconnection revenues
The revenues from network interconnection with other domestic and international telecommunications carriers are recognized monthly on the basis of the actual recorded traffic for the month. Interconnection revenues consist of revenues derived from other operator’s subscribers’ calls to the Company’s and subsidiary’s operator’s subscribers (incoming), and calls between subscribers of other operator made through the Company’s and subsidiary’s network (transit).
F - 29
PERUSAHAAN PERSEROAN (PERSERO)
PT TELEKOMUNIKASI INDONESIA Tbk AND SUBSIDIARIES
NOTES TO THE CONSOLIDATED FINANCIAL STATEMENTS
As of December 31, 2011 and 2012 and
for the years ended December 31, 2010, 2011 and 2012
(Figures in tables are presented in billions of rupiah, unless otherwise stated)
TABLE OF CONTENTS
2. SUMMARY OF SIGNIFICANT ACCOUNTING POLICIES (continued)
q. Revenue and expense recognition(continued)
iv. Data, internet and information technology services revenues
Revenues from data communication and internet are recognized based onservice activity and performance whichismeasured by duration of internet usage or based on the fixed amount charged depending on the arrangements with customers.
Revenues from sales, installation and implementation of computer software and hardware, computer data network installation service and installation are recognizedwhen the goods are delivered to customers or the installation takes place.
Revenue from computer software development service is recognized using the percentage-of-completion method.
v. Revenues from network
Revenues from network consist of revenues from leased lines and satellite transponder leases which are recognized over the period in which the services are rendered.
vi. Other telecommunication services revenues
Revenues from other telecommunications services consist ofRevenue-Sharing Arrangements (“RSA”), service concession arrangement and sales of other telecommunication services or goods.
The RSA are recorded in a manner similar to finance leases where the property and equipment and obligation under RSA are reflected on the consolidatedstatements of financial position. All revenues generated from the RSA are recorded as a component of revenues, while a portion of the investors’ share of the revenues from the RSA is recorded as finance costs, with the balance treated as a reduction of the obligation under RSA.
Universal Service Obligation (“USO”) compensation from construction activities to design, build and finance assets for the grantor is recognized on a stage-of-completion basis. Revenues from operating and maintainance activities in respect of the assets under the concession are recognized when the services are rendered.
In concession contract under USO, the Company and subsidiaries have contractual rights to receive considerations from the grantor. The Company and subsidiaries recognize a financial asset in the consolidated statements of financial position in consideration for the services they provide (designing, building, operation or maintenance of assets under concession). Such financial assets are recognized in the consolidated statements of financial position as Accounts Receivable, for the amount of the fair value of the infrastructure on initial recognition and subsequently at amortized cost. The receivable is settled by means of the grantor’s payments received. The financial income calculated on the basis of the effective interest rate is recognized as financing income.
Revenues from sales of other telecommunication services or goods are recognized upon completion of services and/or delivery of goods to customers.
vii. Multiple-element arrangements
Where two or more revenue-generating activities or deliverables are sold under a single arrangement, each deliverable that is considered to be a separate unit of accounting is accounted for separately. The total revenue is allocated to each separately identifiable component based on the relative fair value of each component and the appropriate revenue recognition criteria are applied to each component as described above.
F - 30
PERUSAHAAN PERSEROAN (PERSERO)
PT TELEKOMUNIKASI INDONESIA Tbk AND SUBSIDIARIES
NOTES TO THE CONSOLIDATED FINANCIAL STATEMENTS
As of December 31, 2011 and 2012 and
for the years ended December 31, 2010, 2011 and 2012
(Figures in tables are presented in billions of rupiah, unless otherwise stated)
TABLE OF CONTENTS
2. SUMMARY OF SIGNIFICANT ACCOUNTING POLICIES (continued)
q. Revenue and expense recognition(continued)
viii. Agency relationship
Revenues from an agency relationship are recorded based on the gross amount billed to the customers when the Company and subsidiaries act as principal in the sale of goods and services. Revenues are recorded based on the net amount retained (the amount paid by the customer less amount paid to the suppliers) because, in substance, the Company and subsidiaries have acted as agents and earned commission from the suppliers of the goods and services sold.
ix. Customer loyalty programme
The Company and subsidiaries operate a loyalty point programme, which allows customers to accumulate points for every multiple of certain usage of telecommunication services. The points can then be redeemed in the future for free or discounted products, provided other qualifying conditions are achieved.
Consideration received is allocated between the telecommunication services and the points issued, with the consideration allocated to the points equal to their fair value. Fair value of the points is determined based on historical information about redemption rate of award points. The fair value of the points issued is deferred and recognized as revenue when the points are redeemed or expired.
x. Expenses
Expenses are recognizedas these are incurred.
r. Employee benefits
i. Short-term employee benefits
All short-term employee benefits which consist of salaries and related benefits, vacation pay, incentives and other benefits are recognized as expense on undiscounted basis when employees have rendered service to the Company and subsidiaries.
ii. Pension and post-employment health care benefit plans
The net obligations in respect of the defined pension benefit and post-employment health care benefit plans are calculated at the present value of estimated future benefits that the employees have earned in return for their service in the current and prior periods, less the fair value of plan assets and adjusted for unrecognized actuarial gains or losses and unrecognized past service cost. The calculation is performed by an independent actuary using the projected unit credit method. The present value of the defined benefit obligation is determined by discounting the estimated future cash outflows using interest rates of government bonds that are denominated in the currency in which the benefits will be paid and that have terms to maturity approximating the terms of the related retirement benefit obligation. Government bonds are used as there are no deep markets for high quality corporate bonds.
The amount of prepaid pension costs recognized in the consolidated statements of financial position is limited to the total of (i) any unrecognized past service costs; and (ii) any reduction in future contribution to the plan.
F - 31
PERUSAHAAN PERSEROAN (PERSERO)
PT TELEKOMUNIKASI INDONESIA Tbk AND SUBSIDIARIES
NOTES TO THE CONSOLIDATED FINANCIAL STATEMENTS
As of December 31, 2011 and 2012 and
for the years ended December 31, 2010, 2011 and 2012
(Figures in tables are presented in billions of rupiah, unless otherwise stated)
TABLE OF CONTENTS
2. SUMMARY OF SIGNIFICANT ACCOUNTING POLICIES (continued)
r. Employee benefits(continued)
ii. Pension and post-employment health care benefit plans (continued)
Prior service cost is recognized immediately if vested or amortized over the vesting period. All other expenses related to the defined benefits are charged to personnel expenses in profit or loss.
Plan assets are assets that are held by the pension and post-employment health care benefit plans. These assets are measured at fair value at the end of the reporting period. The amount of prepaid pension costs that can be recognized is limited to the total of any unrecognized past service costs, unrecognized actuarial losses and the present value of economic benefits available in the form of refunds from the plan or reductions in future contributions to the plan.
For defined contribution plans, the regular contributions constitute net periodic costs for the year in which they are due and such are included in staff costs as they become payable.
iii. Long Service Awards (“LSA”) and Long Service Leave (“LSL”)
Employees of Telkomsel, a subsidiary, are entitled to receive certain cash awardsor certain numbers of days leave benefits based on length of service requirements. LSA are either paid at the time the employees reach certain anniversary dates during employment, or at the time of termination.LSL is either a certain number of days leave benefit or cash, subject to approval by management, provided to employee who has met the requisite number of years of service and a certain minimum age.
The obligations with respect to LSA and LSL are calculated by an independent actuary using the projected unit credit method.
iv. Early retirement benefits
Early retirement benefits are accrued at the time the Company makes a commitment to provide early retirement benefits as a result of an offer made in order to encourage voluntary redundancy. A commitment to a termination arises when, and only when, a detailed formal plan for the early retirement cannot be withdrawn.
v. Pre-retirement benefits
Employees of the Company are entitled to a benefit during a pre-retirement period in which they are inactive for 6 months prior to their normal retirement age of 56 years. During the pre-retirement period, the employees still receive benefits provided to active employees, which include, but are not limited to, regular salary, health care, annual leave, bonus and other benefits. Benefits provided to employees who enter pre-retirement period are calculated by an independent actuary using the projected unit credit method.
F - 32
PERUSAHAAN PERSEROAN (PERSERO)
PT TELEKOMUNIKASI INDONESIA Tbk AND SUBSIDIARIES
NOTES TO THE CONSOLIDATED FINANCIAL STATEMENTS
As of December 31, 2011 and 2012 and
for the years ended December 31, 2010, 2011 and 2012
(Figures in tables are presented in billions of rupiah, unless otherwise stated)
2. SUMMARY OF SIGNIFICANT ACCOUNTING POLICIES (continued)
r. Employee benefits(continued)
vi. Other post-employment benefits
Employees are entitled to home leave passage benefits and final housing facility benefits to their retirement age of 56 years. Those benefits are calculated by an independent actuary using the projected unit credit method.
Actuarial gains or losses arising from experience adjustments and changes in actuarial assumptionsare charged or credited toOCI. Such actuarial gains and losses are also immediately recognized in retained earnings and are not reclassified to profit or loss in subsequent periods.
Gains or losses on curtailment are recognized when there is a commitment to make a material reduction in the number of employees covered by a plan or when there is an amendment of defined benefit plan terms such as that a material element of future services to be provided by current employees will no longer qualify for benefits, or will qualify only for reduced benefits.
Gains or losses on settlement are recognized when there is a transaction that eliminates all further legal or constructive obligation for part or all of the benefits provided under a defined benefit plan.
s. Income tax
Current and deferred taxes arerecognized as income or an expense and included intheconsolidated statements of comprehensive income, except to the extent thatifthe tax arises from a transaction or event which is recognized directly in equity, the taxis recognized directly to equity.
The current tax assets and liabilities are measured at the amount expected to be recovered or paid using the tax rates and tax laws that have been enacted at each reporting date. Management periodically evaluates positions taken in tax returns with respect to situations in which applicable tax regulation is subject to interpretation. Where appropriate, management establishes provisions based on the amounts expected to be paid to the tax authorities.
The Company and subsidiaries recognize deferred tax assets and liabilities for temporary differences between the financial and tax bases of assets and liabilities at each reporting date and on tax losses carried forward, to the extent their future realization is probable. Deferred tax assets and liabilities are measured using enacted or substantively enacted tax rates and tax laws at each reporting date which are expected to apply to the taxable income in the years in which those temporary differences are expected to be recovered or settled.
Deferred tax assets and liabilities are offset in the consolidated statements of financial position, except if these are for different legal entities, in the same manner the current tax assets and liabilities are presented.
Amendment to taxation obligation is recorded when an assessment letter (“Surat Ketetapan Pajak” or “SKP”) is received or if appealed against, when the results of the appeal are determined. The additional taxes and penalty imposed through SKP are recognized as expense in profit or loss, unless objection/appeal action is taken. The additional taxes and penalty imposed through SKP are deferred as long as they meet the asset recognition criteria.
F - 33
PERUSAHAAN PERSEROAN (PERSERO)
PT TELEKOMUNIKASI INDONESIA Tbk AND SUBSIDIARIES
NOTES TO THE CONSOLIDATED FINANCIAL STATEMENTS
As of December 31, 2011 and 2012 and
for the years ended December 31, 2010, 2011 and 2012
(Figures in tables are presented in billions of rupiah, unless otherwise stated)
TABLE OF CONTENTS
2. SUMMARY OF SIGNIFICANT ACCOUNTING POLICIES (continued)
t. Financial instruments
The Company and subsidiaries classify financial instruments into financial assets and financial liabilities.Financial assets and liabilities are recognized initially at fair value including transaction costs. These are subsequently measured either at fair value or amortized cost using the effective interest method in accordance with their classification.
i. Financial assets
The Company and subsidiaries classify their financial assets as (i) financial assets at fair value through profit or loss, (ii) loans and receivables, (iii) held-to-maturity financial assets or (iv) available-for-sale financial assets. The
classification depends on the purpose for which the financial assets were acquired. Management determines the classification of financial assets at initial recognition.
Purchases or sales of financial assets that require delivery of assets within a time frame established by regulation or convention in the marketplace (regular way trades) are recognized on the trade date, i.e., the date that the Company and subsidiaries commit to purchase or sell the assets.
The Company’s financial assets include cash and cash equivalents, trade and other receivables,other current financial assets, long-term investments, advances and other non-current financial assets.
a. Financial assets at fair value through profit or loss
Financial assets at fair value through profit or loss are financial assets classified as held for trading. A financial asset is classified as held for trading if it is acquired principally for the purpose of selling or repurchasing it in the near term and for which there is evidence of a recent actual pattern of short-term profit taking.Gains or losses arising from changes in fair value of the trading securities are presented as either other income or other expenses in the consolidated statements of comprehensive income.
No financial assets were classified as financial assets at fair value through profitor loss as of December 31, 2011 and 2012.
b. Loans and receivables
Loans and receivables are non-derivative financial assets with fixed or determinable payments that are not quoted in an active market. Loans and receivables consist of, among other assets,cash and cash equivalents,trade and other receivables, other current financial assets and other non-current financial assets.
These are initially recognized at fair value including transaction costs and subsequently measured at amortized cost, using the effective interest method.
c. Held-to-maturity financial assets
Held-to-maturity investments are non-derivative financial assets with fixed or determinable payments and fixed maturities which management has the positive intention and ability to hold to maturity, other than:
a) those that the Company upon initial recognition designates as at fair value through profit or loss;
b) those that the Company designates as available for sale; and
c) those that meet the definition of loans and receivables.
No financial assets were classified as held-to-maturity financial assets as of December 31, 2011 and 2012.
F - 34
PERUSAHAAN PERSEROAN (PERSERO)
PT TELEKOMUNIKASI INDONESIA Tbk AND SUBSIDIARIES
NOTES TO THE CONSOLIDATED FINANCIAL STATEMENTS
As of December 31, 2011 and 2012 and
for the years ended December 31, 2010, 2011 and 2012
(Figures in tables are presented in billions of rupiah, unless otherwise stated)
TABLE OF CONTENTS
2. SUMMARY OF SIGNIFICANT ACCOUNTING POLICIES (continued)
t. Financial instruments(continued)
i. Financial assets (continued)
d. Available-for-sale financial assets
Available-for-sale investments are non-derivative financial assets that are intended to be held for indefinite periods of time, which may be sold in response to needs for liquidity or changes in interest rates, exchange rates or that are not classified as loans and receivables, held-to-maturity investments or financial assets at fair value through profit or loss.Available-for-sale financial assets consist ofbonds and mutual funds whichare recorded asother current financial assets.
Available-for-sale securities are stated at fair value. Unrealized holding gains or losses on available-for-sale securities are excluded from income of the current period and are reported as a separate component in the equity section of the consolidated statements of financial position until realized. Realized gains or losses from the sale of available-for-sale securities are recognized in the consolidated statements of comprehensiveincome, and are determined on a specific-identification basis. A decline in the fair value of any available-for-sale securities below cost that is deemed to be significant or prolonged, is charged to the consolidated statements of comprehensive income. Significant decline in the fair value is evaluated against the original cost of the investment and prolonged decline inthefair value is evaluated against the period in which the fair value of the investment has been below its original cost.
ii. Financial liabilities
The Company and subsidiaries classify their financial liabilities as (i) financial liabilities at fair value through profit or loss or (ii) financial liabilities measured at amortized cost.
The Companyand subsidiaries’financial liabilities include trade and other payables, accrued expenses, loans and other borrowings which consist of short-term bank loans, obligations under finance leases, two-step loans, bonds and notes, and long-term bank loans.
a. Financial liabilities at fair value through profit or loss
Financial liabilities at fair value through profit or loss are financial liabilities classified as held for trading. A financial liability is classified as held for trading if it is incurred principally for the purpose of selling or repurchasing it in the near term and for which there is evidence of a recent actual pattern of short-term profit taking.
No financial liabilities were categorized as held for trading as of December 31, 2011 and 2012.
c. Financial liabilities measured at amortized cost
Financial liabilities that are not classified as at fair value through profit or loss fall into this category and are measured at amortized cost. Financial liabilities measured at amortized cost are, among other liabilities, trade and other payables, accrued expenses, loans and other borrowings.
F - 35
PERUSAHAAN PERSEROAN (PERSERO)
PT TELEKOMUNIKASI INDONESIA Tbk AND SUBSIDIARIES
NOTES TO THE CONSOLIDATED FINANCIAL STATEMENTS
As of December 31, 2011 and 2012 and
for the years ended December 31, 2010, 2011 and 2012
(Figures in tables are presented in billions of rupiah, unless otherwise stated)
TABLE OF CONTENTS
2. SUMMARY OF SIGNIFICANT ACCOUNTING POLICIES (continued)
t. Financial instruments(continued)
iii. Offsetting financial instruments
Financial assets and liabilities are offset and the net amount is reported in the consolidated statements of financial position when there is a legally enforceable right to offset the recognized amounts and there is an intention to settle them on a net basis, or realize the assets and settle the liabilities simultaneously.
iv. Fair value of financial instruments
Fair value is the amount for which an asset could be exchanged, or liability settled, in an arm’s length transaction between willing and knowledgeable parties.
The fair value of financial instruments that are traded in active markets at each reporting date is determined by reference to quoted market prices, without any deduction for transaction costs.
For financial instruments not traded in an active market, the fair value is determined using appropriate valuation techniques. Such techniques may include using recent arm’s length market transactions, reference to the current fair value of another instrument that is substantially the same and a discounted cash flow analysis or other valuation models.
An analysis of fair values of financial instruments and further details as to how they are measured are provided in Note 39.
v. Impairment of financial assets
The Company and subsidiaries assess the impairment of financial assets if there is objective evidence that a loss event has a negative impact on the estimated future cash flows of the financial assets. Impairment is recognized when the loss event can be reliably estimated. Losses expected as a result of future events, no matter how likely, are not recognized.
Impairment loss of financial assets carried at cost is measured as the difference between the assets’ carrying amount and the present value of estimated future cash flows discounted at the financial assets’ original effective interest rate. Cash flows relating to short-term receivables are not discounted if the effect of discounting is immaterial.
For loans and receivables carried at amortized cost, the Company and subsidiaries first assess whether objective evidence of impairment exists individually for financial assets that are individually significant, or collectively for financial assets that are not individually significant. If the Company and subsidiaries determine that no objective evidence of impairment exists for an individually assessed financial asset, whether significant or not, the asset is included in a group of financial assets with similar credit risk characteristics and the group is collectively assessed for impairment. Assets that are individually assessed for impairment and for which an impairment loss is, or continues to be, recognized are not included in a collective assessment of impairment.
When a decline in the fair value of an available-for-sale financial asset has been recognized inOCI and there is objective evidence that the asset is impaired, the cumulative loss that had been recognized inOCI is recognized in profit or loss as an impairment loss. The amount of the cumulative loss is the difference between the acquisition cost (net of any principal repayment and amortization) and current fair value, less any impairment loss on that financial asset previously recognized.
F - 36
PERUSAHAAN PERSEROAN (PERSERO)
PT TELEKOMUNIKASI INDONESIA Tbk AND SUBSIDIARIES
NOTES TO THE CONSOLIDATED FINANCIAL STATEMENTS
As of December 31, 2011 and 2012 and
for the years ended December 31, 2010, 2011 and 2012
(Figures in tables are presented in billions of rupiah, unless otherwise stated)
TABLE OF CONTENTS
2. SUMMARY OF SIGNIFICANT ACCOUNTING POLICIES (continued)
t. Financial instruments(continued)
vi. Derecognition of financial instrument
The Company and subsidiaries derecognize a financial asset when the contractual rights to the cash flows from the financial asset expire, or when the Company and subsidiaries transfer substantially all the risks and rewards of ownership of the financial asset.
The Company and subsidiaries derecognize a financial liability when the obligation specified in the contract is discharged or cancelled or expired.
u. Treasury stock
Reacquired Company shares of stock are accounted for at their reacquisition cost and classified as “Treasury Stock” and presented as a deduction to equity. The cost of treasury stock sold is accounted for using the weighted average method. The difference between the cost and the proceeds from the resale of treasury stock is credited to “Additional Paid-in Capital”.
v. Dividends
Dividend for distribution to the Company’s stockholders is recognized as a liability in the Company’s consolidated financial statements in the period in which the dividend is approved by the Company’s stockholders. The Company recognizes interim dividend as a liability based on the Board of Directors’ decision supported by the approval from the Board of Commissioners.
w. Basicand dilutedearnings per share and earnings per ADS
Basic earnings per share is computed by dividing profit for the year attributable to owners of the parent company by the weighted average number of shares outstanding during the year. Income per ADS is computed by multiplying the basic earnings per share by 40, the number of shares represented by each ADS.
The Company does not have potentially dilutive financialinstruments.
x. Segment information
The Company and subsidiaries' segment information is presented based upon identified operating segments. An operating segment is a component of an entity: a)that engages in business activities from which it may earn revenues and incur expenses (including revenues and expenses relating to transactions with other components of the same entity); b) whose operating results are regularly reviewed by the Company and subsidiaries’ chief operating decision maker (“CODM”) i.e., the Directors of the Company, to make decisions about resources to be allocated to the segment and assess its performance; and c) for which discrete financial information is available (Note 2z).
F - 37
PERUSAHAAN PERSEROAN (PERSERO)
PT TELEKOMUNIKASI INDONESIA Tbk AND SUBSIDIARIES
NOTES TO THE CONSOLIDATED FINANCIAL STATEMENTS
As of December 31, 2011 and 2012 and
for the years ended December 31, 2010, 2011 and 2012
(Figures in tables are presented in billions of rupiah, unless otherwise stated)
2. SUMMARY OF SIGNIFICANT ACCOUNTING POLICIES (continued)
y. Provisions
Provisions are recognized when the Company and subsidiaries have a present obligation (legal or constructive) as a result of a past event, and it is probable that an outflow of resources embodying economic benefits will be required to settle the obligation and a reliable estimate can be made of the obligation.
z. Changes in accounting estimate and disclosures
Segment information
In 2012, management decided to change the way it manages the Company's business portfolios from a product-based approach to a customer-centric approach, as part of the Company’s strategy to provide a one-stop solution to its customers. This resulted in a change in the Company’s organizational structure to accommodate decision-making and performance assessment based on a customer-centric approach. Consequently, the segment financial information presented to the Company's Chief Operational Decision Maker was amended to facilitate decision making on the new segments. The segment information disclosed in Note 35 for the year ended December 31, 2011 has been restated to conform with the presentation of segment information for the year ended December 31, 2012.
Estimated useful lives of property and equipment
In 2012, Telkomsel reassessed and changed the estimated useful lives of certain of its equipment to reflect the current expected usage and the physical wear and tear of the equipment. Refer to Note 11d for further details on the nature and effect of the change.
aa. Critical accounting estimates, judgments and assumptions
Estimates and judgments are continually evaluated and are based on historical experience and other factors, including expectations of future events that are believed to be reasonable under the circumstances.
The Company and subsidiaries make estimates and assumptions concerning the future. The resulting accounting estimates will, by definition, seldom equal the related actual results. The estimates and assumptions that have a significant risk of causing a material adjustment to the carrying amounts of assets and liabilities within the next financial year are addressed below.
i. Pension benefits
The present value of the pension benefit obligations depends on a number of factors that are determined on an actuarial basis using a number of assumptions. The assumptions used in determining the net cost (income) for pensions include the discount rate. Any changes in the assumptions will impact the carrying amount of the pension benefit obligations.
F - 38
PERUSAHAAN PERSEROAN (PERSERO)
PT TELEKOMUNIKASI INDONESIA Tbk AND SUBSIDIARIES
NOTES TO THE CONSOLIDATED FINANCIAL STATEMENTS
As of December 31, 2011 and 2012 and
for the years ended December 31, 2010, 2011 and 2012
(Figures in tables are presented in billions of rupiah, unless otherwise stated)
TABLE OF CONTENTS
2. SUMMARY OF SIGNIFICANT ACCOUNTING POLICIES (continued)
aa. Critical accounting estimates, judgments and assumptions (continued)
i. Pension benefits (continued)
The Company and subsidiaries determine the appropriate discount rate at the end of each reporting period. This is the interest rate that should be used to determine the present value of estimated future cash outflows expected to be required to settle the obligations. In determining the appropriate discount rate, the Company and subsidiaries consider the interest rates of government bonds that are denominated in the currency in which the benefits will be paid and that have terms to maturity approximating the terms of the related pension benefit obligations.
If there is an improvement in the ratings of such government bonds or a decrease in interest rates as a result of improving economic conditions, there could be a material impact on the discount rate used in determining the pension benefit obligations.
Other key assumptions for pension benefit obligations are based in part on current market conditions. Additional information is disclosed in Notes 32 and 33.
ii Estimating useful lives of property and equipment and intangible assets
The Company and subsidiaries estimate the useful lives of their property and equipment and intangible assets based on expected asset utilization, considering strategic business plans, expected future technological developments and market behavior. The estimates of useful lives of property and equipment are based on the Company and subsidiaries’ collective assessment of industry practice, internal technical evaluation and experience with similar assets.
The Company and subsidiaries review estimates of useful lives at least each financial year end which are updated if expectations differ from previous estimates due to physical wear and tear, technical or commercial obsolescence and legal or other limitations on the use of the assets. The amounts and timing of recorded expenses for any year will be affected by changes in these factors and circumstances. A change in the estimated useful lives of the property and equipment is a change in accounting estimate and is applied prospectively in the consolidated statements of comprehensive income at the date of the change and future periods.
Detail of nature and carrying amounts of property and equipment is disclosed in Note 11 and intangible assets in Note 13.
iii. Provision for impairment of receivables
The Company and subsidiaries assess whether there is objective evidence that trade and other receivables have been impaired at the end of each reporting period. Provision for impairment of receivables is calculated based on a review of the current status of existing receivables and historical collection experience. Such provisions are adjusted periodically to reflect actual and anticipated experiences.Detail of nature and carrying amounts of provision for impairment of receivables is disclosed in Note 6.
F - 39
PERUSAHAAN PERSEROAN (PERSERO)
PT TELEKOMUNIKASI INDONESIA Tbk AND SUBSIDIARIES
NOTES TO THE CONSOLIDATED FINANCIAL STATEMENTS
As of December 31, 2011 and 2012 and
for the years ended December 31, 2010, 2011 and 2012
(Figures in tables are presented in billions of rupiah, unless otherwise stated)
TABLE OF CONTENTS
2. SUMMARY OF SIGNIFICANT ACCOUNTING POLICIES (continued)
aa. Critical accounting estimates, judgments and assumptions(continued)
iv. Income taxes
Significant judgment is required in determining the provision for income taxes. There are various transactions and calculations for which the ultimate tax determination is uncertain and subject to interpretation. The Company and subsidiaries recognize liabilities for anticipated tax audit issues based on estimates of whether additional taxes will be due. Where the final tax outcome of these matters is different from the amounts that were initially recorded, such differences will impact the current and deferred income tax assets and liabilities in the period in which such determination is made. Detail of nature and carrying amounts of income tax is disclosed in Note 31.
v. Impairment of non-financial assets
The Company and subsidiaries annually assess whether goodwill is impaired. Other non-financial assets are reviewed for impairment whenever events or changes in circumstances indicate that the carrying amount of the asset exceeds its recoverable amount. The recoverable amount of an asset or a cash-generating unit (“CGU”) is determined based on the higher of its fair value less costs to sell and its value in use, calculated on the basis of management’s assumptions and estimates.
In determining valuein use, the Company and subsidiaries apply management judgment in establishing forecasts of future operating performance, as well as the selection of growth rates and discount rates. These judgments are applied based on the management’s understanding of historical information and expectations of future performance. Changing the key assumptions, including the discount rates or the growth rate assumptions in the cash flow projections, could materially affect the value in use calculations.
For the years ended December 31, 2011 and 2012, the Company recognized Rp563 billion and Rp247 billion, respectively, impairment loss on property and equipment, particularly pertaining to the fixed wireless services. A 1% increase in the discount rate used would result in an increase in impairment loss of approximately Rp907 billion and Rp458 billion, respectively. However, the recoverable amount of the fixed wireless CGU is most sensitive to whether management will be able to implement its plans, including the cost efficiency plan, such that it generates positive cash flows and returns to profitability as projected. If the performance of the fixed wireless CGU continues to decline or if management’s initiatives are not performing as expected in the next financial year, analysis will be required to assess whether there will be further impairment(Note 11c).
3. TRANSLATION OF RUPIAH INTO UNITED STATES DOLLAR
The consolidated financial statements are stated in Indonesian rupiah. The translations of the Indonesian rupiah amounts into U.S. dollar amounts are included solely for the convenience of the readers and have been made using the average of the market buy and sell rates of Rp9,637.5 to US$1 as published by Reuters on December 31, 2012. The convenience translations should not be construed as representations that the Indonesian rupiah amounts have been, could have been, or could in the future be, converted into United States dollar at this or any other rate of exchange.
F - 40
PERUSAHAAN PERSEROAN (PERSERO)
PT TELEKOMUNIKASI INDONESIA Tbk AND SUBSIDIARIES
NOTES TO THE CONSOLIDATED FINANCIAL STATEMENTS
As of December 31, 2011 and 2012 and
for the years ended December 31, 2010, 2011 and 2012
(Figures in tables are presented in billions of rupiah, unless otherwise stated)
4. CASH AND CASH EQUIVALENTS
| 2011 | | 2012 | |
Cash on hand | 6 | | 7 | |
Cash in banks | | | | |
Related parties | | | | |
Rupiah | | | | |
PT Bank Mandiri (Persero) Tbk (“Bank Mandiri”) | 687 | | 913 | |
PT Bank Negara Indonesia (Persero) Tbk (“BNI”) | 302 | | 284 | |
PT Bank Rakyat Indonesia (Persero) Tbk (“BRI”) | 101 | | 87 | |
Others | 18 | | 22 | |
| 1,108 | | 1,306 | |
Foreign currencies | | | | |
Bank Mandiri | 198 | | 222 | |
BNI | 48 | | 20 | |
Others | 2 | | 2 | |
| 248 | | 244 | |
Sub-total | 1,356 | | 1,550 | |
Third parties | | | | |
Rupiah | | | | |
Deutsche Bank AG (“DB”) | 31 | | 62 | |
PT Bank CIMB Niaga Tbk (”Bank CIMB Niaga”) | 12 | | 59 | |
Others (each below Rp50 billion) | 72 | | 95 | |
| 115 | | 216 | |
Foreign currencies | | | | |
PT Standard Chartered Bank (“SCB”) | 7 | | 112 | |
Others (each below Rp50 billion) | 62 | | 65 | |
| 69 | | 177 | |
Sub-total | 184 | | 393 | |
Total cash in banks | 1,540 | | 1,943 | |
Time deposits | | | | |
Related parties | | | | |
Rupiah | | | | |
BRI | 2,620 | | 2,883 | |
BNI | 2,418 | | 1,511 | |
PT Bank Tabungan Negara (Persero) Tbk (“BTN”) | 446 | | 401 | |
Bank Mandiri | 448 | | 312 | |
PT Bank Pembangunan Daerah Jawa Barat dan Banten Tbk (“Bank Jabar”) | 145 | | 170 | |
PT Bank Syariah Mandiri (“BSM”) | 77 | | 23 | |
Others | 32 | | 20 | |
| 6,186 | | 5,320 | |
Foreign currencies | | | | |
BRI | 299 | | 1,966 | |
Bank Mandiri | - | | 222 | |
BNI | 7 | | 112 | |
| 306 | | 2,300 | |
Sub-total | 6,492 | | 7,620 | |
F - 41
PERUSAHAAN PERSEROAN (PERSERO)
PT TELEKOMUNIKASI INDONESIA Tbk AND SUBSIDIARIES
NOTES TO THE CONSOLIDATED FINANCIAL STATEMENTS
As of December 31, 2011 and 2012 and
for the years ended December 31, 2010, 2011 and 2012
(Figures in tables are presented in billions of rupiah, unless otherwise stated)
4. CASH AND CASH EQUIVALENTS (continued)
| 2011 | | 2012 | |
Time deposits (continued) | | | | |
Third parties | | | | |
Rupiah | | | | |
PT Bank OCBC NISP Tbk (“OCBC NISP”) | - | | 400 | |
Citibank N.A. (“Citibank”) | - | | 400 | |
PT Bank Mega Tbk (“Bank Mega”) | 180 | | 335 | |
Bank CIMB Niaga | 11 | | 225 | |
PT Bank Tabungan Pensiunan Nasional Tbk | 190 | | 167 | |
PT Bank Bukopin Tbk (“Bank Bukopin”) | 181 | | 160 | |
PT Bank Muamalat Indonesia | 95 | | 153 | |
PT Bank Internasional Indonesia Tbk (“BII”) | 25 | | 120 | |
PT Pan Indonesia Bank Tbk | 90 | | 100 | |
PT Bank Danamon Indonesia Tbk (“Bank Danamon”) | 10 | | 61 | |
PT BankUOB Indonesia | 1 | | 60 | |
DB | 78 | | 31 | |
Others | 18 | | 15 | |
| 879 | | 2,227 | |
Foreign currencies | | | | |
SCB | 42 | | 804 | |
OCBC NISP | 641 | | 517 | |
Others | 34 | | - | |
| 717 | | 1,321 | |
Sub-total | 1,596 | | 3,548 | |
Total time deposits | 8,088 | | 11,168 | |
Grand Total | 9,634 | | 13,118 | |
Interest rates per annum on time deposits are as follows:
| 2011 | | 2012 | |
Rupiah | 2.85% - 9.25% | | 2.25% - 8.50% | |
Foreign currencies | 0.05% - 3.00% | | 0.05% - 3.50% | |
The related parties in which the Company and subsidiaries place their funds are state-owned banks. The Company and subsidiaries placed a majority of their cash and cash equivalents in these banks because they have the most extensive branch networks in Indonesia and are considered to be financially sound banks as they are owned by the State.
Refer to Note 34 for details of related party transactions.
F - 42
PERUSAHAAN PERSEROAN (PERSERO)
PT TELEKOMUNIKASI INDONESIA Tbk AND SUBSIDIARIES
NOTES TO THE CONSOLIDATED FINANCIAL STATEMENTS
As of December 31, 2011 and 2012 and
for the years ended December 31, 2010, 2011 and 2012
(Figures in tables are presented in billions of rupiah, unless otherwise stated)
TABLE OF CONTENTS
5.
OTHER CURRENT FINANCIAL ASSETS
| 2011 | | 2012 | |
Time deposits | | | | |
Related party | | | | |
BRI | - | | 1,650 | |
Third parties | | | | |
SCB | - | | 1,350 | |
OCBC NISP | - | | 1,000 | |
Sub-total | - | | 2,350 | |
Total time deposits | - | | 4,000 | |
Available-for-sale financial assets | | | | |
Related parties | | | | |
The Government | 140 | | 123 | |
State-owned enterprises | 110 | | 87 | |
PT Bahana Securities (“Bahana”) | 64 | | 48 | |
Sub-total | 314 | | 258 | |
Third parties | 47 | | 52 | |
Total available-for-sale financial assets | 361 | | 310 | |
Others | 12 | | 28 | |
Total | 373 | | 4,338 | |
Time deposits represent time deposits with maturities of more than three months but not more than one year, with interest ratesrangingfrom 6.25%to 6.75% per annum.
Refer to Note 34 for details of related party transactions.
6. TRADE AND OTHER RECEIVABLES
Trade and other receivables as of December 31, 2011 and 2012 consist of:
| 2011 | | 2012 | |
Trade receivables | 6,790 | | 7,270 | |
Provision for impairment of receivables | (1,732 | ) | (2,047 | ) |
Net | 5,058 | | 5,223 | |
Other receivables | 340 | | 190 | |
Provision for impairment of receivables | (5 | ) | (4 | ) |
Net | 335 | | 186 | |
Total trade and other receivables | 5,393 | | 5,409 | |
F - 43
PERUSAHAAN PERSEROAN (PERSERO)
PT TELEKOMUNIKASI INDONESIA Tbk AND SUBSIDIARIES
NOTES TO THE CONSOLIDATED FINANCIAL STATEMENTS
As of December 31, 2011 and 2012 and
for the years ended December 31, 2010, 2011 and 2012
(Figures in tables are presented in billions of rupiah, unless otherwise stated)
TABLE OF CONTENTS
6. TRADE AND OTHER RECEIVABLES (continued)
Trade receivables arise from services provided to both retail and non-retail customers, with details as follows:
a. By debtor
(i) Related parties
| 2011 | | 2012 | |
Government Agencies | 953 | | 1,232 | |
PT Patra Telekomunikasi Indonesia (“Patrakom”) | 31 | | 56 | |
PT Indosat Tbk (“Indosat”) | 36 | | 55 | |
PT Citra Sari Makmur (“CSM”) | 86 | | 51 | |
Others (each below Rp30 billion) | 52 | | 62 | |
Total | 1,158 | | 1,456 | |
Provision for impairment of receivables | (83 | ) | (72 | ) |
Net | 1,075 | | 1,384 | |
(ii) Third parties
| 2011 | | 2012 | |
Individual and business subscribers | 5,255 | | 5,494 | |
Overseas international carriers | 377 | | 320 | |
Total | 5,632 | | 5,814 | |
Provision for impairment of receivables | (1,649 | ) | (1,975 | ) |
Net | 3,983 | | 3,839 | |
Trade receivables from certain parties are presented net of the Company and subsidiaries’ liabilities to such parties due to the existence of a legal right of set-off in accordance with agreements with those parties.
b. By age
(i) Related parties
| 2011 | | 2012 | |
Up to 6 months | 869 | | 1,125 | |
7 to 12 months | 137 | | 248 | |
More than 12 months | 152 | | 83 | |
Total | 1,158 | | 1,456 | |
Provision for impairment of receivables | (83 | ) | (72 | ) |
Net | 1,075 | | 1,384 | |
F - 44
PERUSAHAAN PERSEROAN (PERSERO)
PT TELEKOMUNIKASI INDONESIA Tbk AND SUBSIDIARIES
NOTES TO THE CONSOLIDATED FINANCIAL STATEMENTS
As of December 31, 2011 and 2012 and
for the years ended December 31, 2010, 2011 and 2012
(Figures in tables are presented in billions of rupiah, unless otherwise stated)
6. TRADE AND OTHER RECEIVABLES (continued)
b. By age (continued)
(ii) Third parties
| 2011 | | 2012 | |
Up to 3 months | 3,153 | | 3,286 | |
More than 3 months | 2,479 | | 2,528 | |
Total | 5,632 | | 5,814 | |
Provision for impairment of receivables | (1,649 | ) | (1,975 | ) |
Net | 3,983 | | 3,839 | |
(iii) Aging of total trade receivables
| 2011 | | 2012 | |
| Gross | | Provision for impairment of receivables | | Gross | | Provision for impairment of receivables | |
Not past due | 3,024 | | 32 | | 3,174 | | 140 | |
Past due up to 3 months | 887 | | 139 | | 1,250 | | 157 | |
Past due more than 3 to 6 months | 981 | | 259 | | 455 | | 193 | |
Past due more than 6 months | 1,898 | | 1,302 | | 2,391 | | 1,557 | |
Total | 6,790 | | 1,732 | | 7,270 | | 2,047 | |
The Company and subsidiaries have made provision for impairment of receivables based on the collective account of historical impairment rates and individual account of their customers’ credit history. The Company and subsidiaries do not apply a distinction between related party and third party receivables in assessing amounts past due. AsofDecember 31, 2011 and 2012, the carrying amount of trade receivables of the Company and subsidiaries considered past due but not impaired amounted to Rp2,066 billion and Rp2,189 billion, respectively. Management has concluded that receivables past due but not impaired, along with trade receivables that are neither past due nor impaired, are due from customers with good credit history and are expected to be recoverable.
c. By currency
(i) Related parties
| 2011 | | 2012 | |
Rupiah | 1,115 | | 1,369 | |
U.S. dollar | 43 | | 87 | |
Total | 1,158 | | 1,456 | |
Provision for impairment of receivables | (83 | ) | (72 | ) |
Net | 1,075 | | 1,384 | |
F - 45
PERUSAHAAN PERSEROAN (PERSERO)
PT TELEKOMUNIKASI INDONESIA Tbk AND SUBSIDIARIES
NOTES TO THE CONSOLIDATED FINANCIAL STATEMENTS
As of December 31, 2011 and 2012 and
for the years ended December 31, 2010, 2011 and 2012
(Figures in tables are presented in billions of rupiah, unless otherwise stated)
6. TRADE AND OTHER RECEIVABLES (continued)
c. By currency (continued)
(ii) Third parties
| 2011 | | 2012 | |
Rupiah | 4,829 | | 5,087 | |
U.S. dollar | 802 | | 722 | |
Euro | 1 | | 3 | |
Hong Kong dollar | - | | 2 | |
Total | 5,632 | | 5,814 | |
Provision for impairment of receivables | (1,649 | ) | (1,975 | ) |
Net | 3,983 | | 3,839 | |
d. Movements in the provision for impairment of receivables
| 2011 | | 2012 | |
Beginning balance | 1,445 | | 1,732 | |
Provision recognized during the year | 856 | | 848 | |
Provision recognized during the year | (569 | ) | (533 | ) |
Ending balance | 1,732 | | 2,047 | |
The receivables written off are third-party trade receivables.
Management believes that the provision for impairment of receivables is adequate to cover losses on uncollectible trade receivables.
Certain trade receivables of the subsidiaries amounting to Rp1,344 billion have been pledged as collateral under lending agreements (Notes17 and18).
Refer to Note 34 for details of related party transactions.
7. INVENTORIES
| 2011 | | 2012 | |
Modules | 297 | | 316 | |
Components | 173 | | 183 | |
SIM cards, RUIM cards, set top box and blank prepaid vouchers | 238 | | 134 | |
Others (each below Rp50 billion) | 156 | | 94 | |
Total | 864 | | 727 | |
Provision for obsolescence | | | | |
Modules | (91 | ) | (96 | ) |
Components | (15 | ) | (51 | ) |
SIM cards, RUIM cards, set top box and blank prepaid vouchers | - | | (1 | ) |
Total | (106 | ) | (148 | ) |
Net | 758 | | 579 | |
F - 46
PERUSAHAAN PERSEROAN (PERSERO)
PT TELEKOMUNIKASI INDONESIA Tbk AND SUBSIDIARIES
NOTES TO THE CONSOLIDATED FINANCIAL STATEMENTS
As of December 31, 2011 and 2012 and
for the years ended December 31, 2010, 2011 and 2012
(Figures in tables are presented in billions of rupiah, unless otherwise stated)
TABLE OF CONTENTS
7. INVENTORIES (continued)
Movements in the provision for obsolescence are as follows:
| 2011 | | 2012 | |
Beginning balance | 83 | | 106 | |
Provision recognized during the year | 27 | | 67 | |
Inventories written off | (4 | ) | (25 | ) |
Ending balance | 106 | | 148 | |
Management believes that the provision is adequate to cover losses from declines in inventory value due to obsolescence.
The inventories recognized as expense and included in operations, maintenance, and telecommunication services expenses (Note 28) for the years ended December 31, 2010, 2011 and 2012 amounted to Rp1,022 billion, Rp818 billion and Rp633 billion, respectively.
Certain inventories of the subsidiaries amounting to Rp49 billion have been pledged as collateral under lending agreements (Notes 17 and 18).
As of December 31, 2011 and 2012, modules and components held by the Company and subsidiaries have been insured against fire, theft, and other specific risks with total sum insured amounting to Rp235 billion and Rp275 billion, respectively.
Management believes that the insurance coverage is adequate to cover potential losses from the above risks.
8. ADVANCES AND PREPAID EXPENSES
| 2011 | | 2012 | |
Frequency license (Notes 37c.i and 37c.iii) | 2,211 | | 2,563 | |
Prepaid rental | 530 | | 666 | |
Salaries | 201 | | 165 | |
Advances | 184 | | 120 | |
Others (each below Rp50 billion) | 168 | | 207 | |
Total | 3,294 | | 3,721 | |
Refer to Note 34 for details of related party transactions.
9. ASSET HELD FOR SALE
This account represents the carrying amount of Telkomsel’s equipment to be exchanged with equipment of Nokia Siemens Network Oy (“NSN Oy”) and PT Huawei Tech Investment (“PT Huawei”). The equipment will be used as part of the settlement for the exchanges of equipment from these companies.
In 2012, Telkomsel’s equipment units with net carrying amount of Rp791 billion were exchanged with the equipment of NSN Oy and PT Huawei (Note 11d.vi). The cost of the acquired equipment is measured at the aggregate of the carrying amount of the equipment given up and the amount of cash paid.
Asset held for sale is presented under personal segment (Note 35).
F - 47
PERUSAHAAN PERSEROAN (PERSERO)
PT TELEKOMUNIKASI INDONESIA Tbk AND SUBSIDIARIES
NOTES TO THE CONSOLIDATED FINANCIAL STATEMENTS
As of December 31, 2011 and 2012 and
for the years ended December 31, 2010, 2011 and 2012
(Figures in tables are presented in billions of rupiah, unless otherwise stated)
TABLE OF CONTENTS
10. LONG-TERM INVESTMENTS
| 2011 | |
| Percentage of ownership | | Beginning balance | | Share of net (loss) profit of associated companies | | Dividend | | Translation adjustment | | Ending balance | |
Long-term investments in associated companies: | | | | | | | | | | | | |
Scicoma | 29.71 | | 109 | | (1 | ) | (7 | ) | (0 | ) | 101 | |
PT Melon Indonesia (“Melon”)d | 51.00 | | 51 | | (7 | ) | - | | - | | 44 | |
Patrakomc | 40.00 | | 40 | | 4 | | (1 | ) | - | | 43 | |
CSMe | 25.00 | | 33 | | (6 | ) | - | | (1 | ) | 26 | |
PSNf | 22.38 | | - | | - | | - | | - | | - | |
Sub-total | | | 233 | | (10 | ) | (8 | ) | (1 | ) | 214 | |
Other long-term investments | | | 21 | | - | | - | | - | | 21 | |
Total long-term investments | | | 254 | | (10 | ) | (8 | ) | (1 | ) | 235 | |
| 2011 | |
| Assets | | Liabilities | | Revenue | | Profit (loss) | |
Long-term investments in associated companies: | | | | | | | | |
Scicoma | 193 | | 20 | | 390 | | 40 | |
Melond | 96 | | 10 | | 6 | | (14 | ) |
Patrakomc | 196 | | 88 | | 188 | | 11 | |
CSMe | 1,261 | | 1,023 | | 460 | | (24 | ) |
PSNf | 596 | | 1,517 | | 282 | | 1 | |
Total | 2,342 | | 2,658 | | 1,326 | | 14 | |
| 2012 | |
| Percentage of ownership | | Beginning balance | | Addition | | Share of net (loss) profit of associated companies | | Dividend | | Translation adjustment | | Ending balance | |
Long-term investments in associated companies: | | | | | | | | | | | | | | |
Scicoma | 29.71 | | 101 | | - | | (2 | ) | (8 | ) | 7 | | 98 | |
ILCSb | 49.00 | | - | | 49 | | (1 | ) | - | | - | | 48 | |
Patrakomc | 40.00 | | 43 | | - | | 5 | | (2 | ) | - | | 46 | |
Melond | 51.00 | | 44 | | - | | (2 | ) | - | | - | | 42 | |
CSMe | 25.00 | | 26 | | - | | (11 | ) | - | | 5 | | 20 | |
PSNf | 22.38 | | - | | - | | - | | - | | - | | - | |
Sub-total | | | 214 | | 49 | | (11 | ) | (10 | ) | 12 | | 254 | |
Other long-term investments | | | 21 | | - | | - | | - | | - | | 21 | |
Total long-term investments | | | 235 | | 49 | | (11 | ) | (10 | ) | 12 | | 275 | |
F - 48
PERUSAHAAN PERSEROAN (PERSERO)
PT TELEKOMUNIKASI INDONESIA Tbk AND SUBSIDIARIES
NOTES TO THE CONSOLIDATED FINANCIAL STATEMENTS
As of December 31, 2011 and 2012 and
for the years ended December 31, 2010, 2011 and 2012
(Figures in tables are presented in billions of rupiah, unless otherwise stated)
TABLE OF CONTENTS
10. LONG-TERM INVESTMENTS (continued)
| 2012 | |
| Assets | | Liabilities | | Revenue | | Profit (loss) | |
Long-term investments in associated companies: | | | | | | | | |
Scicoma | 223 | | 17 | | 399 | | 40 | |
ILCSb | 104 | | 7 | | 1 | | (3 | ) |
Patrakomc | 218 | | 102 | | 226 | | 12 | |
Melond | 89 | | 7 | | 10 | | (4 | ) |
CSMe | 1,168 | | 905 | | 403 | | (44 | ) |
PSNf | 590 | | 1,512 | | 292 | | 1 | |
Total | 2,392 | | 2,550 | | 1,331 | | 2 | |
|
aScicom is engaged in providing call center services in Malaysia. As of December 31, 2012, the fair value of the investment is Rp111 billion. The fair value is calculated by multiplying the number of shares by the published price quotation as of December 28, 2012 (MYR0.400). |
b ILCS will engage in providing E-trade logistics services and other related services. |
c Patrakom is engaged in providing satellite communication system services, related services and facilities to companies in the petroleum industry. |
d Melon is engaged in providing Digital Content Exchange Hub services (“DCEH”). As a result of the existence of substantive participating rights held by the other venturer over the significant financial and operating policies of Melon, Metra does not have control over Melon. |
e CSM is engaged in providing Very Small Aperture Terminal (“VSAT”), network application services and consulting services on telecommunications technology and related facilities. |
f PSN is engaged in providing satellite transponder leasing and satellite-based communication services in the Asia Pacific region. The Company’s share in losses of PSN has exceeded the carrying amount of its investment since 2001, accordingly, the investment value has been reduced to nil. |
11. PROPERTY AND EQUIPMENT
| December 31, 2010 | | Additions | | Deductions | | Reclassifications | | December 31, 2011 | |
At cost: | | | | | | | | | | |
Land rights | 817 | | 40 | | (14 | ) | (1 | ) | 842 | |
Buildings | 3,203 | | 149 | | (66 | ) | 131 | | 3,417 | |
Leasehold improvements | 601 | | 12 | | (5 | ) | 42 | | 650 | |
Switching equipment | 30,209 | | 113 | | (5,565 | ) | 794 | | 25,551 | |
Telegraph, telex and data communication equipment | 20 | | - | | - | | - | | 20 | |
Transmission installation and equipment | 74,217 | | 2,186 | | (829 | ) | 3,123 | | 78,697 | |
Satellite, earth station and equipment | 6,922 | | 72 | | - | | 75 | | 7,069 | |
Cable network | 24,939 | | 1,491 | | (698 | ) | 1,040 | | 26,772 | |
Power supply | 8,215 | | 466 | | (151 | ) | 755 | | 9,285 | |
Data processing equipment | 8,194 | | 366 | | (480 | ) | 346 | | 8,426 | |
Other telecommunications peripherals | 498 | | 6 | | (3 | ) | (27 | ) | 474 | |
Office equipment | 670 | | 95 | | (59 | ) | 47 | | 753 | |
Vehicles | 166 | | 3 | | (8 | ) | (29 | ) | 132 | |
Customer premise equipment | 22 | | - | | - | | - | | 22 | |
Other equipment | 108 | | 5 | | (1 | ) | - | | 112 | |
Property under construction: | | | | | | | | | | |
Buildings | 58 | | 149 | | - | | (67 | ) | 140 | |
Leasehold improvements | 91 | | 82 | | - | | (170 | ) | 3 | |
Switching equipment | - | | 1,852 | | - | | (1,782 | ) | 70 | |
Transmission installation and | | | | | | | | | | |
equipment | 289 | | 6,051 | | - | | (5,513 | ) | 827 | |
Satellite, earth station and equipment | 27 | | 164 | | - | | (170 | ) | 21 | |
Cable network | 6 | | 38 | | - | | (2 | ) | 42 | |
Power supply | 40 | | 704 | | - | | (714 | ) | 30 | |
Data processing equipment | 68 | | 510 | | - | | (506 | ) | 72 | |
Total | 159,380 | | 14,554 | | (7,879 | ) | (2,628 | ) | 163,427 | |
F - 49
PERUSAHAAN PERSEROAN (PERSERO)
PT TELEKOMUNIKASI INDONESIA Tbk AND SUBSIDIARIES
NOTES TO THE CONSOLIDATED FINANCIAL STATEMENTS
As of December 31, 2011 and 2012 and
for the years ended December 31, 2010, 2011 and 2012
(Figures in tables are presented in billions of rupiah, unless otherwise stated)
11. PROPERTY AND EQUIPMENT (continued)
| December 31, 2010 | | Additions | | Impairments | | Deductions | | Reclassifications | | December 31, 2011 | |
Accumulated depreciation and impairment losses: | | | | | | | | | | | | |
Land rights | 105 | | 18 | | - | | (1 | ) | (1 | ) | 121 | |
Buildings | 1,576 | | 104 | | 2 | | (66 | ) | 55 | | 1,671 | |
Leasehold improvements | 443 | | 64 | | - | | (5 | ) | - | | 502 | |
Switching equipment | 20,942 | | 2,701 | | - | | (5,325 | ) | (871 | ) | 17,447 | |
Telegraph, telex and data communication equipment | 17 | | - | | - | | - | | - | | 17 | |
Transmission installation and equipment | 30,422 | | 6,706 | | 320 | | (511 | ) | (1,560 | ) | 35,377 | |
Satellite, earth station and equipment | 3,621 | | 486 | | 176 | | - | | (148 | ) | 4,135 | |
Cable network | 15,685 | | 1,110 | | 39 | | (698 | ) | 992 | | 17,128 | |
Power supply | 3,834 | | 1,230 | | 12 | | (144 | ) | (59 | ) | 4,873 | |
Data processing equipment | 5,990 | | 1,134 | | 13 | | (479 | ) | (252 | ) | 6,406 | |
Other telecommunications peripherals | 370 | | 13 | | 1 | | (3 | ) | (27 | ) | 354 | |
Office equipment | 512 | | 68 | | - | | (59 | ) | 10 | | 531 | |
Vehicles | 139 | | 18 | | - | | (7 | ) | (30 | ) | 120 | |
Customer premise equipment | 7 | | 2 | | - | | - | | - | | 9 | |
Other equipment | 93 | | 6 | | - | | (1 | ) | - | | 98 | |
Total | 83,756 | | 13,660 | | 563 | | (7,299 | ) | (1,891 | ) | 88,789 | |
Net Book Value | 75,624 | | | | | | | | | | 74,638 | |
| December 31, 2011 | | Additions | | Deductions | | Reclassifications | | December 31, 2012 | |
At cost: | | | | | | | | | | |
Land rights | 842 | | 135 | | - | | (0 | ) | 977 | |
Buildings | 3,417 | | 98 | | (0 | ) | 272 | | 3,787 | |
Leasehold improvements | 650 | | 6 | | (3 | ) | 130 | | 783 | |
Switching equipment | 25,551 | | 91 | | (1,438 | ) | (371 | ) | 23,833 | |
Telegraph, telex and data communication equipment | 20 | | - | | - | | (1 | ) | 19 | |
Transmission installation and equipment | 78,697 | | 3,328 | | (1,484 | ) | 7,629 | | 88,170 | |
Satellite, earth station and equipment | 7,069 | | 35 | | - | | 163 | | 7,267 | |
Cable network | 26,772 | | 1,965 | | (244 | ) | (469 | ) | 28,024 | |
Power supply | 9,285 | | 194 | | (29 | ) | 984 | | 10,434 | |
Data processing equipment | 8,426 | | 329 | | (210 | ) | (10 | ) | 8,535 | |
Other telecommunications peripherals | 474 | | - | | - | | (192 | ) | 282 | |
Office equipment | 753 | | 60 | | (47 | ) | (71 | ) | 695 | |
Vehicles | 132 | | 6 | | (52 | ) | (15 | ) | 71 | |
Customer premise equipment | 22 | | - | | - | | - | | 22 | |
Other equipment | 112 | | 1 | | - | | (2 | ) | 111 | |
Property under construction: | | | | | | | | | | |
Buildings | 140 | | 381 | | - | | (315 | ) | 206 | |
Leasehold improvements | 3 | | 32 | | - | | (34 | ) | 1 | |
Switching equipment | 70 | | 883 | | - | | (953 | ) | - | |
Transmission installation and equipment | 827 | | 7,951 | | (1 | ) | (8,138 | ) | 639 | |
Satellite, earth station and equipment | 21 | | 125 | | | - | (146 | ) | - | |
Cable network | 42 | | 241 | | (42 | ) | 47 | | 288 | |
Power supply | 30 | | 909 | | - | | (827 | ) | 112 | |
Data processing equipment | 72 | | 502 | | - | | (508 | ) | 66 | |
Total | 163,427 | | 17,272 | | (3,550 | ) | (2,827 | ) | 174,322 | |
F - 50
PERUSAHAAN PERSEROAN (PERSERO)
PT TELEKOMUNIKASI INDONESIA Tbk AND SUBSIDIARIES
NOTES TO THE CONSOLIDATED FINANCIAL STATEMENTS
As of December 31, 2011 and 2012 and
for the years ended December 31, 2010, 2011 and 2012
(Figures in tables are presented in billions of rupiah, unless otherwise stated)
1
1. PROPERTY AND EQUIPMENT (continued)
| December 31, 2011 | | Additions | | Impairments | | Deductions | | Reclassifications | | December 31, 2012 | |
Accumulated depreciation and impairment losses: | | | | | | | | | | | | |
Land rights | 121 | | 18 | | - | | - | | - | | 139 | |
Buildings | 1,671 | | 130 | | - | | (0 | ) | (62 | ) | 1,739 | |
Leasehold improvements | 502 | | 63 | | - | | (3 | ) | 47 | | 609 | |
Switching equipment | 17,447 | | 2,071 | | - | | (1,112 | ) | (1,260 | ) | 17,146 | |
Telegraph, telex and data communication equipment | 17 | | 0 | | - | | - | | (1 | ) | 16 | |
Transmission installation and equipment | 35,377 | | 7,410 | | 153 | | (909 | ) | (27 | ) | 42,004 | |
Satellite, earth station and equipment | 4,135 | | 517 | | 94 | | - | | (62 | ) | 4,684 | |
Cable network | 17,128 | | 1,085 | | - | | (238 | ) | (485 | ) | 17,490 | |
Power supply | 4,873 | | 1,221 | | - | | (18 | ) | (94 | ) | 5,982 | |
Data processing equipment | 6,406 | | 1,052 | | - | | (165 | ) | (677 | ) | 6,616 | |
Other telecommunications peripherals | 354 | | 5 | | - | | - | | (99 | ) | 260 | |
Office equipment | 531 | | 65 | | - | | (14 | ) | (27 | ) | 555 | |
Vehicles | 120 | | 7 | | - | | (52 | ) | (14 | ) | 61 | |
Customer premise equipment | 9 | | 2 | | - | | - | | - | | 11 | |
Other equipment | 98 | | 5 | | - | | - | | (1 | ) | 102 | |
Total | 88,789 | | 13,651 | | 247 | | (2,511 | ) | (2,762 | ) | 97,414 | |
Net Book Value | 74,638 | | | | | | | | | | 76,908 | |
a. Gain on disposal or sale ofproperty and equipment
| 2010 | | 2011 | | 2012 | |
Proceeds from sale of property and equipment | 11 | | 56 | | 360 | |
Net book value | (7 | ) | (17 | ) | (144 | ) |
Exchange of property and equipment - net | - | | 24 | | - | |
Gain on disposal or sale of property and equipment | 4 | | 63 | | 216 | |
b. KSO assets ownership arrangements
(i) In accordance with the amended and restated KSO VII agreement with PT Bukaka Singtel International (“BSI”), the ownership rights to the acquired property and equipment in KSO VII were legally retained by BSI until the end of the KSO period which was on December 31, 2010. As of December 31, 2010, the net book value of these property and equipment was Rp710 billion. As of January 1, 2011, the legal rights over these property and equipment were transferred to the Company and such assets have been included in the balances above.
(ii) In accordance with the amended and restated KSO IV agreement with PT Mitra Global Telekomunikasi Indonesia (“MGTI”), the ownership rights to the acquired property and equipment in KSO IV were legally retained by MGTI until the end of the KSO period which was on December 31, 2010. As of December 31, 2010, the net book value of such property and equipment was Rp161 billion. As of January 1, 2011, the legal rights over these property and equipment were transferred to the Company, and such assets have been included in the balances above.
F - 51
PERUSAHAAN PERSEROAN (PERSERO)
PT TELEKOMUNIKASI INDONESIA Tbk AND SUBSIDIARIES
NOTES TO THE CONSOLIDATED FINANCIAL STATEMENTS
As of December 31, 2011 and 2012 and
for the years ended December 31, 2010, 2011 and 2012
(Figures in tables are presented in billions of rupiah, unless otherwise stated)
1
1. PROPERTY AND EQUIPMENT (continued)
c. Assets impairment
(i) As of December 31, 2011 and 2012, the CGUs that independently generated cash inflows were fixed wireline, fixed wireless, cellular and others. As of December 31, 2011 and 2012, there were indications of impairment in the fixed wireless CGU (presented as part of personal segment), which were mainly due to increased competition in the fixed wireless market that has resulted in lower average tariffs, declining active customers and declining Average Revenue Per User (“ARPU”). The Company assessed the recoverable value of the assets in the CGU and determined that assets for the fixed wireless CGU were impaired amounting to Rp563 billion and Rp247 billion at December 31, 2011 and 2012, respectively, which were recognized in the consolidated statements of comprehensive income under “Depreciation and amortization”. The recoverable amount has been determined based on value-in-use (“VIU”) calculations. These calculations used pre-tax cash flow projections approved by management covering a five-year period and with cash flows beyond the five-year period extrapolated using a perpetuity growth rate. The cash flow projections reflect management’s expectations of revenue, Earnings before Interest, Tax, Depreciation and Amortization (“EBITDA”) growth and operating cash flows on the basis that the fixed wireless CGU generates positive net cash flows from 2013. Management’s cash flow projection also incorporates its reasonable expectations for developments in macro economic conditions and market expectations for the Indonesian telecommunications industry. As of December 31, 2011 and 2012, management applied a pre-tax discount rate of 11.4% and 12.3%, respectively, derived from the Company’s post-tax weighted average cost of capital and benchmarked to externally available data. As of December 31, 2011 and 2012, the perpetuity growth rate used of 0% and 0.5%, respectively, assumes that subscriber numbers may continue to increase after five years, while average revenue per user may decline such that the long-term growth will not be significant.
If the performance of the fixed wireless CGU continues to decline or if management’s initiatives are not performing as expected in the next financial year, analysis will be required to assess whether there will be further impairment.
(ii) Management believes that there is no indication of impairment in the value of other CGUs as of December 31, 2011 and 2012.
d. Others
(i) Interest capitalized to property under construction amounted to Rp44 billion for the year ended December 31, 2012, while no interest was capitalized for 2010 and 2011. The capitalization rates used to determine the amount of borrowing costs eligible for capitalization ranged from 7.72%-9.75% for the year ended December 31, 2012.
(ii) No foreign exchange loss was capitalized as part of property under construction for the years ended December 31, 2010, 2011 and 2012.
(iii) On August 7, 2012, Telkom-3 Satellite with a total value of Rp1,606 billion was built and launched, but failed to reach its orbit. The carrying value of the satellite was charged to other expenses in the 2012 consolidated statement of comprehensive income. Telkom-3 Satellite was insured with coverage that was adequate to cover losses from the insured risks such as the event experienced by the Company. Insurance claim was made and the amount of insurance compensation amounting to Rp1,772 billion was agreed and approved by the insurer and recorded as part of other income in the 2012 consolidated statement of comprehensive income. In November 2012, the Company received the proceeds from the insurance claim.
F - 52
PERUSAHAAN PERSEROAN (PERSERO)
PT TELEKOMUNIKASI INDONESIA Tbk AND SUBSIDIARIES
NOTES TO THE CONSOLIDATED FINANCIAL STATEMENTS
As of December 31, 2011 and 2012 and
for the years ended December 31, 2010, 2011 and 2012
(Figures in tables are presented in billions of rupiah, unless otherwise stated)
1
1. PROPERTY AND EQUIPMENT (continued) d. Others (continued)
(iv) In 2012, Telkomsel decided to replace certain equipment units with net carrying amount of Rp1,037 billion, as part of a modernization program. Accordingly, Telkomsel changed the estimated useful lives of such equipment units resulting in additional depreciation expense of Rp534 billion that was charged to the 2012 consolidated statement of comprehensive income.
The impact of the change in the estimated useful lives of equipment in future periods is to decrease the profit before income tax as follows:
Years | | Amount |
2013 | | 131 |
2014 | | 84 |
In 2011, Telkomsel replaced certain equipment with net carrying amount of Rp189 billion. Accordingly, Telkomsel changed the estimated useful lives of such equipment units resulting in additional depreciation expense of Rp154 billion charged to the 2011 consolidated statement of comprehensive income. Telkomsel also derecognized part of the equipment with total cost of Rp584 billion. Upon derecognition, the equipment had been fully depreciated.
(v) In 2012, the estimated useful life of Telkomsel’s towers was changed from 10 years to 20 years to reflect the current expected usage and the physical wear and tear of the towers. The impact is a reduction of depreciation expense by Rp635 billion recognized in the 2012 consolidated statement of comprehensive income.
The impact of the change in the estimated useful life of the towers in future periods is to increase the profit before income tax as follows:
Years | | Amount |
2013 | | 606 |
2014 | | 565 |
2015 | | 469 |
2016 | | 301 |
2017 | | 92 |
In May 2011, the estimated useful life of Telkomsel’s equipment was changed from 10 years to 6 years to reflect its current economic life. The impact is an additional depreciation expense of Rp295 billion charged to the 2011 consolidated statement of comprehensive income.
In 2010, the estimated useful lives of the Company’s office and installation buildings, Submarine Cable Communication System/Fiber Optic Communication System and Antenna and Tower were changed and accounted for prospectively. The impact is a reduction in the amount of depreciation expense by Rp126 billion recognized in the 2010 consolidated statement of comprehensive income.
F - 53
PERUSAHAAN PERSEROAN (PERSERO)
PT TELEKOMUNIKASI INDONESIA Tbk AND SUBSIDIARIES
NOTES TO THE CONSOLIDATED FINANCIAL STATEMENTS
As of December 31, 2011 and 2012 and
for the years ended December 31, 2010, 2011 and 2012
(Figures in tables are presented in billions of rupiah, unless otherwise stated)
d. Others (continued)
(vi) Exchange of property and equipment
· In 2011, the Company and PT Industri Telekomunikasi Indonesia (“INTI”) signed Purchase Orders of Procurement and Installation Agreement for the Modernization of the Copper Cable Network through Optimization of Asset Copper Cable Network with Trade In/Trade Off (TITO) mode for STO Cengkareng, STO Gandaria and STO Injoko amounting to Rp96 billion, for STO Semanggi amounting to Rp44 billion, and for STO Kelapa Gading, STO Rawamangun, STO Slipi and STO Manyar amounting to Rp177 billion.
Up to December 31, 2012, the Company has derecognized the copper cable network asset with net book value of Rp6 billion and recorded the fiber optic network asset from the exchange transaction of Rp430 billion.
· In 2012, certain Telkomsel equipment units with net carrying amount of Rp1,686 billion were exchanged with equipment fromNSNOy and PT Huawei. Rp791 billion of the net carrying amount of the equipment exchanged relates to Telkomsel’s asset held for sale (Note 9).
The cost of the acquired equipment is measured at the aggregate of the carrying amount of the equipment given up and the amount of cash paid.
In 2011, certain Telkomsel equipment units with cost and net carrying amount of Rp1,730 billion and Rp547 billion, respectively, were exchanged with equipment fromNSNOy and PT Huawei with a total price of US$63 million.
(vii) The Company and subsidiaries own several pieces of land rights located throughout Indonesia with Building Use Rights (“Hak Guna Bangunan” or “HGB”) for a period of 20 - 45 years which will expire between 2012 and 2052. Management believes that there will be no issue in obtaining the extension of the land rights when they expire.
(viii) As of December 31, 2012, the Company and subsidiaries’ property and equipment except land rights were insured against fire, theft, earthquake and other specified risks. Total net carrying amount of assets insured amounted to Rp72,192 billion, which was covered by sum insured basis with a maximum loss claim of Rp9,523 billion, US$52 million, EURO1 million, SGD14 million and HKD2 million and on first loss basis of Rp6,118 billion including business recovery of Rp324 billion with Automatic Reinstatement of Loss Clause. In addition, Telkom-1 and Telkom-2 satellites were insured separately for US$9 million and US$33 million, respectively. Management believes that the insurance coverage is adequate to cover potential losses from the insured risks.
(ix) As of December 31, 2012, the percentage of completion of property under construction was around 36.15% of the total contract value, with estimated dates of completion of between January 2013 and March 2014. Management believes that there is no impediment to the completion of the construction in progress.
(x) All assets owned by the Company and certain subsidiaries have been pledged as collateral for bonds and Medium Term Notes (Note 18b). Certain property and equipment of the Company’s subsidiaries with gross carrying value amounting to Rp2,841 billion as of December 31, 2012 have been pledged as collateral for lending agreements (Notes 17a and 18c).
F - 54
PERUSAHAAN PERSEROAN (PERSERO)
PT TELEKOMUNIKASI INDONESIA Tbk AND SUBSIDIARIES
NOTES TO THE CONSOLIDATED FINANCIAL STATEMENTS
As of December 31, 2011 and 2012 and
for the years ended December 31, 2010, 2011 and 2012
(Figures in tables are presented in billions of rupiah, unless otherwise stated)
11. PROPERTY AND EQUIPMENT (continued)
d. Others (continued)
(xi) As of December 31, 2012, the cost of fully depreciated property and equipment of the Company and subsidiaries that are still used in operations amounted to Rp39,073 billion. The Company and subsidiaries are currently performing modernization of network assets to replace the fully depreciated property and equipment.
(xii) As of December 31, 2012, the fair values of land rights and buildings of the Company and subsidiaries, which are determined based on the sale value of the tax object (“Nilai Jual Objek Pajak” or “NJOP”) of the related land rights and buildings, amounted to Rp10,261 billion.
(xiii) The Company and Telkomsel entered into several agreements with PT Solusindo Kreasi Pratama, PT Prima Media Selaras, PT Naragita Dinamika Komunika, PT Profesional Telekomunikasi Indonesia, PT Tower Bersama Infrastructure Tbk and other tower providers to lease slot spaces in telecommunication towers for periods of 10 years each. The Company and Telkomsel may extend the lease periods based on mutual agreement with the parties. In addition, the Company and subsidiaries also have lease commitments for property and equipment under RSA arrangement and other leases for transmission installation and equipment, data processing equipment, office equipment, vehicles and CPE assets with the option to purchase certain leased assets at the end of the lease terms. Future minimum lease payments for assets under finance leases as of December 31, 2012 are as follows:
Years | | | |
2013 | | 652 | |
2014 | | 548 | |
2015 | | 398 | |
2016 | | 354 | |
2017 | | 334 | |
Thereafter | | 886 | |
Total minimum lease payments | | 3,172 | |
Interest | | (848 | ) |
Net present value of minimum lease payments | | 2,324 | |
Current maturities (Note 17b) | | (510 | ) |
Long-term portion (Note 18) | | 1,814 | |
F - 55
PERUSAHAAN PERSEROAN (PERSERO)
PT TELEKOMUNIKASI INDONESIA Tbk AND SUBSIDIARIES
NOTES TO THE CONSOLIDATED FINANCIAL STATEMENTS
As of December 31, 2011 and 2012 and
for the years ended December 31, 2010, 2011 and 2012
(Figures in tables are presented in billions of rupiah, unless otherwise stated)
12. ADVANCES AND OTHER NON-CURRENT ASSETS
Advances and other non-current assets as of December 31, 2011 and 2012 consist of:
| | 2011 | | 2012 | |
Prepaid rental - net of current portion (Note 8) | | 1,143 | | 1,367 | |
Advances for purchase of property and equipment | | 2,017 | | 775 | |
Deferred charges | | 435 | | 471 | |
Long-term trade receivables - net of current portion (Note 6) | | - | | 294 | |
Frequency license - net of current portion (Note 8) | | - | | 279 | |
Restricted cash | | 164 | | 217 | |
Security deposits | | 54 | | 103 | |
Equipment not used in operations - net | | 1 | | 0 | |
Others | | 3 | | 4 | |
Total | | 3,817 | | 3,510 | |
Prepaid rental pertains to leased line and telecommunication equipment and land and building under lease agreements with rental periods ranging from 1 to 25 years.
As of December 31, 2011 and 2012, deferred charges represent deferred RSA charges and deferred Indefeasible Right of Use (“IRU”) Agreement charges. As of December 31, 2011, deferred charges include land rights. Total deferred charges amortization expense for the years ended December 31, 2010, 2011 and 2012 amounted to Rp19 billion, Rp84 billion and Rp87 billion, respectively.
Long-term trade receivables represent receivables which aremeasured at amortized cost using the effective interestmethod, payable in installments over a 4 year-period, related to providing telecommunication access and services in rural areas (USO) (Note 26).
As of December 31, 2011 and 2012, restricted cash represents time deposits with original maturities of more than one year and cash pledged as collateral for bank guarantees for the USO contract (Note 26) and other contracts.
Refer to Note 34 for details of related party transactions.
F - 56
PERUSAHAAN PERSEROAN (PERSERO)
PT TELEKOMUNIKASI INDONESIA Tbk AND SUBSIDIARIES
NOTES TO THE CONSOLIDATED FINANCIAL STATEMENTS
As of December 31, 2011 and 2012 and
for the years ended December 31, 2010, 2011 and 2012
(Figures in tables are presented in billions of rupiah, unless otherwise stated)
13. INTANGIBLE ASSETS
(i) The changes in the carrying amount of goodwill, license and other intangible assets for the years ended December 31,2011 and 2012are as follows:
| Goodwill | | License | | Other intangible assets | | Total | |
Gross carrying amount: | | | | | | | | |
Balance, January 1, 2011 | 192 | | 812 | | 9,877 | | 10,881 | |
Additions - acquired separately: | | | | | | | | |
The Company’s software | - | | - | | 293 | | 293 | |
The subsidiaries’ software | - | | - | | 309 | | 309 | |
The subsidiaries’ license | - | | 1 | | - | | 1 | |
USO agreement | - | | - | | 1 | | 1 | |
Reclassifications | - | | 2 | | (105 | ) | (103 | ) |
Deductions | - | | - | | (7,603 | ) | (7,603 | ) |
Balance, December 31, 2011 | 192 | | 815 | | 2,772 | | 3,779 | |
Accumulated amortization: | | | | | | | | |
Balance, January 1, 2011 | (21 | ) | (250 | ) | (8,824 | ) | (9,095 | ) |
Amortization expense during the year | - | | (87 | ) | (429 | ) | (516 | ) |
Reclassifications | - | | (2 | ) | 22 | | 20 | |
Deductions | - | | - | | 7,603 | | 7,603 | |
Balance, December 31, 2011 | (21 | ) | (339 | ) | (1,628 | ) | (1,988 | ) |
Net Book Value | 171 | | 476 | | 1,144 | | 1,791 | |
Weighted-average amortization period | - | | 9.39 years | | 6.46 years | | | |
| Goodwill | | License | | Other intangible assets | | Total | |
Gross carrying amount: | | | | | | | | |
Balance, January 1, 2012 | 192 | | 815 | | 2,772 | | 3,779 | |
Additions - acquired separately: | | | | | | | | |
The Company’s software | - | | - | | 103 | | 103 | |
The subsidiaries’ software | - | | - | | 334 | | 334 | |
Acquisition of BDM’s Data Center (Note 1d) | 77 | | - | | 3 | | 80 | |
Reclassifications | - | | (749 | ) | 155 | | (594 | ) |
Deductions | - | | - | | (58 | ) | (58 | ) |
Balance, December 31, 2012 | 269 | | 66 | | 3,309 | | 3,644 | |
Accumulated amortization: | | | | | | | | |
Balance, January 1, 2012 | (21 | ) | (339 | ) | (1,628 | ) | (1,988 | ) |
Amortization expense during the year | - | | (6 | ) | (460 | ) | (466 | ) |
Reclassifications | - | | 314 | | (119 | ) | 195 | |
Deductions | - | | - | | 58 | | 58 | |
Balance, December 31, 2012 | (21) | | (31 | ) | (2,149) | | (2,201) | |
Net book value | 248 | | 35 | | 1,160 | | 1,443 | |
Weighted-average amortization period | - | | 10.43 years | | 7.21 years | | | |
F - 57
PERUSAHAAN PERSEROAN (PERSERO)
PT TELEKOMUNIKASI INDONESIA Tbk AND SUBSIDIARIES
NOTES TO THE CONSOLIDATED FINANCIAL STATEMENTS
As of December 31, 2011 and 2012 and
for the years ended December 31, 2010, 2011 and 2012
(Figures in tables are presented in billions of rupiah, unless otherwise stated)
13. INTANGIBLE ASSETS (continued)
(ii) Goodwill resulted from the acquisitionofthedata center businessofBDMby Sigmain 2012 (Note 1d),andacquisitions of Ad Medika in 2010, Indonusa in 2008 andSigma in 2008. Other intangible assets included land rights in 2012 and the acquisitions of Dayamitra, Pramindo, TII, KSO IV and KSO VII, and represented the rights to operate the business in the KSO areas. In accordance with the expiration of the KSO agreement (Note 11b), the gross carrying amount and the accumulated amortization of the intangible assets relating to the KSO have been derecognized.
(iii) The estimated annual amortization expense of other intangible assets from January 1, 2013 is approximately Rp441 billion. The remaining amortization periods of intangible assets, excluding land rights, range from 1 to 19 years.
(iv) The aggregate amounts of goodwill allocated to each CGU are as follows:
| 2011 | | 2012 | |
Sigma | 88 | | 88 | |
AdMedika | 82 | | 82 | |
Total | 170 | | 170 | |
Metra performed its annual impairment tests of those CGUs based on fair value less cost to sell using discounted cash flow projections. The impairment tests used management-approved cash flow projections covering a five-year period, and the following key assumptions:
| 2011 | | 2012 | |
| Sigma | | Ad Medika | | Sigma | | Ad Medika | |
Discount rate | 12.5% | | 12.1% | | 11.8% | | 11.5% | |
Perpetuity growth rate | 2% | | 2% | | 4.5% | | 4.5% | |
As of December 31, 2011 and 2012, no impairment charge was required for goodwill on acquisition of subsidiaries, with any reasonably possible changes to the key assumptions applied not likely to cause the carrying amount of the CGUs to exceed their recoverable amounts.
14. TRADE AND OTHER PAYABLES
Trade and other payables as of December 31, 2011 and 2012 consist of:
| 2011 | | 2012 | |
Trade payables | 8,317 | | 7,280 | |
Other payables | 38 | | 177 | |
Total trade and other payables | 8,355 | | 7,457 | |
F - 58
PERUSAHAAN PERSEROAN (PERSERO)
PT TELEKOMUNIKASI INDONESIA Tbk AND SUBSIDIARIES
NOTES TO THE CONSOLIDATED FINANCIAL STATEMENTS
As of December 31, 2011 and 2012 and
for the years ended December 31, 2010, 2011 and 2012
(Figures in tables are presented in billions of rupiah, unless otherwise stated)
14. TRADE AND OTHER PAYABLES (continued)
Trade payables to related parties and third parties as of December 31, 2011 and 2012 consist of:
| 2011 | | 2012 | |
Related parties | | | | |
Radio frequency usage charges, concession fees and USO charges | 409 | | 607 | |
Purchases of equipment, materials and services | 369 | | 414 | |
Payables to other telecommunications providers | 60 | | 20 | |
Sub-total | 838 | | 1,041 | |
Third parties | | | | |
Purchases of equipment, materials and services | 7,429 | | 6,035 | |
Payables to other telecommunications providers | 50 | | 204 | |
Sub-total | 7,479 | | 6,239 | |
Total | 8,317 | | 7,280 | |
Trade payables by currency are as follows:
| 2011 | | 2012 | |
Rupiah | 4,422 | | 4,146 | |
U.S. dollar | 3,883 | | 3,111 | |
Others | 12 | | 23 | |
Total | 8,317 | | 7,280 | |
Refer to Note 34 for details of related party transactions.
15. ACCRUED EXPENSES
| 2011 | | 2012 | |
Operations, maintenance and telecommunications services | 2,917 | | 2,917 | |
Salaries and benefits | 900 | | 1,491 | |
General, administrative and marketing | 805 | | 882 | |
Early retirement program (Note 27) | - | | 699 | |
Interest and bank charges | 168 | | 174 | |
Total | 4,790 | | 6,163 | |
Accruals under the early retirement program dated November 1, 2012 arose from the Decision No. PR.206.01/r.02/PD000/COP-B0010000/2012 of the Human Capital and General Affairs Director on early retirement program which was communicated to the employees on the same date. The Company estimated the accruals on the basis of the number of eligible employees that met the criteria stipulated in the Company’s regulation related to this program. Accrued early retirement benefits as of December 31, 2012 amounting to Rp699 billion were charged to the 2012 consolidated statement of comprehensive income (Note 27).
Refer to Note 34 for details of related party transaction.
F - 59
PERUSAHAAN PERSEROAN (PERSERO)
PT TELEKOMUNIKASI INDONESIA Tbk AND SUBSIDIARIES
NOTES TO THE CONSOLIDATED FINANCIAL STATEMENTS
As of December 31, 2011 and 2012 and
for the years ended December 31, 2010, 2011 and 2012
(Figures in tables are presented in billions of rupiah, unless otherwise stated)
16. UNEARNED INCOME
| 2011 | | 2012 | |
Prepaid pulse reload vouchers | 2,526 | | 2,352 | |
Other telecommunications services | 153 | | 132 | |
Others | 142 | | 245 | |
Total | 2,821 | | 2,729 | |
17. SHORT-TERM LOANS AND OTHER BORROWINGS
Short-term loans and other borrowings consist of short-term bank loans and current maturities of long-term liabilities, as follows:
| 2011 | | 2012 | |
Short-term bank loans | 100 | | 37 | |
Current maturities of long-term liabilities | 4,813 | | 5,621 | |
Total | 4,913 | | 5,658 | |
a. Short-term bank loans
| | | | 2011 | | 2012 | |
| | | | Outstanding | | Outstanding | |
Lenders | | Currency | | Original currency (in millions) | | Rupiah equivalent | | Original currency (in millions) | | Rupiah equivalent | |
Bank CIMB Niaga | | Rp | | - | | 45 | | - | | 20 | |
Others | | Rp | | - | | 55 | | - | | 13 | |
| | US$ | | - | | - | | 0.42 | | 4 | |
Total | | | | | | 100 | | | | 37 | |
Refer to Note 34 for details of related party transactions.
Other significant information relating to short-term bank loans as of December 31, 2012 is as follows:
| Borrower | | Currency | | Total facility (in billions) | | Maturity date | | Interest payment period | | Interest rate per annum | | Security | |
Bank CIMB Niaga | | | | | | | | | | | | | | |
April 25, 2005 a | Balebat | | Rp | | 12 | | May 29, 2013 | | Monthly | | 10.50% - 11.00% | | Property and equipment (Note 11), inventories(Note 7) and trade receivables (Note 6) | |
April 29, 2008 a | Balebat | | Rp | | 10 | | May 29, 2013 | | Monthly | | 10.50% - 11.00% | | Property and equipment (Note 11), inventories (Note 7) and trade receivables (Note 6) | |
F - 60
PERUSAHAAN PERSEROAN (PERSERO)
PT TELEKOMUNIKASI INDONESIA Tbk AND SUBSIDIARIES
NOTES TO THE CONSOLIDATED FINANCIAL STATEMENTS
As of December 31, 2011 and 2012 and
for the years ended December 31, 2010, 2011 and 2012
(Figures in tables are presented in billions of rupiah, unless otherwise stated)
17. SHORT-TERM LOANS AND OTHER BORROWINGS (continued)
a. Short-term bank loans (continued)
| Borrower | | Currency | | Total facility (in billions) | | Maturity date | | Interest payment period | | Interest rate per annum | | Security | |
Bank Ekonomi | | | | | | | | | | | | | | |
August 7, 2009b | Sigma | | Rp | | 35 | | July 1, 2013 | | Monthly | | 9.00% | | Property and equipment (Note 11) and trade receivables (Note 6) | |
August 7, 2009b | Sigma | | US$ | | 0.001 | | July 1, 2013 | | Monthly | | 6.00% | | Property and equipment (Note 11) and trade receivables (Note 6) | |
The credit facilities obtained by the Company’s subsidiaries are used for working capital purposes.
a based on the latest amendment on October 10, 2012
b based on the latest amendment on October 1, 2012
As of December 31, 2012, the Company's subsidiaries have complied with all convenants.
b. Current maturities of long-term liabilities
| | Notes | | 2011 | | 2012 | |
Bank loans | | 18c | | 3,960 | | 4,475 | |
Obligations under finance leases | | 11d | | 196 | | 510 | |
Bonds and notes | | 18b | | 385 | | 440 | |
Two-step loans | | 18a | | 272 | | 196 | |
Total | | | | 4,813 | | 5,621 | |
Refer to Note 34 for details of related party transactions.
18. LONG-TERM LOANS AND OTHER BORROWINGS
Long-term loans and other borrowings consist of long-term bank loans, bonds and notes, two-step loans, and obligations under finance leases with the amounts as of December 31, 2011 and 2012 as follows:
| 2011 | | 2012 | |
Bank loans | 7,231 | | 6,783 | |
Bonds and notes | 3,401 | | 3,229 | |
Two-step loans | 2,012 | | 1,791 | |
Obligations under finance leases | 314 | | 1,814 | |
Total | 12,958 | | 13,617 | |
F - 61
PERUSAHAAN PERSEROAN (PERSERO)
PT TELEKOMUNIKASI INDONESIA Tbk AND SUBSIDIARIES
NOTES TO THE CONSOLIDATED FINANCIAL STATEMENTS
As of December 31, 2011 and 2012 and
for the years ended December 31, 2010, 2011 and 2012
(Figures in tables are presented in billions of rupiah, unless otherwise stated)
18.
LONG-TERM LOANS AND OTHER BORROWINGS (continued)
Scheduled principal payments as ofDecember 31, 2012are as follows :
| | | Year | |
| Total | | 2014 | | 2015 | | 2016 | | 2017 | | Thereafter | |
Bank loans | 6,783 | | 3,480 | | 2,337 | | 548 | | 328 | | 90 | |
Bonds and notes | 3,229 | | 192 | | 1,042 | | - | | - | | 1,995 | |
Two-step loans | 1,791 | | 198 | | 201 | | 204 | | 205 | | 983 | |
Obligations under finance leases | 1,814 | | 396 | | 270 | | 246 | | 227 | | 675 | |
Total | 13,617 | | 4,266 | | 3,850 | | 998 | | 760 | | 3,743 | |
a. Two-step loans
Two-step loans are unsecured loans initially obtained by the Government which are then re-loaned to the Company. The loans obtained up to July 1994 were recorded and payable in rupiah based on the exchange rate at the date of drawdown. Loans obtained after July 1994 are payable in their original currencies and any resulting foreign exchange gain or loss is borne by the Company.
| | | | 2011 | | 2012 | |
| | | | Outstanding | | Outstanding | |
| | | | Original currency | | Rupiah | | Original currency | | Rupiah | |
Lenders | | Currency | | (in millions) | | equivalent | | (in millions) | | equivalent | |
Overseas banks | | Yen | | 9,983 | | 1,167 | | 9,215 | | 1,031 | |
| | Rp | | - | | 717 | | - | | 574 | |
| | US$ | | 44 | | 400 | | 40 | | 382 | |
Total | | | | | | 2,284 | | | | 1,987 | |
Current maturities (Note 17b) | | | | | | (272 | ) | | | (196 | ) |
Long-term portion (Note 18) | | | | | | 2,012 | | | | 1,791 | |
| | | | Principal payment | | Interest payment | | Interest rate | |
Lenders | | Currency | | schedule | | period | | per annum | |
Overseas banks | | US$ | | Semi-annually | | Semi-annually | | 4.00% | |
| | Rp | | Semi-annually | | Semi-annually | | 6.79% | |
| | Yen | | Semi-annually | | Semi-annually | | 3.10% | |
The loans are intended for the development of telecommunications infrastructure and supporting telecommunications equipment. The loans are payable in semi-annual installments and are due on various dates through 2024.
Since 2008, the Company had used all facilities under the two-step loans program.
The Company is required to maintain financial ratios as follows:
a. Projected net revenue to projected debt service ratio should exceed 1.2:1 for the two-step loans originating from Asian Development Bank (“ADB”).
b. Internal financing (earnings before depreciation and finance costs) should exceed 20% compared to annual average capital expenditures for loans originating from ADB.
F - 62
PERUSAHAAN PERSEROAN (PERSERO)
PT TELEKOMUNIKASI INDONESIA Tbk AND SUBSIDIARIES
NOTES TO THE CONSOLIDATED FINANCIAL STATEMENTS
As of December 31, 2011 and 2012 and
for the years ended December 31, 2010, 2011 and 2012
(Figures in tables are presented in billions of rupiah, unless otherwise stated)
18. LONG-TERM LOANS AND OTHER BORROWINGS (continued)
a. Two-step loans (continued)
As of December 31, 2012, the Company has complied with all covenants.
Refer to Note 34 for details of related party transactions.
b. Bonds and notes
| | | | 2011 | | 2012 | |
| | | | Outstanding | | Outstanding | |
| | | | Original currency | | Rupiah | | Original currency | | Rupiah | |
Bonds and notes | | Currency | | (in millions) | | equivalent | | (in millions) | | equivalent | |
Bonds | | | | | | | | | | | |
Series A | | Rp | | - | | 1,005 | | - | | 1,005 | |
Series B | | Rp | | - | | 1,995 | | - | | 1,995 | |
Medium Term Notes (“MTN”) | | | | | | | | | | | |
Finnet | | Rp | | - | | 18 | | - | | 8 | |
Metra | | Rp | | - | | 59 | | - | | 0 | |
Sigma | | Rp | | - | | 30 | | - | | 0 | |
Promissory Notes | | | | | | | | | | | |
PT Huawei | | US$ | | 60 | | 545 | | 46 | | 445 | |
PT ZTE Indonesia (“ZTE”) | | US$ | | 15 | | 134 | | 22 | | 216 | |
Total | | | | | | 3,786 | | | | 3,669 | |
Current maturities (Note 17b) | | | | | | (385 | ) | | | (440 | ) |
Long-term portion (Note 18) | | | | | | 3,401 | | | | 3,229 | |
1. Bonds
Bonds | | Principal | | Issuer | | Listed on | | Issuance date | | Maturity date | | Interest payment period | | Interest rate per annum | |
Series A | | 1,005 | | The Company | | IDX | | June 25, 2010 | | July 6, 2015 | | Quarterly | | 9.60% | |
Series B | | 1,995 | | The Company | | IDX | | June 25, 2010 | | July 6, 2020 | | Quarterly | | 10.20% | |
Total | | 3,000 | | | | | | | | | | | | | |
The bonds are secured by all of the Company’s assets, movable or non-movable, either existing or in the future (Note 11d.x). The underwriters of the bonds are Bahana, PT Danareksa Sekuritas and PT Mandiri Sekuritas, and the trustee is PT CIMB Niaga Tbk.
The Company received the proceeds of the issuance of bonds on July 6, 2010.
The funds received from public offering of bonds net of issuance costs, have been used for financing capital expenditure which consisted of: wave broadband (bandwidth, softswitching, datacom, information technology and others), infrastructure (backbone, metro network, regional metro junction, internet protocol and satellite system) and optimizing legacy and supporting facilities (fixed wireline and wireless).
As of December 31, 2012, the rating for the bonds issued by PT Pemeringkat Efek Indonesia (Pefindo) is idAAA (stable outlook).
F - 63
PERUSAHAAN PERSEROAN (PERSERO)
PT TELEKOMUNIKASI INDONESIA Tbk AND SUBSIDIARIES
NOTES TO THE CONSOLIDATED FINANCIAL STATEMENTS
As of December 31, 2011 and 2012 and
for the years ended December 31, 2010, 2011 and 2012
(Figures in tables are presented in billions of rupiah, unless otherwise stated)
18. LONG-TERM LOANS AND OTHER BORROWINGS (continued)
b. Bonds and notes (continued)
1. Bonds (continued)
Based on indenture trusts agreement, the Company is required to comply with all covenants or restrictions including maintaining financial ratios as follows:
1. Debt to equity ratio should not exceed 2:1;
2. EBITDA to finance costs ratio should not be less than 5:1;
3. Debt service coverage is 125%.
2. MTN
Notes | | Principal | | Issuancedate | | Maturitydate | | Interestpaymentperiod | |
MTN | | | | | | | | | |
Metra I* | | | | | | | | | |
Phase 1 | | 30 | | June 9, 2009 | | June 19, 2012 | | Quarterly | |
Phase 2 | | 20 | | February 1, 2010 | | February 2, 2013 | | Quarterly | |
Metra II | | | | | | | | | |
Phase 1 | | 20 | | December 28, 2011 | | December 28, 2014 | | Quarterly | |
Phase2 | | 10 | | February 22, 2012 | | February 22, 2015 | | Quarterly | |
Sigma** | | 30 | | November 17, 2009 | | November 17, 2014 | | Semi-annually | |
Finnet | | | | | | | | | |
Phase 1 | | 10 | | October 16, 2009 | | November 17, 2012 | | Monthly | |
Phase 2 | | 15 | | March 18, 2010 | | March 24, 2013 | | Monthly | |
* In December 2012, the MTN was fully repaid by Metra through refinancing with BNI. | |
** In May 2012, the MTN was fully repaid by Sigma. | |
The Arranger of the Medium Term Notes is Bahana, with Bank Mega acting as Trustee, and PT Kustodian Sentral Efek Indonesia (“KSEI”) acting as Collecting Agent and Custodian. Proceeds from the issuance of MTN were used to, among others, expand the business and as working capital.
Metra secures a minimum value of 40% of the outstanding MTN principal. The maximum value of 60% of the outstanding MTN principal is unsecured and at all times ranked (pari passu) with other unsecured debts of Metra. Metra may buy back all or part of the MTN at any time before the maturity date of the MTN.
The MTN of Sigma and Finnet are not secured by a specific collateral, but secured by all of Sigma’s and Finnet’s assets, movable or non-movable, either existing or in the future (Note 11d.x) which become a collateral to MTN holders and at all times ranked (pari passu) without any preference or other creditor privileges in accordance with prevailing regulations. Sigma and Finnet may buy back all or part of the MTN at any time before the maturity date of the MTN.
Refer to Note 34 for details of related party transactions.
F - 64
PERUSAHAAN PERSEROAN (PERSERO)
PT TELEKOMUNIKASI INDONESIA Tbk AND SUBSIDIARIES
NOTES TO THE CONSOLIDATED FINANCIAL STATEMENTS
As of December 31, 2011 and 2012 and
for the years ended December 31, 2010, 2011 and 2012
(Figures in tables are presented in billions of rupiah, unless otherwise stated)
18. LONG-TERM LOANS AND OTHER BORROWINGS (continued)
b. Bonds and notes (continued)
3. Promissory Notes
Supplier | | Currency | | Principal (in millions) | | Issuance date | | Principal payment schedule | | Interest payment period | | Interest rate per annum | |
PT Huawei | | US$ | | 300 | | June 19, 2009 | | Semi-annually | | Semi-annually (January 11, 2013 - June 28, 2015) | | 6 month LIBOR+2.5% | |
ZTE | | US$ | | 100 | | August 20, 2009 | | Semi-annually | | Semi-annually (March 10, 2013 - June 10, 2015) | | 6 month LIBOR+1.5% 6 month LIBOR+2.5% | |
Based on Agreement of Frame Supply and Deferred Payment Arrangement of the Company with ZTE and PT Huawei, the promissory notes issued by the Company to ZTE and PT Huawei are for unsecured supplier financing facilities covering 85% of Hand Over Report (“Berita Acara Serah Terima” or BAST) projects with ZTE and PT Huawei.
As of December 31, 2012, the Company and subsidiaries have complied with all covenants.
c. Bank loans
| | | | 2011 | | 2012 | |
| | | | Outstanding | |
Outstanding | |
Lenders | | Currency | | Originalcurrency (in millions) | | Rupiahequivalent | | Originalcurrency (in millions) | | Rupiah equivalent | |
BRI | | Rp | | - | | 1,131 | | - | | 4,011 | |
Syndication of banks | | Rp | | - | | 3,225 | | - | | 1,950 | |
BCA | | Rp | | - | | 2,271 | | - | | 1,564 | |
Bank Mandiri | | Rp | | - | | 2,111 | | - | | 1,417 | |
BNI | | Rp | | - | | 400 | | - | | 1,201 | |
ABN Amro Bank N.V., Stockholm Branch (“AAB Stockholm”) and Standard Chartered Bank | | US$ | | 85 | | 771 | | 68 | | 659 | |
Japan Bank for International Cooperation (“JBIC”) | | US$ | | 42 | | 381 | | 30 | | 289 | |
Bank CIMB Niaga | | Rp | | - | | 81 | | - | | 174 | |
PT Bank Ekonomi Raharja Tbk (“Bank Ekonomi”) | | Rp | | - | | 69 | | - | | 41 | |
| | US$ | | 0 | | 4 | | 0 | | 3 | |
OCBC NISP | | Rp | | - | | 466 | | - | | - | |
Industrial and Commercial Bank of China Limited (“ICBC”) | | US$ | | 39 | | 350 | | - | | - | |
Others | | Rp | | - | | 1 | | - | | - | |
Total | | | | | | 11,261 | | | | 11,309 | |
Unamortized debt issue cost | | | | | | (70 | ) | | | (51 | ) |
| | | | | | 11,191 | | | | 11,258 | |
Current maturities (Note 17b) | | | | | | (3,960 | ) | | | (4,475 | ) |
Long-term portion (Note 18) | | | | | | 7,231 | | | | 6,783 | |
Refer to Note 34 for details of related party transactions.
F - 65
PERUSAHAAN PERSEROAN (PERSERO)
PT TELEKOMUNIKASI INDONESIA Tbk AND SUBSIDIARIES
NOTES TO THE CONSOLIDATED FINANCIAL STATEMENTS
As of December 31, 2011 and 2012 and
for the years ended December 31, 2010, 2011 and 2012
(Figures in tables are presented in billions of rupiah, unless otherwise stated)
18. LONG-TERM LOANS AND OTHER BORROWINGS
(continued)
c. Bank loans (continued)
Other significant information relating to bank loans as of December 31, 2012 is as follows:
| Borrower | | Currency | | Total facility (in billions) | | Current period payment (in billions) | | Principal payment schedule | | Interest payment period | | Interest rate per annum | | Security | |
Syndication of banks | | | | | | | | | | | | | | | | |
July 29, 2008a (BNI, BRI and Bank Jabar) | The Company | | Rp | | 2,400 | | 600 | | Semi-annually (2010 - 2013) | | Quarterly | | 3 months JIBOR+1.20% | | None | |
June 16, 2009a (BNI and BRI) | The Company | | Rp | | 2,700 | | 675 | | Semi-annually (2011 - 2014) | | Quarterly | | 3 months JIBOR+2.45% | | None | |
Syndication of banks | | | | | | | | | | | | | | | | |
December 19, 2012 (BNI, BRI andBank Mandiri) k | Dayamitra | | Rp | | 2.5 | | - | | Semi-annually (2014 - 2020) | | Quarterly | | 3 months JIBOR + 3.00% | | Property and equipment (Note 11) and trade receivables (Note 6) | |
BCA | | | | | | | | | | | | | | | | |
July 5, 2010b&c | Telkomsel | | Rp | | 2,000 | | 667 | | Semi-annually (2012 - 2016) | | Quarterly | | 3 months JIBOR+1.20% | | None | |
December 16, 2010a | TII | | Rp | | 200 | | 40 | | Semi-annually (2011 - 2015) | | Quarterly | | 3 months JIBOR+1.25% | | None | |
Bank Mandiri | | | | | | | | | | | | | | | | |
July 5, 2010b&c | Telkomsel | | Rp | | 3,000 | | 694 | | Semi-annually (2012 - 2016) | | Quarterly | | 3 months JIBOR+1.20% | | None | |
BRI | | | | | | | | | | | | | | | | |
October 13, 2010a | The Company | | Rp | | 3,000 | | - | | Semi-annually (2013 - 2015) | | Quarterly | | 3 months JIBOR+1.25% | | None | |
July 20, 2011a | Dayamitra | | Rp | | 1,000 | | - | | Semi-annually (2011 - 2017) | | Quarterly | | 3 months JIBOR+1.40% | | Property and equipment (Note 11) | |
April 17, 2012 a&j | Indonusa | | Rp | | 225 | | - | | Semi-annually (2013 - 2017) | | Quarterly | | 3 months JIBOR+3.76% | | Indonusa’s cash flows | |
ABN Amro Bank N.V.Stockholm Branch(“AAB Stockholm”) and StandardChartered Bank | | | | | | | | | | | | | | | | |
December 30, 2009b&d | Telkomsel | | US$ | | 0.3 | | 0.02 | | Semi-annually (2011- 2016) | | Semi-annually | | 6 months LIBOR+0.82% | | None | |
BNI | | | | | | | | | | | | | | | | |
October 13, 2010a | The Company | | Rp | | 1,000 | | 143 | | Semi-annually (2013 - 2015) | | Quarterly | | 3 months JIBOR+1.25% | | None | |
December 23, 2011a | PIN | | Rp | | 500 | | - | | Semi-annually (2013 - 2016) | | Quarterly | | 3 months JIBOR+1.50% | | Inventories (Note 7) and trade receivables (Note 6) | |
November 28, 2012a | Metra | | Rp | | 44 | | - | | Annually (2013-2015) | | Monthly | | 8% | | Property and equipment (Note 11) and trade receivables (Note 6 | |
Japan Bank for International Cooperation(“JBIC”) | | | | | | | | | | | | | | | | |
March 26, 2010a&e | The Company | | US$ | | 0.06 | | 0.01 | | Semi-annually(2010 - 2015) | | Semi-annually | | 4.56% and 6 months LIBOR+0.70% | | None | |
ICBC | | | | | | | | | | | | | | | | |
December 30, 2009 | Telkomsel | | US$ | | 0.3 | | 0.039 | | Semi-annually(2011 – 2016) | | Semi-annually | | 6 months LIBOR+1,20% | | None | |
F - 66
dPERUSAHAAN PERSEROAN (PERSERO)
PT TELEKOMUNIKASI INDONESIA Tbk AND SUBSIDIARIES
NOTES TO THE CONSOLIDATED FINANCIAL STATEMENTS
As of December 31, 2011 and 2012 and
for the years ended December 31, 2010, 2011 and 2012
(Figures in tables are presented in billions of rupiah, unless otherwise stated)
18. LONG-TERM LOANS AND OTHER BORROWINGS (continued)
c. Bank loans (continued)
| Borrower | | Currency | | Total facility (in billions) | | Current period payment (in billions) | | Principal payment schedule | | Interest payment period | | Interest rate per annum | | Security | |
| Bank CIMB Niaga | | | | | | | | | | | | | | | | |
March 21, 2007f | GSD | | Rp | | 21 | | 8.6 | | Quarterly (2007 - 2015) | | Monthly | | 9.75% | | Property and equipment (Note 11) | |
November 23, 2007f | GSD | | Rp | | 9 | | 8 | | Monthly (2007 - 2012) | | Monthly | | 9.75% | | Property and equipment (Note 11) | |
July 28, 2009g | Balebat | | Rp | | 2 | | 0.5 | | Monthly (2010 - 2014) | | Monthly | | 10.50% | | Property and equipment (Note 11), inventories (Note 7), and trade receivables (Note 6) | |
May 24, 2010g | Balebat | | Rp | | 2 | | 0.6 | | Monthly (2010 - 2015) | | Monthly | | 10.50% | | Property and equipment (Note 11), inventories (Note 7) and trade receivables (Note 6) | |
March 31, 2011 | GSD | | Rp | | 24 | | 3.2 | | Monthly (2011 - 2019) | | Monthly | | 9.75% | | Property and equipment (Note 11) | |
March 31, 2011 | GSD | | Rp | | 13 | | 2.1 | | Monthly (2011 - 2019) | | Monthly | | 9.75% | | Property and equipment (Note 11) | |
March 31, 2011 | GSD | | Rp | | 12 | | 2.1 | | Monthly (2011 - 2015) | | Monthly | | 9.75% | | Property and equipment (Note 11) | |
September 9, 2011 | GSD | | Rp | | 41 | | 1.9 | | Monthly (2011 - 2021) | | Monthly | | 9.75% | | Property and equipment (Note 11) | |
September 9, 2011 | GSD | | Rp | | 11 | | 3.9 | | Monthly (2011 - 2015) | | Monthly | | 9.75% | | Property and equipment (Note 11) | |
August 2, 2012g | Balebat | | Rp | | 4 | | 0.3 | | Monthly (2012 - 2015) | | Monthly | | 10.50% | | Property and equipment (Note 11), inventories (Note 7) and trade receivables (Note 6) | |
September 20, 2012a | TLT | | Rp | | 1,150 | | - | | Monthly (2015 - 2030) | | Monthly | | 3 months JIBOR+3.45% | | Property and equipment (Note 11) | |
F - 67
PERUSAHAAN PERSEROAN (PERSERO)
PT TELEKOMUNIKASI INDONESIA Tbk AND SUBSIDIARIES
NOTES TO THE CONSOLIDATED FINANCIAL STATEMENTS
As of December 31, 2011 and 2012 and
for the years ended December 31, 2010, 2011 and 2012
(Figures in tables are presented in billions of rupiah, unless otherwise stated)
18. LONG-TERM LOANS AND OTHER BORROWINGS (continued)
c. Bank loans (continued)
| Borrower | | Currency | | Total facility (in billions) | | Current period payment (in billions) | | PrincipalPaymentschedule | | Interest paymentperiod | | Interestrate per annum | | Security | |
September 20, 2012a | TLT | | Rp | | 118 | | - | | Monthly (2015 - 2030) | | Monthly | | 9.00% | | Property and equipment (Note 11) | |
October 10, 2012g | Balebat | | Rp | | 1 | | 0.07 | | Monthly (2012 - 2015) | | Monthly | | 10.50% | | Property and equipment (Note 11), inventories (Note 7) and trade receivables (Note 6) | |
Bank Ekonomi December 7, 2006i | Sigma | | Rp | | 14 | | 3.4 | | Monthly (2006 - 2012) | | Monthly | | 9.00% | | Property and equipment (Note 11), and trade receivables (Note 6) | |
March 9, 2007i | Sigma | | Rp | | 13 | | 2.7 | | Monthly (2008 - 2012) | | Monthly | | 9.00% | | Property and equipment (Note 11), and trade receivables (Note 6) | |
September 10, 2008a&h | Sigma | | Rp | | 33 | | 5.8 | | Monthly (2009 - 2015) | | Monthly | | 9.00% | | Property and equipment (Note 11), and trade receivables (Note 6) | |
August 7, 2009a&h | Sigma | | Rp | | 35 | | 10.4 | | Monthly for some Installments (2009- 2013) | | Monthly | | 9.00% | | Property and equipment (Note 11),and trade receivables (Note 6) | |
August 7, 2009a&h | Sigma | | Rp | | 20 | | 5.3 | | Monthly for some installments (2009 - 2014) | | Monthly | | 9.00% | | Property and equipment (Note 11), and trade receivables (Note 6) | |
February 23, 2011a&h | Sigma | | Rp | | 30 | | 8.6 | | Monthly (2011 - 2015) | | Monthly | | 9.00% | | Property and equipment (Note 11), and trade receivables (Note 6) | |
February 23, 2011a&h | Sigma | | US$ | | 0.002 | | 0.0001 | | Monthly (2011 - 2015) | | Monthly | | 6.00% | | Property and equipment (Note 11), and trade receivables (Note 6) | |
F - 68
PERUSAHAAN PERSEROAN (PERSERO)
PT TELEKOMUNIKASI INDONESIA Tbk AND SUBSIDIARIES
NOTES TO THE CONSOLIDATED FINANCIAL STATEMENTS
As of December 31, 2011 and 2012 and
for the years ended December 31, 2010, 2011 and 2012
(Figures in tables are presented in billions of rupiah, unless otherwise stated)
18. LONG-TERM LOANS AND OTHER BORROWINGS (continued)
c. Bank Loans (Continued)
The credit facilities obtained by the Company and subsidiaries are used for working capital purpose.
a As stated in the agreements, the Company and subsidiaries are required to comply with all covenants or restrictions such as dividend distribution restrictions, new loans restriction, including maintaining financial ratios. As of December 31, 2012, the Company and subsidiaries have complied with all covenants.
b Telkomsel has no collateral for its bank loans, or other credit facilities. The terms of the various agreements with Telkomsel’s lenders and financiers require compliance with a number of pledges and negative pledges as well as financial and other covenants, which include, among other things, certain restrictions on the amount of dividends and other profit distributions which could adversely affect Telkomsel’s capacity to comply with its obligation under the facilities. The terms of the relevant agreements also contain default and cross default clauses. As of December 31, 2012, Telkomsel complied with the above covenants.
c In January 2012, the availability periods of the facilities from BCA and Bank Mandiri expired.
d Pursuant to the agreements with PT Ericsson Indonesia (“Ericsson Indonesia”) and Ericsson AB (Note 37a.ii), Telkomsel entered into an EKN-Backed Facility Agreement (“facility”) with ABN Amro Bank N.V. Stockholm Branch (as “the original lender”) and Standard Chartered Bank (“SCB”) (as “the original lender”, “the arranger”, “the facility agent” and “the EKN agent”), ABN Amro Bank N.V., Hong Kong (as “the arranger”), for the purchase of Ericsson telecommunication equipment and services. The facilities consist of facility 1, 2 and 3 amounting to US$117 million, US$106 million and US$95 million, respectively. The availability period of facility 1, 2 and 3 expired in July 2010, March 2011 and November 2011, respectively. In October 2011, EKN agreed to reduce the premium of the unused facility by US$3 million through a cash refund.
e In connection with the agreement with NSW-Fujitsu Consortium, the Company entered into a loan agreement with JBIC, the international arm of Japan Finance Corporation for the purchase of NSW-Fujitsu Consortium telecommunication equipment and services. The facilities consist of facility A and B amounting to US$36 million and US$24 million, respectively.
f Based on the latest amendment on March 31, 2011
g Based on the latest amendment on October 10, 2012
h Based on the latest amendment on October 1, 2012
i In 2012, the loan was fully repaid by Sigma and Telkomsel, and the facility was not extended.
j Based on the latest amendment on October 16, 2012, the loan was required to be repaid by Indonusa on April 24, 2013.
k As of December 31, 2012, the credit facility from the syndication of banks has not been used by Dayamitra.
19. NON-CONTROLLING INTERESTS
| 2011 | | 2012 | |
Non-controlling interest in net assets of subsidiaries: | | | | |
Telkomsel | 13,275 | | 15,218 | |
Metra* | 32 | | 65 | |
GSD* | - | | 31 | |
Infomedia* | 8 | | - | |
Total | 13,315 | | 15,314 | |
| | 2010 | | 2011 | | 2012 | |
Non-controlling interests in total comprehensive income of subsidiaries: | | | | | | | |
Telkomsel | | 4,282 | | 4,417 | | 5,532 | |
Metra* | | 5 | | 16 | | 14 | |
GSD* | | - | | - | | (1 | ) |
Infomedia* | | 1 | | 1 | | - | |
Total | | 4,288 | | 4,434 | | 5,545 | |
* These amounts represent other third parties’ share of ownership in subsidiaries of Metra, Infomedia and GSD. | |
F - 69
-
PERUSAHAAN PERSEROAN (PERSERO)
PT TELEKOMUNIKASI INDONESIA Tbk AND SUBSIDIARIES
NOTES TO THE CONSOLIDATED FINANCIAL STATEMENTS
As of December 31, 2011 and 2012 and
for the years ended December 31, 2010, 2011 and 2012
(Figures in tables are presented in billions of rupiah, unless otherwise stated)
20. CAPITAL STOCK
| | | | 2011 | | | |
Description | | Number of shares | | Percentage of ownership | | Total paid-up capital | |
Series A Dwiwarna share | | | | | | | |
Government | | 1 | | - | | - | |
Series B shares | | | | | | | |
Government | | 10,320,470,711 | | 53.24 | | 2,580 | |
The Bank of New York Mellon Corporation* | | 2,952,965.536 | | 15.23 | | 738 | |
Directors (Note 1b): | | | | | | | |
Ermady Dahlan | | 17,604 | | - | | - | |
Indra Utoyo | | 5,508 | | - | | - | |
Public (individually less than 5%) | | 6,112,879,960 | | 31.53 | | 1,529 | |
Total | | 19,386,339,320 | | 100.00 | | 4,847 | |
Treasury stock (Note 22) | | 773,659,960 | | - | | 193 | |
Total | | 20,159,999,280 | | 100.00 | | 5,040 | |
* The Bank of New York Mellon Corporation serves as thedepositary oftheregistered ADS holders for the Company’s ADSs. | |
| | | | 2012 | | | |
| | Number of shares | | Percentage of ownership | | Total paid-up capital | |
Description | | | | | | | |
Series A Dwiwarna share | | 1 | | - | | - | |
Government | | | | | �� | | |
Series B shares | | 10,320,470,711 | | 53.90 | | 2,580 | |
Government | | 2,197,688,216 | | 11.48 | | 549 | |
The Bank of New York Mellon Corporation* | | | | | | | |
Directors (Note 1b): | | | | | | | |
Indra Utoyo | | 5,508 | | - | | - | |
Priyantono Rudito | | 108 | | - | | - | |
Sukardi Silalahi | | 108 | | - | | - | |
Public (individually less than 5%) | | 6,630,904,168 | | 34.62 | | 1,658 | |
Total | | 19,149,068,820 | | 100.00 | | 4,787 | |
Treasury stock (Note 22) | | 1,010,930,460 | | - | | 253 | |
Total | | 20,159,999,280 | | 100.00 | | 5,040 | |
* The Bank of New York Mellon Corporation serves as thedepositary oftheregistered ADS holders for the Company’s ADSs. | |
The Company issued only 1 Series A Dwiwarna share which is held by the Government and cannot be transferred to any other party, and it has a right to veto in the General Meeting of Stockholders of the Company with respect to the election and removal of any member of the Boards of Commissioners and Directors, issuance of new shares and amendment of the Company’s Articles of Association.
F - 70
PERUSAHAAN PERSEROAN (PERSERO)
PT TELEKOMUNIKASI INDONESIA Tbk AND SUBSIDIARIES
NOTES TO THE CONSOLIDATED FINANCIAL STATEMENTS
As of December 31, 2011 and 2012 and
for the years ended December 31, 2010, 2011 and 2012
(Figures in tables are presented in billions of rupiah, unless otherwise stated)
20. CAPITAL STOCK (continued)
Pursuant to the AGM of Stockholders of the Company as stated in notarial deed No. 17 dated June 11, 2010 of A. Partomuan Pohan, S.H., LLM., the Company’s stockholders agreed on the distribution of cash dividends for 2009 amounting to Rp5,666 billion or Rp288.06 per share (of which Rp524 billion or Rp26.65 per share was distributed as an interim cash dividend in November 2009).
Pursuant to the AGM of Stockholders of the Company as stated in notarial deed No. 21 dated May 19, 2011 of A. Partomuan Pohan, S.H., LLM., the Company’s stockholders agreed on the distribution of cash dividends for 2010 amounting to Rp6,345 billion or Rp322.59 per share (of which Rp526 billion or Rp26.75 per share was distributed as an interim cash dividend in December 2010).
Pursuant to the AGM of Stockholders of the Company as stated in notarial deed No. 14 dated May 11, 2012 of Ashoya Ratam, S.H., MKn., the Company’s stockholders agreed on the distribution of cash dividends and special cash dividend for 2011 amounting to Rp6,031 billion and Rp1,096 billion, respectively.
On June 22, 2012, the Company paid the above-mentioned cash dividends and special cash dividend totaling Rp7,127 billion.
21. ADDITIONAL PAID-IN CAPITAL
| | 2011 | | 2012 | |
Proceeds from sale of 933,333,000 shares in excess of par value | | | | | |
through IPO in 1995 | | 1,446 | | 1,446 | |
Capitalization into 746,666,640 Series B shares in 1999 | | (373 | ) | (373) | |
Net | | 1,073 | | 1,073 | |
22. TREASURY STOCK
| | | | | | Maximum Purchase | |
Phase | | Basis | | Period | | Numberof Shares | | Amount | |
I | | EGM | | December 21, 2005 - June 20, 2007 | | 1,007,999,964 | | Rp5,250 | |
II | | AGM | | June 29, 2007 - December, 28, 2008 | | 215,000,000 | | Rp2,000 | |
III | | AGM | | June 20, 2008 - December 20, 2009 | | 339,443,313 | | Rp3,000 | |
- | | BAPEPAM - LK | | October 13, 2008 - January 12, 2009 | | 4,031,999,856 | | Rp3,000 | |
IV | | AGM | | May 19, 2011 - November 20, 2012 | | 645,161,290 | | Rp5,000 | |
F - 71
PERUSAHAAN PERSEROAN (PERSERO)
PT TELEKOMUNIKASI INDONESIA Tbk AND SUBSIDIARIES
NOTES TO THE CONSOLIDATED FINANCIAL STATEMENTS
As of December 31, 2011 and 2012 and
for the years ended December 31, 2010, 2011 and 2012
(Figures in tables are presented in billions of rupiah, unless otherwise stated)
22. TREASURY STOCK (continued)
Movement in treasury stock as a result of share repurchase is as follows:
| | 2011 | | 2012 | |
| | Number of shares | | % | | Rp | | Number of shares | | % | | Rp | |
Beginning balance | | 490,574,500 | | 2.43 | | 4,264 | | 773,659,960 | | 3.84 | | 6,323 | |
Number of shares acquired | | 283,085,460 | | 1.41 | | 2,059 | | 237,270,500 | | 1.17 | | 1,744 | |
Ending balance (Note 20) | | 773,659,960 | | 3.84 | | 6,323 | | 1,010,930,460 | | 5.01 | | 8,067 | |
Pursuant to the AGM of Stockholders of the Company held on June 11, 2010, the stockholders approved the changes to the Company’s plan for use of the treasury stock as a result of the Shares Buyback phase I, II and III, as follows: (i) market placement; (ii) cancellation; (iii) equity conversion; and (iv) funding.
23. OTHER RESERVES
Other reserves consist of the translation reserve and fair value reserve. The translation reserve consists of all foreign currency differences arising from the translation of the financial statements of foreign operations (including equity-accounted investees) amounting to Rp9 billion and Rp40 billion as of December 31, 2011 and 2012, respectively.
The fair value reserve consists of the cumulative net change in the fair value of available-for-sale financial assets until the investments are derecognized or impaired amounting to Rp47 billion and Rp42 billion as of December 31, 2011 and2012,respectively.
24. BASIC AND DILUTED EARNINGS PER SHARE
Basic and diluted earnings per share is computed by dividingprofit for the year attributable to owners of the parent company amounting to Rp11,427 billion, Rp10,848 billion and Rp12,864 billion by the weighted average number of shares outstanding during the year totaling 19,669,424,780 shares, 19,591,872,544 shares and19,202,263,101 shares for the years ended December 31, 2010, 2011 and 2012, respectively.
The basic and diluted earnings per share amounts are Rp580.95, Rp553.70 and Rp669.92 for the years ended December 31, 2010, 2011 and 2012, respectively. The Company does not have potentially dilutive financial instruments as of December 31, 2010, 2011 and 2012.
F - 72
PERUSAHAAN PERSEROAN (PERSERO)
PT TELEKOMUNIKASI INDONESIA Tbk AND SUBSIDIARIES
NOTES TO THE CONSOLIDATED FINANCIAL STATEMENTS
As of December 31, 2011 and 2012 and
for the years ended December 31, 2010, 2011 and 2012
(Figures in tables are presented in billions of rupiah, unless otherwise stated)
25. REVENUES
| | 2010 | | 2011 | | 2012 | |
Telephone Revenues | | | | | | | |
Cellular | | | | | | | |
Usage charges | | 28,024 | | 27,189 | | 29,477 | |
Monthly subscription charges | | 488 | | 569 | | 696 | |
Features | | 582 | | 838 | | 558 | |
Connection fee charges | | 40 | | 2 | | - | |
| | 29,134 | | 28,598 | | 30,731 | |
Fixed lines | | | | | | | |
Usage charges | | 9,287 | | 8,213 | | 7,323 | |
Monthly subscription charges | | 3,251 | | 3,004 | | 2,805 | |
Installation charges | | 179 | | 135 | | 112 | |
Others | | 223 | | 267 | | 422 | |
| | 12,940 | | 11,619 | | 10,662 | |
Total Telephone Revenues | | 42,074 | | 40,217 | | 41,393 | |
Interconnection Revenues | | | | | | | |
Domestic interconnection and transit | | 2,174 | | 2,071 | | 2,618 | |
International interconnection | | 1,561 | | 1,438 | | 1,655 | |
Total Interconnection Revenues | | 3,735 | | 3,509 | | 4,273 | |
Data,Internet, andInformationTechnologyServicesRevenues | | | | | | | |
Internet, data communication and information technology services | | 8,297 | | 10,548 | | 14,857 | |
Short Messaging Services (“SMS”) | | 11,289 | | 13,093 | | 12,631 | |
VoIP | | 197 | | 245 | | 81 | |
e-Business | | 18 | | 38 | | 55 | |
Total Data, Internet, and Information Technology Services Revenues | | 19,801 | | 23,924 | | 27,624 | |
Network Revenues | | | | | | | |
Leased lines | | 687 | | 911 | | 824 | |
Satellite transponder lease | | 371 | | 390 | | 384 | |
Total Network Revenues | | 1,058 | | 1,301 | | 1,208 | |
Other Telecommunications Services Revenues | | | | | | | |
Customer Premise Equipment (“CPE”)and terminal | | 851 | | 739 | | 1,046 | |
Pay TV | | 159 | | 259 | | 405 | |
Leases | | 75 | | 219 | | 401 | |
Directory assistance | | 322 | | 349 | | 295 | |
USO compensation | | 242 | | 415 | | 237 | |
Sales of modems | | 170 | | 163 | | 35 | |
Others | | 42 | | 143 | | 210 | |
Total Other Telecommunications Services Revenues | | 1,861 | | 2,287 | | 2,629 | |
TOTAL REVENUES | | 68,529 | | 71,238 | | 77,127 | |
|
|
|
|
|
|
|
|
Refer to Note 34 for details of related party transactions. | | | | | | | |
F - 73
PERUSAHAAN PERSEROAN (PERSERO)
PT TELEKOMUNIKASI INDONESIA Tbk AND SUBSIDIARIES
NOTES TO THE CONSOLIDATED FINANCIAL STATEMENTS
As of December 31, 2011 and 2012 and
for the years ended December 31, 2010, 2011 and 2012
(Figures in tables are presented in billions of rupiah, unless otherwise stated)
26. SERVICE CONCESSION ARRANGEMENT
The Ministry of Communication and Information (“MoCI”) issued Regulation No. 15/PER/M.KOMINFO/9/2005 dated September 30, 2005, which sets forth the basic policies underlying the USO program and requires telecommunications operators in Indonesia to contribute 0.75% of their gross revenues (with due consideration for bad debts and interconnection charges) for USO development. Based on the Government’s Decree No. 7/2009 dated January 16, 2009, the contribution is changed to 1.25% of gross revenues, net of bad debts and/or interconnection charges and/or connection charges.
Based on MoCI Decree No. 32/PER/M.KOMINFO/10/2008 dated October 10, 2008 which replaced MoCI Decree No. 11/PER/M.KOMINFO/04/2007 dated April 13, 2007 and MoCI Decree No. 38/PER/M.KOMINFO/9/2007 dated September 20, 2007, it is stipulated that, among others, in providing telecommunication access and services in rural areas (USO Program), the provider is determined through a selection process byBalai Telekomunikasi dan Informatika Pedesaan (“BTIP”) which was established based on MoCI Decree No. 35/PER/M.KOMINFO/11/2006 dated November 30, 2006. Subsequently, based on Decree No. 18/PER/M.KOMINFO/11/2010 dated November 19, 2010 of MoCI, BTIP was changed toBalai Penyedia dan Pengelola Pembiayaan Telekomunikasi dan Informatika (“BPPPTI”).
a. Company
On March 12, 2010, the Company was selected in a tender by the Government through BTIP to provide internet access service centers for USO sub-districts for a total amount of Rp322 billion, covering Nanggroe Aceh Darussalam, North Sumatera, North Sulawesi, Gorontalo, Central Sulawesi, West Sulawesi, South Sulawesi and South East Sulawesi.
On December 23, 2010, the Company was selected in a tender by the Government through BPPPTI to provide mobile internet access service centers for USO sub-districts for a total amount of Rp528 billion, covering Jambi, Riau, Kepulauan Riau, North Sulawesi, Central Sulawesi, Gorontalo, West Sulawesi, South East Sulawesi, Central Kalimantan, South Sulawesi, Papua and West Irian Jaya.
b. Telkomsel
On January 16, 2009 and January 23, 2009, Telkomsel was selected in a tender by the Government through BTIP to provide telecommunication access and services in rural areas (USO Program) for a total amount of Rp1.66 trillion, covering all Indonesian territories except Sulawesi, Maluku and Papua. Telkomsel will obtain local fixed-line licenses and the right to use radio frequency in the 2390 MHz - 2400 MHz bandwidths.
Subsequently, in 2010 and 2011, the agreements were amended, which amendments cover, among other matters, changing the price to Rp1.76 trillion and changing the term of payment from quarterly to monthly or quarterly.
In January 2010, the MoCI granted Telkomsel operating license to provide local fixed-line services under the USO program.
F - 74
PERUSAHAAN PERSEROAN (PERSERO)
PT TELEKOMUNIKASI INDONESIA Tbk AND SUBSIDIARIES
NOTES TO THE CONSOLIDATED FINANCIAL STATEMENTS
As of December 31, 2011 and 2012 and
for the years ended December 31, 2010, 2011 and 2012
(Figures in tables are presented in billions of rupiah, unless otherwise stated)
26.
SERVICE CONCESSION ARRANGEMENT(continued)
b. Telkomsel (continued)
On December 27, 2011, Telkomsel (on behalf of Konsorsium Telkomsel, a consortium which was established with Dayamitra on December 9, 2011) was selected by BPPPTI as a provider of the USO Program in the border areas for all packages (package 1 to package 13) with a total price of Rp830 billion. On such date, Telkomsel was also selected by BPPPTI as a provider of the USO Program (upgrading) “Desa Pinter” or “Desa Punya Internet” for packages 1, 2 and 3 with a total price of Rp261 billion.
On January 5, 2012 and January 9, 2012, Telkomsel (on behalf of Konsorsium Telkomsel) entered into agreements with BPPPTI for providing services under the USO programs Desa Pinter and in border areas, respectively.
The agreements contain, among other matters, the following provisions:
· Telkomsel and Konsorsium (“the Parties”) will receive advances representing 15% of the total contract price. Prior to payment of the advances, the Parties should issue bank guarantee for at least the same amount.
· The Parties are required to:
- Issue performance bonds representing 5% of the total contract price; and
- Provide end-to-end telecommunication access and services within approximately 60 months which are divided into pre-operating and operating phases.
· The Parties will receive progress payments from BPPPTI based on performance evaluation on a monthly or quarterly basis.
Dayamitra, through Telkomsel, has received the advance from BPPPTI for the USO Program in border areas amounting to Rp113 billion (net of tax). The bank guarantees for the advance and performance bonds were issued by Dayamitra. Part of the advance amounting to Rp28 billion was recorded as part of other current assets and the remainder was recorded as part of other non-current assets.
Telkomsel has received the advance from BPPPTI for the USO Program Desa Pinter amounting to Rp36 billion (net of tax). Telkomsel had issued bank guarantees with a total amount of Rp52 billion for the advance and as performance bonds.
Part of the advances received from BPPPTI from the USO Program in border areas and Desa Pinter totaling Rp37 billion was recorded as part of trade payables.
On December 31, 2012, the Company’s and Telkomsel’s trade receivables under the USO programs which are measured at amortized cost using the effective interest method amount to Rp533 billion (Notes 6 and 12).
For the years ended December 31, 2010, 2011 and 2012, the Company and Telkomsel recognized the following amounts:
| | 2010 | | 2011 | | 2012 | |
The Company | | | | | | | |
Revenue - construction | | - | | 112 | | 245 | |
Gain (loss) - construction | | - | | (16 | ) | 6 | |
F - 75
PERUSAHAAN PERSEROAN (PERSERO)
PT TELEKOMUNIKASI INDONESIA Tbk AND SUBSIDIARIES
NOTES TO THE CONSOLIDATED FINANCIAL STATEMENTS
As of December 31, 2011 and 2012 and
for the years ended December 31, 2010, 2011 and 2012
(Figures in tables are presented in billions of rupiah, unless otherwise stated)
26.
SERVICE CONCESSION ARRANGEMENT(continued)
| | 2010 | | 2011 | | 2012 | |
The Company and Telkomsel | | | | | | | |
Revenue - operation of telecommunication service centre | | 244 | | 255 | | 353 | |
Profit - operation of telecommunication service centre | | 79 | | 105 | | 83 | |
27. PERSONNEL EXPENSES
| | 2010 | | 2011 | | 2012 | |
Vacation pay, incentives and other benefits | | 2,575 | | 2,814 | | 3,400 | |
Salaries and related benefits | | 2,751 | | 3,001 | | 3,257 | |
Employees’ income tax | | 796 | | 1,043 | | 1,022 | |
Net periodic pension benefit cost (Note 32) | | 624 | | 629 | | 715 | |
Early retirement program (Note 15) | | - | | 517 | | 699 | |
Housing | | 214 | | 197 | | 200 | |
LSA expenses (Note33) | | 78 | | 96 | | 121 | |
Net periodic post-employment health care benefit cost (Note32) | | 238 | | 199 | | 90 | |
Insurance | | 68 | | 70 | | 83 | |
Net periodic other post-employment benefit cost (Note 32) | | 61 | | 53 | | 49 | |
Others (each below Rp50 billion) | | 42 | | 52 | | 59 | |
Total | | 7,447 | | 8,671 | | 9,695 | |
|
|
|
|
|
|
|
|
Refer to Note 34 for details of related party transactions. | | | | | | | |
28. OPERATIONS, MAINTENANCE AND TELECOMMUNICATION SERVICES EXPENSES
| | 2010 | | 2011 | | 2012 | |
Operations and maintenance | | 8,836 | | 9,184 | | 9,012 | |
Radio frequency usage charges (Notes 34c.i, 37c.i and 37c.iii) | | 2,892 | | 2,846 | | 3,002 | |
Concession fees andUniversal Service Obligationcharges(Note 26) | | 1,177 | | 1,235 | | 1,445 | |
Electricity, gas and water | | 841 | | 836 | | 879 | |
Cost of phone, set top box, SIM and RUIM cards | | 1,067 | | 967 | | 687 | |
Insurance | | 384 | | 431 | | 671 | |
Leased lines and CPE | | 215 | | 406 | | 407 | |
Vehicles rental and supporting facilities | | 283 | | 291 | | 293 | |
Cost of IT services | | 200 | | 144 | | 222 | |
Travelling expenses | | 60 | | 54 | | 57 | |
Others (each below Rp50 billion) | | 91 | | 59 | | 121 | |
Total | | 16,046 | | 16,453 | | 16,796 | |
|
|
|
|
|
|
|
|
Refer to Note 34 for details of related party transactions. |
|
|
|
|
|
|
|
F - 76
PERUSAHAAN PERSEROAN (PERSERO)
PT TELEKOMUNIKASI INDONESIA Tbk AND SUBSIDIARIES
NOTES TO THE CONSOLIDATED FINANCIAL STATEMENTS
As of December 31, 2011 and 2012 and
for the years ended December 31, 2010, 2011 and 2012
(Figures in tables are presented in billions of rupiah, unless otherwise stated)
29. GENERAL AND ADMINISTRATIVE EXPENSES
| | 2010 | | 2011 | | 2012 | |
Provision for impairment of receivables | | 525 | | 883 | | 915 | |
General expenses | | 301 | | 326 | | 527 | |
Collection expenses | | 401 | | 327 | | 341 | |
Travelling | | 260 | | 256 | | 259 | |
Training, education and recruitment | | 216 | | 229 | | 259 | |
Professional fees | | 163 | | 235 | | 187 | |
Social contribution | | 171 | | 290 | | 129 | |
Meetings | | 80 | | 86 | | 105 | |
Security and screening | | 215 | | 97 | | 62 | |
Stationery and printing | | 64 | | 53 | | 55 | |
Others (each below Rp50 billion) | | 141 | | 153 | | 197 | |
Total | | 2,537 | | 2,935 | | 3,036 | |
|
|
| | | | | |
Refer to Note 34 for details of related party transactions. | | | | | | | |
30. INTERCONNECTION EXPENSES
| | 2010 | | 2011 | | 2012 | |
Domestic interconnection and transit | | 1,980 | | 2,414 | | 3,464 | |
International interconnection | | 1,106 | | 1,141 | | 1,203 | |
Total | | 3,086 | | 3,555 | | 4,667 | |
| | | | | | | |
Refer to Note 34 for details of related party transactions. | | | | | | | |
31. TAXATION
a. Prepaid income taxes
| | 2011 | | 2012 | |
Corporate income taxes: | | | | | |
Subsidiaries | | 633 | | 52 | |
b. Prepaid other taxes
| | 2011 | | 2012 | |
Other taxes - The Company: | | | | | |
Value Added Tax (“VAT”) | | 43 | | - | |
Other taxes - Subsidiaries: | | | | | |
Import duties | | - | | 10 | |
VAT | | 471 | | 735 | |
Article 23 - Withholding tax on services | | 11 | | 11 | |
Total | | 525 | | 756 | |
F - 77
PERUSAHAAN PERSEROAN (PERSERO)
PT TELEKOMUNIKASI INDONESIA Tbk AND SUBSIDIARIES
NOTES TO THE CONSOLIDATED FINANCIAL STATEMENTS
As of December 31, 2011 and 2012 and
for the years ended December 31, 2010, 2011 and 2012
(Figures in tables are presented in billions of rupiah, unless otherwise stated)
31. TAXATION (continued)
c. Current income tax liabilities
| | 2011 | | 2012 | |
Corporate income taxes - The Company | | | | | |
Article 25 - Installment of corporate | | | | | |
income tax | | 40 | | 30 | |
Article 29 - Corporate income tax | | 1 | | 198 | |
Corporate income taxes - Subsidiaries: | | | | | |
Article 25 - Installment of corporate | | | | | |
income tax | | 6 | | 378 | |
Article 29 - Corporate income tax | | 682 | | 674 | |
Total | | 729 | | 1,280 | |
d. Other tax liabilities
| | 2011 | | 2012 | |
Other taxes - The Company: | | | | | |
Article 4 (2) - Final tax | | 4 | | 6 | |
Article 21 - Individual income tax | | 68 | | 21 | |
Article 23 - Withholding tax on services | | 11 | | 10 | |
Article 26 - Withholding tax on non-resident income | | 1 | | 3 | |
VAT | | - | | 374 | |
Sub-total | | 84 | | 414 | |
Other taxes - Subsidiaries: | | | | | |
Article 4 (2) - Final tax | | 29 | | 37 | |
Article 21 - Individual income tax | | 75 | | 60 | |
Article 23 - Withholding tax on services | | 25 | | 32 | |
Article 26 - Withholding tax on non-resident income | | 10 | | 18 | |
VAT | | 87 | | 3 | |
Sub-total | | 226 | | 150 | |
Total | | 310 | | 564 | |
F - 78
PERUSAHAAN PERSEROAN (PERSERO)
PT TELEKOMUNIKASI INDONESIA Tbk AND SUBSIDIARIES
NOTES TO THE CONSOLIDATED FINANCIAL STATEMENTS
As of December 31, 2011 and 2012 and
for the years ended December 31, 2010, 2011 and 2012
(Figures in tables are presented in billions of rupiah, unless otherwise stated)
31. TAXATION (continued)
e. The components of income tax expense (benefit) are as follows:
| | 2010 | | 2011 | | 2012 | |
Current | | | | | | | |
The Company | | 558 | | 777 | | 878 | |
Subsidiaries | | 4,111 | | 4,896 | | 5,750 | |
Sub-total | | 4,669 | | 5,673 | | 6,628 | |
Deferred | | | | | | | |
The Company | | 640 | | (7 | ) | (439 | ) |
Subsidiaries | | 203 | | (281 | ) | (281 | ) |
Net | | 843 | | (288 | ) | (720 | ) |
Total | | 5,512 | | 5,385 | | 5,908 | |
f. Reconciliation of income tax expense
The reconciliation between the income tax expense calculated by applying the applicable tax rate of 20% to the profit before income tax less income subject to final tax, and the net income tax expense as shown in the consolidated statements of comprehensive income is as follows:
| 2010 | | 2011 | | 2012 | |
Profit before income tax | 21,264 | | 20,735 | | 24,292 | |
Less income subject to final tax | (633 | ) | (462 | ) | (913 | ) |
| 20,631 | | 20,273 | | 23,379 | |
Tax calculated at the Company’s applicable statutory tax rate of 20% | 4,126 | | 4,055 | | 4,676 | |
Difference in applicable statutory tax rate for subsidiaries | 850 | | 906 | | 1,050 | |
Non-deductible expenses | 369 | | 326 | | 361 | |
Final income tax expense | 61 | | 63 | | 52 | |
Others | 106 | | 35 | | (231 | ) |
Net income tax expense | 5,512 | | 5,385 | | 5,908 | |
The computations of the income tax expense for the years ended December 31, 2010, 2011 and 2012 are as follows:
| | 2010 | | 2011 | | 2012 | |
Estimated taxable income of the Company | | 2,485 | | 3,568 | | 4,209 | |
The Company | | 497 | | 714 | | 842 | |
Final tax expense - Company | | 61 | | 63 | | 36 | |
Subsidiaries | | 4,111 | | 4,896 | | 5,750 | |
Total income tax expense - current | | 4,669 | | 5,673 | | 6,628 | |
F - 79
PERUSAHAAN PERSEROAN (PERSERO)
PT TELEKOMUNIKASI INDONESIA Tbk AND SUBSIDIARIES
NOTES TO THE CONSOLIDATED FINANCIAL STATEMENTS
As of December 31, 2011 and 2012 and
for the years ended December 31, 2010, 2011 and 2012
(Figures in tables are presented in billions of rupiah, unless otherwise stated)
31. TAXATION (continued)
f. Reconciliation of income tax expense (continued)
| | 2010 | | 2011 | | 2012 | |
Income tax expense (benefit) - deferred - effect of temporary differences at enacted | | | | | | | |
maximum tax rate (25% in 2010 and 2011, and 20% in 2012) | | | | | | | |
The Company | | | | | | | |
Provision for impairment of receivables and trade receivables written off | | (18 | ) | (47 | ) | 58 | |
Deferred installation fee | | 22 | | 21 | | 31 | |
Finance leases | | 8 | | (6 | ) | 31 | |
Accrued expenses and provisions for obsolescence | | 28 | | (4 | ) | 8 | |
Depreciation and gain on sales of property and equipment | | 243 | | (36 | ) | (348 | ) |
Accrued early retirement benefits | | 257 | | - | | (140 | ) |
Net periodic post-employment benefits costs | | 44 | | (30 | ) | (72 | ) |
Amortization of intangible assets, land rights and other | | (252 | ) | (4 | ) | (7 | ) |
Payments of deferred consideration for business combinations | | 308 | | 27 | | - | |
The Company- net | | 640 | | (7 | ) | (439 | ) |
Telkomsel | | | | | | | |
Charges from leasing transactions | | - | | - | | 23 | |
Depreciation ofproperty and equipment | | 241 | | (238 | ) | (156 | ) |
Provision for impairment of receivables and trade receivables written off | | (20 | ) | (14 | ) | (53 | ) |
Provision for employee benefits | | (15 | ) | (39 | ) | (49 | ) |
Accounts receivable - Government | | (17 | ) | (17 | ) | (14 | ) |
Amortization of license | | 7 | | - | | (5 | ) |
Telkomsel - net | | 196 | | (308) | | (254 | ) |
Subsidiaries -others - net | | 7 | | 27 | | (27 | ) |
Net income tax expense- deferred | | 843 | | (288 | ) | (720 | ) |
Income tax expense - net | | 5,512 | | 5,385 | | 5,908 | |
F - 80
PERUSAHAAN PERSEROAN (PERSERO)
PT TELEKOMUNIKASI INDONESIA Tbk AND SUBSIDIARIES
NOTES TO THE CONSOLIDATED FINANCIAL STATEMENTS
As of December 31, 2011 and 2012 and
for the years ended December 31, 2010, 2011 and 2012
(Figures in tables are presented in billions of rupiah, unless otherwise stated)
31. TAXATION
(continued)
f. Reconciliation of income tax expense (continued)
The Tax Law No. 36/2008 stipulates a reduction of 5% from the maximum rate applicable to qualifying listed companies, for those whose shares are traded on the IDX which meet the prescribed criteria that the public own 40% or more of the total fully paid and traded shares, and such shares are owned by at least 300 parties,witheach party owning less than 5% of the total paid-up shares. These requirements must be met by a company for a period of 6 months in one tax year. The Company has met all of the required criteria,therefore, for purposes of calculating income tax expense and liabilities for theyear endedDecember 31, 2010, 2011 and 2012, the Company hasreduced the applicable tax rate by 5%.
The Company applied a tax rate of 20% for the fiscal years 2010,2011 and 2012. The subsidiaries applied a tax rate of 25% for the fiscal years 2010,2011 and 2012.
The Company will submit the above corporate income tax computation in its income tax returns (“Surat Pemberitahuan Tahunan” or “Annual SPT”) for the fiscal year 2012 that will be reported to the Tax Office based on prevailing regulations. The amount of corporate income tax for the year ended December 31, 2011 agreed with what was reported in the 2011 Annual SPT.
g. Tax assessments
(i) The Company
The Directorate General of Tax (“DGT”) is assessing the Company’s withholding income taxes for fiscal year 2008 and as of the issuance date of the consolidated financial statements, the assessment is still in process.
(ii) Telkomsel
On February 25, 2009, the Tax Authorities filed a judicial review request to the Indonesian Supreme Court (“SC”) for the Tax Court’s acceptance of Telkomsel’s appeal for a refund of Rp115 billion withholding taxes covering the fiscal year 2002. On April 3, 2009, Telkomsel filed a contra-appeal to the SC. Based on its verdict which was received in November 2012, the SC decided to reject the request of the Tax Authorities. The SC verdict is legally binding in favor of Telkomsel.
On August 10, 2010, the Tax Authorities filed a judicial review request to the SC on the Tax Court’s verdict. On September 24, 2010, Telkomsel filed a contra-appeal to the SC. As of the issuance date of the consolidated financial statements, the judicial review is still in process.
On April 21, 2010, the Tax Court notified Telkomsel that the Tax Authorities have filed an appeal to the SC on the Tax Court’s verdict to cancel the Tax Collection Letter (STP) for the underpayment of income tax Article 25 for the period December 2008 of Rp429 billion (including a penalty of Rp8 billion). In May 2010, Telkomsel filed a contra-appeal to the SC. As of the issuance date of the consolidated financial statements, the appeal is still in process.
F - 81
PERUSAHAAN PERSEROAN (PERSERO)
PT TELEKOMUNIKASI INDONESIA Tbk AND SUBSIDIARIES
NOTES TO THE CONSOLIDATED FINANCIAL STATEMENTS
As of December 31, 2011 and 2012 and
for the years ended December 31, 2010, 2011 and 2012
(Figures in tables are presented in billions of rupiah, unless otherwise stated)
TABLE OF CONTENTS
31. TAXATION (continued)
g. Tax assessments (continued)
(ii) Telkomsel (continued)
In 2010, Telkomsel was assessed for underpayments of corporate income tax, withholding taxes and VAT for the fiscal year 2006 totaling Rp212 billion (including penalty of Rp69 billion). In November 2010, Telkomsel paid the assessments and in December 2010, Telkomsel filed an objection to the DGT for the withholding tax and VAT assessments amounting to Rp116 billion (including a penalty of Rp38 billion) and recorded the payments as a claim for tax refund. A portion of the assessment accepted by the Company in the amount of Rp50 billion had been previously charged to the 2008 consolidated statement of comprehensive income while the remaining portion of Rp46 billion was charged to the 2010 consolidated statement of comprehensive income. Subsequently, in September 2011, the Tax Authorities rejected Telkomsel’s objection. In December 2011, Telkomsel filed an appeal to the Tax Court. As of the issuance date of the consolidated financial statements, the appeal is still in process.
In October and November 2010, Telkomsel received tax assessments (STPs) for the underpayments of income tax Article 25 for the fiscal year 2010 of Rp229 billion (including penalty of Rp11 billion). The STPs were paid in November and December 2010. The principal payment of Rp218 billion was considered as a tax prepayment in calculating the 2010 corporate income tax which at the end resulted in an overpayment of Rp599.87 billion. Through its letters in November 2010, Telkomsel requested the Tax Authorities to cancel the STPs. Subsequently, in April 2011, Telkomsel received STPs from the Tax Authorities which revised the above-mentioned STPs issued in October and November 2010 with an additional penalty of Rp4.3 billion.
On May 5, 2011, the Tax Authorities rejected Telkomsel’s request for cancellation of those STPs. Subsequently, on May 31, 2011, Telkomsel filed an appeal to the Tax Court. The overpayment and penalty are recognized as claims for tax refund as of December 31, 2011. Based on its verdict in March 2012, the Tax Court approved the cancellation of the STPs. In May and June 2012, Telkomsel received the refund of the penalty of Rp15.7 billion. On July 17, 2012, the Tax Authorities filed a judicial review request to the SC. Subsequently, on September 14, 2012, Telkomsel filed a contra appeal to the SC. As of the issuance date of the consolidated financial statements, the appeal is still in process.
In August 2011, Telkomsel was assessed for underpayments of withholding taxes and VAT for the fiscal year 2008 totaling Rp235 billion. In September 2011, Telkomsel paid the assessments and in November 2011, Telkomsel filed an objection to the Tax Authorities for the VAT assessment amounting to Rp232 billion (including penalty of Rp81.9 billion) and recorded it as a claim for tax refund. The remaining portion of Rp3 billion was charged to the 2011 consolidated statement of comprehensive income. In August 2012, the Tax Court approved Telkomsel’s appeal on the VAT and the refund of all the claims.
F - 82
PERUSAHAAN PERSEROAN (PERSERO)
PT TELEKOMUNIKASI INDONESIA Tbk AND SUBSIDIARIES
NOTES TO THE CONSOLIDATED FINANCIAL STATEMENTS
As of December 31, 2011 and 2012 and
for the years ended December 31, 2010, 2011 and 2012
(Figures in tables are presented in billions of rupiah, unless otherwise stated)
31. TAXATION (continued)
g. Tax assessments (continued)
(ii) Telkomsel (continued)
On March 12, 2012, Telkomsel received Assessment Letters as a result of the tax audit for fiscal year 2010 by the Tax Authorities. Based on the letters, Telkomsel overpaid corporate income tax by Rp597.4 billion and underpaid VAT amounting to Rp302.7 billion (including penalty of Rp73.3 billion). Telkomsel accepted the overpayment of corporate income tax and Rp12.1 billion underpayment of VAT (including penalty of Rp6.3 billion). The portion accepted by Telkomsel was charged to the 2012 consolidated statement of comprehensive income. Telkomsel filed an objection to the Tax Authorities for the VAT assessment of Rp290.6 billion (including penalty of Rp67 billion) and recorded a claim for tax refund. As of the issuance date of the consolidated financial statements, the Tax Authorities have not yet issued their decision on the objection.
On April 5, 2012, Telkomsel received the refund of the overpayment of corporate income tax for fiscal year 2010 amounting to Rp294.7 billion, net of the underpayment of VAT.
h. Deferred tax assets and liabilities
The details of the Company and subsidiaries' deferred tax assets and liabilities are as follows:
| | | (Charged) credited to the | | | | | |
| | | consolidated statement of | | Recognized in other | | | |
| December 31, 2010 | | comprehensive income | | comprehensive income | | December 31, 2011 | |
The Company | | | | | | | | |
Deferred tax assets: | | | | | | | | |
Deferred consideration for business combinations | 27 | | (27 | ) | - | | - | |
Provision for impairment of receivables | 287 | | 47 | | - | | 334 | |
Net periodic pension and other post-employment | | | | | | | | |
benefit cost | 47 | | 34 | | 253 | | 334 | |
Accrued expenses and provision for inventory | | | | | | | | |
obsolescence | 26 | | 4 | | - | | 30 | |
Provision for employee benefits | 86 | | (4 | ) | - | | 82 | |
Deferred connection fee | 106 | | (21 | ) | - | | 85 | |
Total deferred tax assets | 579 | | 33 | | 253 | | 865 | |
Deferred tax liabilities: | | | | | | | | |
Difference between accounting and tax property and equipment net book value | (1,893 | ) | (36 | ) | - | | (1,929 | ) |
Land rights, intangible assets and others | (25 | ) | 4 | | - | | (21 | ) |
Finance leases | (39 | ) | 6 | | - | | (33 | ) |
Total deferred tax liabilities | (1,957 | ) | (26 | ) | - | | (1,983 | ) |
Net deferred tax liabilities | (1,378 | ) | 7 | | 253 | | (1,118 | ) |
F - 83
PERUSAHAAN PERSEROAN (PERSERO)
PT TELEKOMUNIKASI INDONESIA Tbk AND SUBSIDIARIES
NOTES TO THE CONSOLIDATED FINANCIAL STATEMENTS
As of December 31, 2011 and 2012 and
for the years ended December 31, 2010, 2011 and 2012
(Figures in tables are presented in billions of rupiah, unless otherwise stated)
31. TAXATION (continued)
h. Deferred tax assets and liabilities (continued)
| | | | (Charged) credited to the | | | | | |
| | | | consolidated statement of | | Recognized in other | | | |
| | December 31, 2010 | | comprehensive income | | comprehensive income | | December 31, 2011 | |
Telkomsel | | | | | | | | | |
Deferred tax assets: | | | | | | | | | |
Provision for impairment of receivables | | 50 | | 14 | | - | | 64 | |
Provision for employee benefits | | 173 | | 39 | | 65 | | 277 | |
Total deferred tax assets | | 223 | | 53 | | 65 | | 341 | |
Deferred tax liabilities: | | | | | | | | | |
Depreciation of fixed assets | | (2,757 | ) | 238 | | - | | (2,519 | ) |
License amortization | | (48 | ) | - | | - | | (48 | ) |
Accounts receivable - Government | | (25 | ) | 17 | | - | | (8 | ) |
Total deferred tax liabilities | | (2,830 | ) | 255 | | - | | (2,575) | |
Net deferred tax liabilities of Telkomsel | | (2,607 | ) | 308 | | 65 | | (2,234 | ) |
deferred tax liabilities of the other subsidiaries | | (62 | ) | (34 | ) | - | | (96 | ) |
Total deferred tax liabilities | | (4,047 | ) | 281 | | 318 | | (3,448 | ) |
Net deferred tax assets of other subsidiaries | | 64 | | 7 | | 4 | | 75 | |
| | | | (Charged) credited to the | | | | | | | |
| | | | consolidated statement of | | Recognized in other | | | | | |
| | December 31, 2011 | | comprehensive income | | comprehensive income | | Realized to equity | | December 31, 2012 | |
The Company | | | | | | | | | | | |
Deferred tax assets: | | | | | | | | | | | |
Provision for impairment of receivables | | 334 | | (58 | ) | - | | - | | 276 | |
Net periodic pension and other post-employment benefit cost | | 334 | | (19 | ) | 303 | | - | | 618 | |
Accrued expenses and provision for inventory obsolescence | | 30 | | (8 | ) | - | | - | | 22 | |
Provison for early retirement expense | | - | | 140 | | - | | - | | 140 | |
Provision for employee benefits | | 82 | | 91 | | - | | - | | 173 | |
Deferred connection fee | | 85 | | (31 | ) | - | | - | | 54 | |
Total deferred tax assets | | 865 | | 115 | | 303 | | - | | 1,283 | |
Deferred tax liabilities: | | | | | | | | | | | |
Difference between accounting and tax property and equipment net book value | | (1,929 | ) | 348 | | - | | - | | (1,581 | ) |
Land rights, intangible assets and others | | (21 | ) | 7 | | - | | - | | (14 | ) |
Finance leases | | (33 | ) | (31 | ) | - | | - | | (64 | ) |
Total deferred tax liabilities | | (1,983 | ) | 324 | | - | | - | | (1,659 | ) |
Net deferred tax liabilities | | (1,118 | ) | 439 | | 303 | | - | | (376 | ) |
F - 84
PERUSAHAAN PERSEROAN (PERSERO)
PT TELEKOMUNIKASI INDONESIA Tbk AND SUBSIDIARIES
NOTES TO THE CONSOLIDATED FINANCIAL STATEMENTS
As of December 31, 2011 and 2012 and
for the years ended December 31, 2010, 2011 and 2012
(Figures in tables are presented in billions of rupiah, unless otherwise stated)
31. TAXATION (continued)
h. Deferred tax assets and liabilities (continued)
| | | | (Charged)credited to the | | | | | | | |
| | | | consolidated statement of | | Recognized in other | | | | | |
| | December 31, 2011 | | comprehensive income | | comprehensive income | | Realized to equity | | December 31, 2012 | |
Telkomsel | | | | | | | | | | | |
Deferred tax assets: | | | | | | | | | | | |
Provision for impairment of receivables | | 64 | | 53 | | - | | - | | 117 | |
Provision for employee benefits | | 277 | | 49 | | (29 | ) | - | | 297 | |
Recognition of interest under USO arrangements | | (8 | ) | 14 | | - | | - | | 6 | |
Total deferred tax assets | | 333 | | 116 | | (29 | ) | - | | 420 | |
Deferred tax liabilities: | | | | | | | | | | | |
Difference between accounting and tax property | | | | | | | | | | | |
and equipment net book value | | (2,519 | ) | 156 | | - | | - | | (2,363 | ) |
License amortization | | (48 | ) | 5 | | - | | - | | (43 | ) |
Finance leases | | - | | (23 | ) | - | | - | | (23 | ) |
Total deferred tax liabilities | | (2,567 | ) | 138 | | - | | - | | (2,429 | ) |
Netdeferred tax liabilities of Telkomsel | | (2,234 | ) | 254 | | (29 | ) | - | | (2,009 | ) |
Net deferred tax liabilities of the other subsidiaries | | (96 | ) | (4 | ) | 0 | | - | | (100 | ) |
Total deferred tax liabilities | | (3,448 | ) | 689 | | 274 | | - | | (2,485 | ) |
Net deferred tax assets of other subsidiaries | | 75 | | 31 | | 1 | | (5 | ) | 102 | |
As of December 31, 2011 and 2012, the aggregate amounts of temporary differences associated with investments in subsidiary and associates, for which deferred tax liabilities have not been recognized, amounted to Rp16,505 billion and Rp20,317 billion, respectively.
Realization of the deferred tax assets is dependent upon the Company’s and subsidiaries’ capability in generating future profitable operations. Although realization is not assured, the Company and subsidiaries believe that it is probable that these deferred tax assets will be realized through reduction of future taxable income when temporary differences reverse. The amount of deferred tax assets is considered realizable, however, it could be reduced if actual future taxable income is lower than estimates.
i. Administration
From 2008 to 2011, the Company has been consecutively entitled to income tax rate reduction of 5% for meeting the requirements set forth in the Government Regulation No. 81/2007 in conjunction with the Ministry of Finance Regulation No. 238/PMK.03/2008. On the basis of historical data, for the year 2012, the Company calculated deferred tax using the tax rate of 20%.
The taxation laws of Indonesia require that the Company and subsidiaries submit individual tax returns on the basis of self-assessment. Under prevailing regulations, the DGT may assess or amend taxes within a certain period. For fiscal years 2007 and earlier, this period is within ten years from the time the tax became due, but not later than 2013, while for fiscal years 2008 and onwards, the period is within five years from the time the tax becomes due.
F - 85
PERUSAHAAN PERSEROAN (PERSERO)
PT TELEKOMUNIKASI INDONESIA Tbk AND SUBSIDIARIES
NOTES TO THE CONSOLIDATED FINANCIAL STATEMENTS
As of December 31, 2011 and 2012 and
for the years ended December 31, 2010, 2011 and 2012
(Figures in tables are presented in billions of rupiah, unless otherwise stated)
31. TAXATION(continued)
i. Administration(continued)
The Minister of Finance of the Republic of Indonesia has issued Regulation No.85/PMK.03/2012 dated June 6, 2012 concerning the appointment of State-Owned Enterprises ("SOEs") to withhold, deposit and report VAT and Sales Tax on Luxury Goods ("PPnBM") according to the procedures outlined in the Regulation. The Regulation is effective from July 1, 2012 and the Company has withheld, deposited and reported the VAT and PPnBM or VAT in accordance with the Regulation.
No tax audit has been conducted for fiscal years 2003, 2005, 2006, 2007, 2009 and 2010 on the Company. Tax audits have been completed for all other fiscal years, except for fiscal year 2011.
The Company received a certificate of tax audit exemption from the DGT for fiscal year 2007, 2008, 2009 and 2010, which is valid unless the Company files for corporate income tax overpayment, in which case a tax audit will be performed.
32. PENSION BENEFIT AND OTHER POST-EMPLOYMENT BENEFIT OBLIGATIONS
| | Notes | | 2011 | | 2012 | |
Prepaid pension benefit cost | | | | | | | |
The Company - funded | | 32a.i.a | | 765 | | - | |
Infomedia | | | | 0 | | 0 | |
Prepaid pension benefit cost | | | | 765 | | 0 | |
Pension benefit cost and other | | | | | | | |
post-employment benefit obligations | | | | | | | |
Pension benefit cost provisions | | | | | | | |
The Company | | | | | | | |
Funded | | 32a.i.a | | - | | 810 | |
Unfunded | | 32a.i.b | | 1,668 | | 1,798 | |
Telkomsel | | 32a.ii | | 779 | | 806 | |
Total pension benefit cost provisions | | | | 2,447 | | 3,414 | |
Post-employment health care benefit provisions | | 32b | | 1,561 | | 3,249 | |
Other post-employment benefit provisions | | 32c | | 434 | | 487 | |
Obligation under the Labor Law provisions | | 32d | | 130 | | 156 | |
Total pension benefit cost and other | | | | | | | |
post-employment benefit obligations | | | | 4,572 | | 7,306 | |
F - 86
PERUSAHAAN PERSEROAN (PERSERO)
PT TELEKOMUNIKASI INDONESIA Tbk AND SUBSIDIARIES
NOTES TO THE CONSOLIDATED FINANCIAL STATEMENTS
As of December 31, 2011 and 2012 and
for the years ended December 31, 2010, 2011 and 2012
(Figures in tables are presented in billions of rupiah, unless otherwise stated)
32. PENSION BENEFIT AND OTHER POST-EMPLOYMENT BENEFIT OBLIGATIONS (continued)
| | Notes | | 2010 | | 2011 | | 2012 | |
Net periodic pension benefit cost | | | | | | | | | |
The Company | | 32a.i.a,32a.i.b | | 554 | | 524 | | 543 | |
Telkomsel | | 32a.ii | | 70 | | 105 | | 172 | |
Infomedia | | | | 0 | | 0 | | 0 | |
Net periodic pension benefit cost | | 27 | | 624 | | 629 | | 715 | |
Net periodic post-employment health care benefit cost | | 27,32b | | 238 | | 199 | | 90 | |
Net periodic other post-employment benefit cost | | 27,32c | | 61 | | 53 | | 49 | |
Cost of obligation under the Labor Law | | 32d | | 23 | | 30 | | 35 | |
Amounts recognized inOCI are as follows:
| | Notes | | 2010 | | 2011 | | 2012 | |
Defined benefit plan actuarial losses (gains) | | | | | | | | | |
Pension benefit cost | | | | | | | | | |
The Company - netof asset ceiling limitation | | 32a.i.a,32a.i.b | | 119 | | 973 | | 1,488 | |
Telkomsel | | 32a.ii | | 142 | | 260 | | (103 | ) |
Post-employment health care benefit | | 32b | | 344 | | 986 | | 1,897 | |
Other post-employment benefit | | 32c | | 53 | | 40 | | 32 | |
Obligation under the Labor Law | | 32d | | 10 | | 21 | | (8 | ) |
Sub-total | | | | 668 | | 2,280 | | 3,306 | |
Deferred tax effect at the applicable tax rates | | 31h | | (81 | ) | (322 | ) | (275 | ) |
Defined benefit plan actuarial losses, net of tax | | | | 587 | | 1,958 | | 3,031 | |
F - 87
PERUSAHAAN PERSEROAN (PERSERO)
PT TELEKOMUNIKASI INDONESIA Tbk AND SUBSIDIARIES
NOTES TO THE CONSOLIDATED FINANCIAL STATEMENTS
As of December 31, 2011 and 2012 and
for the years ended December 31, 2010, 2011 and 2012
(Figures in tables are presented in billions of rupiah, unless otherwise stated)
TABLE OF CONTENTS
32. PENSION BENEFIT AND OTHER POST-EMPLOYMENT BENEFIT OBLIGATIONS (continued)
a. Pension benefit cost
i. The Company
a. Funded pension plan
The Company sponsors a defined benefit pension plan for employees with permanent status prior to July 1, 2002. The pension benefit is paid based on the participating employees’ latest basic salaries at retirement and the number of years of their service. The plan is managed by Telkom Pension Fund (“Dana Pensiun Telkom” or “Dapen”). The participating employees contribute 18% (before March 2003: 8.4%) of their basic salaries to the pension plan. The Company’s contributions to the pension fund for the years ended December 31, 2010, 2011 and 2012 amounted to Rp485 billion, Rp187 billion, and Rp186 billion, respectively.
The following table presents the change in projected pension benefit obligations, change in pension plan assets, funded status of the pension plan and net amount recognized in the Company’s consolidated statements of financial position as of December 31,2011 and 2012, for its defined benefit pension plan:
| | 2011 | | 2012 | |
Changes in projected pension benefit obligations | | | | | |
Projected pension benefit obligations at beginning of year | | 11,924 | | 16,188 | |
Service costs | | 307 | | 372 | |
Interest costs | | 1,105 | | 1,151 | |
Pension plan participants’ contributions | | 44 | | 44 | |
Actuarial losses | | 3,391 | | 2,123 | |
Expected pension benefits paid | | (583 | ) | (629 | ) |
Projected pension benefit obligations at end of year | | 16,188 | | 19,249 | |
Changes in pension benefit plan assets | | | | | |
Fair value of pension plan assets at beginning of year | | 15,098 | | 16,597 | |
Expected return on pension plan assets | | 1,441 | | 1,517 | |
Employer’s contributions | | 187 | | 186 | |
Pension plan participants' contributions | | 44 | | 44 | |
Actuarial gains | | 410 | | 507 | |
Expected pension benefits paid | | (583 | ) | (629 | ) |
Fair value of pension plan assets at end of year | | 16,597 | | 18,222 | |
Funded status | | 409 | | (1,027 | ) |
Unrecognized prior service costs | | 356 | | 217 | |
Prepaid (provision for) pension benefit cost | | 765 | | (810) | |
F - 88
PERUSAHAAN PERSEROAN (PERSERO)
PT TELEKOMUNIKASI INDONESIA Tbk AND SUBSIDIARIES
NOTES TO THE CONSOLIDATED FINANCIAL STATEMENTS
As of December 31, 2011 and 2012 and
for the years ended December 31, 2010, 2011 and 2012
(Figures in tables are presented in billions of rupiah, unless otherwise stated)
32. PENSION BENEFIT AND OTHER POST-EMPLOYMENT BENEFIT OBLIGATIONS (continued)
a. Pension benefit cost (continued)
i. The Company (continued)
a. Funded pension plan (continued)
As of December 31, 2011 and 2012, plan assets consisted of :
| | 2011 | | 2012 | |
Indonesian equity securities | | 22.13% | | 21.82% | |
Government bonds | | 39.67% | | 37.96% | |
Corporate bonds | | 17.37% | | 16.91% | |
Others | | 20.83% | | 23.31% | |
Total | | 100.00% | | 100.00% | |
Pension plan assets also include Series B shares issued by the Company with fair value totaling Rp234 billion and Rp223 billion representing 1.41% and 1.23% of total assets as of December 31, 2011 and 2012, respectively, and bonds issued by the Company with fair value totaling Rp156 billion and Rp159 billion representing 0.94% and 0.87% of total assets as of December 31, 2011 and 2012, respectively.
The expected return is determined based on market expectation for returns over the entire life of the obligation by considering the portfolio mix of the plan assets. The actual return on plan assets wasRp2,891 billion, Rp1,851 billion and Rp2,024 for the years ended December 31, 2010, 2011 and 2012, respectively. The Company expects to contribute Rp179 billion to its defined benefit pension plan during 2013.
The movements of the prepaid pension benefit cost during the years ended December 31, 2011 and 2012 are as follows:
| | 2011 | | 2012 | |
Prepaid pension benefit cost at beginning of year | | 1,417 | | 765 | |
Net periodic pension cost | | (110 | ) | (145 | ) |
Loss recognized via the OCI | | (2,981 | ) | (1,616 | ) |
Assetceiling recognized via the OCI | | 2,252 | | - | |
Employer’s contributions | | 187 | | 186 | |
Prepaid (provision for) pension benefit cost at end ofyear | | 765 | | (810 | ) |
F - 89
PERUSAHAAN PERSEROAN (PERSERO)
PT TELEKOMUNIKASI INDONESIA Tbk AND SUBSIDIARIES
NOTES TO THE CONSOLIDATED FINANCIAL STATEMENTS
As of December 31, 2011 and 2012 and
for the years ended December 31, 2010, 2011 and 2012
(Figures in tables are presented in billions of rupiah, unless otherwise stated)
32. PENSION BENEFIT AND OTHER POST-EMPLOYMENT BENEFIT OBLIGATIONS (continued)
a. Pension benefit cost (continued)
i. The Company (continued)
a. Funded pension plan (continued)
The components of net periodic pension benefit cost are as follows:
| | 2010 | | 2011 | | 2012 | |
Service costs | | 254 | | 307 | | 372 | |
Interest costs | | 1,003 | | 1,105 | | 1,151 | |
Expected return on pension plan assets | | (1,287 | ) | (1,441 | ) | (1,517 | ) |
Amortization of prior service cost | | 139 | | 139 | | 139 | |
Net periodic pension benefit cost | | 109 | | 110 | | 145 | |
Amount charged to subsidiaries | | | | | | | |
under contractual agreements | | (2 | ) | (2 | ) | (12 | ) |
Net periodic pension benefit cost - net | | 107 | | 108 | | 133 | |
Amounts recognized inOCI are as follows:
| | 2010 | | 2011 | | 2012 | |
Cumulative amount at beginning of year | | 470 | | 528 | | 1,257 | |
Actuarial losses (gains) recognized during the year | | (489 | ) | 2,981 | | 1,616 | |
Asset ceiling limitation | | 547 | | (2,252 | ) | - | |
Cumulative amount at end of year | | 528 | | 1,257 | | 2,873 | |
The actuarial valuation for the defined benefit pension plan and the other post-employment benefits was performed based on the measurement date as of December 31, 2010,2011 and 2012, with reports dated March 15, 2011,March 7, 2012 andFebruary28,2013, respectively, by PT Towers Watson Purbajaga (“TWP”), an independent actuary in association with Towers Watson (“TW”) (formerly Watson Wyatt Worldwide). The principal actuarial assumptions used by the independent actuary as of December 31, 2011 and 2012 are as follows:
| | 2011 | | 2012 | |
Discount rate | | 7.25% | | 6.25% | |
Expected long-term return on plan assets | | 9.25% | | 8.25% | |
Rate of compensation increases | | 8% | | 8% | |
F - 90
PERUSAHAAN PERSEROAN (PERSERO)
PT TELEKOMUNIKASI INDONESIA Tbk AND SUBSIDIARIES
NOTES TO THE CONSOLIDATED FINANCIAL STATEMENTS
As of December 31, 2011 and 2012 and
for the years ended December 31, 2010, 2011 and 2012
(Figures in tables are presented in billions of rupiah, unless otherwise stated)
32. PENSION BENEFIT AND OTHER POST-EMPLOYMENT BENEFIT OBLIGATIONS (continued)
a. Pension benefit cost (continued)
i. The Company (continued)
a. Funded pension plan (continued)
Historical information:
| | January 1, 2010 | | December 31, 2010 | | December 31, 2011 | | December 31, 2012 | |
Present value of funded defined benefit | | | | | | | | | |
obligation | | (10,131 | ) | (11,924 | ) | (16,188 | ) | (19,249 | ) |
Fair value of plan assets | | 12,300 | | 15,098 | | 16,597 | | 18,222 | |
(Deficit) surplus in the plan | | 2,169 | | 3,174 | | 409 | | (1,027 | ) |
Experience adjustments arising on plan liabilities | | (318 | ) | (314 | ) | (156 | ) | (1 | ) |
Experience adjustments arising on planassets | | (2,028 | ) | (1,604 | ) | (410 | ) | (507 | ) |
b. Unfunded pension plan
The Company sponsors unfunded defined benefit pension plans and a defined contribution pension plan.
The defined contribution pension plan is provided to employees hired with permanent status on or after July 1, 2002. The plan is managed by Financial Institutions Pension Fund (“Dana Pensiun Lembaga Keuangan” or “DPLK”). The Company’s contribution to DPLK is determined based on a certain percentage of the participants’ salaries and amounted to Rp4 billion, Rp5 billion and Rp5 billion for the years ended December 31, 2010, 2011 and2012, respectively.
Since 2007, the Company has provided pension benefits based on uniformulation for both participants prior to and from April 20, 1992 effective for employees retiring beginning February 1, 2009. The change in benefits had increased the Company’s liabilities by Rp699 billion, which is being amortized over 9.9 years until 2016. In 2010, the Company replaced the uniformulation with “Manfaat Pensiun Sekaligus” (“MPS”). MPS is given to those employees reaching retirement age, upon death or upon becoming disabled starting from February 1, 2009. The change in benefit had increased the Company’s liabilities by Rp435 billion, which is being amortized over 8.63 years until 2018.
The Company also provides benefits to employees during a pre-retirement period in which they are inactive for 6 months prior to their normal retirement age of 56 years, known as pre-retirement benefits (“Masa Persiapan Pensiun” or “MPP”). During the pre-retirement period, the employees still receive benefits provided to active employees, which include, but are not limited to, regular salary, health care, annual leave, bonus and other benefits. Since 2012, the Company has issued a new requirement for MPP that effective for employees retiring beginning April 1, 2012, the employee is required to file a request for MPP and, if the employee does not file the request, he or she is required to work until the retirement date.
F - 91
PERUSAHAAN PERSEROAN (PERSERO)
PT TELEKOMUNIKASI INDONESIA Tbk AND SUBSIDIARIES
NOTES TO THE CONSOLIDATED FINANCIAL STATEMENTS
As of December 31, 2011 and 2012 and
for the years ended December 31, 2010, 2011 and 2012
(Figures in tables are presented in billions of rupiah, unless otherwise stated)
32. PENSION BENEFIT AND OTHER POST-EMPLOYMENT BENEFIT OBLIGATIONS (continued)
a. Pension benefit cost (continued)
i. The Company (continued)
b. Unfunded pension plan (continued)
The following table presents the changes in projected pension benefit obligation pertaining to MPS and MPP for the years ended December 31, 2011 and 2012:
| | 2011 | | 2012 | |
Changes in projected pension benefit obligation | | | | | |
Unfunded projected pension benefit obligation at beginning of year | | 2,096 | | 2,440 | |
Service costs | | 89 | | 104 | |
Interest costs | | 194 | | 173 | |
Actuarial losses (gain) | | 244 | | (128 | ) |
Benefits paid by employer | | (183) | | (152 | ) |
Unfunded projected pension benefit obligation at end of year | | 2,440 | | 2,437 | |
Unrecognized prior service costs | | (772 | ) | (639 | ) |
Pension benefit cost provisions at end of year | | 1,668 | | 1,798 | |
The movements of the pension benefit cost provisions during the years ended December 31, 2011 and 2012, are as follows:
| | 2011 | | 2012 | |
Pension benefit cost provisions at beginning of year | | 1,191 | | 1,668 | |
Net periodic pension benefit cost | | 416 | | 410 | |
Benefits paid directly by employer | | (183 | ) | (152 | ) |
Loss (gain) recognized via the OCI | | 244 | | (128 | ) |
Pension benefit cost provisions at end of year | | 1,668 | | 1,798 | |
F - 92
PERUSAHAAN PERSEROAN (PERSERO)
PT TELEKOMUNIKASI INDONESIA Tbk AND SUBSIDIARIES
NOTES TO THE CONSOLIDATED FINANCIAL STATEMENTS
As of December 31, 2011 and 2012 and
for the years ended December 31, 2010, 2011 and 2012
(Figures in tables are presented in billions of rupiah, unless otherwise stated)
32. PENSION BENEFIT AND OTHER POST-EMPLOYMENT BENEFIT OBLIGATIONS (continued)
a. Pension benefit cost (continued)
i. The Company (continued)
b. Unfunded pension plan (continued)
The components of net periodic pension benefit cost are as follows:
| | 2010 | | 2011 | | 2012 | |
Service costs | | 77 | | 89 | | 104 | |
Interest costs | | 197 | | 194 | | 173 | |
Amortization of prior service costs | | 173 | | 133 | | 133 | |
Net periodic pension benefit cost | | 447 | | 416 | | 410 | |
Amounts recognized in OCI are as follows: |
|
|
|
|
|
|
|
| | 2010 | | 2011 | | 2012 | |
Cumulative amount at beginning of year | | 414 | | 475 | | 719 | |
Actuarial (gains) losses recognized during the year | | 61 | | 244 | | (128 | ) |
Cumulative amount at end of year | | 475 | | 719 | | 591 | |
Historical information :
| January 1, 2010 | | December 31, 2010 | | December 31,2011 | | December 31, 2012 | |
Present value of unfunded defined benefit obligation | (1,622 | ) | (2,096 | ) | (2,440 | ) | (2,437 | ) |
Fair value of plan assets | - | | - | | - | | - | |
Deficit in the plan | (1,622 | ) | (2,096 | ) | (2,440 | ) | (2,437 | ) |
Experience adjustments arising on plan liabilities | 309 | | 23 | | (30 | ) | (72 | ) |
ii. Telkomsel
Telkomsel provides a defined benefit pension plan to its employees. Under this plan, employees are entitled to pension benefits based on their latest basic salary or take-home pay and the number of years of their service. PT Asuransi Jiwasraya (“Jiwasraya”), a state-owned life insurance company, manages the plan under an annuity insurance contract. Until 2004, the employees contributed 5% of their monthly salaries to the plan and Telkomsel contributed any remaining amount required to fund the plan. Starting 2005, the entire contributions have been fully made by Telkomsel.
Telkomsel's contributions to Jiwasraya amounted to Rp40 billion,Rp2 billion and Rp45 billion for the years ended December 31, 2010,2011 and 2012, respectively.
F - 93
PERUSAHAAN PERSEROAN (PERSERO)
PT TELEKOMUNIKASI INDONESIA Tbk AND SUBSIDIARIES
NOTES TO THE CONSOLIDATED FINANCIAL STATEMENTS
As of December 31, 2011 and 2012 and
for the years ended December 31, 2010, 2011 and 2012
(Figures in tables are presented in billions of rupiah, unless otherwise stated)
32. PENSION BENEFIT AND OTHER POST-EMPLOYMENT BENEFIT OBLIGATIONS (continued)
a. Pension benefit cost (continued)
ii. Telkomsel (continued)
The following table presents the changes in the projected pension benefit obligation for the years ended December 31, 2011 and 2012.
| | 2011 | | 2012 | |
Changes in projected pension benefit obligation | | | | | |
Projected benefits obligation | | 663 | | 1,237 | |
Service costs | | 67 | | 120 | |
Interest costs | | 59 | | 83 | |
Actuarial losses | | 452 | | 37 | |
Expected benefits paid | | (4 | ) | (5 | ) |
Projected benefits obligation | | 1,237 | | 1,472 | |
Fair value of plan assets | | 246 | | 458 | |
Expected return on plan assets | | 22 | | 31 | |
Employer’s contributions | | 2 | | 42 | |
Actuarial gains | | 192 | | 140 | |
Expected benefits paid | | (4 | ) | (5 | ) |
Fair value of plan assets | | 458 | | 666 | |
Funded status | | (779 | ) | (806 | ) |
Unrecognized prior service costs | | 0 | | 0 | |
Pension benefit cost provisions | | (779 | ) | (806 | ) |
The movements of the pension benefit cost provisions during the years ended December 31, 2011 and 2012 are as follows:
| | 2011 | | 2012 | |
Pension benefit cost provisions at beginning of year | | (416 | ) | (779 | ) |
Net periodic pension benefit cost | | (105 | ) | (172 | ) |
Employer contributions | | 2 | | 42 | |
Gain (loss) recognized via the OCI | | (260 | ) | 103 | |
Pension benefit cost provisions at end of year | | (779 | ) | (806 | ) |
F - 94
PERUSAHAAN PERSEROAN (PERSERO)
PT TELEKOMUNIKASI INDONESIA Tbk AND SUBSIDIARIES
NOTES TO THE CONSOLIDATED FINANCIAL STATEMENTS
As of December 31, 2011 and 2012 and
for the years ended December 31, 2010, 2011 and 2012
(Figures in tables are presented in billions of rupiah, unless otherwise stated)
32. PENSION BENEFIT AND OTHER POST-EMPLOYMENT BENEFIT OBLIGATIONS (continued)
a. Pension benefit cost (continued)
ii. Telkomsel(continued)
The components of the net periodic pension benefit cost are as follows:
| | 2010 | | 2011 | | 2012 | |
Service costs | | 44 | | 67 | | 120 | |
Interest costs | | 42 | | 59 | | 83 | |
Expected return on plan assets | | (16 | ) | (22 | ) | (31 | ) |
Amortization of past service costs | | 0 | | 1 | | - | |
Net periodic pension benefit cost | | 70 | | 105 | | 172 | |
Amounts recognized inOCI are as follows:
| | 2010 | | 2011 | | 2012 | |
Cumulative amount at beginning of year | | 132 | | 274 | | 534 | |
Actuarial losses (gains) recognized during the year | | 142 | | 260 | | (103 | ) |
Cumulative amount at end of year | | 274 | | 534 | | 431 | |
The net periodic pension benefit cost for the pension plan was calculated based on the measurement date as of December 31, 2011 and 2012, with reports dated February 24, 2012 and February 12, 2013, respectively, by TWP, an independent actuary in association with TW. The principal actuarial assumptions used by the independent actuary based on the measurement date as of December 31, 2011 and 2012 for each of the years, are as follows:
| | 2011 | | 2012 | |
Discount rate | | 6.75% | | 6% | |
Expected long-term return on plan assets | | 6.75% | | 6% | |
Rate of compensation increases | | 8% | | 6.5% | |
Historical information
| | January 1, 2010 | | December 31, 2010 | | December 31, 2011 | | December 31, 2012 | |
Present value of funded defined benefit obligation | | (399 | ) | (663 | ) | (1,237 | ) | (1,472 | ) |
Fair value of plan assets | | 154 | | 246 | | 458 | | 666 | |
Deficit in the plan | | (245 | ) | (417 | ) | (779 | ) | (806) | |
Experience adjustments arising on plan liabilities | | (17 | ) | 9 | | (44 | ) | 71 | |
Experience adjustments arising on plan assets | | 25 | | (49 | ) | (192 | ) | (140 | ) |
F - 95
PERUSAHAAN PERSEROAN (PERSERO)
PT TELEKOMUNIKASI INDONESIA Tbk AND SUBSIDIARIES
NOTES TO THE CONSOLIDATED FINANCIAL STATEMENTS
As of December 31, 2011 and 2012 and
for the years ended December 31, 2010, 2011 and 2012
(Figures in tables are presented in billions of rupiah, unless otherwise stated)
32. PENSION BENEFIT AND OTHER POST-EMPLOYMENT BENEFIT OBLIGATIONS (continued)
b. Post-employment health care benefit provisions
The Company provides post-employment health care benefits to all of its employees hired before November 1, 1995 who have worked for the Company for 20 years or more when they retire, and to their eligible dependents. The requirement to work for 20 years does not apply to employees who retired prior to June 3, 1995. The employees hired by the Company starting from November 1, 1995 are no longer entitled to this plan. The plan is managed by Yayasan Kesehatan.
The defined contribution post-employment health care benefit plan is provided to employees hired with permanent status on or after November 1, 1995 or employees with terms of service less than 20 years at the time of retirement. The Company’s contribution amounted to Rp20 billion, Rp19 billion and Rp18 billion for the years ended December 31, 2010,2011 and 2012, respectively.
The following table presents the changes in the projected post-employment health care benefit obligation, change in plan assets, funded status of the post-employment health care benefit plan and net amount recognized in the Company’s consolidated statements of financial position as of December 31,2011 and 2012.
| | 2011 | | 2012 | |
Changes in projected post-employment health care benefit provisions | | | | | |
Projected post-employment health care benefit obligations at beginning of year | | 8,741 | | 10,547 | |
Service costs | | 43 | | 56 | |
Interest costs | | 818 | | 755 | |
Actuarial losses | | 1,208 | | 2,074 | |
Expected post-employment health care benefits paid | | (263 | ) | (270 | ) |
Projected post-employment health care benefit provisions at end of year | | 10,547 | | 13,162 | |
Changes in post-employment health care plan assets | | | | | |
Fair value of plan assets at beginning of year | | 8,005 | | 8,986 | |
Expected return on plan assets | | 662 | | 720 | |
Employer’s contributions | | 361 | | 300 | |
Actuarial gains | | 222 | | 177 | |
Expected post-employment health care benefits paid | | (264 | ) | (270 | ) |
Fair value of plan assets at end of year | | 8,986 | | 9,913 | |
Funded status | | (1,561 | ) | (3,249 | ) |
Post-employment health care benefit provisions | | (1,561 | ) | (3,249 | ) |
F - 96
PERUSAHAAN PERSEROAN (PERSERO)
PT TELEKOMUNIKASI INDONESIA Tbk AND SUBSIDIARIES
NOTES TO THE CONSOLIDATED FINANCIAL STATEMENTS
As of December 31, 2011 and 2012 and
for the years ended December 31, 2010, 2011 and 2012
(Figures in tables are presented in billions of rupiah, unless otherwise stated)
32. PENSION BENEFIT AND OTHER POST-EMPLOYMENT BENEFIT OBLIGATIONS (continued)
b. Post-employment health care benefit provisions(continued)
As of December 31, 2011 and 2012, plan assets consisted of :
| | 2011 | | 2012 | |
Mutual funds | | 84.64% | | 81.00% | |
Time deposits | | 8.38% | | 10.72% | |
Indonesian equity securities | | 6.79% | | 7.61% | |
Others | | 0.19% | | 0.67% | |
Total assets | | 100.00% | | 100.00% | |
Yakes plan assets also include Series B shares issued by the Company with fair value totaling Rp24 billion and Rp35 billion representing 0.27% and0.35% of total assets as of December 31, 2011 and2012, respectively.
The expected return is determined based on market expectation for returns over the entire life of the obligation by considering the portfolio mix of the plan assets. The actual return on plan assets was Rp1,280 billion, Rp884 billion and Rp897 billion for the years ended December 31, 2010, 2011 and 2012, respectively. The Company expects to contribute Rp300 billion to its post-employment health care plan during 2013.
The components of net periodic post-employment health care benefit cost for the years ended December 31, 2010, 2011 and 2012 are as follows:
| | 2010 | | 2011 | | 2012 | |
Service costs | | 84 | | 43 | | 56 | |
Interest costs | | 744 | | 818 | | 755 | |
Expected return on plan assets | | (589 | ) | (662 | ) | (720 | ) |
Net periodic post-employment health care benefit cost | | 239 | | 199 | | 91 | |
Amounts charged to subsidiaries under contractual agreements | | (1 | ) | (0 | ) | (1 | ) |
Net periodic post-employment health care benefit cost | | 238 | | 199 | | 90 | |
Amounts recognized inOCI are as follows:
| | 2010 | | 2011 | | 2012 | |
Cumulative amount at beginning of year | | 60 | | 404 | | 1,390 | |
Actuarial losses recognized during the year | | 344 | | 986 | | 1,897 | |
Cumulative amount at end of year | | 404 | | 1,390 | | 3,287 | |
F - 97
PERUSAHAAN PERSEROAN (PERSERO)
PT TELEKOMUNIKASI INDONESIA Tbk AND SUBSIDIARIES
NOTES TO THE CONSOLIDATED FINANCIAL STATEMENTS
As of December 31, 2011 and 2012 and
for the years ended December 31, 2010, 2011 and 2012
(Figures in tables are presented in billions of rupiah, unless otherwise stated)
32. PENSION BENEFIT AND OTHER POST-EMPLOYMENT BENEFIT OBLIGATIONS (continued)
b. Post-employment health care benefit provisions(continued)
The actuarial valuation for the post-employment health care benefits was performed based on the measurement date as of December 31, 2010, 2011 and 2012, with reports dated March 15, 2011, March 7, 2012 and February 28, 2013, respectively, by TWP, an independent actuary in association with TW. The principal actuarial assumptions used by the independent actuary as of December 31, 2010, 2011 and 2012 are as follows:
| | 2010 | | 2011 | | 2012 | |
Discount rate | | 9.50% | | 7.25% | | 6.25% | |
Expected long-term return on plan assets | | 8.21% | | 8.00% | | 7.50% | |
Health care costs trend rate assumed for next year | | 8.00% | | 7.00% | | 7.00% | |
Ultimate health care costs trend rate | | 8.00% | | 7.00% | | 7.00% | |
Year that the rate reaches the ultimate trend rate | | 2011 | | 2012 | | 2013 | |
The movements of the projected post-employment health care benefit obligation for the years ended December 31, 2011 and 2012, are as follows:
| | 2011 | | 2012 | |
Changes in projected post-employment health care benefit obligation | | | | | |
Defined benefit liability at end of prior fiscal year | | 736 | | 1,561 | |
Net periodic pension cost | | 199 | | 91 | |
Employer contributions | | (361 | ) | (300 | ) |
Loss recognized via the OCI | | 987 | | 1,897 | |
Post-employment health care benefit provisions | | 1,561 | | 3,249 | |
1% change in assumed future health care costs trend rates would have the following effects:
| | 1% point increase | | 1% point decrease | |
Service costs and interest costs | | 342 | | (256 | ) |
Accumulated post-employment health care benefits obligation | | 2,615 | | (2,085 | ) |
Historical information:
| | January 1, 2010 | | December 31,2010 | | December 31, 2011 | | December 31, 2012 | |
Present value of funded defined benefit obligation | | (7,166 | ) | (8,741 | ) | (10,547 | ) | (13,162 | ) |
Fair value of plan assets | | 6,022 | | 8,005 | | 8,986 | | 9,913 | |
Deficit in the plan | | (1,144 | ) | (736 | ) | (1,561 | ) | (3,249 | ) |
Experience adjustments arising on plan liabilities | | (722 | ) | (231 | ) | (64 | ) | 74 | |
Experience adjustments arising on plan assets | | (756 | ) | (691 | ) | (222 | ) | (177 | ) |
F - 98
PERUSAHAAN PERSEROAN (PERSERO)
PT TELEKOMUNIKASI INDONESIA Tbk AND SUBSIDIARIES
NOTES TO THE CONSOLIDATED FINANCIAL STATEMENTS
As of December 31, 2011 and 2012 and
for the years ended December 31, 2010, 2011 and 2012
(Figures in tables are presented in billions of rupiah, unless otherwise stated)
TABLE OF CONTENTS
32. PENSION BENEFIT AND OTHER POST-EMPLOYMENT BENEFIT OBLIGATIONS (continued)
c. Other post-employment benefits provisions
The Company provides other post-employment benefit in the form of cash paid to employees on their retirement or termination with certain requirement. These benefits consist of final housing facility (“Biaya Fasilitas Perumahan Terakhir” or BFPT) and home leave passage (“Biaya Perjalanan Pensiun dan Purnabhakti” or BPP).
The changes in the projected other post-employment benefit obligation for the years ended December 31, 2011 and 2012 are as follows:
| | 2011 | | 2012 | |
Changes in projected other post-employment benefit obligation | | | | | |
Unfunded projected benefits obligation at beginning of year | | 409 | | 462 | |
Service costs | | 9 | | 10 | |
Interest costs | | 37 | | 32 | |
Actuarial losses | | 40 | | 32 | |
Benefits paid by employer | | (33 | ) | (28 | ) |
Unfunded projected benefits obligation at end of year | | 462 | | 508 | |
Unrecognized prior service costs | | (28 | ) | (21 | ) |
Total other post-employment benefit provisions at end of year | | 434 | | 487 | |
The components of the net periodic other post-employment benefit cost for the years ended December 31, 2010,2011 and 2012 are as follows:
| | 2010 | | 2011 | | 2012 | |
Service costs | | 18 | | 9 | | 10 | |
Interest costs | | 36 | | 37 | | 32 | |
Amortization of past service costs | | 7 | | 7 | | 7 | |
Net periodic other post-employment benefit cost | | 61 | | 53 | | 49 | |
F - 99
PERUSAHAAN PERSEROAN (PERSERO)
PT TELEKOMUNIKASI INDONESIA Tbk AND SUBSIDIARIES
NOTES TO THE CONSOLIDATED FINANCIAL STATEMENTS
As of December 31, 2011 and 2012 and
for the years ended December 31, 2010, 2011 and 2012
(Figures in tables are presented in billions of rupiah, unless otherwise stated)
32. PENSION BENEFIT AND OTHER POST-EMPLOYMENT BENEFIT OBLIGATIONS (continued)
c. Other post-employment benefits provisions (continued)
Amounts recognized inOCI are as follows:
| | 2010 | | 2011 | | 2012 | |
Cumulative amount at beginning of year | | (23 | ) | 30 | | 70 | |
Acturial losses recognized during the year | | 53 | | 40 | | 32 | |
Cumulative amount at end of year | | 30 | | 70 | | 102 | |
Historical information:
| | January 1, 2010 | | December 31, 2010 | | December 31,2011 | | December 31, 2012 | |
Present value of unfunded defined benefit obligation | | (336 | ) | (409 | ) | (462 | ) | (508 | ) |
Fair value of plan assets | | - | | - | | - | | - | |
Deficit in the plan | | (336 | ) | (409 | ) | (462 | ) | (508 | ) |
Experience adjustments arising on plan liabilities | | (1 | ) | 11 | | (13 | ) | 5 | |
d. Obligation under the Labor Law provisions
Under Law No. 13 Year 2003 concerning labor regulation, the Company and subsidiaries are required to provide a minimum pension benefits, if not covered yet by the sponsored pension plans, to their employees upon retirement age. The total related obligation recognized as of December 31, 2011 and 2012 amounted to Rp130 billion and Rp156 billion, respectively. The related employee benefits cost charged to expense amounted to Rp23 billion, Rp30 billion and Rp35 billion for the years ended December 31, 2010,2011 and 2012, respectively. The actuarial losses and (gains) recognized inOCI amounted to Rp10 billion,Rp21 billionand(Rp8 billion) for the years ended December 31, 2010,2011 and 2012, respectively.
33. LSA
Telkomsel provides certain cash awards or certain number of days leave benefits to its employees based on the employees’ length of service requirements, including LSA and LSL. LSA are either paid at the time the employees reachcertain number of years ofemployment, or at the time of termination. LSL are either certain number of days leave benefit or cash benefit, subject to approval by management, provided to employees who met the requisite number of years of service and certain minimum age.
The obligation with respect to these awards was determined based on an actuarial valuation using the Projected Unit Credit method, and amounted to Rp287 billion and Rp347 billion as of December 31, 2011 and 2012, respectively. The related benefits costs charged to expense amounted to Rp78 billion, Rp96 billion and Rp121 billionfor the years ended December 31, 2010, 2011 and 2012, respectively (Note 27).
.
F - 100
PERUSAHAAN PERSEROAN (PERSERO)
PT TELEKOMUNIKASI INDONESIA Tbk AND SUBSIDIARIES
NOTES TO THE CONSOLIDATED FINANCIAL STATEMENTS
As of December 31, 2011 and 2012 and
for the years ended December 31, 2010, 2011 and 2012
(Figures in tables are presented in billions of rupiah, unless otherwise stated)
34. RELATED PARTY TRANSACTIONS
In the normal course oftheirbusiness, the Company and subsidiaries entered into transactions with related parties. It is the Company’s policy that the pricing of these transactions be the same as those of arm’s length transactions.
a. Nature of relationships and accounts/transactions with related parties
Details of the nature of relationships and accounts/transactions with significant related parties are as follows:
Related parties |
| Nature of relationships with related parties |
| Nature of transactions/accounts |
The Government: Minister of Finance | | Majority stockholder | | Finance costs andinvestment in financial instruments |
Government Agencies | | Entity under common control | | Network revenues and operating expenses |
MoCI | | Entity under common control | | Concession fees, radio frequency usage charge, USO charges and telecommunication service revenue |
State-owned enterprises | | Entity under common control | | Operating expenses, purchase of propertyand equipment, construction and installation services, insurance expense, finance costs, finance income, investment in financial instruments |
Indosat | | Entity under common control | | Interconnection revenues, interconnection expenses, telecommunications facilities usage, operating and maintenance cost, leased lines revenue, satellite transponders usage revenues,usage of data communication network system expenses and lease revenues |
PT Aplikanusa Lintasarta(“Lintasarta”) | | Entity under common control | | Network revenues, usage of data communication network system expenses and leased lines expenses |
Indosat Mega Media | | Entity under common control | | Network revenues |
PT Sistelindo Mitralintas | | Entity under common control | | Network revenues |
CSM | | Associated company | | Satellite transponders usage revenues, leased lines revenues, transmission lease expenses |
Patrakom | | Associated company | | Satellite transponders usage revenues, leased lines revenues, transmission lease expenses |
PSN | | Associated company | | Satellite transponders usage revenues, leased lines revenues, transmission lease expenses, interconnection revenues and interconnection expense |
PT Industri Telekomunikasi Indonesia (“INTI”) | | Entity under common control | | Purchase of property and equipment |
PT Asuransi Jasa Indonesia(“Jasindo”) | | Entity under common control | | Insurance of property and equipment |
PT Jaminan Sosial Tenaga Kerja(“Jamsostek”) | | Entity under common control | | Insurance expenses for employees |
PT Perusahaan Listrik Negara(Persero) (“PLN”) | | Entity under common control | | Electricity expenses |
PT Pos Indonesia | | Entity under common control | | Cost of SIM cards |
State-owned banks | | Entity under common control | | Finance income and finance costs |
BNI | | Entity under common control | | Finance income and finance costs |
Bank Mandiri | | Entity under common control | | Finance income and finance costs |
F - 101
PERUSAHAAN PERSEROAN (PERSERO)
PT TELEKOMUNIKASI INDONESIA Tbk AND SUBSIDIARIES
NOTES TO THE CONSOLIDATED FINANCIAL STATEMENTS
As of December 31, 2011 and 2012 and
for the years ended December 31, 2010, 2011 and 2012
(Figures in tables are presented in billions of rupiah, unless otherwise stated)
34. RELATED PARTY TRANSACTIONS
(continued)
a. Nature of relationships and transactions/accounts with related parties (continued)
Related parties |
| Nature of relationships with related parties |
| Nature of transactions/accounts |
BRI | | Entity under common control | | Finance income and finance costs |
Bank Jabar | | Entity under common control | | Finance income and finance costs |
BTN | | Entity under common control | | Finance income and finance costs |
Bahana | | Entity under common control | | Available-for-sale financial assets, bonds and notes |
Koperasi Pegawai Telkom(“Kopegtel”) | | Entity under significant influence | | Purchase of property and equipment, construction and installation services, leases of buildings, leases of vehicles, purchases of materials and construction services, utilization of maintenance and cleaning services and RSA revenues |
PT Sandhy Putra Makmur (“SPM”) | | Entity under significant influence | | Leases of buildings, leases of vehicles, purchases of materials and construction services, utilities maintenance and cleaning services |
Koperasi Pegawai Telkomsel (“Kisel”) | | Entity under significant influence | | Leases of vehicle, printing and distribution of customer bills, collection fee and other services fee, distribution of SIM cards and pulse reload vouchers |
PT Graha Informatika Nusantara (“Gratika”) | | Entity under significant influence | | Leased lines revenues, purchase of property and equipment, installation and maintenance expense |
Directors and commissioners | | Key management personnel | | Honorarium and facilities |
Yakes | | Entity under common control | | Medical expenses |
b. Transactions with related parties
The following are significant transactions with related parties:
| | 2010 | | 2011 | | 2012 | |
| | Amount | | % of total revenues | | Amount | | % of total revenues | | Amount | | % of total revenues | |
REVENUES | | | | | | | | | | | | | |
Entity under common control | | | | | | | | | | | | | |
Indosat | | 965 | | 1.41 | | 857 | | 1.20 | | 1,033 | | 1.34 | |
Government agencies | | 242 | | 0.35 | | 415 | | 0.58 | | 237 | | 0.31 | |
Lintasarta | | 103 | | 0.15 | | 93 | | 0.13 | | 85 | | 0.11 | |
Sub-total | | 1,310 | | 1.91 | | 1,365 | | 1.91 | | 1,355 | | 1.76 | |
Entity under significant influence | | | | | | | | | | | | | |
Kisel | | 2,155 | | 3.14 | | 2,347 | | 3.29 | | 2,351 | | 3.05 | |
Associated companies | | | | | | | | | | | | | |
Patrakom | | 66 | | 0.10 | | 67 | | 0.09 | | 80 | | 0.10 | |
CSM | | 77 | | 0.11 | | 57 | | 0.08 | | 47 | | 0.06 | |
Sub-total | | 143 | | 0.21 | | 124 | | 0.17 | | 127 | | 0.16 | |
Others | | 30 | | 0.04 | | 30 | | 0.04 | | 30 | | 0.04 | |
Total | | 3,638 | | 5.3 | | 3,866 | | 5.41 | | 3,863 | | 5.01 | |
F - 102
PERUSAHAAN PERSEROAN (PERSERO)
PT TELEKOMUNIKASI INDONESIA Tbk AND SUBSIDIARIES
NOTES TO THE CONSOLIDATED FINANCIAL STATEMENTS
As of December 31, 2011 and 2012 and
for the years ended December 31, 2010, 2011 and 2012
(Figures in tables are presented in billions of rupiah, unless otherwise stated)
34. RELATED PARTY TRANSACTIONS
(continued)
b. Transactions with related parties (continued)
| | 2010 | | 2011 | | 2012 | |
| | Amount | | % oftotalexpenses | | Amount | | % oftotalexpenses | | Amount | | % oftotalexpenses | |
EXPENSES | | | | | | | | | | | | | |
Entity under common control | | | | | | | | | | | | | |
MoCI | | 4,153 | | 8.96 | | 4,165 | | 8.31 | | 6,539 | | 12.63 | |
Indosat | | 910 | | 1.96 | | 814 | | 1.62 | | 1,004 | | 1.94 | |
PLN | | 1,623 | | 3.50 | | 1,243 | | 2.48 | | 660 | | 1.28 | |
Jasindo | | 359 | | 0.77 | | 401 | | 0.80 | | 370 | | 0.71 | |
Yakes | | 136 | | 0.29 | | 121 | | 0.24 | | 150 | | 0.29 | |
PT Pos Indonesia | | 29 | | 0.06 | | 54 | | 0.11 | | 51 | | 0.10 | |
Jamsostek | | 31 | | 0.07 | | 33 | | 0.07 | | 36 | | 0.07 | |
Sub-total | | 7,241 | | 15.61 | | 6,831 | | 13.63 | | 8,810 | | 17.02 | |
Entity under significant | | | | | | | | | | | | | |
influence | | | | | | | | | | | | | |
Kisel | | 634 | | 1.37 | | 745 | | 1.49 | | 825 | | 1.59 | |
Kopegtel | | 936 | | 2.02 | | 956 | | 1.91 | | 817 | | 1.58 | |
SPM | | 182 | | 0.39 | | 91 | | 0.18 | | 25 | | 0.05 | |
Sub-total | | 1,752 | | 3.78 | | 1,792 | | 3.58 | | 1,667 | | 3,22 | |
Associated companies | | | | | | | | | | | | | |
PSN | | 181 | | 0.39 | | 170 | | 0.34 | | 165 | | 0.32 | |
CSM | | 121 | | 0.26 | | 107 | | 0.21 | | 100 | | 0.19 | |
Patrakom | | 74 | | 0.16 | | 77 | | 0.15 | | 73 | | 0.14 | |
Sub-total | | 376 | | 0.81 | | 354 | | 0.70 | | 338 | | 0.65 | |
Others (each below Rp 30 billion) | | 72 | | 0.16 | | 47 | | 0.09 | | 36 | | 0.07 | |
Total | | 9,441 | | 20.36 | | 9,024 | | 18.00 | | 10,851 | | 20.96 | |
| | 2010 | | 2011 | | 2012 | |
| | Amount | | % of totalfinanceincome | | Amount | | % of totalfinanceincome | | Amount | | % of totalfinanceincome | |
Finance income | | | | | | | | | | | | | |
| Majority stockholder | | | | | | | | | | | | | |
The Government | | 32 | | 7.08 | | 74 | | 11.94 | | 13 | | 2.18 | |
| Entity under common control | | | | | | | | | | | | | |
State-owned banks | | 233 | | 51.55 | | 320 | | 51.61 | | 366 | | 61.41 | |
Total | | 265 | | 58.63 | | 394 | | 63.55 | | 379 | | 63.59 | |
| | 2010 | | 2011 | | 2012 | |
| | Amount | | % of total finance costs | | Amount | | % of total finance costs | | Amount | | % of total finance costs | |
Finance costs | | | | | | | | | | | | | |
| Majority stockholder | | | | | | | | | | | | | |
The Government | | 163 | | 8.45 | | 169 | | 10.17 | | 82 | | 3.99 | |
| Entity under common control | | | | | | | | | | | | | |
State-owned banks | | 938 | | 48.65 | | 621 | | 37.36 | | 424 | | 20.63 | |
Total | | 1,101 | | 57.10 | | 790 | | 47.53 | | 506 | | 24.62 | |
F - 103
PERUSAHAAN PERSEROAN (PERSERO)
PT TELEKOMUNIKASI INDONESIA Tbk AND SUBSIDIARIES
NOTES TO THE CONSOLIDATED FINANCIAL STATEMENTS
As of December 31, 2011 and 2012 and
for the years ended December 31, 2010, 2011 and 2012
(Figures in tables are presented in billions of rupiah, unless otherwise stated)
34. RELATED PARTY TRANSACTIONS (continued)
b. Transactions with related parties (continued)
| | 2010 | | 2011 | | 2012 | |
| | Amount | | % oftotal fixed assets purchased | | Amount | | % oftotal fixed assets purchased | | Amount | | % oftotal fixed assets purchased | |
PURCHASE OF PROPERTY AND | | | | | | | | | | | | | |
EQUIPMENT(Note 11) | | | | | | | | | | | | | |
Entity under common control | | | | | | | | | | | | | |
State-owned enterprises | | 140 | | 1.12 | | 116 | | 0.79 | | 98 | | 0.57 | |
| Entity under significant influence | | | | | | | | | | | | | |
Kopegtel | | 127 | | 1.02 | | 183 | | 1.25 | | 237 | | 1.37 | |
Others (each below Rp30 billion) | | 36 | | 0.29 | | 23 | | 0.15 | | 47 | | 0.27 | |
Total | | 303 | | 2.43 | | 322 | | 2.19 | | 382 | | 2.21 | |
Presented below are balances of accounts with related parties:
| | | 2011 | | 2012 | |
| | | Amount | | % of total assets | | Amount | | % of total assets | |
a. | Cash and cash equivalents (Note 4) | | 7,848 | | 7.64 | | 9,170 | | 8.32 | |
b. | Other current financial assets (Note 5) | | 314 | | 0.31 | | 1,908 | | 1.73 | |
c. | Trade and other receivables (Note 6) | | 1,042 | | 1.01 | | 1,384 | | 1.26 | |
d. | Advances and prepaid expenses (Note 8) | | | | | | | | | |
| Entities under common control | | | | | | | | | |
| MoCI | | 2,206 | | 2.15 | | 2,588 | | 2.35 | |
| Others (each below Rp30 billion) | | 27 | | 0.03 | | 18 | | 0.02 | |
| Total | | 2,233 | | 2.18 | | 2,606 | | 2.37 | |
e. | Advances and other non-current assets (Note 12) | | | | | | | | | |
| Entities under common control | | | | | | | | | |
| Bank Mandiri | | - | | - | | 13 | | 0.01 | |
| BNI | | 92 | | 0.09 | | - | | 0.00 | |
| Others | | 5 | | 0.00 | | 1 | | 0.00 | |
| Total | | 97 | | 0.09 | | 14 | | 0.01 | |
F - 104
PERUSAHAAN PERSEROAN (PERSERO)
PT TELEKOMUNIKASI INDONESIA Tbk AND SUBSIDIARIES
NOTES TO THE CONSOLIDATED FINANCIAL STATEMENTS
As of December 31, 2011 and 2012 and
for the years ended December 31, 2010, 2011 and 2012
(Figures in tables are presented in billions of rupiah, unless otherwise stated)
34. RELATED PARTY TRANSACTIONS
(continued)
b. Transactions with related parties (continued)
| | | 2011 | | 2012 | |
| | | Amount | | % of total liabilities | | Amount | | % of total liabilities | |
f. | Trade payables (Note 14) | | | | | | | | | |
| Entity under common control | | | | | | | | | |
| MoCI | | 409 | | 0.94 | | 609 | | 1.26 | |
| INTI | | 66 | | 0.15 | | 197 | | 0.41 | |
| Yakes | | 35 | | 0.08 | | 39 | | 0.08 | |
| Indosat | | 52 | | 0.12 | | 31 | | 0.06 | |
| State-owned enterprises | | 41 | | 0.09 | | 3 | | 0.01 | |
| Sub-total | | 603 | | 1.38 | | 879 | | 1.82 | |
| Entity under significant influence | | | | | | | | | |
| Kopegtel | | 92 | | 0.21 | | 115 | | 0.24 | |
| Others (each below Rp30 billion) | | 143 | | 0.33 | | 47 | | 0.09 | |
| Total | | 838 | | 1.92 | | 1,041 | | 2.15 | |
g. | Accrued expenses (Note 15) | | | | | | | | | |
| Majority stockholder | | | | | | | | | |
| The Government | | 22 | | 0.05 | | 17 | | 0.04 | |
| Entities under common control | | | | | | | | | |
| State-owned banks | | 50 | | 0.11 | | 72 | | 0.15 | |
| Total | | 72 | | 0.16 | | 89 | | 0.19 | |
h. | Advances from customers andsuppliers | | | | | | | | | |
| Majority stockholder |
|
|
|
|
|
|
|
|
|
| The Government | | 151 | | 0.35 | | 64 | | 0.13 | |
i. | Short-term bank loans (Note 17) | | | | | | | | | |
| Entity under common control |
|
|
|
|
|
|
|
|
|
| State-owned bank | | 7 | | 0.02 | | 5 | | 0.01 | |
j. | Two-step loans (Note 18a) | | | | | | | | | |
| Majority stockholder |
|
|
|
|
|
|
|
|
|
| The Government | | 2,284 | | 5.23 | | 1.987 | | 4.12 | |
k. | Bonds and notes (Note 18b) | | | | | | | | | |
| Entity under common control |
|
|
|
|
|
|
|
|
|
| Bahana | | 107 | | 0.24 | | 8 | | 0.02 | |
l. | Long-term bank loans (Note 18c) | | | | | | | | | |
| Entities under common control | | | | | | | | | |
| BNI | | 2,273 | | 5.20 | | 2,349 | | 4.87 | |
| BRI | | 2,131 | | 4.88 | | 4,630 | | 9.61 | |
| Bank Mandiri | | 2,111 | | 4.83 | | 1,417 | | 2.94 | |
| Bank Jabar | | 350 | | 0.80 | | 175 | | 0.36 | |
| Total | | 6,865 | | 15.71 | | 8,571 | | 17.78 | |
F - 105
PERUSAHAAN PERSEROAN (PERSERO)
PT TELEKOMUNIKASI INDONESIA Tbk AND SUBSIDIARIES
NOTES TO THE CONSOLIDATED FINANCIAL STATEMENTS
As of December 31, 2011 and 2012 and
for the years ended December 31, 2010, 2011 and 2012
(Figures in tables are presented in billions of rupiah, unless otherwise stated)
34. RELATED PARTY TRANSACTIONS
(continued)
c. Significant agreements with related parties
i. The Government
The Company obtained two-step loans from the Government (Note 18a).
The Company and subsidiaries pay the MoCI concession fees for telecommunications services provided and radio frequency usage charges. Telkomsel paid an up-front fee for the 3G license amounting to Rp756 billion.
Starting 2005, the Company and its subsidiaries pay USO charges to the MoCI pursuant to MoCI Regulation No.15/Per/M.KOMINFO/9/2005 dated September 30, 2005.
ii. Indosat
The Company has an agreement with Indosat for the provision of international telecommunications services to the public.
The Company has also entered into an interconnection agreement between the Company’s fixed line network (Public Switched Telephone Network or “PSTN”) and Indosat’s GSM mobile cellular telecommunications network in connection with the implementation of the Indosat Multimedia Mobile services and the settlement of the related interconnection rights and obligations.
The Company also has an agreement with Indosat for the interconnection of Indosat's GSM mobile cellular telecommunications network with the Company's PSTN, enabling each party’s customers to make domestic calls between Indosat’s GSM mobile network and the Company’s fixed line network and allowing Indosat’s mobile customers to access the Company’s IDD service by dialing “007”.
The Company has been handling customer billings and collections for Indosat. Indosat is gradually taking over the activities and performing its own direct billing and collection. The Company receives compensation from Indosat computed at 1% of the collections made by the Company beginning January 1, 1995, plus the billing process expenses which are fixed at a certain amount per record. On December 11, 2008, the Company and Indosat agreed to implement an IDD service charge tariff, which already takes into account the compensation for its billing and collection. The agreement is valid and effective starting on January to December 2012, and can be applied until a new Minutes of Agreement becomes available.
On December 28, 2006, the Company and Indosat signed amendments to the interconnection agreements for the fixed line networks (local, SLJJ and international) and mobile network for the implementation of the cost-based tariff obligations under the MoCI Regulation No.8/Year 2006. These amendments took effect starting on January 1, 2007.
Telkomsel also entered into an agreement with Indosat for the provision of international telecommunications services to its GSM mobile cellular customers.
The Company provides leased lines to Indosat and its subsidiaries, namely Indosat Mega Media, Lintasarta and PT Sistelindo Mitralintas. The leased lines can be used by these companies for telephone, telegraph, data, telex, facsimile or other telecommunication services.
F - 106
PERUSAHAAN PERSEROAN (PERSERO)
PT TELEKOMUNIKASI INDONESIA Tbk AND SUBSIDIARIES
NOTES TO THE CONSOLIDATED FINANCIAL STATEMENTS
As of December 31, 2011 and 2012 and
for the years ended December 31, 2010, 2011 and 2012
(Figures in tables are presented in billions of rupiah, unless otherwise stated)
34. RELATED PARTY TRANSACTIONS
(continued)
c. Significant agreements with related parties (continued)
iii. Others
The Company has entered into agreements with associated companies, namely CSM, Patrakom, PSN and Gratika for the utilization of the Company's satellite transponders or frequency channels and leased lines.
Telkomsel has an agreement with PSN for the lease of PSN’s transmission link. Based on the agreement, which was made on March 14, 2001, the minimum lease period is 2 years from the operation of the transmission link and is extendable subject to agreement by both parties. The agreement was extended until March 29, 2013.
Kisel is a cooperative that was established by Telkomsel’s employees to engage in car rental services, printing and distribution of customer bills, collection and other services principally for the benefit of Telkomsel. Telkomsel also has dealership agreements with Kisel for distribution of SIM cards and pulse reload vouchers.
d. Key management personnel remuneration
Key management personnel of the Company are the Boards of Commissioners and Directors as detailed in Note 1b.
The Company and subsidiaries provide honorarium and facilities to support the operational duties of their respective boards of commissioners. The Company and subsidiaries provide short-term employment benefits in the form of salaries and facilities to support the operational duties of their respective boards of directors. The total of such benefits is as follows:
| | 2010 | | 2011 | | 2012 | |
| | Amount | | % of totalexpense | | Amount | | % of totalexpense | | Amount | | % of totalexpense | |
Board of Directors | | 166 | | 0.36% | | 181 | | 0.36% | | 252 | | 0.49% | |
Board of Commissioners | | 53 | | 0.11% | | 57 | | 0.11% | | 61 | | 0.12% | |
35. SEGMENT INFORMATION
In 2012, management decided to change the way it manages the Company's business portfolios from a product-based approach to a customer-centric approach, as part of the Company’s strategy to provide a one-stop solution to its customers. This resulted in a change in the Company’s organizational structure to accommodate decision-making and performance assessment based on a customer-centric approach. Consequently, the segment financial information presented to the Company's Chief Operational Decision Maker was amended to facilitate decision making on the new segments. The segment information for the year ended December 31, 2011 has been restated to conform with the presentation of segment information for the year ended December 31, 2012. However, the costs of extending the restatement of each individual item of comparative information fortheyear ended December 31, 2010 were considered to outweigh the benefits of providing a more accurate comparative information. Management considered that the restatement of the 2010 segment information was impracticable. Moreover, management also considered that the presentation of 2010,2011 and 2012 segment information in the old basis (product-based approach) are not relevant considering that managementcurrently manages its business on a customer-centric approach. Therefore, these information were not included in the consolidated financial statements.
F - 107
PERUSAHAAN PERSEROAN (PERSERO)
PT TELEKOMUNIKASI INDONESIA Tbk AND SUBSIDIARIES
NOTES TO THE CONSOLIDATED FINANCIAL STATEMENTS
As of December 31, 2011 and 2012 and
for the years ended December 31, 2010, 2011 and 2012
(Figures in tables are presented in billions of rupiah, unless otherwise stated)
3
5. SEGMENT INFORMATION (continued)
The Company and subsidiaries have four main operating segments, namely personal, home, corporate and others. The personal segment provides mobile cellular and fixed wireless telecommunications services to individual customers. The home segment provides fixed wireline telecommunications services, pay TV, data and internet services to home customers. The corporate segment provides telecommunications services, including interconnection, leased lines, satellite, VSAT, contact center, broadband access, information technology services, data and internet services to companies and institutions. Operating segments that are not monitored separately by Chief Operation Decision Maker are presented as "Others" that provides building management services.
Management monitors the operating results of its business units separately for the purpose of making decisions about resource allocation and performance assessment. Segment performance is evaluated based on operating profit or loss and is measured on the basis of Indonesian Financial Accounting Standards which differs significantly from IFRS primarily in the accounting for land rights and employee benefits.
However, the financing activities and income taxes are not separately monitored and are not allocated to operating segments.
Segment revenues and expenses include transactions between operating segments and are accounted for at prices that Management believes represent market prices.
| | 2011 | |
| | | | | | | | | | Total before | | | | Total | | IFRS | | IFRS | |
| | Corporate | | Home | | Personal | | Others | | Elimination | | Elimination | | Consolidated | | Reconciliation | | Balance | |
| | | | | | | | | | | | | | | | | | | |
Segment results | | | | | | | | | | | | | | | | | | | |
Revenues | | | | | | | | | | | | | | | | | | | |
External revenues | | 14,279 | | 8,171 | | 48,733 | | 70 | | 71,253 | | - | | 71,253 | | (15 | ) | 71,238 | |
Inter-segment revenues | | 5,289 | | 1,888 | | 2,180 | | 350 | | 9,707 | | (9,707 | ) | - | | - | | - | |
Total segment revenues | | 19,568 | | 10,059 | | 50,913 | | 420 | | 80,960 | | (9,707 | ) | 71,253 | | (15 | ) | 71,238 | |
Expenses - net | | | | | | | | | | | | | | | | | | | |
External expenses | | (12,362 | ) | (6,408 | ) | (29,999 | ) | (526 | ) | (49,295 | ) | - | | (49,295 | ) | (156 | ) | (49,451 | ) |
Inter-segment expenses | | (3,297 | ) | (1,914 | ) | (4,680 | ) | 184 | | (9,707 | ) | 9,707 | | - | | | - | - | |
Total segment expenses - net | | (15,659 | ) | (8,322 | ) | (34,679 | ) | (342 | ) | (59,002 | ) | 9,707 | | (49,295 | ) | (156 | ) | (49,451 | ) |
Segment results | | 3,909 | | 1,737 | | 16,234 | | 78 | | 21,958 | | - | | 21,958 | | (171 | ) | 21,787 | |
Other information | | | | | | | | | | | | | | | | | | | |
Segment assets | | 26,842 | | 16,893 | | 62,368 | | 390 | | 106,493 | | (4,465 | ) | 102,028 | | (332 | ) | 101,696 | |
Assets held for sale | | - | | - | | 791 | | - | | 791 | | - | | 791 | | - | | 791 | |
Long-term investments | | 214 | | - | | 21 | | - | | 235 | | - | | 235 | | - | | 235 | |
Total consolidated assets | | 27,056 | | 16,893 | | 63,180 | | 390 | | 107,519 | | (4,465) | | 103,054 | | (332 | ) | 102,722 | |
Total consolidated liabilities | | (14,459 | ) | (10,452 | ) | (21,434 | ) | (193 | ) | (46,538 | ) | 4,465 | | (42,073 | ) | (1,623 | ) | (43,696 | ) |
Capital expenditures | | (4,390 | ) | (1,529 | ) | (8,684 | ) | (45 | ) | (14,648 | ) | - | | (14,648) | | 94 | | (14,554 | ) |
Depreciation and amortization expenses | | (1,890 | ) | (1,389 | ) | (11,007 | ) | (14 | ) | (14,300 | ) | - | | (14,300 | ) | 40 | | (14,260 | ) |
Impairment of assets | | - | | - | | (563 | ) | - | | (563 | ) | - | | (563 | ) | - | | (563 | ) |
Provision for impairment of receivables | | (255 | ) | (454 | ) | (174 | ) | - | | (883 | ) | - | | (883 | ) | - | | (883 | ) |
F - 108
PERUSAHAAN PERSEROAN (PERSERO)
PT TELEKOMUNIKASI INDONESIA Tbk AND SUBSIDIARIES
NOTES TO THE CONSOLIDATED FINANCIAL STATEMENTS
As of December 31, 2011 and 2012 and
for the years ended December 31, 2010, 2011 and 2012
(Figures in tables are presented in billions of rupiah, unless otherwise stated)
35. SEGMENT INFORMATION (continued)
| | 2012 | |
| | | | | | | | | | Total before | | | | Total | | IFRS | | IFRS | |
| | Corporate | | Home | | Personal | | Others | | Elimination | | Elimination | | Consolidated | | Reconciliation | | Balance | |
Segment results | | | | | | | | | | | | | | | | | | | |
Revenues | | | | | | | | | | | | | | | | | | | |
External revenues | | 15,579 | | 7,360 | | 54,087 | | 117 | | 77,143 | | - | | 77,143 | | (16 | ) | 77,127 | |
Inter-segment revenues | | 6,468 | | 2,223 | | 2,188 | | 648 | | 11,527 | | (11,527 | ) | - | | - | | - | |
Total segment revenues | | 22,047 | | 9,583 | | 56,275 | | 765 | | 88,670 | | (11,527 | ) | 77,143 | | (16 | ) | 77,127 | |
Expenses - net | | | | | | | | | | | | | | | | | | | |
External expenses | | (13,961 | ) | (5,646 | ) | (31,169 | ) | (669 | ) | (51,445 | ) | - | | (51,445 | ) | 80 | | (51,365 | ) |
Inter-segment expenses | | (4,015 | ) | (2,293 | ) | (5,203 | ) | (16 | ) | (11,527 | ) | 11,527 | | - | | - | | - | |
Total segment expenses - net | | (17,976 | ) | (7,939 | ) | (36,372 | ) | (685 | ) | (62,972 | ) | 11,527 | | (51,445 | ) | 80 | | (51,365 | ) |
Segment results | | 4,071 | | 1,644 | | 19,903 | | 80 | | 25,698 | | - | | 25,698 | | 64 | | 25,762 | |
Other information | | | | | | | | | | | | | | | | | | | |
Segment assets | | 30,458 | | 17,780 | | 67,216 | | 611 | | 116,065 | | (4,971 | ) | 111,094 | | (1,158 | ) | 109,936 | |
Long-term investments | | 254 | | - | | 21 | | - | | 275 | | - | | 275 | | - | | 275 | |
Total consolidated assets | | 30,712 | | 17,780 | | 67,237 | | 611 | | 116,340 | | (4,971 | ) | 111,369 | | (1,158 | ) | 110,211 | |
Total consolidated liabilities | | (17,143 | ) | (11,478 | ) | (20,414 | ) | (327 | ) | (49,362 | ) | 4,971 | | (44,391 | ) | (3,806 | ) | (48,197 | ) |
Capital expenditures | | (4,375 | ) | (2,083 | ) | (10,664 | ) | (150 | ) | (17,272 | ) | - | | (17,272 | ) | - | | (17,272 | ) |
Depreciation and amortization expenses | | (2,079 | ) | (1,168 | ) | (10,940 | ) | (22 | ) | (14,209 | ) | - | | (14,209 | ) | (18 | ) | (14,227 | ) |
Impairment of assets | | - | | - | | (247 | ) | - | | (247 | ) | - | | (247 | ) | - | | (247 | ) |
Provision for impairment of receivables | | (92 | ) | (505 | ) | (318 | ) | - | | (915 | ) | - | | (915 | ) | - | | (915 | ) |
The Company predominantly generates revenue and profit within Indonesia. Revenue with respect to international interconnections and assets held by geographical location are disclosed in Note 25 and Note 1, respectively.
36. RSA
The Company has entered into separate agreements with several investors under RSA to develop fixed lines, public card-phone booths, data and internet network, and related supporting telecommunications facilities.
As of December 31, 2012, the Company has 4 RSA’s with 4 investors. The RSA’s are located in East Java, Makassar, Pare-pare, Manado, Denpasar, Mataram and Kupang, with concession periods ranging from 129 to 148 months.
Under the RSA, the investors finance the costs incurred in developing the telecommunications facilities and the Company manages and operates the telecommunication facilities upon the completion of the constructions. Repairs and maintenance costs during RSA period are borne jointly by the Company and investors. The investors legally retain the rights to the property and equipment constructed by them during the RSA periods. At the end of the RSA period, the investors will transfer the ownership of the telecommunication facilities to the Company at a nominal price.
Generally, the revenues earned in the form of line installation charges, outgoing telephone pulses and monthly subscription charges are shared between the Company and investors based on certain agreed amount and/or ratio.
F - 109
PERUSAHAAN PERSEROAN (PERSERO)
PT TELEKOMUNIKASI INDONESIA Tbk AND SUBSIDIARIES
NOTES TO THE CONSOLIDATED FINANCIAL STATEMENTS
As of December 31, 2011 and 2012 and
for the years ended December 31, 2010, 2011 and 2012
(Figures in tables are presented in billions of rupiah, unless otherwise stated)
37. SIGNIFICANT COMMITMENTS AND AGREEMENTS
a. Capital expenditures
As of December 31, 2012, capital expenditures committed under the contractual arrangements, principally relating to procurement and installation of switching equipment, transmission equipment and cable network, are as follows:
Currencies | | Amounts in foreign currencies(in millions) | | Equivalent in rupiah | |
Rupiah | | - | | 6,678 | |
U.S. dollar | | 380 | | 3,674 | |
Euro | | 0.2 | | 3 | |
SGD | | 0.1 | | 0 | |
Total | | | | 10,355 | |
The above balance includes the following significant agreements:
Contracting parties | | Date of agreement | | Significant provisions of the agreement | |
(i) The Company | | | | | |
The Company and Sansaine Huawei Consortium | | May 27, 2009 June 15, 2009 | | Cooperation agreement for procurement and installation of MSAN ALU and Secondary Access 2008 Batch 3 Cooperation agreement for procurement and installation of MSAN ALU and Secondary Access 2008 Batch 1 | |
The Company and ZTE Consortium | | June 2, 2009 | | Cooperation agreement for procurement and installation of MSAN ALU and Secondary Access 2008 Batch 2 | |
The Company and Sansaine Huawei Consortium | | August 3, 2009 | | Procurement and installation agreement for Softswitch and modernization of MSAN Divre I, Divre II, Divre III and Divre IV | |
The Company and PT ZTE Indonesia | | September 4, 2009 | | Procurement and installation agreement for Modernization MSAN Softswitch Divre VI and Divre VII | |
The Company and Tekken - DMT Consortium | | September 15, 2009 | | Procurement and installation agreement for Fiber Optic Cable Access Divre VI Kalimantan | |
The Company and Sansaine Huawei Consortium | | November 24, 2009 | | Procurement and installation agreement for Palapa Ring Mataram-Kupang Cable System Project ("MKCS") | |
The Company and PT ZTE Indonesia | | October 6, 2010 | | Procurement and installation agreement for Gigabit Capable Passive Optical Network ("G-PON") | |
The Company and PT Lintas Teknologi Indonesia | | June 8, 2011 | | Procurement and installation agreement for DWDM Alcatel-Lucent ("ALU") | |
The Company and G-Pas Consortium | | June 14, 2011 | | Procurement and installation agreement for Outside Plant Fiber Optic ("OSP-FO") Access & RMJ GPAS | |
The Company and Mandiri Maju Consortium | | June 14,2011 | | Procurement and installation agreement for Outside Plant Fiber Optic ("OSP-FO") Access & RMJ | |
F - 110
PERUSAHAAN PERSEROAN (PERSERO)
PT TELEKOMUNIKASI INDONESIA Tbk AND SUBSIDIARIES
NOTES TO THE CONSOLIDATED FINANCIAL STATEMENTS
As of December 31, 2011 and 2012 and
for the years ended December 31, 2010, 2011 and 2012
(Figures in tables are presented in billions of rupiah, unless otherwise stated)
37. SIGNIFICANT COMMITMENTS AND AGREEMENTS (continued)
a. Capital expenditures (continued)
Contracting parties | | Date of agreement | | Significant provisions of the agreement | |
(i)The Company (continued) | | | | | |
The Company and PT Datacomm Diangraha | | June 30, 2011 | | Procurement and installation agreement for Expansion of Metro Ethernet ALU | |
The Company and PT Bina Nusantara Perkasa | | December 9, 2011 | | Procurement and installation agreement for “Sistem Komunikasi Kabel Laut” (“SKKL”) Sumatera - Bangka ("SBCS") and SKKL Tarakan - Tanjung Selor ("TSCS") | |
The Company and PT Ketrosden Triasmitra | | March 6, 2012 | | Procurement agreement for 2 Fiber Pairs (4 Core) SKKL Jakarta - Bangka - Batam - Singapore and Batam - Bintan with IRU Pattern | |
The Company and PT Ketrosden Triasmitra - PT Nautic Maritime Salvage | | August 30, 2012 | | Procurement and installation agreement for SKKL Luwuk - Tutuyan Cable System ("LTCS") | |
The Company and PT Industri Telekomunikasi Indonesia | | December 30, 2010 | | Procurement and installation agreement for copper wire access modernization through Trade In/Trade Off method | |
The Company and PT Len Industri (Persero) | | March 29, 2012 | | Procurement and installation agreement for copper wire access modernization through Trade In/Trade Off method | |
(ii) Telkomsel | | | | | |
Telkomsel, PT Ericsson Indonesia, Ericsson AB, PT Nokia Siemens Networks, Nokia Siemens Networks Oy and Nokia Siemens Network GmbH & Co. KG | | April 17, 2008* | | The combined 2G and 3G CS Core Network Rollout Agreements | |
Telkomsel, PT Ericsson Indonesia, and PT Nokia Siemens Networks | | April17, 2008* | | Technical Service Agreement ("TSA") forCombined 2G and 3G CS Core Network | |
Telkomsel, PT Ericsson Indonesia, Ericsson AB, PT Nokia Siemens Networks, Nokia Siemens Networks Oy Huawei International Pte. Ltd.,PT Huawei Tech Investment and PT ZTE Indonesia | | March and June 2009* | | 2G BSS and 3G UTRANRollout agreement for the provision of2G GSM BSS and 3G UMTS Radio Access Network | |
Telkomsel, PT Trikomsel OKE and PT Mitra Telekomunikasi Selular (“MTS”) | | July 2009** | | Purchase of iPhone products and provision of cellular network service | |
Telkomsel, PT Packet Systems Indonesia and PT Huawei Tech Investment | | February 3, 2010 | | Maintenance and procurement of equipment and related service agreement for Next Generation Convergence IP RAN Rollout and Technical Support | |
Telkomsel, PT Datacraft Indonesia andPT Huawei Tech Investment | | February 3, 2010 | | Maintenance and procurement of equipment and related service agreement for Next Generation Convergence Core Transport Rollout and Technical Support | |
Telkomsel, Amdocs Software Solutions Limited Liability Company and PT Application Solutions | | February 8, 2010 | | Online Charging System (“OCS”) and Service Control Points (“SCP”) System Solution Development Agreement | |
Telkomsel and PT Application Solutions | | February 8, 2010 | | Technical Support Agreement to provide technical support services for the OCS and SCP | |
| | | | | |
* Based on PT Nokia Siemens Network("NSN")letters in July and September 2012, NSN agreed on a new extension up to December 31, 2012 (Note 42). Based on PT Ericsson Indonesia letter dated October 1, 2012, PT Ericsson Indonesia (“EI”) and Ericsson AB agreed to apply price adjustment to hardware, software and service purchased by Telkomsel up to December 31, 2012. Subsequently, in December 2012, EI and Ericsson AB agreed to extend the period until March 2, 2013. | |
- ** Note 37c.iv. | |
F - 111
PERUSAHAAN PERSEROAN (PERSERO)
PT TELEKOMUNIKASI INDONESIA Tbk AND SUBSIDIARIES
NOTES TO THE CONSOLIDATED FINANCIAL STATEMENTS
As of December 31, 2011 and 2012 and
for the years ended December 31, 2010, 2011 and 2012
(Figures in tables are presented in billions of rupiah, unless otherwise stated)
TABLE OF CONTENTS
3
7. SIGNIFICANT COMMITMENTS AND AGREEMENTS (continued)
a. Capital expenditures (continued)
Contracting parties | | Date of agreement | | Significant provisions of the agreement | |
(ii) Telkomsel (continued) | | | | | |
Telkomsel,PT Nokia Siemens Networks and Nokia Siemens Networks Oy | | January 27, 2011 | | Soft HLR Rollout agreement | |
Telkomsel and PT Nokia Siemens Networks | | January 27, 2011 | | Soft HLR Technical Support Agreement | |
Telkomsel and PT Application Solutions | | July 5, 2011 | | Development and Rollout agreement for Customer Relationship Management and Contact Center solutions | |
Telkomsel and Nokia Siemens Networks Oy andPTHuawei Tech Investment | | July 11, 2011 | | Procurement agreement for equipment | |
Telkomsel andPT Ericsson Indonesia | | December 21, 2011 | | Development and Rollout of Operation Support System (“OSS”) | |
Telkomsel and Huawei International Pte. Ltd and PT Huawei Tech Investment | | July 17, 2012 | | CS Core System Rollout and CS Core System Technical Support | |
(iii) GSD | | | | | |
TLTand PTAdhi Karya | | November 6, 2012 | | Service arrangement structure and main contractor architecture for Telkom Landmark Tower Building development project | |
(iv) Dayamitra | | | | | |
Dayamitra and PT Aksara Indah | | December 11, 2012 | | Telecommunication tower development agreement | |
Dayamitra and PT Citramas Heavy Industries | | October 8, 2012 | | Telecommunication tower procurement agreement | |
Dayamitra and PT Bukaka Teknik Utama | | February 17, 2012 | | Telecommunication tower procurement agreement | |
F - 112
PERUSAHAAN PERSEROAN (PERSERO)
PT TELEKOMUNIKASI INDONESIA Tbk AND SUBSIDIARIES
NOTES TO THE CONSOLIDATED FINANCIAL STATEMENTS
As of December 31, 2011 and 2012 and
for the years ended December 31, 2010, 2011 and 2012
(Figures in tables are presented in billions of rupiah, unless otherwise stated)
TABLE OF CONTENTS
3
7. SIGNIFICANT COMMITMENTS AND AGREEMENTS (continued)
b. Borrowings and other credit facilities
(i) As of December 31, 2012, the Company has bank guarantee facilities for tender bond, performance bond, maintenance bond, deposit guarantee and advance payment bond for various projects of the Company, as follows:
| | | | | | Facility utilized | |
Lenders | | Totalfacility | | Maturity | | Currency | | Original currency (in millions) | | Rupiah/ rupiah equivalent | |
BRI | | 250 | | March 14, 2014 | | Rp | | - | | 173 | |
| | | | | | US$ | | 0.03 | | 1 | |
BNI | | 250 | | March 31, 2013 | | Rp | | - | | 98 | |
| | | | | | US$ | | 0.26 | | 3 | |
Bank Mandiri | | 150 | | December 23, 2013 | | Rp | | - | | 46 | |
| | | | | | US$ | | 0.02 | | - | |
Total | | 650 | | | | | | | | 321 | |
(ii) Telkomsel has a US$3 million bond and bank guarantee and standby letter of credit facilities with SCB, Jakarta. The facilities expire on July 31, 2013. Under these facilities, as of December 31, 2012, Telkomsel has issued a bank guarantee of Rp20 billion (equivalent to US$2.1 million) for a 3G performance bond (Note 37c.i). The bank guaranteeis valid until April 7, 2013.
(iii) TII has a US$15 million bank guarantee from Bank Mandiri. The facility expires on December 18, 2013. Under this facility, as of December 31, 2012, TII has issued a bank guarantee of Rp96.3 billion (equivalent to US$10 million) for mobile spectrum license performance bond in Timor Leste.
c. Others
(i) 3G license
With reference to the Decision Letters No. 07/PER/M.KOMINFO/2/2006 and No. 268/KEP/M.KOMINFO/9/2009 of the MoCI, Telkomsel is required, among other things, to:
1. Pay an annual BHP fee which is calculated based on a certain formula over the license term (10 years) as set forth in the Decision Letters. The BHP is payable upon receipt of the notification letter (“Surat Pemberitahuan Pembayaran”) from the DGPI. The BHP fee is payable annually up to the expiry date of the license in 2019. Annual BHP fee for 2011 based on notification letter from the DGPI amounted to Rp495 billion. Such fee amount for each year varies depending on certain variables set in the formula.
2. Provide roaming access for the existing other 3G operators.
3. Contribute to USO development.
4. Construct a 3G network which covers at least 14 provinces by the sixth year of holding the 3G license.
5. Issue a performance bond each year amounting to Rp20 billion or 5% of the annual fee to be paid for the subsequent year, whichever is bigger.
F - 113
PERUSAHAAN PERSEROAN (PERSERO)
PT TELEKOMUNIKASI INDONESIA Tbk AND SUBSIDIARIES
NOTES TO THE CONSOLIDATED FINANCIAL STATEMENTS
As of December 31, 2011 and 2012 and
for the years ended December 31, 2010, 2011 and 2012
(Figures in tables are presented in billions of rupiah, unless otherwise stated)
TABLE OF CONTENTS
3
7. SIGNIFICANT COMMITMENTS AND AGREEMENTS (continued)
c. Others (continued)
(ii) Palapa Ring Consortium
On November 22, 2011, based on the letter No. 01/PR-MC/IV/2011 of the management of the Palapa Ring Consortium, the Palapa Ring Consortium agreement was terminated. Subsequently, based on the letter No. 02/PR-MC/IV/2011 dated December 28, 2011, the escrow account was closed and the escrow account balance amounting to US$4.6 million was returned to the Company.
(iii) Radio Frequency Usage
Based on the Decree No. 76 dated December 15, 2010 of the Government of the Republic of Indonesia, which amended Decree No. 7 dated January 16, 2009, the annual frequency usage fees for bandwidths of 800 Megahertz (“MHz”), 900 MHz and 1800 MHz are determined using a formula set forth intheDecree. The Decree is applicable for 5 years unless further amended.
As an implementation of the Decree above, on December 15, 2010, in its Decision Letter No. 456A/KEP/M.KOMINFO/12/2010, the MoCI determined that the first year (Y1), 2010, for annual frequency usage fee of Telkomsel with licenses in the bandwidths of 900 MHz and 1800 MHz was Rp716 billion which was paid on December 30, 2010.
Based on the same Decision Letter above and Decision Letter No. 5039/T/DJPT.4/KOMINFO/12/2010 dated December 16, 2010, the MoCI determined that the first year (Y1), 2010, annual frequency usage fee of the Company with licenses in the bandwidth of 800 MHz was Rp52 billion which was paid on December 27, 2010.
Subsequently, based on Decision Letter No. 590/KEP/M.KOMINFO/11/2011 dated
November 14, 2011, the Company and Telkomsel were determined to have overpaid the fees by Rp31 billion and Rp117 billion, respectively, which are treated as a prepayment of annual frequency usage fee in the second year.
Based on Decision Letters No. 349/KEP/M.KOMINFO/08/2011 and No.350/KEP/M.KOMINFO/08/2011 dated August 8, 2011, the MoCI determined that the second year (Y2), 2011, annual frequency usage fees of the Company and Telkomsel were Rp142 billion and Rp1,834 billion, respectively. The fees were paid in December 2011, net of the above-mentioned prepayment.
Based on Decision Letters No. 495 dated August 29, 2012 and No. 491 dated August 29, 2012, the MoCI determined that the third year (Y3), 2012, annual frequency usage fees of the Company and Telkomsel were Rp174 billion and Rp1,718 billion, respectively. The fees were paid on December 15, 2012.
Prior to issuance of the Decree above, in accordance with the prevailing laws and telecommunications regulations, the operators were obliged to register their radio stations with the DGPI to obtain frequency usage license, except those stations that use 2.1 GHz frequency bandwidth (Note 37c.i). The frequency usage fees were payable upon receipt of notification letter (“Surat Pemberitahuan Pembayaran”) from the DGPI. The fee was determined based on the number of registered carriers (“TX”) for the Company and transceivers (“TRX”) for Telkomsel of the radio stations with fees ranging from Rp0.07 million to Rp17.55 million for each TX and from Rp3.4 million to Rp15.9 million for each TRX (Note 8).
F - 114
PERUSAHAAN PERSEROAN (PERSERO)
PT TELEKOMUNIKASI INDONESIA Tbk AND SUBSIDIARIES
NOTES TO THE CONSOLIDATED FINANCIAL STATEMENTS
As of December 31, 2011 and 2012 and
for the years ended December 31, 2010, 2011 and 2012
(Figures in tables are presented in billions of rupiah, unless otherwise stated)
TABLE OF CONTENTS
3
7. SIGNIFICANT COMMITMENTS AND AGREEMENTS (continued)
c. Others (continued)
(iv) Apple, Inc
On January 9 and July 16, 2009, Telkomsel entered into agreements with Apple, Inc for the purchase of iPhone products, marketing them to customers using third parties (PT Trikomsel OKEand PT Mitra Telekomunikasi Selular) andproviding cellular network services over a 3-year term. Subsequently, on July 16, 2012, Telkomsel replaced them with a new agreement. Cumulative minimum iPhone units to be purchased up to June 2015 are at least 500,000 units.
(v) Future Minimum Lease Payments under Operating Leases
The Company and subsidiaries entered into non-cancelable lease agreements with both third and related parties. The lease agreements consist of leased line, telecommunication equipment and land and building with terms ranging from1 until 10 years and with expiry dates between 2013 and 2022.
Future minimum lease payments for operating lease agreements as of December 31, 2012 are as follows:
| | Total | | Less than 1 year | | 1-5 years | | More than 5 years | |
As lessee | | 13,829 | | 2,017 | | 6,617 | | 5,195 | |
As lessor | | 5,602 | | 1,863 | | 3,207 | | 532 | |
38. CONTINGENCIES
a. In the ordinary course of business, the Company and subsidiaries have been named as defendants in various legal actions in relation to land disputes, monopolistic practice and unfair business competition and SMS cartel practices. Based on management's estimate of the probable outcomes of these matters, the Company and subsidiaries have recognized provision for losses amounting to Rp53 billion as of December 31, 2012.
b. The Company, Telkomsel and seven other local operators are being investigated by the Commission for the Supervision of Business Competition(“Komisi Pengawasan Persaingan Usaha” or “KPPU”) for allegations of SMS cartel practices. As a result of the investigations on June 17, 2008, the KPPU found that the Company, Telkomsel and certain other local operators had violated Law No. 5 year 1999 article 5 and charged the Company and Telkomsel penalties in the amounts of Rp18 billion and Rp25 billion, respectively.
Management believes that there are no such cartel practices that led to a breach of prevailing regulations. Accordingly, the Company and Telkomsel filed an appeal with the Bandung District Court and South Jakarta District Court, on July 14, 2008 and July 11, 2008, respectively.
Due to the filing of cases by operators in various courts, subsequently, the KPPU requested the SC to consolidate the cases into the Central Jakarta District Court. Based on the SC’s decision letter dated April 12, 2011, the SCappointed theCentral Jakarta District Courtto investigate and resolve the case.
As of the issuance date of the consolidated financial statements, the parties have not received any notification from theCourt about the progress of the case.
F - 115
PERUSAHAAN PERSEROAN (PERSERO)
PT TELEKOMUNIKASI INDONESIA Tbk AND SUBSIDIARIES
NOTES TO THE CONSOLIDATED FINANCIAL STATEMENTS
As of December 31, 2011 and 2012 and
for the years ended December 31, 2010, 2011 and 2012
(Figures in tables are presented in billions of rupiah, unless otherwise stated)
TABLE OF CONTENTS
3
8. CONTINGENCIES (continued)
c. In connection with the dispute between Telkomsel and PT Prima Jaya Informatika ("PT Prima"), a distributor of Telkomsel of pulse reload vouchers under a distribution agreement between the parties, based on its verdict on September 14, 2012, the Central Jakarta District Court accepted a bankruptcy petition against Telkomsel filed by PT Prima.
The bankruptcy petition was filed by PT Prima on the basis of:
• PT Prima’s claim on overdue receivables from Telkomsel amounting to Rp5.26 billion which represent undelivered pulse reload vouchers based on purchase orders of PT Prima, and
• An outstanding receivable of another company from Telkomsel.
Telkomsel argued that the payable to the other company has been paid and PT Prima has no right to claim any receivables from Telkomsel, considering thatPTPrima has not made any payment to Telkomsel on its orders and it has breached the terms and conditions as stipulated in the above-mentioned agreement. Therefore, the requirement for a bankruptcy petition should not have been met.
Accordingly, Telkomsel has taken the necessary actions to resolve the case, including filing an appeal to the Supreme Court (“SC”) on September 21, 2012.
On November 21, 2012,based on the SC’s verdict No. 704 K/Pdt.Sus/2012, the SC decided to:
• Approve Telkomsel’s appeals and
• Revoke theCentral Jakarta District Court’s verdict.
As of the issuance date of the consolidated financial statements, the case is still under Judicial Review (“Peninjauan Kembali” or “PK”) process in the SC since PT Prima filed aPK on the SC’s verdict (Note 42g).
The Company and subsidiaries do not believe that any subsequent investigation or court decision on the above matters and cases will have significant financial impact to the Company and subsidiaries.
F - 116
PERUSAHAAN PERSEROAN (PERSERO)
PT TELEKOMUNIKASI INDONESIA Tbk AND SUBSIDIARIES
NOTES TO THE CONSOLIDATED FINANCIAL STATEMENTS
As of December 31, 2011 and 2012 and
for the years ended December 31, 2010, 2011 and 2012
(Figures in tables are presented in billions of rupiah, unless otherwise stated)
TABLE OF CONTENTS
39. FINANCIAL RISK MANAGEMENT
1. Financial risk management
The Company and subsidiaries’ activities exposethemto a variety of financial risks such as market risks (including foreign exchange risk and interest rate risk), credit risk and liquidity risk. Overall, the Company and subsidiaries’ financial risk management program is intended for minimizing losses on the financial assets and financial liabilities arising from fluctuation of foreign currency exchange rates and the fluctuation of interest rates. Managementhas a written policy for foreign currency risk management mainly through time deposit placements and hedging to cover foreign currency risk exposures forperiods ranging from 3 up to 12 months.
Financial risk management is carried out bythe Treasury Management unit under policies approved by the Board of Directors. The Treasury Management unit identifies, evaluates and hedges financial risks.
a. Foreign exchange risk
The Company and subsidiaries are exposed to foreign exchange risk on sales, purchases and borrowings that are denominated in foreign currencies. The foreign currency denominated transactions are primarily inU.S. dollar and Japaneseyen. The Company’s and subsidiaries’ exposures to other foreign exchange rates are not material.
Increasing risks of foreign currency exchange rates on the obligations of the Company and subsidiaries are expected to be offset by time deposits and receivables in foreign currencies that are equal to at least 25% of the outstanding current liabilities.
The following tablepresents the Company and subsidiaries’ financial assets andfinancialliabilitiesexposure to foreign currency risk:
| | 2011 | | 2012 | |
| | U.S Dollars (in billions) | | JapaneseYen (in billions) | | U.S Dollars (in billions) | | JapaneseYen (in billions) | |
Financial assets | | 0.28 | | 0.00 | | 0.51 | | 0.00 | |
Financial liabilities | | (0.77 | ) | (10.02 | ) | (0.61 | ) | (9.25 | ) |
Net exposure | | (0.49 | ) | (10.02 | ) | (0.10 | ) | (9.25 | ) |
Sensitivity analysis
A strengthening of theU.S. dollar and Japaneseyen, as indicated below, against the rupiah at December 31, 2012 would have decreased equity and profit or loss by the amounts shown below. This analysis is based on foreign currency exchange rate variances that the Company and subsidiaries considered to be reasonably possible at the reporting date. The analysis assumes that all other variables, in particular interest rates, remain constant.
| | Equity/profit (loss) | |
December 31, 2012 | | | |
U.S. dollar (1% strengthening) | | (10 | ) |
Japanese yen (5% strengthening) | | (52 | ) |
A weakening of theU.S. dollar and Japaneseyen against the rupiah at December 31, 2012 would have had an equal but opposite effect on the above currencies to the amounts shown above, on the basis that all other variables remain constant.
F - 117
PERUSAHAAN PERSEROAN (PERSERO)
PT TELEKOMUNIKASI INDONESIA Tbk AND SUBSIDIARIES
NOTES TO THE CONSOLIDATED FINANCIAL STATEMENTS
As of December 31, 2011 and 2012 and
for the years ended December 31, 2010, 2011 and 2012
(Figures in tables are presented in billions of rupiah, unless otherwise stated)
TABLE OF CONTENTS
39. FINANCIAL RISK MANAGEMENT (continued)
1. Financial risk management (continued)
b. Market price risk
The Company and subsidiaries are exposed to changes in debt and equity market prices related to available-for-sale investments carried at fair value. Gains and losses arising from changes in the fair value of available-for-sale investments are recognized in equity.
The performance of the Company and subsidiaries’ available-for-sale investmentsismonitored periodically, together with a regular assessment of their relevance to the Company and subsidiaries’ long-term strategic plans.
As of December 31, 2012, management considered the price risk for its available-for-sale investments to be immaterial in terms of the possible impact on profit or loss and total equity from a reasonably possible change in fair value.
c. Interest rate risk
Interest rate fluctuation is monitored to minimize any negative impact to financial position. Borrowings at variable interest rates expose the Company and subsidiaries to interest rate risk (Notes 17and 18). To measure market riskpertaining tofluctuations in interest rates, the Companyand subsidiariesprimarily use interest margin and maturity profile of the financial assets and liabilities based on changing schedule of the interest rate.
At reporting date, the interest rate profile of the Company and subsidiaries’ interest-bearing borrowings wasas follows:
| | 2011 | | 2012 | |
Fixed rate borrowings | | (5,409 | ) | (7,025 | ) |
Variable rate borrowings | | (12,462 | ) | (12,250 | ) |
Sensitivity analysis for variable rate borrowings
At December 31, 2012, a change of 25 basis pointsin interest rates of variable rate borrowings would have increased or decreased equity and profit or loss by Rp31 billion, respectively. This analysis assumes that all other variables, in particular foreign currency rates, remain constant.
d. Credit risk
The following table presentsthe maximum exposure to credit risk of the Company and subsidiaries’ financial assets:
| | 2011 | | 2012 | |
Cash and cash equivalents | | 9,634 | | 13,118 | |
Other current financial assets | | 373 | | 4,338 | |
Trade and other receivables | | 5,393 | | 5,409 | |
Long-term investments | | 21 | | 21 | |
Advances and other non-current assets | | 218 | | 614 | |
Total | | 15,639 | | 23,500 | |
The Company and subsidiaries are exposed to credit risk primarily from trade receivables and other receivables.The credit risk is managed by continuous monitoringofoutstanding balances and collection of trade and other receivables.
F - 118
PERUSAHAAN PERSEROAN (PERSERO)
PT TELEKOMUNIKASI INDONESIA Tbk AND SUBSIDIARIES
NOTES TO THE CONSOLIDATED FINANCIAL STATEMENTS
As of December 31, 2011 and 2012 and
for the years ended December 31, 2010, 2011 and 2012
(Figures in tables are presented in billions of rupiah, unless otherwise stated)
TABLE OF CONTENTS
39. FINANCIAL RISK MANAGEMENT (continued)
1. Financial risk management (continued)
d. Credit risk (continued)
Trade and other receivables do not include any major concentration of credit risk by customer. Each of the top three customers account for less than 1% of the trade receivables as ofDecember 31, 2012.
Management is confident in its ability to continue to control and sustain minimal exposureto credit risk given that the Company and subsidiaries have provided sufficientprovision for impairment of receivables to cover incurred loss arising from uncollectible receivables based on existing historicaldata on credit losses.
e. Liquidity risk
Liquidity risk arises in situations where the Company and subsidiaries have difficulties in fulfilling financial liabilities when they become due.
Prudent liquidity risk management implies maintaining sufficient cash and cash equivalents in order tomeet the Company and subsidiaries’ financial obligations. The Company and subsidiaries continuously perform an analysis to monitorfinancial position ratios, among others, liquidity ratios, debt equity ratios against debt covenant requirements.
The following is the maturity profile of the Company and subsidiaries’ financial liabilities:
| | | | | | Maturity | |
| | Carrying amount | | Contractual cash flows | | 2012 | | 2013 | | 2014 | | 2015 | | 2016 and thereafter | |
December 31, 2011 | | | | | | | | | | | | | | | |
Trade and other payables | | 8,355 | | (8,355 | ) | (8,355 | ) | - | | - | | - | | - | |
Accrued expenses | | 4,790 | | (4,790 | ) | (4,790 | ) | - | | - | | - | | - | |
Loans and other borrowings | | | | | | | | | | | | | | | |
Bank loans | | 11,291 | | (12,763 | ) | (4,852 | ) | (3,854 | ) | (2,468 | ) | (1,156 | ) | (433 | ) |
Obligations under finance leases | | 510 | | (642 | ) | (259 | ) | (179 | ) | (110 | ) | (33 | ) | (61 | ) |
Two-step loans | | 2,284 | | (2,866 | ) | (374 | ) | (286 | ) | (279 | ) | (272 | ) | (1,655 | ) |
Bonds and notes | | 3,786 | | (5,895 | ) | (708 | ) | (608 | ) | (407 | ) | (1,258 | ) | (2,914 | ) |
Total | | 31,016 | | (35,311 | ) | (19,338 | ) | (4,927 | ) | (3,264 | ) | (2,719 | ) | (5,063 | ) |
| | | | | | Maturity | |
| | Carrying amount | | Contractual cash flows | | 2013 | | 2014 | | 2015 | | 2016 | | 2017 and thereafter | |
December 31, 2012 | | | | | | | | | | | | | | | |
Trade and other payables | | 7,457 | | (7,457 | ) | (7,457 | ) | - | | - | | - | | - | |
Accrued expenses | | 6,163 | | (6,163 | ) | (6,163 | ) | - | | - | | - | | - | |
Loans and other borrowings | | | | | | | | | | | | | | | |
Bank loans | | 11,295 | | (12,585 | ) | (5,118 | ) | (3,869 | ) | (2,518 | ) | (602 | ) | (478 | ) |
Obligations under finance leases | | 2,324 | | (3,172 | ) | (652 | ) | (548 | ) | (398 | ) | (354 | ) | (1,220 | ) |
Two-step loans | | 1,987 | | (2,462 | ) | (283 | ) | (277 | ) | (270 | ) | (263 | ) | (1,369 | ) |
Bonds and notes | | 3,669 | | (5,462 | ) | (757 | ) | (505 | ) | (1,287 | ) | (203 | ) | (2,710 | ) |
Total | | 32,895 | | (37,301 | ) | (20,430 | ) | (5,199 | ) | (4,473 | ) | (1,422 | ) | (5,777 | ) |
The difference between the carrying amount and the contractual cash flows is interest value.
F - 119
PERUSAHAAN PERSEROAN (PERSERO)
PT TELEKOMUNIKASI INDONESIA Tbk AND SUBSIDIARIES
NOTES TO THE CONSOLIDATED FINANCIAL STATEMENTS
As of December 31, 2011 and 2012 and
for the years ended December 31, 2010, 2011 and 2012
(Figures in tables are presented in billions of rupiah, unless otherwise stated)
TABLE OF CONTENTS
39. FINANCIAL RISK MANAGEMENT
(continued)
2. Fair value of financial assets andfinancialliabilities
a. Fair value measurement
Fair value is the amount for which an asset could be exchanged, or liability settled,between knowledgeable, willing parties in an arm’s length transaction.
The Company and subsidiaries determined the fair value measurement for disclosure purposes of each class of financial assets and financial liabilities based on the following methods and assumptions:
(i) The fair values of short-term financial assets and financial liabilities with maturities of one year or less (cash and cash equivalents, other current financial assets, trade and other receivables, trade and other payables, accrued expenses
and short-term bank loans) are considered toapproximate their carrying amountsas the impact of discounting is not significant.
(ii) Available-for-sale financial assets primarily consist of shares, mutual funds and Corporate and Government bonds. Shares and mutual funds actively traded on an established market are stated at fair value using quoted market price or if unquoted, determined using a valuation technique. Corporate and Government bonds are stated at fair value by reference to prices of similar securities at the reporting date.
(iii) The fair values of long-termfinancialliabilities are estimated by discounting the future contractual cash flows of each liability at rates offered to the Company and subsidiaries for similarliabilities of comparable maturities by the bankers of the Company and subsidiaries, except for bonds which are based on market prices.
The fair value estimates are inherently judgmental and involve various limitations, including:
a. Fair values presented do not take into consideration the effect of future currency fluctuations.
b. Estimated fair values are not necessarily indicative of the amounts that the Company and subsidiaries would record upon disposal/termination of the financial assets and liabilities.
b. Classification and fair value
The followingtable presents the carrying value and estimated fair values of the Company and subsidiaries' financial assets and liabilities based on their classifications:
| | December 31, 2011 | |
| | Trading | | Loans andreceivables | | Available forsale | | Other financialliabilities | | Total carryingamount | | Fair value | |
Cash and cash equivalents | | - | | 9,634 | | - | | - | | 9,634 | | 9,634 | |
Other current financial assets | | - | | 12 | | 361 | | - | | 373 | | 373 | |
Trade and other receivables | | - | | 5,393 | | - | | - | | 5,393 | | 5,393 | |
Long-term investments | | - | | - | | 21 | | - | | 21 | | 21 | |
Advances and other non-current assets | | - | | 218 | | - | | - | | 218 | | 218 | |
Total financial assets | | - | | 15,257 | | 382 | | - | | 15,639 | | 15,639 | |
Trade and other payables | | - | | - | | - | | (8,355 | ) | (8,355 | ) | (8,355 | ) |
Accrued expenses | | - | | - | | - | | (4,790 | ) | (4,790 | ) | (4,790 | ) |
Loans and other borrowings | | | | | | | | | | | | | |
Short-term bank loans | | - | | - | | - | | (100 | ) | (100 | ) | (100 | ) |
Obligations under finance leases | | - | | - | | - | | (510 | ) | (510 | ) | (510 | ) |
Two-step loans | | - | | - | | - | | (2,284 | ) | (2,284 | ) | (2,357 | ) |
Bonds and notes | | - | | - | | - | | (3,786 | ) | (3,786 | ) | (3,974 | ) |
Long-term bank loans | | - | | - | | - | | (11,191 | ) | (11,191 | ) | (11,325 | ) |
Total financial liabilities | | - | | - | | - | | (31,016 | ) | (31,016 | ) | (31,411 | ) |
F - 120
PERUSAHAAN PERSEROAN (PERSERO)
PT TELEKOMUNIKASI INDONESIA Tbk AND SUBSIDIARIES
NOTES TO THE CONSOLIDATED FINANCIAL STATEMENTS
As of December 31, 2011 and 2012 and
for the years ended December 31, 2010, 2011 and 2012
(Figures in tables are presented in billions of rupiah, unless otherwise stated)
TABLE OF CONTENTS
39. FINANCIAL RISK MANAGEMENT
(continued)
2. Fair value of financial assets andfinancialliabilities(continued)
b. Classification and fair value (continued)
| | December 31, 2012 | |
| | Trading | | Loans andreceivables | | Available forsale | | Other financial liabilities | | Total amount | | Fair value | |
Cash and cash equivalents | | - | | 13,118 | | - | | - | | 13,118 | | 13,118 | |
Other current financial assets | | - | | 4,028 | | 310 | | - | | 4,338 | | 4,338 | |
Trade and other receivables | | - | | 5,409 | | - | | - | | 5,409 | | 5,409 | |
Long-term investments | | - | | - | | 21 | | - | | 21 | | 21 | |
Advances and other non-current assets | | - | | 614 | | - | | - | | 614 | | 614 | |
Total financial assets | | - | | 23,169 | | 331 | | - | | 23,500 | | 23,500 | |
Trade and other payables | | - | | - | | - | | (7,457 | ) | (7,457 | ) | (7,457 | ) |
Accrued expenses | | - | | - | | - | | (6,163 | ) | (6,163 | ) | (6,163 | ) |
Loans and other borrowings | | | | | | | | | | | | | |
Short-term bank loans | | - | | - | | - | | (37 | ) | (37 | ) | (37 | ) |
Obligations under finance leases | | - | | - | | - | | (2,324 | ) | (2,324 | ) | (2,324 | ) |
Two-step loans | | - | | - | | - | | (1,987 | ) | (1,987 | ) | (2,075 | ) |
Bonds and notes | | - | | - | | - | | (3,669 | ) | (3,669 | ) | (4,022 | ) |
Long-term bank loans | | - | | - | | - | | (11,258 | ) | (11,258 | ) | (11,346 | ) |
Total financial liabilities | | - | | - | | - | | (32,895 | ) | (32,895 | ) | (33,424 | ) |
c. Fair value hierarchy
The table below presents the recorded amount of financial assets measured at fair value and limited mutual funds participation unit for debt-based securities where the Net Asset Value (“NAV”) per share of the investments information is not published as explained below:
| | December 31, 2011 | |
| | | | Fair value measurement at reporting date using | |
| | Balance | | Quoted pricesin active marketsfor identicalassets orliabilities (level 1) | | Significantother observableinputs (level 2) | | Significant unobservableinputs (level 3) | |
Financial assets | | | | | | | | | |
Available-for-sale securities | | 361 | | 46 | | 251 | | 64 | |
| | December 31, 2012 | |
| | | | Fair value measurement at reporting date using | |
| | Balance | | Quoted pricesin active marketsfor identical assets orliabilities (level 1) | | Significant other observable inputs (level 2) | | Significant unobservableinputs (level 3) | |
Financial assets | | | | | | | | | |
Available-for-sale securities | | 310 | | 52 | | 210 | | 48 | |
F - 121
PERUSAHAAN PERSEROAN (PERSERO)
PT TELEKOMUNIKASI INDONESIA Tbk AND SUBSIDIARIES
NOTES TO THE CONSOLIDATED FINANCIAL STATEMENTS
As of December 31, 2011 and 2012 and
for the years ended December 31, 2010, 2011 and 2012
(Figures in tables are presented in billions of rupiah, unless otherwise stated)
TABLE OF CONTENTS
39. FINANCIAL RISK MANAGEMENT
(continued)
2. Fair value of financial assets andfinancialliabilities(continued)
c. Fair value hierarchy (continued)
Available-for-sale financial assets primarily consist of shares, mutual funds and Corporate and Government bonds. Corporate and Government bonds are stated at fair value by reference to prices of similar securities at the reporting date. As they are not actively traded on an established market, these securities are classified as level 2.
Shares and mutual funds actively traded on an established market are stated at fair value using quoted market price and classified within level 1. The valuation of the mutual funds invested in Corporate and Government bonds requires significant management judgment due to the absence of quoted market prices, the inherent lack of liquidity and the long-term nature of such assets. As these investments are subject to restrictions on redemption (such as transfer restrictions and initial lock-up periods) and observable activity for the investments is limited, these investments are therefore classified within level 3 of the fair value hierarchy.Management considers, among other assumptions, the valuation and quoted price of the arrangement of the mutual funds.
Reconciliations between the beginning and ending balances for items measured at fair value using significant unobservable inputs (level 3) as of December 31, 2011 and 2012 are as follows:
| | 2011 | | 2012 | |
Mutual fund | | | | | |
Balance at January 1 | | 58 | | 64 | |
Purchase | | 16 | | 8 | |
Included in consolidated statementsof comprehensive Income: | | | | | |
Realized loss - recognizedin profit or loss for the year | | (0 | ) | (1 | ) |
Unrealized loss - recognizedin other comprehensive income | | (2 | ) | (2 | ) |
Redemption | | (8 | ) | (21 | ) |
Balance at December 31 | | 64 | | 48 | |
F - 122
PERUSAHAAN PERSEROAN (PERSERO)
PT TELEKOMUNIKASI INDONESIA Tbk AND SUBSIDIARIES
NOTES TO THE CONSOLIDATED FINANCIAL STATEMENTS
As of December 31, 2011 and 2012 and
for the years ended December 31, 2010, 2011 and 2012
(Figures in tables are presented in billions of rupiah, unless otherwise stated)
TABLE OF CONTENTS
40. CAPITAL MANAGEMENT
The capital structure of the Company and subsidiaries is as follows:
| | 2011 | | 2012 | |
| | Amount | | Portion | | Amount | | Portion | |
Short-term debts | | 100 | | 0.16% | | 37 | | 0.06% | |
Long-term debts | | 17,771 | | 27.95% | | 19,238 | | 29.16% | |
Total debts | | 17,871 | | 28.11% | | 19,275 | | 29.22% | |
Equity attributable to owners | | 45,711 | | 71.89% | | 46,700 | | 70.78% | |
Total | | 63,582 | | 100.00% | | 65,975 | | 100.00% | |
The Company’s objectives when managing capital are to safeguard the Company’s ability to continue as a going concern in order to provide returns for stockholders and benefits to other stockholders and to maintain an optimum capital structure to minimize the cost of capital.
Periodically, the Company conducts debt valuation to assess possibilities of refinancing existing debts with new ones which have more efficient cost that will lead to more optimized cost-of-debt. In case of rich idle cash coupled with limited investment opportunities, the Company will consider buying back its shares or paying dividend to its stockholders.
In addition to complying with loan covenants, the Company also maintains its capital structure at the level it believes will not risk its credit rating and that is comparable with that of its competitors.
Debt-to-equity ratio (comparing net interest-bearing debt to total equity) is a ratio which is monitored by management to evaluate the Company’s capital structure and review the effectiveness of the Company’s debts. The Company monitors its debt levels to ensure the debt-to-equity ratio complies with or is below the ratio set out in its contractual borrowings and that such ratio is comparable or better than the ratios of other regional area entities in the telecommunications industry.
The Company’s debt-to-equity ratio as of December 31, 2011 and 2012 is as follows:
| | 2011 | | 2012 | |
Total interest-bearing debts | | 17,871 | | 19,275 | |
Less cash and cash equivalents | | (9,634 | ) | (13,118 | ) |
Net debts | | 8,237 | | 6,157 | |
Total equity attributable to owners | | 45,711 | | 46,700 | |
Debt-to-equity ratio | | 18.02% | | 13.18% | |
As stated in Note 18, the Company is required to maintain a certain debt-to-equity ratio and debt service coverage ratio by the lenders. During the years ended December 31,2011 and 2012, the Company has complied with the externally imposed capital requirements.
PERUSAHAAN PERSEROAN (PERSERO)
PT TELEKOMUNIKASI INDONESIA Tbk AND SUBSIDIARIES
NOTES TO THE CONSOLIDATED FINANCIAL STATEMENTS
As of December 31, 2011 and 2012 and
for the years ended December 31, 2010, 2011 and 2012
(Figures in tables are presented in billions of rupiah, unless otherwise stated)
TABLE OF CONTENTS
41. SUPPLEMENTAL CASH FLOW INFORMATION
Certain investing and financing transactions do not require the use of cash and cash equivalents (non-cash investing and financing activities) although they affect the capital and asset structure of the Company and subsidiaries. The non-cash investing and financing activities for the years ended December 31, 2010, 2011 and 2012 are as follows:
| | 2010 | | 2011 | | 2012 | |
Acquisition of property and equipment through: | | | | | | | |
Trade payables | | 4,817 | | 4,900 | | 4,627 | |
Obligations under finance leases | | 58 | | 79 | | 2,588 | |
Non-monetary exchange | | - | | 1,226 | | 1,686 | |
Acquisition of data center business | | - | | - | | 150 | |
Reclassification of property and equipment to asset held for sale | | - | | 791 | | - | |
42. SUBSEQUENT EVENTS
a. On January 7, 2013, pursuant to the expiry of the agreement for procurement of core equipment and related services with NSN, NSN agreed on the extension period of price adjustment by applying final price to any hardware, software and service of the New Solution purchased by Telkomsel (Note37a.ii), from January 1, 2013 until the earlier of:
(i) the date that NSN enters into the New CS Core System Rollout Agreement (“ROA”) and/or TSA which supersedes the Existing CS Core Agreements with Telkomsel; and
(ii) January 31, 2013.
b. On January 8, 2013, based on notarial deed No. 02 dated January 8, 2013 of Utiek R. Abdurachman, S.H., MLI., MKn., which was approved by the MoLHR through its Letter No. AHU-03276.AH.01.01/2013 dated January 29, 2013, Metra established a subsidiary, PT Metra Media (“MM”), with 99.83% ownership. MM will engage in providing trade, construction, advertising and other services.
c. On January 8, 2013, based on notarial deed No. 03 dated January 8, 2013 of Utiek R. Abdurachman, SH., MLI., MKn., which was approved by the MoLHR through its Letter No. AHU-03261.AH.01.01/2013 dated January 29, 2013, Metra established a subsidiary, PT Metra TV (“Metra TV”), with 99.83% ownership. Metra TV will engage in providing subscription broadcasting services.
d. On January 9, 2013, based on the Circular Resolution of the Stockholders of TII dated January 9, 2013, as covered by notarial deed No. 04 dated February 6, 2013 of Siti Safarijah, S.H., TII’s stockholders agreed to establish a subsidiary, Telekomunikasi Indonesia Internasional Australia Pty. Ltd. (“Telkom Australia”). Telkom Australia will engage in providing telecommunication services and IT-based services.
e. On January 17, 2013, Sigma signed a share sale and transfer and loan assignment agreement with Landeskreditbank Baden-Wuttemberg-Forderbank (“L-Bank”), and Step Stuttgarter Engineering Park Gmbh. (“STEP”) as PT German Center Indonesia’s (“GCI”) stockholders. Based on that agreement, Sigma agreed to buy all the shares of GCI owned by L-Bank and STEP and take over L-Bank’s stockholders’ loan at a purchase price of US$17.8 million (equivalent to Rp170 billion). The transaction will close on April 1, 2013, subject to change with the written consent of all parties.
F - 124
PERUSAHAAN PERSEROAN (PERSERO)
PT TELEKOMUNIKASI INDONESIA Tbk AND SUBSIDIARIES
NOTES TO THE CONSOLIDATED FINANCIAL STATEMENTS
As of December 31, 2011 and 2012 and
for the years ended December 31, 2010, 2011 and 2012
(Figures in tables are presented in billions of rupiah, unless otherwise stated)
42. SUBSEQUENT EVENTS (continued)
f. On January 22, 2013, based on notarial deed No. 28 dated January 22, 2013 of N.M. Dipo Nusantara Pua Upa, S.H., MKn., which was approved by the MoLHR through its Letter No. AHU-03084.AH.01.01/2013 dated January 28, 2013, Metra established a subsidiary, PT Metra Digital Media (“MDM”), with 99.83% ownership. MDM will engage in providing telecommunication information and other services.
g. Dispute between Telkomsel and PT Prima
In connection with, the dispute between Telkomsel and PT Prima, on January 31, 2013, Telkomsel was notified by the Central Jakarta District Court (“Court”) that on January 29, 2013, PT Prima filed a PK to the SC on the SC’s verdict dated November 21, 2012. Based on the verdict, the SC revoked the decision of the Court which accepted the bankruptcy petition (Note38c).
Telkomsel believes that the SC has made a proper decision, accordingly, it filed a Contra-Memorandum to the SC on February 7, 2013.
As of the issuance date of the consolidated financial statements, the PK is still in process. The SC’s decision on this PK is expected to be issued in March 2013.
On January 31, 2013, the Court decided that a curator fee amounting to Rp147 billion shall be borne by Telkomsel. Telkomsel refuses to pay such fee, accordingly, through its letter dated February 12, 2013, Telkomsel requested the SC, among other things, to revoke the Court’s decision as the decision is not based on applicable guidelines as stipulated by the Decree of the MoLHR No. 01 Year 2013 dated January 11, 2013. Telkomsel also plans to file a PK on such decision to the SC.
h. Additional 3G License
In accordance with the announcement of MoCI No. 19/PIH/KOMINFO/2/2013 datedFebruary 25, 2013, Telkomsel is selected as one of the companies to be granted an additional 3G license with radio frequency in the 2.1 GHz bandwidth.
43. NEW STANDARDS AND INTERPRETATIONS NOT YET ADOPTED
The standards and interpretations that are issued, but not yet effective for the year ended December 31, 2012 and which have not been applied in preparing these consolidated financial statements are disclosed below. The Company and subsidiaries intend to adopt these standards, if applicable, when they become effective.
Effective for annual periods beginning on or after July 1, 2012
· IAS 1 Presentation of Items of Other Comprehensive Income - Amendments to IAS 1
The amendments to IAS 1 change the grouping of items presented in other comprehensive income. Items that could be reclassified (or ‘recycled’) to profit or loss at a future point in time (for example, net gain on hedge of net investment, exchange differences on translation of foreign operations, net movement on cash flow hedges and net loss or gain on available-for-sale financial assets) would be presented separately from items that will never be reclassified (for example, actuarial gains and losses on defined benefit plans and revaluation of land and buildings). The amendments affect presentation only and have no impact on the consolidated financial position or performance of the Company and subsidiaries.
F - 125
PERUSAHAAN PERSEROAN (PERSERO)
PT TELEKOMUNIKASI INDONESIA Tbk AND SUBSIDIARIES
NOTES TO THE CONSOLIDATED FINANCIAL STATEMENTS
As of December 31, 2011 and 2012 and
for the years ended December 31, 2010, 2011 and 2012
(Figures in tables are presented in billions of rupiah, unless otherwise stated)
TABLE OF CONTENTS
43. NEW STANDARDS AND INTERPRETATIONS NOT YET ADOPTED (continued)
Effective for annual periods beginning on or after January 1, 2013
· IAS 19 Employee Benefits (Revised)
The IASB has issued numerous amendments to IAS 19. These range from fundamental changes, such as removing the corridor mechanism and the concept of expected returns on plan assets to simple clarifications and re-wording. The Company and its subsidiaries elected to recognize actuarial gains and losses in other comprehensive income on its first adoption of IFRS in 2011. However, the amended standard will impact the net benefit expense as the expected return on plan assets will be calculated using the same interest rate as applied for the purpose of discounting the benefit obligation.
· IAS 28 Investments in Associates and Joint Ventures (as revised in 2011)
As a consequence of the new IFRS 11 Joint Arrangements and IFRS 12 Disclosure of Interests in Other Entities, IAS 28 Investments in Associates has been renamed IAS 28 Investments in Associates and Joint Ventures, and describes the application of the equity method to investments in joint ventures in addition to associates. It has no impact on the consolidated financial statements.
· IFRS 1 Government Loans - Amendments to IFRS 1
These amendments require first-time adopters to apply the requirements of IAS 20 Accounting for Government Grants and Disclosure of Government Assistance, prospectively to government loans existing at the date of transition to IFRS. Entities may choose to apply the requirements of IFRS 9 (or IAS 39, as applicable) and IAS 20 to government loans retrospectively if the information needed to do so had been obtained at the time of initially accounting for that loan. The exception would give first-time adopters relief from retrospective measurement of government loans with a below-market rate of interest. The amendments have no impact on the consolidated financial statements.
· IFRS 7 Disclosures - Offsetting Financial Assets and Financial Liabilities - Amendments to IFRS 7
These amendments require an entity to disclose information about rights to set off and related arrangements (e.g., collateral agreements). The disclosures would provide users with information that is useful in evaluating the effect of netting arrangements on an entity’s financial position. The new disclosures are required for all recognized financial instruments that are set off in accordance with IAS 32 Financial Instruments: Presentation.
The disclosures also apply to recognized financial instruments that are subject to an enforceable master netting arrangement or similar agreement, irrespective of whether they are set off in accordance with IAS 32. The amendments have no impact on the consolidated financial statements.
F - 126
PERUSAHAAN PERSEROAN (PERSERO)
PT TELEKOMUNIKASI INDONESIA Tbk AND SUBSIDIARIES
NOTES TO THE CONSOLIDATED FINANCIAL STATEMENTS
As of December 31, 2011 and 2012 and
for the years ended December 31, 2010, 2011 and 2012
(Figures in tables are presented in billions of rupiah, unless otherwise stated)
TABLE OF CONTENTS
43. NEW STANDARDS AND INTERPRETATIONS NOT YET ADOPTED (continued)
Effective for annual periods beginning on or after January 1, 2013 (continued)
· IFRS 10 Consolidated Financial Statements, IAS 27 Separate Financial Statements
IFRS 10 replaces the portion of IAS 27 Consolidated and Separate Financial Statements that addresses the accounting for consolidated financial statements. It also addresses the issues raised in SIC-12 Consolidation - Special Purpose Entities.
IFRS 10 establishes a single control model that applies to all entities including special purpose entities. The changes introduced by IFRS 10 will require management to exercise significant judgment to determine which entities are controlled and therefore are required to be consolidated by a parent, compared with the requirements that were in IAS 27. Based on the preliminary analyses performed, IFRS 10 is not expected to have any impact on the currently held investments of the Company and subsidiaries.
· IFRS 11 Joint Arrangements
IFRS 11 replaces IAS 31 Interests in Joint Ventures and SIC-13 Jointly-controlled Entitie Non-monetary Contributions by Venturers. IFRS 11 removes the option to account for jointly controlled entities (JCEs) using proportionate consolidation. Instead, JCEs that meet the definition of a joint venture must be accounted for using the equity method.
Based on preliminary analyses, no material impact is expected on the consolidated financial position and performance of the Company and subsidiaries.
· IFRS 12 Disclosure of Interests in Other Entities
IFRS 12 includes all of the disclosures that were previously in IAS 27 related to consolidated financial statements, as well as all of the disclosures that were previously included in IAS 31 and IAS 28. These disclosures relate to an entity’s interests in subsidiaries, joint arrangements, associates and structured entities.
A number of new disclosures are also required, but it has no impact on the consolidated financial position or performance of the Company and subsidiaries.
· IFRS 13 Fair Value Measurement
IFRS 13 establishes a single source of guidance under IFRS for all fair value measurements. IFRS 13 does not change when an entity is required to use fair value, but rather provides guidance on how to measure fair value under IFRS when fair value is required or permitted. Based on preliminary analyses, no material impact is expected on the consolidated financial position and performance of the Company and subsidiaries.
· Annual Improvements May 2012
These improvements will not have an impact on the Company and its subsidiaries:
- IFRS 1 First-time Adoption of International Financial Reporting Standards
This improvement clarifies that an entity that stopped applying IFRS in the past and chooses, or is required, to apply IFRS, has the option to re-apply IFRS 1. If IFRS 1 is not re-applied, an entity must retrospectively restate its financial statements as if it had never stopped applying IFRS.
F - 127
PERUSAHAAN PERSEROAN (PERSERO)
PT TELEKOMUNIKASI INDONESIA Tbk AND SUBSIDIARIES
NOTES TO THE CONSOLIDATED FINANCIAL STATEMENTS
As of December 31, 2011 and 2012 and
for the years ended December 31, 2010, 2011 and 2012
(Figures in tables are presented in billions of rupiah, unless otherwise stated)
TABLE OF CONTENTS
43. NEW STANDARDS AND INTERPRETATIONS NOT YET ADOPTED (continued)
Effective for annual periods beginning on or after January 1, 2013 (continued)
- IAS 1 Presentation of Financial Statements
This improvement clarifies the difference between voluntary additional comparative information and the minimum required comparative information. Generally, the minimum required comparative information is the information for the previous period.
- IAS 16 Property Plant and Equipment
This improvement clarifies that major spare parts and servicing equipment that meet the definition of property and equipment are not classified as inventories.
- IAS 32 Financial Instruments, Presentation
This improvement clarifies that income taxes arising from distributions to equity holders are accounted for in accordance with IAS 12 Income Taxes.
- IAS 34 Interim Financial Reporting
The amendment aligns the disclosure requirements for total segment assets with total segment liabilities in interim financial statements. This clarification also ensures that interim disclosures are aligned with annual disclosures.
Effective for annual periods beginning on or after January 1, 2014
· IAS 32 Offsetting Financial Assets and Financial Liabilities - Amendments to IAS 32
These amendments clarify the meaning of “currently has a legally enforceable right to set off”. The amendments also clarify the application of the IAS 32 offsetting criteria to settlement systems (such as central clearing house systems) which apply gross settlement mechanisms that are not simultaneous. These amendments are not expected to impact the Company and its subsidiaries’consolidatedfinancial position or performance and become effective for annual periods beginning on or after January 1, 2014.
· IFRS 9 Financial Instruments: Classification and Measurement
IFRS 9, as issued, reflects the first phase of the IASB’s work on the replacement of IAS 39 and applies to classification and measurement of financial assets and financial liabilities as defined in IAS 39. The standard was initially effective for annual periods beginning on or after January 1, 2013, but Amendments to IFRS 9 Mandatory Effective Date of IFRS 9 and Transition Disclosures, issued in December 2011, moved the mandatory effective date to January 1, 2015. In subsequent phases, the IASB will address hedge accounting and impairment of financial assets. The adoption of the first phase of IFRS 9 will have an effect on the classification and measurement of the Company and its subsidiaries’ financial assets, but will not have an impact on the classification and measurements of financial liabilities. The Company and its subsidiaries will quantify the effect in conjunction with the other phases, when the final standard, including all phases, is issued.
F - 128


