UNITED STATES
SECURITIES AND EXCHANGE COMMISSION
Washington, D.C. 20549
FORM N-CSR
CERTIFIED SHAREHOLDER REPORT OF REGISTERED
MANAGEMENT INVESTMENT COMPANIES
Investment Company Act file number 811-09114
The Needham Funds, Inc.
(Exact name of registrant as specified in charter)
250 Park Avenue, 10th Floor,
New York, NY 10177-1099
(Address of principal executive offices) (Zip code)
Mr. George A. Needham
250 Park Avenue, 10th Floor,
New York, NY 10177-1099
(Name and address of agent for service)
1-800-625-7071
Registrant's telephone number, including area code
Date of fiscal year end: December 31, 2023
Date of reporting period: January 1, 2023-June 30, 2023
Item 1. Reports to Stockholders.
SEMI-ANNUAL
REPORT
NEEDHAM FUNDS
Seeking to build wealth for long-term investors
June 30, 2023
Needham Growth Fund
Needham Aggressive Growth Fund
Needham Small Cap Growth Fund
www.needhamfunds.com
250 Park Avenue, 10th Floor
New York, New York 10177
1-800-625-7071
www.needhamfunds.com
Semi-Annual Report
June 30, 2023
| CONTENTS | |
| Letter from the Adviser | 1 |
| Portfolio Characteristics (Unaudited) | |
| Needham Growtˇh Fund | 5 |
| Needham Aggressive Growth Fund | 6 |
| Needham Small Cap Growth Fund | 7 |
| Disclosure of Fund Expenses | 9 |
| Schedules of Investments | |
| Needham Growth Fund | 11 |
| Needham Aggressive Growth Fund | 15 |
| Needham Small Cap Growth Fund | 19 |
| Statements of Assets and Liabilities | 22 |
| Statements of Operations | 23 |
| Statements of Changes in Net Assets | 24 |
| Financial Highlights | |
| Needham Growth Fund | 27 |
| Needham Aggressive Growth Fund | 29 |
| Needham Small Cap Growth Fund | 31 |
| Notes to Financial Statements | 33 |
| Supplementary Information | 39 |
This report is authorized for distribution to prospective investors only when preceded or accompanied by a current prospectus.
The prospectus contains more complete information, including investment objectives, risks, expenses and charges and should be
read carefully before investing or sending any money. To obtain a prospectus or summary prospectus, please call 1-800-625-7071.
Portfolios of The Needham Funds, Inc., like all mutual funds:
| | • | Are NOT FDIC insured |
| | • | Have no bank guarantee |
| | • | May lose value |
The Needham Funds, Inc. are distributed by Needham & Company, LLC.
Semi-Annual Report 2023
 | 250 Park Avenue, 10th Floor |
| New York, New York 10177 |
| (800) 625-7071 |
| www.needhamfunds.com |
August 2023
Dear Shareholders, Friends of Needham, and Prospective Shareholders,
We are pleased to report Needham Funds’ results for the half-year ended June 30, 2023. Our mission is to create wealth for long-term investors.
IN THIS LETTER
| • | Macro Observations – John Barr, Portfolio Manager |
| • | Review of First Half Performance: |
| | O | Needham Aggressive Growth Fund – John Barr, Portfolio Manager |
| | O | Needham Small Cap Growth Fund – Chris Retzler, Portfolio Manager |
| | O | Needham Growth Fund – John Barr and Chris Retzler, Co-Portfolio Managers |
MACRO OBSERVATIONS – JOHN BARR, PORTFOLIO MANAGER
Economic growth, inflation, Federal Reserve policy, and even a bipartisan political development all pointed toward signs of stability in the first half, following the early March failures of Silicon Valley Bank (SVB) and Signature Bank.
SVB was brought down by the classic failure of mismatched assets and liabilities. SVB was invested in 10-year Treasuries but was funded with overnight, uninsured deposits. With the Fed rate hikes, the Treasuries lost value, and corporate clients with deposits over the insured limit of $250,000 rapidly withdrew funds, creating a bank run. The Federal Reserve, Treasury Department, and FDIC (Federal Deposit Insurance Corporation) issued a joint statement, insured all deposits of SVB, and SVB reopened under new management after a long weekend. Pressure on the banking system has stabilized, but deposits continue to move toward higher-yielding money market funds.
On May 3, the Federal Reserve raised interest rates by 25 bps to 5.00% - 5.25% and then paused rate hikes in June. Fed consensus calls for two more rate hikes in 2023.1 In late May, President Biden signed a bipartisan bill to extend the debt ceiling and reduce growth in Federal spending.
The economy continued to move forward with 2.0% estimated GDP growth in 2Q23, the fourth consecutive quarter of growth. 1Q23 inflation was 4.1% year-over-year, with estimates near 3.0% for 2Q23. 2Q23 will likely be the fourth quarter of 3-4% consumer price index inflation, after 5-7% in the preceding four quarters.
Important to our investing universe, NVIDIA Corporation (NVDA) reported an epic quarter and guidance based on strong demand for its AI (artificial intelligence) systems. Many of our investments benefit directly and indirectly from the adoption of AI. In March, we wrote The Growth Factor Vol. 36, “Artificial Intelligence and Needham Funds’ Investments.”2
One of the highlights of my year is my annual May trip to Omaha for the Berkshire Hathaway Annual Meeting. It reminds me of the importance of patience and long-term investing. While the purchase price of a stock may protect our downside, we earn returns by patiently holding. As Berkshire Hathaway’s Charlie Munger said, “The big money is not in the buying and the selling but in the waiting.”
NEEDHAM AGGRESSIVE GROWTH FUND FIRST HALF 2023 PERFORMANCE – JOHN BARR, PORTFOLIO MANAGER
The Needham Funds’ mission is to create wealth for long-term investors and the first half of 2023 was a positive step forward. For the half-year ended June 30, 2023, Needham Aggressive Growth Fund Institutional and Retail classes returned 27.60% and 27.31%, respectively. The Russell 2000 Growth Index returned 13.55%. The Fund’s standardized performance can be obtained at https://www.needhamfunds.com/mutual-funds/aggressive-growth-fund/.
On June 30, 2023, the Fund’s top ten positions were 43.75% of net assets. The Fund had an Active Share of 97.0% versus the Russell 2000 Growth Index, and trailing 12-month turnover was 9%. Morningstar and Lipper categorize the Fund as Small Cap Growth.
The Fund’s leading contributor in the first half was Super Micro Computer, Inc. (SMCI), which we have owned since 2009. Super Micro is seeing high growth from its Artificial Intelligence GPU (graphics processing unit) servers.
The second leading contributor was ESI Group SA (ESI-FR). The Fund first purchased ESI in 2021 as we were impressed with new CEO Cristel de Rouvray’s plans to increase margins and revenue growth. ESI supplies CAD (computer-aided design) software for the automotive, aerospace, and other heavy industries. It has particular expertise in virtual crash testing. In June, ESI announced a merger agreement with Keysight Technologies Inc. (KEYS).
1 | https://www.cnbc.com/2023/06/14/the-fed-forecasts-two-more-hikes-this-year-taking-rates-as-high-as-5point6percent.html. |
2 | https://www.needhamfunds.com/wp-content/uploads/2023/03/GF-36-Artificial-Intelligence-and-Needham-Funds-Investments.pdf. |
Needham Funds
PDF Solutions, Inc. (PDFS) was the Fund’s third leading contributor in the first half. PDF’s Exensio® data analytics platform helps customers across the electronics manufacturing industry improve manufacturing yield. In 1Q23, PDF signed a seven-figure, multi-year agreement with a customer planning to use Exensio in conjunction with SAP SE’s (SAP) enterprise resource planning (ERP) system. We believe SAP could be an important partner for PDF. PDF is already benefitting from the resurgence of activity in building semiconductor manufacturing plants in the United States.
Aspen Aerogels Inc. (ASPN) was the Fund’s only detractor of note. Aspen Aerogels makes aerogel insulation used for energy infrastructure and pipelines. The aerogel insulation is also used for thermal protection of lithium-ion batteries. Aspen won contract awards from General Motors Company (GM), Toyota Motor Corp. (TM), and other EV makers. Aspen was the Fund’s top detractor in 2022, and the downtrend continued in the first half of 2023. On its May earnings conference call, Aspen announced plans to move all manufacturing for EV customers to its Rhode Island plant, and move manufacturing for other customers to a contract manufacturer in China. Aspen guided to positive EBITDA in 4Q23, which we believe could be a turning point for the market’s view of the company.
NEEDHAM AGGRESSIVE GROWTH FUND – FIRST HALF 2023 PORTFOLIO CHANGES
The Fund’s most significant new position was Northern Technologies International Corporation (NTIC). Northern Technologies has a $100 million market cap and has two product lines. The company manufactures biodegradable plastic bags and sells resin to customers making plastic cutlery and other products. Adoption is in its early stages, and environmental awareness and regulation could drive demand. Northern Technologies’ corrosion-resistant solutions are used in the oil and gas industries.
Where did we put new capital to work? The three largest purchases were of existing holdings:
| | • | ESI Group – In May, ESI announced that it was in acquisition talks. We thought potential bidders could recognize the value that we saw. |
| | | |
| | • | Oil-Dri Corp. of America (ODC) adds value to sorbent materials like clay. It has a core lightweight cat litter business and has been investing for years in antibiotic-free animal health products. In June, Oil-Dri announced what we viewed as breakout earnings. |
| | | |
| | • | Unisys Corporation (UIS) is the renaissance of the old-line computer company, with roots back to Sperry Corporation, Burroughs Corporation, and Remington Typewriter. Unisys provides digital workplace, cloud & infrastructure, and enterprise computing solutions. In May, Unisys reported a solid quarter with revenue growth and margin expansion. |
The Fund made small reductions to a few holdings and exited several smaller positions. The Fund did more buying than selling in the first half and exited the half-year with 10.9% cash.
NEEDHAM SMALL CAP GROWTH FUND FIRST HALF 2023 PERFORMANCE – CHRIS RETZLER, PORTFOLIO MANAGER
For the half-year ended June 30, 2023, the Needham Small Cap Growth Fund Institutional and Retail classes returned 2.68% and 2.77%, respectively. The Russell 2000 Growth Index returned 13.55%. The Fund’s standardized performance can be obtained at https://www.needhamfunds.com/mutual-funds/small-cap-growth-fund/.
The Fund’s top contributors in the first half were: nLight, Inc. (LASR), Sumo Logic, Inc. (SUMO), Zuora, Inc. (ZUO), Standard BioTools, Inc. (LAB), and Vicor Corp. (VICR).
nLight, Inc. (LASR) is a fiber laser and direct energy laser manufacturer. It continues to shift sales away from China and build its market share globally. It is also developing its directed energy business that will be used for defense purposes. We expect accelerated sales from nLight over the next few years.
The Fund’s top detractors in the first half were: ViewRay, Inc. (VRAY), Adtran Holdings, Inc. (ADTN), Aspen Aerogels, Inc. (ASPN), Telos Corp. (TLS) and Cambium Networks Corp. (CMBM).
I want to address the extreme disappointment the Fund suffered from ViewRay (VRAY), a long-time holding of the Fund, and an unprecedented event in my 18 years of portfolio management. ViewRay experienced a perfect storm of liquidity pressures. We expected that the announced strategic review would lead to a sale of the company to a larger platform, however after months of efforts, that was not the final result. The rapid and shocking decline of ViewRay serves as a valuable lesson for future high-growth, small-cap companies that may encounter liquidity risks in a tightening economic environment.
In the first half, the Fund increased its investment in Aspen Aerogels, Inc. (ASPN), a long-time portfolio holding. We remain excited about Aspen Aerogels, Inc. (ASPN). Aspen manufactures aerogel-based insulation and benefits from the increased opportunity in EV battery technology and the increase in electric vehicles. The expected product ramp and penetration into the EV industry should continue to grow for many years.
Many of the Fund’s portfolio holdings are defined as technology companies, however, technology has permeated the entire global economy. We achieve diversity in the portfolio through the end markets that our portfolio companies serve. The diverse end markets of our technology holdings include advanced communications, military modernization, automotive advancement, industrial digitization, medical enhancement, 5G wireless, data center buildouts, infrastructure expansion, security improvements, and overall semiconductor processing and power management enhancements. Many of our portfolio companies sit at the crossroads of several industries and therefore in our view have multiple opportunities for success. This market positioning should give the portfolio a natural hedge and ultimately help reduce volatility and risk.
Widespread semiconductor shortages had negative implications for many end markets, including automotive, medical, industrial, and defense. However, supply chains have been recalibrated and disruptions have improved somewhat. We expect semiconductors and semiconductor capital equipment companies to continue their strong, long-term trends.
Semi-Annual Report 2023
We believe technology remains a great area for long-term investment, and there are secular trends firmly in place to support the technology sector’s continued growth. Areas of long-term investment that we like are mobile electrification, communications infrastructure, artificial intelligence, cloud computing, 5G devices and wireless connectivity, software and security, and specialty material manufacturing. We also see opportunities in military modernization.
After a challenging 2022, we were optimistic that the markets would stabilize in 2023, and they did until March when the regional bank failures caused a significant sell-off in small-cap stocks. The asset class did not recover immediately but slowly improved throughout the second quarter. Wage pressures, logistics and transportation complications, higher commodity prices, and supply chain constraints continued to hamper earnings and forward guidance for many companies. These trends hurt smaller companies that lack the buying power and operational flexibility of larger companies.
We expect the headline risk of a global economic slowdown to remain elevated as investors digest data, however, if there is ultimately a recession, it is expected to be further into the future than previously projected. We will continue our strategy of investing in small-cap growth companies that we believe have good management teams, strong balance sheets, and the ability to generate cash flow and profits.
NEEDHAM GROWTH FUND FIRST HALF 2023 PERFORMANCE – JOHN BARR AND CHRIS RETZLER, CO-PORTFOLIO MANAGERS
For the half-year ended June 30, 2023, the Needham Growth Fund Institutional and Retail classes returned 23.86% and 23.61%, respectively. The S&P 500 Index returned 16.89%, and the S&P MidCap 400 returned 8.84%. The Fund’s standardized performance can be obtained at https://www.needhamfunds.com/mutual-funds/growth-fund/.
On June 30, the Fund’s top ten positions were 52.27% of net assets. The Fund had trailing 12-month turnover of 10%. Morningstar categorizes the Fund as Mid-Cap Growth; Lipper categorizes it as Mid-Cap Core.
The Fund’s top contributor in the first half was Super Micro Computer, followed by PDF Solutions and Entegris, Inc. (ENTG). (Super Micro and PDF Solutions are discussed in the review of Needham Aggressive Growth Fund.) Entegris supplies filters, specialty materials, chemicals, and delivery systems primarily used for semiconductor manufacturing. In May, the company reported an in-line quarter and guidance. Entegris also announced an agreement to sell a division of the newly acquired CMP Materials for $700 million, and it will use the proceeds to deleverage. Revenue resilience and deleveraging progress led to Entegris’ outperformance.
The Fund’s top detractor in the first half was Aspen Aerogels (previously discussed in the reviews of Needham Aggressive Growth Fund and Needham Small Cap Growth Fund).
The Fund’s most significant new position was Unisys (previously discussed in the review of Needham Aggressive Growth Fund). The Fund’s largest additions to existing positions were to Coherent Corp. (COHR), Marvel Technology, Inc. (MRVL), Veeco Instruments, Inc. (VECO), and Vicor Corp. (VICR).
The most significant reductions were to long-time holdings PDF Solutions, Photronics Inc. (PLAB), Super Micro Computer, and Thermo Fisher Scientific, Inc. (TMO), to manage position size.
CLOSING
We believe the U.S. remains the best place in the world to invest, and we continue to see an opportunity to invest in small and mid-cap stocks. Most importantly, we see a technological revolution that has created and continues to create investment opportunities. We see opportunity in our strategy of investing in companies that we know well and believe are positioned with secular growth drivers.
We welcome our new investors and thank all of our investors for their continued support. If you have any questions, thoughts, or concerns, please contact us at (800) 625-7071 or jbarr@needhamco.com and cretzler@needhamco.com. For information about the Needham Funds, please visit our website at www.needhamfunds.com.
Sincerely,
 |  |
| Chris Retzler, | John O. Barr, |
| Portfolio Manager | Portfolio Manager |
Needham Funds
The information presented in this commentary is not intended as personalized investment advice and does not constitute a recommendation to buy or sell a particular security or other investments. Past performance is no guarantee of future results. The views of Needham Investment Management L.L.C., the Funds’ investment adviser (the “Adviser”), and the securities described in this report are as of June 30, 2023; these views and portfolio holdings may have changed subsequent to this date. The specific securities discussed may, in aggregate, represent only a small percentage of a Fund’s holdings. If a specific security discussed is not found in a Fund’s Schedule of Investments, it may have been held by the Fund during the period. It should not be assumed that securities identified and discussed were, or will be, profitable, or that the investment decisions made in the future will be profitable, or equal the investment performance of the securities discussed herein. There can be no guarantee as to the accuracy of any outlooks for markets, sectors and securities as discussed herein.
This message is not an offer of the Needham Growth Fund, the Needham Aggressive Growth Fund or the Needham Small Cap Growth Fund. Shares are sold only through the currently effective prospectus. Please read the prospectus or summary prospectus carefully and consider the investment objectives, risks and charges and expenses of the Funds carefully before you invest. The prospectus and summary prospectus contain this and other information about the Funds and can be obtained on our website, www.needhamfunds.com or by contacting the Funds’ transfer agent U.S. Bancorp Fund Services LLC doing business as U.S. Bank Global Fund Services (“Fund Services”) at 1-800-625-7071.
Investment returns and principal value will fluctuate, and when redeemed, shares may be worth more or less than their original cost. Performance data quoted represents past performance, and does not guarantee future results. Current performance may be higher or lower than these results. Performance current to the most recent month-end may be obtained by calling our transfer agent at 1-800-625-7071. Total return figures include reinvestment of all dividends and capital gains.
All three of the Needham Funds have substantial exposure to small and micro capitalized companies. Funds holding smaller capitalized companies are subject to greater price fluctuation than those of larger companies. The coronavirus disease 2019 (COVID-19) global pandemic and the aggressive responses taken by many governments or voluntarily imposed by private parties, including closing borders, restricting travel and imposing prolonged quarantines or similar restrictions, as well as the closure of, or operational changes to, many retail and other businesses, have had negative impacts, and in many cases severe negative impacts, on markets worldwide. It is not known how long such impacts, or any future impacts of other significant events described above, will or would last, but there could be a prolonged period of global economic slowdown, which may impact your Fund investment. Needham & Company, LLC, member FINRA/SIPC, is the distributor of The Needham Funds, Inc.
The Russell 2000 Index is a broad unmanaged index composed of the smallest 2,000 companies in the Russell 3000 Index. The Russell 3000 Index is a market-capitalization-weighted equity index that provides exposure to the entire U.S. stock market. The Russell 3000 Index tracks the performance of the 3,000 largest U.S.-traded stocks. The Russell 2000 Growth Index measures the performance of the small cap growth segment of the U.S. equity universe. It includes those Russell 2000 companies with relatively higher price-to-value ratios and higher forecasted growth values. Please see the disclaimer regarding these indexes under “Supplementary Information—Index Disclaimer” on page 39 of this report.
Semi-Annual Report 2023
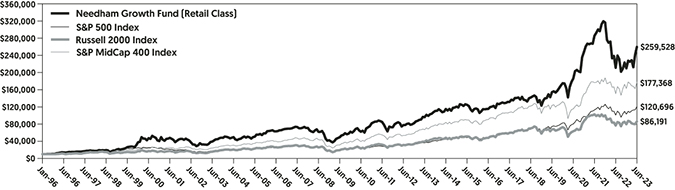
| NEEDHAM GROWTH FUND | Retail Class |
| Portfolio Characteristics (Unaudited) | Ticker Symbol: NEEGX |
| | Institutional Class |
| | Ticker Symbol: NEEIX |
COMPARISON OF CHANGE IN VALUE OF A $10,000 INVESTMENT
The chart above assumes an initial gross investment of $10,000 made on January 1, 1996.
COMPARATIVE PERFORMANCE STATISTICS AS OF JUNE 30, 2023
| | 1 | 5 | 10 | Since |
| | Year | Years | Years | Inception |
Needham Growth Fund Retail Class(1)(2) | 22.85% | 12.84% | 10.44% | 12.57% |
Needham Growth Fund Institutional Class(1)(3) | 23.39% | 13.37% | n/a | 12.22% |
S&P 500 Index(4)(5) | 19.59% | 12.31% | 12.86% | 9.48%(9) |
S&P MidCap 400 Index(4)(6) | 17.61% | 7.79% | 10.21% | 11.02%(9) |
Russell 2000 Index(4)(7) | 12.31% | 4.21% | 8.26% | 8.15%(9) |
Top Ten Holdings*
(as a % of total investments, as of June 30, 2023)
| | | % of Total |
Security | | Investments |
| Super Micro Computer, Inc. | SMCI | 9.34% |
| PDF Solutions, Inc. | PDFS | 9.01% |
| Entegris, Inc. | ENTG | 7.45% |
| Thermo Fisher Scientific, Inc. | TMO | 6.00% |
| CarMax, Inc. | KMX | 4.06% |
| Nova, Ltd. | NVMI | 3.73% |
| Becton Dickinson & Co. | BDX | 3.41% |
| Vicor Corp. | VICR | 3.36% |
| KVH Industries, Inc. | KVHI | 3.23% |
| Photronics, Inc. | PLAB | 2.78% |
| | | |
| Top Ten Holdings = 52.37% of Total Investments | | |
Sector Weightings*
(as a % of net investments, as of June 30, 2023)
Sector(10) | Long(11) | (Short) | Total(12) |
| Cash | 1.9% | — | 1.9% |
| Communication Services | 4.9% | — | 4.9% |
| Consumer Discretionary | 4.7% | — | 4.7% |
| Energy | 0.7% | — | 0.7% |
| Health Care | 14.9% | — | 14.9% |
| Industrials | 8.0% | — | 8.0% |
| Information Technology | 63.0% | (0.6)% | 62.4% |
| Materials | 2.2% | — | 2.2% |
| Real Estate | 0.3% | — | 0.3% |
Needham Funds
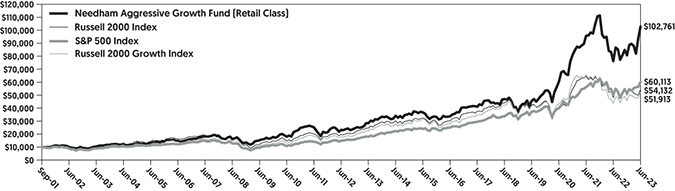
| NEEDHAM AGGRESSIVE GROWTH FUND | Retail Class |
| Portfolio Characteristics (Unaudited) | Ticker Symbol: NEAGX |
| | Institutional Class |
| | Ticker Symbol: NEAIX |
COMPARISON OF CHANGE IN VALUE OF A $10,000 INVESTMENT
The chart above assumes an initial gross investment of $10,000 made on September 4, 2001.
COMPARATIVE PERFORMANCE STATISTICS AS OF JUNE 30, 2023
| | 1 | 5 | 10 | Since |
| | Year | Years | Years | Inception |
Needham Aggressive Growth Fund Retail Class(1)(2) | 34.79% | 16.97% | 13.70% | 11.27% |
Needham Aggressive Growth Fund Institutional Class(1)(3) | 35.58% | 17.68% | n/a | 16.06% |
S&P 500 Index(4)(5) | 19.59% | 12.31% | 12.86% | 8.57%(9) |
Russell 2000 Index(4)(7) | 12.31% | 4.21% | 8.26% | 8.05%(9) |
Russell 2000 Growth Index(4)(8) | 18.53% | 4.22% | 8.83% | 7.84%(9) |
Top Ten Holdings*
(as a % of total investments, as of June 30, 2023)
| | | % of Total |
|
| Investments |
| Super Micro Computer, Inc. | SMCI | 8.54% |
| PDF Solutions, Inc. | PDFS | 7.67% |
| ESI Group | ESI FP | 6.17% |
| Vicor Corp. | VICR | 4.01% |
| Nova, Ltd. | NVMI | 3.47% |
| Entegris, Inc. | ENTG | 3.36% |
| Photronics, Inc. | PLAB | 3.01% |
| KVH Industries, Inc. | KVHI | 2.97% |
| Vertiv Holdings Co. | VRT | 2.69% |
| Unisys Corp. | UIS | 2.55% |
| | | |
| Top Ten Holdings = 44.43% of Total Investments | | |
Sector Weightings*
(as a % of net investments, as of June 30, 2023)
Sector(10) | Long(11) | (Short) | Total(12) |
| Cash | 10.9% | — | 10.9% |
| Communication Services | 0.7% | — | 0.7% |
| Consumer Discretionary | 3.8% | — | 3.8% |
| Consumer Staples | 2.1% | — | 2.1% |
| Energy | 1.8% | — | 1.8% |
| Financials | 1.1% | — | 1.1% |
| Health Care | 4.3% | — | 4.3% |
| Industrials | 16.0% | — | 16.0% |
| Information Technology | 53.2% | — | 53.2% |
| Materials | 5.1% | — | 5.1% |
| Real Estate | 1.0% | — | 1.0% |
Semi-Annual Report 2023
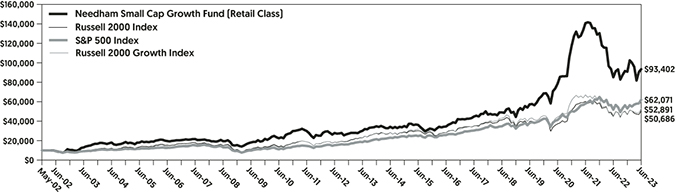
| NEEDHAM SMALL CAP GROWTH FUND | Retail Class |
| Portfolio Characteristics (Unaudited) | Ticker Symbol: NESGX |
| | Institutional Class |
| | Ticker Symbol: NESIX |
COMPARISON OF CHANGE IN VALUE OF A $10,000 INVESTMENT
The chart above assumes an initial gross investment of $10,000 made on May 22, 2002.
COMPARATIVE PERFORMANCE STATISTICS AS OF JUNE 30, 2023
| | 1 | 5 | 10 | Since |
| | Year | Years | Years | Inception |
Needham Small Cap Growth Fund Retail Class(1)(2) | 9.60% | 13.73% | 11.99% | 11.17% |
Needham Small Cap Growth Fund Institutional Class(1)(3) | 9.94% | 14.38% | n/a | 13.79% |
S&P 500 Index(4)(5) | 19.59% | 12.31% | 12.86% | 9.03%(9) |
Russell 2000 Index(4)(7) | 12.31% | 4.21% | 8.26% | 7.99%(9) |
Russell 2000 Growth Index(4)(8) | 18.53% | 4.22% | 8.83% | 8.21%(9) |
Top Ten Holdings*
(as a % of total investments, as of June 30, 2023)
| | | % of Total |
Security | | Investments |
| Aspen Aerogels, Inc. | ASPN | 6.08% |
| ADTRAN Holdings, Inc. | ADTN | 5.97% |
| nLight, Inc. | LASR | 5.52% |
| TTM Technologies, Inc. | TTMI | 4.88% |
| Vicor Corp. | VICR | 4.46% |
| Cambium Networks Corp. | CMBM | 3.99% |
| Zuora, Inc. | ZUO | 3.75% |
| AXT, Inc. | AXTI | 3.00% |
| KVH Industries, Inc. | KVHI | 2.62% |
| Akoustis Technologies, Inc. | AKTS | 2.57% |
| | | |
| Top Ten Holdings = 42.84% of Total Investments | | |
Sector Weightings*
(as a % of net investments, as of June 30, 2023)
Sector(10) | Long(11) | (Short) | Total(12) |
| Cash | 31.2% | — | 31.2% |
| Health Care | 2.7% | — | 2.7% |
| Industrials | 6.5% | — | 6.5% |
| Information Technology | 55.3% | (1.8)% | 53.5% |
| Materials | 6.1% | — | 6.1% |
Needham Funds
Each Fund’s performance figures are for the period ended June 30, 2023. The performance data quoted is historical. Past performance is no guarantee of future results. Current performance may be higher or lower than the performance data quoted. The principal value and investment return of an investment will fluctuate so that your shares, when redeemed, may be worth more or less than their original cost. To obtain performance information current to the most recent month-end, please visit www.needhamfunds.com or call 1-800-625-7071. The returns shown above are net of expenses. The returns shown do not reflect the deduction of taxes that a shareholder would pay on Fund distributions or on the redemptions of Fund shares. In the absence of fee waivers and expense reimbursements, when they are necessary to keep the Fund’s total annual operating expenses at the expense cap currently in effect, total return would be reduced. Performance figures for periods greater than one year are annualized. For information about each index shown above, please see the notes below. The Global Industry Classification Standard (GICS®) was developed by and/or is the exclusive property of MSCI, Inc. and Standard & Poor Financial Services LLC (“S&P”). GICS is a service mark of MSCI and S&P and has been licensed for use by U.S. Bancorp Fund Services, LLC, doing business as U.S. Bank Global Fund Services (“Fund Services”).
| (1) | Investment results calculated after reinvestment of dividends. |
| (2) | The inception date of the Retail Class of each Fund was as follows: Needham Growth Fund – 1/1/96; Needham Aggressive Growth Fund – 9/4/01; and Needham Small Cap Growth Fund – 5/22/02. |
| (3) | The inception date of the Institutional Class of each Fund was 12/30/16. |
| (4) | It is not possible to invest directly in an index. The performance of the index does not include the deduction of expenses associated with a mutual fund, such as investment management fees. |
| (5) | The S&P 500 Index focuses on the large-cap sector of the market; however, since it includes a significant portion of the total value of the market, it also is considered representative of the market. Companies in the S&P 500 are considered leading companies in leading industries. |
| (6) | The S&P MidCap 400 Index provides investors with a benchmark for mid-sized companies. The index seeks to remain an accurate measure of mid-sized companies, reflecting the risk and return characteristics of the broader mid-cap universe on an on-going basis. |
| (7) | The Russell 2000 Index measures the performance of the small-cap segment of the U.S. equity universe. The Russell 2000 Index is a subset of the Russell 3000 Index representing approximately 8% of the total market capitalization of that index. The Russell 2000 Index includes approximately 2,000 of the smallest securities based on a combination of their market cap and current index membership. |
| (8) | The Russell 2000 Growth Index is constructed to provide a comprehensive and unbiased barometer for the small-cap growth segment. The index is completely reconstituted annually to ensure new and growing equities are included and that the represented companies continue to reflect growth characteristics. |
| (9) | The return shown for the index is from the inception date of the Retail Class. The returns for the S&P 500 Index, S&P MidCap 400 Index, Russell 2000 Growth, and the Russell 2000 Index from the inception date of the Institutional Class are 13.17%, 9.00%, 7.99% and 6.62%, respectively. |
| (10) | These categories represent broad market sectors. Refer to the Schedule of Investments for a more detailed categorization by industry. |
| (11) | Percentage of total investments includes all stocks, plus cash. |
| (12) | Net exposure represents the difference between the long exposure and the short exposure, which produces the net investment exposure. |
| * | Current portfolio holdings may not be indicative of future portfolio holdings. |
Semi-Annual Report 2023
Disclosure of Fund Expenses (Unaudited)
The following expense table is shown so that you can understand the impact of fees on your investment. All mutual funds have operating expenses. As a shareholder of a Portfolio, you incur transactional costs and ongoing costs, which include costs for portfolio management, administrative services, and shareholder reports, among others. A Portfolio’s expenses are expressed as a percentage of its average net assets. This figure is known as the expense ratio. The following examples are intended to help you understand the ongoing costs (in dollars) of investing in each Portfolio and to compare these costs with those of other mutual funds. The examples are based on an investment of $1,000 made at the beginning of a six-month period and held for the entire period. The expense example table below illustrates your fund’s cost in two ways:
| • | Actual Expenses. This section helps you to estimate the actual expenses after fee waivers that you paid over the period. The “Ending Account Value” shown is derived from the Portfolio’s actual return, and “Expenses Paid During Period” shows the dollar amount that would have been paid by an investor who started with $1,000 in the Portfolio. You may use the information here, together with the amount you invested, to estimate the expenses that you paid over the period. To do so, simply divide your account value by $1,000 (for example, an $8,600 account value divided by $1,000 = 8.6), then multiply the result by the number given for your Portfolio under the heading entitled “Expenses Paid During Period”. |
| | |
| • | Hypothetical Expenses on a 5% Return. This section is intended to help you compare your Portfolio’s costs with those of other mutual funds. It assumes that the Portfolio had a return of 5% before expenses during the period shown, but that the expense ratio is unchanged. In this case, because the return used is not the Portfolio’s actual return, the results do not apply to your investment. The example is useful in making comparisons because the Securities and Exchange Commission requires all mutual funds to calculate expenses based on a 5% return. You can assess your Portfolio’s cost by comparing this hypothetical example with the hypothetical examples that appear in shareholders reports of other funds. |
Please note that the expenses shown in the table are meant to highlight your ongoing costs only and do not reflect any transactional costs. Therefore, the table is useful in comparing ongoing costs only, and will not help you determine the relative total costs of owning different funds. In addition, if these transactional costs were included, your costs would have been higher.
Needham Funds
For the Period January 1, 2023 to June 30, 2023
Expense Example Table (Unaudited)
| | | Beginning | | | Ending | | | Expenses Paid | | | Expense Ratio | |
| | | Account Value | | | Account Value | | | During Period* | | | During Period* | |
| | | 1/1/23 | | | 6/30/23 | | | 1/1/23 – 6/30/23 | | | 1/1/23 – 6/30/23 | |
| Needham Growth Fund | | | | | | | | | | | | |
| Retail Class Actual Expenses | | $ | 1,000.00 | | | $ | 1,236.10 | | | $ | 9.97 | | | | 1.80 | % |
| Retail Class Hypothetical | | | | | | | | | | | | | | | | |
| Example for Comparison Purposes | | | | | | | | | | | | | | | | |
| (5% return before expenses) | | $ | 1,000.00 | | | $ | 1,015.87 | | | $ | 8.99 | | | | 1.80 | % |
| Institutional Class Actual Expenses | | $ | 1,000.00 | | | $ | 1,238.60 | | | $ | 7.77 | | | | 1.40 | % |
| Institutional Class Hypothetical | | | | | | | | | | | | | | | | |
| Example for Comparison Purposes | | | | | | | | | | | | | | | | |
| (5% return before expenses) | | $ | 1,000.00 | | | $ | 1,017.85 | | | $ | 7.00 | | | | 1.40 | % |
| | | | | | | | | | | | | | | | | |
| Needham Aggressive Growth Fund | | | | | | | | | | | | | | | | |
| Retail Class Actual Expenses | | $ | 1,000.00 | | | $ | 1,273.10 | | | $ | 10.22 | | | | 1.81 | % |
| Retail Class Hypothetical | | | | | | | | | | | | | | | | |
| Example for Comparison Purposes | | | | | | | | | | | | | | | | |
| (5% return before expenses) | | $ | 1,000.00 | | | $ | 1,015.88 | | | $ | 9.06 | | | | 1.81 | % |
| Institutional Class Actual Expenses | | $ | 1,000.00 | | | $ | 1,276.00 | | | $ | 6.66 | | | | 1.18 | % |
| Institutional Class Hypothetical | | | | | | | | | | | | | | | | |
| Example for Comparison Purposes | | | | | | | | | | | | | | | | |
| (5% return before expenses) | | $ | 1,000.00 | | | $ | 1,018.94 | | | $ | 5.91 | | | | 1.18 | % |
| | | | | | | | | | | | | | | | | |
| Needham Small Cap Growth Fund | | | | | | | | | | | | | | | | |
| Retail Class Actual Expenses | | $ | 1,000.00 | | | $ | 1,027.70 | | | $ | 9.19 | | | | 1.83 | % |
| Retail Class Hypothetical | | | | | | | | | | | | | | | | |
| Example for Comparison Purposes | | | | | | | | | | | | | | | | |
| (5% return before expenses) | | $ | 1,000.00 | | | $ | 1,015.73 | | | $ | 9.14 | | | | 1.83 | % |
| Institutional Class Actual Expenses | | $ | 1,000.00 | | | $ | 1,026.80 | | | $ | 5.93 | | | | 1.18 | % |
| Institutional Class Hypothetical | | | | | | | | | | | | | | | | |
| Example for Comparison Purposes | | | | | | | | | | | | | | | | |
| (5% return before expenses) | | $ | 1,000.00 | | | $ | 1,018.94 | | | $ | 5.91 | | | | 1.18 | % |
| * | Expenses are equal to the average account value times the Portfolio’s annualized expense ratio multiplied 181/365 (to reflect the one-half-year period). |
Semi-Annual Report 2023
Needham Growth Fund
Schedule of Investments
June 30, 2023 (Unaudited)
| | | Shares | | | Fair Value | |
| Common Stocks (98.0%) | | | | | | |
| | | | | | | |
| Aerospace & Defense (2.6%) | | | | | | |
| Parsons Corp. (a) | | | 77,500 | | | $ | 3,730,850 | |
| | | | | | | | | |
| Biotechnology (0.9%) | | | | | | | | |
| G1 Therapeutics, Inc. (a) | | | 64,000 | | | | 159,360 | |
| Gilead Sciences, Inc. | | | 14,000 | | | | 1,078,980 | |
| | | | | | | | 1,238,340 | |
| Chemicals (2.2%) | | | | | | | | |
| Aspen Aerogels, Inc. (a) | | | 400,000 | | | | 3,156,000 | |
| | | | | | | | | |
| Commercial Services & Supplies (1.4%) | | | | | | | | |
| Clean Harbors, Inc. (a) | | | 12,000 | | | | 1,973,160 | |
| | | | | | | | | |
| Communications Equipment (5.5%) | | | | | | | | |
| ADTRAN Holdings, Inc. | | | 145,000 | | | | 1,526,850 | |
| Cambium Networks Corp. (a) | | | 90,000 | | | | 1,369,800 | |
| KVH Industries, Inc. (a)(c) | | | 500,000 | | | | 4,570,000 | |
| ViaSat, Inc. (a)(c) | | | 7,500 | | | | 309,450 | |
| | | | | | | | 7,776,100 | |
| Diversified Consumer Services (0.5%) | | | | | | | | |
| Bright Horizons Family Solutions, Inc. (a) | | | 8,000 | | | | 739,600 | |
| | | | | | | | | |
| Electrical Equipment (3.3%) | | | | | | | | |
| Vicor Corp. (a) | | | 87,850 | | | | 4,743,900 | |
| | | | | | | | | |
| Electronic Equipment, Instruments & Components (5.1%) | | | | | | | | |
| Coherent Corp. (a) | | | 27,500 | | | | 1,401,950 | |
| Corning, Inc. | | | 38,250 | | | | 1,340,280 | |
| nLight, Inc. (a) | | | 135,000 | | | | 2,081,700 | |
| TTM Technologies, Inc. (a) | | | 51,600 | | | | 717,240 | |
| Vishay Intertechnology, Inc. | | | 55,000 | | | | 1,617,000 | |
| | | | | | | | 7,158,170 | |
| Health Care Equipment & Supplies (4.7%) | | | | | | | | |
| Becton Dickinson & Co. | | | 18,250 | | | | 4,818,183 | |
| Medtronic PLC (Ireland) | | | 20,000 | | | | 1,762,000 | |
| ViewRay, Inc. (a) | | | 125,000 | | | | 44,025 | |
| | | | | | | | 6,624,208 | |
| Health Care Providers & Services (2.4%) | | | | | | | | |
| Laboratory Corp. of America Holdings | | | 10,700 | | | | 2,582,231 | |
| Quest Diagnostics, Inc. | | | 5,500 | | | | 773,080 | |
| | | | | | | | 3,355,311 | |
| Hotels, Restaurants & Leisure (0.1%) | | | | | | | | |
| Vacasa, Inc. – Class A (a) | | | 212,500 | | | | 144,181 | |
| | | | | | | | | |
| Industrial Conglomerates (0.4%) | | | | | | | | |
| Honeywell International, Inc. – ADR | | | 2,500 | | | | 518,750 | |
| | | | | | | | | |
| Interactive Media & Services (0.4%) | | | | | | | | |
| Alphabet, Inc. – Class A (a) | | | 5,000 | | | | 598,500 | |
See accompanying notes to financial statements.
Needham Funds
Needham Growth Fund
Schedule of Investments (Continued)
June 30, 2023 (Unaudited)
| | | Shares | | | Fair Value | |
| Common Stocks – Continued | | | | | | |
| | | | | | | |
| IT Services (3.3%) | | | | | | |
| Akamai Technologies, Inc. (a)(c) | | | 33,000 | | | $ | 2,965,710 | |
| Unisys Corp. (a) | | | 415,000 | | | | 1,651,700 | |
| | | | | | | | 4,617,410 | |
| Life Sciences Tools & Services (6.9%) | | | | | | | | |
| Bruker Corp. | | | 7,500 | | | | 554,400 | |
| CryoPort, Inc. (a) | | | 43,500 | | | | 750,375 | |
| Thermo Fisher Scientific, Inc. | | | 16,250 | | | | 8,478,438 | |
| | | | | | | | 9,783,213 | |
| Media (4.5%) | | | | | | | | |
| The Trade Desk, Inc. – Class A (a) | | | 45,000 | | | | 3,474,900 | |
| Comcast Corp. – Class A | | | 70,000 | | | | 2,908,500 | |
| | | | | | | | 6,383,400 | |
| Oil, Gas & Consumable Fuels (0.7%) | | | | | | | | |
| Chevron Corp. | | | 5,000 | | | | 786,750 | |
| Navigator Holdings, Ltd. (a) | | | 20,000 | | | | 260,200 | |
| | | | | | | | 1,046,950 | |
| Real Estate Investment Trusts (REITs) (0.4%) | | | | | | | | |
| American Tower Corp. | | | 2,500 | | | | 484,850 | |
| | | | | | | | | |
| Semiconductors & Semiconductor Equipment (37.1%)(d) | | | | | | | | |
| Analog Devices, Inc. | | | 10,000 | | | | 1,948,100 | |
| Applied Materials, Inc. | | | 9,000 | | | | 1,300,860 | |
| ASML Holding NV (Netherlands) | | | 2,250 | | | | 1,630,687 | |
| AXT, Inc. (a) | | | 335,450 | | | | 1,153,948 | |
| Entegris, Inc. | | | 95,000 | | | | 10,527,900 | |
| FormFactor, Inc. (a) | | | 114,900 | | | | 3,931,878 | |
| Lam Research Corp. | | | 2,500 | | | | 1,607,150 | |
| Marvell Technology, Inc. | | | 30,000 | | | | 1,793,400 | |
| MKS Instruments, Inc. | | | 22,000 | | | | 2,378,200 | |
| Nova, Ltd. (Israel) (a) | | | 45,000 | | | | 5,278,500 | |
| PDF Solutions, Inc. (a)(c) | | | 282,500 | | | | 12,740,750 | |
| Photronics, Inc. (a) | | | 152,500 | | | | 3,932,975 | |
| SiTime Corp. (a) | | | 12,000 | | | | 1,415,640 | |
| Teradyne, Inc. | | | 5,000 | | | | 556,650 | |
| Veeco Instruments, Inc. (a) | | | 90,000 | | | | 2,311,200 | |
| | | | | | | | 52,507,838 | |
| Software (0.3%) | | | | | | | | |
| Alteryx, Inc. – Class A (a) | | | 7,400 | | | | 335,960 | |
| Telos Corp. (a) | | | 50,000 | | | | 128,000 | |
| | | | | | | | 463,960 | |
| Specialty Retail (4.0%) | | | | | | | | |
| CarMax, Inc. (a) | | | 68,500 | | | | 5,733,450 | |
| | | | | | | | | |
| Technology Hardware, Storage & Peripherals (11.1%) | | | | | | | | |
| Apple, Inc. | | | 8,000 | | | | 1,551,760 | |
| Hewlett Packard Enterprise Co. | | | 20,000 | | | | 336,000 | |
| Intevac, Inc. (a) | | | 155,000 | | | | 581,250 | |
| Super Micro Computer, Inc. (a)(c) | | | 53,000 | | | | 13,210,250 | |
| | | | | | | | 15,679,260
| |
See accompanying notes to financial statements.
Semi-Annual Report 2023
Needham Growth Fund
Schedule of Investments (Continued)
June 30, 2023 (Unaudited)
| | | Shares | | | Fair Value | |
| Common Stocks – Continued | | | | | | |
| | | | | | | |
| Trading Companies & Distributors (0.2%) | | | | | | |
| Air Lease Corp. | | | 7,500 | | | $ | 313,875 | |
| | | | | | | | | |
| Total Common Stocks | | | | | | | | |
| (Cost $53,033,484) | | | | | | $ | 138,771,276 | |
| | | | | | | | | |
| Short-Term Investments (1.8%) | | | | | | | | |
| | | | | | | | | |
| Money Market Fund (1.8%) | | | | | | | | |
| Dreyfus Treasury Securities Cash Management – Institutional Class, 4.96% (b) | | | | | | | | |
| | | | | | | | | |
| Total Short-Term Investments | | | | | | | | |
| (Cost $2,593,825) | | | 2,593,825 | | | $ | 2,593,825 | |
| | | | | | | | | |
| Total Investments (99.8%) | | | | | | | | |
| (Cost $55,627,309) | | | | | | | 141,365,101 | |
| | | | | | | | | |
| Total Securities Sold Short (-0.6%) | | | | | | | | |
| (Proceeds $776,932) | | | | | | | (845,385 | ) |
| Other Assets in Excess of Liabilities (0.8%) | | | | | | | 1,132,170 | |
| Net Assets (100.0%) | | | | | | $ | 141,651,886 | |
| | Percentages are stated as a percent of net assets. |
| | Industry classifications may be different than those used for compliance monitoring purposes. |
| (a) | Non-income producing security. |
| (b) | Rate shown is the seven day yield as of June 30, 2023. |
| (c) | Security position is either entirely or partially held in a segregated account as collateral for securities sold short, aggregating a total market value of $4,537,835. |
| (d) | As of June 30, 2023, the Fund had a significant portion of its assets invested in the Semiconductors & Semiconductor Equipment industry. |
| ADR | American Depositary Receipt |
The Global Industry Classification Standard (GICS®) was developed by and/or is the exclusive property of MSCI, Inc. and Standard & Poor’s Financial Services LLC (“S&P”). GICS is a service mark of MSCI and S&P and has been licensed for use by U.S. Bancorp Fund Services, LLC.
Distribution of investments by country or territory of incorporation, as a percentage of Total Investments, is as follows (Unaudited):
| Country | Long |
| United States^ | 93.9% |
| Israel | 3.7% |
| Ireland | 1.2% |
| Netherlands | 1.2% |
| Total | 100.0% |
| ^ | United States allocation includes Short-Term Investment-Money Market Fund of 1.8%. |
See accompanying notes to financial statements.
Needham Funds
Needham Growth Fund
Schedule of Securities Sold Short
June 30, 2023 (Unaudited)
| | | Shares | | | Fair Value | |
| Securities Sold Short (-0.6%) | | | | | | |
| | | | | | | |
| Semiconductors & Semiconductor Equipment (-0.5%) | | | | | | |
| Advanced Energy Industries, Inc. | | | 1,000 | | | $ | 111,450 | |
| Aehr Test Systems (a) | | | 2,500 | | | | 103,125 | |
| Cohu, Inc. (a) | | | 5,000 | | | | 207,800 | |
| Onto Innovation, Inc. (a) | | | 3,000 | | | | 349,410 | |
| | | | | | | | 771,785 | |
| Software (-0.1%) | | | | | | | | |
| Digimarc Corp. (a) | | | 2,500 | | | | 73,600 | |
| | | | | | | | | |
| Total Securities Sold Short (-0.6%) | | | | | | | | |
| (Proceeds $776,932) | | | | | | $ | 845,385 | |
| (a) | Non-income producing security. |
Distribution of securities sold short by country or territory of incorporation, as a percentage of Total Securities Sold Short, is as follows (Unaudited):
| Country | Short |
| United States | 100.0% |
| Total | 100.0% |
See accompanying notes to financial statements.
Semi-Annual Report 2023
Needham Aggressive Growth Fund
Schedule of Investments
June 30, 2023 (Unaudited)
| | | Shares | | | Fair Value | |
| Common Stocks (87.6%) | | | | | | |
| | | | | | | |
| Aerospace & Defense (1.8%) | | | | | | |
| Parsons Corp. (a) | | | 77,500 | | | $ | 3,730,850 | |
| | | | | | | | | |
| Biotechnology (0.1%) | | | | | | | | |
| G1 Therapeutics, Inc. (a) | | | 70,000 | | | | 174,300 | |
| | | | | | | | | |
| Building Products (0.4%) | | | | | | | | |
| Alpha Pro Tech, Ltd. (a) | | | 220,000 | | | | 875,600 | |
| Jewett-Cameron Trading Co., Ltd. (Canada) (a) | | | 7,500 | | | | 33,000 | |
| | | | | | | | 908,600 | |
| Chemicals (3.3%) | | | | | | | | |
| Aspen Aerogels, Inc. (a) | | | 400,000 | | | | 3,156,000 | |
| Mativ Holdings, Inc. | | | 135,000 | | | | 2,041,200 | |
| Northern Technologies International Corp. | | | 150,000 | | | | 1,606,500 | |
| | | | | | | | 6,803,700 | |
| Commercial Services & Supplies (2.7%) | | | | | | | | |
| ACV Auctions, Inc. – Class A (a) | | | 86,500 | | | | 1,493,855 | |
| Clean Harbors, Inc. (a) | | | 24,500 | | | | 4,028,535 | |
| | | | | | | | 5,522,390 | |
| Communications Equipment (4.0%) | | | | | | | | |
| ADTRAN Holdings, Inc. | | | 85,000 | | | | 895,050 | |
| Cambium Networks Corp. (a) | | | 71,400 | | | | 1,086,708 | |
| EMCORE Corp. (a) | | | 303,350 | | | | 228,301 | |
| KVH Industries, Inc. (a)(b) | | | 658,750 | | | | 6,020,975 | |
| | | | | | | | 8,231,034 | |
| Construction & Engineering (0.5%) | | | | | | | | |
| Matrix Service Co. (a) | | | 178,300 | | | | 1,050,187 | |
| | | | | | | | | |
| Construction Materials (1.7%) | | | | | | | | |
| Smith-Midland Corp. (a) | | | 146,100 | | | | 3,469,875 | |
| | | | | | | | | |
| Distributors (0.3%) | | | | | | | | |
| Educational Development Corp. (a)(d) | | | 475,000 | | | | 565,250 | |
| | | | | | | | | |
| Diversified Consumer Services (1.5%) | | | | | | | | |
| Bright Horizons Family Solutions, Inc. (a) | | | 32,500 | | | | 3,004,625 | |
| | | | | | | | | |
| Electrical Equipment (8.2%) | | | | | | | | |
| Thermon Group Holdings, Inc. (a) | | | 122,500 | | | | 3,258,500 | |
| Vertiv Holdings Co. | | | 220,000 | | | | 5,449,400 | |
| Vicor Corp. (a) | | | 150,800 | | | | 8,143,200 | |
| | | | | | | | 16,851,100 | |
| Electronic Equipment, Instruments & Components (4.1%) | | | | | | | | |
| Arlo Technologies, Inc. (a) | | | 45,000 | | | | 490,950 | |
| FARO Technologies, Inc. (a) | | | 10,300 | | | | 166,860 | |
| nLight, Inc. (a) | | | 148,800 | | | | 2,294,496 | |
| VIA Optronics AG – ADR (Germany) (a) | | | 130,000 | | | | 343,200 | |
| Vishay Precision Group, Inc. (a) | | | 137,500 | | | | 5,108,125 | |
| | | | | | | | 8,403,631 | |
See accompanying notes to financial statements.
Needham Funds
Needham Aggressive Growth Fund
Schedule of Investments (Continued)
June 30, 2023 (Unaudited)
| | | Shares | | | Fair Value | |
| Common Stocks – Continued | | | | | | |
| | | | | | | |
| Entertainment (0.1%) | | | | | | |
| World Wrestling Entertainment, Inc. – Class A | | | 2,250 | | | $ | 244,058 | |
| | | | | | | | | |
| Health Care Equipment & Supplies (1.4%) | | | | | | | | |
| LeMaitre Vascular, Inc. | | | 20,500 | | | | 1,379,240 | |
| Omnicell, Inc. (a) | | | 2,900 | | | | 213,643 | |
| Precision Optics Corp, Inc. (a) | | | 198,500 | | | | 1,240,625 | |
| | | | | | | | 2,833,508 | |
| Health Care Providers & Services (1.6%) | | | | | | | | |
| Laboratory Corp. of America Holdings | | | 12,300 | | | | 2,968,359 | |
| Quest Diagnostics, Inc. | | | 3,000 | | | | 421,680 | |
| | | | | | | | 3,390,039 | |
| Hotels, Restaurants & Leisure (0.3%) | | | | | | | | |
| Vacasa, Inc. – Class A (a) | | | 970,000 | | | | 658,145 | |
| | | | | | | | | |
| Household Products (2.0%) | | | | | | | | |
| Oil-Dri Corp. of America | | | 71,250 | | | | 4,203,037 | |
| | | | | | | | | |
| Insurance (1.1%) | | | | | | | | |
| Markel Group, Inc. (a) | | | 1,600 | | | | 2,213,088 | |
| | | | | | | | | |
| Interactive Media & Services (0.1%) | | | | | | | | |
| Illumin Holdings, Inc. (Canada) (a) | | | 150,000 | | | | 253,500 | |
| | | | | | | | | |
| IT Services (3.7%) | | | | | | | | |
| Akamai Technologies, Inc. (a)(b) | | | 14,500 | | | | 1,303,115 | |
| Research Solutions, Inc. (a) | | | 532,500 | | | | 1,086,300 | |
| Unisys Corp. (a) | | | 1,300,000 | | | | 5,174,000 | |
| | | | | | | | 7,563,415 | |
| Life Sciences Tools & Services (1.1%) | | | | | | | | |
| Bruker Corp. | | | 22,500 | | | | 1,663,200 | |
| CryoPort, Inc. (a) | | | 37,500 | | | | 646,875 | |
| | | | | | | | 2,310,075 | |
| Machinery (0.1%) | | | | | | | | |
| Westinghouse Air Brake Technologies Corp. | | | 3,000 | | | | 329,010 | |
| | | | | | | | | |
| Media (0.4%) | | | | | | | | |
| The Trade Desk, Inc. – Class A (a) | | | 12,000 | | | | 926,640 | |
| | | | | | | | | |
| Oil, Gas & Consumable Fuels (1.8%) | | | | | | | | |
| Adams Resources & Energy, Inc. | | | 103,500 | | | | 3,638,025 | |
| | | | | | | | | |
| Professional Services (1.3%) | | | | | | | | |
| CRA International, Inc. | | | 26,000 | | | | 2,652,000 | |
| | | | | | | | | |
| Real Estate Investment Trusts (REITs) (1.0%) | | | | | | | | |
| American Tower Corp. | | | 2,250 | | | | 436,365 | |
| Equinix, Inc. | | | 2,100 | | | | 1,646,274 | |
| | | | | | | | 2,082,639 | |
See accompanying notes to financial statements.
Semi-Annual Report 2023
Needham Aggressive Growth Fund
Schedule of Investments (Continued)
June 30, 2023 (Unaudited)
| | | Shares | | | Fair Value | |
| Common Stocks – Continued | | | | | | |
| | | | | | | |
| Semiconductors & Semiconductor Equipment (21.5%) | | | | | | |
| ASML Holding NV (Netherlands) | | | 2,500 | | | $ | 1,811,875 | |
| AXT, Inc. (a) | | | 125,000 | | | | 430,000 | |
| Entegris, Inc. | | | 61,500 | | | | 6,815,430 | |
| FormFactor, Inc. (a) | | | 31,000 | | | | 1,060,820 | |
| MKS Instruments, Inc. | | | 22,000 | | | | 2,378,200 | |
| Nova, Ltd. (Israel) (a) | | | 60,000 | | | | 7,038,000 | |
| PDF Solutions, Inc. (a)(b) | | | 345,000 | | | | 15,559,500 | |
| Photronics, Inc. (a) | | | 236,900 | | | | 6,109,651 | |
| SiTime Corp. (a) | | | 5,000 | | | | 589,850 | |
| SkyWater Technology, Inc. (a) | | | 7,500 | | | | 70,650 | |
| Teradyne, Inc. | | | 5,000 | | | | 556,650 | |
| Veeco Instruments, Inc. (a) | | | 75,000 | | | | 1,926,000 | |
| | | | | | | | 44,346,626 | |
| Software (8.2%) | | | | | | | | |
| Altair Engineering, Inc. – Class A (a) | | | 26,000 | | | | 1,971,840 | |
| American Software, Inc. – Class A | | | 50,000 | | | | 525,500 | |
| Applied Digital Corp. (a) | | | 60,000 | | | | 561,000 | |
| Arteris, Inc. (a) | | | 65,000 | | | | 443,300 | |
| Copperleaf Technologies, Inc. (Canada) (a) | | | 75,000 | | | | 322,703 | |
| ESI Group (France) (a) | | | 77,500 | | | | 12,516,095 | |
| GSE Systems, Inc. (a)(d) | | | 1,430,000 | | | | 514,800 | |
| Telos Corp. (a) | | | 32,500 | | | | 83,200 | |
| | | | | | | | 16,938,438 | |
| Specialty Retail (1.7%) | | | | | | | | |
| CarMax, Inc. (a) | | | 20,500 | | | | 1,715,850 | |
| ThredUp, Inc. – Class A (a) | | | 700,000 | | | | 1,708,000 | |
| | | | | | | | 3,423,850 | |
| Technology Hardware, Storage & Peripherals (10.9%) | | | | | | | | |
| Apple, Inc. (b) | | | 25,000 | | | | 4,849,250 | |
| Intevac, Inc. (a) | | | 75,000 | | | | 281,250 | |
| Super Micro Computer, Inc. (a)(b) | | | 69,500 | | | | 17,322,875 | |
| | | | | | | | 22,453,375 | |
| Textiles, Apparel & Luxury Goods (0.0%) | | | | | | | | |
| Allbirds, Inc. – Class A (a) | | | 50,000 | | | | 63,000 | |
| | | | | | | | | |
| Trading Companies & Distributors (0.7%) | | | | | | | | |
| Transcat, Inc. (a) | | | 17,500 | | | | 1,492,925 | |
| | | | | | | | | |
| Total Common Stocks | | | | | | | | |
| (Cost $111,594,063) | | | | | | $ | 180,730,935 | |
See accompanying notes to financial statements.
Needham Funds
Needham Aggressive Growth Fund
Schedule of Investments (Continued)
June 30, 2023 (Unaudited)
| | | Shares | | | Fair Value | |
| Short-Term Investments (10.9%) | | | | | | |
| | | | | | | |
| Money Market Fund (10.9%) | | | | | | |
| Dreyfus Treasury Securities Cash Management – Institutional Class, 4.96% (c) | | | | | | |
| | | | | | | |
| Total Short-Term Investments | | | | | | |
| (Cost $22,188,378) | | | 22,188,378 | | | $ | 22,188,378 | |
| | | | | | | | | |
| Total Investments (98.5%) | | | | | | | | |
| (Cost $133,782,441) | | | | | | | 202,919,313 | |
| Other Assets in Excess of Liabilities (1.5%) | | | | | | | 3,132,074 | |
| Net Assets (100.0%) | | | | | | $ | 206,051,387 | |
| | Percentages are stated as a percent of net assets. |
| | Industry classifications may be different than those used for compliance monitoring purposes. |
| (a) | Non-income producing security. |
| (b) | Security position is either entirely or partially held in a segregated account as collateral for securities sold short, aggregating a total market value of $3,804,500. |
| (c) | Rate shown is the seven day yield as of June 30, 2023. |
| (d) | Affiliated security. Please refer to Note 11 of the Financial Statements. |
| | |
| ADR | American Depositary Receipt |
The Global Industry Classification Standard (GICS®) was developed by and/or is the exclusive property of MSCI, Inc. and Standard & Poor’s Financial Services LLC (“S&P”).
Distribution of investments by country or territory of incorporation, as a percentage of Total Investments, is as follows (Unaudited):
| Country | Long |
| United States^ | 89.0% |
| France | 6.2% |
| Israel | 3.4% |
| Netherlands | 0.9% |
| Canada | 0.3% |
| Germany | 0.2% |
| Total | 100.0% |
| ^ | United States allocation includes Short-Term Investment-Money Market Fund of 10.9%. |
See accompanying notes to financial statements.
Semi-Annual Report 2023
Needham Small Cap Growth Fund
Schedule of Investments
June 30, 2023 (Unaudited)
| | | Shares | | | Fair Value | |
| Common Stocks (68.8%) | | | | | | |
| | | | | | | |
| Aerospace & Defense (0.4%) | | | | | | |
| Mercury Systems, Inc. (a) | | | 20,000 | | | $ | 691,800 | |
| | | | | | | | | |
| Chemicals (6.1%) | | | | | | | | |
| Aspen Aerogels, Inc. (a)(b) | | | 1,325,000 | | | | 10,454,250 | |
| | | | | | | | | |
| Communications Equipment (14.7%) | | | | | | | | |
| ADTRAN Holdings, Inc. (b) | | | 975,000 | | | | 10,266,750 | |
| Cambium Networks Corp. (a) | | | 450,000 | | | | 6,849,000 | |
| Ciena Corp. (a) | | | 30,000 | | | | 1,274,700 | |
| EMCORE Corp. (a) | | | 606,650 | | | | 456,565 | |
| Infinera Corp. (a) | | | 382,500 | | | | 1,847,475 | |
| KVH Industries, Inc. (a)(b) | | | 492,500 | | | | 4,501,450 | |
| | | | | | | | 25,195,940 | |
| Electrical Equipment (6.1%) | | | | | | | | |
| Generac Holdings, Inc. (a) | | | 10,000 | | | | 1,491,300 | |
| Sensata Technologies Holding PLC | | | 30,000 | | | | 1,349,700 | |
| Vicor Corp. (a) | | | 141,850 | | | | 7,659,900 | |
| | | | | | | | 10,500,900 | |
| Electronic Equipment, Instruments & Components (15.8%) | | | | | | | | |
| Akoustis Technologies, Inc. (a) | | | 1,387,500 | | | | 4,412,250 | |
| Coherent Corp. (a) | | | 20,000 | | | | 1,019,600 | |
| Frequency Electronics, Inc. (d) | | | 545,000 | | | | 3,607,900 | |
| nLight, Inc. (a)(b) | | | 615,000 | | | | 9,483,300 | |
| TTM Technologies, Inc. (a) | | | 602,900 | | | | 8,380,310 | |
| Vishay Precision Group, Inc. (a) | | | 7,500 | | | | 278,625 | |
| | | | | | | | 27,181,985 | |
| Health Care Equipment & Supplies (0.5%) | | | | | | | | |
| ViewRay, Inc. (a) | | | 2,400,000 | | | | 845,280 | |
| | | | | | | | | |
| IT Services (1.1%) | | | | | | | | |
| BigCommerce Holdings, Inc. (a) | | | 150,000 | | | | 1,492,500 | |
| Unisys Corp. (a) | | | 100,000 | | | | 398,000 | |
| | | | | | | | 1,890,500 | |
| Life Sciences Tools & Services (2.2%) | | | | | | | | |
| Standard BioTools, Inc. (a) | | | 2,000,000 | | | | 3,860,000 | |
| | | | | | | | | |
| Semiconductors & Semiconductor Equipment (9.7%) | | | | | | | | |
| AXT, Inc. (a) | | | 1,500,000 | | | | 5,160,000 | |
| FormFactor, Inc. (a)(b) | | | 113,000 | | | | 3,866,860 | |
| MKS Instruments, Inc. | | | 27,000 | | | | 2,918,700 | |
| PDF Solutions, Inc. (a) | | | 30,000 | | | | 1,353,000 | |
| SiTime Corp. (a) | | | 17,500 | | | | 2,064,475 | |
| Veeco Instruments, Inc. (a) | | | 50,000 | | | | 1,284,000 | |
| | | | | | | | 16,647,035 | |
See accompanying notes to financial statements.
Needham Funds
Needham Small Cap Growth Fund
Schedule of Investments (Continued)
June 30, 2023 (Unaudited)
| | | Shares | | | Fair Value | |
| Common Stocks – Continued | | | | | | |
| | | | | | | |
| Software (10.5%) | | | | | | |
| 8x8, Inc. (a) | | | 1,000,000 | | | $ | 4,230,000 | |
| Alteryx, Inc. – Class A (a) | | | 53,100 | | | | 2,410,740 | |
| New Relic, Inc. (a) | | | 60,000 | | | | 3,926,400 | |
| Telos Corp. (a) | | | 275,000 | | | | 704,000 | |
| Upland Software, Inc. (a) | | | 100,000 | | | | 360,000 | |
| Zuora, Inc. – Class A (a) | | | 588,000 | | | | 6,450,360 | |
| | | | | | | | 18,081,500 | |
| Technology Hardware, Storage & Peripherals (1.7%) | | | | | | | | |
| Intevac, Inc. (a) | | | 788,100 | | | | 2,955,375 | |
| Total Common Stocks | | | | | | | | |
| (Cost $137,081,452) | | | | | | $ | 118,304,565 | |
| Warrants (0.0%) | | | | | | | | |
| Agile Therapeutics, Inc. (a) | | | 88 | | | | 46 | |
| Total Warrants | | | | | | | | |
| (Cost $1,750) | | | | | | | 46 | |
| Short-Term Investments (31.1%) | | | | | | | | |
| Money Market Fund (31.1%) | | | | | | | | |
| Dreyfus Treasury Securities Cash Management – Institutional Class, 4.96% (c) | | | | | | | | |
| Total Short-Term Investments | | | | | | | | |
| (Cost $53,527,621) | | | 53,527,621 | | | $ | 53,527,621 | |
| Total Investments (99.9%) | | | | | | | | |
| (Cost $190,610,822) | | | | | | | 171,832,232 | |
| Total Securities Sold Short (-1.8%) | | | | | | | | |
| (Proceeds $3,001,011) | | | | | | | (3,168,800 | ) |
| Other Assets in Excess of Liabilities (1.9%) | | | | | | | 3,310,212 | |
| Net Assets (100.0%) | | | | | | $ | 171,973,644 | |
| | Percentages are stated as a percent of net assets. |
| | Industry classifications may be different than those used for compliance purposes. |
| (a) | Non-income producing security. |
| (b) | Security position is either entirely or partially held in a segregated account as collateral for securities sold short, aggregating a total market value of $5,967,800. |
| (c) | Rate shown is the seven day yield as of June 30, 2023. |
| (d) | Affiliated security. Please refer to Note 11 of the Financial Statements. |
The Global Industry Classification Standard (GICS®) was developed by and/or is the exclusive property of MSCI, Inc. and Standard & Poor’s Financial Services LLC (“S&P”).
Distribution of investments by country or territory of incorporation, as a percentage of Total Investments, is as follows (Unaudited):
| Country | Long |
| United States^ | 100.0% |
| Total | 100.0% |
| ^ | United States allocation includes Short-Term Investment-Money Market Fund of 31.1%. |
See accompanying notes to financial statements.
Semi-Annual Report 2023
Needham Small Cap Growth Fund
Schedule of Securities Sold Short
June 30, 2023 (Unaudited)
| | | Shares | | | Fair Value | |
| Securities Sold Short (-1.8%) | | | | | | |
| | | | | | | |
| Semiconductors & Semiconductor Equipment (-1.8%) | | | | | | |
| Advanced Energy Industries, Inc. | | | 5,000 | | | $ | 557,250 | |
| Aehr Test Systems (a) | | | 25,000 | | | | 1,031,250 | |
| Cohu, Inc. (a) | | | 10,000 | | | | 415,600 | |
| Onto Innovation, Inc. (a) | | | 10,000 | | | | 1,164,700 | |
| | | | | | | | 3,168,800 | |
| Total Securities Sold Short (-1.8%) | | | | | | | | |
| (Proceeds $3,001,011) | | | | | | $ | 3,168,800 | |
| (a) | Non-income producing security. |
Distribution of securities sold short by country or territory of incorporation, as a percentage of Total Securities Sold Short, is as follows (Unaudited):
| Country | Short |
| United States | 100.0% |
| Total | 100.0% |
See accompanying notes to financial statements.
Needham Funds
Statements of Assets and Liabilities
June 30, 2023 (Unaudited)
| | | | | | Needham | | | Needham | |
| | | Needham | | | Aggressive | | | Small Cap | |
| | | Growth Fund | | | Growth Fund | | | Growth Fund | |
| Assets | | | | | | | | | |
| Investments, at Value | | | | | | | | | |
| Unaffiliated Securities (Cost $55,627,309, $128,929,200, $185,948,083) | | $ | 141,365,101 | | | $ | 201,839,263 | | | $ | 168,224,332 | |
| Affiliated Securities, (Cost $-, $4,853,241, $4,662,739) | | | — | | | | 1,080,050 | | | | 3,607,900 | |
| Foreign Currency, (Cost $-, $9, $-) | | | — | | | | 10 | | | | — | |
| Receivables: | | | | | | | | | | | | |
| Deposit with Broker for Securities Sold Short | | | 801,263 | | | | 231,702 | | | | 2,504,805 | |
| Dividends and Interest | | | 32,576 | | | | 46,688 | | | | 235,303 | |
| Fund Shares Sold | | | 402,855 | | | | 3,054,620 | | | | 811,158 | |
| Investment Securities Sold | | | 205,641 | | | | 300,392 | | | | 1,417,939 | |
| Prepaid Expenses | | | 26,184 | | | | 38,329 | | | | 52,061 | |
| Total Assets | | | 142,833,620 | | | | 206,591,054 | | | | 176,853,498 | |
| | | | | | | | | | | | | |
| Liabilities | | | | | | | | | | | | |
| Securities Sold Short, at Value | | | | | | | | | | | | |
| (Proceeds $776,932, $—, $3,001,011) | | | 845,385 | | | | — | | | | 3,168,800 | |
| Payables: | | | | | | | | | | | | |
| Investment Securities Purchased | | | — | | | | 148,219 | | | | 985,271 | |
| Fund Shares Redeemed | | | 89,358 | | | | 156,868 | | | | 434,779 | |
| Due to Adviser | | | 135,912 | | | | 164,696 | | | | 137,709 | |
| Distribution Fees | | | 14,957 | | | | 16,152 | | | | 8,693 | |
| Administration and Accounting Fees | | | 25,360 | | | | 10,299 | | | | 9,672 | |
| Transfer Agent Fees | | | 7,988 | | | | 10,019 | | | | 24,583 | |
| Audit and Tax Fees | | | 24,996 | | | | 16,022 | | | | 37,984 | |
| Directors’ Fees | | | 3,376 | | | | 4,423 | | | | 5,999 | |
| Accrued Expenses and Other Liabilities | | | 34,402 | | | | 12,969 | | | | 66,364 | |
| Total Liabilities | | | 1,181,734 | | | | 539,667 | | | | 4,879,854 | |
| Net Assets | | $ | 141,651,886 | | | $ | 206,051,387 | | | $ | 171,973,644 | |
| | | | | | | | | | | | | |
| Retail Class Shares | | | | | | | | | | | | |
| Net Assets | | | 73,858,630 | | | | 85,249,856 | | | | 55,489,001 | |
| Shares Issued and Outstanding $0.001 Par Value | | | | | | | | | | | | |
| (Authorized 800,000,000, 100,000,000 and 100,000,000, respectively) | | | 1,369,542 | | | | 2,277,266 | | | | 3,482,845 | |
| Net Asset Value and Offering Price Per Share | | $ | 53.93 | | | $ | 37.44 | | | $ | 15.93 | |
| | | | | | | | | | | | | |
| Institutional Class Shares | | | | | | | | | | | | |
| Net Assets | | | 67,793,256 | | | | 120,801,531 | | | | 116,484,643 | |
| Shares Issued and Outstanding $0.001 Par Value | | | | | | | | | | | | |
| (Authorized 800,000,000,100,000,000 and 100,000,000, respectively) | | | 1,209,195 | | | | 3,080,879 | | | | 6,913,320 | |
| Net Asset Value and Offering Price Per Share | | $ | 56.06 | | | $ | 39.21 | | | $ | 16.85 | |
| | | | | | | | | | | | | |
| Components of Net Assets | | | | | | | | | | | | |
| Paid-in Capital | | | 55,487,556 | | | | 141,222,386 | | | | 250,335,761 | |
| Distributable Earnings | | | 86,164,330 | | | | 64,829,001 | | | | (78,362,117 | ) |
| Undistributed Net Investment Income | | | (596,063 | ) | | | (657,072 | ) | | | (114,877 | ) |
| Accumulated Unrealized Appreciation/(Depreciation) of Investments | | | 85,669,339 | | | | 69,136,872 | | | | (18,946,379 | ) |
| Undistributed Net Realized Gain/(Loss) | | | 1,091,054 | | | | (3,650,799 | ) | | | (59,300,861 | ) |
| Total Net Assets | | $ | 141,651,886 | | | $ | 206,051,387 | | | $ | 171,973,644 | |
See accompanying notes to financial statements.
Semi-Annual Report 2023
Statements of Operations
For the six months ended June 30, 2023 (Unaudited)
| | | | | | Needham | | | Needham | |
| | | Needham | | | Aggressive | | | Small Cap | |
| | | Growth Fund | | | Growth Fund | | | Growth Fund | |
| Investment Income | | | | | | | | | |
| Dividend Income from unaffiliated securities | | | | | | | | | |
| (net of foreign withholding tax of $1,120, $1,245, $—) | | $ | 330,320 | | | $ | 321,187 | | | $ | 140,598 | |
| Interest Income | | | 84,270 | | | | 122,316 | | | | 1,045,751 | |
| Total Investment Income | | | 414,590 | | | | 443,503 | | | | 1,186,349 | |
| | | | | | | | | | | | | |
| Expenses | | | | | | | | | | | | |
| Investment Advisory Fees | | | 786,343 | | | | 951,658 | | | | 1,173,905 | |
| Distribution Fees | | | 81,287 | | | | 79,871 | | | | 74,293 | |
| Administration and Accounting Fees | | | 79,426 | | | | 73,513 | | | | 94,940 | |
| Audit Fees | | | 14,972 | | | | 20,557 | | | | 20,214 | |
| Chief Compliance Officer Fees | | | 5,047 | | | | 5,411 | | | | 8,088 | |
| Custodian Fees | | | 6,271 | | | | 7,108 | | | | 7,627 | |
| Directors’ Fees | | | 5,913 | | | | 6,080 | | | | 8,977 | |
Dividend Expense(1) | | | 35 | | | | — | | | | 130 | |
| Filing Fees | | | 19,354 | | | | 27,358 | | | | 33,759 | |
| Legal Fees | | | 6,660 | | | | 10,021 | | | | 36,560 | |
| Printing Fees | | | 5,122 | | | | 6,472 | | | | 12,739 | |
| Transfer Agent Fees | | | 26,253 | | | | 37,975 | | | | 79,082 | |
| Other Expenses | | | 10,167 | | | | 13,079 | | | | 18,709 | |
| Total Expenses | | | 1,046,850 | | | | 1,239,103 | | | | 1,569,023 | |
| Fees Waived by Investment Adviser | | | (36,197 | ) | | | (149,837 | ) | | | (269,756 | ) |
| Fees Recouped by Investment Adviser | | | — | | | | 11,309 | | | | 1,960 | |
| Net Expenses | | | 1,010,653 | | | | 1,100,575 | | | | 1,301,227 | |
| Net Investment Loss | | | (596,063 | ) | | | (657,072 | ) | | | (114,878 | ) |
| | | | | | | | | | | | | |
| Net Realized / Unrealized Gain (Loss) from Investments, | | | | | | | | | | | | |
| Securities Sold Short, Foreign Currency Transactions and Currency | | | | | | | | | | | | |
| Net Realized Gain (Loss) from Unaffiliated Securities | | | 1,685,740 | | | | (3,494,251 | ) | | | (29,717,933 | ) |
| Net Realized Loss from Affiliated Securities | | | — | | | | (152,612 | ) | | | (53,415 | ) |
| Net Realized Gain from Securities Sold Short | | | 35,879 | | | | — | | | | 9,209,201 | |
| Net Realized Loss from Foreign Currency Transactions and Currency | | | — | | | | (433 | ) | | | — | |
| Change in Unrealized Depreciation on Investments and Securities Sold Short | | | 26,332,336 | | | | 45,116,952 | | | | 25,867,273 | |
| Change in Unrealized Appreciation (Depreciation) on Affiliated Investments | | | — | | | | (2,242,926 | ) | | | (1,022,326 | ) |
| Change in Unrealized Appreciation on Foreign Currency Transactions and Currency | | | — | | | | (1 | ) | | | — | |
| Net Realized / Unrealized Gain from Investments, | | | | | | | | | | | | |
| Securities Sold Short, Foreign Currency Transactions and Currency | | | 28,053,955 | | | | 39,226,729 | | | | 4,282,800 | |
| Change in Net Assets Resulting from Operations | | $ | 27,457,892 | | | $ | 38,569,657 | | | $ | 4,167,922 | |
(1) | Expense related to short selling activities. |
See accompanying notes to financial statements.
Needham Funds
Needham Growth Fund
Statements of Changes in Net Assets
| | | Period Ended | | | Year Ended | |
| | | June 30, 2023 | | | December 31, 2022 | |
| Change in Net Assets | | | | | | |
| Operations: | | | | | | |
| Net Investment Loss | | $ | (596,063 | ) | | $ | (1,622,783 | ) |
| Net Realized Gain/(Loss) from Investments, Securities Sold Short, | | | | | | | | |
| Foreign Currency Transactions, and Currency | | | 1,721,619 | | | | (561,686 | ) |
| Net Change in Unrealized Appreciation/(Depreciation) on Investments, | | | | | | | | |
| Securities Sold Short, Foreign Currency Translations | | | 26,332,336 | | | | (65,440,863 | ) |
| Change in Net Assets Resulting from Operations | | | 27,457,892 | | | | (67,625,332 | ) |
| | | | | | | | | |
| Distributable Earnings: | | | | | | | | |
| Retail Class | | | — | | | | (1,112,516 | ) |
| Institutional Class | | | — | | | | (1,008,195 | ) |
| Total Distributable Earnings | | | — | | | | (2,120,711 | ) |
| | | | | | | | | |
| Capital Transactions: | | | | | | | | |
| Retail Class: | | | | | | | | |
| Shares Issued | | | 1,884,633 | | | | 3,103,586 | |
| Shares Issued in Reinvestment of Distribution | | | — | | | | 1,046,663 | |
| Shares Exchanged for Institutional Class Shares | | | (2,218 | ) | | | (329,331 | ) |
| Shares Redeemed | | | (4,305,228 | ) | | | (8,542,497 | ) |
| Institutional Class: | | | | | | | | |
| Shares Issued | | | 2,388,301 | | | | 12,533,645 | |
| Shares Issued in Reinvestment of Distribution | | | — | | | | 975,002 | |
| Shares Issued in Exchange for Retail Class Shares | | | 2,218 | | | | 329,331 | |
| Shares Redeemed | | | (6,333,317 | ) | | | (35,719,878 | ) |
| Total Change in Net Assets from Capital Transactions | | | (6,365,611 | ) | | | (26,603,479 | ) |
| | | | | | | | | |
| Change in Net Assets | | | 21,092,281 | | | | (96,349,522 | ) |
| | | | | | | | | |
| Total Net Assets | | | | | | | | |
| Beginning of Year | | | 120,559,605 | | | | 216,909,127 | |
| End of Period | | $ | 141,651,886 | | | $ | 120,559,605 | |
| | | | | | | | | |
| Share Transactions: | | | | | | | | |
| Retail Class: | | | | | | | | |
| Number of Shares Issued | | | 36,921 | | | | 57,289 | |
| Number of Shares Reinvested | | | — | | | | 23,584 | |
| Number of Shares Exchanged for Institutional Class Shares | | | (47 | ) | | | (6,573 | ) |
| Number of Shares Redeemed | | | (91,044 | ) | | | (165,817 | ) |
| Change in Retail Class Shares | | | (54,170 | ) | | | (91,517 | ) |
| Institutional Class: | | | | | | | | |
| Number of Shares Issued | | | 46,204 | | | | 228,548 | |
| Number of Shares Reinvested | | | — | | | | 21,182 | |
| Number of Shares Issued in Exchange for Retail Class Shares | | | 45 | | | | 6,351 | |
| Number of Shares Redeemed | | | (128,064 | ) | | | (638,226 | ) |
| Change in Institutional Class Shares | | | (81,815 | ) | | | (382,145 | ) |
| Total Change in Shares | | | (135,985 | ) | | | (473,662 | ) |
See accompanying notes to financial statements.
Semi-Annual Report 2023
Needham Aggressive Growth Fund
Statements of Changes in Net Assets
| | | Period Ended | | | Year Ended | |
| | | June 30, 2023 | | | December 31, 2022 | |
| Change in Net Assets | | | | | | |
| Operations: | | | | | | |
| Net Investment Loss | | $ | (657,072 | ) | | $ | (1,381,891 | ) |
| Net Realized Gain/(Loss) from Investments, Securities Sold Short, | | | | | | | | |
| Foreign Currency Transactions, and Currency | | | (3,647,296 | ) | | | 1,252,127 | |
| Net Change in Unrealized Appreciation/(Depreciation) on Investments, | | | | | | | | |
| Securities Sold Short, Foreign Currency Translations | | | 42,874,025 | | | | (47,417,967 | ) |
| Change in Net Assets Resulting from Operations | | | 38,569,657 | | | | (47,547,731 | ) |
| | | | | | | | | |
| Distributable Earnings: | | | | | | | | |
| Retail Class | | | — | | | | — | |
| Institutional Class | | | — | | | | — | |
| Total Distributable Earnings | | | — | | | | — | |
| | | | | | | | | |
| Capital Transactions: | | | | | | | | |
| Retail Class: | | | | | | | | |
| Shares Issued | | | 20,021,742 | | | | 32,589,452 | |
| Shares Issued in Reinvestment of Distribution | | | — | | | | — | |
| Shares Exchanged for Institutional Class Shares | | | (218,476 | ) | | | (738,424 | ) |
| Shares Redeemed | | | (5,983,883 | ) | | | (19,962,515 | ) |
| Capital Contribution | | | 83,012 | | | | — | |
| Institutional Class: | | | | | | | | |
| Shares Issued | | | 34,540,636 | | | | 75,218,012 | |
| Shares Issued in Reinvestment of Distribution | | | — | | | | — | |
| Shares Issued in Exchange for Retail Class Shares | | | 218,476 | | | | 738,424 | |
| Shares Redeemed | | | (16,099,081 | ) | | | (45,755,366 | ) |
| Total Change in Net Assets from Capital Transactions | | | 32,562,426 | | | | 42,089,583 | |
| | | | | | | | | |
| Change in Net Assets | | | 71,132,083 | | | | (5,458,148 | ) |
| | | | | | | | | |
| Total Net Assets | | | | | | | | |
| Beginning of Year | | | 134,919,304 | | | | 140,377,452 | |
| End of Period | | $ | 206,051,387 | | | $ | 134,919,304 | |
| | | | | | | | | |
| Share Transactions: | | | | | | | | |
| Retail Class: | | | | | | | | |
| Number of Shares Issued | | | 598,764 | | | | 962,894 | |
| Number of Shares Reinvested | | | — | | | | — | |
| Number of Shares Exchanged for Institutional Class Shares | | | (6,990 | ) | | | (23,793 | ) |
| Number of Shares Redeemed | | | (186,176 | ) | | | (635,372 | ) |
| Change in Retail Class Shares | | | 405,598 | | | | 303,729 | |
| Institutional Class: | | | | | | | | |
| Number of Shares Issued | | | 964,276 | | | | 2,160,212 | |
| Number of Shares Reinvested | | | — | | | | — | |
| Number of Shares Issued in Exchange for Retail Class Shares | | | 6,676 | | | | 22,856 | |
| Number of Shares Redeemed | | | (490,075 | ) | | | (1,406,449 | ) |
| Change in Institutional Class Shares | | | 480,877 | | | | 776,619 | |
| Total Change in Shares | | | 886,475 | | | | 1,080,348 | |
See accompanying notes to financial statements.
Needham Funds
Needham Small Cap Growth FundStatements of Changes in Net Assets
| | | Period Ended | | | Year Ended | |
| | | June 30, 2023 | | | December 31, 2022 | |
| Change in Net Assets | | | | | | |
| Operations: | | | | | | |
| Net Investment Loss | | $ | (114,878 | ) | | $ | (2,101,991 | ) |
| Net Realized Gain/(Loss) from Investments, Securities Sold Short, | | | | | | | | |
| Foreign Currency Transactions, and Currency | | | (20,562,147 | ) | | | (38,149,724 | ) |
| Net Change in Unrealized Appreciation/(Depreciation) on Investments, | | | | | | | | |
| Securities Sold Short, Foreign Currency Translations | | | 24,844,947 | | | | (43,233,707 | ) |
| Change in Net Assets Resulting from Operations | | | 4,167,922 | | | | (83,485,422 | ) |
| | | | | | | | | |
| Distributable Earnings: | | | | | | | | |
| Retail Class | | | — | | | | (2,436,435 | ) |
| Institutional Class | | | — | | | | (5,043,317 | ) |
| Total Distributable Earnings | | | — | | | | (7,479,752 | ) |
| | | | | | | | | |
| Capital Transactions: | | | | | | | | |
| Retail Class: | | | | | | | | |
| Shares Issued | | | 7,932,306 | | | | 23,274,194 | |
| Shares Issued in Reinvestment of Distribution | | | — | | | | 2,249,936 | |
| Shares Exchanged for Institutional Class Shares | | | (586,354 | ) | | | (355,490 | ) |
| Shares Redeemed | | | (12,013,989 | ) | | | (44,181,952 | ) |
| Capital Contribution | | | 210,184 | | | | — | |
| Institutional Class: | | | | | | | | |
| Shares Issued | | | 18,844,220 | | | | 89,867,190 | |
| Shares Issued in Reinvestment of Distribution | | | — | | | | 4,912,810 | |
| Shares Issued in Exchange for Retail Class Shares | | | 586,354 | | | | 355,490 | |
| Shares Redeemed | | | (43,799,680 | ) | | | (75,209,316 | ) |
| Total Change in Net Assets from Capital Transactions | | | (28,826,959 | ) | | | 912,862 | |
| | | | | | | | | |
| Change in Net Assets | | | (24,659,037 | ) | | | (90,052,312 | ) |
| | | | | | | | | |
| Total Net Assets | | | | | | | | |
| Beginning of Year | | | 196,632,681 | | | | 286,684,993 | |
| End of Period | | $ | 171,973,644 | | | $ | 196,632,681 | |
| | | | | | | | | |
| Share Transactions: | | | | | | | | |
| Retail Class: | | | | | | | | |
| Number of Shares Issued | | | 475,165 | | | | 1,274,649 | |
| Number of Shares Reinvested | | | — | | | | 147,827 | |
| Number of Shares Exchanged for Institutional Class Shares | | | (37,630 | ) | | | (22,360 | ) |
| Number of Shares Redeemed | | | (765,097 | ) | | | (2,454,992 | ) |
| Change in Retail Class Shares | | | (327,562 | ) | | | (1,054,876 | ) |
| Institutional Class: | | | | | | | | |
| Number of Shares Issued | | | 1,087,745 | | | | 4,829,226 | |
| Number of Shares Reinvested | | | — | | | | 305,333 | |
| Number of Shares Issued in Exchange for Retail Class Shares | | | 35,514 | | | | 21,248 | |
| Number of Shares Redeemed | | | (2,598,836 | ) | | | (3,914,928 | ) |
| Change in Institutional Class Shares | | | (1,475,577 | ) | | | 1,240,879 | |
| Total Change in Shares | | | (1,803,139 | ) | | | 186,003 | |
See accompanying notes to financial statements.
Semi-Annual Report 2023
Needham Growth Fund
Financial Highlights
| | | Retail Class | |
| | | Six Months | | | | | | | | | | | | | | | | |
| | | Ended | | | | | | | | | | | | | | | | |
| (For a Share Outstanding | | June 30, 2023 | | | Year Ended December 31 | |
| Throughout each Period/Year) | | (Unaudited) | | | 2022 | | | 2021 | | | 2020 | | | 2019 | | | 2018 | |
| Net Asset Value, Beginning of Period/Year | | $ | 43.63 | | | $ | 66.90 | | | $ | 55.89 | | | $ | 41.99 | | | $ | 33.04 | | | $ | 42.91 | |
| Investment Operations | | | | | | | | | | | | | | | | | | | | | | | | |
| Net Investment Loss | | | (0.27 | ) | | | (0.67 | ) | | | (0.89 | ) | | | (0.56 | ) | | | (0.48 | ) | | | (0.88 | ) |
| Net Realized and Unrealized | | | | | | | | | | | | | | | | | | | | | | | | |
| Gain (Loss) on Investments | | | 10.57 | | | | (21.82 | ) | | | 16.53 | | | | 17.66 | | | | 14.18 | | | | (3.11 | ) |
| Total from Investment Operations | | | 10.30 | | | | (22.49 | ) | | | 15.64 | | | | 17.10 | | | | 13.70 | | | | (3.99 | ) |
| | | | | | | | | | | | | | | | | | | | | | | | | |
| Less Distributions | | | | | | | | | | | | | | | | | | | | | | | | |
| Net Realized Gains | | | — | | | | (0.78 | ) | | | (4.63 | ) | | | (3.20 | ) | | | (4.75 | ) | | | (5.88 | ) |
| Total Distributions | | | — | | | | (0.78 | ) | | | (4.63 | ) | | | (3.20 | ) | | | (4.75 | ) | | | (5.88 | ) |
| Net Asset Value, End of Period/Year | | $ | 53.93 | | | $ | 43.63 | | | $ | 66.90 | | | $ | 55.89 | | | $ | 41.99 | | | $ | 33.04 | |
| | | | | | | | | | | | | | | | | | | | | | | | | |
| Total Return | | | 23.61 | % | | | (33.66 | )% | | | 27.68 | % | | | 41.59 | % | | | 42.31 | %(1) | | | (10.26 | )% |
| Net Assets, End of Period/Year (000’s) | | $ | 73,858 | | | $ | 62,117 | | | $ | 101,366 | | | $ | 82,628 | | | $ | 65,526 | | | $ | 54,245 | |
| Ratios/Supplemental Data | | | | | | | | | | | | | | | | | | | | | | | | |
| Ratio of Net Expenses to Average Net Assets | | | 1.80 | % | | | 1.85 | % | | | 1.78 | % | | | 1.85 | % | | | 1.98 | % | | | 2.76 | % |
| Ratio of Net Expenses to Average Net Assets | | | | | | | | | | | | | | | | | | | | | | | | |
| (before interest and dividend expense) | | | 1.80 | %(2) | | | 1.85 | % | | | 1.78 | % | | | 1.85 | % | | | 1.95 | % | | | 1.92 | % |
| Ratio of Total Expenses to | | | | | | | | | | | | | | | | | | | | | | | | |
| Average Net Assets (before waiver | | | | | | | | | | | | | | | | | | | | | | | | |
| and reimbursement of expenses) | | | 1.80 | % | | | 1.85 | % | | | 1.78 | % | | | 1.83 | % | | | 2.01 | % | | | 2.76 | % |
| Ratio of Net Investment Loss | | | | | | | | | | | | | | | | | | | | | | | | |
| to Average Net Assets | | | (1.14 | )% | | | (1.34 | )% | | | (1.40 | )% | | | (1.23 | )% | | | (1.21 | )% | | | (2.07 | )% |
| Ratio of Net Investment Loss to | | | | | | | | | | | | | | | | | | | | | | | | |
| Average Net Assets (before waivers | | | | | | | | | | | | | | | | | | | | | | | | |
| and reimbursements of expenses) | | | (1.15 | )% | | | (1.34 | )% | | | (1.40 | )% | | | (1.21 | )% | | | (1.24 | )% | | | (2.07 | )% |
| Portfolio turnover rate | | | 10 | % | | | 14 | % | | | 15 | % | | | 15 | % | | | 13 | % | | | 8 | % |
(1) | The return reflects the actual performance for the year and does not include the impact of any adjustments made for financial reporting required by Generally Accepted Accounting Principles (GAAP). |
(2) | The Adviser has contractually agreed to waive its fee and, if necessary, reimburse the Fund until May 1, 2024 to the extent Total Annual Fund Operating Expenses exceed 1.95% of the average daily net assets of the Retail Class shares of the Fund. |
See accompanying notes to financial statements.
Needham Funds
Needham Growth Fund
Financial Highlights
| | | Institutional Class | |
| | | Six Months | | | | | | | | | | | | | | | | |
| | | Ended | | | | | | | | | | | | | | | | |
| (For a Share Outstanding | | June 30, 2023 | | | Year Ended December 31 | |
| Throughout each Period/Year) | | (Unaudited) | | | 2022 | | | 2021 | | | 2020 | | | 2019 | | | 2018 | |
| Net Asset Value, Beginning of Period/Year | | $ | 45.27 | | | $ | 69.06 | | | $ | 57.36 | | | $ | 42.83 | | | $ | 33.45 | | | $ | 43.15 | |
| Investment Operations | | | | | | | | | | | | | | | | | | | | | | | | |
| Net Investment Loss | | | (0.19 | ) | | | (0.47 | ) | | | (0.68 | ) | | | (0.36 | ) | | | (0.26 | ) | | | (0.65 | ) |
| Net Realized and Unrealized | | | | | | | | | | | | | | | | | | | | | | | | |
| Gain (Loss) on Investments | | | 10.98 | | | | (22.54 | ) | | | 17.01 | | | | 18.09 | | | | 14.39 | | | | (3.17 | ) |
| Total from Investment Operations | | | 10.79 | | | | (23.01 | ) | | | 16.33 | | | | 17.73 | | | | 14.13 | | | | (3.82 | ) |
| | | | | | | | | | | | | | | | | | | | | | | | | |
| Less Distributions | | | | | | | | | | | | | | | | | | | | | | | | |
| Net Realized Gains | | | — | | | | (0.78 | ) | | | (4.63 | ) | | | (3.20 | ) | | | (4.75 | ) | | | (5.88 | ) |
| Total Distributions | | | — | | | | (0.78 | ) | | | (4.63 | ) | | | (3.20 | ) | | | (4.75 | ) | | | (5.88 | ) |
| Net Asset Value, End of Period/Year | | $ | 56.06 | | | $ | 45.27 | | | $ | 69.06 | | | $ | 57.36 | | | $ | 42.83 | | | $ | 33.45 | |
| | | | | | | | | | | | | | | | | | | | | | | | | |
| Total Return | | | 23.86 | % | | | (33.34 | )% | | | 28.18 | % | | | 42.24 | % | | | 43.13 | % | | | (9.83 | )% |
| Net Assets, End of Period/Year (000’s) | | $ | 67,793 | | | $ | 58,441 | | | $ | 115,543 | | | $ | 58,046 | | | $ | 44,959 | | | $ | 29,149 | |
| Ratios/Supplemental Data | | | | | | | | | | | | | | | | | | | | | | | | |
| Ratio of Net Expenses to Average Net Assets | | | 1.40 | % | | | 1.40 | % | | | 1.40 | % | | | 1.40 | % | | | 1.43 | % | | | 2.21 | % |
| Ratio of Net Expenses to Average Net Assets | | | | | | | | | | | | | | | | | | | | | | | | |
| (before interest and dividend expense) | | | 1.40 | %(1) | | | 1.40 | % | | | 1.40 | % | | | 1.40 | % | | | 1.40 | % | | | 1.40 | % |
| Ratio of Total Expenses to | | | | | | | | | | | | | | | | | | | | | | | | |
| Average Net Assets (before waiver | | | | | | | | | | | | | | | | | | | | | | | | |
| and reimbursement of expenses) | | | 1.52 | % | | | 1.58 | % | | | 1.50 | % | | | 1.58 | % | | | 1.73 | % | | | 2.48 | % |
| Ratio of Net Investment Loss | | | | | | | | | | | | | | | | | | | | | | | | |
| to Average Net Assets | | | (0.74 | )% | | | (0.90 | )% | | | (1.02 | )% | | | (0.77 | )% | | | (0.65 | )% | | | (1.52 | )% |
| Ratio of Net Investment Loss to | | | | | | | | | | | | | | | | | | | | | | | | |
| Average Net Assets (before waivers | | | | | | | | | | | | | | | | | | | | | | | | |
| and reimbursements of expenses) | | | (0.86 | )% | | | (1.08 | )% | | | (1.12 | )% | | | (0.96 | )% | | | (0.95 | )% | | | (1.79 | )% |
| Portfolio turnover rate | | | 10 | % | | | 14 | % | | | 15 | % | | | 15 | % | | | 13 | % | | | 8 | % |
(1) | The Adviser has contractually agreed to waive its fee and, if necessary, reimburse the Fund until May 1, 2024 to the extent Total Annual Fund Operating Expenses exceed 1.40% of the average daily net assets of the Institutional Class shares of the Fund. |
See accompanying notes to financial statements.
Semi-Annual Report 2023
Needham Aggressive Growth Fund
Financial Highlights
| | | Retail Class | |
| | | Six Months | | | | | | | | | | | | | | | | |
| | | Ended | | | | | | | | | | | | | | | | |
| (For a Share Outstanding | | June 30, 2023 | | | Year Ended December 31 | |
| Throughout each Period/Year) | | (Unaudited) | | | 2022 | | | 2021 | | | 2020 | | | 2019 | | | 2018 | |
| Net Asset Value, Beginning of Period/Year | | $ | 29.40 | | | $ | 40.56 | | | $ | 31.58 | | | $ | 21.77 | | | $ | 16.86 | | | $ | 23.07 | |
| Investment Operations | | | | | | | | | | | | | | | | | | | | | | | | |
| Net Investment Loss | | | (0.19 | ) | | | (0.43 | ) | | | (0.59 | ) | | | (0.37 | ) | | | (0.30 | ) | | | (0.54 | ) |
| Net Realized and Unrealized | | | | | | | | | | | | | | | | | | | | | | | | |
| Gain (Loss) on Investments | | | 8.23 | | | | (10.73 | ) | | | 12.45 | | | | 11.41 | | | | 7.53 | | | | (2.88 | ) |
| Total from Investment Operations | | | 8.04 | | | | (11.16 | ) | | | 11.86 | | | | 11.04 | | | | 7.23 | | | | (3.42 | ) |
| | | | | | | | | | | | | | | | | | | | | | | | | |
| Less Distributions | | | | | | | | | | | | | | | | | | | | | | | | |
| Net Realized Gains | | | — | | | | — | | | | (2.88 | ) | | | (1.23 | ) | | | (2.32 | ) | | | (2.79 | ) |
| Total Distributions | | | — | | | | — | | | | (2.88 | ) | | | (1.23 | ) | | | (2.32 | ) | | | (2.79 | ) |
| Net Asset Value, End of Period/Year | | $ | 37.44 | | | $ | 29.40 | | | $ | 40.56 | | | $ | 31.58 | | | $ | 21.77 | | | $ | 16.86 | |
| | | | | | | | | | | | | | | | | | | | | | | | | |
| Total Return | | | 27.31 | % | | | (27.53 | )% | | | 37.54 | % | | | 51.39 | % | | | 43.93 | % | | | (15.80 | )% |
| Net Assets, End of Period/Year (000’s) | | $ | 85,249 | | | $ | 55,027 | | | $ | 63,599 | | | $ | 40,258 | | | $ | 30,238 | | | $ | 27,119 | |
| Ratios/Supplemental Data | | | | | | | | | | | | | | | | | | | | | | | | |
| Ratio of Net Expenses to Average Net Assets | | | 1.81 | % | | | 1.85 | % | | | 1.86 | % | | | 1.95 | % | | | 2.02 | % | | | 2.91 | % |
| Ratio of Net Expenses to Average Net Assets | | | | | | | | | | | | | | | | | | | | | | | | |
| (before interest and dividend expense) | | | 1.81 | %(1) | | | 1.85 | % | | | 1.86 | % | | | 1.95 | % | | | 1.95 | % | | | 1.95 | % |
| Ratio of Total Expenses to | | | | | | | | | | | | | | | | | | | | | | | | |
| Average Net Assets (before waiver | | | | | | | | | | | | | | | | | | | | | | | | |
| and reimbursement of expenses) | | | 1.78 | % | | | 1.82 | % | | | 1.82 | % | | | 1.96 | % | | | 2.17 | % | | | 2.97 | % |
| Ratio of Net Investment Loss’ | | | | | | | | | | | | | | | | | | | | | | | | |
| to Average Net Assets | | | (1.23 | )% | | | (1.38 | )% | | | (1.62 | )% | | | (1.56 | )% | | | (1.46 | )% | | | (2.40 | )% |
| Ratio of Net Investment Loss to | | | | | | | | | | | | | | | | | | | | | | | | |
| Average Net Assets (before waivers | | | | | | | | | | | | | | | | | | | | | | | | |
| and reimbursements of expenses) | | | (1.19 | )% | | | (1.35 | )% | | | (1.59 | )% | | | (1.57 | )% | | | (1.61 | )% | | | (2.46 | )% |
| Portfolio turnover rate | | | 9 | % | | | 11 | % | | | 12 | % | | | 13 | % | | | 9 | % | | | 8 | % |
(1) | The Adviser has contractually agreed to waive its fee and, if necessary, reimburse the Fund until May 1, 2024 to the extent Total Annual Fund Operating Expenses exceed 1.85% of the average daily net assets of the Retail Class shares of the Fund. |
See accompanying notes to financial statements.
Needham Funds
Needham Aggressive Growth Fund
Financial Highlights
| | | | | | Institutional Class | |
| | | Six Months | | | | | | | | | | | | | | | | |
| | | Ended | | | | | | | | | | | | | | | | |
| (For a Share Outstanding | | June 30, 2023 | | | Year Ended December 31 | |
| Throughout each Period/Year) | | (Unaudited) | | | 2022 | | | 2021 | | | 2020 | | | 2019 | | | 2018 | |
| Net Asset Value, Beginning of Period/Year | | $ | 30.73 | | | $ | 42.11 | | | $ | 32.49 | | | $ | 22.23 | | | $ | 17.08 | | | $ | 23.21 | |
| Investment Operations | | | | | | | | | | | | | | | | | | | | | | | | |
| Net Investment Loss | | | (0.10 | ) | | | (0.23 | ) | | | (0.36 | ) | | | (0.22 | ) | | | (0.19 | ) | | | (0.42 | ) |
| Net Realized and Unrealized | | | | | | | | | | | | | | | | | | | | | | | | |
| Gain (Loss) on Investments | | | 8.58 | | | | (11.15 | ) | | | 12.86 | | | | 11.71 | | | | 7.66 | | | | (2.92 | ) |
| Total from Investment Operations | | | 8.48 | | | | (11.38 | ) | | | 12.50 | | | | 11.49 | | | | 7.47 | | | | (3.34 | ) |
| | | | | | | | | | | | | | | | | | | | | | | | | |
| Less Distributions | | | | | | | | | | | | | | | | | | | | | | | | |
| Net Realized Gains | | | — | | | | — | | | | (2.88 | ) | | | (1.23 | ) | | | (2.32 | ) | | | (2.79 | ) |
| Total Distributions | | | — | | | | — | | | | (2.88 | ) | | | (1.23 | ) | | | (2.32 | ) | | | (2.79 | ) |
| Net Asset Value, End of Period/Year | | $ | 39.21 | | | $ | 30.73 | | | $ | 42.11 | | | $ | 32.49 | | | $ | 22.23 | | | $ | 17.08 | |
| | | | | | | | | | | | | | | | | | | | | | | | | |
| Total Return | | | 27.60 | % | | | (27.02 | )% | | | 38.43 | % | | | 52.36 | % | | | 44.79 | % | | | (15.36 | )% |
| Net Assets, End of Period/Year (000’s) | | $ | 120,801 | | | $ | 79,891 | | | $ | 76,778 | | | $ | 34,132 | | | $ | 25,821 | | | $ | 13,478 | |
| Ratios/Supplemental Data | | | | | | | | | | | | | | | | | | | | | | | | |
| Ratio of Net Expenses to Average Net Assets | | | 1.18 | % | | | 1.18 | % | | | 1.18 | % | | | 1.33 | % | | | 1.46 | % | | | 2.35 | % |
| Ratio of Net Expenses to Average Net Assets | | | | | | | | | | | | | | | | | | | | | | | | |
| (before interest and dividend expense) | | | 1.18 | %(1) | | | 1.18 | % | | | 1.18 | % | | | 1.32 | % | | | 1.40 | % | | | 1.40 | % |
| Ratio of Total Expenses to | | | | | | | | | | | | | | | | | | | | | | | | |
| Average Net Assets (before waiver | | | | | | | | | | | | | | | | | | | | | | | | |
| and reimbursement of expenses) | | | 1.52 | % | | | 1.55 | % | | | 1.53 | % | | | 1.71 | % | | | 1.90 | % | | | 2.79 | % |
| Ratio of Net Investment Loss | | | | | | | | | | | | | | | | | | | | | | | | |
| to Average Net Assets | | | (0.60 | )% | | | (0.71 | )% | | | (0.95 | )% | | | (0.94 | )% | | | (0.90 | )% | | | (1.84 | )% |
| Ratio of Net Investment Loss to | | | | | | | | | | | | | | | | | | | | | | | | |
| Average Net Assets (before waivers | | | | | | | | | | | | | | | | | | | | | | | | |
| and reimbursements of expenses) | | | (0.94 | )% | | | (1.08 | )% | | | (1.30 | )% | | | (1.32 | )% | | | (1.34 | )% | | | (2.28 | )% |
| Portfolio turnover rate | | | 9 | % | | | 11 | % | | | 12 | % | | | 13 | % | | | 9 | % | | | 8 | % |
(1) | The Adviser has contractually agreed to waive its fee and, if necessary, reimburse the Fund until May 1, 2024 to the extent Total Annual Fund Operating Expenses exceed 1.18% of the average daily net assets of the Institutional Class shares of the Fund. |
See accompanying notes to financial statements.
Semi-Annual Report 2023
Needham Small Cap Growth Fund
Financial Highlights
| | | | | | Retail Class | |
| | | Six Months | | | | | | | | | | | | | | | | |
| | | Ended | | | | | | | | | | | | | | | | |
| (For a Share Outstanding | | June 30, 2023 | | | Year Ended December 31 | |
| Throughout each Period/Year) | | (Unaudited) | | | 2022 | | | 2021 | | | 2020 | | | 2019 | | | 2018 | |
| Net Asset Value, Beginning of Period/Year | | $ | 15.50 | | | $ | 23.19 | | | $ | 25.80 | | | $ | 17.59 | | | $ | 12.40 | | | $ | 15.67 | |
| Investment Operations | | | | | | | | | | | | | | | | | | | | | | | | |
| Net Investment Loss | | | (0.05 | ) | | | (0.26 | ) | | | (0.48 | ) | | | (0.32 | ) | | | (0.22 | ) | | | (0.19 | ) |
| Net Realized and Unrealized | | | | | | | | | | | | | | | | | | | | | | | | |
| Gain (Loss) on Investments | | | 0.48 | | | | (6.79 | ) | | | 3.69 | | | | 12.06 | | | | 6.89 | | | | (0.32 | ) |
| Total from Investment Operations | | | 0.43 | | | | (7.05 | ) | | | 3.21 | | | | 11.74 | | | | 6.67 | | | | (0.51 | ) |
| | | | | | | | | | | | | | | | | | | | | | | | | |
| Less Distributions | | | | | | | | | | | | | | | | | | | | | | | | |
| Net Realized Gains | | | — | | | | (0.64 | ) | | | (5.82 | ) | | | (3.53 | ) | | | (1.48 | ) | | | (2.76 | ) |
| Total Distributions | | | — | | | | (0.64 | ) | | | (5.82 | ) | | | (3.53 | ) | | | (1.48 | ) | | | (2.76 | ) |
| Net Asset Value, End of Period/Year | | $ | 15.93 | | | $ | 15.50 | | | $ | 23.19 | | | $ | 25.80 | | | $ | 17.59 | | | $ | 12.40 | |
| | | | | | | | | | | | | | | | | | | | | | | | | |
| Total Return | | | 2.77 | % | | | (30.33 | )% | | | 10.98 | % | | | 71.35 | % | | | 54.45 | % | | | (5.13 | )%(1) |
| Net Assets, End of Period/Year (000’s) | | $ | 55,489 | | | $ | 59,054 | | | $ | 112,830 | | | $ | 89,206 | | | $ | 85,521 | | | $ | 12,487 | |
| Ratios/Supplemental Data | | | | | | | | | | | | | | | | | | | | | | | | |
| Ratio of Net Expenses to Average Net Assets | | | 1.83 | % | | | 1.85 | % | | | 1.85 | % | | | 1.85 | % | | | 1.87 | % | | | 1.95 | % |
| Ratio of Net Expenses to Average Net Assets | | | | | | | | | | | | | | | | | | | | | | | | |
| (before interest and dividend expense) | | | 1.83 | %(2) | | | 1.85 | % | | | 1.85 | % | | | 1.85 | % | | | 1.87 | % | | | 1.95 | % |
| Ratio of Total Expenses to | | | | | | | | | | | | | | | | | | | | | | | | |
| Average Net Assets (before waiver | | | | | | | | | | | | | | | | | | | | | | | | |
| and reimbursement of expenses) | | | 1.86 | % | | | 1.86 | % | | | 1.83 | % | | | 1.80 | % | | | 2.07 | % | | | 2.19 | % |
| Ratio of Net Investment Loss | | | | | | | | | | | | | | | | | | | | | | | | |
| to Average Net Assets | | | (0.60 | )% | | | (1.47 | )% | | | (1.72 | )% | | | (1.64 | )% | | | (1.36 | )% | | | (1.20 | )% |
| Ratio of Net Investment Loss to | | | | | | | | | | | | | | | | | | | | | | | | |
| Average Net Assets (before waivers | | | | | | | | | | | | | | | | | | | | | | | | |
| and reimbursements of expenses) | | | (0.63 | )% | | | (1.48 | )% | | | (1.70 | )% | | | (1.59 | )% | | | (1.56 | )% | | | (1.44 | )% |
| Portfolio turnover rate | | | 137 | % | | | 109 | % | | | 133 | % | | | 191 | % | | | 136 | % | | | 103 | % |
(1) | The return reflects the actual performance for the year and does not include the impact of any adjustments made for financial reporting required by Generally Accepted Accounting Principles (GAAP). |
(2) | The Adviser has contractually agreed to waive its fee and, if necessary, reimburse the Fund until May 1, 2024 to the extent Total Annual Fund Operating Expenses exceed 1.85% of the average daily net assets of the Retail Class shares of the Fund. |
See accompanying notes to financial statements.
Needham Funds
Needham Small Cap Growth Fund
Financial Highlights
| | | | | | Institutional Class | |
| | | Six Months | | | | | | | | | | | | | | | | |
| | | Ended | | | | | | | | | | | | | | | | |
| (For a Share Outstanding | | June 30, 2023 | | | Year Ended December 31 | |
| Throughout each Period/Year) | | (Unaudited) | | | 2022 | | | 2021 | | | 2020 | | | 2019 | | | 2018 | |
| Net Asset Value, Beginning of Period/Year | | $ | 16.40 | | | $ | 24.32 | | | $ | 26.64 | | | $ | 17.96 | | | $ | 12.57 | | | $ | 15.76 | |
| Investment Operations | | | | | | | | | | | | | | | | | | | | | | | | |
| Net Investment Gain (Loss) | | | 0.01 | | | | (0.14 | ) | | | (0.31 | ) | | | (0.20 | ) | | | (0.12 | ) | | | (0.10 | ) |
| Net Realized and Unrealized | | | | | | | | | | | | | | | | | | | | | | | | |
| Gain (Loss) on Investments | | | 0.44 | | | | (7.14 | ) | | | 3.81 | | | | 12.41 | | | | 6.99 | | | | (0.33 | ) |
| Total from Investment Operations | | | 0.45 | | | | (7.28 | ) | | | 3.50 | | | | 12.21 | | | | 6.87 | | | | (0.43 | ) |
| | | | | | | | | | | | | | | | | | | | | | | | | |
| Less Distributions | | | | | | | | | | | | | | | | | | | | | | | | |
| Net Realized Gains | | | — | | | | (0.64 | ) | | | (5.82 | ) | | | (3.53 | ) | | | (1.48 | ) | | | (2.76 | ) |
| Total Distributions | | | — | | | | (0.64 | ) | | | (5.82 | ) | | | (3.53 | ) | | | (1.48 | ) | | | (2.76 | ) |
| Net Asset Value, End of Period/Year | | $ | 16.85 | | | $ | 16.40 | | | $ | 24.32 | | | $ | 26.64 | | | $ | 17.96 | | | $ | 12.57 | |
| | | | | | | | | | | | | | | | | | | | | | | | | |
| Total Return | | | 2.68 | % | | | (29.82 | )% | | | 11.74 | % | | | 72.51 | % | | | 55.31 | % | | | (4.58 | )%(1) |
| Net Assets, End of Period/Year (000’s) | | $ | 116,484 | | | $ | 137,578 | | | $ | 173,855 | | | $ | 127,943 | | | $ | 46,589 | | | $ | 12,168 | |
| Ratios/Supplemental Data | | | | | | | | | | | | | | | | | | | | | | | | |
| Ratio of Net Expenses to Average Net Assets | | | 1.18 | % | | | 1.18 | % | | | 1.18 | % | | | 1.18 | % | | | 1.22 | % | | | 1.40 | % |
| Ratio of Net Expenses to Average Net Assets | | | | | | | | | | | | | | | | | | | | | | | | |
| (before interest and dividend expense) | | | 1.18 | %(2) | | | 1.18 | % | | | 1.18 | % | | | 1.18 | % | | | 1.22 | % | | | 1.40 | % |
| Ratio of Total Expenses to | | | | | | | | | | | | | | | | | | | | | | | | |
| Average Net Assets (before waiver | | | | | | | | | | | | | | | | | | | | | | | | |
| and reimbursement of expenses) | | | 1.58 | % | | | 1.62 | % | | | 1.54 | % | | | 1.57 | % | | | 1.83 | % | | | 1.95 | % |
| Ratio of Net Investment Gain (Loss) | | | | | | | | | | | | | | | | | | | | | | | | |
| to Average Net Assets | | | 0.10 | % | | | (0.76 | )% | | | (1.04 | )% | | | (0.97 | )% | | | (0.72 | )% | | | (0.65 | )% |
| Ratio of Net Investment Loss to | | | | | | | | | | | | | | | | | | | | | | | | |
| Average Net Assets (before waivers | | | | | | | | | | | | | | | | | | | | | | | | |
| and reimbursements of expenses) | | | (0.30 | )% | | | (1.21 | )% | | | (1.40 | )% | | | (1.35 | )% | | | (1.33 | )% | | | (1.21 | )% |
| Portfolio turnover rate | | | 137 | % | | | 109 | % | | | 133 | % | | | 191 | % | | | 136 | % | | | 103 | % |
(1) | The return reflects the actual performance for the year and does not include the impact of any adjustments made for financial reporting required by Generally Accepted Accounting Principles (GAAP). |
(2) | The Adviser has contractually agreed to waive its fee and, if necessary, reimburse the Fund until May 1, 2024 to the extent Total Annual Fund Operating Expenses exceed 1.18% of the average daily net assets of the Institutional Class shares of the Fund. |
See accompanying notes to financial statements.
Semi-Annual Report 2023
Notes to Financial Statements
June 30, 2023 (Unaudited)
1. Organization
Needham Growth Fund (“NGF”), Needham Aggressive Growth Fund (“NAGF”) and Needham Small Cap Growth Fund (“NSCGF”) (each, a “Portfolio” and collectively, the “Portfolios”), are portfolios of The Needham Funds, Inc. (the “Company”), which is registered under the Investment Company Act of 1940, as amended (the “1940 Act”), as an open-end management investment company. The Portfolios are “diversified” for purposes of the 1940 Act. Please refer to the most recently filed Registration Statement and Statement of Additional Information for a detailed description of each Portfolio’s investment strategy. The Company was organized as a Maryland corporation on October 12, 1995. NGF, NAGF, and NSCGF each currently offer two classes, the Retail Class and the Institutional Class. The Institutional Class of each Portfolio commenced operations on December 30, 2016.
Each Portfolio is an investment company and accordingly follows the investment company accounting and reporting guidance of the Financial Accounting Standards Board (“FASB”) Accounting Standards Codification Topic 946 “Financial Services – Investment Companies.”
2. Class Specific Expenses
Class level expenses are allocated daily to each class of shares based upon the ratio of net assets represented by each class as a percentage of the net assets of the Portfolio. Expenses deemed directly attributable to a class of shares are recorded by the specific class. Most Portfolio expenses are allocated by class based on relative net assets. Distribution Fees incurred in connection with the Company’s Amended and Restated Plan of Distribution Pursuant to Rule 12b-1 are expensed at 0.25% of average daily net assets of the Retail Class shares, and the specific amounts are detailed in Note 5.
3. Significant Accounting Policies
The following is a summary of significant accounting policies followed by the Company in the preparation of its financial statements. These policies are in conformity with accounting principles generally accepted in the United States of America (“GAAP”).
Security Valuation: Portfolio securities for which market quotations are readily available are stated at the last reported sale price reported by the principal exchange for the security as of the exchange’s close of business. Securities for which no sale has taken place during the day and securities which are not listed on an exchange are valued at the mean of the highest closing bid and lowest asked prices. Exchange traded options are valued at the last reported sale price on any exchange on which the option is principally traded. If no sales are reported on a particular day, the options will be valued at the mean between the highest closing bid and lowest asked prices across the exchanges where the option is traded. Non-exchange traded options will also be valued at the mean between the last bid and asked quotations. For options where market quotations are not readily available, value will be determined in accordance with the fair value procedures described below. All other securities and assets for which (a) market quotations are not readily available, such as in the case of a market or technical disruption that prevents the normal trading of a security held by a Portfolio, (b) market quotations are believed to be unrepresentative of fair market value, such as in the case of a thinly traded security, or (c) valuation is normally made at the last sale price on a foreign exchange and a significant event occurs after the close of that exchange but before the New York Stock Exchange closes, are valued at their fair value as determined in good faith by the Company’s Valuation Designee in accordance with Fair Value Procedures. The Company’s Fair Value Procedures are implemented and monitored by a Fair Value Committee (the “Committee”) established by the Valuation Designee. The Company’s Board of Directors (the “Board”) has designated the Portfolios’ investment adviser as the Company’s Valuation Designee.
When a security is valued in accordance with the Fair Value Procedures, the Committee determines a value after taking into consideration any relevant information that is reasonably available to the Committee. Some of the more common reasons that may necessitate that a security be valued pursuant to these Fair Value Procedures include, but are not limited to: the security’s trading has been halted or suspended; the security has been delisted from a national exchange; the security’s primary trading market is temporarily closed at a time when under normal conditions it would be open; or the security’s primary pricing source is not able or willing to provide a price. The securities of each Portfolio may also be valued on the basis of valuations provided by a pricing service approved by, or on behalf of, the Board.
Portfolio securities listed or traded on securities exchanges, including American Depositary Receipts (“ADRs”), are valued at the closing price on the exchange or system where the security is principally traded or at the NASDAQ Official Closing Price. If there have been no sales for that day on the exchange or system, a security is valued at the mean of the highest closing bid and lowest asked prices on the exchange or system where the security is principally traded.
Investment Transactions: Changes in holdings of portfolio securities for the Portfolios shall be reflected no later than in the first calculation on the first business day following the trade date for purposes of calculating each Portfolio’s daily net asset value per share. However, for financial reporting purposes, portfolio security transactions are reported on the trade date of the last business day of the reporting period. The cost (proceeds) of investments sold (bought to cover) is determined on a specific identification basis for the purpose of determining gains or losses on sales and buys to cover short positions. Dividend income, distributions to shareholders and dividend expense from securities sold short are recorded on the ex-dividend date. Interest income and interest expense from securities sold short is recorded on an accrual basis.
Needham Funds
Notes to Financial Statements (Continued)
June 30, 2023 (Unaudited)
Foreign Currency: Foreign currency amounts are translated into U.S. dollars as follows: (i) assets and liabilities at the rate of exchange at the end of the respective period; and (ii) purchases and sales of securities and income and expenses at the rate of exchange prevailing on the dates of such transactions. The portion of realized/unrealized gains (losses) arising from changes in the exchange rates are included with the net realized/unrealized gain (loss) from affiliated and unaffiliated securities, securities sold short and foreign currency translations. Principal risks associated with such transactions include the movement in value of the foreign currency relative to the U.S. dollar and the ability of the counterparty to perform.
The Portfolios may also invest in forward currency contracts. Fluctuations in the value of such forward currency transactions are recorded daily as unrealized gain or loss; realized gain or loss includes net gain or loss on transactions that have terminated by settlement. These instruments involve securities and currency market risk, credit risk, or both kinds of risks, in excess of the amount recognized in the statements of assets and liabilities. Risks also arise from the possible inability of counterparties to meet the terms of their contracts. The Portfolios did not enter into forward currency contracts during the period ended June 30, 2023.
Allocation of Expenses: Expenses directly attributable to a Portfolio are charged directly to that Portfolio, while expenses which are attributable to more than one Portfolio are allocated among the respective Portfolios based upon relative net assets or some other reasonable method.
Use of Estimates: The preparation of financial statements in conformity with GAAP requires management to make estimates and assumptions that affect the reported amounts of assets and liabilities and disclosure of contingent assets and liabilities at the date of the financial statements and the reported amounts of increases and decreases in net assets from operations during the reporting period.
Actual results could differ from those estimates.
Distributions to Shareholders: Dividends from net investment income, if any, are declared and paid annually for the Portfolios. Distributable net realized gains, if any, are declared and distributed at least annually.
Federal Income Taxes: It is the policy of each Portfolio to continue to qualify as a regulated investment company, as defined in the Internal Revenue Code, by complying with the provisions available to certain investment companies and to make distributions of net investment income and net realized capital gains sufficient to relieve it from all, or substantially all, federal income taxes. Accordingly, no provision for income taxes has been made in the Portfolios’ financial statements.
As of December 31, 2022, the Portfolios did not have any tax positions that did not meet the “more-likely-than-not” threshold of being sustained by the applicable tax authority. Open tax years are those that are open for exam by Federal and state taxing authorities. As of December 31, 2022, open Federal and New York tax years include the tax years ended December 31, 2019 through December 31, 2022. The Portfolios have no tax examinations in progress.
Fair Value Measurements: Valuation inputs used to determine the value of the Portfolios’ investments are summarized in the three broad levels listed below:
| | Level 1 — | Unadjusted quoted prices in active markets for identical assets and liabilities that the Portfolios have the ability to access. |
| | | |
| | Level 2 — | Observable inputs other than quoted prices included in Level 1 that are observable for the asset or liability, either directly or indirectly. These inputs may include quoted prices for the identical instrument in an inactive market, prices for similar instruments, interest rates, prepayment speeds, credit risk, yield curves, default rates and similar data. |
| | | |
| | Level 3 — | Unobservable inputs for the asset or liability, to the extent relevant observable inputs are not available, representing the Portfolios’ own assumptions about the assumptions a market participant would use in valuing the asset or liability, and would be based on the best information available. |
The inputs or methodology used to value securities are not necessarily an indication of the risk associated with investing in those securities.
Portfolio securities listed or traded on securities exchanges, including ADRs, are valued at the closing price on the exchange or system where the security is principally traded or at the NASDAQ Official Closing Price. If there have been no sales for that day on the exchange or system, a security is valued at the mean of the highest closing bid and lowest asked prices on the exchange or system where the security is principally traded. These valuations are typically categorized as Level 1 in the fair value hierarchy.
Fair value pricing may be used if events materially affecting the value of foreign securities occur between the times the exchange on which they are traded closes and the time the Portfolios’ net asset values are calculated. These valuations are categorized as Level 2 in the fair value hierarchy.
Semi-Annual Report 2023
Notes to Financial Statements (Continued)
June 30, 2023 (Unaudited)
The following is a summary categorization, as of June 30, 2023, of each Portfolio’s investments based on the level of inputs utilized in determining the value of such investments:
| Needham Growth Fund | | | | | | | | | | | | |
| | | | | | | | | | | | | |
Assets(1) | | Level 1 | | | Level 2 | | | Level 3 | | | Total | |
| Common Stocks | | $ | 138,771,276 | | | $ | — | | | $ | — | | | $ | 138,771,276 | |
| Short-Term Investments | | | 2,593,825 | | | | — | | | | — | | | | 2,593,825 | |
| Total | | $ | 141,365,101 | | | $ | — | | | $ | — | | | $ | 141,365,101 | |
| | | | | | | | | | | | | |
Liabilities(2) | | Level 1 | | | Level 2 | | | Level 3 | | | Total | |
| Securities Sold Short | | $ | 845,385 | | | $ | — | | | $ | — | | | $ | 845,385 | |
| Total | | $ | 845,385 | | | $ | — | | | $ | — | | | $ | 845,385 | |
| | | | | | | | | | | | | | | | | |
| Needham Aggressive Growth Fund | | | | | | | | | | | | | | | | |
| | | | | | | | | | | | | |
Assets(1) | | Level 1 | | | Level 2 | | | Level 3 | | | Total | |
| Common Stocks | | $ | 180,730,935 | | | $ | — | | | $ | — | | | $ | 180,730,935 | |
| Short-Term Investments | | | 22,188,378 | | | | — | | | | — | | | | 22,188,378 | |
| Total | | $ | 202,919,313 | | | $ | — | | | $ | — | | | $ | 202,919,313 | |
| | | | | | | | | | | | | | | | | |
| Needham Small Cap Growth Fund | | | | | | | | | | | | | | | | |
| | | | | | | | | | | | | |
Assets(1) | | Level 1 | | | Level 2 | | | Level 3 | | | Total | |
| Common Stocks | | $ | 118,304,565 | | | $ | — | | | $ | — | | | $ | 118,304,565 | |
| Warrants | | | — | | | | — | | | | 46 | | | | 46 | |
| Short-Term Investments | | | 53,527,621 | | | | — | | | | — | | | | 53,527,621 | |
| Total | | $ | 171,832,186 | | | $ | — | | | $ | 46 | | | $ | 171,832,232 | |
| | | | | | | | | | | | | |
Liabilities(2) | | Level 1 | | | Level 2 | | | Level 3 | | | Total | |
| Securities Sold Short | | $ | 3,168,800 | | | $ | — | | | $ | — | | | $ | 3,168,800 | |
| Total | | $ | 3,168,800 | | | $ | — | | | $ | — | | | $ | 3,168,800 | |
(1) | Please refer to the Schedule of Investments to view segregation by industry. |
(2) | Please refer to the Schedule of Securities Sold Short to view segregation by industry. |
4. Investment Advisory and Administrative Services
The Company has engaged Needham Investment Management L.L.C. (the “Adviser”) to manage its investments pursuant to an Investment Advisory Agreement. The Company pays the Adviser an investment advisory fee at the annual rate of 1.25% of the average daily net assets of each Portfolio.
The Adviser has entered into an agreement with the Company (the “Expense Limitation Agreement”) whereby the Adviser has contractually agreed to waive its investment advisory fee for, and to reimburse expenses of, the Institutional Class and Retail Class shares of each Portfolio in an amount that limits annual operating expenses to not more than 1.40% and 1.95% for NGF, 1.18% and 1.85% for NAGF, and 1.18% and 1.85% for NSCGF, of the average daily net assets of the Portfolio’s Institutional Class and Retail Class, respectively (excluding taxes, interest, brokerage, dividends on short positions, acquired fund fees and expenses and extraordinary items, but including the investment advisory fee stated in the Investment Advisory Agreement). The Expense Limitation Agreement is effective for the period from April 27, 2023 through May 1, 2024. The Expense Limitation Agreement shall continue in effect from year to year thereafter only upon mutual agreement of the Company and the Adviser. Similar agreements were in effect for certain prior periods.
Any reimbursements or fee waivers made by the Adviser in respect of a Portfolio are subject to recoupment by the Adviser, to the extent that the Portfolio is able to make the repayment within the expense limitation established in the Expense Limitation Agreement. Under the Expense Limitation Agreement, the Adviser has a right to receive from each Portfolio class reimbursement for fee waivers and/or expense reimbursements made pursuant to the Agreement for a period of up to 36 months from the time of any waiver or reimbursement. The table below contains the amounts of fee waivers and expense reimbursements subject to recapture by the Adviser through December 31 of the period indicated:
| | | 2026 | | | 2025 | | | 2024 | | | 2023 | | | Total | |
| NGF (Retail Class) | | $ | — | | | $ | — | | | $ | — | | | $ | — | | | $ | — | |
| NGF (Institutional Class) | | | 36,197 | | | | 144,749 | | | | 76,378 | | | | 46,472 | | | | 303,796 | |
| NAGF (Retail Class) | | | 3,672 | | | | 53,347 | | | | — | | | | — | | | | 57,019 | |
| NAGF (Institutional Class) | | | 149,838 | | | | 307,532 | | | | 163,479 | | | | 82,405 | | | | 703,254 | |
| NSCGF (Retail Class) | | | 22,918 | | | | 60,133 | | | | — | | | | — | | | | 83,051 | |
| NSCGF (Institutional Class) | | | 259,306 | | | | 597,068 | | | | 584,256 | | | | 161,950 | | | | 1,602,580 | |
Needham Funds
Notes to Financial Statements (Continued)
June 30, 2023 (Unaudited)
The Company and Fund Services (the “Administrator”) are parties to a Fund Administration Servicing Agreement. The Administrator provides administrative and fund accounting services pursuant to this agreement and, in consideration of these services, receives a fee computed daily and paid monthly at an annual rate based on a percentage of the value of each Portfolio’s assets. The Administrator is also compensated for any out of pocket expenses that are reasonably incurred in carrying out its duties under this agreement. The Administrator also provides transfer agent services pursuant to a Transfer Agent Servicing Agreement for additional fees.
Certain officers of the Company are also officers of the Adviser and/or Needham & Company, LLC (the “Distributor”), an affiliate of the Adviser. Such officers receive no fees from the Company for serving as officers of the Company. Each of the three Directors who is not an “interested person” (as defined in the 1940 Act) of the Company (each, an “Independent Director”) receives a quarterly retainer of $3,000 and a per-meeting fee of $500. Each Independent Director is also a member of the Audit Committee of the Board and receives a fee of $500 per meeting attended. An affiliate of the Adviser provides an employee to serve as Chief Compliance Officer for the Company and to provide certain related services. The affiliate pays the Chief Compliance Officer’s compensation for acting as such and the Company reimburses the affiliate for the Company’s allocated portion of the expense.
5. Distribution Plan and Brokerage Commissions
The Company has adopted an Amended and Restated Plan of Distribution pursuant to Rule 12b-1 under the 1940 Act. Under the Plan, each Portfolio may pay compensation to the Distributor or any other distributor or financial institution with which the Company has an agreement with respect to the Retail Class of each Portfolio, with the amount of such compensation not to exceed an annual rate of 0.25% of the daily average net assets of each Portfolio’s Retail Class shares. During the period ended June 30, 2023, NGF, NAGF, and NSCGF Retail Class shares incurred $81,287, $79,871, $74,293, respectively, pursuant to the Plan.
During the period ended June 30, 2023, NGF, NAGF and NSCGF incurred and paid brokerage commissions to the Distributor in the amount of $14,500, $33,977, and $105,997, respectively.
6. Temporary Borrowings
Each Portfolio may borrow from banks up to 25% of its total assets and may pledge its assets in connection with these borrowings, provided that no additional investments shall be made while borrowings exceed 5% of total assets.
The Portfolios did not engage in any temporary borrowings during the year ended June 30, 2023.
7. Short Sale Transactions
During the period ended June 30, 2023, NGF and NSCGF sold securities short. Upon selling a security short, the Portfolios record an asset for the settlement amount as “Deposit with Broker for Securities Sold Short” and a corresponding liability, which is marked-to- market to reflect current value. The broker for the Portfolios’ short sale transactions requires maintenance by each Portfolio of a minimum amount of collateral at all times, regardless of whether any short sales are outstanding. To the extent necessary to meet the broker’s collateral requirements for open short positions, additional securities will be segregated above the minimum to cover the short positions. At June 30, 2023, the market value of securities separately segregated to cover short positions was $4,537,835, $3,804,500, and $5,967,800 for NGF, NAGF and NSCGF, respectively.
Additionally, the Portfolios had receivables for Deposit with Broker for Securities Sold Short of $801,263, $231,702, and $2,504,805 pledged as collateral with a broker in connection with any open short positions for NGF, NAGF, and NSCGF, respectively as of June 30, 2023. NGF and NSCGF held securities sold short as of June 30, 2023. NAGF did not hold any securities sold short as of June 30, 2023.
8. Investment Transactions
The following summarizes the aggregate amount of the cost of purchases and proceeds from sales of investment securities and securities sold short, excluding short-term securities, during the period ended June 30, 2023:
| | | Purchases | | | Sales | |
| NGF | | | | | | |
| Long Transactions | | $ | 5,328,947 | | | $ | 9,592,468 | |
| Short Sale Transactions | | | 1,505,224 | | | | 692,414 | |
| NAGF | | | | | | | | |
| Long Transactions | | | 18,861,338 | | | | 2,551,526 | |
| Short Sale Transactions | | | 130,698 | | | | 148,219 | |
| NSCGF | | | | | | | | |
| Long Transactions | | | 95,540,008 | | | | 146,842,945 | |
| Short Sale Transactions | | | 6,245,574 | | | | 3,076,286 | |
Semi-Annual Report 2023
Notes to Financial Statements (Continued)
June 30, 2023 (Unaudited)
9. Financial Instruments With Off-Balance Sheet Risk
In the normal course of their business, the Portfolios may engage in transactions with off-balance sheet risk, including securities sold short, written options, futures, and forward currency contracts. Transactions in certain financial instruments represent future commitments to purchase or sell other financial instruments at specific terms at specified future dates. Each of these financial instruments contains varying degrees of off-balance sheet risk whereby changes in the market values of the securities underlying the financial instruments may be in excess of the amounts recognized in the financial statements.
Securities sold short represent obligations of the Portfolios to make future delivery of specific securities and, correspondingly, create an obligation to purchase the securities at market prices prevailing at a later delivery date (or to deliver the securities if already owned by the Portfolios). As a result, short sales create the risk that the Portfolios’ ultimate obligation to satisfy the delivery requirements may exceed the amount of the proceeds initially received on the liability recorded in the financial statements.
10. Indemnification
Under the Company’s organizational documents, the Company’s Directors and Officers are indemnified against certain liabilities arising out of the performance of their duties to the Company. In addition, in the ordinary course of business, the Company enters into contracts that contain a variety of indemnifications. The Company’s maximum exposure under these arrangements is unknown.
However, the Company has not had prior claims or losses pursuant to these contracts and expects the risk of loss to be remote.
11. Transactions with Affiliates
NAGF owned 5% or more of the voting securities of the following companies during the period ended June 30, 2023. As a result, each of these companies is deemed to be an “affiliated person” (as defined in the 1940 Act) of NAGF (and the other Portfolios). Transactions during the year in affiliated companies were as follows:
| | | | | | | | Net Change | | Net | | | | | | | |
| | Value at | | | | | | in Unrealized | | Realized | | | | | | Share | |
| | January 1, | | Value of | | Value of | | Appreciation | | Gains | | Dividend | | Value at | | Balance | |
Security Name | 2023 | | Purchases | | Sales | | (Depreciation) | | (Losses) | | Income | | June 30, 2023 | | June 30, 2023 | |
| Educational | | | | | | | | | | | | | | | | |
| �� Development Corp. | | $ | 1,264,000 | | | $ | 232,891 | | | $ | — | | | $ | (931,641 | ) | | $ | — | | | $ | — | | | $ | 565,250 | | | | 475,000 | |
| GSE Systems, Inc. | | | 1,080,000 | | | | — | | | | (42,770 | ) | | | (369,818 | ) | | | (152,612 | ) | | | — | | | | 514,800 | | | | 1,430,000 | |
| | | $ | 2,344,000 | | | $ | 232,891 | | | $ | (42,770 | ) | | $ | (1,301,459 | ) | | $ | (152,612 | ) | | $ | — | | | $ | 1,080,050 | * | | | | |
| * | The value of these securities agrees to the Investments in Affiliated Securities, at Value in the Statements of Assets and Liabilities. |
NSCGF owned 5% or more of the voting securities of the following company during the period ended June 30, 2023. As a result, this company is deemed to be an “affiliated person” (as defined in the 1940 Act) of NSCGF (and the other Portfolios). Transactions during the year in this affiliated company were as follows:
| | | | | | | | Net Change | | Net | | | | | | | | |
| | Value at | | | | | | in Unrealized | | Realized | | | | | | Share | | |
| | January 1, | | Value of | | Value of | | Appreciation | | Gains | | Dividend | | Value at | | Balance | | |
Security Name | 2023 | | Purchases | | Sales | | (Depreciation) | | (Losses) | | Income | | June 30, 2023 | | June 30, 2023 | | |
| Frequency | | | | | | | | | | | | | | | | | |
| Electronics, Inc. | $4,018,500 | | $— | | $(168,002) | | $380,817 | | $(53,415) | | $(570,000) | | $3,607,900* | | 545,000 | | |
| * | The value of this security agrees to the Investments in Affiliated Securities, at Value in the Statements of Assets and Liabilities. |
12. Federal Income Taxes
No provision for federal income taxes is required since the Company intends to continue to qualify as a regulated investment company under Subchapter M of the Internal Revenue Code and distribute substantially all of its taxable income and capital gains to shareholders. Because income tax regulations differ from GAAP, the timing and character of income and capital gain distributions determined in accordance with tax regulations can differ from income and capital gains recognized for financial reporting purposes. Accordingly, the character of distributions and the composition of net assets for tax purposes can differ from those reflected in the financial statements. These book/tax differences may be temporary or permanent in nature. Temporary differences are generally due to differing book and tax treatment for the timing of the recognition of gains and losses on securities, including post-October losses (as described below). Permanent differences are generally due to differing treatment of net investment losses and distributions paid in
Needham Funds
Notes to Financial Statements (Continued)
June 30, 2023 (Unaudited)
connection with redemptions. To the extent these differences are permanent, they are charged or credited to paid-in capital or distributable earnings, as appropriate, in the period in which the differences arise. These reclassifications have no effect on net assets or net asset value per share of each Portfolio. For the year ended December 31, 2022, the following table shows the reclassifications made:
| | | Distributable Earnings/ | | | Paid In | |
| | | (Accumulated Deficit) | | | Capital | |
| NGF | | $ | 1,622,788 | | | $ | (1,622,788 | ) |
| NAGF | | | 129,764 | | | | (129,764 | ) |
| NSCGF | | | 2,102,105 | | | | (2,102,105 | ) |
As of December 31, 2022, the cost, gross unrealized appreciation, gross unrealized depreciation, and the net unrealized appreciation (depreciation) on securities, including proceeds from securities sold short for federal income tax purposes, were as follows:
| | | | | | Gross | | | Gross | | | Net Unrealized | |
| | | | | | Unrealized | | | Unrealized | | | Appreciation | |
| | | Cost | | | Appreciation | | | Depreciation | | | (Depreciation) | |
| NGF | | $ | 61,194,146 | | | $ | 66,030,323 | | | $ | (6,743,445 | ) | | $ | 59,286,878 | |
| NAGF | | | 107,939,709 | | | | 46,599,665 | | | | (20,340,321 | ) | | | 26,259,344 | |
| NSCGF | | | 245,694,671 | | | | 10,681,009 | | | | (54,685,861 | ) | | | (44,004,852 | ) |
The difference between the tax cost of investments and the cost of investments for GAAP purposes is primarily due to the tax treatment for wash sale losses and as it relates to NAGF Passive Foreign Investment Company income.
As of December 31, 2022, the components of distributable earnings (loss) on a tax basis were as follows:
| | | NGF | | | NAGF | | | NSCGF | |
| Undistributed ordinary income | | $ | — | | | $ | — | | | $ | — | |
| Undistributed long-term capital gains | | | — | | | | — | | | | — | |
| Other accumulated appreciation (depreciation) | | | (580,439 | ) | | | — | | | | (38,525,187 | ) |
| Unrealized appreciation (depreciation) | | | 59,286,878 | | | | 26,259,344 | | | | (44,004,852 | ) |
| Total accumulated earnings (loss) | | $ | 58,706,439 | | | $ | 26,259,344 | | | $ | (82,530,039 | ) |
The tax character of distributions paid during the year ended December 31, 2022 was as follows:
| | | NGF | | | NAGF | | | NSCGF | |
| Ordinary income | | $ | 10,444 | | | $ | — | | | $ | 988,562 | |
| Net long-term capital gains | | | 2,110,267 | | | | — | | | | 6,491,190 | |
| Total distributions paid | | $ | 2,120,711 | | | $ | — | | | $ | 7,479,752 | |
As of December 31, 2022, the Portfolios had accumulated capital loss carryovers of:
| | | Capital Loss | | | Capital Loss | | | | |
| | | Carryover ST | | | Carryover LT | | | Expires | |
| NGF | | $ | (580,439 | ) | | $ | — | | | Indefinite | |
| NAGF | | | — | | | | — | | | N/A | |
| NSCG | | | (25,474,824 | ) | | | (13,050,363 | ) | | Indefinite | |
Under current tax law, capital and currency losses realized after October 31 of a Portfolio’s fiscal year may be deferred and treated as occurring on the first business day of the following fiscal year for tax purposes. For the year ended December 31, 2022, the Portfolios had no such losses to defer.
13. Subsequent Events
Management has evaluated subsequent events through the date the financial statements were issued. This evaluation did not result in any subsequent events that necessitated recognition or disclosures.
Semi-Annual Report 2023
Supplementary Information (Unaudited)
June 30, 2023
Disclosure of Portfolio Holdings
Each Portfolio files its complete schedule of portfolio holdings with the Securities and Exchange Commission (“SEC”) for the first and third quarters of each fiscal year as an exhibit to its reports on Form N-PORT. For the Portfolios, this would be for the fiscal quarters ending March 31 and September 30. Each Portfolio’s Form N-PORT reports are available without charge, upon request, by calling 800-625-7071 or on the SEC’s website at http://www.sec.gov.
Voting Proxies on Company Portfolio Securities
A description of the policies and procedures that the Company uses to determine how to vote proxies relating to portfolio securities and information regarding how the Company voted proxies relating to portfolio securities during the most recent 12-month period ended June 30 are available without charge, upon request, by calling 800-625-7071 or on the SEC’s website at http://www.sec.gov.
Household Delivery of Shareholder Documents
To reduce expenses, the Company may mail only one copy of the Portfolios’ prospectuses, proxy statements, information statements, and each annual and semi-annual report to those addresses shared by two or more accounts. If you wish to receive individual copies of these documents, please call the Portfolios at 1-800-625-7071 or contact your financial institution. You will begin receiving individual copies thirty days after receiving your request.
Index Disclaimer
The Portfolios have been developed solely by the Adviser. The Portfolios are not in any way connected to or sponsored, endorsed, sold or promoted by the London Stock Exchange Group plc and its group undertakings (collectively, the “LSE Group”). FTSE Russell is a trading name of certain of the LSE Group companies.
All rights in the Russell 2000 Index and the Russell 3000 Index (together, the “Indexes”) vest in the relevant LSE Group company which owns the Index. “Russell®” is a trade mark of the relevant LSE Group company and is used by any other LSE Group company under license. The Indexes are calculated by or on behalf of FTSE International Limited or its affiliate, agent or partner. The LSE Group does not accept any liability whatsoever to any person arising out of (a) the use of, reliance on or any error in the Indexes or (b) investment in or operation of the Portfolios. The LSE Group makes no claim, prediction, warranty or representation either as to the results to be obtained from the Portfolios or the suitability of the Indexes for the purpose to which it is being put by the Adviser.
The source of the data for each of the Indexes is the LSE Group. © LSE Group 2021. All rights in the Indexes or data vest in the relevant LSE Group company which owns the Index or the data. Neither LSE Group nor its licensors accept any liability for any errors or omissions in the Indexes or data and no party may rely on any Indexes or data contained in this communication. No further distribution of data from the LSE Group is permitted without the relevant LSE Group company’s express written consent. The LSE Group does not promote, sponsor or endorse the content of this communication.
(This Page Intentionally Left Blank.)
250 Park Avenue, 10th Floor
New York, New York 10177
1-800-625-7071
Investment Adviser:
Needham Investment Management L.L.C.
250 Park Avenue, 10th Floor
New York, New York 10177
President
George A. Needham
Executive Vice Presidents and Portfolio Managers
John Barr
Needham Growth Fund
Needham Aggressive Growth Fund
Chris Retzler
Needham Growth Fund
Needham Small Cap Growth Fund
Directors
George A. Needham
John W. Larson
David T. Shukis
F. Randall Smith
Distributor:
Needham & Company, LLC
250 Park Avenue, 10th Floor
New York, New York 10177
212-371-8300
Administrator, Shareholder Servicing Agent, and Transfer Agent:
U.S. Bancorp Fund Services, LLC,
doing business as U.S. Bank Global Fund Services
615 East Michigan Street
Milwaukee, WI 53202
Custodian:
U.S. Bank, N.A.
1555 North RiverCenter Drive
Milwaukee, WI 53212
Counsel:
Proskauer Rose LLP
Eleven Times Square
New York, NY 10036-8299
Independent Registered Public Accounting Firm:
RSM US LLP
80 City Square
Boston, MA 02129