Semi-Annual
Report
Needham Funds
Seeking to build wealth for long-term investors.
June 30, 2020
Needham Growth Fund
Needham Aggressive Growth Fund
Needham Small Cap Growth Fund
www.needhamfunds.com
Beginning on January 1, 2021, as permitted by regulations adopted by the Securities and Exchange Commission, paper copies of the Funds’ shareholder reports will no longer be sent by mail, unless you specifically request paper copies of the reports from the Funds or from your financial intermediary, such as a broker-dealer or bank. Instead, the reports will be made available on a website, and you will be notified by mail each time a report is posted and provided with a website link to access the report.
If you already elected to receive shareholder reports electronically, you will not be affected by this change and you need not take any action. You may elect to receive shareholder reports and other communications electronically from the Funds by calling 1-800-625-7071 or by contacting your financial intermediary (such as a broker-dealer or bank).
You may elect to receive all future reports in paper free of charge. You can request to continue receiving paper copies of your shareholder reports by contacting your financial intermediary or, if you invest directly with a Fund, calling 1-800-625-7071 to let the Fund know of your request. Your election to receive in paper will apply to all funds held in your account.
250 Park Avenue, 10th Floor
New York, New York 10177
1-800-625-7071
www.needhamfunds.com
Semi-Annual Report
June 30, 2020
Contents
| Letter from the Adviser | 1 |
| Portfolio Characteristics | |
| Needham Growth Fund | 10 |
| Needham Aggressive Growth Fund | 14 |
| Needham Small Cap Growth Fund | 16 |
| Disclosure of Fund Expenses | 18 |
| Schedules of Investments | |
| Needham Growth Fund | 20 |
| Needham Aggressive Growth Fund | 25 |
| Needham Small Cap Growth Fund | 30 |
| Schedules of Securities Sold Short | |
| Needham Growth Fund | 24 |
| Needham Aggressive Growth Fund | 29 |
| Needham Small Cap Growth Fund | 33 |
| Statements of Assets and Liabilities | 34 |
| Statements of Operations | 36 |
| Statements of Changes in Net Assets | 37 |
| Financial Highlights | |
| Needham Growth Fund | 40 |
| Needham Aggressive Growth Fund | 42 |
| Needham Small Cap Growth Fund | 44 |
| Notes to Financial Statements | 46 |
| Supplementary Information | 56 |
This report is authorized for distribution to prospective investors only when preceded or accompanied by a current prospectus. The prospectus contains more complete information, including investment objectives, risks, expenses and charges and should be read carefully before investing or sending any money. To obtain a prospectus or summary prospectus, please call 1-800-625-7071.
Portfolios of The Needham Funds, Inc., like all mutual funds:
| | • | Are NOT FDIC insured |
| | • | Have no bank guarantee |
| | • | May lose value |
The Needham Funds, Inc. are distributed by Needham & Company, LLC.
Semi-Annual Report 2020
| 250 Park Avenue, 10th Floor |
| New York, NY 10177 |
| | (800) 625-7071 |
| | www.needhamfunds.com |
August 2020
Dear Shareholders, Friends of Needham, and Prospective Shareholders,
We are pleased to report Needham Funds’ results for the half-year ended June 30, 2020. Our mission is to create wealth for long-term investors and the first half of 2020 was another step forward despite an unprecedented economic and social background. All three Needham Funds outperformed the Russell 2000 Index and the S&P 500 Index for the half-year.
Macroeconomic and Market Commentary
Entering the year, we anticipated strategic progress and growth from our portfolio companies. That all changed with COVID-19. From late February until March 23, the S&P 500 declined 34%, its largest drop in history. It was one of the worst quarters in the recorded history of the United States’ markets, and, in April 2020, the S&P 500 posted its best month since January 1987.
Along with the stock market performance, the monetary and fiscal policy responses to COVID-19 were unprecedented. The Federal Reserve announced an unlimited bond-buying program. These bonds included high-yield ETFs, bonds rated investment grade before the crisis, small business loans, municipals, asset-backed securities, collateralized loan obligations and commercial mortgage-backed securities. The fiscal response included the CARES Act with over $2 trillion of grants and loans to all kinds of businesses, including airlines, hospitals and small businesses, payments to state and local governments, and a $1,200 direct payment to some individuals. We believe these policy responses contributed to the strong performance of equities.
Company earnings for the March quarter were as expected. Business in the U.S. was strong until shelter-in-place restrictions went into effect in mid-March. Although most companies followed the legalistic path of withdrawing guidance, their commentaries on second quarter revenue and bookings was much better than we expected.
In April, Needham Funds recovered nearly all of their entire first quarter declines. April unemployment was 14.7%, the worst since an estimated 24.9% in the Great Depression.
May was another strong month for Needham Funds and the market. We believe the monetary and fiscal stimulus was a contributor to the positive month. May unemployment improved to 13.3%. June was another positive month for Needham Funds and the markets as more states began to open their economies.
In early June, the Federal Reserve estimated second quarter GDP might drop a stunning 52.8%, following a 5.0% first quarter decline. In July, the U.S. Bureau of Economic Analysis published its first estimate of -32.8% GDP in the second quarter. Unemployment improved to 11.1% in June.
Needham Funds
Needham Funds’ Portfolio Overview & Opportunity in the Time of COVID-19
Some of the companies that have had reasonably positive outlooks and earnings so far in 2020 are involved with infrastructure build-out. This type of infrastructure is not what one typically thinks of as infrastructure. We see the beneficiaries as companies involved with the build-out of cloud data centers, communications, software-as-a service applications, technology-based manufacturing and life sciences research.
The ease with which much of the white-collar workforce has adapted to work from home is a testament to the communications infrastructure. In his book Digital Cathedrals, Mark Mills writes that the cloud is the first “foundationally new infrastructure in nearly a century.” Datacenters are the physical representations of this infrastructure. Mills states that we are still very early in the build-out of this infrastructure and even earlier in the applications and societal benefits it will bring. Many of our portfolio companies are directly involved with datacenter build-out and delivery of applications to users:
| | • | Equinix, Inc. (EQIX) is the premier data center company. Infinera Corporation (INFN), Pure Storage, Inc. (PSTG), Super Micro Computer Inc. (SMCI), Taiwan Semiconductor Manufacturing ADR (TSM) and Vicor Corporation (VICR) provide semiconductors and systems for computing and storage in data centers and communications equipment to connect data centers to the world. |
| | | |
| | • | Akamai Technologies Inc.’s (AKAM) and Limelight Networks’ (LLNW) distributed content delivery network and security services make delivery of data more efficient. |
| | | |
| | • | 8x8 Inc. (EGHT) and Vonage Holdings (VG) provide voice and data services to enterprises. |
| | | |
| | • | Appian Corporation (APPN), Everbridge, Inc. (EVBG) and Q2 Holdings, Inc. (QTWO) are SaaS providers. Pluralsight, Inc. (PS) provides a cloud-based learning platform. |
COVID-19 has also highlighted the risk of a concentrated supply chain. Manufacturing and pharmaceutical companies may look to build out capacity in the United States, Mexico and Canada to diversify supply chains and reduce transit routes. Our portfolio companies Aspen Aerogels, Inc. (ASPN), Clean Harbors, Inc. (CLH), IPG Photonics Corp. (IPGP), MKS Instruments Inc. (MKSI), National Instruments Corp. (NATI), and Vishay Precision Group, Inc. (VPG) could benefit from supply chain diversification.
We also see a build-out in scientific infrastructure used for life sciences research. Several of our portfolio companies supply equipment and consumables used for life sciences research, including Bruker Corp. (BRKR), Corning Inc. (GLW), Entegris Inc. (ENTG), MKS Instruments Inc. (MKSI), and Thermo Fisher Scientific, Inc. (TMO). CryoPort, Inc. (CYRX) supplies the cold-chain logistics to transport therapies and samples used for both research and treatment.
Readjustment to a post-COVID-19 world will be difficult. The unprecedented unemployment is the biggest issue. The economy has serious issues ahead for the travel, retail, entertainment, hospitality and other consumer-facing industries. Some of those industries may employ less people than before. Opportunities in the growing sectors require new skills for displaced workers. However, the second quarter provided a preview of elements of an optimistic future. We are hopeful.
Needham Growth Fund First Half 2020 Performance – John Barr, Chris Retzler, Co-Portfolio Managers
For the half year ended June 30, 2020, the Needham Growth Fund Institutional and Retail classes returned 6.47% and 6.19%, respectively. The Russell 2000 Index returned -12.98% and the S&P 500 Index returned -3.08%.
Vicor Corporation (VICR) was the leading contributor in the first half of 2020. Vicor makes small, modular power converters used in data centers, on servers and in cars and transportation systems. It has invested $400 million in new product development over the last decade. Vicor has worked with Alphabet’s Google (GOOGL) on its Open Compute data centers to distribute DC (direct current) power throughout the data center rather than go through the inefficient conversions to AC (alternating current) and back again to DC. Many artificial intelligence and machine learning applications require sophisticated power conversion and Vicor is uniquely positioned to meet these needs.
PDF Solutions, Inc. (PDFS) was another leading contributor in the first half. PDF’s results showed continued progress with its strategy of making Exensio, the semiconductor manufacturing industry standard big data platform. In its 1st quarter conference call, PDF discussed a multi-year, eight-figure Exensio agreement with a major semiconductor company. PDF’s stock traded down in early February when China was the center of the COVID-19 outbreak. PDF has an engineering team in Shanghai and generated 16% of revenue from China in 2019.
Gilead Sciences, Inc. (GILD), a 9-year holding of the Needham Growth Fund, was another top contributor for the half-year. In late January, Gilead’s remdesivir emerged as a leading therapeutic to treat COVID-19 patients. On May 1, the FDA issued an Emergency Use Authorization for remdesivir. On June 1, Gilead announced results from a Phase 3 study, which showed clinical improvement from a 5-day treatment regime of remdesivir.
Gilead donated its first 120,000 treatment courses of remdesivir. On June 29, the U.S. Department of Health and Human Services secured 500,000 treatment courses, nearly all of Gilead’s production through September 2020. Hospitals will pay no more than $3,200 per treatment course. Remdesivir could represent a $1-4 billion a year opportunity for Gilead. Gilead had $22 billion of revenue in 2019, so remdesivir would be a relatively small, but welcome addition.
On April 7, Gilead acquired Forty Seven, Inc. (FTSV) for $4.9 billion. Forty Seven’s lead product candidate is magrolimab, which is an anti-CD47 agent for treatment of bone marrow and blood cell cancers including MDS (myelodysplastic syndromes), AML (acute myeloid leukemia) and DLBCL (diffuse large B-cell lymphoma).
Entegris, Inc. (ENTG) was also a leading first half contributor. Entegris supplies filters and chemicals used in advanced semiconductor manufacturing processes. Over time, we believe that semiconductors will increase as a percentage of industrial output and that Entegris’ filtration and specialty materials products will grow even faster than the semiconductor industry.
KVH Industries, Inc. (KVHI) was the only significant detractor for the half-year. KVH’s first quarter results were in-line, but the company’s leisure marine business suffered due to COVID-19, growth initiatives were delayed and the stock price suffered. We remain positive about KVH’s AgilePlans, which provides connectivity-as-a-service to the maritime industry and bundles a satellite antenna, air time, and news, entertainment and training programming. KVH has continued to report positive AgilePlans subscription results.
The Fund’s largest new positions included ADTRAN, Inc. (ADTN), AXT, Inc. (AXTI), 8x8, Inc. (EGHT) and FirEeye, Inc. (FEYE). The Fund’s largest additions to existing positions were Aspen Aerogels Inc. (ASPN) and II-VI Incorporated (IIVI).
The Fund’s largest complete exits were Bill.com Holdings (BILL) over concern for its small business customer base and GenMark Diagnostics, Inc. (GNMK) on valuation after its COVID-19 testing success. Both investments were big winners. The Fund also reduced positions in some of the longer-term, larger holdings in the Fund, including Entegris, FormFactor, Inc. (FORM), PDF Solutions and Thermo Fisher Scientific, Inc. (TMO).
At June 30, 2020, the Fund’s top 10 positions were 55.63% of net assets. The Fund had 1.3% of net assets in cash and was short 0.8%. The Fund had an Active Share of 96.6% versus the Russell 2000 and trailing 12-month turnover was 18%.
Morningstar categorizes the Fund as Mid Cap Growth. Lipper categorizes it as Mid Cap Core. When you hold companies for 10-15 years, and they succeed, they grow to larger market cap categories. Our mission is to find companies that may be compounders over many years, independent of industry or market cap.
Needham Aggressive Growth Fund First Half 2020 Performance – John Barr, Portfolio Manager
For the half year ended June 30, 2020, the Needham Aggressive Growth Fund Institutional and Retail classes returned 12.96% and 12.68%, respectively. The Russell 2000 Index returned -12.98% and the S&P 500 Index returned -3.08%.
The Fund’s leading contributor in the first half was Alpha Pro Tech, Ltd. (APT), which manufactures disposable and protective apparel for health care and industrial markets, and weatherization products for the construction industry. I discovered the company on a trip to Toronto and the Fund first invested in 2018.
I was attracted by Alpha Pro Tech’s management, double-digit return on capital and robust balance sheet. Lloyd Hoffman, son of the company’s co-founder, has been at Alpha Pro Tech for 30 years and has been CEO for the last four years. The company has been profitable every year since 1997.
Alpha Pro Tech is one of only a few companies with N-95 mask manufacturing in the United States. Its N-95 masks have long been approved by the NIOSH (part of the CDC), and cleared by the FDA as a surgical mask. The company typically had $3-4 million of annual mask revenue, but we believe mask revenue will be over $50 million in 2020. While Alpha Pro Tech is a significantly smaller mask maker than Honeywell or 3M, we believe the market for domestically manufactured N-95 masks will be significantly larger in the future. The company also manufactures face shields, gowns and other PPE. We believe the company may earn $2-3 per share in 2020 and beyond.
Apple, Inc. (AAPL) was also a leading contributor in the first half. In January, Apple reported strong results and positive guidance for iPhones, Services and Wearables. However, on February 16, Apple pre-announced a negative quarter based on manufacturing, supply chain and demand issues in China. China retail stores started to open in March, and U.S. stores opened in May and June. The market looked forward to a fall launch of the 5G iPhone and demand recovery. Apple closed the second quarter near an all-time high.
Vicor Corporation (VICR), PDF Solutions, Inc. (PDFS) and Entegris, Inc. (ENTG) were also leading contributors to the Fund’s first half performance.
DIRTT Environmental Solutions Ltd. (DRTT) was the leading detractor to the Fund’s performance in the first half. DIRTT provides customized, prefabricated interior office spaces. It has an incredible virtual reality CAD system, and it manufactures walls and interior components, which are shipped and assembled on-site. As a result, there is less on-site waste and a more predictable construction schedule. DIRTT competes with dry wall construction and in the market for skilled workers. I believe DIRTT is the future of interior construction.
DIRTT’s first quarter revenue and earnings and second quarter guidance were weak. We are concerned about the impact of the weak economy, and the impact of social distancing requirements on office construction. Longer-term, we believe DIRTT could benefit from a need to modify floor plans; however, there may be a pause before companies make such changes. Consequently, the Fund sold its DIRTT position and realized a tax-loss. We will revisit this decision as we develop a view of the future of office environments. The Fund added small new positions in Clean Harbors, Inc. (CLH) and Arlo Technologies, Inc. (ARLO). We hope to build both positions over time. The largest addition to an existing holding was to Smith-Midland Corporation (SMID), a micro-cap maker of pre-cast concrete systems for road barriers and construction. We were impressed by the company’s management and believe the market misunderstands the returns from its barrier rental business.
The Fund exited Bill.com Holdings (BILL) and Coupa Software, Inc. (COUP) over concern for their small business customer bases. Both were small positions, but big winners. We hope to have a chance to repurchase shares in the future. The Fund also reduced its positions in some of the longer-term, larger holdings in the Fund, including Apple, Akamai Technologies (AKAM), Entegris and PDF Solutions.
At June 30, 2020, the Fund’s top 10 positions were 68.62% of net assets. The Fund was fully invested and was short 0.4%. The Fund had an Active Share of 99.4% versus the Russell 2000 and trailing 12-month turnover was 14%. Morningstar categorizes the Fund as Small Cap Growth, and as of April 30, 2020, Lipper also categorizes it as Small Cap Growth.
Needham Small Cap Growth Fund First Half 2020 Performance – Chris Retzler, Portfolio Manager
For the half year ended June 30, 2020, the Needham Small Cap Growth Fund Institutional and Retail classes returned 14.87% and 14.50%, respectively. The Russell 2000 Index returned -12.98% and the S&P 500 Index returned -3.08%.
After a strong finish to 2019, we were cautious entering 2020 that the momentum and strength of 2019 would continue. We remained patient with the Fund’s cash position in January and continued to exit and trim positions into February. We believed the market was due for a pullback, however, we did not expect such a violent and rapid selloff in March. This pullback offered a tremendous opportunity to invest most of our cash position at generationally low prices. We continued to deploy cash into April.
Many of the Fund’s investments are technology-defined companies, however we achieve diversity in the portfolio through the end markets that these companies serve. Technology has permeated the entire global economy. End markets with strong secular growth include advanced communications, military modernization, automotive advancement, industrial digitization, medical enhancement, 5G wireless, data center buildouts, infrastructure expansion, security improvements and overall semiconductor processing and power management enhancements. Many of our portfolio companies are at the crossroads of many industries and therefore have multiple opportunities for success. This market positioning inherently gives the portfolio a natural hedge and ultimately helps reduce volatility and risk. Using an old phrase, we like companies that “sell picks to the miners.”
The Fund benefitted in the first half from its concentrated investments in GenMark Diagnostics (GNMK), MaxLinear (MXL), Channel Advisor (ECOM), Limelight Networks, II-VI (IIVI) and Akoustis Technologies (AKTS).
GenMark received fast track approval for its COVID-19 test panel, which accelerated purchases of its primary diagnostic machines. The stock price surpassed our high-end target price, and we exited the entire position.
MaxLinear’s stock price was under pressure over the last year until April 6, when it announced the acquisition of Intel’s broadband assets at a price lower than the market’s estimate. A steady increase in share price ensued through the end of the second quarter, greatly benefiting the Fund’s position in the stock.
ChannelAdvisor benefited from increased online consumer activity driven by COVID-19 shelter-in-place restrictions. We have been patient investors in ChannelAdvisor and have been rewarded for that patience.
Limelight Networks benefitted from the need for improved infrastructure and content delivery as remote work and over-the-top media (OTT) demands surged. The stock price has nearly doubled since 2019, and we will evaluate target prices and forward growth rate opportunities.
II-IV, a materials and optoelectronics components manufacturer and long-time holding in the Fund, found its stock under pressure since its September 2019 acquisition of former rival Finisar. Investors were skeptical that II-VI could integrate and retool the Finisar assets, but the acquisition is beginning to work under the company’s dynamic leadership, and the integration is now reflected in the stock price. During the first half, II-VI achieved our price targets and we exited the position.
Finally, our investment in Akoustis Technologies also paid off, as filter technology for wireless communications continued to see customer interest and acceptance. As 5G continues to expand, we expect Akoustis to benefit and further broaden their end-market customer base.
Closing
As we enter a volatile election season filled with headline risks, we remain comfortable with our portfolio at this moment, but we will continue to evaluate our exposure and stock selection. We believe that global central banks will remain accommodative, and substantial fiscal stimulus policies will continue, with the goal of minimizing the economic impact of COVID-19 while simultaneously supporting risk assets. We expect economic activity to accelerate as we begin to recover from the dramatic stop in the first half of 2020. While we do not believe we are completely out of the woods regarding the health crisis, we believe the global economy, businesses and healthcare systems are better prepared for any deterioration resulting from any further worsening of the pandemic.
We believe the U.S. remains the best place in the world to be investing, and we continue to see an opportunity to invest in small and mid-cap stocks. Most importantly, we see a revolution happening in technology that has created and continues to create investment opportunities. We see opportunity in our strategy of investing in companies that we know well and that we believe are positioned with secular growth drivers.
We welcome our new investors and thank all of our investors for their continued support. If you have any questions, thoughts or concerns, please contact us at (800) 625-7071 or jbarr@needhamco.com and cretzler@needhamco.com. For information about the Needham Funds, please visit our website at www.needhamfunds.com.
Sincerely,
 |  |
| Chris Retzler, | John O. Barr, |
| Portfolio Manager | Portfolio Manager |
Fact Sheet Links:
Needham Growth Fund
Needham Aggressive Growth Fund
Needham Small Cap Growth Fund
The information presented in this commentary is not intended as personalized investment advice and does not constitute a recommendation to buy or sell a particular security or other investments. Past performance is no guarantee of future results. The views of Needham Investment Management L.L.C., the Funds’ investment adviser (the “Adviser”), and the securities described in this report are as of June 30, 2020; these views and portfolio holdings may have changed subsequent to this date. The specific securities discussed may, in aggregate, represent only a small percentage of a Fund’s holdings. If a specific security discussed is not found in a Fund’s Schedule of Investments, it may have been held by the Fund during the period. It should not be assumed that securities identified and discussed were, or will be, profitable, or that the investment decisions made in the future will be profitable, or equal the investment performance of the securities discussed herein. There can be no guarantee as to the accuracy of any outlooks for markets, sectors and securities as discussed herein.
This message is not an offer of the Needham Growth Fund, the Needham Aggressive Growth Fund or the Needham Small Cap Growth Fund. Shares are sold only through the currently effective prospectus. Please read the prospectus or summary prospectus carefully and consider the investment objectives, risks and charges and expenses of the Funds carefully before you invest. The prospectus and summary prospectus contain this and other information about the Funds and can be obtained on our website, www.needhamfunds.com or by contacting the Funds’ transfer agent U.S. Bancorp Fund Services LLC doing business as U.S. Bank Global Fund Services (“Fund Services”) at 1-800-625-7071.
Investment returns and principal value will fluctuate, and when redeemed, shares may be worth more or less than their original cost. Performance data quoted represents past performance, and does not guarantee future results. Current performance may be higher or lower than these results. Performance current to the most recent month-end may be obtained by calling our transfer agent at 1-800-625-7071. Total return figures include reinvestment of all dividends and capital gains.
All three of the Needham Funds have substantial exposure to small and micro capitalized companies. Funds holding smaller capitalized companies are subject to greater price fluctuation than those of larger companies. The coronavirus disease 2019 (COVID-19) global pandemic and the aggressive responses taken by many governments or voluntarily imposed by private parties, including closing borders, restricting travel and imposing prolonged quarantines or similar restrictions, as well as the closure of, or operational changes to, many retail and other businesses, have had negative impacts, and in many cases severe negative impacts, on markets worldwide. It is not known how long such impacts, or any future impacts of other significant events described above, will or would last, but there could be a prolonged period of global economic slowdown, which may impact your Fund investment. Needham & Company, LLC, member FINRA/SIPC, is the distributor of The Needham Funds, Inc.
The Russell 2000 Index is a broad unmanaged index composed of the smallest 2,000 companies in the Russell 3000 Index. The Russell 3000 Index is a market-capitalization-weighted equity index that provides exposure to the entire U.S. stock market. The Russell 3000 Index tracks the performance of the 3,000 largest U.S.-traded stocks. Please see the disclaimer regarding these indexes under “Supplementary Information—Index Disclaimer” on page 56 of this report.
| NEEDHAM GROWTH FUND | Retail Class |
| Portfolio Characteristics (Unaudited) | Ticker Symbol: NEEGX |
| | Institutional Class |
| | Ticker Symbol: NEEIX |
Comparison of Change in Value of a $10,000 Investment
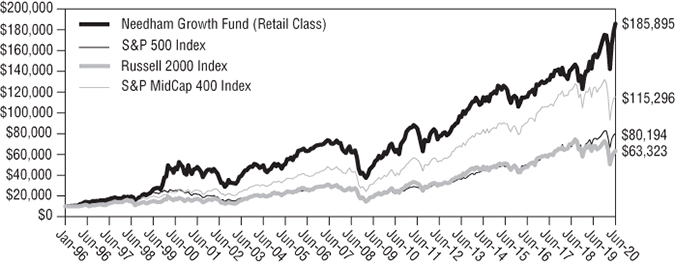
The chart above assumes an initial gross investment of $10,000 made on January 1, 1996. The Fund’s performance figures are for the period ended June 30, 2020. The performance data quoted is historical. Past performance is no guarantee of future results. Current performance may be higher or lower than the performance data quoted. The principal value and investment return of an investment will fluctuate so that your shares, when redeemed, may be worth more or less than their original cost. To obtain performance information current to the most recent month-end, please visit www.needhamfunds.com or call 1-800-625-7071. The returns shown do not reflect the deduction of taxes that a shareholder would pay on Fund distributions or on the redemptions of Fund shares. In the absence of fee waivers and expense reimbursements, when they are necessary to keep the Fund’s total annual operating expenses at the expense cap currently in effect, total return would be reduced. Performance figures for periods greater than one year are annualized. For information about each index shown in the chart above, please refer to the following page.
The Global Industry Classification Standard (GICS®) was developed by and/or is the exclusive property of MSCI, Inc. and Standard & Poor Financial Services LLC (“S&P”). GICS is a service mark of MSCI and S&P and has been licensed for use by U.S. Bancorp Fund Services, LLC., doing business as U.S. Bank Global Fund Services (“Fund Services”).
Comparative Performance Statistics as of June 30, 2020 (Unaudited)
| | 1 | 5 | 10 | Since |
| | Year | Years | Years | Inception |
Needham Growth Fund Retail Class(1)(2) | 20.47% | 8.30% | 11.55% | 12.67% |
Needham Growth Fund Institutional Class(1)(3) | 21.11% | n/a | n/a | 12.21% |
S&P 500 Index(4)(5) | 7.51% | 10.73% | 13.99% | 8.87%(8) |
S&P MidCap 400 Index(4)(6) | -6.70% | 5.22% | 11.34% | 10.50%(8) |
Russell 2000 Index(4)(7) | -6.63% | 4.29% | 10.50% | 7.83%(8) |
Past performance does not guarantee future results. The performance data quoted represents past performance, and current returns may be lower or higher. The investment return and net asset value will fluctuate so that an investor’s shares, when redeemed, may be worth more or less than the original cost. To obtain performance information current to the most recent month-end, please call 1-800-625-7071. The returns shown in the above table and accompanying footnotes are net of expenses. The table above does not reflect the deduction of taxes that a shareholder would have paid on Fund distributions or on the redemption of Fund shares.
| 1. | Investment results calculated after reinvestment of dividends. |
| 2. | The inception date of the Retail Class was 1/1/96. |
| 3. | The inception date of the Institutional Class was 12/30/16. |
| 4. | It is not possible to invest directly in an index. The performance of the index does not include the deduction of expenses associated with a mutual fund, such as investment management fees. |
| 5. | The S&P 500 Index focuses on the large-cap sector of the market; however, since it includes a significant portion of the total value of the market, it also is considered representative of the market. Companies in the S&P 500 are considered leading companies in leading industries. |
| 6. | The S&P MidCap 400 Index provides investors with a benchmark for mid-sized companies. The index seeks to remain an accurate measure of mid-sized companies, reflecting the risk and return characteristics of the broader mid-cap universe on an on-going basis. |
| 7. | The Russell 2000 Index measures the performance of the small-cap segment of the U.S. equity universe. The Russell 2000 Index is a subset of the Russell 3000 Index representing approximately 8% of the total market capitalization of that index. The Russell 2000 Index includes approximately 2,000 of the smallest securities based on a combination of their market cap and current index membership. |
| 8. | The return shown for the index is from the inception date of the Retail Class. The returns for the S&P 500 Index, S&P MidCap 400 Index and Russell 2000 Index from the inception date of the Institutional Class are 11.95%, 3.76%, 3.14%, respectively. |
| Top Ten Holdings* |
| (as a % of total investments, |
| as of June 30, 2020) |
| | | % of Total |
Security |
| Investments |
| Thermo Fisher Scientific, Inc. | TMO | 8.79% |
| PDF Solutions, Inc. | PDFS | 8.13% |
| CarMax, Inc. | KMX | 6.44% |
| Entegris, Inc. | ENTG | 6.31% |
| Gilead Sciences, Inc. | GILD | 5.67% |
| Vicor Corp. | VICR | 4.69% |
| KVH Industries, Inc. | KVHI | 4.41% |
| Becton Dickinson & Co. | BDX | 4.14% |
| Comcast Corp. – Class A | CMCSA | 3.99% |
| Super Micro Computer, Inc. | SMCI | 3.51% |
Top Ten Holdings = 56.08% of Total Investments†
| * | Current portfolio holdings may not be indicative of future portfolio holdings. |
| † | Percentage of total investments less cash. |
| Sector Weightings* |
| (as a % of net investments, |
| as of June 30, 2020) |
Sector(3) | Long* | (Short)(1) | Total(1)(2) |
| Cash | 1.3% | — | 1.3% |
| Communication Services | 4.5% | — | 4.5% |
| Consumer Discretionary | 6.6% | — | 6.6% |
| Consumer Staples | 0.5% | — | 0.5% |
| Energy | 2.8% | — | 2.8% |
| Financials | 0.3% | — | 0.3% |
| Health Care | 22.4%
| — | 22.4%
|
| Industrials | 7.2% | — | 7.2% |
| Information Technology | 55.0%
| (0.8)% | 54.2%
|
| Real Estate | 0.2% | — | 0.2% |
| * | Current portfolio holdings may not be indicative of future portfolio holdings. |
(1) | Percentage of total investments includes all stocks, plus cash minus all short positions. |
(2) | Total represents the difference between the long exposure and the short exposure, which produces the net exposure. |
(3) | These categories represent broad market sectors. Refer to the Schedule of Investments for a more detailed categorization by industry. |
(This Page Intentionally Left Blank.)
| NEEDHAM AGGRESSIVE GROWTH FUND | Retail Class |
| Portfolio Characteristics (Unaudited) | Ticker Symbol: NEAGX |
| | Institutional Class |
| | Ticker Symbol: NEAIX |
Comparison of Change in Value of a $10,000 Investment
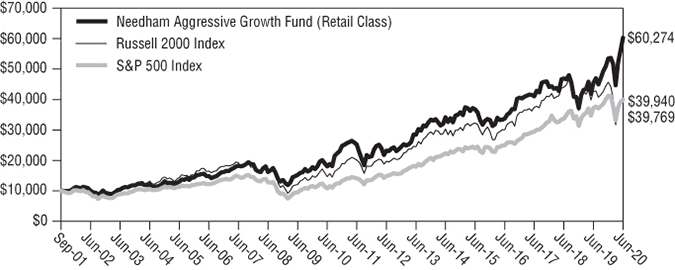
The chart above assumes an initial gross investment of $10,000 made on September 4, 2001. The Fund’s performance figures are for the period ended June 30, 2020. The performance data quoted is historical. Past performance is no guarantee of future results. Current performance may be higher or lower than the performance data quoted. The principal value and investment return of an investment will fluctuate so that your shares, when redeemed, may be worth more or less than their original cost. To obtain performance information current to the most recent month-end, please visit www.needhamfunds.com or call 1-800-625-7071. The returns shown do not reflect the deduction of taxes that a shareholder would pay on Fund distributions or on the redemptions of Fund shares. In the absence of fee waivers and expense reimbursements, when they are necessary to keep the Fund’s total annual operating expenses at the expense cap currently in effect, total return would be reduced. Performance figures for periods greater than one year are annualized. For information about each index shown in the chart above, please refer to the following page.
The Global Industry Classification Standard (GICS®) was developed by and/or is the exclusive property of MSCI, Inc. and Standard & Poor Financial Services LLC (“S&P”). GICS is a service mark of MSCI and S&P and has been licensed for use by U.S. Bancorp Fund Services, LLC., doing business as U.S. Bank Global Fund Services (“Fund Services”).
Comparative Performance Statistics as of June 30, 2020 (Unaudited)
| | 1 | 5 | 10 | Since |
| | Year | Years | Years | Inception |
Needham Aggressive Growth Fund Retail Class(1)(2) | 32.61% | 10.40% | 12.82% | 10.02% |
Needham Aggressive Growth Fund Institutional Class(1)(3) | 33.33% | n/a | n/a | 12.58% |
S&P 500 Index(4)(5) | 7.51% | 10.73% | 13.99% | 7.64%(7) |
Russell 2000 Index(4)(6) | -6.63% | 4.29% | 10.50% | 7.61%(7) |
Past performance does not guarantee future results. The performance data quoted represents past performance, and current returns may be lower or higher. The investment return and net asset value will fluctuate so that an investor’s shares, when redeemed, may be worth more or less than the original cost. To obtain performance information current to the most recent month-end, please call 1-800-625-7071. The returns shown in the above table and accompanying footnotes are net of expenses. The table above does not reflect the deduction of taxes that a shareholder would have paid on Fund distributions or on the redemption of Fund shares.
| 1. | Investment results calculated after reinvestment of dividends. |
| 2. | The inception date of the Retail Class was 9/4/01. |
| 3. | The inception date of the Institutional Class was 12/30/16. |
| 4. | It is not possible to invest directly in an index. The performance of the index does not include the deduction of expenses associated with a mutual fund, such as investment management fees. |
| 5. | The S&P 500 Index focuses on the large-cap sector of the market; however, since it includes a significant portion of the total value of the market, it also is considered representative of the market. Companies in the S&P 500 are considered leading companies in leading industries. |
| 6. | The Russell 2000 Index measures the performance of the small-cap segment of the U.S. equity universe. The Russell 2000 Index is a subset of the Russell 3000 Index representing approximately 8% of the total market capitalization of that index. The Russell 2000 Index includes approximately 2,000 of the smallest securities based on a combination of their market cap and current index membership. |
| 7. | The return shown for the index is from the inception date of the Retail Class. The returns for the S&P 500 Index and Russell 2000 Index from the inception date of the Institutional Class are 11.95% and 3.14%, respectively. |
| Top Ten Holdings* |
| (as a % of total investments, |
| as of June 30, 2020) |
| | | % of Total |
Security |
| Investments |
| PDF Solutions, Inc. | PDFS | 12.18% |
| Apple, Inc. | AAPL | 10.49% |
| Vicor Corp. | VICR | 10.34% |
| Entegris, Inc. | ENTG | 10.08% |
| KVH Industries, Inc. | KVHI | 5.93% |
| Nova Measuring | | |
| Instruments, Ltd. (Israel) | NVMI | 5.45% |
| MKS Instruments, Inc. | MKSI | 4.68% |
| Super Micro Computer, Inc. | SMCI | 3.55% |
| CarMax, Inc. | KMX | 3.30% |
| Akamai Technologies, Inc. | AKAM | 2.79% |
Top Ten Holdings = 68.79% of Total Investments†
| * | Current portfolio holdings may not be indicative of future portfolio holdings. |
| † | Percentage of total investments less cash. |
| Sector Weightings* |
| (as a % of net investments, |
| as of June 30, 2020) |
Sector(3) | Long* | (Short)(1) | Total(1)(2) |
| Cash | 0.1% | — | 0.1% |
| Communication Services | 0.2% | — | 0.2% |
| Consumer Discretionary | 3.3% | — | 3.3% |
| Consumer Staples | 2.4% | — | 2.4% |
| Energy | 1.6% | — | 1.6% |
| Health Care | 4.5% | — | 4.5% |
| Industrials | 15.7%
| — | 15.7%
|
| Information Technology | 68.5%
| (0.3)% | 68.2%
|
| Materials | 1.4% | — | 1.4% |
| Real Estate | 2.6% | — | 2.6% |
| * | Current portfolio holdings may not be indicative of future portfolio holdings. |
(1) | Percentage of total investments includes all stocks, plus cash minus all short positions. |
(2) | Total represents the difference between the long exposure and the short exposure, which produces the net exposure. |
(3) | These categories represent broad market sectors. Refer to the Schedule of Investments for a more detailed categorization by industry. |
| NEEDHAM SMALL CAP GROWTH FUND | Retail Class |
| Portfolio Characteristics (Unaudited) | Ticker Symbol: NESGX |
| | Institutional Class |
| | Ticker Symbol: NESIX |
Comparison of Change in Value of a $10,000 Investment
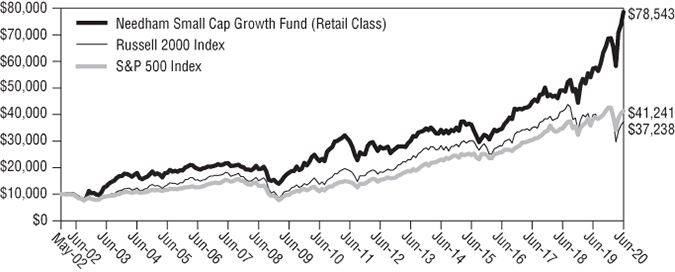
The chart above assumes an initial gross investment of $10,000 made on May 22, 2002. The Fund’s performance figures are for the period ended June 30, 2020. The performance data quoted is historical. Past performance is no guarantee of future results. Current performance may be higher or lower than the performance data quoted. The principal value and investment return of an investment will fluctuate so that your shares, when redeemed, may be worth more or less than their original cost. To obtain performance information current to the most recent month-end, please visit www.needhamfunds.com or call 1-800-625-7071. The returns shown do not reflect the deduction of taxes that a shareholder would pay on Fund distributions or on the redemptions of Fund shares. In the absence of fee waivers and expense reimbursements, when they are necessary to keep the Fund’s total annual operating expenses at the expense cap currently in effect, total return would be reduced. Performance figures for periods greater than one year are annualized. For information about each index shown in the chart above, please refer to the following page.
The Global Industry Classification Standard (GICS®) was developed by and/or is the exclusive property of MSCI, Inc. and Standard & Poor Financial Services LLC (“S&P”). GICS is a service mark of MSCI and S&P and has been licensed for use by U.S. Bancorp Fund Services, LLC., doing business as U.S. Bank Global Fund Services (“Fund Services”).
Comparative Performance Statistics as of June 30, 2020 (Unaudited)
| | 1 | 5 | 10 | Since |
| | Year | Years | Years | Inception |
Needham Small Cap Growth Fund Retail Class(1)(2) | 37.05% | 16.77% | 13.32% | 12.06% |
Needham Small Cap Growth Fund Institutional Class(1)(3) | 37.91% | n/a | n/a | 20.40% |
S&P 500 Index(4)(5) | 7.51% | 10.73% | 13.99% | 8.14%(7) |
Russell 2000 Index(4)(6) | -6.63% | 4.29% | 10.50% | 7.53%(7) |
Past performance does not guarantee future results. The performance data quoted represents past performance, and current returns may be lower or higher. The investment return and net asset value will fluctuate so that an investor’s shares, when redeemed, may be worth more or less than the original cost. To obtain performance information current to the most recent month-end, please call 1-800-625-7071. The returns shown in the above table and accompanying footnotes are net of expenses. The table above does not reflect the deduction of taxes that a shareholder would have paid on Fund distributions or on the redemption of Fund shares.
| 1. | Investment results calculated after reinvestment of dividends. |
| 2. | The inception date of the Retail Class was 5/22/02. |
| 3. | The inception date of the Institutional Class was 12/30/16. |
| 4. | It is not possible to invest directly in an index. The performance of the index does not include the deduction of expenses associated with a mutual fund, such as investment management fees. |
| 5. | The S&P 500 Index focuses on the large-cap sector of the market; however, since it includes a significant portion of the total value of the market, it also is considered representative of the market. Companies in the S&P 500 are considered leading companies in leading industries. |
| 6. | The Russell 2000 Index measures the performance of the small-cap segment of the U.S. equity universe. The Russell 2000 Index is a subset of the Russell 3000 Index representing approximately 8% of the total market capitalization of that index. The Russell 2000 Index includes approximately 2,000 of the smallest securities based on a combination of their market cap and current index membership. |
| 7. | The return shown for the index is from the inception date of the Retail Class. The returns for the S&P 500 Index and Russell 2000 Index from the inception date of the Institutional Class are 11.95% and 3.14%, respectively. |
| Top Ten Holdings* |
| (as a % of total investments, |
| as of June 30, 2020) |
| | | % of Total |
Security |
| Investments |
| FireEye, Inc. | FEYE | 6.17% |
| MaxLinear, Inc. | MXL | 5.75% |
| Limelight Networks, Inc. | LLNW | 5.04% |
| 8x8, Inc. | EGHT | 4.29% |
| Infinera Corp. | INFN | 3.88% |
| Cambium Networks Corp. | CMBM | 3.73% |
| Mimecast Ltd. | MIME | 3.72% |
| Pluralsight, Inc. | PS | 3.49% |
| AXT, Inc. | AXTI | 3.47% |
| Super Micro Computer, Inc. | SMCI | 3.38% |
Top Ten Holdings = 42.92% of Total Investments†
* Current portfolio holdings may not be indicative of future portfolio holdings.
† Percentage of total investments less cash.
| Sector Weightings* |
| (as a % of net investments, |
| as of June 30, 2020) |
Sector(3) | Long* | (Short)(1) | Total(1)(2) |
| Cash | 6.6% | — | 6.6% |
| Communication Services | 1.8% | — | 1.8% |
| Energy | 3.0% | — | 3.0% |
| Health Care | 6.6% | — | 6.6% |
| Industrials | 2.6% | — | 2.6% |
| Information Technology | 80.8%
| (1.4)% | 79.4%
|
| * | Current portfolio holdings may not be indicative of future portfolio holdings. |
(1) | Percentage of total investments includes all stocks, plus cash minus all short positions. |
(2) | Total represents the difference between the long exposure and the short exposure, which produces the net exposure. |
(3) | These categories represent broad market sectors. Refer to the Schedule of Investments for a more detailed categorization by industry. |
Disclosure of Fund Expenses (Unaudited)
The following expense table is shown so that you can understand the impact of fees on your investment. All mutual funds have operating expenses. As a shareholder of a Fund, you incur ongoing costs, which include costs for portfolio management, administrative services, and shareholder reports, among others. A Fund’s expenses are expressed as a percentage of its average net assets. This figure is known as the expense ratio. The following examples are intended to help you understand the ongoing costs (in dollars) of investing in each Fund and to compare these costs with those of other mutual funds. The examples are based on an investment of $1,000 made at the beginning of a six-month period and held for the entire period. The expense example table below illustrates your Fund’s cost in two ways:
| • | Actual Expenses. This section helps you to estimate the actual expenses after fee waivers that you paid over the period. The “Ending Account Value” shown is derived from the Fund’s actual return, and “Expenses Paid During Period” shows the dollar amount that would have been paid by an investor who started with $1,000 in the Fund. You may use the information here, together with the amount you invested, to estimate the expenses that you paid over the period. To do so, simply divide your account value by $1,000 (for example, an $8,600 account value divided by $1,000 = 8.6), then multiply the result by the number given for your Fund under the heading entitled “Expenses Paid During Period”. |
| | |
| • | Hypothetical Expenses on a 5% Return. This section is intended to help you compare your Fund’s costs with those of other mutual funds. It assumes that the Fund had a return of 5% before expenses during the period shown, but that the expense ratio is unchanged. In this case, because the return used is not the Fund’s actual return, the results do not apply to your investment. The example is useful in making comparisons because the Securities and Exchange Commission requires all mutual funds to calculate expenses based on a 5% return. You can assess your Fund’s cost by comparing this hypothetical example with the hypothetical examples that appear in shareholders reports of other funds. |
For the Period January 1, 2020 to June 30, 2020
Expense Example Table (Unaudited)
| | Beginning | Ending | Expenses Paid | Expense Ratio |
| | Account | Account | During Period(1) | During Period(1) |
| | Value | Value | 1/1/2020 – | 1/1/2020 – |
| | 1/1/2020 | 6/30/2020 | 6/30/2020 | 6/30/2020 |
| Needham Growth Fund | | | | |
| Retail Class Actual Expenses | $1,000.00 | $1,061.90 | $ 9.84 | 1.92% |
| Retail Class Hypothetical Example | | | | |
| for Comparison Purposes | | | | |
| (5% return before expenses) | $1,000.00 | $1,015.32 | $ 9.62 | 1.92% |
| Institutional Class Actual Expenses | $1,000.00 | $1,064.70 | $ 7.19 | 1.40% |
| Institutional Class Hypothetical | | | | |
| Example for Comparison Purposes | | | | |
| (5% return before expenses) | $1,000.00 | $1,017.90 | $ 7.02 | 1.40% |
| | | | | |
Needham Aggressive Growth Fund(2) | | | | |
| Retail Class Actual Expenses | $1,000.00 | $1,126.80 | $10.26 | 1.94% |
| Retail Class Hypothetical Example | | | | |
| for Comparison Purposes | | | | |
| (5% return before expenses) | $1,000.00 | $1,015.22 | $ 9.72 | 1.94% |
| Institutional Class Actual Expenses | $1,000.00 | $1,129.60 | $ 7.25 | 1.37% |
| Institutional Class Hypothetical | | | | |
| Example for Comparison Purposes | | | | |
| (5% return before expenses) | $1,000.00 | $1,018.05 | $ 6.87 | 1.37% |
| | | | | |
| Needham Small Cap Growth Fund | | | | |
| Retail Class Actual Expenses | $1,000.00 | $1,145.00 | $ 9.87 | 1.85% |
| Retail Class Hypothetical Example | | | | |
| for Comparison Purposes | | | | |
| (5% return before expenses) | $1,000.00 | $1,015.66 | $ 9.27 | 1.85% |
| Institutional Class Actual Expenses | $1,000.00 | $1,148.70 | $ 6.30 | 1.18% |
| Institutional Class Hypothetical | | | | |
| Example for Comparison Purposes | | | | |
| (5% return before expenses) | $1,000.00 | $1,019.00 | $ 5.92 | 1.18% |
(1) | Expenses are equal to the average account value times the Fund’s annualized expense ratio multiplied by 182/366 (to reflect the one-half-year period). |
(2) | Effective June 1, 2020, the Adviser has contractually agreed to waive its fee and, if necessary, reimburse the Needham Aggressive Growth Fund until April 30, 2021 to the extent Total Annual Fund Operating Expenses exceed 1.85% and 1.18% of the average daily net assets of the Retail Class shares and the Institutional Class shares respectively, of the Fund. |
Needham Growth Fund
Schedule of Investments
June 30, 2020 (Unaudited)
| | | Shares | | | Value | |
| Common Stocks (98.7%) | | | | | | |
| | | | | | | |
| Aerospace & Defense (0.5%) | | | | | | |
| Parsons Corp. (a) | | | 14,050 | | | $ | 509,172 | |
| | | | | | | | | |
| Biotechnology (5.7%) | | | | | | | | |
| Gilead Sciences, Inc. | | | 82,000 | | | | 6,309,080 | |
| Moderna, Inc. (a) | | | 1,200 | | | | 77,052 | |
| | | | | | | | 6,386,132 | |
| Building Products (0.2%) | | | | | | | | |
| Alpha Pro Tech, Ltd. (a) | | | 7,500 | | | | 132,750 | |
| DIRTT Environmental Solutions (Canada) (a) | | | 71,500 | | | | 86,515 | |
| | | | | | | | 219,265 | |
| Capital Markets (0.3%) | | | | | | | | |
| Brookfield Asset Management, Inc. – Class A (Canada) | | | 9,259 | | | | 304,621 | |
| | | | | | | | | |
| Commercial Services & Supplies (0.2%) | | | | | | | | |
| Clean Harbors, Inc. (a) | | | 3,500 | | | | 209,930 | |
| | | | | | | | | |
| Communications Equipment (6.1%) | | | | | | | | |
| ADTRAN, Inc. | | | 22,500 | | | | 245,925 | |
| Cambium Networks Corp. (a) | | | 127,500 | | | | 938,400 | |
| KVH Industries, Inc. (a) | | | 550,000 | | | | 4,911,500 | |
| ViaSat, Inc. (a)(c) | | | 19,500 | | | | 748,215 | |
| | | | | | | | 6,844,040 | |
| Electrical Equipment (4.6%) | | | | | | | | |
| Vicor Corp. (a) | | | 72,500 | | | | 5,216,375 | |
| | | | | | | | | |
| Electronic Equipment, Instruments & Components (5.3%) | | | | | | | | |
| Arlo Technologies, Inc. (a) | | | 55,000 | | | | 141,900 | |
| Corning, Inc. | | | 34,500 | | | | 893,550 | |
| FARO Technologies, Inc. (a) | | | 10,000 | | | | 536,000 | |
| FLIR Systems, Inc. | | | 7,500 | | | | 304,275 | |
| Frequency Electronics, Inc. (a) | | | 30,000 | | | | 262,800 | |
| II-VI, Inc. (a) | | | 15,000 | | | | 708,300 | |
| IPG Photonics Corp. (a) | | | 6,250 | | | | 1,002,438 | |
| National Instruments Corp. | | | 19,000 | | | | 735,490 | |
| nLight, Inc. (a) | | | 2,500 | | | | 55,650 | |
| Vishay Intertechnology, Inc. | | | 60,000 | | | | 916,200 | |
| Vishay Precision Group, Inc. (a) | | | 15,000 | | | | 368,700 | |
| | | | | | | | 5,925,303 | |
See accompanying notes to financial statements.
Needham Growth Fund
Schedule of Investments (Continued)
June 30, 2020 (Unaudited)
| | | Shares | | | Value | |
| Common Stocks – Continued | | | | | | |
| | | | | | | |
| Energy Equipment & Services (2.6%) | | | | | | |
| Aspen Aerogels, Inc. (a) | | | 440,000 | | | $ | 2,895,200 | |
| | | | | | | | | |
| Entertainment (0.2%) | | | | | | | | |
| World Wrestling Entertainment, Inc. – Class A | | | 4,500 | | | | 195,525 | |
| | | | | | | | | |
| Health Care Equipment & Supplies (7.1%) | | | | | | | | |
| Becton Dickinson & Co. | | | 19,250 | | | | 4,605,948 | |
| CryoPort, Inc. (a) | | | 45,000 | | | | 1,361,250 | |
| Medtronic PLC (Ireland) | | | 22,000 | | | | 2,017,400 | |
| | | | | | | | 7,984,598 | |
| Health Care Providers & Services (0.6%) | | | | | | | | |
| Laboratory Corp. of America Holdings (a) | | | 2,000 | | | | 332,220 | |
| Quest Diagnostics, Inc. | | | 3,500 | | | | 398,860 | |
| | | | | | | | 731,080 | |
| Household Products (0.4%) | | | | | | | | |
| Oil-Dri Corp. of America | | | 14,500 | | | | 503,150 | |
| | | | | | | | | |
| Industrial Conglomerates (0.3%) | | | | | | | | |
| Honeywell International, Inc. | | | 2,500 | | | | 361,475 | |
| | | | | | | | | |
| Interactive Media & Services (0.3%) | | | | | | | | |
| Alphabet, Inc. (Canada) – Class A (a) | | | 250 | | | | 354,512 | |
| | | | | | | | | |
| IT Services (3.2%) | | | | | | | | |
| Akamai Technologies, Inc. (a)(c) | | | 33,500 | | | | 3,587,515 | |
| | | | | | | | | |
| Life Sciences Tools & Services (8.8%) | | | | | | | | |
| Bruker Corp. | | | 1,000 | | | | 40,680 | |
| Thermo Fisher Scientific, Inc. (c) | | | 27,000 | | | | 9,783,180 | |
| | | | | | | | 9,823,860 | |
| Machinery (0.3%) | | | | | | | | |
| Westinghouse Air Brake Technologies Corp. | | | 5,000 | | | | 287,850 | |
| | | | | | | | | |
| Media (4.0%) | | | | | | | | |
| Comcast Corp. – Class A | | | 114,000 | | | | 4,443,720 | |
| | | | | | | | | |
| Oil, Gas & Consumable Fuels (0.2%) | | | | | | | | |
| Navigator Holdings, Ltd. (a) | | | 32,000 | | | | 205,760 | |
| | | | | | | | | |
| Real Estate Investment Trusts (REITs) (0.2%) | | | | | | | | |
| American Tower Corp. | | | 1,000 | | | | 258,540 | |
See accompanying notes to financial statements.
Needham Growth Fund
Schedule of Investments (Continued)
June 30, 2020 (Unaudited)
| | | Shares | | | Value | |
| Common Stocks – Continued | | | | | | |
| | | | | | | |
| Semiconductors & Semiconductor Equipment (26.8%) (d) | | | | | | |
| Applied Materials, Inc. | | | 9,000 | | | $ | 544,050 | |
| AXT, Inc. (a) | | | 225,000 | | | | 1,071,000 | |
| Entegris, Inc. | | | 119,000 | | | | 7,026,950 | |
| FormFactor, Inc. (a) | | | 130,000 | | | | 3,812,900 | |
| Lam Research Corp. | | | 2,500 | | | | 808,650 | |
| MKS Instruments, Inc. | | | 22,500 | | | | 2,547,900 | |
| Nova Measuring Instruments, Ltd. (Israel) (a) | | | 50,000 | | | | 2,409,500 | |
| PDF Solutions, Inc. (a) | | | 462,500 | | | | 9,046,500 | |
| Photronics, Inc. (a) | | | 100,500 | | | | 1,118,565 | |
| SiTime Corp. (a) | | | 15,000 | | | | 711,150 | |
| Taiwan Semiconductor | | | | | | | | |
| Manufacturing Co., Ltd. – ADR (Taiwan) | | | 9,000 | | | | 510,930 | |
| Veeco Instruments, Inc. (a) | | | 34,000 | | | | 458,660 | |
| | | | | | | | 30,066,755 | |
| Software (7.5%) | | | | | | | | |
| The Trade Desk, Inc. – Class A (a) | | | 5,000 | | | | 2,032,500 | |
| 8x8, Inc. (a) | | | 35,000 | | | | 560,000 | |
| Appian Corp. (a) | | | 7,000 | | | | 358,750 | |
| ChannelAdvisor Corp. (a) | | | 52,500 | | | | 831,600 | |
| Coupa Software, Inc. (a) | | | 3,000 | | | | 831,120 | |
| Everbridge, Inc. (a) | | | 11,500 | | | | 1,591,140 | |
| FireEye, Inc. (a) | | | 27,500 | | | | 334,812 | |
| GSE Systems, Inc. (a) | | | 24,029 | | | | 24,269 | |
| Q2 Holdings, Inc. (a) | | | 17,250 | | | | 1,479,878 | |
| Zuora, Inc. – Class A (a) | | | 27,000 | | | | 344,250 | |
| | | | | | | | 8,388,319 | |
| Specialty Retail (6.5%) | | | | | | | | |
| CarMax, Inc. (a)(c) | | | 80,000 | | | | 7,164,000 | |
| Floor & Decor Holdings, Inc. – Class A (a) | | | 2,500 | | | | 144,125 | |
| | | | | | | | 7,308,125 | |
| Technology Hardware, Storage & Peripherals (5.7%) | | | | | | | | |
| Apple, Inc. | | | 2,700 | | | | 984,960 | |
| Intevac, Inc. (a) | | | 181,875 | | | | 993,038 | |
| Pure Storage, Inc. – Class A (a) | | | 30,000 | | | | 519,900 | |
| Super Micro Computer, Inc. (a) | | | 137,500 | | | | 3,903,625 | |
| | | | | | | | 6,401,523 | |
See accompanying notes to financial statements.
Needham Growth Fund
Schedule of Investments (Continued)
June 30, 2020 (Unaudited)
| | | Shares | | | Value | |
| Common Stocks – Continued | | | | | | |
| | | | | | | |
| Trading Companies & Distributors (1.1%) | | | | | | |
| Air Lease Corp. | | | 43,500 | | | $ | 1,274,115 | |
| Total Common Stocks | | | | | | | | |
| (Cost $43,945,460) | | | | | | $ | 110,686,460 | |
| | | | | | | | | |
| Short-Term Investments (1.3%) | | | | | | | | |
| | | | | | | | | |
| Money Market Fund (1.3%) | | | | | | | | |
| Dreyfus Treasury Securities Cash Management – | | | | | | | | |
| Institutional Class 0.08% (b) | | | | | | | | |
| Total Short-Term Investments | | | | | | | | |
| (Cost $1,487,210) | | | 1,487,210 | | | $ | 1,487,210 | |
| | | | | | | | | |
| Total Investments (100.0%) | | | | | | | | |
| (Cost $45,432,670) | | | | | | | 112,173,670 | |
| Total Securities Sold Short (-0.8%) | | | | | | | (847,218 | ) |
| (Proceeds $721,604) | | | | | | | | |
| Other Assets in Excess of Liabilities (0.8%) | | | | | | | 870,917 | |
| Net Assets (100.0%) | | | | | | $ | 112,197,369 | |
| | Percentages are stated as a percent of net assets. |
| | Industry classifications may be different than those used for compliance monitoring purposes. |
| (a) | Non-income producing security. |
| (b) | Rate shown is the seven-day yield as of June 30, 2020. |
| (c) | Security position is either entirely or partially held in a segregated account as collateral for securities sold short, aggregating a total market value of $2,263,380. |
| (d) | As of June 30, 2020, the Fund had a significant portion of its assets invested in the Semiconductors & Semiconductor Equipment industry. |
| ADR | American Depositary Receipt |
Distribution of investments by country or territory of incorporation, as a percentage of Total Investments, is as follows (Unaudited):
| Country | | Long | |
| United States^ | | | 95.1 | % | |
| Canada | | | 0.5 | % | |
| Taiwan | | | 0.5 | % | |
| Ireland | | | 1.8 | % | |
| Israel | | | 2.1 | % | |
| Total | | | 100.0 | % | |
| ^ | United States allocation includes Short-Term Investment-Money Market Fund of 1.30%. |
See accompanying notes to financial statements.
Needham Growth Fund
Schedule of Securities Sold Short
June 30, 2020 (Unaudited)
| | | Shares | | | Value | |
| Securities Sold Short (-0.8%) | | | | | | |
| | | | | | | |
| Communications Equipment (-0.1%) | | | | | | |
| Ubiquiti, Inc. | | | 500 | | | $ | 87,280 | |
| | | | | | | | | |
| Consumer Finance (0.0%) | | | | | | | | |
| Medallion Financial Corp. (a) | | | 2,250 | | | | 5,963 | |
| | | | | | | | | |
| Semiconductors & Semiconductor Equipment (-0.2%) | | | | | | | | |
| Brooks Automation, Inc. | | | 5,000 | | | | 221,200 | |
| | | | | | | | | |
| Software (-0.5%) | | | | | | | | |
| Dynatrace, Inc. (a) | | | 1,750 | | | | 71,050 | |
| New Relic, Inc. (a) | | | 1,250 | | | | 86,125 | |
| SPS Commerce, Inc. (a) | | | 5,000 | | | | 375,600 | |
| | | | | | | | 532,775 | |
| Total Securities Sold Short (-0.8%) | | | | | | | | |
| (Proceeds $721,604) | | | | | | $ | 847,218 | |
| (a) | Non-income producing security. |
Distribution of investments by country or territory of incorporation, as a percentage of Total Securities Sold Short, is as follows (Unaudited):
| Country | | Short | |
| United States | | | 100.0 | % | |
| Total | | | 100.0 | % | |
See accompanying notes to financial statements.
Needham Aggressive Growth Fund
Schedule of Investments
June 30, 2020 (Unaudited)
| | | Shares | | | Value | |
| Common Stocks (100.1%) | | | | | | |
| | | | | | | |
| Aerospace & Defense (0.6%) | | | | | | |
| Parsons Corp. (a) | | | 9,000 | | | $ | 326,160 | |
| | | | | | | | | |
| Biotechnology (0.1%) | | | | | | | | |
| Moderna, Inc. (a) | | | 600 | | | | 38,526 | |
| | | | | | | | | |
| Building Products (2.5%) | | | | | | | | |
| Alpha Pro Tech, Ltd. (a) | | | 75,000 | | | | 1,327,500 | |
| Jewett-Cameron Trading Co., Ltd. (Canada) (a) | | | 7,500 | | | | 53,700 | |
| | | | | | | | 1,381,200 | |
| Commercial Services & Supplies (0.2%) | | | | | | | | |
| Clean Harbors, Inc. (a) | | | 2,000 | | | | 119,960 | |
| | | | | | | | | |
| Communications Equipment (6.3%) | | | | | | | | |
| ADTRAN, Inc. | | | 7,500 | | | | 81,975 | |
| Cambium Networks Corp. (a) | | | 17,500 | | | | 128,800 | |
| KVH Industries, Inc. (a) | | | 369,400 | | | | 3,298,742 | |
| | | | | | | | 3,509,517 | |
| Construction Materials (1.4%) | | | | | | | | |
| Smith-Midland Corp. (a) | | | 137,500 | | | | 779,625 | |
| | | | | | | | | |
| Electrical Equipment (10.3%) | | | | | | | | |
| Vicor Corp. (a) | | | 80,000 | | | | 5,756,000 | |
| | | | | | | | | |
| Electronic Equipment, Instruments & Components (3.2%) | | | | | | | | |
| Arlo Technologies, Inc. (a) | | | 55,000 | | | | 141,900 | |
| IPG Photonics Corp. (a) | | | 7,000 | | | | 1,122,730 | |
| National Instruments Corp. | | | 4,500 | | | | 174,195 | |
| Vishay Precision Group, Inc. (a) | | | 15,000 | | | | 368,700 | |
| | | | | | | | 1,807,525 | |
| Energy Equipment & Services (1.6%) | | | | | | | | |
| Aspen Aerogels, Inc. (a) | | | 138,100 | | | | 908,698 | |
| | | | | | | | | |
| Entertainment (0.2%) | | | | | | | | |
| World Wrestling Entertainment, Inc. – Class A | | | 2,250 | | | | 97,762 | |
See accompanying notes to financial statements.
Needham Aggressive Growth Fund
Schedule of Investments (Continued)
June 30, 2020 (Unaudited)
| | | Shares | | | Value | |
| Common Stocks – Continued | | | | | | |
| | | | | | | |
| Health Care Equipment & Supplies (2.7%) | | | | | | |
| CryoPort, Inc. (a) | | | 31,000 | | | $ | 937,750 | |
| LeMaitre Vascular, Inc. | | | 22,500 | | | | 594,000 | |
| | | | | | | | 1,531,750 | |
| Health Care Providers & Services (0.5%) | | | | | | | | |
| Laboratory Corp. of America Holdings (a) | | | 500 | | | | 83,055 | |
| Quest Diagnostics, Inc. | | | 1,750 | | | | 199,430 | |
| | | | | | | | 282,485 | |
| | | | | | | | | |
| Health Care Technology (0.4%) | | | | | | | | |
| Omnicell, Inc. (a) | | | 3,000 | | | | 211,860 | |
| | | | | | | | | |
| Household Products (2.5%) | | | | | | | | |
| Oil-Dri Corp. of America | | | 39,500 | | | | 1,370,650 | |
| | | | | | | | | |
| IT Services (2.8%) | | | | | | | | |
| Akamai Technologies, Inc. (a)(c) | | | 14,500 | | | | 1,552,805 | |
| | | | | | | | | |
| Life Sciences Tools & Services (0.8%) | | | | | | | | |
| Bruker Corp. | | | 11,000 | | | | 447,480 | |
| | | | | | | | | |
| Machinery (0.7%) | | | | | | | | |
| FreightCar America, Inc. (a) | | | 65,000 | | | | 80,600 | |
| Westinghouse Air Brake Technologies Corp. | | | 5,000 | | | | 287,850 | |
| | | | | | | | 368,450 | |
| Professional Services (0.7%) | | | | | | | | |
| CRA International, Inc. | | | 10,500 | | | | 414,750 | |
| | | | | | | | | |
| Real Estate Investment Trusts (REITs) (2.7%) | | | | | | | | |
| Equinix, Inc. | | | 2,000 | | | | 1,404,600 | |
| American Tower Corp. | | | 200 | | | | 51,708 | |
| | | | | | | | 1,456,308 | |
| Semiconductors & Semiconductor Equipment (35.5%) (d) | | | | | | | | |
| AXT, Inc. (a) | | | 35,000 | | | | 166,600 | |
| Entegris, Inc. | | | 95,000 | | | | 5,609,750 | |
| FormFactor, Inc. (a) | | | 23,000 | | | | 674,590 | |
| MKS Instruments, Inc. | | | 23,000 | | | | 2,604,520 | |
| Nova Measuring Instruments, Ltd. (Israel) (a)(c) | | | 63,000 | | | | 3,035,970 | |
See accompanying notes to financial statements.
Needham Aggressive Growth Fund
Schedule of Investments (Continued)
June 30, 2020 (Unaudited)
| | | Shares | | | Value | |
| Common Stocks – Continued | | | | | | |
| | | | | | | |
| Semiconductors & Semiconductor Equipment – Continued | | | | | | |
| PDF Solutions, Inc. (a)(c) | | | 346,500 | | | $ | 6,777,540 | |
| Photronics, Inc. (a) | | | 22,500 | | | | 250,425 | |
| SiTime Corp. (a) | | | 5,000 | | | | 237,050 | |
| Taiwan Semiconductor | | | | | | | | |
| Manufacturing Co., Ltd. (Taiwan) – ADR | | | 7,500 | | | | 425,775 | |
| Veeco Instruments, Inc. (a) | | | 6,800 | | | | 91,732 | |
| | | | | | | | 19,873,952 | |
| Software (5.5%) | | | | | | | | |
| The Trade Desk, Inc. – Class A (a) | | | 1,200 | | | | 487,800 | |
| Altair Engineering, Inc. – Class A (a) | | | 1,000 | | | | 39,750 | |
| Appian Corp. (a) | | | 1,500 | | | | 76,875 | |
| ChannelAdvisor Corp. (a) | | | 29,000 | | | | 459,360 | |
| Everbridge, Inc. (a) | | | 2,000 | | | | 276,720 | |
| GSE Systems, Inc. (a)(e) | | | 1,052,625 | | | | 1,063,151 | |
| Q2 Holdings, Inc. (a) | | | 8,000 | | | | 686,320 | |
| | | | | | | | 3,089,976 | |
| Specialty Retail (3.3%) | | | | | | | | |
| CarMax, Inc. (a)(c) | | | 20,500 | | | | 1,835,775 | |
| | | | | | | | | |
| Technology Hardware, Storage & Peripherals (15.0%) | | | | | | | | |
| Apple, Inc. (c) | | | 16,000 | | | | 5,836,800 | |
| Intevac, Inc. (a) | | | 88,450 | | | | 482,937 | |
| Super Micro Computer, Inc. (a) | | | 69,500 | | | | 1,973,105 | |
| | | | | | | | 8,292,842 | |
| Trading Companies & Distributors (0.6%) | | | | | | | | |
| Transcat, Inc. (a) | | | 13,500 | | | | 349,110 | |
| Total Common Stocks | | | | | | | | |
| (Cost $21,517,652) | | | | | | $ | 55,803,166 | |
See accompanying notes to financial statements.
Needham Aggressive Growth Fund
Schedule of Investments (Continued)
June 30, 2020 (Unaudited)
| | | Shares | | | Value | |
| Short-Term Investments (0.1%) | | | | | | |
| | | | | | | |
| Money Market Fund (0.1%) | | | | | | |
| Dreyfus Treasury Securities Cash Management – | | | | | | |
| Institutional Class 0.08% (b) | | | | | | |
| Total Short-Term Investment | | | | | | |
| (Cost $46,760) | | | 46,760 | | | $ | 46,760 | |
| | | | | | | | | |
| Total Investments (100.2%) | | | | | | | | |
| (Cost $21,564,412) | | | | | | | 55,849,926 | |
| Total Securities Sold Short (-0.4%) | | | | | | | (194,075 | ) |
| (Proceeds $116,901) | | | | | | | | |
| Other Assets in Excess of Liabilities (0.2%) | | | | | | | 119,968 | |
| Net Assets (100.0%) | | | | | | $ | 55,775,819 | |
| | Percentages are stated as a percent of net assets. |
| | Industry classifications may be different than those used for compliance monitoring purposes. |
| (a) | Non-income producing security. |
| (b) | Rate shown is the seven-day yield as of June 30, 2020. |
| (c) | Security position is either entirely or partially held in a segregated account as collateral for securities sold short, aggregating a total market value of $4,791,920. |
| (d) | As of June 30, 2020, the Fund had a significant portion of its assets invested in the Semiconductors & Semiconductor Equipment industry. |
| (e) | Affiliated security. Please refer to Note 11 of the Financial Statements. |
ADR
| American Depositary Receipt |
Distribution of investments by country or territory of incorporation, as a percentage of Total Investments, is as follows (Unaudited):
| Country | | Long | |
| United States^ | | | 91.4 | % | |
| Canada | | | 2.4 | % | |
| Taiwan | | | 0.8 | % | |
| Israel | | | 5.4 | % | |
| Total | | | 100.0 | % | |
| ^ | United States allocation includes Short-Term Investment-Money Market Fund of 0.1%. |
See accompanying notes to financial statements.
Needham Aggressive Growth Fund
Schedule of Securities Sold Short
June 30, 2020 (Unaudited)
| | | Shares | | | Value | |
| Securities Sold Short (-0.4%) | | | | | | |
| | | | | | | |
| Communications Equipment (0.1%) | | | | | | |
| Ubiquiti, Inc. | | | 200 | | | $ | 34,912 | |
| | | | | | | | | |
| Consumer Finance (0.0%) | | | | | | | | |
| Medallion Financial Corp. (a) | | | 750 | | | | 1,988 | |
| | | | | | | | | |
| Software (-0.3%) | | | | | | | | |
| Dynatrace, Inc. (a) | | | 1,750 | | | | 71,050 | |
| New Relic, Inc. (a) | | | 1,250 | | | | 86,125 | |
| | | | | | | | 157,175 | |
| Total Securities Sold Short (-0.4%) | | | | | | | | |
| (Proceeds $116,901) | | | | | | $ | 194,075 | |
| (a) | Non-income producing security. |
Distribution of investments by country or territory of incorporation, as a percentage of Total Securities Sold Short, is as follows (Unaudited):
| Country | | Short | |
| United States | | | 100.0 | % | |
| Total | | | 100.0 | % | |
See accompanying notes to financial statements.
Needham Small Cap Growth Fund
Schedule of Investments
June 30, 2020 (Unaudited)
| | | Shares | | | Value | |
| Common Stocks (91.9%) | | | | | | |
| | | | | | | |
| Aerospace & Defense (1.9%) | | | | | | |
| Parsons Corp. (a) | | | 90,000 | | | $ | 3,261,600 | |
| | | | | | | | | |
| Biotechnology (0.6%) | | | | | | | | |
| Voyager Therapeutics, Inc. (a) | | | 90,000 | | | | 1,135,800 | |
| | | | | | | | | |
| Communications Equipment (18.1%) | | | | | | | | |
| Cambium Networks Corp. (a) | | | 850,000 | | | | 6,256,000 | |
| EMCORE Corp. (a) | | | 1,300,000 | | | | 4,134,000 | |
| Infinera Corp. (a) | | | 1,100,000 | | | | 6,512,000 | |
| Inseego Corp. (a) | | | 400,000 | | | | 4,640,000 | |
| KVH Industries, Inc. (a)(b) | | | 525,000 | | | | 4,688,250 | |
| ViaSat, Inc. (a) | | | 130,000 | | | | 4,988,100 | |
| | | | | | | | 31,218,350 | |
| Diversified Telecommunication Services (1.7%) | | | | | | | | |
| Vonage Holdings Corp. (a) | | | 300,000 | | | | 3,018,000 | |
| | | | | | | | | |
| Electrical Equipment (0.2%) | | | | | | | | |
| Vicor Corp. (a)(b) | | | 5,000 | | | | 359,750 | |
| | | | | | | | | |
| Electronic Equipment, Instruments & Components (7.2%) | | | | | | | | |
| Akoustis Technologies, Inc. (a) | | | 514,000 | | | | 4,261,060 | |
| Frequency Electronics, Inc. (a) | | | 156,429 | | | | 1,370,318 | |
| Vishay Intertechnology, Inc. | | | 150,000 | | | | 2,290,500 | |
| Vishay Precision Group, Inc. (a) | | | 185,000 | | | | 4,547,300 | |
| | | | | | | | 12,469,178 | |
| Energy Equipment & Services (2.3%) | | | | | | | | |
| Aspen Aerogels, Inc. (a) | | | 600,000 | | | | 3,948,000 | |
| | | | | | | | | |
| Health Care Equipment & Supplies (4.4%) | | | | | | | | |
| Inogen, Inc. (a) | | | 140,000 | | | | 4,972,800 | |
| Sientra, Inc. (a) | | | 150,000 | | | | 580,500 | |
| ViewRay, Inc. (a) | | | 950,000 | | | | 2,128,000 | |
| | | | | | | | 7,681,300 | |
| IT Services (4.9%) | | | | | | | | |
| Limelight Networks, Inc. (a) | | | 1,150,000 | | | | 8,464,000 | |
| | | | | | | | | |
| Life Sciences Tools & Services (1.3%) | | | | | | | | |
| Fluidigm Corp. (a) | | | 562,500 | | | | 2,255,625 | |
See accompanying notes to financial statements.
Needham Small Cap Growth Fund
Schedule of Investments (Continued)
June 30, 2020 (Unaudited)
| | | Shares | | | Value | |
| Common Stocks – Continued | | | | | | |
| | | | | | | |
| Oil, Gas & Consumable Fuels (0.7%) | | | | | | |
| Navigator Holdings, Ltd. (a) | | | 180,000 | | | $ | 1,157,400 | |
| | | | | | | | | |
| Semiconductors & Semiconductor Equipment (16.7%) | | | | | | | | |
| AXT, Inc. (a) | | | 1,225,000 | | | | 5,831,000 | |
| Cohu, Inc. | | | 275,000 | | | | 4,768,500 | |
| Ichor Holdings Ltd. (a) | | | 25,000 | | | | 664,500 | |
| MaxLinear, Inc. (a) | | | 450,000 | | | | 9,657,000 | |
| PDF Solutions, Inc. (a)(b) | | | 75,000 | | | | 1,467,000 | |
| Photronics, Inc. (a) | | | 425,000 | | | | 4,730,250 | |
| Veeco Instruments, Inc. (a) | | | 126,700 | | | | 1,709,183 | |
| | | | | | | | 28,827,433 | |
| Software (31.5%) (d) | | | | | | | | |
| 8x8, Inc. (a) | | | 450,000 | | | | 7,200,000 | |
| Bottomline Technologies DE, Inc. (a) | | | 30,000 | | | | 1,523,100 | |
| ChannelAdvisor Corp. (a) | | | 275,000 | | | | 4,356,000 | |
| FireEye, Inc. (a) | | | 850,000 | | | | 10,348,750 | |
| Mimecast Ltd. (a) | | | 150,000 | | | | 6,249,000 | |
| Pluralsight, Inc. – Class A (a) | | | 325,000 | | | | 5,866,250 | |
| Zuora, Inc. – Class A (a) | | | 179,500 | | | | 2,288,625 | |
| Intevac, Inc. (a) | | | 1,017,175 | | | | 5,553,775 | |
| Pure Storage, Inc., Class A (a) | | | 320,000 | | | | 5,545,600 | |
| Super Micro Computer, Inc. (a)(b) | | | 200,000 | | | | 5,678,000 | |
| | | | | | | | 54,609,100 | |
| Trading Companies & Distributors (0.4%) | | | | | | | | |
| Air Lease Corp. | | | 22,500 | | | | 659,025 | |
| Total Common Stocks | | | | | | | | |
| (Cost $145,175,870) | | | | | | $ | 159,064,561 | |
See accompanying notes to financial statements.
Needham Small Cap Growth Fund
Schedule of Investments (Continued)
June 30, 2020 (Unaudited)
| | | Shares | | | Value | |
| Short-Term Investments (6.5%) | | | | | | |
| | | | | | | |
| Money Market Fund (6.5%) | | | | | | |
| Dreyfus Treasury Securities Cash Management – | | | | | | |
| Institutional Class 0.08% (c) | | | | | | |
| Total Short-Term Investments | | | | | | |
| (Cost $11,172,873) | | | 11,172,873 | | | $ | 11,172,873 | |
| | | | | | | | | |
| Total Investments (98.4%) | | | | | | | | |
| (Cost $156,348,743) | | | | | | | 170,237,434 | |
| Total Securities Sold Short (-1.4%) | | | | | | | (2,387,200 | ) |
| (Proceeds $2,379,026) | | | | | | | | |
| Other Assets in Excess of Liabilities (3.0%) | | | | | | | 4,959,270 | |
| Net Assets (100.0%) | | | | | | $ | 172,809,504 | |
| | Percentages are stated as a percent of net assets. |
| | Industry classifications may be different than those used for compliance monitoring purposes. |
| (a) | Non-income producing security. |
| (b) | Security position is either entirely or partially held in a segregated account as collateral for securities sold short, aggregating a total market value of $2,267,625. |
| (c) | Rate shown is the seven day yield as of June 30, 2020. |
| (d) | As of June 30, 2020, the Fund had a significant portion of its assets invested in the Software industry. |
Distribution of investments by country or territory of incorporation, as a percentage of Total Investments, is as follows (Unaudited):
| Country | | Long | |
| United States^ | | | 95.6 | % | |
| Jersey | | | 3.7 | % | |
| Marshall Islands | | | 0.7 | % | |
| Total | | | 100.0 | % | |
| ^ | United States allocation includes Short-Term Investment-Money Market Fund of 6.60%. |
See accompanying notes to financial statements.
Needham Small Cap Growth Fund
Schedule of Securities Sold Short
June 30, 2020 (Unaudited)
| | | Shares | | | Value | |
| Securities Sold Short (-1.4%) | | | | | | |
| | | | | | | |
| Semiconductors & Semiconductor Equipment (-0.5%) | | | | | | |
| Brooks Automation, Inc. | | | 20,000 | | | $ | 884,800 | |
| | | | | | | | | |
| Software (-0.9%) | | | | | | | | |
| SPS Commerce, Inc. (a) | | | 20,000 | | | | 1,502,400 | |
| Total Securities Sold Short (-1.4%) | | | | | | | | |
(Proceeds $2,379,026) | | | | | | $ | 2,387,200 | |
| (a) | Non-income producing security. |
Distribution of investments by country or territory of incorporation, as a percentage of Total Securities Sold Short, is as follows (Unaudited):
| Country | | Short | |
| United States | | | 100.0 | % | |
| Total | | | 100.0 | % | |
See accompanying notes to financial statements.
Statements of Assets and Liabilities
June 30, 2020 (Unaudited)
| | | | | | Needham | | | Needham | |
| | | Needham | | | Aggressive | | | Small Cap | |
| | | Growth Fund | | | Growth Fund | | | Growth Fund | |
| Assets | | | | | | | | | |
| Investments, at Value: | | | | | | | | | |
| Unaffiliated securities, | | | | | | | | | |
| (Cost $45,432,670, $19,583,177, $156,348,743) | | $ | 112,173,670 | | | $ | 54,786,775 | | | $ | 170,237,434 | |
| Affiliated securities (Cost $—, $1,981,235, $—) | | | — | | | | 1,063,151 | | | | — | |
| Cash | | | | | | | | | | | | |
| Receivables: | | | | | | | | | | | | |
| Deposit with Broker for Securities Sold Short | | | 326,701 | | | | 213,471 | | | | 154,830 | |
| Dividends and Interest | | | 58,537 | | | | 2,701 | | | | 5,256 | |
| From Adviser | | | 10,189 | | | | — | | | | — | |
| Fund Shares Sold | | | 8,013 | | | | 5,023 | | | | 275,552 | |
| Investment Securities Sold | | | 674,903 | | | | 32,207 | | | | 4,990,694 | |
| Prepaid Expenses | | | 38,385 | | | | 5,418 | | | | 58,885 | |
| Total Assets | | | 113,290,398 | | | | 56,108,746 | | | | 175,722,651 | |
| | | | | | | | | | | | | |
| Liabilities | | | | | | | | | | | | |
| Securities Sold Short, at Value | | | | | | | | | | | | |
| (Proceeds $721,604, $116,901, $2,379,026) | | | 847,218 | | | | 194,075 | | | | 2,387,200 | |
| Payables: | | | | | | | | | | | | |
| Investment Securities Purchased | | | 13,504 | | | | 6,752 | | | | 83,469 | |
| Fund Shares Redeemed | | | — | | | | 14,021 | | | | 205,747 | |
| Due to Adviser | | | 113,063 | | | | 42,594 | | | | 170,481 | |
| Distribution Fees | | | 13,673 | | | | 6,346 | | | | 24,943 | |
| Administration and Accounting Fees | | | 29,471 | | | | 15,884 | | | | 2,538 | |
| Transfer Agent Fees | | | 13,519 | | | | 7,771 | | | | 4,574 | |
| Directors’ Fees | | | 3,046 | | | | 1,299 | | | | 3,654 | |
| Accrued Expenses and Other Liabilities | | | 59,535 | | | | 44,185 | | | | 30,541 | |
| Total Liabilities | | | 1,093,029 | | | | 332,927 | | | | 2,913,147 | |
| Total Net Assets | | $ | 112,197,369 | | | $ | 55,775,819 | | | $ | 172,809,504 | |
See accompanying notes to financial statements.
Statements of Assets and Liabilities (Continued)
June 30, 2020 (Unaudited)
| | | | | | Needham | | | Needham | |
| | | Needham | | | Aggressive | | | Small Cap | |
| | | Growth Fund | | | Growth Fund | | | Growth Fund | |
| Retail Class Shares | | | | | | | | | |
| Net Assets | | $ | 65,081,485 | | | $ | 30,854,825 | | | $ | 123,602,436 | |
| Shares Issued and Outstanding | | | | | | | | | | | | |
| $0.001 Par Value (Authorized | | | | | | | | | | | | |
| 800,000,000,100,000,000 and | | | | | | | | | | | | |
| 100,000,000 respectively) | | | 1,459,487 | | | | 1,258,021 | | | | 6,138,173 | |
| Net Asset Value and | | | | | | | | | | | | |
| Offering Price Per Share | | $ | 44.59 | | | $ | 24.53 | | | $ | 20.14 | |
| | | | | | | | | | | | | |
| Institutional Class Shares | | | | | | | | | | | | |
| Net Assets | | $ | 47,115,884 | | | $ | 24,920,994 | | | $ | 49,207,068 | |
| Shares Issued and Outstanding | | | | | | | | | | | | |
| $0.001 Par Value (Authorized | | | | | | | | | | | | |
| 800,000,000,100,000,000 and | | | | | | | | | | | | |
| 100,000,000 respectively) | | | 1,033,145 | | | | 992,300 | | | | 2,384,745 | |
| Net Asset Value and | | | | | | | | | | | | |
| Offering Price Per Share | | $ | 45.60 | | | $ | 25.11 | | | $ | 20.63 | |
| | | | | | | | | | | | | |
| Components of Net Assets | | | | | | | | | | | | |
| Paid in Capital | | | 39,480,414 | | | | 20,451,527 | | | | 146,144,499 | |
| Distributable Earnings | | | 72,716,955 | | | | 35,324,292 | | | | 26,665,005 | |
| Total Net Assets | | $ | 112,197,369 | | | $ | 55,775,819 | | | $ | 172,809,504 | |
See accompanying notes to financial statements.
Statements of Operations
For the period ended June 30, 2020 (Unaudited)
| | | | | | Needham | | | Needham | |
| | | Needham | | | Aggressive | | | Small Cap | |
| | | Growth Fund | | | Growth Fund | | | Growth Fund | |
| Investment Income | | | | | | | | | |
| Dividend Income from unaffiliated securities (net of | | | | | | | | | |
| foreign withholding tax of $2,114 $1,327, $—) | | $ | 394,351 | | | $ | 106,855 | | | $ | 14,393 | |
| Interest Income | | | 13,711 | | | | 8,461 | | | | 261,359 | |
| Total Investment Income | | | 408,062 | | | | 115,316 | | | | 275,752 | |
| | | | | | | | | | | | | |
| Expenses | | | | | | | | | | | | |
| Investment Advisory Fees | | | 667,699 | | | | 320,470 | | | | 929,253 | |
| Distribution Fees | | | 76,651 | | | | 35,188 | | | | 131,997 | |
| Administration and Accounting Fees | | | 65,583 | | | | 37,041 | | | | 51,030 | |
| Audit Fees | | | 15,348 | | | | 14,735 | | | | 15,546 | |
| Chief Compliance Officer Fees | | | 7,264 | | | | 3,408 | | | | 7,748 | |
| Custodian Fees | | | 6,958 | | | | 4,461 | | | | 6,225 | |
| Directors’ Fees | | | 7,343 | | | | 3,465 | | | | 6,764 | |
Dividend Expense(1) | | | 525 | | | | 225 | | | | — | |
| Filing Fees | | | 19,466 | | | | 32,351 | | | | 21,157 | |
Interest Expense(1) | | | 69 | | | | 27 | | | | — | |
| Legal Fees | | | 35,033 | | | | 16,443 | | | | 31,113 | |
| Printing Fees | | | 3,633 | | | | 1,938 | | | | 4,664 | |
| Transfer Agent Fees | | | 19,819 | | | | 9,072 | | | | 16,489 | |
| Other Expenses | | | 15,859 | | | | 8,457 | | | | 6,959 | |
| Total Expenses | | | 941,250 | | | | 487,281 | | | | 1,228,945 | |
| Fees Waived/Recouped by Investment Adviser | | | (34,389 | ) | | | (56,349 | ) | | | 2,081 | |
| Net Expenses | | | 906,861 | | | | 430,932 | | | | 1,231,026 | |
| Net Investment Loss | | | (498,799 | ) | | | (315,616 | ) | | | (955,274 | ) |
| | | | | | | | | | | | | |
| Net Realized / Unrealized Gain (Loss) from | | | | | | | | | | | | |
| Affiliated and unaffiliated securities, Securities | | | | | | | | | | | | |
| Sold Short, Foreign Currency Transactions (Note 3) | | | | | | | | | | | | |
| Net Realized Gain from Unaffiliated Securities | | | 3,970,250 | | | | 1,597,969 | | | | 11,524,764 | |
| Net Realized Loss from Securities Sold Short | | | (370,729 | ) | | | (160,598 | ) | | | 73,926 | |
| Change in Unrealized Appreciation on | | | | | | | | | | | | |
| Unaffiliated Securities and Securities Sold Short | | | 2,412,866 | | | | 5,060,678 | | | | 5,789,937 | |
| Change in Unrealized Appreciation on Affiliated Securities | | | — | | | | (673,680 | ) | | | — | |
| Net Realized / Unrealized Gain (Loss) from Affiliated | | | | | | | | | | | | |
| and Unaffiliated Securities, Securities Sold Short, | | | | | | | | | | | | |
| Foreign Currency Translations (Note 3) | | | 6,012,387 | | | | 5,824,369 | | | | 17,388,627 | |
| Change in Net Assets Resulting from Operations | | $ | 5,513,588 | | | $ | 5,508,753 | | | $ | 16,433,353 | |
(1) | Expense related to securities sold short. |
See accompanying notes to financial statements.
Needham Growth Fund
Statements of Changes in Net Assets
| | | Period Ended | | | | |
| | | June 30, 2020 | | | Year Ended | |
| | | (Unaudited) | | | December 31, 2019 | |
| Change in Net Assets | | | | | | |
| Operations: | | | | | | |
| Net Investment Loss | | $ | (498,799 | ) | | $ | (961,241 | ) |
| Net Realized Gain from Securities, Securities Sold Short, | | | | | | | | |
| Foreign Currency Transactions, and Currency | | | 3,599,521 | | | | 6,876,369 | |
| Net Change in Unrealized Appreciation (Depreciation) on | | | | | | | | |
| Investments, Securities Sold Short, Foreign Currency Translations | | | 2,412,866 | | | | 27,738,179 | |
| Change in Net Assets Resulting from Operations | | | 5,513,588 | | | | 33,653,307 | |
| | | | | | | | | |
| Distributions to Shareholders from: | | | | | | | | |
| Distributable Earnings | | | — | | | | (11,150,898 | ) |
| | | | | | | | | |
| Capital Transactions: | | | | | | | | |
| Retail Class: | | | | | | | | |
| Shares Issued | | | 1,927,876 | | | | 2,797,341 | |
| Shares Issued in Reinvestment of Distribution | | | — | | | | 6,238,725 | |
| Shares Exchanged for Institutional Class Shares | | | (195,232 | ) | | | (609,257 | ) |
| Shares Redeemed | | | (5,573,803 | ) | | | (11,380,847 | ) |
| Institutional Class: | | | | | | | | |
| Shares Issued | | | 7,127,923 | | | | 5,618,710 | |
| Shares Issued in Reinvestment of Distribution | | | — | | | | 4,144,602 | |
| Shares Issued in Exchange for Retail Class Shares | | | 195,232 | | | | 609,257 | |
| Shares Redeemed | | | (7,283,471 | ) | | | (2,829,421 | ) |
| Total Change in Net Assets from Capital Transactions | | | (3,801,475 | ) | | | 4,589,110 | |
| | | | | | | | | |
| Change in Net Assets | | | 1,712,113 | | | | 27,091,519 | |
| | | | | | | | | |
| Total Net Assets | | | | | | | | |
| Beginning of Period/Year | | | 110,485,256 | | | | 83,393,737 | |
| End of Period/Year | | $ | 112,197,369 | | | $ | 110,485,256 | |
| | | | | | | | | |
| Share Transaction: | | | | | | | | |
| Retail Class: | | | | | | | | |
| Number of Shares Issued | | | 46,406 | | | | 66,920 | |
| Number of Shares Reinvested | | | — | | | | 157,823 | |
| Number of Shares Exchanged for Institutional Class Shares | | | (4,844 | ) | | | (16,407 | ) |
| Number of Shares Redeemed | | | (142,516 | ) | | | (289,538 | ) |
| Change in Retail Class Shares | | | (100,954 | ) | | | (81,202 | ) |
| Institutional Class: | | | | | | | | |
| Number of Shares Issued | | | 161,578 | | | | 130,488 | |
| Number of Shares Reinvested | | | — | | | | 102,869 | |
| Number of Shares Issued in Exchange for Retail Class Shares | | | 4,741 | | | | 16,181 | |
| Number of Shares Redeemed | | | (182,781 | ) | | | (71,300 | ) |
| Change in Institutional Class Shares | | | (16,462 | ) | | | 178,238 | |
| Total Change in Shares | | | (117,416 | ) | | | 97,036 | |
See accompanying notes to financial statements.
Needham Aggressive Growth Fund
Statements of Changes in Net Assets
| | | Period Ended | | | | |
| | | June 30, 2020 | | | Year Ended | |
| | | (Unaudited) | | | December 31, 2019 | |
| Change in Net Assets | | | | | | |
| Operations: | | | | | | |
| Net Investment Loss | | $ | (315,616 | ) | | $ | (573,290 | ) |
| Net Realized Gain from Securities, Securities Sold Short, | | | | | | | | |
| Foreign Currency Transactions, and Currency | | | 1,437,371 | | | | 3,753,492 | |
| Net Change in Unrealized Appreciation (Depreciation) on | | | | | | | | |
| Investments, Securities Sold Short, Foreign Currency Translations | | | 4,386,998 | | | | 13,584,503 | |
| Change in Net Assets Resulting from Operations | | | 5,508,753 | | | | 16,764,705 | |
| | | | | | | | | |
| Distributions to Shareholders from: | | | | | | | | |
| Distributable Earnings | | | — | | | | (4,975,386 | ) |
| | | | | | | | | |
| Capital Transactions: | | | | | | | | |
| Retail Class: | | | | | | | | |
| Shares Issued | | | 1,698,545 | | | | 1,808,099 | |
| Shares Issued in Reinvestment of Distribution | | | — | | | | 2,926,680 | |
| Shares Exchanged for Institutional Class Shares | | | (29,758 | ) | | | (1,367,428 | ) |
| Shares Redeemed | | | (4,181,860 | ) | | | (7,657,411 | ) |
| Institutional Class: | | | | | | | | |
| Shares Issued | | | 853,481 | | | | 6,220,562 | |
| Shares Issued in Reinvestment of Distribution | | | — | | | | 2,002,195 | |
| Shares Issued in Exchange for Retail Class Shares | | | 29,758 | | | | 1,367,428 | |
| Shares Redeemed | | | (4,162,825 | ) | | | (1,627,132 | ) |
| Total Change in Net Assets from Capital Transactions | | | (5,792,659 | ) | | | 3,672,993 | |
| | | | | | | | | |
| Change in Net Assets | | | (283,906 | ) | | | 15,462,312 | |
| | | | | | | | | |
| Total Net Assets | | | | | | | | |
| Beginning of Period/Year | | | 56,059,725 | | | | 40,597,413 | |
| End of Period/Year | | $ | 55,775,819 | | | $ | 56,059,725 | |
| | | | | | | | | |
| Share Transaction: | | | | | | | | |
| Retail Class: | | | | | | | | |
| Number of Shares Issued | | | 78,997 | | | | 85,672 | |
| Number of Shares Reinvested | | | — | | | | 144,885 | |
| Number of Shares Exchanged for Institutional Class Shares | | | (1,385 | ) | | | (68,640 | ) |
| Number of Shares Redeemed | | | (208,412 | ) | | | (381,645 | ) |
| Change in Retail Class Shares | | | (130,800 | ) | | | (219,728 | ) |
| Institutional Class: | | | | | | | | |
| Number of Shares Issued | | | 36,721 | | | | 286,847 | |
| Number of Shares Reinvested | | | — | | | | 97,147 | |
| Number of Shares Issued in Exchange for Retail Class Shares | | | 1,355 | | | | 67,464 | |
| Number of Shares Redeemed | | | (207,216 | ) | | | (78,919 | ) |
| Change in Institutional Class Shares | | | (169,140 | ) | | | 372,539 | |
| Total Change in Shares | | | (299,940 | ) | | | 152,811 | |
See accompanying notes to financial statements.
Needham Small Cap Growth Fund
Statements of Changes in Net Assets
| | | Period Ended | | | | |
| | | June 30, 2020 | | | Year Ended | |
| | | (Unaudited) | | | December 31, 2019 | |
| Change in Net Assets | | | | | | |
| Operations: | | | | | | |
| Net Investment Loss | | $ | (955,274 | ) | | $ | (420,133 | ) |
| Net Realized Gain from Securities, Securities Sold Short, | | | | | | | | |
| Foreign Currency Transactions, and Currency | | | 11,598,690 | | | | 6,998,200 | |
| Net Change in Unrealized Appreciation (Depreciation) on | | | | | | | | |
| Investments, Securities Sold Short, Foreign Currency Translations | | | 5,789,937 | | | | 10,435,265 | |
| Change in Net Assets Resulting from Operations | | | 16,433,353 | | | | 17,013,331 | |
| | | | | | | | | |
| Distributions to Shareholders from: | | | | | | | | |
| Distributable Earnings | | | — | | | | (4,004,063 | ) |
| | | | | | | | | |
| Capital Transactions: | | | | | | | | |
| Retail Class: | | | | | | | | |
| Shares Issued | | | 64,014,277 | | | | 70,656,572 | |
| Shares Issued in Reinvestment of Distribution | | | — | | | | 2,044,608 | |
| Shares Exchanged for Institutional Class Shares | | | (102,090 | ) | | | (167,969 | ) |
| Shares Redeemed | | | (38,528,840 | ) | | | (5,572,277 | ) |
| Institutional Class: | | | | | | | | |
| Shares Issued | | | 17,249,330 | | | | 28,146,610 | |
| Shares Issued in Reinvestment of Distribution | | | — | | | | 1,902,565 | |
| Shares Issued in Exchange for Retail Class Shares | | | 102,090 | | | | 167,969 | |
| Shares Redeemed | | | (18,468,480 | ) | | | (2,731,986 | ) |
| Total Change in Net Assets from Capital Transactions | | | 24,266,287 | | | | 94,446,092 | |
| | | | | | | | | |
| Change in Net Assets | | | 40,699,640 | | | | 107,455,360 | |
| | | | | | | | | |
| Total Net Assets | | | | | | | | |
| Beginning of Period/Year | | | 132,109,864 | | | | 24,654,504 | |
| End of Period/Year | | $ | 172,809,504 | | | $ | 132,109,864 | |
| | | | | | | | | |
| Share Transaction: | | | | | | | | |
| Retail Class: | | | | | | | | |
| Number of Shares Issued | | | 3,648,206 | | | | 4,096,204 | |
| Number of Shares Reinvested | | | — | | | | 122,432 | |
| Number of Shares Exchanged for Institutional Class Shares | | | (5,520 | ) | | | (10,353 | ) |
| Number of Shares Redeemed | | | (2,366,632 | ) | | | (352,870 | ) |
| Change in Retail Class Shares | | | 1,276,054 | | | | 3,855,413 | |
| Institutional Class: | | | | | | | | |
| Number of Shares Issued | | | 948,466 | | | | 1,668,920 | |
| Number of Shares Reinvested | | | — | | | | 111,653 | |
| Number of Shares Issued in Exchange for Retail Class Shares | | | 5,392 | | | | 10,176 | |
| Number of Shares Redeemed | | | (1,162,560 | ) | | | (165,549 | ) |
| Change in Institutional Class Shares | | | (208,702 | ) | | | 1,625,200 | |
| Total Change in Shares | | | 1,067,352 | | | | 5,480,613 | |
See accompanying notes to financial statements.
Needham Growth Fund
Financial Highlights
| | | Retail Class | |
| | | Six Months | | | | | | | | | | | | | | | | |
| | | Ended | | | | | | | | | | | | | | | | |
| (For a Share Outstanding | | June 30, 2020 | | | Year Ended December 31, | |
| Throughout each Period/Year) | | (Unaudited) | | | 2019 | | | 2018 | | | 2017 | | | 2016 | | | 2015 | |
| Net Asset Value, | | | | | | | | | | | | | | | | | | |
| Beginning of Year | | $ | 41.99 | | | $ | 33.04 | | | $ | 42.91 | | | $ | 43.40 | | | $ | 40.96 | | | $ | 46.00 | |
| Investment Operations | | | | | | | | | | | | | | | | | | | | | | | | |
| Net Investment Income (Loss) | | | (0.23 | ) | | | (0.48 | ) | | | (0.88 | ) | | | (0.78 | ) | | | (0.59 | ) | | | (0.68 | ) |
| Net Realized and Unrealized | | | | | | | | | | | | | | | | | | | | | | | | |
| Gain (Loss) on Investments | | | 2.83 | | | | 14.18 | | | | (3.11 | ) | | | 4.45 | | | | 4.86 | | | | (1.60 | ) |
| Total from | | | | | | | | | | | | | | | | | | | | | | | | |
| Investment Operations | | | 2.60 | | | | 13.70 | | | | (3.99 | ) | | | 3.67 | | | | 4.27 | | | | (2.28 | ) |
| | | | | | | | | | | | | | | | | | | | | | | | | |
| Less Distributions | | | | | | | | | | | | | | | | | | | | | | | | |
| Net Realized Gains | | | — | | | | (4.75 | ) | | | (5.88 | ) | | | (4.16 | ) | | | (1.83 | ) | | | (2.76 | ) |
| Total Distributions | | | — | | | | (4.75 | ) | | | (5.88 | ) | | | (4.16 | ) | | | (1.83 | ) | | | (2.76 | ) |
| | | | | | | | | | | | | | | | | | | | | | | | | |
| Capital Contributions | | | | | | | | | | | | | | | | | | | | | | | | |
| Redemption Fees | | | — | | | | — | | | | — | | | | — | (1) | | | — | (1) | | | — | (1) |
| Total Capital Contributions | | | — | | | | — | | | | — | | | | — | (1) | | | — | (1) | | | — | (1) |
| Net Asset Value, | | | | | | | | | | | | | | | | | | | | | | | | |
| End of Year | | $ | 44.59 | | | $ | 41.99 | | | $ | 33.04 | | | $ | 42.91 | | | $ | 43.40 | | | $ | 40.96 | |
| | | | | | | | | | | | | | | | | | | | | | | | | |
| Total Return | | | 6.19 | %(3) | | | 42.31 | %(4) | | | (10.26 | )% | | | 8.32 | % | | | 10.57 | % | | | (5.07 | )% |
| Net Assets, | | | | | | | | | | | | | | | | | | | | | | | | |
| End of Period (000’s) | | $ | 65,081 | | | $ | 65,526 | | | $ | 54,245 | | | $ | 78,014 | | | $ | 119,117 | | | $ | 127,154 | |
| Ratios/Supplemental Data | | | | | | | | | | | | | | | | | | | | | | | | |
| Ratio of Net Expenses to | | | | | | | | | | | | | | | | | | | | | | | | |
| Average Net Assets | | | 1.92 | %(2) | | | 1.98 | % | | | 2.76 | % | | | 2.34 | % | | | 2.17 | % | | | 2.05 | % |
| Ratio of Net Expenses to | | | | | | | | | | | | | | | | | | | | | | | | |
| Average Net Assets (before | | | | | | | | | | | | | | | | | | | | | | | | |
| interest and dividend expense) | | | 1.92 | %(2) | | | 1.95 | % | | | 1.92 | % | | | 1.90 | % | | | 1.84 | % | | | 1.82 | % |
| Ratio of Total Expenses to | | | | | | | | | | | | | | | | | | | | | | | | |
| Average Net Assets (before waiver | | | | | | | | | | | | | | | | | | | | | | | | |
| and reimbursement of expenses) | | | 1.87 | %(2) | | | 2.01 | % | | | 2.76 | % | | | 2.34 | % | | | 2.17 | % | | | 2.05 | % |
| Ratio of Net Investment | | | | | | | | | | | | | | | | | | | | | | | | |
| Loss to Average Net Assets | | | (1.16 | )%(2) | | | (1.21 | )% | | | (2.07 | )% | | | (1.73 | )% | | | (1.36 | )% | | | (1.48 | )% |
| Ratio of Net Investment | | | | | | | | | | | | | | | | | | | | | | | | |
| Loss to Average Net Assets | | | | | | | | | | | | | | | | | | | | | | | | |
| (before waivers and | | | | | | | | | | | | | | | | | | | | | | | | |
| reimbursements of expenses) | | | (1.11 | )%(2) | | | (1.24 | )% | | | (2.07 | )% | | | (1.73 | )% | | | (1.36 | )% | | | (1.48 | )% |
| Portfolio turnover rate | | | 9 | %(3) | | | 13 | % | | | 8 | % | | | 9 | % | | | 12 | % | | | 13 | % |
(1) | Value is less than $0.005 per share. |
(2) | Annualized for periods less than one year. |
(3) | Not annualized for periods less than one year. |
(4) | The return reflects the actual performance for the year and does not include the impact of any adjustments made for financial reporting required by Generally Accepted Accounting Principles (GAAP). |
See accompanying notes to financial statements.
Needham Growth Fund
Financial Highlights
| | | Institutional Class | |
| | | | | | | | | | | | | | | Period from | |
| | | | | | | | | | | | | | | December 30, | |
| Six Months | | | | | | | | | | | | | | 2016 | |
| Ended | | | | | | | | | | | | | | through | |
| (For a Share Outstanding | | June 30, 2020 | | | Year Ended December 31, | | | December 31, | |
| Throughout each Period/Year) | | (Unaudited) | | | 2019 | | | 2018 | | | 2017 | | | 2016(1) | |
| Net Asset Value, Beginning of Period/Year | | $ | 42.83 | | | $ | 33.45 | | | $ | 43.15 | | | $ | 43.40 | | | $ | 43.40 | |
| Investment Operations | | | | | | | | | | | | | | | | | | | | |
| Net Investment Loss | | | (0.13 | ) | | | (0.26 | ) | | | (0.65 | ) | | | (0.56 | ) | | | — | |
| Net Realized and Unrealized | | | | | | | | | | | | | | | | | | | | |
| Gain (Loss) on Investments | | | 2.90 | | | | 14.39 | | | | (3.17 | ) | | | 4.47 | | | | — | |
| Total from Investment Operations | | | 2.77 | | | | 14.13 | | | | (3.82 | ) | | | 3.91 | | | | — | |
| | | | | | | | | | | | | | | | | | | | | |
| Less Distributions | | | | | | | | | | | | | | | | | | | | |
| Net Realized Gains | | | — | | | | (4.75 | ) | | | (5.88 | ) | | | (4.16 | ) | | | — | |
| Total Distributions | | | — | | | | (4.75 | ) | | | (5.88 | ) | | | (4.16 | ) | | | — | |
| Net Asset Value, End of Period/Year | | $ | 45.60 | | | $ | 42.83 | | | $ | 33.45 | | | $ | 43.15 | | | $ | 43.40 | |
| | | | | | | | | | | | | | | | | | | | | |
| Total Return | | | 6.47 | %(4) | | | 43.13 | % | | | (9.83 | )% | | | 8.89 | % | | | 0.00 | % |
| Net Assets, End of Period/Year (000’s) | | $ | 47,116 | | | $ | 44,959 | | | $ | 29,149 | | | $ | 32,476 | | | $ | 117 | |
| Ratios/Supplemental Data | | | | | | | | | | | | | | | | | | | | |
| Ratio of Net Expenses to | | | | | | | | | | | | | | | | | | | | |
| Average Net Assets | | | 1.40 | %(3) | | | 1.43 | % | | | 2.21 | % | | | 1.90 | % | | | 1.40 | % |
| Ratio of Net Expenses to Average | | | | | | | | | | | | | | | | | | | | |
| Net Assets (before interest | | | | | | | | | | | | | | | | | | | | |
| and dividend expense) | | | 1.40 | %(3) | | | 1.40 | % | | | 1.40 | % | | | 1.40 | % | | | 1.40 | % |
| Ratio of Total Expenses to Average | | | | | | | | | | | | | | | | | | | | |
| Net Assets (before waiver | | | | | | | | | | | | | | | | | | | | |
| and reimbursement of expenses) | | | 1.62 | %(3) | | | 1.73 | % | | | 2.48 | % | | | 2.15 | % | | | — | %(2) |
| Ratio of Net Investment Loss | | | | | | | | | | | | | | | | | | | | |
| to Average Net Assets | | | (0.63 | )%(3) | | | (0.65 | )% | | | (1.52 | )% | | | (1.24 | )% | | | — | %(2) |
| Ratio of Net Investment Loss to | | | | | | | | | | | | | | | | | | | | |
| Average Net Assets (before waivers | | | | | | | | | | | | | | | | | | | | |
| and reimbursements of expenses) | | | (0.85 | )%(3) | | | (0.95 | )% | | | (1.79 | )% | | | (1.49 | )% | | | — | %(2) |
| Portfolio turnover rate | | | 9 | %(4) | | | 13 | % | | | 8 | % | | | 9 | % | | | 0 | % |
(1) | The Class commenced operations on December 30, 2016. |
(2) | Refer to Note 2 for further description of non-recurring charges related to the issuance of the share class. |
(3) | Annualized for periods less than one year. |
(4) | Not annualized for periods less than one year. |
See accompanying notes to financial statements.
Needham Aggressive Growth Fund
Financial Highlights
| | | Retail Class | |
| | | Six Months | | | | | | | | | | | | | | | | |
| | | Ended | | | | | | | | | | | | | | | | |
| (For a Share Outstanding | | June 30, 2020 | | | Year Ended December 31, | |
| Throughout each Period/Year) | | (Unaudited) | | | 2019 | | | 2018 | | | 2017 | | | 2016 | | | 2015 | |
| Net Asset Value, | | | | | | | | | | | | | | | | | | |
| Beginning of Year | | $ | 21.77 | | | $ | 16.86 | | | $ | 23.07 | | | $ | 22.29 | | | $ | 19.56 | | | $ | 23.55 | |
| Investment Operations | | | | | | | | | | | | | | | | | | | | | | | | |
| Net Investment Loss | | | (0.16 | ) | | | (0.30 | ) | | | (0.54 | ) | | | (0.49 | ) | | | (0.38 | ) | | | (0.39 | ) |
| Net Realized and Unrealized | | | | | | | | | | | | | | | | | | | | | | | | |
| Gain (Loss) on Investments | | | 2.92 | | | | 7.53 | | | | (2.88 | ) | | | 2.46 | | | | 4.61 | | | | (1.28 | ) |
| Total from | | | | | | | | | | | | | | | | | | | | | | | | |
| Investment Operations | | | 2.76 | | | | 7.23 | | | | (3.42 | ) | | | 1.97 | | | | 4.23 | | | | (1.67 | ) |
| | | | | | | | | | | | | | | | | | | | | | | | | |
| Less Distributions | | | | | | | | | | | | | | | | | | | | | | | | |
| Net Realized Gains | | | — | | | | (2.32 | ) | | | (2.79 | ) | | | (1.19 | ) | | | (1.50 | ) | | | (2.32 | ) |
| Total Distributions | | | — | | | | (2.32 | ) | | | (2.79 | ) | | | (1.19 | ) | | | (1.50 | ) | | | (2.32 | ) |
| | | | | | | | | | | | | | | | | | | | | | | | | |
| Capital Contributions | | | | | | | | | | | | | | | | | | | | | | | | |
| Redemption Fees | | | — | | | | — | | | | — | | | | — | (1) | | | — | (1) | | | — | (1) |
| Total Capital Contributions | | | — | | | | — | | | | — | | | | — | (1) | | | — | (1) | | | — | (1) |
| Net Asset Value, | | | | | | | | | | | | | | | | | | | | | | | | |
| End of Year | | $ | 24.53 | | | $ | 21.77 | | | $ | 16.86 | | | $ | 23.07 | | | $ | 22.29 | | | $ | 19.56 | |
| | | | | | | | | | | | | | | | | | | | | | | | | |
| Total Return | | | 12.68 | %(3) | | | 43.93 | % | | | (15.80 | )% | | | 8.73 | % | | | 22.18 | % | | | (7.09 | )%(5) |
| Net Assets, | | | | | | | | | | | | | | | | | | | | | | | | |
| End of Year (000’s) | | $ | 30,855 | | | $ | 30,238 | | | $ | 27,119 | | | $ | 41,107 | | | $ | 58,696 | | | $ | 50,906 | |
| Ratios/Supplemental Data | | | | | | | | | | | | | | | | | | | | | | | | |
| Ratio of Net Expenses to | | | | | | | | | | | | | | | | | | | | | | | | |
| Average Net Assets | | | 1.94 | %(2) | | | 2.02 | % | | | 2.91 | % | | | 2.63 | % | | | 2.71 | % | | | 2.41 | % |
| Ratio of Net Expenses to | | | | | | | | | | | | | | | | | | | | | | | | |
| Average Net Assets (before | | | | | | | | | | | | | | | | | | | | | | | | |
| interest and dividend expense) | | | 1.93 | %(2)(4) | | | 1.95 | % | | | 1.95 | % | | | 1.95 | % | | | 1.95 | % | | | 1.93 | % |
| Ratio of Total Expenses to | | | | | | | | | | | | | | | | | | | | | | | | |
| Average Net Assets (before waiver | | | | | | | | | | | | | | | | | | | | | | | | |
| and reimbursement of expenses) | | | 2.02 | %(2) | | | 2.17 | % | | | 2.97 | % | | | 2.65 | % | | | 2.72 | % | | | 2.42 | % |
| Ratio of Net Investment | | | | | | | | | | | | | | | | | | | | | | | | |
| Loss to Average Net Assets | | | (1.49 | )%(2) | | | (1.46 | )% | | | (2.40 | )% | | | (2.12 | )% | | | (1.99 | )% | | | (1.73 | )% |
| Ratio of Net Investment Loss to | | | | | | | | | | | | | | | | | | | | | | | | |
| Average Net Assets (before waivers | | | | | | | | | | | | | | | | | | | | | | | | |
| and reimbursements of expenses) | | | (1.57 | )%(2) | | | (1.61 | )% | | | (2.46 | )% | | | (2.14 | )% | | | (2.00 | )% | | | (1.74 | )% |
| Portfolio turnover rate | | | 6 | %(3) | | | 9 | % | | | 8 | % | | | 15 | % | | | 14 | % | | | 15 | % |
(1) | Value is less than $0.005 per share. |
(2) | Annualized for periods less than one year. |
(3) | Not annualized for periods less than one year. |
(4) | Effective June 1, 2020, the Adviser has contractually agreed to waive its fee and, if necessary, reimburse the Fund until April 30, 2021 to the extent Total Annual Fund Operating Expenses exceed 1.85% of the average daily net assets of the Retail Class shares of the Fund. Previously, the Adviser had contractually agreed to waive its fee and, if necessary, reimburse the Fund to the extent Total Annual Fund Operating Expenses exceeded 1.95% of the average daily net assets of the Retail Class shares of the Fund. |
(5) | The return reflects the actual performance for the year and does not include the impact of any adjustments made for financial reporting required by Generally Accepted Accounting Principles (GAAP). |
See accompanying notes to financial statements.
Needham Aggressive Growth Fund
Financial Highlights
| | | Institutional Class | |
| | | | | | | | | | | | | | | Period from | |
| | | | | | | | | | | | | | | December 30, | |
| | | Six Months | | | | | | | | | | | | 2016 | |
| | | Ended | | | | | | | | | | | | through | |
| (For a Share Outstanding | | June 30, 2020 | | | Year Ended December 31, | | | December 31, | |
| Throughout each Period/Year) | | (Unaudited) | | | 2019 | | | 2018 | | | 2017 | | | 2016(1) | |
| Net Asset Value, Beginning of Period/Year | | $ | 22.23 | | | $ | 17.08 | | | $ | 23.21 | | | $ | 22.29 | | | $ | 22.29 | |
| Investment Operations | | | | | | | | | | | | | | | | | | | | |
| Net Investment Loss | | | (0.10 | ) | | | (0.19 | ) | | | (0.42 | ) | | | (0.39 | ) | | | — | |
| Net Realized and Unrealized | | | | | | | | | | | | | | | | | | | | |
| Gain (Loss) on Investments | | | 2.98 | | | | 7.66 | | | | (2.92 | ) | | | 2.50 | | | | — | |
| Total from Investment Operations | | | 2.88 | | | | 7.47 | | | | (3.34 | ) | | | 2.11 | | | | — | |
| | | | | | | | | | | | | | | | | | | | | |
| Less Distributions | | | | | | | | | | | | | | | | | | | | |
| Net Realized Gains | | | — | | | | (2.32 | ) | | | (2.79 | ) | | | (1.19 | ) | | | — | |
| Total Distributions | | | — | | | | (2.32 | ) | | | (2.79 | ) | | | (1.19 | ) | | | — | |
| Net Asset Value, End of Period/Year | | $ | 25.11 | | | $ | 22.23 | | | $ | 17.08 | | | $ | 23.21 | | | $ | 22.29 | |
| | | | | | | | | | | | | | | | | | | | | |
| Total Return | | | 12.96 | %(4) | | | 44.79 | % | | | (15.36 | )% | | | 9.36 | % | | | 0.00 | % |
| Net Assets, End of Period/Year (000’s) | | $ | 24,921 | | | $ | 25,821 | | | $ | 13,478 | | | $ | 20,441 | | | $ | 162 | |
| Ratios/Supplemental Data | | | | | | | | | | | | | | | | | | | | |
| Ratio of Net Expenses to | | | | | | | | | | | | | | | | | | | | |
| Average Net Assets | | | 1.37 | %(3) | | | 1.46 | % | | | 2.35 | % | | | 2.22 | % | | | 1.40 | % |
| Ratio of Net Expenses to Average | | | | | | | | | | | | | | | | | | | | |
| Net Assets (before interest | | | | | | | | | | | | | | | | | | | | |
| and dividend expense) | | | 1.37 | %(3)(5) | | | 1.40 | % | | | 1.40 | % | | | 1.40 | % | | | 1.40 | % |
| Ratio of Total Expenses to Average | | | | | | | | | | | | | | | | | | | | |
| Net Assets (before waiver | | | | | | | | | | | | | | | | | | | | |
| and reimbursement of expenses) | | | 1.76 | %(3) | | | 1.90 | % | | | 2.79 | % | | | 2.64 | % | | | — | %(2) |
| Ratio of Net Investment Loss to | | | | | | | | | | | | | | | | | | | | |
| Average Net Assets | | | (0.92 | )%(3) | | | (0.90 | )% | | | (1.84 | )% | | | (1.69 | )% | | | — | %(2) |
| Ratio of Net Investment Loss to Average | | | | | | | | | | | | | | | | | | | | |
| Net Assets (before waivers | | | | | | | | | | | | | | | | | | | | |
| and reimbursements of expenses) | | | (1.31 | )%(3) | | | (1.34 | )% | | | (2.28 | )% | | | (2.11 | )% | | | — | %(2) |
| Portfolio turnover rate | | | 6 | %(4) | | | 9 | % | | | 8 | % | | | 15 | % | | | 0 | % |
(1) | The Class commenced operations on December 30, 2016. |
(2) | Refer to Note 2 for further description of non-recurring charges related to the issuance of the share class. |
(3) | Annualized for periods less than one year. |
(4) | Not annualized for periods less than one year. |
(5) | Effective June 1, 2020, the Adviser has contractually agreed to waive its fee and, if necessary, reimburse the Fund until April 30, 2021 to the extent Total Annual Fund Operating Expenses exceed 1.18% of the average daily net assets of the Institutional Class shares of the Fund. Previously, the Adviser had contractually agreed to waive its fee and, if necessary, reimburse the Fund to the extent Total Annual Fund Operating Expenses exceeded 1.40% of the average daily net assets of the Institutional Class shares of the Fund. |
See accompanying notes to financial statements.
Needham Small Cap Growth Fund
Financial Highlights
| | | Retail Class | |
| | | Six Months | | | | | | | | | | | | | | | | |
| | | Ended | | | | | | | | | | | | | | | | |
| (For a Share Outstanding | | June 30, 2020 | | | Year Ended December 31, | |
| Throughout each Period/Year) | | (Unaudited) | | | 2019 | | | 2018 | | | 2017 | | | 2016 | | | 2015 | |
| Net Asset Value, | | | | | | | | | | | | | | | | | | |
| Beginning of Year | | $ | 17.59 | | | $ | 12.40 | | | $ | 15.67 | | | $ | 15.25 | | | $ | 12.44 | | | $ | 14.01 | |
| Investment Operations | | | | | | | | | | | | | | | | | | | | | | | | |
| Net Investment Loss | | | (0.13 | ) | | | (0.22 | ) | | | (0.19 | ) | | | (0.18 | ) | | | (0.20 | ) | | | (0.24 | ) |
| Net Realized and Unrealized | | | | | | | | | | | | | | | | | | | | | | | | |
| Gain (Loss) on Investments | | | 2.68 | | | | 6.89 | | | | (0.32 | ) | | | 1.99 | | | | 4.03 | | | | (1.02 | ) |
| Total from | | | | | | | | | | | | | | | | | | | | | | | | |
| Investment Operations | | | 2.55 | | | | 6.67 | | | | (0.51 | ) | | | 1.81 | | | | 3.83 | | | | (1.26 | ) |
| | | | | | | | | | | | | | | | | | | | | | | | | |
| Less Distributions | | | | | | | | | | | | | | | | | | | | | | | | |
| Net Realized Gains | | | — | | | | (1.48 | ) | | | (2.76 | ) | | | (1.40 | ) | | | (1.02 | ) | | | (0.31 | ) |
| Total Distributions | | | — | | | | (1.48 | ) | | | (2.76 | ) | | | (1.40 | ) | | | (1.02 | ) | | | (0.31 | ) |
| | | | | | | | | | | | | | | | | | | | | | | | | |
| Capital Contributions | | | | | | | | | | | | | | | | | | | | | | | | |
| Redemption Fees | | | — | | | | — | | | | — | (1) | | | 0.01 | | | | — | (1) | | | — | (1) |
| Total Capital Contributions | | | — | | | | — | | | | — | (1) | | | 0.01 | | | | — | (1) | | | — | (1) |
| Net Asset Value, | | | | | | | | | | | | | | | | | | | | | | | | |
| End of Year | | $ | 20.14 | | | $ | 17.59 | | | $ | 12.40 | | | $ | 15.67 | | | $ | 15.25 | | | $ | 12.44 | |
| | | | | | | | | | | | | | | | | | | | | | | | | |
| Total Return | | | 14.50 | %(3) | | | 54.45 | % | | | (5.13 | )%(5) | | | 11.88 | %(5) | | | 31.26 | % | | | (8.96 | )% |
| Net Assets, | | | | | | | | | | | | | | | | | | | | | | | | |
| End of Year (000’s) | | $ | 123,602 | | | $ | 85,521 | | | $ | 12,487 | | | $ | 19,317 | | | $ | 35,518 | | | $ | 23,473 | |
| Ratios/Supplemental Data | | | | | | | | | | | | | | | | | | | | | | | | |
| Ratio of Net Expenses to | | | | | | | | | | | | | | | | | | | | | | | | |
| Average Net Assets | | | 1.85 | %(2) | | | 1.87 | % | | | 1.95 | % | | | 1.95 | % | | | 2.09 | % | | | 2.05 | % |
| Ratio of Net Expenses to | | | | | | | | | | | | | | | | | | | | | | | | |
| Average Net Assets (before | | | | | | | | | | | | | | | | | | | | | | | | |
| interest and dividend expense) | | | 1.85 | %(2) | | | 1.87 | %(4) | | | 1.95 | % | | | 1.95 | % | | | 1.95 | % | | | 1.95 | % |
| Ratio of Total Expenses to | | | | | | | | | | | | | | | | | | | | | | | | |
| Average Net Assets (before waiver | | | | | | | | | | | | | | | | | | | | | | | | |
| and reimbursement of expenses) | | | 1.72 | %(2) | | | 2.07 | % | | | 2.19 | % | | | 2.15 | % | | | 2.30 | % | | | 2.25 | % |
| Ratio of Net Investment Loss to | | | | | | | | | | | | | | | | | | | | | | | | |
| Average Net Assets | | | (1.49 | )%(2) | | | (1.36 | )% | | | (1.20 | )% | | | (1.14 | )% | | | (1.83 | )% | | | (1.61 | )% |
| Ratio of Net Investment Loss to | | | | | | | | | | | | | | | | | | | | | | | | |
| Average Net Assets (before waivers | | | | | | | | | | | | | | | | | | | | | | | | |
| and reimbursements of expenses) | | | (1.36 | )%(2) | | | (1.56 | )% | | | (1.44 | )% | | | (1.34 | )% | | | (2.04 | )% | | | (1.81 | )% |
| Portfolio turnover rate | | | 69 | %(3) | | | 136 | % | | | 103 | % | | | 80 | % | | | 99 | % | | | 64 | % |
(1) | Value is less than $0.005 per share. |
(2) | Annualized for periods less than one year. |
(3) | Not annualized for periods less than one year. |
(4) | Effective April 1, 2019, the Adviser had contractually agreed to waive its fee and, if necessary, reimburse the Fund to the extent Total Annual Fund Operating Expenses exceed 1.85% of the average daily net assets of the Retail Class shares of the Fund. Previously, the Adviser had contractually agreed to waive its fee and, if necessary, reimburse the Fund to the extent Total Annual Fund Operating Expenses exceeded 1.95% of the average daily net assets of the Retail Class shares of the Fund. |
(5) | The return reflects the actual performance for the year and do not include the impact of any adjustments made for financial reporting required by Generally Accepted Accounting Principles (GAAP). |
See accompanying notes to financial statements.
Needham Small Cap Growth Fund
Financial Highlights
| | | Institutional Class | |
| | | | | | | | | | | | | | | Period from | |
| | | | | | | | | | | | | | | December 30, | |
| | | Six Months | | | | | | | | | | | | 2016 | |
| | | Ended | | | | | | | | | | | | through | |
| (For a Share Outstanding | | June 30, 2020 | | | Year Ended December 31, | | | December 31, | |
| Throughout each Period/Year) | | (Unaudited) | | | 2019 | | | 2018 | | | 2017 | | | 2016(1) | |
| Net Asset Value, Beginning of Period/Year | | $ | 17.96 | | | $ | 12.57 | | | $ | 15.76 | | | $ | 15.25 | | | $ | 15.25 | |
| Investment Operations | | | | | | | | | | | | | | | | | | | | |
| Net Investment Loss | | | (0.07 | ) | | | (0.12 | ) | | | (0.10 | ) | | | (0.07 | ) | | | — | |
| Net Realized and Unrealized | | | | | | | | | | | | | | | | | | | | |
| Gain (Loss) on Investments | | | 2.74 | | | | 6.99 | | | | (0.33 | ) | | | 1.98 | | | | — | |
| Total from Investment Operations | | | 2.67 | | | | 6.87 | | | | (0.43 | ) | | | 1.91 | | | | — | |
| | | | | | | | | | | | | | | | | | | | | |
| Less Distributions | | | | | | | | | | | | | | | | | | | | |
| Net Realized Gains | | | — | | | | (1.48 | ) | | | (2.76 | ) | | | (1.40 | ) | | | — | |
| Total Distributions | | | — | | | | (1.48 | ) | | | (2.76 | ) | | | (1.40 | ) | | | — | |
| Net Asset Value, End of Period/Year | | $ | 20.63 | | | $ | 17.96 | | | $ | 12.57 | | | $ | 15.76 | | | $ | 15.25 | |
| | | | | | | | | | | | | | | | | | | | | |
| Total Return | | | 14.87 | %(4) | | | 55.31 | % | | | (4.58 | )%(6) | | | 12.48 | %(6) | | | 0.00 | % |
| Net Assets, End of Period/Year (000’s) | | $ | 49,208 | | | $ | 46,589 | | | $ | 12,168 | | | $ | 10,325 | | | $ | 140 | |
| Ratios/Supplemental Data | | | | | | | | | | | | | | | | | | | | |
| Ratio of Net Expenses to | | | | | | | | | | | | | | | | | | | | |
| Average Net Assets | | | 1.18 | %(3) | | | 1.22 | % | | | 1.40 | % | | | 1.40 | % | | | 1.40 | % |
| Ratio of Net Expenses to Average | | | | | | | | | | | | | | | | | | | | |
| Net Assets (before interest | | | | | | | | | | | | | | | | | | | | |
| and dividend expense) | | | 1.18 | %(3) | | | 1.22 | %(5) | | | 1.40 | % | | | 1.40 | % | | | 1.40 | % |
| Ratio of Total Expenses to Average | | | | | | | | | | | | | | | | | | | | |
| Net Assets (before waiver | | | | | | | | | | | | | | | | | | | | |
| and reimbursement of expenses) | | | 1.48 | %(3) | | | 1.83 | % | | | 1.95 | % | | | 2.08 | % | | | — | %(2) |
| Ratio of Net Investment Loss to | | | | | | | | | | | | | | | | | | | | |
| Average Net Assets | | | (0.78 | )%(3) | | | (0.72 | )% | | | (0.65 | )% | | | (0.41 | )% | | | — | %(2) |
| Ratio of Net Investment Loss to Average | | | | | | | | | | | | | | | | | | | | |
| Net Assets (before waivers | | | | | | | | | | | | | | | | | | | | |
| and reimbursements of expenses) | | | (1.08 | )%(3) | | | (1.33 | )% | | | (1.21 | )% | | | (1.09 | )% | | | — | %(2) |
| Portfolio turnover rate | | | 69 | %(4) | | | 136 | % | | | 103 | % | | | 80 | % | | | 0 | % |
(1) | The Class commenced operations on December 30, 2016. |
(2) | Refer to Note 2 for further description of non-recurring charges related to the issuance of the share class. |
(3) | Annualized for periods less than one year. |
(4) | Not annualized for periods less than one year. |
(5) | Effective April 1, 2019, the Adviser had contractually agreed to waive its fee and, if necessary, reimburse the Fund to the extent Total Annual Fund Operating Expenses exceed 1.15% of the average daily net assets of the Institutional Class shares of the Fund. Previously, the Adviser had contractually agreed to waive its fee and, if necessary, reimburse the Fund to the extent Total Annual Fund Operating Expenses exceeded 1.40% of the average daily net assets of the Institutional Class shares of the Fund. |
(6) | The return reflects the actual performance for the year and do not include the impact of any adjustments made for financial reporting required by Generally Accepted Accounting Principles (GAAP). |
See accompanying notes to financial statements.
Notes to Financial Statements (Unaudited)
June 30, 2020
1. Organization
Needham Growth Fund (“NGF”), Needham Aggressive Growth Fund (“NAGF”) and Needham Small Cap Growth Fund (“NSCGF”) (each, a “Portfolio” and collectively, the “Portfolios”), are portfolios of The Needham Funds, Inc. (the “Company”), which is registered under the Investment Company Act of 1940, as amended (the “1940 Act”), as an open-end management investment company. The Company was organized as a Maryland corporation on October 12, 1995. NGF, NAGF, and NSCGF each currently offer two classes, the Retail Class and the Institutional Class. The Institutional Class of each Portfolio commenced operations on December 30, 2016.
Each Portfolio is an investment company and accordingly follows the investment company accounting and reporting guidance of the Financial Accounting Standards Board (“FASB”) Accounting Standards Codification Topic 946 “Financial Services – Investment Companies.”
2. Class Specific Expenses
Class level expenses are allocated daily to each class of shares based upon the ratio of net assets represented by each class as a percentage of the net assets of the Portfolio. Expenses deemed directly attributable to a class of shares are recorded by the specific class. Most Portfolio expenses are allocated by class based on relative net assets. Distribution Fees incurred in connection with the Company’s Amended and Restated Plan of Distribution Pursuant to Rule 12b-1 are expensed at 0.25% of average daily net assets of the Retail Class shares, and the specific amounts are detailed in Note 5.
Certain of the Ratios and Supplemental Data presented in the Financial Highlights of the Institutional Class as of December 31, 2016 include non-recurring charges related to the issuance of the class and are not meaningful.
3. Significant Accounting Policies
The following is a summary of significant accounting policies followed by the Company in the preparation of its financial statements. These policies are in conformity with accounting principles generally accepted in the United States of America (“GAAP”).
Security Valuation: Portfolio securities for which market quotations are readily available are stated at the last sale price reported by the principal exchange for the security as of the exchange’s close of business. Securities for which no sale has taken place during the day and securities which are not listed on an exchange are valued at the mean of the highest closing bid and lowest asked prices. Exchange traded options are valued at the last reported sale price on any exchange on which the option is principally traded. If no sales are reported on a particular day, the options will be valued at the mean between the highest closing bid and lowest asked prices across the exchanges where the option is traded. Non-exchange traded options will also be valued at the mean between the last bid and asked quotations. For options where market quotations are not readily available, value will be determined in accordance with the fair value procedures described below. All other securities and assets for which (a) market quotations are not readily available, such as in the case of a market or technical disruption that prevents the normal trading of a security held by a Portfolio,
Notes to Financial Statements (Unaudited) (Continued)
June 30, 2020
(b) market quotations are believed to be unrepresentative of fair market value, such as in the case of a thinly traded security, or (c) valuation is normally made at the last sale price on a foreign exchange and a significant event occurs after the close of that exchange but before the New York Stock Exchange closes, are valued at their fair value as determined in good faith by the Company’s Board of Directors (the “Board”) in accordance with Fair Value Procedures established by the Board. The Company’s Fair Value Procedures are implemented and monitored by a Fair Value Committee (the “Committee”) designated by the Board. When a security is valued in accordance with the Fair Value Procedures, the Committee determines a value after taking into consideration any relevant information that is reasonably available to the Committee. Some of the more common reasons that may necessitate that a security be valued pursuant to these Fair Value Procedures include, but are not limited to: the security’s trading has been halted or suspended; the security has been delisted from a national exchange; the security’s primary trading market is temporarily closed at a time when under normal conditions it would be open; or the security’s primary pricing source is not able or willing to provide a price. The securities of each Portfolio may also be valued on the basis of valuations provided by a pricing service approved by, or on behalf of, the Board.
Portfolio securities listed or traded on securities exchanges, including American Depositary Receipts (“ADRs”), are valued at the closing price on the exchange or system where the security is principally traded or at the NASDAQ Official Closing Price. If there have been no sales for that day on the exchange or system, a security is valued at the mean of the highest closing bid and lowest asked prices on the exchange or system where the security is principally traded.
The Portfolios did not value any securities in accordance with the Fair Value Procedures as of June 30, 2020.
Investment Transactions: Changes in holdings of portfolio securities for the Portfolios shall be reflected no later than in the first calculation on the first business day following the trade date for purposes of calculating each Portfolio’s daily net asset value per share. However, for financial reporting purposes, portfolio security transactions are reported on the trade date of the last business day of the reporting period. The cost (proceeds) of investments sold (bought to cover) is determined on a specific identification basis for the purpose of determining gains or losses on sales and buys to cover short positions. Dividend income, distributions to shareholders and dividend expense from securities sold short are recorded on the ex-dividend date. Interest income and interest expense from securities sold short is recorded on an accrual basis.
Foreign Currency: Foreign currency amounts are translated into U.S. dollars as follows: (i) assets and liabilities at the rate of exchange at the end of the respective period; and (ii) purchases and sales of securities and income and expenses at the rate of exchange prevailing on the dates of such transactions. The portion of realized/unrealized gains arising from changes in the exchange rates are included with the net realized/unrealized gain (loss) from affiliated and unaffiliated securities, securities sold short and foreign currency translations. Principal risks associated with such transactions include the
Notes to Financial Statements (Unaudited) (Continued)
June 30, 2020
movement in value of the foreign currency relative to the U.S. dollar and the ability of the counterparty to perform.
The Portfolios may also invest in forward currency contracts. Fluctuations in the value of such forward currency transactions are recorded daily as unrealized gain or loss; realized gain or loss includes net gain or loss on transactions that have terminated by settlement. These instruments involve securities and currency market risk, credit risk, or both kinds of risks, in excess of the amount recognized in the statements of assets and liabilities. Risks also arise from the possible inability of counterparties to meet the terms of their contracts. The Portfolios did not enter into forward currency contracts during the period ended June 30, 2020.
Allocation of Expenses: Expenses directly attributable to a Portfolio are charged directly to that Portfolio, while expenses which are attributable to more than one Portfolio are allocated among the respective Portfolios based upon relative net assets or some other reasonable method.
Use of Estimates: The preparation of financial statements in conformity with GAAP requires management to make estimates and assumptions that affect the reported amounts of assets and liabilities and disclosure of contingent assets and liabilities at the date of the financial statements and the reported amounts of increases and decreases in net assets from operations during the reporting period. Actual results could differ from those estimates.
Distributions to Shareholders: Dividends from net investment income, if any, are declared and paid annually for the Portfolios. Distributable net realized gains, if any, are declared and distributed at least annually.
Federal Income Taxes: It is the policy of each Portfolio to continue to qualify as a regulated investment company, as defined in the Internal Revenue Code, by complying with the provisions available to certain investment companies and to make distributions of net investment income and net realized capital gains sufficient to relieve it from all, or substantially all, federal income taxes. Accordingly, no provision for income taxes has been made in the Portfolios’ financial statements.
As of December 31, 2019, the Portfolios did not have any tax positions that did not meet the “more-likely than-not” threshold of being sustained by the applicable tax authority. Open tax years are those that are open for exam by Federal and state taxing authorities. As of December 31, 2019, open Federal tax years include the tax years ended December 31, 2016 through December 31, 2019, and open New York tax years include the tax years ended December 31, 2016 through December 31, 2019. The Portfolios have no tax examinations in progress.
Fair Value Measurements: Valuation inputs used to determine the value of the Portfolios’ investments are summarized in the three broad levels listed below:
| | Level 1 — | Unadjusted quoted prices in active markets for identical assets and liabilities that the Portfolios have the ability to access. |
Notes to Financial Statements (Unaudited) (Continued)
June 30, 2020
| | Level 2 — | Observable inputs other than quoted prices included in Level 1 that are observable for the asset or liability, either directly or indirectly. These inputs may include quoted prices for the identical instrument in an inactive market, prices for similar instruments, interest rates, prepayment speeds, credit risk, yield curves, default rates and similar data. |
| | | |
| | Level 3 — | Unobservable inputs for the asset or liability, to the extent relevant observable inputs are not available, representing the Portfolios’ own assumptions about the assumptions a market participant would use in valuing the asset or liability, and would be based on the best information available. |
The inputs or methodology used to value securities are not necessarily an indication of the risk associated with investing in those securities.
Portfolio securities listed or traded on securities exchanges, including ADRs, are valued at the closing price on the exchange or system where the security is principally traded or at the NASDAQ Official Closing Price. If there have been no sales for that day on the exchange or system, a security is valued at the mean of the highest closing bid and lowest asked prices on the exchange or system where the security is principally traded. These valuations are typically categorized as Level 1 in the fair value hierarchy.
In accordance with procedures adopted by the Board, fair value pricing may be used if events materially affecting the value of foreign securities occur between the times the exchange on which they are traded closes and the time the Portfolios’ net asset values are calculated. These valuations are categorized as Level 2 in the fair value hierarchy.
The following is a summary categorization, as of June 30, 2020, of each Portfolio’s investments based on the level of inputs utilized in determining the value of such investments:
| | | LEVEL 1 – Quoted Prices(1) | |
| | | NGF | | | NAGF | | | NSCGF | |
| Assets | | | | | | | | | |
Common Stocks(2) | | $ | 110,686,460 | | | $ | 55,803,166 | | | $ | 159,064,561 | |
| Short-Term Investments | | | 1,487,210 | | | | 46,760 | | | | 11,172,873 | |
| Liabilities | | | | | | | | | | | | |
Securities Sold Short(2) | | | (847,218 | ) | | | (194,075 | ) | | | (2,387,200 | ) |
| Total | | $ | 111,326,452 | | | $ | 55,655,851 | | | $ | 167,850,234 | |
(1) | As of June 30, 2020, the Portfolios did not hold Level 2 or Level 3 investments. |
(2) | Please refer to the Schedule of Investments and Schedule of Securities Sold Short to view segregation by industry. |
4. Investment Advisory and Administrative Services
The Company has engaged Needham Investment Management L.L.C. (the “Adviser”) to manage its investments pursuant to an Investment Advisory Agreement. The Company pays the Adviser an investment advisory fee at the annual rate of 1.25% of the average daily net assets of each Portfolio.
Notes to Financial Statements (Unaudited) (Continued)
June 30, 2020
The Adviser has entered into an agreement with the Company (the “Expense Limitation Agreement”) whereby the Adviser has contractually agreed to waive its investment advisory fee for, and to reimburse expenses of, the Institutional Class and Retail Class shares of each Portfolio in an amount that limits annual operating expenses to not more than 1.40% and 1.95% for NGF or 1.18% and 1.85% for NSCGF and NAGF, of the average daily net assets of the Portfolio’s Institutional Class and Retail Class, respectively (excluding taxes, interest, brokerage, dividends on short positions, acquired fund fees and expenses and extraordinary items, but including the investment advisory fee stated in the Investment Advisory Agreement). The Expense Limitation Agreement is effective for the period from June 1, 2020 through April 30, 2021. The Expense Limitation Agreement shall continue in effect from year to year thereafter only upon mutual agreement of the Company and the Adviser. Similar agreements were in effect for certain prior periods.
Any reimbursements or fee waivers made by the Adviser in respect of a Portfolio are subject to recoupment by the Adviser, to the extent that the Portfolio is able to make the repayment within the expense limitation established in the Expense Limitation Agreement. Under the Expense Limitation Agreement, the Adviser has a right to receive from each Portfolio class reimbursement for fee waivers and/or expense reimbursements made pursuant to the Agreement for a period of up to 36 months from the time of any waiver or reimbursement. The table below contains the amounts of fee waivers and expense reimbursements subject to recapture by the Adviser through December 31 of the year indicated:
| | | 2023 | | | 2022 | | | 2021 | | | 2020 | | | Total | |
| NGF (Retail Class) | | $ | — | | | $ | — | | | $ | — | | | $ | — | | | $ | — | |
| NGF (Institutional Class) | | | 48,763 | | | | 110,106 | | | | 91,844 | | | | 85,822 | | | | 336,535 | |
| NAGF (Retail Class) | | | 11,318 | | | | 45,600 | | | | 23,838 | | | | 16,112 | | | | 96,868 | |
| NAGF (Institutional Class) | | | 45,733 | | | | 77,228 | | | | 83,507 | | | | 65,936 | | | | 272,404 | |
| NSCGF (Retail Class) | | | — | | | | 41,029 | | | | 27,241 | | | | — | | | | 68,270 | |
| NSCGF (Institutional Class) | | | 65,277 | | | | 124,826 | | | | 69,833 | | | | 48,693 | | | | 308,629 | |
The Company and Fund Services (the “Administrator”) are parties to a Fund Administration Servicing Agreement. The Administrator provides administrative and fund accounting services pursuant to this agreement and, in consideration of these services, receives a fee computed daily and paid monthly at an annual rate based on a percentage of the value of each Portfolio’s assets. The Administrator is also compensated for any out of pocket expenses that are reasonably incurred in carrying out its duties under this agreement. The Administrator also provides transfer agent services pursuant to a Transfer Agent Servicing Agreement for additional fees.
Certain officers of the Company are also officers of the Adviser and/or Needham & Company, LLC (the “Distributor”), an affiliate of the Adviser. Such officers receive no fees from the Company for serving as officers of the Company. Each of the two Directors who is not an “interested person” (as defined in the 1940 Act) of the Company (each, an “Independent Director”) receives a quarterly retainer of $3,000 and a per-meeting fee of $500. Each
Notes to Financial Statements (Unaudited) (Continued)
June 30, 2020
Independent Director is also a member of the Audit Committee of the Board and receives a fee of $500 per meeting attended. The Adviser provides an employee to serve as Chief Compliance Officer for the Company and to provide certain related services. The Distributor, Needham & Company, LLC, pays the Chief Compliance Officer’s compensation and the Company reimburses the Distributor for the Company’s allocated portion of the expense.
5. Distribution Plan and Brokerage Commissions
The Company has adopted an Amended and Restated Plan of Distribution pursuant to Rule 12b-1 under the 1940 Act. Under the Plan, each Portfolio may pay compensation to the Distributor or any other distributor or financial institution with which the Company has an agreement with respect to the Retail Class of the Portfolio, with the amount of such compensation not to exceed an annual rate of 0.25% of each Portfolio’s daily average net assets of each Portfolio’s Retail Class shares.
During the period ended June 30, 2020, NGF, NAGF and NSCGF incurred and paid brokerage commissions to the Distributor in the amount of $10,669, $7,728, and $73,283, respectively.
6. Temporary Borrowings
Each Portfolio may borrow from banks up to 25% of its total assets and may pledge its assets in connection with these borrowings, provided that no additional investments shall be made while borrowings exceed 5% of total assets.
The Portfolios did not engage in any temporary borrowings during the period ended June 30, 2020.
7. Short Sale Transactions
During the period ended June 30, 2020, each Portfolio sold securities short. Upon selling a security short, the Portfolios record an asset for the settlement amount as “Deposit with Broker for Securities Sold Short” and a corresponding liability, which is marked-to-market to reflect current value. The broker for the Portfolios’ short sale transactions requires maintenance by each Portfolio of a minimum amount of collateral at all times, regardless of whether any short sales are outstanding. To the extent necessary to meet the broker’s collateral requirements for open short positions, additional securities will be segregated above the minimum to cover the short positions. At June 30, 2020, the market value of securities separately segregated to cover short positions was $2,263,380, $4,791,920, and $2,267,625 for NGF, NAGF and NSCGF, respectively.
Additionally, the Portfolios had receivables for Deposit with Broker for Securities Sold Short of $326,701, $213,471 and $154,830 pledged as collateral with a broker in connection with any open short positions for NGF, NAGF, and NSCGF, respectively at June 30, 2020. Securities sold short at June 30, 2020 and their related market values and proceeds are set forth in the preceding Schedule of Securities Sold Short for NGF, NAGF, and NSCGF.
Notes to Financial Statements (Unaudited) (Continued)
June 30, 2020
8. Investment Transactions
The following summarizes the aggregate amount of the cost of purchases and proceeds from sales of investment securities and securities sold short, excluding short-term securities, during the period ended June 30, 2020:
| | | Purchases | | | Sales | |
| NGF | | | | | | |
| Long Transactions | | $ | 9,264,553 | | | $ | 13,457,234 | |
| Short Sale Transactions | | | — | | | | 1,094,189 | |
| NAGF | | | | | | | | |
| Long Transactions | | | 4,160,648 | | | | 6,267,287 | |
| Short Sale Transactions | | | — | | | | 619,604 | |
| NSCGF | | | | | | | | |
| Long Transactions | | | 152,897,706 | | | | 69,545,017 | |
| Short Sale Transactions | | | — | | | | 1,104,611 | |
There were no purchases or sales of U.S. government securities during the period ended June 30, 2020.
9. Financial Instruments With Off-Balance Sheet Risk
In the normal course of their business, the Portfolios may engage in transactions with off-balance sheet risk, including securities sold short, written options, futures, and forward currency contracts. Transactions in certain financial instruments represent future commitments to purchase or sell other financial instruments at specific terms at specified future dates. Each of these financial instruments contains varying degrees of off-balance sheet risk whereby changes in the market values of the securities underlying the financial instruments may be in excess of the amounts recognized in the financial statements.
Securities sold short represent obligations of the Portfolios to make future delivery of specific securities and, correspondingly, create an obligation to purchase the securities at market prices prevailing at a later delivery date (or to deliver the securities if already owned by the Portfolios). As a result, short sales create the risk that the Portfolios’ ultimate obligation to satisfy the delivery requirements may exceed the amount of the proceeds initially received on the liability recorded in the financial statements.
10. Indemnification
Under the Company’s organizational documents, the Company’s Directors and Officers are indemnified against certain liabilities arising out of the performance of their duties to the Company. In addition, in the ordinary course of business, the Company enters into contracts that contain a variety of indemnifications. The Company’s maximum exposure under these arrangements is unknown. However, the Company has not had prior claims or losses pursuant to these contracts and expects the risk of loss to be remote.
Notes to Financial Statements (Unaudited) (Continued)
June 30, 2020
11. Transactions with Affiliates
NAGF owned 5% or more of the voting securities of the following company during the period ended June 30, 2020. As a result, this company is deemed to be an “affiliated person” (as defined in the 1940 Act) of NAGF and the other Portfolios as defined by the 1940 Act. Transactions during the period in this affiliated company were as follows:
| | | | | Net Change | Net | | | Share |
| | Value at | | | in Unrealized | Realized | | Value at | Balance |
| Security | Jan. 1, | Value of | Value of | Appreciation | Gains | Dividend | June 30, | June 30, |
Name | 2020 | Purchases | Sales | (Depreciation) | (Losses) | Income | 2020 | 2020 |
| GSE | | | | | | | | |
| Systems, | | | | | | | | |
| Inc. | $1,736,831 | $— | $— | $(673,680) | $— | $— | $1,063,151 | 1,052,625 |
12. Federal Income Taxes
No provision for federal income taxes is required since the Company intends to continue to qualify as a regulated investment company under Subchapter M of the Internal Revenue Code and distribute substantially all of its taxable income and capital gains to shareholders. Because income tax regulations differ from GAAP, the timing and character of income and capital gain distributions determined in accordance with tax regulations can differ from income and capital gains recognized for financial reporting purposes. Accordingly, the character of distributions and the composition of net assets for tax purposes can differ from those reflected in the financial statements. These book/tax differences may be temporary or permanent in nature. Temporary differences are generally due to differing book and tax treatment for the timing of the recognition of gains and losses on securities, including post-October losses (as described below). Permanent differences are generally due to differing treatment of net investment losses. To the extent these differences are permanent, they are charged or credited to paid-in capital or distributable earnings, accumulated net realized gain (loss), or accumulated net investment income (loss), as appropriate, in the period in which the differences arise. These reclassifications have no effect on net assets or net asset value per share of each Portfolio.
As of December 31, 2019, the cost, gross unrealized appreciation, gross unrealized depreciation, and the net unrealized appreciation (depreciation) on securities, including proceeds from securities sold short for federal income tax purposes, were as follows:
| | | | | | | | | | | | Net | |
| | | | | | Gross | | | Gross | | | Unrealized | |
| | | | | | Unrealized | | | Unrealized | | | Appreciation | |
| | | Cost | | | Appreciation | | | Depreciation | | | (Depreciation) | |
| NGF | | $ | 45,791,442 | | | $ | 65,868,454 | | | $ | (1,679,481 | ) | | $ | 64,188,973 | |
| NAGF | | | 25,663,661 | | | | 31,440,951 | | | | (1,625,412 | ) | | | 29,815,539 | |
| NSCGF | | | 120,180,001 | | | | 9,292,314 | | | | (1,218,323 | ) | | | 8,073,991 | |
The difference between the tax cost of investments and the cost of investments for GAAP purposes is primarily due to the tax treatment for wash sale losses.
Notes to Financial Statements (Unaudited) (Continued)
June 30, 2020
As of December 31, 2019, the components of distributable earnings (loss) on a tax basis were as follows:
| | | NGF | | | NAGF | | | NSCGF | |
| Undistributed ordinary income | | $ | — | | | $ | — | | | $ | 1,593,081 | |
| Undistributed long-term capital gains | | | 3,014,394 | | | | — | | | | 564,580 | |
| Unrealized appreciation (depreciation) | | | 64,188,973 | | | | 29,815,539 | | | | 8,073,991 | |
| Other accumulated gains (loss) | | | — | | | | — | | | | — | |
| Total accumulated earnings (loss) | | $ | 67,203,367 | | | $ | 29,815,539 | | | $ | 10,231,652 | |
The tax character of distributions paid during the year ended December 31, 2019 was as follows:
| | | NGF | | | NAGF | | | NSCGF | |
| Ordinary income | | $ | — | | | $ | — | | | $ | 414,676 | |
| Net long-term capital gains | | | 11,150,898 | | | | 4,975,386 | | | | 3,589,387 | |
| Return of capital | | | | | | | | | | | | |
| Total distributions paid | | $ | 11,150,898 | | | $ | 4,975,386 | | | $ | 4,004,063 | |
In 2019 a portion of such dividends was distributed in connection with NEEGX, NEAGX, and NESGX redemptions.
The tax character of distributions paid during the year ended December 31, 2018 was as follows:
| | | NGF | | | NAGF | | | NSCGF | |
| Ordinary income | | $ | — | | | $ | — | | | $ | 2,522,946 | |
| Net long-term capital gains | | | 13,467,264 | | | | 6,200,868 | | | | 2,691,253 | |
| Return of capital | | | — | | | | — | | | | — | |
| Total distributions paid | | $ | 13,467,264 | | | $ | 6,200,868 | | | $ | 5,214,199 | |
Under current tax law, capital and currency losses realized after October 31 of a Portfolio’s fiscal year may be deferred and treated as occurring on the first business day of the following fiscal year for tax purposes. For the year ended December 31, 2019, the Portfolios had no such losses to defer.
As of December 31, 2019, none of the Portfolios had accumulated capital loss carryovers.
13. New Accounting Pronouncements
In August 2018, FASB issued Accounting Standards Update (“ASU”) 2018-13, Fair Value Measurement (Topic 820): Disclosure Framework — Changes to the Disclosure Requirements for Fair Value Measurement (“ASU 2018-13”). The primary focus of ASU 2018-13 is to improve the effectiveness of the disclosure requirements for fair value measurements. The changes affect all companies that are required to include fair value measurement disclosures. In general, the amendments in ASU 2018-13 are effective for all entities for fiscal years and interim periods within those fiscal years, beginning after December 15, 2019. Management has adopted the relevant provisions of the disclosure framework for the period ended June 30, 2020.
Notes to Financial Statements (Unaudited) (Continued)
June 30, 2020
14. Subsequent Events
Management has evaluated subsequent events through the date of this filing. This evaluation did not result in any subsequent events that necessitated recognition or disclosures.
Supplementary Information (Unaudited)
June 30, 2020
Disclosure of Portfolio Holdings
Each Portfolio files its complete schedule of portfolio holdings with the Securities and Exchange Commission (“SEC”) for the first and third quarters of each fiscal year as an exhibit to its reports on Form N-PORT. For the Portfolios, this would be for the fiscal quarters ending March 31 and September 30. Each Portfolio’s Form N-PORT reports are available without charge, upon request, by calling 800-625-7071 or on the SEC’s website at http://www.sec.gov.
Voting Proxies on Company Portfolio Securities
A description of the policies and procedures that the Company uses to determine how to vote proxies relating to portfolio securities and information regarding how the Company voted proxies relating to portfolio securities during the most recent 12-month period ended June 30 are available without charge, upon request, by calling 800-625-7071 or on the SEC’s website at http://www.sec.gov.
Household Delivery of Shareholder Documents
To reduce expenses, the Company may mail only one copy of the Portfolios’ prospectuses, proxy statements, information statements, and each annual and semi-annual report to those addresses shared by two or more accounts. If you wish to receive individual copies of these documents, please call the Portfolios at 1-800-625-7071 or contact your financial institution. You will begin receiving individual copies thirty days after receiving your request.
Index Disclaimer
The Portfolios have been developed solely by the Adviser. The Portfolios are not in any way connected to or sponsored, endorsed, sold or promoted by the London Stock Exchange Group plc and its group undertakings (collectively, the “LSE Group”). FTSE Russell is a trading name of certain of the LSE Group companies.
All rights in the Russell 2000 Index and the Russell 3000 Index (together, the “Indexes”) vest in the relevant LSE Group company which owns the Index. “Russell®” is a trade mark of the relevant LSE Group company and is used by any other LSE Group company under license.
The Indexes are calculated by or on behalf of FTSE International Limited or its affiliate, agent or partner. The LSE Group does not accept any liability whatsoever to any person arising out of (a) the use of, reliance on or any error in the Indexes or (b) investment in or operation of the Portfolios. The LSE Group makes no claim, prediction, warranty or representation either as to the results to be obtained from the Portfolios or the suitability of the Indexes for the purpose to which it is being put by the Adviser.
Supplementary Information (Unaudited) (Continued)
June 30, 2020
The source of the data for each of the Indexes is the LSE Group. © LSE Group 2020. All rights in the Indexes or data vest in the relevant LSE Group company which owns the Index or the data. Neither LSE Group nor its licensors accept any liability for any errors or omissions in the Indexes or data and no party may rely on any Indexes or data contained in this communication. No further distribution of data from the LSE Group is permitted without the relevant LSE Group company’s express written consent. The LSE Group does not promote, sponsor or endorse the content of this communication.
250 Park Avenue, 10th Floor
New York, New York 10177
1-800-625-7071
Investment Adviser:
Needham Investment Management L.L.C.
250 Park Avenue, 10th Floor
New York, New York 10177
President
George A. Needham
Executive Vice Presidents and Portfolio Managers
John Barr
Needham Growth Fund
Needham Aggressive Growth Fund
Chris Retzler
Needham Growth Fund
Needham Small Cap Growth Fund
Directors
George A. Needham
John W. Larson
F. Randall Smith
Distributor:
Needham & Company, LLC
250 Park Avenue, 10th Floor
New York, New York 10177
212-371-8300
Administrator, Shareholder Servicing Agent, and Transfer Agent:
U.S. Bancorp Fund Services, LLC, doing business as U.S. Bank Global Fund Services
615 East Michigan Street
Milwaukee, WI 53202
Custodian:
U.S. Bank, N.A.
1555 North RiverCenter Drive
Milwaukee, WI 53212
Counsel:
Proskauer Rose LLP
Eleven Times Square
New York, NY 10036-8299
Independent Registered Public Accounting Firm:
KPMG LLP
345 Park Avenue
New York, NY 10154
Item 2. Code of Ethics.
Not applicable for semi-annual reports.
Item 3. Audit Committee Financial Expert.
Not applicable for semi-annual reports.
Item 4. Principal Accountant Fees and Services.
Not applicable for semi-annual reports.
Item 5. Audit Committee of Listed Registrants.
Not applicable to registrants who are not listed issuers (as defined in Rule 10A-3 under the Securities Exchange Act of 1934).
Item 6. Investments.
| (a) | Schedule of Investments is included as part of the report to shareholders filed under Item 1 of this Form. |
Item 7. Disclosure of Proxy Voting Policies and Procedures for Closed-End Management Investment Companies.
Not applicable to open-end investment companies.
Item 8. Portfolio Managers of Closed-End Management Investment Companies.
Not applicable to open-end investment companies.
Item 9. Purchases of Equity Securities by Closed‑End Management Investment Company and Affiliated Purchasers.
Not applicable to open-end investment companies.
Item 10. Submission of Matters to a Vote of Security Holders.
Not Applicable.
Item 11. Controls and Procedures.
(a) | The Registrant’s Chief Executive Officer and Chief Financial Officer have reviewed the Registrant's disclosure controls and procedures (as defined in Rule 30a-3(c) under the Investment Company Act of 1940 (the “Act”)) as of a date within 90 days of the filing of this report, as required by Rule 30a-3(b) under the Act and Rules 13a-15(b) or 15d‑15(b) under the Securities Exchange Act of 1934. Based on their review, such officers have concluded that the disclosure controls and procedures are effective in ensuring that information required to be disclosed in this report is appropriately recorded, processed, summarized and reported and made known to them by others within the Registrant and by the Registrant’s service provider. |
(b) | There were no changes in the Registrant's internal control over financial reporting (as defined in Rule 30a-3(d) under the Act) that occurred during the Registrant’s first fiscal half-year of the period covered by this report that has materially affected, or is reasonably likely to materially affect, the Registrant's internal control over financial reporting. |
Item 12. Disclosure of Securities Lending Activities for Closed-End Management Investment Companies
Not applicable to open-end investment companies.
Item 13. Exhibits.
| (a) | (1) Any code of ethics or amendment thereto, that is the subject of the disclosure required by Item 2, to the extent that the registrant intends to satisfy Item 2 requirements through filing an exhibit. Not applicable for semi-annual reports. |
(3) Any written solicitation to purchase securities under Rule 23c‑1 under the Act sent or given during the period covered by the report by or on behalf of the registrant to 10 or more persons. Not applicable to open-end investment companies.
SIGNATURES
Pursuant to the requirements of the Securities Exchange Act of 1934 and the Investment Company Act of 1940, the registrant has duly caused this report to be signed on its behalf by the undersigned, thereunto duly authorized.
(Registrant) The Needham Funds, Inc.
By (Signature and Title) /s/George A. Needham
George A. Needham, President (Chief Executive Officer)
Date September 3, 2020
Pursuant to the requirements of the Securities Exchange Act of 1934 and the Investment Company Act of 1940, this report has been signed below by the following persons on behalf of the registrant and in the capacities and on the dates indicated.
By (Signature and Title) /s/George A. Needham
George A. Needham, President (Chief Executive Officer)
Date September 3, 2020
By (Signature and Title) /s/James W. Giangrasso
James W. Giangrasso, Treasurer and Secretary (Chief Financial Officer)
Date September 3, 2020