Semi-Annual
Report
Needham Funds
Seeking to build wealth for long-term investors.
June 30, 2019
Needham Growth Fund
Needham Aggressive Growth Fund
Needham Small Cap Growth Fund
www.needhamfunds.com
Beginning on January 1, 2021, as permitted by regulations adopted by the Securities and Exchange Commission, paper copies of the Funds’ shareholder reports will no longer be sent by mail, unless you specifically request paper copies of the reports from the Funds or from your financial intermediary, such as a broker-dealer or bank. Instead, the reports will be made available on a website, and you will be notified by mail each time a report is posted and provided with a website link to access the report.
If you already elected to receive shareholder reports electronically, you will not be affected by this change and you need not take any action. You may elect to receive shareholder reports and other communications electronically from the Funds by calling 1-800-625-7071 or by contacting your financial intermediary (such as a broker-dealer or bank).
You may elect to receive all future reports in paper free of charge. You can request to continue receiving paper copies of your shareholder reports by contacting your financial intermediary or, if you invest directly with a Fund, calling 1-800-625-7071 to let the Fund know of your request. Your election to receive in paper will apply to all funds held in your account.
250 Park Avenue, 10th Floor
New York, New York 10177
1-800-625-7071
www.needhamfunds.com
Semi-Annual Report
June 30, 2019
Contents
| Letter from the Adviser | 1 |
| Portfolio Characteristics | |
| Needham Growth Fund | 8 |
| Needham Aggressive Growth Fund | 10 |
| Needham Small Cap Growth Fund | 12 |
| Disclosure of Fund Expenses | 14 |
| Schedules of Investments | |
| Needham Growth Fund | 16 |
| Needham Aggressive Growth Fund | 21 |
| Needham Small Cap Growth Fund | 26 |
| Schedules of Securities Sold Short | |
| Needham Growth Fund | 20 |
| Needham Aggressive Growth Fund | 25 |
| Statements of Assets and Liabilities | 30 |
| Statements of Operations | 32 |
| Statements of Changes in Net Assets | 33 |
| Financial Highlights | |
| Needham Growth Fund | 36 |
| Needham Aggressive Growth Fund | 38 |
| Needham Small Cap Growth Fund | 40 |
| Notes to Financial Statements | 42 |
| Supplementary Information | 52 |
This report is authorized for distribution to prospective investors only when preceded or accompanied by a current prospectus. The prospectus contains more complete information, including investment objectives, risks, expenses and charges and should be read carefully before investing or sending any money. To obtain a prospectus or summary prospectus, please call 1-800-625-7071.
Portfolios of The Needham Funds, Inc., like all mutual funds:
• Are NOT FDIC insured
• Have no bank guarantee
• May lose value
The Needham Funds, Inc. are distributed by Needham & Company, LLC.
Semi-Annual Report 2019
| | |
 | 250 Park Avenue, 10th Floor |
| New York, NY 10177 |
| (800) 625-7071 |
| | www.needhamfunds.com |
August 2019
Dear Shareholders, Friends of Needham and Prospective Shareholders,
We are pleased to report results for the half-year ended June 30, 2019 for the Needham Growth Fund, the Needham Aggressive Growth Fund and the Needham Small Cap Growth Fund. Our mission is to create wealth for long-term investors and the first half of 2019 was a good step forward.
Review of the First Half of 2019
In January, the markets roared and the Needham Funds earned back the December losses and most of the fourth quarter 2018 losses. Talk of a global economic slowdown created uncertainty surrounding the U.S. Federal Reserve’s plan to increase interest rates in 2019. On January 25, the 35-day partial U.S. Federal government shutdown ended.
At its February 1 meeting, the Federal Reserve decided to hold interest rates flat and forego the planned hikes for 2019, confirming what the market had anticipated. The Fed cited slow growth in China and Europe, Brexit, the risks of U.S.-China trade talks, and the government shutdown. While a Federal Reserve pause is good for the equity markets, we also recognize that 2.25-2.50% is a historically low range for interest rates. We have long said that as a rule, monetary authorities pursue easy money policies. Paul Volcker was the one exception in the last 40 years. We believe equity markets could continue to benefit in 2019 from these easy monetary policies.
In February, fourth quarter 2018 GDP growth was confirmed at 2.6%, versus an initial estimate of 1.8-2.0%. The U.S. also agreed to postpone its announced tariff increase from 10% to 25% on $200 billion of Chinese goods, and trade negotiations continued. In House testimony, Federal Reserve Chairman Powell confirmed that the Fed will pause on its plan to downsize its $4 trillion balance sheet.
March was a relatively flat month. Inverted yield curves have traditionally foreshadowed economic slowdowns. For a few days in March, the yield curve inverted when the yield on 10-Year Treasuries fell below maturity dates under one year. By the end of March, Chairman Powell said wages were growing, consumer confidence rebounded, and economic fundamentals were strong.
In April, the market continued its positive trend of the first quarter and the Needham Funds outperformed. Unemployment was just 3.6% and first quarter GDP growth was 3.1%. April closed with the Secretary of the Treasury making positive comments about trade negotiations with China. Within the week, the talks were off and President Trump accused the Chinese of attempting to “renegotiate” the agreement. Economists were predicting that second quarter GDP growth would fall to 1.5%, as the U.S. was threatening trade wars with Europe and China.
Needham Funds
In May, the market was down and the Needham Funds underperformed owing to weakness in semiconductor capital equipment stocks. The economy weakened in May, and the Labor Department reported that only 72,000 jobs were added. The U.S. raised tariffs on $200 billion of Chinese goods to 25% from 10%. A few days later, on May 15, President Trump issued a national security order effectively banning sales to Huawei over concern that Huawei posed a national security risk to the United States. The President is concerned that Huawei’s leadership position in supplying 5G wireless equipment to countries around the world, including U.S. allies in Western Europe, would make U.S. communications vulnerable. As Huawei is part of the integrated worldwide electronics supply chain, May brought uncertainty to semiconductor companies. I had previously written about expecting a U.S.-China trade deal. At this point, it is hard to be an optimist on trade, although both sides would benefit from a resolution.
In response to the May economic weakness, talk of a Federal Reserve rate cut started in June. In June, the markets roared higher and the Needham Funds once again outperformed. By mid-July, Federal Reserve Chairman Powell signaled that a 25bps rate cut was appropriate in July, given concern about economic weakness.
Our outlook for 2019 remains positive, with an accommodative Federal Reserve, and value recognition in our small cap companies that lagged in 2018. We look forward to a year of patience rewarded.
Needham Aggressive Growth Fund
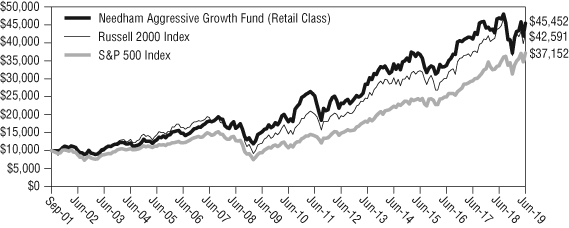
For the half year 2019, the Needham Aggressive Growth Fund Institutional and Retail classes returned 22.66% and 22.30%, respectively. The Russell 2000 Index returned 16.98% and the S&P 500 Index returned 18.54%.
For the first half, PDF Solutions, Inc. (PDFS) was the top contributor. The company made continued progress on its new initiatives, including a January announcement of a new agreement for Design-for-Inspection (DFI) with its lead customer, which we believe to be Taiwan Semiconductor Manufacturing Co., Ltd (TSM). DFI is used to detect electrical failures on semiconductors during the manufacturing process. PDF’s business model is to provide e-beam testers, the Exensio Big Data Analytics platform and software-applications-as-a-service, which results in recurring revenue for PDF. The Fund owns the stock in anticipation of PDF addressing these markets and growing to a much larger company over the years ahead. PDF has been in a five-year investment period. We look forward to PDF’s October investor day, which will be only its second in 18 years as a public company.
The second-leading contributor for the first half was nine-year-holding, Entegris, Inc. (ENTG). Entegris supplies filters and chemicals used in semiconductor advanced manufacturing processes. On January 28, Entegris and Versum Materials (VSM) announced an agreement to merge and announced $75 million of expense savings. A month later, Merck (MRK) announced a competing bid for Versum. Merck’s interest in Versum shows the value of Entegris, which is a similar business. In early April, Merck increased its bid for Versum and won the acquisition. Entegris walked away with a $140 million break-up fee. At a comparable multiple, Entegris would be valued at $52 per share, well above the $37.32 June 30 closing price.
The third-leading contributor for the first half was Apple Inc. (AAPL), a 13-year holding. In the fourth quarter of 2018, Apple reported weakness in China, specifically with its new, high-end phones. It’s hard to remember but 2018 brought the worst December for the U.S. stock market since 1931. Apple reported a March quarter with earnings per share, iPhone revenue and Services revenue, and gross margin above Wall Street estimates. It also increased its share buyback and raised its quarterly dividend.
For the half year, the leading detractors were the short positions in Medallion Financial Corp. (MFIN) and Ubiquiti Networks, Inc. (UBNT). We continue to believe that Medallion Financial has overstated earnings and the value of assets on its balance sheet, but the stock market has not cared. Ubiquiti furthered its retreat from the public eye by stopping its investor conference calls in January. The head of Investor Relations left the company in the first quarter. The company hasn’t had a CFO since April 2015. In October 2018, Ben Moore, long-time VP of Business Development and one of only three named officers, resigned. In November 2018, Ubiquiti released earnings that showed ongoing tax audits in the U.S. and Hong Kong, and a Notice of Proposed Adjustment from the IRS relating to 2015 and 2016, indicating the company owes $50 million. Ubiquiti disagrees and hasn’t recorded a tax liability. In November 2018, Ubiquiti announced a new $200 million stock repurchase program. Its previous buybacks have mostly been funded with bank debt.
We have not changed our thesis on Ubiquiti or Medallion Financial. However, it’s hard for a mutual fund to compound returns when a short position keeps requiring capital that can be used to buy positions, which we’d like to hold for years. Consequently, we reduced both of these short positions. Combined they were -7.14% of net assets on December 31, 2018 and down to -1.57% on June 30, 2019. They were detractors in the first quarter and neutral contributors in the second quarter.
In the first half, the Needham Aggressive Growth Fund added a position in Wabtec (Westinghouse Air Brake Technologies Corp.) (WAB), a leading locomotive manufacturer. Wabtec closed its transformational acquisition of General Electric’s locomotive business. We believe there is likely to be a strong market for new and retrofit locomotives over the next few years, as technology is more widely adopted and the cost of trucking and shortage of drivers makes rail an even more attractive shipping option. The Fund added to its positions in DIRTT Environmental Solutions (DRT:TSE), Taiwan Semiconductor Manufacturing ADR (TSM) and Vicor Corporation (VICR).
The Fund sold its position in Amber Road upon its acquisition. The Fund’s largest sales in the first half were in Electronics for Imaging, Inc. (EFII), Entegris, Inc. (ENTG). FormFactor, Inc. (FORM), and Super Micro Computer, Inc. (SMCI).
At June 30, 2019, the Fund’s top 10 positions were 63.85% of net assets. The Fund had an Active Share of 101.2% versus the Russell 2000 and had trailing 12-month turnover of 7%. The Fund was short 1.7% of total investments. Once again, the Fund looks nothing like the S&P 500 and its performance was not correlated.
Needham Growth Fund
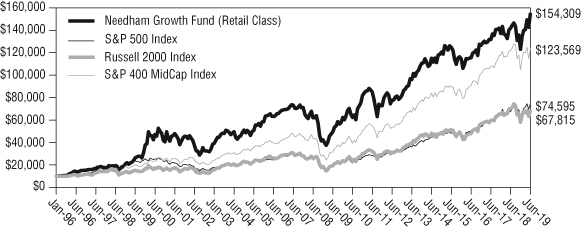
For the half year 2019, the Needham Growth Fund Institutional and Retail classes returned 25.83% and 25.45%, respectively. The Russell 2000 Index returned 16.98% and the S&P 500 Index returned 18.54%.
Like Needham Aggressive Growth Fund, for the first half, PDF Solutions, Inc. (PDFS) was the top contributor. The Fund’s largest position, Thermo Fisher Scientific (TMO), was the second best contributor in the first half. The company develops instruments and consumables used in life science and other research-oriented industries, and we see continued organic growth and acquisition opportunities. Thermo Fisher is a 19-year holding of the Fund.
For the half year, the leading detractors were the short positions in Medallion Financial Corp. (MFIN) and Ubiquiti Networks, Inc. (UBNT). As with Needham Aggressive Growth Fund, we have not changed our thesis on Ubiquiti or Medallion Financial. However, it’s hard for a mutual fund to compound returns when a short position keeps requiring capital that can be used to buy positions, which we’d like to hold for years. Consequently, we reduced both of these short positions. Combined they were -6.20% of net assets of the Needham Growth Fund on December 31, 2018 and down to -1.70% on June 30, 2019. They detracted from first quarter performance and were neutral contributors in the second quarter.
In the first half, the Needham Growth Fund added a position in Wabtec (Westinghouse Air Brake Technologies Corp.) (WAB), a leading locomotive manufacturer. The Fund also added to its positions in DIRTT Environmental Solutions (DRT:TSE) and Navigator Holdings (NVGS) on price weakness. The Fund sold its position in Genmark Diagnostics, Inc. (GNMK) and Hess Corp. (HES). Amber Road was acquired. The Fund reduced its positions in Electronics for Imaging, Inc. (EFII). FormFactor, Inc. (FORM), Super Micro Computer, Inc. (SMCI), Thermo Fisher Scientific, and ViaSat (VSAT).
As of June 30, 2019, the top 10 positions were 55.63% of the Fund’s net assets. Trailing 12-month turnover was just 8% and the Fund’s Active Share vs. the S&P 500 was 99.1%. The Fund was short 1.8% of total investments. Once again, the Fund looks nothing like the S&P 500 and its performance was not correlated.
Needham Small Cap Growth Fund
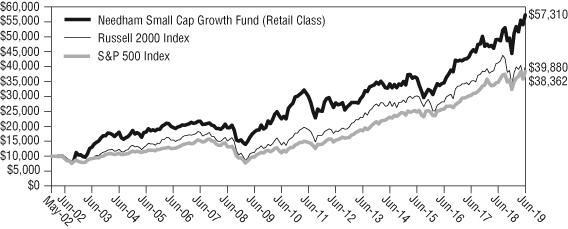
In the half-year ended June 30, 2019, the Needham Small Cap Growth Fund Institutional and Retail classes returned 29.36% and 29.03%, respectively. The Russell 2000 Index returned 16.98% and the S&P 500 Index returned 18.54%.
We are very pleased with the performance of the Fund for the first six months of the year. We have benefited significantly from our investment in Aspen Aerogels which suffered in the fourth quarter of 2018 and has since recovered. We also were rewarded from our patience in Amber Road as it received a takeover offer above $13. We look forward to the second half of the year but do not expect volatility from headline risk to abate anytime soon. We will remain patient as we deploy our cash position.
In the first half of 2019, we were able to reduce specific positions that achieved our price targets while deploying capital into new and existing positions. While volatility may seem to be a bad word for the overall markets, it is a great chance for active managers to find buying opportunities. It is in these volatile markets when a cash position is truly strategic for small cap fund managers. Many small cap investment opportunities “trade by appointment” and we like to capitalize on these opportunities when liquidity is available to both buy and sell stock positions. The Fund continued its lean toward a concentrated portfolio of stocks, with the top 10 holdings representing 53.99% of net assets at June 30, 2019.
Top holdings at June 30, 2019 included Photronics, Inc. (PLAB), PDF Solutions, Inc. (PDFS), Aspen Aerogels, Inc. (ASPN), Zuora, Inc. (ZUO) and MACOM Technology Solutions Holdings, Inc. (MTSI). The Fund’s top contributors in the first half included Aspen Aerogels, Inc. (ASPN), Amber Road, Inc. (AMBR), PDF Solutions, Inc. (PDFS), Ultra Clean Holdings, Inc. (UCTT), Electronics For Imaging, Inc. (EFII) and Aquantia Corp. (AQ). The Fund’s largest detractors in the first half were Neophotonics Corp. (NPTN), Photonics, Inc. (PLAB), EMCORE Corp (EMKR) and Zuora, Inc. (ZUO).
After a very strong start to the year, the markets were due for a pause and pullback, and we experienced that weakness in March. The increased volatility continued throughout the second quarter due to headlines focused on trade disputes and restrictions, with particular attention paid to the Huawei ban, both on the supply chain and end-customer markets. While we recognize these impacts are meaningful and will have negative consequences for industries such as semiconductors, optical and communications, we also believe that companies have creative plans to balance their exposure to such headwinds. As the market digested daily updates from trade uncertainties, our patience paid off, and we were able to deploy a significant amount of our cash position into stocks at good value points. The Fund ended the quarter with a cash position of 17.1%, and we will remain patient as we deploy the remaining capital. After our investments in Amber Road, Inc. (AMBR), Electronics for Imaging, Inc. (EFII), Aquantia Corp. (AQ) and Quantenna Communications, Inc. (QTNA) announced their intentions to be acquired, we had the challenge of redeploying a significant amount of capital that was returned along with investment inflows into the Fund. We added to some of our larger positions, such as Photronics, Inc. (PLAB), TTM Technologies, Inc. (TTMI), EMCORE Corp. (EMKR) and Intevac, Inc. (IVAC), and remain excited about the remainder of the summer to find good points of entry to investments.
Our outlook for 2019 remains positive, with the possibilities of a U.S.-China trade deal, an accommodative Federal Reserve, and value recognition in our small cap companies that lagged in 2018. We look forward to a year of patience rewarded. We continue to believe that a good environment remains for investment in equities. Three themes we are focused on include: 1) continuation of the growth in the semiconductor capital equipment industry; 2) 5G communication infrastructure build-outs; and 3) military and defense modernization. These three areas of investment impact much of our portfolio, and we believe that long term, they should create shareholder value.
We expect the increased volatility to continue throughout 2019 and into 2020. We expect at least one but probably two rate cuts this year from the Federal Reserve unless the economy returns to very strong and sustained growth rates. While the global trade
negotiations have been painful headlines for many, any resolution to these disagreements should provide a nice tailwind to the global economy as we enter the general election of 2020. The high-yield markets remain strong, which is also supportive of the small cap asset class valuations. We reiterate from past quarterly letters that mergers and acquisitions continued in the small cap universe. We expect to see increased M&A activity to improve and benefit our portfolio of stocks in 2019.
Closing
We believe the U.S. remains the best place in the world to be investing, and we continue to see an opportunity to invest in small and mid-cap stocks. Most importantly, we see a revolution happening in technology that has created and continues to create investment opportunities. We see opportunity in our strategy of investing in companies that we know well and that we believe are positioned with secular growth drivers.
We welcome our new investors and thank all of our investors for their continued support. If you have any questions, thoughts or concerns, please contact us at (800) 625-7071 or at cretzler@needhamco.com or jbarr@needhamco.com. For information about the Needham Funds, please visit our website at www.needhamfunds.com.
Sincerely,
 |  |
| Chris Retzler, | John O. Barr, |
| Portfolio Manager | Portfolio Manager |
Fact Sheet Links:
Needham Growth Fund
Needham Aggressive Growth Fund
Needham Small Cap Growth Fund
The information presented in this commentary is not intended as personalized investment advice and does not constitute a recommendation to buy or sell a particular security or other investments. Past performance is no guarantee of future results. The views of the Needham Investment Management L.L.C., the Funds’ investment adviser, and the securities described in this report are as of June 30, 2019; these views and portfolio holdings may have changed subsequent to this date. The specific securities discussed may, in aggregate, represent only a small percentage of a Fund’s holdings. It should not be assumed that securities identified and discussed were, or will be, profitable, or that the investment decisions made in the future will be profitable, or equal the investment performance of the securities discussed herein. There can be no guarantee as to the accuracy of any outlooks for markets, sectors and securities as discussed herein.
This message is not an offer of the Needham Growth Fund, the Needham Aggressive Growth Fund or the Needham Small Cap Growth Fund. Shares are sold only through the currently effective prospectus. Please read the prospectus or summary prospectus carefully and consider the investment objectives, risks and charges and expenses of the Funds carefully before you invest. The prospectus and summary prospectus contain this and other information about the Funds and can be obtained on our website, www.needhamfunds.com or by contacting the Funds’ transfer agent at 1-800-625-7071.
Investment returns and principal value will fluctuate, and when redeemed, shares may be worth more or less than their original cost. Performance data quoted represents past performance, and does not guarantee future results. Current performance may be higher or lower than these results. Performance current to the most recent month-end may be obtained by calling our transfer agent at 1-800-625-7071. Total return figures include reinvestment of all dividends and capital gains.
All three of the Needham Funds have substantial exposure to small and micro capitalized companies. Funds holding smaller capitalized companies are subject to greater price fluctuation than those of larger companies. Needham & Company, LLC, member FINRA/SIPC, is the distributor of The Needham Funds, Inc.
The Russell 2000 Index is a broad unmanaged index composed of the smallest 2,000 companies in the Russell 3000 Index. The Russell 3000 Index is a market-capitalization-weighted equity index that provides exposure to the entire U.S. stock market. The Russell 3000 Index tracks the performance of the 3,000 largest U.S.-traded stocks. Please see the disclaimer regarding these indexes under “Supplementary Information—Index Disclaimer” on page 52 of this report.
| | |
| NEEDHAM GROWTH FUND | Retail Class |
| | Ticker Symbol: NEEGX |
| | Institutional Class |
| | Ticker Symbol: NEEIX |
Comparison of Change in Value of a $10,000 Investment (Unaudited)
The chart above assumes an initial gross investment of $10,000 made on January 1, 1996. The Fund’s performance figures are for the period ended June 30, 2019. The Performance data quoted is historical. Past performance is no guarantee of future results. Current performance may be higher or lower than the performance data quoted. The principal value and investment return of an investment will fluctuate so that your shares, when redeemed, may be worth more or less than their original cost. The returns shown do not reflect the deduction of taxes that a shareholder would pay on Fund distributions or on the redemptions of Fund shares. In the absence of fee waivers and reimbursements, when they are necessary to keep expenses at the expense cap, total return would be reduced. Performance figures for periods greater than one year are annualized.
The Global Industry Classification Standard (GICS®) was developed by and/or is the exclusive property of MSCI, Inc. and Standard & Poor Financial Services LLC (“S&P”). GICS is a service mark of MSCI and S&P and has been licensed for use by Fund Services.
Comparative Performance Statistics as of June 30, 2019 (Unaudited)
| | 1 | 5 | 10 | Since |
| | Year | Years | Years | Inception |
Needham Growth Fund Retail Class(1)(2) | 8.77% | 6.05% | 12.06% | 12.35% |
Needham Growth Fund Institutional Class(1)(3) | 9.38% | n/a | n/a | 8.83% |
S&P 500 Index(4)(5) | 10.42% | 10.71% | 14.70% | 8.93%(8) |
S&P 400 MidCap Index(4)(6) | 1.36% | 8.02% | 14.64% | 11.29%(8) |
Russell 2000 Index(4)(7) | -3.31% | 7.06% | 13.45% | 8.49%(8) |
Past performance does not guarantee future results. The performance data quoted represents past performance, and current returns may be lower or higher. The investment return and net asset value will fluctuate so that an investor’s shares, when redeemed, may be worth more or less than the original cost. To obtain performance information current to the most recent month-end, please call 1-800-625-7071. The returns shown in the above table and accompanying footnotes are net of expenses. The table above does not reflect the deduction of taxes that a shareholder would have paid on Fund distributions or on the redemption of Fund shares.
| 1. | Investment results calculated after reinvestment of dividends. |
| 2. | The inception date of the Retail Class was 1/1/96. |
| 3. | The inception date of the Institutional Class was 12/30/16. |
| 4. | It is not possible to invest directly in an index. The performance of the index does not include the deduction of expenses associated with a mutual fund, such as investment management fees. |
| 5. | The S&P 500 Index is a broad unmanaged measure of the U.S. stock market. |
| 6. | The S&P 400 MidCap Index is a broad unmanaged measure of the U.S. stock market. |
| 7. | The Russell 2000 Index is a broad unmanaged index composed of the smallest 2,000 companies in the Russell 3000 Index. |
| 8. | The return shown for the Index is from the Inception date of the Retail Class. |
| Top Ten Holdings* | |
| (Unaudited) | |
| (as a % of total investments, | |
| as of June 30, 2019) | |
| | | | |
| | | % of Total | |
Security | | Investments | |
| Thermo Fisher Scientific, Inc. | TMO | 9.64% | |
| CarMax, Inc. | KMX | 7.84% | |
| PDF Solutions, Inc. | PDFS | 7.11% | |
| Gilead Sciences, Inc. | GILD | 6.36% | |
| KVH Industries, Inc. | KVHI | 5.83% | |
| Becton Dickinson & Co. | BDX | 5.51% | |
| Comcast Corp., Class A | CMCSA | 5.32% | |
| Entegris, Inc. | ENTG | 5.31% | |
| Akamai Technologies, Inc. | AKAM | 2.98% | |
| Aspen Aerogels, Inc. | ASPN | 2.87% | |
Top Ten Holdings = 58.77% of Total Investments†
| * | Current portfolio holdings may not be indicative of future portfolio holdings. |
| † | Percentage of total investments less cash. |
| Sector Weightings* |
| (Unaudited) |
| (as a % of net investments, |
| as of June 30, 2019) |
| | | | | | |
Sector | Long* | (Short)(1) | | Total(1)(2) | |
| Communication Services | 5.9% | — | | 5.9% | |
| Consumer Discretionary | 7.6% | — | | 7.6% | |
| Consumer Staples | 0.6% | — | | 0.6% | |
| Energy | 3.5% | — | | 3.5% | |
| Financials | 1.0% | (0.5 | )% | 0.5% | |
| Health Care | 24.9% | — | | 24.9% | |
| Industrials | 5.7% | — | | 5.7% | |
| Information Technology | 47.4% | (1.3 | )% | 46.1% | |
| Cash | 5.2% | — | | 5.2% | |
| * | Current portfolio holdings may not be indicative of future portfolio holdings. |
(1) | Percentage of total investments includes all stocks, plus cash minus all short positions. |
(2) | Total represents the difference between the long exposure and the short exposure, which produces the net exposure. |
| | |
| NEEDHAM AGGRESSIVE GROWTH FUND | Retail Class |
| | Ticker Symbol: NEAGX |
| | Institutional Class |
| | Ticker Symbol: NEAIX |
Comparison of Change in Value of a $10,000 Investment (Unaudited)
The chart above assumes an initial gross investment of $10,000 made on September 4, 2001. The Fund’s performance figures are for the period ended June 30, 2019.The Performance data quoted is historical. Past performance is no guarantee of future results. Current performance may be higher or lower than the performance data quoted. The principal value and investment return of an investment will fluctuate so that your shares, when redeemed, may be worth more or less than their original cost. The returns shown do not reflect the deduction of taxes that a shareholder would pay on Fund distributions or on the redemptions of Fund shares. In the absence of fee waivers and reimbursements, when they are necessary to keep expenses at the expense cap, total return would be reduced. Performance figures for periods greater than one year are annualized.
Comparative Performance Statistics as of June 30, 2019 (Unaudited)
| | 1 | 5 | 10 | Since |
| | Year | Years | Years | Inception |
Needham Aggressive Growth Fund Retail Class(1)(2) | -3.15% | 5.90% | 11.57% | 8.87% |
Needham Aggressive Growth Fund Institutional Class(1)(3) | -2.64% | n/a | n/a | 5.22% |
S&P 500 Index(4)(5) | 10.42% | 10.71% | 14.70% | 7.64%(7) |
Russell 2000 Index(4)(6) | -3.31% | 7.06% | 13.45% | 8.47%(7) |
Past performance does not guarantee future results. The performance data quoted represents past performance, and current returns may be lower or higher. The investment return and net asset value will fluctuate so that an investor’s shares, when redeemed, may be worth more or less than the original cost. To obtain performance information current to the most recent month-end, please call 1-800-625-7071. The returns shown in the above table and accompanying footnotes are net of expenses. The table above does not reflect the deduction of taxes that a shareholder would have paid on Fund distributions or on the redemption of Fund shares.
| 1. | Investment results calculated after reinvestment of dividends. |
| 2. | The inception date of the Retail Class was 9/4/01. |
| 3. | The inception date of the Institutional Class was 12/30/16. |
| 4. | It is not possible to invest directly in an index. The performance of the index does not include the deduction of expenses associated with a mutual fund, such as investment management fees. |
| 5. | The S&P 500 Index is a broad unmanaged measure of the U.S. stock market. |
| 6. | The Russell 2000 Index is a broad unmanaged index composed of the smallest 2,000 companies in the Russell 3000 Index. |
| 7. | The return shown for the Index is from the Inception date of the Retail Class. |
| Top Ten Holdings* | |
| (Unaudited) | |
| (as a % of total investments, | |
| as of June 30, 2019) | |
| | | | |
| | | % of Total | |
Security | | Investments | |
| PDF Solutions, Inc. | PDFS | 10.84%
| |
| Entegris, Inc. | ENTG | 10.12%
| |
| KVH Industries, Inc. | KVHI | 9.08% | |
| Apple, Inc. | AAPL | 8.95% | |
| GSE Systems, Inc. | GVP | 5.93% | |
| Vicor Corp. | VICR | 4.46% | |
| Akamai Technologies, Inc. | AKAM | 4.26% | |
| MKS Instruments, Inc. | MKSI | 4.05% | |
| CarMax, Inc. | KMX | 4.02% | |
| DIRTT Environmental | | | |
| Solutions (Canada) | DRT | 4.02% | |
Top Ten Holdings = 65.73% of Total Investments†
| * | Current portfolio holdings may not be indicative of future portfolio holdings. |
| † | Percentage of total investments less cash. |
| Sector Weightings* |
| (Unaudited) |
| (as a % of net investments, |
| as of June 30, 2019) |
| | | | | | |
Sector | Long* | (Short)(1) | | Total(1)(2) | |
| Communication Services | 0.8% | — | | 0.8% | |
| Consumer Discretionary | 4.0% | — | | 4.0% | |
| Consumer Staples | 3.2% | — | | 3.2% | |
| Energy | 1.9% | — | | 1.9% | |
| Financials | 0.0% | (0.8 | )% | (0.8)% | |
| Health Care | 4.0% | — | | 4.0% | |
| Industrials | 11.8% | — | | 11.8% | |
| Information Technology | 69.8% | (0.9 | )% | 68.9% | |
| Materials | 0.4% | — | | 0.4% | |
| Real Estate | 2.2% | — | | 2.2% | |
| Technology Hardware | | | | | |
| & Equipment | 0.0% | — | | 0.0% | |
| Cash | 3.6% | — | | 3.6% | |
| * | Current portfolio holdings may not be indicative of future portfolio holdings. |
(1) | Percentage of total investments includes all stocks, plus cash minus all short positions. |
(2) | Total represents the difference between the long exposure and the short exposure, which produces the net exposure. |
| | |
| NEEDHAM SMALL CAP GROWTH FUND | Retail Class |
| | Ticker Symbol: NESGX |
| | Institutional Class |
| | Ticker Symbol: NESIX |
Comparison of Change in Value of a $10,000 Investment (Unaudited)
The chart above assumes an initial gross investment of $10,000 made on May 22, 2002. The Fund’s performance figures are for the period ended June 30, 2019.The Performance data quoted is historical. Past performance is no guarantee of future results. Current performance may be higher or lower than the performance data quoted. The principal value and investment return of an investment will fluctuate so that your shares, when redeemed, may be worth more or less than their original cost. The returns shown do not reflect the deduction of taxes that a shareholder would pay on Fund distributions or on the redemptions of Fund shares. In the absence of fee waivers and reimbursements, when they are necessary to keep expenses at the expense cap, total return would be reduced. Performance figures for periods greater than one year are annualized.
Comparative Performance Statistics as of June 30, 2019 (Unaudited)
| | 1 | 5 | 10 | Since |
| | Year | Years | Years | Inception |
Needham Small Cap Growth Fund Retail Class(1)(2) | 16.75% | 10.87% | 12.21% | 10.74% |
Needham Small Cap Growth Fund Institutional Class(1)(3) | 17.41% | n/a | n/a | 14.04% |
S&P 500 Index(4)(5) | 10.42% | 10.71% | 14.70% | 8.18%(7) |
Russell 2000 Index(4)(6) | -3.31% | 7.06% | 13.45% | 8.42%(7) |
Past performance does not guarantee future results. The performance data quoted represents past performance, and current returns may be lower or higher. The investment return and net asset value will fluctuate so that an investor’s shares, when redeemed, may be worth more or less than the original cost. To obtain performance information current to the most recent month-end, please call 1-800-625-7071. The returns shown in the above table and accompanying footnotes are net of expenses. The table above does not reflect the deduction of taxes that a shareholder would have paid on Fund distributions or on the redemption of Fund shares.
| 1. | Investment results calculated after reinvestment of dividends. |
| 2. | The inception date of the Retail Class was 5/22/02. |
| 3. | The inception date of the Institutional Class was 12/30/16. |
| 4. | It is not possible to invest directly in an index. The performance of the index does not include the deduction of expenses associated with a mutual fund, such as investment management fees. |
| 5. | The S&P 500 Index is a broad unmanaged measure of the U.S. stock market. |
| 6. | The Russell 2000 Index is a broad unmanaged index composed of the smallest 2,000 companies in the Russell 3000 Index. |
| 7. | The return shown for the Index is from the Inception date of the Retail Class. |
| Top Ten Holdings* | |
| (Unaudited) | |
| (as a % of total investments, | |
| as of June 30, 2019) | |
| | | | |
| | | % of Total | |
Security | | Investments | |
| Photronics, Inc. | PLAB | 10.15%
| |
| PDF Solutions, Inc. | PDFS | 8.93% | |
| Aspen Aerogels, Inc. | ASPN | 7.99% | |
| Zuora, Inc. | ZUO | 5.69% | |
| MACOM Technology | | | |
| Solutions Holdings, Inc. | MTSI | 5.62% | |
| Ultra Clean Holdings, Inc. | UCTT | 5.38% | |
| Cohu, Inc. | COHU | 5.25% | |
| TTM Technologies, Inc. | TTMI | 4.73% | |
| Navigator Holdings Ltd. | | | |
| (Marshall Islands) | NVGS | 4.55% | |
| EMCORE Corp. | EMKR | 4.17% | |
Top Ten Holdings = 62.46% of Total Investments†
| * | Current portfolio holdings may not be indicative of future portfolio holdings. |
| † | Percentage of total investments less cash. |
| Sector Weightings* | |
| (Unaudited) | |
| (as a % of net investments, | |
| as of June 30, 2019) | |
| | | | | |
Sector | Long* | (Short)(1) | Total(1)(2) | |
| Closed-End Funds | 1.5% | — | 1.5% | |
| Energy | 11.1% | — | 11.1% | |
| Health Care | 3.3% | — | 3.3% | |
| Industrials | 10.5% | — | 10.5% | |
| Information Technology | 56.5% | — | 56.5% | |
| Technology | | | | |
| Hardware & Equipment | 0.0% | — | 0.0% | |
| Cash | 17.1% | — | 17.1% | |
| * | Current portfolio holdings may not be indicative of future portfolio holdings. |
(1) | Percentage of total investments includes all stocks, plus cash minus all short positions. |
(2) | Total represents the difference between the long exposure and the short exposure, which produces the net exposure. |
Disclosure of Fund Expenses (Unaudited)
The following expense table is shown so that you can understand the impact of fees on your investment. All mutual funds have operating expenses. As a shareholder of a Portfolio, you incur transactional costs, including redemption fees and ongoing costs, which include costs for portfolio management, administrative services, and shareholder reports, among others. A Portfolio’s expenses are expressed as a percentage of its average net assets. This figure is known as the expense ratio. The following examples are intended to help you understand the ongoing costs (in dollars) of investing in each Portfolio and to compare these costs with those of other mutual funds. The examples are based on an investment of $1,000 made at the beginning of a six-month period and held for the entire period. The expense example table below illustrates your fund’s cost in two ways:
| • | Actual Expenses. This section helps you to estimate the actual expenses after fee waivers that you paid over the period. The “Ending Account Value” shown is derived from the Portfolio’s actual return, and “Expenses Paid During Period” shows the dollar amount that would have been paid by an investor who started with $1,000 in the Portfolio. You may use the information here, together with the amount you invested, to estimate the expenses that you paid over the period. To do so, simply divide your account value by $1,000 (for example, an $8,600 account value divided by $1,000 = 8.6), then multiply the result by the number given for your Portfolio under the heading entitled “Expenses Paid During Period”. |
| | |
| • | Hypothetical Expenses on a 5% Return. This section is intended to help you compare your Portfolio’s costs with those of other mutual funds. It assumes that the Portfolio had a return of 5% before expenses during the period shown, but that the expense ratio is unchanged. In this case, because the return used is not the Portfolio’s actual return, the results do not apply to your investment. The example is useful in making comparisons because the Securities and Exchange Commission requires all mutual funds to calculate expenses based on a 5% return. You can assess your Portfolio’s cost by comparing this hypothetical example with the hypothetical examples that appear in shareholders reports of other funds. |
Please note that the expenses shown in the table are meant to highlight your ongoing costs only and do not reflect any transactional costs, such as redemption fees or exchange fees. Therefore, the table is useful in comparing ongoing costs only, and will not help you determine the relative total costs of owning different funds. In addition, if these transactional costs were included, your costs would have been higher.
For the Period January 1, 2019 to June 30, 2019
Expense Example Table (Unaudited)
| | Beginning | Ending | Expenses Paid | Expense Ratio |
| | Account | Account | During Period(1) | During Period(1) |
| | Value | Value | 1/1/2019 – | 1/1/2019 – |
| | 1/1/2019 | 6/30/2019 | 6/30/2019 | 6/30/2019 |
| Needham Growth Fund | | | | |
| Retail Class Actual Expenses | $1,000.00 | $1,254.50 | $11.24 | 2.01% |
| Retail Class Hypothetical Example | | | | |
| for Comparison Purposes | | | | |
| (5% return before expenses) | $1,000.00 | $1,014.83 | $10.04 | 2.01% |
| Institutional Class Actual Expenses | $1,000.00 | $1,258.30 | $ 8.18 | 1.46% |
| Institutional Class Hypothetical | | | | |
| Example for Comparison Purposes | | | | |
| (5% return before expenses) | $1,000.00 | $1,017.55 | $ 7.30 | 1.46% |
| | | | | |
| Needham Aggressive Growth Fund | | | | |
| Retail Class Actual Expenses | $1,000.00 | $1,223.00 | $11.41 | 2.07% |
| Retail Class Hypothetical Example | | | | |
| for Comparison Purposes | | | | |
| (5% return before expenses) | $1,000.00 | $1,014.53 | $10.34 | 2.07% |
| Institutional Class Actual Expenses | $1,000.00 | $1,226.60 | $ 8.39 | 1.52% |
| Institutional Class Hypothetical | | | | |
| Example for Comparison Purposes | | | | |
| (5% return before expenses) | $1,000.00 | $1,017.26 | $ 7.60 | 1.52% |
| | | | | |
Needham Small Cap Growth Fund(2) | | | | |
| Retail Class Actual Expenses | $1,000.00 | $1,290.30 | $10.79 | 1.90% |
| Retail Class Hypothetical Example | | | | |
| for Comparison Purposes | | | | |
| (5% return before expenses) | $1,000.00 | $1,015.37 | $ 9.49 | 1.90% |
| Institutional Class Actual Expenses | $1,000.00 | $1,293.60 | $ 7.28 | 1.28% |
| Institutional Class Hypothetical | | | | |
| Example for Comparison Purposes | | | | |
| (5% return before expenses) | $1,000.00 | $1,018.45 | $ 6.41 | 1.28% |
(1) | Expenses are equal to the average account value times the Portfolio’s annualized expense ratio multiplied by 181/365 (to reflect the one-half-year period). |
(2) | Effective April 1, 2019, the Adviser has agreed to waive its fee and, if necessary, reimburse the Needham Small Cap Growth Fund (the “Fund”) until April 30, 2020 to the extent Total Annual Fund Operating Expenses exceed 1.85% and 1.18% of the average daily net assets of Retail Class shares and Institutional Class shares respectively, of the Fund. |
Needham Growth Fund
Schedule of Investments
June 30, 2019 (Unaudited)
| | | Shares | | | Value | |
| Common Stocks (94.7%) | | | | | | |
| | | | | | | |
| Aerospace & Defense (0.2%) | | | | | | |
| Parsons Corp. (a) | | | 4,750 | | | $ | 175,085 | |
| | | | | | | | | |
| Airlines (0.3%) | | | | | | | | |
| Hawaiian Holdings, Inc. | | | 9,500 | | | | 260,585 | |
| | | | | | | | | |
| Biotechnology (6.0%) | | | | | | | | |
| Gilead Sciences, Inc. | | | 86,000 | | | | 5,810,160 | |
| | | | | | | | | |
| Building Products (0.6%) | | | | | | | | |
| DIRTT Environmental Solutions (Canada) (a) | | | 100,000 | | | | 568,898 | |
| | | | | | | | | |
| Capital Markets (1.0%) | | | | | | | | |
| Oaktree Capital Group – Class A | | | 20,000 | | | | 990,800 | |
| | | | | | | | | |
| Commercial Services & Supplies (0.1%) | | | | | | | | |
| Clean Harbors, Inc. (a) | | | 1,500 | | | | 106,650 | |
| | | | | | | | | |
| Communications Equipment (7.2%) | | | | | | | | |
| Cambium Networks Corp. (a) | | | 1,360 | | | | 13,042 | |
| KVH Industries, Inc. (a) | | | 490,000 | | | | 5,326,300 | |
| ViaSat, Inc. (a)(c) | | | 19,500 | | | | 1,575,990 | |
| | | | | | | | 6,915,332 | |
| Electrical Equipment (1.0%) | | | | | | | | |
| Vicor Corp. (a) | | | 30,000 | | | | 931,500 | |
| | | | | | | | | |
| Electronic Equipment, Instruments & Components (5.0%) | | | | | | | | |
| Corning, Inc. | | | 35,000 | | | | 1,163,050 | |
| FLIR Systems, Inc. | | | 8,500 | | | | 459,850 | |
| Frequency Electronics, Inc. (a) | | | 26,000 | | | | 296,140 | |
| IPG Photonics Corp. (a) | | | 6,250 | | | | 964,063 | |
| National Instruments Corp. | | | 20,000 | | | | 839,800 | |
| nLight, Inc. (a) | | | 3,500 | | | | 67,200 | |
| Vishay Intertechnology, Inc. | | | 60,000 | | | | 991,200 | |
| | | | | | | | 4,781,303 | |
| Energy Equipment & Services (3.1%) | | | | | | | | |
| Aspen Aerogels, Inc. (a) | | | 367,650 | | | | 2,621,345 | |
| Schlumberger, Ltd. (Netherlands) | | | 10,000 | | | | 397,400 | |
| | | | | | | | 3,018,745 | |
See accompanying notes to financial statements.
Needham Growth Fund
Schedule of Investments (Continued)
June 30, 2019 (Unaudited)
| | | Shares | | | Value | |
| Common Stocks – Continued | | | | | | |
| | | | | | | |
| Entertainment (0.7%) | | | | | | |
| World Wrestling Entertainment, Inc. – Class A | | | 9,500 | | | $ | 685,995 | |
| | | | | | | | | |
| Health Care Equipment & Supplies (8.5%) | | | | | | | | |
| Becton Dickinson & Co. | | | 20,000 | | | | 5,040,200 | |
| CryoPort, Inc. (a) | | | 57,500 | | | | 1,053,400 | |
| Medtronic PLC (Ireland) | | | 22,000 | | | | 2,142,580 | |
| | | | | | | | 8,236,180 | |
| Health Care Providers & Services (0.7%) | | | | | | | | |
| Laboratory Corp of America Holdings (a) | | | 2,000 | | | | 345,800 | |
| Quest Diagnostics, Inc. | | | 3,500 | | | | 356,335 | |
| | | | | | | | 702,135 | |
| Household Products (0.6%) | | | | | | | | |
| Oil-Dri Corp. of America | | | 17,000 | | | | 578,680 | |
| | | | | | | | | |
| Industrial Conglomerates (0.5%) | | | | | | | | |
| Honeywell International, Inc. | | | 2,500 | | | | 436,475 | |
| | | | | | | | | |
| Interactive Media & Services (0.0%) | | | | | | | | |
| Eventbrite, Inc. – Class A (a) | | | 1,000 | | | | 16,200 | |
| | | | | | | | | |
| IT Services (2.8%) | | | | | | | | |
| Akamai Technologies, Inc. (a)(c) | | | 34,000 | | | | 2,724,760 | |
| | | | | | | | | |
| Life Sciences Tools & Services (9.1%) | | | | | | | | |
| Thermo Fisher Scientific, Inc. (c) | | | 30,000 | | | | 8,810,400 | |
| | | | | | | | | |
| Machinery (0.8%) | | | | | | | | |
| Wabtec Corp. | | | 11,250 | | | | 807,300 | |
| | | | | | | | | |
| Media (5.0%) | | | | | | | | |
| Comcast Corp. – Class A | | | 115,000 | | | | 4,862,200 | |
| | | | | | | | | |
| Oil, Gas & Consumable Fuels (0.3%) | | | | | | | | |
| Navigator Holdings, Ltd. (a) | | | 33,000 | | | | 308,880 | |
| | | | | | | | | |
| Road & Rail (0.1%) | | | | | | | | |
| Uber Technologies, Inc. (a) | | | 1,321 | | | | 61,268 | |
See accompanying notes to financial statements.
Needham Growth Fund
Schedule of Investments (Continued)
June 30, 2019 (Unaudited)
| | | Shares | | | Value | |
| Common Stocks – Continued | | | | | | |
| | | | | | | |
| Semiconductors & Semiconductor Equipment (20.9%) | | | | | | |
| Applied Materials, Inc. | | | 9,000 | | | $ | 404,190 | |
| Entegris, Inc. | | | 130,000 | | | | 4,851,600 | |
| FormFactor, Inc. (a) | | | 162,500 | | | | 2,546,375 | |
| Lam Research Corp. | | | 2,500 | | | | 469,600 | |
| MKS Instruments, Inc. | | | 25,000 | | | | 1,947,250 | |
| Nova Measuring Instruments, Ltd. (Israel) (a) | | | 58,500 | | | | 1,497,015 | |
| PDF Solutions, Inc. (a) | | | 495,400 | | | | 6,499,648 | |
| Photronics, Inc. (a) | | | 150,000 | | | | 1,230,000 | |
| Taiwan Semiconductor Manufacturing | | | | | | | | |
| Co., Ltd. (Taiwan) – ADR | | | 8,500 | | | | 332,945 | |
| Ultra Clean Holdings, Inc. (a) | | | 25,000 | | | | 348,000 | |
| | | | | | | | 20,126,623 | |
| Software (6.1%) | | | | | | | | |
| The Trade Desk, Inc. – Class A (a) | | | 5,300 | | | | 1,207,234 | |
| 2U, Inc. (a) | | | 10,000 | | | | 376,400 | |
| Altair Engineering, Inc. – Class A (a) | | | 2,996 | | | | 121,008 | |
| Appian Corp. (a) | | | 10,000 | | | | 360,700 | |
| ChannelAdvisor Corp. (a) | | | 30,000 | | | | 262,800 | |
| Coupa Software, Inc. (a) | | | 4,800 | | | | 607,728 | |
| Everbridge, Inc. (a) | | | 10,000 | | | | 894,200 | |
| Q2 Holdings, Inc. (a) | | | 19,000 | | | | 1,450,839 | |
| Zuora, Inc. – Class A (a) | | | 40,000 | | | | 612,800 | |
| | | | | | | | 5,893,709 | |
| Specialty Retail (7.4%) | | | | | | | | |
| CarMax, Inc. (a)(c) | | | 82,500 | | | | 7,163,475 | |
| | | | | | | | | |
| Technology Hardware, Storage & Peripherals (4.5%) | | | | | | | | |
| Apple, Inc. | | | 2,700 | | | | 534,384 | |
| Electronics for Imaging, Inc. (a) | | | 40,000 | | | | 1,476,400 | |
| Super Micro Computer, Inc. (a) | | | 122,500 | | | | 2,370,375 | |
| | | | | | | | 4,381,159 | |
| Trading Companies & Distributors (2.2%) | | | | | | | | |
| Air Lease Corp. – Class A | | | 50,000 | | | | 2,067,000 | |
| | | | | | | | | |
| Total Common Stocks | | | | | | | | |
| (Cost $38,388,722) | | | | | | $ | 91,421,497 | |
See accompanying notes to financial statements.
Needham Growth Fund
Schedule of Investments (Continued)
June 30, 2019 (Unaudited)
| | | Shares | | | Value | |
| Short-Term Investments (5.0%) | | | | | | |
| | | | | | | |
| Money Market Fund (5.0%) | | | | | | |
| Dreyfus Treasury Securities Cash Management – | | | | | | |
| Institutional Class 2.10% (b) | | | | | | |
| | | | | | | |
| Total Short-Term Investments | | | | | | |
| (Cost $4,843,383) | | | 4,843,383 | | | $ | 4,843,383 | |
| | | | | | | | | |
| Total Investments (99.7%) | | | | | | | | |
| (Cost $43,232,105) | | | | | | | 96,264,880 | |
| Total Securities Sold Short (-1.7%) | | | | | | | (1,664,370 | ) |
| (Proceeds $338,383) | | | | | | | | |
| Other Assets in Excess of Liabilities (2.0%) | | | | | | | 1,951,424 | |
| Net Assets (100.0%) | | | | | | $ | 96,551,934 | |
| | Percentages are stated as a percent of net assets. |
| | Industry classifications may be different than those used for compliance monitoring purposes. |
| (a) | Non-income producing security. |
| (b) | Rate shown is the seven-day yield as of June 30, 2019. |
| (c) | Security position is either entirely or partially held in a segregated account as collateral for securities sold short, aggregating a total market value of $2,724,440. |
| ADR | American Depositary Receipt |
See accompanying notes to financial statements.
Needham Growth Fund
Schedule of Securities Sold Short
June 30, 2019 (Unaudited)
| | | Shares | | | Value | |
| Securities Sold Short (-1.7%) | | | | | | |
| | | | | | | |
| Communications Equipment (-1.2%) | | | | | | |
| Ubiquiti Networks, Inc. | | | 9,000 | | | $ | 1,183,500 | |
| | | | | | | | | |
| Consumer Finance (-0.5%) | | | | | | | | |
| Medallion Financial Corp. (a) | | | 67,500 | | | | 454,950 | |
| | | | | | | | | |
| Insurance (0.0%) | | | | | | | | |
| Health Insurance Innovations, Inc. – Class A (a) | | | 1,000 | | | | 25,920 | |
| | | | | | | | | |
| Total Securities Sold Short (-1.7%) | | | | | | | | |
| (Proceeds $338,383) | | | | | | $ | 1,664,370 | |
| (a) | Non-income producing security. |
See accompanying notes to financial statements.
Needham Aggressive Growth Fund
Schedule of Investments
June 30, 2019 (Unaudited)
| | | Shares | | | Value | |
| Common Stocks (97.2%) | | | | | | |
| | | | | | | |
| Aerospace & Defense (0.2%) | | | | | | |
| Parsons Corp. (a) | | | 2,350 | | | $ | 86,621 | |
| | | | | | | | | |
| Airlines (0.2%) | | | | | | | | |
| Hawaiian Holdings, Inc. | | | 2,500 | | | | 68,575 | |
| | | | | | | | | |
| Building Products (4.4%) | | | | | | | | |
| Alpha Pro Tech, Ltd. (a) | | | 60,544 | | | | 206,455 | |
| DIRTT Environmental Solutions (Canada) (a) | | | 312,500 | | | | 1,777,805 | |
| Jewett-Cameron Trading Co., Ltd. (Canada) (a) | | | 4,000 | | | | 33,200 | |
| | | | | | | | 2,017,460 | |
| Commercial Services & Supplies (0.7%) | | | | | | | | |
| Ecology and Environment, Inc. – Class A | | | 29,972 | | | | 326,695 | |
| | | | | | | | | |
| Communications Equipment (8.8%) | | | | | | | | |
| Cambium Networks Corp. (a) | | | 635 | | | | 6,090 | |
| KVH Industries, Inc. (a) | | | 369,400 | | | | 4,015,378 | |
| | | | | | | | 4,021,468 | |
| Construction Materials (0.4%) | | | | | | | | |
| Smith-Midland Corp. | | | 20,000 | | | | 176,000 | |
| | | | | | | | | |
| Electrical Equipment (4.3%) | | | | | | | | |
| Vicor Corp. (a) | | | 63,500 | | | | 1,971,675 | |
| | | | | | | | | |
| Electronic Equipment, Instruments & Components (3.8%) | | | | | | | | |
| IPG Photonics Corp. (a) | | | 7,000 | | | | 1,079,750 | |
| National Instruments Corp. | | | 7,000 | | | | 293,930 | |
| nLight, Inc. (a) | | | 1,523 | | | | 29,242 | |
| Vishay Precision Group, Inc. (a) | | | 7,500 | | | | 304,725 | |
| | | | | | | | 1,707,647 | |
| Energy Equipment & Services (1.9%) | | | | | | | | |
| Aspen Aerogels, Inc. (a) | | | 122,050 | | | | 870,216 | |
| | | | | | | | | |
| Entertainment (0.7%) | | | | | | | | |
| World Wrestling Entertainment, Inc. – Class A | | | 4,500 | | | | 324,945 | |
See accompanying notes to financial statements.
Needham Aggressive Growth Fund
Schedule of Investments (Continued)
June 30, 2019 (Unaudited)
| | | Shares | | | Value | |
| Common Stocks – Continued | | | | | | |
| | | | | | | |
| Health Care Equipment & Supplies (2.8%) | | | | | | |
| CryoPort, Inc. (a) | | | 35,000 | | | $ | 641,200 | |
| LeMaitre Vascular, Inc. | | | 22,500 | | | | 629,550 | |
| | | | | | | | 1,270,750 | |
| Health Care Providers & Services (0.6%) | | | | | | | | |
| Laboratory Corp. of America Holdings (a) | | | 500 | | | | 86,450 | |
| Quest Diagnostics, Inc. | | | 1,750 | | | | 178,167 | |
| | | | | | | | 264,617 | |
| Health Care Technology (0.6%) | | | | | | | | |
| Omnicell, Inc. (a) | | | 3,000 | | | | 258,090 | |
| | | | | | | | | |
| Household Durables (0.0%) | | | | | | | | |
| iRobot Corp. (a) | | | 200 | | | | 18,328 | |
| | | | | | | | | |
| Household Products (3.2%) | | | | | | | | |
| Oil-Dri Corp. of America | | | 43,000 | | | | 1,463,720 | |
| | | | | | | | | |
| Interactive Media & Services (0.1%) | | | | | | | | |
| Eventbrite, Inc. – Class A (a) | | | 1,500 | | | | 24,300 | |
| | | | | | | | | |
| IT Services (4.1%) | | | | | | | | |
| Akamai Technologies, Inc. (a)(c) | | | 23,500 | | | | 1,883,290 | |
| | | | | | | | | |
| Life Sciences Tools & Services (0.1%) | | | | | | | | |
| Bruker Corp. | | | 500 | | | | 24,975 | |
| | | | | | | | | |
| Machinery (1.1%) | | | | | | | | |
| Wabtec Corp. | | | 7,000 | | | | 502,320 | |
| | | | | | | | | |
| Professional Services (0.4%) | | | | | | | | |
| CRA International, Inc. | | | 5,000 | | | | 191,650 | |
| | | | | | | | | |
| Real Estate Investment Trusts (REITs) (2.2%) | | | | | | | | |
| Equinix, Inc. | | | 2,000 | | | | 1,008,580 | |
| | | | | | | | | |
| Road & Rail (0.1%) | | | | | | | | |
| Uber Technologies, Inc. (a) | | | 649 | | | | 30,101 | |
See accompanying notes to financial statements.
Needham Aggressive Growth Fund
Schedule of Investments (Continued)
June 30, 2019 (Unaudited)
| | | Shares | | | Value | |
| Common Stocks – Continued | | | | | | |
| | | | | | | |
| Semiconductors & Semiconductor Equipment (30.8%) (d) | | | | | | |
| Entegris, Inc. | | | 120,000 | | | $ | 4,478,400 | |
| FormFactor, Inc. (a) | | | 30,000 | | | | 470,100 | |
| MKS Instruments, Inc. | | | 23,000 | | | | 1,791,470 | |
| Nova Measuring Instruments, Ltd. (Israel) (a)(c) | | | 63,000 | | | | 1,612,170 | |
| PDF Solutions, Inc. (a)(c) | | | 365,500 | | | | 4,795,360 | |
| Photronics, Inc. (a) | | | 70,000 | | | | 574,000 | |
| Taiwan Semiconductor Manufacturing | | | | | | | | |
| Co., Ltd. (Taiwan) – ADR | | | 7,000 | | | | 274,190 | |
| Ultra Clean Holdings, Inc. (a) | | | 2,000 | | | | 27,840 | |
| | | | | | | | 14,023,530 | |
| Software (9.7%) | | | | | | | | |
| The Trade Desk, Inc. – Class A (a) | | | 1,300 | | | | 296,114 | |
| Altair Engineering, Inc. – Class A (a) | | | 1,000 | | | | 40,390 | |
| Appian Corp. (a) | | | 2,500 | | | | 90,175 | |
| Carbon Black, Inc. (a) | | | 1,500 | | | | 25,080 | |
| ChannelAdvisor Corp. (a) | | | 5,000 | | | | 43,800 | |
| Coupa Software, Inc. (a) | | | 1,200 | | | | 151,932 | |
| Everbridge, Inc. (a) | | | 4,000 | | | | 357,680 | |
| GSE Systems, Inc. (a)(e) | | | 1,120,000 | | | | 2,620,800 | |
| Pluralsight, Inc. – Class A (a) | | | 1,000 | | | | 30,320 | |
| Q2 Holdings, Inc. (a) | | | 9,000 | | | | 687,240 | |
| Zuora, Inc. – Class A (a) | | | 4,381 | | | | 67,117 | |
| | | | | | | | 4,410,648 | |
| Specialty Retail (3.9%) | | | | | | | | |
| CarMax, Inc. (a)(c) | | | 20,500 | | | | 1,780,015 | |
| | | | | | | | | |
| Technology Hardware, Storage & Peripherals (11.8%) | | | | | | | | |
| Apple, Inc. (c) | | | 20,000 | | | | 3,958,400 | |
| Electronics for Imaging, Inc. (a) | | | 4,500 | | | | 166,095 | |
| Super Micro Computer, Inc. (a) | | | 65,000 | | | | 1,257,750 | |
| | | | | | | | 5,382,245 | |
| Trading Companies & Distributors (0.3%) | | | | | | | | |
| Air Lease Corp. – Class A | | | 3,000 | | | | 124,021 | |
| | | | | | | | | |
| Total Common Stocks | | | | | | | | |
| (Cost $21,119,446) | | | | | | $ | 44,232,482 | |
See accompanying notes to financial statements.
Needham Aggressive Growth Fund
Schedule of Investments (Continued)
June 30, 2019 (Unaudited)
| | | Shares | | | Value | |
| Short-Term Investments (3.4%) | | | | | | |
| | | | | | | |
| Money Market Fund (3.4%) | | | | | | |
| Dreyfus Treasury Securities Cash Management – | | | | | | |
| Institutional Class 2.10% (b) | | | | | | |
| | | | | | | |
| Total Short-Term Investments | | | | | | |
| (Cost $1,555,026) | | | 1,555,026 | | | $ | 1,555,026 | |
| | | | | | | | | |
| Total Investments (100.6%) | | | | | | | | |
| (Cost $22,674,472) | | | | | | | 45,787,508 | |
| Total Securities Sold Short (-1.6%) | | | | | | | (740,570 | ) |
| (Proceeds $171,827) | | | | | | | | |
| Other Assets in Excess of Liabilities (1.0%) | | | | | | | 479,909 | |
| Net Assets (100.0%) | | | | | | $ | 45,526,847 | |
| | Percentages are stated as a percent of net assets. |
| | Industry classifications may be different than those used for compliance monitoring purposes. |
| (a) | Non-income producing security. |
| (b) | Rate shown is the seven-day yield as of June 30, 2019. |
| (c) | Security position is either entirely or partially held in a segregated account as collateral for securities sold short, aggregating a total market value of $3,736,510 |
| (d) | As of June 30, 2019, the Fund had a significant portion of its assets invested in the Semiconductors & Semiconductor Equipment industry. |
| (e) | Affiliated security. Please refer to Note 11 of the Financial Statements. |
| ADR | American Depositary Receipt |
See accompanying notes to financial statements.
Needham Aggressive Growth Fund
Schedule of Securities Sold Short
June 30, 2019 (Unaudited)
| | | Shares | | | Value | |
| Securities Sold Short (-1.6%) | | | | | | |
| | | | | | | |
| Communications Equipment (-0.9%) | | | | | | |
| Ubiquiti Networks, Inc. | | | 3,000 | | | $ | 394,500 | |
| | | | | | | | | |
| Consumer Finance (-0.7%) | | | | | | | | |
| Medallion Financial Corp. (a) | | | 47,500 | | | | 320,150 | |
| | | | | | | | | |
| Insurance (0.0%) | | | | | | | | |
| Health Insurance Innovations, Inc. – Class A (a) | | | 1,000 | | | | 25,920 | |
| | | | | | | | | |
| Total Securities Sold Short (-1.6%) | | | | | | | | |
| (Proceeds $171,827) | | | | | | $ | 740,570 | |
| (a) | Non-income producing security. |
See accompanying notes to financial statements.
Needham Small Cap Growth Fund
Schedule of Investments
June 30, 2019 (Unaudited)
| | | Shares | | | Value | |
| Common Stocks (84.8%) | | | | | | |
| | | | | | | |
| Airlines (3.3%) | | | | | | |
| Hawaiian Holdings, Inc. | | | 45,000 | | | $ | 1,234,350 | |
| | | | | | | | | |
| Biotechnology (0.8%) | | | | | | | | |
| Moderna, Inc. (a) | | | 20,000 | | | | 292,800 | |
| | | | | | | | | |
| Building Products (0.6%) | | | | | | | | |
| DIRTT Environmental Solutions (Canada) (a) | | | 40,000 | | | | 227,559 | |
| | | | | | | | | |
| Communications Equipment (6.2%) | | | | | | | | |
| Cambium Networks Corp. (a) | | | 517 | | | | 4,958 | |
| Emcore Corp. (a) | | | 410,000 | | | | 1,348,900 | |
| KVH Industries, Inc. (a)(b) | | | 91,000 | | | | 989,170 | |
| | | | | | | | 2,343,028 | |
| Electrical Equipment (2.5%) | | | | | | | | |
| Vicor Corp. (a) | | | 30,000 | | | | 931,500 | |
| | | | | | | | | |
| Electronic Equipment, Instruments & Components (7.4%) | | | | | | | | |
| Akoustis Technologies, Inc. (a) | | | 120,000 | | | | 768,000 | |
| Frequency Electronics, Inc. (a) | | | 42,500 | | | | 484,075 | |
| TTM Technologies, Inc. (a) | | | 150,000 | | | | 1,530,000 | |
| | | | | | | | 2,782,075 | |
| Energy Equipment & Services (7.6%) | | | | | | | | |
| Aspen Aerogels, Inc. (a) | | | 362,500 | | | | 2,584,625 | |
| Core Laboratories NV (Netherlands) | | | 2,000 | | | | 104,560 | |
| Schlumberger, Ltd. (Netherlands) | | | 4,000 | | | | 158,960 | |
| | | | | | | | 2,848,145 | |
| Health Care Equipment & Supplies (2.3%) | | | | | | | | |
| CryoPort, Inc. (a) | | | 15,000 | | | | 274,800 | |
| GenMark Diagnostics, Inc. (a) | | | 90,000 | | | | 584,100 | |
| | | | | | | | 858,900 | |
| Machinery (1.2%) | | | | | | | | |
| Wabtec Corp. | | | 6,000 | | | | 430,560 | |
| | | | | | | | | |
| Oil, Gas & Consumable Fuels (3.9%) | | | | | | | | |
| Navigator Holdings, Ltd. (a) | | | 157,300 | | | | 1,472,328 | |
See accompanying notes to financial statements.
Needham Small Cap Growth Fund
Schedule of Investments (Continued)
June 30, 2019 (Unaudited)
| | | Shares | | | Value | |
| Common Stocks – Continued | | | | | | |
| | | | | | | |
| Pharmaceuticals (0.4%) | | | | | | |
| Agile Therapeutics, Inc. (a) | | | 95,000 | | | $ | 138,700 | |
| | | | | | | | | |
| Road & Rail (0.1%) | | | | | | | | |
| Uber Technologies, Inc. (a) | | | 514 | | | | 23,839 | |
| | | | | | | | | |
| Semiconductors & Semiconductor Equipment (32.8%) (d) | | | | | | | | |
| Aquantia Corp. (a) | | | 5,000 | | | | 65,150 | |
| Cohu, Inc. | | | 110,000 | | | | 1,697,300 | |
| FormFactor, Inc. (a) | | | 500 | | | | 7,835 | |
| MACOM Technology Solutions Holdings, Inc. (a) | | | 120,000 | | | | 1,815,600 | |
| MKS Instruments, Inc. | | | 10,000 | | | | 778,900 | |
| PDF Solutions, Inc. (a)(b) | | | 220,000 | | | | 2,886,400 | |
| Photronics, Inc. (a) | | | 400,000 | | | | 3,280,000 | |
| Ultra Clean Holdings, Inc. (a) | | | 125,000 | | | | 1,740,000 | |
| | | | | | | | 12,271,185 | |
| Software (9.4%) | | | | | | | | |
| 2U, Inc. (a) | | | 10,000 | | | | 376,400 | |
| Appian Corp. (a) | | | 4,500 | | | | 162,315 | |
| ChannelAdvisor Corp. (a) | | | 60,000 | | | | 525,600 | |
| Everbridge, Inc. (a) | | | 2,000 | | | | 178,840 | |
| FireEye, Inc. (a) | | | 30,000 | | | | 444,300 | |
| Zuora, Inc. (a) | | | 120,000 | | | | 1,838,400 | |
| | | | | | | | 3,525,855 | |
| Technology Hardware, Storage & Peripherals (3.0%) | | | | | | | | |
| Intevac, Inc. (a) | | | 200,000 | | | | 968,000 | |
| Super Micro Computer, Inc. (a)(b) | | | 7,500 | | | | 145,124 | |
| | | | | | | | 1,113,124 | |
| Trading Companies & Distributors (3.3%) | | | | | | | | |
| Air Lease Corp. | | | 30,000 | | | | 1,240,200 | |
| | | | | | | | | |
| Total Common Stocks | | | | | | | | |
| (Cost $29,050,664) | | | | | | $ | 31,734,148 | |
See accompanying notes to financial statements.
Needham Small Cap Growth Fund
Schedule of Investments (Continued)
June 30, 2019 (Unaudited)
| | | Shares | | | Value | |
| Closed-End Funds (1.6%) | | | | | | |
| Tekla Healthcare Investors | | | 15,000 | | | $ | 301,200 | |
| Tekla Life Sciences Investors | | | 17,500 | | | | 294,875 | |
| | | | | | | | | |
| Total Closed-End Funds | | | | | | | | |
| (Cost $688,095) | | | | | | $ | 596,075 | |
| | | | | | | | | |
| Short-Term Investments (17.8%) | | | | | | | | |
| | | | | | | | | |
| Money Market Fund (17.8%) | | | | | | | | |
| Dreyfus Treasury Securities Cash Management – | | | | | | | | |
| Institutional Class 2.10% (c) | | | | | | | | |
| | | | | | | | | |
| Total Short-Term Investments | | | | | | | | |
| (Cost $6,652,941) | | | 6,652,941 | | | $ | 6,652,941 | |
| | | | | | | | | |
| Total Investments (104.2%) | | | | | | | | |
| (Cost $36,391,700) | | | | | | | 38,983,164 | |
| Liabilities in Excess of Other Assets (-4.2%) | | | | | | | (1,578,231 | ) |
| Net Assets (100.0%) | | | | | | $ | 37,404,933 | |
| | Percentages are stated as a percent of net assets. |
| | Industry classifications may be different than those used for compliance monitoring purposes. |
| (a) | Non-income producing security. |
| (b) | Security position is either entirely or partially held in a segregated account as collateral for securities sold short, aggregating a total market value of $1,235,925. |
| (c) | Rate shown is the seven-day yield as of June 30, 2019. |
| (d) | As of June 30, 2019, the Fund had a significant portion of its assets invested in the Semiconductors & Semiconductor Equipment industry. |
See accompanying notes to financial statements.
(This Page Intentionally Left Blank.)
Statements of Assets and Liabilities
June 30, 2019 (Unaudited)
| | | | | | Needham | | | Needham | |
| | | Needham | | | Aggressive | | | Small Cap | |
| | | Growth Fund | | | Growth Fund | | | Growth Fund | |
| Assets | | | | | | | | | |
| Investments, at value: | | | | | | | | | |
| Unaffiliated securities, | | | | | | | | | |
| (Cost $43,232,105, $20,395,354, $36,391,700) | | $ | 96,264,880 | | | $ | 43,166,708 | | | $ | 38,983,164 | |
| Affiliated securities (Cost $—, $2,279,118, $—) | | | — | | | | 2,620,800 | | | | — | |
| Cash | | | — | | | | — | | | | 22,800 | |
| Receivables: | | | | | | | | | | | | |
| Deposit with Broker for Securities Sold Short | | | 1,898,635 | | | | 788,742 | | | | — | |
| Dividends and Interest | | | 37,573 | | | | 11,310 | | | | 29,365 | |
| Fund Shares Sold | | | 65 | | | | 88 | | | | 11,154 | |
| Investment Securities Sold | | | 265,267 | | | | 38,439 | | | | 224,488 | |
| Prepaid Expenses | | | 37,633 | | | | 16,571 | | | | 49,775 | |
| Total Assets | | | 98,504,053 | | | | 46,642,658 | | | | 39,320,746 | |
| | | | | | | | | | | | | |
| Liabilities | | | | | | | | | | | | |
| Securities Sold Short, at Value | | | | | | | | | | | | |
| (Proceeds $338,383, $171,827, $—) | | | 1,664,370 | | | | 740,570 | | | | — | |
| Payables: | | | | | | | | | | | | |
| Investment Securities Purchased | | | 104,936 | | | | 101,056 | | | | 1,837,571 | |
| Fund Shares Redeemed | | | — | | | | 172,456 | | | | 2,940 | |
| Due to Adviser | | | 88,537 | | | | 34,418 | | | | 27,321 | |
| Custodian Fees | | | 2,261 | | | | 2,938 | | | | 2,799 | |
| Distribution Fees | | | 12,675 | | | | 5,981 | | | | 3,784 | |
| Administration and Accounting Fees | | | 32,099 | | | | 17,987 | | | | 12,521 | |
| Transfer Agent Fees | | | 12,878 | | | | 12,975 | | | | 9,270 | |
| Accrued Expenses and Other Liabilities | | | 34,363 | | | | 27,430 | | | | 19,607 | |
| Total Liabilities | | | 1,952,119 | | | | 1,115,809 | | | | 1,915,813 | |
| Total Net Assets | | $ | 96,551,934 | | | $ | 45,526,847 | | | $ | 37,404,933 | |
See accompanying notes to financial statements.
Statements of Assets and Liabilities (Continued)
June 30, 2019 (Unaudited)
| | | | | | Needham | | | Needham | |
| | | Needham | | | Aggressive | | | Small Cap | |
| | | Growth Fund | | | Growth Fund | | | Growth Fund | |
| Retail Class Shares | | | | | | | | | |
| Net Assets | | $ | 60,589,700 | | | $ | 28,574,008 | | | $ | 17,851,606 | |
| Shares Issued and Outstanding | | | | | | | | | | | | |
| $0.001 Par Value (Authorized | | | | | | | | | | | | |
| 800,000,000,100,000,000 and | | | | | | | | | | | | |
| 100,000,000 respectively) | | | 1,461,301 | | | | 1,385,801 | | | | 1,115,610 | |
| Net Asset Value and | | | | | | | | | | | | |
| Offering Price Per Share | | $ | 41.46 | | | $ | 20.62 | | | $ | 16.00 | |
| | | | | | | | | | | | | |
| Institutional Class Shares | | | | | | | | | | | | |
| Net Assets | | $ | 35,962,234 | | | $ | 16,952,839 | | | $ | 19,553,327 | |
| Shares Issued and Outstanding | | | | | | | | | | | | |
| $0.001 Par Value (Authorized | | | | | | | | | | | | |
| 800,000,000,100,000,000 and | | | | | | | | | | | | |
| 100,000,000 respectively) | | | 854,380 | | | | 809,134 | | | | 1,202,371 | |
| Net Asset Value and | | | | | | | | | | | | |
| Offering Price Per Share | | $ | 42.09 | | | $ | 20.95 | | | $ | 16.26 | |
| | | | | | | | | | | | | |
| Components of Net Assets | | | | | | | | | | | | |
| Paid in Capital | | | 31,664,675 | | | | 18,901,346 | | | | 32,240,957 | |
| Distributable Earnings | | | 64,887,259 | | | | 26,625,501 | | | | 5,163,976 | |
| Total Net Assets | | $ | 96,551,934 | | | $ | 45,526,847 | | | $ | 37,404,933 | |
See accompanying notes to financial statements.
Statements of Operations
For the period ended June 30, 2019 (Unaudited)
| | | | | | Needham | | | Needham | |
| | | Needham | | | Aggressive | | | Small Cap | |
| | | Growth Fund | | | Growth Fund | | | Growth Fund | |
| Investment Income | | | | | | | | | |
| Dividend Income from unaffiliated securities (net of | | | | | | | | | |
| foreign withholding tax of $165, $1,875, $0) | | $ | 319,427 | | | $ | 116,097 | | | $ | 78,671 | |
| Interest Income | | | 9,766 | | | | 2,966 | | | | 50,229 | |
| Total Investment Income | | | 329,193 | | | | 119,063 | | | | 128,900 | |
| | | | | | | | | | | | | |
| Expenses | | | | | | | | | | | | |
| Investment Advisory Fees | | | 568,606 | | | | 277,337 | | | | 205,456 | |
| Distribution Fees | | | 72,678 | | | | 35,662 | | | | 20,043 | |
| Administration and Accounting Fees | | | 59,293 | | | | 35,072 | | | | 24,211 | |
| Audit Fees | | | 21,139 | | | | 15,026 | | | | 15,025 | |
| Chief Compliance Officer Fees | | | 10,065 | | | | 5,338 | | | | 3,130 | |
| Custodian Fees | | | 6,454 | | | | 6,376 | | | | 4,341 | |
| Directors’ Fees | | | 8,647 | | | | 4,430 | | | | 2,774 | |
Dividend Expense(1) | | | 13,375 | | | | 5,687 | | | | 500 | |
| Registration Fees | | | 14,857 | | | | 21,080 | | | | 14,359 | |
Interest Expense(1) | | | 14,434 | | | | 19,034 | | | | 180 | |
| Legal Fees | | | 33,707 | | | | 23,095 | | | | 8,069 | |
| Printing Fees | | | 3,206 | | | | 2,603 | | | | 1,502 | |
| Transfer Agent Fees | | | 9,766 | | | | 20,993 | | | | 13,153 | |
| Other Expenses | | | 39,417 | | | | 10,268 | | | | 5,840 | |
| Total Expenses | | | 875,644 | | | | 482,001 | | | | 318,583 | |
| Fees Waived by Investment Adviser | | | (50,451 | ) | | | (66,535 | ) | | | (58,036 | ) |
| Net Expenses | | | 825,193 | | | | 415,466 | | | | 260,547 | |
| Net Investment Loss | | | (496,000 | ) | | | (296,403 | ) | | | (131,647 | ) |
| | | | | | | | | | | | | |
| Net Realized / Unrealized Gain (Loss) from Affiliated | | | | | | | | | | | | |
| and Unaffiliated Securities, Securities Sold Short, | | | | | | | | | | | | |
| Foreign Currency Translations (Note 3) | | | | | | | | | | | | |
| Net Realized Gain from Unaffiliated Securities | | | 10,664,562 | | | | 5,507,497 | | | | 2,849,672 | |
| Net Realized Loss from Securities Sold Short | | | (4,757,398 | ) | | | (2,650,184 | ) | | | — | |
| Change in Unrealized Appreciation on | | | | | | | | | | | | |
| Unaffiliated Securities and Securities Sold Short | | | 15,242,447 | | | | 6,038,654 | | | | 4,936,149 | |
| Change in Unrealized Appreciation on Affiliated Securities | | | — | | | | 268,800 | | | | — | |
| Net Realized / Unrealized Gain (Loss) from Affiliated and | | | | | | | | | | | | |
| Unaffiliated Securities, Securities Sold Short, | | | | | | | | | | | | |
| Foreign Currency Translations (Note 3) | | | 21,149,611 | | | | 9,164,767 | | | | 7,785,821 | |
| Change in Net Assets Resulting from Operations | | $ | 20,653,611 | | | $ | 8,868,364 | | | $ | 7,654,174 | |
(1) | Expense related to securities sold short. |
See accompanying notes to financial statements.
Needham Growth Fund
Statements of Changes in Net Assets
| | | Period Ended | | | | |
| | | June 30, 2019 | | | Year Ended | |
| | | (Unaudited) | | | December 31, 2018 | |
| Change in Net Assets | | | | | | |
| Operations: | | | | | | |
| Net Investment Loss | | $ | (496,000 | ) | | $ | (1,955,502 | ) |
| Net Realized Gain from Securities, Securities Sold Short, | | | | | | | | |
| Foreign Currency Transactions, and Currency | | | 5,907,164 | | | | 13,196,649 | |
| Net Change in Unrealized Appreciation (Depreciation) on Investments, | | | | | | | | |
| Securities Sold Short, Foreign Currency Translations | | | 15,242,447 | | | | (20,652,199 | ) |
| Change in Net Assets Resulting from Operations | | | 20,653,611 | | | | (9,411,052 | ) |
| | | | | | | | | |
| Distributions to Shareholders from: | | | | | | | | |
| Distributable Earnings | | | — | | | | (13,467,264 | ) |
| | | | | | | | | |
| Capital Transactions: | | | | | | | | |
| Retail Class: | | | | | | | | |
| Shares Issued | | | 156,724 | | | | 819,983 | |
| Shares Issued in Reinvestment of Distribution | | | — | | | | 8,154,389 | |
| Shares Exchanged for Institutional Class Shares | | | (577,409 | ) | | | (3,993,084 | ) |
| Shares Redeemed | | | (6,387,995 | ) | | | (14,136,166 | ) |
| Institutional Class: | | | | | | | | |
| Shares Issued | | | 723,663 | | | | 849,415 | |
| Shares Issued in Reinvestment of Distribution | | | — | | | | 4,391,658 | |
| Shares Issued in Exchange for Retail Class Shares | | | 577,409 | | | | 3,993,084 | |
| Shares Redeemed | | | (1,987,806 | ) | | | (4,297,069 | ) |
| Total Change in Net Assets from Capital Transactions | | | (7,495,414 | ) | | | (4,217,790 | ) |
| | | | | | | | | |
| Change in Net Assets | | | 13,158,197 | | | | (27,096,106 | ) |
| | | | | | | | | |
| Total Net Assets | | | | | | | | |
| Beginning of Period/Year | | | 83,393,737 | | | | 110,489,843 | |
| End of Period/Year | | $ | 96,551,934 | | | $ | 83,393,737 | |
| | | | | | | | | |
| Share Transaction: | | | | | | | | |
| Retail Class: | | | | | | | | |
| Number of Shares Issued | | | 4,204 | | | | 19,432 | |
| Number of Shares Reinvested | | | — | | | | 228,927 | |
| Number of Shares Exchanged for Institutional Class Shares | | | (15,616 | ) | | | (88,717 | ) |
| Number of Shares Redeemed | | | (168,930 | ) | | | (336,013 | ) |
| Change in Retail Class Shares | | | (180,342 | ) | | | (176,371 | ) |
| Institutional Class: | | | | | | | | |
| Number of Shares Issued | | | 18,542 | | | | 20,085 | |
| Number of Shares Reinvested | | | — | | | | 121,889 | |
| Number of Shares Issued in Exchange for Retail Class Shares | | | 15,405 | | | | 88,007 | |
| Number of Shares Redeemed | | | (50,936 | ) | | | (111,309 | ) |
| Change in Institutional Class Shares | | | (16,989 | ) | | | 118,672 | |
| Total Change in Shares | | | (197,331 | ) | | | (57,699 | ) |
See accompanying notes to financial statements.
Needham Aggressive Growth Fund
Statements of Changes in Net Assets
| | | Period Ended | | | | |
| | | June 30, 2019 | | | Year Ended | |
| | | (Unaudited) | | | December 31, 2018 | |
| Change in Net Assets | | | | | | |
| Operations: | | | | | | |
| Net Investment Loss | | $ | (296,403 | ) | | $ | (1,231,378 | ) |
| Net Realized Gain from Securities, Securities Sold Short, | | | | | | | | |
| Foreign Currency Transactions, and Currency | | | 2,857,313 | | | | 8,651,884 | |
| Net Change in Unrealized Appreciation (Depreciation) on Investments, | | | | | | | | |
| Securities Sold Short, Foreign Currency Translations | | | 6,307,454 | | | | (15,384,172 | ) |
| Change in Net Assets Resulting from Operations | | | 8,868,364 | | | | (7,963,666 | ) |
| | | | | | | | | |
| Distributions to Shareholders from: | | | | | | | | |
| Distributable Earnings | | | — | | | | (6,200,868 | ) |
| | | | | | | | | |
| Capital Transactions: | | | | | | | | |
| Retail Class: | | | | | | | | |
| Shares Issued | | | 477,139 | | | | 1,299,673 | |
| Shares Issued in Reinvestment of Distribution | | | — | | | | 4,037,862 | |
| Shares Exchanged for Institutional Class Shares | | | (632,852 | ) | | | (1,302,417 | ) |
| Shares Redeemed | | | (4,140,551 | ) | | | (8,767,504 | ) |
| Institutional Class: | | | | | | | | |
| Shares Issued | | | 558,945 | | | | 2,354,427 | |
| Shares Issued in Reinvestment of Distribution | | | — | | | | 2,069,912 | |
| Shares Issued in Exchange for Retail Class Shares | | | 632,852 | | | | 1,302,417 | |
| Shares Redeemed | | | (834,463 | ) | | | (7,780,135 | ) |
| Total Change in Net Assets from Capital Transactions | | | (3,938,930 | ) | | | (6,785,765 | ) |
| | | | | | | | | |
| Change in Net Assets | | | 4,929,434 | | | | (20,950,299 | ) |
| | | | | | | | | |
| Total Net Assets | | | | | | | | |
| Beginning of Period/Year | | | 40,597,413 | | | | 61,547,712 | |
| End of Period/Year | | $ | 45,526,847 | | | $ | 40,597,413 | |
| | | | | | | | | |
| Share Transaction: | | | | | | | | |
| Retail Class: | | | | | | | | |
| Number of Shares Issued | | | 23,885 | | | | 56,865 | |
| Number of Shares Reinvested | | | — | | | | 219,927 | |
| Number of Shares Exchanged for Institutional Class Shares | | | (34,073 | ) | | | (55,934 | ) |
| Number of Shares Redeemed | | | (212,560 | ) | | | (393,860 | ) |
| Change in Retail Class Shares | | | (222,748 | ) | | | (173,002 | ) |
| Institutional Class: | | | | | | | | |
| Number of Shares Issued | | | 28,175 | | | | 103,957 | |
| Number of Shares Reinvested | | | — | | | | 111,345 | |
| Number of Shares Issued in Exchange for Retail Class Shares | | | 33,610 | | | | 52,355 | |
| Number of Shares Redeemed | | | (41,552 | ) | | | (359,268 | ) |
| Change in Institutional Class Shares | | | 20,233 | | | | (91,611 | ) |
| Total Change in Shares | | | (202,515 | ) | | | (264,613 | ) |
See accompanying notes to financial statements.
Needham Small Cap Growth Fund
Statements of Changes in Net Assets
| | | Period Ended | | | | |
| | | June 30, 2019 | | | Year Ended | |
| | | (Unaudited) | | | December 31, 2018 | |
| Change in Net Assets | | | | | | |
| Operations: | | | | | | |
| Net Investment Loss | | $ | (131,647 | ) | | $ | (308,285 | ) |
| Net Realized Gain from Securities, Securities Sold Short, | | | | | | | | |
| Foreign Currency Transactions, and Currency | | | 2,849,672 | | | | 5,382,884 | |
| Net Change in Unrealized Appreciation (Depreciation) on Investments, | | | | | | | | |
| Securities Sold Short, Foreign Currency Translations | | | 4,936,149 | | | | (6,218,661 | ) |
| Change in Net Assets Resulting from Operations | | | 7,654,174 | | | | (1,144,062 | ) |
| | | | | | | | | |
| Distributions to Shareholders from: | | | | | | | | |
| Distributable Earnings | | | — | | | | (5,214,199 | ) |
| | | | | | | | | |
| Capital Transactions: | | | | | | | | |
| Retail Class: | | | | | | | | |
| Shares Issued | | | 3,952,014 | | | | 2,080,595 | |
| Shares Issued in Reinvestment of Distribution | | | — | | | | 2,958,778 | |
| Shares Exchanged for Institutional Class Shares | | | (43,184 | ) | | | (513,300 | ) |
| Shares Redeemed | | | (2,232,584 | ) | | | (7,736,681 | ) |
| Redemption Fees | | | — | | | | 82 | |
| Institutional Class: | | | | | | | | |
| Shares Issued | | | 4,149,668 | | | | 4,684,908 | |
| Shares Issued in Reinvestment of Distribution | | | — | | | | 2,178,089 | |
| Shares Issued in Exchange for Retail Class Shares | | | 43,184 | | | | 513,300 | |
| Shares Redeemed | | | (772,843 | ) | | | (2,795,178 | ) |
| Total Change in Net Assets from Capital Transactions | | | 5,096,255 | | | | 1,370,593 | |
| | | | | | | | | |
| Change in Net Assets | | | 12,750,429 | | | | (4,987,668 | ) |
| | | | | | | | | |
| Total Net Assets | | | | | | | | |
| Beginning of Period/Year | | | 24,654,504 | | | | 29,642,172 | |
| End of Period/Year | | $ | 37,404,933 | | | $ | 24,654,504 | |
| | | | | | | | | |
| Share Transaction: | | | | | | | | |
| Retail Class: | | | | | | | | |
| Number of Shares Issued | | | 264,739 | | | | 129,771 | |
| Number of Shares Reinvested | | | — | | | | 213,939 | |
| Number of Shares Exchanged for Institutional Class Shares | | | (2,760 | ) | | | (31,379 | ) |
| Number of Shares Redeemed | | | (153,075 | ) | | | (538,198 | ) |
| Change in Retail Class Shares | | | 108,904 | | | | (225,867 | ) |
| Institutional Class: | | | | | | | | |
| Number of Shares Issued | | | 280,583 | | | | 321,658 | |
| Number of Shares Reinvested | | | — | | | | 155,578 | |
| Number of Shares Issued in Exchange for Retail Class Shares | | | 2,718 | | | | 31,112 | |
| Number of Shares Redeemed | | | (49,177 | ) | | | (195,266 | ) |
| Change in Institutional Class Shares | | | 234,124 | | | | 313,082 | |
| Total Change in Shares | | | 343,028 | | | | 87,215 | |
See accompanying notes to financial statements.
Needham Growth Fund
Financial Highlights
| | | Retail Class |
| | | Six Months | | | | | | | | | | | | | | | | |
| | | Ended | | | | | | | | | | | | | | | | |
| (For a Share Outstanding | | June 30, 2019 | | | Year Ended December 31, |
| Throughout each Period/Year) | | (Unaudited) | | | 2018 | | | 2017 | | | 2016 | | | 2015 | | | 2014 | |
| Net Asset Value, | | | | | | | | | | | | | | | | | | |
| Beginning of Period/Year | | $ | 33.04 | | | $ | 42.91 | | | $ | 43.40 | | | $ | 40.96 | | | $ | 46.00 | | | $ | 45.06 | |
| Investment Operations | | | | | | | | | | | | | | | | | | | | | | | | |
| Net Investment Income (Loss) | | | (0.24 | ) | | | (0.88 | ) | | | (0.78 | ) | | | (0.59 | ) | | | (0.68 | ) | | | 0.58 | |
| Net Realized and Unrealized | | | | | | | | | | | | | | | | | | | | | | | | |
| Gain (Loss) on Investments | | | 8.66 | | | | (3.11 | ) | | | 4.45 | | | | 4.86 | | | | (1.60 | ) | | | 4.59 | |
| Total from | | | | | | | | | | | | | | | | | | | | | | | | |
| Investment Operations | | | 8.42 | | | | (3.99 | ) | | | 3.67 | | | | 4.27 | | | | (2.28 | ) | | | 4.01 | |
| | | | | | | | | | | | | | | | | | | | | | | | | |
| Less Distributions | | | | | | | | | | | | | | | | | | | | | | | | |
| Net Realized Gains | | | — | | | | (5.88 | ) | | | (4.16 | ) | | | (1.83 | ) | | | (2.76 | ) | | | (3.07 | ) |
| Total Distributions | | | — | | | | (5.88 | ) | | | (4.16 | ) | | | (1.83 | ) | | | (2.76 | ) | | | (3.07 | ) |
| | | | | | | | | | | | | | | | | | | | | | | | | |
| Capital Contributions | | | | | | | | | | | | | | | | | | | | | | | | |
| Redemption Fees | | | — | | | | — | | | | — | (1) | | | — | (1) | | | — | (1) | | | — | (1) |
| Total Capital Contributions | | | — | | | | — | | | | — | (1) | | | — | (1) | | | — | (1) | | | — | (1) |
| Net Asset Value, | | | | | | | | | | | | | | | | | | | | | | | | |
| End of Period/Year | | $ | 41.46 | | | $ | 33.04 | | | $ | 42.91 | | | $ | 43.40 | | | $ | 40.96 | | | $ | 46.00 | |
| | | | | | | | | | | | | | | | | | | | | | | | | |
| Total Return | | | 25.45 | %(3) | | | (10.26 | )% | | | 8.32 | % | | | 10.57 | % | | | (5.07 | )% | | | 8.98 | % |
| Net Assets, | | | | | | | | | | | | | | | | | | | | | | | | |
| End of Period/Year (000’s) | | $ | 60,590 | | | $ | 54,245 | | | $ | 78,014 | | | $ | 119,117 | | | $ | 127,154 | | | $ | 147,816 | |
| Ratios/Supplemental Data | | | | | | | | | | | | | | | | | | | | | | | | |
| Ratio of Net Expenses to | | | | | | | | | | | | | | | | | | | | | | | | |
| Average Net Assets | | | 2.01 | %(2) | | | 2.76 | % | | | 2.34 | % | | | 2.17 | % | | | 2.05 | % | | | 1.84 | % |
| Ratio of Net Expenses to | | | | | | | | | | | | | | | | | | | | | | | | |
| Average Net Assets (before | | | | | | | | | | | | | | | | | | | | | | | | |
| interest and dividend expense) | | | 1.95 | %(2) | | | 1.92 | % | | | 1.90 | % | | | 1.84 | % | | | 1.82 | % | | | 1.80 | % |
| Ratio of Total Expenses to | | | | | | | | | | | | | | | | | | | | | | | | |
| Average Net Assets (before waiver | | | | | | | | | | | | | | | | | | | | | | | | |
| and reimbursement of expenses) | | | 2.02 | %(2) | | | 2.76 | % | | | 2.34 | % | | | 2.17 | % | | | 2.05 | % | | | 1.84 | % |
| Ratio of Net Investment Income | | | | | | | | | | | | | | | | | | | | | | | | |
| (Loss) to Average Net Assets | | | (1.29 | )%(2) | | | (2.07 | )% | | | (1.73 | )% | | | (1.36 | )% | | | (1.48 | )% | | | (1.32 | )% |
| Ratio of Net Investment | | | | | | | | | | | | | | | | | | | | | | | | |
| Loss to Average Net Assets | | | | | | | | | | | | | | | | | | | | | | | | |
| (before waivers and | | | | | | | | | | | | | | | | | | | | | | | | |
| reimbursements of expenses) | | | (1.30 | )%(2) | | | (2.07 | )% | | | (1.73 | )% | | | (1.36 | )% | | | (1.48 | )% | | | (1.32 | )% |
| Portfolio turnover rate | | | 3 | %(3) | | | 8 | % | | | 9 | % | | | 12 | % | | | 13 | % | | | 12 | % |
(1) | Value is less than $0.005 per share. |
(2) | Annualized for periods less than one year. |
(3) | Not annualized for periods less than one year. |
See accompanying notes to financial statements.
Needham Growth Fund
Financial Highlights
| | | Institutional Class |
| | | | | | | | | | | | Period from | |
| | | | | | | | | | | | December 30, | |
| | | Six Months | | | | | | | | | 2016 | |
| | | Ended | | | Year Ended | | | Year Ended | | | through | |
| (For a Share Outstanding | | June 30, 2019 | | | December 31, | | | December 31, | | | December 31, | |
| Throughout each Period/Year) | | (Unaudited) | | | 2018 | | | 2017 | | | 2016(1) | |
| Net Asset Value, Beginning of Period/Year | | $ | 33.45 | | | $ | 43.15 | | | $ | 43.40 | | | $ | 43.40 | |
| Investment Operations | | | | | | | | | | | | | | | | |
| Net Investment Loss | | | (0.14 | ) | | | (0.65 | ) | | | (0.56 | ) | | | — | |
| Net Realized and Unrealized | | | | | | | | | | | | | | | | |
| Gain (Loss) on Investments | | | 8.78 | | | | (3.17 | ) | | | 4.47 | | | | — | |
| Total from Investment Operations | | | 8.64 | | | | (3.82 | ) | | | 3.91 | | | | — | |
| | | | | | | | | | | | | | | | | |
| Less Distributions | | | | | | | | | | | | | | | | |
| Net Realized Gains | | | — | | | | (5.88 | ) | | | (4.16 | ) | | | — | |
| Total Distributions | | | — | | | | (5.88 | ) | | | (4.16 | ) | | | — | |
| Net Asset Value, End of Period/Year | | $ | 42.09 | | | $ | 33.45 | | | $ | 43.15 | | | $ | 43.40 | |
| | | | | | | | | | | | | | | | | |
| Total Return | | | 25.83 | %(4) | | | (9.83 | )% | | | 8.89 | % | | | 0.00 | % |
| Net Assets, End of Period/Year (000’s) | | $ | 35,962 | | | $ | 29,149 | | | $ | 32,476 | | | $ | 117 | |
| Ratios/Supplemental Data | | | | | | | | | | | | | | | | |
| Ratio of Net Expenses to | | | | | | | | | | | | | | | | |
| Average Net Assets | | | 1.46 | %(3) | | | 2.21 | % | | | 1.90 | % | | | 1.40 | % |
| Ratio of Net Expenses to Average Net Assets | | | | | | | | | | | | | | | | |
| (before interest and dividend expense) | | | 1.40 | %(3) | | | 1.40 | % | | | 1.40 | % | | | 1.40 | % |
| Ratio of Total Expenses to Average Net Assets | | | | | | | | | | | | | | | | |
| (before waiver and reimbursement of expenses) | | | 1.75 | %(3) | | | 2.48 | % | | | 2.15 | % | | | — | %(2) |
| Ratio of Net Investment Loss to | | | | | | | | | | | | | | | | |
| Average Net Assets | | | (0.73 | )%(3) | | | (1.52 | )% | | | (1.24 | )% | | | — | %(2) |
| Ratio of Net Investment Loss to | | | | | | | | | | | | | | | | |
| Average Net Assets (before waivers | | | | | | | | | | | | | | | | |
| and reimbursements of expenses) | | | (1.02 | )%(3) | | | (1.79 | )% | | | (1.49 | )% | | | — | %(2) |
| Portfolio turnover rate | | | 3 | %(4) | | | 8 | % | | | 9 | % | | | 0 | % |
(1) | The Class commenced operations on December 30, 2016. |
(2) | Refer to Note 2 for further description of non-recurring charges related to the issuance of the share class. |
(3) | Annualized for periods less than one year. |
(4) | Not annualized for periods less than one year. |
See accompanying notes to financial statements.
Needham Aggressive Growth Fund
Financial Highlights
| | | Retail Class |
| | | Six Months | | | | | | | | | | | | | | | | |
| | | Ended | | | | | | | | | | | | | | | | |
| (For a Share Outstanding | | June 30, 2019 | | | Year Ended December 31, |
| Throughout each Period/Year) | | (Unaudited) | | | 2018 | | | 2017 | | | 2016 | | | 2015 | | | 2014 | |
| Net Asset Value, | | | | | | | | | | | | | | | | | | |
| Beginning of Period/Year | | $ | 16.86 | | | $ | 23.07 | | | $ | 22.29 | | | $ | 19.56 | | | $ | 23.55 | | | $ | 22.66 | |
| Investment Operations | | | | | | | | | | | | | | | | | | | | | | | | |
| Net Investment Loss | | | (0.15 | ) | | | (0.54 | ) | | | (0.49 | ) | | | (0.38 | ) | | | (0.39 | ) | | | (0.38 | ) |
| Net Realized and Unrealized | | | | | | | | | | | | | | | | | | | | | | | | |
| Gain (Loss) on Investments | | | 3.91 | | | | (2.88 | ) | | | 2.46 | | | | 4.61 | | | | (1.28 | ) | | | 1.98 | |
| Total from | | | | | | | | | | | | | | | | | | | | | | | | |
| Investment Operations | | | 3.76 | | | | (3.42 | ) | | | 1.97 | | | | 4.23 | | | | (1.67 | ) | | | 1.60 | |
| | | | | | | | | | | | | | | | | | | | | | | | | |
| Less Distributions | | | | | | | | | | | | | | | | | | | | | | | | |
| Net Realized Gains | | | — | | | | (2.79 | ) | | | (1.19 | ) | | | (1.50 | ) | | | (2.32 | ) | | | (0.71 | ) |
| Total Distributions | | | — | | | | (2.79 | ) | | | (1.19 | ) | | | (1.50 | ) | | | (2.32 | ) | | | (0.71 | ) |
| | | | | | | | | | | | | | | | | | | | | | | | | |
| Capital Contributions | | | | | | | | | | | | | | | | | | | | | | | | |
| Redemption Fees | | | — | | | | — | | | | — | (1) | | | — | (1) | | | — | (1) | | | — | (1) |
| Total Capital Contributions | | | — | | | | — | | | | — | (1) | | | — | (1) | | | — | (1) | | | — | (1) |
| Net Asset Value, | | | | | | | | | | | | | | | | | | | | | | | | |
| End of Period/Year | | $ | 20.62 | | | $ | 16.86 | | | $ | 23.07 | | | $ | 22.29 | | | $ | 19.56 | | | $ | 23.55 | |
| | | | | | | | | | | | | | | | | | | | | | | | | |
| Total Return | | | 22.30 | %(3) | | | (15.80 | )% | | | 8.73 | % | | | 22.18 | % | | | (7.05 | )% | | | 7.13 | % |
| Net Assets, | | | | | | | | | | | | | | | | | | | | | | | | |
| End of Period/Year (000’s) | | $ | 28,574 | | | $ | 27,119 | | | $ | 41,107 | | | $ | 58,696 | | | $ | 50,906 | | | $ | 62,353 | |
| Ratios/Supplemental Data | | | | | | | | | | | | | | | | | | | | | | | | |
| Ratio of Net Expenses to | | | | | | | | | | | | | | | | | | | | | | | | |
| Average Net Assets | | | 2.07 | %(2) | | | 2.91 | % | | | 2.63 | % | | | 2.71 | % | | | 2.41 | % | | | 2.09 | % |
| Ratio of Net Expenses to | | | | | | | | | | | | | | | | | | | | | | | | |
| Average Net Assets (before | | | | | | | | | | | | | | | | | | | | | | | | |
| interest and dividend expense) | | | 1.95 | %(2) | | | 1.95 | % | | | 1.95 | % | | | 1.95 | % | | | 1.93 | % | | | 1.91 | % |
| Ratio of Total Expenses to | | | | | | | | | | | | | | | | | | | | | | | | |
| Average Net Assets (before waiver | | | | | | | | | | | | | | | | | | | | | | | | |
| and reimbursement of expenses) | | | 2.25 | %(2) | | | 2.97 | % | | | 2.65 | % | | | 2.72 | % | | | 2.42 | % | | | 2.09 | % |
| Ratio of Net Investment | | | | | | | | | | | | | | | | | | | | | | | | |
| Loss to Average Net Assets | | | (1.53 | )%(2) | | | (2.40 | )% | | | (2.12 | )% | | | (1.99 | )% | | | (1.73 | )% | | | (1.60 | )% |
| Ratio of Net Investment | | | | | | | | | | | | | | | | | | | | | | | | |
| Loss to Average Net Assets | | | | | | | | | | | | | | | | | | | | | | | | |
| (before waivers and | | | | | | | | | | | | | | | | | | | | | | | | |
| reimbursements of expenses) | | | (1.71 | )%(2) | | | (2.46 | )% | | | (2.14 | )% | | | (2.00 | )% | | | (1.74 | )% | | | (1.60 | )% |
| Portfolio turnover rate | | | 3 | %(3) | | | 8 | % | | | 15 | % | | | 14 | % | | | 15 | % | | | 19 | % |
(1) | Value is less than $0.005 per share. |
(2) | Annualized for periods less than one year. |
(3) | Not annualized for periods less than one year. |
See accompanying notes to financial statements.
Needham Aggressive Growth Fund
Financial Highlights
| | | Institutional Class |
| | | | | | | | | | | | Period from | |
| | | | | | | | | | | | December 30, | |
| | | Six Months | | | | | | | | | 2016 | |
| | | Ended | | | Year Ended | | | Year Ended | | | through | |
| (For a Share Outstanding | | June 30, 2019 | | | December 31, | | | December 31, | | | December 31, | |
| Throughout each Period/Year) | | (Unaudited) | | | 2018 | | | 2017 | | | 2016(1) | |
| Net Asset Value, Beginning of Period/Year | | $ | 17.08 | | | $ | 23.21 | | | $ | 22.29 | | | $ | 22.29 | |
| Investment Operations | | | | | | | | | | | | | | | | |
| Net Investment Loss | | | (0.10 | ) | | | (0.42 | ) | | | (0.39 | ) | | | — | |
| Net Realized and Unrealized | | | | | | | | | | | | | | | | |
| Gain (Loss) on Investments | | | 3.97 | | | | (2.92 | ) | | | 2.50 | | | | — | |
| Total from Investment Operations | | | 3.87 | | | | (3.34 | ) | | | 2.11 | | | | — | |
| | | | | | | | | | | | | | | | | |
| Less Distributions | | | | | | | | | | | | | | | | |
| Net Realized Gains | | | — | | | | (2.79 | ) | | | (1.19 | ) | | | — | |
| Total Distributions | | | — | | | | (2.79 | ) | | | (1.19 | ) | | | — | |
| Net Asset Value, End of Period/Year | | $ | 20.95 | | | $ | 17.08 | | | $ | 23.21 | | | $ | 22.29 | |
| | | | | | | | | | | | | | | | | |
| Total Return | | | 22.66 | %(4) | | | (15.36 | )% | | | 9.36 | % | | | 0.00 | % |
| Net Assets, End of Period/Year (000’s) | | $ | 16,953 | | | $ | 13,478 | | | $ | 20,441 | | | $ | 162 | |
| Ratios/Supplemental Data | | | | | | | | | | | | | | | | |
| Ratio of Net Expenses to | | | | | | | | | | | | | | | | |
| Average Net Assets | | | 1.52 | %(3) | | | 2.35 | % | | | 2.22 | % | | | 1.40 | % |
| Ratio of Net Expenses to Average Net Assets | | | | | | | | | | | | | | | | |
| (before interest and dividend expense) | | | 1.40 | %(3) | | | 1.40 | % | | | 1.40 | % | | | 1.40 | % |
| Ratio of Total Expenses to Average Net Assets | | | | | | | | | | | | | | | | |
| (before waiver and reimbursement of expenses) | | | 2.03 | %(3) | | | 2.79 | % | | | 2.64 | % | | | — | %(2) |
| Ratio of Net Investment Loss to | | | | | | | | | | | | | | | | |
| Average Net Assets | | | (0.98 | )%(3) | | | (1.84 | )% | | | (1.69 | )% | | | — | %(2) |
| Ratio of Net Investment Loss to | | | | | | | | | | | | | | | | |
| Average Net Assets (before waivers | | | | | | | | | | | | | | | | |
| and reimbursements of expenses) | | | (1.50 | )%(3) | | | (2.28 | )% | | | (2.11 | )% | | | — | %(2) |
| Portfolio turnover rate | | | 3 | %(4) | | | 8 | % | | | 15 | % | | | 0 | % |
(1) | The Class commenced operations on December 30, 2016. |
(2) | Refer to Note 2 for further description of non-recurring charges related to the issuance of the share class. |
(3) | Annualized for periods less than one year. |
(4) | Not annualized for periods less than one year. |
See accompanying notes to financial statements.
Needham Small Cap Growth Fund
Financial Highlights
| | | Retail Class |
| | | Six Months | | | | | | | | | | | | | | | | |
| | | Ended | | | | | | | | | | | | | | | | |
| (For a Share Outstanding | | June 30, 2019 | | | Year Ended December 31, |
| Throughout each Period/Year) | | (Unaudited) | | | 2018 | | | 2017 | | | 2016 | | | 2015 | | | 2014 | |
| Net Asset Value, | | | | | | | | | | | | | | | | | | |
| Beginning of Period/Year | | $ | 12.40 | | | $ | 15.67 | | | $ | 15.25 | | | $ | 12.44 | | | $ | 14.01 | | | $ | 15.63 | |
| Investment Operations | | | | | | | | | | | | | | | | | | | | | | | | |
| Net Investment Loss | | | (0.08 | ) | | | (0.19 | ) | | | (0.18 | ) | | | (0.20 | ) | | | (0.24 | ) | | | (0.24 | ) |
| Net Realized and Unrealized | | | | | | | | | | | | | | | | | | | | | | | | |
| Gain (Loss) on Investments | | | 3.68 | | | | (0.32 | ) | | | 1.99 | | | | 4.03 | | | | (1.02 | ) | | | 0.32 | |
| Total from | | | | | | | | | | | | | | | | | | | | | | | | |
| Investment Operations | | | 3.60 | | | | (0.51 | ) | | | 1.81 | | | | 3.83 | | | | (1.26 | ) | | | 0.08 | |
| | | | | | | | | | | | | | | | | | | | | | | | | |
| Less Distributions | | | | | | | | | | | | | | | | | | | | | | | | |
| Net Realized Gains | | | — | | | | (2.76 | ) | | | (1.40 | ) | | | (1.02 | ) | | | (0.31 | ) | | | (1.70 | ) |
| Total Distributions | | | — | | | | (2.76 | ) | | | (1.40 | ) | | | (1.02 | ) | | | (0.31 | ) | | | (1.70 | ) |
| | | | | | | | | | | | | | | | | | | | | | | | | |
| Capital Contributions | | | | | | | | | | | | | | | | | | | | | | | | |
| Redemption Fees | | | — | | | | — | (1) | | | 0.01 | | | | — | (1) | | | — | (1) | | | — | (1) |
| Total Capital Contributions | | | — | | | | — | (1) | | | 0.01 | | | | — | (1) | | | — | (1) | | | — | (1) |
| Net Asset Value, | | | | | | | | | | | | | | | | | | | | | | | | |
| End of Period/Year | | $ | 16.00 | | | $ | 12.40 | | | $ | 15.67 | | | $ | 15.25 | | | $ | 12.44 | | | $ | 14.01 | |
| | | | | | | | | | | | | | | | | | | | | | | | | |
| Total Return | | | 29.03 | %(3) | | | (5.07 | )% | | | 11.81 | % | | | 31.26 | % | | | (8.96 | )% | | | 0.80 | % |
| Net Assets, | | | | | | | | | | | | | | | | | | | | | | | | |
| End of Period/Year (000’s) | | $ | 17,852 | | | $ | 12,487 | | | $ | 19,317 | | | $ | 35,518 | | | $ | 23,473 | | | $ | 32,116 | |
| Ratios/Supplemental Data | | | | | | | | | | | | | | | | | | | | | | | | |
| Ratio of Net Expenses to | | | | | | | | | | | | | | | | | | | | | | | | |
| Average Net Assets | | | 1.90 | %(2) | | | 1.95 | % | | | 1.95 | % | | | 2.09 | % | | | 2.05 | % | | | 2.01 | % |
| Ratio of Net Expenses to | | | | | | | | | | | | | | | | | | | | | | | | |
| Average Net Assets (before | | | | | | | | | | | | | | | | | | | | | | | | |
| interest and dividend expense) | | | 1.90 | %(2)(4) | | | 1.95 | % | | | 1.95 | % | | | 1.95 | % | | | 1.95 | % | | | 1.95 | % |
| Ratio of Total Expenses to | | | | | | | | | | | | | | | | | | | | | | | | |
| Average Net Assets (before waiver | | | | | | | | | | | | | | | | | | | | | | | | |
| and reimbursement of expenses) | | | 2.08 | %(2) | | | 2.19 | % | | | 2.15 | % | | | 2.30 | % | | | 2.25 | % | | | 2.11 | % |
| Ratio of Net Investment | | | | | | | | | | | | | | | | | | | | | | | | |
| Loss to Average Net Assets | | | (1.12 | )%(2) | | | (1.20 | )% | | | (1.14 | )% | | | (1.83 | )% | | | (1.61 | )% | | | (1.49 | )% |
| Ratio of Net Investment Loss to | | | | | | | | | | | | | | | | | | | | | | | | |
| Average Net Assets (before waivers | | | | | | | | | | | | | | | | | | | | | | | | |
| and reimbursements of expenses) | | | (1.30 | )%(2) | | | (1.44 | )% | | | (1.34 | )% | | | (2.04 | )% | | | (1.81 | )% | | | (1.59 | )% |
| Portfolio turnover rate | | | 77 | %(3) | | | 103 | % | | | 80 | % | | | 99 | % | | | 64 | % | | | 69 | % |
(1) | Value is less than $0.005 per share. |
(2) | Annualized for periods less than one year. |
(3) | Not annualized for periods less than one year. |
(4) | Effective April 1, 2019, the Adviser has contractually agreed to waive its fee and, if necessary, reimburse the Fund until April 30, 2020 to the extent Total Annual Fund Operating Expenses exceed 1.85% of the average daily net assets of the Retail Class shares of the Fund. |
See accompanying notes to financial statements.
Needham Small Cap Growth Fund
Financial Highlights
| | | Institutional Class |
| | | | | | | | | | | | Period from | |
| | | | | | | | | | | | December 30, | |
| | | Six Months | | | | | | | | | 2016 | |
| | | Ended | | | Year Ended | | | Year Ended | | | through | |
| (For a Share Outstanding | | June 30, 2019 | | | December 31, | | | December 31, | | | December 31, | |
| Throughout each Period/Year) | | (Unaudited) | | | 2018 | | | 2017 | | | 2016(1) | |
| Net Asset Value, Beginning of Period/Year | | $ | 12.57 | | | $ | 15.76 | | | $ | 15.25 | | | $ | 15.25 | |
| Investment Operations | | | | | | | | | | | | | | | | |
| Net Investment Loss | | | (0.04 | ) | | | (0.10 | ) | | | (0.07 | ) | | | — | |
| Net Realized and Unrealized | | | | | | | | | | | | | | | | |
| Gain (Loss) on Investments | | | 3.73 | | | | (0.33 | ) | | | 1.98 | | | | — | |
| Total from Investment Operations | | | 3.69 | | | | (0.43 | ) | | | 1.91 | | | | — | |
| | | | | | | | | | | | | | | | | |
| Less Distributions | | | | | | | | | | | | | | | | |
| Net Realized Gains | | | — | | | | (2.76 | ) | | | (1.40 | ) | | | — | |
| Total Distributions | | | — | | | | (2.76 | ) | | | (1.40 | ) | | | — | |
| Net Asset Value, End of Period/Year | | $ | 16.26 | | | $ | 12.57 | | | $ | 15.76 | | | $ | 15.25 | |
| | | | | | | | | | | | | | | | | |
| Total Return | | | 29.36 | %(4) | | | (4.32 | )% | | | 12.41 | % | | | 0.00 | % |
| Net Assets, End of Period/Year (000’s) | | $ | 19,553 | | | $ | 12,168 | | | $ | 10,325 | | | $ | 140 | |
| Ratios/Supplemental Data | | | | | | | | | | | | | | | | |
| Ratio of Net Expenses to | | | | | | | | | | | | | | | | |
| Average Net Assets | | | 1.28 | %(3) | | | 1.40 | % | | | 1.40 | % | | | 1.40 | % |
| Ratio of Net Expenses to Average Net Assets | | | | | | | | | | | | | | | | |
| (before interest and dividend expense) | | | 1.28 | %(3)(5) | | | 1.40 | % | | | 1.40 | % | | | 1.40 | % |
| Ratio of Total Expenses to Average Net Assets | | | | | | | | | | | | | | | | |
| (before waiver and reimbursement of expenses) | | | 1.80 | %(3) | | | 1.95 | % | | | 2.08 | % | | | — | %(2) |
| Ratio of Net Investment Loss | | | | | | | | | | | | | | | | |
| to Average Net Assets | | | (0.50 | )%(3) | | | (0.65 | )% | | | (0.41 | )% | | | — | %(2) |
| Ratio of Net Investment Loss to | | | | | | | | | | | | | | | | |
| Average Net Assets (before waivers | | | | | | | | | | | | | | | | |
| and reimbursements of expenses) | | | (1.02 | )%(3) | | | (1.21 | )% | | | (1.09 | )% | | | — | %(2) |
| Portfolio turnover rate | | | 77 | %(4) | | | 103 | % | | | 80 | % | | | 0 | % |
(1) | The Class commenced operations on December 30, 2016. |
(2) | Refer to Note 2 for further description of non-recurring charges related to the issuance of the share class. |
(3) | Annualized for periods less than one year. |
(4) | Not annualized for periods less than one year. |
(5) | Effective April 1, 2019, the Adviser has contractually agreed to waive its fee and, if necessary, reimburse the Fund until April 30, 2020 to the extent Total Annual Fund Operating Expenses exceed 1.18% of the average daily net assets of the Institutional Class shares of the Fund. |
See accompanying notes to financial statements.
Notes to Financial Statements (Unaudited)
June 30, 2019
1. Organization
Needham Growth Fund (“NGF”), Needham Aggressive Growth Fund (“NAGF”) and Needham Small Cap Growth Fund (“NSCGF”) (each, a “Portfolio” and collectively, the “Portfolios”), are portfolios of The Needham Funds, Inc. (the “Company”), which is registered under the Investment Company Act of 1940, as amended (the “1940 Act”), as an open-end management investment company. The Company was organized as a Maryland corporation on October 12, 1995. NGF, NAGF, and NSCGF each currently offer two classes, the Retail Class and the Institutional Class.
2. Class Specific Expenses
Class level expenses are allocated daily to each class of shares based upon the ratio of net assets represented by each class as a percentage of the net assets of the Portfolio. Expenses deemed directly attributable to a class of shares are recorded by the specific class. Most Portfolio expenses are allocated by class based on relative net assets. Distribution Fees incurred in connection with the Company’s Amended and Restated Plan of Distribution Pursuant to Rule 12b-1 are expensed at 0.25% of average daily net assets of the Retail Class shares, and the specific amounts are detailed in Note 5.
Certain of the Ratios and Supplemental Data presented in the Financial Highlights of the Institutional Class as of December 31, 2016 include non-recurring charges related to the issuance of the class and are not meaningful.
3. Significant Accounting Policies
The following is a summary of significant accounting policies followed by the Company in the preparation of its financial statements. These policies are in conformity with accounting principles generally accepted in the United States of America (“GAAP”).
Security Valuation: Portfolio securities for which market quotations are readily available are stated at the last sale price reported by the principal exchange for the security as of the exchange’s close of business. Securities for which no sale has taken place during the day and securities which are not listed on an exchange are valued at the mean of the highest closing bid and lowest asked prices. Exchange traded options are valued at the last reported sale price on any exchange on which the option is principally traded. If no sales are reported on a particular day, the options will be valued at the mean between the highest closing bid and lowest asked prices across the exchanges where the option is traded. Non-exchange traded options will also be valued at the mean between the last bid and asked quotations. For options where market quotations are not readily available, value will be determined in accordance with the fair value procedures described below. All other securities and assets for which (a) market quotations are not readily available, such as in the case of a market or technical disruption that prevents the normal trading of a security held by a Portfolio, (b) market quotations are believed to be unrepresentative of fair market value, such as in the case of a thinly traded security, or (c) valuation is normally made at the last sale price on a foreign exchange and a significant event occurs after the close of that exchange but before
Notes to Financial Statements (Unaudited) (Continued)
June 30, 2019
the New York Stock Exchange closes, are valued at their fair value as determined in good faith by the Board of Directors (the “Board”) in accordance with Fair Value Procedures established by the Board. The Company’s Fair Value Procedures are implemented and monitored by a Fair Value Committee (the “Committee”) designated by the Board. When a security is valued in accordance with the Fair Value Procedures, the Committee determines a value after taking into consideration any relevant information that is reasonably available to the Committee. Some of the more common reasons that may necessitate that a security be valued pursuant to these Fair Value Procedures include, but are not limited to: the security’s trading has been halted or suspended; the security has been delisted from a national exchange; the security’s primary trading market is temporarily closed at a time when under normal conditions it would be open; or the security’s primary pricing source is not able or willing to provide a price. The securities of each Portfolio may also be valued on the basis of valuations provided by a pricing service approved by, or on behalf of, the Board.
Portfolio securities listed or traded on securities exchanges, including American Depositary Receipts (“ADRs”), are valued at the closing price on the exchange or system where the security is principally traded or at the NASDAQ Official Closing Price. If there have been no sales for that day on the exchange or system, a security is valued at the mean of the highest closing bid and lowest asked prices on the exchange or system where the security is principally traded.
The Portfolios did not value any securities in accordance with the Fair Value Procedures as of June 30, 2019.
Investment Transactions: Changes in holdings of portfolio securities for the Portfolios shall be reflected no later than in the first calculation on the first business day following the trade date for purposes of calculating each Portfolio’s daily net asset value per share. However, for financial reporting purposes, portfolio security transactions are reported on the trade date of the last business day of the reporting period. The cost (proceeds) of investments sold (bought to cover) is determined on a specific identification basis for the purpose of determining gains or losses on sales and buys to cover short positions. Dividend income, distributions to shareholders and dividend expense from securities sold short are recorded on the ex-dividend date. Interest income and interest expense from securities sold short is recorded on an accrual basis.
Foreign Currency: Foreign currency amounts are translated into U.S. dollars as follows: (i) assets and liabilities at the rate of exchange at the end of the respective period; and (ii) purchases and sales of securities and income and expenses at the rate of exchange prevailing on the dates of such transactions. The portion of realized/unrealized gains arising from changes in the exchange rates are included with the net realized/unrealized gain (loss) from affiliated and unaffiliated securities, securities sold short and foreign currency translations. Principal risks associated with such transactions include the movement in value of the foreign currency relative to the U.S. dollar and the ability of the counterparty to perform.
Notes to Financial Statements (Unaudited) (Continued)
June 30, 2019
The Portfolios may also invest in forward currency contracts. Fluctuations in the value of such forward currency transactions are recorded daily as unrealized gain or loss; realized gain or loss includes net gain or loss on transactions that have terminated by settlement. These instruments involve securities and currency market risk, credit risk, or both kinds of risks, in excess of the amount recognized in the statements of assets and liabilities. Risks also arise from the possible inability of counterparties to meet the terms of their contracts. The Portfolios did not enter into forward currency contracts during the period ended June 30, 2019.
Allocation of Expenses: Expenses directly attributable to a Portfolio are charged directly to that Portfolio, while expenses which are attributable to more than one Portfolio are allocated among the respective Portfolios based upon relative net assets or some other reasonable method.
Use of Estimates: The preparation of financial statements in conformity with GAAP requires management to make estimates and assumptions that affect the reported amounts of assets and liabilities and disclosure of contingent assets and liabilities at the date of the financial statements and the reported amounts of increases and decreases in net assets from operations during the reporting period. Actual results could differ from those estimates.
Distributions to Shareholders: Dividends from net investment income, if any, are declared and paid annually for the Portfolios. Distributable net realized gains, if any, are declared and distributed at least annually.
Federal Income Taxes: It is the policy of each Portfolio to continue to qualify as a regulated investment company, as defined in the Internal Revenue Code, by complying with the provisions available to certain investment companies and to make distributions of net investment income and net realized capital gains sufficient to relieve it from all, or substantially all, federal income taxes. Accordingly, no provision for income taxes has been made in the Portfolios’ financial statements.
As of December 31, 2018, the Portfolios did not have any tax positions that did not meet the “more-likely-than-not” threshold of being sustained by the applicable tax authority. Open tax years are those that are open for exam by Federal and state taxing authorities. As of December 31, 2018, open Federal tax years include the tax years ended December 31, 2015 through December 31, 2018, and open New York tax years include the tax years ended December 31, 2015 through December 31, 2018. The Portfolios have no tax examinations in progress.
Fair Value Measurements: Valuation inputs used to determine the value of the Portfolios’ investments are summarized in the three broad levels listed below:
| | Level 1 — | Unadjusted quoted prices in active markets for identical assets and liabilities that the Portfolios have the ability to access. |
Notes to Financial Statements (Unaudited) (Continued)
June 30, 2019
| | Level 2 — | Observable inputs other than quoted prices included in Level 1 that are observable for the asset or liability, either directly or indirectly. These inputs may include quoted prices for the identical instrument in an inactive market, prices for similar instruments, interest rates, prepayment speeds, credit risk, yield curves, default rates and similar data. |
| | | |
| | Level 3 — | Unobservable inputs for the asset or liability, to the extent relevant observable inputs are not available, representing the Portfolios’ own assumptions about the assumptions a market participant would use in valuing the asset or liability, and would be based on the best information available. |
The inputs or methodology used to value securities are not necessarily an indication of the risk associated with investing in those securities.
Portfolio securities listed or traded on securities exchanges, including ADRs, are valued at the closing price on the exchange or system where the security is principally traded or at the NASDAQ Official Closing Price. If there have been no sales for that day on the exchange or system, a security is valued at the mean of the highest closing bid and lowest asked prices on the exchange or system where the security is principally traded. These valuations are typically categorized as Level 1 in the fair value hierarchy.
In accordance with procedures adopted by the Board, fair value pricing may be used if events materially affecting the value of foreign securities occur between the times the exchange on which they are traded closes and the time the Portfolios’ net asset values are calculated. These valuations are categorized as Level 2 in the fair value hierarchy.
The following is a summary categorization, as of June 30, 2019, of each Portfolio’s investments based on the level of inputs utilized in determining the value of such investments:
| | | LEVEL 1 – Quoted Prices(1) |
| | | NGF | | | NAGF | | | NSCGF | |
| Assets | | | | | | | | | |
Common Stocks(2) | | $ | 91,421,497 | | | $ | 44,232,482 | | | $ | 31,734,148 | |
| Closed-End Funds | | | — | | | | — | | | | 596,075 | |
| Short-Term Investments | | | 4,843,383 | | | | 1,555,026 | | | | 6,652,941 | |
| Liabilities | | | | | | | | | | | | |
Securities Sold Short(2) | | | (1,664,370 | ) | | | (740,570 | ) | | | — | |
| Total | | $ | 94,600,510 | | | $ | 45,046,938 | | | $ | 38,983,164 | |
(1) | As of June 30, 2019, the Portfolios did not hold Level 2 or Level 3 investments. |
(2) | Please refer to the Schedule of Investments and Schedule of Securities Sold Short to view segregation by industry. |
4. Investment Advisory and Administrative Services
The Company has engaged Needham Investment Management L.L.C. (the “Adviser”) to manage its investments pursuant to an Investment Advisory Agreement. The Company pays the Adviser an investment advisory fee at the annual rate of 1.25% of the average daily net assets of each Portfolio.
Notes to Financial Statements (Unaudited) (Continued)
June 30, 2019
The Adviser has entered into an agreement with the Company (the “Expense Limitation Agreement”) whereby the Adviser has contractually agreed to waive its investment advisory fee for, and to reimburse expenses of, the Institutional Class and Retail Class shares of each Portfolio in an amount that limits annual operating expenses to not more than 1.40% and 1.95% (or, for NSCGF only, 1.18% and 1.85%) of the average daily net assets of the Portfolio’s Institutional Class and Retail Class, respectively (excluding taxes, interest, brokerage, dividends on short positions, acquired fund fees and expenses and extraordinary items, but including the investment advisory fee stated in the Investment Advisory Agreement). The Expense Limitation Agreement is effective for the period from April 1, 2019 through April 30, 2020. The Expense Limitation Agreement shall continue in effect from year to year thereafter only upon mutual agreement of the Company and the Adviser. Similar agreements were in effect for certain prior periods.
Any reimbursements or fee waivers made by the Adviser in respect of a Portfolio are subject to recoupment by the Adviser, to the extent that the Portfolio is able to make the repayment within the expense limitation established in the Expense Limitation Agreement. Under the Expense Limitation Agreement, the Adviser has a right to receive from each Portfolio class reimbursement for fee waivers and/or expense reimbursements made pursuant to the Agreement for a period of up to 36 months from the time of any waiver or reimbursement. The table below contains the amounts of fee waivers and expense reimbursements subject to recapture by the Adviser through December 31 of the year indicated:
| | | 2022 | | | 2021 | | | 2020 | | | 2019 | | | Total | |
| NGF (Retail Class) | | $ | 2,869 | | | $ | — | | | $ | — | | | $ | — | | | $ | 2,869 | |
| NGF (Institutional Class) | | | 47,615 | | | | 91,844 | | | | 84,071 | | | | — | | | | 223,530 | |
| NAGF (Retail Class) | | | 25,661 | | | | 23,838 | | | | 18,700 | | | | 2,038 | | | | 70,238 | |
| NAGF (Institutional Class) | | | 40,873 | | | | 83,507 | | | | 65,936 | | | | — | | | | 190,317 | |
| NSCGF (Retail Class) | | | 14,394 | | | | 45,317 | | | | 50,855 | | | | 24,337 | | | | 134,903 | |
| NSCGF (Institutional Class) | | | 43,642 | | | | 69,833 | | | | 48,693 | | | | — | | | | 162,167 | |
The Company and Fund Services (the “Administrator”) are parties to a Fund Administration Servicing Agreement. The Administrator provides administrative and fund accounting services pursuant to this agreement and, in consideration of these services, receives a fee computed daily and paid monthly at an annual rate based on a percentage of the value of each Portfolio’s assets. The Administrator is also compensated for any out of pocket expenses that are reasonably incurred in carrying out its duties under the Administration Agreement. The Administrator also provides transfer agent services pursuant to a Transfer Agent Servicing Agreement for additional fees.
Certain officers of the Company are also officers of the Adviser and/or Needham & Company, LLC (the “Distributor”). Such officers receive no fees from the Company for serving as officers of the Company. Each of the two Directors who is not an “interested person” (as defined in the 1940 Act) of the Company (each, an “Independent Director”) receives a quarterly retainer of $3,000 and a per-meeting fee of $500. Each Independent
Notes to Financial Statements (Unaudited) (Continued)
June 30, 2019
Director is also a member of the Audit Committee of the Company’s Board of Directors and receives a fee of $500 per meeting attended. The Adviser provides an employee to serve as Chief Compliance Officer for the Company and to provide certain related services. An affiliate of the Adviser, Needham & Company, LLC, pays the Chief Compliance Officer’s compensation and the Company reimburses this affiliate for the Company’s allocated portion of the expense.
5. Distribution Plan
The Company has adopted an Amended and Restated Plan of Distribution pursuant to Rule 12b-1 under the 1940 Act. Under the Plan, each Portfolio may pay compensation to the Distributor or any other distributor or financial institution with which the Company has an agreement with respect to the Retail Class of each Portfolio, with the amount of such compensation not to exceed an annual rate of 0.25% of each Portfolio’s daily average net assets.
During the period ended June 30, 2019, NGF, NAGF and NSCGF incurred and paid brokerage commissions to the Distributor in the amount of $12,958, $4,343, and $41,368, respectively.
6. Temporary Borrowings
Each Portfolio may borrow from banks up to 25% of its total assets and may pledge its assets in connection with these borrowings, provided that no additional investments shall be made while borrowings exceed 5% of total assets.
The Portfolios did not engage in any temporary borrowings during the period ended June 30, 2019.
7. Short Sale Transactions
During the period ended June 30, 2019, NGF and NAGF sold securities short. Upon selling a security short, the Portfolios record an asset for the settlement amount as “Deposit with Broker for Securities Sold Short” and a corresponding liability, which is marked-to-market to reflect current value. The broker for the Portfolios’ short sale transactions requires maintenance by each Portfolio of a minimum amount of collateral at all times, regardless of whether any short sales are outstanding. To the extent necessary to meet the broker’s collateral requirements for open short positions, additional securities will be segregated above the minimum to cover the short positions. At June 30, 2019, the market value of securities separately segregated to cover short positions was $2,724,440, $3,736,510, and $1,235,925 for NGF, NAGF and NSCGF, respectively.
Additionally, the Portfolios had receivables for Deposit with Broker for Securities Sold Short of $1,898,635, $788,742 and $0 pledged as collateral with a broker in connection with any open short positions for NGF, NAGF, and NSCGF, respectively at June 30, 2019. Securities sold short at June 30, 2019 and their related market values and proceeds are set forth in the preceding Schedule of Securities Sold Short for NGF and NAGF.
Notes to Financial Statements (Unaudited) (Continued)
June 30, 2019
8. Investment Transactions
The following summarizes the aggregate amount of the cost of purchases and proceeds from sales of investment securities and securities sold short, excluding short-term securities, during the period ended June 30, 2019:
| | | Purchases | | | Sales | |
| NGF | | | | | | |
| Long Transactions | | $ | 3,293,132 | | | $ | 17,829,054 | |
| Short Sale Transactions | | | — | | | | 6,043,414 | |
| NAGF | | | | | | | | |
| Long Transactions | | | 1,389,768 | | | | 9,096,790 | |
| Short Sale Transactions | | | — | | | | 3,620,789 | |
| NSCGF | | | | | | | | |
| Long Transactions | | | 22,560,222 | | | | 22,043,940 | |
| Short Sale Transactions | | | — | | | | — | |
There were no purchases or sales of U.S. government securities during the period ended June 30, 2019.
9. Financial Instruments With Off-Balance Sheet Risk
In the normal course of their business, the Portfolios may engage in transactions with off-balance sheet risk, including securities sold short, written options, futures, and forward currency contracts. Transactions in certain financial instruments represent future commitments to purchase or sell other financial instruments at specific terms at specified future dates. Each of these financial instruments contains varying degrees of off-balance sheet risk whereby changes in the market values of the securities underlying the financial instruments may be in excess of the amounts recognized in the financial statements.
Securities sold short represent obligations of the Portfolios to make future delivery of specific securities and, correspondingly, create an obligation to purchase the securities at market prices prevailing at a later delivery date (or to deliver the securities if already owned by the Portfolios). As a result, short sales create the risk that the Portfolios’ ultimate obligation to satisfy the delivery requirements may exceed the amount of the proceeds initially received on the liability recorded in the financial statements.
10. Indemnification
Under the Company’s organizational documents, its Directors and Officers are indemnified against certain liabilities arising out of the performance of their duties to the Company. In addition, in the ordinary course of business, the Company enters into contracts that contain a variety of indemnifications. The Company’s maximum exposure under these arrangements is unknown. However, the Company has not had prior claims or losses pursuant to these contracts and expects the risk of loss to be remote.
Notes to Financial Statements (Unaudited) (Continued)
June 30, 2019
11. Transactions with Affiliates
NAGF owned 5% or more of the voting securities of the following company during the period ended June 30, 2019. As a result, this company is deemed to be an affiliate of NAGF (and the other Portfolios) as defined by the 1940 Act. Transactions during the period in this affiliated company were as follows:
| | | | | Net Change | Net | | | Share |
| | Value at | | | in Unrealized | Realized | | Value at | Balance |
| Security | Dec. 31, | Value of | Value of | Appreciation | Gains | Dividend | June 30, | June 30, |
Name | 2018 | Purchases | Sales | (Depreciation) | (Losses) | Income | 2019 | 2019 |
| GSE | | | | | | | | |
| Systems, | | | | | | | | |
| Inc. | $2,352,000 | $— | $— | $268,800 | $— | $— | $2,620,800 | 1,120,000 |
12. Federal Income Taxes
No provision for federal income taxes is required since the Company intends to continue to qualify as a regulated investment company under Subchapter M of the Internal Revenue Code and distribute substantially all of its taxable income and capital gains to shareholders. Because income tax regulations differ from GAAP, the timing and character of income and capital gain distributions determined in accordance with tax regulations can differ from income and capital gains recognized for financial reporting purposes. Accordingly, the character of distributions and the composition of net assets for tax purposes can differ from those reflected in the financial statements. These book/tax differences may be temporary or permanent in nature. Temporary differences are generally due to differing book and tax treatment for the timing of the recognition of gains and losses on securities, including post-October losses (as described below). Permanent differences are generally due to differing treatment of net investment losses. To the extent these differences are permanent, they are charged or credited to paid-in capital or distributable earnings, accumulated net realized gain (loss), or accumulated net investment income (loss), as appropriate, in the period in which the differences arise. These reclassifications have no effect on net assets or net asset value per share of each Portfolio.
As of December 31, 2018, the cost, gross unrealized appreciation, gross unrealized depreciation, and the net unrealized appreciation (depreciation) on securities, including proceeds from securities sold short for federal income tax purposes, were as follows:
| | | | | | | | | | | | Net | |
| | | | | | Gross | | | Gross | | | Unrealized | |
| | | | | | Unrealized | | | Unrealized | | | Appreciation | |
| | | Cost | | | Appreciation | | | Depreciation | | | (Depreciation) | |
| NGF | | $ | 41,430,094 | | | $ | 44,114,649 | | | $ | (7,872,601 | ) | | $ | 36,242,048 | |
| NAGF | | | 22,176,537 | | | | 20,551,457 | | | | (4,314,618 | ) | | | 16,236,839 | |
| NSCGF | | | 27,552,841 | | | | 1,900,346 | | | | (4,266,260 | ) | | | (2,365,914 | ) |
The difference between the tax cost of investments and the cost of investments for GAAP purposes is primarily due to the tax treatment for wash sale losses.
Notes to Financial Statements (Unaudited) (Continued)
June 30, 2019
As of December 31, 2018, the components of distributable earnings (loss) on a tax basis were as follows:
| | | NGF | | | NAGF | | | NSCGF | |
| Undistributed ordinary income | | $ | — | | | $ | — | | | $ | — | |
| Undistributed long-term capital gains | | | 7,994,747 | | | | 1,520,298 | | | | — | |
| Unrealized appreciation (depreciation) | | | 36,242,048 | | | | 16,236,839 | | | | (2,365,914 | ) |
| Other accumulated gains (loss) | | | (3,147 | ) | | | — | | | | (124,284 | ) |
| Total accumulated earnings (loss) | | $ | 44,233,648 | | | $ | 17,757,137 | | | $ | (2,490,198 | ) |
The tax character of distributions paid during the year ended December 31, 2018 was as follows:
| | | NGF | | | NAGF | | | NSCGF | |
| Ordinary income | | $ | — | | | $ | — | | | $ | 2,522,946 | |
| Net long-term capital gains | | | 13,467,264 | | | | 6,200,868 | | | | 2,691,253 | |
| Return of capital | | | — | | | | — | | | | — | |
| Total distributions paid | | $ | 13,467,264 | | | $ | 6,200,868 | | | $ | 5,214,199 | |
In 2018 a portion of such dividends was distributed in connection with NEEGX, NEAGX, and NESGX redemptions.
The tax character of distributions paid during the year ended December 31, 2017 was as follows:
| | | NGF | | | NAGF | | | NSCGF | |
| Ordinary income | | $ | 66,959 | | | $ | — | | | $ | 2,019,133 | |
| Net long-term capital gains | | | 10,413,410 | | | | 3,108,250 | | | | 345,430 | |
| Return of capital | | | — | | | | — | | | | — | |
| Total distributions paid | | $ | 10,480,369 | | | $ | 3,108,250 | | | $ | 2,364,563 | |
Under current tax law, capital and currency losses realized after October 31 of a Portfolio’s fiscal year may be deferred and treated as occurring on the first business day of the following fiscal year for tax purposes. The following Portfolios had deferred post-October capital and currency losses, which will be treated as arising on the first business day of the year ended of December 31, 2018.
| NGF | | $ | 3,147 | |
| NAGF | | | — | |
| NSCGF | | | 124,284 | |
As of December 31, 2018, none of the Portfolios had accumulated capital loss carryovers.
13. New Accounting Pronouncements
In August 2018, FASB issued Accounting Standards Update (“ASU”) 2018-13, Fair Value Measurement (Topic 820): Disclosure Framework — Changes to the Disclosure Requirements for Fair Value Measurement (“ASU 2018-13”). The primary focus of ASU 2018-13 is to improve the effectiveness of the disclosure requirements for fair value measurements. The changes affect all companies that are required to include fair value
Notes to Financial Statements (Unaudited) (Continued)
June 30, 2019
measurement disclosures. In general, the amendments in ASU 2018-13 are effective for all entities for fiscal years and interim periods within those fiscal years, beginning after December 15, 2019. An entity is permitted to early adopt the removed or modified disclosures upon the issuance of ASU 2018-13 and may delay adoption of the additional disclosures, which are required for public companies only, until their effective date. Management has evaluated ASU 2018-13 and has early adopted the relevant provisions of the disclosure framework.
14. Subsequent Events
Management has evaluated subsequent events through the date of this filing. This evaluation did not result in any subsequent events that necessitated recognition or disclosures.
Supplementary Information (Unaudited)
June 30, 2019
Disclosure of Portfolio Holdings
The Company files a Form N-Q with the Securities and Exchange Commission (the “SEC”) no more than sixty days after the Company’s first and third fiscal quarters. For the Company, this would be for the fiscal quarters ending March 31 and September 30. Form N-Q includes a complete schedule of the Company’s portfolio holdings as of the end of those fiscal quarters. The Company’s N-Q filings are available without charge, upon request, by calling 800-625-7071 or on the SEC’s website at http://www.sec.gov.
Voting Proxies on Company Portfolio Securities
A description of the policies and procedures that the Company uses to determine how to vote proxies relating to portfolio securities and information regarding how the Company voted proxies relating to portfolio securities during the most recent 12-month period ended June 30 are available without charge, upon request, by calling 800-625-7071 or on the SEC’s website at http://www.sec.gov.
Household Delivery of Shareholder Documents
To reduce expenses, the Company may mail only one copy of the Portfolios’ prospectuses, proxy statements, information statements, and each annual and semi-annual report to those addresses shared by two or more accounts. If you wish to receive individual copies of these documents, please call the Portfolios at 1-800-625-7071 or contact your financial institution. You will begin receiving individual copies thirty days after receiving your request.
Index Disclaimer
The Needham Growth Fund, the Needham Aggressive Growth Fund and the Needham Small Cap Growth Fund (collectively, the “Funds”) have been developed solely by Needham Investment Management L.L.C. (the “Adviser”). The Funds are not in any way connected to or sponsored, endorsed, sold or promoted by the London Stock Exchange Group plc and its group undertakings (collectively, the “LSE Group”). FTSE Russell is a trading name of certain of the LSE Group companies.
All rights in the Russell 2000 Index and the Russell 3000 Index (together, the “Indexes”) vest in the relevant LSE Group company which owns the Index. “Russell®” is a trade mark of the relevant LSE Group company and is used by any other LSE Group company under license.
The Indexes are calculated by or on behalf of FTSE International Limited or its affiliate, agent or partner. The LSE Group does not accept any liability whatsoever to any person arising out of (a) the use of, reliance on or any error in the Indexes or (b) investment in or operation of the Funds. The LSE Group makes no claim, prediction, warranty or representation either as to the results to be obtained from the Funds or the suitability of the Indexes for the purpose to which it is being put by the Adviser.
Supplementary Information (Unaudited) (Continued)
June 30, 2019
The source of the data for each of the Indexes is the LSE Group. © LSE Group 2019. All rights in the Indexes or data vest in the relevant LSE Group company which owns the Index or the data. Neither LSE Group nor its licensors accept any liability for any errors or omissions in the Indexes or data and no party may rely on any Indexes or data contained in this communication. No further distribution of data from the LSE Group is permitted without the relevant LSE Group company’s express written consent. The LSE Group does not promote, sponsor or endorse the content of this communication.
250 Park Avenue, 10th Floor
New York, New York 10177
1-800-625-7071
Investment Adviser:
Needham Investment Management L.L.C.
250 Park Avenue, 10th Floor
New York, New York 10177
President
George A. Needham
Executive Vice Presidents and Portfolio Managers
John Barr
Needham Growth Fund
Needham Aggressive Growth Fund
Chris Retzler
Needham Growth Fund
Needham Small Cap Growth Fund
Directors
George A. Needham
John W. Larson
F. Randall Smith
Distributor:
Needham & Company, LLC
250 Park Avenue, 10th Floor
New York, New York 10177
212-371-8300
Administrator, Shareholder Servicing Agent, and Transfer Agent:
U.S. Bancorp Fund Services, LLC, doing business as U.S. Bank Global Fund Services
615 East Michigan Street
Milwaukee, WI 53202
Custodian:
U.S. Bank, N.A.
1555 North RiverCenter Drive
Milwaukee, WI 53212
Counsel:
Proskauer Rose LLP
Eleven Times Square
New York, NY 10036-8299
Independent Registered Public Accounting Firm:
KPMG LLP
345 Park Avenue
New York, NY 10154
Item 2. Code of Ethics.
Not applicable for semi-annual reports.
Item 3. Audit Committee Financial Expert.
Not applicable for semi-annual reports.
Item 4. Principal Accountant Fees and Services.
Not applicable for semi-annual reports.
Item 5. Audit Committee of Listed Registrants.
Not applicable to registrants who are not listed issuers (as defined in Rule 10A-3 under the Securities Exchange Act of 1934).
Item 6. Investments.
| (a) | Schedule of Investments is included as part of the report to shareholders filed under Item 1 of this Form. |
Item 7. Disclosure of Proxy Voting Policies and Procedures for Closed-End Management Investment Companies.
Not applicable to open-end investment companies.
Item 8. Portfolio Managers of Closed-End Management Investment Companies.
Not applicable to open-end investment companies.
Item 9. Purchases of Equity Securities by Closed‑End Management Investment Company and Affiliated Purchasers.
Not applicable to open-end investment companies.
Item 10. Submission of Matters to a Vote of Security Holders.
Not Applicable.
Item 11. Controls and Procedures.
(a) | The Registrant’s Chief Executive Officer and Chief Financial Officer have reviewed the Registrant's disclosure controls and procedures (as defined in Rule 30a-3(c) under the Investment Company Act of 1940 (the “Act”)) as of a date within 90 days of the filing of this report, as required by Rule 30a-3(b) under the Act and Rules 13a-15(b) or 15d‑15(b) under the Securities Exchange Act of 1934. Based on their review, such officers have concluded that the disclosure controls and procedures are effective in ensuring that information required to be disclosed in this report is appropriately recorded, processed, summarized and reported and made known to them by others within the Registrant and by the Registrant’s service provider. |
(b) | There were no changes in the Registrant's internal control over financial reporting (as defined in Rule 30a-3(d) under the Act) that occurred during the Registrant’s first fiscal half-year of the period covered by this report that has materially affected, or is reasonably likely to materially affect, the Registrant's internal control over financial reporting. |
Item 12. Disclosure of Securities Lending Activities for Closed-End Management Investment Companies
Not applicable to open-end investment companies.
Item 13. Exhibits.
| (a) | (1) Any code of ethics or amendment thereto, that is the subject of the disclosure required by Item 2, to the extent that the registrant intends to satisfy Item 2 requirements through filing an exhibit. Not applicable for semi-annual reports. |
(2) A separate certification for each principal executive and principal financial officer pursuant to Section 302 of the Sarbanes-Oxley Act of 2002. Filed herewith.
(3) Any written solicitation to purchase securities under Rule 23c‑1 under the Act sent or given during the period covered by the report by or on behalf of the registrant to 10 or more persons. Not applicable to open-end investment companies.
| (b) | Certifications pursuant to Section 906 of the Sarbanes‑Oxley Act of 2002. Furnished herewith. |
SIGNATURES
Pursuant to the requirements of the Securities Exchange Act of 1934 and the Investment Company Act of 1940, the registrant has duly caused this report to be signed on its behalf by the undersigned, thereunto duly authorized.
(Registrant) The Needham Funds, Inc.
By (Signature and Title) /s/George A. Needham
George A. Needham, President (Chief Executive Officer)
Date September 4, 2019
Pursuant to the requirements of the Securities Exchange Act of 1934 and the Investment Company Act of 1940, this report has been signed below by the following persons on behalf of the registrant and in the capacities and on the dates indicated.
By (Signature and Title) /s/George A. Needham
George A. Needham, President (Chief Executive Officer)
Date September 4, 2019
By (Signature and Title) /s/James W. Giangrasso
James W. Giangrasso, Treasurer and Secretary (Chief Financial Officer)
Date September 4, 2019