As filed with the Securities and Exchange Commission on September 2, 2016.
UNITED STATES
SECURITIES AND EXCHANGE COMMISSION
Washington, D.C. 20549
FORM N-CSR
CERTIFIED SHAREHOLDER REPORT OF REGISTERED
MANAGEMENT INVESTMENT COMPANIES
Investment Company Act file number 811-09114
The Needham Funds, Inc.
(Exact name of registrant as specified in charter)
445 Park Avenue, New York, NY 10022-2606
(Address of principal executive offices) (Zip code)
Mr. George A. Needham, 445 Park Avenue, New York, NY 10022-2606
(Name and address of agent for service)
1-800-625-7071
Registrant’s telephone number, including area code
Date of fiscal year end: December 31, 2016
Date of reporting period: June 30, 2016
Item 1. Reports to Stockholders.
445 Park Avenue
New York, New York 10022-2606
1-800-625-7071
www.needhamfunds.com
Semi-Annual Report
June 30, 2016
Contents
| 1 |
| Portfolio Characteristics | |
| 7 |
| 8 |
| 9 |
| 10 |
| Schedule of Investments | |
| 11 |
| 14 |
| 17 |
| Schedule of Securities Sold Short | |
| 13 |
| 16 |
| 18 |
| 19 |
| 20 |
| 21 |
| Financial Highlights | |
| 22 |
| 23 |
| 24 |
| 25 |
| 30 |
This report is authorized for distribution to prospective investors only when preceded or accompanied by a current prospectus. The prospectus contains more complete information, including investment objectives, risks, expenses and charges and should be read carefully before investing or sending any money. To obtain a prospectus, please call 1-800-625-7071.
Portfolios of The Needham Funds, Inc., like all mutual funds:
The Needham Funds, Inc. are distributed by Needham & Company, LLC.
 | 445 Park Avenue
New York, NY 10022
(800) 625-7071
www.needhamfunds.com |
August 2016
Dear Shareholders, Friends of Needham and Prospective Shareholders,
We are pleased to report results for the second quarter and first half of 2016 for the Needham Growth Fund, Needham Aggressive Growth Fund, and Needham Small Cap Growth Fund. Our mission is to create wealth for long-term investors.
Needham Funds’ Second Quarter and Semiannual Review
In the second quarter, the Needham Growth Fund (NEEGX) returned 0.61%, the Needham Aggressive Growth Fund (NEAGX) lost 0.80%, and the Needham Small Cap Growth Fund (NESGX) returned 0.90%. The Russell 2000 Total Return Index returned 3.79%, the S&P 500 Total Return Index returned 2.46%, and the NASDAQ Composite Index declined 0.22%.
For the half-year, the Needham Growth Fund returned 0.88%, the Needham Aggressive Growth Fund returned 1.43%, and the Needham Small Cap Growth Fund outperformed and returned 8.44%. The Russell 2000 Total Return Index returned 2.22%, the S&P 500 Total Return Index returned 3.84%, and the NASDAQ Composite Index declined 2.61%.
First Half 2016: Fears Overcome
Our theme for the first half of 2016 is “Fears Overcome.” 2016 started with an unprecedented sell-off amidst fear of a stock market crash, devaluation in China, and a slowing world economy. Energy companies and their bankers were hurt as West Texas Intermediate oil hit a low of $26.21, down from $37.04 at year end. The oil industry was hurt by a slowing world economy and fears of extra supply coming on-line from Iran.
In late January, Japan announced a surprise interest rate cut, which placed rates at -0.1% for financial firms with deposits at the Bank of Japan. In late January, we learned that 4Q15 GDP growth was just 0.7%. At the low in mid-February, the Russell 2000 was down 16% and the S&P 500 was down 11%. On February 10, Janet Yellen reiterated to Congress the Federal Reserve’s cautious stance in raising interest rates and wouldn’t take negative rates off the table. On February 11, The Guardian called the bottom and wrote, “Global stocks enter bear market after another rout.”(1) This was followed a few days later by Russia, Saudi Arabia, Venezuela and Qatar announcing an oil production cutback, which at the time appeared to have teeth. Oil closed the first quarter at $40 per barrel. The rebound was aided by the weak dollar, which fell 4.5% versus the DXY index, a basket of currencies. All three Needham Funds outperformed during the sell-off and trailed the averages on the rebound.
In the second quarter, the markets continued to overcome fear. In April, we learned that first quarter GDP growth was just 0.5%. The employment report for April showed just 160,000 jobs added. April ended with the markets down seven days in a row, including a big down day to close the month. Apple, Google and Microsoft reported disappointing first quarter earnings, and the Bank of Japan surprised by not easing further. The yen appreciated 5% vs. the dollar on one day. Japan instituted negative interest rates in January. Much more easing is hard to imagine.
Nonetheless, in mid-May, the Federal Reserve minutes read, “It likely would be appropriate to raise rates in June if the economy shows clear signs of a rebound.”(2) The report for May showed a disastrous 32,000 jobs created. Just a few weeks later, Barron’s wrote an article titled, “Watching for a Market Crash.”(3)
| (1) | https://www.theguardian.com/business/live/2016/feb/11/market-turmoil-hong-kong-europe-ftse-banks-yellen-live |
| (2) | http://www.nytimes.com/2016/05/19/business/economy/federal-reserve-interest-rates-meeting-minutes.html?_r=0 |
| (3) | http://www.barrons.com/video/barrons-buzz-watching-for-a-market-crash/781305DB-0706-4D4B-B87C- |
Needless to say, a June interest rate hike seemed off the table.
While the market overcame the previous fears, Brexit was the unanticipated monster. On June 22, the people of the United Kingdom unexpectedly voted to leave the European Union and turmoil filled the markets... for all of two days. The CBOE Market Volatility Index spiked 49%. The S&P 500 fell 5.3%. By July 8, the S&P 500 had regained these losses. The one lasting impact may be that the devalued pound, which fell 10% in those 2 days to $1.315, will be good for companies with more expenses than revenues in the U.K.
To top it off, we had fears of terrorism from attacks in Brussels, Orlando, and Nice, to name a few. Finally, we had the unusual circumstances of two Presidential primary elections more befitting of reality TV shows.
Again, we see no hope for a growth-oriented domestic policy built on an internationally competitive corporate tax regime, lower regulatory and policy barriers to private sector hiring, lower marginal tax rates, and a lower rate of increase of government spending. At best, we believe the economy will muddle along.
These continuing fears make us continue to believe that monetary policy will remain accommodative across the world. The market has climbed a wall of worry that we believe will return with the slightest of market drawdowns.
Even the much-publicized Brexit came to near no impact on the markets. As our investors know, we believe our time is better spent researching companies than worrying about most macro factors, over which we have no control. We continue to see opportunity in our small and mid-cap universe.
Why Small Caps and Why Now?
| 1. | Small caps complement other equity and fixed income positions, which can lead to lower correlation and positive risk-adjusted returns. Professor Harry Markowitz of the University of Chicago posited this thesis and won the 1990 Nobel Prize for his Modern Portfolio Theory.(4) |
| 2. | Over time, small caps can outperform. Eugene S. Fama (University of Chicago, Nobel Prize 2013) and Kenneth R. French (Tuck School of Business, Dartmouth) compared the performance of the average small-cap value stock to the average large-cap growth stock and found that the small caps outperformed by 2.4% per year since 1926. |
| 3. | “You pay a very high price in the stock market for a cheery consensus” was the headline of an article written for Forbes by Warren Buffett in 1974 in the midst of the market crash. It was republished on November 9, 2008.(5) The macro-environment seems chaotic, but then doesn’t it always? |
| 4. | Small caps have lagged the S&P 500 for the last year. The Russell 2000 has underperformed the S&P 500 by about 8% for the year starting May 31, 2015. Mean reversion alone would suggest outperformance relative to the S&P 500. |
| 5. | The Needham Funds and small caps can provide growth at attractive valuations. As shown in Table 1, the Needham Funds have lower average valuations than the indices, with the exception of NEAGX having a slightly higher multiple to sales than the Russell 2000. NEAGX and NEEGX have superior cash flow growth relative to their benchmark indices. They also have superior sales growth compared to the S&P 500. |
Table 1: Superior Growth at Attractive Valuations
(* Forward-looking based on historical data as of 6/30/16. Source: Morningstar.)
| | | | Price/Book* | | Price/Sales* | | Price/Cash Flow* | | Sales Growth | | Cash Flow Growth |
| NEEGX | | | | 2.22 | | | | 1.13 | | | | 4.99 | | | | 5.79 | % | | | 17.19 | % |
| NEAGX | | | | 2.28 | | | | 1.44 | | | | 4.79 | | | | 9.23 | % | | | 19.26 | % |
| S&P 500 | | | | 2.57 | | | | 1.80 | | | | 10.04 | | | | 1.54 | % | | | 1.39 | % |
| Russell 2000 | | | | 1.69 | | | | 1.03 | | | | 6.46 | | | | (0.25 | )% | | | 3.90 | % |
| (4) | A well diversified portfolio is still subject to various risks, including but not limited to investment risk, which could result in a loss of principal. |
| (5) | http://www.forbes.com/2008/11/08/buffett-forbes-article-markets-cx_pm-1107stocks.html |
| 6. | Advice from Warren Buffett, Charlie Munger and Philip Fisher: |
| a. | Pay little attention to the macro. “If you find yourself discussing and debating...STOP.”(6) |
| b. | “Does the company have products or services with sufficient market potential to make possible a sizable increase in sales for at least several years?”(7) |
| c. | “Hold a small piece of an outstanding business with the same tenacity that an owner would exhibit if he owned all of that business.”(8) |
Second Quarter and First Half Contributors Across All Three Needham Funds
For the second quarter, the leading contributor across the Needham Funds was FormFactor, Inc. (FORM), which closed its accretive acquisition of Cascade Microtech, Inc. (formerly CSCD) and returned 24%. Cascade makes wafer probe cards for the radio frequency semiconductor market and will further diversify FormFactor’s business away from the DRAM memory market. The acquisition is estimated to increase FormFactor’s 2017 earnings per share by 25%. The market gave little credit for this acquisition until a month before closing. Since the bottom on May 19, Form Factor’s stock is up 59% as of August 9.
Amber Road, Inc. (AMBR), which returned 43%, was another leading contributor across all three Needham Funds. Amber Road had a difficult year in 2015, as it struggled to get major customers up and running. The company’s new Quick Start program contributed to improved results in the first quarter and an improved outlook for 2016.
In the first half of 2016, the leading contributors were Newport Corporation (formerly NEWP), which returned 45% on its takeover by MKS Instruments (MKSI), which will diversify MKS’s product line and markets. Newport sells photonics, lasers and optics products and systems to scientific research, microelectronics, security, life and health sciences, and industrial markets. MKS was also a leading contributor, returning 21%, as it sees an opportunity to improve Newport’s margins through manufacturing and other efficiencies. Amber Road returned 52% during the first half and PDF Solutions (PDFS) returned 29%. In January at the Needham Growth Conference, PDF Solutions discussed its new product, Design For Inspection. We believe Design For Inspection has the potential to double the size of PDF’s available market.
Second Quarter and First Half Detractors Across All Three Needham Funds
In the second quarter 2016, the leading detractors were Super Micro Computer, Inc. (SMCI), down 27%, and KVH Industries, down 19%. In mid-April, Super Micro preannounced a revenue shortfall from its large data center customers. KVH supplies communications services, equipment and media content to the maritime industry. Segments of the maritime industry are suffering due to the oil and gas exploration slowdown, slowing international trade, and overcapacity in shipping; KVH has suffered along with these customers. Nonetheless, we believe it is an undervalued stock.
For the first half of 2016, the leading detractors in the Funds were KVH Industries, down 18%, and Photronics (PLAB), down 28%. Photronics makes photomasks, which are used on new designs by semiconductor manufacturers. Photronics saw a pause in spending as its logic and memory customers prepare for their next generation of technology.
Needham Growth Fund
The Needham Growth Fund returned 0.61% in the second quarter ending June 30, 2016 and returned 0.88% in the first six months of 2016.
During the second quarter, FormFactor was the top contributor followed by Amber Road. Express Scripts Holding Corporation (ESRX), the second largest holding of the Fund, returned 10% as it filed a counterclaim to the lawsuit filed against it by Anthem, Inc. (ANTM). Anthem sued Express Scripts in an attempt to extract better commercial terms. Express Scripts purchased Anthem’s pharmacy benefit management business in 2009 and the two entered into a supply agreement. We believe Express Scripts’ counterclaim places the dispute in the proper perspective and the stock market agreed.
A number of NEEGX’s other large-cap, long-term holdings were top second quarter contributors. The Fund’s largest holding at 8.3% of net assets, Thermo Fisher Scientific, Inc. (TMO), returned 4%; other positions contributing included Hess Corporation (HES), up 14%, Medtronic Plc. (MDT), up 16%, and Comcast Corporation Class A (CMCSA), up 7%.
| (6) | Robert Hagstron, Jr., The Warren Buffett Way: Investment Strategies of the World’s Greatest Investor (1995). |
| (7) | Philip Fisher, Common Stocks and Uncommon Profits (2003). |
| (8) | Berkshire Hathaway, Annual Report, 1993. |
In the second quarter, Super Micro Computer and KVH Industries were the largest detractors.
For the first half of 2016, the leading contributors were Newport Corporation, up 45%, and Amber Road, up 52%. ViaSat, Inc. (VSAT) returned 17% and was the third-leading contributor. ViaSat announced additional details about its next-generation ViaSat-3 ultra-high-bandwidth satellites.
The Fund’s leading detractor for the half-year was Express Scripts, down 13%, followed by Gilead Sciences, Inc. (GILD), down 17%. Gilead manufactures and sells market-leading AIDS/HIV and hepatitis C drugs, and the company’s stock price declined over concerns regarding maturity of the hepatitis C drug market.
During the second quarter, Needham Growth Fund added three new positions, all equities already held by the other Needham Funds. Apple, Inc. (AAPL) was purchased on its price drop after the March quarter results. With its loyal customer base, high return on equity, and trading at 8x earnings, after deducting cash, we are believers in Apple. We were recently asked about the fates of Nokia, Motorola, and Blackberry Limited (BB-Canada) as examples of what could happen to Apple. We believe Apple has a culture of innovation, a software and services business, and loyal customers, which will prevent its commoditization.
The Fund also added Vicor Corporation (VICR). Vicor has worked with Alphabet Inc.’s Google (GOOGL) on its Open Compute data centers to distribute DC (direct current) power throughout the data center rather than go through the inefficient conversions to AC (alternating current) and back again to DC.
In the first quarter, the Needham Growth Fund reduced its long-time successful position in Becton Dickinson (BDX) by almost 20% to manage position size. We trimmed other top holdings, including Thermo Fisher Scientific, Express Scripts, Gilead, and ViaSat. In the first quarter, the Fund also reduced its long-time position in Honeywell International, Inc. (HON) due to valuation.
In the second quarter, the Fund exited its long-time positions in Electro Scientific Industries, Inc. (ESIO) and Newport Corporation, through its acquisition by MKS Instruments.
Needham Growth Fund had an Active Share of 103.9% vs. the S&P 500 TR Index, and trailing 12-month turnover of just 9%. Active share is a measure of the differentiation of the holdings of a portfolio from the holdings of its appropriate passive benchmark index. Active Share is calculated by taking the sum of the absolute value of the differences of the weight of each holding in the manager’s portfolio versus the weight of each holding in the benchmark index and dividing by two. It is possible for funds that hold short positions to have an Active Share of over 100%.
On June 30, 2016, the Fund had 54% of net assets in the top 10 positions. 51% of Needham Growth Fund’s net assets were invested in companies with market capitalizations of over $8 billion, 20% between $2 billion and $8 billion, and 29% under $2 billion. During the second quarter, long-time holdings Entegris (ENTG), Electronics for Imaging (EFII), MKS Instruments (MKSI) and WageWorks, Inc. (WAGE) crossed above the $2 billion market cap level. The Fund had a 5% short position and 4% in cash.
Needham Aggressive Growth Fund
The Needham Aggressive Growth Fund lost 0.80% in the second quarter ending June 30, 2016 and returned 1.43% in the first six months of 2016.
In the second quarter, FormFactor, Amber Road and FEI Company (FEIC) were the leading contributors. FEI announced its acquisition by Thermo Fisher Scientific on May 27. FEI’s science and biotech product lines could benefit from the combination, while the quarterly volatility of the semiconductor and other industrial businesses will no longer be significant due to Thermo Fisher’s size.
Another top contributor in the second quarter was WageWorks (WAGE), which returned 18% with a strong quarter and expansion of their business managing the flexible spending accounts for the U.S. Office of Personnel Management, the largest employer in the United States. This partnership will provide nearly 1.8 million eligible employees access to WageWorks’ proprietary platform to manage healthcare and dependent care spending.
In the second quarter, the leading detractors were Super Micro Computer and FormFactor. GSE Systems, Inc. (GVP), down 18%, was the third detractor due to selling pressure on the stock. We added 215,000 shares to the portfolio in the second quarter.
For the half-year, PDF Solutions, Inc. returned 29% and was the top contributor. On May 24, PDF announced its new Design For Inspection solution along with the first two customer orders. These orders were not expected for another two or three quarters. PDF also has growth opportunities to provide its yield ramping software and services to the growing Chinese semiconductor manufacturing market and its Exsensio big-data analytics solution to a range of fabless and fab customers. Amber Road was the second-leading contributor, and WageWorks, which returned 32%, was the third.
The first half 2016 leading detractors were FormFactor and Medallion Financial (MFIN, formerly known as TAXI). Medallion Financial, a short position of NEAGX, originates, acquires and services loans that finance taxicab medallions. The stock was up 35%, from $7 to over $9 per share, and cost the Fund in the first quarter. However, loan delinquencies accelerated, taxicab medallions continued to lose value, and the market ignored the data. As we write this letter in early August, Medallion Financial announced on August 2 a cut to its dividend to $0.05 per share from $0.25 per share; the stock is down over 25% and trading under $6. We believe a number of Medallion’s assets, most obviously its Chicago medallions, are worth far less than reported on the company’s balance sheet.
During the first half of 2016, we added to several positions, including Amber Road, IPG Photonics (IPGP), KVH Industries, PDF Solutions and Vicor Corp. We also reduced positions, including TheStreet, Inc. (TST), Hess Corp., FEI Company, Financial Engines (FNGN), Oil-Dri Corporation of America (ODI), and Photronics (PLAB). In the second quarter, we exited small positions in GSV Capital Corp (GSVC), Newport Corporation, Barracuda Networks (CUDA), Panera Bread Co. (PNRA), and FedEx (FDX).
The Fund had an Active Share of 114.3% versus the Russell 2000 and a trailing 12-month turnover of 12%.
Needham Aggressive Growth Fund exited the quarter with 43% of assets in companies over $2 billion in market cap, up from 31% last quarter. Like the Needham Growth Fund, four of the portfolio’s long-term positions crossed the bar to over $2 billion. The Fund remained concentrated with the top 10 positions at 54% of net assets. The Fund had an 8% short position and was once again fully invested.
Needham Small Cap Growth Fund
The Needham Small Growth Fund returned 0.90% in the second quarter and 8.44% in the first half of 2016, while the Russell 2000 Total Return Index returned 3.79% in the second quarter and 2.22% in the first half of 2016.
The Fund saw the completion of the acquisition of Newport Corp. (NEWP) to MKS Instruments (MKSI), and we saw a significant cash increase due partly to this deal closing. Ruckus Wireless (RKUS) agreed to sell itself to Brocade Communications (BRCD) for a slight premium and, as a result, we sold the position.
Semiconductor capital equipment was a highlight in the second quarter for the Fund, and we expect to see continued strength from the industry in the second half of 2016 and into 2017. The summer 2015 delays that significantly impacted the Fund’s performance last year are now flowing through many of our investments in the sector. Ultra Clean Holdings (UCTT), NESGX’s second-largest holding, is strongly leveraged to this cycle and ramp of increased capital intensity in the fabrication of semiconductors. Although the long-time Chief Financial Officer, Casey Eichler, decided to leave the company at the end of July, we believe he leaves the company at a time when fundamentals are very strong.
Our investment in Amber Road recovered nicely in the quarter. Amber Road provides cloud-based global trade management solutions. After a substantial correction in 2015 and early in 2016, we added significantly to the position. The cash burn was largely reduced, removing the overhang of a potential equity offering that the market feared. We believe the company is now on firm ground and is able to continue to pursue its long-term financial goals.
We are very pleased with the performance of Needham Small Cap Growth Fund in the first half of the year; many of our long-term holdings performed nicely as their fundamental stories delivered results. Although January and early February was a difficult start to the year, we were able to make valuable investments during this period, which ultimately recovered from their lows. Our investments in the semiconductor capital equipment industry saw greater visibility after a disappointing second half of 2015. We also benefited from an increased trend in consolidation of small cap stocks. Global central banks continued to provide accommodative monetary support to risk assets and this helped the markets to recover. We also saw a recovery in the energy markets that helped to boost the high yield markets off their lows. This recovery provided a tailwind to small cap stocks in the first half, as high yield investment opportunities trade less like equity investments as they trade closer to par. We continued to balance the Fund as our concentrated top ideas achieved price targets and a higher percentage of the Fund.
Closing
The second quarter saw a nice return in the equity markets, as global Central Banks continued to offer accommodative monetary policy, and this continued investor appetite for risk assets. We saw an increase in negative interest rates around the world, which pressured U.S. interest rates lower. The fundamental economic growth story remained slow but the consistency of the growth allowed companies to recover from the significant sell-off in the early months of the year.
The suspense of the Brexit vote in the United Kingdom escalated throughout the quarter and the final decision to leave the EU was a surprise to the markets. The initial negative impact of the Brexit vote on the markets turned out to be short-lived, and during it, we were able to acquire some new additions to our portfolios. While the long-term implications of leaving the EU are not completely known at this time, the markets recovered quite quickly as the actual leave will not occur for at least two years. We expect some companies to expose risk to the Brexit decision but the U.S. markets, in general, are large and strong enough to work through these risks.
We believe the U.S. is still facing sub-par economic growth, but it remains the best place in the world to be investing and working. Asia and Europe are facing difficult economic times. We believe there is opportunity in small and mid-cap stocks in this difficult market. We are particularly excited that this market may give us a chance to add to positions already in the portfolio.
We see opportunity in our strategy of investing in companies that we know well and that we believe are positioned with secular growth drivers. We believe the remainder of 2016 will bring a modest rebound for equities. As it already has this year, we believe the markets will experience more volatility and that our ability to short could dampen the possible volatility.
To reiterate our overall thesis: monetary policy remains accommodative. Most importantly, we see a revolution happening in technology that has created and continues to create investment opportunities.
We welcome our new investors and thank all of our investors for their continued support. If you have any questions, thoughts or concerns, please contact us at (800) 625-7071 or send us an email at cretzler@needhamco.com or jbarr@needhamco.com. For information about the funds, please visit our website at www.needhamfunds.com.
| Sincerely, | |
| | |
 |  |
| | |
| Chris Retzler | John O. Barr |
| Portfolio Manager | Portfolio Manager |
| | Semi-Annual Report 2016 |
| | |
| TICKER: NEEGX |
Comparative Performance Statistics as of June 30, 2016 (Unaudited)
| | | | | | | | | | | | | | | | | | | | | | |
| | | 6 Months(7) | | 1 Year | | 3 Years(8) | | 5 Years(8) | | 10 Years(8) | | Since
Inception(8)(12) | | Gross Expense
Ratio(14) |
Needham Growth Fund(1) | | 0.88 | % | | -7.48 | % | | 6.30 | %(9) | | 6.33 | %(10) | | 6.22 | %(11) | | 12.68 | %(13) | | 2.07 | % |
S&P 500 Index(2)(3) | | 3.84 | % | | 3.99 | % | | 11.66 | % | | 12.10 | % | | 7.42 | % | | 8.18 | % | | | |
NASDAQ Composite Index(2)(4) | | -2.61 | % | | -1.58 | % | | 13.95 | % | | 13.29 | % | | 9.57 | % | | 8.64 | % | | | |
S&P 400 MidCap Index(2)(5) | | 7.93 | % | | 1.33 | % | | 10.53 | % | | 10.55 | % | | 8.55 | % | | 11.35 | % | | | |
Russell 2000 Index(2)(6) | | 2.22 | % | | -6.73 | % | | 7.09 | % | | 8.35 | % | | 6.20 | % | | 7.94 | % | | | |
Past performance does not guarantee future results. The performance data quoted represents past performance, and current returns may be lower or higher. The investment return and net asset value will fluctuate so that an investor’s shares, when redeemed, may be worth more or less than the original cost. To obtain performance information current to the most recent month-end, please call 1-800-625-7071. The returns shown in the above table and accompanying footnotes are net of expenses. The table above does not reflect the deduction of taxes that a shareholder would have paid on Fund distributions or on the redemption of Fund shares.
| 1. | Investment results calculated after reinvestment of dividends. |
| 2. | It is not possible to invest directly in an index. The performance of the index does not include the deduction of expenses associated with a mutual fund, such as investment management fees. |
| 3. | The S&P 500 Index is a broad unmanaged measure of the U.S. stock market. |
| 4. | The NASDAQ Composite Index is a broad-based capitalization-weighted index of all NASDAQ Global Market and Small Cap stocks. |
| 5. | The S&P 400 MidCap Index is a broad unmanaged measure of the U.S. stock market. |
| 6. | The Russell 2000 Index is a broad unmanaged index composed of the smallest 2,000 companies in the Russell 3000 Index. |
| 8. | Compound annual growth rate (annualized return). Assumes all dividends were reinvested in shares of the Fund. |
| 9. | Cumulative return for the three year period was 20.11%, assuming all dividends were reinvested in shares of the Fund. |
| 10. | Cumulative return for the five year period was 35.92%, assuming all dividends were reinvested in shares of the Fund. |
| 11. | Cumulative return for the ten year period was 82.79%, assuming all dividends were reinvested in shares of the Fund. |
| 12. | The inception date of the Fund was 1/1/96. |
| 13. | Cumulative return since inception was 1,054.52%, assuming all dividends were reinvested in shares of the Fund. |
| 14. | Gross expense ratio is from the Fund’s prospectus dated May 1, 2016. Additional information pertaining to the Fund’s expense ratios as of June 30, 2016 can be found in the financial highlights. Since January 1, 2009, the investment performance reflects contractually agreed upon fee waivers which expire at the close of business on April 30, 2017. Without these fee waivers, the performance would have been lower. Excluding the indirect costs of investing in acquired funds, total fund operating expenses would be 2.05%. |
Top Ten Holdings*
(as a % of total investments, as of June 30, 2016)
| | | | Security | | | | | % of Total
Investments† | |
| 1 | | Thermo Fisher Scientific, Inc. | | TMO | | 8.69% | | |
| 2 | | Express Scripts Holding Co. | | ESRX | | 8.65% | | |
| 3 | | Gilead Sciences, Inc. | | GILD | | 6.86% | | |
| 4 | | ViaSat, Inc. | | VSAT | | 5.52% | | |
| 5 | | Becton Dickinson and Co. | | BDX | | 5.32% | | |
| 6 | | CarMax, Inc. | | KMX | | 4.86% | | |
| 7 | | FormFactor, Inc. | | FORM | | 4.77% | | |
| 8 | | Super Micro Computer, Inc. | | SMCI | | 4.23% | | |
| 9 | | KVH Industries, Inc. | | KVHI | | 3.58% | | |
| 10 | | Comcast Corp. | | CMCSA | | 3.46% | | |
Top Ten Holdings = 55.94% of Total Investments†
| * | Current portfolio holdings may not be indicative of future portfolio holdings. |
| † | Percentage of total investments less cash. |
Sector Weightings*
(as a % of total investments, as of June 30, 2016)
| | Sector | | | Long(1) | | (Short)(1) | | Total(1)(2) |
| Consumer Discretionary | | 10.3 | % | | — | | | 10.3 | % |
| Energy | | 3.2 | % | | — | | | 3.2 | % |
| Exchange Traded Funds | | — | | | (0.3 | )% | | (0.3 | )% |
| Financials | | 2.8 | % | | (0.8 | )% | | 2.0 | % |
| Health Care | | 35.5 | % | | — | | | 35.5 | % |
| Industrials | | 3.1 | % | | — | | | 3.1 | % |
| Information Technology | | 46.1 | % | | (3.7 | )% | | 42.4 | % |
| Cash | | 3.8 | % | | — | | | 3.8 | % |
| * | Current portfolio holdings may not be indicative of future portfolio holdings. |
| (1) | Percentage of total investments includes all stocks, plus cash minus all short positions. |
| (2) | Total represents the difference between the long exposure and the short exposure, which produces the net exposure. |
Comparison of Change in Value of a $10,000 Investment
Past performance does not guarantee future results. The performance data quoted represents past performance, and current returns may be lower or higher. The investment return and net asset value will fluctuate so that an investor’s shares, when redeemed, may be worth more or less than the original cost. To obtain performance information current to the most recent month-end, please call 1-800-625-7071. The graph above does not reflect the deduction of taxes that a shareholder would have paid on Fund distributions or on the redemption of Fund shares. Since inception, the Fund’s adviser has absorbed certain expenses of the Fund, without which returns would have been lower.
The Global Industry Classification Standard (GICS®) was developed by and/or is the exclusive property of MSCI, Inc. and Standard & Poor Financial Services LLC (“S&P”). GICS is a service mark of MSCI and S&P and has been licensed for use by U.S. Bancorp Fund Services, LLC.
| Needham Funds | |
| | |
NEEDHAM AGGRESSIVE G ROWTH FUND | TICKER: NEAGX |
| Comparative Performance Statistics as of June 30, 2016 (Unaudited) |
| | | 6 Months(6) | | 1 Year | | 3 Years(7) | | 5 Years(7) | | 10 Years(7) | | Since
Inception(7)(11) | | Gross Expense
Ratio(13) |
Needham Aggressive Growth Fund(1) | | 1.43 | % | | -8.29 | % | | 5.81 | %(8) | | 5.96 | %(9) | | 8.56 | %(10) | | 8.54 | %(12) | | 2.43 | % |
S&P 500 Index(2)(3) | | 3.84 | % | | 3.99 | % | | 11.66 | % | | 12.10 | % | | 7.42 | % | | 6.36 | % | | | |
NASDAQ Composite Index(2)(4) | | -2.61 | % | | -1.58 | % | | 13.95 | % | | 13.29 | % | | 9.57 | % | | 8.00 | % | | | |
Russell 2000 Index(2)(5) | | 2.22 | % | | -6.73 | % | | 7.09 | % | | 8.35 | % | | 6.20 | % | | 7.71 | % | | | |
Past performance does not guarantee future results. The performance data quoted represents past performance, and current returns may be lower or higher. The investment return and net asset value will fluctuate so that an investor’s shares, when redeemed, may be worth more or less than the original cost. To obtain performance information current to the most recent month-end, please call 1-800-625-7071. The returns shown in the above table and accompanying footnotes are net of expenses. The table above does not reflect the deduction of taxes that a shareholder would have paid on Fund distributions or on the redemption of Fund shares.
| 1. | Investment results calculated after reinvestment of dividends. |
| 2. | It is not possible to invest directly in an index. The performance of the index does not include the deduction of expenses associated with a mutual fund, such as investment management fees. |
| 3. | The S&P 500 Index is a broad unmanaged measure of the U.S. stock market. |
| 4. | The NASDAQ Composite Index is a broad-based capitalization-weighted index of all NASDAQ Global Market and Small Cap stocks. |
| 5. | The Russell 2000 Index is a broad unmanaged index composed of the smallest 2,000 companies in the Russell 3000 Index. |
| 7. | Compound annual growth rate (annualized return). Assumes all dividends were reinvested in shares of the Fund. |
| 8. | Cumulative return for the three year period was 18.46%, assuming all dividends were reinvested in shares of the Fund. |
| 9. | Cumulative return for the five year period was 33.60%, assuming all dividends were reinvested in shares of the Fund. |
| 10. | Cumulative return for the ten year period was 127.27%, assuming all dividends were reinvested in shares of the Fund. |
| 11. | The inception date of the Fund was 9/4/2001. |
| 12. | Cumulative return since inception was 237.00% assuming all dividends were reinvested in shares of the Fund. |
| 13. | Gross expense ratio is from the Fund’s prospectus dated May 1, 2016. Additional information pertaining to the Fund’s expense ratios as of June 30, 2016 can be found in the financial highlights. Since January 1, 2009, the investment performance reflects contractually agreed upon fee waivers which expire at the close of business on April 30, 2017. Without these fee waivers, the performance would have been lower. Excluding the indirect costs of investing in acquired funds, total fund operating expenses would be 2.41%. |
Top Ten Holdings*
(as a % of total investments, as of June 30, 2016)
| | | | Security | | | | | % of Total
Investments† | |
| 1 | | Akamai Technologies, Inc. | | AKAM | | 7.60% | | |
| 2 | | PDF Solutions, Inc. | | PDFS | | 7.41% | | |
| 3 | | FormFactor, Inc. | | FORM | | 6.20% | | |
| 4 | | Entegris, Inc. | | ENTG | | 5.96% | | |
| 5 | | KVH Industries, Inc. | | KVHI | | 4.96% | | |
| 6 | | Reis, Inc. | | REIS | | 4.94% | | |
| 7 | | Apple, Inc. | | AAPL | | 4.67% | | |
| 8 | | Super Micro Computer, Inc. | | SMCI | | 4.37% | | |
| 9 | | GSE Systems, Inc. | | GVP | | 4.02% | | |
| 10 | | Gilead Sciences, Inc. | | GILD | | 3.95% | | |
Top Ten Holdings = 54.08% of Total Investments†
| * | Current portfolio holdings may not be indicative of future portfolio holdings. |
| † | Percentage of total investments less cash. |
Sector Weightings*
(as a % of total investments, as of June 30, 2016)
| | Sector | | | Long(1) | | (Short)(1) | | Total(1)(2) |
| Consumer Discretionary | | 4.0 | % | | — | | | 4.0 | % |
| Consumer Staples | | 2.0 | % | | — | | | 2.0 | % |
| Energy | | 0.5 | % | | — | | | 0.5 | % |
| Financials | | 5.1 | % | | (2.7 | )% | | 2.4 | % |
| Health Care | | 10.6 | % | | — | | | 10.6 | % |
| Industrials | | 6.4 | % | | — | | | 6.4 | % |
| Information Technology | | 79.4 | % | | (5.3 | )% | | 74.1 | % |
| * | Current portfolio holdings may not be indicative of future portfolio holdings. |
| (1) | Percentage of total investments includes all stocks, plus cash minus all short positions. |
| (2) | Total represents the difference between the long exposure and the short exposure, which produces the net exposure. |
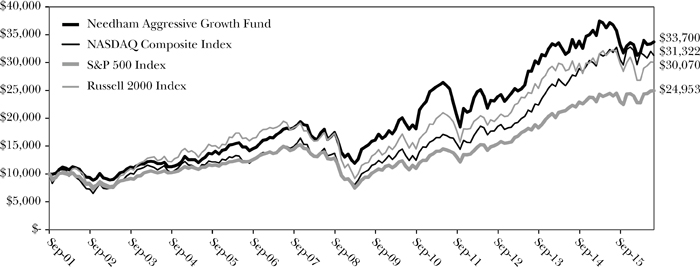
Comparison of Change in Value of a $10,000 Investment
Past performance does not guarantee future results. The performance data quoted represents past performance, and current returns may be lower or higher. The investment return and net asset value will fluctuate so that an investor’s shares, when redeemed, may be worth more or less than the original cost. To obtain performance information current to the most recent month-end, please call 1-800-625-7071. The graph above does not reflect the deduction of taxes that a shareholder would have paid on Fund distributions or on the redemption of Fund shares. Since inception, the Fund’s adviser has absorbed certain expenses of the Fund, without which returns would have been lower.
The Global Industry Classification Standard (GICS®) was developed by and/or is the exclusive property of MSCI, Inc. and Standard & Poor Financial Services LLC (“S&P”). GICS is a service mark of MSCI and S&P and has been licensed for use by U.S. Bancorp Fund Services, LLC.
| | Semi-Annual Report 2016 |
| | |
NEEDHAM SMALL CAP GROWTH FUND | TICKER: NESGX |
| Comparative Performance Statistics as of June 30, 2016 (Unaudited) |
| | | 6 Months(6) | | 1 Year | | 3 Years(7) | | 5 Years(7) | | 10 Years(7) | | Since
Inception(7)(11) | | Gross Expense
Ratio(13) |
Needham Small Cap Growth Fund(1) | | 8.44 | % | | -4.42 | % | | 4.73 | %(8) | | 2.94 | %(9) | | 5.85 | %(10) | | 9.19 | %(12) | | 2.05 | % |
S&P 500 Index(2)(3) | | 3.84 | % | | 3.99 | % | | 11.66 | % | | 12.10 | % | | 7.42 | % | | 6.94 | % | | | |
NASDAQ Composite Index(2)(4) | | -2.61 | % | | -1.58 | % | | 13.95 | % | | 13.29 | % | | 9.57 | % | | 9.03 | % | | | |
Russell 2000 Index(2)(5) | | 2.22 | % | | -6.73 | % | | 7.09 | % | | 8.35 | % | | 6.20 | % | | 7.61 | % | | | |
Past performance does not guarantee future results. The performance data quoted represents past performance, and current returns may be lower or higher. The investment return and net asset value will fluctuate so that an investor’s shares, when redeemed, may be worth more or less than the original cost. To obtain performance information current to the most recent month-end, please call 1-800-625-7071. The returns shown in the above table and accompanying footnotes are net of expenses. The table above does not reflect the deduction of taxes that a shareholder would have paid on Fund distributions or on the redemption of Fund shares.
| 1. | Investment results calculated after reinvestment of dividends. |
| 2. | It is not possible to invest directly in an index. The performance of the index does not include the deduction of expenses associated with a mutual fund, such as investment management fees. |
| 3. | The S&P 500 Index is a broad unmanaged measure of the U.S. stock market. |
| 4. | The NASDAQ Composite Index is a broad-based capitalization-weighted index of all NASDAQ Global Market and Small Cap stocks. |
| 5. | The Russell 2000 Index is a broad unmanaged index composed of the smallest 2,000 companies in the Russell 3000 Index. |
| 7. | Compound annual growth rate (annualized return). Assumes all dividends were reinvested in shares of the Fund. |
| 8. | Cumulative return for the three year period was 14.87%, assuming all dividends were reinvested in shares of the Fund. |
| 9. | Cumulative return for the five year period was 15.57%, assuming all dividends were reinvested in shares of the Fund. |
| 10. | Cumulative return for the ten year period was 76.51%, assuming all dividends were reinvested in shares of the Fund. |
| 11. | The inception date of the Fund was 5/22/02. |
| 12. | Cumulative return since inception was 245.74% assuming all dividends were reinvested in shares of the Fund. |
| 13. | Gross expense ratio is from the Fund’s prospectus dated May 1, 2016. Additional information pertaining to the Fund’s expense ratios as of June 30, 2016 can be found in the financial highlights. Since January 1, 2009, the investment performance reflects contractually agreed upon fee waivers which expire at the close of business on April 30, 2017. Without these fee waivers, the performance would have been lower. Excluding the indirect costs of investing in acquired funds, total fund operating expenses would be 2.05%. |
Top Ten Holdings*
(as a % of total investments, as of June 30, 2016)
| | | | Security | | | | | % of Total
Investments† | |
| 1 | | Amber Road, Inc. | | AMBR | | 11.35% | | |
| 2 | | Ultra Clean Holdings, Inc. | | UCTT | | 11.32% | | |
| 3 | | TTM Technologies, Inc. | | TTMI | | 8.87% | | |
| 4 | | Silicon Graphics International Corp. | | SGI | | 8.13% | | |
| 5 | | PDF Solutions, Inc. | | PDFS | | 7.89% | | |
| 6 | | FormFactor, Inc. | | FORM | | 6.76% | | |
| 7 | | Frequency Electronics, Inc. | | FEIM | | 6.12% | | |
| 8 | | KVH Industries, Inc. | | KVHI | | 5.88% | | |
| 9 | | Super Micro Computer, Inc. | | SMCI | | 5.06% | | |
| 10 | | Reis, Inc. | | REIS | | 3.59% | | |
Top Ten Holdings = 74.97% of Total Investments†
| * | Current portfolio holdings may not be indicative of future portfolio holdings. |
| † | Percentage of total investments less cash. |
Sector Weightings*
(as a % of total investments, as of June 30, 2016)
| | Sector | | | Long(1) | | (Short)(1) | | Total(1)(2) |
| Closed End Funds | | 0.2 | % | | — | | | 0.2 | % |
| Energy | | 1.3 | % | | — | | | 1.3 | % |
| Exchange Traded Funds | | — | | | (6.3 | )% | | (6.3 | )% |
| Financials | | 2.1 | % | | — | | | 2.1 | % |
| Health Care | | 2.2 | % | | — | | | 2.2 | % |
| Industrials | | 2.9 | % | | — | | | 2.9 | % |
| Information Technology | | 57.2 | % | | (0.8 | )% | | 56.4 | % |
| Cash | | 41.2 | % | | — | | | 41.2 | % |
| * | Current portfolio holdings may not be indicative of future portfolio holdings. |
| (1) | Percentage of total investments includes all stocks, plus cash minus all short positions. |
| (2) | Total represents the difference between the long exposure and the short exposure, which produces the net exposure. |
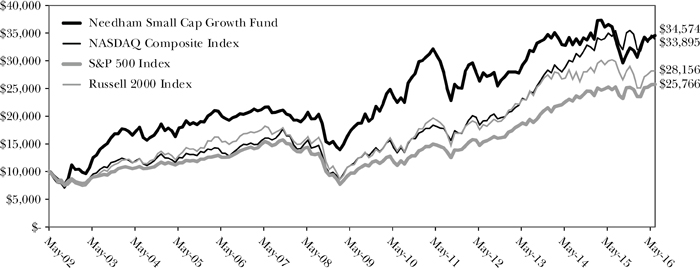
Comparison of Change in Value of a $10,000 Investment
Past performance does not guarantee future results. The performance data quoted represents past performance, and current returns may be lower or higher. The investment return and net asset value will fluctuate so that an investor’s shares, when redeemed, may be worth more or less than the original cost. To obtain performance information current to the most recent month-end, please call 1-800-625-7071. The graph above does not reflect the deduction of taxes that a shareholder would have paid on Fund distributions or on the redemption of Fund shares. Since inception, the Fund’s adviser has absorbed certain expenses of the Fund, without which returns would have been lower.
The Global Industry Classification Standard (GICS®) was developed by and/or is the exclusive property of MSCI, Inc. and Standard & Poor Financial Services LLC (“S&P”). GICS is a service mark of MSCI and S&P and has been licensed for use by U.S. Bancorp Fund Services, LLC.
Disclosure of Fund Expenses (Unaudite
d)
The following expense table is shown so that you can understand the impact of fees on your investment. All mutual funds have operating expenses. As a shareholder of a Portfolio, you incur transactional costs, including redemption fees and ongoing costs, which include costs for portfolio management, administrative services, and shareholder reports, among others. A Portfolio’s expenses are expressed as a percentage of its average net assets. This figure is known as the expense ratio. The following examples are intended to help you understand the ongoing costs (in dollars) of investing in each Portfolio and to compare these costs with those of other mutual funds. The examples are based on an investment of $1,000 made at the beginning of the period shown and held for the entire period. The expense example table below illustrates your fund’s cost in two ways:
| ● | Actual Expenses. This section helps you to estimate the actual expenses after fee waivers that you paid over the period. The “Ending Account Value” shown is derived from the Portfolio’s actual return, and “Expenses Paid During Period” shows the dollar amount that would have been paid by an investor who started with $1,000 in the Portfolio. You may use the information here, together with the amount you invested, to estimate the expenses that you paid over the period. To do so, simply divide your account value by $1,000 (for example, an $8,600 account value divided by $1,000 = 8.6), then multiply the result by the number given for your Portfolio under the heading entitled “Expenses Paid During Period”. |
| ● | Hypothetical Expenses on a 5% Return. This section is intended to help you compare your Portfolio’s costs with those of other mutual funds. It assumes that the Portfolio had a return of 5% before expenses during the period shown, but that the expense ratio is unchanged. In this case, because the return used is not the Portfolio’s actual return, the results do not apply to your investment. The example is useful in making comparisons because the Securities and Exchange Commission requires all mutual funds to calculate expenses based on a 5% return. You can assess your Portfolio’s cost by comparing this hypothetical example with the hypothetical examples that appear in shareholders reports of other funds. |
Please note that the expenses shown in the table are meant to highlight your ongoing costs only and do not reflect any transactional costs, such as redemption fees or exchange fees. Therefore, the table is useful in comparing ongoing costs only, and will not help you determine the relative total costs of owning different funds. In addition, if these transactional costs were included, your costs would have been higher.
For the Period January 1, 2016 to June 30, 2016
Expense Example Table
| | | | | | | | | |
| | | Beginning
Account Value
1/1/16 | | Ending
Account Value
6/30/16 | | Expenses Paid
During Period*
1/1/16 – 6/30/16 | | Expense Ratio
During Period*
1/1/16 – 6/30/16 |
| Needham Growth Fund | | | | | | | | |
| Actual Expenses | | $1,000.00 | | $1,008.80 | | $11.34 | | 2.27% |
Hypothetical Example for Comparison Purposes
(5% return before expenses) | | $1,000.00 | | $1,013.58 | | $11.36 | | 2.27% |
| | | | | | | | | |
| Needham Aggressive Growth Fund | | | | | | | | |
| Actual Expenses | | $1,000.00 | | $1,014.30 | | $14.77 | | 2.95% |
Hypothetical Example for Comparison Purposes
(5% return before expenses) | | $1,000.00 | | $1,010.19 | | $14.74 | | 2.95% |
| | | | | | | | | |
| Needham Small Cap Growth Fund | | | | | | | | |
| Actual Expenses | | $1,000.00 | | $1,084.40 | | $10.52 | | 2.03% |
Hypothetical Example for Comparison Purposes
(5% return before expenses) | | $1,000.00 | | $1,014.77 | | $10.17 | | 2.03% |
| * | Expenses are equal to the average account value times the Portfolio’s annualized expense ratio multiplied 182/366 (to reflect the one-half-year period). |
| | | | | | |
| Schedule of Investments | | | | | | |
| June 30, 2016 (Unaudited) | | | | | | |
| | | Shares | | | Market Value | |
| Common Stocks (96.4%) | | | | | | |
| | | | | | | |
| Aerospace & Defense (0.4%) | | | | | | |
| Honeywell International, Inc. | | | 4,500 | | | $ | 523,440 | |
| | | | | | | | | |
| Airlines (0.2%) | | | | | | | | |
| United Continental Holdings, Inc.* | | | 5,000 | | | | 205,200 | |
| | | | | | | | | |
| Auto Components (0.2%) | | | | | | | | |
| Sypris Solutions, Inc.* | | | 213,573 | | | | 181,537 | |
| | | | | | | | | |
| Biotechnology (6.6%) | | | | | | | | |
| Gilead Sciences, Inc.† | | | 93,000 | | | | 7,758,060 | |
| | | | | | | | | |
| Capital Markets (2.3%) | | | | | | | | |
| Financial Engines, Inc.† | | | 60,000 | | | | 1,552,200 | |
| GSV Capital Corp. | | | 47,500 | | | | 238,450 | |
| Oaktree Capital Group LLC | | | 20,000 | | | | 895,200 | |
| | | | | | | | 2,685,850 | |
| | | | | | | | | |
| Communications Equipment (8.8%) | | | | | | | | |
| KVH Industries, Inc.* | | | 526,300 | | | | 4,052,510 | |
| ViaSat, Inc.*† | | | 87,500 | | | | 6,247,500 | |
| | | | | | | | 10,300,010 | |
| | | | | | | | | |
| Electrical Equipment (0.1%) | | | | | | | | |
| Vicor Corp.* | | | 15,000 | | | | 151,050 | |
| | | | | | | | | |
| Electronic Equipment, Instruments & Components (5.5%) | | | | | | | | |
| Corning, Inc. | | | 35,000 | | | | 716,800 | |
| FLIR Systems, Inc. | | | 15,000 | | | | 464,250 | |
| Frequency Electronics, Inc.* | | | 33,247 | | | | 309,197 | |
| IPG Photonics Corp.* | | | 6,000 | | | | 480,000 | |
| Jabil Circuit, Inc.† | | | 150,000 | | | | 2,770,500 | |
| National Instruments Corp. | | | 23,300 | | | | 638,420 | |
| TTM Technologies, Inc.* | | | 36,500 | | | | 274,845 | |
| Vishay Intertechnology, Inc. | | | 62,500 | | | | 774,375 | |
| | | | | | | | 6,428,387 | |
| | | | | | | | | |
| Energy Equipment & Services (0.8%) | | | | | | | | |
| Schlumberger Ltd. | | | 12,500 | | | | 988,500 | |
| | | | | | | | | |
| Health Care Equipment & Supplies (10.0%) | | | | | | | | |
| Analogic Corp. | | | 6,250 | | | | 496,500 | |
| Becton Dickinson and Co. | | | 35,500 | | | | 6,020,445 | |
| CONMED Corp. | | | 30,000 | | | | 1,431,900 | |
| Medtronic PLC | | | 26,290 | | | | 2,281,183 | |
| Varian Medical Systems, Inc.* | | | 19,000 | | | | 1,562,370 | |
| | | | | | | | 11,792,398 | |
| | | | | | | | | |
| Health Care Providers & Services (8.3%) | | | | | | | | |
| Express Scripts Holding Co.*† | | | 129,000 | | | | 9,778,200 | |
| Health Care Technology (0.1%) | | | | | | |
| Castlight Health, Inc.* | | | 20,000 | | | | 79,200 | |
| | | | | | | | | |
| Internet Software & Services (6.5%) | | | | | | | | |
| Akamai Technologies, Inc.*† | | | 56,000 | | | | 3,132,080 | |
| Amber Road, Inc.* | | | 404,800 | | | | 3,121,008 | |
| Q2 Holdings, Inc.* | | | 20,000 | | | | 560,400 | |
| Reis, Inc. | | | 34,500 | | | | 859,050 | |
| | | | | | | | 7,672,538 | |
| | | | | | | | | |
| Life Sciences Tools & Services (8.6%) | | | | | | | | |
| Bruker Corp. | | | 10,000 | | | | 227,400 | |
| Thermo Fisher Scientific, Inc.† | | | 66,500 | | | | 9,826,040 | |
| | | | | | | | 10,053,440 | |
| | | | | | | | | |
| Media (3.8%) | | | | | | | | |
| Comcast Corp. | | | 60,000 | | | | 3,911,400 | |
| Twenty-First Century Fox, Inc. | | | 10,000 | | | | 270,500 | |
| World Wrestling Entertainment, Inc. | | | 12,500 | | | | 230,125 | |
| | | | | | | | 4,412,025 | |
| | | | | | | | | |
| Oil, Gas & Consumable Fuels (2.2%) | | | | | | | | |
| Hess Corp.† | | | 43,000 | | | | 2,584,300 | |
| | | | | | | | | |
| Pharmaceuticals (0.2%) | | | | | | | | |
| Corium International, Inc.* | | | 80,000 | | | | 277,600 | |
| | | | | | | | | |
| Professional Services (1.2%) | | | | | | | | |
| WageWorks, Inc.* | | | 23,500 | | | | 1,405,535 | |
| | | | | | | | | |
| Semiconductors & Semiconductor Equipment (15.2%) | | | | | | | | |
| Applied Materials, Inc. | | | 8,000 | | | | 191,760 | |
| Brooks Automation, Inc. | | | 85,000 | | | | 953,700 | |
| Entegris, Inc.* | | | 200,000 | | | | 2,894,000 | |
| FormFactor, Inc.* | | | 600,000 | | | | 5,394,000 | |
| Lam Research Corp. | | | 2,500 | | | | 210,150 | |
| MKS Instruments, Inc. | | | 59,000 | | | | 2,540,540 | |
| Nova Measuring Instruments Ltd.* | | | 130,000 | | | | 1,422,200 | |
| PDF Solutions, Inc.* | | | 212,500 | | | | 2,972,875 | |
| Photronics, Inc.* | | | 130,000 | | | | 1,158,300 | |
| Ultra Clean Holdings, Inc.* | | | 7,700 | | | | 43,813 | |
| | | | | | | | 17,781,338 | |
| | | | | | | | | |
| Software (0.2%) | | | | | | | | |
| Barracuda Networks, Inc.* | | | 13,650 | | | | 206,661 | |
| | | | | | | | | |
| Specialty Retail (5.7%) | | | | | | | | |
| CarMax, Inc.*† | | | 112,000 | | | | 5,491,360 | |
| Dick’s Sporting Goods, Inc. | | | 24,000 | | | | 1,081,440 | |
| Tiffany & Co. | | | 2,500 | | | | 151,600 | |
| | | | | | | | 6,724,400 | |
See accompanying notes to financial statements.
| Needham Growth Fund | | | | | | |
| Schedule of Investments (Continued) | | | | | | |
| June 30, 2016 (Unaudited) | | | | | | |
| | | Shares | | | Market Value | |
| Common Stocks – Continued | | | | | | |
| | | | | | | |
| Technology Hardware, Storage & Peripherals (7.9%) | | | | | | |
| Apple, Inc. | | | 7,500 | | | $ | 717,000 | |
| Electronics For Imaging, Inc.* | | | 64,000 | | | | 2,754,560 | |
| Hutchinson Technology, Inc.* | | | 287,500 | | | | 974,625 | |
| Silicon Graphics International Corp.* | | | 6,325 | | | | 31,815 | |
| Super Micro Computer, Inc.* | | | 192,500 | | | | 4,783,625 | |
| | | | | | | | 9,261,625 | |
| | | | | | | | | |
| Textiles, Apparel & Luxury Goods (0.2%) | | | | | | | | |
| Under Armour, Inc.* | | | 5,018 | | | | 191,971 | |
| | | | | | | | | |
| Thrifts & Mortgage Finance (0.4%) | | | | | | | | |
| Ladder Capital Corp. | | | 36,007 | | | | 439,286 | |
| | | | | | | | | |
| Trading Companies & Distributors (1.0%) | | | | | | | | |
| Air Lease Corp. | | | 45,000 | | | | 1,205,100 | |
| | | | | | | | | |
| Total Common Stocks | | | | | | | | |
| (Cost $55,077,092) | | | | | | $ | 113,087,651 | |
| Short-Term Investments (3.7%) | | | | | | |
| | | | | | | |
| Money Market Fund (3.7%) | | | | | | |
| | | | | | | |
| Dreyfus Treasury Securities Cash Management – Institutional Class 0.16%(a) (Cost $4,314,655) | | | 4,314,655 | | | | 4,314,655 | |
| | | | | | | | | |
| Total Investments (100.1%) | | | | | | | | |
| (Cost $59,391,747) | | | | | | | 117,402,306 | |
| Total Securities Sold Short (-4.5%) (Proceeds $4,585,547) | | | | | | | (5,336,457 | ) |
| Other Assets in Excess of Liabilities (4.4%) | | | | | | | 5,227,741 | |
| Net Assets (100.0%) | | | | | | $ | 117,293,590 | |
| * | Non-income producing security. |
| (a) | Rate shown is the seven day yield as of June 30, 2016. |
| † | Security position is either entirely or partially held in a segregated account as collateral for securities sold short, aggregating a total market value of $3,498,100. |
| | The Global Industry Classification Standard (GICS®) was developed by and/or is the exclusive property of MSCI, Inc. and Standard & Poor’s Financial Services LLC (‘‘S&P’’). GICS is a service mark of MSCI and S&P and has been licensed for use by U.S. Bancorp Fund Services, LLC. |
See accompanying notes to financial statements.
| | | | | | |
| Schedule of Securities Sold Short | | | | | | |
| June 30, 2016 (Unaudited) | | | | | | |
| | | | | | | |
| | | Shares | | | Market Value | |
| Securities Sold Short (-4.2%) | | | | | | |
| | | | | | | |
| Capital Markets (-0.7%) | | | | | | |
| Medallion Financial Corp. | | | 115,000 | | | $ | 848,700 | |
| | | | | | | | | |
| Communications Equipment (-2.3%) | | | | | | | | |
| Ubiquiti Networks, Inc.* | | | 69,250 | | | | 2,677,205 | |
| | | | | | | | | |
| Semiconductors & Semiconductor Equipment (-0.3%) | | | | | | | | |
| Acacia Communications, Inc.* | | | 2,500 | | | | 99,850 | |
| Advanced Energy Industries, Inc.* | | | 3,750 | | | | 142,350 | |
| Applied Micro Circuits Corp.* | | | 15,000 | | | | 96,300 | |
| | | | | | | | 338,500 | |
| | | | | | | | | |
| Software (-0.9%) | | | | | | | | |
| ANSYS, Inc.* | | | 12,500 | | | | 1,134,375 | |
| | | | | | | | | |
| Total Securities Sold Short (-4.2%) | | | | | | | | |
| (Proceeds $4,260,729) | | | | | | | | |
| | | | | | | | 4,998,780 | |
| Exchange Traded Funds Sold Short (-0.3%) | | | | | | | | |
| iShares Russell 2000 ETF | | | 2,000 | | | | 229,940 | |
| VanEck Vectors Semiconductor ETF | | | 1,875 | | | | 107,737 | |
| | | | | | | | | |
| Total Exchange Traded Funds Sold Short | | | | | | | | |
| (Proceeds $324,818) | | | | | | | 337,677 | |
| | | | | | | | | |
| Total Securities & Exchange Traded Funds Sold Short (-4.5%) | | | | | | | | |
| (Proceeds $4,585,547) | | | | | | $ | 5,336,457 | |
| * | Non-income producing security. |
See accompanying notes to financial statements.
Ne
edham Aggressive Growth Fund
Schedule of Investments
June 30, 2016 (Unaudited)
| | | Shares | | | Market Value | |
| Common Stocks (99.6%) | | | | | | |
| | | | | | | |
| Biotechnology (3.9%) | | | | | | |
| Gilead Sciences, Inc.† | | | 23,000 | | | $ | 1,918,660 | |
| | | | | | | | | |
| Capital Markets (1.3%) | | | | | | | | |
| Financial Engines, Inc. | | | 25,000 | | | | 646,750 | |
| | | | | | | | | |
| Commercial Services & Supplies (0.3%) | | | | | | | | |
| Clean Harbors, Inc.* | | | 2,400 | | | | 125,064 | |
| | | | | | | | | |
| Communications Equipment (8.7%) | | | | | | | | |
| KVH Industries, Inc.* | | | 313,100 | | | | 2,410,870 | |
| Norsat International, Inc.* | | | 67,500 | | | | 454,275 | |
| ViaSat, Inc.*† | | | 19,500 | | | | 1,392,300 | |
| | | | | | | | 4,257,445 | |
| | | | | | | | | |
| Diversified Financial Services (0.1%) | | | | | | | | |
| TheStreet, Inc. | | | 45,000 | | | | 50,850 | |
| | | | | | | | | |
| Electrical Equipment (1.5%) | | | | | | | | |
| Vicor Corp.* | | | 72,500 | | | | 730,075 | |
| | | | | | | | | |
| Electronic Equipment, Instruments & Components (4.7%) | | | | | | | | |
| FEI Co.† | | | 6,000 | | | | 641,280 | |
| FLIR Systems, Inc. | | | 8,500 | | | | 263,075 | |
| Frequency Electronics, Inc.* | | | 43,619 | | | | 405,657 | |
| IPG Photonics Corp.* | | | 7,500 | | | | 600,000 | |
| National Instruments Corp. | | | 9,700 | | | | 265,780 | |
| Vishay Precision Group, Inc.* | | | 10,000 | | | | 134,200 | |
| | | | | | | | 2,309,992 | |
| | | | | | | | | |
| Energy Equipment & Services (0.4%) | | | | | | | | |
| Aspen Aerogels, Inc.* | | | 35,200 | | | | 174,944 | |
| | | | | | | | | |
| Health Care Equipment & Supplies (3.3%) | | | | | | | | |
| Analogic Corp. | | | 5,750 | | | | 456,780 | |
| Becton Dickinson and Co. | | | 4,500 | | | | 763,155 | |
| LeMaitre Vascular, Inc. | | | 28,000 | | | | 399,560 | |
| | | | | | | | 1,619,495 | |
| | | | | | | | | |
| Health Care Providers & Services (1.3%) | | | | | | | | |
| Civitas Solutions, Inc.* | | | 7,500 | | | | 156,225 | |
| Express Scripts Holding Co.* | | | 6,000 | | | | 454,800 | |
| | | | | | | | 611,025 | |
| | | | | | | | | |
| Health Care Technology (0.9%) | | | | | | | | |
| Omnicell, Inc.* | | | 13,000 | | | | 444,990 | |
| | | | | | | | | |
| Household Durables (0.3%) | | | | | | | | |
| iRobot Corp.* | | | 4,000 | | | | 140,320 | |
| Household Products (1.9%) | | | | | | |
| Oil-Dri Corp. of America | | | 26,268 | | | | 907,034 | |
| | | | | | | | | |
| Internet Software & Services (16.6%) | | | | | | | | |
| Akamai Technologies, Inc.*† | | | 66,000 | | | | 3,691,380 | |
| Amber Road, Inc.* | | | 172,800 | | | | 1,332,288 | |
| ARI Network Services, Inc.* | | | 15,000 | | | | 63,000 | |
| ChannelAdvisor Corp.* | | | 14,117 | | | | 204,555 | |
| comScore, Inc.* | | | 3,000 | | | | 71,640 | |
| Q2 Holdings, Inc.* | | | 12,500 | | | | 350,250 | |
| Reis, Inc.† | | | 96,500 | | | | 2,402,850 | |
| | | | | | | | 8,115,963 | |
| | | | | | | | | |
| Media (0.2%) | | | | | | | | |
| World Wrestling Entertainment, Inc. | | | 6,000 | | | | 110,460 | |
| | | | | | | | | |
| Oil, Gas & Consumable Fuels (0.1%) | | | | | | | | |
| Hess Corp. | | | 500 | | | | 30,050 | |
| | | | | | | | | |
| Pharmaceuticals (0.3%) | | | | | | | | |
| Corium International, Inc.* | | | 46,050 | | | | 159,794 | |
| | | | | | | | | |
| Professional Services (4.1%) | | | | | | | | |
| CRA International, Inc.* | | | 13,500 | | | | 340,470 | |
| WageWorks, Inc.*† | | | 28,000 | | | | 1,674,680 | |
| | | | | | | | 2,015,150 | |
| | | | | | | | | |
| Real Estate Investment Trusts (REITs) (2.9%) | | | | | | | | |
| Equinix, Inc. | | | 3,593 | | | | 1,393,114 | |
| | | | | | | | | |
| Semiconductors & Semiconductor Equipment (26.3%) | | | | | | | | |
| Entegris, Inc.* | | | 200,000 | | | | 2,894,000 | |
| FormFactor, Inc.* | | | 335,000 | | | | 3,011,650 | |
| MKS Instruments, Inc. | | | 27,000 | | | | 1,162,620 | |
| Nova Measuring Instruments Ltd.* | | | 94,900 | | | | 1,038,206 | |
| PDF Solutions, Inc.*† | | | 257,500 | | | | 3,602,425 | |
| Photronics, Inc.* | | | 97,500 | | | | 868,725 | |
| Ultra Clean Holdings, Inc.* | | | 31,425 | | | | 178,808 | |
| Xcerra Corp.* | | | 10,000 | | | | 57,500 | |
| | | | | | | | 12,813,934 | |
| | | | | | | | | |
| Software (5.1%) | | | | | | | | |
| Bottomline Technologies, Inc.* | | | 22,000 | | | | 473,660 | |
| Exa Corp.* | | | 5,000 | | | | 72,250 | |
| GSE Systems, Inc.* | | | 875,000 | | | | 1,951,250 | |
| | | | | | | | 2,497,160 | |
| | | | | | | | | |
| Specialty Retail (3.2%) | | | | | | | | |
| CarMax, Inc.*† | | | 22,500 | | | | 1,103,175 | |
| Dick’s Sporting Goods, Inc. | | | 10,000 | | | | 450,600 | |
| | | | | | | | 1,553,775 | |
See accompanying notes to financial statements.
Needham Aggressive Growth Fund
Schedule of Investments (Continued)
June 30, 2016 (Unaudited)
| | | Shares | | | Market Value | |
| Common Stocks - Continued | | | | | | |
| | | | | | | |
| Technology Hardware, Storage & Peripherals (11.8%) | | | | | | |
| Apple, Inc.† | | | 23,750 | | | $ | 2,270,500 | |
| Electronics For Imaging, Inc.* | | | 16,000 | | | | 688,640 | |
| Hutchinson Technology, Inc.* | | | 162,500 | | | | 550,875 | |
| Silicon Graphics International Corp.* | | | 25,075 | | | | 126,127 | |
| Super Micro Computer, Inc.*† | | | 85,500 | | | | 2,124,675 | |
| | | | | | | | 5,760,817 | |
| | | | | | | | | |
| Thrifts & Mortgage Finance (0.4%) | | | | | | | | |
| Ladder Capital Corp. | | | 16,783 | | | | 204,753 | |
| | | | | | | | | |
Total Common Stocks
(Cost $26,784,990) | | | | | | $ | 48,591,614 | |
| Short-Term Investments (0.0%) | | | | | | |
| | | | | | | |
| Money Market Fund (0.0%) | | | | | | |
| Dreyfus Treasury Securities Cash Management – Institutional Class 0.16%(a) (Cost $1,687) | | | 1,687 | | | | 1,687 | |
| | | | | | | | | |
Total Investments (99.6%)
(Cost $26,786,677) | | | | | | | 48,593,301 | |
Total Securities Sold Short (-7.3%)
(Proceeds $3,046,647) | | | | | | | (3,578,915 | ) |
| Other Assets in Excess of Liabilities (7.7%) | | | | | | | 3,789,645 | |
| Net Assets (100.0%) | | | | | | $ | 48,804,031 | |
| * | Non-income producing security. |
| (a) | Rate shown is the seven day yield as of June 30, 2016. |
| † | Security position is either entirely or partially held in a segregated account as collateral for securities sold short, aggregating a total market value of $3,772,700. |
The Global Industry Classification Standard (GICS®) was developed by and/or is the exclusive property of MSCI, Inc. and Standard & Poor’s Financial Services LLC (‘‘S&P’’). GICS is a service mark of MSCI and S&P and has been licensed for use by U.S. Bancorp Fund Services, LLC.
See accompanying notes to financial statements.
N
eedham Aggressive Growth Fund
Schedule of Securities Sold Short
June 30, 2016 (Unaudited)
| | | Shares | | | Market Value | |
| Securities Sold Short (-7.3%) | | | | | | |
| | | | | | | |
| Capital Markets (-1.8%) | | | | | | |
| Medallion Financial Corp. | | | 123,000 | | | $ | 907,740 | |
| | | | | | | | | |
| Communications Equipment (-3.7%) | | | | | | | | |
| Ubiquiti Networks, Inc.* | | | 46,250 | | | | 1,788,025 | |
| | | | | | | | | |
| Semiconductors & Semiconductor Equipment (-0.4%) | | | | | | | | |
| Acacia Communications, Inc.* | | | 2,500 | | | | 99,850 | |
| Applied Micro Circuits Corp.* | | | 15,000 | | | | 96,300 | |
| | | | | | | | 196,150 | |
| | | | | | | | | |
| Software (-0.8%) | | | | | | | | |
| ANSYS, Inc.* | | | 4,500 | | | | 408,375 | |
| | | | | | | | | |
| Thrifts & Mortgage Finance (-0.6%) | | | | | | | | |
| Federal Home Loan Mortgage Corp.* | | | 142,500 | | | | 263,625 | |
| Federal National Mortgage Association* | | | 7,500 | | | | 15,000 | |
| | | | | | | | 278,625 | |
| | | | | | | | | |
Total Securities Sold Short (-7.3%)
(Proceeds $3,046,647) | | | | | | $ | 3,578,915 | |
| * | Non-income producing security. |
See accompanying notes to financial statements.
Ne
edham Small Cap Growth Fund
Schedule of Investments
June 30, 2016 (Unaudited)
| | | Shares | | | Market Value | |
| Common Stocks (62.8%) | | | | | | |
| | | | | | | |
| Capital Markets (0.5%) | | | | | | |
| Financial Engines, Inc. | | | 5,000 | | | $ | 129,350 | |
| | | | | | | | | |
| Communications Equipment (3.7%) | | | | | | | | |
| KVH Industries, Inc.* | | | 121,950 | | | | 939,015 | |
| | | | | | | | | |
| Diversified Financial Services (1.3%) | | | | | | | | |
| TheStreet, Inc. | | | 300,000 | | | | 339,000 | |
| | | | | | | | | |
| Electrical Equipment (0.7%) | | | | | | | | |
| Generac Holdings, Inc.* | | | 5,000 | | | | 174,800 | |
| | | | | | | | | |
| Electronic Equipment, Instruments & Components (10.5%) | | | | | | | | |
| Frequency Electronics, Inc.* | | | 105,000 | | | | 976,500 | |
| Jabil Circuit, Inc. | | | 7,500 | | | | 138,525 | |
| National Instruments Corp. | | | 4,700 | | | | 128,780 | |
| TTM Technologies, Inc.* | | | 188,000 | | | | 1,415,640 | |
| | | | | | | | 2,659,445 | |
| | | | | | | | | |
| Energy Equipment & Services (0.1%) | | | | | | | | |
| Aspen Aerogels, Inc.* | | | 5,000 | | | | 24,850 | |
| | | | | | | | | |
| Health Care Providers & Services (0.9%) | | | | | | | | |
| Express Scripts Holding Co.* | | | 2,900 | | | | 219,820 | |
| | | | | | | | | |
| Health Care Technology (1.2%) | | | | | | | | |
| Castlight Health, Inc.* | | | 25,000 | | | | 99,000 | |
| Omnicell, Inc.* | | | 6,000 | | | | 205,380 | |
| | | | | | | | 304,380 | |
| | | | | | | | | |
| Internet Software & Services (10.0%) | | | | | | | | |
| Akamai Technologies, Inc.* | | | 1,000 | | | | 55,930 | |
| Amber Road, Inc.* | | | 235,000 | | | | 1,811,850 | |
| Hortonworks, Inc.* | | | 2,500 | | | | 26,725 | |
| Reis, Inc.† | | | 23,000 | | | | 572,700 | |
| YUME, Inc.* | | | 20,000 | | | | 73,600 | |
| | | | | | | | 2,540,805 | |
| | | | | | | | | |
| Oil, Gas & Consumable Fuels (1.1%) | | | | | | | | |
| Hess Corp. | | | 4,750 | | | | 285,475 | |
| | | | | | | | | |
| Pharmaceuticals (0.1%) | | | | | | | | |
| Corium International, Inc.* | | | 5,000 | | | | 17,350 | |
| | | | | | | | | |
| Semiconductors & Semiconductor Equipment (19.8%) | | | | | | | | |
| Cohu, Inc. | | | 5,000 | | | | 54,250 | |
| Entegris, Inc.*† | | | 11,000 | | | | 159,170 | |
| FormFactor, Inc.* | | | 120,000 | | | | 1,078,800 | |
| MKS Instruments, Inc.† | | | 12,500 | | | | 538,250 | |
| PDF Solutions, Inc.*† | | | 90,000 | | | | 1,259,100 | |
| Photronics, Inc.* | | | 15,000 | | | | 133,650 | |
| Ultra Clean Holdings, Inc.* | | | 317,575 | | | | 1,807,002 | |
| | | | | | | | 5,030,222 | |
| | | | | | | | | |
| Software (0.6%) | | | | | | | | |
| Barracuda Networks, Inc.* | | | 10,000 | | | | 151,400 | |
| | | | | | | | | |
| Technology Hardware, Storage & Peripherals (10.1%) | | | | | | | | |
| Hutchinson Technology, Inc.* | | | 137,500 | | | | 466,125 | |
| Silicon Graphics International Corp.* | | | 258,119 | | | | 1,298,338 | |
| Super Micro Computer, Inc.*† | | | 32,500 | | | | 807,625 | |
| | | | | | | | 2,572,088 | |
| | | | | | | | | |
| Thrifts & Mortgage Finance (0.2%) | | | | | | | | |
| LendingTree, Inc.* | | | 500 | | | | 44,165 | |
| | | | | | | | | |
| Trading Companies & Distributors (2.1%) | | | | | | | | |
| Air Lease Corp.† | | | 20,000 | | | | 535,600 | |
| | | | | | | | | |
Total Common Stocks
(Cost $15,410,122) | | | | | | $ | 15,967,765 | |
| | | | | | | | | |
| Closed-End Funds (0.2%) | | | | | | | | |
| Tekla Healthcare Investors | | | 1,000 | | | | 23,420 | |
| Tekla Life Sciences Investors | | | 1,500 | | | | 25,785 | |
| | | | | | | | 49,205 | |
| | | | | | | | |
Total Closed-End Funds
(Cost $48,852) | | | | | | $ | 49,205 | |
| | | | | | | | | |
| Short-Term Investments (39.3%) | | | | | | | | |
| | | | | | | | | |
| Money Market Fund (39.3%) | | | | | | | | |
| Dreyfus Treasury Securities Cash Management – Institutional Class 0.16%(a) (Cost $10,004,695) | | | 10,004,695 | | | | 10,004,695 | |
| | | | | | | | | |
| | | | | | | | |
Total Investments (102.3%)
(Cost $25,463,669) | | | | | | | 26,021,665 | |
Total Securities Sold Short (-6.8%)
(Proceeds $1,615,444) | | | | | | | (1,720,465 | ) |
| Other Assets in Excess of Liabilities (4.5%) | | | | | | | 1,143,513 | |
| Net Assets (100.0%) | | | | | | $ | 25,444,713 | |
| * | Non-income producing security. |
| (a) | Rate shown is the seven day yield as of June 30, 2016. |
| † | Security position is either entirely or partially held in a segregated account as collateral for securities sold short, aggregating a total market value of $1,082,175. |
The Global Industry Classification Standard (GICS®) was developed by and/or is the exclusive property of MSCI, Inc. and Standard & Poor’s Financial Services LLC (‘‘S&P’’). GICS is a service mark of MSCI and S&P and has been licensed for use by U.S. Bancorp Fund Services, LLC.
See accompanying notes to financial statements.
Needham Small Cap Growth Fund
Sc
hedule of Securities Sold Short
June 30, 2016 (Unaudited)
| | | Shares | | | Market Value | |
| Securities Sold Short (-0.8%) | | | | | | |
| | | | | | | |
| Communications Equipment (-0.2%) | | | | | | |
| Ubiquiti Networks, Inc.* | | | 1,500 | | | $ | 57,990 | |
| | | | | | | | | |
| Semiconductors & Semiconductor Equipment (-0.6%) | | | | | | | | |
| Advanced Energy Industries, Inc.* | | | 3,750 | | | | 142,350 | |
| | | | | | | | | |
Total Securities Sold Short (-0.8%)
(Proceeds $167,386) | | | | | | | 200,340 | |
| | | | | | | | | |
| Exchange Traded Funds Sold Short (-6.0%) | | | | | | | | |
| iShares Russell 2000 ETF | | | 3,000 | | | | 344,910 | |
| iShares Russell 2000 Growth ETF | | | 3,000 | | | | 411,540 | |
| iShares Russell 2000 Value ETF | | | 2,000 | | | | 194,600 | |
| iShares Micro-Cap ETF | | | 5,000 | | | | 353,600 | |
| VanEck Vectors Semiconductor ETF | | | 3,750 | | | | 215,475 | |
| | | | | | | | | |
Total Exchange Traded Funds Sold Short (-6.0%)
(Proceeds $1,448,058) | | | | | | | 1,520,125 | |
| | | | | | | | | |
Total Securities and Exchange Traded Funds Sold Short (-6.8%)
(Proceeds $1,615,444) | | | | | | $ | 1,720,465 | |
| * | Non-income producing security. |
See accompanying notes to financial statements.
Statements of Assets and Liabilities
June 30, 2016 (Unaudited)
| | | | | | | | | | | |
| | | Needham
Growth Fund | | Needham
Aggressive
Growth Fund | | Needham
Small Cap
Growth Fund | |
| Assets | | | | | | | | | | |
Investments, at Value
(Cost $59,391,747, $26,786,677, $25,463,669) | | $ | 117,402,306 | | $ | 48,593,301 | | $ | 26,021,665 | |
| Cash | | | — | | | — | | | 490 | |
| Receivables: | | | | | | | | | | |
| Deposit with Broker for Securities Sold Short | | | 5,310,756 | | | 3,498,426 | | | 1,441,412 | |
| Dividends and Interest | | | 40,337 | | | 6,414 | | | 3,561 | |
| Fund Shares Sold | | | 354 | | | 10,979 | | | 6,037 | |
| Investment Securities Sold | | | 205,213 | | | 504,928 | | | 391,224 | |
| Prepaid Expenses | | | 20,053 | | | 11,718 | | | 19,145 | |
| Total Assets | | | 122,979,019 | | | 52,625,766 | | | 27,883,534 | |
| | | | | | | | | | | |
| Liabilities | | | | | | | | | | |
Securities Sold Short, at Value
(Proceeds $4,585,547, $3,046,647, $1,615,444) | | | 5,336,457 | | | 3,578,915 | | | 1,720,465 | |
| Payables: | | | | | | | | | | |
| Investment Securities Purchased | | | 1,099 | | | 71,551 | | | 571,375 | |
| Fund Shares Redeemed | | | 91,665 | | | 46,727 | | | 79,992 | |
| Due to Adviser | | | 120,233 | | | 49,353 | | | 20,121 | |
| Distribution Fees | | | 24,490 | | | 10,202 | | | 5,374 | |
| Administration and Accounting Fees | | | 36,699 | | | 16,412 | | | 8,940 | |
| Transfer Agent Fees | | | 14,621 | | | 10,606 | | | 10,094 | |
| Directors’ Fees | | | 2,557 | | | 2,447 | | | 560 | |
| Accrued Expenses and Other Liabilities | | | 57,608 | | | 35,522 | | | 21,900 | |
| Total Liabilities | | | 5,685,429 | | | 3,821,735 | | | 2,438,821 | |
| | | | | | | | | | | |
| Net Assets | | $ | 117,293,590 | | $ | 48,804,031 | | $ | 25,444,713 | |
Shares Issued and Outstanding $0.001 Par Value
(Authorized 800,000,000,100,000,000 and 100,000,000 respectively) | | | 2,838,761 | | | 2,460,418 | | | 1,886,721 | |
Net Asset Value, Offering and Redemption Price Per Share(a) | | $ | 41.32 | | $ | 19.84 | | $ | 13.49 | |
| | | | | | | | | | | |
| Components of Net Assets | | | | | | | | | | |
| Paid-in Capital | | | 53,090,618 | | | 25,546,715 | | | 24,158,256 | |
| Accumulated Net Investment Loss | | | (807,878 | ) | | (497,651 | ) | | (211,199 | ) |
| Accumulated Net Realized Gain from Investments, Securities Sold Short, Foreign Currency Transactions and Currency | | | 7,751,201 | | | 2,480,611 | | | 1,044,681 | |
| Net Unrealized Appreciation on Investment Securities and Securities Sold Short | | | 57,259,649 | | | 21,274,356 | | | 452,975 | |
| Total Net Assets | | $ | 117,293,590 | | $ | 48,804,031 | | $ | 25,444,713 | |
| (a) | Subject to certain exceptions, a 2% redemption fee is imposed upon shares redeemed within 60 days of their purchase. See Note 2 of the notes to financial statements. |
See accompanying notes to financial statements.
For the six months ended June 30, 2016 (Unaudited)
| | | | | | | | | | | |
| | | Needham
Growth Fund | | Needham
Aggressive
Growth Fund | | Needham
Small Cap
Growth Fund | |
| Investment Income | | | | | | | | | | |
| Dividends | | $ | 511,243 | | $ | 210,836 | | $ | 27,409 | |
| Interest | | | 2,989 | | | 224 | | | 4,686 | |
| Total Investment Income | | | 514,232 | | | 211,060 | | | 32,095 | |
| | | | | | | | | | | |
| Expenses | | | | | | | | | | |
| Investment Advisory Fees | | | 733,381 | | | 299,885 | | | 149,869 | |
| Distribution Fees | | | 146,676 | | | 59,977 | | | 29,974 | |
| Administration and Accounting Fees | | | 72,552 | | | 32,061 | | | 17,057 | |
| Audit Fees | | | 21,467 | | | 16,922 | | | 13,792 | |
| Chief Compliance Officer Fees | | | 11,579 | | | 4,723 | | | 2,345 | |
| Custodian Fees | | | 4,309 | | | 3,567 | | | 3,517 | |
| Directors’ Fees | | | 12,696 | | | 5,584 | | | 2,497 | |
Dividend Expense(1) | | | 57,500 | | | 61,500 | | | 1,766 | |
| Filing Fees | | | 10,297 | | | 11,112 | | | 9,735 | |
Interest Expense(1) | | | 185,939 | | | 178,538 | | | 7,317 | |
| Legal Fees | | | 20,283 | | | 8,171 | | | 3,984 | |
| Printing Fees | | | 8,427 | | | 5,719 | | | 3,988 | |
| Transfer Agent Fees | | | 29,891 | | | 21,470 | | | 19,851 | |
| Other Expenses | | | 14,736 | | | 9,265 | | | 7,869 | |
| Total Expenses | | | 1,329,733 | | | 718,494 | | | 273,561 | |
| Fees Waived by Investment Adviser | | | — | | | (9,783 | ) | | (30,267 | ) |
| Net Expenses | | | 1,329,733 | | | 708,711 | | | 243,294 | |
| Net Investment Loss | | | (815,501 | ) | | (497,651 | ) | | (211,199 | ) |
| | | | | | | | | | | |
| Net Realized/Unrealized Gain (Loss) from Investments and Securities Sold Short | | | | | | | | | | |
| Net Realized Gain from Investments | | | 4,418,097 | | | 2,603,237 | | | 1,130,523 | |
| Net Realized Gain (Loss) from Securities Sold Short | | | (28,070 | ) | | (74,051 | ) | | 28,095 | |
| Change in Unrealized Appreciation (Depreciation) on Investments and Securities Sold Short | | | (2,853,769 | ) | | (1,437,780 | ) | | 954,744 | |
| Net Realized/Unrealized Gain from Investments and Securities Sold Short | | | 1,536,258 | | | 1,091,406 | | | 2,113,362 | |
| Change in Net Assets Resulting from Operations | | $ | 720,757 | | $ | 593,755 | | $ | 1,902,163 | |
| (1) | Expense related to securities sold short. |
See accompanying notes to financial statements.
Statements of Changes in Net Assets
| | | | | | | | | | | | | | | | | | | | | | |
| | | Needham Growth Fund | | | Needham Aggressive
Growth Fund | | | Needham Small Cap
Growth Fund | |
| | | Six Months
Ended June 30,
2016 | | Year Ended
December 31,
2015 | | | Six Months
Ended June 30,
2016 | | Year Ended
December 31,
2015 | | | Six Months
Ended June 30,
2016 | | Year Ended
December 31,
2015 | |
| | | (Unaudited) | | | | | (Unaudited) | | | | | (Unaudited) | | | |
| Change in Net Assets | | | | | | | | | | | | | | | | | | | | | |
| Operations: | | | | | | | | | | | | �� | | | | | | | | | |
| Net Investment Loss | | $ | (815,501 | ) | $ | (2,097,678 | ) | | $ | (497,651 | ) | $ | (1,016,187 | ) | | $ | (211,199 | ) | $ | (456,897 | ) |
| Net Realized Gain from Investments, Securities Sold Short, Foreign Currency Transactions, and Currency | | | 4,390,027 | | | 8,475,547 | | | | 2,529,186 | | | 5,622,283 | | | | 1,158,618 | | | 1,472,214 | |
| Net Change in Unrealized Appreciation (Depreciation) on Investments, Securities Sold Short, Foreign Currency Transactions and Currency | | | (2,853,769 | ) | | (13,415,509 | ) | | | (1,437,780 | ) | | (8,806,498 | ) | | | 954,744 | | | (3,436,493 | ) |
| Change in Net Assets Resulting from Operations | | | 720,757 | | | (7,037,640 | ) | | | 593,755 | | | (4,200,402 | ) | | | 1,902,163 | | | (2,421,176 | ) |
| | | | | | | | | | | | | | | | | | | | | | |
| Distributions to Shareholders from: | | | | | | | | | | | | | | | | | | | | | |
| Net Investment Income | | | — | | | — | | | | — | | | — | | | | — | | | — | |
| Capital Gains | | | — | | | (8,209,695 | ) | | | — | | | (5,612,688 | ) | | | — | | | (606,909 | ) |
| Total Distributions to Shareholders | | | — | | | (8,209,695 | ) | | | — | | | (5,612,688 | ) | | | — | | | (606,909 | ) |
| | | | | | | | | | | | | | | | | | | | | | |
| Capital Transactions: | | | | | | | | | | | | | | | | | | | | | |
| Shares Issued | | | 2,176,586 | | | 5,600,757 | | | | 989,051 | | | 4,292,138 | | | | 2,781,211 | | | 2,202,629 | |
| Shares Issued in Reinvestment of Distribution | | | — | | | 7,775,634 | | | | — | | | 5,457,811 | | | | — | | | 566,101 | |
| Shares Redeemed | | | (12,758,671 | ) | | (18,794,360 | ) | | | (3,684,808 | ) | | (11,385,924 | ) | | | (2,713,559 | ) | | (8,383,898 | ) |
| Redemption Fees | | | 556 | | | 3,397 | | | | 390 | | | 1,539 | | | | 1,579 | | | 120 | |
| Change in Net Assets from Capital Transactions | | | (10,581,529 | ) | | (5,414,572 | ) | | | (2,695,367 | ) | | (1,634,436 | ) | | | 69,231 | | | (5,615,048 | ) |
| | | | | | | | | | | | | | | | | | | | | | |
| Change in Net Assets | | | (9,860,772 | ) | | (20,661,907 | ) | | | (2,101,612 | ) | | (11,447,526 | ) | | | 1,971,394 | | | (8,643,133 | ) |
| | | | | | | | | | | | | | | | | | | | | | |
| Net Assets | | | | | | | | | | | | | | | | | | | | | |
| Beginning of Period | | | 127,154,362 | | | 147,816,269 | | | | 50,905,643 | | | 62,353,169 | | | | 23,473,319 | | | 32,116,452 | |
| End of Period | | $ | 117,293,590 | | $ | 127,154,362 | | | $ | 48,804,031 | | $ | 50,905,643 | | | $ | 25,444,713 | | $ | 23,473,319 | |
| Accumulated Net Investment Loss | | $ | (807,878 | ) | $ | 7,623 | | | $ | (497,651 | ) | $ | — | | | $ | (211,199 | ) | $ | (1,008,829 | ) |
| | | | | | | | | | | | | | | | | | | | | | |
| Share Transaction: | | | | | | | | | | | | | | | | | | | | | |
| Number of Shares Issued | | | 55,191 | | | 125,623 | | | | 51,585 | | | 185,078 | | | | 212,530 | | | 158,817 | |
| Number of Shares Reinvested | | | — | | | 186,109 | | | | — | | | 279,744 | | | | — | | | 45,617 | |
| Number of Shares Redeemed | | | (320,626 | ) | | (420,680 | ) | | | (193,971 | ) | | (509,153 | ) | | | (212,276 | ) | | (610,896 | ) |
| Change in Shares | | | (265,435 | ) | | (108,948 | ) | | | (142,386 | ) | | (44,331 | ) | | | 254 | | | (406,462 | ) |
See accompanying notes to financial statements.
Financial Highlights
| | | Six Months | | | | | | | | | | | | | | | | |
| | | Ended | | | | |
| (For a Share Outstanding | | June 30, 2016 | | | Year Ended December 31, | |
| Throughout each Period) | | (Unaudited) | | | 2015 | | | 2014 | | | 2013 | | | 2012 | | | 2011 | |
| Net Asset Value, Beginning of Year | | $ | 40.96 | | | $ | 46.00 | | | $ | 45.06 | | | $ | 33.66 | | | $ | 32.78 | | | $ | 39.11 | |
| Investment Operations | | | | | | | | | | | | | | | | | | | | | | | | |
| Net Investment Income | | | (0.29 | ) | | | (0.68 | ) | | | (0.58 | ) | | | (0.54 | ) | | | (0.24 | ) | | | (0.58 | ) |
| Net Realized and Unrealized Gain (Loss) on Investments | | | 0.65 | | | | (1.60 | ) | | | 4.59 | | | | 12.20 | | | | 4.31 | | | | (3.79 | ) |
| Total from Investment Operations | | | 0.36 | | | | (2.28 | ) | | | 4.01 | | | | 11.66 | | | | 4.07 | | | | (4.37 | ) |
| | | | | | | | | | | | | | | | | | | | | | | | | |
| Less Distributions | | | | | | | | | | | | | | | | | | | | | | | | |
| Net Realized Gains | | | — | | | | (2.76 | ) | | | (3.07 | ) | | | (0.26 | ) | | | (3.19 | ) | | | (1.97 | ) |
| Total Distributions | | | — | | | | (2.76 | ) | | | (3.07 | ) | | | (0.26 | ) | | | (3.19 | ) | | | (1.97 | ) |
| | | | | | | | | | | | | | | | | | | | | | | | | |
| Capital Contributions | | | | | | | | | | | | | | | | | | | | | | | | |
| Redemption Fees | | | — | (a) | | | — | (a) | | | — | (a) | | | — | (a) | | | — | (a) | | | 0.01 | |
| Total Capital Contributions | | | — | (a) | | | — | (a) | | | — | (a) | | | — | (a) | | | — | (a) | | | 0.01 | |
| Net Asset Value, End of Year | | $ | 41.32 | | | $ | 40.96 | | | $ | 46.00 | | | $ | 45.06 | | | $ | 33.66 | | | $ | 32.78 | |
| | | | | | | | | | | | | | | | | | | | | | | | | |
| Total Return | | | 0.88 | %(c) | | | (5.07 | )% | | | 8.98 | % | | | 34.68 | % | | | 12.80 | % | | | (10.94 | )% |
| Net Assets, End of Year (000’s) | | $ | 117,294 | | | $ | 127,154 | | | $ | 147,816 | | | $ | 141,693 | | | $ | 113,561 | | | $ | 125,966 | |
| Ratios/Supplemental Data | | | | | | | | | | | | | | | | | | | | | | | | |
| Ratio of Total Expenses to Average Net Assets | | | 2.27 | %(b) | | | 2.05 | % | | | 1.84 | % | | | 1.89 | % | | | 1.94 | % | | | 1.81 | % |
| Ratio of Total Expenses to Average Net Assets (before interest and dividend expense) | | | 1.85 | %(b) | | | 1.82 | % | | | 1.80 | % | | | 1.82 | % | | | 1.82 | % | | | 1.78 | % |
| Ratio of Total Expenses to Average Net Assets (before waiver and reimbursement of expenses) | | | 2.27 | %(b) | | | 2.05 | % | | | 1.84 | % | | | 1.89 | % | | | 1.94 | % | | | 1.81 | % |
| Ratio of Net Investment Income (Loss) to Average Net Assets | | | (1.39 | )%(b) | | | (1.48 | )% | | | (1.32 | )% | | | (1.30 | )% | | | (0.65 | )% | | | (1.41 | )% |
| Ratio of Net Investment Income (Loss) to Average Net Assets (before waivers and reimbursements of expenses) | | | (1.39 | )%(b) | | | (1.48 | )% | | | (1.32 | )% | | | (1.30 | )% | | | (0.65 | )% | | | (1.41 | )% |
| Portfolio turnover rate | | | 4 | %(c) | | | 13 | % | | | 12 | % | | | 12 | % | | | 17 | % | | | 29 | % |
| (a) | Value is less than $0.005 per share. |
| (b) | Annualized for periods less than one year. |
| (c) | Not annualized for periods less than one year. |
See accompanying notes to financial statements.
N
eedham Aggressive Growth Fund
Financial Highlights
| | | Six Months | | | | | | | | | | | | | | | | |
| | | Ended | | | | |
| (For a Share Outstanding | | June 30, 2016 | | | Year Ended December 31, | |
| Throughout each Period) | | (Unaudited) | | | 2015 | | | 2014 | | | 2013 | | | 2012 | | | 2011 | |
| Net Asset Value, Beginning of Year | | $ | 19.56 | | | $ | 23.55 | | | $ | 22.66 | | | $ | 16.63 | | | $ | 14.52 | | | $ | 17.14 | |
| Investment Operations | | | | | | | | | | | | | | | | | | | | | | | | |
| Net Investment Income | | | (0.20 | ) | | | (0.39 | ) | | | (0.38 | ) | | | (0.37 | ) | | | (0.29 | ) | | | (0.34 | ) |
| Net Realized and Unrealized Gain (Loss) on Investments | | | 0.48 | | | | (1.28 | ) | | | 1.98 | | | | 6.40 | | | | 2.41 | | | | (2.04 | ) |
| Total from Investment Operations | | | 0.28 | | | | (1.67 | ) | | | 1.60 | | | | 6.03 | | | | 2.12 | | | | (2.38 | ) |
| | | | | | | | | | | | | | | | | | | | | | | | | |
| Less Distributions | | | | | | | | | | | | | | | | | | | | | | | | |
| Net Realized Gains | | | — | | | | (2.32 | ) | | | (0.71 | ) | | | — | | | | (0.01 | ) | | | (0.25 | ) |
| Total Distributions | | | — | | | | (2.32 | ) | | | (0.71 | ) | | | — | | | | (0.01 | ) | | | (0.25 | ) |
| | | | | | | | | | | | | | | | | | | | | | | | | |
| Capital Contributions | | | | | | | | | | | | | | | | | | | | | | | | |
| Redemption Fees | | | — | (a) | | | — | (a) | | | — | (a) | | | — | (a) | | | — | (a) | | | 0.01 | |
| Total Capital Contributions | | | — | (a) | | | — | (a) | | | — | (a) | | | — | (a) | | | — | (a) | | | 0.01 | |
| Net Asset Value, End of Year | | $ | 19.84 | | | $ | 19.56 | | | $ | 23.55 | | | $ | 22.66 | | | $ | 16.63 | | | $ | 14.52 | |
| | | | | | | | | | | | | | | | | | | | | | | | | |
| Total Return | | | 1.43 | %(c) | | | (7.05 | )% | | | 7.13 | % | | | 36.26 | % | | | 14.61 | % | | | (13.77 | )% |
| Net Assets, End of Year (000’s) | | $ | 48,804 | | | $ | 50,906 | | | $ | 62,353 | | | $ | 68,470 | | | $ | 66,746 | | | $ | 90,170 | |
| Ratios/Supplemental Data | | | | | | | | | | | | | | | | | | | | | | | | |
| Ratio of Total Expenses to Average Net Assets | | | 2.95 | %(b) | | | 2.41 | % | | | 2.09 | % | | | 2.07 | % | | | 2.06 | % | | | 1.83 | % |
| Ratio of Total Expenses to Average Net Assets (before interest and dividend expense) | | | 1.95 | %(b) | | | 1.93 | % | | | 1.91 | % | | | 1.91 | % | | | 1.89 | % | | | 1.80 | % |
| Ratio of Total Expenses to Average Net Assets (before waiver and reimbursement of expenses) | | | 2.99 | %(b) | | | 2.42 | % | | | 2.09 | % | | | 2.07 | % | | | 2.06 | % | | | 1.83 | % |
| Ratio of Net Investment Income (Loss) to Average Net Assets | | | (2.07 | )%(b) | | | (1.73 | )% | | | (1.60 | )% | | | (1.74 | )% | | | (1.40 | )% | | | (1.62 | )% |
| Ratio of Net Investment Income (Loss) to Average Net Assets (before waivers and reimbursements of expenses) | | | (2.11 | )%(b) | | | (1.74 | )% | | | (1.60 | )% | | | (1.74 | )% | | | (1.40 | )% | | | (1.62 | )% |
| Portfolio turnover rate | | | 7 | %(c) | | | 15 | % | | | 19 | % | | | 20 | % | | | 15 | % | | | 45 | % |
| (a) | Value is less than $0.005 per share. |
| (b) | Annualized for periods less than one year. |
| (c) | Not annualized for periods less than one year. |
See accompanying notes to financial statements.
N
eedham Small Cap Growth Fund
Financial Highlights
| | | Six Months | | | | | | | | | | | | | | | | |
| | | Ended | | | | |
| (For a Share Outstanding | | June 30, 2016 | | | Year Ended December 31, | |
| Throughout each Period) | | (Unaudited) | | | 2015 | | | 2014 | | | 2013 | | | 2012 | | | 2011 | |
| Net Asset Value, Beginning of Year | | $ | 12.44 | | | $ | 14.01 | | | $ | 15.63 | | | $ | 12.22 | | | $ | 11.26 | | | $ | 14.21 | |
| Investment Operations | | | | | | | | | | | | | | | | | | | | | | | | |
| Net Investment Income | | | (0.11 | ) | | | (0.24 | ) | | | (0.24 | ) | | | (0.31 | ) | | | (0.15 | ) | | | (0.27 | ) |
| Net Realized and Unrealized Gain (Loss) on Investments | | | 1.16 | | | | (1.02 | ) | | | 0.32 | | | | 3.72 | | | | 1.11 | | | | (2.04 | ) |
| Total from Investment Operations | | | 1.05 | | | | (1.26 | ) | | | 0.08 | | | | 3.41 | | | | 0.96 | | | | (2.31 | ) |
| | | | | | | | | | | | | | | | | | | | | | | | | |
| Less Distributions | | | | | | | | | | | | | | | | | | | | | | | | |
| Net Realized Gains | | | — | | | | (0.31 | ) | | | (1.70 | ) | | | — | | | | — | | | | (0.62 | ) |
| Return of Capital | | | — | | | | — | | | | — | | | | — | | | | — | | | | (0.02 | ) |
| Total Distributions | | | — | | | | (0.31 | ) | | | (1.70 | ) | | | — | | | | — | | | | (0.64 | ) |
| | | | | | | | | | | | | | | | | | | | | | | | | |
| Capital Contributions | | | | | | | | | | | | | | | | | | | | | | | | |
| Redemption Fees | | | — | (a) | | | — | (a) | | | — | (a) | | | — | (a) | | | — | (a) | | | — | (a) |
| Total Capital Contributions | | | — | (a) | | | — | (a) | | | — | (a) | | | — | (a) | | | — | (a) | | | — | (a) |
| Net Asset Value, End of Year | | $ | 13.49 | | | $ | 12.44 | | | $ | 14.01 | | | $ | 15.63 | | | $ | 12.22 | | | $ | 11.26 | |
| | | | | | | | | | | | | | | | | | | | | | | | | |
| Total Return | | | 8.44 | %(c) | | | (8.96 | )% | | | 0.80 | % | | | 27.91 | % | | | 8.53 | % | | | (16.10 | )% |
| Net Assets, End of Year (000’s) | | $ | 25,445 | | | $ | 23,473 | | | $ | 32,116 | | | $ | 43,950 | | | $ | 60,614 | | | $ | 82,675 | |
| Ratios/Supplemental Data | | | | | | | | | | | | | | | | | | | | | | | | |
| Ratio of Total Expenses to Average Net Assets | | | 2.03 | %(b) | | | 2.05 | % | | | 2.01 | % | | | 2.06 | % | | | 2.04 | % | | | 1.84 | % |
| Ratio of Total Expenses to Average Net Assets (before interest and dividend expense) | | | 1.95 | %(b) | | | 1.95 | % | | | 1.95 | % | | | 1.96 | % | | | 1.92 | % | | | 1.81 | % |
| Ratio of Total Expenses to Average Net Assets (before waiver and reimbursement of expenses) | | | 2.28 | %(b) | | | 2.25 | % | | | 2.11 | % | | | 2.09 | % | | | 2.04 | % | | | 1.84 | % |
| Ratio of Net Investment Income (Loss) to Average Net Assets | | | (1.76 | )%(b) | | | (1.61 | )% | | | (1.49 | )% | | | (1.80 | )% | | | (1.02 | )% | | | (1.57 | )% |
| Ratio of Net Investment Income (Loss) to Average Net Assets (before waivers and reimbursements of expenses) | | | (2.01 | )%(b) | | | (1.81 | )% | | | (1.59 | )% | | | (1.83 | )% | | | (1.02 | )% | | | (1.57 | )% |
| Portfolio turnover rate | | | 19 | %(c) | | | 64 | % | | | 69 | % | | | 58 | % | | | 72 | % | | | 105 | % |
| (a) | Value is less than $0.005 per share. |
| (b) | Annualized for periods less than one year. |
| (c) | Not annualized for periods less than one year. |
See accompanying notes to financial statements.
Notes to Financial Statements (Unaudited)
1. Organization
Needham Growth Fund (“NGF”), Needham Aggressive Growth Fund (“NAGF”) and Needham Small Cap Growth Fund (“NSCGF”) (each, a “Portfolio” and collectively, the “Portfolios”), are portfolios of The Needham Funds, Inc. (the “Company”), which is registered under the Investment Company Act of 1940, as amended (the “1940 Act”), as a diversified, open-end management investment company. The Company was organized as a Maryland corporation on October 12, 1995.
2. Significant Accounting Policies
The following is a summary of significant accounting policies followed by the Company in the preparation of its financial statements. These policies are in conformity with accounting principles generally accepted in the United States of America (“GAAP”).
Security Valuation: Portfolio securities for which market quotations are readily available are stated at the last sale price reported by the principal exchange for the security as of the exchange’s close of business. Securities for which no sale has taken place during the day and securities which are not listed on an exchange are valued at the mean of the highest closing bid and lowest asked prices. Exchange traded options are valued at the last reported sale price on any exchange on which the option is principally traded. If no sales are reported on a particular day, the options will be valued at the mean between the highest closing bid and lowest asked prices across the exchanges where the option is traded. Non-exchange traded options will also be valued at the mean between the last bid and asked quotations. For options where market quotations are not readily available, value will be determined in accordance with the fair value procedures described below. All other securities and assets for which (a) market quotations are not readily available, such as in the case of a market or technical disruption that prevents the normal trading of a security held by a Portfolio, (b) market quotations are believed to be unrepresentative of fair market value, such as in the case of a thinly traded security, or (c) valuation is normally made at the last sale price on a foreign exchange and a significant event occurs after the close of that exchange but before the New York Stock Exchange closes, are valued at their fair value as determined in good faith by the Board of Directors (the “Board”) in accordance with Fair Value Procedures established by the Board. The Company’s Fair Value Procedures are implemented and monitored by a Fair Value Committee (the “Committee”) designated by the Board. When a security is valued in accordance with the Fair Value Procedures, the Committee determines a value after taking into consideration any relevant information that is reasonably available to the Committee. Some of the more common reasons that may necessitate that a security be valued pursuant to these Fair Value Procedures include, but are not limited to: the security’s trading has been halted or suspended; the security has been de-listed from a national exchange; the security’s primary trading market is temporarily closed at a time when under normal conditions it would be open; or the security’s primary pricing source is not able or willing to provide a price. The assets of each Portfolio may also be valued on the basis of valuations provided by a pricing service approved by, or on behalf of, the Board.
Portfolio securities listed or traded on securities exchanges, including American Depositary Receipts (“ADRs”), are valued at the closing price on the exchange or system where the security is principally traded or at the NASDAQ Official Closing Price. If there have been no sales for that day on the exchange or system, a security is valued at the mean of the highest closing bid and lowest asked prices on the exchange or system where the security is principally traded.
The Portfolios did not value any securities in accordance with the Fair Value Procedures as of June 30, 2016.
Investment Transactions: Changes in holdings of portfolio securities for the Portfolios shall be reflected no later than in the first calculation on the first business day following the trade date for purposes of calculating each Portfolio’s daily net asset value per share. However, for financial reporting purposes, portfolio security transactions are reported on the trade date of the last business day of the reporting period. The cost (proceeds) of investments sold (bought to cover) is determined on a specific identification basis for the purpose of determining gains or losses on sales and buys to cover short positions. Dividend income, distributions to shareholders and dividend expense from securities sold short are recorded on the ex-dividend date. Interest income and interest expense from securities sold short is recorded on an accrual basis.
Foreign Currency: Foreign currency amounts are translated into U.S. dollars as follows: (i) assets and liabilities at the rate of exchange at the end of the respective period; and (ii) purchases and sales of securities and income and expenses at the rate of exchange prevailing on the dates of such transactions. The portion of realized gains arising from changes in the exchange rates are included with the net realized and unrealized gain or loss on investments. Principal risks associated with such transactions include the movement in value of the foreign currency relative to the U.S. dollar and the ability of the counterparty to perform.
Notes to Financial Statements (Unaudited) (Continued)
The Portfolios may also invest in forward currency contracts. Fluctuations in the value of such forward currency transactions are recorded daily as unrealized gain or loss; realized gain or loss includes net gain or loss on transactions that have terminated by settlement. These instruments involve securities and currency market risk, credit risk, or both kinds of risks, in excess of the amount recognized in the statements of assets and liabilities. Risks also arise from the possible inability of counterparties to meet the terms of their contracts. The Portfolios did not enter into forward currency contracts during the six months ended June 30, 2016.
Allocation of Expenses: Expenses directly attributable to a Portfolio are charged directly to that Portfolio, while expenses which are attributable to more than one Portfolio are allocated among the respective Portfolios based upon relative net assets or some other reasonable method.
Use of Estimates: The preparation of financial statements in accordance with GAAP requires management to make estimates and assumptions that affect the reported amounts and disclosures in the financial statements. Actual results could differ from those estimates and those differences could be material.
Distributions to Shareholders: Dividends from net investment income, if any, are declared and paid annually for the Portfolios. Distributable net realized gains, if any, are declared and distributed at least annually.
Redemption Fees: The Portfolios reserve the right to assess a redemption fee for shares held 60 days or less. The shareholder will be charged a fee equal to 2.00% of the value of the shares redeemed. The redemption fee is intended to offset excess brokerage commissions and other costs associated with fluctuations in asset levels and cash flows caused by frequent trading by shareholders. The applicability of the redemption fee will be calculated using a first-in first-out method, which means the oldest shares, will be redeemed first, followed by the redemption of more recently acquired shares. For the six months ended June 30, 2016, NGF, NAGF and NSCGF had contributions to capital due to redemption fees in the amounts of $556, $390 and $1,579, respectively.
Federal Income Taxes: It is the policy of each Portfolio to continue to qualify as a regulated investment company, as defined in the Internal Revenue Code, by complying with the provisions available to certain investment companies and to make distributions of net investment income and net realized capital gains sufficient to relieve it from all, or substantially all, federal income taxes. Accordingly, no provision for income taxes has been made in the Portfolios’ financial statements.
As of June 30, 2016, the Portfolios did not have any tax positions that did not meet the “more-likely-than-not” threshold of being sustained by the applicable tax authority. Open tax years are those that are open for exam by Federal and state taxing authorities. As of June 30, 2016, open Federal tax years include the tax years ended December 31, 2012 through December 31, 2015, open New York tax years include the tax years ended December 31, 2012 through December 31, 2015. The Portfolios have no tax examinations in progress.
Fair Value Measurements: Valuation inputs used to determine the value of the Portfolios’ investments are summarized in the three broad levels listed below:
| Level 1 — | quoted prices in active markets for identical assets. |
| Level 2 — | other significant inputs (including quoted prices of similar securities, interest rates, prepayment speeds, credit risk, etc.). |
| Level 3 — | significant unobservable inputs (which may include the Portfolios’ own assumptions in determining the fair value of investments). |
The inputs or methodology used to value securities are not necessarily an indication of the risk associated with investing in those securities.
Portfolio securities listed or traded on securities exchanges, including ADRs, are valued at the closing price on the exchange or system where the security is principally traded or at the NASDAQ Official Closing Price. If there have been no sales for that day on the exchange or system, a security is valued at the mean of the highest closing bid and lowest asked prices on the exchange or system where the security is principally traded. These valuations are typically categorized as Level 1 in the fair value hierarchy.
In accordance with procedures adopted by the Board, fair value pricing may be used if events materially affecting the value of foreign securities occur between the time the exchange on which they are traded closes and the time the Portfolios’ net asset values are calculated. These valuations are categorized as Level 2 in the fair value hierarchy. As of June 30, 2016, the Portfolios did not hold any Level 2 or Level 3 securities.
Notes to Financial Statements (Unaudited) (Continued)
The following is a summary categorization, as of June 30, 2016, of each Portfolio’s investments based on the level of inputs utilized in determining the value of such investments:
| | | LEVEL 1 – Quoted Prices(1)(3) | |
| | | NGF | | | NAGF | | | NSCGF | |
| Assets | | | | | | | | | |
Common Stocks(2) | | $ | 113,087,651 | | | $ | 48,591,614 | | | $ | 15,967,765 | |
| Closed-End Funds | | | — | | | | — | | | | 49,205 | |
| Short-Term Investments | | | 4,314,655 | | | | 1,687 | | | | 10,004,695 | |
| Liabilities | | | | | | | | | | | | |
Securities Sold Short(2) | | | (5,336,457 | ) | | | (3,578,915 | ) | | | (1,720,465 | ) |
| Total | | $ | 112,065,849 | | | $ | 45,014,386 | | | $ | 24,301,200 | |
(1) | As of June 30, 2016, the Portfolios did not hold Level 2 or Level 3 investments. |
(2) | Please refer to the Schedule of Investments and Schedule of Securities Sold Short to view segregation by industry. |
(3) | There were no transfers into or out of Levels 1, 2 or 3 during the period. |
3. Investment Advisory and Administrative Services
The Company has engaged Needham Investment Management L.L.C. (the “Adviser”) to manage its investments pursuant to an Investment Advisory Agreement. The Company pays the Adviser a fee at the annual rate of 1.25% of the average daily net assets of each Portfolio.
The Adviser has entered into an agreement with the Company (the “Expense Limitation Agreement”) whereby the Adviser has contractually agreed to waive its management fee for, and to reimburse expenses of, NGF, NAGF and NSCGF in an amount that limits annual operating expenses to not more than 1.95% of the average daily net assets of the relevant Portfolio (excluding taxes, interest, brokerage, dividends on short positions, acquired fund fees and expenses and extraordinary items, and excluding shareholder redemption fees but including the management fee stated in the Investment Advisory Agreement). The agreement is effective for the period from May 1, 2016 through April 30, 2017. The agreement shall continue in effect from year to year thereafter only upon mutual agreement of the Company and the Adviser.
Any reimbursements or fee waivers made by the Adviser in respect of a Portfolio are subject to recoupment by the Adviser, to the extent that the Portfolio is able to make the repayment within the expense limitation established in the Expense Limitation Agreement. Under the Expense Limitation Agreement, such recoupments must be made within three years following the fiscal year in which the Adviser reduced its compensation and/or assumed expenses for the applicable Portfolio. The Adviser did not recoup any fees previously waived or reimbursed under the Expense Limitation Agreement during the six months ended June 30, 2016. The table below indicates the amount of fees that the Adviser has the potential to recoup:
| | | Recovery Expiring on | |
| | | 4/30/2020 | | | 4/30/2019 | | | 4/30/2018 | | | 4/30/2017 | |
| NGF | | $ | — | | | $ | — | | | $ | — | | | $ | — | |
| NAGF | | | 3,431 | | | | 11,950 | | | | — | | | | — | |
| NSCGF | | | 11,068 | | | | 60,837 | | | �� | 37,932 | | | | 24,636 | |
The Company and U.S. Bancorp Fund Services, LLC (the “Administrator”) are parties to a Fund Administration Servicing Agreement. The Administrator provides administrative and fund accounting services pursuant to this agreement and, in consideration of these services, receives a fee computed daily and paid monthly at an annual rate based on a percentage of the value of each Portfolio’s assets. The Administrator is also compensated for any out of pocket expenses that are reasonably incurred in carrying out its duties under the Administration Agreement. The Administrator also provides transfer agent services pursuant to a Transfer Agent Servicing Agreement for additional fees.
Certain officers of the Company are also officers of the Adviser and/or Needham & Company, LLC (the “Distributor”). Such officers receive no fees from the Company for serving as officers of the Company. Each of the two Directors who is not an “interested person” (as defined in the 1940 Act) of the Company (each, an “Independent Director”) receives a quarterly retainer of $3,000 and a per-meeting fee of $500. Each Independent Director is also a member of the Audit Committee of the Company’s Board of Directors and receives a fee of $500 per meeting attended. The Adviser provides an employee to serve as Chief Compliance Officer for the Company and to provide certain related services. An affiliate of the Adviser, Needham & Company, LLC, pays the Chief Compliance Officer’s compensation and the Company reimburses this affiliate for the Company’s allocated portion of the expense.
4. Distribution Plan
The Company has adopted an Amended and Restated Plan of Distribution pursuant to Rule 12b-1 under the 1940 Act. Under the Plan, each Portfolio may pay compensation to the Distributor or any other distributor or financial institution with which the Company has an agreement with respect to each Portfolio, with the amount of such compensation not to exceed an annual rate of 0.25% of each Portfolio’s daily average net assets. For the six months ended June 30, 2016, NGF, NAGF and NSCGF paid 12b-1 fees to the Distributor in the amount of $146,676, $59,977 and $29,974, respectively.
Notes to Financial Statements (Unaudited) (Continued)
During the six months ended June 30, 2016, NGF, NAGF and NSCGF incurred and paid brokerage commissions to the Distributor in the amount of $6,656, $6,851, and $6,851, respectively.
5. Temporary Borrowings
Each Portfolio may borrow from banks up to 25% of its total assets and may pledge its assets in connection with these borrowings, provided that no additional investments shall be made while borrowings exceed 5% of total assets.
The Portfolios did not engage in any temporary borrowings during the six months ended June 30, 2016.
6. Short Sale Transactions
During the six months ended June 30, 2016, each Portfolio sold securities short. Upon selling a security short, the Portfolios record an asset for the settlement amount and a corresponding liability, which is marked-to-market to reflect current value. Certain securities owned by each respective Portfolio are segregated as collateral while the short sales are outstanding. At June 30, 2016, the market value of securities separately segregated to cover short positions was $3,498,100, $3,772,700, and $1,082,175 for NGF, NAGF and NSCGF, respectively.
Additionally, the Portfolios had receivables for Deposit with Broker for Securities Sold Short of $5,310,756, $3,498,426, and $1,441,412 pledged as collateral with a broker in connection with open short positions for NGF, NAGF and NSCGF, respectively. Securities sold short at June 30, 2016 and their related market values and proceeds are set forth in the preceding Schedule of Securities Sold Short for each Portfolio.
7. Investment Transactions
The following summarizes the aggregate amount of the cost of purchases and proceeds from sales of investment securities and securities sold short, excluding short-term securities, during the six months ended June 30, 2016:
| | | Purchases | | | Sales | |
| NGF | | $ | 4,983,476 | | | $ | 13,135,766 | |
| NAGF | | | 3,594,935 | | | | 7,181,051 | |
| NSCGF | | | 3,371,504 | | | | 8,692,680 | |
There were no purchases or sales of U.S. government securities during the six months ended June 30, 2016.
8. Financial Instruments With Off-Balance Sheet Risk
In the normal course of their business, the Portfolios may engage in transactions with off-balance sheet risk, including securities sold short, written options, futures, and forward currency contracts. Transactions in certain financial instruments represent future commitments to purchase or sell other financial instruments at specific terms at specified future dates. Each of these financial instruments contains varying degrees of off-balance sheet risk whereby changes in the market values of the securities underlying the financial instruments may be in excess of the amounts recognized in the financial statements.
Securities sold short represent obligations of the Portfolios to make future delivery of specific securities and, correspondingly, create an obligation to purchase the securities at market prices prevailing at a later delivery date (or to deliver the securities if already owned by the Portfolios). As a result, short sales create the risk that the Portfolios’ ultimate obligation to satisfy the delivery requirements may exceed the amount of the proceeds initially received on the liability recorded in the financial statements.
9. Indemnification
Under the Company’s organizational documents, its Directors and Officers are indemnified against certain liabilities arising out of the performance of their duties to the Company. In addition, in the ordinary course of business, the Company enters into contracts that contain a variety of indemnifications. The Company’s maximum exposure under these arrangements is unknown. However, the Company has not had prior claims or losses pursuant to these contracts and expects the risk of loss to be remote.
10. Federal Income Taxes
No provision for federal income taxes is required since the Company intends to continue to qualify as a regulated investment company under Subchapter M of the Internal Revenue Code and distribute substantially all of its taxable income and capital gains to shareholders. Because income tax regulations differ from GAAP, the timing and character of income and capital gain distributions determined in accordance with tax regulations can differ from income and capital gains recognized for financial reporting purposes. Accordingly, the character of distributions and the composition of net assets for tax purposes can differ from those reflected in the financial statements. These book/tax differences may be temporary or permanent in nature. Temporary differences are generally due to differing book and tax treatment for the timing of the recognition of gains and losses on securities, including post-October losses (as described below). Permanent differences are generally due to differing treatment of net investment losses. To the extent these differences are permanent, they are charged or credited to paid-in capital, accumulated net realized gain (loss), or accumulated net investment income (loss), as appropriate, in the period in which the differences arise. These reclassifications have no effect on net assets or net asset value per share of each Portfolio.
Notes to Financial Statements (Unaudited) (Continued)
As of December 31, 2015, the cost, gross unrealized appreciation, gross unrealized depreciation, and the net unrealized appreciation (depreciation) on securities, including proceeds from securities sold short for federal income tax purposes, were as follows:
| | | Cost | | | Gross
Unrealized
Appreciation | | | Gross
Unrealized
Depreciation | | | Net Unrealized
Appreciation
(Depreciation) | |
| NGF | | $ | 66,025,870 | | | $ | 65,528,413 | | | $ | (5,190,766 | ) | | $ | 60,337,647 | |
| NAGF | | | 27,938,076 | | | | 25,344,869 | | | | (2,517,339 | ) | | | 22,827,530 | |
| NSCGF | | | 24,275,835 | | | | 2,429,892 | | | | (3,010,528 | ) | | | (580,636 | ) |
The difference between the tax cost of investments and the cost of investments for GAAP purposes is primarily due to the tax treatment for wash sale losses.
As of December 31, 2015, the components of distributable earnings (loss) on a tax basis were as follows:
| | | NGF | | | NAGF | | | NSCGF | |
| Undistributed ordinary income | | $ | — | | | $ | — | | | $ | — | |
| Undistributed long-term capital gains | | | 3,475,941 | | | | — | | | | — | |
| Unrealized appreciation (depreciation) | | | 60,337,647 | | | | 22,827,530 | | | | (580,636 | ) |
| Other accumulated gains (loss) | | | (331,373 | ) | | | (163,969 | ) | | | (35,070 | ) |
| Total accumulated earnings (loss) | | $ | 63,482,215 | | | $ | 22,663,561 | | | $ | (615,706 | ) |
The tax character of distributions paid during the year ended of December 31, 2015 was as follows:
| | | NGF | | | NAGF | | | NSCGF | |
| Ordinary income | | $ | — | | | $ | — | | | $ | — | |
| Net long-term capital gains | | | 8,209,695 | | | | 5,612,688 | | | | 606,909 | |
| Return of capital | | | — | | | | — | | | | — | |
| Total distributions paid | | $ | 8,209,695 | | | $ | 5,612,688 | | | $ | 606,909 | |
The tax character of distributions paid during the year ended December 31, 2014 was as follows:
| | | NGF | | | NAGF | | | NSCGF | |
| Ordinary income | | $ | — | | | $ | — | | | $ | 39,890 | |
| Net long-term capital gains | | | 9,182,355 | | | | 1,796,420 | | | | 2,470,645 | |
| Distribution in excess for required excise distribution | | | — | | | | 56,369 | | | | 1,132,201 | |
| Total distributions paid | | $ | 9,182,355 | | | $ | 1,852,789 | | | $ | 3,642,736 | |
Under current tax law, capital and currency losses realized after October 31 of a Portfolio’s fiscal year may be deferred and treated as occurring on the first business day of the following fiscal year for tax purposes. The following Portfolios had deferred post-October capital and currency losses, which will be treated as arising on the first business day of the year ended of December 31, 2015.
| | NGF | | $ | — | |
| | NAGF | | | 18,456 | |
| | NSCGF | | | 1,895 | |
As of December 31, 2015 none of the Portfolios had accumulated capital loss carryovers.
11. New Accounting Pronouncements
In May 2015, the Financial Accounting Standards Board (“FASB”) issued Accounting Standards Update (“ASU”) No. 2015-07 “Disclosure for Investments in Certain Entities that Calculate Net Asset Value per Share (or Its Equivalent)”. The amendments in ASU No. 2015-07 remove the requirement to categorize within the fair value hierarchy investments measured using the NAV practical expedient. The ASU also removes certain disclosure requirements for investments that qualify, but do not utilize, the NAV practical expedient. The amendments in the ASU are effective for fiscal years beginning after December 15, 2015, and interim periods within those fiscal years. Management is currently evaluating the impact these changes will have on the Portfolios’ financial statements and related disclosures.
12. Subsequent Events
Management has evaluated subsequent events through the date of this filing. This evaluation did not result in any subsequent events that necessitated recognition or disclosures.
Supplementary Information (Unaudited) June 30, 2016
Disclosure of Portfolio Holdings
The Company files a Form N-Q with the Securities and Exchange Commission (the “SEC”) no more than sixty days after the Company’s first and third fiscal quarters. For the Company, this would be for the fiscal quarters ending March 31 and September 30. Form N-Q includes a complete schedule of the Company’s portfolio holdings as of the end of those fiscal quarters. The Company’s N-Q filings can be found free of charge on the SEC’s website at http://www.sec.gov, or they may be reviewed and copied at the SEC’s Public Reference Room in Washington, D.C. (call 800-SEC-0330 for information on the operation of the Public Reference Room).
Voting Proxies on Company Portfolio Securities
A description of the policies and procedures that the Company uses to determine how to vote proxies relating to portfolio securities and information regarding how the Company voted proxies relating to portfolio securities during the most recent 12-month period ended June 30 are available without charge, upon request, by calling 800-625-7071 or on the SEC’s website at http://www.sec.gov.
Household Delivery of Shareholder Documents
To reduce expenses, the Company may mail only one copy of the Funds’ prospectuses, proxy statements, information statements, and each annual and semi-annual report to those addresses shared by two or more accounts. If you wish to receive individual copies of these documents, please call the Funds at 1-800-625-7071 or contact your financial institution. You will begin receiving individual copies thirty days after receiving your request.
(This page intentionally left blank.)
(This page intentionally left blank.)

Item 2. Code of Ethics.
Not applicable for semi-annual reports.
Item 3. Audit Committee Financial Expert.
Not applicable for semi-annual reports.
Item 4. Principal Accountant Fees and Services.
Not applicable for semi-annual reports.
Item 5. Audit Committee of Listed Registrants.
Not applicable to registrants who are not listed issuers (as defined in Rule 10A-3 under the Securities Exchange Act of 1934).
Item 6. Investments.
| (a) | Schedule of Investments is included as part of the report to shareholders filed under Item 1 of this Form. |
Item 7. Disclosure of Proxy Voting Policies and Procedures for Closed-End Management Investment Companies.
Not applicable to open-end investment companies.
Item 8. Portfolio Managers of Closed-End Management Investment Companies.
Not applicable to open-end investment companies.
Item 9. Purchases of Equity Securities by Closed‑End Management Investment Company and Affiliated Purchasers.
Not applicable to open-end investment companies.
Item 10. Submission of Matters to a Vote of Security Holders.
Not Applicable.
Item 11. Controls and Procedures.
| (a) | The Registrant’s Chief Executive Officer and Chief Financial Officer have reviewed the Registrant’s disclosure controls and procedures (as defined in Rule 30a-3(c) under the Investment Company Act of 1940 (the “Act”)) as of a date within 90 days of the filing of this report, as required by Rule 30a-3(b) under the Act and Rules 13a-15(b) or 15d‑15(b) under the Securities Exchange Act of 1934. Based on their review, such officers have concluded that the disclosure controls and procedures are effective in ensuring that information required to be disclosed in this report is appropriately recorded, processed, summarized and reported and made known to them by others within the Registrant and by the Registrant’s service provider. |
| (b) | There were no changes in the Registrant’s internal control over financial reporting (as defined in Rule 30a-3(d) under the Act) that occurred during the Registrant’s first fiscal half-year of the period covered by this report that has materially affected, or is reasonably likely to materially affect, the Registrant’s internal control over financial reporting. |
Item 12. Exhibits.
| (a) | (1) Any code of ethics or amendment thereto, that is the subject of the disclosure required by Item 2, to the extent that the registrant intends to satisfy Item 2 requirements through filing an exhibit. Not applicable for semi-annual reports. |
(2) A separate certification for each principal executive and principal financial officer pursuant to Section 302 of the Sarbanes-Oxley Act of 2002. Filed herewith.
(3) Any written solicitation to purchase securities under Rule 23c‑1 under the Act sent or given during the period covered by the report by or on behalf of the registrant to 10 or more persons. Not applicable to open-end investment companies.
| (b) | Certifications pursuant to Section 906 of the Sarbanes‑Oxley Act of 2002. Furnished herewith. |
SIGNATURES
Pursuant to the requirements of the Securities Exchange Act of 1934 and the Investment Company Act of 1940, the registrant has duly caused this report to be signed on its behalf by the undersigned, thereunto duly authorized.
(Registrant) The Needham Funds, Inc.
By (Signature and Title) /s/ George A. Needham
George A. Needham, President (Chief Executive Officer)
Date 8-24-16
Pursuant to the requirements of the Securities Exchange Act of 1934 and the Investment Company Act of 1940, this report has been signed below by the following persons on behalf of the registrant and in the capacities and on the dates indicated.
By (Signature and Title) /s/ George A. Needham
George A. Needham, President (Chief Executive Officer)
Date 8-24-16
By (Signature and Title) /s/ James W. Giangrasso
James W. Giangrasso, Treasurer and Secretary (Chief Financial Officer)
Date 8-24-16