As filed with the Securities and Exchange Commission on September 8, 2015.
UNITED STATES
SECURITIES AND EXCHANGE COMMISSION
Washington, D.C. 20549
FORM N-CSR
CERTIFIED SHAREHOLDER REPORT OF REGISTERED MANAGEMENT INVESTMENT COMPANIES
Investment Company Act file number 811-09114
The Needham Funds, Inc.
(Exact name of registrant as specified in charter)
445 Park Avenue, New York, NY 10022-2606
(Address of principal executive offices) (Zip code)
Mr. George A. Needham, 445 Park Avenue, New York, NY 10022-2606
(Name and address of agent for service)
1-800-625-7071
Registrant's telephone number, including area code
Date of fiscal year end: December 31, 2015
Date of reporting period: June 30, 2015
Item 1. Reports to Stockholders.

445 Park Avenue
New York, New York 10022-2606
1-800-625-7071
www.needhamfunds.com
Semi-Annual Report
June 30, 2015
| Contents | |
| | |
| Letter from the Adviser | 1 |
| | |
| Portfolio Characteristics | |
| Needham Growth Fund | 6 |
| Needham Aggressive Growth Fund | 7 |
| Needham Small Cap Growth Fund | 8 |
| Disclosure of Fund Expenses | 9 |
| | |
| Schedule of Investments | |
| Needham Growth Fund | 10 |
| Needham Aggressive Growth Fund | 13 |
| Needham Small Cap Growth Fund | 16 |
| | |
| Schedule of Securities Sold Short | |
| Needham Growth Fund | 12 |
| Needham Aggressive Growth Fund | 15 |
| Needham Small Cap Growth Fund | 17 |
| | |
| Statements of Assets and Liabilities | 18 |
| | |
| Statements of Operations | 19 |
| | |
| Statements of Changes in Net Assets | 20 |
| | |
| Financial Highlights | |
| Needham Growth Fund | 21 |
| Needham Aggressive Growth Fund | 22 |
| Needham Small Cap Growth Fund | 23 |
| | |
| Notes to Financial Statements | 24 |
| | |
| Supplementary Information | 30 |
This report is authorized for distribution to prospective investors only when preceded or accompanied by a current prospectus. The prospectus contains more complete information, including investment objectives, risks, expenses and charges and should be read carefully before investing or sending any money. To obtain a prospectus, please call 1-800-625-7071.
Portfolios of The Needham Funds, Inc., like all mutual funds:
The Needham Funds, Inc. are distributed by Needham & Company, LLC.
| Needham Funds | Semi-Annual Report 2015 |
| 445 Park Avenue New York, NY 10022 (800) 625-7071 www.needhamfunds.com |
August 2015
Dear Shareholders, Friends of Needham and Prospective Shareholders,
We are pleased to report results for the second quarter and for the half-year ending June 30, 2015 for the Needham Growth Fund, Needham Aggressive Growth Fund, and Needham Small Cap Growth Fund. Our mission is to create wealth for long-term investors.
Needham Funds’ Second Quarter and Semiannual Review
In the second quarter, the Needham Growth Fund (NEEGX) lost 0.08%, the Needham Aggressive Growth Fund (NEAGX) lost 0.98%, and the Needham Small Cap Growth Fund (NESGX) lost 3.15%. The Russell 2000 Total Return Index returned 0.42%, the S&P 500 Total Return Index returned 0.28%, and the NASDAQ Composite Index returned 2.06%.
For the half-year, the Needham Growth Fund returned 3.50%, the Needham Aggressive Growth Fund returned 2.80%, and the Needham Small Cap Growth Fund returned 3.28%. The Russell 2000 Total Return Index returned 4.75%, the S&P 500 Total Return Index returned 1.23%, and the NASDAQ Composite Index returned 5.99%.
The first half of 2015 was dominated by weak economic results and a strong dollar. In late January, the European Central Bank announced its massive quantitative easing program that will run through September 2016. Consequently, February was a very strong month as the Funds outperformed the rising markets. In March, the U.S. Federal Reserve dropped the word “patient” from its outlook for interest rates, but made it clear they are in no hurry to normalize rates.
The Funds and the markets declined at the beginning of the second quarter owing to weak economic results. In late April, it became clear the Federal Reserve would not be raising interest rates in June. May was a positive month for the Funds and the averages. In June, the Funds were down, outperforming the S&P 500, but trailing the Russell 2000.
With weak inflation, we believe the data does not support that the Federal Reserve will raise interest rates at their September Board of Governors’ meeting. David Malpass, Chief Economist at Encima Global Advisors, believes a rate increase would be positive for the economy, as it will allow more rational capital decisions. Free money leads to distortions. There has been monetary easing somewhere in the world every third day since 2009. We believe monetary policy will remain accommodative, whether or not the Federal Reserve raises interest rates by 25 basis points at its September or December meetings.
Commodities, the Dollar and China
China has been an engine for worldwide growth—and it has slowed. China has been a major consumer of commodities to fuel its infrastructure construction. With the Chinese economy slowing, the Thomson Reuters Core Commodity CRB Index has fallen 30% over the last 12 months. Most telling, the price of West Texas Intermediate crude oil has fallen 60% since June 2014. The inverse of the commodity price decline has been the strong U.S. dollar.
At the beginning of April, China lowered its reserve requirement for banks by the largest amount since 2008. Chinese officials made stunning policy moves in July to attempt to counteract the falling Shenzen stock market. The Shanghai Stock Exchange Composite Index had been up over 60% in 2015, but then fell over 30% from mid-June into July. China halted trading in many stocks, forbid large holders from selling, and the People’s Bank of China injected over $200 billion to prop up equity prices. On August 7, China announced a surprise devaluation of the Yuan in the face of a slowing Chinese economy. These are extraordinary measures for investors in Chinese securities to consider. We continue to believe that U.S. equities are the most viable asset class.
Some of our portfolio companies have been affected by the slowing international economy and the low commodity prices. These companies supply advanced technology for industrial markets and have suffered, particularly in the July earnings season. The semiconductor equipment and technology sector—including our holdings in Form Factor, Inc. (FORM), PDF Solutions, Inc. (PDFS), Photronics, Inc. (PLAB), and MKS Instruments, Inc. (MKSI)—are all down near 10% or more in
July alone. The decline in oil prices has affected Hess Corp. (HES; a holding of all three Funds), Schlumberger Ltd. (SLB; NEEGX), WPX Energy, Inc. (WPX; NEEGX and NESGX), and KVH Industries, Inc. (KVHI; all three Funds).
While falling commodity prices, the strong dollar and a slowing worldwide economy are a concern, we invest on a company-by-company basis. In “One Up on Wall Street,” Peter Lynch wrote, “The bearish argument always sounds more intelligent. You can find good reasons to scuttle your equities in every morning paper and on every broadcast of the nightly news.” We are positive about the companies in our portfolios. We also believe that our short positions could provide some protection should the market volatility continue.
“Patient Capital Outperformance: High Active Share Managers Who Trade Infrequently” & The Needham Funds
In The Growth Factor 19, Needham Funds’ CFO Jim Giangrasso and John Barr discussed a paper written by Professors Martijin Cremers of the University of Notre Dame and Ankur Pareek of Rutgers Business School. The paper, “Patient Capital Outperformance: High Active Share Managers Who Trade Infrequently,” analyzed performance, Active Share and turnover for asset managers from 1995 through 2013. High Active Share combined with infrequent trading resulted in average annual outperformance of 2.3% over the 19-year period. Cremers and Pareek also wrote, “We find no evidence that even the most active (i.e., high Active Share) mutual funds with short durations or frequent trading were able to outperform their benchmarks on average.”
Active Share measures and aggregates the differences between the weights of individual portfolio holdings versus their weights in the benchmark index. More simply put, Active Share is the percentage of the portfolio that is different from the benchmark. The Cremers and Pareek study divided investors into quintiles based on Active Share and duration. The highest quintile required an Active Share of 92% and the highest duration quintile required portfolio turnover of 27% and below. The Needham Funds have historically combined high Active Share with low turnover, as shown in Tables 1 and 2:
Table 1: Needham Funds’ Active Share as of June 30, 2015
| Active Share | vs. S&P 500 | vs. Russell 2000 |
| NEEGX | 102.9% | 106.5% |
| NEAGX | 105.8% | 109.8% |
| NESGX | 117.0% | 116.5% |
Table 2: Needham Funds’ 12-Month Trailing Turnover as of June 30, 2015
| | Turnover |
| Cremers & Pareek Lowest Quintile | 27% and below |
| NEEGX | 12% |
| NEAGX | 16% |
| NESGX | 77% |
| Morningstar Small-Cap Growth Average | 81% |
All three Needham Funds have outperformed the indices since their inceptions, as demonstrated in Table 3:
Table 3: Needham Funds’ Performance Since Inception as of June 30, 2015
| | | | | Since | Since | Since |
| | | | | Inception | Inception | Inception |
| | 1 Year | 5 Year | 10 Year | 1/1/96 | 9/4/01 | 5/22/02 |
| NEEGX | 8.46% | 14.90% | 9.43% | 13.82% | — | — |
| NEAGX | 7.66% | 15.29% | 10.95% | — | 9.88% | — |
| NESGX | 5.73% | 9.98% | 7.19% | — | — | 10.31% |
| S&P 500 TR | 7.42% | 17.34% | 7.89% | 8.40% | 6.54% | 7.17% |
| Russell 2000 TR | 6.49% | 17.08% | 8.40% | 8.75% | 8.84% | 8.79% |
Our high Active Share percentages are partially a result of high conviction portfolios; our top 10 holdings in all three Funds comprise around 50% of net assets. The Funds’ short positions also contribute to high Active Share.
Leaders & Detractors Across The Needham Funds
Gilead Sciences (GILD), a top holding of Needham Growth Fund and Needham Aggressive Growth Fund, returned 20% in the second quarter and 25% in the first half. Gilead recovered from a late December sell-off over concern that competitor AbbVie’s (ABBV) discounted rate agreement for its Viekira Pak Hepatitis C drug with pharmacy benefits manager Express Scripts (ESRX) would create pricing issues for Gilead. Yet, Gilead has achieved near 90% market share and the stock has appreciated.
Super Micro Computer, Inc. (SMCI) returned -11% for the quarter and 15% for the half-year. The company makes servers and storage systems used in cloud data centers by the leading Internet companies. The company’s June quarter guidance was a bit light. We believe Super Micro has an opportunity to gain market share versus Lenovo Group Limited (992-HK) and Hewlett-Packard (HPQ). Lenovo purchased IBM’s (IBM) server business in 2014. Super Micro’s customers include such high-growth, next-generation storage companies as Nimble (NMBL) and Nutanix. We believe Super Micro will also benefit from expanding margins, as it fills its new Taiwan manufacturing and distribution center.
Needham Growth Fund
The Needham Growth Fund returned -0.08% in the second quarter and 3.50% year-to-date as of June 30, 2015. Gilead, the Fund’s second largest position at 7.5% of net assets on June 30, was by far the largest contributor for the quarter and the half-year. The second-largest contributor for the half-year was II-VI, Inc. (IIVI), which returned 39%. II-VI manufactures engineered materials used in defense and aerospace applications and has other technical market offerings. Over the last few years, II-VI had strayed from its strong return-on-capital metrics. This half saw a return to positive results. Other major contributors to NEEGX were Emulex Corp. (ELX), which returned 41% with its sale to Avago Technologies Limited (AVGO), and CONMED Corp. (CNMD), which was up 31% for the half-year and 16% for the second quarter.
The Fund’s leading detractor for the second quarter and the half-year was Super Micro. Electro Scientific Industries, Inc. (ESIO), down 32%, was the second-leading detractor in the first half. Electro Scientific makes laser-based systems used for cutting, etching and drilling electronic devices. Last year, the company started a transformation to address the large market of Asian manufacturers. It is still too early to judge the success of the new strategy and first-half results suffered.
During the second quarter, we started positions in Analogic Corp. (ALOG), Castlight Health, Inc. (CLST), FLIR Systems, Inc. (FLIR), Foundation Medicine, Inc. (FMI), National Instruments Corp. (NATI) and REIS, Inc. (REIS). REIS is a major holding of Needham Aggressive Growth Fund and Needham Small Cap Growth Fund. The stock’s sell-off in the second quarter gave us an opportunity to start a position for NEEGX. REIS supplies real-estate information services, and the stock returned -13% in the second quarter, as the company filed a shelf offering and piggybacked registration rights for the CEO and CTO. Investors were concerned about dilution and management’s possible future sale of stock, but we believe REIS’s strong business prospects are more important.
We added to the Fund’s position in Amber Road (AMBR) as it traded down to near $4 per share from $7 per share on disappointing earnings. Amber Road supplies import and export management Software-as-a-Service. Bookings have been uneven on a quarter-to-quarter basis, but we believe the company’s Global KnowledgeTM database of trade rules and regulations creates a barrier to entry, which adds significant value to customers. We also added to Frequency Electronics, Inc. (FEIM), Entegris, Inc. (ENTG) and Newport Corp. (NEWP), and trimmed positions in Express Scripts and II-VI, Inc.
Needham Growth Fund had M&A activity in the first half. BorderFree, Inc. returned 134% in the second quarter upon its acquisition by Pitney Bowes (PBI); LifeTime Fitness, Inc. was purchased by a private equity firm; and Broadcom Corp. (BRCM) announced a sale to Avago (AVGO).
On June 30, 2015, 48% of Needham Growth Fund net assets were invested in companies with market capitalizations of over $8 billion, 20% over $2 billion, and 31% under $2 billion. The Fund had a 4% short position. While Morningstar categorizes the Fund as Mid-Cap Growth, we view our mandate to make money through long-term holdings with as little risk as possible.
Needham Aggressive Growth Fund
The Needham Aggressive Growth Fund returned -0.98% in the second quarter and 2.80% year-to-date at June 30, 2015. The top contributor for the second quarter and half-year was Gilead. Apple, Inc. (AAPL) returned 15% and was the second leading year-to-date contributor. We reduced our holding in Apple to 4.6% from 6.3% over the last six months. We continue to like Apple, but we believe the opportunities in some of the smaller companies are compelling.
Akamai Technologies, Inc. (AKAM), the largest holding in the Fund, returned 11% year-to-date and was the third largest year-to-date contributor. Akamai continues to benefit from growth in video over the internet and its cloud-based security offering.
The Fund’s largest detractor for the half-year was WageWorks, Inc. (WAGE), down 38%. WageWorks is a provider of consumer-directed benefits such as commuter cards, Health Savings Accounts, and private healthcare exchanges. Wage-Works is partnered with Towers Watson on their private exchange. During the second quarter, Towers Watson announced the acquisition of Acclaris, which administers consumer-driven health care accounts and competes with WageWorks.
For the second quarter, the leading detractors were PDF Solutions (PDFS), down 11%, Constant Contact, Inc. (CTCT), down 25%, and KVH Industries, Inc. (KVHI), down 11%. All three companies guided estimates slightly below expectations. We remain positive and believe the reaction of the stock prices was exaggerated.
During the quarter, we started positions in Analogic Corp., Checkpoints Systems, Inc. (CKP), FLIR Systems, Inc., Foundation Medicine, Inc. and National Instruments Corp. The most important addition was a doubling of the Amber Road position. We added to positions in KVH Industries, Constant Contact, Frequency Electronics, GSE Systems (GVP), Vicor (VICR), Corium (CORI), GSV Capital (GSVC) and Norsat International, Inc. (NSAT).
We also started a position in Sutron Corporation (STRN); it announced a takeover by a division of Danaher (DHR) at a 67% premium, all within the quarter. We sold BorderFree, Inc. and LifeTime Fitness, Inc. to their acquirers. We also sold a small position in Discovery Communications, Inc. (DISCA).
The Fund exited the second quarter with 28% of net assets invested in companies with over an $8 billion market cap, 19% between $2 billion and $8 billion, 33% between $250 million and $8 billion and 19% under $250 million. The Fund also ended the second quarter with a 6% short position and was fully invested. Morningstar categorizes the fund as Small-Cap Growth.
Needham Small Cap Growth Fund
The Needham Small Cap Growth Fund returned -3.15% in the second quarter of 2015 and 3.28% year-to-date ending June 30, 2015. We were disappointed that some of our larger holdings were affected by a pause in global growth as worries in China, Greece and interest rate increases grabbed the headlines. The fundamental stories of our investments remain strong and our long-term views have not changed. Although the second quarter was a setback to the first quarter’s solid performance, we are excited to see the results from our portfolio in the second half of 2015.
The energy industry is certainly having a negative impact on many sectors as their expenditures and activity are widespread. For example, Needham Small Cap Growth Fund’s holding in KVH Industries, Inc. has seen headwinds from lower utilization of its broadband service by service boats in the energy industry. While we think this downturn may last, we believe the numbers are de-risking and KVH’s growth story will return as they see strong hardware placement in other maritime opportunities.
Another area where we have significant exposure is within the semiconductor industry—more specifically, semiconductor capital equipment. Semiconductors are very sensitive to economic growth and slowdowns, and while we lightened the portfolio’s exposure, it is not an industry we avoided completely. We are closely monitoring inventory levels and activities from consumers of semiconductors. The long-term story of innovation and an arms race between foundries and memory manufacturers remains in place. We prefer to invest in companies that deliver high levels of technological innovation with a wide moat to competition. An example of this is MKS Instruments, Inc. (MKSI), a provider of measurement instruments and solutions for advanced manufacturing processes. Their components and subcomponents are certified on tools of record and require exact copy specifications. We believe the company is strategically situated in the industry to gain market share and drive long-term shareholder value. Our holding in FormFactor (FORM) is also a leader in technology innovation within the probe card market. Although the stock has corrected, we believe it is only resetting for its next leg of growth.
We have been long-time holders of Ruckus Wireless (RKUS), a global supplier of advanced WiFi solutions for the mobile Internet infrastructure market. We believe the company has been in an investment phase and stands to benefit from the recent launch of E-Rate funding for K-12 educational institutions. The company has missed expectations the past few quarters, but after our visits with management, we are confident that they will achieve their financial objectives as they come out of this elevated investment period and continue to drive new partnerships in the wake of HP’s acquisition of Aruba Networks.
One of the best performing holdings in the Fund was LendingTree (TREE). We have known the management team for many years and are thrilled at the company’s continued success. LendingTree has found its “second act” and it is executing on its business plan. We attended its analyst day in New York earlier this year, and the company has developed a marketplace platform that goes far beyond only serving the mortgage loan vertical. We will monitor valuation as the stock has experienced a huge move, but we remain satisfied with the momentum.
Closing
We believe the U.S. is again facing sub-par economic growth, but it remains the best place in the world to be investing and working. Asia and Europe are facing difficult economic times.
To reiterate our overall thesis: monetary policy remains accommodative. We continue to see opportunities and continue to add starter positions in selected companies. Most importantly, we see a revolution happening in technology that has created investment opportunities.
We see opportunity in our strategy of investing in companies that we know well and that we believe are positioned with secular growth drivers. We believe the second half of 2015 will bring a modest rebound for equities. As it already has, we believe 2015 could bring more volatility to the markets and that our ability to short could dampen the possible volatility.
We welcome our new investors and thank all of our investors for their continued support. If you have any questions, thoughts or concerns, please contact us at (800) 625-7071 or send us an email at cretzler@needhamco.com or jbarr@needhamco.com. For information about the funds, please visit our website at www.needhamfunds.com.
| Sincerely, | |
| | |
 |  |
| | |
| Chris Retzler | John O. Barr |
| Portfolio Manager | Portfolio Manager |
| NEEDHAM GROWTH FUND | TICKER: NEEGX |
Comparative Performance Statistics as of June 30, 2015 (Unaudited)
| | | | | | | | | | | | | Since | | Gross Expense |
| | | 6 Months(7) | | 1 Year | | 3 Years(8) | | 5 Years(8) | | 10 Years(8) | | Inception(8)(12) | | Ratio(14) |
| Needham Growth Fund(1) | | 3.50% | | 8.46% | | 17.14%(9) | | 14.90%(10) | | 9.43%(11) | | 13.82%(13) | | 1.84% |
| S&P 500 Index(2)(3) | | 1.23% | | 7.42% | | 17.31% | | 17.34% | | 7.89% | | 8.40% | | |
| NASDAQ Composite Index(2)(4) | | 5.99% | | 14.61% | | 21.02% | | 20.30% | | 10.49% | | 9.19% | | |
| S&P 400 MidCap Index(2)(5) | | 4.20% | | 6.40% | | 18.60% | | 17.82% | | 9.74% | | 11.89% | | |
| Russell 2000 Index(2)(6) | | 4.75% | | 6.49% | | 17.81% | | 17.08% | | 8.40% | | 8.75% | | |
Past performance does not guarantee future results. The performance data quoted represents past performance, and current returns may be lower or higher. The investment return and net asset value will fluctuate so that an investor’s shares, when redeemed, may be worth more or less than the original cost. To obtain performance information current to the most recent month-end, please call 1-800-625-7071. The returns shown in the above table and accompanying footnotes are net of expenses. The table above does not reflect the deduction of taxes that a shareholder would have paid on Fund distributions or on the redemption of Fund shares.
| 1. | Investment results calculated after reinvestment of dividends. |
| 2. | It is not possible to invest directly in an index. The performance of the index does not include the deduction of expenses associated with a mutual fund, such as investment management fees. |
| 3. | The S&P 500 Index is a broad unmanaged measure of the U.S. stock market. |
| 4. | The NASDAQ Composite Index is a broad-based capitalization-weighted index of all NASDAQ Global Market and Small Cap stocks. |
| 5. | The S&P 400 MidCap Index is a broad unmanaged measure of the U.S. stock market. |
| 6. | The Russell 2000 Index is a broad unmanaged index composed of the smallest 2,000 companies in the Russell 3000 Index. |
| 8. | Compound annual growth rate (annualized return). Assumes all dividends were reinvested in shares of the Fund. |
| 9. | Cumulative return for the three year period was 60.72%, assuming all dividends were reinvested in shares of the Fund. |
| 10. | Cumulative return for the five year period was 100.29%, assuming all dividends were reinvested in shares of the Fund. |
| 11. | Cumulative return for the ten year period was 146.19%, assuming all dividends were reinvested in shares of the Fund. |
| 12. | The inception date of the Fund was 1/1/96. |
| 13. | Cumulative return since inception was 1,147.82%, assuming all dividends were reinvested in shares of the Fund. |
| 14. | Gross expense ratio is from the Fund’s prospectus dated May 1, 2015. Additional information pertaining to the Fund’s expense ratios as of June 30, 2015 can be found in the financial highlights. Since January 1, 2009, the investment performance reflects contractually agreed upon fee waivers which expire at the close of business on April 30, 2016. Without these fee waivers, the performance would have been lower. Excluding the indirect costs of investing in acquired funds, total fund operating expenses would be 1.84%. |
Top Ten Holdings*
(as a % of total investments, as of June 30, 2015)
| | | | | % of Total |
| | | Security | | | | | Investments† |
| 1 Express Scripts Holding Co. | | ESRX | | 8.92% |
| 2 Gilead Sciences, Inc. | | GILD | | 8.26% |
| 3 Thermo Fisher Scientific, Inc. | | TMO | | 7.23% |
| 4 CarMax, Inc. | | KMX | | 5.53% |
| 5 FormFactor, Inc. | | FORM | | 4.54% |
| 6 Becton Dickinson and Co. | | BDX | | 4.37% |
| 7 KVH Industries, Inc. | | KVHI | | 4.34% |
| 8 Super Micro Computer, Inc. | | SMCI | | 4.23% |
| 9 ViaSat, Inc. | | VSAT | | 4.14% |
| 10 Entegris, Inc. | | ENTG | | 2.70% |
Top Ten Holdings = 54.26% of Total Investments†
* Current portfolio holdings may not be indicative of future portfolio holdings.
† Percentage of total investments less cash.
Sector Weightings*
(as a % of total investments, as of June 30, 2015)
| | Sector | | | Long(1) | | (Short)(1) | | Total(1)(2) |
| Consumer Discretionary | | 9.8% | | — | | 9.8% |
| Energy | | 3.5% | | — | | 3.5% |
| Exchange Traded Funds | | — | | (0.7)% | | (0.7)% |
| Financials | | 3.4% | | (0.5)% | | 2.9% |
| Health Care | | 33.0% | | — | | 33.0% |
| Industrials | | 3.0% | | (0.1)% | | 2.9% |
| Information Technology | | 41.9% | | (2.7)% | | 39.2% |
| Cash | | 9.4% | | — | | 9.4% |
* Current portfolio holdings may not be indicative of future portfolio holdings
(1) Percentage of total investments includes all stocks, plus cash minus all short positions.
(2) Total represents the difference between the long exposure and the short exposure, which produces the net exposure.
Comparison of Change in Value of a $10,000 Investment

Past performance does not guarantee future results. The performance data quoted represents past performance, and current returns may be lower or higher. The investment return and net asset value will fluctuate so that an investor’s shares, when redeemed, may be worth more or less than the original cost. To obtain performance information current to the most recent month-end, please call 1-800-625-7071. The graph above does not reflect the deduction of taxes that a shareholder would have paid on Fund distributions or on the redemption of Fund shares. Since inception, the Fund’s adviser has absorbed certain expenses of the Fund, without which returns would have been lower.
The Global Industry Classification Standard (GICS®) was developed by and/or is the exclusive property of MSCI, Inc. and Standard & Poor Financial Services LLC (“S&P”). GICS is a service mark of MSCI and S&P and has been licensed for use by U.S. Bancorp Fund Services, LLC.
| NEEDHAM AGGRESSIVE GROWTH FUND | TICKER: NEAGX |
Comparative Performance Statistics as of June 30, 2015 (Unaudited)
| | | | | | | | | | | | | Since | | Gross Expense |
| | | 6 Months(6) | | 1 Year | | 3 Years(7) | | 5 Years(7) | | 10 Years(7) | | Inception(7)(11) | | Ratio(13) |
| Needham Aggressive Growth Fund(1) | | 2.80% | | 7.66% | | 16.56%(8) | | 15.29%(9) | | 10.95%(10) | | 9.88%(12) | | 2.09% |
| S&P 500 Index(2)(3) | | 1.23% | | 7.42% | | 17.31% | | 17.34% | | 7.89% | | 6.54% | | |
| NASDAQ Composite Index(2)(4) | | 5.99% | | 14.61% | | 21.02% | | 20.30% | | 10.49% | | 8.73% | | |
| Russell 2000 Index(2)(5) | | 4.75% | | 6.49% | | 17.81% | | 17.08% | | 8.40% | | 8.84% | | |
Past performance does not guarantee future results. The performance data quoted represents past performance, and current returns may be lower or higher. The investment return and net asset value will fluctuate so that an investor’s shares, when redeemed, may be worth more or less than the original cost. To obtain performance information current to the most recent month- end, please call 1-800-625-7071. The returns shown in the above table and accompanying footnotes are net of expenses. The table above does not reflect the deduction of taxes that a shareholder would have paid on Fund distributions or on the redemption of Fund shares.
| 1. | Investment results calculated after reinvestment of dividends. |
| 2. | It is not possible to invest directly in an index. The performance of the index does not include the deduction of expenses associated with a mutual fund, such as investment management fees. |
| 3. | The S&P 500 Index is a broad unmanaged measure of the U.S. stock market. |
| 4. | The NASDAQ Composite Index is a broad-based capitalization-weighted index of all NASDAQ Global Market and Small Cap stocks. |
| 5. | The Russell 2000 Index is a broad unmanaged index composed of the smallest 2,000 companies in the Russell 3000 Index. |
| 7. | Compound annual growth rate (annualized return). Assumes all dividends were reinvested in shares of the Fund. |
| 8. | Cumulative return for the three year period was 58.35%, assuming all dividends were reinvested in shares of the Fund. |
| 9. | Cumulative return for the five year period was 103.64%, assuming all dividends were reinvested in shares of the Fund. |
| 10. | Cumulative return for the ten year period was 182.68%, assuming all dividends were reinvested in shares of the Fund. |
| 11. | The inception date of the Fund was 9/4/2001. |
| 12. | Cumulative return since inception was 267.46% assuming all dividends were reinvested in shares of the Fund. |
| 14. | Gross expense ratio is from the Fund’s prospectus dated May 1, 2015. Additional information pertaining to the Fund’s expense ratios as of June 30, 2015 can be found in the financial highlights. Since January 1, 2009, the investment performance reflects contractually agreed upon fee waivers which expire at the close of business on April 30, 2016. Without these fee waivers, the performance would have been lower. Excluding the indirect costs of investing in acquired funds, total fund operating expenses would be 2.09%. |
Top Ten Holdings*
(as a % of total investments, as of June 30, 2015)
| | | | | % of Total |
| | | Security | | | | | Investments† |
| 1 Akamai Technologies, Inc. | | AKAM | | 7.49% |
| 2 Gilead Sciences, Inc. | | GILD | | 6.80% |
| 3 FormFactor, Inc. | | FORM | | 6.42% |
| 4 PDF Solutions, Inc. | | PDFS | | 6.06% |
| 5 KVH Industries, Inc. | | KVHI | | 5.24% |
| 6 Entegris, Inc. | | ENTG | | 4.70% |
| 7 Apple, Inc. | | AAPL | | 4.65% |
| 8 Super Micro Computer, Inc. | | SMCI | | 4.08% |
| 9 Reis, Inc. | | REIS | | 3.40% |
| 10 Electronics For Imaging, Inc. | | EFII | | 2.74% |
Top Ten Holdings = 51.58% of Total Investments†
* Current portfolio holdings may not be indicative of future portfolio holdings.
† Percentage of total investments less cash.
Sector Weightings*
(as a % of total investments, as of June 30, 2015)
| | | Sector | | | Long(1) | | (Short)(1) | | Total(1)(2) |
| Consumer Discretionary | | 5.3% | | — | | 5.3% |
| Consumer Staples | | 1.8% | | — | | 1.8% |
| Energy | | 1.0% | | — | | 1.0% |
| Financials | | 3.6% | | (1.8)% | | 1.8% |
| Health Care | | 13.6% | | (0.1)% | | 13.5% |
| Industrials | | 5.2% | | (0.2)% | | 5.0% |
| Information Technology | | 75.1% | | (3.5)% | | 71.6% |
| Materials | | — | | (0.3)% | | (0.3)% |
| Cash | | 0.3% | | — | | 0.3% |
* Current portfolio holdings may not be indicative of future portfolio holdings.
(1) Percentage of total investments includes all stocks, plus cash minus all short positions.
(2) Total represents the difference between the long exposure and the short exposure, which produces the net exposure.
Comparison of Change in Value of a $10,000 Investment
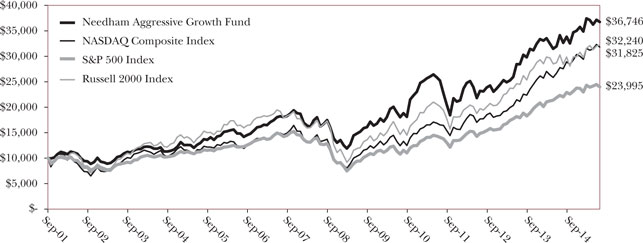
Past performance does not guarantee future results. The performance data quoted represents past performance, and current returns may be lower or higher. The investment return and net asset value will fluctuate so that an investor’s shares, when redeemed, may be worth more or less than the original cost. To obtain performance information current to the most recent month-end, please call 1-800-625-7071. The graph above does not reflect the deduction of taxes that a shareholder would have paid on Fund distributions or on the redemption of Fund shares. Since inception, the Fund’s adviser has absorbed certain expenses of the Fund, without which returns would have been lower.
The Global Industry Classification Standard (GICS®) was developed by and/or is the exclusive property of MSCI, Inc. and Standard & Poor Financial Services LLC (“S&P”). GICS is a service mark of MSCI and S&P and has been licensed for use by U.S. Bancorp Fund Services, LLC.
| NEEDHAM SMALL CAP GROWTH FUND | TICKER: NESGX |
Comparative Performance Statistics as of June 30, 2015 (Unaudited)
| | | | | | | | | | | | | Since | | Gross Expense |
| | | 6 Months(6) | | 1 Year | | 3 Years(7) | | 5 Years(7) | | 10 Years(7) | | Inception(7)(11) | | Ratio(13) |
| Needham Small Cap Growth Fund(1) | | 3.28% | | 5.73% | | 9.13%(8) | | 9.98%(9) | | 7.19%(10) | | 10.31%(12) | | 2.01% |
| S&P 500 Index(2)(3) | | 1.23% | | 7.42% | | 17.31% | | 17.34% | | 7.89% | | 7.17% | | |
| NASDAQ Composite Index(2)(4) | | 5.99% | | 14.61% | | 21.02% | | 20.30% | | 10.49% | | 9.89% | | |
| Russell 2000 Index(2)(5) | | 4.75% | | 6.49% | | 17.81% | | 17.08% | | 8.40% | | 8.79% | | |
Past performance does not guarantee future results. The performance data quoted represents past performance, and current returns may be lower or higher. The investment return and net asset value will fluctuate so that an investor’s shares, when redeemed, may be worth more or less than the original cost. To obtain performance information current to the most recent month-end, please call 1-800-625-7071. The returns shown in the above table and accompanying footnotes are net of expenses. The table above does not reflect the deduction of taxes that a shareholder would have paid on Fund distributions or on the redemption of Fund shares.
| 1. | Investment results calculated after reinvestment of dividends. |
| 2. | It is not possible to invest directly in an index. The performance of the index does not include the deduction of expenses associated with a mutual fund, such as investment management fees. |
| 3. | The S&P 500 Index is a broad unmanaged measure of the U.S. stock market. |
| 4. | The NASDAQ Composite Index is a broad-based capitalization-weighted index of all NASDAQ Global Market and Small Cap stocks. |
| 5. | The Russell 2000 Index is a broad unmanaged index composed of the smallest 2,000 companies in the Russell 3000 Index. |
| 7. | Compound annual growth rate (annualized return). Assumes all dividends were reinvested in shares of the Fund. |
| 8. | Cumulative return for the three year period was 29.97%, assuming all dividends were reinvested in shares of the Fund. |
| 9. | Cumulative return for the five year period was 60.88%, assuming all dividends were reinvested in shares of the Fund. |
| 10. | Cumulative return for the ten year period was 100.17%, assuming all dividends were reinvested in shares of the Fund. |
| 11. | The inception date of the Fund was 5/22/02. |
| 12. | Cumulative return since inception was 261.72% assuming all dividends were reinvested in shares of the Fund. |
| 14. | Gross expense ratio is from the Fund’s prospectus dated May 1, 2015. Additional information pertaining to the Fund’s expense ratios as of June 30, 2015 can be found in the financial highlights. Since January 1, 2009, the investment performance reflects contractually agreed upon fee waivers which expire at the close of business on April 30, 2016. Without these fee waivers, the performance would have been lower. Excluding the indirect costs of investing in acquired funds, total fund operating expenses would be 2.01%. |
Top Ten Holdings*
(as a % of total investments, as of June 30, 2015)
| | | | | % of Total |
| | | Security | | | | | Investments† |
| 1 FormFactor, Inc. | | FORM | | 6.50% |
| 2 KVH Industries, Inc. | | KVHI | | 6.48% |
| 3 TTM Technologies, Inc. | | TTMI | | 6.35% |
| 4 Entegris, Inc. | | ENTG | | 5.14% |
| 5 Newport Corp. | | NEWP | | 4.96% |
| 6 Super Micro Computer, Inc. | | SMCI | | 4.70% |
| 7 Reis, Inc. | | REIS | | 4.70% |
| 8 Air Lease Corp. | | AL | | 4.49% |
| 9 Photronics, Inc. | | PLAB | | 4.48% |
| 10 Ruckus Wireless, Inc. | | RKUS | | 4.43% |
Top Ten Holdings = 52.23% of Total Investments†
* Current portfolio holdings may not be indicative of future portfolio holdings.
† Percentage of total investments less cash.
Sector Weightings*
(as a % of total investments, as of June 30, 2015)
| | | Sector | | | Long(1) | | (Short)(1) | | Total(1)(2) |
| Consumer Discretionary | | 0.2% | | — | | 0.2% |
| Consumer Staples | | 2.6% | | — | | 2.6% |
| Energy | | 5.7% | | — | | 5.7% |
| Exchange Traded Funds | | — | | (5.7)% | | (5.7)% |
| Financials | | 1.1% | | — | | 1.1% |
| Health Care | | 4.7% | | — | | 4.7% |
| Industrials | | 5.6% | | — | | 5.6% |
| Information Technology | | 82.1% | | (3.0)% | | 79.1% |
| Cash | | 6.7% | | — | | 6.7% |
* Current portfolio holdings may not be indicative of future portfolio holdings.
(1) Percentage of total investments includes all stocks, plus cash minus all short positions.
(2) Total represents the difference between the long exposure and the short exposure, which produces the net exposure.
Comparison of Change in Value of a $10,000 Investment
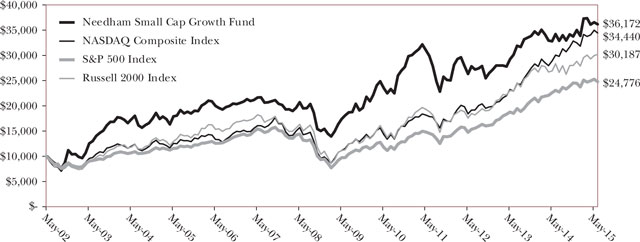
Past performance does not guarantee future results. The performance data quoted represents past performance, and current returns may be lower or higher. The investment return and net asset value will fluctuate so that an investor’s shares, when redeemed, may be worth more or less than the original cost. To obtain performance information current to the most recent month-end, please call 1-800-625-7071. The graph above does not reflect the deduction of taxes that a shareholder would have paid on Fund distributions or on the redemption of Fund shares. Since inception, the Fund’s adviser has absorbed certain expenses of the Fund, without which returns would have been lower.
The Global Industry Classification Standard (GICS®) was developed by and/or is the exclusive property of MSCI, Inc. and Standard & Poor Financial Services LLC (“S&P”). GICS is a service mark of MSCI and S&P and has been licensed for use by U.S. Bancorp Fund Services, LLC.
Semi-Annual Report 2015
Disclosure of Fund Expenses (Unaudited)
The following expense table is shown so that you can understand the impact of fees on your investment. All mutual funds have operating expenses. As a shareholder of a Portfolio, you incur transactional costs, including redemption fees and ongoing costs, which include costs for portfolio management, administrative services, and shareholder reports, among others. A Portfolio’s expenses are expressed as a percentage of its average net assets. This figure is known as the expense ratio. The following examples are intended to help you understand the ongoing costs (in dollars) of investing in each Portfolio and to compare these costs with those of other mutual funds. The examples are based on an investment of $1,000 made at the beginning of the period shown and held for the entire period. The expense example table below illustrates your fund’s cost in two ways:
| • | Actual Expenses. This section helps you to estimate the actual expenses after fee waivers that you paid over the period. The “Ending Account Value” shown is derived from the Portfolio’s actual return, and “Expenses Paid During Period” shows the dollar amount that would have been paid by an investor who started with $1,000 in the Portfolio. You may use the information here, together with the amount you invested, to estimate the expenses that you paid over the period. To do so, simply divide your account value by $1,000 (for example, an $8,600 account value divided by $1,000 = 8.6), then multiply the result by the number given for your Portfolio under the heading entitled “Expenses Paid During Period”. |
| • | Hypothetical Expenses on a 5% Return. This section is intended to help you compare your Portfolio’s costs with those of other mutual funds. It assumes that the Portfolio had a return of 5% before expenses during the period shown, but that the expense ratio is unchanged. In this case, because the return used is not the Portfolio’s actual return, the results do not apply to your investment. The example is useful in making comparisons because the Securities and Exchange Commission requires all mutual funds to calculate expenses based on a 5% return. You can assess your Portfolio’s cost by comparing this hypothetical example with the hypothetical examples that appear in shareholders reports of other funds. |
Please note that the expenses shown in the table are meant to highlight your ongoing costs only and do not reflect any transactional costs, such as redemption fees. Therefore, the table is useful in comparing ongoing costs only, and will not help you determine the relative total costs of owning different funds. In addition, if these transactional costs were included, your costs would have been higher.
For the Period January 1, 2015 to June 30, 2015
Expense Example Table
| | | Beginning | | Ending | | Expenses Paid | | Expense Ratio | |
| | | Account Value | | Account Value | | During Period* | | During Period* | |
| | | 1/1/15 | | 6/30/15 | | 1/1/15 – 6/30/15 | | 1/1/15 – 6/30/15 | |
| Needham Growth Fund | | | | | | | | | | | | | | | | | |
| Actual Expenses | | $ | 1,000.00 | | | $ | 1,035.00 | | | $ | 9.38 | | | | 1.86 | % | |
| Hypothetical Example for Comparison Purposes (5% return before expenses) | | $ | 1,000.00 | | | $ | 1,015.57 | | | $ | 9.30 | | | | 1.86 | % | |
| | | | | | | | | | | | | | | | | | |
| Needham Aggressive Growth Fund | | | | | | | | | | | | | | | | | |
| Actual Expenses | | $ | 1,000.00 | | | $ | 1,028.00 | | | $ | 10.26 | | | | 2.04 | % | |
| Hypothetical Example for Comparison Purposes (5% return before expenses) | | $ | 1,000.00 | | | $ | 1,014.68 | | | $ | 10.19 | | | | 2.04 | % | |
| | | | | | | | | | | | | | | | | | |
| Needham Small Cap Growth Fund | | | | | | | | | | | | | | | | | |
| Actual Expenses | | $ | 1,000.00 | | | $ | 1,032.80 | | | $ | 9.98 | | | | 1.98 | % | |
| Hypothetical Example for Comparison Purposes (5% return before expenses) | | $ | 1,000.00 | | | $ | 1,014.98 | | | $ | 9.89 | | | | 1.98 | % | |
| * | Expenses are equal to the average account value times the Portfolio’s annualized expense ratio multiplied by the number of days in the most recent fiscal half-year divided by the number of days in the fiscal year. |
Needham Funds
Needham Growth Fund
Schedule of Investments
June 30, 2015 (Unaudited)
| | | Shares | | | Market Value | |
| Common Stocks (91.1%) | | | | | | | | |
| | | | | | | | | |
| Aerospace & Defense (0.6%) | | | | | | | | |
| Honeywell International, Inc. | | | 8,000 | | | $ | 815,760 | |
| | | | | | | | | |
| Airlines (0.2%) | | | | | | | | |
| United Continental Holdings, Inc.* | | | 5,000 | | | | 265,050 | |
| | | | | | | | | |
| Auto Components (0.3%) | | | | | | | | |
| Sypris Solutions, Inc. | | | 333,244 | | | | 483,204 | |
| | | | | | | | | |
| Biotechnology (7.7%) | | | | | | | | |
| Foundation Medicine, Inc.* | | | 7,500 | | | | 253,800 | |
| Gilead Sciences, Inc. | | | 95,000 | | | | 11,122,600 | |
| | | | | | | | 11,376,400 | |
| | | | | | | | | |
| Capital Markets (2.9%) | | | | | | | | |
| GSV Capital Corp.* | | | 37,500 | | | | 386,625 | |
| Financial Engines, Inc. | | | 67,500 | | | | 2,867,400 | |
| Oaktree Capital Group LLC | | | 20,000 | | | | 1,063,600 | |
| | | | | | | | 4,317,625 | |
| | | | | | | | | |
| Commercial Services & Supplies (0.5%) | | | | | | | | |
| Clean Harbors, Inc.* | | | 14,000 | | | | 752,360 | |
| | | | | | | | | |
| Communications Equipment (7.8%) | | | | | | | | |
| KVH Industries, Inc.* | | | 435,000 | | | | 5,850,750 | |
| QUALCOMM, Inc. | | | 2,500 | | | | 156,575 | |
| ViaSat, Inc.*† | | | 92,500 | | | | 5,574,050 | |
| | | | | | | | 11,581,375 | |
| | | | | | | | | |
| Electronic Equipment, Instruments & Components (8.7%) | | | | | | | | |
| Corning, Inc. | | | 35,000 | | | | 690,550 | |
| Electro Scientific Industries, Inc. | | | 300,000 | | | | 1,581,000 | |
| FLIR Systems, Inc. | | | 7,500 | | | | 231,150 | |
| Frequency Electronics, Inc.* | | | 50,550 | | | | 570,204 | |
| II-VI, Inc.* | | | 165,000 | | | | 3,131,700 | |
| Ingram Micro, Inc.* | | | 10,000 | | | | 250,300 | |
| Jabil Circuit, Inc.† | | | 150,000 | | | | 3,193,500 | |
| National Instruments Corp. | | | 5,000 | | | | 147,300 | |
| Newport Corp.* | | | 120,850 | | | | 2,291,316 | |
| Vishay Intertechnology, Inc. | | | 62,500 | | | | 730,000 | |
| | | | | | | | 12,817,020 | |
| | | | | | | | | |
| Energy Equipment & Services (0.7%) | | | | | | | | |
| Schlumberger Ltd. | | | 12,500 | | | | 1,077,375 | |
| | | | | | | | | |
| Health Care Equipment & Supplies (8.6%) | | | | | | | | |
| Analogic Corp. | | | 5,000 | | | | 394,500 | |
| Becton Dickinson and Co. | | | 41,500 | | | | 5,878,475 | |
| CONMED Corp. | | | 48,150 | | | | 2,805,701 | |
| Medtronic PLC | | | 26,290 | | | | 1,948,089 | |
| Varian Medical Systems, Inc.* | | | 20,000 | | | | 1,686,600 | |
| | | | | | | | 12,713,365 | |
| | | | | | | | | |
| Health Care Providers & Services (8.1%) | | | | | | | | |
| Express Scripts Holding Co.*† | | | 135,000 | | | | 12,006,900 | |
| | | | | | | | | |
| Health Care Technology (0.1%) | | | | | | | | |
| Castlight Health, Inc.* | | | 10,000 | | | | 81,400 | |
| | | | | | | | | |
| Internet Software & Services (3.5%) | | | | | | | | |
| Akamai Technologies, Inc.* | | | 48,000 | | | | 3,351,360 | |
| Amber Road, Inc.* | | | 154,500 | | | | 1,084,590 | |
| Q2 Holdings, Inc.* | | | 20,000 | | | | 565,000 | |
| Reis, Inc. | | | 10,000 | | | | 221,800 | |
| | | | | | | | 5,222,750 | |
| | | | | | | | | |
| Life Sciences Tools & Services (6.9%) | | | | | | | | |
| Bruker Corp.* | | | 25,000 | | | | 510,250 | |
| Thermo Fisher Scientific, Inc.† | | | 75,000 | | | | 9,732,000 | |
| | | | | | | | 10,242,250 | |
| | | | | | | | | |
| Media (3.1%) | | | | | | | | |
| Comcast Corp. | | | 60,000 | | | | 3,608,400 | |
| Discovery Communications, Inc. Class A* | | | 5,000 | | | | 166,300 | |
| Discovery Communications, Inc. Class C* | | | 5,000 | | | | 155,400 | |
| Time, Inc. | | | 5,000 | | | | 115,050 | |
| Twenty-First Century Fox, Inc. | | | 10,000 | | | | 325,450 | |
| World Wrestling Entertainment, Inc. | | | 12,500 | | | | 206,250 | |
| | | | | | | | 4,576,850 | |
| | | | | | | | | |
| Oil, Gas & Consumable Fuels (2.6%) | | | | | | | | |
| Hess Corp.† | | | 52,500 | | | | 3,511,200 | |
| WPX Energy, Inc.* | | | 27,500 | | | | 337,700 | |
| | | | | | | | 3,848,900 | |
| | | | | | | | | |
| Pharmaceuticals (0.4%) | | | | | | | | |
| Corium International, Inc.* | | | 40,000 | | | | 547,600 | |
| | | | | | | | | |
| Professional Services (0.7%) | | | | | | | | |
| WageWorks, Inc.* | | | 23,500 | | | | 950,575 | |
| | | | | | | | | |
| Semiconductors & Semiconductor Equipment (13.7%) | | | | | | | | |
| Brooks Automation, Inc. | | | 90,000 | | | | 1,030,500 | |
| Entegris, Inc.* | | | 250,000 | | | | 3,642,500 | |
| FormFactor, Inc.* | | | 665,000 | | | | 6,118,000 | |
| Micrel, Inc. | | | 22,150 | | | | 307,885 | |
| MKS Instruments, Inc. | | | 67,500 | | | | 2,560,950 | |
| Nova Measuring Instruments Ltd.* | | | 130,000 | | | | 1,625,000 | |
| PDF Solutions, Inc.* | | | 184,250 | | | | 2,948,000 | |
| Photronics, Inc.* | | | 206,500 | | | | 1,963,815 | |
| | | | | | | | 20,196,650 | |
See accompanying notes to financial statements.
Semi-Annual Report 2015
Needham Growth Fund
Schedule of Investments (Continued)
June 30, 2015 (Unaudited)
| | | Shares | | | Market Value | |
| Common Stocks - Continued | | | | | | | | |
| | | | | | | | | |
| Software (0.8%) | | | | | | | | |
| Barracuda Networks, Inc.* | | | 28,023 | | | $ | 1,110,271 | |
| | | | | | | | | |
| Specialty Retail (6.0%) | | | | | | | | |
| CarMax, Inc.*† | | | 112,500 | | | | 7,448,625 | |
| Dick’s Sporting Goods, Inc.† | | | 24,000 | | | | 1,242,480 | |
| Tiffany & Co. | | | 2,500 | | | | 229,500 | |
| | | | | | | | 8,920,605 | |
| | | | | | | | | |
| Technology Hardware, Storage & Peripherals (5.9%) | | | | | | | | |
| Electronics For Imaging, Inc.* | | | 70,000 | | | | 3,045,700 | |
| Super Micro Computer, Inc.* | | | 192,500 | | | | 5,694,150 | |
| | | | | | | | 8,739,850 | |
| | | | | | | | | |
| Thrifts & Mortgage Finance (0.3%) | | | | | | | | |
| Ladder Capital Corp. | | | 28,577 | | | | 495,811 | |
| | | | | | | | | |
| Trading Companies & Distributors (1.0%) | | | | | | | | |
| Air Lease Corp. | | | 45,000 | | | | 1,525,500 | |
| | | | | | | | | |
| Total Common Stocks | | | | | | | | |
| (Cost $62,731,492) | | | | | | $ | 134,665,446 | |
| | | | | | | | | |
| Short-Term Investment (9.0%) | | | | | | |
| | | | | | | | | |
| Money Market Fund (9.0%) | | | | | | | | |
| Dreyfus Treasury Prime Cash | | | | | | | | |
| Management 0.00%(a) | | | | | | | | |
| (Cost $13,295,589) | | | 13,295,589 | | | | 13,295,589 | |
| | | | | | | | | |
| Total Investments (100.1%) | | | | | | | | |
| (Cost $76,027,081) | | | | | | | 147,961,035 | |
| Total Securities Sold Short (-3.8%) | | | | | | | | |
| (Proceeds $5,184,111) | | | | | | | (5,659,064 | ) |
| Other Assets in Excess of Liabilities | | | | | | | | |
| (3.7%) | | | | | | | 5,420,685 | |
| Net Assets (100.0%) | | | | | | $ | 147,722,656 | |
| * | Non-income producing security. |
| (a) | Rate shown is the seven day yield as of June 30, 2015. |
| † | Security position is either entirely or partially held in a segregated account as collateral for securities sold short, aggregating a total market value of $3,434,075. |
The Global Industry Classification Standard (GICS®) was developed by and/or is the exclusive property of MSCI, Inc. and Standard & Poor’s Financial Services LLC (“S&P”). GICS is a service mark of MSCI and S&P and has been licensed for use by U.S. Bancorp Fund Services, LLC.
See accompanying notes to financial statements.
Needham Funds
Needham Growth Fund
Schedule of Securities Sold Short
June 30, 2015 (Unaudited)
| | | Shares | | | Market Value | |
| Securities Sold Short (-3.1%) | | | | | | | | |
| | | | | | | | | |
| Capital Markets (-0.4%) | | | | | | | | |
| Medallion Financial Corp. | | | 78,250 | | | $ | 653,387 | |
| | | | | | | | | |
| Communications Equipment (-1.4%) | | | | | | | | |
| Ubiquiti Networks, Inc. | | | 63,500 | | | | 2,026,603 | |
| | | | | | | | | |
| Electrical Equipment (-0.1%) | | | | | | | | |
| Power Solutions International, Inc.* | | | 2,000 | | | | 108,040 | |
| | | | | | | | | |
| Health Care Providers & Services (0.0%) | | | | | | | | |
| Trupanion, Inc.* | | | 7,500 | | | | 61,800 | |
| | | | | | | | | |
| Internet Software & Services (-0.1%) | | | | | | | | |
| SPS Commerce, Inc.* | | | 3,000 | | | | 197,400 | |
| | | | | | | | | |
| Semiconductors & Semiconductor Equipment (0.0%) | | | | | | | | |
| Applied Micro Circuits Corp.* | | | 5,000 | | | | 33,750 | |
| | | | | | | | | |
| Software (-1.0%) | | | | | | | | |
| ANSYS, Inc.* | | | 16,000 | | | | 1,459,840 | |
| | | | | | | | | |
| Technology Hardware, Storage & Peripherals (-0.1%) | | | | | | | | |
| QLogic Corp.* | | | 5,000 | | | | 70,950 | |
| | | | | | | | | |
| Total Securities Sold Short (-3.1%) | | | | | | | | |
| (Proceeds $4,151,913) | | | | | | | 4,611,770 | |
| | | | | | | | | |
| Exchange Traded Funds Sold Short (-0.7%) | | | | | | | | |
| iShares Russell 2000 ETF | | | 1,250 | | | | 156,075 | |
| iShares Russell 2000 Growth ETF | | | 1,250 | | | | 193,225 | |
| iShares Russell 2000 Value ETF | | | 1,400 | | | | 142,744 | |
| Market Vectors Semiconductor ETF | | | 10,175 | | | | 555,250 | |
| | | | | | | | 1,047,294 | |
| | | | | | | | | |
| Total Exchange Traded Funds Sold Short | | | | | | | | |
| (Proceeds $1,032,198) | | | | | | | 1,047,294 | |
| | | | | | | | | |
| Total Securities Sold Short (-3.8%) | | | | | | | | |
| (Proceeds $5,184,111) | | | | | | $ | 5,659,064 | |
| * | Non-income producing security. |
See accompanying notes to financial statements.
Semi-Annual Report 2015
Needham Aggressive Growth Fund
Schedule of Investments
June 30, 2015 (Unaudited)
| | | Shares | | | Market Value | |
| Common Stocks (99.8%) | | | | | | | | |
| | | | | | | | | |
| Aerospace & Defense (1.6%) | | | | | | | | |
| Precision Castparts Corp.† | | | 5,000 | | | $ | 999,350 | |
| | | | | | | | | |
| Biotechnology (6.9%) | | | | | | | | |
| Foundation Medicine, Inc.* | | | 2,500 | | | | 84,600 | |
| Gilead Sciences, Inc.† | | | 36,000 | | | | 4,214,880 | |
| | | | | | | | 4,299,480 | |
| | | | | | | �� | | |
| Capital Markets (2.4%) | | | | | | | | |
| Financial Engines, Inc.† | | | 30,000 | | | | 1,274,400 | |
| GSV Capital Corp.* | | | 18,700 | | | | 192,797 | |
| | | | | | | | 1,467,197 | |
| | | | | | | | | |
| Commercial Services & Supplies (0.3%) | | | | | | | | |
| Clean Harbors, Inc.* | | | 3,000 | | | | 161,220 | |
| | | | | | | | | |
| Communications Equipment (7.6%) | | | | | | | | |
| KVH Industries, Inc.* | | | 241,850 | | | | 3,252,883 | |
| Norsat International, Inc.* | | | 20,000 | | | | 100,400 | |
| ViaSat, Inc.*† | | | 23,000 | | | | 1,385,980 | |
| | | | | | | | 4,739,263 | |
| | | | | | | | | |
| Electrical Equipment (0.9%) | | | | | | | | |
| Vicor Corp.* | | | 45,000 | | | | 548,550 | |
| | | | | | | | | |
| Electronic Equipment, Instruments & Components (7.6%) | | | | | | | | |
| Checkpoint Systems, Inc. | | | 2,500 | | | | 25,450 | |
| Electro Scientific Industries, Inc. | | | 25,000 | | | | 131,750 | |
| FEI Co.† | | | 14,000 | | | | 1,161,020 | |
| Flir Systems, Inc. | | | 7,500 | | | | 231,150 | |
| Frequency Electronics, Inc.* | | | 101,075 | | | | 1,140,126 | |
| II-VI, Inc.* | | | 10,000 | | | | 189,800 | |
| IPG Photonics Corp.*† | | | 5,000 | | | | 425,875 | |
| National Instruments Corp. | | | 5,000 | | | | 147,300 | |
| Newport Corp.* | | | 5,000 | | | | 94,800 | |
| Sutron Corp.* | | | 17,500 | | | | 147,875 | |
| Vishay Precision Group, Inc.* | | | 70,000 | | | | 1,054,200 | |
| | | | | | | | 4,749,346 | |
| | | | | | | | | |
| Health Care Equipment & Supplies (2.7%) | | | | | | | | |
| Analogic Corp. | | | 5,000 | | | | 394,500 | |
| Becton Dickinson and Co. | | | 4,500 | | | | 637,425 | |
| LeMaitre Vascular, Inc. | | | 55,000 | | | | 663,300 | |
| | | | | | | | 1,695,225 | |
| | | | | | | | | |
| Health Care Providers & Services (0.9%) | | | | | | | | |
| Express Scripts Holding Co.*† | | | 6,000 | | | | 533,640 | |
| | | | | | | | | |
| Health Care Technology (0.8%) | | | | | | | | |
| Omnicell, Inc.* | | | 13,000 | | | | 490,230 | |
| | | | | | | | | |
| Hotels, Restaurants & Leisure (0.6%) | | | | | | | | |
| Panera Bread Co.* | | | 2,000 | | | | 349,540 | |
| | | | | | | | | |
| Household Durables (0.9%) | | | | | | | | |
| iRobot Corp.* | | | 5,000 | | | | 159,400 | |
| Libbey, Inc. | | | 10,000 | | | | 413,300 | |
| | | | | | | | 572,700 | |
| | | | | | | | | |
| Household Products (1.7%) | | | | | | | | |
| Oil-Dri Corp. of America | | | 34,800 | | | | 1,057,224 | |
| | | | | | | | | |
| Insurance (0.7%) | | | | | | | | |
| Crawford & Co. | | | 55,200 | | | | 420,072 | |
| | | | | | | | | |
| Internet Software & Services (15.4%) | | | | | | | | |
| Akamai Technologies, Inc.*† | | | 66,500 | | | | 4,643,030 | |
| Amber Road, Inc.* | | | 49,708 | | | | 348,950 | |
| ARI Network Services, Inc.* | | | 15,000 | | | | 46,950 | |
| ChannelAdvisor Corp.* | | | 17,500 | | | | 209,125 | |
| Constant Contact, Inc.*† | | | 55,000 | | | | 1,581,800 | |
| Coupons.com, Inc.* | | | 671 | | | | 7,240 | |
| Q2 Holdings, Inc.* | | | 12,500 | | | | 353,125 | |
| Reis, Inc. | | | 95,000 | | | | 2,107,100 | |
| TheStreet, Inc. | | | 155,025 | | | | 280,595 | |
| | | | | | | | 9,577,915 | |
| | | | | | | | | |
| Life Sciences Tools & Services (1.0%) | | | | | | | | |
| Bruker Corp.* | | | 30,000 | | | | 612,300 | |
| | | | | | | | | |
| Machinery (0.1%) | | | | | | | | |
| Kornit Digital Ltd* | | | 2,500 | | | | 34,400 | |
| | | | | | | | | |
| Media (0.3%) | | | | | | | | |
| Time, Inc. | | | 2,500 | | | | 57,525 | |
| World Wrestling Entertainment, Inc. | | | 6,000 | | | | 99,000 | |
| | | | | | | | 156,525 | |
| | | | | | | | | |
| Oil, Gas & Consumable Fuels (0.9%) | | | | | | | | |
| Hess Corp.† | | | 8,500 | | | | 568,480 | |
| | | | | | | | | |
| Pharmaceuticals (0.6%) | | | | | | | | |
| Corium International, Inc.* | | | 25,000 | | | | 342,250 | |
| | | | | | | | | |
| Professional Services (1.8%) | | | | | | | | |
| WageWorks, Inc.*† | | | 28,000 | | | | 1,132,600 | |
| | | | | | | | | |
| Real Estate Investment Trusts (REITs) (1.4%) | | | | | | | | |
| Equinix, Inc. | | | 3,499 | | | | 888,746 | |
See accompanying notes to financial statements.
Needham Funds
Needham Aggressive Growth Fund
Schedule of Investments (Continued)
June 30, 2015 (Unaudited)
| | | Shares | | | Market Value | |
| Common Stocks - Continued | | | | | | | | |
| | | | | | | | | |
| Semiconductors & Semiconductor Equipment (23.0%) | | | | | | | | |
| Brooks Automation, Inc. | | | 10,000 | | | $ | 114,500 | |
| Entegris, Inc.* | | | 200,000 | | | | 2,914,000 | |
| FormFactor, Inc.* | | | 432,500 | | | | 3,979,000 | |
| Micrel, Inc. | | | 10,480 | | | | 145,672 | |
| MKS Instruments, Inc.† | | | 29,100 | | | | 1,104,054 | |
| Nova Measuring Instruments Ltd.* | | | 94,900 | | | | 1,186,250 | |
| PDF Solutions, Inc.*† | | | 235,000 | | | | 3,760,000 | |
| Photronics, Inc.* | | | 114,700 | | | | 1,090,797 | |
| Xcerra Corp.* | | | 10,000 | | | | 75,700 | |
| | | | | | | | 14,369,973 | |
| | | | | | | | | |
| Software (3.4%) | | | | | | | | |
| Barracuda Networks, Inc.* | | | 13,539 | | | | 536,415 | |
| Bottomline Technologies, Inc.*† | | | 25,000 | | | | 695,250 | |
| Exa Corp.* | | | 5,000 | | | | 55,750 | |
| GSE Systems, Inc.* | | | 550,000 | | | | 852,500 | |
| | | | | | | | 2,139,915 | |
| | | | | | | | | |
| Specialty Retail (3.2%) | | | | | | | | |
| CarMax, Inc.*† | | | 22,500 | | | | 1,489,725 | |
| Dick’s Sporting Goods, Inc.† | | | 10,000 | | | | 517,700 | |
| | | | | | | | 2,007,425 | |
| | | | | | | | | |
| Technology Hardware, Storage & Peripherals (12.4%) | | | | | | | | |
| Apple, Inc.† | | | 23,000 | | | | 2,884,775 | |
| Avid Technology, Inc.* | | | 45,000 | | | | 600,300 | |
| Electronics For Imaging, Inc.*† | | | 39,000 | | | | 1,696,890 | |
| Super Micro Computer, Inc.*† | | | 85,500 | | | | 2,529,090 | |
| | | | | | | | 7,711,055 | |
| | | | | | | | | |
| Thrifts & Mortgage Finance (0.4%) | | | | | | | | |
| Ladder Capital Corp. | | | 13,318 | | | | 231,067 | |
| | | | | | | | | |
| Trading Companies & Distributors (0.3%) | | | | | | | | |
| Air Lease Corp. | | | 5,000 | | | | 169,500 | |
| | | | | | | | | |
| Total Common Stocks | | | | | | | | |
| (Cost $31,200,934) | | | | | | $ | 62,025,188 | |
| | | | | | | | | |
| Short-Term Investments (0.3%) | | | | | | | | |
| | | | | | | | | |
| Money Market Fund (0.3%) | | | | | | | | |
| Dreyfus Treasury Prime Cash | | | | | | | | |
| Management 0.00%(a) | | | | | | | | |
| (Cost $204,252) | | | 204,252 | | | | 204,252 | |
| | | | | | | | | |
| Total Investments (100.1%) | | | | | | | | |
| (Cost $31,405,186) | | | | | | | 62,229,440 | |
| Total Securities Sold Short (-5.5%) | | | | | | | | |
| (Proceeds $3,015,626) | | | | | | | (3,432,624 | ) |
| Other Assets in Excess of Liabilities | | | | | | | | |
| (5.4%) | | | | | | | 3,338,166 | |
| Net Assets (100.0%) | | | | | | $ | 62,134,982 | |
| * | Non-income producing security. |
| (a) | Rate shown is the seven day yield as of June 30, 2015. |
| † | Security position is either entirely or partially held in a segregated account as collateral for securities sold short, aggregating a total market value of $3,389,430. |
The Global Industry Classification Standard (GICS®) was developed by and/or is the exclusive property of MSCI, Inc. and Standard & Poor’s Financial Services LLC (“S&P”). GICS is a service mark of MSCI and S&P and has been licensed for use by U.S. Bancorp Fund Services, LLC.
See accompanying notes to financial statements.
Semi-Annual Report 2015
Needham Aggressive Growth Fund
Schedule of Securities Sold Short
June 30, 2015 (Unaudited)
| | | Shares | | | Market Value | |
| Securities Sold Short (-5.5%) | | | | | | | | |
| | | | | | | | | |
| Capital Markets (-1.2%) | | | | | | | | |
| Medallion Financial Corp. | | | 88,500 | | | $ | 738,975 | |
| | | | | | | | | |
| Communications Equipment (-2.4%) | | | | | | | | |
| Ubiquiti Networks, Inc. | | | 46,250 | | | | 1,476,069 | |
| | | | | | | | | |
| Containers & Packaging (-0.3%) | | | | | | | | |
| Greif, Inc. | | | 5,000 | | | | 179,250 | |
| | | | | | | | | |
| Electrical Equipment (-0.2%) | | | | | | | | |
| Power Solutions International, Inc.* | | | 2,000 | | | | 108,040 | |
| | | | | | | | | |
| Health Care Providers & Services (-0.1%) | | | | | | | | |
| Trupanion, Inc.* | | | 7,500 | | | | 61,800 | |
| | | | | | | | | |
| Semiconductors & Semiconductor Equipment (0.0%) | | | | | | | | |
| Applied Micro Circuits Corp.* | | | 5,000 | | | | 33,750 | |
| | | | | | | | | |
| Software (-0.9%) | | | | | | | | |
| ANSYS, Inc.* | | | 6,000 | | | | 547,440 | |
| | | | | | | | | |
| Thrifts & Mortgage Finance (-0.4%) | | | | | | | | |
| Federal Home Loan Mortgage Corp.* | | | 130,000 | | | | 287,300 | |
| | | | | | | | | |
| Total Securities Sold Short (-5.5%) | | | | | | | | |
| (Proceeds $3,015,626) | | | | | | $ | 3,432,624 | |
| * | Non-income producing security. |
See accompanying notes to financial statements.
Needham Funds
Needham Small Cap Growth Fund
Schedule of Investments
June 30, 2015 (Unaudited)
| | | Shares | | | Market Value | |
| Common Stocks (94.2%) | | | | | | | | |
| | | | | | | | | |
| Biotechnology (1.5%) | | | | | | | | |
| Exact Sciences Corp.* | | | 15,000 | | | $ | 446,100 | |
| | | | | | | | | |
| Commercial Services & Supplies (0.7%) | | | | | | | | |
| Clean Harbors, Inc.* | | | 4,000 | | | | 214,960 | |
| | | | | | | | | |
| Communications Equipment (10.3%) | | | | | | | | |
| KVH Industries, Inc.* | | | 136,450 | | | | 1,835,253 | |
| Ruckus Wireless, Inc.*† | | | 121,271 | | | | 1,253,942 | |
| | | | | | | | 3,089,195 | |
| | | | | | | | | |
| Electrical Equipment (0.3%) | | | | | | | | |
| Generac Holdings, Inc.* | | | 2,000 | | | | 79,500 | |
| | | | | | | | | |
| Electronic Equipment, Instruments & Components (21.4%) | | | | | | | | |
| Electro Scientific Industries, Inc. | | | 150,000 | | | | 790,500 | |
| Frequency Electronics, Inc.* | | | 101,075 | | | | 1,140,126 | |
| II-VI, Inc.*† | | | 55,000 | | | | 1,043,900 | |
| Ingram Micro, Inc.*† | | | 10,000 | | | | 250,300 | |
| Newport Corp.* | | | 74,100 | | | | 1,404,936 | |
| TTM Technologies, Inc.*† | | | 180,000 | | | | 1,798,200 | |
| | | | | | | | 6,427,962 | |
| | | | | | | | | |
| Health Care Equipment & Supplies (0.5%) | | | | | | | | |
| Cutera, Inc.* | | | 10,000 | | | | 154,800 | |
| | | | | | | | | |
| Health Care Providers & Services (2.1%) | | | | | | | | |
| Express Scripts Holding Co.*† | | | 7,000 | | | | 622,580 | |
| | | | | | | | | |
| Health Care Technology (0.3%) | | | | | | | | |
| Castlight Health, Inc.* | | | 10,000 | | | | 81,400 | |
| | | | | | | | | |
| Household Products (2.4%) | | | | | | | | |
| Oil-Dri Corp. of America | | | 23,700 | | | | 720,006 | |
| | | | | | | | | |
| Internet Software & Services (10.2%) | | | | | | | | |
| Amber Road, Inc.* | | | 150,000 | | | | 1,053,000 | |
| Reis, Inc. | | | 60,000 | | | | 1,330,800 | |
| TheStreet, Inc. | | | 383,350 | | | | 693,863 | |
| | | | | | | | 3,077,663 | |
| | | | | | | | | |
| Media (0.1%) | | | | | | | | |
| World Wrestling Entertainment, Inc. | | | 2,500 | | | | 41,250 | |
| | | | | | | | | |
| Oil, Gas & Consumable Fuels (5.2%) | | | | | | | | |
| Hess Corp.† | | | 7,500 | | | | 501,600 | |
| WPX Energy, Inc.*† | | | 87,500 | | | | 1,074,500 | |
| | | | | | | | 1,576,100 | |
| | | | | | | | | |
| Semiconductors & Semiconductor Equipment (26.3%) | | | | | | | | |
| Entegris, Inc.* | | | 100,000 | | | | 1,457,000 | |
| FormFactor, Inc.*† | | | 200,000 | | | | 1,840,000 | |
| MKS Instruments, Inc.† | | | 30,000 | | | | 1,138,200 | |
| Nanometrics, Inc.* | | | 25,000 | | | | 403,000 | |
| PDF Solutions, Inc.* | | | 55,000 | | | | 880,000 | |
| Photronics, Inc.* | | | 133,500 | | | | 1,269,585 | |
| Ultra Clean Holdings, Inc.* | | | 150,000 | | | | 934,500 | |
| | | | | | | | 7,922,285 | |
| | | | | | | | | |
| Software (0.3%) | | | | | | | | |
| FireEye, Inc.* | | | 2,000 | | | | 97,820 | |
| | | | | | | | | |
| Technology Hardware, Storage & Peripherals (7.3%) | | | | | | | | |
| Silicon Graphics International Corp.* | | | 132,524 | | | | 857,430 | |
| Super Micro Computer, Inc.*† | | | 45,000 | | | | 1,331,100 | |
| | | | | | | | 2,188,530 | |
| | | | | | | | | |
| Thrifts & Mortgage Finance (1.1%) | | | | | | | | |
| LendingTree, Inc.* | | | 4,000 | | | | 314,440 | |
| | | | | | | | | |
| Trading Companies & Distributors (4.2%) | | | | | | | | |
| Air Lease Corp.† | | | 37,500 | | | | 1,271,250 | |
| | | | | | | | | |
| Total Common Stocks | | | | | | | | |
| (Cost $26,457,142) | | | | | | $ | 28,325,841 | |
| | | | | | | | | |
| Short-Term Investment (6.2%) | | | | | | | | |
| | | | | | | | | |
| Money Market Fund (6.2%) | | | | | | | | |
| Dreyfus Treasury Prime Cash | | | | | | | | |
| Management 0.00%(a) | | | | | | | | |
| (Cost $1,866,464) | | | 1,866,464 | | | $ | 1,866,464 | |
| | | | | | | | | |
| Total Investments (100.4%) | | | | | | | | |
| (Cost $28,323,606) | | | | | | | 30,192,305 | |
| Total Securities Sold Short (-8.1%) | | | | | | | | |
| (Proceeds $2,422,884) | | | | | | | (2,423,368 | ) |
| Other Assets in Excess of Liabilities | | | | | | | | |
| (7.7%) | | | | | | | 2,304,464 | |
| Net Assets (100.0%) | | | | | | $ | 30,073,401 | |
| * | Non-income producing security. |
| (a) | Rate shown is the seven day yield as of June 30, 2015. |
| † | Security position is either entirely or partially held in a segregated account as collateral for securities sold short, aggregating a total market value of $1,095,106. |
The Global Industry Classification Standard (GICS®) was developed by and/or is the exclusive property of MSCI, Inc. and Standard & Poor’s Financial Services LLC (“S&P”). GICS is a service mark of MSCI and S&P and has been licensed for use by U.S. Bancorp Fund Services, LLC.
See accompanying notes to financial statements.
Semi-Annual Report 2015
Needham Small Cap Growth Fund
Schedule of Securities Sold Short
June 30, 2015 (Unaudited)
| | | Shares | | | Market Value | |
| Securities Sold Short (-2.8%) | | | | | | | | |
| | | | | | | | | |
| Communications Equipment (-0.9%) | | | | | | | | |
| Ubiquiti Networks, Inc. | | | 8,000 | | | $ | 255,320 | |
| | | | | | | | | |
| Internet Software & Services (-0.9%) | | | | | | | | |
| SPS Commerce, Inc.* | | | 4,000 | | | | 263,200 | |
| | | | | | | | | |
| Software (-0.3%) | | | | | | | | |
| ANSYS, Inc.* | | | 1,000 | | | | 91,240 | |
| | | | | | | | | |
| Technology Hardware, Storage & Peripherals (-0.7%) | | | | | | | | |
| QLogic Corp.* | | | 15,000 | | | | 212,850 | |
| | | | | | | | | |
| Total Securities Sold Short (-2.8%) | | | | | | | | |
| (Proceeds $826,152) | | | | | | | 822,610 | |
| | | | | | | | | |
| Exchange Traded Funds Sold Short (-5.3%) | | | | | | | | |
| iShares Russell 2000 ETF | | | 2,500 | | | | 312,150 | |
| iShares Russell 2000 Growth ETF | | | 2,000 | | | | 309,160 | |
| iShares Russell 2000 Value ETF | | | 2,850 | | | | 290,586 | |
| Market Vectors Semiconductor ETF | | | 6,575 | | | | 358,798 | |
| iShares Core S&P Small-Cap ETF† | | | 2,800 | | | | 330,064 | |
| | | | | | | | 1,600,758 | |
| | | | | | | | | |
| Total Exchange Traded Funds Sold Short | | | | | | | | |
| (Proceeds $1,596,732) | | | | | | | 1,600,758 | |
| | | | | | | | | |
| Total Securities Sold Short (-8.1%) | | | | | | | | |
| (Proceeds $2,422,884) | | | | | | $ | 2,423,368 | |
| * | Non-income producing security. |
See accompanying notes to financial statements.
Needham Funds
Statements of Assets and Liabilities
June 30, 2015 (Unaudited)
| | | | | | Needham | | | Needham | |
| | | Needham | | | Aggressive | | | Small Cap | |
| | | Growth Fund | | | Growth Fund | | | Growth Fund | |
| Assets | | | | | | | | | | | | |
| Investments, at Value | | | | | | | | | | | | |
| (Cost $76,027,081, $31,405,186, $28,323,606) | | $ | 147,961,035 | | | $ | 62,229,440 | | | $ | 30,192,305 | |
| Receivables: | | | | | | | | | | | | |
| Deposit with Broker for Securities Sold Short | | | 5,969,175 | | | | 3,558,545 | | | | 2,631,273 | |
| Dividends and Interest | | | 66,790 | | | | 5,625 | | | | 1,500 | |
| Fund Shares Sold | | | 19,439 | | | | 1,204 | | | | 8,716 | |
| Investment Securities Sold | | | 114,065 | | | | 256,715 | | | | 166,092 | |
| Prepaid Expenses | | | 20,145 | | | | 12,691 | | | | 18,065 | |
| Total Assets | | | 154,150,649 | | | | 66,064,220 | | | | 33,017,951 | |
| | | | | | | | | | | | | |
| Liabilities | | | | | | | | | | | | |
| Securities Sold Short, at Value | | | | | | | | | | | | |
| (Proceeds $5,184,111, $3,015,626, $2,422,884) | | | 5,659,064 | | | | 3,432,624 | | | | 2,423,368 | |
| Payables: | | | | | | | | | | | | |
| Investment Securities Purchased | | | 494,998 | | | | 344,512 | | | | 445,390 | |
| Fund Shares Redeemed | | | 2,033 | | | | 22,333 | | | | 6,130 | |
| Due to Adviser | | | 154,716 | | | | 65,528 | | | | 27,577 | |
| Distribution Fees | | | 31,233 | | | | 13,234 | | | | 6,418 | |
| Administration and Accounting Fees | | | 25,922 | | | | 12,376 | | | | 6,610 | |
| Transfer Agent Fees | | | 9,768 | | | | 8,128 | | | | 7,152 | |
| Accrued Expenses and Other Liabilities | | | 50,259 | | | | 30,503 | | | | 21,905 | |
| Total Liabilities | | | 6,427,993 | | | | 3,929,238 | | | | 2,944,550 | |
| | | | | | | | | | | | | |
| Net Assets | | $ | 147,722,656 | | | $ | 62,134,982 | | | $ | 30,073,401 | |
| Shares Issued and Outstanding $0.001 Par Value (Authorized 800,000,000,100,000,000 and 100,000,000 respectively) | | | 3,102,731 | | | | 2,566,805 | | | | 2,078,706 | |
| Net Asset Value, Offering and Redemption Price Per Share(a) | | $ | 47.61 | | | $ | 24.21 | | | $ | 14.47 | |
| | | | | | | | | | | | | |
| Components of Net Assets | | | | | | | | | | | | |
| Paid-in Capital | | | 65,328,383 | | | | 28,961,792 | | | | 26,658,546 | |
| Accumulated Net Investment Loss | | | (981,592 | ) | | | (469,966 | ) | | | (248,070 | ) |
| Accumulated Net Realized Gain from Investments, Securities Sold Short, Foreign Currency Transactions and Currency | | | 11,916,864 | | | | 3,235,900 | | | | 1,794,710 | |
Net Unrealized Appreciation on Investment Securities and Securities Sold Short
| | | 71,459,001 | | | | 30,407,256 | | | | 1,868,215 | |
| Total Net Assets | | $ | 147,722,656 | | | $ | 62,134,982 | | | $ | 30,073,401 | |
| (a) | Subject to certain exceptions, a 2% redemption fee is imposed upon shares redeemed within 60 days of their purchase. See Note 2 of the notes to financial statements. |
See accompanying notes to financial statements.
Statements of Operations
For the six months ended June 30, 2015 (Unaudited)
| | | | | | Needham | | | Needham | |
| | | Needham | | | Aggressive | | | Small Cap | |
| | | Growth Fund | | | Growth Fund | | | Growth Fund | |
| Investment Income | | | | | | | | | | | | |
| Dividends | | $ | 372,224 | | | $ | 167,646 | | | $ | 63,101 | |
| Interest | | | 3 | | | | — | | | | — | |
| Total Investment Income | | | 372,227 | | | | 167,646 | | | | 63,101 | |
| | | | | | | | | | | | | |
| Expenses | | | | | | | | | | | | |
| Investment Advisory Fees | | | 932,412 | | | | 390,368 | | | | 196,156 | |
| Distribution Fees | | | 186,482 | | | | 78,074 | | | | 39,231 | |
| Administration and Accounting Fees | | | 79,575 | | | | 36,977 | | | | 19,380 | |
| Audit Fees | | | 15,433 | | | | 10,471 | | | | 10,555 | |
| Chief Compliance Officer Fees | | | 11,480 | | | | 4,774 | | | | 2,407 | |
| Custodian Fees | | | 4,849 | | | | 3,878 | | | | 3,653 | |
| Directors’ Fees | | | 19,432 | | | | 8,142 | | | | 4,175 | |
| Dividend Expense(1) | | | 20,000 | | | | 20,225 | | | | 896 | |
| Filing Fees | | | 11,379 | | | | 10,086 | | | | 12,372 | |
| Interest Expense(1) | | | 28,480 | | | | 26,905 | | | | 4,272 | |
| Legal Fees | | | 19,468 | | | | 8,054 | | | | 4,003 | |
| Printing Fees | | | 9,203 | | | | 4,326 | | | | 4,912 | |
| Transfer Agent Fees | | | 30,121 | | | | 25,086 | | | | 21,922 | |
| Other Expenses | | | 18,183 | | | | 10,244 | | | | 8,517 | |
| Total Expenses | | | 1,386,497 | | | | 637,610 | | | | 332,451 | |
| Fees Waived by Investment Adviser | | | — | | | | — | | | | (21,280 | ) |
| Net Expenses | | | 1,386,497 | | | | 637,610 | | | | 311,171 | |
| Net Investment Loss | | | (1,014,270 | ) | | | (469,964 | ) | | | (248,070 | ) |
| | | | | | | | | | | | | |
| Net Realized/Unrealized Gain (Loss) from Investments, Securities Sold Short, Foreign Currency Transactions and Currency | | | | | | | | | | | | |
| Net Realized Gain from Investments | | | 8,446,174 | | | | 3,357,646 | | | | 2,404,058 | |
| Net Realized Gain (Loss) from Securities Sold Short | | | (195,121 | ) | | | (63,004 | ) | | | 3,286 | |
| Net Realized Loss from Foreign Currency Transactions and Currency | | | — | | | | (286 | ) | | | — | |
| Change in Unrealized Depreciation on Investments and Securities Sold Short | | | (2,069,926 | ) | | | (1,111,435 | ) | | | (1,066,509 | ) |
| Change in Unrealized Appreciation on Foreign Currency Transactions and Currency | | | — | | | | 57 | | | | — | |
| Net Realized/Unrealized Gain from Investments, Securities Sold Short, Foreign Currency Transactions and Currency | | | 6,181,127 | | | | 2,182,978 | | | | 1,340,835 | |
| Change in Net Assets Resulting from Operations | | $ | 5,166,857 | | | $ | 1,713,014 | | | $ | 1,092,765 | |
| (1) | Expense related to securities sold short. |
See accompanying notes to financial statements.
Statements of Changes in Net Assets
| | | | | | | | Needham Aggressive | | | | | Needham Small Cap | |
| | | Needham Growth Fund | | | | | Growth Fund | | | | | Growth Fund | |
| | | Six Months | | | Year Ended | | | | | Six Months | | | Year Ended | | | | | Six Months | | | Year Ended | |
| | | Ended June 30, | | | December 31, | | | | | Ended June 30, | | | December 31, | | | | | Ended June 30, | | | December 31, | |
| | | 2015 | | | 2014 | | | | | 2015 | | | 2014 | | | | | 2015 | | | 2014 | |
| | | (Unaudited) | | | | | | | | (Unaudited) | | | | | | | | (Unaudited) | | | | |
| Change in Net Assets | | | | | | | | | | | | | | | | | | | | | | | | | | | | |
| Operations: | | | | | | | | | | | | | | | | | | | | | | | | | | | | |
| Net Investment Loss | | $ | (1,014,270 | ) | | $ | (1,875,063 | ) | | | | $ | (469,964 | ) | | $ | (1,005,141 | ) | | | | $ | (248,070 | ) | | $ | (552,072 | ) |
| Net Realized Gain from Investments, Securities Sold Short, Foreign Currency Transactions, and Currency | | | 8,251,053 | | | | 9,622,864 | | | | | | 3,294,356 | | | | 6,415,833 | | | | | | 2,407,344 | | | | 2,071,624 | |
| Net Change in Unrealized Appreciation (Depreciation) on Investments, Securities Sold Short, Foreign Currency Transactions and Currency | | | (2,069,926 | ) | | | 4,452,922 | | | | | | (1,111,378 | ) | | | (1,328,100 | ) | | | | | (1,066,509 | ) | | | (1,701,768 | ) |
| Change in Net Assets Resulting from Operations | | | 5,166,857 | | | | 12,200,723 | | | | | | 1,713,014 | | | | 4,082,592 | | | | | | 1,092,765 | | | | (182,216 | ) |
| | | | | | | | | | | | | | | | | | | | | | | | | | | | | |
| Distributions to Shareholders from: | | | | | | | | | | | | | | | | | | | | | | | | | | | | |
| Net Investment Income | | | — | | | | — | | | | | | — | | | | — | | | | | | — | | | | — | |
| Capital Gains | | | — | | | | (9,182,356 | ) | | | | | — | | | | (1,852,789 | ) | | | | | — | | | | (3,642,737 | ) |
| Total Distributions to Shareholders | | | — | | | | (9,182,356 | ) | | | | | — | | | | (1,852,789 | ) | | | | | — | | | | (3,642,737 | ) |
| | | | | | | | | | | | | | | | | | | | | | | | | | | | | |
| Capital Transactions: | | | | | | | | | | | | | | | | | | | | | | | | | | | | |
| Shares Issued | | | 2,733,303 | | | | 12,224,922 | | | | | | 2,781,785 | | | | 3,447,337 | | | | | | 1,449,123 | | | | 3,876,827 | |
| Shares Issued in Reinvestment of Distribution | | | — | | | | 8,793,743 | | | | | | — | | | | 1,817,962 | | | | | | — | | | | 3,491,790 | |
| Shares Redeemed | | | (7,997,168 | ) | | | (17,914,336 | ) | | | | | (4,713,625 | ) | | | (13,602,601 | ) | | | | | (4,584,956 | ) | | | (15,377,681 | ) |
| Redemption Fees | | | 3,395 | | | | 79 | | | | | | 639 | | | | 1,372 | | | | | | 17 | | | | 173 | |
| Change in Net Assets from Capital Transactions | | | (5,260,470 | ) | | | 3,104,408 | | | | | | (1,931,201 | ) | | | (8,335,930 | ) | | | | | (3,135,816 | ) | | | (8,008,891 | ) |
| | | | | | | | | | | | | | | | | | | | | | | | | | | | | |
| Change in Net Assets | | | (93,613 | ) | | | 6,122,775 | | | | | | (218,187 | ) | | | (6,106,127 | ) | | | | | (2,043,051 | ) | | | (11,833,844 | ) |
| | | | | | | | | | | | | | | | | | | | | | | | | | | | | |
| Net Assets | | | | | | | | | | | | | | | | | | | | | | | | | | | | |
| Beginning of Period | | | 147,816,269 | | | | 141,693,494 | | | | | | 62,353,169 | | | | 68,459,296 | | | | | | 32,116,452 | | | | 43,950,296 | |
| End of Period | | $ | 147,722,656 | | | $ | 147,816,269 | | | | | $ | 62,134,982 | | | $ | 62,353,169 | | | | | $ | 30,073,401 | | | $ | 32,116,452 | |
| Accumulated Net Investment Gain (Loss) | | $ | (981,592 | ) | | $ | 32,678 | | | | | $ | (469,966 | ) | | $ | (2 | ) | | | | $ | (248,070 | ) | | $ | — | |
| | | | | | | | | | | | | | | | | | | | | | | | | | | | | |
| Share Transaction: | | | | | | | | | | | | | | | | | | | | | | | | | | | | |
| Number of Shares Issued | | | 57,949 | | | | 267,721 | | | | | | 114,365 | | | | 152,427 | | | | | | 99,787 | | | | 255,422 | |
| Number of Shares Reinvested | | | — | | | | 193,652 | | | | | | — | | | | 78,734 | | | | | | — | | | | 255,809 | |
| Number of Shares Redeemed | | | (168,362 | ) | | | (392,522 | ) | | | | | (194,695 | ) | | | (605,395 | ) | | | | | (314,010 | ) | | | (1,030,428 | ) |
| Change in Shares | | | (110,413 | ) | | | 68,851 | | | | | | (80,330 | ) | | | (374,234 | ) | | | | | (214,223 | ) | | | (519,197 | ) |
See accompanying notes to financial statements.
Needham Growth Fund
Financial Highlights
| | | Six Months | | | | | | | | | | | | | | | | |
| | | Ended | | | | | | | | | | | | | | | | |
| | | June 30, | | | | | | | | | | |
| (For a Share Outstanding | | 2015 | | | Year Ended December 31, | |
| Throughout each Period) | | (Unaudited) | | | 2014 | | | 2013 | | | 2012 | | | 2011 | | | 2010 | |
| Net Asset Value, Beginning of Year | | $ | 46.00 | | | $ | 45.06 | | | $ | 33.66 | | | $ | 32.78 | | | $ | 39.11 | | | $ | 29.77 | |
| Investment Operations | | | | | | | | | | | | | | | | | | | | | | | | |
| Net Investment Loss | | | (0.33 | ) | | | (0.58 | ) | | | (0.54 | ) | | | (0.24 | ) | | | (0.58 | ) | | | (0.60 | ) |
| Net Realized and Unrealized Gain (Loss) on Investments | | | 1.94 | | | | 4.59 | | | | 12.20 | | | | 4.31 | | | | (3.79 | ) | | | 9.94 | |
| Total from Investment Operations | | | 1.61 | | | | 4.01 | | | | 11.66 | | | | 4.07 | | | | (4.37 | ) | | | 9.34 | |
| | | | | | | | | | | | | | | | | | | | | | | | | |
| Less Distributions | | | | | | | | | | | | | | | | | | | | | | | | |
| Net Realized Gains | | | — | | | | (3.07 | ) | | | (0.26 | ) | | | (3.19 | ) | | | (1.97 | ) | | | — | |
| Total Distributions | | | — | | | | (3.07 | ) | | | (0.26 | ) | | | (3.19 | ) | | | (1.97 | ) | | | — | |
| | | | | | | | | | | | | | | | | | | | | | | | | |
| Capital Contributions | | | | | | | | | | | | | | | | | | | | | | | | |
| Redemption Fees | | | — | (a) | | | — | (a) | | | — | (a) | | | — | (a) | | | 0.01 | | | | — | (a) |
| Total Capital Contributions | | | — | (a) | | | — | (a) | | | — | (a) | | | — | (a) | | | 0.01 | | | | — | (a) |
| Net Asset Value, End of Year | | $ | 47.61 | | | $ | 46.00 | | | $ | 45.06 | | | $ | 33.66 | | | $ | 32.78 | | | $ | 39.11 | |
| | | | | | | | | | | | | | | | | | | | | | | | | |
| Total Return | | | 3.50 | % | | | 8.98 | % | | | 34.68 | % | | | 12.80 | % | | | (10.94 | )% | | | 31.37 | % |
| Net Assets, End of Year (000’s) | | $ | 147,723 | | | $ | 147,816 | | | $ | 141,693 | | | $ | 113,561 | | | $ | 125,966 | | | $ | 159,805 | |
| Ratios/Supplemental Data | | | | | | | | | | | | | | | | | | | | | | | | |
| Ratio of Total Expenses to Average Net Assets | | | 1.86 | %(b) | | | 1.84 | % | | | 1.89 | % | | | 1.94 | % | | | 1.81 | % | | | 2.11 | % |
| Ratio of Total Expenses to Average Net Assets (before interest and dividend expense) | | | 1.79 | %(b) | | | 1.80 | % | | | 1.82 | % | | | 1.82 | % | | | 1.78 | % | | | 2.00 | % |
| Ratio of Total Expenses to Average Net Assets (before waiver and reimbursement of expenses) | | | 1.86 | %(b) | | | 1.84 | % | | | 1.89 | % | | | 1.94 | % | | | 1.81 | % | | | 2.11 | % |
| Ratio of Net Investment Income (Loss) to Average Net Assets | | | (1.36 | )%(b) | | | (1.32 | )% | | | (1.30 | )% | | | (0.65 | )% | | | (1.41 | )% | | | (1.85 | )% |
| Ratio of Net Investment Income (Loss) to Average Net Assets (before waivers and reimbursements of expenses) | | | (1.36 | )%(b) | | | (1.32 | )% | | | (1.30 | )% | | | (0.65 | )% | | | (1.41 | )% | | | (1.85 | )% |
| Portfolio turnover rate | | | 8 | %(2) | | | 12 | % | | | 12 | % | | | 17 | % | | | 29 | % | | | 62 | % |
| (a) | Value is less than $0.005 per share. |
| (b) | Annualized for periods less than one year. |
| (c) | Not annualized for periods less than one year. |
See accompanying notes to financial statements.
Needham Aggressive Growth Fund
Financial Highlights
| | | Six Months | | | | | | | | | | | | | | | | |
| | | Ended | | | | | | | | | | | | | | | | |
| | | June 30, | | | | |
| (For a Share Outstanding | | 2015 | | | Year Ended December 31, | |
| Throughout each Period) | | (Unaudited) | | | 2014 | | | 2013 | | | 2012 | | | 2011 | | | 2010 | |
| Net Asset Value, Beginning of Year | | $ | 23.55 | | | $ | 22.66 | | | $ | 16.63 | | | $ | 14.52 | | | $ | 17.14 | | | $ | 12.38 | |
| Investment Operations | | | | | | | | | | | | | | | | | | | | | | | | |
| Net Investment Loss | | | (0.18 | ) | | | (0.38 | ) | | | (0.37 | ) | | | (0.29 | ) | | | (0.34 | ) | | | (0.11 | ) |
| Net Realized and Unrealized Gain (Loss) on Investments | | | 0.84 | | | | 1.98 | | | | 6.40 | | | | 2.41 | | | | (2.04 | ) | | | 4.98 | |
| Total from Investment Operations | | | 0.66 | | | | 1.60 | | | | 6.03 | | | | 2.12 | | | | (2.38 | ) | | | 4.87 | |
| | | | | | | | | | | | | | | | | | | | | | | | | |
| Less Distributions | | | | | | | | | | | | | | | | | | | | | | | | |
| Net Realized Gains | | | — | | | | (0.71 | ) | | | — | | | | (0.01 | ) | | | (0.25 | ) | | | (0.11 | ) |
| Total Distributions | | | — | | | | (0.71 | ) | | | — | | | | (0.01 | ) | | | (0.25 | ) | | | (0.11 | ) |
| | | | | | | | | | | | | | | | | | | | | | | | | |
| Capital Contributions | | | | | | | | | | | | | | | | | | | | | | | | |
| Redemption Fees | | | — | (a) | | | — | (a) | | | — | (a) | | | — | (a) | | | 0.01 | | | | — | (a) |
| Total Capital Contributions | | | — | (a) | | | — | (a) | | | — | (a) | | | — | (a) | | | 0.01 | | | | — | (a) |
| Net Asset Value, End of Year | | $ | 24.21 | | | $ | 23.55 | | | $ | 22.66 | | | $ | 16.63 | | | $ | 14.52 | | | $ | 17.14 | |
| | | | | | | | | | | | | | | | | | | | | | | | | |
| Total Return | | | 2.80 | % | | | 7.13 | % | | | 36.26 | % | | | 14.61 | % | | | (13.77 | )% | | | 39.42 | % |
| Net Assets, End of Year (000’s) | | $ | 62,135 | | | $ | 62,353 | | | $ | 68,470 | | | $ | 66,746 | | | $ | 90,170 | | | $ | 106,551 | |
| Ratios/Supplemental Data | | | | | | | | | | | | | | | | | | | | | | | | |
| Ratio of Total Expenses to Average Net Assets | | | 2.04 | %(b) | | | 2.09 | % | | | 2.07 | % | | | 2.06 | % | | | 1.83 | % | | | 2.09 | % |
| Ratio of Total Expenses to Average Net Assets (before interest and dividend expense) | | | 1.89 | %(b) | | | 1.91 | % | | | 1.91 | % | | | 1.89 | % | | | 1.80 | % | | | 2.05 | % |
| Ratio of Total Expenses to Average Net Assets (before waiver and reimbursement of expenses) | | | 2.04 | %(b) | | | 2.09 | % | | | 2.07 | % | | | 2.06 | % | | | 1.83 | % | | | 2.09 | % |
| Ratio of Net Investment Income (Loss) to Average Net Assets | | | (1.50 | )%(b) | | | (1.60 | )% | | | (1.74 | )% | | | (1.40 | )% | | | (1.62 | )% | | | (1.77 | )% |
| Ratio of Net Investment Income (Loss) to Average Net Assets (before waivers and reimbursements of expenses) | | | (1.50 | )%(b) | | | (1.60 | )% | | | (1.74 | )% | | | (1.40 | )% | | | (1.62 | )% | | | (1.77 | )% |
| Portfolio turnover rate | | | 10 | %(c) | | | 19 | % | | | 20 | % | | | 15 | % | | | 45 | % | | | 55 | % |
| (a) | Value is less than $0.005 per share. |
| (b) | Annualized for periods less than one year. |
| (c) | Not annualized for periods less than one year. |
See accompanying notes to financial statements.
Needham Small Cap Growth Fund
Financial Highlights
| | | Six Months | | | | | | | | | | | | | | | | |
| | | Ended | | | | | | | | | | | | | |
| (For a Share Outstanding | | June 30, 2015 | | | Year Ended December 31, | |
| Throughout each Period) | | (Unaudited) | | | 2014 | | | 2013 | | | 2012 | | | 2011 | | | 2010 | |
| Net Asset Value, Beginning of Year | | $ | 14.01 | | | $ | 15.63 | | | $ | 12.22 | | | $ | 11.26 | | | $ | 14.21 | | | $ | 10.73 | |
| Investment Operations | | | | | | | | | | | | | | | | | | | | | | | | |
| Net Investment Loss | | | (0.12 | ) | | | (0.24 | ) | | | (0.31 | ) | | | (0.15 | ) | | | (0.27 | ) | | | (0.08 | ) |
| Net Realized and Unrealized Gain (Loss) on Investments | | | 0.58 | | | | 0.32 | | | | 3.72 | | | | 1.11 | | | | (2.04 | ) | | | 3.99 | |
| Total from Investment Operations | | | 0.46 | | | | 0.08 | | | | 3.41 | | | | 0.96 | | | | (2.31 | ) | | | 3.91 | |
| | | | | | | | | | | | | | | | | | | | | | | | | |
| Less Distributions | | | | | | | | | | | | | | | | | | | | | | | | |
| Net Realized Gains | | | — | | | | (1.70 | ) | | | — | | | | — | | | | (0.62 | ) | | | (0.43 | ) |
| Return of Capital | | | — | | | | — | | | | — | | | | — | | | | (0.02 | ) | | | — | |
| Total Distributions | | | — | | | | (1.70 | ) | | | — | | | | — | | | | (0.64 | ) | | | (0.43 | ) |
| | | | | | | | | | | | | | | | | | | | | | | | | |
| Capital Contributions | | | | | | | | | | | | | | | | | | | | | | | | |
| Redemption Fees | | | — | (a) | | | — | (a) | | | — | (a) | | | — | (a) | | | — | (a) | | | — | (a) |
| Total Capital Contributions | | | — | (a) | | | — | (a) | | | — | (a) | | | — | (a) | | | — | (a) | | | — | (a) |
| Net Asset Value, End of Year | | $ | 14.47 | | | $ | 14.01 | | | $ | 15.63 | | | $ | 12.22 | | | $ | 11.26 | | | $ | 14.21 | |
| | | | | | | | | | | | | | | | | | | | | | | | | |
| Total Return | | | 3.28 | % | | | 0.80 | % | | | 27.91 | % | | | 8.53 | % | | | (16.10 | )% | | | 36.89 | % |
| Net Assets, End of Year (000’s) | | $ | 30,073 | | | $ | 32,116 | | | $ | 43,950 | | | $ | 60,614 | | | $ | 82,675 | | | $ | 98,911 | |
| Ratios/Supplemental Data | | | | | | | | | | | | | | | | | | | | | | | | |
| Ratio of Total Expenses to Average Net Assets | | | 1.98 | %(b) | | | 2.01 | % | | | 2.06 | % | | | 2.04 | % | | | 1.84 | % | | | 2.16 | % |
| Ratio of Total Expenses to Average Net Assets (before interest and dividend expense) | | | 1.95 | %(b) | | | 1.95 | % | | | 1.96 | % | | | 1.92 | % | | | 1.81 | % | | | 2.08 | % |
| Ratio of Total Expenses to Average Net Assets (before waiver and reimbursement of expenses) | | | 2.12 | %(b) | | | 2.11 | % | | | 2.09 | % | | | 2.04 | % | | | 1.84 | % | | | 2.16 | % |
| Ratio of Net Investment Income (Loss) to Average Net Assets | | | (1.58 | )%(b) | | | (1.49 | )% | | | (1.80 | )% | | | (1.02 | )% | | | (1.57 | )% | | | (1.88 | )% |
| Ratio of Net Investment Income (Loss) to Average Net Assets (before waivers and reimbursements of expenses) | | | (1.72 | )%(b) | | | (1.59 | )% | | | (1.83 | )% | | | (1.02 | )% | | | (1.57 | )% | | | (1.88 | )% |
| Portfolio turnover rate | | | 43 | %(c) | | | 69 | % | | | 58 | % | | | 72 | % | | | 105 | % | | | 65 | % |
| (a) | Value is less than $0.005 per share. |
| (b) | Annualized for periods less than one year. |
| (c) | Not annualized for periods less than one year. |
See accompanying notes to financial statements.
Notes to Financial Statements (Unaudited)
Needham Growth Fund (“NGF”), Needham Aggressive Growth Fund (“NAGF”) and Needham Small Cap Growth Fund (“NSCGF”) (each, a “Portfolio” and collectively, the “Portfolios”), are portfolios of The Needham Funds, Inc. (the “Company”), which is registered under the Investment Company Act of 1940, as amended (the “1940 Act”), as a diversified, open-end management investment company. The Company was organized as a Maryland corporation on October 12, 1995.
| 2. | Significant Accounting Policies |
The following is a summary of significant accounting policies followed by the Company in the preparation of its financial statements. These policies are in conformity with accounting principles generally accepted in the United States of America (“GAAP”).
Security Valuation: Portfolio securities for which market quotations are readily available are stated at the last sale price reported by the principal exchange for the security as of the exchange’s close of business. Securities for which no sale has taken place during the day and securities which are not listed on an exchange are valued at the mean of the highest closing bid and lowest asked prices. Exchange traded options are valued at the last reported sale price on any exchange on which the option is principally traded. If no sales are reported on a particular day, the options will be valued at the mean between the highest closing bid and lowest asked prices across the exchanges where the option is traded. Non-exchange traded options will also be valued at the mean between the last bid and asked quotations. For options where market quotations are not readily available, value will be determined in accordance with the fair value procedures described below. All other securities and assets for which (a) market quotations are not readily available, such as in the case of a market or technical disruption that prevents the normal trading of a security held by a Portfolio, (b) market quotations are believed to be unrepresentative of fair market value, such as in the case of a thinly traded security, or (c) valuation is normally made at the last sale price on a foreign exchange and a significant event occurs after the close of that exchange but before the New York Stock Exchange closes, are valued at their fair value as determined in good faith by the Board of Directors (the “Board”) in accordance with Fair Value Procedures established by the Board. The Company’s Fair Value Procedures are implemented and monitored by a Fair Value Committee (the “Committee”) designated by the Board. When a security is valued in accordance with the Fair Value Procedures, the Committee determines a after taking into consideration any relevant information that is reasonably available to the Committee. Some of the more common reasons that may necessitate that a security be valued pursuant to these Fair Value Procedures include, but are not limited to: the security’s trading has been halted or suspended; the security has been de-listed from a national exchange; the security’s primary trading market is temporarily closed at a time when under normal conditions it would be open; or the security’s primary pricing source is not able or willing to provide a price. The assets of each Portfolio may also be valued on the basis of valuations provided by a pricing service approved by, or on behalf of, the Board.
Portfolio securities listed or traded on securities exchanges, including American Depositary Receipts (“ADRs”), are valued at the closing price on the exchange or system where the security is principally traded or at the NASDAQ Official Closing Price. If there have been no sales for that day on the exchange or system, a security is valued at the mean of the highest closing bid and lowest asked prices on the exchange or system where the security is principally traded.
The Portfolios did not value any securities in accordance with the Fair Value Procedures as of June 30, 2015.
Investment Transactions: Changes in holdings of portfolio securities for the Portfolios shall be reflected no later than in the first calculation on the first business day following the trade date for purposes of calculating each Portfolio’s daily net asset value per share. However, for financial reporting purposes, portfolio security transactions are reported on the trade date of the last business day of the reporting period. The cost (proceeds) of investments sold (bought to cover) is determined on a specific identification basis for the purpose of determining gains or losses on sales and buys to cover short positions. Dividend income, distributions to shareholders and dividend expense from securities sold short are recorded on the ex-dividend date. Interest income and interest expense from securities sold short is recorded on an accrual basis.
Foreign Currency: Foreign currency amounts are translated into U.S. dollars as follows: (i) assets and liabilities at the rate of exchange at the end of the respective period; and (ii) purchases and sales of securities and income and expenses at the rate of exchange prevailing on the dates of such transactions. The portion of realized gains arising from changes in the exchange rates are included with the net realized and unrealized gain or loss on investments. Principal risks associated with such transactions include the
Notes to Financial Statements (Unaudited) (Continued)
movement in value of the foreign currency relative to the U.S. dollar and the ability of the counterparty to perform.
The Portfolios may also invest in forward currency contracts. Fluctuations in the value of such forward currency transactions are recorded daily as unrealized gain or loss; realized gain or loss includes net gain or loss on transactions that have terminated by settlement. These instruments involve securities and currency market risk, credit risk, or both kinds of risks, in excess of the amount recognized in the statements of assets and liabilities. Risks also arise from the possible inability of counterparties to meet the terms of their contracts. The Portfolios did not enter into forward currency contracts during the six months ended June 30, 2015.
Allocation of Expenses: Expenses directly attributable to a Portfolio are charged directly to that Portfolio, while expenses which are attributable to more than one Portfolio are allocated among the respective Portfolios based upon relative net assets or some other reasonable method.
Use of Estimates: The preparation of financial statements in accordance with GAAP requires management to make estimates and assumptions that affect the reported amounts and disclosures in the financial statements. Actual results could differ from those estimates and those differences could be material.
Distributions to Shareholders: Dividends from net investment income, if any, are declared and paid annually for the Portfolios. Distributable net realized gains, if any, are declared and distributed at least annually.
Redemption Fees: The Portfolios reserve the right to assess a redemption fee for shares held 60 days or less. The shareholder will be charged a fee equal to 2.00% of the value of the shares redeemed. The redemption fee is intended to offset excess brokerage commissions and other costs associated with fluctuations in asset levels and cash flows caused by frequent trading by shareholders. The applicability of the redemption fee will be calculated using a first-in first-out method, which means the oldest shares, will be redeemed first, followed by the redemption of more recently acquired shares. For the six months ended June 30, 2015, NGF, NAGF and NSCGF had contributions to capital due to redemption fees in the amounts of $3,395, $639 and $17, respectively.
Federal Income Taxes: It is the policy of each Portfolio to continue to qualify as a regulated investment company, as defined in the Internal Revenue Code, by complying with the provisions available to certain investment companies and to make distributions of net investment income and net realized capital gains sufficient to relieve it from all, or substantially all, federal income taxes. Accordingly, no provision for income taxes has been made in the Portfolios’ financial statements.
As of June 30, 2015, the Portfolios did not have any tax positions that did not meet the “more-likely-than-not” threshold of being sustained by the applicable tax authority. Open tax years are those that are open for exam by Federal and state taxing authorities. As of June 30, 2015, open Federal tax years include the tax years ended December 31, 2011 through December 31, 2014, open New York tax years include the tax years ended December 31, 2011 through December 31, 2014. The Portfolios have no tax examinations in progress.
Fair Value Measurements: Valuation inputs used to determine the value of the Portfolios’ investments are summarized in the three broad levels listed below:
| | Level 1 — | quoted prices in active markets for identical assets. |
| | | |
| | Level 2 — | other significant inputs (including quoted prices of similar securities, interest rates, prepayment speeds, credit risk, etc.). |
| | | |
| | Level 3 — | significant unobservable inputs (which may include the Portfolios’ own assumptions in determining the fair value of investments). |
The inputs or methodology used to value securities are not necessarily an indication of the risk associated with investing in those securities.
Portfolio securities listed or traded on securities exchanges, including ADRs, are valued at the closing price on the exchange or system where the security is principally traded or at the NASDAQ Official Closing Price. If there have been no sales for that day on the exchange or system, a security is valued at the mean of the highest closing bid and lowest asked prices on the exchange or system where the security is principally traded. These valuations are typically categorized as Level 1 in the fair value hierarchy.
In accordance with procedures adopted by the Board, fair value pricing may be used if events materially affecting the value of foreign securities occur between the time the exchange on which they are traded closes and the time the Portfolios’ net asset values are calculated. These valuations are categorized as Level 2 in the fair value hierarchy. As of June 30, 2015, the Portfolios did not hold any Level 2 or Level 3 securities.
Notes to Financial Statements (Unaudited) (Continued)
The following is a summary categorization, as of June 30, 2015, of each Portfolio’s investments based on the level of inputs utilized in determining the value of such investments:
| | | LEVEL 1 – Quoted Prices(1)(3) | |
| | | NGF | | | NAGF | | | NSCGF | |
| Assets | | | | | | | | | | | | |
| Common Stocks(2) | | $ | 134,665,446 | | | $ | 62,025,188 | | | $ | 28,325,841 | |
| Short-Term Investments | | | 13,295,589 | | | | 204,252 | | | | 1,866,464 | |
| Liabilities | | | | | | | | | | | | |
| Securities Sold Short(2) | | | (5,659,064 | ) | | | (3,432,624 | ) | | | (2,423,368 | ) |
| Total | | $ | 142,301,971 | | | $ | 58,796,816 | | | $ | 27,768,937 | |
| (1) | As of June 30, 2015, the Portfolios did not hold Level 2 or Level 3 investments. |
| (2) | Please refer to the Schedule of Investments and Schedule of Securities Sold Short to view segregation by industry. |
| (3) | There were no transfers into or out of Levels 1, 2 or 3 during the period. |
| 3. | Derivative Instruments and Hedging Activities |
The “Derivatives and Hedging” Topic of the Codification (Accounting Standards Codification 815, formerly Statement of Financial Accounting Standards (“SFAS”) 133 and SFAS 161) requires enhanced disclosures about the Portfolios’ derivative and hedging activities, including how such activities are accounted for and their effect on the Portfolios’ financial position, performance and cash flows. The Portfolios did not use derivatives during the six months ended June 30, 2015.
| 4. | Investment Advisory and Administrative Services |
The Company has engaged Needham Investment Management L.L.C. (the “Adviser”) to manage its investments. The Company pays the Adviser a fee at the annual rate of 1.25% of the average daily net assets of each Portfolio.
The Adviser has entered into an agreement with the Company (the “Expense Limitation Agreement”) whereby the Adviser has contractually agreed to waive its fee for, and to reimburse expenses (excluding interest, dividends on short positions, acquired fund fees and expenses and extraordinary items) of NGF, NAGF and NSCGF in an amount that limits annual operating expenses to not more than 1.95% of the average daily net assets. The agreement is effective for the period from May 1, 2015 through April 30, 2016. The agreement shall continue in effect from year to year thereafter only upon mutual agreement of the Company and the Adviser.
Any reimbursements or fee waivers made by the Adviser in respect of a Portfolio are subject to recoupment by the Adviser, to the extent that the Portfolio is able to make the repayment within the expense limitation established in the Expense Limitation Agreement. Under the Expense Limitation Agreement, such recoupments must be made within three years following the fiscal year in which the Adviser reduced its compensation and/or assumed expenses for the applicable Portfolio. The Adviser did not recoup any fees previously waived or reimbursed under the Expense Limitation Agreement during the six months ended June 30, 2015. The table below indicates the amount of fees that the Adviser has the potential to recoup:
| | | | | | Recovery Expiring on | | | | |
| | | 4/30/2019 | | | 4/30/2018 | | | 4/30/2017 | | | 4/30/2016 | |
| NGF | | $ | — | | | $ | — | | | $ | — | | | $ | — | |
| NAGF | | | — | | | | — | | | | — | | | | — | |
| NSCGF | | | 21,280 | | | | 25,076 | | | | 24,636 | | | | 1,464 | |
The Company and U.S. Bancorp Fund Services, LLC (the “Administrator”) are parties to a Fund Administration Servicing Agreement. The Administrator provides administrative and fund accounting services pursuant to this agreement and, in consideration of these services, receives a fee computed daily and paid monthly at an annual rate based on a percentage of the value of each Portfolio’s assets. The Administrator is also compensated for any out of pocket expenses that are reasonably incurred in carrying out its duties under the Administration Agreement. The Administrator also provides transfer agent services pursuant to a Transfer Agent Servicing Agreement for additional fees.
Certain officers of the Company are also officers of the Adviser and/or Needham & Company, LLC (the “Distributor”). Such officers receive no fees from the Company for serving as officers of the Company. Each of the two Directors who is not an “interested person” (as defined in the 1940 Act) of the Company (each, an “Independent Director”) receives a quarterly retainer of $3,000 and a per-meeting fee of $500. Each Independent Director is also a member of the Audit Committee of the Company’s Board of Directors and receives a fee of $500 per meeting attended. The Adviser provides an employee to serve as Chief Compliance Officer for the Company and to provide certain related services. An affiliate of the Adviser, Needham & Company, LLC, pays the Chief Compliance Officer’s compensation and the Company reimburses this affiliate for the Company’s allocated portion of the expense.
The Company has adopted an Amended and Restated Plan of Distribution pursuant to Rule 12b-1 under the 1940 Act. Under the Plan, each Portfolio may pay compensation to the Distributor or any other distributor or financial
Notes to Financial Statements (Unaudited) (Continued)
institution with which the Company has an agreement with respect to each Portfolio, with the amount of such compensation not to exceed an annual rate of 0.25% of each Portfolio’s daily average net assets. For the six months ended June 30, 2015, NGF, NAGF and NSCGF paid 12b-1 fees to the Distributor in the amount of $186,482, $78,074 and $39,231, respectively.
During the six months ended June 30, 2015, NGF, NAGF and NSCGF incurred and paid brokerage commissions to the Distributor in the amount of $9,812 $4,022, and $13,242, respectively.
Each Portfolio may borrow from banks up to 25% of its total assets and may pledge its assets in connection with these borrowings, provided that no additional investments shall be made while borrowings exceed 5% of total assets.
The Portfolios did not engage in any temporary borrowings during the six months ended June 30, 2015.
| 7. | Short Sale Transactions |
During the six months ended June 30, 2015, each Portfolio sold securities short. Upon selling a security short, the Portfolios record an asset for the settlement amount and a corresponding liability, which is marked-to-market to reflect current value. Certain securities owned by each respective Portfolio are segregated as collateral while the short sales are outstanding. At June 30, 2015, the market value of securities separately segregated to cover short positions was $3,434,075, $3,389,430, and $1,095,106 for NGF, NAGF and NSCGF, respectively.
Additionally, the Portfolios had receivables for Deposit with Broker for Securities Sold Short of $5,969,175, $3,558,545, and $2,631,273 pledged as collateral with a broker in connection with open short positions for NGF, NAGF and NSCGF, respectively. Securities sold short at June 30, 2015 and their related market values and proceeds are set forth in the preceding Schedule of Securities Sold Short for each Portfolio.
| 8. | Investment Transactions |
The following summarizes the aggregate amount of the cost of purchases and proceeds from sales of investment securities and securities sold short, excluding short-term securities, during the six months ended June 30, 2015:
| | | Purchases | | | Sales | |
| NGF | | $ | 11,361,814 | | | $ | 19,482,488 | |
| NAGF | | | 6,229,144 | | | | 8,638,072 | |
| NSCGF | | | 12,402,821 | | | | 16,055,840 | |
There were no purchases or sales of U.S. government securities during the six months ended June 30, 2015.
| 9. | Financial Instruments With Off-Balance Sheet Risk |
In the normal course of their business, the Portfolios may engage in transactions with off-balance sheet risk, including securities sold short, written options, futures, and forward currency contracts. Transactions in certain financial instruments represent future commitments to purchase or sell other financial instruments at specific terms at specified future dates. Each of these financial instruments contains varying degrees of off-balance sheet risk whereby changes in the market values of the securities underlying the financial instruments may be in excess of the amounts recognized in the financial statements.
Securities sold short represent obligations of the Portfolios to make future delivery of specific securities and, correspondingly, create an obligation to purchase the securities at market prices prevailing at a later delivery date (or to deliver the securities if already owned by the Portfolios). As a result, short sales create the risk that the Portfolios’ ultimate obligation to satisfy the delivery requirements may exceed the amount of the proceeds initially received on the liability recorded in the financial statements.
Under the Company’s organizational documents, its Directors and Officers are indemnified against certain liabilities arising out of the performance of their duties to the Company. In addition, in the ordinary course of business, the Company enters into contracts that contain a variety of indemnifications. The Company’s maximum exposure under these arrangements is unknown. However, the Company has not had prior claims or losses pursuant to these contracts and expects the risk of loss to be remote.
No provision for federal income taxes is required since the Company intends to continue to qualify as a regulated investment company under Subchapter M of the Internal Revenue Code and distribute substantially all of its taxable income and capital gains to shareholders. Because income tax regulations differ from GAAP, the timing and character of income and capital gain distributions determined in accordance with tax regulations can differ from income and capital gains recognized for financial reporting purposes. Accordingly, the character of distributions and the composition of net assets for tax purposes can differ from those reflected in the financial statements. These
Notes to Financial Statements (Unaudited) (Continued)
book/tax differences may be temporary or permanent in nature. Temporary differences are generally due to differing book and tax treatment for the timing of the recognition of gains and losses on securities, including post-October losses (as described below). Permanent differences are generally due to differing treatment of net investment losses. To the extent these differences are permanent, they are charged or credited to paid-in capital, accumulated net realized gain (loss), or accumulated net investment income (loss), as appropriate, in the period in which the differences arise. These reclassifications have no effect on net assets or net asset value per share of each Portfolio.
As of December 31, 2014, the cost, gross unrealized appreciation, gross unrealized depreciation, and the net unrealized appreciation (depreciation) on securities, including proceeds from securities sold short for federal income tax purposes, were as follows:
| | | | | | Gross | | | Gross | | | Net Unrealized | |
| | | | | | Unrealized | | | Unrealized | | | Appreciation | |
| | | | Cost | | | | Appreciation | | | | Depreciation | | | | (Depreciation) | |
| NGF | | $ | 73,396,559 | | | $ | 78,123,672 | | | $ | (4,318,871 | ) | | $ | 73,804,801 | |
| NAGF | | | 30,369,584 | | | | 33,178,173 | | | | (1,278,514 | ) | | | 31,899,659 | |
| NSCGF | | | 29,426,614 | | | | 5,144,563 | | | | (2,322,061 | ) | | | 2,822,502 | |
The difference between the tax cost of investments and the cost of investments for GAAP purposes is primarily due to the tax treatment for wash sale losses.
As of December 31, 2014, the components of distributable earnings (loss) on a tax basis were as follows:
| | | NGF | | | NAGF | | | NSCGF | |
| Undistributed ordinary income | | $ | — | | | $ | — | | | $ | — | |
| Undistributed long-term capital gains | | | 3,949,612 | | | | — | | | | — | |
| Unrealized appreciation (depreciation) | | | 73,804,801 | | | | 31,899,659 | | | | 2,822,502 | |
| Other accumulated gains (loss) | | | (526,997 | ) | | | (439,481 | ) | | | (500,412 | ) |
| Total accumulated earnings (loss) | | $ | 77,227,416 | | | $ | 31,460,178 | | | $ | 2,322,090 | |
The tax character of distributions paid during the December 31, 2013 was as follows:
| | | NGF | | | NAGF | | | NSCGF | |
| Ordinary Income | | $ | — | | | $ | — | | | $ | — | |
| Net long-term capital gains | | | 820,726 | | | | — | | | | — | |
| Return of Capital | | | — | | | | — | | | | — | |
| Total distributions paid | | $ | 820,726 | | | $ | — | | | $ | — | |
The tax character of distributions paid during the year ended December 31, 2014 was as follows:
| | | NGF | | | NAGF | | | NSCGF | |
| Ordinary income | | $ | — | | | $ | — | | | $ | 39,890 | |
| Net long-term capital gains | | | 9,182,355 | | | | 1,796,420 | | | | 2,470,645 | |
| Return of capital | | | — | | | | 56,369 | | | | 1,132,201 | |
| Total distributions paid | | $ | 9,182,355 | | | $ | 1,852,789 | | | $ | 3,642,736 | |
Under current tax law, capital and currency losses realized after October 31 of a Portfolio’s fiscal year may be deferred and treated as occurring on the first business day of the following fiscal year for tax purposes. The following Portfolios had deferred post-October capital and currency losses, which will be treated as arising on the first business day of the year ended December 31, 2014.
| | NGF | | $ | — | |
| | NAGF | | | 21,822 | |
| | NSCGF | | | 488,611 | |
As of December 31, 2014 none of the Portfolios had accumulated capital loss carryovers.
| 12. | New Accounting Pronouncements |
In May 2015, the Financial Accounting Standards Board (“FASB”) issued Accounting Standards Update (“ASU”) No. 2015-07 “Disclosure for Investments in Certain Entities that Calculate Net Asset Value per Share (or Its Equivalent)”. The amendments in ASU No. 2015-07 remove the requirement to categorize within the fair value hierarchy investments measured using the NAV practical expedient. The ASU also removes certain disclosure requirements for investments that qualify, but do not utilize, the NAV practical expedient. The amendments in the ASU are effective for fiscal years beginning after December 15, 2015, and interim periods within those fiscal years. Management is currently evaluating the impact these changes will have on the Portfolios’ financial statements and related disclosures.
Notes to Financial Statements (Unaudited) (Continued)
Management has evaluated subsequent events through the date of this filing. This evaluation did not result in any subsequent events that necessitated recognition or disclosures.
Supplementary Information (Unaudited)
June 30, 2014
Disclosure of Portfolio Holdings
The Company files a Form N-Q with the Securities and Exchange Commission (the “SEC”) no more than sixty days after the Company’s first and third fiscal quarters. For the Company, this would be for the fiscal quarters ending March 31 and September 30. Form N-Q includes a complete schedule of the Company’s portfolio holdings as of the end of those fiscal quarters. The Company’s N-Q filings can be found free of charge on the SEC’s website at http://www.sec.gov, or they may be reviewed and copied at the SEC’s Public Reference Room in Washington, D.C. (call 800-SEC-0330 for information on the operation of the Public Reference Room).
Voting Proxies on Company Portfolio Securities
A description of the policies and procedures that the Company uses to determine how to vote proxies relating to portfolio securities and information regarding how the Company voted proxies relating to portfolio securities during the most recent 12-month period ended June 30 are available without charge, upon request, by calling 800-625-7071 or on the SEC’s website at http://www.sec.gov.
Household Delivery of Shareholder Documents
To reduce expenses, the Company may mail only one copy of the Funds’ prospectuses, proxy statements, information statements, and each annual and semi-annual report to those addresses shared by two or more accounts. If you wish to receive individual copies of these documents, please call the Funds at 1-800-625-7071 or contact your financial institution. You will begin receiving individual copies thirty days after receiving your request.
Item 2. Code of Ethics.
Not applicable for semi-annual reports.
Item 3. Audit Committee Financial Expert.
Not applicable for semi-annual reports.
Item 4. Principal Accountant Fees and Services.
Not applicable for semi-annual reports.
Item 5. Audit Committee of Listed Registrants.
Not applicable to registrants who are not listed issuers (as defined in Rule 10A-3 under the Securities Exchange Act of 1934).
Item 6. Investments.
| (a) | Schedule of Investments is included as part of the report to shareholders filed under Item 1 of this Form. |
Item 7. Disclosure of Proxy Voting Policies and Procedures for Closed-End Management Investment Companies.
Not applicable to open-end investment companies.
Item 8. Portfolio Managers of Closed-End Management Investment Companies.
Not applicable to open-end investment companies.
Item 9. Purchases of Equity Securities by Closed-End Management Investment Company and Affiliated Purchasers.
Not applicable to open-end investment companies.
Item 10. Submission of Matters to a Vote of Security Holders.
Not Applicable.
Item 11. Controls and Procedures.
| (a) | The Registrant’s Chief Executive Officer and Chief Financial Officer have reviewed the Registrant's disclosure controls and procedures (as defined in Rule 30a-3(c) under the Investment Company Act of 1940 (the “Act”)) as of a date within 90 days of the filing of this report, as required by Rule 30a-3(b) under the Act and Rules 13a-15(b) or 15d-15(b) under the Securities Exchange Act of 1934. Based on their review, such officers have concluded that the disclosure controls and procedures are effective in ensuring that information required to be disclosed in this report is appropriately recorded, processed, summarized and reported and made known to them by others within the Registrant and by the Registrant’s service provider. |
| (b) | There were no changes in the Registrant's internal control over financial reporting (as defined in Rule 30a-3(d) under the Act) that occurred during the Registrant’s first fiscal half-year of the period covered by this report that has materially affected, or is reasonably likely to materially affect, the Registrant's internal control over financial reporting. |
Item 12. Exhibits.
| (a) | (1) Any code of ethics or amendment thereto, that is the subject of the disclosure required by Item 2, to the extent that the registrant intends to satisfy Item 2 requirements through filing an exhibit. Not applicable for semi-annual reports. |
(2) A separate certification for each principal executive and principal financial officer pursuant to Section 302 of the Sarbanes-Oxley Act of 2002. Filed herewith.
(3) Any written solicitation to purchase securities under Rule 23c-1 under the Act sent or given during the period covered by the report by or on behalf of the registrant to 10 or more persons. Not applicable to open-end investment companies.
| (b) | Certifications pursuant to Section 906 of the Sarbanes-Oxley Act of 2002. Furnished herewith. |
SIGNATURES
Pursuant to the requirements of the Securities Exchange Act of 1934 and the Investment Company Act of 1940, the registrant has duly caused this report to be signed on its behalf by the undersigned, thereunto duly authorized.
(Registrant) The Needham Funds, Inc.
By (Signature and Title) /s/ George A. Needham
George A. Needham, President (Chief Executive Officer)
Date September 8, 2015
Pursuant to the requirements of the Securities Exchange Act of 1934 and the Investment Company Act of 1940, this report has been signed below by the following persons on behalf of the registrant and in the capacities and on the dates indicated.
By (Signature and Title) /s/ George A. Needham
George A. Needham, President (Chief Executive Officer)
Date September 8, 2015
By (Signature and Title) /s/ James W. Giangrasso
James W. Giangrasso, Treasurer and Secretary (Chief Financial Officer)
Date September 4, 2015