As filed with the Securities and Exchange Commission on September 10, 2012
UNITED STATES
SECURITIES AND EXCHANGE COMMISSION
Washington, D.C. 20549
FORM N-CSR
CERTIFIED SHAREHOLDER REPORT OF REGISTERED
MANAGEMENT INVESTMENT COMPANIES
Investment Company Act file number 811-09114
The Needham Funds, Inc.
(Exact name of registrant as specified in charter)
445 Park Avenue, New York, NY 10022
(Address of principal executive offices) (Zip code)
Mr. George A. Needham, 445 Park Avenue, New York, NY 10022
(Name and address of agent for service)
1-800-625-7071
Registrant's telephone number, including area code
Date of fiscal year end: December 31, 2012
Date of reporting period: June 30, 2012
Item 1. Reports to Stockholders.
445 Park Avenue
New York, New York 10022-2606
1-800-625-7071
www.needhamfunds.com
Semi-Annual Report
June 30, 2012
| Contents | | |
| | | |
| Letter from the Adviser | 1 | |
| | | |
| Portfolio Characteristics | | |
| Needham Growth Fund | 5 | |
| Needham Aggressive Growth Fund | 6 | |
| Needham Small Cap Growth Fund | 7 | |
| Disclosure of Fund Expenses | 8 | |
| | | |
| Schedule of Investments | | |
| Needham Growth Fund | 9 | |
| Needham Aggressive Growth Fund | 12 | |
| Needham Small Cap Growth Fund | 15 | |
| | | |
| Schedule of Securities Sold Short | | |
| Needham Growth Fund | 11 | |
| Needham Aggressive Growth Fund | 14 | |
| Needham Small Cap Growth Fund | 17 | |
| | | |
| Statements of Assets and Liabilities | 18 | |
| | | |
| Statements of Operations | 19 | |
| | | |
| Statements of Changes in Net Assets | 20 | |
| | | |
| Financial Highlights | | |
| Needham Growth Fund | 21 | |
| Needham Aggressive Growth Fund | 22 | |
| Needham Small Cap Growth Fund | 23 | |
| | | |
| Notes to Financial Statements | 24 | |
| | | |
| Supplementary Information | 29 | |
This report is authorized for distribution to prospective investors only when preceded or accompanied by a current prospectus. The prospectus contains more complete information, including investment objectives, risks, expenses and charges and should be read carefully before investing or sending any money. To obtain a prospectus, please call 1-800-625-7071.
Portfolios of The Needham Funds, Inc., like all mutual funds:
The Needham Funds, Inc. are distributed by Needham & Company, LLC.
| Needham Funds | Semi-Annual Report 2012 |
August 30, 2012
Dear Shareholders, Friends of Needham and Prospective Shareholders,
We are reporting our semiannual results for the Needham Growth Fund, Needham Aggressive Growth Fund and Needham Small Cap Growth Fund.
Needham Funds Overview and Market Commentary
Like the last two years, the first half of 2012 was a tale of two markets. The Dow Jones Industrial Average and the Standard & Poor’s 500 Index had their best first quarters since 1998. The Needham Funds also had a strong start to the year. We believe the equity markets anticipated the European Central Bank’s LTRO2 (Long-Term Refinancing Operation), which occurred at the end of February. The ECB lent €530 billion to European banks at a 1% interest rate. The ECB now has a 3 trillion Euro balance sheet, up a trillion Euros since mid-July 2011.
After a very strong start to the year, both the markets and our funds pulled back in the second quarter. The funds were down in both April and May as the economy slowed and the European debt situation deteriorated. However, our funds closed the quarter with strong June performance as the markets were buoyed by three developments. In early June, Chancellor Merkel of Germany and EU President Barroso discussed a possible banking union. Second, in mid-June, the second Greek election was won by the pro-Euro New Democracy party and they successfully formed a coalition government. Finally, on June 29, European leaders agreed to speed plans for a single supervisor of European banks and to allow the European Financial Stability Facility (EFSF), and in the future the European Stability Mechanism (ESM), to provide funds directly to Spanish banks without a government guarantee. While these developments are mostly plans for future actions, they were enough to lift the markets.
For the first half of 2012, the Needham Growth Fund was up 6.6%, the Needham Aggressive Growth Fund was up 8.6%, and the Needham Small Cap Growth Fund was up 11.2%, while the Russell 2000 was up 8.5% and the S&P 500 Index was up 9.5%.
In an era of managed, low interest rates, we believe that growth equities have a role to play in a portfolio. Growth companies are managed by smart entrepreneurs always looking for ways to improve earnings and cash generation. Bond yields are at an all-time low and are subject to the risk of higher interest rates. We continue to find and own stocks within our growth universes that are attractively valued with the potential to benefit us in 2012 and beyond.
Needham Funds
Our top contributor in all three funds was Seagate Technology (STX), which appreciated 53.5%. On January 31, Seagate reported a very strong December quarter with impressive 31.7% gross margins and positive guidance. These earnings were partially a result of disk drive shortages resulting from the fall 2011 floods in Thailand. These floods took competitors’ drive capacity off of the market. Looking forward, the disk drive industry should structurally benefit from Western Digital’s (WDC) purchase of Hitachi Global Storage Technology, which closed on March 8, 2012, and Seagate’s purchase of Samsung’s hard disk drive business on December 19, 2011. On April 17, Seagate reported another strong quarter with gross margins of 37.5%. On July 5, Seagate preannounced negative results due to softer demand. All three funds trimmed their Seagate positions as the stock hit our price targets during the first half of 2012.
As of August 21, Seagate had 397 million shares outstanding. With buybacks, share count could reach 350 million by mid-2013. Street consensus for FY ending June 2013 non-GAAP EPS is $8.52 for a P/E of 4.08x at a stock price of $34.72. With a $0.32 per share quarterly dividend, Seagate also has a current dividend yield of 3.9%.
Another top contributor to all three funds was Express Scripts (ESRX), which appreciated 24.9%. Express Scripts is a leading pharmacy benefits management company. On June 30, ESRX was the largest holding, at 9.0%, in the Needham Growth Fund as well as a holding in the other two funds. Express Scripts and Medco Health Solutions recently merged and announced expected synergies of $1 billion. We see Express Scripts contributing savings to the U.S. healthcare system and benefitting from the number of drugs going generic in 2012, including Plavix, Viagra and Lexapro. In 2Q12, Express Scripts filled 77.8% of its prescriptions with generics, which are lower cost for the payor and higher margin for Express Scripts. Availability of a generic drug increases utilization and therefore increases Express Scripts’ fulfillments.
In June, Chris Retzler had the opportunity to visit with management and tour Express Scripts’ St. Louis headquarters. The visit reinforced our Firm’s opinion of the strength of the business opportunities and market leadership. It is an impressive operation that shows that scale and technology really matter in this business. His visit to the mail distribution facility provided an opportunity to see the significant investment required to achieve a high quality, low error drug dispensing operation. The management is well positioned to drive significant synergies from the Medco merger across multiple areas of the company. On August 8, Express Scripts reported 2Q12 earnings results that exceeded expectations. We believe Express Scripts has a strong business model that can handle uncertain markets.
A third leading contributor across all three funds was PDF Solutions (PDFS), up 41.6% in the first half. PDF Solutions supplies software and services to help semiconductor companies ramp new processes. PDF should benefit as Samsung manufactures the A5 processor for Apple and as Global Foundries ramps its leading-edge processes in Dresden and Malta, New York. Qualcomm’s announcement that it needed additional 28nm chip supply could benefit PDFS as Global Foundries is a likely beneficiary of Qualcomm’s new orders. PDFS earns ‘‘Gain Share’’ revenues as semiconductors are produced in semiconductor fabs that PDFS was involved with. On August 8, PDF Solutions announced positive June quarter results.
Needham Growth Fund
The Needham Growth Fund was up 6.6% in the first half.
The Fund’s largest contributors were Seagate Technology, Express Scripts and PDF Solutions. Other top contributors included Sypris Solutions (SYPR, +79.3%), Thermo Fisher Scientific (TMO, +16.0%), Gilead Sciences (GILD, +25.3%), Dicks Sporting Goods (DKS, +30.9%), Comcast Corporation (CMCSA, +36.3%) and Entropic Communications (ENTR, 10.3%).
Many of these top performers are significant, long-term holdings of the Fund. Sypris Solutions provides outsourced manufacturing and technical services for industrial, electronics, aerospace and defense customers. On May 15, the company reported strong results. Sypris has been an underfollowed and, we believe, undervalued company for a number of years.
Amongst our detractors in the first half were ViaSat (VSAT, -18.1%), CarMax (KMX, -14.9%), Hess Corp. (HES, -23.2%), Electro Scientific Industries (ESIO, -17.4%), and Allscripts Healthcare Solutions (MDRX, -42.3%). ViaSat launched its Exede satellite broadband service during the first quarter and saw initial demand outstrip its installation capacity. In the June quarter, ViaSat had mixed net subscriber adds for Exede. CarMax, a leading retailer of used vehicles, cited persistent unemployment in their disappointing May quarter-ending comparable-store results. Hess reported natural gas production at the Bakken field in North Dakota below its previous guidance combined with higher capital expenditures. Electro Scientific Industries reported a strong March quarter with a book-to-bill ratio of 1.4:1. On July 25, ESIO reported a strong June end quarter. The stock trades at a discount to its tangible book of $12.18 per share. We are optimistic about the growth prospects for these four companies.
Allscripts is another matter. Allscripts supplies software, services and information used by physicians and other healthcare providers. On April 25, the company announced disappointing March quarter results, the departure of the CFO, and resignations of four directors. These changes were precipitated by the merger of Allscripts with Eclipsys in mid-2010. Allscripts is strong in ambulatory facilities (doctors’ offices), while Eclipsys was strong with hospitals. Integration of the products has been more difficult than anticipated. We reduced our position across all three funds in the first half.
During the first half, we increased our average market cap exposure. Our large-cap and small-cap exposures increased while our mid-cap and micro-cap exposures decreased. We also increased our short positions to 8.3% from 3.1%. These changes are intended to decrease the volatility of the Fund. Our cash position decreased to 5.3% from 14.6%.
Needham Aggressive Growth Fund
The Needham Aggressive Growth Fund was up 8.6% in the first half.
The top contributors for the Fund were Seagate Technology and PDF Solutions. The third largest contributor was Apple (AAPL), which appreciated 44.2%. The Fund’s Apple investment goes back to 2006. We are enthusiastic about Apple’s product pipeline, including the iPhone 5, the iPad Mini and, ultimately, Apple TV. We believe that Apple TV is a misnomer and that it is unlikely Apple enters the ‘‘glass’’ portion of the business. At the recent Brightcove (BCOV) PLAY 2012 Conference, CEO Jeremy Allaire spoke of combining the iPad tablet with the television in an interactive environment of original content. Street estimates show $55 EPS for 2013, giving Apple a market price-to-earnings ratio of 12x with well above market, estimated 21% revenue growth.
The Fund’s largest detractors were TTM Technologies (TTMI, -14.4%) and RF Micro Devices (RFMD, -21.3%). TTM makes printed circuit board and backplane assemblies. In May, TTM reported mixed results and guidance citing less than expected demand for cell phones. TTM’s top 5 customers (Apple, Cisco, Ericsson, Huawei and ZTE) were 34% of revenues. We believe TTM suffered from share shifts, despite our belief that Apple is their largest customer. In the June quarter, TTM again reported mixed results with weakness in enterprise networking in China (Huawei and ZTE). Long term, we remain positive about TTM with its broad exposure to the winning suppliers of smartphones, e-readers and enterprise network equipment.
RFMD suffered in the first half due to its exposure to Nokia and 2G and 2.5G handsets. Nokia is now significantly below 10% of revenues for RFMD. We continue to like RFMD’s new product line-up for 3G/4G phones and Samsung’s position as RFMD’s largest customer.
Like the Needham Growth Fund, the Needham Aggressive Growth Fund increased the average market capitalization of its investments. The Fund increased its invested position in large-cap (Apple’s appreciation was part of this) and small-cap stocks. Mid-cap and micro-cap exposure decreased. The Fund’s short position increased to 6.6% from 3.4%.
Needham Small Cap Growth Fund
The Needham Small Cap Growth Fund was up 11.2% in the first half.
The Small Cap Growth Fund’s top contributors were Seagate Technology, followed by American Eagle Outfitters (AEO, +30.6%) and Entropic Communications (ENTR, 10.3%).
American Eagle Outfitters was a new investment in 2011, and we believed that expectations were too low. AEO had strong sales in the April-ending quarter and raised guidance for the July quarter. Robert Hanson, formerly of Levi Strauss, took over in January replacing long-time CEO Jim O’Donnell. We trimmed some of the position as it appreciated and ended the quarter with a 3.3% position, down from 4.8% at the beginning of the quarter. On August 1, American Eagle preannounced positive comparable-store sales of +9% for the quarter with a full earnings report expected on August 22. American Eagle’s preannouncement showed good results relative to the weak earnings reported by competitor Aeropostale (ARO, +16.9%) on August 1.
Entropic Communications was the third largest gainer for the Fund. On June 27, Entropic preannounced positive results from its core MoCA© business and good progress in the integration of the Trident set-top box acquisition. Earlier in the year, the stock had suffered due to concern over the length of time it would take the set-top box business to contribute.
The largest detractors were Allscripts, TTMI and Aruba Networks (ARUN). Aruba Networks is the leader in enterprise wireless systems. Aruba had a difficult quarter ending in May due to the slowing economy and the stock suffered. The company is a leader in its segment that provides wireless LAN solutions for the enterprise and is the largest WLAN pure-play vendor on the market. We expect the company will continue to experience strong enterprise demand, driven by BYOD and spending in higher education. Aruba is expected to report earnings for the quarter ending July 30 on August 23.
We believed that we needed to get through the second quarter earnings period and digest the second half guidance. As we had feared, second half guidance for many of the companies we follow was weak. We believe that many Street estimates are still too high, but think that the market is closer to factoring in lower estimates. We remain concerned that negative second half GDP may not yet be factored into current valuations. We are cautiously looking to put our cash to work. We believe we will find attractive values for new buys in the second half of 2012.
The Fund increased its short positions to 11.7% from 3.8% at the end of December.
Closing
We remain positive on our strategy of investing in companies that we know well and that we believe are positioned with secular growth drivers. We welcome our new investors and thank all of our investors for their continued support. If you have any questions, thoughts or concerns, please contact us at (800) 625-7071 or send us an email at cretzler@needhamco.com or jbarr@needhamco.com. For information about the funds, please visit our website at www.needhamfunds.com.
Sincerely,
 |  |
| Chris Retzler | John O. Barr |
| Portfolio Manager | Portfolio Manager |
| Semi-Annual Report 2012 |
| | |
| NEEDHAM GROWTH FUND (Unaudited) | TICKER: NEEGX |
| Comparative Performance Statistics as of June 30, 2012 |
| | | | | | | | | | | | | | | | | | | Since | | Gross Expense | |
| | | | 6 Months(7) | | 1 Year | | 3 Years(8) | | 5 Years(8) | | 10 Years(8) | | Inception(8)(12) | | Ratio(14) | |
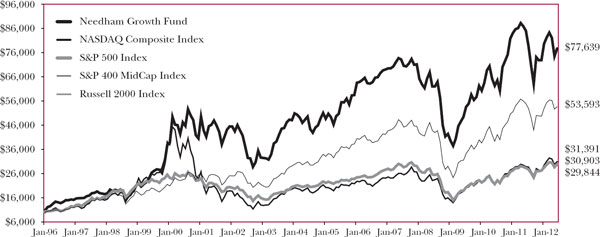
| | Needham Growth Fund(1) | | 6.62 | % | | -8.60 | % | | 16.25 | %(9) | | 1.19 | %(10) | | 7.65 | %(11) | | 13.23 | %(13) | | 1.82 | % | |
| | S&P 500 Index(2)(3) | | 9.49 | % | | 5.45 | % | | 16.40 | % | | 0.22 | % | | 5.33 | % | | 6.85 | % | | | | |
| | NASDAQ Composite Index(2)(4) | | 13.32 | % | | 7.04 | % | | 18.16 | % | | 3.46 | % | | 8.08 | % | | 7.07 | % | | | | |
| | S&P 400 MidCap Index(2)(5) | | 7.90 | % | | -2.33 | % | | 19.36 | % | | 2.55 | % | | 8.21 | % | | 10.71 | % | | | | |
| | Russell 2000 Index(2)(6) | | 8.53 | % | | -2.08 | % | | 17.80 | % | | 0.54 | % | | 7.00 | % | | 7.18 | % | | | | |
| | Past performance does not guarantee future results. The performance data quoted represents past performance, and current returns may be lower or higher. The investment return and net asset value will fluctuate so that an investor’s shares, when redeemed, may be worth more or less than the original cost. To obtain performance information current to the most recent month-end, please call 1-800-625-7071. The returns shown in the above table and accompanying footnotes are net of expenses. The table above does not reflect the deduction of taxes that a shareholder would have paid on Fund distributions or on the redemption of Fund shares. | |
| | 1. | Investment results calculated after reinvestment of dividends. | |
| | 2. | It is not possible to invest directly in an index. The performance of the index does not include the deduction of expenses associated with a mutual fund, such as investment management fees. | |
| | 3. | The S&P 500 Index is a broad unmanaged measure of the U.S. stock market. | |
| | 4. | The NASDAQ Composite Index is a broad-based capitalization-weighted index of all NASDAQ Global Market and Small Cap stocks. | |
| | 5. | The S&P 400 MidCap Index is a broad unmanaged measure of the U.S. stock market. | |
| | 6. | The Russell 2000 Index is a broad unmanaged index composed of the smallest 2,000 companies in the Russell 3000 Index. | |
| | 7. | Not annualized. | |
| | 8. | Compound annual growth rate (annualized return). Assumes all dividends were reinvested in shares of the Fund. | |
| | 9. | Cumulative return for the three year period was 57.10%, assuming all dividends were reinvested in shares of the Fund. | |
| | 10. | Cumulative return for the five year period was 6.12%, assuming all dividends were reinvested in shares of the Fund. | |
| | 11. | Cumulative return for the ten year period was 109.01%, assuming all dividends were reinvested in shares of the Fund. | |
| | 12. | The inception date of the Fund was 1/1/96. | |
| | 13. | Cumulative return since inception was 676.39%, assuming all dividends were reinvested in shares of the Fund. | |
| | 14. | Gross expense ratio is from the Fund’s prospectus dated May 1, 2012. Additional information pertaining to the Fund’s expense ratios as of June 30, 2012 can be found in the financial highlights. Since January 1, 2009, the investment performance reflects contractually agreed upon fee waivers which expire at the close of business on May 1, 2013. Without these fee waivers, the performance would have been lower. Excluding the indirect costs of investing in acquired funds, total net fund operating expenses would be 1.81%. | |
| Top Ten Holdings* |
| (as a % of total investments, as of June 30, 2012) |
| | | | | | % of Total | |
| | | Security | | | | Investments† | |
| | 1 Express Scripts Holding Co. | | ESRX | | | 11.02 | % | |
| | 2 Seagate Technology PLC | | STX | | | 6.40 | % | |
| | 3 Thermo Fisher Scientific, Inc. | | TMO | | | 5.24 | % | |
| | 4 ViaSat, Inc. | | VSAT | | | 3.98 | % | |
| | 5 CarMax, Inc. | | KMX | | | 3.81 | % | |
| | 6 Entropic Communications, Inc. | | ENTR | | | 3.46 | % | |
| | 7 PDF Solutions, Inc. | | PDFS | | | 3.29 | % | |
| | 8 Gilead Sciences, Inc. | | GILD | | | 3.15 | % | |
| | 9 Super Micro Computer, Inc. | | SMCI | | | 3.09 | % | |
| | 10 Becton Dickinson and Co. | | BDX | | | 3.02 | % | |
| | Top Ten Holdings = 46.46% of Total Investments† | |
| | * Current portfolio holdings may not be indicative of future portfolio holdings. | |
| | † Percentage of total investments less cash. | |
| | | |
| Sector Weightings* |
| (as a % of total investments, as of June 30, 2012) |
| | | | | | | | | | |
| | | Sector | | | Long(1) | | (Short)(1) | | Total(1)(2) | |
| | Consumer Discretionary | | | 7.9 | % | | (0.1 | )% | | 7.8 | % | |
| | Energy | | | 2.9 | % | | — | | | 2.9 | % | |
| | Financials | | | 2.6 | % | | — | | | 2.6 | % | |
| | Health Care | | | 29.5 | % | | — | | | 29.5 | % | |
| | Industrials | | | 4.5 | % | | (1.2 | )% | | 3.3 | % | |
| | Information Technology | | | 55.6 | % | | (4.5 | )% | | 51.1 | % | |
| | Exchange Traded Funds | | | — | | | (2.5 | )% | | (2.5 | )% | |
| | Cash | | | 5.3 | % | | — | | | 5.3 | % | |
| | * Current portfolio holdings may not be indicative of future portfolio holdings. | |
| | (1) Percentage of total investments includes all stocks, plus cash minus all short positions. | |
| | (2) Total represents the difference between the long exposure and the short exposure, which produces the net exposure. | |
| | | |
Comparison of Change in Value of a $10,000 Investment
Past performance does not guarantee future results. The performance data quoted represents past performance, and current returns may be lower or higher. The investment return and net asset value will fluctuate so that an investor’s shares, when redeemed, may be worth more or less than the original cost. To obtain performance information current to the most recent month-end, please call 1-800-625-7071. The graph above does not reflect the deduction of taxes that a shareholder would have paid on Fund distributions or on the redemption of Fund shares. Since inception, the Fund’s Adviser has absorbed certain expenses of the Fund, without which returns would have been lower.
The Global Industry Classification Standard (GICS®) was developed by and/or is the exclusive property of MSCI, Inc. and Standard & Poor Financial Services LLC (“S&P”). GICS is a service mark of MSCI and S&P and has been licensed for use by U.S. Bancorp Fund Services, LLC.
| Needham Funds |
| | |
NEEDHAM AGGRESSIVE GROWTH FUND (Unaudited) | TICKER: NEAGX |
Comparative Performance Statistics as of June 30, 2012 |
| | | | | | | | | | | | | | | | | | | | | | | | |
| | | | | | | | | | | | | | | | | | | Since | | Gross Expense | |
| | | | 6 Months(6) | | 1 Year | | 3 Years(7) | | 5 Years(7) | | 10 Years(7) | | Inception(7)(11) | | Ratio(13) | |
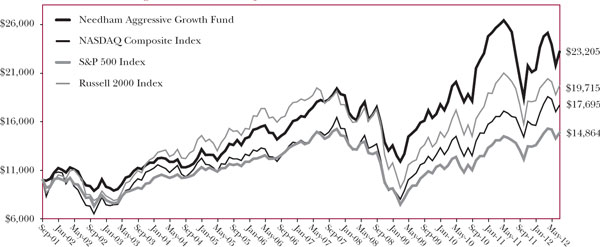
| | Needham Aggressive Growth Fund(1) | | 8.61 | % | | -8.01 | % | | 15.12 | %(8) | | 4.94 | %(9) | | 8.75 | %(10) | | 8.09 | %(12) | | 1.85 | % | |
| | S&P 500 Index(2)(3) | | 9.49 | % | | 5.45 | % | | 16.40 | % | | 0.22 | % | | 5.33 | % | | 3.73 | % | | | | |
| | NASDAQ Composite Index(2)(4) | | 13.32 | % | | 7.04 | % | | 18.16 | % | | 3.46 | % | | 8.08 | % | | 5.41 | % | | | | |
| | Russell 2000 Index(2)(5) | | 8.53 | % | | -2.08 | % | | 17.80 | % | | 0.54 | % | | 7.00 | % | | 6.47 | % | | | | |
| | Past performance does not guarantee future results. The performance data quoted represents past performance, and current returns may be lower or higher. The investment return and net asset value will fluctuate so that an investor’s shares, when redeemed, may be worth more or less than the original cost. To obtain performance information current to the most recent month-end, please call 1-800-625-7071. The returns shown in the above table and accompanying footnotes are net of expenses. The table above does not reflect the deduction of taxes that a shareholder would have paid on Fund distributions or on the redemption of Fund shares. | |
| | 1. | Investment results calculated after reinvestment of dividends. | |
| | 2. | It is not possible to invest directly in an index. The performance of the index does not include the deduction of expenses associated with a mutual fund, such as investment management fees. | |
| | 3. | The S&P 500 Index is a broad unmanaged measure of the U.S. stock market. | |
| | 4. | The NASDAQ Composite Index is a broad-based capitalization-weighted index of all NASDAQ Global Market and Small Cap stocks. | |
| | 5. | The Russell 2000 Index is a broad unmanaged index composed of the smallest 2,000 companies in the Russell 3000 Index. | |
| | 6. | Not annualized. | |
| | 7. | Compound annual growth rate (annualized return). Assumes all dividends were reinvested in shares of the Fund. | |
| | 8. | Cumulative return for the three year period was 52.56%, assuming all dividends were reinvested in shares of the Fund. | |
| | 9. | Cumulative return for the five year period was 27.27%, assuming all dividends were reinvested in shares of the Fund. | |
| | 10. | Cumulative return for the ten year period was 131.36%, assuming all dividends were reinvested in shares of the Fund. | |
| | 11. | The inception date of the Fund was 9/4/2001. | |
| | 12. | Cumulative return since inception was 132.05% assuming all dividends were reinvested in shares of the Fund. | |
| | 13. | Gross expense ratio is from the Fund’s prospectus dated May 1, 2012. Additional information pertaining to the Fund’s expense ratios as of June 30, 2012 can be found in the financial highlights. Since inception, the investment performance reflects contractually agreed upon fee waivers which expire at the close of business on May 1, 2013. Without these fee waivers, the performance would have been lower. Excluding the indirect costs of investing in acquired funds, total net fund operating expenses would be 1.83%. | |
| Top Ten Holdings* |
| (as a % of total investments, as of June 30, 2012) |
| | | | | | | |
| | | | | | % of Total | |
| | | Security | | | | Investments† | |
| | 1 Akamai Technologies, Inc. | | AKAM | | 8.18 | % | |
| | 2 PDF Solutions, Inc. | | PDFS | | 6.39 | % | |
| | 3 Entropic Communications, Inc. | | ENTR | | 5.36 | % | |
| | 4 Seagate Technology PLC | | STX | | 5.26 | % | |
| | 5 Apple, Inc. | | AAPL | | 3.95 | % | |
| | 6 Gilead Sciences, Inc. | | GILD | | 3.30 | % | |
| | 7 Mercury Computer Systems, Inc. | | MRCY | | 3.27 | % | |
| | 8 Finisar Corp. | | FNSR | | 2.89 | % | |
| | 9 Jabil Circuit, Inc. | | JBL | | 2.75 | % | |
| | 10 Emulex Corp. | | ELX | | 2.72 | % | |
| | Top Ten Holdings = 44.07% of Total Investments† | | | | | |
| | * Current portfolio holdings may not be indicative of future portfolio holdings. | | | | | |
| | † Percentage of total investments less cash. | | | | | |
Sector Weightings*
(as a % of total investments, as of June 30, 2012)
| | | | | | | | | | | | |
| | | Sector | | Long(1) | | (Short)(1) | | Total(1)(2) | |
| | Consumer Discretionary | | 3.0 | % | | -0.1 | % | | 2.9 | % | |
| | Energy | | 2.4 | % | | — | | | 2.4 | % | |
| | Financials | | 2.3 | % | | — | | | 2.3 | % | |
| | Health Care | | 8.6 | % | | — | | | 8.6 | % | |
| | Industrials | | 2.1 | % | | -1.1 | % | | 1.0 | % | |
| | Information Technology | | 85.7 | % | | -3.9 | % | | 81.8 | % | |
| | Materials | | 0.3 | % | | -0.2 | % | | 0.1 | % | |
| | Exchange Traded Funds | | — | | | -1.3 | % | | -1.3 | % | |
| | Cash | | 2.2 | % | | — | | | 2.2 | % | |
| | * Current portfolio holdings may not be indicative of future portfolio holdings. | |
| | (1) Percentage of total investments includes all stocks, plus cash minus all short positions. | |
| | (2) Total represents the difference between the long exposure and the short exposure, which produces the net exposure. | |
| | | | |
Comparison of Change in Value of a $10,000 Investment
Past performance does not guarantee future results. The performance data quoted represents past performance, and current returns may be lower or higher. The investment return and net asset value will fluctuate so that an investor’s shares, when redeemed, may be worth more or less than the original cost. To obtain performance information current to the most recent month-end, please call 1-800-625-7071. The graph above does not reflect the deduction of taxes that a shareholder would have paid on Fund distributions or on the redemption of Fund shares. Since inception, the Fund’s Adviser has absorbed certain expenses of the Fund, without which returns would have been lower.
The Global Industry Classification Standard (GICS®) was developed by and/or is the exclusive property of MSCI, Inc. and Standard & Poor Financial Services LLC (“S&P”). GICS is a service mark of MSCI and S&P and has been licensed for use by U.S. Bancorp Fund Services, LLC.
| | Semi-Annual Report 2012 |
| | |
| NEEDHAM SMALL CAP GROWTH FUND(Unaudited) | TICKER: NESGX |
| Comparative Performance Statistics as of June 30, 2012 |
| | | | 6 Months(6) | | 1 Year | | 3 Years(7) | | 5 Years(7) | | 10 Years(7) | | Since Inception(7)(11) | | Gross Expense Ratio(13) | |
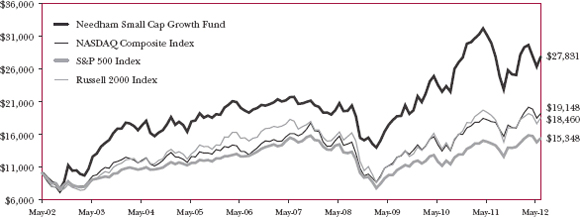
| | Needham Small Cap Growth Fund(1) | | 11.19 | % | | -6.97 | % | | 15.39 | %(8) | | 5.11 | %(9) | | 11.62 | %(10) | | 10.66 | %(12) | | 1.86 | % | |
| | S&P 500 Index(2)(3) | | 9.49 | % | | 5.45 | % | | 16.40 | % | | 0.22 | % | | 5.33 | % | | 4.33 | % | | | | |
| | NASDAQ Composite Index(2)(4) | | 13.32 | % | | 7.04 | % | | 18.16 | % | | 3.46 | % | | 8.08 | % | | 6.63 | % | | | | |
| | Russell 2000 Index(2)(5) | | 8.53 | % | | -2.08 | % | | 17.80 | % | | 0.54 | % | | 7.00 | % | | 6.25 | % | | | | |
| | Past performance does not guarantee future results. The performance data quoted represents past performance, and current returns may be lower or higher. The investment return and net asset value will fluctuate so that an investor’s shares, when redeemed, may be worth more or less than the original cost. To obtain performance information current to the most recent month-end, please call 1-800-625-7071. The returns shown in the above table and accompanying footnotes are net of expenses. The table above does not reflect the deduction of taxes that a shareholder would have paid on Fund distributions or on the redemption of Fund shares. | |
| | 1. | Investment results calculated after reinvestment of dividends. | |
| | 2. | It is not possible to invest directly in an index. The performance of the index does not include the deduction of expenses associated with a mutual fund, such as investment management fees. | |
| | 3. | The S&P 500 Index is a broad unmanaged measure of the U.S. stock market. | |
| | 4. | The NASDAQ Composite Index is a broad-based capitalization-weighted index of all NASDAQ Global Market and Small Cap stocks. | |
| | 5. | The Russell 2000 Index is a broad unmanaged index composed of the smallest 2,000 companies in the Russell 3000 Index. | |
| | 6. | Not annualized. | |
| | 7. | Compound annual growth rate (annualized return). Assumes all dividends were reinvested in shares of the Fund. | |
| | 8. | Cumulative return for the three year period was 53.64%, assuming all dividends were reinvested in shares of the Fund. | |
| | 9. | Cumulative return for the five year period was 28.31%, assuming all dividends were reinvested in shares of the Fund. | |
| | 10. | Cumulative return for the ten year period was 200.23%, assuming all dividends were reinvested in shares of the Fund. 11. The inception date of the Fund was 5/22/02. | |
| | 12. | Cumulative return since inception was 178.31%, assuming all dividends were reinvested in shares of the Fund. | |
| | 13. | Gross expense ratio is from the Fund’s prospectus dated May 1, 2012. Additional information pertaining to the Fund’s expense ratios as of June 30, 2012 can be found in the financial highlights. Since inception, the investment performance reflects contractually agreed upon fee waivers which expire at the close of business on May 1, 2013. Without these fee waivers, the performance would have been lower. Excluding the indirect costs of investing in acquired funds, total net fund operating expenses would be 1.84%. | |
Top Ten Holdings*
(as a % of total investments, as of June 30, 2012)
| | | | Security | | | | | % of Total Investments† | |
| | 1 | Emulex Corp. | | ELX | | 7.31 | % | |
| | 2 | Entropic Communications, Inc. | | ENTR | | 5.32 | % | |
| | 3 | FormFactor, Inc. | | FORM | | 4.69 | % | |
| | 4 | Anaren, Inc. | | ANEN | | 4.26 | % | |
| | 5 | QuinStreet, Inc. | | QNST | | 4.16 | % | |
| | 6 | Aeropostale, Inc. | | ARO | | 3.88 | % | |
| | 7 | Super Micro Computer, Inc. | | SMCI | | 3.71 | % | |
| | 8 | American Eagle Outfitters, Inc. | | AEO | | 3.58 | % | |
| | 9 | Financial Engines, Inc. | | FNGN | | 3.42 | % | |
| | 10 | TTM Technologies, Inc. | | TTMI | | 3.41 | % | |
| | Top Ten Holdings = 43.74% of Total Investments† | |
| | * | Current portfolio holdings may not be indicative of future portfolio holdings. | |
| | † | Percentage of total investments less cash. | |
Sector Weightings*
(as a % of total investments, as of June 30, 2012)
| | | Sector | | | Long(1) | | (Short)(1) | | Total(1)(2) | |
| | Consumer Discretionary | | 9.3 | % | | (0.2 | )% | | 9.1 | % | |
| | Energy | | 5.2 | % | | — | | | 5.2 | % | |
| | Financials | | 3.5 | % | | — | | | 3.5 | % | |
| | Health Care | | 11.9 | % | | (0.6 | )% | | 11.3 | % | |
| | Industrials | | 5.6 | % | | (1.5 | )% | | 4.1 | % | |
| | Information Technology | | 65.7 | % | | (4.9 | )% | | 60.8 | % | |
| | Exchange Traded Funds | | — | | | (4.5 | )% | | (4.5 | )% | |
| | Cash | | 10.5 | % | | — | | | 10.5 | % | |
| | * | Current portfolio holdings may not be indicative of future portfolio holdings. | |
| | (1) | Percentage of total investments includes all stocks, plus cash minus all short positions. | |
| | (2) | Total represents the difference between the long exposure and the short exposure, which produces the net exposure. | |
| | | | |
Comparison of Change in Value of a $10,000 Investment
Past performance does not guarantee future results. The performance data quoted represents past performance, and current returns may be lower or higher. The investment return and net asset value will fluctuate so that an investor’s shares, when redeemed, may be worth more or less than the original cost. To obtain performance information current to the most recent month-end, please call 1-800-625-7071. The graph above does not reflect the deduction of taxes that a shareholder would have paid on Fund distributions or on the redemption of Fund shares. Since inception, the Fund’s Adviser has absorbed certain expenses of the Fund, without which returns would have been lower.
The Global Industry Classification Standard (GICS®) was developed by and/or is the exclusive property of MSCI, Inc. and Standard & Poor Financial Services LLC (“S&P”). GICS is a service mark of MSCI and S&P and has been licensed for use by U.S. Bancorp Fund Services, LLC.
Disclosure of Fund Expenses (Unaudited)
The following expense table is shown so that you can understand the impact of fees on your investment. All mutual funds have operating expenses. As a shareholder of the fund, you incur transactional costs, including redemption fees and exchange fees, and ongoing costs, which include costs for portfolio management, administrative services, and shareholder reports, among others. A fund’s expenses are expressed as a percentage of its average net assets. This figure is known as the expense ratio. The following examples are intended to help you understand the ongoing costs (in dollars) of investing in each fund and to compare these costs with those of other mutual funds. The examples are based on an investment of $1,000 made at the beginning of the period shown and held for the entire period.
The expense example table below illustrates your fund’s cost in two ways:
| | |
| ● | Actual Expenses. This section helps you to estimate the actual expenses after fee waivers that you paid over the period. The ‘‘Ending Account Value’’ shown is derived from the fund’s actual return, and ‘‘Expenses Paid During Period’’ shows the dollar amount that would have been paid by an investor who started with $1,000 in the fund. You may use the information here, together with the amount you invested, to estimate the expenses that you paid over the period. To do so, simply divide your account value by $1,000 (for example, an $8,600 account value divided by $1,000 = 8.6), then multiply the result by the number given for your fund under the heading entitled ‘‘Expenses Paid During Period’’. |
| | |
| ● | Hypothetical Expenses on a 5% Return. This section is intended to help you compare your fund’s costs with those of other mutual funds. It assumes that the fund had a return of 5% before expenses during the period shown, but that the expense ratio is unchanged. In this case, because the return used is not the fund’s actual return, the results do not apply to your investment. The example is useful in making comparisons because the Securities and Exchange Commission requires all mutual funds to calculate expenses based on a 5% return. You can assess your fund’s cost by comparing this hypothetical example with the hypothetical examples that appear in shareholders reports of other funds. |
Please note that the expenses shown in the table are meant to highlight your ongoing costs only and do not reflect any transactional costs, such as redemption fees or exchange fees. Therefore, the table is useful in comparing ongoing costs only, and will not help you determine the relative total costs of owning different funds. In addition, if these transactional costs were included, your costs would have been higher.
For the Period January 1, 2012 to June 30, 2012
Expense Example Table
| | | | | | | | | | | | | | |
| | | Beginning Account Value 1/1/12 | | Ending Account Value 6/30/12 | | Expenses Paid During Period* 1/1/12 - 6/30/12 | | Expenses Ratio During Period* 1/1/12 - 6/30/12 | |
| Needham Growth Fund | | | | | | | | | | | | | | | | | | | |
| Actual Expenses | | | $ | 1,000.00 | | | | $ | 1,066.20 | | | | $ | 9.71 | | | 1.89 | % | |
| Hypothetical Example for Comparison Purposes (5% return before expenses) | | | $ | 1,000.00 | | | | $ | 1,015.47 | | | | $ | 9.47 | | | 1.89 | % | |
| | | | | | | | | | | | | | | | | | | | |
| Needham Aggressive Growth Fund | | | | | | | | | | | | | | | | | | | |
| Actual Expenses | | | $ | 1,000.00 | | | | $ | 1,086.10 | | | | $ | 10.53 | | | 2.03 | % | |
| Hypothetical Example for Comparison Purposes (5% return before expenses) | | | $ | 1,000.00 | | | | $ | 1,014.77 | | | | $ | 10.17 | | | 2.03 | % | |
| | | | | | | | | | | | | | | | | | | | |
| Needham Small Cap Growth Fund | | | | | | | | | | | | | | | | | | | |
| Actual Expenses | | | $ | 1,000.00 | | | | $ | 1,111.90 | | | | $ | 10.40 | | | 1.98 | % | |
| Hypothetical Example for Comparison Purposes (5% return before expenses) | | | $ | 1,000.00 | | | | $ | 1,015.02 | | | | $ | 9.92 | | | 1.98 | % | |
| * | Expenses are equal to the average account value times the Fund’s annualized expense ratio multiplied by the number of days in the most recent fiscal half-year divided by the number of days in the fiscal year. |
June 30, 2012 (Unaudited)
| | | Shares | | | Fair Value | |
| Common Stocks (95.9%) | | | | | | |
| | | | | | | |
| Aerospace & Defense (2.7%) | | | | | | |
| Honeywell International, Inc. | | | 20,000 | | | $ | 1,116,800 | |
| Sypris Solutions, Inc. | | | 300,000 | | | | 2,091,000 | |
| | | | | | | | 3,207,800 | |
| | | | | | | | | |
| Biotechnology (3.0%) | | | | | | | | |
| Gilead Sciences, Inc.* | | | 70,000 | | | | 3,589,600 | |
| | | | | | | | | |
| Capital Markets (2.5%) | | | | | | | | |
| Financial Engines, Inc.* | | | 102,500 | | | | 2,198,625 | |
| Oaktree Capital Group LLC | | | 20,000 | | | | 707,000 | |
| | | | | | | | 2,905,625 | |
| | | | | | | | | |
| Communications Equipment (8.9%) | | | | | | | | |
| Anaren, Inc.* | | | 100,000 | | | | 1,960,000 | |
| Emulex Corp.* | | | 300,000 | | | | 2,160,000 | |
| Finisar Corp.* | | | 115,000 | | | | 1,720,400 | |
| Riverbed Technology, Inc.* | | | 15,000 | | | | 242,250 | |
| ViaSat, Inc.* | | | 120,000 | | | | 4,532,400 | |
| | | | | | | | 10,615,050 | |
| | | | | | | | | |
| Computers & Peripherals (10.3%) | | | | | | | | |
| Electronics for Imaging, Inc.* | | | 86,250 | | | | 1,401,563 | |
| Seagate Technology PLC | | | 295,000 | | | | 7,295,350 | |
| Super Micro Computer, Inc.* | | | 222,250 | | | | 3,524,885 | |
| | | | | | | | 12,221,798 | |
| | | | | | | | | |
| Electrical Equipment (1.1%) | | | | | | | | |
| II-VI, Inc.* | | | 76,200 | | | | 1,270,254 | |
| | | | | | | | | |
| Electronic Equipment, Instruments & Components (9.2%) | | | | | | | | |
| | | | | | | | | |
| Corning, Inc. | | | 43,750 | | | | 565,687 | |
| Electro Scientific Industries, Inc. | | | 230,000 | | | | 2,718,600 | |
| Jabil Circuit, Inc. † | | | 150,000 | | | | 3,049,500 | |
| Mercury Computer Systems, Inc.* | | | 104,500 | | | | 1,351,185 | |
| Newport Corp.* | | | 125,000 | | | | 1,502,500 | |
| Vishay Intertechnology, Inc.* | | | 185,000 | | | | 1,744,550 | |
| | | | | | | | 10,932,022 | |
| | | | | | | | | |
| Energy Equipment & Services (0.6%) | | | | | | | | |
| Schlumberger Ltd. | | | 10,000 | | | | 649,100 | |
| | | | | | | | | |
| Health Care Equipment & Supplies (8.2%) | | | | | | | | |
| Becton Dickinson and Co. | | | 46,000 | | | | 3,438,500 | |
| CONMED Corp. | | | 50,000 | | | | 1,383,500 | |
| Covidien PLC | | | 30,000 | | | | 1,605,000 | |
| Varian Medical Systems, Inc.* | | | 55,000 | | | | 3,342,350 | |
| | | | | | | | 9,769,350 | |
| | | Shares | | | Fair Value | |
| Common Stocks – Continued | | | | | | |
| | | | | | | |
| Health Care Providers & Services (10.6%) | | | | | | |
| Express Scripts Holding Co.* † | | | 225,000 | | | $ | 12,561,750 | |
| | | | | | | | | |
| Health Care Technology (0.6%) | | | | | | | | |
| Allscripts Healthcare Solutions, Inc.* | | | 70,000 | | | | 765,100 | |
| | | | | | | | | |
| Household Durables (0.3%) | | | | | | | | |
| iRobot Corp.* | | | 15,000 | | | | 332,250 | |
| | | | | | | | | |
| Internet Software & Services (4.9%) | | | | | | | | |
| Akamai Technologies, Inc.* | | | 75,000 | | | | 2,381,250 | |
| Brightcove, Inc.* | | | 25,220 | | | | 384,605 | |
| CoStar Group, Inc.* | | | 2,500 | | | | 203,000 | |
| Facebook, Inc.* | | | 9,718 | | | | 302,424 | |
| QuinStreet, Inc.* | | | 185,000 | | | | 1,713,100 | |
| Responsys, Inc.* | | | 27,500 | | | | 333,300 | |
| Soundbite Communications, Inc.* | | | 200,000 | | | | 526,000 | |
| | | | | | | | 5,843,679 | |
| | | | | | | | | |
| Life Sciences Tools & Services (5.0%) | | | | | | | | |
| Thermo Fisher Scientific, Inc. | | | 115,000 | | | | 5,969,650 | |
| | | | | | | | | |
| Media (1.6%) | | | | | | | | |
| Comcast Corp. | | | 60,000 | | | | 1,918,200 | |
| | | | | | | | | |
| Metals & Mining (0.3%) | | | | | | | | |
| Walter Energy, Inc. | | | 7,500 | | | | 331,200 | |
| | | | | | | | | |
| Oil, Gas & Consumable Fuels (1.8%) | | | | | | | | |
| Hess Corp. | | | 50,000 | | | | 2,172,500 | |
| | | | | | | | | |
| Professional Services (0.4%) | | | | | | | | |
| WageWorks, Inc.* | | | 35,000 | | | | 527,100 | |
| | | | | | | | | |
| Semiconductors & Semiconductor Equipment (16.6%) | | | | | | | | |
| Brooks Automation, Inc. | | | 335,000 | | | | 3,162,400 | |
| Entegris, Inc.* | | | 210,000 | | | | 1,793,400 | |
| Entropic Communications, Inc.* | | | 700,000 | | | | 3,948,000 | |
| FormFactor, Inc.* | | | 335,950 | | | | 2,173,597 | |
| MKS Instruments, Inc. | | | 60,000 | | | | 1,735,800 | |
| Nova Measuring Instruments Ltd.* | | | 170,000 | | | | 1,482,400 | |
| PDF Solutions, Inc.* | | | 380,000 | | | | 3,750,600 | |
| TriQuint Semiconductor, Inc.* | | | 161,750 | | | | 889,625 | |
| Ultra Clean Holdings* | | | 122,500 | | | | 787,675 | |
| | | | | | | | 19,723,497 | |
| | | | | | | | | |
| Software (1.8%) | | | | | | | | |
| Actuate Corp.* | | | 50,000 | | | | 346,500 | |
| AVG Technologies NV* | | | 138,600 | | | | 1,803,186 | |
| | | | | | | | 2,149,686 | |
See accompanying notes to financial statements.
Needham Growth Fund
Schedule of Investments (Continued)
June 30, 2012 (Unaudited)
| | | Shares | | | Fair Value | |
| Common Stocks - Continued | | | | | | |
| | | | | | | |
| Specialty Retail (5.5%) | | | | | | |
| CarMax, Inc.* | | | 167,500 | | | $ | 4,344,950 | |
| Dick’s Sporting Goods, Inc. † | | | 45,000 | | | | 2,160,000 | |
| | | | | | | | 6,504,950 | |
| | | | | | | | | |
| Total Common Stocks | | | | | | | | |
| (Cost $81,967,947) | | | | | | | 113,960,161 | |
| | | | | | | | | |
| Short-Term Investment (4.9%) | | | | | | | | |
| | | | | | | | | |
| Money Market Fund (4.9%) | | | | | | | | |
| Dreyfus Treasury Prime Cash Management 0.00% (a) | | | | | | | | |
| (Cost $5,865,225) | | | 5,865,225 | | | $ | 5,865,225 | |
| | | | | | | | | |
| Total Investments (100.8%) | | | | | | | | |
| (Cost $87,833,172) | | | | | | | 119,825,386 | |
| Total Securities Sold Short (-7.8%) | | | | | | | (9,258,806 | ) |
| (Proceeds $8,850,927) | | | | | | | | |
| Other Assets in Excess of Liabilities (7.0%) | | | | | | | 8,251,597 | |
| Net Assets (100.0%) | | | | | | $ | 118,818,177 | |
| (a) | Rate shown is the seven day yield as of June 30, 2012 and is less than 0.01%. |
| | |
| * | Non-income producing security. |
| | |
| † | Security position is either entirely or partially held in a segregated account as collateral for securities sold short, aggregating a total market value of $5,298,050. |
The Global Industry Classification Standard (GICS®) was developed by and/or is the exclusive property of MSCI, Inc. and Standard & Poor’s Financial Services LLC (“S&P”). GICS is a service mark of MSCI and S&P and has been licensed for use by U.S. Bancorp Fund Services, LLC.
See accompanying notes to financial statements.
Needham Growth Fund
Schedule of Securities Sold Short
June 30, 2012 (Unaudited)
| | | Shares | | | Fair Value | |
| Securities Sold Short (-5.4%) | | | | | | |
| | | | | | | |
| Airlines (-1.2%) | | | | | | |
| Allegiant Travel Co.* | | | 20,000 | | | $ | 1,393,600 | |
| | | | | | | | | |
| Auto Components (0.0%) | | | | | | | | |
| Drew Industries, Inc.* | | | 2,500 | | | | 69,625 | |
| | | | | | | | | |
| Electronic Equipment, Instruments & Components (-0.2%) | | | | | | | | |
| Trimble Navigation Ltd.* | | | 5,000 | | | | 230,050 | |
| | | | | | | | | |
| Internet Software & Services (-0.7%) | | | | | | | | |
| KIT Digital, Inc.* | | | 10,625 | | | | 45,581 | |
| SPS Commerce, Inc.* | | | 25,000 | | | | 759,500 | |
| | | | | | | | 805,081 | |
| | | | | | | | | |
| Semiconductors & Semiconductor Equipment (-1.7%) | | | | | | | | |
| Advanced Energy Industries, Inc.* | | | 15,000 | | | | 201,300 | |
| EZchip Semiconductor Ltd.* | | | 17,500 | | | | 700,700 | |
| Hittite Microwave Corp.* | | | 15,000 | | | | 766,800 | |
| Microsemi Corp.* | | | 15,000 | | | | 277,350 | |
| STR Holdings, Inc.* | | | 20,000 | | | | 91,200 | |
| | | | | | | | 2,037,350 | |
| | | | | | | | | |
| Software (-1.6%) | | | | | | | | |
| ANSYS, Inc.* | | | 24,000 | | | | 1,514,640 | |
| Sourcefire, Inc.* | | | 7,500 | | | | 385,500 | |
| | | | | | | | 1,900,140 | |
| | | | | | | | | |
| Total Securities Sold Short | | | | | | | | |
| (Proceeds $6,001,028) | | | | | | | 6,435,846 | |
| | | | | | | | | |
| Exchange Traded Funds Sold Short (-2.4%) | | | | | | | | |
| iShares Russell 2000 Growth Index Fund | | | 10,500 | | | | 960,435 | |
| iShares Russell 2000 Index Fund | | | 10,500 | | | | 836,325 | |
| iShares Russell 2000 Value Index Fund | | | 10,000 | | | | 703,900 | |
| Market Vectors Semiconductor ETF* | | | 10,000 | | | | 322,300 | |
| | | | | | | | | |
| Total Exchange Traded Funds Sold Short | | | | | | | | |
| (Proceeds $2,849,899) | | | | | | | 2,822,960 | |
| | | | | | | | | |
| Total Securities & Exchange Traded Funds Sold Short | | | | | | | | |
| (Proceeds $8,850,927) | | | | | | | 9,258,806 | |
| | | | | | | | | |
| Total Securities & Exchange Traded Funds Sold Short (-7.8%) | | | | | | | (9,258,806 | ) |
Total Investments
(Cost $87,833,172)(100.4%) | | | | | | | 119,825,386 | |
| Other Assets in Excess of Liabilities (7.4%) | | | | | | | 8,251,597 | |
| Net Assets (100.0%) | | | | | | $ | 118,818,177 | |
| * | Non-income producing security. |
The Global Industry Classification Standard (GICS®) was developed by and/or is the exclusive property of MSCI, Inc. and Standard & Poor’s Financial Services LLC (“S&P”). GICS is a service mark of MSCI and S&P and has been licensed for use by U.S. Bancorp Fund Services, LLC.
See accompanying notes to financial statements.
| Needham Aggressive Growth Fund |
| Schedule of Investments |
| June 30, 2012 (Unaudited) |
| | | Shares | | | Fair Value | |
| | | | | | | |
| Common Stocks (97.7%) | | | | | | |
| | | | | | | |
| Aerospace & Defense (1.0%) | | | | | | |
| Precision Castparts Corp.† | | | 5,000 | | | $ | 822,450 | |
| | | | | | | | | |
| Biotechnology (3.2%) | | | | | | | | |
| Gilead Sciences, Inc.* | | | 50,000 | | | | 2,564,000 | |
| | | | | | | | | |
| Capital Markets (2.2%) | | | | | | | | |
| Financial Engines, Inc.* | | | 80,000 | | | | 1,716,000 | |
| | | | | | | | | |
| Chemicals (0.3%) | | | | | | | | |
| AZ Electronic Materials SA | | | 50,000 | | | | 224,742 | |
| | | | | | | | | |
| Communications Equipment (9.0%) | | | | | | | | |
| Anaren, Inc.* | | | 91,550 | | | | 1,794,380 | |
| Emulex Corp.* | | | 292,800 | | | | 2,108,160 | |
| Finisar Corp.* | | | 150,000 | | | | 2,244,000 | |
| Riverbed Technology, Inc.* | | | 10,000 | | | | 161,500 | |
| ViaSat, Inc.* | | | 22,500 | | | | 849,825 | |
| | | | | | | | 7,157,865 | |
| | | | | | | | | |
| Computers & Peripherals (12.9%) | | | | | | | | |
| Apple, Inc.* † | | | 5,250 | | | | 3,066,000 | |
| Electronics for Imaging, Inc.* | | | 70,000 | | | | 1,137,500 | |
| Seagate Technology PLC | | | 165,000 | | | | 4,080,450 | |
| STEC, Inc.* | | | 32,500 | | | | 253,500 | |
| Super Micro Computer, Inc.* | | | 110,000 | | | | 1,744,600 | |
| | | | | | | | 10,282,050 | |
| | | | | | | | | |
| Electrical Equipment (0.2%) | | | | | | | | |
| II-VI, Inc.* | | | 10,200 | | | | 170,034 | |
| | | | | | | | | |
| Electronic Equipment, Instruments & Components (15.0%) | | | | | | | | |
| Corning, Inc. | | | 84,500 | | | | 1,092,585 | |
| Electro Scientific Industries, Inc. | | | 60,000 | | | | 709,200 | |
| FEI Co.* | | | 16,000 | | | | 765,440 | |
| IPG Photonics Corp.* | | | 5,000 | | | | 217,950 | |
| Jabil Circuit, Inc. † | | | 105,100 | | | | 2,136,683 | |
| Mercury Computer Systems, Inc.* | | | 196,000 | | | | 2,534,280 | |
| Multi-Fineline Electronix, Inc.* | | | 65,000 | | | | 1,601,600 | |
| Newport Corp.* | | | 70,000 | | | | 841,400 | |
| TTM Technologies, Inc.* | | | 210,500 | | | | 1,980,805 | |
| | | | | | | | 11,879,943 | |
| | | | | | | | | |
| Health Care Equipment & Supplies (2.9%) | | | | | | | | |
| Becton Dickinson and Co. | | | 8,000 | | | | 598,000 | |
| LeMaitre Vascular, Inc. | | | 40,000 | | | | 240,000 | |
| Varian Medical Systems, Inc.* | | | 16,000 | | | | 972,320 | |
| Volcano Corp.* | | | 16,000 | | | | 458,400 | |
| | | | | | | | 2,268,720 | |
| | | Shares | | | Fair Value | |
| | | | | | | |
| Common Stocks - Continued | | | | | | |
| | | | | | | |
| Health Care Providers & Services (1.3%) | | | | | | |
| Express Scripts Holding Co.* † | | | 18,000 | | | $ | 1,004,940 | |
| | | | | | | | | |
| Health Care Technology (0.7%) | | | | | | | | |
| Allscripts Healthcare Solutions, Inc.* | | | 13,000 | | | | 142,090 | |
| Omnicell, Inc.* | | | 29,200 | | | | 427,488 | |
| | | | | | | | 569,578 | |
| | | | | | | | | |
| Household Durables (0.3%) | | | | | | | | |
| iRobot Corp.* | | | 10,000 | | | | 221,500 | |
| | | | | | | | | |
| Internet Software & Services (16.4%) | | | | | | | | |
| Akamai Technologies, Inc.* † | | | 200,000 | | | | 6,350,000 | |
| Brightcove, Inc.* | | | 18,774 | | | | 286,304 | |
| Carbonite, Inc.* | | | 15,000 | | | | 134,100 | |
| CoStar Group, Inc.* | | | 1,500 | | | | 121,800 | |
| Equinix, Inc.* | | | 5,300 | | | | 930,945 | |
| Facebook, Inc.* | | | 5,494 | | | | 170,973 | |
| QuinStreet, Inc.* | | | 27,000 | | | | 250,020 | |
| Reis, Inc.* | | | 101,000 | | | | 970,105 | |
| Responsys, Inc.* | | | 65,000 | | | | 787,800 | |
| Saba Software, Inc.* | | | 222,500 | | | | 2,064,800 | |
| Soundbite Communications, Inc.* | | | 375,000 | | | | 986,250 | |
| | | | | | | | 13,053,097 | |
| | | | | | | | | |
| Oil, Gas & Consumable Fuels (2.2%) | | | | | | | | |
| Hess Corp. | | | 7,500 | | | | 325,875 | |
| Suncor Energy, Inc. † | | | 50,500 | | | | 1,461,975 | |
| | | | | | | | 1,787,850 | |
| | | | | | | | | |
| Professional Services (0.7%) | | | | | | | | |
| WageWorks, Inc.* | | | 35,000 | | | | 527,100 | |
| | | | | | | | | |
| Semiconductors & Semiconductor Equipment (24.3%) | | | | | | | | |
| ATMI, Inc.* | | | 35,000 | | | | 719,950 | |
| Entegris, Inc.* | | | 185,000 | | | | 1,579,900 | |
| Entropic Communications, Inc.* | | | 737,500 | | | | 4,159,500 | |
| FormFactor, Inc.* | | | 286,000 | | | | 1,850,420 | |
| MIPS Technologies, Inc.* | | | 168,000 | | | | 1,120,560 | |
| MKS Instruments, Inc. | | | 29,100 | | | | 841,863 | |
| Nanometrics, Inc.* | | | 5,000 | | | | 76,800 | |
| Nova Measuring Instruments Ltd.* | | | 138,200 | | | | 1,205,104 | |
| PDF Solutions, Inc.* | | | 502,500 | | | | 4,959,675 | |
| Photronics, Inc.* | | | 35,000 | | | | 213,500 | |
| RF Micro Devices, Inc.* | | | 212,500 | | | | 903,125 | |
| TriQuint Semiconductor, Inc.* † | | | 235,900 | | | | 1,297,450 | |
| Ultra Clean Holdings* | | | 65,250 | | | | 419,558 | |
| | | | | | | | 19,347,405 | |
See accompanying notes to financial statements.
| Needham Aggressive Growth Fund |
| Schedule of Investments (Continued) |
| June 30, 2012 (Unaudited) |
| | | Shares | | | Fair Value | |
| | | | | | | |
| Common Stocks - Continued | | | | | | |
| | | | | | | |
| Software (2.6%) | | | | | | |
| Actuate Corp.* | | | 15,000 | | | $ | 103,950 | |
| AVG Technologies NV* | | | 83,000 | | | | 1,079,830 | |
| Bottomline Technologies, Inc.* | | | 32,280 | | | | 582,654 | |
| Exa Corp.* | | | 25,000 | | | | 265,250 | |
| | | | | | | | 2,031,684 | |
| | | | | | | | | |
| Specialty Retail (2.5%) | | | | | | | | |
| Aeropostale, Inc.* | | | 30,000 | | | | 534,900 | |
| CarMax, Inc.* | | | 22,500 | | | | 583,650 | |
| Dick’s Sporting Goods, Inc. † | | | 18,000 | | | | 864,000 | |
| | | | | | | | 1,982,550 | |
| | | | | | | | | |
| Total Common Stocks | | | | | | | | |
| (Cost $70,743,443) | | | | | | | 77,611,508 | |
| | | | | | | | | |
| Short Term Investment (2.1%) | | | | | | | | |
| | | | | | | | | |
| Money Market Fund (2.1%) | | | | | | | | |
Dreyfus Treasury Prime Cash Management 0.00% (a)
(Cost $1,667,704) | | | 1,667,704 | | | $ | 1,667,704 | |
| | | | | | | | | |
| Total Investments (99.8%) | | | | | | | | |
| (Cost $72,411,147) | | | | | | | 79,279,212 | |
| Total Securities Sold Short (-6.2%) (Proceeds $4,797,156) | | | | | | | (4,914,565 | ) |
| Other Assets in Excess of Liabilities (6.4%) | | | | | | | 5,077,810 | |
| Net Assets (100.0%) | | | | | | $ | 79,442,457 | |
| (a) | Rate shown is the seven day yield as of June 30, 2012 and is less than 0.01%. |
| | |
| * | Non-income producing security. |
| | |
| † | Security position is either entirely or partially held in a segregated account as collateral for securities sold short, aggregating a total market value of $6,753,960. |
| | |
The Global Industry Classification Standard (GICS®) was developed by and/or is the exclusive property of MSCI, Inc. and Standard & Poor’s Financial Services LLC (“S&P”). GICS is a service mark of MSCI and S&P and has been licensed for use by U.S. Bancorp Fund Services, LLC. |
See accompanying notes to financial statements.
| Needham Aggressive Growth Fund |
| Schedule of Securities Sold Short |
| June 30, 2012 (Unaudited) |
| | | Shares | | | Fair Value | |
| | | | | | | |
| Securities Sold Short (-5.0%) | | | | | | |
| | | | | | | |
| Airlines (-1.1%) | | | | | | |
| Allegiant Travel Co.* | | | 12,250 | | | $ | 853,580 | |
| | | | | | | | | |
| Chemicals (-0.2%) | | | | | | | | |
| Zoltek Cos., Inc.* | | | 16,250 | | | | 146,738 | |
| | | | | | | | | |
| Internet & Catalog Retail (-0.1%) | | | | | | | | |
| HomeAway, Inc.* | | | 5,000 | | | | 108,700 | |
| | | | | | | | | |
| Internet Software & Services (-1.1%) | | | | | | | | |
| KIT Digital, Inc.* | | | 66,250 | | | | 284,212 | |
| SPS Commerce, Inc.* | | | 20,000 | | | | 607,600 | |
| | | | | | | | 891,812 | |
| | | | | | | | | |
| IT Services (-0.1%) | | | | | | | | |
| ServiceSource International, Inc.* | | | 2,500 | | | | 34,625 | |
| | | | | | | | | |
| Software (-2.4%) | | | | | | | | |
| ANSYS, Inc.* | | | 20,000 | | | | 1,262,200 | |
| Fortinet, Inc.* | | | 12,500 | | | | 290,250 | |
| Sourcefire, Inc.* | | | 7,500 | | | | 385,500 | |
| | | | | | | | 1,937,950 | |
| | | | | | | | | |
| Total Securities Sold Short | | | | | | | | |
| (Proceeds $3,864,714) | | | | | | | 3,973,405 | |
| | | | | | | | | |
| Exchange Traded Funds Sold Short (-1.2%) | | | | | | | | |
| iShares Russell 2000 Growth Index Fund | | | 5,500 | | | | 503,085 | |
| iShares Russell 2000 Index Fund | | | 5,500 | | | | 438,075 | |
| | | | | | | | | |
| Total Exchange Traded Funds Sold Short | | | | | | | | |
| (Proceeds $932,442) | | | | | | | 941,160 | |
| | | | | | | | | |
| Total Securities & Exchange Traded Funds Sold Short | | | | | | | | |
| (Proceeds $4,797,156) | | | | | | | 4,914,565 | |
| | | | | | | | | |
| Total Securities & Exchange Traded Funds Sold Short (-6.2%) | | | | | | | (4,914,565 | ) |
Total Investments
(Cost $72,411,147)(99.8%) | | | | | | | 79,279,212 | |
| Other Assets in Excess of Liabilities (6.4%) | | | | | | | 5,077,810 | |
| Net Assets (100.0%) | | | | | | $ | 79,442,457 | |
| * | Non-income producing security. |
| | |
| The Global Industry Classification Standard (GICS®) was developed by and/or is the exclusive property of MSCI, Inc. and Standard & Poor’s Financial Services LLC (“S&P”). GICS is a service mark of MSCI and S&P and has been licensed for use by U.S. Bancorp Fund Services, LLC. |
See accompanying notes to financial statements.
| Needham Small Cap Growth Fund |
| Schedule of Investments |
| June 30, 2012 (Unaudited) |
| | | Shares | | | Fair Value | |
| Common Stocks (91.7%) | | | | | | |
| | | | | | | |
| Capital Markets (3.1%) | | | | | | |
| Financial Engines, Inc.*† | | | 110,000 | | | $ | 2,359,500 | |
| | | | | | | | | |
| Commercial Services & Supplies (2.7%) | | | | | | | | |
| Ritchie Bros Auctioneers, Inc.† | | | 95,000 | | | | 2,018,750 | |
| | | | | | | | | |
| Communications Equipment (15.9%) | | | | | | | | |
| Anaren, Inc.*† | | | 150,000 | | | | 2,940,000 | |
| Aruba Networks, Inc.*† | | | 110,000 | | | | 1,655,500 | |
| Emulex Corp.* | | | 700,000 | | | | 5,040,000 | |
| Finisar Corp.* | | | 40,000 | | | | 598,400 | |
| Riverbed Technology, Inc.* | | | 35,000 | | | | 565,250 | |
| ViaSat, Inc.* | | | 30,000 | | | | 1,133,100 | |
| | | | | | | | 11,932,250 | |
| | | | | | | | | |
| Computers & Peripherals (4.9%) | | | | | | | | |
| QLogic Corp.* | | | 30,000 | | | | 410,700 | |
| Seagate Technology PLC | | | 30,000 | | | | 741,900 | |
| Super Micro Computer, Inc.*† | | | 161,250 | | | | 2,557,425 | |
| | | | | | | | 3,710,025 | |
| | | | | | | | | |
| Electrical Equipment (1.4%) | | | | | | | | |
| II-VI, Inc.* | | | 62,300 | | | | 1,038,541 | |
| | | | | | | | | |
| Electronic Equipment, Instruments & Components (10.9%) | | | | | | | | |
| Electro Scientific Industries, Inc.† | | | 173,700 | | | | 2,053,134 | |
| Mercury Computer Systems, Inc.*† | | | 138,889 | | | | 1,795,835 | |
| Newport Corp.* | | | 20,000 | | | | 240,400 | |
| TTM Technologies, Inc.*† | | | 250,000 | | | | 2,352,500 | |
| Vishay Intertechnology, Inc.*† | | | 185,000 | | | | 1,744,550 | |
| | | | | | | | 8,186,419 | |
| | | | | | | | | |
| Energy Equipment & Services (2.5%) | | | | | | | | |
| CE Franklin Ltd.*† | | | 150,000 | | | | 1,872,000 | |
| | | | | | | | | |
| Health Care Equipment & Supplies (3.3%) | | | | | | | | |
| DexCom, Inc.* | | | 100,000 | | | | 1,296,000 | |
| Palomar Medical Technologies, Inc.* | | | 140,000 | | | | 1,190,000 | |
| | | | | | | | 2,486,000 | |
| | | | | | | | | |
| Health Care Providers & Services (2.6%) | | | | | | | | |
| Express Scripts Holding Co.*† | | | 35,000 | | | | 1,954,050 | |
| | | | | | | | | |
| Health Care Technology (4.9%) | | | | | | | | |
| Allscripts Healthcare Solutions, Inc.*† | | | 150,000 | | | | 1,639,500 | |
| Omnicell, Inc.*† | | | 140,000 | | | | 2,049,600 | |
| | | | | | | | 3,689,100 | |
| | | Shares | | | Fair Value | |
| Common Stocks - Continued | | | | | | |
| | | | | | | |
| Household Durables (0.4%) | | | | | | |
| iRobot Corp.* | | | 12,500 | | | $ | 276,875 | |
| | | | | | | | | |
| Internet Software & Services (4.7%) | | | | | | | | |
| QuinStreet, Inc.* | | | 310,000 | | | | 2,870,600 | |
| Responsys, Inc.* | | | 30,900 | | | | 374,508 | |
| Soundbite Communications, Inc.* | | | 121,463 | | | | 319,447 | |
| | | | | | | | 3,564,555 | |
| | | | | | | | | |
| Metals & Mining (0.8%) | | | | | | | | |
| Walter Energy, Inc. | | | 13,000 | | | | 574,080 | |
| | | | | | | | | |
| Oil, Gas & Consumable Fuels (1.4%) | | | | | | | | |
| Hess Corp. | | | 25,000 | | | | 1,086,250 | |
| | | | | | | | | |
| Professional Services (1.0%) | | | | | | | | |
| WageWorks, Inc.* | | | 50,000 | | | | 753,000 | |
| | | | | | | | | |
| Semiconductors & Semiconductor Equipment (21.3%) | | | | | | | | |
| Brooks Automation, Inc. | | | 50,000 | | | | 472,000 | |
| Entropic Communications, Inc.* | | | 650,000 | | | | 3,666,000 | |
| FormFactor, Inc.* | | | 500,000 | | | | 3,235,000 | |
| MaxLinear, Inc.* | | | 450,000 | | | | 2,232,000 | |
| Nova Measuring Instruments Ltd.* | | | 40,000 | | | | 348,800 | |
| PDF Solutions, Inc.* | | | 130,000 | | | | 1,283,100 | |
| Photronics, Inc.* | | | 175,000 | | | | 1,067,500 | |
| RF Micro Devices, Inc.* | | | 125,000 | | | | 531,250 | |
| Rudolph Technologies, Inc.* | | | 20,000 | | | | 174,400 | |
| Tessera Technologies, Inc.* | | | 20,000 | | | | 307,400 | |
| TriQuint Semiconductor, Inc.* | | | 200,000 | | | | 1,100,000 | |
| Ultra Clean Holdings* | | | 250,000 | | | | 1,607,500 | |
| | | | | | | | 16,024,950 | |
| | | | | | | | | |
| Software (1.9%) | | | | | | | | |
| AVG Technologies NV* | | | 107,200 | | | | 1,394,672 | |
| | | | | | | | | |
| Specialty Retail (8.0%) | | | | | | | | |
| Aeropostale, Inc.*† | | | 150,000 | | | | 2,674,500 | |
| American Eagle Outfitters, Inc.† | | | 125,000 | | | | 2,466,250 | |
| Guess?, Inc. | | | 30,000 | | | | 911,100 | |
| | | | | | | | 6,051,850 | |
| | | | | | | | | |
| Total Common Stocks | | | | | | | | |
| (Cost $72,714,969) | | | | | | | 68,972,867 | |
See accompanying notes to financial statements.
| Needham Small Cap Growth Fund |
| Schedule of Investments (Continued) |
| June 30, 2012 (Unaudited) |
| | | Shares | | | Fair Value | |
| Short-Term Investment (9.5%) | | | | | | |
| | | | | | | |
| Money Market Fund (9.5%) | | | | | | |
Dreyfus Treasury Prime Cash Management 0.00%(a)
(Cost $7,175,240) | | | 7,175,240 | | | $ | 7,175,240 | |
| | | | | | | | | |
| Total Investments (101.2%) | | | | | | | | |
| (Cost $79,890,209) | | | | | | | 76,148,107 | |
| Total Securities Sold Short (-10.6%) | | | | | | | (7,949,670 | ) |
| (Proceeds $8,091,662) | | | | | | | | |
Other Assets in Excess of Liabilities
(9.4%) | | | | | | | 7,035,563 | |
| Net Assets (100.0%) | | | | | | $ | 75,234,000 | |
| (a) | Rate shown is the seven day yield as of June 30, 2012 and is less than 0.01%. |
| | |
| * | Non-income producing security. |
| | |
| † | Security position is either entirely or partially held in a segregated account as collateral for securities sold short, aggregating a total market value of $13,757,400. |
| | |
The Global Industry Classification Standard (GICS®) was developed by and/or is the exclusive property of MSCI, Inc. and Standard & Poor’s Financial Services LLC (“S&P”). GICS is a service mark of MSCI and S&P and has been licensed for use by U.S. Bancorp Fund Services, LLC. |
See accompanying notes to financial statements.
| Needham Small Cap Growth Fund |
| Schedule of Securities Sold Short |
| June 30, 2012 (Unaudited) |
| | | Shares | | | Fair Value | |
| Securities Sold Short (-6.5%) | | | | | | |
| | | | | | | |
| Airlines (-1.4%) | | | | | | |
| Allegiant Travel Co.* | | | 15,000 | | | $ | 1,045,200 | |
| | | | | | | | | |
| Auto Components (-0.2%) | | | | | | | | |
| Drew Industries, Inc.* | | | 4,000 | | | | 111,400 | |
| | | | | | | | | |
| Communications Equipment (-0.2%) | | | | | | | | |
| Arris Group, Inc.* | | | 10,000 | | | | 139,100 | |
| | | | | | | | | |
| Health Care Providers & Services (-0.5%) | | | | | | | | |
| Bio-Reference Labs, Inc.* | | | 15,000 | | | | 394,200 | |
| | | | | | | | | |
| Internet Software & Services (-1.2%) | | | | | | | | |
| SPS Commerce, Inc.* | | | 30,000 | | | | 911,400 | |
| | | | | | | | | |
| Semiconductors & Semiconductor Equipment (-1.9%) | | | | | | | | |
| Advanced Energy Industries, Inc.* | | | 15,000 | | | | 201,300 | |
| Hittite Microwave Corp.* | | | 15,000 | | | | 766,800 | |
| Microsemi Corp.* | | | 15,000 | | | | 277,350 | |
| STR Holdings, Inc.* | | | 35,000 | | | | 159,600 | |
| | | | | | | | 1,405,050 | |
| | | | | | | | | |
| Software (-1.1%) | | | | | | | | |
| ANSYS, Inc.* | | | 7,500 | | | | 473,325 | |
| Sourcefire, Inc.* | | | 7,500 | | | | 385,500 | |
| | | | | | | | 858,825 | |
| | | | | | | | | |
| Total Securities Sold Short | | | | | | | | |
| (Proceeds $5,002,232) | | | | | | | 4,865,175 | |
| | | | | | | | | |
| Exchange Traded Funds Sold Short (-4.1%) | | | | | | | | |
| iShares Russell 2000 Growth Index Fund | | | 11,000 | | | | 1,006,170 | |
| iShares Russell 2000 Index Fund | | | 11,000 | | | | 876,150 | |
| iShares Russell 2000 Value Index Fund | | | 12,500 | | | | 879,875 | |
| Market Vectors Semiconductor ETF* | | | 10,000 | | | | 322,300 | |
| | | | | | | | | |
| Total Exchange Traded Funds Sold Short | | | | | | | | |
| (Proceeds $3,089,430) | | | | | | | 3,084,495 | |
| | | | | | | | | |
| Total Securities & Exchange Traded Funds Sold Short | | | | | | | | |
| (Proceeds $8,091,662) | | | | | | | 7,949,670 | |
| | | | | | | | | |
| Total Securities & Exchange Traded | | | | | | | | |
| Funds Sold Short (-10.6%) | | | | | | | (7,949,670 | ) |
| Total Investments | | | | | | | | |
| (Cost $79,890,209) (100.1%) | | | | | | | 76,148,107 | |
| Other Assets in Excess of | | | | | | | | |
| Liabilities (10.5%) | | | | | | | 7,035,563 | |
| Net Assets (100.0%) | | | | | | $ | 75,234,000 | |
| * | Non-income producing security. |
The Global Industry Classification Standard (GICS®) was developed by and/or is the exclusive property of MSCI, Inc. and Standard & Poor’s Financial Services LLC (“S&P”). GICS is a service mark of MSCI and S&P and has been licensed for use by U.S. Bancorp Fund Services, LLC.
See accompanying notes to financial statements.
Statements of Assets and Liabilities
June 30, 2012 (Unaudited)
| | | | | | | | | | |
| | | Needham Growth Fund | | | Needham Aggressive Growth Fund | | | Needham Small Cap Growth Fund | |
| Assets | | | | | | | | | |
| Investments, at Value (Cost $87,833,172, $72,411,147, $79,890,209) | | $ | 119,825,386 | | | $ | 79,279,212 | | | $ | 76,148,107 | |
| Receivables: | | | | | | | | | | | | |
| Deposit with Broker for Securities Sold Short | | | 8,309,008 | | | | 5,850,329 | | | | 6,183,494 | |
| Dividends and Interest | | | 41,762 | | | | 150 | | | | 13,750 | |
| Fund Shares Sold | | | 1,528 | | | | 3,059 | | | | 85,602 | |
| Investment Securities Sold | | | 664,680 | | | | 902,333 | | | | 1,381,348 | |
| Prepaid Expenses | | | 26,519 | | | | 27,140 | | | | 32,241 | |
| Total Assets | | | 128,868,883 | | | | 86,062,223 | | | | 83,844,542 | |
| | | | | | | | | | | | | |
| Liabilities | | | | | | | | | | | | |
| Securities Sold Short, at Value (Proceeds $8,850,927, $4,797,156, $8,091,662) | | | 9,258,806 | | | | 4,914,565 | | | | 7,949,670 | |
| Payables: | | | | | | | | | | | | |
| Investment Securities Purchased | | | 266,474 | | | | 1,505,468 | | | | 487,610 | |
| Fund Shares Redeemed | | | 318,397 | | | | 46,930 | | | | 32,073 | |
| Due to Adviser | | | 118,599 | | | | 78,205 | | | | 74,418 | |
| Distribution Fees | | | 23,848 | | | | 15,709 | | | | 14,938 | |
| Administration and Accounting Fees | | | 21,178 | | | | 16,137 | | | | 14,579 | |
| Transfer Agent Fees | | | 10,376 | | | | 12,084 | | | | 12,149 | |
| Accrued Expenses and Other Liabilities | | | 33,028 | | | | 30,668 | | | | 25,105 | |
| Total Liabilities | | | 10,050,706 | | | | 6,619,766 | | | | 8,610,542 | |
| | | | | | | | | | | | | |
| Net Assets | | $ | 118,818,177 | | | $ | 79,442,457 | | | $ | 75,234,000 | |
| Shares Issued and Outstanding $0.001 Par Value (Authorized 800,000,000, 100,000,000 and 100,000,000 respectively) | | | 3,399,644 | | | | 5,036,681 | | | | 6,008,315 | |
Net Asset Value, Offering and Redemption Price Per Share(a) | | $ | 34.95 | | | $ | 15.77 | | | $ | 12.52 | |
| | | | | | | | | | | | | |
| Components of Net Assets | | | | | | | | | | | | |
| Paid-in Capital | | | 82,881,081 | | | | 76,899,774 | | | | 80,677,506 | |
| Accumulated Net Investment Loss | | | (725,918 | ) | | | (741,445 | ) | | | (657,674 | ) |
| Accumulated Net Realized Gain (Loss) from Investments, Securities Sold Short, Foreign Currency Transactions and Currency | | | 5,078,679 | | | | (3,466,528 | ) | | | (1,185,722 | ) |
| Net Unrealized Appreciation (Depreciation) on Investment Securities and Securities Sold Short | | | 31,584,335 | | | | 6,750,656 | | | | (3,600,110 | ) |
| Total Net Assets | | $ | 118,818,177 | | | $ | 79,442,457 | | | $ | 75,234,000 | |
| (a) | Subject to certain exceptions, a 2% redemption fee is imposed upon shares redeemed within 60 days of their purchase. See Note 2 of the notes to financial statements. |
See accompanying notes to financial statements.
Statements of Operations
For the six months ended June 30, 2012 (Unaudited)
| | | | | | | | | | |
| | | Needham Growth Fund | | | Needham Aggressive Growth Fund | | | Needham Small Cap Growth Fund | |
| Investment Income | | | | | | | | | |
| Dividends | | $ | 493,081 | | | $ | 187,076 | | | $ | 174,488 | |
| Interest | | | 2 | | | | — | | | | 2 | |
| Less: Foreign Taxes Withheld | | | — | | | | (2,090 | ) | | | (2,194 | ) |
| Total Investment Income | | | 493,083 | | | | 184,986 | | | | 172,296 | |
| | | | | | | | | | | | | |
| Expenses | | | | | | | | | | | | |
| Investment Advisory Fees | | | 803,963 | | | | 567,598 | | | | 521,517 | |
| Distribution Fees | | | 160,793 | | | | 113,520 | | | | 104,304 | |
| Administration and Accounting Fees | | | 64,402 | | | | 42,211 | | | | 42,390 | |
| Audit Fees | | | 16,578 | | | | 5,452 | | | | 5,909 | |
| Chief Compliance Officer Fees | | | 7,932 | | | | 5,651 | | | | 5,168 | |
| Custodian Fees | | | 4,191 | | | | 4,483 | | | | 3,949 | |
| Directors’ Fees | | | 11,763 | | | | 8,331 | | | | 7,600 | |
Dividend Expense(1) | | | 20,765 | | | | 12,350 | | | | 24,771 | |
| Filing Fees | | | 11,384 | | | | 14,886 | | | | 13,178 | |
Interest Expense(1) | | | 32,791 | | | | 71,275 | | | | 20,698 | |
| Legal Fees | | | 21,741 | | | | 17,332 | | | | 14,332 | |
| Printing Fees | | | 10,180 | | | | 9,443 | | | | 11,112 | |
| Transfer Agent Fees | | | 31,304 | | | | 36,716 | | | | 37,482 | |
| Other Expenses | | | 21,214 | | | | 17,183 | | | | 17,560 | |
| Total Expenses | | | 1,219,001 | | | | 926,431 | | | | 829,970 | |
| | | | | | | | | | | | | |
| Net Investment Loss | | | (725,918 | ) | | | (741,445 | ) | | | (657,674 | ) |
| | | | | | | | | | | | | |
| Net Realized/Unrealized Gain (Loss) from Investments, Securities Sold Short, | | | | | | | | | | | | |
| Foreign Currency Transactions and Currency | | | | | | | | | | | | |
| Net Realized Gain (Loss) from Investments | | | 3,147,740 | | | | (3,333,971 | ) | | | 821,318 | |
| Net Realized Loss from Securities Sold Short | | | (125,891 | ) | | | (97,313 | ) | | | (128,927 | ) |
| Net Realized Loss from Foreign Currency Transactions | | | — | | | | (50 | ) | | | — | |
| Net Realized Gain from Currency | | | — | | | | 20 | | | | — | |
| Change in Unrealized Depreciation on Investments and Securities Sold Short | | | 6,670,789 | | | | 12,242,104 | | | | 9,116,302 | |
| Net Realized/Unrealized Gain from Investments, Securities Sold Short, Foreign Currency Transactions and Currency | | | 9,692,638 | | | | 8,810,790 | | | | 9,808,693 | |
| Change in Net Assets Resulting from Operations | | $ | 8,966,720 | | | $ | 8,069,345 | | | $ | 9,151,019 | |
| (1) | Expense related to securities sold short. |
See accompanying notes to financial statements.
Statements of Changes in Net Assets
| | | | | | | | | | | | | | | | | | | |
| | | Needham Growth Fund | | | Needham Aggressive Growth Fund | | | Needham Small Cap Growth Fund | |
| | | Six months ended June 30, 2012 | | | Year Ended December 31, 2011 | | | Six months ended June 30, 2012 | | | Year Ended December 31, 2011 | | | Six months ended June 30, 2012 | | | Year Ended December 31, 2011 | |
| | | (Unaudited) | | | | | | (Unaudited) | | | | | | (Unaudited) | | | | |
| Change in Net Assets | | | | | | | | | �� | | | | | | | | | |
| Operations: | | | | | | | | | | | | | | | | | | |
| Net Investment Loss | | $ | (725,918 | ) | | $ | (2,224,789 | ) | | $ | (741,445 | ) | | $ | (2,115,245 | ) | | $ | (657,674 | ) | | $ | (1,992,147 | ) |
| Net Realized Gain (Loss) from Investments, Securities Sold Short, Foreign Currency Transactions, and Currency | | | 3,021,849 | | | | 4,607,364 | | | | (3,431,314 | ) | | | 3,402,036 | | | | 692,391 | | | | 2,008,962 | |
| | | | | | | | | | | | | | | | | | | | | | | | | |
| Change in Unrealized Appreciation/Depreciation on Investments and Securities Sold Short | | | 6,670,789 | | | | (21,938,332 | ) | | | 12,242,104 | | | | (25,075,813 | ) | | | 9,116,302 | | | | (25,763,708 | ) |
| Change in Net Assets Resulting from Operations | | | 8,966,720 | | | | (19,555,757 | ) | | | 8,069,345 | | | | (23,789,022 | ) | | | 9,151,019 | | | | (25,746,893 | ) |
| | | | | | | | | | | | | | | | | | | | | | | | | |
| Distributions to Shareholders from: | | | | | | | | | | | | | | | | | | | | | | | | |
| Capital Gains | | | — | | | | (7,330,132 | ) | | | — | | | | (1,568,190 | ) | | | — | | | | (4,537,435 | ) |
| Return of Capital | | | — | | | | — | | | | — | | | | — | | | | — | | | | (135,521 | ) |
| Total Distributions to Shareholders | | | — | | | | (7,330,132 | ) | | | — | | | | (1,568,190 | ) | | | — | | | | (4,672,956 | ) |
| | | | | | | | | | | | | | | | | | | | | | | | | |
| Capital Transactions: | | | | | | | | | | | | | | | | | | | | | | | | |
| Shares Issued | | | 3,739,084 | | | | 51,065,814 | | | | 5,860,856 | | | | 110,323,772 | | | | 8,709,484 | | | | 106,098,656 | |
| Shares Issued in Reinvestment of Distribution | | | — | | | | 7,104,581 | | | | — | | | | 1,550,038 | | | | — | | | | 4,495,940 | |
| Shares Redeemed | | | (19,855,297 | ) | | | (65,153,889 | ) | | | (24,669,905 | ) | | | (102,972,789 | ) | | | (25,320,236 | ) | | | (96,483,443 | ) |
| Redemption Fees | | | 1,683 | | | | 29,934 | | | | 12,303 | | | | 74,691 | | | | 19,002 | | | | 72,766 | |
| Change in Net Assets from Capital Transactions | | | (16,114,530 | ) | | | (6,953,560 | ) | | | (18,796,746 | ) | | | 8,975,712 | | | | (16,591,750 | ) | | | 14,183,919 | |
| | | | | | | | | | | | | | | | | | | | | | | | | |
| Change in Net Assets | | | (7,147,810 | ) | | | (33,839,449 | ) | | | (10,727,401 | ) | | | (16,381,500 | ) | | | (7,440,731 | ) | | | (16,235,930 | ) |
| | | | | | | | | | | | | | | | | | | | | | | | | |
| Net Assets | | | | | | | | | | | | | | | | | | | | | | | | |
| Beginning of Period | | | 125,965,987 | | | | 159,805,436 | | | | 90,169,858 | | | | 106,551,358 | | | | 82,674,731 | | | | 98,910,661 | |
| End of Period | | $ | 118,818,177 | | | $ | 125,965,987 | | | $ | 79,442,457 | | | $ | 90,169,858 | | | $ | 75,234,000 | | | $ | 82,674,731 | |
| Accumulated Net Investment Loss | | $ | (725,918 | ) | | $ | — | | | $ | (741,445 | ) | | $ | — | | | $ | (657,674 | ) | | $ | — | |
| | | | | | | | | | | | | | | | | | | | | | | | | |
| Share Transaction: | | | | | | | | | | | | | | | | | | | | | | | | |
| Number of Shares Issued | | | 103,233 | | | | 1,281,150 | | | | 356,880 | | | | 6,348,443 | | | | 679,798 | | | | 7,443,556 | |
| Number of Shares Reinvested | | | — | | | | 225,685 | | | | — | | | | 113,806 | | | | — | | | | 416,677 | |
| Number of Shares Redeemed | | | (546,865 | ) | | | (1,749,928 | ) | | | (1,531,489 | ) | | | (6,468,840 | ) | | | (2,010,632 | ) | | | (7,481,888 | ) |
| Change in Shares | | | (443,632 | ) | | | (243,093 | ) | | | (1,174,609 | ) | | | (6,591 | ) | | | (1,330,834 | ) | | | 378,345 | |
See accompanying notes to financial statements.
Needham Growth Fund
Financial Highlights
| | | Six Months | | | | | | | | | | | | | | | | |
| (For a Share Outstanding | | | | | Year Ended December 31, | |
| Throughout each Period) | | (Unaudited) | | | 2011 | | | 2010 | | | 2009 | | | 2008 | | | 2007 | |
| Net Asset Value, Beginning of Period | | $ | 32.78 | | | $ | 39.11 | | | $ | 29.77 | | | $ | 20.27 | | | $ | 36.05 | | | $ | 39.01 | |
| Investment Operations | | | | | | | | | | | | | | | | | | | | | | | | |
| Net Investment Loss | | | (0.21 | ) | | | (0.58 | ) | | | (0.60 | ) | | | (0.43 | ) | | | (0.45 | ) | | | (0.25 | ) |
Net Realized and Unrealized Gain (Loss) on Investments | | | 2.38 | | | | (3.79 | ) | | | 9.94 | | | | 9.93 | | | | (14.10 | ) | | | 1.45 | |
| Total from Investment Operations | | | 2.17 | | | | (4.37 | ) | | | 9.34 | | | | 9.50 | | | | (14.55 | ) | | | 1.20 | |
| | | | | | | | | | | | | | | | | | | | | | | | | |
| Less Distributions | | | | | | | | | | | | | | | | | | | | | | | | |
| Net Investment Income | | | — | | | | — | | | | — | | | | — | | | | — | | | | (0.01 | ) |
| Net Realized Gains | | | — | | | | (1.97 | ) | | | — | | | | — | | | | (1.23 | ) | | | (4.15 | ) |
| Total Distributions | | | — | | | | (1.97 | ) | | | — | | | | — | | | | (1.23 | ) | | | (4.16 | ) |
| | | | | | | | | | | | | | | | | | | | | | | | | |
| Capital Contributions | | | | | | | | | | | | | | | | | | | | | | | | |
| Redemption Fees | | | — | (a) | | | 0.01 | | | | — | (a) | | | — | (a) | | | — | | | | — | |
| Total Capital Contributions | | | — | (a) | | | 0.01 | | | | — | (a) | | | — | (a) | | | — | | | | — | |
| Net Asset Value, End of Period | | $ | 34.95 | | | $ | 32.78 | | | $ | 39.11 | | | $ | 29.77 | | | $ | 20.27 | | | $ | 36.05 | |
| | | | | | | | | | | | | | | | | | | | | | | | | |
| Total Return | | | 6.62 | % | | | (10.94 | )% | | | 31.37 | % | | | 46.87 | % | | | (40.41 | )% | | | 3.09 | % |
| Net Assets, End of Period (000’s) | | $ | 118,818 | | | $ | 125,966 | | | $ | 159,805 | | | $ | 119,175 | | | $ | 92,818 | | | $ | 209,397 | |
| Ratios/Supplemental Data | | | | | | | | | | | | | | | | | | | | | | | | |
Ratio of Total Expenses to Average Net Assets | | | 1.90 | %(b) | | | 1.81 | % | | | 2.11 | % | | | 2.03 | % | | | 2.04 | % | | | 1.86 | % |
Ratio of Total Expenses to Average Net Assets (before interest and dividend expense) | | | 1.81 | %(b) | | | 1.78 | % | | | 2.00 | % | | | 2.00 | % | | | 2.03 | % | | | 1.85 | % |
Ratio of Total Expenses to Average Net Assets (before waiver and reimbursement of expenses) | | | 1.90 | %(b) | | | 1.81 | % | | | 2.11 | % | | | 2.08 | % | | | 2.04 | % | | | 1.86 | % |
Ratio of Total Investment Loss to Average Net Assets | | | (1.13 | %)(b) | | | (1.41 | %) | | | (1.85 | %) | | | (1.71 | %) | | | (1.37 | %) | | | (0.61 | %) |
Ratio of Total Investment Loss to Average Net Assets (before waivers and reimbursements of expenses) | | | (1.13 | %)(b) | | | (1.41 | %) | | | (1.85 | %) | | | (1.76 | %) | | | (1.37 | %) | | | (0.61 | %) |
| Portfolio turnover rate | | | 12 | %(c) | | | 29 | % | | | 62 | % | | | 29 | % | | | 41 | % | | | 41 | % |
(a) Value is less than $0.005 per share.
(b) Annualized for periods less than one year.
(c) Not annualized for periods less than one year.
See accompanying notes to financial statements.
Needham Aggressive Growth Fund
Financial Highlights
| | | Six Months | | | | | | | | | | | | | | | | |
| (For a Share Outstanding | | | | Year Ended December 31, | |
| Throughout each Period) | | (Unaudited) | | | 2011 | | | 2010 | | | 2009 | | | 2008 | | | 2007 | |
| Net Asset Value, Beginning of Period | | $ | 14.52 | | | $ | 17.14 | | | $ | 12.38 | | | $ | 9.45 | | | $ | 14.14 | | | $ | 13.96 | |
| Investment Operations | | | | | | | | | | | | | | | | | | | | | | | | |
| Net Investment Loss | | | (0.15 | ) | | | (0.34 | ) | | | (0.11 | ) | | | (0.19 | ) | | | (0.26 | ) | | | (0.16 | ) |
Net Realized and Unrealized Gain (Loss) on Investments | | | 1.40 | | | | (2.04 | ) | | | 4.98 | | | | 3.13 | | | | (3.65 | ) | | | 2.34 | |
| Total from Investment Operations | | | 1.25 | | | | (2.38 | ) | | | 4.87 | | | | 2.94 | | | | (3.91 | ) | | | 2.18 | |
| | | | | | | | | | | | | | | | | | | | | | | | | |
| Less Distributions | | | | | | | | | | | | | | | | | | | | | | | | |
| Net Realized Gains | | | — | | | | (0.25 | ) | | | (0.11 | ) | | | (0.02 | ) | | | (0.78 | ) | | | (2.00 | ) |
| Total Distributions | | | — | | | | (0.25 | ) | | | (0.11 | ) | | | (0.02 | ) | | | (0.78 | ) | | | (2.00 | ) |
| | | | | | | | | | | | | | | | | | | | | | | | | |
| Capital Contributions | | | | | | | | | | | | | | | | | | | | | | | | |
| Redemption Fees | | | — | (a) | | | 0.01 | | | | — | (a) | | | 0.01 | | | | — | | | | — | |
| Total Capital Contributions | | | — | (a) | | | 0.01 | | | | — | (a) | | | 0.01 | | | | — | | | | — | |
| Net Asset Value, End of Period | | $ | 15.77 | | | $ | 14.52 | | | $ | 17.14 | | | $ | 12.38 | | | $ | 9.45 | | | $ | 14.14 | |
| | | | | | | | | | | | | | | | | | | | | | | | | |
| Total Return | | | 8.61 | % | | | (13.77 | )% | | | 39.42 | % | | | 31.18 | % | | | (27.60 | )% | | | 15.58 | % |
| Net Assets, End of Period (000’s) | | $ | 79,442 | | | $ | 90,170 | | | $ | 106,551 | | | $ | 22,819 | | | $ | 10,202 | | | $ | 20,518 | |
| Ratios/Supplemental Data | | | | | | | | | | | | | | | | | | | | | | | | |
Ratio of Total Expenses to Average Total Assets | | | 2.04 | %(b) | | | 1.83 | % | | | 2.09 | % | | | 2.50 | % | | | 2.51 | % | | | 2.18 | % |
Ratio of Total Expenses to Average Total Assets (before interest and dividend expense) | | | 1.86 | %(b) | | | 1.80 | % | | | 2.05 | % | | | 2.49 | % | | | 2.50 | % | | | 2.18 | % |
Ratio of Total Expenses to Average Total Assets (before waiver and reimbursement of expenses) | | | 2.04 | %(b) | | | 1.83 | % | | | 2.09 | % | | | 2.50 | % | | | 2.63 | % | | | 2.18 | % |
Ratio of Total Investment Loss to Average Total Assets | | | (1.63 | %)(b) | | | (1.62 | %) | | | (1.77 | %) | | | (2.39 | %) | | | (2.04 | %) | | | (1.18 | %) |
Ratio of Total Investment Loss to Average Total Assets (before waiver and reimbursement of expenses) | | | (1.63 | %)(b) | | | (1.62 | %) | | | (1.77 | %) | | | (2.39 | %) | | | (2.15 | %) | | | (1.18 | %) |
| Portfolio turnover rate | | | 8 | %(c) | | | 45 | % | | | 55 | % | | | 70 | % | | | 45 | % | | | 64 | % |
(a) Value is less than $0.005 per share.
(b) Annualized for periods less than one year.
(c) Not annualized for periods less than one year.
See accompanying notes to financial statements.
Needham Small Cap Growth Fund
Financial Highlights
| | | Six Months | | | | | | | | | | | | | | | | |
| (For a Share Outstanding | | | | Year Ended December 31, | |
| Throughout each Period) | | (Unaudited) | | | 2011 | | | 2010 | | | 2009 | | | 2008 | | | 2007 | |
| Net Asset Value, Beginning of Period | | $ | 11.26 | | | $ | 14.21 | | | $ | 10.73 | | | $ | 7.61 | | | $ | 11.29 | | | $ | 14.32 | |
| Investment Operations | | | | | | | | | | | | | | | | | | | | | | | | |
| Net Investment Loss | | | (0.11 | ) | | | (0.27 | ) | | | (0.08 | ) | | | (0.20 | ) | | | (0.19 | ) | | | (0.26 | ) |
Net Realized and Unrealized Gain (Loss) on Investments | | | 1.37 | | | | (2.04 | ) | | | 3.99 | | | | 3.33 | | | | (2.49 | ) | | | (0.02 | ) |
| Total from Investment Operations | | | 1.26 | | | | (2.31 | ) | | | 3.91 | | | | 3.13 | | | | (2.68 | ) | | | (0.28 | ) |
| | | | | | | | | | | | | | | | | | | | | | | | | |
| Less Distributions | | | | | | | | | | | | | | | | | | | | | | | | |
| Net Realized Gains | | | — | | | | (0.62 | ) | | | (0.43 | ) | | | (0.01 | ) | | | (0.82 | ) | | | (2.75 | ) |
| Return of Capital | | | — | | | | (0.02 | ) | | | — | | | | — | | | | (0.18 | ) | | | — | |
| Total Distributions | | | — | | | | (0.64 | ) | | | (0.43 | ) | | | (0.01 | ) | | | (1.00 | ) | | | (2.75 | ) |
| | | | | | | | | | | | | | | | | | | | | | | | | |
| Capital Contributions | | | | | | | | | | | | | | | | | | | | | | | | |
| Redemption Fees | | | — | (a) | | | — | (a) | | | — | (a) | | | — | (a) | | | — | | | | — | |
| Total Capital Contributions | | | — | (a) | | | — | (a) | | | — | (a) | | | — | (a) | | | — | | | | — | |
| Net Asset Value, End of Period | | $ | 12.52 | | | $ | 11.26 | | | $ | 14.21 | | | $ | 10.73 | | | $ | 7.61 | | | $ | 11.29 | |
| | | | | | | | | | | | | | | | | | | | | | | | | |
| Total Return | | | 11.19 | % | | | (16.10 | )% | | | 36.89 | % | | | 41.18 | % | | | (23.42 | )% | | | (2.01 | )% |
| Net Assets, End of Period (000’s) | | $ | 75,234 | | | $ | 82,675 | | | $ | 98,911 | | | $ | 11,303 | | | $ | 5,309 | | | $ | 7,726 | |
| Ratios/Supplemental Data | | | | | | | | | | | | | | | | | | | | | | | | |
Ratio of Total Expenses to Average Total Assets | | | 1.99 | %(b) | | | 1.84 | % | | | 2.16 | % | | | 2.57 | % | | | 2.51 | % | | | 2.50 | % |
Ratio of Total Expenses to Average Total Assets (before interest and dividend expense) | | | 1.88 | %(b) | | | 1.81 | % | | | 2.08 | % | | | 2.50 | % | | | 2.50 | % | | | 2.50 | % |
Ratio of Total Expenses to Average Total Assets (before waiver and reimbursement of expenses) | | | 1.99 | %(b) | | | 1.84 | % | | | 2.16 | % | | | 3.02 | % | | | 3.57 | % | | | 2.64 | % |
Ratio of Total Investment Loss to Average Total Assets | | | (1.58 | %)(b) | | | (1.57 | %) | | | (1.88 | %) | | | (2.50 | %) | | | (2.02 | %) | | | (1.54 | %) |
Ratio of Total Investment Loss to Average Total Assets (before waivers and reimbursements of expenses) | | | (1.58 | %)(b) | | | (1.57 | %) | | | (1.88 | %) | | | (2.95 | %) | | | (3.09 | %) | | | (1.68 | %) |
| Portfolio turnover rate | | | 45 | %(c) | | | 105 | % | | | 65 | % | | | 154 | % | | | 219 | % | | | 38 | % |
(a) Value is less than $0.005 per share.
(b) Annualized for periods less than one year.
(c) Not annualized for periods less than one year.
See accompanying notes to financial statements.
Notes to Financial Statements (Unaudited)
Needham Growth Fund (“NGF”), Needham Aggressive Growth Fund (“NAGF”) and Needham Small Cap Growth Fund (“NSCGF”) (each, a “Portfolio” and collectively, the “Portfolios”), are portfolios of The Needham Funds, Inc. (the “Company”), which is registered under the Investment Company Act of 1940, as amended (the “1940 Act”) as a non-diversified, open-end management investment company. The Company was organized as a Maryland corporation on October 12, 1995.
| | |
| 2. | Significant Accounting Policies |
The following is a summary of significant accounting policies followed by the Company in the preparation of its financial statements. These policies are in conformity with accounting principles generally accepted in the United States of America (“GAAP”).
Security Valuation: Portfolio securities for which market quotations are readily available are stated at the last sale price reported by the principal exchange for the security as of the exchange’s close of business. Securities for which no sale has taken place during the day and securities which are not listed on an exchange are valued at the mean of the highest closing bid and lowest asked prices. New York Stock Exchange traded options are valued at the last reported sale price on any exchange on which the option is principally traded. If no sales are reported on a particular day, the options will be valued at the mean between the highest closing bid and lowest asked prices across the exchanges where the option is traded. Non-exchange traded options will also be valued at the mean between the last bid and asked quotations. For options where market quotations are not readily available, value will be determined in accordance with the fair value procedures described below. All other securities and assets for which (a) market quotations are not readily available, such as in the case of a market or technical disruption that prevents the normal trading of a security held by a Portfolio, (b) market quotations are believed to be unrepresentative of fair market value, such as in the case of a thinly traded security, or (c) valuation is normally made at the last sale price on a foreign exchange and a significant event occurs after the close of that exchange but before the New York Stock Exchange close, are valued at their fair value as determined in good faith by the Board of Directors (the “Board”) in accordance with Fair Value Procedures established by the Board. The Company’s Fair Value Procedures are implemented and monitored by a Fair Value Committee (the “Committee”) designated by the Board. When a security is valued in accordance with the Fair Value Procedures, the Committee determines a value after taking into consideration any relevant information that is reasonably available to the Committee. Some of the more common reasons that may necessitate that a security be valued pursuant to these Fair Value Procedures include, but are not limited to: the security’s trading has been halted or suspended; the security has been de-listed from a national exchange; the security’s primary trading market is temporarily closed at a time when under normal conditions it would be open; or the security’s primary pricing source is not able or willing to provide a price. The assets of each Portfolio may also be valued on the basis of valuations provided by a pricing service approved by, or on behalf of, the Board.
The Portfolios did not value any securities in accordance with the Fair Value Procedures as of June 30, 2012.
Investment Transactions: Changes in holdings of portfolio securities for the Portfolios shall be reflected no later than in the first calculation on the first business day following the trade date for purposes of calculating each Portfolio’s daily net asset value per share. However, for financial reporting purposes, portfolio security transactions are reported on the trade date of the last business day of the reporting period. The cost (proceeds) of investments sold (bought to cover) is determined on a specific identification basis for the purpose of determining gains or losses on sales and buys to cover short positions. Dividend income, distributions to shareholders and dividend expense from securities sold short are recorded on the ex-dividend date. Interest income and interest expense from securities sold short is recorded on an accrual basis.
Foreign Currency: Foreign currency amounts are translated into U.S. dollars as follows: (i) assets and liabilities at the rate of exchange at the end of the respective period; and (ii) purchases and sales of securities and income and expenses at the rate of exchange prevailing on the dates of such transactions. The portion of realized gains arising from changes in the exchange rates are included with the net realized and unrealized gain or loss on investments. Principal risks associated with such transactions include the movement in value of the foreign currency relative to the U.S. dollar and the ability of the counterparty to perform.
The Portfolios may also invest in forward currency contracts. Fluctuations in the value of such forward currency transactions are recorded daily as unrealized gain or loss; realized gain or loss includes net gain or loss on transactions that have terminated by settlement. These instruments involve market risk, credit risk, or both kinds of risks, in excess of the amount recognized in the statements of assets and liabilities. Risks arise from the possible inability of counterparties to meet the terms of their contracts and from movement in currency and securities values and interest rates. The Portfolios did not enter into forward currency contracts during the six months ended June 30, 2012.
Allocation of Expenses: Expenses directly attributable to a Portfolio are charged directly to that Portfolio, while expenses which are attributable to more than one Portfolio are allocated among the respective Portfolios based upon relative net assets or some other reasonable method.
Notes to Financial Statements (Unaudited) (Continued)
Use of Estimates: The preparation of financial statements in accordance with GAAP requires management to make estimates and assumptions that affect the reported amounts and disclosures in the financial statements. Actual results could differ from those estimates and those differences could be material.
Distributions to Shareholders: Dividends from net investment income, if any, are declared and paid annually for the Portfolios. Distributable net realized gains, if any, are declared and distributed at least annually.
Redemption Fees: The Portfolios reserve the right to assess a redemption fee for shares held 60 days or less. The shareholder will be charged a fee equal to 2.00% of the value of the shares redeemed. The redemption fee is intended to offset excess brokerage commissions and other costs associated with fluctuations in asset levels and cash flows caused by frequent trading by shareholders. The applicability of the redemption fee will be calculated using a first-in first-out method, which means the oldest shares will be redeemed first, followed by the redemption of more recently acquired shares. For the six months ended June 30, 2012, NGF, NAGF and NSCGF had contributions to capital due to redemption fees in the amounts of $1,683, $12,303 and $19,002, respectively.
Federal Income Taxes: It is the policy of each Portfolio to continue to qualify as a regulated investment company, as defined in the Internal Revenue Code, by complying with the provisions available to certain investment companies and to make distributions of net investment income and net realized capital gains sufficient to relieve it from all, or substantially all, federal income taxes. Accordingly, no provision for income taxes has been made in the Portfolios’ financial statements.
As of June 30, 2012, the Portfolios did not have any tax positions that did not meet the “more-likely-than-not” threshold of being sustained by the applicable tax authority. Generally, tax authorities can examine all the tax returns filed for the last three years.
Fair Value Measurements: Valuation inputs used to determine the value of the Portfolios’ investments are summarized in the three broad levels listed below:
| | | |
| | Level 1 — | quoted prices in active markets for identical assets. |
| | | |
| | Level 2 — | other significant inputs (including quoted prices of similar securities, interest rates, prepayment speeds, credit risk, etc.). |
| | | |
| | Level 3 — | significant unobservable inputs (which may include the Portfolios’ own assumptions in determining the fair value of investments). |
The inputs or methodology used to value securities are not necessarily an indication of the risk associated with investing in those securities.
Portfolio securities listed or traded on securities exchanges, including American Depositary Receipts (“ADRs”), are valued at the closing price on the exchange or system where the security is principally traded or at the NASDAQ Official Closing Price. If there have been no sales for that day on the exchange or system, a security is valued at the mean of the highest closing bid and lowest asked prices on the exchange or system where the security is principally traded. These valuations are typically categorized as Level 1 in the fair value hierarchy.
In accordance with procedures adopted by the Board, fair value pricing may be used if events materially affecting the value of foreign securities occur between the time the exchange on which they are traded closes and the time the Portfolios’ net asset values are calculated. These valuations are categorized as Level 2 in the fair value hierarchy.
The following is a summary categorization, as of June 30, 2012, of each Portfolio’s investments based on the level of inputs utilized in determining the value of such investments:
| | | | | | | | | | |
| | | LEVEL 1 - Quoted Prices(1)(3) | |
| | | NGF | | | NAGF | | | NSCGF | |
| Assets | | | | | | | | | |
Common Stocks(2) | | $ | 113,960,161 | | | $ | 77,611,508 | | | $ | 68,972,867 | |
| Short-Term Investments | | | 5,865,225 | | | | 1,667,704 | | | | 7,175,240 | |
| Liabilities | | | | | | | | | | | | |
Securities Sold Short(2) | | | (9,258,806 | ) | | | (4,914,565 | ) | | | (7,949,670 | ) |
| Total | | $ | 110,566,580 | | | $ | 74,364,647 | | | $ | 68,198,437 | |
| (1) | As of June 30, 2012, the Portfolios did not hold Level 2 or Level 3 investments. |
| | |
| (2) | Please refer to the Schedule of Investments to view segregation by industry. |
| | |
| (3) | There were no transfers into or out of Level 1 or Level 2 during the period. |
| 3. | Derivative Instruments and Hedging Activities |
The “Derivatives and Hedging” Topic of the Codification (ASC 815, formerly SFAS 133 and SFAS 161) requires enhanced disclosures about the Portfolios’ derivative and hedging activities, including how such activities are accounted for and their effect on the Portfolios’ financial position, performance and cash flows. The Portfolios did not use derivatives during the six months ended June 30, 2012.
| 4. | Investment Advisory and Administrative Services |
The Company has engaged Needham Investment Management L.L.C. (the “Adviser”) to manage its investments. The Company pays the Adviser a fee at the annual rate of 1.25% of the average daily net assets of each Portfolio.
Notes to Financial Statements (Unaudited) (Continued)
The Adviser has entered into agreements with the Portfolios whereby the Adviser has contractually agreed to waive its fee for, and to reimburse expenses (excluding interest, dividends on short positions, acquired fund fees and expenses and extraordinary items) of NGF, NAGF and NSCGF in an amount that limits annual operating expenses to not more than 1.95% of the average daily net assets. The agreement is effective for the period from May 1, 2012 through May 1, 2013. The agreement shall continue in effect from year to year thereafter only upon mutual agreement of the respective Portfolio and the Adviser.
The Company and U.S. Bancorp Fund Services, LLC (the “Administrator”) are parties to a Fund Administration Servicing Agreement. The Administrator provides administrative and fund accounting services pursuant to this agreement and, in consideration of these services, receives a fee computed daily and paid monthly at an annual rate based on a percentage of the value of the Company’s assets. The Administrator is also compensated for any out of pocket expenses that are reasonably incurred by the Administrator in carrying out its duties under the Administration Agreement. The Administrator also provides transfer agent services pursuant to a Transfer Agent Servicing Agreement for additional fees.
Certain officers of the Company are also officers of the Adviser and/or Needham & Company, LLC (the “Distributor”). Such officers receive no fees from the Company for serving as officers of the Company. Each of the three Independent Directors receives a quarterly retainer of $3,000 and a per-meeting fee of $500. Each Independent Director is also a member of the Board’s Audit Committee and receives a fee of $500 per meeting attended. The Adviser provides an employee to serve as Chief Compliance Officer for the Company and to provide certain related services. An affiliate of the Adviser, Needham & Company, LLC, pays the Chief Compliance Officer’s compensation and the Company reimburses this affiliate for the Company’s portion of the expense.
The Company has adopted an Amended and Restated Plan of Distribution pursuant to Rule 12b-1 under the 1940 Act. Under the Plan, each Portfolio pays the Distributor and any other distributor or financial institution with which the Company has an agreement with respect to each Portfolio, a fee at an annual rate of 0.25% of each Portfolio’s daily average net assets. For the six months ended June 30, 2012, NGF, NAGF and NSCGF paid 12b-1 fees to the Distributor in the amount of $160,793, $113,520, and $104,304, respectively.
During the six months ended June 30, 2012, NGF, NAGF and NSCGF incurred and paid brokerage commissions to the Distributor in the amount of $14,378, $14,059 and $40,462, respectively.
Each Portfolio may borrow from banks up to 25% of its total assets and may pledge its assets in connection with these borrowings, provided that no additional investments shall be made while borrowings exceed 5% of total assets.
The Portfolios did not engage in any temporary borrowings during the six months ended June 30, 2012.
| | |
| 7. | Short Sale Transactions |
During the six months ended June 30, 2012, each Portfolio sold securities short. Upon selling a security short, the Portfolios record a receivable for the settlement amount and a corresponding liability, which is marked-to-market to reflect current value. Certain securities owned by each respective Portfolio are segregated as collateral while the short sales are outstanding. At June 30, 2012, the market value of securities separately segregated to cover short positions was $5,298,050, $6,753,960, and $13,757,400 for NGF, NAGF and NSCGF, respectively.
Additionally, the Portfolios had receivables for Deposit with Broker for Securities Sold Short of $8,309,008, $5,850,329, and $6,183,494 pledged as collateral with brokers in connection with open short positions for NGF, NAGF and NSCGF, respectively. Securities sold short at June 30, 2012 and their related market values and proceeds are set forth in the preceding Schedule of Securities Sold Short for each Portfolio.
| | |
| 8. | Investment Transactions |
The following summarizes the aggregate amount of the cost of purchases and proceeds from sales of investment securities and securities sold short, excluding short-term securities, during the six months ended June 30, 2012:
| | | | | | | |
| | Purchases | | Sales | |
| NGF | | $ | 20,138,455 | | | $ | 29,810,878 | |
| NAGF | | | 11,680,391 | | | | 32,891,687 | |
| NSCGF | | | 39,257,690 | | | | 59,966,307 | |
| 9. | Financial Instruments With Off-Balance Sheet Risk |
In the normal course of their business, the Portfolios may trade various financial instruments with off-balance sheet risk. These financial instruments include securities sold short, written options, futures, and forward currency contracts. Generally, these financial instruments represent future commitments to purchase or sell other financial instruments at specific terms at specified future dates. Each of these financial instruments contains varying degrees of off-balance sheet risk whereby changes in the market values of the securities underlying the financial instruments may be in excess of the amounts recognized in the financial statements.
Notes to Financial Statements (Unaudited) (Continued)
Securities sold short represent obligations of the Portfolios to make future delivery of specific securities and, correspondingly, create an obligation to purchase the securities at market prices prevailing at a later delivery date (or to deliver the securities if already owned by the Portfolios). As a result, short sales create the risk that the Portfolios’ ultimate obligation to satisfy the delivery requirements may exceed the amount of the proceeds initially received on the liability recorded in the financial statements.
Under the Company’s organizational documents, its directors and officers are indemnified against certain liabilities arising out of the performance of their duties to the Company. In addition, in the ordinary course of business, the Company enters into contracts that contain a variety of indemnifications. The Company’s maximum exposure under these arrangements is unknown. However, the Company has not had prior claims or losses pursuant to these contracts and expects the risk of loss to be remote.
No provision for federal income taxes is required since the Company intends to continue to qualify as a regulated investment company under Subchapter M of the Internal Revenue Code and distribute substantially all of its taxable income and capital gains to shareholders. Because income tax regulations differ from GAAP, the timing and character of income and capital gain distributions determined in accordance with tax regulations can differ from income and capital gains recognized for financial reporting purposes. Accordingly, the character of distributions and the composition of net assets for tax purposes can differ from those reflected in the financial statements. These book/tax differences may be temporary or permanent in nature. Temporary differences are generally due to differing book and tax treatment for the timing of the recognition of gains and losses on securities, including post-October losses (as described below). Permanent differences are generally due to differing treatment of net investment losses. To the extent these differences are permanent, they are charged or credited to paid-in capital, accumulated net realized gain (loss), or accumulated net investment income (loss), as appropriate, in the period in which the differences arise. These reclassifications have no effect on net assets or net asset value per share of each Portfolio.
As of December 31, 2011, the cost, gross unrealized appreciation, gross unrealized depreciation, and the net unrealized appreciation (depreciation) on securities, including proceeds from securities sold short for federal income tax purposes, were as follows:
| | | | | | | | | | | | | |
| | Cost | | Gross Unrealized Appreciation | | Gross Unrealized Depreciation | | Net Unrealized Appreciation (depreciation) | |
| NGF | | $ | 101,119,541 | | | $ | 35,557,883 | | | $ | (10,369,611 | ) | | $ | 25,188,272 | |
| NAGF | | | 95,501,083 | | | | 14,968,647 | | | | (20,287,712 | ) | | | (5,319,065 | ) |
| NSCGF | | | 95,970,899 | | | | 6,285,931 | | | | (19,109,629 | ) | | | (12,823,698 | ) |
The difference between the tax cost of investments and the cost of investments for GAAP purposes is primarily due to the tax treatment for wash sale losses.
As of December 31, 2011, the components of distributable earnings (loss) on a tax basis were as follows:
| | | | | | | | | | |
| | | NGF | | | NAGF | | | NSCGF | |
| Undistributed ordinary income | | $ | — | | | $ | — | | | $ | — | |
| Undistributed long-term capital gains | | | 3,328,227 | | | | 42,591 | | | | — | |
| Unrealized appreciation (depreciation) | | | 25,188,272 | | | | (5,319,065 | ) | | | (12,823,698 | ) |
| Total accumulated earnings (loss) | | $ | 28,516,499 | | | $ | (5,276,474 | ) | | $ | (12,823,698 | ) |
The tax character of distributions paid during the year ended December 31, 2011 was as follows:
| | | | | | | | | | |
| | | NGF | | | NAGF | | | NSCGF | |
| Ordinary income | | $ | 52,091 | | | $ | 30,729 | | | $ | — | |
| Net long-term capital gains | | | 7,278,041 | | | | 1,537,461 | | | | 4,537,435 | |
| Return of capital | | | — | | | | — | | | | 135,521 | |
| Total distributions paid | | $ | 7,330,132 | | | $ | 1,568,190 | | | $ | 4,672,956 | |
Under current tax law, capital and currency losses realized after October 31 of a Portfolio’s fiscal year may be deferred and treated as occurring on the first business day of the following fiscal year for tax purposes. The following Portfolios had deferred post-October capital and currency losses, which will be treated as arising on the first business day of the fiscal year ending December 31, 2012.
| | | | | |
| NGF | | $ | 1,118,733 | |
| NAGF | | | 10,976 | |
| NSCGF | | | 1,707,312 | |
The Regulated Investment Company Modernization Act of 2010 (the “Act”) was enacted on December 22, 2010. The Act made changes to several tax rules impacting the Portfolios. In general, the provisions of the Act are effective for the Company’s fiscal year ending December 31, 2011. Although the Act provides several benefits, including the unlimited carryover of future capital losses, there may be a greater likelihood that all or a portion of each Portfolio’s pre-enactment capital loss carryovers may expire without being utilized due to the fact that post-enactment capital losses get utilized before pre-enactment capital loss carryovers.
Notes to Financial Statements (Unaudited) (Continued)
The Act also changed the definition of post-October capital losses eligible for elective deferral to the greatest of a Regulated Investment Company’s (“RIC’s”) net capital loss attributable to the portion of the RIC’s taxable year after October 31, the RIC’s net long-term capital loss attributable to the portion of the RIC’s taxable year after October 31, or the RIC’s net short-term capital loss attributable to the portion of the RIC’s taxable year after October 31. As such, any post-October capital loss which a RIC has elected to defer is deemed to arise on the first day of the RIC’s following taxable year. The aggregate amount of the RIC’s anticipated deferred post-October capital losses would be included in the RIC’s tax basis accumulated loss carryforward, if applicable.
Management has evaluated subsequent events through the date of this filing. This evaluation did not result in any subsequent events that necessitated recognition or disclosures.
| | |
| 13. | New Accounting Pronouncements |
In December 2011, the Financial Accounting Standards Board (“FASB’’) issued Accounting Standards Update (“ASU”) No. 2011-11 “Disclosures about Offsetting Assets and Liabilities.” ASU No. 2011-11 requires disclosures to make financial statements that are prepared under U.S. GAAP more comparable to those prepared under IFRS. The new disclosure requirements mandate that entities disclose both gross and net information about instruments and transactions eligible for offset in the Statements of Assets and Liabilities as well as instruments and transactions subject to an agreement similar to a master netting arrangement. In addition, ASU No. 2011-11 requires disclosure of collateral received and posted in connection with master netting agreements or similar arrangements. New disclosures are required for annual reporting periods beginning on or after January 1, 2013, and interim periods within those annual periods.
Management is currently evaluating the impact ASU No. 2011-11 will have on the Funds’ financial statements and disclosures.
| | |
| 14. | Change in Independent Registered Public Accounting Firm |
Ernst & Young LLP (“E&Y”), 1100 Huntington Center, 41 South High Street, Columbus, Ohio 43215, an independent registered public accounting firm, was the independent registered public accounting firm for the Company for the fiscal year ended December 31, 2010. Effective November 23, 2011, the Audit Committee engaged KPMG LLP to replace E&Y as the independent registered public accounting firm for the Company.
During the Company’s past two fiscal years and any subsequent interim period: (i) no report on the Company’s financial statements contained an adverse opinion or a disclaimer of opinion, or was qualified or modified as to uncertainty, audit scope, or accounting principles; and (ii) there were no “disagreements” (as such term is used in Item 304 of Regulation S-K) with E&Y on any matter of accounting principles or practices, financial statement disclosure, or auditing scope or procedure, which disagreement(s), if not resolved to the satisfaction of E&Y, would have caused it to make reference to the subject matter of the disagreement(s) in connection with its report.
Supplementary Information (Unaudited)
June 30, 2012
Disclosure of Portfolio Holdings
The Company files a Form N-Q with the Securities and Exchange Commission (the “SEC”) no more than sixty days after the Company’s first and third fiscal quarters. For the Company, this would be for the fiscal quarters ending March 31 and September 30. Form N-Q includes a complete schedule of the Company’s portfolio holdings as of the end of those fiscal quarters. The Company’s N-Q filings can be found free of charge on the SEC’s website at http://www.sec.gov, or they may be reviewed and copied at the SEC’s Public Reference Room in Washington, D.C. (call 800-SEC-0330 for information on the operation of the Public Reference Room).
Voting Proxies on Company Portfolio Securities
A description of the policies and procedures that the Company uses to determine how to vote proxies relating to portfolio securities and information regarding how the Company voted proxies relating to portfolio securities during the most recent 12-month period ended June 30 are available without charge, upon request, by calling 800-625-7071 or on the SEC’s website at http://www.sec.gov.
Item 2. Code of Ethics.
Not applicable for semi-annual reports.
Item 3. Audit Committee Financial Expert.
Not applicable for semi-annual reports.
Item 4. Principal Accountant Fees and Services.
Not applicable for semi-annual reports.
Item 5. Audit Committee of Listed Registrants.
Not applicable to registrants who are not listed issuers (as defined in Rule 10A-3 under the Securities Exchange Act of 1934).
Item 6. Investments.
| (a) | Schedule of Investments is included as part of the report to shareholders filed under Item 1 of this Form. |
Item 7. Disclosure of Proxy Voting Policies and Procedures for Closed-End Management Investment Companies.
Not applicable to open-end investment companies.
Item 8. Portfolio Managers of Closed-End Management Investment Companies.
Not applicable to open-end investment companies.
Item 9. Purchases of Equity Securities by Closed-End Management Investment Company and Affiliated Purchasers.
Not applicable to open-end investment companies.
Item 10. Submission of Matters to a Vote of Security Holders.
Not Applicable.
Item 11. Controls and Procedures.
| (a) | The Registrant’s Chief Executive Officer and Chief Financial Officer have reviewed the Registrant's disclosure controls and procedures (as defined in Rule 30a-3(c) under the Investment Company Act of 1940 (the “Act”)) as of a date within 90 days of the filing of this report, as required by Rule 30a-3(b) under the Act and Rules 13a-15(b) or 15d-15(b) under the Securities Exchange Act of 1934. Based on their review, such officers have concluded that the disclosure controls and procedures are effective in ensuring that information required to be disclosed in this report is appropriately recorded, processed, summarized and reported and made known to them by others within the Registrant and by the Registrant’s service provider. |
| (b) | There were no changes in the Registrant's internal control over financial reporting (as defined in Rule 30a-3(d) under the Act) that occurred during the Registrant’s first fiscal half-year of the period covered by this report that has materially affected, or is reasonably likely to materially affect, the Registrant's internal control over financial reporting. |
Item 12. Exhibits.
| (a) | (1) Any code of ethics or amendment thereto, that is the subject of the disclosure required by Item 2, to the extent that the registrant intends to satisfy Item 2 requirements through filing an exhibit. Not applicable for semi-annual reports. |
(2) A separate certification for each principal executive and principal financial officer pursuant to Section 302 of the Sarbanes-Oxley Act of 2002. Filed herewith.
(3) Any written solicitation to purchase securities under Rule 23c-1 under the Act sent or given during the period covered by the report by or on behalf of the registrant to 10 or more persons. Not applicable to open-end investment companies.
| (b) | Certifications pursuant to Section 906 of the Sarbanes-Oxley Act of 2002. Furnished herewith. |
SIGNATURES
Pursuant to the requirements of the Securities Exchange Act of 1934 and the Investment Company Act of 1940, the registrant has duly caused this report to be signed on its behalf by the undersigned, thereunto duly authorized.
(Registrant) The Needham Funds, Inc.
By (Signature and Title) /s/ George A. Needham
George A. Needham, President (Chief Executive Officer)
Date September 10, 2012
Pursuant to the requirements of the Securities Exchange Act of 1934 and the Investment Company Act of 1940, this report has been signed below by the following persons on behalf of the registrant and in the capacities and on the dates indicated.
By (Signature and Title) /s/ George A. Needham
George A. Needham, President (Chief Executive Officer)
Date September 10, 2012
By (Signature and Title) /s/ James W. Giangrasso
James W. Giangrasso, Treasurer and Secretary (Chief Financial Officer)
Date September 10, 2012