UNITED STATES
SECURITIES AND EXCHANGE COMMISSION
Washington, D.C. 20549
FORM N-CSR
CERTIFIED SHAREHOLDER REPORT OF REGISTERED
MANAGEMENT INVESTMENT COMPANIES
Investment Company Act file number | 811-09114 |
|
The Needham Funds, Inc. |
(Exact name of registrant as specified in charter) |
|
445 Park Avenue, New York, NY | | 10022-2606 |
(Address of principal executive offices) | | (Zip code) |
|
Citi Fund Services Ohio, Inc., 3435 Stelzer Road, Columbus, OH 43219 |
(Name and address of agent for service) |
|
Registrant’s telephone number, including area code: | 1-800-625-7071 | |
|
Date of fiscal year end: | December 31 | |
|
Date of reporting period: | June 30, 2009 | |
| | | | | | | | |
Item 1. Reports to Stockholders.
Semiannual
Report
Needham Funds
Seeking to build wealth for long-term investors.
Six Months Ended June 30, 2009 (unaudited)
Needham Growth Fund
Needham Aggressive Growth Fund
Needham Small Cap Growth Fund

www.needhamfunds.com

445 Park Avenue
New York, New York 10022-2606
1-800-625-7071
www.needhamfunds.com
Semiannual Report
For the Six Months Ended June 30, 2009
(Unaudited)
Contents
| Letter from the Adviser | | | 1 | | |
|
| Portfolio Characteristics | |
|
| Needham Growth Fund | | | 5 | | |
|
| Needham Aggressive Growth Fund | | | 6 | | |
|
| Needham Small Cap Growth Fund | | | 7 | | |
|
| Disclosure of Fund Expenses | | | 8 | | |
|
| Schedule of Investments | |
|
| Needham Growth Fund | | | 9 | | |
|
| Needham Aggressive Growth Fund | | | 12 | | |
|
| Needham Small Cap Growth Fund | | | 14 | | |
|
| Schedule of Securities Sold Short | |
|
| Needham Growth Fund | | | 11 | | |
|
| Needham Aggressive Growth Fund | | | 13 | | |
|
| Needham Small Cap Growth Fund | | | 15 | | |
|
| Statements of Assets and Liabilities | | | 16 | | |
|
| Statements of Operations | | | 17 | | |
|
| Statements of Changes in Net Assets | | | 18 | | |
|
| Financial Highlights | |
|
| Needham Growth Fund | | | 19 | | |
|
| Needham Aggressive Growth Fund | | | 20 | | |
|
| Needham Small Cap Growth Fund | | | 21 | | |
|
| Notes to Financial Statements | | | 22 | | |
|
| Supplemental Data | | | 27 | | |
|
This report is authorized for distribution to prospective investors only when preceded or accompanied by a current prospectus. The prospectus contains more complete information, including investment objectives, risks, expenses and charges and should be read carefully before investing or sending any money. To obtain a prospectus, please call 1-800-625-7071.
Portfolios of The Needham Funds, Inc., like all mutual funds:
• Are NOT FDIC insured
• Have no bank guarantee
• May lose value
The Needham Funds, Inc. are distributed by Needham & Company, LLC.
Needham Funds Semiannual Report 2009
Dear Shareholders,
The first half of 2009 presented spectacular challenges and opportunities. The world at large continued to fall apart through mid-March, as the financial and economic crisis continued its relentless course. It seemed that all news was bleak: massive destocking, rising unemployment, bankruptcies of the weak (including the U.S. auto industry), distrust of the U.S. Government's program and the recession in Asia combined to generate a further 25% loss for investors, after the 40% punishment experienced in 2008. However, a very sharp turn occurred in late March. The U.S. stimulus program took shape, the world financial systems started to function again (with kudos to the U.S. Treasury and the Federal Reserve for unprecedented and creative interventions), and restocking and quick "shovels" in China helped restore some confidence. Optimism, short covering and trickling cash inflows into equity boosted the market over 40% from its lows, to close the first half in the black, yet still about a third below the fall 2007 highs. The NASDAQ was more swift at bouncing back, outperforming the Dow and the S&P 500, which registered modest gains.
We at The Needham Funds, Inc. focus on buying growth stocks at reasonable prices. In the six-month period ended June 30, 2009, the Growth Fund was up 16.63%, the Aggressive Growth Fund was up 12.28% and the Small Cap Growth Fund was up 17.35%. By comparison, the S&P 500 Index was up 3.16%, the NASDAQ Composite Index was up 16.98% and the Russell 2000 Index was up 2.64%.
The Needham Growth Fund (the "Growth Fund") seeks to create long-term, tax-efficient capital appreciation for its investors. To this end, the Growth Fund targets companies with products or services that are selling or marketing into growth markets. These companies normally have earnings growth of at least 10-15%, product and market dominance, and the ability to consolidate their market positions. They may also have a competitive advantage by acquiring and retaining more customers or driving costs down and profits up. The Growth Fund also looks for seasoned and motivated managements with records of building shareholder value. Companies with these characteristics sometimes find themselves in a temporary earnings shortfall or may be in a product transition. This often causes aggressive growth or momentum investors to sell. At this point, the Growth Fund may deem the stock to be reasonably priced and purchase it for long-term capita l appreciation. Hence, the discipline called "Growth At a Reasonable Price," or "GARP."
As of June 30, 2009, the Growth Fund was down 20.28% for the 1 year period, down 7.85% for the 3 years, down 0.05% for the 5 years, up 6.50% for the 10 years, and up 12.57% since inception, compounded annually. The Growth Fund received a four-star MorningstarTM Rating for the Ten-Year Period in the U.S.-domiciled Mid-Cap Growth Funds category as of June 30, 2009, based on Risk-Adjusted Return, when rated against 331 Mid-Cap Growth Funds. We ended the six-month period with approximately 9.5% of total investments in cash and 4.2% as our short position. Our best contributing stocks were CarMax (+86.5%), Express Scripts (+25.0%), Seagate (+136.1%), Morgan Stanley (+77.7%), 3Com (+107.5%) and Schering-Plough (+47.5%). Our worst detracting stocks were CONMED (-35.2%), Brooks Automation (-22.9%), EMS Technologies (-19.2%) and our short positions. We benefited from our exposure to healthcare services, consumer discretionary, storage, and energy; our medical technology and semi-cap equipment stocks hurt the Growth Fund. We expect the latter to rebound. We initiated a few positions such as Becton Dickinson, Entegris, Hologic, Iconix Brands, IPG Photonics, TomoTherapy and Xyratex. The fact that we kept our short position small throughout the quarter helped the fund in an overall rising market.
The Needham Aggressive Growth Fund (the "Aggressive Growth Fund") seeks to create long-term, tax-efficient capital appreciation for its investors. To this end, the Aggressive Growth Fund targets the equities of
1
Needham Funds
companies with strong, above-average prospective growth rates. The Aggressive Growth Fund invests, in general, in markets and industries with strong growth rates, focusing on the market leaders in these areas. These market leaders, especially as they break away from their competitors, tend to garner a disproportionate share of the positive financial returns. Also important is the long-term sustainability of the companies' leadership positions. Thus, the Aggressive Growth Fund looks for companies with strong management teams, superior balance sheets, above-average margins that can generate excess cash, and strong R&D and brand spending in industries with high barriers to entry.
As of June 30, 2009, the Aggressive Growth Fund was down 6.10% for the 1 year period, up 0.85% for the 3 years, up 4.68% for the 5 years, and up 5.51% since inception, compounded annually. The Aggressive Growth Fund received a five-star MorningstarTM Rating (Morningstar's highest rating) Overall and for the Three-Year and Five-Year Periods in the U.S.-domiciled Mid-Cap Growth Funds category as of June 30, 2009, based on Risk-Adjusted Return, when rated against 794, 794 and 658 Mid-Cap Growth Funds, respectively. In April, the Aggressive Growth Fund was honored by Lipper for being the 2009 top performer in the Mid-Cap Growth — United States category over a three-year period when ranked against 529 funds. The Wall Street Journal listed the fund as the top performer in that category for the 12-month period ending June 30, 2009 among 521 funds, significantly outperforming the average comparable fund, which lost about 31% during the period. Throughout the quarter, we maintained in excess of 35% of cash in the Aggressive Growth Fund, which protected our shareholders last year, but contributed to some underperformance so far this year. Our best contributing stocks were Apple (+66.9%), Solta Medical (which more than doubled after we bought it during the first half), Express Scripts (+25.0%) and Morgan Stanley (+77.7%). Our worst detracting stocks were Alliance Healthcare (-8.0%), Gilead Sciences (-8.4%), Cavium Networks (-23.3%), Brooks Automation (-22.9%) and our short positions. We benefited from our exposure to consumer discretionary, healthcare services and technology stocks; our medical technology stocks hurt the Aggressive Growth Fund. We initiated a few positions such as Daktronics, Gentiva, Iconix Brands and Powerwave. The fact that we kept our short position small throughout the quarter was of help to the fund in an overall rising market.
The Needham Small Cap Growth Fund (the "Small Cap Growth Fund") seeks long-term, tax-efficient capital appreciation by investing primarily in equity securities of smaller growth companies that the Small Cap Growth Fund believes are trading at a discount to their underlying value, yet have the potential for superior long-term growth. Under normal conditions, the Small Cap Growth Fund invests at least 80% of its net assets in equity securities of domestic issuers listed on a nationally recognized securities exchange or traded on the NASDAQ System that have market capitalizations not exceeding $2 billion or the highest market capitalization in the Russell 2000 Index, if greater. As of June 30, 2009, the highest market capitalization in the Russell 2000 Index was $2.284 billion. Due to the abnormal market conditions that we have faced over the past year, we have maintained, and continue to maintain, a higher than usual cash position until we observe a more normal investment environment.
Central to the Small Cap Growth Fund's investment strategy is a sound valuation discipline that seeks to acquire growth companies at reasonable prices. The Small Cap Growth Fund seeks tax efficiency by holding securities for a period of 12 months or more to obtain long-term capital gain treatment and by offsetting capital gains on the sale of securities with capital losses.
As of June 30, 2009, the Small Cap Growth Fund was down 7.09% for the 1 year period, down 2.57% for the 3 years, up 0.10% for the 5 years, and up 8.72% since inception, compounded annually. The Small Cap Growth Fund received a five-star MorningstarTM Rating (Morningstar's highest rating) Overall and for the Three-Year
2
Semiannual Report 2009
and Five-Year Periods in the U.S.-domiciled Small-Cap Growth Funds category as of June 30, 2009, based on Risk-Adjusted Return, when rated against 687, 687 and 573 Small-Cap Growth Funds, respectively. Many of our investments at the end of 2008 and early 2009 performed very well relative to the market and helped the fund to outperform its comparative indices both in the second quarter and on a year-to-date basis. Our cautious stance during the early part of the first quarter allowed us the opportunity to minimize a significant market slide and deploy cash at very attractive entry levels. We continued to invest cash throughout the second quarter as well as harvest some investments that had made substantial gains off their lows. We continue to maintain a significant exposure to the semiconductor and semiconductor equipment industries and do not expect that we have seen the end of the early cycle movement in these names. That being said, we also believe that the early success experienced to date was the result of an inventory refresh rather than the start of a new bull cycle. During 2008, many of the semiconductor names were relatively ignored by the market and we were able to successfully purchase specific names that are well managed and have great product opportunities. These names include MKS Instruments, Semitool and Entegris.
The portfolio turnover rates were 13% for the Growth Fund, 51% for the Aggressive Growth Fund and 82% for the Small Cap Growth Fund for the six months ended June 30, 2009. The expense ratios were 2.03% for the Growth Fund, 2.50% for the Aggressive Growth Fund and 2.58% for the Small Cap Growth Fund for the six months ended June 30, 2009.
As we write this letter in late July 2009, the market is testing new highs buoyed by improving housing and confidence statistics. It appears likely that the U.S. GDP will grow in the third quarter after four consecutive quarters of decline. Volatility remains elevated but has declined somewhat from its peaks of 2008. Investors remain by and large cautious, both from fear of a bear rally and elevated valuations. Our guiding light in our investing decisions remains unchanged: sound management teams with sustainable, value-added strategies and execution skills; outperforming growth prospects; and bargain valuation. Overall, as we reflect on this extraordinary first half of 2009, it seems extremely likely that we will not return to the mid-March lows anytime soon. The period was marked by a disproportionate pessimism of investors in relation to the then actual reality. Investors feared Depression 2.0 at the time when in fact all was in place for a recovery of the financial system. Corporate earnings were assumed to be obliterated, when, in fact, second quarter earnings exceeded all expectations as massive cost savings measures such as reducing supplier and employee costs were a significant boost. So we ask, "Is optimism vs. the future disconnected from the current reality?" Fears are less profound now that the green shoots have turned into a low rising tide. Unemployment statistics will continue to rise, putting a significant brake on the economy and on confidence. Earnings gains will come more from true growth than from cost savings. Overall, the market seems relatively fairly valued, and it is up to us to identify the outperforming companies as we expect less correlation among stocks. Stock picking is our skill. We are glad to have an opportunity to practice it again.
Sincerely,
 | |  | |
|
| Bernard Lirola | | Chris Retzler | |
|
| Portfolio Manager | | Portfolio Manager | |
|
3
Needham Funds
Mr. Bernard Lirola is the Co-Portfolio Manager of the Growth Fund and the Portfolio Manager of the Aggressive Growth Fund. Mr. Lirola has an extensive 31-year career on Wall Street covering investment banking, research and now asset management. He graduated from École Polytechnique in Paris, France in 1973 and received an MBA from Harvard Business School in 1976. Prior to joining Needham in 1994, he worked at Smith Barney, Harris Upham & Co. (1976-1978), at CS First Boston (1978-1990) and at Swiss Bank Corporation (1990-1994). Mr. Lirola was an early member of CS First Boston's M&A group (1978), recruited by Joseph Perella and Bruce Wasserstein and headed First Boston's M&A healthcare group (1985-1990). At Swiss Bank Corporation, he was Head of U.S. M&A activities (1990-1994). Mr. Lirola joined Needham & Company, Inc. (predecessor to The Needham Group, Inc.) on the investment banking side in 1994 and w as successively a Co-Head of Health Care, Co-Head of Investment Banking and a member of its Operating Committee. Between 1996 and 1999, he was also an equity research analyst covering the health care services industry. Mr. Lirola joined the Adviser in 2007, where he provided sourcing and assessing of investment opportunities for the Needham Funds both in the U.S. and overseas. He also serves as Executive Vice President of the Growth Fund and the Aggressive Growth Fund. Mr. Lirola became Portfolio Manager of the Growth Fund and the Aggressive Growth Fund in January 2008. He engages in a variety of portfolio management-related activities, including stock selection, research, company visits and market analysis.
Mr. Chris Retzler is the Co-Portfolio Manager of the Growth Fund and the Portfolio Manager of the Small Cap Growth Fund. Mr. Retzler has been with Needham Asset Management, LLC since 2005. Mr. Retzler is a graduate of the Columbia Business School and was a Fulbright Scholar. He began his career in 1994 with Merrill Lynch Investment Banking. When he left Merrill Lynch in 2002, Mr. Retzler was an associate in Mergers and Acquisitions where he participated in numerous stock and asset transactions across a wide range of domestic and global industries. From 2002 until he joined Needham, he was in charge of Winterkorn, a privately owned company. Prior to becoming the sole Portfolio Manager of the Small Cap Growth Fund, Mr. Retzler's responsibilities at Needham included examining and conducting due diligence on both existing and new investment opportunities for the Needham Funds. He also serves as Executive Vice President of the Growth Fund and the Small Cap Growth Fund. Mr. Retzler became Co-Portfolio Manager of the Growth Fund in January 2009 and Portfolio Manager of the Small Cap Growth Fund in January 2008. He engages in a variety of portfolio management-related activities, including stock selection, research, company visits and market analysis.
4
Semiannual Report 2009
NEEDHAM GROWTH FUND (Unaudited) TICKER: NEEGX
Comparative Performance Statistics as of June 30, 2009
| | | 6 Months(7) | | 1 Year | | 3 Years(8) | | 5 Years(8) | | 10 Years(8) | | Since Inception(8)(12) | | Gross Expense
Ratio(14) | |
| Needham Growth Fund(1) | | | 16.63 | % | | | (20.28 | )% | | | (7.85 | )%(9) | | | (0.05 | )%(10) | | | 6.50 | %(11) | | | 12.57 | %(13) | | | 2.06 | % | |
| S&P 500 Index(2)(3) | | | 3.16 | % | | | (26.21 | )% | | | (8.21 | )% | | | (2.24 | )% | | | (2.22 | )% | | | 4.83 | % | | | |
| NASDAQ Composite Index(2)(4) | | | 16.98 | % | | | (19.13 | )% | | | (4.64 | )% | | | (1.37 | )% | | | (3.17 | )% | | | 4.75 | % | | | |
| S&P 400 MidCap Index(2)(5) | | | 8.47 | % | | | (28.02 | )% | | | (7.54 | )% | | | 0.36 | % | | | 4.60 | % | | | 8.86 | % | | | |
| Russell 2000® Index(2)(6) | | | 2.64 | % | | | (25.01 | )% | | | (9.88 | )% | | | (1.67 | )% | | | 2.43 | % | | | 5.01 | % | | | |
Past performance does not guarantee future results. The performance data quoted represents past performance, and current returns may be lower or higher. The investment return and net asset value will fluctuate so that an investor's shares, when redeemed, may be worth more or less than the original cost. To obtain performance information current to the most recent month-end, please visit www.needhamfunds.com. The returns shown in the above table and accompanying footnotes are net of expenses. The table above does not reflect the deduction of taxes that a shareholder would have paid on Fund distributions or on the redemption of Fund shares.
1. Investment results calculated after reinvestment of dividends.
2. It is not possible to invest directly in an index. The performance of the index does not include the deduction of expenses associated with a mutual fund, such as investment management fees.
3. The S&P 500 Index is a broad unmanaged measure of the U.S. stock market.
4. The NASDAQ Composite Index is a broad-based capitalization-weighted index of all NASDAQ Global Market and Small Cap stocks.
5. The S&P 400 MidCap Index is a broad unmanaged measure of the U.S. stock market.
6. The Russell 2000® Index is a broad unmanaged index composed of the smallest 2,000 companies in the Russell 3000® Index.
7. Not annualized.
8. Compound annual growth rate (annualized return). Assumes all dividends were reinvested in shares of the Fund.
9. Cumulative return for the three year period was (21.75)%, assuming all dividends were reinvested in shares of the Fund.
10. Cumulative return for the five year period was (0.24)%, assuming all dividends were reinvested in shares of the Fund.
11. Cumulative return for the ten year period was 87.74%, assuming all dividends were reinvested in shares of the Fund.
12. The inception date of the Fund was 1/1/96.
13. Cumulative return since inception was 394.22%, assuming all dividends were reinvested in shares of the Fund.
14. The above expense ratio is from the Funds' prospectus dated May 1, 2009. Additional information pertaining to the Funds' expense ratios as of June 30, 2009 can be found in the financial highlights. Since January 1, 2009, the investment performance reflects contractually agreed upon fee waivers which expire at the close of business on December 31, 2009. Without these fee waivers, the performance would have been lower. Excluding the indirect costs of investing in acquired funds, total net fund operating expenses would be 2.04%.
Top Ten Holdings*
(as a % of total investments, as of June 30, 2009)
| Security | | | | % of Total
Investments† | |
| 1) Express Scripts, Inc. | | ESRX | | | 8.84 | % | |
| 2) Iron Mountain, Inc. | | IRM | | | 5.47 | % | |
| 3) Thermo Fisher Scientific, Inc. | | TMO | | | 5.24 | % | |
| 4) Varian Medical Systems, Inc. | | VAR | | | 4.52 | % | |
| 5) CarMax, Inc. | | KMX | | | 4.36 | % | |
| 6) ViaSat, Inc. | | VSAT | | | 4.30 | % | |
| 7) Luxottica Group Spa | | LUX | | | 3.83 | % | |
| 8) EMS Technologies, Inc. | | ELMG | | | 2.92 | % | |
| 9) Brooks Automation, Inc. | | BRKS | | | 2.67 | % | |
| 10) National Semiconductor Corp. | | NSM | | | 2.53 | % | |
Top Ten Holdings = 44.68% of Total Investments†
* Current portfolio holdings may not be indicative of future portfolio holdings.
† Percentage of total investments includes all stocks, plus cash minus all short positions.
Sector Weightings*
(as a % of total investments, as of June 30, 2009)
| Sector | | Long(1) | | (Short)(1) | | Total(1)(2) | |
| Business Services | | | 11.2 | % | | | — | | | | 11.2 | % | |
| Consumer | | | 12.3 | % | | | (1.7 | )% | | | 10.6 | % | |
| Energy | | | 3.5 | % | | | — | | | | 3.5 | % | |
| Financial Services | | | 2.3 | % | | | (1.3 | )% | | | 1.0 | % | |
| Healthcare | | | 28.5 | % | | | (0.4 | )% | | | 28.1 | % | |
| Industrial | | | 1.3 | % | | | (0.4 | )% | | | 0.9 | % | |
| Technology | | | 24.6 | % | | | (0.3 | )% | | | 24.3 | % | |
| Telecommunications/Cable | | | 11.0 | % | | | (0.1 | )% | | | 10.9 | % | |
| Cash | | | 9.5 | % | | | — | | | | 9.5 | % | |
* Current portfolio holdings may not be indicative of future portfolio holdings.
(1) Percentage of total investments includes all stocks, plus cash minus all short positions.
(2) Total represents the difference between the long exposure and the short exposure, which produces the net exposure.
Comparison of Change in Value of a $10,000 Investment
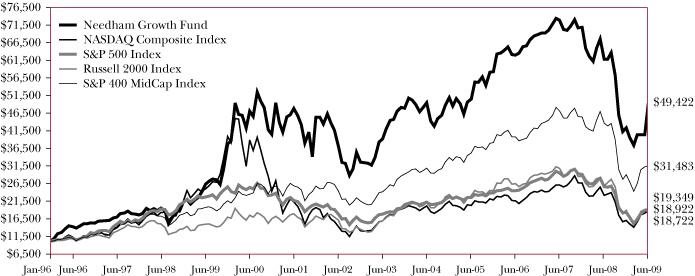
Past performance does not guarantee future results. The performance data quoted represents past performance, and current returns may be lower or higher. The investment return and net asset value will fluctuate so that an investor's shares, when redeemed, may be worth more or less than the original cost. To obtain performance information current to the most recent month-end, please visit www.needhamfunds.com. The graph above does not reflect the deduction of taxes that a shareholder would have paid on Fund distributions or on the redemption of Fund shares. Since inception, the Fund's Adviser has absorbed certain expenses of the Fund, without which returns would have been lower.
5
Needham Funds
NEEDHAM AGGRESSIVE GROWTH FUND (Unaudited) TICKER: NEAGX
Comparative Performance Statistics as of June 30, 2009
| | | 6 Months(6) | | 1 Year | | 3 Years(7) | | 5 Years(7) | | Since Inception(7)(10) | | Gross Expense
Ratio(12) | |
| Needham Aggressive Growth Fund(1) | | | 12.28 | % | | | (6.10 | )% | | | 0.85 | %(8) | | | 4.68 | %(9) | | | 5.51 | %(11) | | | 2.65 | % | |
| S&P 500 Index(2)(3) | | | 3.16 | % | | | (26.21 | )% | | | (8.21 | )% | | | (2.24 | )% | | | (0.76 | )% | | | |
| NASDAQ Composite Index(2)(4) | | | 16.98 | % | | | (19.13 | )% | | | (4.64 | )% | | | (1.37 | )% | | | 0.89 | % | | | |
| Russell 2000® Index(2)(5) | | | 2.64 | % | | | (25.01 | )% | | | (9.88 | )% | | | (1.67 | )% | | | 2.40 | % | | | |
Past performance does not guarantee future results. The performance data quoted represents past performance, and current returns may be lower or higher. The investment return and net asset value will fluctuate so that an investor's shares, when redeemed, may be worth more or less than the original cost. To obtain performance information current to the most recent month-end, please visit www.needhamfunds.com. The returns shown in the above table and accompanying footnotes are net of expenses. The table above does not reflect the deduction of taxes that a shareholder would have paid on Fund distributions or on the redemption of Fund shares.
1. Investment results calculated after reinvestment of dividends.
2. It is not possible to invest directly in an index. The performance of the index does not include the deduction of expenses associated with a mutual fund, such as investment management fees.
3. The S&P 500 Index is a broad unmanaged measure of the U.S. stock market.
4. The NASDAQ Composite Index is a broad-based capitalization-weighted index of all NASDAQ Global Market and Small Cap stocks.
5. The Russell 2000® Index is a broad unmanaged index composed of the smallest 2,000 companies in the Russell 3000® Index.
6. Not annualized.
7. Compound annual growth rate (annualized return). Assumes all dividends were reinvested in shares of the Fund.
8. Cumulative return for the three year period was 2.58%, assuming all dividends were reinvested in shares of the Fund.
9. Cumulative return for the five year period was 25.72%, assuming all dividends were reinvested in shares of the Fund.
10. The inception date of the Fund was 9/4/01.
11. Cumulative return since inception was 52.11%, assuming all dividends were reinvested in shares of the Fund.
12. The above expense ratio is from the Funds' prospectus dated May 1, 2009. Additional information pertaining to the Funds' expense ratios as of June 30, 2009 can be found in the financial highlights. Since inception, the investment performance reflects contractually agreed upon fee waivers which shall continue in effect from year to year only upon mutual agreement of the Funds and the Adviser. Without these fee waivers, the performance would have been lower. Excluding the indirect costs of investing in acquired funds, total net fund operating expenses would be 2.51%.
Top Ten Holdings*
(as a % of total investments, as of June 30, 2009)
| Security | | | | % of Total
Investments† | |
| 1) Gilead Sciences, Inc. | | GILD | | | 7.13 | % | |
| 2) Express Scripts, Inc. | | ESRX | | | 6.28 | % | |
| 3) Iron Mountain, Inc. | | IRM | | | 5.84 | % | |
| 4) Varian Medical Systems, Inc. | | VAR | | | 5.35 | % | |
| 5) Precision Castparts Corp. | | PCP | | | 4.45 | % | |
| 6) Apple, Inc. | | AAPL | | | 4.34 | % | |
| 7) ViaSat, Inc. | | VSAT | | | 3.91 | % | |
| 8) Dick's Sporting Goods, Inc. | | DKS | | | 3.75 | % | |
| 9) Eclypsys Corp. | | ECLP | | | 3.71 | % | |
| 10) Resources Connection, Inc. | | RECN | | | 3.70 | % | |
Top Ten Holdings = 48.46% of Total Investments†
* Current portfolio holdings may not be indicative of future portfolio holdings.
† Percentage of total investments includes all stocks, plus cash minus all short positions.
Sector Weightings*
(as a % of total investments, as of June 30, 2009)
| Sector | | Long(1) | | (Short)(1) | | Total(1)(2) | |
| Business Services | | | 10.4 | % | | | — | | | | 10.4 | % | |
| Consumer | | | 7.2 | % | | | — | | | | 7.2 | % | |
| Financial Services | | | 1.4 | % | | | — | | | | 1.4 | % | |
| Healthcare | | | 27.5 | % | | | (0.4 | )% | | | 27.1 | % | |
| Industrial | | | 3.2 | % | | | — | | | | 3.2 | % | |
| Technology | | | 11.5 | % | | | (0.4 | )% | | | 11.1 | % | |
| Telecommunications/Cable | | | 5.9 | % | | | — | | | | 5.9 | % | |
| Cash | | | 32.0 | % | | | — | | | | 32.0 | % | |
| Exchange Traded Funds | | | 1.7 | % | | | — | | | | 1.7 | % | |
* Current portfolio holdings may not be indicative of future portfolio holdings.
(1) Percentage of total investments includes all stocks, plus cash minus all short positions.
(2) Total represents the difference between the long exposure and the short exposure, which produces the net exposure.
Comparison of Change in Value of a $10,000 Investment
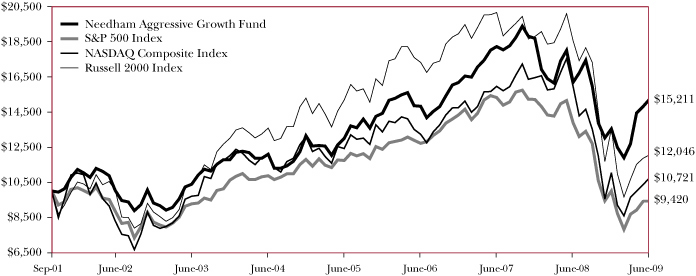
Past performance does not guarantee future results. The performance data quoted represents past performance, and current returns may be lower or higher. The investment return and net asset value will fluctuate so that an investor's shares, when redeemed, may be worth more or less than the original cost. To obtain performance information current to the most recent month-end, please visit www.needhamfunds.com. The graph above does not reflect the deduction of taxes that a shareholder would have paid on Fund distributions or on the redemption of Fund shares. Since inception, the Fund's Adviser has absorbed certain expenses of the Fund, without which returns would have been lower.
6
Semiannual Report 2009
NEEDHAM SMALL CAP GROWTH FUND (Unaudited) TICKER: NESGX
Comparative Performance Statistics as of June 30, 2009
| | | 6 Months(6) | | 1 Year | | 3 Years(7) | | 5 Years(7) | | Since Inception(7)(10) | | Gross Expense
Ratio(12) | |
| Needham Small Cap Growth Fund(1) | | | 17.35 | % | | | (7.09 | )% | | | (2.57 | )%(8) | | | 0.10 | %(9) | | | 8.72 | %(11) | | | 3.62 | % | |
| S&P 500 Index(2)(3) | | | 3.16 | % | | | (26.21 | )% | | | (8.21 | )% | | | (2.24 | )% | | | (0.14 | )% | | | |
| NASDAQ Composite Index(2)(4) | | | 16.98 | % | | | (19.13 | )% | | | (4.64 | )% | | | (1.37 | )% | | | 2.54 | % | | | |
| Russell 2000® Index(2)(5) | | | 2.64 | % | | | (25.01 | )% | | | (9.88 | )% | | | (1.67 | )% | | | 1.94 | % | | | |
Past performance does not guarantee future results. The performance data quoted represents past performance, and current returns may be lower or higher. The investment return and net asset value will fluctuate so that an investor's shares, when redeemed, may be worth more or less than the original cost. To obtain performance information current to the most recent month-end, please visit www.needhamfunds.com. The returns shown in the above table and accompanying footnotes are net of expenses. The table above does not reflect the deduction of taxes that a shareholder would have paid on Fund distributions or on the redemption of Fund shares.
1. Investment results calculated after reinvestment of dividends.
2. It is not possible to invest directly in an index. The performance of the index does not include the deduction of expenses associated with a mutual fund, such as investment management fees.
3. The S&P 500 Index is a broad unmanaged measure of the U.S. stock market.
4. The NASDAQ Composite Index is a broad-based capitalization-weighted index of all NASDAQ Global Market and Small Cap stocks.
5. The Russell 2000® Index is a broad unmanaged index composed of the smallest 2,000 companies in the Russell 3000® Index.
6. Not annualized.
7. Compound annual growth rate (annualized return). Assumes all dividends were reinvested in shares of the Fund.
8. Cumulative return for the three year period was (7.52)%, assuming all dividends were reinvested in shares of the Fund.
9. Cumulative return for the five year period was 0.53%, assuming all dividends were reinvested in shares of the Fund.
10. The inception date of the Fund was 5/22/02.
11. Cumulative return since inception was 81.15%, assuming all dividends were reinvested in shares of the Fund.
12. The above expense ratio is from the Funds' prospectus dated May 1, 2009. Additional information pertaining to the Funds' expense ratios as of June 30, 2009 can be found in the financial highlights. Since inception, the investment performance reflects contractually agreed upon fee waivers which shall continue in effect from year to year only upon mutual agreement of the Funds and the Adviser. Without these fee waivers, the performance would have been lower. Excluding the indirect costs of investing in acquired funds, total net fund operating expenses would be 2.51%.
Top Ten Holdings*
(as a % of total investments, as of June 30, 2009)
| Security | | | | % of Total
Investments† | |
| 1) Express Scripts, Inc. | | ESRX | | | 4.90 | % | |
| 2) CONMED Corp. | | CNMD | | | 4.15 | % | |
| 3) MKS Instruments, Inc. | | MKSI | | | 4.00 | % | |
| 4) Aruba Networks, Inc. | | ARUN | | | 3.90 | % | |
| 5) ICx Technologies, Inc. | | ICXT | | | 3.75 | % | |
| 6) Cognex Corp. | | CGNX | | | 3.53 | % | |
| 7) iRobot Corp. | | IRBT | | | 3.47 | % | |
| 8) Airvana, Inc. | | AIRV | | | 3.41 | % | |
| 9) Eclipsys Corp. | | ECLP | | | 3.26 | % | |
| 10) Varian Medical Systems, Inc. | | VAR | | | 3.13 | % | |
Top Ten Holdings = 37.50% of Total Investments†
* Current portfolio holdings may not be indicative of future portfolio holdings.
† Percentage of total investments includes all stocks, plus cash minus all short positions.
Sector Weightings*
(as a % of total investments, as of June 30, 2009)
| Sector | | Long(1) | | (Short)(1) | | Total(1)(2) | |
| Business Services | | | 2.8 | % | | | — | | | | 2.8 | % | |
| Consumer | | | — | | | | (3.6 | )% | | | (3.6 | )% | |
| Energy | | | 5.0 | % | | | — | | | | 5.0 | % | |
| Financial Services | | | — | | | | (0.6 | )% | | | (0.6 | )% | |
| Healthcare | | | 15.7 | % | | | (0.4 | )% | | | 15.3 | % | |
| Industral | | | 5.1 | % | | | — | | | | 5.1 | % | |
| Technology | | | 26.6 | % | | | (2.5 | )% | | | 24.1 | % | |
| Telecommunications/Cable | | | 15.2 | % | | | (0.3 | )% | | | 14.9 | % | |
| Cash | | | 37.0 | % | | | — | | | | 37.0 | % | |
* Current portfolio holdings may not be indicative of future portfolio holdings.
(1) Percentage of total investments includes all stocks, plus cash minus all short positions.
(2) Total represents the difference between the long exposure and the short exposure, which produces the net exposure.
Comparison of Change in Value of a $10,000 Investment
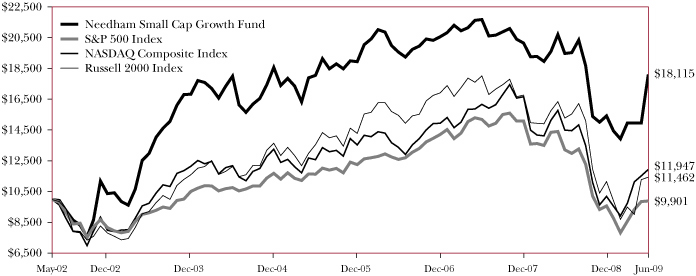
Past performance does not guarantee future results. The performance data quoted represents past performance, and current returns may be lower or higher. The investment return and net asset value will fluctuate so that an investor's shares, when redeemed, may be worth more or less than the original cost. To obtain performance information current to the most recent month-end, please visit www.needhamfunds.com. The graph above does not reflect the deduction of taxes that a shareholder would have paid on Fund distributions or on the redemption of Fund shares. Since inception, the Fund's Adviser has absorbed certain expenses of the Fund, without which returns would have been lower.
7
Needham Funds
Disclosure of Fund Expenses (Unaudited)
The following expense table is shown so that you can understand the impact of fees on your investment. All mutual funds have operating expenses. As a shareholder of the fund, you incur transactional costs, including redemption fees and exchange fees, and ongoing costs, which include costs for portfolio management, administrative services, and shareholder reports, among others. A fund's expenses are expressed as a percentage of its average net assets. This figure is known as the expense ratio. The following examples are intended to help you understand the ongoing costs (in dollars) of investing in each fund and to compare these costs with those of other mutual funds. The examples are based on an investment of $1,000 made at the beginning of the period shown and held for the entire period.
The expense example table below illustrates your fund's cost in two ways:
• Actual Expenses. This section helps you to estimate the actual expenses after fee waivers that you paid over the period. The "Ending Account Value" shown is derived from the fund's actual return, and "Expenses Paid During Period" shows the dollar amount that would have been paid by an investor who started with $1,000 in the fund. You may use the information here, together with the amount you invested, to estimate the expenses that you paid over the period. To do so, simply divide your account value by $1,000 (for example, an $8,600 account value divided by $1,000 = 8.6), then multiply the result by the number given for your fund under the heading entitled "Expenses Paid During Period".
• Hypothetical Expenses on a 5% Return. This section is intended to help you compare your fund's costs with those of other mutual funds. It assumes that the fund had a return of 5% before expenses during the period shown, but that the expense ratio is unchanged. In this case, because the return used is not the fund's actual return, the results do not apply to your investment. The example is useful in making comparisons because the Securities and Exchange Commission requires all mutual funds to calculate expenses based on a 5% return. You can assess your fund's cost by comparing this hypothetical example with the hypothetical examples that appear in shareholders reports of other funds.
Please note that the expenses shown in the table are meant to highlight your ongoing costs only and do not reflect any transactional costs, such as redemption fees or exchange fees. Therefore, the table is useful in comparing ongoing costs only, and will not help you determine the relative total costs of owning different funds. In addition, if these transactional costs were included, your costs would have been higher.
For the Period January 1, 2009 to June 30, 2009
Expense Example Table
| | | Beginning
Account
Value
1/1/09 | | Ending
Account
Value
6/30/09 | | Expenses
Paid During
Period*
1/1/09-
6/30/09 | | Expense Ratio
During
Period
1/1/09-
6/30/09 | |
| Needham Growth Fund | |
| Actual Expenses | | $ | 1,000.00 | | | $ | 1,166.30 | | | $ | 10.90 | | | | 2.03 | % | |
Hypothetical Example for Comparison Purposes
(5% return before expenses) | | $ | 1,000.00 | | | $ | 1,014.73 | | | $ | 10.14 | | | | 2.03 | % | |
| Needham Aggressive Growth Fund | |
| Actual Expenses | | $ | 1,000.00 | | | $ | 1,122.80 | | | $ | 13.16 | | | | 2.50 | % | |
Hypothetical Example for Comparison Purposes
(5% return before expenses) | | $ | 1,000.00 | | | $ | 1,012.40 | | | $ | 12.47 | | | | 2.50 | % | |
| Needham Small Cap Growth Fund | |
| Actual Expenses | | $ | 1,000.00 | | | $ | 1,173.50 | | | $ | 13.90 | | | | 2.58 | % | |
Hypothetical Example for Comparison Purposes
(5% return before expenses) | | $ | 1,000.00 | | | $ | 1,012.00 | | | $ | 12.87 | | | | 2.58 | % | |
* Expenses are equal to the average account value times the Fund's annualized expense ratio multiplied by the number of days in the most recent fiscal half-year divided by the number of days in the fiscal year.
8
Semiannual Report 2009
Needham Growth Fund
Schedule of Investments
June 30, 2009 (Unaudited)
| | | Shares | | Value | |
| Common Stocks (90.7%) | |
| Business Services (7.0%) | |
| Dice Holdings, Inc.* | | | 115,300 | | | $ | 536,145 | | |
| Iconix Brand Group, Inc.* | | | 42,000 | | | | 645,960 | | |
| Iron Mountain, Inc.* | | | 170,000 | | | | 4,887,500 | | |
| Resources Connection, Inc.* | | | 50,000 | | | | 858,500 | | |
| | | | 6,928,105 | | |
| Consumer Services (11.7%) | |
| Avis Budget Group, Inc.*† | | | 50,000 | | | | 282,500 | | |
| CarMax, Inc.* | | | 265,000 | | | | 3,895,500 | | |
| Dick's Sporting Goods, Inc.* | | | 115,000 | | | | 1,978,000 | | |
| Luxottica Group SpA - ADR*† | | | 165,000 | | | | 3,428,700 | | |
| Morton's Restaurant Group* | | | 247,200 | | | | 741,600 | | |
| Whole Foods Market, Inc. | | | 65,000 | | | | 1,233,700 | | |
| | | | 11,560,000 | | |
| Energy (1.8%) | |
| Chesapeake Energy Corp. | | | 90,000 | | | | 1,784,700 | | |
| Financial Services (2.2%) | |
| Morgan Stanley | | | 75,000 | | | | 2,138,250 | | |
| Healthcare Services (27.4%) | |
| Becton, Dickinson & Co. | | | 25,000 | | | | 1,782,750 | | |
| Cardiac Science Corp.* | | | 50,000 | | | | 201,000 | | |
| CONMED Corp.* | | | 135,000 | | | | 2,095,200 | | |
| Covidien Ltd. | | | 43,750 | | | | 1,638,000 | | |
| Express Scripts, Inc.*† | | | 115,000 | | | | 7,906,250 | | |
| Healthways, Inc.* | | | 20,000 | | | | 269,000 | | |
| Hologic, Inc.* | | | 50,000 | | | | 711,500 | | |
| Merck & Co., Inc. | | | 50,000 | | | | 1,398,000 | | |
| Omnicell, Inc.* | | | 39,800 | | | | 427,850 | | |
Palomar Medical
Technologies, Inc.* | | | 8,000 | | | | 117,280 | | |
| Thermo Fisher Scientific, Inc.* | | | 115,000 | | | | 4,688,550 | | |
| TomoTherapy, Inc.* | | | 210,000 | | | | 577,500 | | |
| UnitedHealth Group, Inc. | | | 44,500 | | | | 1,111,610 | | |
| Varian Medical Systems, Inc.*† | | | 115,000 | | | | 4,041,100 | | |
| | | | 26,965,590 | | |
| Industrial (1.2%) | |
| Southwall Technologies, Inc.*† | | | 728,000 | | | | 691,600 | | |
| Sypris Solutions, Inc. | | | 418,700 | | | | 506,627 | | |
| | | | 1,198,227 | | |
| Oil & Gas — Exploration & Production (1.5%) | |
| Transocean, Ltd* | | | 20,000 | | | | 1,485,800 | | |
| | | Shares | | Value | |
| Common Stocks — Continued | |
| Software (3.7%) | |
| Actuate Corp.* | | | 321,854 | | | $ | 1,538,462 | | |
| Aspen Technology, Inc.* | | | 250,000 | | | | 2,132,500 | | |
| | | | 3,670,962 | | |
| Technology (23.6%) | |
| 3Com Corp.* | | | 475,000 | | | | 2,237,250 | | |
| Barco Industries NV | | | 25,000 | | | | 855,298 | | |
| Brooks Automation, Inc.* | | | 531,911 | | | | 2,382,961 | | |
| Cognex Corp. | | | 20,000 | | | | 282,600 | | |
| Eclipsys Corp.* | | | 102,700 | | | | 1,826,006 | | |
Electro Scientific
Industries, Inc.* | | | 175,000 | | | | 1,956,500 | | |
| Entegris, Inc.* | | | 100,000 | | | | 272,000 | | |
| FSI International, Inc.* | | | 558,500 | | | | 228,985 | | |
| Intuit, Inc.* | | | 20,000 | | | | 563,200 | | |
| LogMeIn, Inc.* | | | 811 | | | | 12,976 | | |
| Mattson Technology, Inc.* | | | 91,000 | | | | 107,380 | | |
| MKS Instruments, Inc.* | | | 100,000 | | | | 1,319,000 | | |
| National Semiconductor Corp. | | | 180,000 | | | | 2,259,000 | | |
| Newport Corp.* | | | 237,600 | | | | 1,375,704 | | |
| Orbotech Ltd.* | | | 148,600 | | | | 1,285,390 | | |
| Parametric Technology Corp.* | | | 175,000 | | | | 2,045,750 | | |
| Quantel, SA | | | 20,905 | | | | 101,166 | | |
| Seagate Technology | | | 200,000 | | | | 2,092,000 | | |
| Semitool, Inc.*† | | | 100,000 | | | | 462,000 | | |
| Super Micro Computer, Inc.* | | | 100,000 | | | | 766,000 | | |
| Vishay Intertechnology, Inc.*† | | | 100,000 | | | | 679,000 | | |
| Xyratex, Ltd.* | | | 33,900 | | | | 169,161 | | |
| | | | 23,279,327 | | |
| Telecommunications/Cable (10.6%) | |
| Airvana, Inc.*† | | | 350,000 | | | | 2,229,500 | | |
| Comcast Corp., Class A | | | 75,000 | | | | 1,086,750 | | |
| EMS Technologies, Inc.* | | | 124,800 | | | | 2,608,320 | | |
| IPG Photonics Corp.* | | | 35,000 | | | | 383,950 | | |
SoundBite
Communications, Inc.* | | | 100,000 | | | | 237,000 | | |
| ViaSat, Inc.* | | | 150,000 | | | | 3,846,000 | | |
| | | | 10,391,520 | | |
Total Common Stocks
(Cost $95,326,049) | | | | | | | 89,402,481 | | |
See accompanying notes to financial statements.
9
Needham Funds
Needham Growth Fund
Schedule of Investments (Continued)
June 30, 2009 (Unaudited)
| | | Shares | | Value | |
| Short-Term Investments (9.1%) | |
| Money Market Fund (9.1%) | |
Dreyfus Treasury Prime Cash
Management, 0.00%(a)
(Cost $8,945,152) | | | 8,945,152 | | | $ | 8,945,152 | | |
| Warrants (0.0%) | |
| Technology (0.0%) | |
Quantel, SA, Strike Price
10.00, Expires 6/30/10
(Cost $0) | | | 20,905 | | | | 4,545 | | |
Total Investments (99.8%)
(Cost $104,271,201) | | | | | 98,352,178 | | |
Total Securities Sold Short (-4.1%)
(Proceeds $3,446,238) | | | | | (4,021,575 | ) | |
Other Assets in Excess
of Liabilities (4.3%) | | | | | 4,217,000 | | |
| Net Assets (100.0%) | | | | $ | 98,547,603 | | |
(a) Rate disclosed is the seven day yield as of June 30, 2009.
* Non-income producing security.
† Security position is either entirely or partially held in a segregated account as collateral for securities sold short, aggregating a total market value of $4,202,816.
ADR American Depositary Receipt.
NV Naamloze Vennootschap (Dutch corporation)
SA Société Anonyme (French corporation)
SpA Società per Azìonì (Italian corporation)
See accompanying notes to financial statements.
10
Semiannual Report 2009
Needham Growth Fund
Schedule of Securities Sold Short
June 30, 2009 (Unaudited)
| | | Shares | | Value | |
| Securities Sold Short (-4.1%) | |
| Airline (-0.8%) | |
| Allegiant Travel Co.* | | | 20,000 | | | $ | 792,800 | | |
| Commercial Services (-0.4%) | |
| HMS Holdings Corp.* | | | 10,000 | | | | 407,200 | | |
| Financial Services (-1.2%) | |
| Stifel Financial Corp.* | | | 25,000 | | | | 1,202,250 | | |
| Healthcare Services (-0.5%) | |
Bio-Reference
Laboratories, Inc.* | | | 5,000 | | | | 158,050 | | |
Valeant Pharmaceuticals
International* | | | 10,000 | | | | 257,200 | | |
| | | | 415,250 | | |
| Retail (-0.8%) | |
| Buffalo Wild Wings, Inc.* | | | 25,000 | | | | 813,000 | | |
| Technology (-0.3%) | |
Varian Semiconductor
Equipment Associates, Inc.* | | | 12,500 | | | | 299,875 | | |
| Telecommunications/Cable (-0.1%) | |
| Arris Group, Inc.* | | | 7,500 | | | | 91,200 | | |
Total Securities Sold Short
(Proceeds $3,446,238) | | | | | | | 4,021,575 | | |
| Total Securities Sold Short (-4.1%) | | | | | | | (4,021,575 | ) | |
| Total Investments (99.8%) | | | | | | | 98,352,178 | | |
Other Assets in Excess
of Liabilities (4.3%) | | | | | | | 4,217,000 | | |
| Net Assets (100.0%) | | | | | | $ | 98,547,603 | | |
* Non-income producing security.
See accompanying notes to financial statements.
11
Needham Funds
Needham Aggressive Growth Fund
Schedule of Investments
June 30, 2009 (Unaudited)
| | | Shares | | Value | |
| Common Stocks (66.2%) | |
| Business Services (8.6%) | |
| Dice Holdings, Inc.* | | | 17,300 | | | $ | 80,445 | | |
| Iconix Brand Group, Inc.* | | | 15,000 | | | | 230,700 | | |
| Iron Mountain, Inc.*† | | | 20,000 | | | | 575,000 | | |
| Resources Connection, Inc.*† | | | 21,250 | | | | 364,862 | | |
| | | | 1,251,007 | | |
| Consumer Services (7.1%) | |
| CarMax, Inc.* | | | 15,000 | | | | 220,500 | | |
| Dick's Sporting Goods, Inc.*† | | | 21,500 | | | | 369,800 | | |
| Luxottica Group SpA - ADR* | | | 12,500 | | | | 259,750 | | |
| Morton's Restaurant Group* | | | 45,000 | | | | 135,000 | | |
| Whole Foods Market, Inc. | | | 2,500 | | | | 47,450 | | |
| | | | 1,032,500 | | |
| Financial Services (1.4%) | |
| FCStone Group, Inc.* | | | 35,000 | | | | 138,250 | | |
| Morgan Stanley | | | 2,000 | | | | 57,020 | | |
Oppenheimer Holdings,
Inc., Class A | | | 300 | | | | 6,351 | | |
| | | | 201,621 | | |
| Healthcare Services (27.0%) | |
| Abaxis, Inc.* | | | 2,000 | | | | 41,080 | | |
Alliance HealthCare
Services, Inc.* | | | 10,000 | | | | 73,300 | | |
| Becton, Dickinson & Co. | | | 2,500 | | | | 178,275 | | |
| Cardiac Science Corp.* | | | 30,000 | | | | 120,600 | | |
| CONMED Corp.* | | | 5,000 | | | | 77,600 | | |
| Express Scripts, Inc.*† | | | 9,000 | | | | 618,750 | | |
| Gentiva Health Services, Inc.* | | | 3,000 | | | | 49,380 | | |
| Gilead Sciences, Inc.* | | | 15,000 | | | | 702,600 | | |
| LeMaitre Vascular, Inc.*† | | | 85,700 | | | | 270,812 | | |
| Masimo Corp.* | | | 12,500 | | | | 301,375 | | |
| Natus Medical, Inc.* | | | 10,000 | | | | 115,400 | | |
| Omnicell, Inc.* | | | 18,700 | | | | 201,025 | | |
Palomar Medical
Technologies, Inc.* | | | 7,500 | | | | 109,950 | | |
| Solta Medical, Inc.* | | | 150,000 | | | | 234,000 | | |
| TomoTherapy, Inc.* | | | 20,000 | | | | 55,000 | | |
| Varian Medical Systems, Inc.* | | | 15,000 | | | | 527,100 | | |
| Volcano Corp.* | | | 18,000 | | | | 251,640 | | |
| | | | 3,927,887 | | |
| Industrial (3.2%) | |
| Precision Castparts Corp. | | | 6,000 | | | | 438,180 | | |
| Quixote Corp.* | | | 7,538 | | | | 21,333 | | |
| | | | 459,513 | | |
| Software (1.7%) | |
| Actuate Corp.*† | | | 50,000 | | | | 239,000 | | |
| | | Shares | | Value | |
| Common Stocks — Continued | |
| Technology (11.4%) | |
| Apple, Inc.* † | | | 3,000 | | | $ | 427,290 | | |
| Autodesk, Inc.*† | | | 10,000 | | | | 189,800 | | |
| Brooks Automation, Inc.* | | | 40,000 | | | | 179,200 | | |
| Daktronics, Inc. | | | 5,000 | | | | 38,500 | | |
| Eclipsys Corp.* | | | 20,530 | | | | 365,023 | | |
| Linear Technology Corp. | | | 2,500 | | | | 58,375 | | |
| LogMeIn, Inc.* | | | 119 | | | | 1,904 | | |
| Mattson Technology, Inc.* | | | 9,000 | | | | 10,620 | | |
| Parametric Technology Corp.* | | | 25,000 | | | | 292,250 | | |
| Quantel, SA | | | 10,210 | | | | 49,410 | | |
| Super Micro Computer, Inc.* | | | 5,000 | | | | 38,300 | | |
| | | | 1,650,672 | | |
| Telecommunications/Cable (5.8%) | |
| Airvana, Inc.*† | | | 50,000 | | | | 318,500 | | |
| Powerwave Technologies, Inc.* | | | 90,000 | | | | 144,900 | | |
| ViaSat, Inc.* | | | 15,000 | | | | 384,600 | | |
| | | | 848,000 | | |
Total Common Stocks
(Cost $7,682,718) | | | | | | | 9,610,200 | | |
| Exchange Traded Funds (1.6%) | |
PowerShares QQQ
(Cost $229,895) | | | 6,500 | | | | 236,470 | | |
| Short-Term Investments (31.5%) | |
| Money Market Fund (31.5%) | |
Dreyfus Treasury Prime Cash
Management, 0.00%(a)
(Cost $4,574,119) | | | 4,574,119 | | | | 4,574,119 | | |
| Warrants (0.0%) | |
| Technology (0.0%) | |
Quantel, SA, Strike Price
10.00, Expires 6/30/10
(Cost $0) | | | 10,210 | | | | 2,220 | | |
Total Investments (99.3%)
(Cost $12,486,732) | | | | | | | 14,423,009 | | |
Total Securities Sold Short (-0.7%)
(Proceeds $93,431) | | | | | | | (105,580 | ) | |
Other Assets in Excess
of Liabilities (1.4%) | | | | | | | 207,868 | | |
| Net Assets (100.0%) | | | | | | $ | 14,525,297 | | |
(a) Rate disclosed is the seven day yield as of June 30, 2009.
* Non-income producing security.
† Security position is either entirely or partially held in a segregated account as collateral for securities sold short, aggregating a total market value of $1,886,441.
ADR American Depositary Receipt.
SA Société Anonyme (French corporation)
SpA Società per Azìonì (Italian corporation)
See accompanying notes to financial statements.
12
Semiannual Report 2009
Needham Aggressive Growth Fund
Schedule of Securities Sold Short
June 30, 2009 (Unaudited)
| | | Shares | | Value | |
| Securities Sold Short (-0.7%) | |
| Healthcare Services (-0.3%) | |
Valeant Pharmaceuticals
International* | | | 2,000 | | | $ | 51,440 | | |
| Technology (-0.4%) | |
| DTS, Inc.* | | | 2,000 | | | | 54,140 | | |
Total Securities Sold Short
(Proceeds $93,431) | | | | | 105,580 | | |
| Total Securities Sold Short (-0.7%) | | | | | (105,580 | ) | |
| Total Investments (99.3%) | | | | | 14,423,009 | | |
Other Assets in Excess
of Liabilities (1.4%) | | | | | 207,868 | | |
| Net Assets (100.0%) | | | | $ | 14,525,297 | | |
* Non-income producing security.
See accompanying notes to financial statements.
13
Needham Funds
Needham Small Cap Growth Fund
Schedule of Investments
June 30, 2009 (Unaudited)
| | | Shares | | Value | |
| Common Stocks (62.3%) | |
| Defense (4.5%) | |
| ICx Technologies Inc.* | | | 35,000 | | | $ | 210,000 | | |
| iRobot Corp.*† | | | 15,000 | | | | 194,700 | | |
| | | | 404,700 | | |
| Healthcare Services (13.9%) | |
Alliance HealthCare
Services, Inc.*† | | | 15,000 | | | | 109,950 | | |
| Cardiac Science Corp.*† | | | 15,000 | | | | 60,300 | | |
| CONMED Corp.*† | | | 15,000 | | | | 232,800 | | |
| Express Scripts, Inc.*† | | | 4,000 | | | | 275,000 | | |
| Hologic, Inc.* | | | 5,000 | | | | 71,150 | | |
| Phase Forward, Inc.*† | | | 10,000 | | | | 151,100 | | |
| Solta Medical, Inc.*† | | | 42,000 | | | | 65,520 | | |
| TomoTherapy, Inc.*† | | | 40,000 | | | | 110,000 | | |
| Varian Medical Systems, Inc.* | | | 5,000 | | | | 175,700 | | |
| | | | 1,251,520 | | |
| Oil & Gas — Exploration & Production (4.4%) | |
| ATP Oil & Gas Corp.*† | | | 10,000 | | | | 69,600 | | |
| BPZ Resources, Inc.* | | | 15,000 | | | | 73,350 | | |
| Carrizo Oil & Gas, Inc.* | | | 5,000 | | | | 85,750 | | |
| Compton Petroleum Corp.* | | | 75,000 | | | | 87,750 | | |
| GMX Resources, Inc.* | | | 7,500 | | | | 79,800 | | |
| | | | 396,250 | | |
| Software (2.4%) | |
| Aspen Technology, Inc.*† | | | 20,000 | | | | 170,600 | | |
| PDF Solutions, Inc.*† | | | 20,000 | | | | 51,000 | | |
| | | | 221,600 | | |
| Technology (23.6%) | |
| 3Com Corp.* | | | 15,000 | | | | 70,650 | | |
| ATMI, Inc.*† | | | 2,000 | | | | 31,060 | | |
| BigBand Networks, Inc.*† | | | 15,000 | | | | 77,550 | | |
| Brooks Automation, Inc.* | | | 20,000 | | | | 89,600 | | |
| Cognex Corp. | | | 14,000 | | | | 197,820 | | |
| Eclipsys Corp.*† | | | 10,270 | | | | 182,600 | | |
Electro Scientific
Industries, Inc.* | | | 5,000 | | | | 55,900 | | |
| Entegris, Inc.* | | | 50,000 | | | | 136,000 | | |
| Linear Technology Corp. | | | 2,500 | | | | 58,375 | | |
| LogMeIn, Inc.* | | | 70 | | | | 1,120 | | |
| Mattson Technology, Inc.* | | | 30,000 | | | | 35,400 | | |
| MKS Instruments, Inc.*† | | | 17,000 | | | | 224,230 | | |
| | | Shares | | Value | |
| Common Stocks — Continued | |
| Technology — Continued | |
| Netezza Corp.*† | | | 20,000 | | | $ | 166,400 | | |
| Newport Corp.* | | | 10,000 | | | | 57,900 | | |
| PLX Technology, Inc* | | | 30,000 | | | | 113,100 | | |
| Seagate Technology | | | 12,500 | | | | 130,750 | | |
| Semitool, Inc.*† | | | 31,000 | | | | 143,220 | | |
| STEC, Inc.*† | | | 5,000 | | | | 115,950 | | |
| Super Micro Computer, Inc.*† | | | 20,000 | | | | 153,200 | | |
| Xyratex, Ltd.*† | | | 15,900 | | | | 79,341 | | |
| | | | 2,120,166 | | |
| Telecommunications/Cable (13.5%) | |
| Acme Packet, Inc.* | | | 15,000 | | | | 151,800 | | |
| Airvana, Inc.*† | | | 30,000 | | | | 191,100 | | |
| Anaren, Inc.*† | | | 8,500 | | | | 150,280 | | |
| Aruba Networks, Inc.* | | | 25,000 | | | | 218,500 | | |
| EMS Technologies, Inc.* | | | 7,500 | | | | 156,750 | | |
| Harmonic, Inc.* | | | 10,000 | | | | 58,900 | | |
| IPG Photonics Corp.* | | | 10,000 | | | | 109,700 | | |
| Powerwave Technologies, Inc.* | | | 10,000 | | | | 16,100 | | |
SoundBite
Communications, Inc.*† | | | 40,000 | | | | 94,800 | | |
| ViaSat, Inc.*† | | | 2,500 | | | | 64,100 | | |
| | | | 1,212,030 | | |
Total Common Stocks
(Cost $4,456,675) | | | | | | | 5,606,266 | | |
| Short-Term Investments (32.8%) | |
| Money Market Fund (32.8%) | |
Dreyfus Treasury Prime Cash
Management, 0.00%(a)
(Cost $2,951,987) | | | 2,951,987 | | | | 2,951,987 | | |
Total Investments (95.1%)
(Cost $7,408,662) | | | | | | | 8,558,253 | | |
Total Securities Sold Short (-6.6%)
(Proceeds $555,555) | | | | | | | (589,700 | ) | |
Other Assets in Excess
of Liabilities (11.5%) | | | | | | | 1,032,911 | | |
| Net Assets (100.0%) | | | | | | $ | 9,001,464 | | |
(a) Rate disclosed is the seven day yield as of June 30, 2009.
* Non-income producing security.
† Security position is either entirely or partially held in a segregated account as collateral for securities sold short, aggregating a total market value of $2,800,458.
See accompanying notes to financial statements.
14
Semiannual Report 2009
Needham Small Cap Growth Fund
Schedule of Securities Sold Short
June 30, 2009 (Unaudited)
| | | Shares | | Value | |
| Securities Sold Short (-6.6%) | |
| Airline (-0.9%) | |
| Allegiant Travel Co.* | | | 2,000 | | | $ | 79,280 | | |
| Consumer Products (-1.6%) | |
| The Scotts Miracle-Gro Co. | | | 4,000 | | | | 140,200 | | |
| Financial Services (-0.5%) | |
| Stifel Financial Corp.* | | | 1,000 | | | | 48,090 | | |
| Healthcare Services (-0.4%) | |
| Bio-Reference Laboratories, Inc.* | | | 1,000 | | | | 31,610 | | |
| Retail (-0.7%) | |
| Buffalo Wild Wings, Inc.* | | | 2,000 | | | | 65,040 | | |
| Technology (-2.2%) | |
| DTS, Inc.* | | | 3,000 | | | | 81,210 | | |
Varian Semiconductor
Equipment Associates, Inc.* | | | 5,000 | | | | 119,950 | | |
| | | | 201,160 | | |
| Telecommunications/Cable (-0.3%) | |
| Arris Group, Inc.* | | | 2,000 | | | | 24,320 | | |
Total Securities Sold Short
(Proceeds $555,555) | | | | | | | 589,700 | | |
| Total Securities Sold Short (-6.6%) | | | | | | | (589,700 | ) | |
| Total Investments (95.1%) | | | | | | | 8,558,253 | | |
Other Assets in Excess
of Liabilities (11.5%) | | | | | | | 1,032,911 | | |
| Net Assets (100.0%) | | | | | | $ | 9,001,464 | | |
* Non-income producing security.
See accompanying notes to financial statements.
15
Needham Funds
Statements of Assets and Liabilities
June 30, 2009 (Unaudited)
| | | Needham
Growth Fund | | Needham
Aggressive
Growth Fund | | Needham
Small Cap
Growth Fund | |
| Assets | |
Investments, at Value (Cost $104,271,201, $12,486,732 and
$7,408,662, respectively) | | $ | 98,352,178 | | | $ | 14,423,009 | | | $ | 8,558,253 | | |
| Receivables: | |
| Deposit with Broker for Securities Sold Short | | | 4,729,931 | | | | 156,165 | | | | 566,388 | | |
| Dividends and Interest | | | 40,220 | | | | 160 | | | | 23 | | |
| Fund Shares Sold | | | 21,164 | | | | 95,556 | | | | 500,979 | | |
| Prepaid Expenses | | | 25,817 | | | | 14,201 | | | | 10,232 | | |
| Total Assets | | | 103,169,310 | | | | 14,689,091 | | | | 9,635,875 | | |
| Liabilities | |
Securities Sold Short, at Value (Proceeds $3,446,238,
$93,431 and $555,555, respectively) | | | 4,021,575 | | | | 105,580 | | | | 589,700 | | |
| Payables: | |
| Investment Securities Purchased | | | 12,976 | | | | 1,904 | | | | 1,120 | | |
| Fund Shares Redeemed | | | 334,728 | | | | — | | | | — | | |
| Due to Adviser | | | 102,783 | | | | 16,921 | | | | 6,672 | | |
| Distribution Fees | | | 20,557 | | | | 2,920 | | | | 1,747 | | |
| Directors' Fees | | | 8,249 | | | | 979 | | | | 561 | | |
| Chief Compliance Officer Fees | | | 15,423 | | | | 1,104 | | | | 654 | | |
| Accrued Expenses and Other Liabilities | | | 105,416 | | | | 34,386 | | | | 33,957 | | |
| Total Liabilities | | | 4,621,707 | | | | 163,794 | | | | 634,411 | | |
| Net Assets | | $ | 98,547,603 | | | $ | 14,525,297 | | | $ | 9,001,464 | | |
Shares Issued and Outstanding $.001 Par Value
(Authorized 800,000,000, 100,000,000 and 100,000,000,
respectively) | | | 4,169,539 | | | | 1,369,731 | | | | 1,007,781 | | |
| Net Asset Value, Offering and Redemption Price Per Share(a) | | $ | 23.64 | | | $ | 10.60 | | | $ | 8.93 | | |
| Components of Net Assets | |
| Paid-in Capital | | | 111,293,901 | | | | 12,767,573 | | | | 7,848,523 | | |
| Accumulated Net Investment Loss | | | (734,945 | ) | | | (131,374 | ) | | | (77,772 | ) | |
Accumulated Net Realized Gains (Losses) from Investment
Transactions, Securities Sold Short, Foreign Currency
Transactions, and Written Options | | | (5,516,993 | ) | | | (35,030 | ) | | | 115,267 | | |
Net Unrealized Appreciation (Depreciation) of Investment
Securities and Securities Sold Short | | | (6,494,360 | ) | | | 1,924,128 | | | | 1,115,446 | | |
| Total Net Assets | | $ | 98,547,603 | | | $ | 14,525,297 | | | $ | 9,001,464 | | |
(a) Subject to certain exceptions, a 2% redemption fee is imposed upon shares redeemed within 60 days of their purchase. See Note 2 of the notes to financial statements.
See accompanying notes to financial statements.
16
Semiannual Report 2009
Statements of Operations
For the Six Months Ended June 30, 2009 (Unaudited)
| | | Needham
Growth Fund | | Needham
Aggressive
Growth Fund | | Needham
Small Cap
Growth Fund | |
| Investment Income | |
| Dividends | | $ | 171,721 | | | $ | 3,210 | | | $ | 3,497 | | |
| Interest | | | 2,584 | | | | 973 | | | | 798 | | |
| Total Investment Income | | | 174,305 | | | | 4,183 | | | | 4,295 | | |
| Expenses | |
| Investment Advisory Fees | | | 559,143 | | | | 67,614 | | | | 39,701 | | |
| Distribution Fees | | | 111,828 | | | | 13,523 | | | | 7,940 | | |
| Administration and Accounting Fees | | | 35,882 | | | | 8,739 | | | | 6,880 | | |
| Chief Compliance Officer Fees | | | 15,438 | | | | 2,119 | | | | 1,124 | | |
| Audit Fees | | | 15,121 | | | | 15,121 | | | | 15,120 | | |
| Custodian Fees | | | 11,484 | | | | 1,822 | | | | 1,910 | | |
| Dividend Expense on Securities Sold Short | | | — | | | | — | | | | 625 | | |
| Interest Expense* | | | 14,817 | | | | 251 | | | | 1,818 | | |
| Legal Fees | | | 34,169 | | | | 7,881 | | | | 8,448 | | |
| Filing Fees | | | 11,909 | | | | 6,708 | | | | 5,978 | | |
| Transfer Agent Fees | | | 47,607 | | | | 10,211 | | | | 9,848 | | |
| Directors' Fees | | | 20,278 | | | | 2,287 | | | | 1,352 | | |
| Printing Fees | | | 32,512 | | | | 3,736 | | | | 2,515 | | |
| Other Expenses | | | 57,163 | | | | 5,879 | | | | 4,284 | | |
| Total Expenses | | | 967,351 | | | | 145,891 | | | | 107,543 | | |
| Fees Waived by Investment Adviser | | | (58,101 | ) | | | (10,334 | ) | | | (25,476 | ) | |
| Net Expenses | | | 909,250 | | | | 135,557 | | | | 82,067 | | |
| Net Investment Loss | | | (734,945 | ) | | | (131,374 | ) | | | (77,772 | ) | |
Net Realized/Unrealized Gain (Loss) from
Investment Securities, Securities Sold Short, Foreign
Currency Transactions and Written Options | |
| Net Realized Gain (Loss) from Investment Securities | | | (2,848,738 | ) | | | 98,579 | | | | 141,320 | | |
| Net Realized Gain (Loss) from Securities Sold Short | | | (28,454 | ) | | | 4,577 | | | | 4,330 | | |
| Net Realized Gain (Loss) from Foreign Currency Transactions | | | (1,377 | ) | | | 277 | | | | — | | |
| Net Realized Gain from Written Options | | | 70,275 | | | | 2,115 | | | | — | | |
Change in Unrealized Appreciation/Depreciation of
Investment Securities and Securities Sold Short | | | 17,623,996 | | | | 1,405,163 | | | | 1,177,704 | | |
Net Realized/Unrealized Gain (Loss) from
Investment Securities, Securities Sold Short, Foreign
Currency Transactions and Written Options | | | 14,815,702 | | | | 1,510,711 | | | | 1,323,354 | | |
| Change in Net Assets Resulting from Operations | | $ | 14,080,757 | | | $ | 1,379,337 | | | $ | 1,245,582 | | |
* Expense consists of interest expense on temporary borrowings and/or interest expense related to Securities Sold Short.
See accompanying notes to financial statements.
17
Needham Funds
Statements of Changes in Net Assets
| | | Needham Growth Fund | | Needham Aggressive
Growth Fund | | Needham
Small Cap
Growth Fund | |
| | | Six Months
Ended June 30,
2009
(Unaudited) | | Year Ended
December 31,
2008 | | Six Months
Ended June 30,
2009
(Unaudited) | | Year Ended
December 31,
2008 | | Six Months
Ended June 30,
2009
(Unaudited) | | Year Ended
December 31,
2008 | |
| Change in Net Assets | |
| Operations: | |
| Net Investment Loss | | $ | (734,945 | ) | | $ | (2,055,416 | ) | | $ | (131,374 | ) | | $ | (283,040 | ) | | $ | (77,772 | ) | | $ | (131,472 | ) | |
Net Realized Gain (Loss) from
Investment Securities, Securities
Sold Short, Foreign Currency
Transactions, and Written Options | | | (2,808,294 | ) | | | (1,031,882 | ) | | | 105,548 | | | | 55,219 | | | | 145,650 | | | | 33,520 | | |
Change in Unrealized Appreciation/
Depreciation on Investment
Securities and Securities Sold Short | | | 17,623,996 | | | | (69,741,872 | ) | | | 1,405,163 | | | | (4,436,033 | ) | | | 1,177,704 | | | | (1,564,399 | ) | |
Change in Net Assets Resulting
from Operations | | | 14,080,757 | | | | (72,829,170 | ) | | | 1,379,337 | | | | (4,663,854 | ) | | | 1,245,582 | | | | (1,662,351 | ) | |
| Distributions to Shareholders from: | |
| Long-term Gains | | | — | | | | (5,577,950 | ) | | | — | | | | (715,222 | ) | | | — | | | | (506,898 | ) | |
| Return of Capital | | | — | | | | — | | | | — | | | | — | | | | — | | | | (107,987 | ) | |
| Total Distributions to Shareholders | | | — | | | | (5,577,950 | ) | | | — | | | | (715,222 | ) | | | — | | | | (614,885 | ) | |
| Capital Transactions: | |
| Shares Issued | | | 2,257,495 | | | | 9,876,082 | | | | 4,114,251 | | | | 1,426,700 | | | | 3,514,915 | | | | 1,300,515 | | |
Shares Issued in Reinvestment
of Distributions | | | — | | | | 5,390,946 | | | | — | | | | 714,754 | | | | — | | | | 604,759 | | |
| Shares Redeemed | | | (10,608,886 | ) | | | (53,438,178 | ) | | | (1,170,438 | ) | | | (7,077,777 | ) | | | (1,068,422 | ) | | | (2,044,919 | ) | |
Change in Net Assets from
Capital Transactions | | | (8,351,391 | ) | | | (38,171,150 | ) | | | 2,943,813 | | | | (4,936,323 | ) | | | 2,446,493 | | | | (139,645 | ) | |
| Change in Net Assets | | | 5,729,366 | | | | (116,578,270 | ) | | | 4,323,150 | | | | (10,315,399 | ) | | | 3,692,075 | | | | (2,416,881 | ) | |
| Net Assets | |
| Beginning of Period | | | 92,818,237 | | | | 209,396,507 | | | | 10,202,147 | | | | 20,517,546 | | | | 5,309,389 | | | | 7,726,270 | | |
| End of Period | | $ | 98,547,603 | | | $ | 92,818,237 | | | $ | 14,525,297 | | | $ | 10,202,147 | | | $ | 9,001,464 | | | $ | 5,309,389 | | |
| Accumulated Net Investment Loss | | $ | (734,945 | ) | | $ | — | | | $ | (131,374 | ) | | $ | — | | | $ | (77,772 | ) | | $ | — | | |
| Share Transactions: | |
| Number of Shares Issued | | | 110,881 | | | | 334,933 | | | | 411,625 | | | | 147,044 | | | | 440,355 | | | | 125,527 | | |
| Number of Shares Reinvested | | | — | | | | 262,845 | | | | — | | | | 76,444 | | | | — | | | | 82,618 | | |
| Number of Shares Redeemed | | | (521,012 | ) | | | (1,826,860 | ) | | | (121,950 | ) | | | (594,769 | ) | | | (129,971 | ) | | | (195,029 | ) | |
| Change in Shares | | | (410,131 | ) | | | (1,229,082 | ) | | | 289,675 | | | | (371,281 | ) | | | 310,384 | | | | 13,116 | | |
See accompanying notes to financial statements.
18
Semiannual Report 2009
Needham Growth Fund
Financial Highlights
(For a Share Outstanding | | Six Months
Ended
June 30, | | Year Ended December 31, | |
| Throughout each Period) | | 2009 | | 2008 | | 2007 | | 2006 | | 2005 | | 2004 | |
| | | | (Unaudited) | | | | | | | | | | | | | | | | | | | | | | |
| Net Asset Value, Beginning of Period | | $ | 20.27 | | | $ | 36.05 | | | $ | 39.01 | | | $ | 35.69 | | | $ | 31.17 | | | $ | 29.35 | | |
| Investment Operations | |
| Net Investment Income (Loss) | | | (0.17 | ) | | | (0.45 | ) | | | (0.25 | ) | | | 0.10 | | | | (0.38 | ) | | | (0.84 | ) | |
Net Realized and Unrealized Gains (Losses)
on Investments | | | 3.54 | | | | (14.10 | ) | | | 1.45 | | | | 6.29 | | | | 4.90 | | | | 2.62 | | |
| Total from Investment Operations | | | 3.37 | | | | (14.55 | ) | | | 1.20 | | | | 6.39 | | | | 4.52 | | | | 1.78 | | |
| Less Distributions | |
| Net Investment Income | | | — | | | | — | | | | (0.01 | ) | | | (0.09 | ) | | | — | | | | — | | |
| Net Realized Gains | | | — | | | | (1.23 | ) | | | (4.15 | ) | | | (3.00 | ) | | | — | | | | — | | |
| Total Distributions | | | — | | | | (1.23 | ) | | | (4.16 | ) | | | (3.09 | ) | | | — | | | | — | | |
| Contribution by Adviser | | | — | | | | — | | | | — | | | | 0.02 | (a) | | | — | | | | 0.04 | (b) | |
| Net Asset Value, End of Period | | $ | 23.64 | | | $ | 20.27 | | | $ | 36.05 | | | $ | 39.01 | | | $ | 35.69 | | | $ | 31.17 | | |
| Total Return | | | 16.63 | %(c) | | | (40.41 | )% | | | 3.09 | % | | | 18.05 | %(a) | | | 14.50 | % | | | 6.20 | %(b) | |
| Net Assets, End of Period (000's) | | $ | 98,548 | | | $ | 92,818 | | | $ | 209,397 | | | $ | 308,693 | | | $ | 204,624 | | | $ | 287,372 | | |
| Ratios/Supplemental Data | |
| Ratio of Net Expenses to Average Net Assets | | | 2.03 | %(d) | | | 2.04 | % | | | 1.86 | % | | | 1.79 | % | | | 1.94 | % | | | 2.21 | % | |
Ratio of Net Expenses to Average Net Assets
(excluding interest and dividend expense) | | | 2.00 | %(d) | | | 2.03 | % | | | 1.85 | % | | | 1.78 | % | | | 1.91 | % | | | 1.78 | % | |
Ratio of Net Expenses to Average Net Assets
(excluding waivers and reimbursement
of expenses) | | | 2.16 | %(d) | | | 2.04 | % | | | 1.86 | % | | | 1.79 | % | | | 1.94 | % | | | 2.21 | % | |
Ratio of Net Investment Income (Loss)
to Average Net Assets | | | (1.64 | )%(d) | | | (1.37 | )% | | | (0.61 | )% | | | 0.31 | % | | | (1.01 | )% | | | (1.51 | )% | |
Ratio of Net Investment Income (Loss)
to Average Net Assets (excluding waivers
and reimbursement of expenses) | | | (1.77 | )%(d) | | | (1.37 | )% | | | (0.61 | )% | | | 0.31 | % | | | (1.01 | )% | | | (1.51 | )% | |
| Portfolio Turnover Rate | | | 13 | %(c) | | | 41 | % | | | 41 | % | | | 48 | % | | | 16 | % | | | 15 | % | |
(a) In May 2006, the Adviser made a payment to the Growth Fund which increased the total return by 0.06%.
(b) In October 2004, the Adviser made a payment to the Growth Fund which increased the total return by 0.14%.
(c) Not annualized for periods less than one year.
(d) Annualized for periods less than one year.
See accompanying notes to financial statements.
19
Needham Funds
Needham Aggressive Growth Fund
Financial Highlights
(For a Share Outstanding | | Six Months
Ended
June 30, | | Year Ended December 31, | |
| Throughout each Period) | | 2009 | | 2008 | | 2007 | | 2006 | | 2005 | | 2004 | |
| | | | (Unaudited) | | | | | | | | | | | | | | | | | | | | | | |
| Net Asset Value, Beginning of Period | | $ | 9.45 | | | $ | 14.14 | | | $ | 13.96 | | | $ | 13.73 | | | $ | 12.85 | | | $ | 11.51 | | |
| Investment Operations | |
| Net Investment Loss | | | (0.11 | ) | | | (0.26 | ) | | | (0.16 | ) | | | (0.19 | ) | | | (0.26 | ) | | | (0.36 | ) | |
Net Realized and Unrealized Gains (Losses)
on Investments | | | 1.26 | | | | (3.65 | ) | | | 2.34 | | | | 1.83 | | | | 1.49 | | | | 1.70 | | |
| Total from Investment Operations | | | 1.15 | | | | (3.91 | ) | | | 2.18 | | | | 1.64 | | | | 1.23 | | | | 1.34 | | |
| Less Distributions | |
| Net Realized Gains | | | — | | | | (0.78 | ) | | | (2.00 | ) | | | (1.42 | ) | | | (0.35 | ) | | | — | | |
| Total Distributions | | | — | | | | (0.78 | ) | | | (2.00 | ) | | | (1.42 | ) | | | (0.35 | ) | | | — | | |
| Contribution by Adviser | | | — | | | | — | | | | — | | | | 0.01 | (a) | | | — | | | | — | | |
| Net Asset Value, End of Period | | $ | 10.60 | | | $ | 9.45 | | | $ | 14.14 | | | $ | 13.96 | | | $ | 13.73 | | | $ | 12.85 | | |
| Total Return | | | 12.28 | %(b) | | | (27.60 | )% | | | 15.58 | % | | | 12.22 | %(a) | | | 9.70 | % | | | 11.64 | % | |
| Net Assets, End of Period (000's) | | $ | 14,525 | | | $ | 10,202 | | | $ | 20,518 | | | $ | 18,051 | | | $ | 18,125 | | | $ | 17,000 | | |
| Ratios/Supplemental Data | |
| Ratio of Net Expenses to Average Net Assets | | | 2.50 | %(c) | | | 2.51 | % | | | 2.18 | % | | | 2.24 | % | | | 2.50 | % | | | 2.61 | % | |
Ratio of Net Expenses to Average Net Assets
(excluding interest and dividend expense) | | | 2.50 | %(c) | | | 2.50 | % | | | 2.18 | % | | | 2.23 | % | | | 2.50 | % | | | 2.50 | % | |
Ratio of Net Expenses to Average Net Assets
(excluding waivers and reimbursement
of expenses) | | | 2.69 | %(c) | | | 2.63 | % | | | 2.18 | % | | | 2.24 | % | | | 2.78 | % | | | 3.15 | % | |
Ratio of Net Investment Loss to
Average Net Assets | | | (2.42 | )%(c) | | | (2.04 | )% | | | (1.18 | )% | | | (1.35 | )% | | | (2.01 | )% | | | (2.25 | )% | |
Ratio of Net Investment Loss to
Average Net Assets (excluding waivers
and reimbursement of expenses) | | | (2.61 | )%(c) | | | (2.15 | )% | | | (1.18 | )% | | | (1.35 | )% | | | (2.29 | )% | | | (2.79 | )% | |
| Portfolio Turnover Rate | | | 51 | %(b) | | | 45 | % | | | 64 | % | | | 55 | % | | | 69 | % | | | 64 | % | |
(a) In May 2006, the Adviser made a payment to the Aggressive Growth Fund which increased the total return by 0.08%.
(b) Not annualized for periods less than one year.
(c) Annualized for periods less than one year.
See accompanying notes to financial statements.
20
Semiannual Report 2009
Needham Small Cap Growth Fund
Financial Highlights
(For a Share Outstanding | | Six Months
Ended
June 30, | | Year Ended December 31, | |
| Throughout each Period) | | 2009 | | 2008 | | 2007 | | 2006 | | 2005 | | 2004 | |
| | | | (Unaudited) | | | | | | | | | | | | | | | | | | | | | | |
| Net Asset Value, Beginning of Period | | $ | 7.61 | | | $ | 11.29 | | | $ | 14.32 | | | $ | 17.09 | | | $ | 18.53 | | | $ | 16.84 | | |
| Investment Operations | |
| Net Investment Loss | | | (0.09 | ) | | | (0.19 | ) | | | (0.26 | ) | | | (0.26 | ) | | | (0.31 | ) | | | (0.37 | ) | |
Net Realized and Unrealized Gains (Losses)
on Investments | | | 1.41 | | | | (2.49 | ) | | | (0.02 | ) | | | 1.61 | | | | 0.66 | | | | 2.11 | | |
| Total from Investment Operations | | | 1.32 | | | | (2.68 | ) | | | (0.28 | ) | | | 1.35 | | | | 0.35 | | | | 1.74 | | |
| Less Distributions | |
| Net Realized Gains | | | — | | | | (0.82 | ) | | | (2.75 | ) | | | (4.18 | ) | | | (1.79 | ) | | | (0.05 | ) | |
| Return of Capital | | | — | | | | (0.18 | ) | | | — | | | | — | | | | — | | | | — | | |
| Total Distributions | | | — | | | | (1.00 | ) | | | (2.75 | ) | | | (4.18 | ) | | | (1.79 | ) | | | (0.05 | ) | |
| Contribution by Adviser | | | — | | | | — | | | | — | | | | 0.06 | (a) | | | — | | | | — | | |
| Net Asset Value, End of Period | | $ | 8.93 | | | $ | 7.61 | | | $ | 11.29 | | | $ | 14.32 | | | $ | 17.09 | | | $ | 18.53 | | |
| Total Return | | | 17.35 | %(b) | | | (23.42 | )% | | | (2.01 | )% | | | 8.52 | %(a) | | | 2.01 | % | | | 10.34 | % | |
| Net Assets, End of Period (000's) | | $ | 9,001 | | | $ | 5,309 | | | $ | 7,726 | | | $ | 15,248 | | | $ | 18,789 | | | $ | 25,895 | | |
| Ratios/Supplemental Data | |
| Ratio of Net Expenses to Average Net Assets | | | 2.58 | %(c) | | | 2.51 | % | | | 2.50 | % | | | 2.36 | % | | | 2.44 | % | | | 2.52 | % | |
Ratio of Net Expenses to Average Net Assets
(excluding interest and dividend expense) | | | 2.50 | %(c) | | | 2.50 | % | | | 2.50 | % | | | 2.36 | % | | | 2.44 | % | | | 2.50 | % | |
Ratio of Net Expenses to Average Net Assets
(excluding waivers and reimbursement
of expenses) | | | 3.38 | %(c) | | | 3.57 | % | | | 2.64 | % | | | 2.36 | % | | | 2.58 | % | | | 2.63 | % | |
Ratio of Net Investment Loss to
Average Net Assets | | | (2.44 | )%(c) | | | (2.02 | )% | | | (1.54 | )% | | | (1.61 | )% | | | (1.64 | )% | | | (1.91 | )% | |
Ratio of Net Investment Loss to
Average Net Assets (excluding waivers
and reimbursement of expenses) | | | (3.24 | )%(c) | | | (3.09 | )% | | | (1.68 | )% | | | (1.61 | )% | | | (1.78 | )% | | | (2.02 | )% | |
| Portfolio Turnover Rate | | | 82 | %(b) | | | 219 | % | | | 38 | % | | | 115 | % | | | 104 | % | | | 68 | % | |
(a) In May 2006, the Adviser made a payment to the Small Cap Growth Fund which increased the total return by 0.35%.
(b) Not annualized for periods less than one year.
(c) Annualized for periods less than one year.
See accompanying notes to financial statements.
21
Needham Funds
Notes to Financial Statements
(Unaudited)
1. Organization
Needham Growth Fund ("NGF"), Needham Aggressive Growth Fund ("NAGF") and Needham Small Cap Growth Fund ("NSCGF") (each, a "Portfolio" and collectively, the "Portfolios"), are portfolios of The Needham Funds, Inc. (the "Fund"), which is registered under the Investment Company Act of 1940, as amended (the "1940 Act"), as a non-diversified, open-end management investment company. The Fund was organized as a Maryland corporation on October 12, 1995.
2. Significant Accounting Policies
The following is a summary of significant accounting policies followed by the Fund in the preparation of its financial statements. These policies are in conformity with accounting principles generally accepted in the United States of America ("GAAP").
Security Valuation: Investments in securities (including options) listed or traded on a nationally recognized securities exchange are valued at the last quoted sales price on the date the valuations are made. Portfolio securities and options positions for which market quotations are readily available are stated at the NASDAQ Official Closing Price or the last sale price reported by the principal exchange for each such security as of the exchange's close of business, as applicable. Securities and options for which no sale has taken place during the day and securities which are not listed on an exchange are valued at the mean of the current closing bid and asked prices. All other securities for which market prices are not readily available are valued at their fair value in accordance with Fair Value Procedures established by the Fund's Board of Director s (the "Board"). The Fund's Fair Value Procedures are implemented and monitored by a Valuation Committee (the "Committee") designated by the Board. When a security is valued in accordance with the Fair Value Procedures, the Committee determines a value after taking into consideration any relevant information that is reasonably available to the Committee. Some of the more common reasons that may necessitate that a security be valued pursuant to these Fair Value Procedures include, but are not limited to: the security's trading has been halted or suspended; the security has been de-listed from a national exchange; the security's primary trading market is temporarily closed at a time when under normal conditions it would be open; or the security's primary pricing source is not able or willing to provide a price. The assets of each Portfolio may also be valued on the basis of valuations provided by a pricing service approved by, or on behalf of, the Board.
Investment Transactions: Changes in holdings of portfolio securities for the Portfolios shall be reflected no later than in the first calculation on the first business day following the trade date for purposes of calculating each Portfolio's daily net asset value per share. However, for financial reporting purposes, portfolio security transactions are reported on the trade date of the last business day of the reporting period. The cost (proceeds) of investments sold (bought to cover) is determined on a specific identification basis for the purpose of determining gains or losses on sales and buys to cover short positions. Dividend income and distributions to shareholders are recorded on the ex-dividend date. Interest income is recorded on an accrual basis.
Foreign Currency: Foreign currency amounts are translated into U.S. dollars as follows: (i) assets and liabilities at the rate of exchange at the end of the respective period; and (ii) purchases and sales of securities and income and expenses at the rate of exchange prevailing on the dates of such transactions. The portion of the results of operations arising from changes in the exchange rates and the portion due to fluctuations arising from changes in the market prices of securities are not isolated. Such fluctuations are included with the net realized and unrealized gain or loss on investments. Principal risks associated with such transactions include the movement in value of the foreign currency relative to the U.S. dollar and the ability of the counterparty to perform.
The Portfolios may also invest in forward currency contracts. Fluctuations in the value of such forward currency transactions are recorded daily as unrealized gain or loss; realized gain or loss includes net gain or loss on transactions that have terminated by settlement or by the Fund entering into offsetting commitments. These instruments involve market risk, credit risk, or both kinds of risks, in excess of the amount recognized in the statement of assets and liabilities. Risks arise from the possible inability of counterparties to meet the terms of their contracts and from movement in currency and securities values and interest rates. There were no open forward currency contracts entered into by the Portfolios for the six months ended June 30, 2009.
Allocation of Expenses: Expenses directly attributable to a Portfolio are charged directly to that Portfolio, while expenses which are attributable to more than one Portfolio are allocated among the respective Portfolios based upon relative net assets or some other reasonable method.
Use of Estimates: The preparation of financial statements in accordance with GAAP requires management to make estimates and assumptions that affect the reported amounts and disclosures in the financial statements. Actual results could differ from those estimates and those differences could be material.
Distributions to Shareholders: Dividends from net investment income, if any, are declared and paid annually for the Portfolios. Distributable net realized gains, if any, are declared and distributed at least annually.
Redemption Fees: The Portfolios reserve the right to assess a redemption fee for shares redeemed within 60 days of purchase. The shareholder will be charged a fee equal to 2.00% of the value of the shares redeemed. The redemption fee is intended to offset excess brokerage commissions and
22
Semiannual Report 2009
Notes to Financial Statements (Continued)
(Unaudited)
other costs associated with fluctuations in asset levels and cash flows caused by frequent trading by shareholders. The applicability of the redemption fee will be calculated using a first-in first-out method, which means the oldest shares will be redeemed first, followed by the redemption of more recently acquired shares. For the six months ended June 30, 2009, NGF, NAGF and NSCGF had contributions to capital due to redemption fees in the amounts of $695, $2,975 and $1,249, respectively.
Federal Income Taxes: It is the policy of each Portfolio to continue to qualify as a regulated investment company by complying with the provisions available to certain investment companies, as defined in applicable sections of the Internal Revenue Code, and to make distributions of net investment income and net realized capital gains sufficient to relieve it from all, or substantially all, federal income taxes. Accordingly, no provision for income taxes has been made in the Fund's financial statements.
The Financial Accounting Standards Board ("FASB") Interpretation No. 48, "Accounting for Uncertainty in Income Taxes" ("FIN 48") requires the affirmative evaluation of tax positions taken or expected to be taken in the course of preparing the Fund's tax returns to determine whether it is more-likely-than-not (i.e., greater than 50-percent) that each tax position will be sustained upon examination by a taxing authority based on the technical merits of the position. Tax positions not deemed to meet the more-likely-than-not threshold and that would result in a tax benefit or expense to the Fund would be recorded as a tax benefit or expense in the current period. Differences between tax positions taken in a tax return and amounts recognized in the financial statements will generally result in an increase in a liability for taxes payable (or a reduction of a tax refund receivable), including the recognition of any related interest an d penalties as an operating expense. The Fund has not recognized any tax liability for unrecognized tax benefits in connection with the adoption of FIN 48. A reconciliation is not provided herein, as the beginning and ending amounts of unrecognized benefits are zero, with no interim additions, reductions, or settlements. Tax periods (i.e., the last three tax year ends and the interim tax period since then, as applicable) remain subject to examination by tax authorities.
Fair Value Measurements: Statement of Financial Accounting Standards No. 157, "Fair Value Measurements" ("SFAS No. 157") establishes a single authoritative definition of fair value. This standard sets out a framework for measuring fair value based on inputs used to value the Portfolios' investments, and requires additional disclosures about fair value measurements. SFAS No. 157 applies to fair value measurements already required or permitted by existing standards.
One key component of the implementation of SFAS No. 157 includes the development of a three-tier fair value hierarchy. The basis of the tiers is dependent upon the various "inputs" used to determine the value of the Portfolios' investments. These inputs are summarized in the three broad levels listed below:
Level 1 — quoted prices in active markets for identical assets.
Level 2 — other significant inputs (including quoted prices of similar securities, interest rates, prepayment speeds, credit risk, etc.).
Level 3 — significant unobservable inputs (which may include the Portfolios' own assumptions in determining the fair value of investments).
The inputs or methodology used to value securities are not necessarily an indication of the risk associated with investing in those securities.
Effective June 15, 2009, the Fund adopted FSP No. FAS 157-4, "Determining Fair Value When the Volume and Level of Activity for the Asset or Liability Have Significantly Decreased and Identifying Transactions That Are Not Orderly" ("FSP FAS 157-4"). FSP FAS 157-4 provides guidance on estimating fair value when market activity has decreased and on identifying transactions that are not orderly. Additionally, entities are required to disclose in interim and annual periods the inputs and valuation techniques u sed to measure fair value. In accordance with FSP FAS 157-4, the Fund has included additional disclosures on fair value measurements below.
The following is a summary categorization, as of June 30, 2009, of each Portfolio's investments based on the level of inputs utilized in determining the value of such investments:
| | | Level 1 - Quoted Prices(1) | |
| | | Investment Securities | |
| | | Assets | | Liabilities(2) | |
| NGF | | $ | 98,352,178 | | | $ | (4,021,575 | ) | |
| NAGF | | | 14,423,009 | | | | (105,580 | ) | |
| NSCGF | | | 8,558,253 | | | | (589,700 | ) | |
(1) In accordance with the adoption of FSP 157-4, the amounts disclosed in Level 1 are Equity Securities, Warrants and Short-Term Investments. Refer to the Schedule of Investments and Schedule of Securities Sold Short for the breakout of each security by industry type.
(2) Liabilities consist of securities sold short.
3. Derivative Instruments and Hedging Activities
Effective for the six months ending June 30, 2009, the Fund adopted the provisions of Statement of Financial Accounting Standards No. 161, "Disclosures about Derivative Instruments and Hedging Activities" ("SFAS No. 161"). SFAS No. 161 is effective for fiscal years and interim periods beginning after November 15, 2008. SFAS No. 161 requires enhanced disclosures about each Portfolio's derivative and hedging activities, including how such activities are accounted for and their effect on the Portfolio's financial position, performance and cash flows. In accordance with SFAS 161, the Portfolios have included disclosures related to derivative activities for the six months ended June 30, 2009, consisting of written options, in Note 8.
23
Needham Funds
Notes to Financial Statements (Continued)
(Unaudited)
4. Investment Advisory and Administrative Services
The Fund has engaged Needham Investment Management L.L.C. (the "Adviser") to manage its investments. The Fund pays the Adviser a fee at the annual rate of 1.25% of the average daily net assets of each Portfolio.
The Adviser has entered into agreements with the Portfolios whereby the Adviser has contractually agreed to waive its fee for, and to reimburse expenses (excluding interest, dividend on short positions, acquired fund fees and expenses and extraordinary items) of, (i) NGF in an amount that limits annual operating expenses to not more than 2.00% of the average daily net assets of NGF and (ii) NAGF and NSCGF in an amount that limits annual operating expenses to not more than 2.50% of the average daily net assets of each of NAGF and NSCGF. The agreement with respect to NGF is effective for the period from January 1, 2009 through December 31, 2009. The agreement with respect to NAGF and NSCGF is effective for the period from January 1, 2009 through December 31, 2009 and shall continue in effect from year to year thereafter only upon mutual agreement of the Portfolios and the Adviser.
For the six months ended June 30, 2009, the Adviser waived advisory fees in the amount of $58,101 for NGF, $10,334 for NAGF and $25,476 for NSCGF.
The Fund and Citi Fund Services Ohio, Inc. (the "Administrator") are parties to a Master Services Agreement. The Administrator provides administrative and fund accounting services pursuant to this agreement and, in consideration of these services, receives a fee computed daily and paid monthly at an annual rate equal to 0.07% of the first $750 million of the average daily net assets of the Portfolios, and 0.065% of the average daily net assets of the Portfolios in excess of $750 million. The Administrator also provides transfer agent and other services pursuant to this agreement for additional fees.
Certain officers of the Fund are also officers of the Adviser and/or Needham & Company, LLC (the "Distributor"). Such officers receive no fees from the Fund for serving as officers of the Fund. Each of the three Independent Directors receives a quarterly retainer of $3,000 and a per-meeting fee of $500. Each Independent Director is also a member of the Board's Audit Committee and receives a fee of $500 per meeting attended. The Adviser provides an employee to serve as Chief Compliance Officer for the Fund and to provide certain related services.
5. Distribution Plan
The Fund has adopted a Distribution Plan pursuant to Rule 12b-1 under the 1940 Act. Under the plan, each Portfolio pays the Distributor and any other distributor or financial institution with which the Fund has an agreement with respect to each Portfolio, a fee at an annual rate of 0.25% of each Portfolio's daily average net assets. For the six months ended June 30, 2009, NGF, NAGF and NSCGF incurred distribution fees in the amount of $111,828, $13,523 and $7,940, respectively. For the six months ended June 30, 2009, NGF, NAGF and NSCGF each paid 12b-1 fees to the Distributor in the amount of $28,965, $6,966 and $2,492, respectively.
During the six months ended June 30, 2009, NGF, NAGF and NSCGF each incurred and paid brokerage commissions to the Distributor in the amount of $11,097, $3,665 and $1,069, respectively.
6. Temporary Borrowings
The Fund has entered into an agreement with Custodial Trust Company ("CTC") for temporary borrowing purposes, including the meeting of redemption requests that otherwise might require the untimely disposition of securities. Interest is calculated daily based on the Federal Funds Rate plus one percent. Each Portfolio may borrow from banks up to 25% of its total assets and may pledge its assets in connection with these borrowings, provided that no additional investments shall be made while borrowings exceed 5% of total assets.
There were no borrowings by the Portfolios for the six months ended June 30, 2009.
7. Repurchase Agreements
The Portfolios will only enter into repurchase agreements where (i) the underlying securities are of the type which the Portfolio's investment policies would allow the Portfolio to purchase directly, (ii) the market value of the underlying security, including accrued interest, will at all times be equal to or exceed the fair or market value of the repurchase agreement, and (iii) payment for the underlying securities is made only upon physical delivery or evidence of book-entry transfer to the account of the custodian or a bank acting as agent. A Portfolio will not enter into a repurchase agreement with a maturity of more than seven business days if, as a result, more than 15% of the value of its net assets would then be invested in such repurchase agreements and other illiquid securities.
The repurchase price generally equals the price paid by the Portfolio plus interest negotiated on the basis of current short-term rates, which may be more or less than the rate on the underlying portfolio securities. Repurchase agreements will be fully collateralized at all times.
There were no repurchase agreement transactions by the Portfolios for the six months ended June 30, 2009.
8. Option Transactions
Each Portfolio may invest in options contracts to reduce its exposure to fluctuations in the prices of portfolio securities and to prevent losses if the prices of such securities decline. Similarly, such investments may protect a Portfolio against fluctuations in the value of securities in which the Portfolio is about to invest.
The Portfolios may write call and put options on securities they own or have the right to acquire, and may purchase put and call options on individual securities and indices written
24
Semiannual Report 2009
Notes to Financial Statements (Continued)
(Unaudited)
by others. Put and call options give the holder the right to sell or purchase, respectively, a specified amount of a security at a specified price on or before a certain date.
The Portfolios are subject to market risk associated with changes in the value of the underlying financial instrument, as well as the risk of loss of appreciation if a counterparty fails to perform. For exchange-traded contracts, the exchange acts as the counterparty to specific transactions, and therefore bears the risk of delivery to and from counterparties of specific positions.
Put and call options purchased are accounted for in the same manner as portfolio securities. The cost of securities acquired through the exercise of call options is increased by the premium paid. The proceeds from securities sold through the exercise of put options are decreased by the premiums paid. Options on stock indices differ from options on securities in that the exercise of an option on a stock index does not involve delivery of the actual underlying security and is settled in cash only.
When a Portfolio writes an option, the premium received by the Portfolio is recorded as a liability and is subsequently adjusted to the current market value of the option written. Premiums received from writing options which have expired are recorded by the Portfolio on the expiration date as realized gains from option transactions. When a Portfolio enters into a closing purchase transaction, the Portfolio realizes a gain or loss equal to the difference between the cost of a closing purchase transaction and the premium received when the option was written. If a written call option is exercised, the premium received is added to the proceeds from the sale of the underlying security in determining whether the Portfolio has a realized gain or loss. If a written put option is exercised, the premium received reduces the cost basis of the securities purchased. In writing an option, the Portfolio bears the market risk of an unfavorable change in the price of the security underlying the written option.
In the normal course of business, certain Portfolios may trade and hold certain fair-valued derivative contracts which constitute guarantees under FASB Interpretation No. 45 "Guarantors' Accounting and Disclosure Requirements for Guarantees, Including Indirect Guarantees of Indebtedness of Others." Such contracts include written put and call options, where the Portfolio would be obligated to purchase or sell a specified security at a specified price if the option is exercised by the counterparty. The maximum payout for the written put option contracts is limited to the number of contracts written and the related strike prices, respectively. The maximum payout for the written call option contracts is limited only by how high the underlying securities strike price rises. Maximum payout amounts could be offset by the subsequent sale, if any, of assets obtained via the execution of a payout event. At June 30, 2009, the Portfolios ha d no maximum payout amounts relating to written put or call option contracts.
Written option activity for the six months ended June 30, 2009 was as follows:
| NGF | | Number of
Options | | Amount of
Proceeds | |
Options outstanding at
December 31, 2008 | | | — | | | $ | — | | |
| Options written | | | (630 | ) | | | (70,275 | ) | |
| Options expired | | | 630 | | | | 70,275 | | |
Options outstanding at
June 30, 2009 | | | — | | | $ | — | | |
| NAGF | | Number of
Options | | Amount of
Proceeds | |
Options outstanding at
December 31, 2008 | | | — | | | $ | — | | |
| Options written | | | (18 | ) | | | (2,115 | ) | |
| Options expired | | | 18 | | | | 2,115 | | |
Options outstanding at
June 30, 2009 | | | — | | | $ | — | | |
NSCGF did not have written options for the six months ended June 30, 2009.
9. Short Sale Transactions
During the six months ended June 30, 2009, each Portfolio sold securities short. Upon selling a security short, the Portfolios record a receivable for the settlement amount and a corresponding liability, which is marked-to-market to reflect current value. Certain securities owned by each respective Portfolio are segregated as collateral while the short sales are outstanding. At June 30, 2009, the market value of securities separately segregated to cover short positions was $4,202,816, $1,886,441 and $2,800,458 for NGF, NAGF and NSCGF, respectively. Additionally, included in Deposit with Broker for Securities Sold Short are $4,729,931, $156,165 and $566,388 pledged as collateral with brokers in connection with open short positions for NGF, NAGF and NSCGF, respectively. Securities sold short at June 30, 2009 and their related market values and proceeds are set forth in the preceding Schedule of Securities Sold Short.
10. Investment Transactions
The following summarizes the aggregate amount of purchases and sales of investment securities and securities sold short, excluding short-term securities, during the six months ended June 30, 2009:
| | | Purchases | | Sales | |
| NGF | | $ | 10,014,818 | | | $ | 21,448,413 | | |
| NAGF | | | 5,204,333 | | | | 3,797,845 | | |
| NSCGF | | | 3,583,846 | | | | 2,603,873 | | |
25
Needham Funds
Notes to Financial Statements (Continued)
(Unaudited)
11. Financial Instruments With Off-Balance Sheet Risk
In the normal course of their business, the Portfolios may trade various financial instruments with off-balance sheet risk. These financial instruments include written options, futures, and forward currency contracts. Generally, these financial instruments represent future commitments to purchase or sell other financial instruments at specific terms at specified future dates. Each of these financial instruments contains varying degrees of off-balance sheet risk whereby changes in the market values of the securities underlying the financial instruments may be in excess of the amounts recognized in the financial statements.
Securities sold short represent obligations of the Portfolios to make future delivery of specific securities and, correspondingly, create an obligation to purchase the securities at market prices prevailing at a later delivery date (or to deliver the securities if already owned by the Portfolios). As a result, short sales create the risk that the Portfolios' ultimate obligation to satisfy the delivery requirements may exceed the amount of the proceeds initially received on the liability recorded in the financial statements.
12. Indemnification
Under the Fund's organizational documents, its officers and directors are indemnified against certain liabilities arising out of the performance of their duties to the Fund. In addition, in the ordinary course of business, the Fund enters into contracts that contain a variety of indemnifications. The Fund's maximum exposure under these arrangements is unknown. However, the Fund has not had prior claims or losses pursuant to these contracts and expects the risk of loss to be remote.
13. Federal Income Taxes
No provision for federal income taxes is required since the Fund intends to continue to qualify as a regulated investment company under Subchapter M of the Internal Revenue Code and distribute substantially all of its taxable income and capital gains to shareholders. Because income tax regulations differ from GAAP, the timing and character of income and capital gain distributions determined in accordance with tax regulations can differ from income and capital gains recognized for financial reporting purposes. Accordingly, the character of distributions and the composition of net assets for tax purposes can differ from those reflected in the financial statements. These book/tax differences may be temporary or permanent in nature. Temporary differences are generally due to differing book and tax treatment for the timing of the recognition of gains and losses of securities, including post-October losses (as defined below). Permanen t differences are generally due to differing treatment of net investment losses. To the extent these differences are permanent, they are charged or credited to paid-in capital, accumulated net realized gain (loss), or accumulated net investment income (loss), as appropriate, in the period in which the differences arise. These reclassifications have no effect on net assets or net asset value per share of each Portfolio.
As of June 30, 2009, the cost, gross unrealized appreciation, gross unrealized depreciation, and the net unrealized appreciation (depreciation) on securities, including proceeds from securities sold short for federal income tax purposes, were as follows:
| | | Cost | | Gross
Unrealized
Appreciation | | Gross
Unrealized
Depreciation | | Net
Unrealized
Appreciation
(Depreciation) | |
| NGF | | $ | 100,923,345 | | | $ | 18,597,403 | | | $ | (25,190,145 | ) | | $ | (6,592,742 | ) | |
| NAGF | | | 12,393,301 | | | | 2,502,815 | | | | (578,687 | ) | | | 1,924,128 | | |
| NSCGF | | | 6,858,501 | | | | 1,270,410 | | | | (160,358 | ) | | | 1,110,052 | | |
As of December 31, 2008, the components of distributable earnings (loss) on a tax basis were as follows:
| | | NGF | | NAGF | | NSCGF | |
Accumulated capital
and other losses | | $ | (2,610,317 | ) | | $ | (140,578 | ) | | $ | (23,439 | ) | |
Unrealized appreciation
(depreciation) | | | (24,216,738 | ) | | | 518,965 | | | | (69,202 | ) | |
Total accumulated
earnings (loss) | | $ | (26,827,055 | ) | | $ | 378,387 | | | $ | (92,641 | ) | |
The tax character of distributions paid during the year ended December 31, 2008 was as follows:
| | | NGF | | NAGF | | NSCGF | |
Net long-term capital
gains | | $ | 5,577,950 | | | $ | 715,222 | | | $ | 506,898 | | |
| Return of capital | | | — | | | | — | | | | 107,987 | | |
| Total distributions paid | | $ | 5,577,950 | | | $ | 715,222 | | | $ | 614,885 | | |
Under current tax law, capital losses realized after October 31 of a Portfolio's fiscal year may be deferred and treated as occurring on the first business day of the following fiscal year for tax purposes. The following Portfolios had deferred post October capital losses, which will be treated as arising on the first business day of the fiscal year ending December 31, 2009.
| | | Post-October Loss | |
| NGF | | $ | 622,669 | | |
| NAGF | | | 140,578 | | |
| NSCGF | | | 23,439 | | |
As of December 31, 2008, NGF had capital loss carryforwards, which are available to offset future realized gains of $1,987,648, expiring in 2016.
14. Other Matters
In October 2004, the Adviser made a capital contribution to NGF of $417,668. In May 2006, the Adviser made a capital contribution to NGF of $170,390, to NAGF of $9,265 and to NSCGF of $64,404.
26
Semiannual Report 2009
Supplemental Data (Unaudited)
Disclosure of Portfolio Holdings
The Fund files a Form N-Q with the Securities and Exchange Commission (the "SEC") no more than sixty days after the Fund's first and third fiscal quarters. For the Fund, these are the fiscal quarters ending March 31 and September 30. Form N-Q includes a complete schedule of the Fund's portfolio holdings as of the end of those fiscal quarters. The Fund's N-Q filings can be found free of charge on the SEC's website at http://www.sec.gov, or they may be reviewed and copied at the SEC's Public Reference Room in Washington, D.C. (call 800-SEC-0330 for information on the operation of the Public Reference Room).
Voting Proxies on Fund Portfolio Securities
A description of the policies and procedures that the Fund uses to determine how to vote proxies relating to portfolio securities and information regarding how the Fund voted proxies relating to portfolio securities during the most recent 12-month period ended June 30 are available without charge, upon request, by calling 800-625-7071 or on the SEC's website at http://www.sec.gov.
Directors and Officers
Information pertaining to the Directors and Officers of the Fund is available in the Statement of Additional Information, a copy of which is available without charge, upon request, by calling 800-625-7071.
27
[THIS PAGE INTENTIONALLY LEFT BLANK]

445 Park Avenue
New York, New York 10022-2606
1-800-625-7071
Investment Adviser:
Needham Investment Management L.L.C.
445 Park Avenue
New York, NY 10022-2606
President
George A. Needham
Executive Vice Presidents
and Portfolio Managers
Bernard Lirola
Needham Growth Fund
Needham Aggressive Growth Fund
Chris Retzler
Needham Growth Fund
Needham Small Cap Growth Fund
Directors
George A. Needham
John W. Larson
James P. Poitras
F. Randall Smith
Distributor:
Needham & Company, LLC
445 Park Avenue
New York, NY 10022-2606
212-371-8300
Administrator, Shareholder Servicing
Agent and Transfer Agent:
Citi Fund Services Ohio, Inc.
3435 Stelzer Road
Columbus, OH 43219
Custodian:
JPMorgan Chase Bank, N.A.
14201 North Dallas Parkway
Dallas, Texas 75254-2916
Counsel:
Fulbright & Jaworski L.L.P.
666 Fifth Avenue
New York, NY 10103
Independent Registered Public Accounting Firm:
Ernst & Young LLP
1100 Huntington Center
41 South High Street
Columbus, OH 43215
Item 2. Code of Ethics.
Not applicable.
Item 3. Audit Committee Financial Expert.
Not applicable.
Item 4. Principal Accountant Fees and Services.
Not applicable.
Item 5. Audit Committee of Listed Registrants.
Not applicable.
Item 6. Investments.
(a) Included in item 1 under “Reports to Shareholders”.
(b) Not applicable.
Item 7. Disclosure of Proxy Voting Policies and Procedures for Closed-End Management Investment Companies.
Not applicable.
Item 8. Portfolio Managers of Closed-End Management Investment Companies.
Not applicable.
Item 9. Purchases of Equity Securities by Closed-End Management Investment Company and Affiliated Purchasers.
Not applicable.
Item 10. Submission of Matters to a Vote of Security Holders.
Not applicable.
Item 11. Controls and Procedures.
(a)The registrant’s principal executive officer and principal financial officer have concluded, based on their evaluation of the registrant’s disclosure controls and procedures as conducted within 90 days of the filing date of this report, that these disclosure controls and procedures are adequately designed and are operating effectively to ensure that information required to be disclosed by the registrant on Form N-CSR is recorded, processed, summarized and reported within the time periods specified in the Securities and Exchange Commission’s rules and forms.
(b)There were no changes in the registrant’s internal control over financial reporting (as defined in Rule 30a-3(d) under the Act (17 CFR 270.30a-3(d)) that occurred during the second fiscal quarter of the period covered by this report that have materially affected or are reasonably likely to materially affect, the registrant’s internal control over financial reporting.
Item 12. Exhibits.
(a)(1) Not applicable.
(a)(2) Certifications pursuant to Rule 30a-2(a) are attached hereto.
(a)(3) Not applicable.
(b) Certifications pursuant to Rule 30a-2(b) are furnished herewith.
SIGNATURES
Pursuant to the requirements of the Securities Exchange Act of 1934 and the Investment Company Act of 1940, the registrant has duly caused this report to be signed on its behalf by the undersigned, thereunto duly authorized.
(Registrant) | The Needham Funds, Inc. | |
|
By (Signature and Title) | /s/ George A. Needham, President | |
| George A. Needham, President (Principal Executive Officer) |
|
Date: | September 1, 2009 | |
| | | | |
Pursuant to the requirements of the Securities Exchange Act of 1934 and the Investment Company Act of 1940, this report has been signed below by the following persons on behalf of the registrant and in the capacities and on the dates indicated.
By (Signature and Title) | /s/ George A. Needham, President | |
| George A. Needham, President (Principal Executive Officer) |
|
Date: | September 1, 2009 | |
|
By (Signature and Title) | /s/ Glen W. Albanese, Treasurer and Secretary | |
| Glen W. Albanese, Treasurer and Secretary (Principal Financial Officer) |
|
Date: | September 1, 2009 | |
| | | | |