UNITED STATES
SECURITIES AND EXCHANGE COMMISSION
Washington, D.C. 20549
FORM N-CSR
CERTIFIED SHAREHOLDER REPORT OF REGISTERED
MANAGEMENT INVESTMENT COMPANIES
Investment Company Act file number | 811-09114 |
|
The Needham Funds, Inc. |
(Exact name of registrant as specified in charter) |
|
445 Park Avenue, New York, New York | | 10022-2606 |
(Address of principal executive offices) | | (Zip code) |
|
BISYS Fund Services Ohio, Inc., 3435 Stelzer Road, Columbus, OH 43219 |
(Name and address of agent for service) |
|
Registrant’s telephone number, including area code: | 1-800-625-7071 | |
|
Date of fiscal year end: | December 31 | |
|
Date of reporting period: | June 30, 2007 | |
| | | | | | | | |
Item 1. Reports to Stockholders.
Semiannual
Report
Needham Funds
Seeking to build wealth for long-term investors.
Six Months Ended June 30, 2007 (unaudited)
Needham Growth Fund
Needham Aggressive Growth Fund
Needham Small Cap Growth Fund

www.needhamfunds.com

445 Park Avenue
New York, New York 10022-2606
1-800-625-7071
www.needhamfunds.com
Semiannual Report
For the Six Months Ended June 30, 2007
(Unaudited)
Contents
| Letter from the Adviser | | | 1 | | |
|
| Portfolio Characteristics | |
|
| Needham Growth Fund | | | 3 | | |
|
| Needham Aggressive Growth Fund | | | 4 | | |
|
| Needham Small Cap Growth Fund | | | 5 | | |
|
| Disclosure of Fund Expenses | | | 6 | | |
|
| Schedule of Investments | |
|
| Needham Growth Fund | | | 7 | | |
|
| Needham Aggressive Growth Fund | | | 10 | | |
|
| Needham Small Cap Growth Fund | | | 13 | | |
|
| Schedule of Securities Sold Short | |
|
| Needham Growth Fund | | | 9 | | |
|
| Needham Aggressive Growth Fund | | | 12 | | |
|
| Needham Small Cap Growth Fund | | | 15 | | |
|
| Statements of Assets and Liabilities | | | 16 | | |
|
| Statements of Operations | | | 17 | | |
|
| Statements of Changes in Net Assets | | | 18 | | |
|
| Financial Highlights | |
|
| Needham Growth Fund | | | 19 | | |
|
| Needham Aggressive Growth Fund | | | 20 | | |
|
| Needham Small Cap Growth Fund | | | 21 | | |
|
| Notes to Financial Statements | | | 22 | | |
|
| Supplemental Data | | | 26 | | |
|
This report is authorized for distribution to prospective investors only when preceded or accompanied by a current prospectus. The prospectus contains more complete information, including investment objectives, risks, expenses and charges and should be read carefully before investing or sending any money. To obtain a prospectus, please call 1-800-625-7071.
Portfolios of The Needham Funds, Inc., like all mutual funds:
• Are NOT FDIC insured
• Have no bank guarantee
• May lose value
The Needham Funds, Inc. are distributed by Needham & Company, LLC.
Needham Funds Semiannual Report 2007
Dear Shareholders,
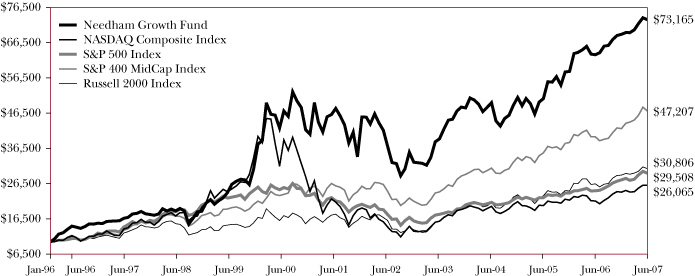
We at The Needham Funds, Inc. focus on buying growth stocks at reasonable prices. In the volatile six-month period ended June 30, 2007, we are pleased that each of the funds performed reasonably well for our investors. During the six months ended June 30, 2007, the Growth Fund was up 6.08%, the Aggressive Growth Fund was up 12.61%, and the Small Cap Growth Fund was up 5.45%. By comparison, the S&P 500 Index was up 6.96%, the NASDAQ Composite Index was up 8.17%, and the Russell 2000 Index was up 6.45%.
The Needham Growth Fund (the "Growth Fund") seeks to create long-term, tax-efficient capital appreciation for its investors. To this end, the Growth Fund targets companies with products or services that are selling or marketing into growth markets. These companies normally have earnings growth of at least 15-20%, product and market dominance, and the ability to consolidate their market positions. They may also have a competitive advantage by acquiring and retaining more customers or driving costs down and profits up. The Growth Fund also looks for seasoned and motivated managements with records of building shareholder value. Companies with these characteristics sometimes find themselves in a temporary earnings downturn or shortfall or may be in a product transition. This often causes aggressive growth or dynamic growth investors to sell. At this point, the Growth Fund may deem the stock to be reasonably priced and purchase it fo r long-term capital appreciation. Hence, the discipline called "Growth At a Reasonable Price," or "GARP."
The Growth Fund was up 6.08% for the six months ended June 30, up 15.84% for the 1 year period, up 13.88% for the 3 years, up 14.52% for the 5 years, up 15.77% for the 10 years, and up 18.90% since inception, compounded annually. The Growth Fund received a four star Overall MorningstarTM Rating in the U.S.-domiciled Mid-Cap Growth Funds category as of June 30, 2007, based on Risk-Adjusted Return, when rated against 814 Mid-Cap Growth Funds. We ended the six-month period with approximately 21.09% of total investments in cash and 8.4% as our short position. The positive returns were driven by improved performance from the Fund's technology holdings and from the strong mergers and acquisitions environment, which saw several of our holdings become the target of takeover bids at attractive premiums to where the stocks had been trading prior to the bids. Our consumer names were under performers as concerns over slowing reta il sales impacted the sector and our shorts were also a negative drag during the first half of 2007. Our best performing stocks were Express Scripts, Inc., GlobalSantaFe Corp., Schering Plough Corp., National Semiconductor Corp., and Talisman Energy, Inc.
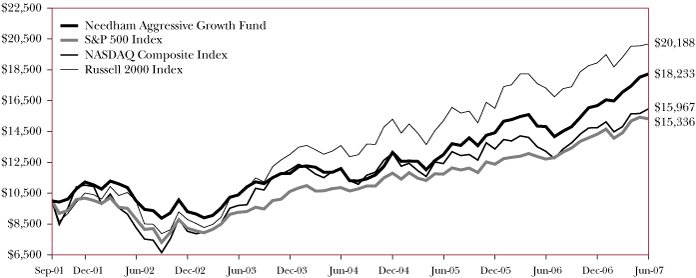
The Needham Aggressive Growth Fund (the "Aggressive Growth Fund") seeks to create long-term, tax-efficient capital appreciation for its investors. To this end, the Aggressive Growth Fund targets the equities of companies with strong, above-average prospective growth rates. The Aggressive Growth Fund invests, in general, in markets and industries with strong growth rates, focusing on the market leaders in these areas. These market leaders, especially as they break away from their competitors, tend to garner a disproportionate share of the positive financial returns. Also important is the long-term sustainability of the companies' leadership positions. Thus, the Aggressive Growth Fund looks for companies with strong management teams, superior balance sheets, above-average margins that can generate excess cash, and strong R&D and brand spending in industries with high barriers to entry.
The Aggressive Growth Fund was up 12.61% for the six months ended June 30, up 22.96% for the 1 year period, up 14.65% for the 3 years, up 12.70% for the 5 years, and up 10.87% since inception, compounded annually. Most notable for the Aggressive Growth Fund for the first half of 2007 was the strong takeover environment. In particular, four of the Fund's largest holdings, Hyperion Solutions, Alliance Data Systems,
1
Needham Funds
Cytyc and Webex all received attractive acquisition offers. Our consumer names were under performers as concerns over slowing retail sales impacted the sector and our shorts were also a negative drag during this six-month period.
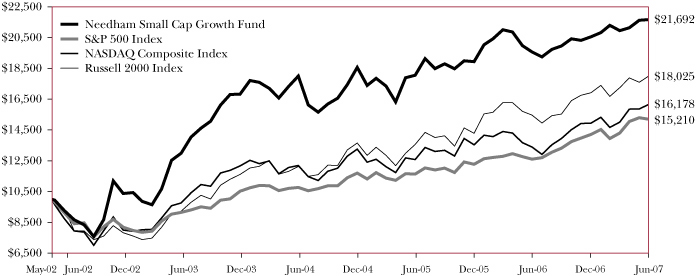
The Needham Small Cap Growth Fund (the "Small Cap Growth Fund") seeks long-term, tax-efficient capital appreciation by investing primarily in equity securities of smaller growth companies that the Small Cap Growth Fund believes are trading at a discount to their underlying value yet have the potential for superior long-term growth. Under normal conditions, the Small Cap Growth Fund invests at least 80% of its net assets in equity securities of domestic issuers listed on a nationally recognized securities exchange or traded on the NASDAQ System that have market capitalizations not exceeding (i) $2 billion, or (ii) the highest market capitalization in the Russell 2000 Index, if greater. As of June 30, the highest market capitalization in the Russell 2000 Index was $3.3 billion. Central to the Small Cap Growth Fund's investment strategy is a sound valuation discipline that seeks to acquire growth companies at reasonable prices. The Small Cap Growth Fund seeks tax efficiency by holding securities for a period of 12 months or more to obtain long-term capital gain treatment and by offsetting capital gains on the sale of securities with capital losses.
The Small Cap Growth Fund was up 5.45% for the six months ended June 30, up 10.74% for the 1 year period, up 6.38% for the 3 years, up 18.53% for the 5 years, and up 16.37% since inception, compounded annually. 2007 has proven to be a difficult time for small-cap stocks. After seven years of out-performance relative to larger cap stocks, the market has turned more favorable to the larger cap names and this has hampered the returns of the Small Cap Growth Fund. In addition, the Small Cap Growth Fund did not benefit form the strong buyout environment that was concentrated in the mid to larger cap size stocks. The Fund's shorts were also a negative drag during this six-month period. Our top performers for the six-month period were Actuant Corp., Neoware Systems, Inc., Genesee & Wyoming, Inc., Advisory Board Co., and FTI Consulting, Inc.
The portfolio turnover rate was 12% for the Growth Fund, 21% for the Aggressive Growth Fund, and 13% for the Small Cap Growth Fund for the six months ended June 30, 2007. The expense ratios for the three funds were 1.84% for the Growth Fund, 2.24% for the Aggressive Growth Fund, and 2.45% for the Small Cap Growth Fund for the six months ended June 30, 2007.
In previous reports we have highlighted the end of the housing boom as a key risk to the stock markets. That fear has become reality, as we look into the second half of 2007. Housing weakness has created turmoil in the sub-prime lending markets, which have, in turn, increased concerns about the health of consumer spending. We expect this to be a depressant to equity valuations at least in the third quarter of 2007. Somewhat offsetting this has been the continued strong growth of economies outside of the U.S., particularly in the emerging markets of China and India.
Sincerely,
James K. Kloppenburg
Portfolio Manager
2
Semiannual Report 2007
NEEDHAM GROWTH FUND (Unaudited) TICKER: NEEGX
Comparative Performance Statistics as of June 30, 2007
| | | 6 Months(6) | | 1 Year | | 3 Years(7) | | 5 Years(7) | | 10 Years(7) | | Since Inception(7)(11) | |
| Needham Growth Fund(1) | | | 6.08 | % | | | 15.84 | % | | | 13.88 | %(8) | | | 14.52 | %(9) | | | 15.77 | %(10) | | | 18.9 | %(12) | |
| NASDAQ Composite Index(2) | | | 8.17 | % | | | 20.77 | % | | | 9.13 | % | | | 12.90 | % | | | 6.59 | % | | | 7.41 | % | |
| S&P 500 Index(3) | | | 6.96 | % | | | 20.64 | % | | | 11.68 | % | | | 10.69 | % | | | 7.12 | % | | | 8.70 | % | |
| S&P 400 MidCap Index(4) | | | 11.97 | % | | | 18.55 | % | | | 15.15 | % | | | 14.14 | % | | | 13.36 | % | | | 14.01 | % | |
| Russell 2000 Index(5) | | | 6.45 | % | | | 16.49 | % | | | 13.52 | % | | | 13.91 | % | | | 9.14 | % | | | 9.70 | % | |
Past performance does not guarantee future results. The performance data quoted represents past performance, and current returns may be lower or higher. The investment return and net asset value will fluctuate so that an investor's shares, when redeemed, may be worth more or less than the original cost. To obtain performance information current to the most recent month-end, please visit www.needhamfunds.com. The returns shown in the above table and accompanying footnotes are net of expenses. The table above does not reflect the deduction of taxes that a shareholder would have paid on Fund distributions or on the redemption of Fund shares. Since inception, the Fund's Adviser has absorbed certain expenses of the Fund, without which returns would have been lower.
1. Investment results calculated after reinvestment of dividends.
2. The NASDAQ Composite Index is a broad-based capitalization-weighted index of all NASDAQ Global Market and Small Cap stocks.
3. The S&P 500 Index is a broad unmanaged measure of the U.S. stock market.
4. The S&P 400 MidCap Index is a broad unmanaged measure of the U.S. stock market.
5. The Russell 2000 Index is a broad unmanaged index composed of the smallest 2,000 companies in the Russell 3000 Index.
6. Not annualized.
7. Compound annual growth rate (annualized return). Assumes all dividends were reinvested in shares of the Fund.
8. Cumulative return for the three year period was 47.69%, assuming all dividends were reinvested in shares of the Fund.
9. Cumulative return for the five year period was 96.96%, assuming all dividends were reinvested in shares of the Fund.
10. Cumulative return for the ten year period was 332.33%, assuming all dividends were reinvested in shares of the Fund.
11. The inception date of the Fund was 1/1/96.
12. Cumulative return since inception was 631.65%, assuming all dividends were reinvested in shares of the Fund.
Top Ten Holdings*
(as a % of total investments, as of June 30, 2007)
| Security | |
| | % of Total
Investments† | |
| 1) Express Scripts, Inc. | | ESRX | | | 3.57 | % | |
| 2) Talisman Energy, Inc. | | TLM | | | 3.19 | % | |
| 3) Motorola, Inc. | | MOT | | | 3.06 | % | |
| 4) Brooks Automation, Inc. | | BRKS | | | 3.02 | % | |
| 5) GlobalSantaFe Corp. | | GSF | | | 2.94 | % | |
| 6) Chesapeake Energy Corp. | | CHK | | | 2.68 | % | |
| 7) Johnson & Johnson | | JNJ | | | 2.51 | % | |
| 8) Thermo Fisher Scientific, Inc. | | TMO | | | 2.42 | % | |
| 9) Tyco International, Inc. | | TYC | | | 2.41 | % | |
| 10) Comcast Corp. | | CMCSA | | | 2.23 | % | |
Top Ten Holdings = 28.03% of Total Investments†
* Current portfolio holdings may not be indicative of future portfolio holdings.
† Percentage of total investments includes all stock and, fixed income securities plus cash minus all short positions.
Sector Weightings*
(as a % of total investments, as of June 30, 2007)
| Sector | | Long(1) | | (Short)(1) | | Total(1)(2) | |
| Healthcare | | | 16.49 | % | | | — | | | | 16.49 | % | |
| Energy & Industrial | | | 19.22 | % | | | (0.32 | )% | | | 18.90 | % | |
| Financial & Business Services | | | 6.76 | % | | | (2.23 | )% | | | 4.52 | % | |
| Consumer | | | 1.59 | % | | | (2.88 | )% | | | (1.29 | )% | |
| Technology | | | 34.39 | % | | | (2.03 | )% | | | 32.36 | % | |
| Telecommunications | | | 8.86 | % | | | (0.94 | )% | | | 7.92 | % | |
| Cash | | | 21.09 | % | | | — | | | | 21.09 | % | |
* Current portfolio holdings may not be indicative of future portfolio holdings.
(1) Percentage of total investments includes all stocks and fixed income securities plus cash minus all short positions.
(2) Total represents the difference between the long exposure and the short exposure, which produces the net exposure.
Comparison of Change in Value of a $10,000 Investment
Past performance does not guarantee future results. The performance data quoted represents past performance, and current returns may be lower or higher. The investment return and net asset value will fluctuate so that an investor's shares, when redeemed, may be worth more or less than the original cost. To obtain performance information current to the most recent month-end, please visit www.needhamfunds.com. The graph above does not reflect the deduction of taxes that a shareholder would have paid on Fund distributions or on the redemption of Fund shares. Since inception, the Fund's Adviser has absorbed certain expenses of the Fund, without which returns would have been lower.
3
Needham Funds
NEEDHAM AGGRESSIVE GROWTH FUND (Unaudited) TICKER: NEAGX
Comparative Performance Statistics as of June 30, 2007
| | | 6 Months(5) | | 1 Year | | 3 Years(6) | | 5 Years(6) | | Since Inception(6)(9) | |
| Needham Aggressive Growth Fund(1) | | | 12.61 | % | | | 22.96 | % | | | 14.65 | %(7) | | | 12.70 | %(8) | | | 10.87 | %(10) | |
| S&P 500 Index(2) | | | 6.96 | % | | | 20.64 | % | | | 11.68 | % | | | 10.69 | % | | | 6.82 | % | |
| NASDAQ Composite Index(3) | | | 8.17 | % | | | 20.77 | % | | | 9.13 | % | | | 12.90 | % | | | 7.11 | % | |
| Russell 2000 Index(4) | | | 6.45 | % | | | 16.49 | % | | | 13.52 | % | | | 13.91 | % | | | 11.82 | % | |
Past performance does not guarantee future results. The performance data quoted represents past performance, and current returns may be lower or higher. The investment return and net asset value will fluctuate so that an investor's shares, when redeemed, may be worth more or less than the original cost. To obtain performance information current to the most recent month-end, please visit www.needhamfunds.com. The returns shown in the above table and accompanying footnotes are net of expenses. The table above does not reflect the deduction of taxes that a shareholder would have paid on Fund distributions or on the redemption of Fund shares. Since inception, the Fund's Adviser has absorbed certain expenses of the Fund, without which returns would have been lower.
1. Investment results calculated after reinvestment of dividends.
2. The S&P 500 Index is a broad unmanaged measure of the U.S. stock market.
3. The NASDAQ Composite Index is a broad-based capitalization-weighted index of all NASDAQ Global Market and Small Cap stocks.
4. The Russell 2000 Index is a broad unmanaged index composed of the smallest 2,000 companies in the Russell 3000 Index.
5. Not annualized.
6. Compound annual growth rate (annualized return). Assumes all dividends were reinvested in shares of the Fund.
7. Cumulative return for the three year period was 50.70%, assuming all dividends were reinvested in shares of the Fund.
8. Cumulative return for the five year period was 81.78%, assuming all dividends were reinvested in shares of the Fund.
9. The inception date of the Fund was 9/4/01.
10. Cumulative return since inception was 82.33%, assuming all dividends were reinvested in shares of the Fund.
Top Ten Holdings*
(as a % of total investments, as of June 30, 2007)
| Security | | | | % of Total
Investments† | |
| 1) Precision Castparts Corp. | | PCP | | | 7.21 | % | |
| 2) Alliance Data Systems Corp. | | ADS | | | 5.74 | % | |
| 3) Express Scripts, Inc. | | ESRX | | | 4.95 | % | |
| 4) Comcast Corp. | | CMCSK | | | 4.15 | % | |
| 5) Dolby Laboratories, Inc. | | DLB | | | 3.66 | % | |
| 6) Coach, Inc. | | COH | | | 3.52 | % | |
| 7) Cytyc Corp. | | CYTC | | | 3.20 | % | |
| 8) Community Health Systems, Inc. | | CYH | | | 3.01 | % | |
| 9) Kyphon, Inc. | | KYPH | | | 2.98 | % | |
| 10) Portfolio Recovery Associates, Inc. | | PRAA | | | 2.97 | % | |
Top Ten Holdings = 41.39% of Total Investments†
* Current portfolio holdings may not be indicative of future portfolio holdings.
† Percentage of total investments includes all stocks plus cash minus all short positions.
Sector Weightings*
(as a % of total investments, as of June 30, 2007)
| Sector | | Long(1) | | (Short)(1) | | Total(1)(2) | |
| Healthcare | | | 22.33 | % | | | — | | | | 22.33 | % | |
| Energy & Industrial | | | 9.35 | % | | | (0.17 | )% | | | 9.18 | % | |
| Financial & Business Services | | | 18.72 | % | | | (0.62 | )% | | | 18.10 | % | |
| Consumer | | | 7.21 | % | | | (2.27 | )% | | | 4.94 | % | |
| Technology | | | 24.38 | % | | | (0.50 | )% | | | 23.89 | % | |
| Telecommunications/Cable | | | 6.43 | % | | | (0.86 | )% | | | 5.58 | % | |
| Cash | | | 15.98 | % | | | �� | | | | 15.98 | % | |
* Current portfolio holdings may not be indicative of future portfolio holdings.
(1) Percentage of total investments includes all stock, plus cash minus all short positions.
(2) Total represents the difference between the long exposure and the short exposure, which produces the net exposure.
Comparison of Change in Value of a $10,000 Investment
Past performance does not guarantee future results. The performance data quoted represents past performance, and current returns may be lower or higher. The investment return and net asset value will fluctuate so that an investor's shares, when redeemed, may be worth more or less than the original cost. To obtain performance information current to the most recent month-end, please visit www.needhamfunds.com. The graph above does not reflect the deduction of taxes that a shareholder would have paid on Fund distributions or on the redemption of Fund shares. Since inception, the Fund's Adviser has absorbed certain expenses of the Fund, without which returns would have been lower.
4
Semiannual Report 2007
NEEDHAM SMALL CAP GROWTH FUND (Unaudited) TICKER: NESGX
Comparative Performance Statistics as of June 30, 2007
| | | 6 Months(5) | | 1 Year | | 3 Years(6) | | 5 Years(6) | | Since Inception(6)(9) | |
| Needham Small Cap Growth Fund(1) | | | 5.45 | % | | | 10.74 | % | | | 6.38 | %(7) | | | 18.53 | %(8) | | | 16.37 | %(10) | |
| S&P 500 Index(2) | | | 6.96 | % | | | 20.64 | % | | | 11.68 | % | | | 10.69 | % | | | 8.92 | % | |
| NASDAQ Composite Index(3) | | | 8.17 | % | | | 20.77 | % | | | 9.13 | % | | | 12.90 | % | | | 7.11 | % | |
| Russell 2000 Index(4) | | | 6.45 | % | | | 16.49 | % | | | 13.52 | % | | | 13.91 | % | | | 11.82 | % | |
Past performance does not guarantee future results. The performance data quoted represents past performance, and current returns may be lower or higher. The investment return and net asset value will fluctuate so that an investor's shares, when redeemed, may be worth more or less than the original cost. To obtain performance information current to the most recent month-end, please visit www.needhamfunds.com. The returns shown in the above table and accompanying footnotes are net of expenses. The table above does not reflect the deduction of taxes that a shareholder would have paid on Fund distributions or on the redemption of Fund shares. Since inception, the Fund's Adviser has absorbed certain expenses of the Fund, without which returns would have been lower.
1. Investment results calculated after reinvestment of dividends.
2. The S&P 500 Index is a broad unmanaged measure of the U.S. stock market.
3. The NASDAQ Composite Index is a broad-based capitalization-weighted index of all NASDAQ Global Market and Small Cap stocks.
4. The Russell 2000 Index is a broad unmanaged index composed of the smallest 2,000 companies in the Russell 3000 Index.
5. Not annualized.
6. Compound annual growth rate (annualized return). Assumes all dividends were reinvested in shares of the Fund.
7. Cumulative return for the three year period was 20.38%, assuming all dividends were reinvested in shares of the Fund.
8. Cumulative return for the five year period was 134.00%, assuming all dividends were reinvested in shares of the Fund.
9. The inception date of the Fund was 5/22/02.
10. Cumulative return since inception was 116.92%, assuming all dividends were reinvested in shares of the Fund.
Top Ten Holdings*
(as a % of total investments, as of June 30, 2007)
| Security | | | | % of Total
Investments† | |
1) Bright Horizons Family Solutions,
Inc. | | BFAM | | | 6.45 | % | |
| 2) Genesee & Wyoming, Inc. | | GWR | | | 4.95 | % | |
| 3) Advisory Board Company | | ABCO | | | 4.61 | % | |
4) Philadelphia Consolidated Holding
Corp. | | PHLY | | | 3.64 | % | |
| 5) Mobile Mini, Inc. | | MINI | | | 3.63 | % | |
| 6) MKS Instruments, Inc. | | MKSI | | | 3.45 | % | |
| 7) Copart, Inc. | | CPRT | | | 3.17 | % | |
| 8) FTI Consulting, Inc. | | FCN | | | 3.15 | % | |
| 9) Jupitermedia Corp. | | JUPM | | | 3.02 | % | |
| 10) Novatel, Inc. | | NGPS | | | 3.01 | % | |
Top Ten Holdings = 39.08% of Total Investments†
* Current portfolio holdings may not be indicative of future portfolio holdings.
† Percentage of total investments includes all stocks plus cash minus all short positions.
Sector Weightings*
(as a % of total investments, as of June 30, 2007)
| Sector | | Long(1) | | (Short)(1) | | Total(1)(2) | |
| Healthcare | | | 12.12 | % | | | — | | | | 12.12 | % | |
| Energy & Industrial | | | 13.09 | % | | | (0.18 | )% | | | 12.90 | % | |
| Financial & Business Services | | | 27.85 | % | | | (0.78 | )% | | | 27.07 | % | |
| Consumer | | | 2.35 | % | | | (3.18 | )% | | | (0.83 | )% | |
| Technology | | | 26.59 | % | | | (1.04 | )% | | | 25.56 | % | |
| Telecommunications/Cable | | | 6.61 | % | | | (1.19 | )% | | | 5.41 | % | |
| Cash | | | 17.77 | % | | | — | | | | 17.77 | % | |
* Current portfolio holdings may not be indicative of future portfolio holdings.
(1) Percentage of total investments includes all stocks plus cash minus all short positions.
(2) Total represents the difference between the long exposure and the short exposure, which produces the net exposure.
Comparison of Change in Value of a $10,000 Investment
Past performance does not guarantee future results. The performance data quoted represents past performance, and current returns may be lower or higher. The investment return and net asset value will fluctuate so that an investor's shares, when redeemed, may be worth more or less than the original cost. To obtain performance information current to the most recent month-end, please visit www.needhamfunds.com. The graph above does not reflect the deduction of taxes that a shareholder would have paid on Fund distributions or on the redemption of Fund shares. Since inception, the Fund's Adviser has absorbed certain expenses of the Fund, without which returns would have been lower.
5
Needham Funds
Disclosure of Fund Expenses (Unaudited)
The following expense table is shown so that you can understand the impact of fees on your investment. All mutual funds have operating expenses. As a shareholder of the fund, you incur ongoing costs, which include costs for portfolio management, administrative services, and shareholder reports, among others. A fund's expenses are expressed as a percentage of its average net assets. This figure is known as the expense ratio. The following examples are intended to help you understand the ongoing costs (in dollars) of investing in each fund and to compare these costs with those of other mutual funds. The examples are based on an investment of $1,000 made at the beginning of the period shown and held for the entire period from January 1, 2007 through June 30, 2007.
• Actual Expenses. This section helps you to estimate the actual expenses after fee waivers that you paid over the period. The "Ending Account Value" shown is derived from the fund's actual return, and "Expenses Paid During Period" shows the dollar amount that would have been paid by an investor who started with $1,000 in the fund. You may use the information here, together with the amount you invested, to estimate the expenses that you paid over the period. To do so, simply divide your account value by $1,000 (for example, a $7,500 account value divided by $1,000 = 7.5), then multiply the result by the number given for your fund under the heading entitled "Expenses Paid During Period."
• Hypothetical Expenses on a 5% Return. This section is intended to help you compare your fund's costs with those of other mutual funds. It assumes that the fund had a return of 5% before expenses during the period shown, but that the expense ratio is unchanged. In this case — because the return used is not the fund's actual return — the results do not apply to your investment. The example is useful in making comparisons because the Securities and Exchange Commission requires all mutual funds to calculate expenses based on a 5% return. You can assess your fund's cost by comparing this hypothetical example with the hypothetical examples that appear in shareholders reports of other funds.
Please note that the expenses shown in the table are meant to highlight your ongoing costs only and do not reflect any transactional costs (if any). Therefore, the table is useful in comparing ongoing costs only, and will not help you determine the relative total costs of owning different funds. In addition, if these transactional costs were included, your costs would have been higher.
For the Period January 1, 2007 to June 30, 2007
Expense Example Table
| | | Beginning
Account
Value
1/1/07 | | Ending
Account
Value
6/30/07 | | Expense
Paid During
Period*
1/1/07-
6/30/07 | | Expense Ratio
During
Period
1/1/07-
6/30/07 | |
| Needham Growth Fund | |
| Actual Expenses | | $ | 1,000.00 | | | $ | 1,060.80 | | | $ | 9.40 | | | | 1.84 | % | |
| Hypothetical Expenses on a 5% Return | | $ | 1,000.00 | | | $ | 1,015.67 | | | $ | 9.20 | | | | 1.84 | % | |
| Needham Aggressive Growth Fund | |
| Actual Expenses | | $ | 1,000.00 | | | $ | 1,126.10 | | | $ | 11.81 | | | | 2.24 | % | |
| Hypothetical Expenses on a 5% Return | | $ | 1,000.00 | | | $ | 1,013.69 | | | $ | 11.18 | | | | 2.24 | % | |
| Needham Small Cap Growth Fund | |
| Actual Expenses | | $ | 1,000.00 | | | $ | 1,054.50 | | | $ | 12.48 | | | | 2.45 | % | |
| Hypothetical Expenses on a 5% Return | | $ | 1,000.00 | | | $ | 1,012.65 | | | $ | 12.23 | | | | 2.45 | % | |
* Expenses are equal to the average account value times the Fund's annualized expense ratio multiplied by the number of days in the most recent fiscal half-year divided by the number of days in the fiscal year.
6
Semiannual Report 2007
Needham Growth Fund
Schedule of Investments
June 30, 2007 (Unaudited)
| | | Shares | | Value | |
| Common Stocks (84.9%) | |
| Business Services (2.9%)(a) | |
| Iron Mountain, Inc.* | | | 200,000 | | | $ | 5,226,000 | | |
| SAIC, Inc.* | | | 100,000 | | | | 1,807,000 | | |
| | | | 7,033,000 | | |
Cable Television &
Equipment (2.2%)† | |
| Comcast Corp. - Class A* | | | 195,000 | | | | 5,483,400 | | |
Computers - Integrated
Systems (0.8%) | |
| RadiSys Corp.* | | | 150,000 | | | | 1,860,000 | | |
| Computers - Storage (3.4%) | |
| Datalink Corp.* | | | 135,000 | | | | 907,200 | | |
| SanDisk Corp.* | | | 52,500 | | | | 2,569,350 | | |
| Seagate Technology(a) | | | 225,000 | | | | 4,898,250 | | |
| | | | 8,374,800 | | |
| Construction (1.2%) | |
| Walter Industries, Inc. | | | 100,000 | | | | 2,896,000 | | |
| Consumer Services (2.5%) | |
| Avis Budget Group, Inc.* | | | 137,500 | | | | 3,909,125 | | |
| Western Union Company(a) | | | 100,000 | | | | 2,083,000 | | |
| | | | 5,992,125 | | |
Contract Manufacturing &
Materials (0.4%)(a) | |
| Merix Corp.* | | | 127,500 | | | | 1,005,975 | | |
Electronic Components &
Equipment (11.2%) | |
| Actel Corp.* | | | 150,000 | | | | 2,086,500 | | |
| Atmel Corp.* | | | 750,000 | | | | 4,170,000 | | |
| AuthenTec, Inc.* | | | 885 | | | | 9,160 | | |
| AXT, Inc.* | | | 325,000 | | | | 1,407,250 | | |
Benchmark
Electronics, Inc.*(a) | | | 64,000 | | | | 1,447,680 | | |
Electro Scientific
Industries, Inc.*† | | | 175,000 | | | | 3,640,000 | | |
Houston Wire & Cable
Company*(a) | | | 50,000 | | | | 1,420,500 | | |
| Newport Corp.*(a) | | | 250,000 | | | | 3,870,000 | | |
| Orbotech Ltd.* | | | 148,600 | | | | 3,316,752 | | |
| Vishay Intertechnology, Inc.*† | | | 150,000 | | | | 2,373,000 | | |
| X-Rite, Inc.(a) | | | 250,000 | | | | 3,692,500 | | |
| | | | 27,433,342 | | |
| Enabling Technology (2.0%) | |
| Dolby Laboratories, Inc.* | | | 125,000 | | | | 4,426,250 | | |
| iRobot Corp.*(a) | | | 29,250 | | | | 580,612 | | |
| | | | 5,006,862 | | |
| Financial Services (1.3%) | |
Interactive Brokers
Group, Inc.* | | | 120,000 | | | | 3,255,600 | | |
| | | Shares | | Value | |
| Healthcare Services (4.7%) | |
| Express Scripts, Inc.* | | | 175,000 | | | $ | 8,751,750 | | |
| HealthSouth Corp.*† | | | 150,000 | | | | 2,716,500 | | |
| | | | 11,468,250 | | |
| Insurance (1.7%) | |
American International
Group, Inc. | | | 60,000 | | | | 4,201,800 | | |
| Internet Infrastructure (0.0%) | |
| comScore, Inc.* | | | 885 | | | | 20,488 | | |
Manufacturing & Industrial
Equipment (5.1%) | |
Mueller Water Products, Inc. -
Class B | | | 165,244 | | | | 2,478,660 | | |
Southwall
Technologies, Inc.*(a) | | | 728,000 | | | | 793,520 | | |
| Sypris Solutions, Inc. | | | 418,700 | | | | 3,357,974 | | |
| Tyco International Ltd.(a) | | | 175,000 | | | | 5,913,250 | | |
| | | | 12,543,404 | | |
| Medical Devices & Supplies (3.9%) | |
| CONMED Corp.*(a) | | | 125,000 | | | | 3,660,000 | | |
Thermo Fisher
Scientific, Inc.*† | | | 115,000 | | | | 5,947,800 | | |
| Tomotherapy, Inc.* | | | 888 | | | | 19,465 | | |
| | | | 9,627,265 | | |
| Networking Products (1.6%) | |
| 3Com Corp.* | | | 475,000 | | | | 1,961,750 | | |
| Foundry Networks, Inc.*(a) | | | 123,750 | | | | 2,061,675 | | |
| | | | 4,023,425 | | |
Oil & Gas - Equipment &
Services (1.0%)(a) | |
| Schlumberger Ltd. | | | 27,500 | | | | 2,335,850 | | |
Oil & Gas - Exploration &
Production (9.9%) | |
| Chesapeake Energy Corp. | | | 190,000 | | | | 6,574,000 | | |
| Geokinetics, Inc.* | | | 85,000 | | | | 2,637,550 | | |
| GlobalSantaFe Corp. | | | 100,000 | | | | 7,225,000 | | |
| Talisman Energy, Inc. | | | 405,000 | | | | 7,828,650 | | |
| | | | 24,265,200 | | |
Pharmaceuticals &
Biotechnology (5.5%) | |
| Johnson & Johnson | | | 100,000 | | | | 6,162,000 | | |
| Merck & Co., Inc. | | | 50,000 | | | | 2,490,000 | | |
| Schering-Plough Corp. | | | 162,000 | | | | 4,931,280 | | |
| | | | 13,583,280 | | |
| Semiconductors (9.5%) | |
| Brooks Automation, Inc.* | | | 408,028 | | | | 7,405,708 | | |
| Entegris, Inc.*(a) | | | 225,000 | | | | 2,673,000 | | |
| FSI International, Inc.* | | | 453,950 | | | | 1,448,101 | | |
| LSI Logic Corp.*† | | | 324,000 | | | | 2,433,240 | | |
| MKS Instruments, Inc.*(a) | | | 100,000 | | | | 2,770,000 | | |
| National Semiconductor Corp. | | | 180,000 | | | | 5,088,600 | | |
| Semitool, Inc.* | | | 144,435 | | | | 1,388,020 | | |
| Sipex Corp.* | | | 15,000 | | | | 133,350 | | |
| | | | 23,340,019 | | |
See accompanying notes to financial statements.
7
Needham Funds
Needham Growth Fund
Schedule of Investments (Continued)
June 30, 2007 (Unaudited)
| | | Shares | | Value | |
| Software (7.5%) | |
| Aspen Technology, Inc.*(a) | | | 250,000 | | | $ | 3,500,000 | | |
| Intuit, Inc.*(a) | | | 125,000 | | | | 3,760,000 | | |
| Microsoft Corp. | | | 100,000 | | | | 2,947,000 | | |
| Neoware, Inc.*(a) | | | 153,100 | | | | 2,072,974 | | |
Parametric
Technology Corp.*(a) | | | 175,000 | | | | 3,781,750 | | |
| Phoenix Technologies Ltd.*(a) | | | 169,200 | | | | 1,426,356 | | |
| Progress Software Corp.* | | | 30,050 | | | | 955,289 | | |
| | | | 18,443,369 | | |
Wireless Communications &
Equipment (6.6%) | |
| EMS Technologies, Inc.* | | | 176,900 | | | | 3,902,414 | | |
| Motorola, Inc. | | | 425,000 | | | | 7,522,500 | | |
| ViaSat, Inc.*† | | | 150,000 | | | | 4,815,000 | | |
| | | | 16,239,914 | | |
Total Common Stocks
(Cost $145,219,191) | | | | | | | 208,433,368 | | |
| Investment Trusts (2.4%) | |
| H&Q Healthcare Investors | | | 183,455 | | | | 3,153,591 | | |
| H&Q Life Sciences Investors | | | 193,912 | | | | 2,625,569 | | |
Total Investment Trusts
(Cost $6,071,753) | | | | | | | 5,779,160 | | |
| | | Principal
Amount | |
| Repurchase Agreements (25.4%) | |
Bear Stearns & Companies,
Inc., 5.38%, 7/2/07,
(Purchased 6/29/07,
proceeds at maturity
$28,166,693, collateralized
by U.S. Treasury Obligation,
2/15/14, value $28,971,454)
(Held as Collateral for
Secur ities Lending) | | $ | 28,154,082 | | | | 28,154,082 | | |
| | | Principal
Amount | | Value | |
Bear Stearns & Companies,
Inc., 2.69%, 7/2/07,
(Purchased on 6/29/07,
proceeds at maturity
$2,953,576, collateralized
by U.S. Treasury Obligations,
2/15/14-2/15/16, value
$3,038,557) (Held as
Collateral for Securities
Lending) | | $ | 2,952,915 | | | $ | 2,952,915 | | |
Bear Stearns Companies,
Inc., 4.30%, 7/2/07,
(Purchased on 6/29/07,
proceeds at maturity
$31,238,153,
collateralized by U.S.
Treasury Obligations,
2/15/10-2/15/14, value
$32,163,863) | | | 31,226,963 | | | | 31,226,963 | | |
Total Repurchase Agreements
(Cost $62,333,960) | | | | | 62,333,960 | | |
Total Investments ( 112.7%)
(Cost $213,624,904) | | | | | 276,546,488 | | |
Total Securities
Sold Short (-8.4%) | | | | | (20,632,480 | ) | |
Liabilities in excess of
other assets (-4.3%) | | | | | (10,432,611 | ) | |
| Net Assets (100.0%) | | | | $ | 245,481,397 | | |
(a) All or a portion of security is on loan as of June 30, 2007. The total value of securities on loan as of June 30, 2007 is $30,187,565.
* Non-income producing security
† Security position is either entirely or partially held in a segregated account as collateral for securities sold short, aggregating a total market value of $25,581,140.
See accompanying notes to financial statements.
8
Semiannual Report 2007
Needham Growth Fund
Schedule of Securities Sold Short
June 30, 2007 (Unaudited)
| | | Shares | | Value | |
| Securities Sold Short (-8.4%) | |
| Alternative Energy (-0.1%) | |
| JA Solar Holdings Co. Ltd* | | | 10,000 | | | $ | 337,300 | | |
| Business Services (-1.6%) | |
| American Reprographics Co.* | | | 50,000 | | | | 1,539,500 | | |
| Kenexa Corp.* | | | 40,000 | | | | 1,508,400 | | |
| VistaPrint Ltd.* | | | 25,000 | | | | 956,250 | | |
| | | | 4,004,150 | | |
| Construction (-0.2%) | |
| Beacon Roofing Supply, Inc.* | | | 26,500 | | | | 450,235 | | |
| Financial Services (-1.2%) | |
Lehman Brothers
Holdings, Inc. | | | 40,000 | | | | 2,980,800 | | |
| Semiconductors (-0.1%) | |
| FormFactor, Inc.* | | | 8,400 | | | | 321,720 | | |
| | | Shares | | Value | |
| Software (-1.3%) | |
| ANSYS, Inc.* | | | 29,800 | | | $ | 789,700 | | |
| salesforce.com, inc.* | | | 20,000 | | | | 857,200 | | |
| Vocus, Inc.* | | | 60,000 | | | | 1,506,600 | | |
| | | | 3,153,500 | | |
Specialty Retailing &
Manufacturing (-2.9%) | |
| Amazon.com, Inc.* | | | 70,000 | | | | 4,788,700 | | |
| Fossil, Inc.* | | | 77,500 | | | | 2,285,475 | | |
| | | | 7,074,175 | | |
| Telecommunications (-0.9%) | |
| Cbeyond, Inc.* | | | 60,000 | | | | 2,310,600 | | |
Total Securities Sold Short
(Proceeds $17,292,462) | | | | | | | 20,632,480 | | |
| Total Securities Sold Short (-8.4%) | | | | | | | (20,632,480 | ) | |
| Total Investments (112.7%) | | | | | | | 276,546,488 | | |
Liabilities in excess of
other assets (-4.3%) | | | | | | | (10,432,611 | ) | |
| Net Assets (100.0%) | | | | | | $ | 245,481,397 | | |
* Non-income producing security
See accompanying notes to financial statements.
9
Needham Funds
Needham Aggressive Growth Fund
Schedule of Investments
June 30, 2007 (Unaudited)
| | | Shares | | Value | |
| Common Stocks (87.5%) | |
| Airline (1.7%)(a) | |
| JetBlue Airways Corp.* | | | 30,000 | | | $ | 352,500 | | |
| Business Services (16.7%) | |
| Alliance Data Systems Corp.*(a) | | | 15,000 | | | | 1,159,200 | | |
| ChoicePoint, Inc.*† | | | 10,000 | | | | 424,500 | | |
| Euronet Worldwide, Inc.*(a) | | | 20,000 | | | | 583,200 | | |
| Iron Mountain, Inc.*(a) | | | 20,000 | | | | 522,600 | | |
Portfolio Recovery
Associates, Inc.(a) | | | 10,000 | | | | 600,200 | | |
| SAIC, Inc.*(a) | | | 5,000 | | | | 90,350 | | |
| | | | 3,380,050 | | |
| Cable Television & Equipment (4.2%) | |
Comcast Corp. - Special
Class A* | | | 30,000 | | | | 838,800 | | |
| Computers (1.8%)(a) | |
| Apple, Inc.* | | | 3,000 | | | | 366,120 | | |
| Computers - Storage (0.9%) | |
| SanDisk Corp.* | | | 3,500 | | | | 171,290 | | |
| Consumer Services (0.8%)(a) | |
| Western Union Company | | | 7,500 | | | | 156,225 | | |
Electronic Components &
Equipment (2.9%) | |
| AuthenTec, Inc.* | | | 72 | | | | 745 | | |
| Cavium Networks*(a) | | | 7,763 | | | | 175,599 | | |
Houston Wire & Cable
Company*(a) | | | 5,000 | | | | 142,050 | | |
| Orbotech Ltd.* | | | 12,000 | | | | 267,840 | | |
| | | | 586,234 | | |
| Enabling Technology (3.7%) | |
| Dolby Laboratories, Inc.* | | | 20,888 | | | | 739,644 | | |
| Financial Services (2.0%) | |
Interactive Brokers
Group, Inc.* | | | 15,000 | | | | 406,950 | | |
| Healthcare Services (8.0%) | |
Community Health
Systems, Inc.* | | | 15,000 | | | | 606,750 | | |
| Express Scripts, Inc.* | | | 20,000 | | | | 1,000,200 | | |
| | | | 1,606,950 | | |
| Internet Infrastructure (2.0%) | |
| comScore, Inc.* | | | 72 | | | | 1,667 | | |
| F5 Networks, Inc.*(a) | | | 5,000 | | | | 403,000 | | |
| | | | 404,667 | | |
| | | Shares | | Value | |
Manufacturing & Industrial
Equipment (7.2%) | |
| Precision Castparts Corp. | | | 12,000 | | | $ | 1,456,320 | | |
| Medical Devices & Supplies (9.3%) | |
| Cytyc Corp.* | | | 15,000 | | | | 646,650 | | |
| Kyphon, Inc.* | | | 12,500 | | | | 601,875 | | |
| NuVasive, Inc.*(a) | | | 15,000 | | | | 405,150 | | |
| Tomotherapy, Inc.* | | | 10,000 | | | | 219,200 | | |
| | | | 1,872,875 | | |
| Networking Products (2.0%) | |
| Acme Packet, Inc.* | | | 25,000 | | | | 287,250 | | |
| Foundry Networks, Inc.* | | | 7,500 | | | | 124,950 | | |
| | | | 412,200 | | |
Oil & Gas - Equipment &
Services (1.2%)(a) | |
| Input/Output, Inc.* | | | 15,000 | | | | 234,150 | | |
Oil & Gas - Exploration &
Production (1.0%) | |
| Geokinetics, Inc.* | | | 6,500 | | | | 201,695 | | |
Pharmaceuticals &
Biotechnology (4.0%) | |
| Gilead Sciences, Inc.* | | | 10,000 | | | | 387,700 | | |
| Vertex Pharmaceuticals, Inc.*† | | | 15,000 | | | | 428,400 | | |
| | | | 816,100 | | |
| Semiconductors (3.4%) | |
| Microsemi Corp.*(a) | | | 15,000 | | | | 359,250 | | |
| Semitool, Inc.* | | | 35,000 | | | | 336,350 | | |
| | | | 695,600 | | |
| Software (8.4%) | |
| Autodesk, Inc.*† | | | 10,000 | | | | 470,800 | | |
| Emageon, Inc.*(a) | | | 60,000 | | | | 541,200 | | |
| Intuit, Inc.*(a) | | | 8,500 | | | | 255,680 | | |
Parametric Technology
Corp.*(a)† | | | 20,000 | | | | 432,200 | | |
| | | | 1,699,880 | | |
Specialty Retailing &
Manufacturing (4.7%) | |
| Coach, Inc.* | | | 15,000 | | | | 710,850 | | |
| Guess?, Inc. | | | 5,000 | | | | 240,200 | | |
| | | | 951,050 | | |
Wireless Communications &
Equipment (1.6%) | |
| ViaSat, Inc.* | | | 10,000 | | | | 321,000 | | |
Total Common Stocks
(Cost $11,606,743) | | | | | | | 17,670,300 | | |
See accompanying notes to financial statements.
10
Semiannual Report 2007
Needham Aggressive Growth Fund
Schedule of Investments (Continued)
June 30, 2007 (Unaudited)
| | | Shares | | Value | |
American Depositary
Receipt (1.1%)(a) | |
Pharmaceuticals &
Biotechnology (1.1%) | |
| Crucell N.V. - ADR* | | | 10,000 | | | $ | 222,300 | | |
Total American Depositary
Receipt (Cost $228,247) | | | | | | | 222,300 | | |
| | | Principal
Amount | | | |
| Repurchase Agreements (31.3%) | |
Bear Stearns & Companies,
Inc., 2.69%, 7/2/07,
(Purchased on 6/29/07,
proceeds at maturity
$719,781, collateralized by
U.S. Treasury Obligation,
2/15/16, value $742,636)
(Held as Collateral
for Securities Lending) | | $ | 719,620 | | | | 719,620 | | |
Bear Stearns & Companies,
Inc., 5.38%, 7/2/07,
(Purchased 6/29/07,
proceeds at maturity
$3,284,181, collateralized
by U.S. Treasury
Obligation, 2/15/16,
value $3,379,154) (Held
as Collateral for Securit ies
Lending) | | | 3,282,711 | | | | 3,282,711 | | |
| | | Principal
Amount | | Value | |
Bear Stearns Companies,
Inc., 4.30%, 7/2/07,
(Purchased on 6/29/07,
proceeds at maturity
$2,318,397, collateralized
by U.S. Treasury
Obligation, 2/15/16,
value $2,386,811) | | $ | 2,317,566 | | | $ | 2,317,566 | | |
Total Repurchase Agreements
(Cost $6,319,897) | | | | | 6,319,897 | | |
Total Investments ( 119.9%)
(Cost $18,154,887) | | | | | 24,212,497 | | |
Total Securities
Sold Short (-4.4%) | | | | | (892,513 | ) | |
Liabilities in excess of
other assets (-15.5%) | | | | | (3,131,971 | ) | |
| Net Assets (100.0%) | | | | $ | 20,188,013 | | |
(a) All or a portion of security is on loan as of June 30, 2007. The total value of securities on loan as of June 30, 2007 is $3,897,536.
* Non-income producing security
† Security position is either entirely or partially held in a segregated account as collateral for securities sold short, aggregating a total market value of $1,418,610.
ADR American Depositary Receipt
See accompanying notes to financial statements.
11
Needham Funds
Needham Aggressive Growth Fund
Schedule of Securities Sold Short
June 30, 2007 (Unaudited)
| | | Shares | | Value | |
| Securities Sold Short (-4.4%) | |
| Business Services (-0.6%) | |
| American Reprographics Co.* | | | 2,500 | | | $ | 76,975 | | |
| VistaPrint Ltd.* | | | 1,250 | | | | 47,813 | | |
| | | | 124,788 | | |
| Construction (-0.2%) | |
| Beacon Roofing Supply, Inc.* | | | 2,000 | | | | 33,980 | | |
| Software (-0.5%) | |
| Vocus, Inc.* | | | 4,000 | | | | 100,440 | | |
Specialty Retailing &
Manufacturing (-2.3%) | |
| Amazon.com, Inc.* | | | 5,000 | | | | 342,050 | | |
| Fossil, Inc.* | | | 4,000 | | | | 117,960 | | |
| | | | 460,010 | | |
| | | Shares | | Value | |
| Telecommunications (-0.9%) | |
| Cbeyond, Inc.* | | | 4,500 | | | $ | 173,295 | | |
Total Securities Sold Short
(Proceeds $696,606) | | | | | 892,513 | | |
Total Securities
Sold Short (-4.4%) | | | | | (892,513 | ) | |
| Total Investments (119.9%) | | | | | 24,212,497 | | |
Liabilities in excess of
other assets (-15.5%) | | | | | (3,131,971 | ) | |
| Net Assets (100.0%) | | | | $ | 20,188,013 | | |
* Non-income producing security
See accompanying notes to financial statements.
12
Semiannual Report 2007
Needham Small Cap Growth Fund
Schedule of Investments
June 30, 2007 (Unaudited)
| | | Shares | | Value | |
| Common Stocks (87.7%) | |
| Aerospace & Satellite (0.8%) | |
| Integral Systems, Inc. | | | 4,000 | | | $ | 97,240 | | |
| Business Services (15.6%) | |
| Copart, Inc.*† | | | 12,500 | | | | 382,375 | | |
| FTI Consulting, Inc.* | | | 10,000 | | | | 380,300 | | |
| Jupitermedia Corp.* | | | 50,000 | | | | 364,000 | | |
| Mobile Mini, Inc.* | | | 15,000 | | | | 438,000 | | |
Ritchie Brothers
Auctioneers, Inc. | | | 5,000 | | | | 313,100 | | |
| | | | 1,877,775 | | |
Computers - Integrated
Systems (2.3%) | |
| MICROS Systems, Inc.* | | | 5,000 | | | | 272,000 | | |
| Consumer Services (2.4%) | |
| Avis Budget Group, Inc.* | | | 10,000 | | | | 284,300 | | |
| Day Care Services (6.5%) | |
Bright Horizons Family
Solutions, Inc.* | | | 20,000 | | | | 778,200 | | |
| Defense (2.4%) | |
| Argon ST, Inc.* | | | 12,500 | | | | 290,125 | | |
Electronic Components &
Equipment (7.7%) | |
| AuthenTec, Inc.* | | | 43 | | | | 445 | | |
| Badger Meter, Inc. | | | 12,500 | | | | 353,250 | | |
Electro Scientific
Industries, Inc.* | | | 10,000 | | | | 208,000 | | |
Houston Wire & Cable
Company* | | | 2,500 | | | | 71,025 | | |
| X-Rite, Inc. | | | 20,000 | | | | 295,400 | | |
| | | | 928,120 | | |
| Enabling Technology (7.0%) | |
| Dolby Laboratories, Inc.* | | | 10,000 | | | | 354,100 | | |
| iRobot Corp.* | | | 6,500 | | | | 129,025 | | |
| NovAtel, Inc.* | | | 10,000 | | | | 363,000 | | |
| | | | 846,125 | | |
| Financial Services (2.2%) | |
Interactive Brokers
Group, Inc.* | | | 10,000 | | | | 271,300 | | |
| | | Shares | | Value | |
| Healthcare Services (10.0%) | |
| Advisory Board Co.* | | | 10,000 | | | $ | 555,600 | | |
| HealthSouth Corp.* | | | 9,500 | | | | 172,045 | | |
| I-trax, Inc.* | | | 50,000 | | | | 208,500 | | |
| inVentiv Health, Inc.*† | | | 7,500 | | | | 274,575 | | |
| | | | 1,210,720 | | |
| Insurance (3.6%) | |
Philadelphia Consolidated
Holding Corp.* | | | 10,500 | | | | 438,900 | | |
| Internet Infrastructure (0.0%) | |
| comScore, Inc.* | | | 43 | | | | 996 | | |
Manufacturing & Industrial
Equipment (3.1%) | |
Mueller Water Products, Inc. -
Class B | | | 20,000 | | | | 300,000 | | |
| Sypris Solutions, Inc. | | | 9,815 | | | | 78,716 | | |
| | | | 378,716 | | |
| Medical Devices & Supplies (1.0%) | |
| Tomotherapy, Inc.* | | | 5,500 | | | | 120,560 | | |
| Networking Products (1.0%) | |
| Acme Packet, Inc.* | | | 10,000 | | | | 114,900 | | |
Oil & Gas - Exploration &
Production (1.0%) | |
| Geokinetics, Inc.* | | | 4,000 | | | | 124,120 | | |
| Semiconductors (8.9%) | |
| Brooks Automation, Inc.* | | | 15,000 | | | | 272,250 | | |
| Entegris, Inc.* | | | 20,000 | | | | 237,600 | | |
| MKS Instruments, Inc.* | | | 15,000 | | | | 415,500 | | |
| Semitool, Inc.* | | | 15,000 | | | | 144,150 | | |
| | | | 1,069,500 | | |
| Software (4.6%) | |
| Neoware, Inc.* | | | 20,300 | | | | 274,862 | | |
| Parametric Technology Corp.* | | | 13,000 | | | | 280,930 | | |
| | | | 555,792 | | |
| Transportation (4.9%) | |
Genesee & Wyoming, Inc. -
Class A* | | | 20,000 | | | | 596,800 | | |
See accompanying notes to financial statements.
13
Needham Funds
Needham Small Cap Growth Fund
Schedule of Investments (Continued)
June 30, 2007 (Unaudited)
| | | Shares | | Value | |
Wireless Communications &
Equipment (2.7%)† | |
| ViaSat, Inc.* | | | 10,000 | | | $ | 321,000 | | |
Total Common Stocks
(Cost $7,351,374) | | | | | 10,577,189 | | |
American Depositary
Receipt (1.1%) | |
Pharmaceuticals &
Biotechnology (1.1%) | |
| Crucell N.V. - ADR* | | | 6,000 | | | | 133,380 | | |
Total American Depositary
Receipt (Cost $134,216) | | | | | 133,380 | | |
| | | Principal
Amount | | Value | |
| Repurchase Agreement (11.3%) | |
Bear Stearns Companies, Inc.,
4.30%, 7/2/07, (Purchased
on 6/29/07, proceeds at
maturity $1,359,555,
collateralized by U.S.
Treasury Obligation,
2/15/16, value
$1,400,954) | | $ | 1,359,068 | | | $ | 1,359,068 | | |
Total Repurchase Agreement
(Cost $1,359,068) | | | | | 1,359,068 | | |
Total Investments ( 100.1%)
(Cost $8,844,658) | | | | | 12,069,637 | | |
Total Securities
Sold Short (-6.4%) | | | | | (770,552 | ) | |
Other assets in excess of
liabilities (6.3%) | | | | | 759,059 | | |
| Net Assets (100.0%) | | | | $ | 12,058,144 | | |
* Non-income producing security
† Security position is either entirely or partially held in a segregated account as collateral for securities sold short, aggregating a total market value of $977,950.
ADR American Depositary Receipt
See accompanying notes to financial statements.
14
Semiannual Report 2007
Needham Small Cap Growth Fund
Schedule of Securities Sold Short
June 30, 2007 (Unaudited)
| | | Shares | | Value | |
| Securities Sold Short (-6.4%) | |
| Business Services (-0.8%) | |
| Kenexa Corp.* | | | 2,500 | | | $ | 94,275 | | |
| Construction (-0.2%) | |
| Beacon Roofing Supply, Inc.* | | | 1,300 | | | | 22,087 | | |
| Software (-1.0%) | |
| Vocus, Inc.* | | | 5,000 | | | | 125,550 | | |
Specialty Retailing &
Manufacturing (-3.2%) | |
| Amazon.com, Inc.* | | | 4,000 | | | | 273,640 | | |
| Fossil, Inc.* | | | 3,750 | | | | 110,587 | | |
| | | | 384,227 | | |
| | | Shares | | Value | |
| Telecommunications (-1.2%) | |
| Cbeyond, Inc.* | | | 3,750 | | | $ | 144,413 | | |
Total Securities Sold Short
(Proceeds $573,291) | | | | | 770,552 | | |
Total Securities
Sold Short (-6.4%) | | | | | (770,552 | ) | |
| Total Investments (100.1%) | | | | | 12,069,637 | | |
Other assets in excess of
liabilities (6.3%) | | | | | 759,059 | | |
| Net Assets (100.0%) | | | | $ | 12,058,144 | | |
* Non-income producing security
See accompanying notes to financial statements.
15
Needham Funds
Statements of Assets and Liabilities
June 30, 2007 (Unaudited)
| | | Needham
Growth Fund | | Needham
Aggressive
Growth Fund | | Needham
Small Cap
Growth Fund | |
| Assets: | |
Investments, at Value* (Cost $151,290,944, $11,834,990 and
$7,485,590, respectively) | | $ | 214,212,528 | | | $ | 17,892,600 | | | $ | 10,710,569 | | |
| Repurchase Agreements, at Cost | | | 62,333,960 | | | | 6,319,897 | | | | 1,359,068 | | |
| Total Investments | | | 276,546,488 | | | | 24,212,497 | | | | 12,069,637 | | |
| Receivables: | |
| Deposit with Broker for Securities Sold Short | | | 20,374,446 | | | | 916,606 | | | | 788,291 | | |
| Dividends and Interest | | | 233,663 | | | | 13,516 | | | | 6,311 | | |
| Fund Shares Sold | | | 187,174 | | | | 975 | | | | 1,077 | | |
| Investment Securities Sold | | | 732,753 | | | | — | | | | 12,451 | | |
| Prepaid Expenses and Other Assets | | | 187,105 | | | | 17,058 | | | | 12,015 | | |
| Total Assets | | | 298,261,629 | | | | 25,160,652 | | | | 12,889,782 | | |
| Liabilities: | |
Securities Sold Short, at Value (Proceeds $17,292,462,
$696,606 and $573,291, respectively) | | | 20,632,480 | | | | 892,513 | | | | 770,552 | | |
| Payable upon Return of Securities Loaned | | | 31,106,997 | | | | 4,002,331 | | | | — | | |
| Payables: | |
| Investment Securities Purchased | | | 433,790 | | | | 1,980 | | | | 1,183 | | |
| Fund Shares Redeemed | | | 161,112 | | | | — | | | | — | | |
| Due to Adviser | | | 255,063 | | | | 20,471 | | | | 12,424 | | |
| Distribution Fees | | | 51,012 | | | | 4,094 | | | | 2,485 | | |
| Chief Compliance Officer Fees | | | 17,469 | | | | 854 | | | | 841 | | |
| Accrued Expenses and Other Liabilities | | | 122,309 | | | | 50,396 | | | | 44,153 | | |
| Total Liabilities | | | 52,780,232 | | | | 4,972,639 | | | | 831,638 | | |
| Net Assets | | $ | 245,481,397 | | | $ | 20,188,013 | | | $ | 12,058,144 | | |
Shares Issued and Outstanding $.001 Par Value
(Authorized 800,000,000, 100,000,000 and
100,000,000, respectively) | | | 5,932,210 | | | | 1,284,125 | | | | 798,835 | | |
| Net Asset Value, Offering and Redemption Price Per Share | | $ | 41.38 | | | $ | 15.72 | | | $ | 15.10 | | |
| Components of Net Assets | |
| Paid-in Capital | | $ | 167,053,992 | | | $ | 12,722,919 | | | $ | 7,566,525 | | |
| Undistributed Net Investment Income (Loss) | | | (395,096 | ) | | | (93,922 | ) | | | (91,369 | ) | |
Accumulated Net Realized Gains (Losses) from
Investment Transactions | | | 19,240,935 | | | | 1,697,313 | | | | 1,555,270 | | |
Net Unrealized Appreciation (Depreciation) of
Investment Securities and Securities Sold Short | | | 59,581,566 | | | | 5,861,703 | | | | 3,027,718 | | |
| Total Net Assets | | $ | 245,481,397 | | | $ | 20,188,013 | | | $ | 12,058,144 | | |
* Includes securities on loan with total values of $30,187,565, $3,897,536 and $0, respectively.
See accompanying notes to financial statements.
16
Semiannual Report 2007
Statements of Operations
For the Six Month Period Ended June 30, 2007 (Unaudited)
| | | Needham
Growth Fund | | Needham
Aggressive
Growth Fund | | Needham
Small Cap
Growth Fund | |
| Investment Income | |
| Dividends | | $ | 496,623 | | | $ | 12,123 | | | $ | 5,777 | | |
| Interest | | | 1,343,994 | | | | 96,837 | | | | 57,791 | | |
| Securities Lending | | | 38,144 | | | | 8,978 | | | | 2,205 | | |
| Total Investment Income | | | 1,878,761 | | | | 117,938 | | | | 65,773 | | |
| Expenses | |
| Investment Advisory Fees | | | 1,585,528 | | | | 118,045 | | | | 80,438 | | |
| Distribution Fees | | | 317,105 | | | | 23,609 | | | | 16,088 | | |
| Administration and Accounting Fees | | | 91,155 | | | | 9,623 | | | | 8,644 | | |
| Chief Compliance Officer Fees | | | 17,621 | | | | 770 | | | | 634 | | |
| Audit Fees | | | 16,130 | | | | 25,316 | | | | 25,558 | | |
| Custodian Fees | | | 61,992 | | | | 1,421 | | | | 2,420 | | |
| Dividend Expense on Securities Sold Short | | | 12,000 | | | | — | | | | — | | |
| Insurance Expense | | | 35,838 | | | | 2,055 | | | | 2,286 | | |
| Interest Expense* | | | 11,232 | | | | 242 | | | | 301 | | |
| Legal Fees | | | 29,501 | | | | 8,722 | | | | 10,834 | | |
| Filing Fees | | | 21,482 | | | | 9,695 | | | | 9,359 | | |
| Shareholders' Reports | | | 42,195 | | | | 2,144 | | | | 1,611 | | |
| Transfer Agent Fees | | | 55,335 | | | | 8,242 | | | | 9,671 | | |
| Directors' Fees | | | 16,447 | | | | 953 | | | | 726 | | |
| Other Expenses | | | 18,333 | | | | 1,023 | | | | 1,023 | | |
| Total Expenses | | | 2,331,894 | | | | 211,860 | | | | 169,593 | | |
| Less: Fees Waived and/or Expenses Reimbursed by the Adviser | | | — | | | | — | | | | (12,451 | ) | |
| Net Expenses | | | 2,331,894 | | | | 211,860 | | | | 157,142 | | |
| Net Investment Income (Loss) | | | (453,133 | ) | | | (93,922 | ) | | | (91,369 | ) | |
Realized and Unrealized Gain (Loss) on Investment
Securities and Securities Sold Short | |
Net Realized Gain (Loss) on Investment Securities and
Foreign Currency | | | 17,795,935 | | | | 1,483,709 | | | | 1,319,545 | | |
| Net Realized Gain (Loss) on Securities Sold Short Transactions | | | 738,376 | | | | 62,642 | | | | 23,672 | | |
| Net Realized Gain Distributions from Underlying Funds | | | 238,458 | | | | — | | | | — | | |
Change in Unrealized Appreciation (Depreciation) of Investment
Securities and Securities Sold Short | | | (3,805,664 | ) | | | 821,336 | | | | (578,763 | ) | |
Net Realized and Unrealized Gain (Loss) on Investment
Securities and Securities Sold Short | | | 14,967,105 | | | | 2,367,687 | | | | 764,454 | | |
| Change in Net Assets Resulting from Operations | | $ | 14,513,972 | | | $ | 2,273,765 | | | $ | 673,085 | | |
* Expense consists of interest expense on temporary borrowings and/or interest expense related to Securities Sold Short.
See accompanying notes to financial statements.
17
Needham Funds
Statements of Changes in Net Assets
| | | Needham
Growth Fund | | Needham
Aggressive
Growth Fund | | Needham
Small Cap
Growth Fund | |
| | | For the
six months
ended
June 30, 2007
(Unaudited) | | Year Ended
December 31,
2006 | | For the
six months
ended
June 30, 2007
(Unaudited) | | Year Ended
December 31,
2006 | | For the
six months
ended
June 30, 2007
(Unaudited) | | Year Ended
December 31,
2006 | |
| Change in Net Assets | |
| Operations: | |
| Net Investment Income (Loss) | | $ | (453,133 | ) | | $ | 830,281 | | | $ | (93,922 | ) | | $ | (241,717 | ) | | $ | (91,369 | ) | | $ | (281,325 | ) | |
Net Realized Gain (Loss) on
Investment Securities, Foreign
Currency and Securities Sold
Short Transactions | | | 18,772,769 | | | | 28,325,611 | | | | 1,546,351 | | | | 2,051,548 | | | | 1,343,217 | | | | 3,954,503 | | |
Change in Unrealized Appreciation
(Depreciation) of Investment
Securities and Securities Sold Short | | | (3,805,664 | ) | | | 14,395,942 | | | | 821,336 | | | | 86,308 | | | | (578,763 | ) | | | (2,282,730 | ) | |
Change in Net Assets Resulting
from Operations | | | 14,513,972 | | | | 43,551,834 | | | | 2,273,765 | | | | 1,896,139 | | | | 673,085 | | | | 1,390,448 | | |
| Distributions to Shareholders from: | |
| Net Investment Income | | | — | | | | (773,125 | ) | | | — | | | | — | | | | — | | | | — | | |
| Short-term Gains | | | — | | | | — | | | | — | | | | (122,358 | ) | | | — | | | | — | | |
| Long-term Gains | | | — | | | | (25,031,542 | ) | | | — | | | | (1,536,150 | ) | | | — | | | | (3,853,526 | ) | |
| Total Distributions to Shareholders | | | — | | | | (25,804,667 | ) | | | — | | | | (1,658,508 | ) | | | — | | | | (3,853,526 | ) | |
| Capital Transactions: | |
| Shares Issued | | | 19,306,187 | | | | 158,751,587 | | | | 442,059 | | | | 320,224 | | | | 394,533 | | | | 1,055,680 | | |
| Contribution by Adviser (Note 14) | | | — | | | | 170,390 | | | | — | | | | 9,265 | | | | — | | | | 64,404 | | |
Shares Issued in Reinvestment of
Distributions | | | — | | | | 24,553,593 | | | | — | | | | 1,655,985 | | | | — | | | | 3,784,900 | | |
| Shares Redeemed | | | (97,032,012 | ) | | | (97,153,652 | ) | | | (578,443 | ) | | | (2,297,155 | ) | | | (4,257,177 | ) | | | (5,982,735 | ) | |
Change in Net Assets from
Capital Transactions | | | (77,725,825 | ) | | | 86,321,918 | | | | (136,384 | ) | | | (311,681 | ) | | | (3,862,644 | ) | | | (1,077,751 | ) | |
| Change in Net Assets | | | (63,211,853 | ) | | | 104,069,085 | | | | 2,137,381 | | | | (74,050 | ) | | | (3,189,559 | ) | | | (3,540,829 | ) | |
| Net Assets | |
| Beginning of Period | | | 308,693,250 | | | | 204,624,165 | | | | 18,050,632 | | | | 18,124,682 | | | | 15,247,703 | | | | 18,788,532 | | |
| End of Period | | $ | 245,481,397 | | | $ | 308,693,250 | | | $ | 20,188,013 | | | $ | 18,050,632 | | | $ | 12,058,144 | | | $ | 15,247,703 | | |
Undistributed Net Investment
Income (Loss) | | $ | (395,096 | ) | | $ | 58,037 | | | $ | (93,922 | ) | | $ | — | | | $ | (91,369 | ) | | $ | — | | |
| Share Transactions: | |
| Number of Shares Issued | | | 487,362 | | | | 4,026,551 | | | | 29,800 | | | | 22,425 | | | | 26,863 | | | | 59,385 | | |
| Number of Shares Reinvested | | | — | | | | 636,210 | | | | — | | | | 121,318 | | | | — | | | | 267,107 | | |
| Number of Shares Redeemed | | | (2,467,565 | ) | | | (2,482,957 | ) | | | (39,058 | ) | | | (170,146 | ) | | | (292,885 | ) | | | (360,744 | ) | |
| Change in Shares | | | (1,980,203 | ) | | | 2,179,804 | | | | (9,258 | ) | | | (26,403 | ) | | | (266,022 | ) | | | (34,252 | ) | |
See accompanying notes to financial statements.
18
Semiannual Report 2007
Needham Growth Fund
Financial Highlights
| (For a Share Outstanding | | Six Months
Ended
June 30, | | Year Ended December 31, | |
| Throughout each Period) | | 2007 | | 2006 | | 2005 | | 2004 | | 2003 | | 2002 | |
| | | (Unaudited) | |
| Net Asset Value, Beginning of Period | | $ | 39.01 | | | $ | 35.69 | | | $ | 31.17 | | | $ | 29.35 | | | $ | 19.92 | | | $ | 27.78 | | |
| Investment Operations | |
| Net Investment Loss | | | (0.04 | ) | | | 0.10 | | | | (0.38 | ) | | | (0.84 | ) | | | (0.38 | ) | | | (0.25 | ) | |
Net Realized and Unrealized Gains (Losses)
on Investments | | | 2.41 | | | | 6.29 | | | | 4.90 | | | | 2.62 | | | | 9.81 | | | | (7.61 | ) | |
| Total from Investment Operations | | | 2.37 | | | | 6.39 | | | | 4.52 | | | | 1.78 | | | | 9.43 | | | | (7.86 | ) | |
| Less Distributions | |
| Net Investment Income | | | — | | | | (0.09 | ) | | | — | | | | — | | | | — | | | | — | | |
| Net Realized Gains | | | — | | | | (3.00 | ) | | | — | | | | — | | | | — | | | | — | | |
| Total Distributions | | | — | | | | (3.09 | ) | | | — | | | | — | | | | — | | | | — | | |
| Contribution by Adviser | | | — | | | | 0.02 | (c) | | | — | | | | 0.04 | (d) | | | — | | | | — | | |
| Net Asset Value, End of Period | | $ | 41.38 | | | $ | 39.01 | | | $ | 35.69 | | | $ | 31.17 | | | $ | 29.35 | | | $ | 19.92 | | |
| Total Return(a) | | | 6.08 | % | | | 18.05 | %(c) | | | 14.50 | % | | | 6.20 | %(d) | | | 47.34 | % | | | (28.29 | )% | |
| Net Assets, End of Period (000's) | | $ | 245,481 | | | $ | 308,693 | | | $ | 204,624 | | | $ | 287,372 | | | $ | 364,320 | | | $ | 264,575 | | |
| Ratios/Supplemental Data | |
Ratio of Net Expenses to
Average Net Assets(b) | | | 1.84 | % | | | 1.79 | % | | | 1.94 | % | | | 2.21 | % | | | 2.16 | % | | | 1.92 | % | |
Ratio of Net Expenses to
Average Net Assets (excluding
interest and dividend expense)(b) | | | 1.82 | % | | | 1.78 | % | | | 1.91 | % | | | 1.78 | % | | | 1.77 | % | | | 1.75 | % | |
Ratio of Net Investment Income
(Loss) to Average Net Assets(b) | | | (0.36 | )% | | | 0.31 | % | | | (1.01 | )% | | | (1.51 | )% | | | (1.38 | )% | | | (1.01 | )% | |
| Portfolio Turnover Rate(a) | | | 12 | % | | | 48 | % | | | 16 | % | | | 15 | % | | | 42 | % | | | 78 | % | |
(a) Not annualized for periods less than one year.
(b) Annualized for periods less than one year.
(c) In May 2006, the Adviser made a payment to the Growth Fund which increased the total return by 0.06%.
(d) In October 2004, the Adviser made a payment to the Growth Fund which increased the total return by 0.14%.
See accompanying notes to financial statements.
19
Needham Funds
Needham Aggressive Growth Fund
Financial Highlights
| (For a Share Outstanding | | Six Months
Ended
June 30, | | Year Ended December 31, | |
| Throughout each Period) | | 2007 | | 2006 | | 2005 | | 2004 | | 2003 | | 2002 | |
| | | (Unaudited) | |
| Net Asset Value, Beginning of Period | | $ | 13.96 | | | $ | 13.73 | | | $ | 12.85 | | | $ | 11.51 | | | $ | 9.09 | | | $ | 11.23 | | |
| Investment Operations | |
| Net Investment Loss | | | (0.07 | ) | | | (0.19 | ) | | | (0.26 | ) | | | (0.36 | ) | | | (0.23 | ) | | | (0.17 | ) | |
Net Realized and Unrealized Gains
(Losses) on Investments | | | 1.83 | | | | 1.83 | | | | 1.49 | | | | 1.70 | | | | 2.65 | | | | (1.76 | ) | |
| Total from Investment Operations | | | 1.76 | | | | 1.64 | | | | 1.23 | | | | 1.34 | | | | 2.42 | | | | (1.93 | ) | |
| Less Distributions | |
| Net Realized Gains | | | — | | | | (1.42 | ) | | | (0.35 | ) | | | — | | | | — | | | | (0.21 | ) | |
| Total Distributions | | | — | | | | (1.42 | ) | | | (0.35 | ) | | | — | | | | — | | | | (0.21 | ) | |
| Capital Contributions | | | — | | | | 0.01 | (c) | | | — | | | | | | | | | | | | | | |
| Net Asset Value, End of Period | | $ | 15.72 | | | $ | 13.96 | | | $ | 13.73 | | | $ | 12.85 | | | $ | 11.51 | | | $ | 9.09 | | |
| Total Return(a) | | | 12.61 | % | | | 12.22 | %(c) | | | 9.70 | % | | | 11.64 | % | | | 26.62 | % | | | (17.15 | )% | |
| Net Assets, End of Period (000's) | | $ | 20,188 | | | $ | 18,051 | | | $ | 18,125 | | | $ | 17,000 | | | $ | 17,719 | | | $ | 14,273 | | |
| Ratios/Supplemental Data | |
Ratio of Net Expenses to Average
Net Assets(b) | | | 2.24 | % | | | 2.24 | % | | | 2.50 | % | | | 2.61 | % | | | 2.52 | % | | | 2.51 | % | |
Ratio of Net Expenses to Average
Net Assets (excluding interest and
dividend expense)(b) | | | 2.24 | % | | | 2.23 | % | | | 2.50 | % | | | 2.50 | % | | | 2.50 | % | | | 2.50 | % | |
Ratio of Net Expenses to Average
Net Assets (excluding waivers and
reimbursement of expenses)(b) | | | 2.24 | % | | | 2.24 | % | | | 2.78 | % | | | 3.15 | % | | | 3.22 | % | | | 2.78 | % | |
Ratio of Net Investment Loss to
Average Net Assets(b) | | | (0.99 | )% | | | (1.35 | )% | | | (2.01 | )% | | | (2.25 | )% | | | (2.24 | )% | | | (1.76 | )% | |
Ratio of Net Investment Loss to
Average Net Assets (excluding waivers
and reimbursement of expenses)(b) | | | (0.99 | )% | | | (1.35 | )% | | | (2.29 | )% | | | (2.79 | )% | | | (2.94 | )% | | | (2.03 | )% | |
| Portfolio Turnover Rate(a) | | | 21 | % | | | 55 | % | | | 69 | % | | | 64 | % | | | 87 | % | | | 58 | % | |
(a) Not annualized for periods less than one year.
(b) Annualized for periods less than one year.
(c) In May 2006, the Adviser made a payment to the Aggressive Growth Fund which increased the total return by 0.08%.
See accompanying notes to financial statements.
20
Semiannual Report 2007
Needham Small Cap Growth Fund
Financial Highlights
| (For a Share Outstanding | | Six Months
Ended
June 30, | | Year Ended December 31, | | May 22, 2002
to December 31, | |
| Throughout each Period) | | 2007 | | 2006 | | 2005 | | 2004 | | 2003 | | 2002* | |
| | | | (Unaudited) | | | | | | | | | | | | | | | | | | | | | | |
| Net Asset Value, Beginning of Period | | $ | 14.32 | | | $ | 17.09 | | | $ | 18.53 | | | $ | 16.84 | | | $ | 10.38 | | | $ | 10.00 | | |
| Investment Operations | |
| Net Investment Loss | | | (0.11 | ) | | | (0.26 | ) | | | (0.31 | ) | | | (0.37 | ) | | | (0.06 | ) | | | (0.10 | ) | |
Net Realized and Unrealized Gains
(Losses) on Investments | | | 0.89 | | | | 1.61 | | | | 0.66 | | | | 2.11 | | | | 6.52 | | | | 0.48 | | |
| Total from Investment Operations | | | 0.78 | | | | 1.35 | | | | 0.35 | | | | 1.74 | | | | 6.46 | | | | 0.38 | | |
| Less Distributions | |
| Net Realized Gains | | | — | | | | (4.18 | ) | | | (1.79 | ) | | | (0.05 | ) | | | — | | | | — | | |
| Total Distributions | | | — | | | | (4.18 | ) | | | (1.79 | ) | | | (0.05 | ) | | | — | | | | — | | |
| Contribution by Adviser | | | — | | | | 0.06 | (c) | | | — | | | | — | | | | — | | | | — | | |
| Net Asset Value, End of Period | | $ | 15.10 | | | $ | 14.32 | | | $ | 17.09 | | | $ | 18.53 | | | $ | 16.84 | | | $ | 10.38 | | |
| Total Return(a) | | | 5.45 | % | | | 8.52 | %(c) | | | 2.01 | % | | | 10.34 | % | | | 62.24 | % | | | 3.80 | % | |
| Net Assets, End of Period (000's) | | $ | 12,058 | | | $ | 15,248 | | | $ | 18,789 | | | $ | 25,895 | | | $ | 27,616 | | | $ | 4,569 | | |
| Ratios/Supplemental Data | |
Ratio of Net Expenses to Average
Net Assets(b) | | | 2.45 | % | | | 2.36 | % | | | 2.44 | % | | | 2.52 | % | | | 2.27 | % | | | 2.50 | % | |
Ratio of Net Expenses to Average
Net Assets(excluding interest
and dividend expense)(b) | | | 2.44 | % | | | 2.36 | % | | | 2.44 | % | | | 2.50 | % | | | 2.26 | % | | | 2.50 | % | |
Ratio of Net Expenses to Average
Net Assets (excluding waivers and
reimbursement of expenses)(b) | | | 2.64 | % | | | 2.36 | % | | | 2.58 | % | | | 2.63 | % | | | 3.25 | % | | | 6.06 | % | |
Ratio of Net Investment Loss to
Average Net Assets(b) | | | (1.42 | )% | | | (1.61 | )% | | | (1.64 | )% | | | (1.91 | )% | | | (1.68 | )% | | | (2.04 | )% | |
Ratio of Net Investment Loss to
Average Net Assets (excluding waivers
and reimbursement of expenses)(b) | | | (1.62 | )% | | | (1.61 | )% | | | (1.78 | )% | | | (2.02 | )% | | | (2.66 | )% | | | (5.60 | )% | |
| Portfolio Turnover Rate(a) | | | 13 | % | | | 115 | % | | | 104 | % | | | 68 | % | | | 67 | % | | | 107 | % | |
* The Needham Small Cap Growth Fund commenced operations on May 22, 2002.
(a) Not annualized for periods less than one year.
(b) Annualized for periods less than one year.
(c) In May 2006, the Adviser made a payment to the Small Cap Growth Fund which increased the total return by 0.35%.
See accompanying notes to financial statements.
21
Needham Funds
Notes to Financial Statements
(Unaudited)
1. Organization
Needham Growth Fund ("NGF"), Needham Aggressive Growth Fund ("NAGF") and Needham Small Cap Growth Fund ("NSCGF") or (each, a "Portfolio" and collectively the "Portfolios"), are portfolios of The Needham Funds, Inc. (the "Fund"), which is registered under the Investment Company Act of 1940 as a non-diversified, open-end management investment company. The Fund was organized as a Maryland corporation on October 12, 1995.
2. Significant Accounting Policies
The following is a summary of significant accounting policies followed by the Fund in the preparation of its financial statements. These policies are in conformity with accounting principles generally accepted in the United States of America ("GAAP").
Security Valuation: Investments in securities (including options) listed or traded on a nationally recognized securities exchange are valued at the last quoted sales price on the date the valuations are made. Portfolio securities and options positions for which market quotations are readily available are stated at the NASDAQ Official Closing Price or the last sale price reported by the principal exchange for each such security as of the exchange's close of business, as applicable. Securities and options for which no sale has taken place during the day and securities which are not listed on an exchange are valued at the mean of the current closing bid and asked prices. All other securities for which market prices are not readily available are valued at their fair value in accordance with Fair Value Procedures established by the Board of Directors. The Fund's Fair Value Procedures are implemented and monitored by a Fair Value Committee (the "Committee") designated by the Board. When a security is valued in accordance with the Fair Value Procedures, the Committee determines a value after taking into consideration any relevant information that is reasonably available to the Committee. Some of the more common reasons that may necessitate that a security be valued pursuant to these Fair Value Procedures include, but are not limited to: the security's trading has been halted or suspended; the security has been de-listed from a national exchange; the security's primary trading market is temporarily closed at a time when under normal conditions it would be open; or the security's primary pricing source is not able or willing to provide a price. The assets of each Portfolio may also be valued on the basis of valuations provided by a pricing service approved by, or on behalf of, the Board of Directors.
Investment Transactions: Changes in holdings of portfolio securities for the Portfolios shall be reflected no later than in the first calculation on the first business day following the trade date for purposes of calculating the Portfolio's daily net asset value per share. For financial reporting purposes, however, portfolio security transactions are reported on trade date of the last business day of the reporting period. The cost (proceeds) of investments sold (bought to cover) is determined on a specific identification basis for the purpose of determining gains or losses on sales and buys to cover short positions. Dividend income and distributions to shareholders are recorded on the ex-dividend date. Interest income is recorded on an accrual basis.
Allocation of Expenses: Expenses directly attributable to a Portfolio are charged directly to that Portfolio, while expenses which are attributable to more than one Portfolio are allocated among the respective Portfolios based upon relative net assets or some other reasonable method.
Distributions to Shareholders: Dividends from net investment income, if any, are declared and paid annually for the Portfolios. Distributable net realized gains, if any, are declared and distributed at least annually.
Use of Estimates: The preparation of financial statements in accordance with GAAP requires management to make estimates and assumptions that affect the reported amounts and disclosures in the financial statements. Actual results could differ from those estimates and those differences could be material.
Federal Income Taxes: It is the policy of each Portfolio to continue to qualify as a regulated investment company by complying with the provisions available to certain investment companies, as defined in applicable sections of the Internal Revenue Code, and to make distributions of net investment income and net realized capital gains sufficient to relieve it from all, or substantially all, federal income taxes. Accordingly, no provision for federal income tax is required.
New Accounting Pronouncements: On July 13, 2006, the Financial Accounting Standards Board ("FASB") released FASB Interpretation No. 48, Accounting for Uncertainty in Income Taxes ("FIN 48"). FIN 48 provides guidance for how uncertain tax positions should be recognized, measured, presented and disclosed in the financial statements. FIN 48 requires the affirmative evaluation of tax positions taken or expected to be taken in the course of preparing the Fund's tax returns to determine whether it is more-likely-than-not (i.e., greater than 50-percent) that each tax position will be sustained upon examination by a taxing authority based on the technical merits of the position. A tax position that meets the more-likely-than-not recognition threshold is measured to determine the amount of benefit to recognize in the financial statements. Differences between t ax positions taken in a tax return and amounts recognized in the financial statements will generally result in an increase in a liability for taxes payable (or a reduction of a tax refund receivable) and an increase in a deferred tax liability (or a reduction in a deferred tax asset). Adoption of FIN 48 was required no later than the last business day of the first financial statement reporting period for fiscal years beginning after December 15, 2006 and is to be applied to all open tax years as of the effective date. Accordingly, the Fund was required to implement FIN 48 in its net asset value per share (NAV) calculation on June 29, 2007. Management has evaluated the implications of FIN 48 and has concluded that there was no
22
Semiannual Report 2007
Notes to Financial Statements (Continued)
(Unaudited)
impact to the Fund's financial statements as of June 29, 2007. The adoption of FIN 48 requires ongoing monitoring and analysis, future conclusions reached by management may be different and result in adjustments to the Fund's NAV and financial statements.
In September 2006, the FASB issued Statement of Financial Accounting Standards No. 157 ("SFAS 157"), "Fair Value Measurements." This standard establishes a single authoritative definition of fair value, sets out a framework for measuring fair value and requires additional disclosures about fair value measurements. SFAS 157 applies to fair value measurements already required or permitted by existing standards. SFAS 157 is effective for financial statements issued for fiscal years beginning after November 15, 2007 and interim periods within those fiscal years. The changes to current accounting principles generally accepted in the United States of America from the application of this Statement relate to the definition of fair value, the methods used to measure fair value and the expanded disclosures about fair value measurements. As of June 30, 2007, the Fund does not believe the adoption of SFAS 157 will impact the financial state ment amounts; however, additional disclosures may be required about the inputs used to develop the measurements and the effect of certain of the measurements on changes in net assets for the period.
3. Investment Advisory and Administrative Services
The Fund has engaged Needham Investment Management L.L.C. (the "Adviser") to manage its investments. The Fund pays the Adviser a fee at the annual rate of 1.25% of the average daily net assets of each Portfolio.
The Adviser has contractually agreed to waive its fee for, and to reimburse expenses of, NAGF and NSCGF in an amount that limits annual operating expenses (excluding interest expense and dividend expense on securities sold short) to not more than 2.50% of the average daily net assets of NAGF and NSCGF for the period ended June 30, 2007.
For the period ended June 30, 2007, the Adviser waived advisory fees in the amount of $12,451 for NSCGF.
The Fund and BISYS Fund Services Ohio, Inc. (the "Administrator") are parties to a Master Services Agreement. The Administrator provides administrative and fund accounting services pursuant to this agreement and, in consideration of these services, receives a fee computed daily and paid monthly at an annual rate equal to 0.07% of the first $750 million of the average daily net assets of the Portfolios, and 0.065% of the average daily net assets of the Portfolios in excess of $750 million. The Administrator also provides transfer agent and other services pursuant to this agreement for additional fees. Effective as of August 1, 2007, BISYS Fund Services Ohio, Inc. ("BISYS"), the Fund's administrator, fund accounting agent and transfer agent, was re-named Citi Fund Services Ohio, Inc. ("CFSO") following the acquisition of The BISYS Group, Inc., the parent company of BISYS, by a subsidiary of Citibank N.A. ("Citi").
Certain officers of the Fund are also officers of the Adviser, Administrator, and/or Needham & Company, LLC (the "Distributor"). Such officers receive no fees from the Fund for serving as officers of the Fund. Each of the three Independent Directors receives a quarterly retainer of $3,000 and a per-meeting fee of $500. Each Independent Director is also a member of the Fund's Audit Committee and receives a fee of $500 per meeting attended. The Adviser provides an employee to serve as Chief Compliance Officer for the Fund and to provide certain related services, and receives an annual fee for this service as approved by the Fund's Board of Directors.
4. Distribution Plan
The Fund has adopted a Distribution Plan pursuant to Rule 12b-1 under the Investment Company Act of 1940. Under the plan, each Portfolio pays Needham & Company, LLC and any other distributor or financial institution with which the Fund has an agreement with respect to each Portfolio, a fee at an annual rate of 0.25% of each Portfolio's daily average net assets. For the period ended June 30, 2007, NGF, NAGF and NSCGF incurred distribution fees in the amount of $317,105, $23,609 and $16,008, respectively. For the period ended June 30, 2007, NGF, NAGF and NSCGF each paid 12b-1 fees to Needham & Company, LLC in the amount of $68,023, $15,264 and $7,752, respectively.
5. Temporary Borrowings
The Fund has entered into an agreement with the Custodial Trust Company ("CTC") for temporary borrowing purposes, including the meeting of redemption requests that otherwise might require the untimely disposition of securities. Interest is calculated daily based on the Federal Funds Rate plus one percent. Each Portfolio may borrow from banks up to 25% of its total assets and may pledge its assets in connection with these borrowings, provided that no additional investments shall be made while borrowings exceed 5% of total assets.
There were no outstanding borrowings by the Portfolios at June 30, 2007.
6. Securities Lending
The Portfolios may lend their respective portfolio securities, provided that with regard to each Portfolio (i) the loan is secured continuously by collateral consisting of U.S. Government securities, cash, or cash equivalents adjusted daily to have a market value at least equal to the current market value of the securities loaned, (ii) the Portfolio may at any time call the loan and regain the securities loaned, (iii) the Portfolio receives any interest or dividends paid on the loaned securities, and (iv) the aggregate market value of securities loaned will not at any time exceed such percentage of the total assets of the Portfolio as the Board of Directors may establish, but not to exceed 20%. In addition, it is anticipated that the Portfolio may share with the borrower some of the income received on the collateral for the loan or that it will be paid a premium for the loan. Before a Portfolio enters into a loan, the Adviser co nsiders relevant facts
23
Needham Funds
Notes to Financial Statements (Continued)
(Unaudited)
including the creditworthiness of the borrower. The risks in lending portfolio securities consist of possible delay in recovery of the securities and possible loss of rights in the collateral should the borrower fail financially.
As of June 30, 2007:
| | | Value of
Securities
on Loan | | Value of
Collateral | |
| NGF | | $ | 30,187,565 | | | $ | 31,106,997 | | |
| NAGF | | | 3,897,536 | | | | 4,002,331 | | |
| NSCGF | | | — | | | | — | | |
7. Repurchase Agreements
The Portfolios will only enter into repurchase agreements where (i) the underlying securities are of the type which the Portfolio's investment policies would allow the Portfolio to purchase directly, (ii) the market value of the underlying security, including accrued interest, will at all times be equal to or exceed the fair or market value of the repurchase agreement, and (iii) payment for the underlying securities is made only upon physical delivery or evidence of book-entry transfer to the account of the custodian or a bank acting as agent. A Portfolio will not enter into a repurchase agreement with a maturity of more than seven business days if, as a result, more than 15% of the value of its net assets would then be invested in such repurchase agreements and other illiquid securities.
The repurchase price generally equals the price paid by the Portfolio plus interest negotiated on the basis of current short-term rates, which may be more or less than the rate on the underlying portfolio securities. Repurchase agreements will be fully collateralized at all times.
8. Option Transactions
Each Portfolio may invest in options contracts to reduce its exposure to fluctuations in the prices of portfolio securities and to prevent losses if the prices of such securities decline. Similarly, such investments may protect a Portfolio against fluctuations in the value of securities in which the Portfolio is about to invest.
The Portfolios may write call and put options on securities they own or have the right to acquire, and may purchase put and call options on individual securities and indices written by others. Put and call options give the holder the right to sell or purchase, respectively, a specified amount of a security at a specified price on a certain date.
The Portfolios are subject to market risk associated with changes in the value of the underlying financial instrument, as well as the risk of loss of appreciation if a counterparty fails to perform. For exchange-traded contracts, the exchange acts as the counterparty to specific transactions, and therefore, bears the risk of delivery to and from counterparties of specific positions.
Put and call options purchased are accounted for in the same manner as portfolio securities. The cost of securities acquired through the exercise of call options is increased by the premium paid. The proceeds from securities sold through the exercise of put options are decreased by the premiums paid. Options on stock indices differ from options on securities in that the exercise of an option on a stock index does not involve delivery of the actual underlying security and is settled in cash only.
When a Portfolio writes an option, the premium received by the Portfolio is recorded as a liability and is subsequently adjusted to the current market value of the option written. Premiums received from writing options which have expired are recorded by the Portfolio on the expiration date as realized gains from option transactions. When a Portfolio enters into a closing purchase transaction, the Portfolio realizes a gain or loss equal to the difference between the cost of a closing purchase transaction and the premium received when the option was written. If a written call option is exercised, the premium received is added to the proceeds from the sale of the underlying security in determining whether the Portfolio has a realized gain or loss. If a written put option is exercised, the premium received reduces the cost basis of the securities purchased. In writing an option, the Portfolio bears the market risk of an unfavorable change in the price of the security underlying the written option.
In the normal course of business, certain Portfolios may trade and hold certain fair-valued derivative contracts which constitute guarantees under FASB Interpretation 45. Such contracts include written options where a Portfolio would be obligated to purchase or sell a specified security at a specified price if the option is exercised by the counterparty. The maximum payouts for these contracts are limited to the number of contracts written and the related strike price. The maximum payout amount could be offset by the subsequent sale of assets obtained via the execution of a payout event.
None of NGF, NAGF or NSCGF had purchased or written options for the period ended June 30, 2007.
9. Short Sale Transactions
During the period ended June 30, 2007, each Portfolio sold securities short. Upon selling a security short, the Portfolios record a receivable for the settlement amount and a corresponding liability, which is marked-to-market to reflect current value. Securities owned by each respective Portfolio are segregated as collateral while the short sales are outstanding. At June 30, 2007, the market value of securities separately segregated to cover short positions were approximately $25,581,140, $1,418,610 and $977,950 for NGF, NAGF and NSCGF, respectively. Additionally, included in Deposit with Brokers for Securities Sold Short is $2,970,000, $220,000 and $215,000 pledged as collateral with brokers in connection with open short positions for NGF, NAGF and NSCGF. Securities sold short at June 30, 2007 and
24
Semiannual Report 2007
Notes to Financial Statements (Continued)
(Unaudited)
their related market values and proceeds are set forth in the preceding Schedule of Securities Sold Short.
10. Investment Transactions
The following summarizes the aggregate amount of purchases and sales of investment securities and securities sold short, excluding short-term securities, during the period ended June 30, 2007:
| | | Purchases | | Sales | |
| NGF | | $ | 24,514,233 | | | $ | 40,285,502 | | |
| NAGF | | | 4,926,915 | | | | 3,138,453 | | |
| NSCGF | | | 1,445,142 | | | | 7,004,751 | | |
During the period ended June 30, 2007, NGF, NAGF and NSCGF each incurred and paid brokerage commissions to Needham & Company, LLC in the amount of $1,932, $179 and $541, respectively.
11. Financial Instruments
The Fund has always maintained a policy of valuing its securities positions and derivative instruments at market values or estimated fair values and of including any realized or unrealized gains or losses in income.
In the normal course of its business, the Portfolios may trade various financial instruments with off-balance sheet risk. These financial instruments include securities sold short and exchange traded options. Generally, these financial instruments represent future commitments to purchase or sell other financial instruments at specific terms at specified future dates. Each of these financial instruments contains varying degrees of off-balance sheet risk whereby changes in the market values of the securities underlying the financial instruments may be in excess of the amounts recognized in the financial statements.
Securities sold short represent obligations of the Portfolios to make future delivery of specific securities and, correspondingly, create an obligation to purchase the securities at market prices prevailing at a later delivery date (or to deliver the securities if already owned by the Portfolios). As a result, short sales create the risk that the Portfolios' ultimate obligation to satisfy the delivery requirements may exceed the amount of the proceeds initially received on the liability recorded in the financial statements.
12. Contractual Obligations
Under the Fund's organizational documents, its officers and Directors are indemnified against certain liabilities arising out of the performance of their duties to the Fund. In addition, in the ordinary course of business, the Fund enters into contracts that contain a variety of indemnifications. The Fund's maximum exposure under these arrangements is unknown. However, the Fund has not had prior claims or losses pursuant to these contracts and expects the risk of loss to be remote.
13. Federal Income Taxes
No provision for federal income taxes is required since the Fund intends to continue to qualify as a regulated investment company under Subchapter M of the Internal Revenue Code and distribute substantially all of its taxable income and capital gains to shareholders. Because income tax regulations differ from generally accepted accounting principles, the timing and character of income and capital gain distributions determined in accordance with tax regulations can differ from income and capital gains recognized for financial reporting purposes. Accordingly, the character of distributions and the composition of net assets for tax purposes can differ from those reflected in the financial statements. These book/tax differences may be temporary or permanent in nature. Temporary differences are generally due to differing book and tax treatment for the timing of the recognition of gains and losses on securities, including post-October losses. Permanent differences are generally due to differing treatment of net investment losses. To the extent these differences are permanent, they are charged or credited to paid-in capital, accumulated net realized gain (loss), or accumulated net investment income (loss), as appropriate, in the period the differences arise. These reclassifications have no effect on net assets or net asset value per share of each Portfolio.
As of June 30, 2007, the cost, gross unrealized appreciation and gross unrealized depreciation on securities, including proceeds from securities sold short, for federal income tax purposes were as follows:
| | | Tax Cost | | Tax
Unrealized
Appreciation | | Tax
Unrealized
Depreciation | | Net
Unrealized
Appreciation
(Depreciation) | |
| NGF | | $ | 165,105,479 | | | $ | 72,288,034 | | | $ | 13,989,355 | | | $ | 58,298,679 | | |
| NAGF | | | 15,140,715 | | | | 6,433,564 | | | | 571,861 | | | | 5,861,703 | | |
| NSCGF | | | 6,912,299 | | | | 3,280,254 | | | | 271,758 | | | | 3,008,496 | | |
Capital losses after October 31 ("post-October losses") within the taxable year are deemed to arise on the first business day of the Portfolios' next taxable year. After October 31, 2006, NGF incurred and will elect to defer long-term capital losses in the approximate amount of $1,252,037. Neither NAGF nor NSCGF had any post-October losses.
14. Other Matters
In October 2004, the Adviser made a capital contribution to NGF of $417,668. In May 2006, the Adviser made a capital contribution to NGF of $170,390, to NAGF of $9,265 and to NSCGF of $64,404.
25
Needham Funds
Supplemental Data
(Unaudited)
Disclosure of Portfolio Holdings
The Needham Funds, Inc. (the "Fund") files a Form N-Q with the Securities and Exchange Commission (the "SEC") no more than sixty days after the Fund's first and third fiscal quarters. For the Fund, this would be for the fiscal quarters ending March 31 and September 30. Form N-Q includes a complete schedule of the Fund's portfolio holdings as of the end of those fiscal quarters. The Fund's N-Q filings can be found free of charge on the SEC's website at http://www.sec.gov, or they may be reviewed and copied at the SEC's Public Reference Room in Washington, D.C. (call 800-SEC-0330 for information on the operation of the Public Reference Room).
Voting Proxies on Fund Portfolio Securities
A description of the policies and procedures that the Fund uses to determine how to vote proxies relating to portfolio securities and information regarding how the Fund voted proxies relating to portfolio securities during the most recent 12-month period ended June 30 are available without charge, upon request, by calling 800-625-7071 or on the SEC's website at http://www.sec.gov.
26
[THIS PAGE INTENTIONALLY LEFT BLANK]
[THIS PAGE INTENTIONALLY LEFT BLANK]

445 Park Avenue
New York, New York 10022-2606
1-800-625-7071
Investment Adviser:
Needham Investment Management L.L.C.
445 Park Avenue
New York, NY 10022-2606
President
George A. Needham
Executive Vice President
and Portfolio Manager
James K. Kloppenburg
Needham Growth Fund
Needham Aggressive Growth Fund
Needham Small Cap Growth Fund
Directors
George A. Needham
John W. Larson
James P. Poitras
F. Randall Smith
Distributor:
Needham & Company, LLC
445 Park Avenue
New York, NY 10022-2606
212-371-8300
Administrator, Shareholder Servicing
Agent and Transfer Agent:
Citi Fund Services Ohio, Inc.
3435 Stelzer Road
Columbus, OH 43219
Custodian:
Custodial Trust Company
101 Carnegie Center
Princeton, NJ 08540
Counsel:
Fulbright & Jaworski L.L.P.
666 Fifth Avenue
New York, NY 10103
Independent Registered Public Accounting Firm:
Ernst & Young LLP
1100 Huntington Center
41 South High Street
Columbus, OH 43215
Item 2. Code of Ethics.
Not applicable – only for annual reports.
Item 3. Audit Committee Financial Expert.
Not applicable – only for annual reports.
Item 4. Principal Accountant Fees and Services.
Not applicable – only for annual reports.
Item 5. Audit Committee of Listed Registrants.
Not applicable.
Item 6. Schedule of Investments.
Not applicable.
Item 7. Disclosure of Proxy Voting Policies and Procedures for Closed-End Management Investment Companies.
Not applicable.
Item 8. Portfolio Managers of Closed-End Management Investment Companies.
Not applicable.
Item 9. Purchases of Equity Securities by Closed-End Management Investment Company and Affiliated Purchasers.
Not applicable.
Item 10. Submission of Matters to a Vote of Security Holders.
Not applicable.
Item 11. Controls and Procedures.
(a)The registrant’s principal executive officer and principal financial officer have concluded, based on their evaluation of the registrant’s disclosure controls and procedures as conducted within 90 days of the filing date of this report, that these disclosure controls and procedures are adequately designed and are operating effectively to ensure that information required to be disclosed by the registrant on Form N-CSR is recorded, processed, summarized and reported within the time periods specified in the Securities and Exchange Commission’s rules and forms.
(b)There were no changes in the registrant’s internal control over financial reporting (as defined in Rule 30a-3(d) under the Act (17 CFR 270.30a-3(d)) that occurred during the second fiscal quarter of the period covered by this report that have materially affected or are reasonably likely to materially affect, the registrant’s internal control over financial reporting.
Item 12. Exhibits.
(a)(1) Not applicable - Only effective for annual reports.
(a)(2) Certifications pursuant to Rule 30a-2(a) are attached hereto.
(a)(3) Not applicable.
(b) Certifications pursuant to Rule 30a-2(b) are furnished herewith.
SIGNATURES
Pursuant to the requirements of the Securities Exchange Act of 1934 and the Investment Company Act of 1940, the registrant has duly caused this report to be signed on its behalf by the undersigned, thereunto duly authorized.
(Registrant) | The Needham Funds, Inc. | |
| | |
By (Signature and Title)* | /s/ George A. Needham, President | |
| George A. Needham, President (Principal Executive Officer) | |
Date | September 7, 2007 | | |
| | | | | |
Pursuant to the requirements of the Securities Exchange Act of 1934 and the Investment Company Act of 1940, this report has been signed below by the following persons on behalf of the registrant and in the capacities and on the dates indicated.
By (Signature and Title)* | /s/ George A. Needham, President | |
| George A. Needham, President (Principal Executive Officer) | |
Date | September 7, 2007 | | |
| | | | |
By (Signature and Title)* | /s/ Glen W. Albanese, Treasurer and Secretary | |
| Glen W. Albanese, Treasurer and Secretary (Principal Financial Officer) | |
Date | September 7, 2007 | | |
| | | | |
* Print the name and title of each signing officer under his or her signature.