UNITED STATES
SECURITIES AND EXCHANGE COMMISSION
Washington, D.C. 20549
FORM N-CSR
CERTIFIED SHAREHOLDER REPORT OF REGISTERED
MANAGEMENT INVESTMENT COMPANIES
Investment Company Act file number | 811-9114 |
|
The Needham Funds, Inc. |
(Exact name of registrant as specified in charter) |
|
445 Park Avenue New York, New York | | 10022 |
(Address of principal executive offices) | | (Zip code) |
|
The Corporation Trust Company 300 E. Lombard Street Baltimore, Maryland 21202 |
(Name and address of agent for service) |
|
Registrant’s telephone number, including area code: | (212) 371-8300 | |
|
Date of fiscal year end: | December 31 | |
|
Date of reporting period: | June 30, 2005 | |
| | | | | | | | |
Form N-CSR is to be used by management investment companies to file reports with the Commission not later than 10 days after the transmission to stockholders of any report that is required to be transmitted to stockholders under Rule 30e-1 under the Investment Company Act of 1940 (17 CFR 270.30e-1). The Commission may use the information provided on Form N-CSR in its regulatory, disclosure review, inspection, and policymaking roles.
A registrant is required to disclose the information specified by Form N-CSR, and the Commission will make this information public. A registrant is not required to respond to the collection of information contained in Form N-CSR unless the Form displays a currently valid Office of Management and Budget (“OMB”) control number. Please direct comments concerning the accuracy of the information collection burden estimate and any suggestions for reducing the burden to Secretary, Securities and Exchange Commission, 450 Fifth Street, NW, Washington, DC 20549-0609. The OMB has reviewed this collection of information under the clearance requirements of 44 U.S.C. § 3507.
Item 1. Reports to Stockholders.
Include a copy of the report transmitted to stockholders pursuant to Rule 30e-1 under the Act (17 CFR 270.30e-1).
Semiannual Report
Needham Funds
Seeking to build wealth for long-term investors.
Six Months Ended June 30, 2005
(Unaudited)
Needham Growth Fund
Needham Aggressive Growth Fund
Needham Small Cap Growth Fund

www.needhamfunds.com

445 Park Avenue
New York, New York 10022-2606
1-800-625-7071
www.needhamfunds.com
Semiannual Report
For the Six Months Ended June 30, 2005
(Unaudited)
Contents
| Letter from the Adviser | | | 1 | | |
|
| Portfolio Characteristics | | | |
|
| Needham Growth Fund | | | 3 | | |
|
| Needham Aggressive Growth Fund | | | 4 | | |
|
| Needham Small Cap Growth Fund | | | 5 | | |
|
| Disclosure of Fund Expenses | | | 6 | | |
|
| Schedule of Investments | | | |
|
| Needham Growth Fund | | | 7 | | |
|
| Needham Aggressive Growth Fund | | | 10 | | |
|
| Needham Small Cap Growth Fund | | | 13 | | |
|
| Schedule of Securities Sold Short | | | |
|
| Needham Growth Fund | | | 9 | | |
|
| Needham Aggressive Growth Fund | | | 12 | | |
|
| Needham Small Cap Growth Fund | | | 15 | | |
|
| Statements of Assets and Liabilities | | | 16 | | |
|
| Statements of Operations | | | 17 | | |
|
| Statements of Changes in Net Assets | | | 18 | | |
|
| Financial Highlights | | | |
|
| Needham Growth Fund | | | 19 | | |
|
| Needham Aggressive Growth Fund | | | 20 | | |
|
| Needham Small Cap Growth Fund | | | 21 | | |
|
| Notes to Financial Statements | | | 22 | | |
|
| Supplemental Data | | | 25 | | |
|
This report is authorized for distribution to prospective investors only when preceded or accompanied by a prospectus of the Needham Funds, Inc. The prospectus contains more complete information, including investment objectives, risks, expenses and charges and should be read carefully before investing or sending any money. To obtain a prospectus, please call 1-800-625-7071.
The Needham Funds, Inc., like all mutual funds:
• Are NOT FDIC insured
• Have no bank guarantee
• May lose value
Needham Funds Semiannual Report 2005
Dear Shareholders,
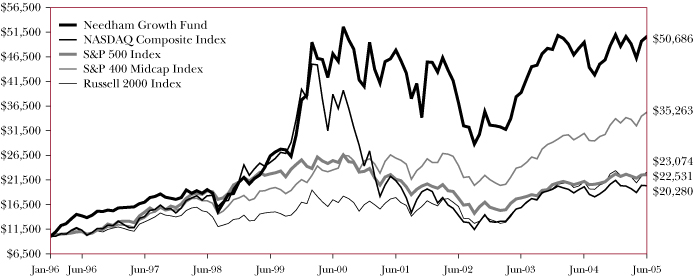
We at The Needham Funds, Inc. focus on buying growth stocks at reasonable prices. In the volatile six-month period we have just experienced, we are pleased that each of the funds performed reasonably well for our investors. During the six months ended June 30, 2005, the Growth Fund was down 0.67%, the Aggressive Growth Fund was down 1.17% and the Small Cap Growth Fund was down 2.75%. By comparison, the S&P 500 Index was down 0.81%, the NASDAQ Composite was down 5.12% and the Russell 2000 Index was down 1.21%.
The Needham Growth Fund (the "Growth Fund") seeks to create long-term, tax-efficient capital appreciation for its investors. To this end, the Growth Fund targets companies with products or services that are selling or marketing into growth markets. These companies normally have earnings growth of at least 15-20%, product and market dominance, and the ability to consolidate their market positions. They may also have a competitive advantage by acquiring and retaining more customers or driving costs down and profits up. The Growth Fund also looks for seasoned and motivated managements with records of building shareholder value. Companies with these characteristics sometimes find themselves in a temporary earnings downturn or shortfall or may be in a product transition. This often causes aggressive growth or dynamic growth investors to sell. At this point, the Growth Fund may deem the stock to be reasonably priced and purchase it for long-term capital appreciation. Hence, the discipline called "Growth At a Reasonable Price," or "GARP."
The Growth Fund was down 0.67% for the six months ended June 30, up 2.31% for the 1 year, up 10.91% for the 3 years, up 1.45% for the 5 years, and up 18.64% since inception, compounded annually. Our cash (5.32%) and short positions (7.34%) were not enough to offset the pressure on our long portfolio. One of our key sectors, technology, was not treated well in these markets. Our concentration in technology at 31.91% is down considerably from a year ago (42.79%). That conscious policy of reducing tech holdings did moderate our decline. Our best performing stocks were Talisman Energy, Inc., National Semiconductor Corp., Chesapeake Energy Corp. and Photronics, Inc.
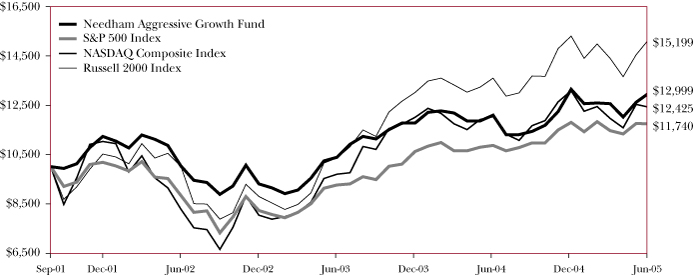
The Needham Aggressive Growth Fund (the "Aggressive Growth Fund") seeks to create long-term, capital appreciation for its investors. To this end, the Aggressive Growth Fund targets the equities of companies with strong, above-average prospective growth rates. The Aggressive Growth Fund invests, in general, in markets and industries with strong growth rates, focusing on the market leaders in these areas. These market leaders, especially as they break away from their competitors, tend to garner a disproportionate share of the positive financial returns. Also important is the long-term sustainability of the companies' leadership positions. Thus, the Aggressive Growth Fund looks for companies with strong management teams, superior balance sheets, above-average margins that can generate excess cash, and strong R&D and brand spending in industries with high barriers to entry.
The Aggressive Growth Fund was down 1.17% for the six months ended June 30, up 7.45% for the 1 year, up 9.03% for the 3 years, and up 7.11% since inception, compounded annually. Hedging activities slightly benefited the Aggressive Growth Fund, but were unable to fully offset the market softness. The technology segment was the weakest for the first half of the period, but recovered strongly in the last two months. No segment significantly underperformed the others; however, the business services holdings lagged the other groups modestly and healthcare was the most positive contributor to the Aggressive Growth Fund's performance for the past six months. The Aggressive Growth Fund particularly benefited from its holdings in Community Health Systems, Inc., Express Scripts, Inc., Kyphon, Inc. and American Eagle Outfitters, Inc.
1
Needham Funds
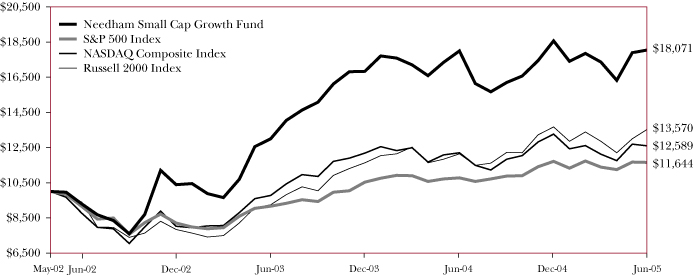
The Needham Small Cap Growth Fund (the "Small Cap Growth Fund") seeks long-term, tax-efficient capital appreciation by investing primarily in equity securities of smaller growth companies that the Small Cap Growth Fund believes are trading at a discount to their underlying value yet have the potential for superior long-term growth. Under normal conditions, the Small Cap Growth Fund invests at least 80% of its total assets in equity securities of domestic issuers that have market capitalizations of $2 billion or less and that are listed on a nationally recognized securities exchange or traded on the NASDAQ system. Central to the Small Cap Growth Fund's investment strategy is a sound valuation discipline that seeks to acquire growth companies at reasonable prices. The Small Cap Growth Fund seeks tax efficiency by holding securities for a period of 12 months or more to obtain long-term capital ga in treatment and by offsetting capital gains on the sale of securities with capital losses.
The Small Cap Growth Fund was down 2.75% for the six months ended June 30, up 0.28% for the 1 year, up 24.92% for the 3 years, and up 20.98% since inception, compounded annually. We were able to do better in the second quarter than the first, mainly due to a rally that began around mid-April. As the market improved, we increased our shorts up to 2.48%, but still would like to add more in the second half. Cash was reduced to 6.02% by the end of June. The Small Cap Growth Fund benefited from several good performers: Bright Horizons Family Solutions, Inc., Advisory Board Co., Immucor, Inc. and Eon Labs, Inc.
The portfolio turnover rate was 5.90% for the Growth Fund, 36.72% for the Aggressive Growth Fund and 59.20% for the Small Cap Growth Fund for the six months ended June 30, 2005. The expense ratios for the three funds were 1.92% for the Growth Fund, 2.50% for the Aggressive Growth Fund and 2.49% for the Small Cap Growth Fund for the six months ended June 30, 2005.
The market remains volatile and uncertain. We believe that there will be an even greater premium on picking the right stocks in the second half of 2005. The problems in Iraq, the price of oil, the Fed's continuing policy to increase interest rates and the "housing bubble" fears are all tugging at investors' decision processes. We do not see any major improvements in these issues in the near term and, thus, we need to find the right stocks on the long side, add to our shorts during rallies and keep some powder dry for the unusual opportunity when it appears.
Sincerely,
 | |  | |
|
| Vincent E. Gallagher | | James K. Kloppenburg | |
|
| Portfolio Manager | | Portfolio Manager | |
|
2
Semiannual Report 2005
NEEDHAM GROWTH FUND TICKER: NEEGX
Comparative Performance Statistics as of June 30, 2005
| | | 6 Months(6) | | 1 Year | | 3 Years(7) | | 5 Years(7) | | Since Inception(7)(10) | |
| Needham Growth Fund(1) | | | (0.67 | )% | | | 2.31 | % | | | 10.91 | %(8) | | | 1.45 | %(9) | | | 18.64 | %(11) | |
| NASDAQ Composite Index(2) | | | (5.12 | )% | | | 1.10 | % | | | 12.58 | % | | | (11.91 | )% | | | 7.72 | % | |
| S&P 500 Index(3) | | | (0.81 | )% | | | 6.32 | % | | | 8.25 | % | | | (2.37 | )% | | | 8.92 | % | |
| S&P 400 Midcap Index(4) | | | 3.85 | % | | | 14.03 | % | | | 13.11 | % | | | 8.48 | % | | | 14.17 | % | |
| Russell 2000 Index(5) | | | (1.21 | )% | | | 9.55 | % | | | 12.82 | % | | | 5.78 | % | | | 9.19 | % | |
The average annual returns shown in the above table and accompanying footnotes are historical, reflect changes in share price and are net of expenses. The table above does not reflect the deduction of taxes that a shareholder would have paid on Fund distributions or on the redemption of Fund shares. Investment results and the principal value of an investment will vary. Past performance noted above do es not guarantee future results. When shares are redeemed, they may be worth more or less than their original cost. Since inception, the Fund's Adviser has absorbed certain expenses of the Fund, without which returns would have been lower.
1. Investment results calculated after reinvestment of dividends.
2. The NASDAQ Composite Index is a broad-based capitalization-weighted index of all NASDAQ National Market and Small Cap stocks.
3. The S&P 500 Index is a broad unmanaged measure of the U.S. stock market.
4. The S&P 400 Midcap Index is a broad unmanaged measure of the U.S. stock market.
5. The Russell 2000 Index is a broad unmanaged index composed of the smallest 2,000 companies in the Russell 3000 Index.
6. Not annualized.
7. Compound annual growth rate. Assumes all dividends are reinvested in shares of the Fund (annualized return).
8. Cumulative return for the three years was 36.45%, assuming all dividends were reinvested in shares of the Fund.
9. Cumulative return for the five years was 7.45%, assuming all dividends were reinvested in shares of the Fund.
10. The inception date of the Fund was 1/1/96.
11. Cumulative return since inception was 406.86%, assuming all dividends were reinvested in shares of the Fund.
Top Ten Holdings*
(as a % of total investments, as of June 30, 2005)
| Security | |
| | % of Total
Investments† | |
| 1) Motorola, Inc. | | MOT | | | 5.59 | % | |
| 2) Ceradyne, Inc. | | CRDN | | | 4.02 | % | |
| 3) National Semiconductor Corp. | | NSM | | | 3.68 | % | |
| 4) Talisman Energy, Inc. | | TLM | | | 3.66 | % | |
| 5) Chesapeake Energy Corp. | | CHK | | | 3.43 | % | |
| 6) Seagate Technology | | STX | | | 3.32 | % | |
| 7) GlobalSantaFe Corp. | | GSF | | | 3.18 | % | |
| 8) Lucent Technologies, Inc. (bond) | | LU | | | 3.16 | % | |
| 9) Scientific-Atlanta, Inc. | | SFA | | | 2.78 | % | |
| 10) Johnson & Johnson | | JNJ | | | 2.72 | % | |
Top Ten Holdings = 35.54% of Total Investments†
* Current portfolio holdings may not be indicative of future portfolio holdings.
† Percentage of total investments includes all stocks, fixed income securities and options plus cash minus all short positions.
Sector Weightings*
(as a % of total investments, as of June 30, 2005)
| Sector | | Long(1) | | (Short)(1) | | Total(1)(2) | |
Healthcare/Medical Devices/
Pharmaceuticals | | | 18.09 | % | | | (0.46 | )% | | | 17.63 | % | |
Cable/Entertainment/Media/
Software | | | 9.03 | % | | | (0.35 | )% | | | 8.68 | % | |
| Energy/Industrial/Metals | | | 21.42 | % | | | - | | | | 21.42 | % | |
Business Services/Consumer/
Financial | | | 6.68 | % | | | (1.97 | )% | | | 4.71 | % | |
| Technology | | | 32.92 | % | | | (1.01 | )% | | | 31.91 | % | |
| Telecommunications | | | 11.29 | % | | | (3.55 | )% | | | 7.74 | % | |
| Miscellaneous & Options | | | 2.59 | % | | | - | | | | 2.59 | % | |
| Cash & Fixed Income Investments | | | 5.32 | % | | | - | | | | 5.32 | % | |
* Current portfolio holdings may not be indicative of future portfolio holdings.
(1) Percentage of total investments includes all stocks, fixed income securities and options plus cash minus all short positions.
(2) Total represents the difference between the long exposure and the short exposure, which produces the net exposure.
Comparison of Change in Value of a $10,000 Investment
The table above does not reflect the deduction of taxes that a shareholder would have paid on Fund distributions or on the redemption of Fund shares. Investment results and the principal value of an investment will vary. Past performance noted above does not guarantee future results. When shares are redeemed, they may be worth more or less than their original cost. Since inception, the Fund's Adviser has absorbed certain expenses of the Fund, without which returns would have been lower.
3
Needham Funds
NEEDHAM AGGRESSIVE GROWTH FUND TICKER: NEAGX
Comparative Performance Statistics as of June 30, 2005
| Benchmarks | | 6 Months(5) | | 1 Year | | 3 Years(6) | | Since Inception(6)(8) | |
| Needham Aggressive Growth Fund(1) | | | (1.17 | )% | | | 7.45 | % | | | 9.03 | %(7) | | | 7.11 | %(9) | |
| S&P 500 Index(2) | | | (0.81 | )% | | | 6.32 | % | | | 8.25 | % | | | 4.29 | % | |
| NASDAQ Composite Index(3) | | | (5.12 | )% | | | 1.10 | % | | | 12.58 | % | | | 5.85 | % | |
| Russell 2000 Index(4) | | | (1.21 | )% | | | 9.55 | % | | | 12.82 | % | | | 11.59 | % | |
The average annual returns shown in the above table and accompanying footnotes are historical, reflect changes in share price and are net of expenses. The table above does not reflect the deduction of taxes that a shareholder would have paid on Fund distributions or on the redemption of Fund shares. Investment results and the principal value of an investment will vary. Past performance noted above does not guarantee future results. When shares are redeemed, they may be worth more or less than their original cost. Since inception, the Fund's Adviser has absorbed certain expenses of the Fund, without which returns would have been lower.
1. Investment results calculated after reinvestment of dividends.
2. The S&P 500 Index is a broad unmanaged measure of the U.S. stock market.
3. The NASDAQ Composite Index is a broad-based capitalization-weighted index of all NASDAQ National Market and Small Cap stocks.
4. The Russell 2000 Index is a broad unmanaged index composed of the smallest 2,000 companies in the Russell 3000 Index.
5. Not annualized.
6. Compound annual growth rate. Assumes all dividends are reinvested in shares of the Fund (annualized return).
7. Cumulative return for the three years was 29.60%, assuming all dividends were reinvested in shares of the Fund.
8. The inception date of the Fund was 9/4/01.
9. Cumulative return since inception was 29.99%, assuming all dividends were reinvested in shares of the Fund.
Top Ten Holdings*
(as a % of total investments, as of June 30, 2005)
| Security | |
| | % of Total
Investments† | |
| 1) Precision Castparts Corp. | | PCP | | | 3.85 | % | |
| 2) Express Scripts, Inc. | | ESRX | | | 3.71 | % | |
| 3) Community Health Systems, Inc. | | CYH | | | 3.50 | % | |
| 4) Alliance Data Systems Corp. | | ADS | | | 3.13 | % | |
| 5) Iron Mountain, Inc. | | IRM | | | 2.88 | % | |
| 6) Animas Corp. | | PUMP | | | 2.80 | % | |
| 7) Getty Images, Inc. | | GYI | | | 2.75 | % | |
| 8) Gilead Sciences, Inc. | | GILD | | | 2.72 | % | |
| 9) Kyphon, Inc. | | KYPH | | | 2.69 | % | |
| 10) American Eagle Outfitters, Inc. | | AEOS | | | 2.65 | % | |
Top Ten Holdings = 30.68% of Total Investments†
* Current portfolio holdings may not be indicative of future portfolio holdings.
† Percentage of total investments includes all stocks, fixed income securities and options plus cash minus all short positions.
Sector Weightings*
(as a % of total investments, as of June 30, 2005)
| Sector | | Long(1) | | (Short)(1) | | Total(1)(2) | |
Healthcare/Medical Devices/
Pharmaceuticals | | | 21.68 | % | | | (0.51 | )% | | | 21.17 | % | |
| Energy/Industrial | | | 5.78 | % | | | - | | | | 5.78 | % | |
| Business Services/Financial | | | 22.14 | % | | | - | | | | 22.14 | % | |
| Consumer | | | 13.57 | % | | | (0.49 | )% | | | 13.08 | % | |
Technology &
Telecommunications | | | 28.37 | % | | | (0.95 | )% | | | 27.42 | % | |
| Miscellaneous & Options | | | 0.01 | % | | | - | | | | 0.01 | % | |
| Cash & Fixed Income Investments | | | 10.40 | % | | | - | | | | 10.40 | % | |
* Current portfolio holdings may not be indicative of future portfolio holdings.
(1) Percentage of total investments includes all stocks, fixed income securities and options plus cash minus all short positions.
(2) Total represents the difference between the long exposure and the short exposure, which produces the net exposure.
Comparison of Change in Value of a $10,000 Investment
The table above does not reflect the deduction of taxes that a shareholder would have paid on Fund distributions or on the redemption of Fund shares. Investment results and the principal value of an investment will vary. Past performance noted above does not guarantee future results. When shares are redeemed, they may be worth more or less than their original cost. Since inception, the Fund's Adviser has absorbed certain expenses of the Fund, without which returns would have been lower.
4
Semiannual Report 2005
NEEDHAM SMALL CAP GROWTH FUND TICKER: NESGX
Comparative Performance Statistics as of June 30, 2005
| Benchmarks | | 6 Months(5) | | 1 Year | | 3 Years(6) | | Since Inception(6)(8) | |
| Needham Small Cap Growth Fund(1) | | | (2.75 | )% | | | 0.28 | % | | | 24.92 | %(7) | | | 20.98 | %(9) | |
| S&P 500 Index(2) | | | (0.81 | )% | | | 6.32 | % | | | 8.25 | % | | | 5.02 | % | |
| NASDAQ Composite Index(3) | | | (5.12 | )% | | | 1.10 | % | | | 12.58 | % | | | 7.69 | % | |
| Russell 2000 Index(4) | | | (1.21 | )% | | | 9.55 | % | | | 12.82 | % | | | 10.33 | % | |
The average annual returns shown in the above table and accompanying footnotes are historical, reflect changes in share price and are net of expenses. The table above does not reflect the deduction of taxes that a shareholder would have paid on Fund distributions or on the redemption of Fund shares. Investment results and the principal value of an investment will vary. Past performance noted above does not guarantee future results. When shares are redeemed, they may be worth more or less than their original cost. Since inception, the Fund's Adviser has absorbed certain expenses of the Fund, without which returns would have been lower.
1. Investment results calculated after reinvestment of dividends.
2. The S&P 500 Index is a broad unmanaged measure of the U.S. stock market.
3. The NASDAQ Composite Index is a broad-based capitalization-weighted index of all NASDAQ National Market and Small Cap stocks.
4. The Russell 2000 Index is a broad unmanaged index composed of the smallest 2,000 companies in the Russell 3000 Index.
5. Not annualized.
6. Compound annual growth rate. Assumes all dividends are reinvested in shares of the Fund (annualized return).
7. Cumulative return for the three years was 94.94%, assuming all dividends were reinvested in shares of the Fund.
8. The inception date of the Fund was 5/22/02.
9. Cumulative return since inception was 80.71%, assuming all dividends were reinvested in shares of the Fund.
Top Ten Holdings*
(as a % of total investments, as of June 30, 2005)
| Security | |
| | % of Total
Investments† | |
| 1) Bright Horizons Family Solutions, Inc. | | BFAM | | | 8.30 | % | |
| 2) Advisory Board Co. | | ABCO | | | 5.71 | % | |
| 3) ARGON ST, Inc. | | STST | | | 3.26 | % | |
| 4) FactSet Research Systems, Inc. | | FRC | | | 3.10 | % | |
| 5) Innovative Solutions & Support, Inc. | | ISSC | | | 2.82 | % | |
| 6) Mobile Mini, Inc. | | MINI | | | 2.63 | % | |
| 7) Immucor, Inc. | | BLUD | | | 2.58 | % | |
| 8) Integral Systems, Inc. | | ISYS | | | 2.54 | % | |
| 9) Genesee & Wyoming, Inc. | | GWR | | | 2.50 | % | |
| 10) Ceradyne, Inc. | | CRDN | | | 2.45 | % | |
Top Ten Holdings = 35.89% of Total Investments†
* Current portfolio holdings may not be indicative of future portfolio holdings.
† Percentage of total investments includes all stocks, fixed income securities and options plus cash minus all short positions.
Sector Weightings*
(as a % of total investments, as of June 30, 2005)
| Sector | | Long(1) | | (Short)(1) | | Total(1)(2) | |
Healthcare/Medical Devices/
Pharmaceuticals | | | 21.62 | % | | | (0.21 | )% | | | 21.41 | % | |
Cable/Entertainment/Media/
Software | | | 2.67 | % | | | - | | | | 2.67 | % | |
| Energy/Industrial/Metals | | | 15.78 | % | | | - | | | | 15.78 | % | |
Business Services/Consumer/
Financial | | | 30.19 | % | | | (0.49 | )% | | | 29.70 | % | |
| Technology | | | 22.54 | % | | | (0.75 | )% | | | 21.79 | % | |
| Telecommunications | | | 3.66 | % | | | (1.03 | )% | | | 2.63 | % | |
| Miscellaneous & Options | | | - | | | | - | | | | - | | |
| Cash & Fixed Income Investments | | | 6.02 | % | | | - | | | | 6.02 | % | |
* Current portfolio holdings may not be indicative of future portfolio holdings.
(1) Percentage of total investments includes all stocks, fixed income securities and options plus cash minus all short positions.
(2) Total represents the difference between the long exposure and the short exposure, which produces the net exposure.
Comparison of Change in Value of a $10,000 Investment
The table above does not reflect the deduction of taxes that a shareholder would have paid on Fund distributions or on the redemption of Fund shares. Investment results and the principal value of an investment will vary. Past performance noted above does not guarantee future results. When shares are redeemed, they may be worth more or less than their original cost. Since inception, the Fund's Adviser has absorbed certain expenses of the Fund, without which returns would have been lower.
5
Disclosure of Fund Expenses (Unaudited)
The following expense table is shown so that you can understand the impact of fees on your investment. All mutual funds have operating expenses. As a shareholder of the fund, you incur ongoing costs, which include costs for portfolio management, administrative services, and shareholder reports, among others. A fund's expenses are expressed as a percentage of its average net assets. This figure is known as the expense ratio. The following examples are intended to help you understand the ongoing costs (in dollars) of investing in each fund and to compare these costs with those of other mutual funds. The examples are based on an investment of $1,000 made at the beginning of the period shown and held for the entire period.
The expense example table below illustrates your fund's costs in two ways:
• Actual Expenses. This section helps you to estimate the actual expenses after fee waivers that you paid over the period. The "Ending Account Value" shown is derived from the fund's actual return, and "Expenses Paid During Period" shows the dollar amount that would have been paid by an investor who started with $1,000 in the fund. You may use the information here, together with the amount you invested, to estimate the expenses that you paid over the period. To do so, simply divide your account value by $1,000 (for example, a $7,500 account value divided by $1,000 = 7.5), then multiply the result by the number given for your fund under the heading ent itled "Expenses Paid During Period."
• Hypothetical Expenses on a 5% Return. This section is intended to help you compare your fund's costs with those of other mutual funds. It assumes that the fund had a return of 5% before expenses during the period shown, but that the expense ratio is unchanged. In this case - because the return used is not the fund's actual return - the results do not apply to your investment. The example is useful in making comparisons because the Securities and Exchange Commission requires all mutual funds to calculate expenses based on a 5% return. You can assess your fund's cost by comparing this hypothetical example with the hypothetical examples that appea r in shareholders reports of other funds.
Please note that the expenses shown in the tables are meant to highlight your ongoing costs only and do not reflect any transactional costs (if any). Therefore, the second line of the table is useful in comparing ongoing costs only, and will not help you determine the relative total costs of owning different funds. In addition, if these transactional costs were included, your costs would have been higher.
For the Period January 1, 2005 to June 30, 2005
Expense Example Table
| | |
Beginning
Account
Value
1/1/05 | |
Ending
Account
Value
6/30/05 | | Expenses
Paid During
Period*
1/1/05-
6/30/05 | | Expense Ratio
During
Period
1/1/05-
6/30/05 | |
| Needham Growth Fund | | | |
| Actual Expenses | | $ | 1,000.00 | | | $ | 993.30 | | | $ | 9.49 | | | | 1.92 | % | |
| Hypothetical Expenses on a 5% Return | | $ | 1,000.00 | | | $ | 1,015.27 | | | $ | 9.59 | | | | 1.92 | % | |
| Needham Aggressive Growth Fund | | | |
| Actual Expense | | $ | 1,000.00 | | | $ | 988.30 | | | $ | 12.32 | | | | 2.50 | % | |
| Hypothetical Expenses on a 5% Return | | $ | 1,000.00 | | | $ | 1,012.40 | | | $ | 12.47 | | | | 2.50 | % | |
| Needham Small Cap Growth Fund | | | |
| Actual Expenses | | $ | 1,000.00 | | | $ | 972.50 | | | $ | 12.18 | | | | 2.49 | % | |
| Hypothetical Expenses on a 5% Return | | $ | 1,000.00 | | | $ | 1,012.45 | | | $ | 12.42 | | | | 2.49 | % | |
* Expenses are equal to the average account value multiplied by the Fund's annualized expense ratio multiplied by the number of days in the most recent fiscal half-year divided by the number of days in the fiscal year.
6
Semiannual Report 2005
Needham Growth Fund
Schedule of Investments
June 30, 2005 (Unaudited)
| | | Shares | | Value | |
| Common Stocks - (91.5%) | |
| Business Services - (4.5%) | |
Affiliated Computer Services,
Inc. - Class A (L)* | | | 45,000 | | | $ | 2,299,500 | | |
| First Data Corp. (L) | | | 75,000 | | | | 3,010,500 | | |
| Iron Mountain, Inc. (L)*† | | | 110,000 | | | | 3,412,200 | | |
| | | | 8,722,200 | | |
Cable Television &
Equipment - (4.6%) | | | |
| Comcast Corp. - Class A*† | | | 130,000 | | | | 3,991,000 | | |
| Scientific-Atlanta, Inc. (L) | | | 150,000 | | | | 4,990,500 | | |
| | | | 8,981,500 | | |
Computers - Integrated
Systems - (2.1%) | | | |
| Kronos, Inc. (L)*† | | | 100,000 | | | | 4,039,000 | | |
| Computers - Storage - (4.9%) | |
| Datalink Corp. (PP)* | | | 400,000 | | | | 1,236,000 | | |
| Datalink Corp. (L)* | | | 280,000 | | | | 865,200 | | |
| Komag, Inc.* | | | 55,000 | | | | 1,560,350 | | |
| Seagate Technology | | | 340,000 | | | | 5,967,000 | | |
| | | | 9,628,550 | | |
Contract Manufacturing &
Materials - (2.9%) | | | |
| Merix Corp. (L)* | | | 200,000 | | | | 1,170,000 | | |
| Park Electrochemical Corp. | | | 150,000 | | | | 3,780,000 | | |
| Pemstar, Inc. (L)* | | | 640,000 | | | | 640,000 | | |
| | | | 5,590,000 | | |
Electronic Components &
Equipment - (11.3%) | | | |
| Actel Corp.* | | | 125,000 | | | | 1,737,500 | | |
| Agere Systems, Inc. (L)* | | | 200,000 | | | | 2,400,000 | | |
| Atmel Corp.* | | | 750,000 | | | | 1,777,500 | | |
| AXT, Inc.* | | | 367,202 | | | | 477,363 | | |
| CEVA, Inc.* | | | 145,090 | | | | 850,227 | | |
MEMC Electronic
Materials, Inc.* | | | 200,000 | | | | 3,154,000 | | |
| Newport Corp. (L)* | | | 250,000 | | | | 3,465,001 | | |
| Orbotech Ltd.* | | | 148,600 | | | | 3,193,414 | | |
| Parlex Corp. (L)* | | | 200,000 | | | | 1,160,000 | | |
| Planar Systems, Inc.* | | | 300,000 | | | | 2,205,000 | | |
| Vishay Intertechnology, Inc.* | | | 150,000 | | | | 1,780,500 | | |
| | | | 22,200,505 | | |
| Enabling Technology - (0.5%) | | | |
Dolby Laboratories, Inc. -
Class A (L)* | | | 40,000 | | | | 882,400 | | |
| Healthcare Services - (2.4%) | |
| HCA, Inc. | | | 50,000 | | | | 2,833,500 | | |
| Phase Forward, Inc. (L)* | | | 265,250 | | | | 1,803,700 | | |
| | | | 4,637,200 | | |
| Insurance - (0.1%) | | | |
American International
Group, Inc. | | | 5,000 | | | | 290,500 | | |
| | | Shares | | Value | |
Lasers - Systems & Components -
(0.2%) | |
Electro Scientific Industries,
Inc.* | | | 20,000 | | | $ | 357,600 | | |
Manufacturing & Industrial
Equipment - (7.4%) | |
| Ceradyne, Inc. (PP)* | | | 300,000 | | | | 7,221,000 | | |
| Intevac, Inc.* | | | 242,500 | | | | 2,538,975 | | |
Southwall Technologies,
Inc. (L)* | | | 728,000 | | | | 946,400 | | |
| Sypris Solutions, Inc. (L)† | | | 300,000 | | | | 3,711,000 | | |
| | | | 14,417,375 | | |
Medical Devices & Supplies -
(8.6%) | | | |
| Analogic Corp. | | | 80,000 | | | | 4,025,600 | | |
| CONMED Corp. (L)* | | | 100,000 | | | | 3,077,000 | | |
| Cutera, Inc.* | | | 85,000 | | | | 1,474,750 | | |
| Thermo Electron Corp.* | | | 180,000 | | | | 4,836,600 | | |
| Viasys Healthcare, Inc.* | | | 150,000 | | | | 3,388,500 | | |
| | | | 16,802,450 | | |
Oil & Gas - Exploration &
Production - (9.5%) | | | |
| Chesapeake Energy Corp. | | | 270,000 | | | | 6,156,000 | | |
| GlobalSantaFe Corp. | | | 140,000 | | | | 5,712,000 | | |
| Talisman Energy, Inc. (L) | | | 175,000 | | | | 6,574,750 | | |
| | | | 18,442,750 | | |
Pharmaceuticals &
Biotechnology - (5.7%) | | | |
| Johnson & Johnson | | | 75,000 | | | | 4,875,000 | | |
| Merck & Co., Inc. | | | 100,000 | | | | 3,080,000 | | |
| Schering-Plough Corp. | | | 162,000 | | | | 3,087,720 | | |
| | | | 11,042,720 | | |
| Semiconductors - (11.2%) | | | |
| Brooks Automation, Inc.* | | | 213,400 | | | | 3,168,990 | | |
| FSI International, Inc. (PP)* | | | 150,000 | | | | 558,000 | | |
| FSI International, Inc.* | | | 331,000 | | | | 1,231,320 | | |
| Helix Technology Corp. (L) | | | 175,341 | | | | 2,328,528 | | |
| MKS Instruments, Inc.* | | | 134,100 | | | | 2,264,949 | | |
National Semiconductor
Corp. | | | 300,000 | | | | 6,609,000 | | |
| Photronics, Inc. (L)* | | | 150,000 | | | | 3,501,000 | | |
Standard Microsystems
Corp. (L)* | | | 100,000 | | | | 2,338,000 | | |
| | | | 21,999,787 | | |
| Software - (3.7%) | | | |
| Aspen Technology, Inc. (L)* | | | 300,000 | | | | 1,560,000 | | |
| Hyperion Solutions Corp.* | | | 85,000 | | | | 3,420,400 | | |
| Phoenix Technologies Ltd.* | | | 290,000 | | | | 2,256,200 | | |
| | | | 7,236,600 | | |
Specialty Retailing &
Manufacturing - (1.5%) | | | |
| CarMax, Inc. (L)* | | | 75,000 | | | | 1,998,750 | | |
| DSW, Inc. - Class A* | | | 2,116 | | | | 52,794 | | |
Pacific Sunwear of California,
Inc.* | | | 40,000 | | | | 919,600 | | |
| | | | 2,971,144 | | |
See accompanying notes to financial statements.
7
Needham Funds
Needham Growth Fund
Schedule of Investments (Continued)
June 30, 2005 (Unaudited)
| | | Shares | | Value | |
Wireless Communications &
Equipment - (10.4%) | |
| Anaren, Inc. (L)*† | | | 250,000 | | | $ | 3,287,500 | | |
| EMS Technologies, Inc. (PP)* | | | 100,000 | | | | 1,495,000 | | |
| EMS Technologies, Inc.* | | | 76,900 | | | | 1,149,655 | | |
| Motorola, Inc.† | | | 550,000 | | | | 10,043,000 | | |
| REMEC, Inc. (L)* | | | 133,800 | | | | 856,320 | | |
| ViaSat, Inc. (L)* | | | 169,000 | | | | 3,435,770 | | |
| | | | 20,267,245 | | |
Total Common Stocks (Cost
$138,418,860) | | | | | | | 178,509,526 | | |
Convertible Preferred Stock -
(0.0%) | |
Cable Television & Equipment -
(0.0%) | |
Adelphia Communications
Corp., 7.50%, 11/15/49,
Series E** | | | 182,000 | | | | 9,100 | | |
Total Convertible Preferred
Stock (Cost $2,554,580) | | | | | | | 9,100 | | |
| Investment Trusts - (2.4%) | |
| H&Q Healthcare Investors | | | 154,515 | | | | 2,719,464 | | |
H&Q Life Sciences
Investors (L) | | | 118,374 | | | | 1,878,595 | | |
Total Investment Trusts (Cost
$4,535,132) | | | | | | | 4,598,059 | | |
| | | Principal
Amount | | | |
| Convertible Bonds - (4.4%) | |
Telecommunication Services &
Equipment - (4.4%) | |
Lucent Technologies, Inc.,
8.00%, 8/1/31 | | $ | 5,500,000 | | | | 5,678,750 | | |
Nortel Networks Corp.,
4.25%, 9/1/08 (L) | | | 3,000,000 | | | | 2,812,500 | | |
Total Convertible Bonds (Cost
$8,365,743) | | | | | | | 8,491,250 | | |
| | | Principal
Amount | | Value | |
| Repurchase Agreements - (8.2%) | |
Bear Stearns Companies,
Inc., 2.80%, 7/1/05
(Purchased on 6/30/05,
proceeds at maturity
$1,058,106, collateralized
by a U.S. Treasury
Obligation, 2/15/17,
value $1,087,574) | | $ | 1,058,024 | | | $ | 1,058,024 | | |
Bear Stearns Companies,
Inc., 3.375%, 7/1/05
(Purchased on 6/30/05,
proceeds at maturity
$12,239,865, collateralized
by U.S. Treasury Obligations,
8/15/16-2/15/17, value
$12,595,502) (Held as
Collateral for Securities
Lending) | | | 12,238,718 | | | | 12,238,718 | | |
Bear Stearns Companies,
Inc., 1.6875%, 7/1/05
(Purchased on 6/30/05,
proceeds at maturity
$2,695,133, collateralized
by a U.S. Treasury
Obligation, 2/15/17,
value $2,774,551) (Held
as Collateral for Securities
Lending) | | | 2,695,006 | | | | 2,695,006 | | |
Total Repurchase Agreements
(Cost $15,991,748) | | | | | | | 15,991,748 | | |
Total Investments - (106.5%)
(Cost $169,866,063) | | | | | | | 207,599,683 | | |
| | | Shares | | | |
| Warrants - (0.0%) | |
| Computers - Storage - (0.0%) | |
Datalink Corp., Expiring
May 07, Strike Price $4.50* | | | 68,000 | | | | 34,680 | | |
| Total Warrants (Cost $35,360) | | | | | | | 34,680 | | |
Total Investments and Warrants -
(106.5%) (Cost $169,901,423)(a) | | | | | | | 207,634,363 | | |
Total Securities Sold Short -
(-6.8%) | | | | | | | (13,182,575 | ) | |
Other Assets in Excess of
Liabilities - (0.3%) | | | | | | | 601,664 | | |
| Net Assets - (100.0%) | | | | | | $ | 195,053,452 | | |
(a) Represents cost for financial reporting purposes and differs from cost basis for federal income tax purposes by the amount of losses recognized for financial reporting in excess of federal income tax reporting of $238,972 due to wash sales. Cost for federal income tax purposes differs from value by net unrealized appreciation of securities as follows:
| Unrealized appreciation | | $ | 57,721,278 | | |
| Unrealized depreciation | | | (20,227,310 | ) | |
| Net unrealized appreciation | | $ | 37,493,968 | | |
* Represents non-income producing securities.
** Represents defaulted securities.
† Security position is either entirely or partially held in a segregated account as collateral for securities sold short.
L All or a portion of security is on loan as of June 30, 2005.
PP Private placement. Securities are exempt from registration under Rule 144 of the Securities Act of 1933. Such securities may be resold, normally to institutional buyers, in transactions exempt from registration. At June 30, 2005, the aggregate value of Rule 144 securities amounted to $10,510,000, which represents approximately 5.4% of net assets as of that date.
See accompanying notes to financial statements.
8
Semiannual Report 2005
Needham Growth Fund
Schedule of Securities Sold Short
June 30, 2005 (Unaudited)
| | | Shares | | Value | |
| Securities Sold Short - (-6.8%) | | | |
| Financial Services - (-1.0%) | | | |
Lehman Brothers Holdings,
Inc. | | | 20,000 | | | $ | 1,985,600 | | |
Medical Devices & Supplies -
(-0.4%) | | | |
| Laserscope* | | | 20,000 | | | | 828,800 | | |
| Networking Products - (-2.6%) | | | |
| Juniper Networks, Inc.* | | | 200,000 | | | | 5,036,000 | | |
| Recreational Vehicles - (-0.6%) | | | |
| Polaris Industries, Inc. | | | 20,000 | | | | 1,080,000 | | |
| Semiconductors - (-0.9%) | | | |
| FormFactor, Inc.* | | | 40,000 | | | | 1,056,800 | | |
Marvell Technology Group
Ltd.* | | | 20,000 | | | | 760,800 | | |
| | | | 1,817,600 | | |
| Software - (-0.3%) | | | |
| ANSYS, Inc.* | | | 17,500 | | | | 621,425 | | |
| | | Shares | | Value | |
Specialty Retailing &
Manufacturing - (-0.3%) | |
A.C. Moore Arts & Crafts,
Inc.* | | | 15,000 | | | $ | 474,150 | | |
Telecommunication Services &
Equipment - (-0.7%) | |
Comtech Telecommunications
Corp.* | | | 20,000 | | | | 652,600 | | |
| Essex Corp.* | | | 30,000 | | | | 686,400 | | |
| | | | 1,339,000 | | |
Total Securities Sold Short
(Proceeds $9,609,169) | | | | | | | 13,182,575 | | |
Total Securities Sold Short -
(-6.8%) | | | | | | | (13,182,575 | ) | |
Total Investments and
Warrants - (106.5%) | | | | | | | 207,634,363 | | |
Other Assets in Excess of
Liabilities - (0.3%) | | | | | | | 601,664 | | |
| Net Assets - (100.0%) | | | | | | $ | 195,053,452 | | |
* Represents non-income producing securities.
See accompanying notes to financial statements.
9
Needham Funds
Needham Aggressive Growth Fund
Schedule of Investments
June 30, 2005 (Unaudited)
| | | Shares | | Value | |
| Common Stocks - (89.6%) | | | |
| Business Services - (21.7%) | | | |
Affiliated Computer Services,
Inc. - Class A* | | | 8,000 | | | $ | 408,800 | | |
| Alliance Data Systems Corp.* | | | 12,500 | | | | 507,001 | | |
| ChoicePoint, Inc. (L)* | | | 10,000 | | | | 400,500 | | |
| Digitas, Inc.* | | | 30,000 | | | | 342,300 | | |
| Euronet Worldwide, Inc.* | | | 10,000 | | | | 290,700 | | |
| First Data Corp. (L) | | | 7,500 | | | | 301,050 | | |
| Getty Images, Inc.* | | | 6,000 | | | | 445,560 | | |
| Iron Mountain, Inc. (L)* | | | 15,000 | | | | 465,300 | | |
Portfolio Recovery Associates,
Inc.* | | | 10,000 | | | | 420,200 | | |
| | | | 3,581,411 | | |
Cable Television & Equipment -
(3.6%) | | | |
Comcast Corp. - Special
Class A* | | | 9,000 | | | | 269,550 | | |
| Scientific-Atlanta, Inc. (L) | | | 10,000 | | | | 332,700 | | |
| | | | 602,250 | | |
Computers - Integrated
Systems - (1.8%) | | | |
| Kronos, Inc.* | | | 7,500 | | | | 302,925 | | |
| Computers - Storage - (0.5%) | | | |
| Datalink Corp. (PP)* | | | 25,000 | | | | 77,250 | | |
Electronic Components &
Equipment - (5.7%) | | | |
| CEVA, Inc.* | | | 50,000 | | | | 293,000 | | |
MEMC Electronic Materials,
Inc.* | | | 25,000 | | | | 394,250 | | |
| Orbotech Ltd.*† | | | 12,000 | | | | 257,880 | | |
| | | | 945,130 | | |
| Enabling Technology - (4.3%) | | | |
Dolby Laboratories, Inc. -
Class A (L)* | | | 15,000 | | | | 330,900 | | |
| NAVTEQ Corp.* | | | 10,000 | | | | 371,800 | | |
| | | | 702,700 | | |
| Healthcare Services - (9.7%) | | | |
Community Health Systems,
Inc.* | | | 15,000 | | | | 566,850 | | |
| Express Scripts, Inc. (L)* | | | 12,000 | | | | 599,760 | | |
| Phase Forward, Inc.* | | | 25,000 | | | | 170,000 | | |
United Surgical Partners
International, Inc.* | | | 5,000 | | | | 260,400 | | |
| | | | 1,597,010 | | |
Manufacturing & Industrial
Equipment - (3.8%) | | | |
| Precision Castparts Corp. (L) | | | 8,000 | | | | 623,200 | | |
| | | Shares | | Value | |
Medical Devices & Supplies -
(7.4%) | | | |
| Animas Corp. (L)* | | | 22,500 | | | $ | 453,375 | | |
Foxhollow Technologies,
Inc. (L)* | | | 7,500 | | | | 287,025 | | |
| Kyphon, Inc.* | | | 12,500 | | | | 434,875 | | |
Micrus Endovascular
Corp. (L)* | | | 5,000 | | | | 55,000 | | |
| | | | 1,230,275 | | |
Oil & Gas - Exploration &
Production - (1.9%) | | | |
| XTO Energy, Inc. | | | 9,166 | | | | 311,552 | | |
Pharmaceuticals &
Biotechnology - (4.1%) | | | |
| Gilead Sciences, Inc.* | | | 10,000 | | | | 439,900 | | |
| Sepracor, Inc.* | | | 4,000 | | | | 240,040 | | |
| | | | 679,940 | | |
| Semiconductors - (2.4%) | | | |
| FSI International, Inc.* | | | 35,000 | | | | 130,200 | | |
| Helix Technology Corp. | | | 20,000 | | | | 265,600 | | |
| | | | 395,800 | | |
| Software - (11.0%) | | | |
| Avid Technology, Inc.* | | | 3,500 | | | | 186,480 | | |
| Callidus Software, Inc.* | | | 25,000 | | | | 91,000 | | |
| Hyperion Solutions Corp.* | | | 10,000 | | | | 402,400 | | |
| Plumtree Software, Inc.* | | | 75,000 | | | | 365,250 | | |
RightNow Technologies,
Inc. (L)* | | | 20,000 | | | | 240,400 | | |
| TIBCO Software, Inc.* | | | 40,000 | | | | 261,600 | | |
WebEx Communications,
Inc. (L)* | | | 10,000 | | | | 264,100 | | |
| | | | 1,811,230 | | |
Specialty Retailing &
Manufacturing - (9.6%) | | | |
American Eagle Outfitters,
Inc. | | | 14,000 | | | | 429,100 | | |
| CarMax, Inc.* | | | 10,000 | | | | 266,500 | | |
| DSW, Inc. - Class A* | | | 172 | | | | 4,291 | | |
Pacific Sunwear of
California, Inc.* | | | 5,000 | | | | 114,950 | | |
PETCO Animal Supplies,
Inc.* | | | 12,000 | | | | 351,840 | | |
| Urban Outfitters, Inc. (L)*† | | | 7,500 | | | | 425,175 | | |
| | | | 1,591,856 | | |
Wireless Communications &
Equipment - (2.1%) | | | |
| EMS Technologies, Inc.* | | | 10,000 | | | | 149,500 | | |
| ViaSat, Inc.* | | | 10,000 | | | | 203,300 | | |
| | | | 352,800 | | |
Total Common Stocks (Cost
$11,632,551) | | | | | | | 14,805,329 | | |
See accompanying notes to financial statements.
10
Semiannual Report 2005
Needham Aggressive Growth Fund
Schedule of Investments
June 30, 2005 (Unaudited)
| | | Principal
Amount | | Value | |
| Repurchase Agreements - (18.3%) | | | |
Bear Stearns Companies,
Inc., 2.80%, 7/1/05
(Purchased on 6/30/05,
proceeds at maturity
$1,681,991, collateralized
by a U.S. Treasury
Obligation, 8/15/16,
value $1,732,886) | | $ | 1,681,860 | | | $ | 1,681,860 | | |
Bear Stearns Companies,
Inc., 3.375%, 7/1/05
(Purchased on 6/30/05,
proceeds at maturity
$1,205,480, collateralized
by a U.S. Treasury
Obligation, 8/15/16,
value $1,242,745) (Held
as Collateral for Securities
Lending) | | | 1,205,367 | | | | 1,205,367 | | |
Bear Stearns Companies,
Inc., 1.6875%, 7/1/05
(Purchased on 6/30/05,
proceeds at maturity
$138,299, collateralized
by a U.S. Treasury
Obligation, 8/15/16,
value $145,461) (Held as
Collateral for Securities
Lending) | | | 138,293 | | | | 138,293 | | |
Total Repurchase Agreements
(Cost $3,025,520) | | | | | | | 3,025,520 | | |
Total Investments - (107.9%)
(Cost $14,658,071) | | | | | | | 17,830,849 | | |
| | | Shares | | Value | |
| Warrants - (0.0%) | |
| Computers - Storage - (0.0%) | |
Datalink Corp., Expiring
May 07, Strike Price $4.50* | | 4,000 | | $ | 2,040 | | |
| Total Warrants (Cost $2,080) | | | | | 2,040 | | |
Total Investments and Warrants -
(107.9%) (Cost $14,660,151)(a) | | | | | 17,832,889 | | |
Total Securities Sold Short -
(-1.9%) | | | | | (315,200 | ) | |
Liabilities in Excess of
Other Assets - (-6.0%) | | | | | (995,956 | ) | |
| Net Assets - (100.0%) | | | | $ | 16,521,733 | | |
(a) Represents cost for financial reporting purposes and federal income tax purposes and differs from value by net unrealized appreciation of securities as follows:
| Unrealized appreciation | | $ | 3,491,910 | | |
| Unrealized depreciation | | | (319,172 | ) | |
| Net unrealized appreciation | | $ | 3,172,738 | | |
* Represents non-income producing securities.
† Security is either entirely or partially held in a segregated account as collateral for securities sold short.
L All or a portion of security is on loan as of June 30, 2005.
PP Private placement. Securities are exempt from registration under Rule 144 of the Securities Act of 1933. Such securities may be resold, normally to institutional buyers, in transactions exempt from registration. At June 30, 2005, the aggregate value of Rule 144 securities amounted to $77,250, which represents approximately 0.5% of net assets as of that date.
See accompanying notes to financial statements.
11
Needham Funds
Needham Aggressive Growth Fund
Schedule of Securities Sold Short
June 30, 2005 (Unaudited)
| | | Shares | | Value | |
| Securities Sold Short - (-1.9%) | |
Medical Devices & Supplies -
(-0.5%) | |
| Laserscope* | | | 2,000 | | | $ | 82,880 | | |
| Semiconductors - (-0.4%) | |
| FormFactor, Inc.* | | | 2,500 | | | | 66,050 | | |
| SpatiaLight, Inc.* | | | 1,000 | | | | 5,670 | | |
| | | | 71,720 | | |
Specialty Retailing &
Manufacturing - (-0.5%) | | | |
A.C. Moore Arts & Crafts,
Inc.* | | | 2,500 | | | | 79,025 | | |
| | | Shares | | Value | |
Telecommunication Services &
Equipment - (-0.5%) | | | |
Comtech Telecommunications
Corp.* | | | 2,500 | | | $ | 81,575 | | |
Total Securities Sold Short
(Proceeds $297,322) | | | | | 315,200 | | |
Total Securities Sold Short -
(-1.9%) | | | | | (315,200 | ) | |
Total Investments and
Warrants - (107.9%) | | | | | 17,832,889 | | |
Liabilities in Excess of
Other Assets - (-6.0%) | | | | | (995,956 | ) | |
| Net Assets - (100.0%) | | | | $ | 16,521,733 | | |
* Represents non-income producing securities.
See accompanying notes to financial statements.
12
Semiannual Report 2005
Needham Small Cap Growth Fund
Schedule of Investments
June 30, 2005 (Unaudited)
| | | Shares | | Value | |
| Common Stocks - (92.9%) | |
| Aerospace & Satellite - (5.2%) | |
Innovative Solutions and
Support, Inc. (L)* | | | 16,500 | | | $ | 553,905 | | |
| Integral Systems, Inc. (L) | | | 22,000 | | | | 497,860 | | |
| | | | 1,051,765 | | |
| Business Services - (21.4%) | | | |
Bright Horizons Family
Solutions, Inc. (L)* | | | 40,000 | | | | 1,628,801 | | |
| Copart, Inc.* | | | 15,000 | | | | 357,000 | | |
Corporate Executive Board
Co. (L) | | | 5,000 | | | | 391,650 | | |
| Digitas, Inc.* | | | 30,000 | | | | 342,300 | | |
| Euronet Worldwide, Inc.* | | | 10,000 | | | | 290,700 | | |
FactSet Research Systems,
Inc. | | | 17,000 | | | | 609,280 | | |
| Mobile Mini, Inc.* | | | 15,000 | | | | 517,200 | | |
SRA International, Inc. -
Class A* | | | 7,000 | | | | 243,040 | | |
| | | | 4,379,971 | | |
Computers - Integrated
Systems - (2.5%) | | | |
| Kronos, Inc.* | | | 5,000 | | | | 201,950 | | |
| MICROS Systems, Inc.* | | | 7,000 | | | | 313,250 | | |
| | | | 515,200 | | |
| Computers - Storage - (0.9%) | | | |
| Datalink Corp. (L) | | | 57,000 | | | | 176,130 | | |
Contract Manufacturing &
Materials - (1.1%) | |
| Pemstar, Inc.* | | | 217,300 | | | | 217,300 | | |
| Defense - (4.5%) | |
| ARGON ST, Inc. (L)* | | | 18,000 | | | | 639,000 | | |
Esterline Technologies
Corp.* | | | 7,000 | | | | 280,560 | | |
| | | | 919,560 | | |
Electronic Components &
Equipment - (1.9%) | | | |
| LeCroy Corp. (L)* | | | 15,000 | | | | 206,250 | | |
| Planar Systems, Inc.* | | | 25,000 | | | | 183,750 | | |
| | | | 390,000 | | |
Enabling Technology -
(1.4%) | | | |
| NAVTEQ Corp.* | | | 7,500 | | | | 278,850 | | |
Entertainment &
Leisure - (1.8%) | |
Penn National Gaming,
Inc. (L)* | | | 10,000 | | | | 365,000 | | |
| | | Shares | | Value | |
| Financial Services - (2.1%) | |
Asset Acceptance Capital
Corp.* | | | 8,000 | | | $ | 207,280 | | |
| First Republic Bank | | | 6,000 | | | | 211,980 | | |
| | | | 419,260 | | |
| Healthcare Services - (10.1%) | | | |
| Advisory Board Co.* | | | 23,000 | | | | 1,121,020 | | |
DataTRAK International,
Inc. (L)* | | | 11,500 | | | | 197,800 | | |
Healthcare Services Group,
Inc. (L) | | | 7,500 | | | | 150,600 | | |
| HealthExtras, Inc.*† | | | 17,000 | | | | 341,190 | | |
| Phase Forward, Inc.* | | | 36,740 | | | | 249,832 | | |
| | | | 2,060,442 | | |
| Insurance - (3.3%) | | | |
Philadelphia Consolidated
Holding Corp.* | | | 2,500 | | | | 211,900 | | |
Universal American
Financial Corp.* | | | 8,500 | | | | 192,270 | | |
| W.R. Berkley Corp. | | | 7,500 | | | | 267,600 | | |
| | | | 671,770 | | |
Manufacturing & Industrial
Equipment - (6.7%) | | | |
| Actuant Corp. - Class A* | | | 7,500 | | | | 359,550 | | |
| Ceradyne, Inc. (PP)* | | | 20,000 | | | | 481,400 | | |
| Intevac, Inc.* | | | 30,000 | | | | 314,100 | | |
| Sypris Solutions, Inc. (L) | | | 17,000 | | | | 210,290 | | |
| | | | 1,365,340 | | |
| Marketing Services - (2.2%) | | | |
| aQuantive, Inc. (L)* | | | 13,500 | | | | 239,220 | | |
| SITEL Corp.* | | | 100,000 | | | | 211,000 | | |
| | | | 450,220 | | |
Medical Devices &
Supplies - (9.3%) | | | |
| Animas Corp. (L)* | | | 12,000 | | | | 241,800 | | |
| Atrion Corp. | | | 900 | | | | 67,095 | | |
| Cantel Medical Corp. (L)* | | | 24,000 | | | | 392,640 | | |
| Immucor, Inc.* | | | 17,500 | | | | 506,625 | | |
Intermagnetics General
Corp.* | | | 15,000 | | | | 461,400 | | |
| IRIS International, Inc.* | | | 12,800 | | | | 227,840 | | |
| | | | 1,897.400 | | |
Oil & Gas - Equipment &
Services - (1.7%) | | | |
Superior Energy Services,
Inc.* | | | 20,000 | | | | 356,000 | | |
Oil & Gas - Exploration &
Production - (3.3%) | |
| Encore Acquisition Co.* | | | 10,000 | | | | 410,000 | | |
| Grey Wolf, Inc.* | | | 35,000 | | | | 259,350 | | |
| | | | 669,350 | | |
See accompanying notes to financial statements.
13
Needham Funds
Needham Small Cap Growth Fund
Schedule of Investments (Continued)
June 30, 2005 (Unaudited)
| | | Shares | | Value | |
Pharmaceuticals &
Biotechnology - (1.4%) | |
First Horizon Pharmaceutical
Corp.*† | | | 15,000 | | | $ | 285,600 | | |
| Semiconductors - (5.4%) | |
| FSI International, Inc.* | | | 44,568 | | | | 165,793 | | |
| MKS Instruments, Inc.* | | | 27,500 | | | | 464,475 | | |
| Standard Microsystems Corp.*† | | | 10,000 | | | | 233,800 | | |
| Therma-Wave, Inc.* | | | 5,100 | | | | 12,240 | | |
| Therma-Wave, Inc. (PP)* | | | 90,000 | | | | 216,000 | | |
| | | | 1,092,308 | | |
| Software - (0.8%) | | | |
| Avid Technology, Inc.* | | | 3,000 | | | | 159,840 | | |
Specialty Retailing &
Manufacturing - (0.0%) | |
| DSW, Inc. - Class A* | | | 212 | | | | 5,288 | | |
| Transportation - (2.4%) | |
Genesee & Wyoming, Inc. -
Class A* | | | 18,000 | | | | 489,780 | | |
Wireless Communications &
Equipment - (3.5%) | |
| Anaren, Inc. (L)* | | | 15,000 | | | | 197,250 | | |
| REMEC, Inc. (L)* | | | 17,840 | | | | 114,176 | | |
| ViaSat, Inc.* | | | 20,000 | | | | 406,600 | | |
| | | | 718,026 | | |
Total Common Stocks (Cost
$14,484,649) | | | | | | | 18,934,400 | | |
| | | Principal
Amount | | Value | |
Repurchase Agreements -
(15.6%) | | | |
Bear Stearns Companies,
Inc., 2.80%, 7/1/05
(Purchased on 6/30/05,
proceeds at maturity
$1,181,524, collateralized
by a U.S. Treasury
Obligation, 8/15/16,
value $1,217,447) | | $ | 1,181,432 | | | $ | 1,181,432 | | |
Bear Stearns Companies,
Inc., 3.375%, 7/1/05
(Purchased on 6/30/05,
proceeds at maturity
$1,858,600, collateralized
by a U.S. Treasury
Obligation, 8/15/16,
value $1,913,131) (Held
as Collateral for Securities
Lending) | | | 1,858,426 | | | | 1,858,426 | | |
Bear Stearns Companies,
Inc., 1.6875%, 7/1/05
(Purchased on 6/30/05,
proceeds at maturity
$133,639, collateralized by
a U.S. Treasury Obligation,
8/15/16, value $139,137)
(Held as Collateral for
Securities Lending) | | | 133,632 | | | | 133,632 | | |
Total Repurchase Agreements
(Cost $3,173,490) | | | | | | | 3,173,490 | | |
Total Investments - (108.5%)
(Cost $17,658,139)(a) | | | | | | | 22,107,890 | | |
Total Securities Sold Short -
(-2.4%) | | | | | | | (486,470 | ) | |
Liabilities in Excess of
Other Assets - (-6.1%) | | | | | | | (1,243,447 | ) | |
| Net Assets - (100.0%) | | | | | | $ | 20,377,973 | | |
(a) Represents cost for financial reporting purposes and differs from cost basis for federal income tax purposes by the amount of losses recognized for financial reporting in excess of federal income tax reporting of $123,278 due to wash sales. Cost for federal income tax purposes differs from value by net unrealized appreciation of securities as follows:
| Unrealized appreciation | | $ | 4,816,190 | | |
| Unrealized depreciation | | | (489,717 | ) | |
| Net unrealized appreciation | | $ | 4,326,473 | | |
* Represents non-income producing securities.
† Security position is either entirely or partially held in a segregated account as collateral for securities sold short.
L All or a portion of security is on loan as of June 30, 2005.
PP Private placement. Securities are exempt from registration under Rule 144 of the Securities Act of 1933. Such securities may be resold, normally to institutional buyers, in transactions exempt from registration. At June 30, 2005, the aggregate value of Rule 144 securities amounted to $697,400, which represents approximately 3.4% of net assets as of that date.
See accompanying notes to financial statements.
14
Semiannual Report 2005
Needham Small Cap Growth Fund
Schedule of Securities Sold Short
June 30, 2005 (Unaudited)
| | | Shares | | Value | |
| Securities Sold Short - (-2.4%) | | | |
Computers - Integrated
Systems - (-0.3%) | | | |
| Radiant Systems, Inc.* | | | 6,000 | | | $ | 68,400 | | |
Medical Devices & Supplies -
(-0.2%) | | | |
| Laserscope* | | | 1,000 | | | | 41,440 | | |
| Semiconductors - (-0.4%) | | | |
| FormFactor, Inc.* | | | 3,000 | | | | 79,260 | | |
Specialty Retailing &
Manufacturing - (-0.5%) | | | |
A.C. Moore Arts & Crafts,
Inc.* | | | 3,000 | | | | 94,830 | | |
| | | Shares | | Value | |
Telecommunication Services &
Equipment - (-1.0%) | |
Comtech Telecommunications
Corp.* | | | 2,000 | | | $ | 65,260 | | |
| Essex Corp.* | | | 6,000 | | | | 137,280 | | |
| | | | 202,540 | | |
Total Securities Sold Short
(Proceeds $459,334) | | | | | 486,470 | | |
Total Securities Sold Short -
(-2.4%) | | | | | (486,470 | ) | |
| Total Investments - (108.5%) | | | | | 22,107,890 | | |
Liabilities in Excess of
Other Assets - (-6.1%) | | | | | (1,243,447 | ) | |
| Net Assets - (100.0%) | | | | $ | 20,377,973 | | |
* Represents non-income producing securities.
See accompanying notes to financial statements.
15
Needham Funds
Statements of Assets and Liabilities (Unaudited)
June 30, 2005
| | | Needham
Growth Fund | | Needham
Aggressive
Growth Fund | | Needham
Small Cap
Growth Fund | |
| Assets: | |
Investments, at Value* (Cost $153,874,315, $11,632,551 and
$14,484,649, respectively) | | $ | 191,607,935 | | | $ | 14,805,329 | | | $ | 18,934,400 | | |
| Warrants, at Value (Cost $35,360, $2,080 and $0, respectively) | | | 34,680 | | | | 2,040 | | | | - | | |
| Repurchase Agreements, at Cost | | | 15,991,748 | | | | 3,025,520 | | | | 3,173,490 | | |
| Cash | | | 77,664 | | | | - | | | | - | | |
| Receivables: | |
| Due from Broker | | | 13,092,180 | | | | 324,722 | | | | 489,318 | | |
| Dividends and Interest | | | 372,069 | | | | 6,318 | | | | 4,402 | | |
| Fund Shares Sold | | | 35,408 | | | | - | | | | 3,531 | | |
| Investment Securities Sold | | | 3,582,092 | | | | 68,416 | | | | 553,164 | | |
| Prepaid Expenses and Other Assets | | | 36,848 | | | | 14,687 | | | | 11,518 | | |
| Total Assets | | | 224,830,624 | | | | 18,247,032 | | | | 23,169,823 | | |
| Liabilities: | |
Securities Sold Short, at Value (Proceeds $9,609,169, $297,322 and
$459,334, respectively) | | | 13,182,575 | | | | 315,200 | | | | 486,470 | | |
| Payable for Collateral Received on Securities Loaned | | | 14,933,724 | | | | 1,343,660 | | | | 1,992,058 | | |
| Payables: | |
| Investment Securities Purchased | | | 1,196,365 | | | | 3,268 | | | | 223,523 | | |
| Fund Shares Redeemed | | | 131,522 | | | | - | | | | 20,668 | | |
| Due to Adviser | | | 210,571 | | | | 14,604 | | | | 19,679 | | |
| Distribution Fees | | | 42,114 | | | | 3,348 | | | | 4,128 | | |
| Accrued Expenses and Other Liabilities | | | 80,301 | | | | 45,219 | | | | 45,324 | | |
| Total Liabilities | | | 29,777,172 | | | | 1,725,299 | | | | 2,791,850 | | |
| Net Assets | | $ | 195,053,452 | | | $ | 16,521,733 | | | $ | 20,377,973 | | |
Shares Issued and Outstanding $.001 Par Value
(Authorized 800,000,000, 100,000,000 and 100,000,000,
respectively) | | | 6,300,414 | | | | 1,301,211 | | | | 1,130,830 | | |
| Net Asset Value, Offering and Redemption Price Per Share | | $ | 30.96 | | | $ | 12.70 | | | $ | 18.02 | | |
| Components of Net Assets | |
| Paid-in Capital | | | 179,857,007 | | | | 12,964,224 | | | | 13,635,959 | | |
| Undistributed Net Investment Income | | | (1,124,299 | ) | | | (166,030 | ) | | | (140,792 | ) | |
| Accumulated Net Realized Gain (Loss) | | | (17,838,790 | ) | | | 568,679 | | | | 2,460,191 | | |
Net Unrealized Appreciation of Investment Securities,
Warrants and Securities Sold Short | | | 34,159,534 | | | | 3,154,860 | | | | 4,422,615 | | |
| Total Net Assets | | $ | 195,053,452 | | | $ | 16,521,733 | | | $ | 20,377,973 | | |
* Includes securities on loan with total values of $14,447,574, $1,310,077 and $1,896,446, respectively.
See accompanying notes to financial statements.
16
Semiannual Report 2005
Statements of Operations (Unaudited)
For the Six Months Ended June 30, 2005
| | | Needham
Growth Fund | | Needham
Aggressive
Growth Fund | | Needham
Small Cap
Growth Fund | |
| Investment Income | |
| Dividends | | $ | 631,831 | | | $ | 13,804 | | | $ | 104,580 | | |
| Interest | | | 365,415 | | | | 19,697 | | | | 16,194 | | |
| Total Investment Income | | | 997,246 | | | | 33,501 | | | | 120,774 | | |
| Expenses | |
| Investment Advisory Fees | | | 1,383,210 | | | | 99,750 | | | | 131,551 | | |
| Distribution Fees | | | 276,642 | | | | 19,881 | | | | 26,323 | | |
| Administration and Accounting Fees | | | 110,444 | | | | 37,707 | | | | 38,010 | | |
| Audit Fees | | | 23,273 | | | | 17,158 | | | | 16,960 | | |
| Custodian Fees | | | 19,007 | | | | 8,664 | | | | 10,978 | | |
| Dividend Expense | | | 22,000 | | | | - | | | | - | | |
| Insurance Expense | | | 15,527 | | | | 942 | | | | 1,010 | | |
| Interest Expense | | | 14,739 | | | | 157 | | | | 246 | | |
| Legal Fees | | | 48,556 | | | | 18,449 | | | | 18,964 | | |
| Filing Fees | | | 10,078 | | | | 7,264 | | | | 7,543 | | |
| Shareholders' Reports | | | 53,308 | | | | 6,171 | | | | 8,382 | | |
| Transfer Agent Fees | | | 14,928 | | | | 14,927 | | | | 14,927 | | |
| Directors' Fees | | | 20,885 | | | | 1,150 | | | | 1,495 | | |
| Other Expenses | | | 108,948 | | | | 11,858 | | | | 13,002 | | |
| Total Expenses | | | 2,121,545 | | | | 244,078 | | | | 289,391 | | |
| Less: Fees Waived and/or Expenses Reimbursed (Note 3) | | | - | | | | (44,547 | ) | | | (27,825 | ) | |
| Net Expenses | | | 2,121,545 | | | | 199,531 | | | | 261,566 | | |
| Net Investment Loss | | | (1,124,299 | ) | | | (166,030 | ) | | | (140,792 | ) | |
Realized and Unrealized Gain (Loss) on Investment
Securities, Warrants and Securities Sold Short | |
Net Realized Gain on Investment Securities, Warrants and
Securities Sold Short | | | 23,518,679 | | | | 736,556 | | | | 3,117,122 | | |
Change in Unrealized Appreciation (Depreciation) of
Investment Securities, Warrants and Securities Sold Short | | | (27,406,649 | ) | | | (786,325 | ) | | | (3,882,026 | ) | |
Net Realized and Unrealized Loss on Investment Securities,
Warrants and Securities Sold Short | | | (3,887,970 | ) | | | (49,769 | ) | | | (764,904 | ) | |
| Change in Net Assets Resulting from Operations | | $ | (5,012,269 | ) | | $ | (215,799 | ) | | $ | (905,696 | ) | |
See accompanying notes to financial statements.
17
Needham Funds
Statements of Changes in Net Assets
| | | Needham Growth Fund | | Needham Aggressive
Growth Fund | | Needham
Small Cap
Growth Fund | |
| | | Six Months
Ended
June 30,
2005
(Unaudited) | | Year Ended
December 31,
2004 | | Six Months
Ended
June 30,
2005
(Unaudited) | | Year Ended
December 31,
2004 | | Six Months
Ended
June 30,
2005
(Unaudited) | | Year Ended
December 31,
2004 | |
| Change in Net Assets | |
| Operations: | |
| Net Investment Loss | | $ | (1,124,299 | ) | | $ | (4,897,093 | ) | | $ | (166,030 | ) | | $ | (378,269 | ) | | $ | (140,792 | ) | | $ | (482,187 | ) | |
Net Realized Loss on
Option Contracts | | | - | | | | (1,322,357 | ) | | | - | | | | - | | | | - | | | | - | | |
Net Realized Gain (Loss) on
Investment Securities, Warrants
and Securities Sold Short | | | 23,518,679 | | | | 13,637,854 | | | | 736,556 | | | | 489,748 | | | | 3,117,122 | | | | (612,078 | ) | |
Change in Unrealized Appreciation
(Depreciation) of Investment
Securities, Warrants and
Securities Sold Short | | | (27,406,649 | ) | | | 5,600,561 | | | | (786,325 | ) | | | 1,639,704 | | | | (3,882,026 | ) | | | 3,227,072 | | |
Change in Net Assets Resulting
from Operations | | | (5,012,269 | ) | | | 13,018,965 | | | | (215,799 | ) | | | 1,751,183 | | | | (905,696 | ) | | | 2,132,807 | | |
| Distributions to Shareholders from: | |
| Net Long-Term Gains | | | - | | | | - | | | | - | | | | - | | | | - | | | | (68,474 | ) | |
| Total Distributions to Shareholders | | | - | | | | - | | | | - | | | | - | | | | - | | | | (68,474 | ) | |
| Capital Transactions: | |
| Shares Issued | | | 6,946,196 | | | | 58,898,114 | | | | 420,458 | | | | 1,013,413 | | | | 1,720,950 | | | | 19,549,157 | | |
| Contribution by Adviser | | | - | | | | 417,668 | | | | - | | | | - | | | | - | | | | - | | |
Shares Issued in Reinvestment of
Distributions | | | - | | | | - | | | | - | | | | - | | | | - | | | | 67,806 | | |
| Shares Redeemed | | | (94,252,535 | ) | | | (149,282,839 | ) | | | (683,411 | ) | | | (3,482,785 | ) | | | (6,332,602 | ) | | | (23,401,507 | ) | |
Change in Net Assets from
Capital Transactions | | | (87,306,339 | ) | | | (89,967,057 | ) | | | (262,953 | ) | | | (2,469,372 | ) | | | (4,611,652 | ) | | | (3,784,544 | ) | |
| Change in Net Assets | | | (92,318,608 | ) | | | (76,948,092 | ) | | | (478,752 | ) | | | (718,189 | ) | | | (5,517,348 | ) | | | (1,720,211 | ) | |
| Net Assets | |
| Beginning of Period | | | 287,372,060 | | | | 364,320,152 | | | | 17,000,485 | | | | 17,718,674 | | | | 25,895,321 | | | | 27,615,532 | | |
| End of Period | | $ | 195,053,452 | | | $ | 287,372,060 | | | $ | 16,521,733 | | | $ | 17,000,485 | | | $ | 20,377,973 | | | $ | 25,895,321 | | |
| Undistributed Net Investment Income | | | (1,124,299 | ) | | | - | | | | (166,030 | ) | | | - | | | | (140,792 | ) | | | - | | |
| Share Transactions: | |
| Number of Shares Issued | | | 231,491 | | | | 1,976,467 | | | | 33,617 | | | | 85,122 | | | | 96,232 | | | | 1,129,912 | | |
| Number of Shares Reinvested | | | - | | | | - | | | | - | | | | - | | | | - | | | | 3,938 | | |
| Number of Shares Redeemed | | | (3,151,314 | ) | | | (5,170,870 | ) | | | (55,386 | ) | | | (301,518 | ) | | | (362,638 | ) | | | (1,376,108 | ) | |
| Change in Shares | | | (2,919,823 | ) | | | (3,194,403 | ) | | | (21,769 | ) | | | (216,396 | ) | | | (266,406 | ) | | | (242,258 | ) | |
See accompanying notes to financial statements.
18
Semiannual Report 2005
Needham Growth Fund
Financial Highlights
(For a Share Outstanding | | Six Months
Ended
June 30, | | Year Ended December 31, | |
| Throughout each Period) | | 2005 | | 2004 | | 2003 | | 2002 | | 2001 | | 2000 | |
| | | | (Unaudited) | | | | | | | | | | | | | | | | | | | | | | |
| Net Asset Value, Beginning of Period | | $ | 31.17 | | | $ | 29.35 | | | $ | 19.92 | | | $ | 27.78 | | | $ | 24.77 | | | $ | 26.47 | | |
| Investment Operations | | | |
| Net Investment Loss | | | (0.18 | ) | | | (0.84 | ) | | | (0.38 | ) | | | (0.25 | ) | | | (0.29 | ) | | | (0.12 | ) | |
Net Realized and Unrealized Gains (Losses)
on Investments | | | (0.03 | ) | | | 2.62 | | | | 9.81 | | | | (7.61 | ) | | | 3.30 | | | | 2.57 | | |
| Total from Investment Operations | | | (0.21 | ) | | | 1.78 | | | | 9.43 | | | | (7.86 | ) | | | 3.01 | | | | 2.45 | | |
| Contribution by Adviser | | | - | | | | 0.04 | | | | - | | | | - | | | | - | | | | - | | |
| Less Distributions | | | |
| Net Realized Gains | | | - | | | | - | | | | - | | | | - | | | | - | | | | (4.15 | ) | |
| Total Distributions | | | - | | | | - | | | | - | | | | - | | | | - | | | | (4.15 | ) | |
| Net Asset Value, End of Period | | $ | 30.96 | | | $ | 31.17 | | | $ | 29.35 | | | $ | 19.92 | | | $ | 27.78 | | | $ | 24.77 | | |
| Total Return | | | (0.67 | )%(b) | | | 6.20 | % | | | 47.34 | % | | | (28.29 | )% | | | 12.15 | % | | | 7.40 | % | |
| Net Assets, End of Period (000's) | | $ | 195,053 | | | $ | 287,372 | | | $ | 364,320 | | | $ | 264,575 | | | $ | 348,387 | | | $ | 76,070 | | |
| Ratios/Supplemental Data | | | |
| Ratio of Expenses to Average Net Assets | | | 1.92 | %(a) | | | 2.21 | % | | | 2.16 | % | | | 1.92 | % | | | 1.94 | % | | | 2.19 | % | |
Ratio of Expenses to Average Net Assets
(excluding interest and dividend expense) | | | 1.88 | %(a) | | | 1.78 | % | | | 1.77 | % | | | 1.75 | % | | | 1.87 | % | | | 2.19 | % | |
Ratio of Net Investment Loss to Average
Net Assets | | | (1.02 | )%(a) | | | (1.51 | )% | | | (1.38 | )% | | | (1.01 | )% | | | (1.04 | )% | | | (1.07 | )% | |
| Portfolio Turnover Rate | | | 6 | %(b) | | | 15 | % | | | 42 | % | | | 78 | % | | | 150 | % | | | 187 | % | |
(a) Annualized.
(b) Not Annualized.
See accompanying notes to financial statements.
19
Needham Funds
Needham Aggressive Growth Fund
Financial Highlights
| (For a Share Outstanding | | Six Months
Ended
June 30, | | Year Ended December 31, | | September 4,
2001 to
December 31, | |
| Throughout each Period) | | 2005 | | 2004 | | 2003 | | 2002 | | 2001* | |
| | | | (Unaudited) | | | | | | | | | | | | | | | | | | |
| Net Asset Value, Beginning of Period | | $ | 12.85 | | | $ | 11.51 | | | $ | 9.09 | | | $ | 11.23 | | | $ | 10.00 | | |
| Investment Operations | | | |
| Net Investment Loss | | | (0.13 | ) | | | (0.36 | ) | | | (0.23 | ) | | | (0.17 | ) | | | (0.03 | ) | |
Net Realized and Unrealized Gains (Losses)
on Investments | | | (0.02 | ) | | | 1.70 | | | | 2.65 | | | | (1.76 | ) | | | 1.26 | | |
| Total from Investment Operations | | | (0.15 | ) | | | 1.34 | | | | 2.42 | | | | (1.93 | ) | | | 1.23 | | |
| Less Distributions | | | |
| Net Realized Gains | | | - | | | | - | | | | - | | | | (0.21 | ) | | | - | | |
| Total Distributions | | | - | | | | - | | | | - | | | | (0.21 | ) | | | - | | |
| Net Asset Value, End of Period | | $ | 12.70 | | | $ | 12.85 | | | $ | 11.51 | | | $ | 9.09 | | | $ | 11.23 | | |
| Total Return | | | (1.17 | )%(b) | | | 11.64 | % | | | 26.62 | % | | | (17.15 | )% | | | 12.30 | %(b) | |
| Net Assets, End of Period (000's) | | $ | 16,522 | | | $ | 17,000 | | | $ | 17,719 | | | $ | 14,273 | | | $ | 13,178 | | |
| Ratios/Supplemental Data | | | |
| Ratio of Expenses to Average Net Assets | | | 2.50 | %(a) | | | 2.61 | % | | | 2.52 | % | | | 2.51 | % | | | 2.57 | %(a) | |
Ratio of Expenses to Average Net Assets
(excluding interest and dividend expense) | | | 2.50 | %(a) | | | 2.50 | % | | | 2.50 | % | | | 2.50 | % | | | 2.50 | %(a) | |
Ratio of Expenses to Average Net Assets
(excluding waivers and reimbursement of expenses) | | | 3.06 | %(a) | | | 3.15 | % | | | 3.22 | % | | | 2.78 | % | | | 4.12 | %(a) | |
| Ratio of Net Investment Loss to Average Net Assets | | | (2.08 | )%(a) | | | (2.25 | )% | | | (2.24 | )% | | | (1.76 | )% | | | (1.23 | )%(a) | |
Ratio of Net Investment Loss to Average Net Assets
(excluding waivers and reimbursement of expenses) | | | (2.64 | )%(a) | | | (2.79 | )% | | | (2.94 | )% | | | (2.03 | )% | | | (2.78 | )%(a) | |
| Portfolio Turnover Rate | | | 37 | %(b) | | | 64 | % | | | 87 | % | | | 58 | % | | | 45 | %(a) | |
* The Needham Aggressive Growth Fund commenced operations on September 4, 2001.
(a) Annualized.
(b) Not Annualized.
See accompanying notes to financial statements.
20
Semiannual Report 2005
Needham Small Cap Growth Fund
Financial Highlights
| (For a Share Outstanding | | Six Months
Ended
June 30, | | Year Ended December 31, | | May 22,
2002 to
December 31, | |
| Throughout each Period) | | 2005 | | 2004 | | 2003 | | 2002* | |
| | | | (Unaudited) | | | | | | | | | | | | | | |
| Net Asset Value, Beginning of Period | | $ | 18.53 | | | $ | 16.84 | | | $ | 10.38 | | | $ | 10.00 | | |
| Investment Operations | | | |
| Net Investment Loss | | | (0.12 | ) | | | (0.37 | ) | | | (0.06 | ) | | | (0.10 | ) | |
Net Realized and Unrealized Gains (Losses)
on Investments | | | (0.39 | ) | | | 2.11 | | | | 6.52 | | | | 0.48 | | |
| Total from Investment Operations | | | (0.51 | ) | | | 1.74 | | | | 6.46 | | | | 0.38 | | |
| Less Distributions | | | |
| Net Realized Gains | | | - | | | | (0.05 | ) | | | - | | | | - | | |
| Total Distributions | | | - | | | | (0.05 | ) | | | - | | | | - | | |
| Net Asset Value, End of Period | | $ | 18.02 | | | $ | 18.53 | | | $ | 16.84 | | | $ | 10.38 | | |
| Total Return | | | (2.75 | )%(b) | | | 10.34 | % | | | 62.24 | % | | | 3.80 | %(b) | |
| Net Assets, End of Period (000's) | | $ | 20,378 | | | $ | 25,895 | | | $ | 27,616 | | | $ | 4,569 | | |
| Ratios/Supplemental Data | | | |
| Ratio of Expenses to Average Net Assets | | | 2.49 | %(a) | | | 2.52 | % | | | 2.27 | % | | | 2.50 | %(a) | |
Ratio of Expenses to Average Net Assets
(excluding interest and dividend expense) | | | 2.48 | %(a) | | | 2.50 | % | | | 2.26 | % | | | 2.50 | %(a) | |
Ratio of Expenses to Average Net Assets
(excluding waivers and reimbursement of expenses) | | | 2.75 | %(a) | | | 2.63 | % | | | 3.25 | % | | | 6.06 | %(a) | |
| Ratio of Net Investment Loss to Average Net Assets | | | (1.34 | )%(a) | | | (1.91 | )% | | | (1.68 | )% | | | (2.04 | )%(a) | |
Ratio of Net Investment Loss to Average Net Assets
(excluding waivers and reimbursement of expenses) | | | (1.60 | )%(a) | | | (2.02 | )% | | | (2.66 | )% | | | (5.60 | )%(a) | |
| Portfolio Turnover Rate | | | 59 | %(b) | | | 68 | % | | | 67 | % | | | 107 | %(a) | |
* The Needham Small Cap Growth Fund commenced operations on May 22, 2002.
(a) Annualized.
(b) Not Annualized.
See accompanying notes to financial statements.
21
Needham Funds
Notes To Financial Statements
(Unaudited)
1. Organization
Needham Growth Fund ("NGF"), Needham Aggressive Growth Fund ("NAGF'') and Needham Small Cap Growth Fund ("NSCGF'') or (the "Portfolios''), are portfolios of The Needham Funds, Inc. (the "Fund''), which is registered under the Investment Company Act of 1940 as a non-diversified, open-end management investment company. The Fund was organized as a Maryland corporation on October 12, 1995.
2. Significant Accounting Policies
Security Valuation: Investments in securities (including options) listed or traded on a nationally recognized securities exchange are valued at the last quoted sales price on the date the valuations are made. Portfolio securities and options positions for which market quotations are readily available are stated at the NASDAQ Official Closing Price or the last sale price reported by the principal exchange for each such security as of the exchange's close of business, as applicable. Securities and options for which no sale has taken place during the day and securities which are not listed on an exchange are valued at the mean of the current closing bid and asked prices. All other securities and assets for which market quotations are not readily available are valued at th eir fair value as determined in good faith by the Board of Directors, although the actual calculations may be made by persons acting pursuant to the direction of the Board of Directors. The assets of each Portfolio may also be valued on the basis of valuations provided by a pricing service approved by, or on behalf of, the Board of Directors.
Investment Transactions: Changes in holdings of portfolio securities for the Portfolios shall be reflected no later than in the first calculation on the first business day following the trade date for purposes of calculating each Portfolio's daily net asset value per share. However, for financial reporting purposes, portfolio security transactions are reported on trade date. The cost (proceeds) of investments sold (bought to cover) is determined on a specific identification basis for the purpose of determining gains or losses on sales and buys to cover short positions. Dividend income and distributions to shareholders are recorded on the ex-dividend date. Interest income is recorded on an accrual basis.
Use of Estimates: The preparation of financial statements in accordance with accounting principles generally accepted in the United States of America requires management to make estimates and assumptions that affect the reported amounts and disclosures in the financial statements. Actual results could differ from those estimates and those differences could be material.
3. Investment Advisory and Administrative Services
The Fund has engaged Needham Investment Management L.L.C. (the "Adviser'') to manage its investments. The Fund pays the Adviser a fee at the annual rate of 1.25% of the average daily net asset value of each Portfolio.
The Adviser has voluntarily agreed to waive its fee for, and to reimburse expenses of, NAGF and NSCGF in an amount that limits annual operating expenses (excluding interest expense and dividend expense on securities sold short) to not more than 2.50% of the average daily net assets of NAGF and NSCGF for the six months ended June 30, 2005.
For the six months ended June 30, 2005, the Adviser waived advisory fees in the amount of $44,547 and $27,825 for NAGF and NSCGF, respectively. The Adviser waived none of its fees for NGF during the six months ended June 30, 2005.
Effective June 6, 2005, BISYS Fund Services Ohio, Inc. ("BISYS") was hired to serve as the Fund's Administrator. In consideration of these services, BISYS receives a fee computed daily and paid monthly at the annual rate equal to 0.07% of the first $750 million of the average daily net assets of the Portfolios and 0.065% of the average daily net assets of the Portfolios in excess of $750 million. BISYS also acts as the Fund's shareholder servicing agent and transfer agent.
Prior to June 6, 2005, PFPC, Inc. served as the Fund's Administrator and received a fee at the annual rate of 0.10% of the average daily net assets of each Portfolio, subject to certain minimums.
Certain officers and directors of the Fund are also officers and directors of the Adviser. Needham & Company, LLC also provides an employee to serve the Fund as Chief Compliance Officer for which Needham & Company, LLC receives compensation from the Fund as approved by the Fund's Board of Directors.
4. Distribution Plan
The Fund has adopted a Distribution Plan pursuant to Rule 12b-1 under the Investment Company Act of 1940. Under the plan, each Portfolio pays Needham & Company, LLC and any other distributor or financial institution with which the Fund has an agreement with respect to each Portfolio, a fee at an annual rate of 0.25 of 1% of each Portfolio's daily average net assets. For the six months ended June 30, 2005, NGF, NAGF and NSCGF incurred distribution fees in the amount of $276,642, $19,881 and $26,323, respectively. For the six months ended June 30, 2005, NGF, NAGF and NSCGF each paid 12b-1 fees to Needham & Company, LLC in the amount of $71,588, $12,920 and $10,771, respectively.
5. Temporary Borrowings
The Fund has entered into an agreement with the Custodial Trust Company for temporary borrowing purposes, including the meeting of redemption requests that otherwise might require the untimely disposition of securities. Interest is calculated daily based on the Federal Funds Rate plus one percent. The Fund may borrow from banks up to 25% of its total assets and may pledge its assets in connection with these borrowings, provided that no additional investments shall be made while borrowings exceed 5% of total assets.
There were no outstanding borrowings by the Fund at June 30, 2005.
22
Semiannual Report 2005
Notes To Financial Statements (Continued)
(Unaudited)
6. Securities Lending
The Portfolios may lend their respective portfolio securities, provided that with regard to each Portfolio (i) the loan is secured continuously by collateral consisting of U.S. Government securities, cash, or cash equivalents adjusted daily to have a market value at least equal to the current market value of the securities loaned, (ii) the Portfolio may at any time call the loan and regain the securities loaned, (iii) the Portfolio will receive any interest or dividends paid on the loaned securities, and (iv) the aggregate market value of securities loaned will not at any time exceed such percentage of the total assets of the Portfolio as the Directors may establish, but not to exceed 20%, including repurchase agreements. In addition, it is anticipated that the Portfolio may share with the borrower some of the income received on the collateral for the loan or that it will be paid a premium for the loan. Before a Portfolio enters into a loan, the Adviser considers the relevant facts including the creditworthiness of the borrower. The risks in lending portfolio securities consist of possible delay in recovery of the securities or possible loss of rights in the collateral should the borrower fail financially.
| | | Value of
Securities Loaned | | Value of
Cash Collateral | |
| NGF | | $ | 14,447,574 | | | $ | 14,933,724 | | |
| NAGF | | | 1,310,077 | | | | 1,343,660 | | |
| NSCGF | | | 1,896,446 | | | | 1,992,058 | | |
7. Repurchase Agreements
The Portfolios will only enter into repurchase agreements where (i) the underlying securities are of the type which the Portfolios' investment policies would allow the Portfolios to purchase directly, (ii) the market value of the underlying security, including accrued interest, will at all times be equal to or exceed the value of the repurchase agreement, and (iii) payment for the underlying securities is made only upon physical delivery or evidence of book-entry transfer to the account of the custodian or a bank acting as agent. A Portfolio will not enter into a repurchase agreement with a maturity of more than seven business days if, as a result, more than 15% of the value of its net assets would then be invested in such repurchase agreements and other illiquid securities.
The repurchase price generally equals the price paid by the Portfolio plus interest negotiated on the basis of current short-term rates, which may be more or less than the rate on the underlying portfolio securities. Repurchase agreements will be fully collateralized at all times.
8. Option Transactions
The Fund may invest in options contracts to reduce the Portfolios' exposure to fluctuations in the prices of portfolio securities and to prevent losses if the prices of such securities decline. Similarly, such investments may protect the Portfolios against fluctuations in the value of securities in which Portfolios are about to invest.
The Portfolios may write call and put options on securities they own or have the right to acquire, and may purchase put and call options on individual securities and indices written by others. Put and call options give the holder the right to sell or purchase, respectively, a specified amount of a security at a specified price on a certain date.
The Portfolios are subject to market risk associated with changes in the value of the underlying financial instrument, as well as the risk of loss of appreciation if a counterparty fails to perform. For exchange-traded contracts, the exchange acts as the counterparty to specific transactions, and therefore, bears the risk of delivery to and from counterparties of specific positions.
Put and call options purchased are accounted for in the same manner as portfolio securities. The cost of securities acquired through the exercise of call options is increased by the premium paid. The proceeds from securities sold through the exercise of put options are decreased by the premiums paid. Options on stock indices differ from options on securities in that the exercise of an option on a stock index does not involve delivery of the actual underlying security and is settled in cash only.
When a Portfolio writes an option, the premium received by the Portfolio is recorded as a liability and is subsequently adjusted to the current market value of the option written. Premiums received from writing options, which have expired, are recorded by the Portfolio on the expiration date as realized gains from option transactions. When a Portfolio enters into a closing purchase transaction, the Portfolio realizes a gain or loss equal to the difference between the cost of a closing purchase transaction and the premium received when the option was written. If a written call option is exercised, the premium received is added to the proceeds from the sale of the underlying security in determining whether the Portfolio has a realized gain or loss. If a written put option is exercised, the premium received reduces the cost basis of the securities purchased. In writing an option, the Portfolio bea rs the market risk of an unfavorable change in the price of the security underlying the written option.
In the normal course of business, certain of the Portfolios will trade and hold certain fair-valued derivative contracts which constitute guarantees under Financial Accounting Standards Board Interpretation 45. Such contracts include written options where the Portfolios would be obligated to purchase or sell a specified security at a specified price if the option is exercised by the counterparty. The maximum payouts for these contracts are limited to the number of contracts written and the related strike price. The maximum payout amount could be offset by the subsequent sale of assets obtained via the execution of a payout event.
Neither NGF, NAGF nor NSCGF had purchased or written options during the six months ended June 30, 2005.
9. Short Sale Transactions
During the six months ended June 30, 2005, the Portfolios sold securities short. Upon selling a security short, the Portfolios record a receivable for the settlement amount and a corresponding liability, which is marked-to-market to reflect current value. Securities owned by the Portfolios are segregated as collateral while the short sales are outstanding.
23
Needham Funds
Notes To Financial Statements (Continued)
(Unaudited)
At June 30, 2005, the market value of securities separately segregated to cover short positions were approximately $17,878,250, $541,330 and $820,450 for NGF, NAGF and NSCGF, respectively. Additionally, included in Due from Brokers is $3,635,505, $27,400 and $29,984 pledged as collateral with the brokers in connection with open short positions for NGF, NAGF and NSCGF, respectively. Securities sold short at June 30, 2005 and their related market values and proceeds are set forth in the accompanying Schedule of Securities Sold Short.
10. Investment Transactions
The following summarizes the aggregate amount of purchases and sales of investment securities and securities sold short, excluding short-term securities, during the six months ended June 30, 2005:
| | | Purchases | | Sales | |
| NGF | | $ | 13,156,099 | | | $ | 97,911,819 | | |
| NAGF | | | 5,401,718 | | | | 6,374,422 | | |
| NSCGF | | | 11,891,718 | | | | 17,486,584 | | |
During the six months ended June 30, 2005, NGF, NAGF and NSCGF each incurred and paid brokerage commissions to Needham & Company, LLC in the amount of $64,563, $789 and $16,139, respectively.
11. Financial Instruments
The Fund has always maintained a policy of valuing its securities positions and derivative instruments at market values or estimated fair values and of including any realized or unrealized gains or losses in income.
In the normal course of its business, the Portfolios may trade various financial instruments with off-balance sheet risk. These financial instruments include securities sold short and exchange traded options. Generally, these financial instruments represent future commitments to purchase or sell other financial instruments at specific terms at specified future dates. Each of these financial instruments contains varying degrees of off-balance sheet risk whereby changes in the market values of the securities underlying the financial instruments may be in excess of the amounts recognized in the financial statements.
Securities sold short represent obligations of the Portfolios to make future delivery of specific securities and, correspondingly, create an obligation to purchase the securities at market prices prevailing at a later delivery date (or to deliver the securities if already owned by the Portfolios). As a result, short sales create the risk that the Portfolios' ultimate obligation to satisfy the delivery requirements may exceed the amount of the proceeds initially received on the liability recorded in the financial statements.
12. Contractual Obligations
In the ordinary course of business, the Fund enters into contracts that contain a variety of indemnifications. The Fund's maximum exposure under these arrangements is unknown. However, the Fund has not had prior claims or losses pursuant to these contracts and expects the risk of loss to be remote.
13. Federal Income Taxes
No provision for federal income taxes is required since the Fund intends to continue to qualify as a regulated investment company under Subchapter M of the Internal Revenue Code and distribute substantially all of its taxable income and capital gains to shareholders. Because income tax regulations differ from generally accepted accounting principles, the timing and character of income and capital gain distributions determined in accordance with tax regulations can differ from income and capital gains recognized for financial reporting purposes. Accordingly, the character of distributions and the composition of net assets for tax purposes can differ from those reflected in the financial statements. These book/tax differences may be temporary or permanent in nature. Temporary differences are generally due to differing book and tax treatment for the timing of the recognition of gains and losses on securities, including post-October losses. Permanent differences are generally due to differing treatment of net investment losses. To the extent these differences are permanent, they are charged or credited to paid-in capital, accumulated net realized gain (loss), or accumulated net investment income (loss), as appropriate, in the period the differences arise. These reclassifications have no effect on net assets or net asset value per share of each Portfolio.
For federal income tax purposes, the Fund measures its capital loss carryforwards annually at December 31, its fiscal year end. At December 31, 2004, the following Portfolios had capital loss carryforwards for federal income tax purposes in the following approximate amounts:
| | | Expires on December 31, | |
| | | 2010 | | 2011 | | 2012 | | Total | |
| NGF | | $ | 28,659,000 | | | $ | 12,380,000 | | | | - | | | $ | 41,039,000 | | |
| NAGF | | | - | | | $ | 99,000 | | | | - | | | $ | 99,000 | | |
| NSCGF | | | - | | | | - | | | $ | 535,000 | | | $ | 535,000 | | |
Capital losses after October 31 ("post-October losses'') within the taxable year are deemed to arise on the first business day of the Portfolios' next taxable year. After October 31, 2004, NAGF incurred and will elect to defer net capital losses in the approximate amount of $69,000. Neither NGF nor NSCGF had any post-October losses.
14. Other Matters
During the year ended December 31, 2004, the Adviser determined that certain interest and dividend income/expense amounts had been under-recorded for NGF in previous years and through June 2004. In connection therewith, an adjustment of approximately $708,500 was recorded to recognize the correct net interest and dividend expense relating to previous years in the 2004 statement of operations (increasing the 2004 net investment loss per share by $0.07, increasing the 2004 ratio of expenses to average net assets by 0.43% and decreasing the 2004 total return by 0.24%). Additionally, in October 2004, the Adviser made a payment to NGF of $417,668 to reimburse NGF for a net overpayment to redeeming shareholders during the period of time that the error persisted, which is reflected in the statement of changes in net assets (which increased the 2004 total return by 0.14%)
24
Semiannual Report 2005
Supplemental Data (Unaudited)
Disclosure of Portfolio Holdings
The Needham Funds, Inc. (the "Fund") files a Form N-Q with the Securities and Exchange Commission (the "SEC") no later than sixty days after the Fund's first and third fiscal quarters. For the Fund, this would be for the fiscal quarters ending March 31 and September 30. Form N-Q includes a complete schedule of the Fund's portfolio holdings as of the end of those fiscal quarters. The Fund's N-Q filings can be found on the SEC website at http://www.sec.gov, or they may be reviewed and copied at the SEC's Public Reference Room in Washington, D.C. (call 800-SEC-0330 for information on the operation of the Public Reference Room).
Voting Proxies on Fund Portfolio Securities
A description of the policies and procedures that the Fund uses to determine how to vote proxies relating to portfolio securities and information regarding how the Fund voted proxies relating to portfolio securities during the most recent 12-month period ended June 30 are available without charge, upon request, by calling 1-800-625-7071 or on the SEC's website at http://www.sec.gov.
25
[THIS PAGE INTENTIONALLY LEFT BLANK]
[THIS PAGE INTENTIONALLY LEFT BLANK]
[THIS PAGE INTENTIONALLY LEFT BLANK]

445 Park Avenue
New York, New York 10022-2606
1-800-625-7071
Investment Adviser:
Needham Investment Management L.L.C.
445 Park Avenue
New York, NY 10022-2606
President
George A. Needham
Executive Vice Presidents
and Portfolio Managers
Vincent E. Gallagher
Needham Growth Fund
Needham Small Cap Growth Fund
James K. Kloppenburg
Needham Growth Fund
Needham Aggressive Growth Fund
Directors
George A. Needham
James P. Poitras
F. Randall Smith
Distributor:
Needham & Company, LLC
445 Park Avenue
New York, NY 10022-2606
212-371-8300
Administrator, Shareholder Servicing
Agent and Transfer Agent:
BISYS Fund Services Ohio, Inc.
3435 Stelzer Road
Columbus, OH 43219
Custodian:
Custodial Trust Company
101 Carnegie Center
Princeton, NJ 08540
Counsel:
Fulbright & Jaworski L.L.P.
666 Fifth Avenue
New York, NY 10103
Independent Registered Public Accounting Firm:
Ernst & Young LLP
5 Times Square
New York, NY 10036
Item 2. Code of Ethics.
Disclose whether, as of the end of the period covered by the report, the registrant has adopted a code of ethics that applies to the registrant’s principal executive officer, principal financial officer, principal accounting officer or controller, or persons performing similar functions, regardless of whether these individuals are employed by the registrant or a third party. If the registrant has not adopted such a code of ethics, explain why it has not done so.
Not applicable for semi-annual reports.
The registrant must briefly describe the nature of any amendment, during the period covered by the report, to a provision of its code of ethics that applies to the registrant’s principal executive officer, principal financial officer, principal accounting officer or controller, or persons performing similar functions, regardless of whether these individuals are employed by the registrant or a third party, and that relates to any element of the code of ethics definition enumerated in paragraph (b) of this Item. The registrant must file a copy of any such amendment as an exhibit pursuant to Item 12(a)(1), unless the registrant has elected to satisfy paragraph (f) of this Item by posting its code of ethics on its website pursuant to paragraph (f)(2) of this Item, or by undertaking to provide its code of ethics to any person without charge, upon request, pursuant to paragraph (f)(3) of this Item.
If the registrant has, during the period covered by the report, granted a waiver, including an implicit waiver, from a provision of the code of ethics that applies to the registrant’s principal executive officer, principal financial officer, principal accounting officer or controller, or persons performing similar functions, regardless of whether these individuals are employed by the registrant or a third party, that relates to one or more items set forth in paragraph (b) of this Item, the registrant must briefly describe the nature of the waiver, the name of the person to whom the waiver was granted, and the date of the waiver.
During the period covered by the report, with respect to the registrant’s code of ethics that applies to its principal executive officer, principal financial officer, principal accounting officer or controller, or persons performing similar functions, there have been no amendments to, nor any waivers granted from, a provision that relates to any element of the code of ethics definition enumerated in paragraph (b) of this Item 2.
Item 3. Audit Committee Financial Expert.
(a) (1) Disclose that the registrant’s board of directors has determined that the registrant either:
(i) Has at least one audit committee financial expert serving on its audit committee; or
(ii) Does not have an audit committee financial expert serving on its audit committee.
(2) If the registrant provides the disclosure required by paragraph (a)(1)(i) of this Item, it must disclose the name of the audit committee financial expert and whether that person is “independent.” In order to be considered “independent” for purposes of this Item, a member of an audit committee may not, other than in his or her capacity as a member of the audit committee, the board of directors, or any other board committee:
(i) Accept directly or indirectly any consulting, advisory, or other compensatory fee from the issuer; or
(ii) Be an “interested person” of the investment company as defined in Section 2(a)(19) of the Act (15 U.S.C.
80a-2(a)(19)).
(3) If the registrant provides the disclosure required by paragraph (a)(1)(ii) of this Item, it must explain why it does not have an audit committee financial expert.
Not applicable for semi-annual reports.
Item 4. Principal Accountant Fees and Services.
(a) Disclose, under the caption Audit Fees, the aggregate fees billed for each of the last two fiscal years for professional services rendered by the principal accountant for the audit of the registrant’s annual financial statements or services that are normally provided by the accountant in connection with statutory and regulatory filings or engagements for those fiscal years.
(b) Disclose, under the caption Audit-Related Fees, the aggregate fees billed in each of the last two fiscal years for assurance and related services by the principal accountant that are reasonably related to the performance of the audit of the registrant’s financial statements and are not reported under paragraph (a) of this Item. Registrants shall describe the nature of the services comprising the fees disclosed under this category.
(c) Disclose, under the caption Tax Fees, the aggregate fees billed in each of the last two fiscal years for professional services rendered by the principal accountant for tax compliance, tax advice, and tax planning. Registrants shall describe the nature of the services comprising the fees disclosed under this category.
(d) Disclose, under the caption All Other Fees, the aggregate fees billed in each of the last two fiscal years for products and services provided by the principal accountant, other than the services reported in paragraphs (a) through (c) of this Item. Registrants shall describe the nature of the services comprising the fees disclosed under this category.
(e) (1) Disclose the audit committee’s pre-approval policies and procedures described in paragraph (c)(7) of Rule 2-01 of Regulation S-X.
(2) Disclose the percentage of services described in each of paragraphs (b) through (d) of this Item that were approved by the audit committee pursuant to paragraph (c)(7)(i)(C) of Rule 2-01 of Regulation S-X.
(f) If greater than 50 percent, disclose the percentage of hours expended on the principal accountant’s engagement to audit the registrant’s financial statements for the most recent fiscal year that were attributed to work performed by persons other than the principal accountant’s full-time, permanent employees.
(g) Disclose the aggregate non-audit fees billed by the registrant’s accountant for services rendered to the registrant, and rendered to the registrant’s investment adviser (not including any sub-adviser whose role is primarily portfolio management and is subcontracted with or overseen by another investment adviser), and any entity controlling, controlled by, or under common control with the adviser that provides ongoing services to the registrant for each of the last two fiscal years of the registrant.
(h) Disclose whether the registrant’s audit committee of the board of directors has considered whether the provision of nonaudit services that were rendered to the registrant’s investment adviser (not including any subadviser whose role is primarily portfolio management and is subcontracted with or overseen by another investment adviser), and any entity controlling, controlled by, or under common control with the investment adviser that provides ongoing services to the registrant that were not pre-approved pursuant to paragraph (c)(7)(ii) of Rule 2-01 of Regulation S-X is compatible with maintaining the principal accountant’s independence.
Not applicable for semi-annual reports.
Item 5. Audit Committee of Listed Registrants.
(a) If the registrant is a listed issuer as defined in Rule 10A-3 under the Exchange Act (17CFR 240.10A-3), state whether or not the registrant has a separately-designated standing audit committee established in accordance with Section
3(a)(58)(A) of the Exchange Act (15 U.S.C. 78c(a)(58)(A)). If the registrant has such a committee, however designated, identify each committee member. If the entire board of directors is acting as the registrant’s audit committee as specified in Section 3(a)(58)(B) of the Exchange Act (15 U.S.C. 78c(a)(58)(B)), so state.
(b) If applicable, provide the disclosure required by Rule 10A-3(d) under the Exchange Act (17CFR 240.10A-3(d)) regarding an exemption from the listing standards for all audit committees.
Not applicable.
Item 6. Schedule of Investments.
File Schedule I – Investments in securities of unaffiliated issuers as of the close of the reporting period as set forth in § 210.12-12 of Regulation S-X, unless the schedule is included as part of the report to shareholders filed under Item 1 of this Form.
Not applicable.
Item 7. Disclosure of Proxy Voting Policies and Procedures for Closed-End Management Investment Companies.
A closed-end management investment company that is filing an annual report on this Form N-CSR must, unless it invests exclusively in non-voting securities, describe the policies and procedures that it uses to determine how to vote proxies relating to portfolio securities, including the procedures that the company uses when a vote presents a conflict between the interests of its shareholders, on the one hand, and those of the company’s investment adviser; principal underwriter; or any affiliated person (as defined in Section 2(a)(3) of the Investment Company Act of 1940 (15 U.S.C. 80a-2(a)(3)) and the rules thereunder) of the company, its investment adviser, or its principal underwriter, on the other. Include any policies and procedures of the company’s investment adviser, or any other third party, that the company uses, or that are used on the company’s behalf, to determine how to vote proxies relating to portfolio securities.
Not applicable.
Item 8. Portfolio Managers of Closed-End Management Investment Companies.
If the registrant is a closed-end management investment company that is filing an annual report on this Form N-CSR, provide the information specified in paragraphs (a) and (b) of this Item with respect to portfolio managers.
Not applicable.
Item 9. Purchases of Equity Securities by Closed-End Management Investment Company and Affiliated Purchasers.
If the registrant is a closed-end management investment company, provide the information specified in paragraph (b) of this Item with respect to any purchase made by or on behalf of the registrant or any “affiliated purchaser,” as defined in Rule 10b-18(a)(3) under the Exchange Act (17 CFR 240.10b-18(a)(3)), of shares or other units of any class of the registrant’s equity securities that is registered by the registrant pursuant to Section 12 of the Exchange Act (15 U.S.C. 781).
Not applicable.
Item 10. Submission of Matters to a Vote of Security Holders.
Describe any material changes to the procedures by which shareholders may recommend nominees to the registrant’s board of directors, where those changes were implemented after the registrant last provided disclosure in response to the requirements of Item
7(d)(2)(ii)(G) of Schedule 14A (17 CFR 240.14a-101), or this Item.
Not applicable.
Item 11. Controls and Procedures.
(a) Disclose the conclusions of the registrant’s principal executive and principal financial officers, or persons performing similar functions, regarding the effectiveness of the registrant’s disclosure controls and procedures (as defined in Rule 30a-3(c) under the Act (17 CFR 270.30a-3(c))) as of a date within 90 days of the filing date of the report that includes the disclosure required by this paragraph, based on the evaluation of these controls and procedures required by Rule 30a-3(b) under the Act (17 CFR 270.30a-3(b)) and Rules 13a-15(b) or 15d-15(b) under the Exchange Act (17 CFR 240.13a-15(b) or 240.15d-15(b)).
The registrant’s principal executive officer and principal financial officer have concluded, based on their evaluation of the registrant’s disclosure controls and procedures as conducted within 90 days of the filing date of this report, that these disclosure controls and procedures are adequately designed and are operating effectively to ensure that information required to be disclosed by the registrant on Form N-CSR is recorded, processed, summarized and reported within the time periods specified in the Securities and Exchange Commission’s rules and forms.
(b) Disclose any change in the registrant’s internal control over financial reporting (as defined in Rule 30a-3(d) under the Act (17 CFR 270.30a-3(d)) that occurred during the second fiscal quarter of the period covered by this report that has materially affected, or is reasonably likely to materially affect, the registrant’s internal control over financial reporting.
There were no changes in the registrant’s internal control over financial reporting that occurred during the second fiscal quarter of the period covered by this report that have materially affected or are reasonably likely to materially affect, the registrant’s internal control over financial reporting.
Item 12. Exhibits.
(a) File the exhibits listed below as part of this Form. Letter or number the exhibits in the sequence indicated.
(a)(1) Any code of ethics, or amendment thereto, that is the subject of the disclosure required by Item 2, to the extent that the registrant intends to satisfy the Item 2 requirements through filing of an exhibit. Not applicable.
(a)(2) A separate certification for each principal executive officer and principal financial officer of the registrant as required by Rule 30a-2(a) under the Act (17 CFR 270.30a-2). Certifications pursuant to Rule 30a-2(a) are filed herewith.
(a)(3) Any written solicitation to purchase securities under Rule 23c-1 under the Act (17 CFR 270.23c-1) sent or given during the period covered by the report by or on behalf of the registrant to 10 or more persons. Not applicable.
(b) If the report is filed under Section 13(a) or 15(d) of the Exchange Act, provide the certifications required by rule
30a-2(b) under the Act as an exhibit. A certification furnished pursuant to this paragraph will not be deemed “filed” for purposes of Section 18 of the Exchange Act, or otherwise subject to the liability of that section. Such certification will not be deemed to be incorporated by reference into any filing under the Securities Act of 1933 or the Exchange Act, except to the extent that the registrant incorporates it by reference. Certifications pursuant to Rule 30a-2(b) are furnished herewith.
SIGNATURES
Pursuant to the requirements of the Securities Exchange Act of 1934 and the Investment Company Act of 1940, the registrant
has duly caused this report to be signed on its behalf by the undersigned, thereunto duly authorized.
(Registrant) | The Needham Funds, Inc. |
| | |
By (Signature and Title) | /s/ George A. Needham | George A. Needham President |
| | |
Date September 6, 2005 | | |
| | | | |
Pursuant to the requirements of the Securities Exchange Act of 1934 and the Investment Company Act of 1940, this report has been signed below by the following persons on behalf of the registrant and in the capacities and on the dates indicated.
By (Signature and Title) | /s/ George A. Needham | George A. Needham President |
| | | |
Date September 6, 2005 | | | |
| | | |
By (Signature and Title) | /s/ Glen W. Albanese | Glen W. Albanese Treasurer and Secretary |
| | | |
Date September 6, 2005 | | | |
| | | | | |