Washington, D.C. 20549
The Needham Funds, Inc.
Mr. George A. Needham, 445 Park Avenue, New York, NY 10022
Item 1. Reports to Stockholders.
 | |
| | |
| 445 Park Avenue | |
| New York, New York 10022-2606 | |
| | |
| 1-800-625-7071 | |
| www.needhamfunds.com | |
| Semi-Annual Report | |
| June 30, 2011 | |
| | |
| Contents | |
| | |
| Letter from the Adviser | 1 |
| Portfolio Characteristics | |
| Needham Growth Fund | 5 |
| Needham Aggressive Growth Fund | 6 |
| Needham Small Cap Growth Fund | 7 |
| Disclosure of Fund Expenses | 8 |
| Schedule of Investments | |
| Needham Growth Fund | 9 |
| Needham Aggressive Growth Fund | 12 |
| Needham Small Cap Growth Fund | 15 |
| Schedule of Securities Sold Short | |
| Needham Growth Fund | 11 |
| Needham Aggressive Growth Fund | 14 |
| Needham Small Cap Growth Fund | 17 |
| Statements of Assets and Liabilities | 18 |
| Statements of Operations | 19 |
| Statements of Changes in Net Assets | 20 |
| Financial Highlights | |
| Needham Growth Fund | 21 |
| Needham Aggressive Growth Fund | 22 |
| Needham Small Cap Growth Fund | 23 |
| Notes to Financial Statements | 24 |
| Supplementary Information | 29 |
This report is authorized for distribution to prospective investors only when preceded or accompanied by a current prospectus. The prospectus contains more complete information, including investment objectives, risks, expenses and charges and should be read carefully before investing or sending any money. To obtain a prospectus, please call 1-800-625-7071.
Portfolios of The Needham Funds, Inc., like all mutual funds:
The Needham Funds, Inc. are distributed by Needham & Company, LLC.
| Needham Funds | Semi-Annual Report 2011 |
August 30, 2011
Dear Shareholders, Friends of Needham and Prospective Shareholders,
We are reporting our semi-annual results for the Needham Growth Fund, Needham Aggressive Growth Fund and Needham Small Cap Growth Fund.
Needham Funds Overview
Like 2010, the first half of 2011 was a tale of two markets. The year began with the funds performing roughly in-line with the S&P 500, which was up 5.4%. However, the second quarter and most of the first two months of the third quarter have been a major disappointment for the market and our funds. In July and August, the S&P 500 is down 9.4%, the Russell 2000 Index is down 13.6% and our funds are down 17.6-19.5%. Our small and mid-cap technology stocks have been hit disproportionately.
In early August the market was quite oversold. The bounce over the last three weeks has corrected that some of the short-term oversold position. Our portfolios remain very attractively valued. Fourteen of our top twenty positions in each of the funds are valued between 1.1x-1.6x enterprise value to revenues. As long-term investors with confidence in our companies, we are loath to make short-term dramatic changes to the portfolios. We continue to make changes around the edges and invest for long-term gains. This strategy has served us quite well over the years.
Market Commentary
The equity markets have been hit very hard since mid-July. Sovereign debt is the big issue. The European debt crisis has moved beyond Greece. The Greek rescue package is facing challenges as Finland has asked for collateral to match their contribution. Germany faces a September 7 ruling on the constitutionality of its participation in European Union bailouts. The bailouts are unpopular in Germany. Concerns over European bank liquidity, due to their exposure to European sovereign debt, have spread to France. We do not see an easy long-term solution, although the most likely short-term outcome is the status quo.
Next we turn to the United States. On August 5, Standard & Poor’s downgraded the U.S. debt to AA+. While the catalyst for the downgrade was the unseemly process around the recent increase in the debt ceiling, the underlying problem is that the United States has been on an unsustainable path for years. While we resent that S&P chose to downgrade while the markets were this vulnerable, as Reinhart and Rogoff wrote in their book, This Time Is Different, countries run into serious trouble when the debt to GDP ratio reaches 80-90%—and we are there. We see a ray of hope in the congressional super committee established to reduce the growth of the budget deficit. As the Wall Street Journal wrote just this morning, this committee may just have the political backing to achieve its objective.
The economic news continues to look weak. GDP growth was revised to 0.4% in 1Q11 and 1.0% in 2Q11. Based on the continuing deterioration of the guidance for the companies we follow, we suspect that GDP could be at a negative run-rate. While the July labor report showed unemployment at a stable 9.1% (better than had been expected), the underlying factors—labor force participation, under-employment and long-term unemployment—were terrible.
Unfortunately, the market seems to turn on little more than a daily evaluation of the prospects for continued liquidity from the Federal Reserve. The Federal Reserve’s QE2 program of providing liquidity to the markets by buying Treasury bonds ended June 30. We, like many others, had thought the end of this program was discounted by the markets. We have been long-time believers that the Federal Reserve and its international counterparts will stay accommodative and bring another liquidity program to the markets. Last year, QE2 brought a strong stock market and a pickup in 4Q10 GDP. At its August 9 meeting, the Federal Reserve announced that it would stay accommodative for two years. This focus on liquidity and other macro issues has led to a very high correlation of the performance of stocks. On August 22, Bloomberg.com wrote that ‘‘the average correlation between the 500 companies and the index was 0.8268 yesterday, using 60 days of data according to MF Global.’’ Jim Bianco noted that the correlation of large cap stocks was near its September 2009 peak. This correlation has made our job of selecting stocks very difficult. We remain confident this correlation will end.
These are difficult times and there are no easy answers. However, valuations are attractive. Even in uncertain times, we believe the best approach is to invest in companies with strong balance sheets and venerable management teams. We have a portfolio of companies with strong growth opportunities.
Needham Funds
One of the highlights during the first half was that our companies continue to be attractive acquisition targets. On April 19, EMS Technologies (ELMG) announced that it hired an investment banker to explore a sale (the stock was at $24.00 per share). On June 13, EMS announced that it had reached an agreement to be acquired by Honeywell International (HON) for $33.00 per share. EMS was the largest gainer for all three of the funds. On May 26, Sky-works Solutions (SWKS) announced the intent to acquire Advanced Analogic Technologies (AATI) for $6.13 per share, which represented a 60% premium. Advanced Analogic had been a small holding of the Needham Aggressive Growth Fund. On April 27, Toshiba Medical Systems announced an agreement to buy Vital Images for $18.75 per share, representing a 32% premium. Vital Images supplies image analysis solutions for healthcare professionals and Toshiba is a major partner. Vital Images had been a small holding for both the Small Cap Growth Fund and Aggressive Growth Fund.
During the first quarter, TomoTherapy (TOMO) announced an agreement to be acquired by Accuray (ARAY) for approximately a 20% premium. Both Iron Mountain (IRM) and Immersion (IMMR) accepted activists onto their boards. Finally, Seagate (STX) announced that it would not pursue a sale of the company but rather a restructuring of its operations and balance sheet.
We believe there will be additional acquisitions of our portfolio companies throughout the year.
Needham Growth Fund
The Needham Growth Fund was up 3.9% in the first half, however it is down 13.6% year-to-date (as of August 29). The largest ten holdings at the beginning of the year remained significant holdings at the end of June. The only new addition to the top ten was Akamai (AKAM).
The fund’s largest contributor was EMS Technologies. The acquisition by Honeywell closed in August. Life science diagnostics continues to be a strong area, and a number of our companies, including Thermo Fisher Scientific (TMO), Becton, Dickinson (BDX) and Covidien (COV), are benefitting. Other leading contributors included IPG Photonics (IPGP) and Super Micro Computer (SMCI). Several of our semiconductor capital equipment holdings, including Brooks Automation (BRKS), Entegris (ENTG) and Electro Scientific Industries (ESIO) were also top contributors, although their positive contribution occurred in the first quarter.
We suffered losses in some of the largest holdings. Akamai stumbled for the second consecutive quarter as price pressure and guidance for a volume shortfall in its core content delivery network business was more severe than expected. Akamai’s value-added services could not make up the difference. Oclaro (OCLR) and Finisar (FNSR) suffered from a difficult market for optical components as China’s network spending slowed. Oclaro was hurt by its own failure to manufacture its ROADM (reconfigurable optical add drop multiplexer) product. ROADMs will be a key component of the next-generation carrier networks, but Oclaro has been late to market.
Entropic Communications (ENTR) was a bottom contributor in 1Q and a top-10 contributor in 2Q. The bearish case believes that MoCA® intellectual property licenses are becoming available to more semiconductor companies. MaxLinear (MXL) announced an agreement to license MoCA® from a company we believe to be Cisco (CSCO). We don’t believe there will be many other licensees at all. We believe Entropic has at least an 18 to 24 month lead on any new potential competitor. This case also sees Entropic’s average selling price declining by 50% in 2H11. We model an annual 5-15% price decrease and see no reason that 2H11 should see an accelerated price decline. On August 3, Entropic announced disappointing 2H guidance based on the Verizon strike and the NFL lockout, and the stock suffered. As of late August, the Verizon workers are back on the job and the lockout is over. Time will tell whether the 35% of the float that are short Entropic continue to be correct, but we see a company with dominant market share in an important growth market with significant technology barriers to entry all making for a potential acquisition candidate.
We had an important development in the portfolio on July 22, as Express Scripts (ESRX) announced an agreement to acquire Medco Health Solutions (MHS) for $29 billion. Both companies are pharmacy benefit managers. The merger will double the size of Express Scripts and the combined company could see over $1 billion in cost savings. Express Scripts is a long-time holding and is the largest position in the fund at 6.9% of assets. We expect an antitrust review that could last nine months and a potential closing in mid-2012.
Needham Aggressive Growth Fund
The Needham Aggressive Growth Fund was up 1.8% in the first half, but is down 17.0% year-to date (as of August 29).
Throughout the quarter, we invested strategically and reduced the cash position from 30% at the end of March to 12% at the end of June. We had thought the market’s pause in the second quarter was sufficient to establish good valuations to purchase stocks. Late July and early August proved we were too early. All ten of the largest holdings as of the beginning of the year were still significant holdings at the end of June. Akamai, TTM Technologies (TTMI, maker of flex circuits for smart phones and tablets), and Mercury Computer Systems (MRCY, maker of defense electronics) are top 10 holdings as of June 30 and new additions in the first half.
Like the other funds, Akamai, Entropic, Oclaro and Finisar were among the largest losers in the first half. We believe investor expectations have discounted how Akamai will be able to grow its business in 2012 as more over-the-top video is consumed and the company’s enterprise initiative grows. We remain positive about Entropic’s market and competitive position.
Also like the other funds, the Needham Aggressive Growth Fund benefitted from Honeywell’s acquisition of EMS Technologies. It also saw gains from TomoTherapy, Advanced Analogic Technologies, Vital Images, Iron Mountain and Immersion. Other positive contributors included Super Micro Computer (SMCI), Saba Software (SABA) and IPG Photonics (IPGP).
Needham Small Cap Growth Fund
The Needham Small Cap Growth Fund was up 0.3% in the first half and is down 16.5% year-to-date (as of August 29). The Fund maintained a cash position of 19% at the end of June, down from 23% of net assets at the end of March.
The Small Cap Growth Fund’s top contributor was EMS Technologies followed by one of our consumer discretionary investments, True Religion Apparel (TRLG). True Religion sells its own branded denim and has benefitted from strength of the high-end consumer. Other top contributors were IPG Photonics, Tomotherapy, SourceFire (FIRE), Brocade Communications (BRCD) and Thoratec (THOR).
The Small Cap Growth Fund suffered from its investments in Akamai Technologies and optical components. Its semiconductor capital equipment investments contributed in the first quarter and declined in the second quarter.
We had believed that we need to get through the second quarter earnings period and digest the second half guidance. As we had feared, second half guidance for many of the companies we follow was weak. We believe that many Street estimates are still too high, but think that the market is closer to factoring in lower estimates. We remain concerned that negative second half GDP may not yet be factored into current valuations. We are cautiously looking to put our cash to work. We believe we will find attractive values for new buys in the second half of 2011.
Closing
We remain positive on our strategy of investing in companies that we know well and that we believe are positioned with secular growth drivers. We welcome our new investors and thank all of our investors for their continued support. If you have any questions, thoughts or concerns, please contact us at (800) 625-7071 or send us an email at cretzler@needhamco.com or jbarr@needhamco.com. For information about the funds, please visit our website at www.needhamfunds.com.
Sincerely,
 |  |
| | |
| Chris Retzler | John Barr |
| Portfolio Manager | Portfolio Manager |
| | Semi-Annual Report 2011 |
| | |
| NEEDHAM GROWTH FUND (Unaudited) | TICKER: NEEGX |
| Comparative Performance Statistics as of June 30, 2011 |
| | | | | | | | | | | | | | | | | |
| | | | | | | | | | | | | | Since | | Gross Expense | |
| | | | 6 Months(7) | | 1 Year | | 3 Years(8) | | 5 Years(8) | | 10 Years(8) | | Inception(8)(12) | | Ratio(14) | |
| | Needham Growth Fund(1) | 3.89% | | 36.34% | | 11.07%(9) | | 6.10%(10) | | 5.90%(11) | | 14.80%(13) | | 2.07% | |
| | S&P 500 Index(2)(3) | 6.02% | | 30.69% | | 3.34% | | 2.94% | | 2.72% | | 6.94% | | | |
| | NASDAQ Composite Index(2)(4) | 5.01% | | 32.87% | | 7.63% | | 5.97% | | 3.28% | | 7.08% | | | |
| | S&P 400 MidCap Index(2)(5) | 8.56% | | 39.38% | | 7.82% | | 6.60% | | 7.94% | | 11.61% | | | |
| | Russell 2000 Index(2)(6) | 6.21% | | 37.41% | | 7.77% | | 4.08% | | 6.27% | | 7.81% | | | |
| | Past performance does not guarantee future results. The performance data quoted represents past performance, and current returns may be lower or higher. The investment return and net asset value will fluctuate so that an investor’s shares, when redeemed, may be worth more or less than the original cost. To obtain performance information current to the most recent month-end, please call 1-800-625-7071. The returns shown in the above table and accompanying footnotes are net of expenses. The table above does not reflect the deduction of taxes that a shareholder would have paid on Fund distributions or on the redemption of Fund shares. | |
| | 1. | Investment results calculated after reinvestment of dividends. | | | | | | | | | | | | | | |
| | 2. | It is not possible to invest directly in an index. The performance of the index does not include the deduction of expenses associated with a mutual fund, such as investment management fees. | |
| | 3. | The S&P 500 Index is a broad unmanaged measure of the U.S. stock market. | | | | | |
| | 4. | The NASDAQ Composite Index is a broad-based capitalization-weighted index of all NASDAQ Global Market and Small Cap stocks. | | | | | |
| | 5. | The S&P 400 MidCap Index is a broad unmanaged measure of the U.S. stock market. | | | | | |
| | 6. | The Russell 2000 Index is a broad unmanaged index composed of the smallest 2,000 companies in the Russell 3000 Index. | | | | | |
| | 7. | Not annualized. | | | | | | | | | | | | | | |
| | 8. | Compound annual growth rate (annualized return). Assumes all dividends were reinvested in shares of the Fund. | | | | | |
| | 9. | Cumulative return for the three year period was 37.01%, assuming all dividends were reinvested in shares of the Fund. | | | |
| | 10. | Cumulative return for the five year period was 34.48%, assuming all dividends were reinvested in shares of the Fund. | | | | | | | |
| | 11. | Cumulative return for the ten year period was 77.32%, assuming all dividends were reinvested in shares of the Fund. | | | | | | | |
| | 12. | The inception date of the Fund was 1/1/96. | | | | | | | | | | | | | | |
| | 13. | Cumulative return since inception was 749.41%, assuming all dividends were reinvested in shares of the Fund. | | | | | |
| | 14. | Gross expense ratio is from the Fund’s prospectus dated May 1, 2011. Additional information pertaining to the Fund’s expense ratios as of June 30, 2011 can be found in the financial highlights. Since January 1, 2009, the investment performance reflects contractually agreed upon fee waivers which expire at the close of business on May 1, 2012. Without these fee waivers, the performance would have been lower. Excluding the indirect costs of investing in acquired funds, total net fund operating expenses would be 2.06%. | |
| | | | |
| Top Ten Holdings* | Sector Weightings* |
| (as a % of total investments, as of June 30, 2011) | (as a % of total investments, as of June 30, 2011) |
| | | | % of Total | | | | | Sector | | | Long(1) | | (Short)(1) | | Total(1)(2) | |
| | | Security | | | Investments | | | | Consumer Discretionary | | 6.8% | | (0.6)% | | 6.2% | |
| | 1) Express Scripts, Inc. | ESRX | 7.41% | | | | Energy | | 1.4% | | — | | 1.4% | |
| | 2) Thermo Fisher Scientific, Inc. | TMO | 4.52% | | | | Financials | | 1.5% | | — | | 1.5% | |
| | 3) Entropic Communications, Inc. | ENTR | 4.42% | | | | Health Care | | 24.2% | | — | | 24.2% | |
| | 4) CarMax, Inc. | KMX | 3.38% | | | | Industrials | | 1.6% | | — | | 1.6% | |
| | 5) Seagate Technology PLC | STX | 3.20% | | | | Information Technology | | 59.7% | | (2.5)% | | 57.2% | |
| | 6) Viasat, Inc. | VSAT | 3.04% | | | | Materials | | 1.1% | | (0.2)% | | 0.9% | |
| | 7) Brooks Automation, Inc. | BRKS | 2.95% | | | | Exchange Traded Funds | | — | | (0.5)% | | (0.5)% | |
| | 8) Super Micro Computer, Inc. | SMCI | 2.93% | | | | Cash | | 7.5% | | — | | 7.5% | |
| | 9) Akamai Technologies, Inc. | AKAM | 2.78% | | | | * Current portfolio holdings may not be indicative of future portfolio holdings. | |
| | 10) Electro Scientific Industries, Inc. | ESIO | 2.58% | | | | (1) Percentage of total investments includes all stocks, plus cash minus all short | |
| | Top Ten Holdings = 37.21% of Total Investments† | | | | positions. | |
| | * Current portfolio holdings may not be indicative of future portfolio holdings. | | | | (2) Total represents the difference between the long exposure and the short | |
| | † Percentage of total investments less cash. | | | | | | exposure, which produces the net exposure. | |
| | | | | | | | | | | | | | | |
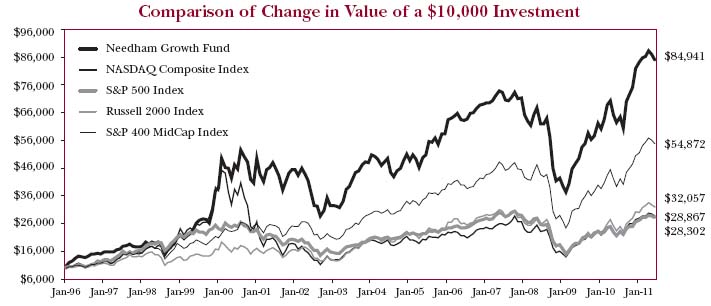
Past performance does not guarantee future results. The performance data quoted represents past performance, and current returns may be lower or higher. The investment return and net asset value will fluctuate so that an investor’s shares, when redeemed, may be worth more or less than the original cost. To obtain performance information current to the most recent month-end, please call 1-800-625-7071. The graph above does not reflect the deduction of taxes that a shareholder would have paid on Fund distributions or on the redemption of Fund shares. Since inception, the Fund’s Adviser has absorbed certain expenses of the Fund, without which returns would have been lower.
The Global Industry Classification Standard (GICS®) was developed by and/or is the exclusive property of MSCI, Inc. and Standard & Poor Financial Services LLC (‘‘S&P’’). GICS is a service mark of MSCI and S&P and has been licensed for use by U.S. Bancorp Fund Services, LLC.
| NEEDHAM AGGRESSIVE GROWTH FUND (Unaudited) | TICKER: NEAGX |
Comparative Performance Statistics as of June 30, 2011
| | | | | | | | | | | | | | | |
| | | | | | | | | | | | Since | | Gross Expense | |
| | | | 6 Months(6) | | 1 Year | | 3 Years(7) | | 5 Years(7) | | Inception(7)(10) | | Ratio(12) | |
| | Needham Aggressive Growth Fund(1) | 1.81% | | 39.80% | | 15.91%(8) | | 11.21%(9) | | 9.88%(11) | | 2.01% | |
| | S&P 500 Index(2)(3) | 6.02% | | 30.69% | | 3.34% | | 2.94% | | 3.56% | | | |
| | NASDAQ Composite Index(2)(4) | 5.01% | | 32.87% | | 7.63% | | 5.97% | | 5.25% | | | |
| | Russell 2000 Index(2)(5) | 6.21% | | 37.41% | | 7.77% | | 4.08% | | 7.39% | | | |
| | Past performance does not guarantee future results. The performance data quoted represents past performance, and current returns may be lower or higher. The investment return and net asset value will fluctuate so that an investor’s shares, when redeemed, may be worth more or less than the original cost. To obtain performance information current to the most recent month-end, please call 1-800-625-7071. The returns shown in the above table and accompanying footnotes are net of expenses. The table above does not reflect the deduction of taxes that a shareholder would have paid on Fund distributions or on the redemption of Fund shares. | |
| | 1. | Investment results calculated after reinvestment of dividends. | | | | | | | | | | | | |
| | 2. | It is not possible to invest directly in an index. The performance of the index does not include the deduction of expenses associated with a mutual fund, such as investment management fees. | |
| | 3. | The S&P 500 Index is a broad unmanaged measure of the U.S. stock market. | | | | | | | | | | | |
| | 4. | The NASDAQ Composite Index is a broad-based capitalization-weighted index of all NASDAQ Global Market and Small Cap stocks. | | | | | |
| | 5. | The Russell 2000 Index is a broad unmanaged index composed of the smallest 2,000 companies in the Russell 3000 Index. | | | | | | | |
| | 6. | Not annualized. | | | | | | | | | | | | |
| | 7. | Compound annual growth rate (annualized return). Assumes all dividends were reinvested in shares of the Fund. | | | | | | | |
| | 8. | Cumulative return for the three year period was 55.72%, assuming all dividends were reinvested in shares of the Fund. | | | | | | | |
| | 9. | Cumulative return for the five year period was 70.12%, assuming all dividends were reinvested in shares of the Fund. | | | | | | | |
| | 10. | The inception date of the Fund was 9/4/2001. | | | | | | | | | |
| | 11. | Cumulative return since inception was 152.25%, assuming all dividends were reinvested in shares of the Fund. | | | | | | | |
| | 12. | Gross expense ratio is from the Fund’s prospectus dated May 1, 2011. Additional information pertaining to the Fund’s expense ratios as of June 30, 2011 can be found in the financial highlights. Since inception, the | |
| | | investment performance reflects contractually agreed upon fee waivers which expire at the close of business on May 1, 2012. Without these fee waivers, the performance would have been lower. Excluding the indirect | |
| | | costs of investing in acquired funds, total net fund operating expenses would be 1.99%. | | | | | |
| | | | | | | | |
| Top Ten Holdings* | Sector Weightings* |
| (as a % of total investments, as of June 30, 2011) | (as a % of total investments, as of June 30, 2011) |
| | | | % of Total | | | | | Sector | | | Long(1) | | (Short)(1) | | Total(1)(2) | |
| | | Security | | | Investments† | | | | Consumer Discretionary | | 1.0% | | (0.7)% | | 0.3% | |
| | 1) Akamai Technologies, Inc. | AKAM | 7.13% | | | | Energy | | 1.2% | | — | | 1.2% | |
| | 2) Entropic Communications, Inc. | ENTR | 6.37% | | | | Financials | | 1.7% | | — | | 1.7% | |
| | 3) Formfactor, Inc. | FORM | 4.03% | | | | Health Care | | 10.6% | | — | | 10.6% | |
| | 4) Sourcefire, Inc. | FIRE | 3.37% | | | | Industrials | | 1.2% | | (0.1)% | | 1.1% | |
| | 5) Emulex Corp. | ELX | 3.30% | | | | Information Technology | | 73.7% | | (1.5)% | | 72.2% | |
| | 6) STEC, Inc. | STEC | 2.95% | | | | Materials | | — | | (0.2)% | | (0.2)% | |
| | 7) TTM Technologies, Inc. | TTMI | 2.93% | | | | Cash | | 13.1% | | — | | 13.1% | |
| | 8) EMS Technologies, Inc. | ELMG | 2.69% | | | | * Current portfolio holdings may not be indicative of future portfolio holdings. | | | |
| | 9) Mercury Computer Systems, Inc. | MRCY | 2.60% | | | | (1) Percentage of total investments includes all stocks, plus cash minus all short | | | |
| | 10) Seagate Technology PLC | STX | 2.42% | | | | positions. | | | | | | | |
| | Top Ten Holdings = 37.79% of Total Investments† | | | | (2) Total represents the difference between the long exposure and the short | | | |
| | * Current portfolio holdings may not be indicative of future portfolio holdings. | | | | exposure, which produces the net exposure. | | | | | | |
| | † Percentage of total investments less cash. | | | | | | | | | | | |
| | | | | | | | | | | | | | | |
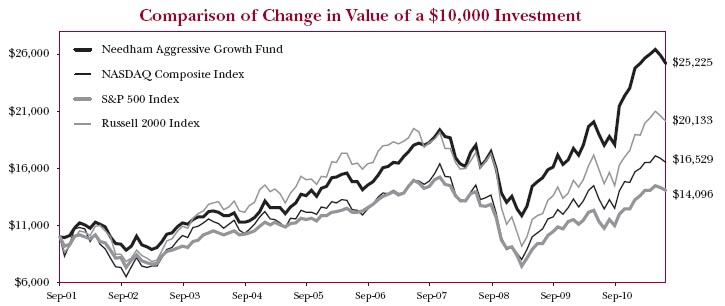
Past performance does not guarantee future results. The performance data quoted represents past performance, and current returns may be lower or higher. The investment return and net asset value will fluctuate so that an investor’s shares, when redeemed, may be worth more or less than the original cost. To obtain performance information current to the most recent month-end, please call 1-800-625-7071. The graph above does not reflect the deduction of taxes that a shareholder would have paid on Fund distributions or on the redemption of Fund shares. Since inception, the Fund’s Adviser has absorbed certain expenses of the Fund, without which returns would have been lower.
The Global Industry Classification Standard (GICS®) was developed by and/or is the exclusive property of MSCI, Inc. and Standard & Poor Financial Services LLC (‘‘S&P’’). GICS is a service mark of MSCI and S&P and has been licensed for use by U.S. Bancorp Fund Services, LLC.
| | Semi-Annual Report 2011 |
| | |
| NEEDHAM SMALL CAP GROWTH FUND (Unaudited) | TICKER: NESGX |
Comparative Performance Statistics as of June 30, 2011
| | | | | | | | | | | | | | |
| | | | | | | | | | | Since | | Gross Expense | |
| | | 6 Months(6) | | 1 Year | | 3 Years(7) | | 5 Years(7) | | Inception(7)(10) | | Ratio(12) | |
| | Needham Small Cap Growth Fund(1) | 0.28% | | 33.06% | | 15.34%(8) | | 8.84%(9) | | 12.79%(11) | | 2.06% | |
| | S&P 500 Index(2)(3) | 6.02% | | 30.69% | | 3.34% | | 2.94% | | 4.21% | | | |
| | NASDAQ Composite Index(2)(4) | 5.01% | | 32.87% | | 7.63% | | 5.97% | | 6.59% | | | |
| | Russell 2000 Index(2)(5) | 6.21% | | 37.41% | | 7.77% | | 4.08% | | 7.21% | | | |
| | Past performance does not guarantee future results. The performance data quoted represents past performance, and current returns may be lower or higher. The investment return and net asset value will fluctuate so that an investor’s shares, when redeemed, may be worth more or less than the original cost. To obtain performance information current to the most recent month-end, please call 1-800-625-7071. The returns shown in the above table and accompanying footnotes are net of expenses. The table above does not reflect the deduction of taxes that a shareholder would have paid on Fund distributions or on the redemption of Fund shares. | |
| | 1. | Investment results calculated after reinvestment of dividends. | | | | | | | | | | | | |
| | 2. | It is not possible to invest directly in an index. The performance of the index does not include the deduction of expenses associated with a mutual fund, such as investment management fees. | |
| | 3. | The S&P 500 Index is a broad unmanaged measure of the U.S. stock market. | | | | | | | | | |
| | 4. | The NASDAQ Composite Index is a broad-based capitalization-weighted index of all NASDAQ Global Market and Small Cap stocks. | | | | | |
| | 5. | The Russell 2000 Index is a broad unmanaged index composed of the smallest 2,000 companies in the Russell 3000 Index. | | | | | |
| | 6. | Not annualized. | | | | | | | | | | | | |
| | 7. | Compound annual growth rate (annualized return). Assumes all dividends were reinvested in shares of the Fund. | | | | | | |
| | 8. | Cumulative return for the three year period was 53.44%, assuming all dividends were reinvested in shares of the Fund. | | | | | |
| | 9. | Cumulative return for the five year period was 52.73%, assuming all dividends were reinvested in shares of the Fund. | | | | | |
| | 10. | The inception date of the Fund was 5/22/02. | | | | | | | | | | | | |
| | 11. | Cumulative return since inception was 199.16%, assuming all dividends were reinvested in shares of the Fund. | | | | | |
| | 12. | Gross expense ratio is from the Fund’s prospectus dated May 1, 2011. Additional information pertaining to the Fund’s expense ratios as of June 30, 2011 can be found in the financial highlights. Since inception, the | |
| | | investment performance reflects contractually agreed upon fee waivers which expire at the close of business on May 1, 2012. Without these fee waivers, the performance would have been lower. Excluding the indirect | |
| | | costs of investing in acquired funds, total net fund operating expenses would be 2.03%. | | | |
| | | | | | |
| Top Ten Holdings* | Sector Weightings* |
| (as a % of total investments, as of June 30, 2011) | (as a % of total investments, as of June 30, 2011) |
| | | | % of Total | | | | | | | | | | | |
| | | Security | | | Investments† | | | | | Sector | | | Long(1) | | (Short)(1) | | Total(1)(2) | |
| | 1) Entropic Communications, Inc. | ENTR | 6.07% | | | | Consumer Discretionary | | 2.7% | | (0.9)% | | 1.8% | |
| | 2) Sourcefire, Inc. | FIRE | 3.99% | | | | Energy | | 1.1% | | — | | 1.1% | |
| | 3) Formfactor, Inc. | FORM | 3.97% | | | | Financials | | 1.4% | | — | | 1.4% | |
| | 4) EMS Technologies, Inc. | ELMG | 3.90% | | | | Health Care | | 17.3% | | — | | 17.3% | |
| | 5) Brocade Communications Systems, Inc. | BRCD | 3.82% | | | | Information Technology | | 61.7% | | (0.6)% | | 61.1% | |
| | 6) Emulex Corp. | ELX | 3.73% | | | | Materials | | — | | (0.2)% | | (0.2)% | |
| | 7) Blue Coat Systems, Inc. | BCSI | 3.62% | | | | Exchange Traded Funds | | — | | (1.8)% | | (1.8)% | |
| | 8) Seagate Technology PLC | STX | 3.57% | | | | Cash | | 19.3% | | — | | 19.3% | |
| | 9) STEC, Inc. | STEC | 2.68% | | | | * Current portfolio holdings may not be indicative of future portfolio holdings. | |
| | 10) NxStage Medical, Inc. | NXTM | 2.46% | | | | (1) Percentage of total investments includes all stocks, plus cash minus all short | |
| | Top Ten Holdings = 37.81% of Total Investments† | | | | | positions. | | | | | | | |
| | * Current portfolio holdings may not be indicative of future portfolio holdings. | | | | (2) Total represents the difference between the long exposure and the short | |
| | † Percentage of total investments less cash. | | | | | | exposure, which produces the net exposure. | | | | | |
| | | | | | | | | | | | | | | |
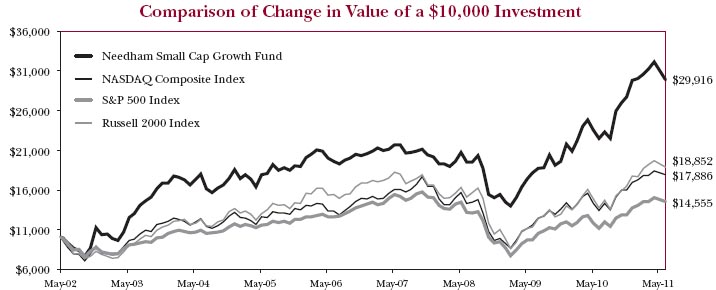
Past performance does not guarantee future results. The performance data quoted represents past performance, and current returns may be lower or higher. The investment return and net asset value will fluctuate so that an investor’s shares, when redeemed, may be worth more or less than the original cost. To obtain performance information current to the most recent month-end, please call 1-800-625-7071. The graph above does not reflect the deduction of taxes that a shareholder would have paid on Fund distributions or on the redemption of Fund shares. Since inception, the Fund’s Adviser has absorbed certain expenses of the Fund, without which returns would have been lower.
The Global Industry Classification Standard (GICS®) was developed by and/or is the exclusive property of MSCI, Inc. and Standard & Poor Financial Services LLC (‘‘S&P’’). GICS is a service mark of MSCI and S&P and has been licensed for use by U.S. Bancorp Fund Services, LLC.
Disclosure of Fund Expenses (Unaudited)
The following expense table is shown so that you can understand the impact of fees on your investment. All mutual funds have operating expenses. As a shareholder of the fund, you incur transaction costs, including redemption fees and exchange fees, and ongoing costs, which include costs for portfolio management, administrative services, and shareholder reports, among others. A fund’s expenses are expressed as a percentage of its average net assets. This figure is known as the expense ratio. The following examples are intended to help you understand the ongoing costs (in dollars) of investing in each fund and to compare these costs with those of other mutual funds. The examples are based on an investment of $1,000 made at the beginning of the period shown and held for the entire period.
The expense example table below illustrates your fund’s cost in two ways:
| ● | Actual Expenses. This section helps you to estimate the actual expenses after fee waivers that you paid over the period. The ‘‘Ending Account Value’’ shown is derived from the fund’s actual return, and ‘‘Expenses Paid During Period’’ shows the dollar amount that would have been paid by an investor who started with $1,000 in the fund. You may use the information here, together with the amount you invested, to estimate the expenses that you paid over the period. To do so, simply divide your account value by $1,000 (for example, an $8,600 account value divided by $1,000 = 8.6), then multiply the result by the number given for your fund under the heading entitled ‘‘Expenses Paid During Period’’. |
| ● | Hypothetical Expenses on a 5% Return. This section is intended to help you compare your fund’s costs with those of other mutual funds. It assumes that the fund had a return of 5% before expenses during the period shown, but that the expense ratio is unchanged. In this case, because the return used is not the fund’s actual return, the results do not apply to your investment. The example is useful in making comparisons because the Securities and Exchange Commission requires all mutual funds to calculate expenses based on a 5% return. You can assess your fund’s cost by comparing this hypothetical example with the hypothetical examples that appear in shareholders reports of other funds. |
Please note that the expenses shown in the table are meant to highlight your ongoing costs only and do not reflect any transactional costs, such as redemption fees or exchange fees. Therefore, the table is useful in comparing ongoing costs only, and will not help you determine the relative total costs of owning different funds. In addition, if these transactional costs were included, your costs would have been higher.
| For the Period January 1, 2011 to June 30, 2011 | | | | |
| Expense Example Table | | | | |
| | | | | |
| | Beginning | Ending | Expenses | Expense |
| | Account | Account | Paid During | Ratio During |
| | Value | Value | Period* | Period* |
| | 1/1/11 | 6/30/11 | 1/1/11 - 6/30/11 | 1/1/11 - 6/30/11 |
| Needham Growth Fund | | | | |
| Actual Expenses | $1,000.00 | $1,038.90 | $9.15 | 1.81% |
| Hypothetical Example for Comparison Purposes | | | | |
| (5% return before expenses) | $1,000.00 | $1,015.82 | $9.05 | 1.81% |
| | | | | |
| Needham Aggressive Growth Fund | | | | |
| Actual Expenses | $1,000.00 | $1,018.10 | $9.01 | 1.80% |
| Hypothetical Example for Comparison Purposes | | | | |
| (5% return before expenses) | $1,000.00 | $1,015.87 | $9.00 | 1.80% |
| | | | | |
| Needham Small Cap Growth Fund | | | | |
| Actual Expenses | $1,000.00 | $1,002.80 | $9.09 | 1.83% |
| Hypothetical Example for Comparison Purposes | | | | |
| (5% return before expenses) | $1,000.00 | $1,015.72 | $9.15 | 1.83% |
* Expenses are equal to the average account value times the Fund’s annualized expense ratio multiplied by the number of days in the most recent fiscal half-year divided by the number of days in the fiscal year. |
| Needham Growth Fund | | | | | |
| Schedule of Investments | | | | | |
| June 30, 2011 (Unaudited) | | | | | |
| | | Shares | | | Value |
| | | | | | |
| Common Stocks (93.1%) | | | | | |
| | | | | | |
| Aerospace & Defense (1.5%) | | | | | |
| Honeywell International, Inc. | | 20,000 | | $ | 1,191,800 |
| Sypris Solutions, Inc.* | | 356,200 | | | 1,467,544 |
| | | | | | 2,659,344 |
| | | | | | |
| Biotechnology (1.7%) | | | | | |
| Gilead Sciences, Inc.* | | 70,000 | | | 2,898,700 |
| | | | | | |
| Capital Markets (1.5%) | | | | | |
| Financial Engines, Inc.* | | 100,000 | | | 2,592,000 |
| | | | | | |
| Chemicals (1.0%) | | | | | |
| Southwall Technologies, Inc.* | | 145,600 | | | 1,831,648 |
| | | | | | |
| Communications Equipment (8.1%) | | | | | |
| Anaren, Inc.* | | 16,025 | | | 340,531 |
| Brocade Communications | | | | | |
| Systems, Inc.* | | 425,000 | | | 2,745,500 |
| Emulex Corp.* | | 325,000 | | | 2,795,000 |
| Finisar Corp.* | | 112,500 | | | 2,028,375 |
| Oclaro, Inc.* | | 210,000 | | | 1,411,200 |
| Viasat, Inc.* | | 115,000 | | | 4,976,050 |
| | | | | | 14,296,656 |
| | | | | | |
| Computers & Peripherals (11.6%) | | | | | |
| Electronics for Imaging, Inc.* | | 86,250 | | | 1,485,225 |
| Immersion Corp.* | | 274,600 | | | 2,342,338 |
| Intevac, Inc.* | | 123,375 | | | 1,259,659 |
| Seagate Technology PLC | | 325,000 | | | 5,251,999 |
| STEC, Inc.* | | 245,815 | | | 4,181,313 |
| Super Micro Computer, Inc.* | | 298,350 | | | 4,800,452 |
| Xyratex Ltd.* | | 102,600 | | | 1,052,676 |
| | | | | | 20,373,662 |
| | | | | | |
| Electronic Equipment, Instruments & Components (9.4%) |
| Corning, Inc. | | 43,750 | | | 794,063 |
| Electro Scientific Industries, Inc.* | | 219,500 | | | 4,236,350 |
| IPG Photonics Corp.* | | 24,179 | | | 1,758,055 |
| Jabil Circuit, Inc. | | 150,000 | | | 3,030,000 |
| Mercury Computer Systems, Inc.* | | 122,400 | | | 2,286,432 |
| Newport Corp.* | | 140,700 | | | 2,556,519 |
| TTM Technologies, Inc.* | | 27,200 | | | 435,744 |
| Vishay Intertechnology, Inc.* | | 100,000 | | | 1,504,000 |
| | | | | | 16,601,163 |
| | | | | | |
| Energy Equipment & Services (0.5%) | | | | | |
| Schlumberger Ltd. | | 10,000 | | | 864,000 |
| | | | | | |
| Health Care Equipment & Supplies (8.7%) | | | |
| Becton Dickinson and Co. | | 46,000 | | | 3,963,820 |
| CONMED Corp.* | | 75,000 | | | 2,136,000 |
| Covidien PLC | | 40,000 | | | 2,129,200 |
| Palomar Medical | | | | | |
| Technologies, Inc.* | | 32,500 | | | 366,600 |
| Varian Medical Systems, Inc.* | | 55,000 | | | 3,851,100 |
| Volcano Corp.* | | 90,000 | | | 2,906,100 |
| | | | | | 15,352,820 |
| | | | | | |
| Health Care Providers & Services (6.9%) | | | | | |
| Express Scripts, Inc.*† | | 225,000 | | | 12,145,500 |
| | | | | | |
| Health Care Technology (1.9%) | | | | | |
| Allscripts Healthcare | | | | | |
| Solutions, Inc.* | | 100,000 | | | 1,942,000 |
| MedAssets, Inc.* | | 105,000 | | | 1,402,800 |
| | | | | | 3,344,800 |
| | | | | | |
| Internet Software & Services (4.2%) | | | | | |
| Akamai Technologies, Inc.* | | 145,000 | | | 4,563,150 |
| QuinStreet, Inc.* | | 75,000 | | | 973,500 |
| Responsys, Inc.* | | 30,000 | | | 531,900 |
| Soundbite Communications, Inc.* | | 195,400 | | | 474,822 |
| SPS Commerce, Inc.* | | 45,667 | | | 812,416 |
| | | | | | 7,355,788 |
| | | | | | |
| IT Services (3.0%) | | | | | |
| InterXion Holding NV* | | 75,000 | | | 1,135,500 |
| SAIC, Inc.* | | 250,000 | | | 4,205,000 |
| | | | | | 5,340,500 |
| | | | | | |
| Life Sciences Tools & Services (4.2%) | | | | | |
| Thermo Fisher Scientific, Inc.*† | | 115,000 | | | 7,404,850 |
| | | | | | |
| Media (0.9%) | | | | | |
| Comcast Corp. | | 60,000 | | | 1,520,400 |
| | | | | | |
| Oil, Gas & Consumable Fuels (0.8%) | | | | | |
| Chesapeake Energy Corp. | | 50,000 | | | 1,484,500 |
| | | | | | |
| Semiconductors & Semiconductor Equipment (18.0%) | | | | | |
| Anadigics, Inc.* | | 200,000 | | | 642,000 |
| Brooks Automation, Inc.* | | 445,000 | | | 4,832,700 |
| Entegris, Inc.* | | 300,000 | | | 3,036,000 |
| Entropic Communications, Inc.* | | 815,000 | | | 7,245,350 |
| Formfactor, Inc.* | | 426,700 | | | 3,865,902 |
| Lattice Semiconductor Corp.* | | 287,000 | | | 1,871,240 |
| MEMC Electronic Materials, Inc.* | | 170,000 | | | 1,450,100 |
| MKS Instruments, Inc. | | 70,000 | | | 1,849,400 |
| Nova Measuring Instruments Ltd.* | | 224,865 | | | 2,275,634 |
| PDF Solutions, Inc.* | | 390,000 | | | 2,324,400 |
| TriQuint Semiconductor, Inc.* | | 50,000 | | | 509,500 |
| Ultra Clean Holdings, Inc.* | | 193,000 | | | 1,752,440 |
| | | | | | 31,654,666 |
See accompanying notes to financial statements.
| Needham Growth Fund | | | | | |
| Schedule of Investments (Continued) | | | | | |
| June 30, 2011 (Unaudited) | | | | | |
| | | Shares | | | Value |
| | | | | | |
| Common Stocks - Continued | | | | | |
| | | | | | |
| Software (3.4%) | | | | | |
| Actuate Corp.* | | 500,000 | | $ | 2,925,000 |
| Sourcefire, Inc.* | | 105,000 | | | 3,120,600 |
| | | | | | 6,045,600 |
| | | | | | |
| Specialty Retail (5.8%) | | | | | |
| American Eagle Outfitters, Inc. | | 165,000 | | | 2,103,750 |
| CarMax, Inc.* | | 167,500 | | | 5,539,225 |
| Dick’s Sporting Goods, Inc.*† | | 65,000 | | | 2,499,250 |
| | | | | | 10,142,225 |
| Total Common Stocks | | | | | |
| (Cost $116,942,665) | | | | | 163,908,822 |
| | | | | | |
| Short-Term Investment (7.3%) | | | | | |
| | | | | | |
| Money Market Fund (7.3%) | | | | | |
| Dreyfus Treasury Prime Cash | | | | | |
| Management, 0.00% (a) | | | | | |
| (Cost $12,749,364) | | 12,749,364 | | $ | 12,749,364 |
| | | | | | |
| Total Investments (100.4%) | | | | | |
| (Cost $129,692,029) | | | | | 176,658,186 |
| Total Securities Sold Short (-3.6%) | | | | | |
| (Proceeds $6,037,980) | | | | | (6,364,533) |
| Other Assets in Excess of | | | | | |
| Liabilities (3.2%) | | | | | 5,727,314 |
| Net Assets (100.0%) | | | | | $176,020,967 |
(a) Rate shown is the seven day yield as of June 30, 2011 and is less than 0.01%.
*Non-income producing security.
†Security position is either entirely or partially held in a segregated account as collateral for securities sold short, aggregating a total market value of $7,093,000.
The Global Industry Classification Standard (GICS®) was developed by and/or is the exclusive property of MSCI, Inc. and Standard & Poor Financial Services LLC (‘‘S&P’’). GICS is a service mark of MSCI and S&P and has been licensed for use by U.S. Bancorp Fund Services, LLC.
See accompanying notes to financial statements.
| Needham Growth Fund | | | | | |
| Schedule of Securities Sold Short | | | | | |
| June 30, 2011 (Unaudited) | | | | | |
| | | Shares | | | Value |
| | | | | | |
| Securities Sold Short (-3.1%) | | | | | |
| | | | | | |
| Chemicals (-0.2%) | | | | | |
| STR Holdings, Inc.* | | 20,000 | | $ | 298,400 |
| | | | | | |
| Communications Equipment (-0.5%) | | | | | |
| Sycamore Networks, Inc. | | 36,875 | | | 820,100 |
| | | | | | |
| Hotels, Restaurants & Leisure (-0.6%) | | | | | |
| Buffalo Wild Wings, Inc.* | | 15,000 | | | 994,650 |
| | | | | | |
| Semiconductors & Semiconductor Equipment (-0.2%) | | | | | |
| Inphi Corp.* | | 15,000 | | | 261,000 |
| QuickLogic Corp.* | | 48,900 | | | 164,793 |
| | | | | | 425,793 |
| | | | | | |
| Software (-1.6%) | | | | | |
| ANSYS, Inc.* | | 37,500 | | | 2,050,125 |
| Blackboard, Inc.* | | 15,000 | | | 650,850 |
| Ebix, Inc.* | | 12,500 | | | 238,125 |
| | | | | | 2,939,100 |
| | | | | | |
| Total Securities Sold Short | | | | | |
| (Proceeds $5,150,575) | | | | | 5,478,043 |
| | | | | | |
| iShares Russell 2000 Growth | | | | | |
| Index Fund | | 5,000 | | | 473,730 |
| iShares Russell 2000 Index Fund | | 5,000 | | | 412,760 |
| | | | | | |
| Total Exchange Traded Funds Sold Short | | | | | |
| (Proceeds $887,405) | | | | | 886,490 |
| | | | | | |
| Total Securities & Exchange | | | | | |
| Traded Funds Sold Short | | | | | |
| (Proceeds $6,037,980) | | | | | 6,364,533 |
| | | | | | |
| Total Securities & Exchange | | | | | |
| Traded Funds Sold Short (-3.6%) | | | | | (6,364,533) |
| Total Investments (100.4%) | | | | | 176,658,186 |
| Other Assets in Excess of | | | | | |
| Liabilities (3.2%) | | | | | 5,727,314 |
| | | | | | |
| Net Assets (100.0%) | | | | $ | 176,020,967 |
*Non-income producing security.
The Global Industry Classification Standard (GICS®) was developed by and/or is the exclusive property of MSCI, Inc. and Standard & Poor Financial Services LLC (‘‘S&P’’). GICS is a service mark of MSCI and S&P and has been licensed for use by U.S. Bancorp Fund Services, LLC.
See accompanying notes to financial statements.
| Needham Aggressive Growth Fund | | | |
| Schedule of Investments | | | | | |
| June 30, 2011 (Unaudited) | | | | | |
| | | Shares | | | Value |
| | | | | | |
| Common Stocks (87.1%) | | | | | |
| | | | | | |
| Aerospace & Defense (0.6%) | | | | | |
| Precision Castparts Corp.† | | 5,500 | | $ | 905,575 |
| | | | | | |
| Biotechnology (1.3%) | | | | | |
| Gilead Sciences, Inc.* | | 50,000 | | | 2,070,500 |
| | | | | | |
| Capital Markets (1.3%) | | | | | |
| Financial Engines, Inc.* | | 80,000 | | | 2,073,600 |
| | | | | | |
| Commercial Services & Supplies (0.6%) | | | | | |
| Iron Mountain, Inc. | | 28,000 | | | 954,520 |
| | | | | | |
| Communications Equipment (12.3%) | | | | | |
| Anaren, Inc.* | | 63,590 | | | 1,351,288 |
| Brocade Communications | | | | | |
| Systems, Inc.* | | 500,000 | | | 3,230,000 |
| EMS Technologies, Inc.* | | 111,800 | | | 3,686,046 |
| Emulex Corp.* | | 525,000 | | | 4,514,999 |
| Finisar Corp.* | | 150,000 | | | 2,704,500 |
| Network Equipment | | | | | |
| Technologies, Inc.* | | 377,750 | | | 831,050 |
| Oclaro, Inc.* | | 75,000 | | | 504,000 |
| Powerwave Technologies, Inc.* | | 550,000 | | | 1,622,500 |
| Viasat, Inc.* | | 20,000 | | | 865,400 |
| | | | | | 19,309,783 |
| | | | | | |
| Computers & Peripherals (10.1%) | | | | | |
| Apple, Inc.*† | | 5,250 | | | 1,762,268 |
| Electronics for Imaging, Inc.* | | 70,000 | | | 1,205,400 |
| Fusion-io, Inc.* | | 2,188 | | | 65,837 |
| Immersion Corp.* | | 94,900 | | | 809,497 |
| Intevac, Inc.* | | 78,689 | | | 803,415 |
| Seagate Technology PLC | | 205,000 | | | 3,312,800 |
| STEC, Inc.* | | 237,150 | | | 4,033,921 |
| Super Micro Computer, Inc.* | | 160,000 | | | 2,574,400 |
| Xyratex Ltd.* | | 128,800 | | | 1,321,488 |
| | | | | | 15,889,026 |
| | | | | | |
| Electronic Equipment, Instruments & Components (10.2%) | | | | | |
| Corning, Inc. | | 65,000 | | | 1,179,750 |
| Electro Scientific Industries, Inc.* | | 50,000 | | | 965,000 |
| IPG Photonics Corp.* | | 10,000 | | | 727,100 |
| Jabil Circuit, Inc. | | 122,550 | | | 2,475,510 |
| LeCroy Corp.* | | 30,000 | | | 361,200 |
| Mercury Computer Systems, Inc.* | | 190,500 | | | 3,558,540 |
| Multi-Fineline Electronix, Inc.* | | 35,000 | | | 756,350 |
| Newport Corp.* | | 70,000 | | | 1,271,900 |
| Trimble Navigation Ltd.* | | 17,500 | | | 693,700 |
| TTM Technologies, Inc.* | | 250,000 | | | 4,005,000 |
| | | | | | 15,994,050 |
| | | | | | |
| Health Care Equipment & Supplies (4.8%) | | | | | |
| Becton Dickinson and Co. | | 8,000 | | | 689,360 |
| DexCom, Inc.* | | 40,000 | | | 579,600 |
| LeMaitre Vascular, Inc. | | 40,000 | | | 282,800 |
| Natus Medical, Inc.* | | 35,900 | | | 543,885 |
| NxStage Medical, Inc.* | | 65,000 | | | 1,353,300 |
| Solta Medical, Inc.*† | | 350,000 | | | 966,000 |
| Varian Medical Systems, Inc.* | | 16,000 | | | 1,120,320 |
| Volcano Corp.* | | 60,000 | | | 1,937,400 |
| | | | | | 7,472,665 |
| | | | | | |
| Health Care Providers & Services (1.2%) | | | | | |
| Alliance HealthCare Services, Inc.* | | 75,000 | | | 285,000 |
| Express Scripts, Inc.* | | 18,000 | | | 971,640 |
| Omnicare, Inc. | | 17,500 | | | 558,075 |
| | | | | | 1,814,715 |
| | | | | | |
| Health Care Technology (2.2%) | | | | | |
| Allscripts Healthcare | | | | | |
| Solutions, Inc.* | | 60,000 | | | 1,165,200 |
| athenahealth, Inc.* | | 10,000 | | | 411,000 |
| MedAssets, Inc.* | | 110,000 | | | 1,469,600 |
| Omnicell, Inc.* | | 30,000 | | | 467,700 |
| | | | | | 3,513,500 |
| | | | | | |
| Insurance (0.3%) | | | | | |
| Crawford & Co. | | 95,000 | | | 479,750 |
| | | | | | |
| Internet Software & Services (10.0%) | | | | | |
| Akamai Technologies, Inc.* | | 310,000 | | | 9,755,699 |
| Cornerstone OnDemand, Inc.* | | 10,610 | | | 187,267 |
| Equinix, Inc.* | | 8,500 | | | 858,670 |
| QuinStreet, Inc.* | | 30,000 | | | 389,400 |
| Responsys, Inc.* | | 30,000 | | | 531,900 |
| Saba Software, Inc.* | | 305,000 | | | 2,754,150 |
| Soundbite Communications, Inc.* | | 156,050 | | | 379,202 |
| SPS Commerce, Inc.* | | 47,350 | | | 842,357 |
| | | | | | 15,698,645 |
| | | | | | |
| IT Services (0.7%) | | | | | |
| InterXion Holding NV* | | 75,000 | | | 1,135,500 |
| | | | | | |
| Oil, Gas & Consumable Fuels (1.2%) | | | | | |
| Suncor Energy, Inc. | | 47,500 | | | 1,857,250 |
| | | | | | |
| Pharmaceuticals (0.9%) | | | | | |
| ISTA Pharmaceuticals, Inc.* | | 185,000 | | | 1,414,325 |
See accompanying notes to financial statements.
| Needham Aggressive Growth Fund | | | |
| Schedule of Investments (Continued) | | | |
| June 30, 2011 (Unaudited) | | | | | |
| | | Shares | | | Value |
| | | | | | |
| Common Stocks - Continued | | | | | |
| | | | | | |
| Semiconductors & Semiconductor Equipment (24.0%) | | | | | |
| Advanced Analogic | | | | | |
| Technologies, Inc.* | | 125,000 | | $ | 756,875 |
| Anadigics, Inc.* | | 245,000 | | | 786,450 |
| ATMI, Inc.* | | 58,200 | | | 1,189,026 |
| Brooks Automation, Inc.* | | 215,000 | | | 2,334,900 |
| Entegris, Inc.* | | 200,000 | | | 2,024,000 |
| Entropic Communications, Inc.* | | 980,000 | | | 8,712,199 |
| Fairchild Semiconductor | | | | | |
| International, Inc.* | | 10,000 | | | 167,100 |
| FEI Co.* | | 32,000 | | | 1,222,080 |
| Formfactor, Inc.* | | 609,100 | | | 5,518,446 |
| Lattice Semiconductor Corp.* | | 182,500 | | | 1,189,900 |
| MEMC Electronic Materials, Inc.* | | 170,000 | | | 1,450,100 |
| MIPS Technologies, Inc.* | | 245,000 | | | 1,692,950 |
| MKS Instruments, Inc. | | 29,100 | | | 768,822 |
| Nanometrics, Inc.* | | 35,000 | | | 664,650 |
| Nova Measuring Instruments Ltd.* | | 130,000 | | | 1,315,600 |
| PDF Solutions, Inc.* | | 555,000 | | | 3,307,800 |
| RF Micro Devices, Inc.* | | 375,000 | | | 2,295,000 |
| TriQuint Semiconductor, Inc.*† | | 55,000 | | | 560,450 |
| Ultra Clean Holdings, Inc.* | | 197,100 | | | 1,789,668 |
| | | | | | 37,746,016 |
| | | | | | |
| | | Shares | | | Value |
| | | | | | |
| Common Stocks - Continued | | | | | |
| | | | | | |
| Software (4.5%) | | | | | |
| Actuate Corp.*† | | 275,000 | | $ | 1,608,750 |
| Bottomline Technologies, Inc.* | | 32,280 | | | 797,639 |
| Sourcefire, Inc.* | | 155,000 | | | 4,606,600 |
| | | | | | 7,012,989 |
| | | | | | |
| Specialty Retail (0.9%) | | | | | |
| CarMax, Inc.* | | 22,500 | | | 744,075 |
| Dick’s Sporting Goods, Inc.*† | | 18,000 | | | 692,100 |
| | | | | | 1,436,175 |
| Total Common Stocks | | | | | |
| (Cost $119,325,926) | | | | | 136,778,584 |
| | | | | | |
| Short-Term Investment (12.7%) | | | | | |
| | | | | | |
| Money Market Fund (12.7%) | | | | | |
| Dreyfus Treasury Prime Cash | | | | | |
| Management, 0.00% (a) | | | | | |
| (Cost $19,966,195) | | 19,966,195 | | $ | 19,966,195 |
| | | | | | |
| Total Investments (99.8%) | | | | | |
| (Cost $139,292,121) | | | | | 156,744,779 |
| Total Securities Sold Short (-2.4%) | | | | | |
| (Proceeds $3,971,215) | | | | | (3,752,853) |
| Other Assets in | | | | | |
| Excess of Liabilities (2.6%) | | | | | 4,112,196 |
| | | | | | |
| Net Assets (100.0%) | | | | $ | 157,104,122 |
(a) Rate shown is the seven day yield as of June 30, 2011 and is less than 0.01%.
*Non-income producing security.
†Security position is either entirely or partially held in a segregated account as collateral for securities sold short, aggregating a total market value of $3,827,145.
The Global Industry Classification Standard (GICS®) was developed by and/or is the exclusive property of MSCI, Inc. and Standard & Poor Financial Services LLC (‘‘S&P’’). GICS is a service mark of MSCI and S&P and has been licensed for use by U.S. Bancorp Fund Services, LLC.
See accompanying notes to financial statements.
| Needham Aggressive Growth Fund | | | |
| Schedule of Securities Sold Short | | | | | |
| June 30, 2011 (Unaudited) | | | | | |
| | | Shares | | | Value |
| | | | | | |
| Securities Sold Short (-2.4%) | | | | | |
| | | | | | |
| Airlines (-0.1%) | | | | | |
| Allegiant Travel Co.* | | 3,500 | | $ | 173,250 |
| | | | | | |
| Chemicals (-0.2%) | | | | | |
| STR Holdings, Inc.* | | 20,000 | | | 298,400 |
| | | | | | |
| Communications Equipment (-0.5%) | | | | | |
| Sycamore Networks, Inc. | | 34,260 | | | 761,942 |
| | | | | | |
| Hotels, Restaurants & Leisure (-0.6%) | | | | | |
| Buffalo Wild Wings, Inc.* | | 15,000 | | | 994,650 |
| | | | | | |
| Semiconductors & Semiconductor Equipment (-0.4%) | | |
| Inphi Corp.* | | 15,000 | | | 261,000 |
| QuickLogic Corp.* | | 102,800 | | | 346,436 |
| | | | | | 607,436 |
| | | | | | |
| Software (-0.6%) | | | | | |
| ANSYS, Inc.* | | 2,500 | | | 136,675 |
| Blackboard, Inc.* | | 12,500 | | | 542,375 |
| Ebix, Inc.* | | 12,500 | | | 238,125 |
| | | | | | 917,175 |
| | | | | | |
| Total Securities Sold Short | | | | | |
| (Proceeds $3,971,215) | | | | | 3,752,853 |
| | | | | | |
| Total Securities Sold Short (-2.4%) | | | | | (3,752,853) |
| | | | | | |
| Total Investments (99.8%) | | | | | 156,744,779 |
| | | | | | |
| Other Assets in | | | | | |
| Excess of Liabilities (2.6%) | | | | | 4,112,196 |
| | | | | | |
| Net Assets (100.0%) | | | | $ | 157,104,122 |
| * | Non-income producing security. |
The Global Industry Classification Standard (GICS®) was developed by and/or is the exclusive property of MSCI, Inc. and Standard & Poor Financial Services LLC (‘‘S&P’’). GICS is a service mark of MSCI and S&P and has been licensed for use by U.S. Bancorp Fund Services, LLC.
See accompanying notes to financial statements.
| Needham Small Cap Growth Fund | | | |
| Schedule of Investments | | | | |
| June 30, 2011 (Unaudited) | | | | |
| | Shares | | | Value |
| Common Stocks (82.1%) | | | | |
| | | | | |
| Capital Markets (1.3%) | | | | |
| Financial Engines, Inc.* | 80,000 | | $ | 2,073,600 |
| | | | | |
| Communications Equipment (16.7%) | | | | |
| Anaren, Inc.* | 78,585 | | | 1,669,931 |
| Blue Coat Systems, Inc.* | 210,000 | | | 4,590,600 |
| Brocade Communications | | | | |
| Systems, Inc.*† | 750,000 | | | 4,845,000 |
| EMS Technologies, Inc.* | 150,000 | | | 4,945,501 |
| Emulex Corp.* | 550,000 | | | 4,730,000 |
| Infinera Corp.* | 215,000 | | | 1,485,650 |
| Network Equipment | | | | |
| Technologies, Inc.* | 233,421 | | | 513,526 |
| Oclaro, Inc.* | 300,000 | | | 2,016,000 |
| Powerwave Technologies, Inc.* | 350,000 | | | 1,032,500 |
| | | | | 25,828,708 |
| | | | | |
| Computers & Peripherals (9.0%) | | | | |
| Immersion Corp.* | 60,000 | | | 511,800 |
| Intevac, Inc.* | 68,690 | | | 701,325 |
| Seagate Technology PLC† | 280,000 | | | 4,524,799 |
| STEC, Inc.* | 200,000 | | | 3,402,000 |
| Super Micro Computer, Inc.* | 173,350 | | | 2,789,202 |
| Xyratex Ltd.* | 188,600 | | | 1,935,036 |
| | | | | 13,864,162 |
| | | | | |
| Electronic Equipment, Instruments & Components (4.7%) |
| Electro Scientific Industries, Inc.* | 55,286 | | | 1,067,020 |
| IPG Photonics Corp.* | 10,000 | | | 727,100 |
| Mercury Computer Systems, Inc.* | 106,111 | | | 1,982,153 |
| Newport Corp.* | 59,300 | | | 1,077,481 |
| TTM Technologies, Inc.* | 150,000 | | | 2,403,000 |
| | | | | 7,256,754 |
| | | | | |
| Energy Equipment & Services (0.4%) | | | | |
| CE Franklin Ltd.* | 59,300 | | | 569,873 |
| | | | | |
| Health Care Equipment & Supplies (7.0%) | | | |
| CONMED Corp.* | 30,000 | | | 854,400 |
| DexCom, Inc.* | 150,000 | | | 2,173,500 |
| NxStage Medical, Inc.* | 150,000 | | | 3,123,000 |
| Palomar Medical | | | | |
| Technologies, Inc.* | 35,521 | | | 400,677 |
| Solta Medical, Inc.* | 400,000 | | | 1,104,000 |
| Thoratec Corp.* | 39,300 | | | 1,289,826 |
| Volcano Corp.* | 60,000 | | | 1,937,400 |
| | | | | 10,882,803 |
| | | | | |
| Health Care Providers & Services (3.6%) | | | | |
| Alliance HealthCare Services, Inc.* | 210,000 | | | 798,000 |
| Bio-Reference Labs, Inc.* | 45,000 | | | 940,500 |
| Catalyst Health Solutions, Inc.* | 30,000 | | | 1,674,600 |
| Gentiva Health Services, Inc.* | 50,000 | | | 1,041,500 |
| Omnicare, Inc. | 35,000 | | | 1,116,150 |
| | | | | 5,570,750 |
| | | | | |
| Health Care Technology (6.2%) | | | | |
| Allscripts Healthcare | | | | |
| Solutions, Inc.* | 150,000 | | | 2,913,000 |
| athenahealth, Inc.* | 25,000 | | | 1,027,500 |
| MedAssets, Inc.* | 190,000 | | | 2,538,400 |
| Omnicell, Inc.* | 200,000 | | | 3,118,000 |
| | | | | 9,596,900 |
| | | | | |
| Internet Software & Services (2.3%) | | | | |
| QuinStreet, Inc.* | 80,000 | | | 1,038,400 |
| Responsys, Inc.* | 30,000 | | | 531,900 |
| Saba Software, Inc.* | 100,000 | | | 903,000 |
| Soundbite Communications, Inc.* | 121,463 | | | 295,155 |
| SPS Commerce, Inc.* | 45,000 | | | 800,550 |
| | | | | 3,569,005 |
| | | | | |
| IT Services (2.7%) | | | | |
| Euronet Worldwide, Inc.* | 120,300 | | | 1,853,823 |
| InterXion Holding NV* | 150,000 | | | 2,271,000 |
| | | | | 4,124,823 |
| | | | | |
| Oil, Gas & Consumable Fuels (0.7%) | | | | |
| GMX Resources, Inc.* | 250,000 | | | 1,112,500 |
| | | | | |
| Semiconductors & Semiconductor Equipment (20.5%) |
| Anadigics, Inc.* | 35,000 | | | 112,350 |
| ATMI, Inc.* | 40,000 | | | 817,200 |
| Brooks Automation, Inc.* | 200,000 | | | 2,172,000 |
| Entegris, Inc.* | 140,000 | | | 1,416,800 |
| Entropic Communications, Inc.*† | 865,000 | | | 7,689,851 |
| FEI Co.* | 34,300 | | | 1,309,917 |
| Formfactor, Inc.* | 555,900 | | | 5,036,454 |
| Intersil Corp. | 90,000 | | | 1,156,500 |
| Lattice Semiconductor Corp.* | 187,000 | | | 1,219,240 |
| Mattson Technology, Inc.* | 56,550 | | | 107,445 |
| MaxLinear, Inc.* | 300,000 | | | 2,598,000 |
| MEMC Electronic Materials, Inc.* | 350,000 | | | 2,985,500 |
| Microsemi Corp.* | 20,000 | | | 410,000 |
See accompanying notes to financial statements.
| Needham Small Cap Growth Fund | | | | |
| Schedule of Investments (Continued) | | | | |
| June 30, 2011 (Unaudited) | | | | | |
| | Shares | | | | Value |
| Common Stocks - Continued | | | | | |
| MKS Instruments, Inc. | 10,000 | | | $ | 264,200 |
| Nova Measuring Instruments Ltd.* | 89,635 | | | | 907,106 |
| PDF Solutions, Inc.* | 215,000 | | | | 1,281,400 |
| Rudolph Technologies, Inc.* | 25,000 | | | | 267,750 |
| Ultra Clean Holdings, Inc.* | 209,475 | | | | 1,902,033 |
| | | | | | 31,653,746 |
| | | | | | |
| Software (4.3%) | | | | | |
| Actuate Corp.* | 170,000 | | | | 994,500 |
| Callidus Software, Inc.* | 100,000 | | | | 585,000 |
| Sourcefire, Inc.* | 170,000 | | | | 5,052,400 |
| | | | | | 6,631,900 |
| | | | | | |
| Specialty Retail (1.9%) | | | | | |
| American Eagle Outfitters, Inc. | 225,000 | | | | 2,868,750 |
| | | | | | |
| Textiles, Apparel & Luxury Goods (0.8%) | | | | |
| True Religion Apparel, Inc.* | 40,000 | | | | 1,163,200 |
| | | | | | |
| Total Common Stocks | | | | | |
| (Cost $115,677,069) | | | | | 126,767,474 |
| | | | | | |
| Short-Term Investment (18.8%) | | | | | |
| | | | | | |
| Money Market Fund (18.8%) | | | | | |
| Dreyfus Treasury Prime Cash | | | | | |
| Management, 0.00% (a) | | | | | |
| (Cost $29,088,278) | 29,088,278 | | | $ | 29,088,278 |
| | | | | | |
| Total Investments (100.9%) | | | | | |
| (Cost $144,765,347) | | | | | 155,855,752 |
| Total Securities Sold Short (-3.4%) | | | | | |
| (Proceeds $5,156,964) | | | | | (5,262,644) |
| Other Assets in Excess | | | | | |
| of Liabilities (2.5%) | | | | | 3,897,779 |
| | | | | | |
| Net Assets (100.0%) | | | | $ | 154,490,887 |
(a) Rate shown is the seven day yield as of June 30, 2011 and is less than 0.01%.
*Non-income producing security.
†Security position is either entirely or partially held in a segregated account as collateral for securities sold short, aggregating a total market value of $6,181,400.
The Global Industry Classification Standard (GICS®) was developed by and/or is the exclusive property of MSCI, Inc. and Standard & Poor Financial Services LLC (‘‘S&P’’). GICS is a service mark of MSCI and S&P and has been licensed for use by U.S. Bancorp Fund Services, LLC.
See accompanying notes to financial statements.
| Needham Small Cap Growth Fund | | | |
| Schedule of Securities Sold Short | | | | |
| June 30, 2011 (Unaudited) | | | | |
| | Shares | | | Value |
| | | | | |
| Securities Sold Short (-1.7%) | | | | |
| | | | | |
| Chemicals (-0.2%) | | | | |
| STR Holdings, Inc.* | 20,000 | | $ | |
| | | | | |
| Communications Equipment (-0.4%) | | | | |
| Sycamore Networks, Inc. | 32,265 | | | 717,574 |
| | | | | |
| Hotels, Restaurants & Leisure (-0.9%) | | | | |
| Buffalo Wild Wings, Inc.* | 20,000 | | | 1,326,200 |
| | | | | |
| Semiconductors & Semiconductor Equipment (-0.2%) | | | | |
| Inphi Corp.* | 15,000 | | | 261,000 |
| | | | | |
| Total Securities Sold Short | | | | |
| (Proceeds $2,494,750) | | | | 2,603,174 |
| | | | | |
| Exchange Traded Funds Sold | | | | |
| Short (-1.7%) | | | | |
| iShares Russell 2000 Growth | | | | |
| Index Fund | 15,000 | | | 1,421,190 |
| iShares Russell 2000 Index Fund | 15,000 | | | 1,238,280 |
| | | | | |
| Total Exchange Traded Funds Sold Short | | | | |
| (Proceeds $2,662,214) | | | | 2,659,470 |
| | | | | |
| Total Securities & Exchange | | | | |
| Traded Funds Sold Short | | | | |
| (Proceeds $5,156,964) | | | | 5,262,644 |
| | | | | |
| Total Securities & Exchange | | | | |
| Traded Funds Sold Short (-3.4%) | | | | (5,262,644) |
| | | | | |
| Total Investments (100.9%) | | | | 155,855,752 |
| | | | | |
| Other Assets in | | | | |
| Excess of Liabilities (2.5%) | | | | 3,897,779 |
| | | | | |
| Net Assets (100.0%) | | | $ | 154,490,887 |
| * | Non-income producing security. |
The Global Industry Classification Standard (GICS®) was developed by and/or is the exclusive property of MSCI, Inc. and Standard & Poor Financial Services LLC (‘‘S&P’’). GICS is a service mark of MSCI and S&P and has been licensed for use by U.S. Bancorp Fund Services, LLC.
See accompanying notes to financial statements.
| Statements of Assets and Liabilities | | | | |
| June 30, 2011 (Unaudited) | | | | |
| | | | | |
| | | | Needham | Needham |
| | | Needham | Aggressive | Small Cap |
| | | Growth Fund | Growth Fund | Growth Fund |
| | | | | |
| Assets | | | | |
| Investments, at Value | | | | |
| (Cost $129,692,029, $139,292,121 and $144,765,347, respectively) | | $176,658,186 | $156,744,779 | $155,855,752 |
| Cash | | 200,441 | — | — |
| Receivables: | | | | |
| Deposit with Broker for Securities Sold Short | | 5,150,626 | 3,950,931 | 2,560,025 |
| Dividends and Interest | | 6,875 | 7,166 | — |
| Fund Shares Sold | | 16,522 | 196,757 | 349,413 |
| Investment Securities Sold | | 1,495,306 | 953,509 | 3,786,777 |
| Prepaid Expenses | | 28,116 | 20,185 | 32,249 |
| Total Assets | | 183,556,072 | 161,873,327 | 162,584,216 |
| | | | | |
| Liabilities | | | | |
| Securities Sold Short, at Value | | | | |
| (Proceeds $6,037,980, $3,971,215 and $5,156,964, respectively) | | 6,364,533 | 3,752,853 | 5,262,644 |
| Payables: | | | | |
| Investment Securities Purchased | | 794,445 | 553,437 | 2,135,609 |
| Fund Shares Redeemed | | 80,926 | 190,602 | 431,557 |
| Due to Adviser | | 176,846 | 161,196 | 156,572 |
| Distribution Fees | | 35,458 | 32,321 | 31,393 |
| Administration and Accounting Fees | | 28,568 | 25,253 | 24,859 |
| Transfer Agent Fees | | 11,428 | 12,939 | 10,082 |
| Directors’ Fees | | — | 118 | 142 |
| Accrued Expenses and Other Liabilities | | 42,901 | 40,486 | 40,471 |
| Total Liabilities | | 7,535,105 | 4,769,205 | 8,093,329 |
| | | | | |
| Net Assets | | $176,020,967 | $157,104,122 | $154,490,887 |
| Shares Issued and Outstanding $0.001 Par Value | | | | |
| (Authorized 800,000,000, 100,000,000 and 100,000,000, respectively) | | 4,332,346 | 9,004,916 | 10,839,194 |
Net Asset Value, Offering and Redemption Price Per Share(a) | | | $ 17.45 | $ 14.25 |
| | | | | |
| | | | | |
| Components of Net Assets | | | | |
| Paid-in Capital | | 118,591,279 | 136,910,478 | 141,843,242 |
| Accumulated Net Investment Loss | | (1,424,502) | (1,295,931) | (1,264,259) |
| Accumulated Net Realized Gain (Loss) from Investments, Securities | | | | |
| Sold Short and Foreign Currency Transactions | | 12,214,586 | 3,818,555 | 2,927,179 |
| Net Unrealized Appreciation on Investment Securities and Securities | | | | |
| Sold Short | | 46,639,604 | 17,671,020 | 10,984,725 |
| Total Net Assets | | $176,020,967 | $157,104,122 | $154,490,887 |
| | | | | |
| (a) Subject to certain exceptions, a 2% redemption fee is imposed upon shares redeemed within 60 days of their purchase. See Note 2 of the notes to financial statements. |
See accompanying notes to financial statements.
| Statements of Operations | | | | |
| | | | | |
| For the Six Months Ended June 30, 2011 (Unaudited) | | | | |
| | | | | |
| | | | Needham | Needham |
| | | Needham | Aggressive | Small Cap |
| | | Growth Fund | Growth Fund | Growth Fund |
| | | | | |
| Investment Income | | | | |
| Dividends | | $ 218,138 | $ 88,348 | $ 98,450 |
| Interest | | 79 | 151 | 123 |
| Less: Foreign Taxes Withheld | | — | (426) | — |
| Total Investment Income | | 218,217 | 88,073 | 98,573 |
| | | | | |
| Expenses | | | | |
| Investment Advisory Fees | | 1,134,663 | 959,711 | 933,021 |
| Distribution Fees | | 226,933 | 191,942 | 186,604 |
| Administration and Accounting Fees | | 82,624 | 73,156 | 78,921 |
| Audit Fees | | 31,944 | 13,619 | 12,299 |
| Chief Compliance Officer Fees | | 6,999 | 5,883 | 5,714 |
| Custodian Fees | | 6,722 | 6,841 | 7,252 |
| Directors’ Fees | | 4,556 | 8,905 | 8,667 |
| Filing Fees | | 21,786 | 18,536 | 23,609 |
Interest Expense(1) | | 31,952 | 12,570 | 20,026 |
| Legal Fees | | 17,400 | 17,972 | 18,787 |
| Printing Fees | | 12,261 | 22,990 | 28,759 |
| Transfer Agent Fees | | 34,169 | 42,133 | 31,919 |
| Other Expenses | | 30,710 | 9,746 | 6,983 |
| Total Expenses | | 1,642,719 | 1,384,004 | 1,362,561 |
| | | | | |
| Fees Waived by Investment Adviser | | — | — | — |
| | | | | |
| Net Expenses | | 1,642,719 | 1,384,004 | 1,362,561 |
| | | | | |
| Net Investment Loss | | (1,424,502) | (1,295,931) | (1,263,988) |
| | | | | |
| Net Realized/Unrealized Gain (Loss) from Investments, Securities Sold Short, | | | | |
| Foreign Currency Transactions and Written Options | | | | |
| Net Realized Gain from Investments | | 9,962,781 | 3,613,134 | 2,748,729 |
| Net Realized Gain (Loss) from Securities Sold Short | | (2,529,580) | 64,227 | (477,543) |
| Net Realized (Loss) from Foreign Currency Transactions | | — | (44) | — |
| Net Realized Gain from Currency | | — | 3 | — |
| Change in Unrealized Appreciation/Depreciation on | | | | |
| Investments and Securities Sold Short | | (212,274) | (1,913,345) | (2,062,571) |
| Net Realized/Unrealized Gain (Loss) from Investments, Securities Sold Short, | | | | |
| Foreign Currency Transactions and Currency | | 7,220,927 | 1,763,975 | 208,615 |
| Change in Net Assets Resulting from Operations | | $ 5,796,425 | $ 468,044 | $(1,055,373) |
| | | | | |
(1) Expense related to securities sold short. | | | | |
See accompanying notes to financial statements.
| Statements of Changes in Net Assets | | | | | | | | | | |
| | | | | | | | | | | | | |
| | | | | | | Needham Aggressive | | Needham Small Cap |
| | | Needham Growth Fund | | Growth Fund | | Growth Fund |
| | | Six Months | | Year Ended | | Six Months | | Year Ended | | Six Months | | Year Ended |
| | | Ended June 30, | | December 31, | | Ended June 30, | | December 31, | | Ended June 30, | | December 31, |
| | | 2011 | | 2010 | | 2011 | | 2010 | | 2011 | | 2010 |
| | | (Unaudited) | | | | (Unaudited) | | | | (Unaudited) | | |
| Change in Net Assets | | | | | | | | | | | | |
| Operations: | | | | | | | | | | | | |
| Net Investment Loss | $ | (1,424,502) | $ | (2,435,448) | $ | (1,295,931) | $ | (699,519) | $ | (1,263,988) | $ | (573,899) |
| Net Realized Gain (Loss) from | | | | | | | | | | | | |
| Investments, Securities Sold | | | | | | | | | | | | |
| Short and Foreign Currency | | | | | | | | | | | | |
| Transactions | | 7,433,201 | | 13,553,779 | | 3,677,320 | | 1,263,483 | | 2,271,186 | | 3,102,850 |
| Change in Unrealized | | | | | | | | | | | | |
| Appreciation/Depreciation | | | | | | | | | | | | |
| on Investments and Securities | | | | | | | | | | | | |
| Sold Short | | (212,274) | | 26,230,306 | | (1,913,345) | | 14,970,923 | | (2,062,571) | | 10,097,638 |
| Change in Net Assets Resulting | | | | | | | | | | | | |
| from Operations | | 5,796,425 | | 37,348,637 | | 468,044 | | 15,534,887 | | (1,055,373) | | 12,626,589 |
| | | | | | | | | | | | | |
| Distributions to | | | | | | | | | | | | |
| Shareholders from: | | | | | | | | | | | | |
| Capital Gains | | — | | — | | — | | (434,554) | | — | | (1,957,692) |
| Return of Capital | | — | | — | | — | | — | | — | | — |
| Total Distributions to | | | | | | | | | | | | |
| Shareholders | | — | | — | | — | | (434,554) | | — | | (1,957,692) |
| | | | | | | | | | | | | |
| Capital Transactions: | | | | | | | | | | | | |
| Shares Issued | | 42,805,449 | | 30,369,946 | | 99,023,416 | | 76,055,443 | | 94,718,695 | | 82,898,156 |
| Shares Issued in Reinvestment | | | | | | | | | | | | |
| of Distribution | | — | | — | | — | | 429,244 | | — | | 1,888,546 |
| Shares Redeemed | | (32,409,505) | | (27,099,636) | | (48,990,495) | | (7,863,052) | | (38,133,863) | | (7,862,485) |
| Redemption Fees | | 23,162 | | 11,664 | | 51,799 | | 10,430 | | 50,767 | | 14,369 |
| Change in Net Assets from | | | | | | | | | | | | |
| Capital Transactions | | 10,419,106 | | 3,281,974 | | 50,084,720 | | 68,632,065 | | 56,635,599 | | 76,938,586 |
| | | | | | | | | | | | | |
| Change in Net Assets | | 16,215,531 | | 40,630,611 | | 50,552,764 | | 83,732,398 | | 55,580,226 | | 87,607,483 |
| | | | | | | | | | | | | |
| Net Assets | | | | | | | | | | | | |
| Beginning of Period | | 159,805,436 | | 119,174,825 | | 106,551,358 | | 22,818,960 | | 98,910,661 | | 11,303,178 |
| End of Period | $ | 176,020,967 | | $159,805,436 | $ | 157,104,122 | $ | 106,551,358 | $ | 154,490,887 | $ | 98,910,661 |
| Accumulated Net | | | | | | | | | | | | |
| Investment Loss | $ | (1,424,502) | $ | — | $ | (1,295,931) | $ | — | $ | (1,264,259) | $ | (271) |
| | | | | | | | | | | | | |
| Share Transactions: | | | | | | | | | | | | |
| Number of Shares Issued | | 1,044,387 | | 921,616 | | 5,603,616 | | 4,922,459 | | 6,516,997 | | 6,413,702 |
| Number of Shares Reinvested | | — | | — | | — | | 27,747 | | — | | 146,626 |
| Number of Shares Redeemed | | (798,410) | | (838,093) | | (2,816,581) | | (574,880) | | (2,638,607) | | (652,522) |
| Change in Shares | | 245,977 | | 83,523 | | 2,787,035 | | 4,375,326 | | 3,878,390 | | 5,907,806 |
See accompanying notes to financial statements.
| Needham Growth Fund | | | | | | | | | | | | |
| | | | | | | | | | | | | |
| Financial Highlights | | | | | | | | | | | | |
| | | | | | | | | | | | | |
| | | Six Months | | | | | | | | | | |
| | | Ended June 30, | | Year Ended December 31, |
| (For a Share Outstanding | | 2011 | | | | | | | | | | |
| Throughout each Period) | | (Unaudited) | | 2010 | | 2009 | | 2008 | | 2007 | | 2006 |
| Net Asset Value, Beginning of Period | $ | 39.11 | $ | 29.77 | $ | 20.27 | | $ 36.05 | $ | 39.01 | $ | 35.69 |
| Investment Operations | | | | | | | | | | | | |
| Net Investment Income (Loss) | | (0.33) | | (0.60) | | (0.43) | | (0.45) | | (0.25) | | 0.10 |
| Net Realized and Unrealized Gain | | | | | | | | | | | | |
| (Loss) on Investments | | 1.84 | | 9.94 | | 9.93 | | (14.10) | | 1.45 | | 6.29 |
| Total from Investment Operations | | 1.51 | | 9.34 | | 9.50 | | (14.55) | | 1.20 | | 6.39 |
| | | | | | | | | | | | | |
| Less Distributions | | | | | | | | | | | | |
| Net Investment Income | | — | | — | | — | | — | | (0.01) | | (0.09) |
| Net Realized Gains | | — | | — | | — | | (1.23) | | (4.15) | | (3.00) |
| Total Distributions | | — | | — | | — | | (1.23) | | (4.16) | | (3.09) |
| | | | | | | | | | | | | |
| Capital Contributions | | | | | | | | | | | | |
| Redemption Fees | | 0.01 | | —(a) | | —(a) | | — | | — | | — |
| Contribution by Adviser | | — | | — | | — | | — | | — | | 0.02(b) |
| Total Capital Contributions | | 0.01 | | —(a) | | —(a) | | — | | — | | 0.02 |
| Net Asset Value, End of Period | $ | 40.63 | $ | 39.11 | $ | 29.77 | $ | 20.27 | $ | 36.05 | $ | 39.01 |
| | | | | | | | | | | | | |
| Total Return | | 3.89% | | 31.37% | | 46.87% | | (40.41)% | | 3.09% | | 18.05%(b) |
| Net Assets, End of Period (000’s) | $ | 176,021 | $ | 159,805 | $ | 119,175 | $ | 92,818 | $ | 209,397 | $ | 308,693 |
| Ratios/Supplemental Data | | | | | | | | | | | | |
| Ratio of Net Expenses to Average | | | | | | | | | | | | |
| Net Assets | | 1.81%(c) | | 2.11% | | 2.03% | | 2.04% | | 1.86% | | 1.79% |
| Ratio of Net Expenses to Average | | | | | | | | | | | | |
| Net Assets (excluding interest and | | | | | | | | | | | | |
| dividend expense) | | 1.77%(c) | | 2.00% | | 2.00% | | 2.03% | | 1.85% | | 1.78% |
| Ratio of Net Expenses to Average | | | | | | | | | | | | |
| Net Assets (excluding waiver and | | | | | | | | | | | | |
| reimbursement of expenses) | | 1.81%(c) | | 2.11% | | 2.08% | | 2.04% | | 1.86% | | 1.79% |
| Ratio of Net Investment Income | | | | | | | | | | | | |
| (Loss) to Average Net Assets | | (1.57)%(c) | | (1.85)% | | (1.71)% | | (1.37)% | | (0.61)% | | 0.31% |
| Ratio of Net Investment Income | | | | | | | | | | | | |
| (Loss) to Average Net Assets | | | | | | | | | | | | |
| (excluding waivers and | | | | | | | | | | | | |
| reimbursements of expenses) | | (1.57)%(c) | | (1.85)% | | (1.76)% | | (1.37)% | | (0.61)% | | 0.31% |
| Portfolio turnover rate | | 19%(d) | | 62% | | 29% | | 41% | | 41% | | 48% |
| | | | | | | | | | | | | |
(a) Value is less than $0.005 per share. | | | | | | | | | | | |
| (b) In May 2006, the Adviser made a payment to the Growth Fund which increased the total return by 0.06%. | | | | | |
| (c) Annualized for periods less than one year. | | | | | | | | | | | |
| (d) Not annualized for periods less than one year. | | | | | | | | | | |
See accompanying notes to financial statements.
| Needham Aggressive Growth Fund | | | | | | | | | | |
| Financial Highlights | | | | | | | | | | | | |
| | | | | | | | | | | | | |
| | | Six Months | | | | | | | | | | |
| | | Ended June 30, | | Year Ended December 31, |
| (For a Share Outstanding | | 2011 | | | | | | | | | | |
| Throughout each Period) | | (Unaudited) | | 2010 | | 2009 | | 2008 | | 2007 | | 2006 |
| Net Asset Value, Beginning of Period | $ | 17.14 | $ | 12.38 | $ | 9.45 | $ | 14.14 | $ | 13.96 | $ | 13.73 |
| Investment Operations | | | | | | | | | | | | |
| Net Investment Income (Loss) | | (0.14) | | (0.11) | | (0.19) | | (0.26) | | (0.16) | | (0.19) |
| Net Realized and Unrealized Gain | | | | | | | | | | | | |
| (Loss) on Investments | | 0.45 | | 4.98 | | 3.13 | | (3.65) | | 2.34 | | 1.83 |
| Total from Investment Operations | | 0.30 | | 4.87 | | 2.94 | | (3.91) | | 2.18 | | 1.64 |
| | | | | | | | | | | | | |
| Less Distributions | | | | | | | | | | | | |
| Net Realized Gains | | — | | (0.11) | | (0.02) | | (0.78) | | (2.00) | | (1.42) |
| Total Distributions | | — | | (0.11) | | (0.02) | | (0.78) | | (2.00) | | (1.42) |
| | | | | | | | | | | | | |
| Capital Contributions | | | | | | | | | | | | |
| Redemption Fees | | 0.01 | | —(a) | | 0.01 | | — | | — | | — |
| Contribution by Adviser | | — | | — | | — | | — | | — | | 0.01(b) |
| Total Capital Contributions | | 0.01 | | —(a) | | 0.01 | | — | | — | | 0.01 |
| Net Asset Value, End of Period | $ | 17.45 | $ | 17.14 | $ | 12.38 | $ | 9.45 | $ | 14.14 | $ | 13.96 |
| | | | | | | | | | | | | |
| Total Return | | 1.81% | | 39.42% | | 31.18% | | (27.60)% | | 15.58% | | 12.22%(b) |
| Net Assets, End of Period (000’s) | $ | 157,104 | $ | 106,551 | $ | 22,819 | $ | 10,202 | $ | 20,518 | $ | 18,051 |
| Ratios/Supplemental Data | | | | | | | | | | | | |
| Ratio of Net Expenses to Average | | | | | | | | | | | | |
| Net Assets | | 1.80%(c) | | 2.09% | | 2.50% | | 2.51% | | 2.18% | | 2.24% |
| Ratio of Net Expenses to Average | | | | | | | | | | | | |
| Net Assets (excluding interest and | | | | | | | | | | | | |
| dividend expense) | | 1.78%(c) | | 2.05% | | 2.49% | | 2.50% | | 2.18% | | 2.23% |
| Ratio of Net Expenses to Average | | | | | | | | | | | | |
| Net Assets (excluding waiver and | | | | | | | | | | | | |
| reimbursement of expenses) | | 1.80%(c) | | 2.09% | | 2.50% | | 2.63% | | 2.18% | | 2.24% |
| Ratio of Net Investment Loss to | | | | | | | | | | | | |
| Average Net Assets | | (1.69)%(c) | | (1.77)% | | (2.39)% | | (2.04)% | | (1.18)% | | (1.35)% |
| Ratio of Net Investment Loss to | | | | | | | | | | | | |
| Average Net Assets (excluding | | | | | | | | | | | | |
| waiver and reimbursement | | | | | | | | | | | | |
| of expenses) | | (1.69)%(c) | | (1.77)% | | (2.39)% | | (2.15)% | | (1.18)% | | (1.35)% |
| Portfolio turnover rate | | 14%(d) | | 55% | | 70% | | 45% | | 64% | | 55% |
| | | | | | | | | | | | | |
(a) Value is less than $0.005 per share. | | | | | | | | | | |
| (b) In May 2006, the Adviser made a payment to the Aggressive Growth Fund which increased the total return by 0.08%. | | |
| (c) Annualized for periods less than one year. | | | | | | | | | | |
| (d) Not annualized for periods less than one year. | | | | | | | | | | |
See accompanying notes to financial statements.
| Needham Small Cap Growth Fund | | | | | | | | | | |
| Financial Highlights | | | | | | | | | | | | |
| | | | | | | | | | | | | |
| | | Six Months | | | | | | | | | | |
| | | Ended June 30, | | Year Ended December 31, |
| (For a Share Outstanding | | 2011 | | | | | | | | | | |
| Throughout each Period) | | (Unaudited) | | 2010 | | 2009 | | 2008 | | 2007 | | 2006 |
| Net Asset Value, Beginning of Period | $ | 14.21 | $ | 10.73 | $ | 7.61 | $ | 11.29 | $ | 14.32 | $ | 17.09 |
| Investment Operations | | | | | | | | | | | | |
| Net Investment Income (Loss) | | (0.12) | | (0.08) | | (0.20) | | (0.19) | | (0.26) | | (0.26) |
| Net Realized and Unrealized Gain | | | | | | | | | | | | |
| (Loss) on Investments | | 0.16 | | 3.99 | | 3.33 | | (2.49) | | (0.02) | | 1.61 |
| Total from Investment Operations | | 0.04 | | 3.91 | | 3.13 | | (2.68) | | (0.28) | | 1.35 |
| | | | | | | | | | | | | |
| | | | | | | | | | | | | |
| Less Distributions | | | | | | | | | | | | |
| Net Realized Gains | | — | | (0.43) | | (0.01) | | (0.82) | | (2.75) | | (4.18) |
| Return of Capital | | — | | — | | — | | (0.18) | | — | | — |
| Total Distributions | | — | | (0.43) | | (0.01) | | (1.00) | | (2.75) | | (4.18) |
| | | | | | | | | | | | | |
| | | | | | | | | | | | | |
| Capital Contributions | | | | | | | | | | | | |
| Redemption Fees | | —(a) | | —(a) | | —(a) | | — | | — | | — |
| Contribution by Adviser | | — | | — | | — | | — | | — | | 0.06(b) |
| Total Capital Contributions | | —(a) | | —(a) | | —(a) | | — | | — | | 0.06 |
| Net Asset Value, End of Period | $ | 14.25 | $ | 14.21 | $ | 10.73 | $ | 7.61 | $ | 11.29 | $ | 14.32 |
| | | | | | | | | | | | | |
| | | | | | | | | | | | | |
| Total Return | | 0.28% | | 36.89% | | 41.18% | | (23.42)% | | (2.01)% | | 8.52%(b) |
| Net Assets, End of Period (000’s) | $ | 154,491 | $ | 98,911 | $ | 11,303 | $ | 5,309 | $ | 7,726 | $ | 15,248 |
| Ratios/Supplemental Data | | | | | | | | | | | | |
| Ratio of Net Expenses to Average | | | | | | | | | | | | |
| Net Assets | | 1.83%(c) | | 2.16% | | 2.57% | | 2.51% | | 2.50% | | 2.36% |
| Ratio of Net Expenses to Average | | | | | | | | | | | | |
| Net Assets (excluding interest and | | | | | | | | | | | | |
| dividend expense) | | 1.80%(c) | | 2.08% | | 2.50% | | 2.50% | | 2.50% | | 2.36% |
| Ratio of Net Expenses to Average | | | | | | | | | | | | |
| Net Assets (excluding waiver and | | | | | | | | | | | | |
| reimbursement of expenses) | | 1.83%(c) | | 2.16% | | 3.02% | | 3.57% | | 2.64% | | 2.36% |
| Ratio of Net Investment Loss to | | | | | | | | | | | | |
| Average Net Assets | | (1.69)%(c) | | (1.88)% | | (2.50)% | | (2.02)% | | (1.54)% | | (1.61)% |
| Ratio of Net Investment Loss to | | | | | | | | | | | | |
| Average Net Assets (excluding | | | | | | | | | | | | |
| waivers and reimbursements of | | | | | | | | | | | | |
| expenses) | | (1.69)%(c) | | (1.88)% | | (2.95)% | | (3.09)% | | (1.68)% | | (1.61)% |
| Portfolio turnover rate | | 42%(d) | | 65% | | 154% | | 219% | | 38% | | 115% |
| | | | | | | | | | | | | |
| (a) Value is less than $0.005 per share. | | | | | | | | | |
| (b) In May 2006, the Adviser made a payment to the Small Cap Growth Fund which increased the total return by 0.35%. | | |
| (c) Annualized for periods less than one year. | | | | | | | | | |
| (d) Not annualized for periods less than one year. | | | | | | | | | |
See accompanying notes to financial statements.
Notes to Financial Statements (Unaudited)
Needham Growth Fund (‘‘NGF’’), Needham Aggressive Growth Fund (‘‘NAGF’’) and Needham Small Cap Growth Fund (‘‘NSCGF’’) (each, a ‘‘Portfolio’’ and collectively, the ‘‘Portfolios’’), are portfolios of The Needham Funds, Inc. (the ‘‘Company’’), which is registered under the Investment Company Act of 1940, as amended (the ‘‘1940 Act’’) as a non-diversified, open-end management investment company. The Company was organized as a Maryland corporation on October 12, 1995.
| 2. | Significant Accounting Policies |
The following is a summary of significant accounting policies followed by the Company in the preparation of its financial statements. These policies are in conformity with accounting principles generally accepted in the United States of America (‘‘GAAP’’).
Security Valuation: Portfolio securities for which market quotations are readily available are stated at the last sale price reported by the principal exchange for the security as of the exchange’s close of business. Securities for which no sale has taken place during the day and securities which are not listed on an exchange are valued at the mean of the highest closing bid and lowest asked prices. New York Stock Exchange traded options are valued at the last reported sale price on any exchange on which the option is principally traded. If no sales are reported on a particular day, the options will be valued at the mean between the highest closing bid and lowest asked prices across the exchanges where the option is traded. Non-exchange traded options will also be valued at the mean between the last bid and asked quotations. For options where market quotations are not readily available, value will be determined in accordance with the fair value procedures described below.
All other securities and assets for which (a) market quotations are not readily available, such as in the case of a market or technical disruption that prevents the normal trading of a security held by a Portfolio, (b) market quotations are believed to be unrepresentative of fair market value, such as in the case of a thinly traded security, or (c) valuation is normally made at the last sale price on a foreign exchange and a significant event occurs after the close of that exchange but before the New York Stock Exchange close, are valued at their fair value as determined in good faith by the Board of Directors (the ‘‘Board’’) in accordance with Fair Value Procedures established by the Board. The Company’s Fair Value Procedures are implemented and monitored by a Fair Value Committee (the ‘‘Committee’’) designated by the Board. When a security is valued in accordance with the Fair Value Procedures, the Committee determines a value after taking into consideration any relevant information that is reasonably available to the Committee. Some of the more common reasons that may necessitate that a security be valued pursuant to these Fair Value Procedures include, but are not limited to: the security’s trading has been halted or suspended; the security has been de-listed from a national exchange; the security’s primary trading market is temporarily closed at a time when under normal conditions it would be open; or the security’s primary pricing source is not able or willing to provide a price. The assets of each Portfolio may also be valued on the basis of valuations provided by a pricing service approved by, or on behalf of, the Board.
The Portfolios did not fair-value any securities during the six months ended June 30, 2011.
Investment Transactions: Changes in holdings of portfolio securities for the Portfolios shall be reflected no later than in the first calculation on the first business day following the trade date for purposes of calculating each Portfolio’s daily net asset value per share. However, for financial reporting purposes, portfolio security transactions are reported on the trade date of the last business day of the reporting period. The cost (proceeds) of investments sold (bought to cover) is determined on a specific identification basis for the purpose of determining gains or losses on sales and buys to cover short positions. Dividend income and distributions to shareholders are recorded on the ex-dividend date. Interest income is recorded on an accrual basis.
Foreign Currency: Foreign currency amounts are translated into U.S. dollars as follows: (i) assets and liabilities at the rate of exchange at the end of the respective period; and (ii) purchases and sales of securities and income and expenses at the rate of exchange prevailing on the dates of such transactions. The portion of the results of operations arising from changes in the exchange rates and the portion due to fluctuations arising from changes in the market prices of securities are not isolated. Such fluctuations are included with the net realized and unrealized gain or loss on investments. Principal risks associated with such transactions include the movement in value of the foreign currency relative to the U.S. dollar and the ability of the counterparty to perform.
The Portfolios may also invest in forward currency contracts. Fluctuations in the value of such forward currency transactions are recorded daily as unrealized gain or loss; realized gain or loss includes net gain or loss on transactions that have terminated by settlement. These instruments involve market risk, credit risk, or both kinds of risks, in excess of the amount recognized in the statements of assets and liabilities. Risks arise from the possible inability of counterparties to meet the terms of their contracts and from movement in currency and securities values and interest rates. The Portfolios did not enter into forward currency contracts during the six months ended June 30, 2011.
Allocation of Expenses: Expenses directly attributable to a Portfolio are charged directly to that Portfolio, while expenses which are attributable to more than one Portfolio are allocated among the respective Portfolios based upon relative net assets or some other reasonable method.
Notes to Financial Statements (Unaudited) (Continued)
Use of Estimates: The preparation of financial statements in accordance with GAAP requires management to make estimates and assumptions that affect the reported amounts and disclosures in the financial statements. Actual results could differ from those estimates and those differences could be material.
Distributions to Shareholders: Dividends from net investment income, if any, are declared and paid annually for the Portfolios. Distributable net realized gains, if any, are declared and distributed at least annually.
Redemption Fees: The Portfolios reserve the right to assess a redemption fee for shares redeemed within 60 days of purchase. The shareholder will be charged a fee equal to 2.00% of the value of the shares redeemed. The redemption fee is intended to offset excess brokerage commissions and other costs associated with fluctuations in asset levels and cash flows caused by frequent trading by shareholders. The applicability of the redemption fee will be calculated using a first-in first-out method, which means the oldest shares will be redeemed first, followed by the redemption of more recently acquired shares. For the six months ended June 30, 2011, NGF, NAGF and NSCGF had contributions to capital due to redemption fees in the amounts of $23,162, $51,799 and $50,767, respectively.
Federal Income Taxes: It is the policy of each Portfolio to continue to qualify as a regulated investment company, as defined in the Internal Revenue Code, by complying with the provisions available to certain investment companies and to make distributions of net investment income and net realized capital gains sufficient to relieve it from all, or substantially all, federal income taxes. Accordingly, no provision for income taxes has been made in the Portfolios’ financial statements.
As of June 30, 2011, the Portfolios did not have any tax positions that did not meet the ‘‘more-likely-than-not’’ threshold of being sustained by the applicable tax authority. Generally, tax authorities can examine all the tax returns filed for the last three years.
Fair Value Measurements: Valuation inputs used to determine the value of the Portfolios’ investments are summarized in the three broad levels listed below:
Level 1 — quoted prices in active markets for identical assets.
Level 2 — other significant inputs (including quoted prices of similar securities, interest rates, prepayment speeds, credit risk, etc.).
Level 3 — significant unobservable inputs (which may include the Portfolios’ own assumptions in determining the fair value of investments).
The inputs or methodology used to value securities are not necessarily an indication of the risk associated with investing in those securities.
Portfolio securities listed or traded on securities exchanges, including American Depositary Receipts (‘‘ADRs’’), are valued at the closing price on the exchange or system where the security is principally traded or at the NASDAQ Official Closing Price. If there have been no sales for that day on the exchange or system, a security is valued at the last available bid quotation on the exchange or system where the security is principally traded. These valuations are typically categorized as Level 1 in the fair value hierarchy.
In accordance with procedures adopted by the Board, fair value pricing may be used if events materially affecting the value of foreign securities occur between the time the exchange on which they are traded closes and the time the Portfolios’ net asset values are calculated. These valuations are categorized as Level 2 in the fair value hierarchy.
The following is a summary categorization, as of June 30, 2011, of each Portfolio’s investments based on the level of inputs utilized in determining the value of such investments:
| | LEVEL 1 - Quoted Prices(1)(3) |
| | NGF | NAGF | NSCGF |
| Assets | | | |
Common Stocks(2) | $163,908,822 | $136,778,584 | $126,767,474 |
| Short-Term Investments | 12,749,364 | 19,966,195 | 29,088,278 |
| Liabilities | | | |
Securities Sold Short(2) | $ (6,364,533) | $ (3,752,853) | $ (5,262,644) |
| Total | $170,293,653 | $152,991,926 | $150,593,108 |
(1) | As of June 30, 2011, the Portfolios did not hold Level 2 or Level 3 investments. |
| (2) | Please refer to the Schedule of Investments to view segregation by industry. |
| (3) | There were no transfers into or out of Level 1 or Level 2 during the period. |
| 3. | Derivative Instruments and Hedging Activities |
The ‘‘Derivatives and Hedging’’ Topic of the Codification (ASC 815, formerly SFAS 133 and SFAS 161) requires enhanced disclosures about the Portfolios’ derivative and hedging activities, including how such activities are accounted for and their effect on the Portfolios’ financial position, performance and cash flows. The Portfolios did not use derivatives during the six months ended June 30, 2011.
| 4. | Investment Advisory and Administrative Services |
The Company has engaged Needham Investment Management L.L.C. (the ‘‘Adviser’’) to manage its investments. The Company pays the Adviser a fee at the annual rate of 1.25% of the average daily net assets of each Portfolio.
The Adviser has entered into agreements with the Portfolios whereby the Adviser has contractually agreed to waive its fee for, and to reimburse expenses (excluding interest, dividends on short positions, acquired fund fees and expenses and extraordinary items) of NGF, NAGF and NSCGF in an amount that limits annual operating expenses to not more than 1.95% of the average daily net assets. The agreement is effective for the period from May 1, 2011 through May 1, 2012. The agreement shall continue in effect from year to year thereafter only upon mutual agreement of the respective Portfolio and the Adviser.
Notes to Financial Statements (Unaudited) (Continued)
The Company and U.S. Bancorp Fund Services, LLC (the ‘‘Administrator’’) are parties to a Fund Administration Servicing Agreement. The Administrator provides administrative and fund accounting services pursuant to this agreement and, in consideration of these services, receives a fee computed daily and paid monthly at an annual rate equal to 0.07% of the first $500 million of the average daily net assets of the Portfolios, 0.05% on the next $500 million of the average daily net assets of the Portfolios, and 0.04% of the average daily net assets of the Portfolios in excess of $1 billion, with a minimum annual fee of $150,000. The Administrator is also compensated for any out of pocket expenses that are reasonably incurred by the Administrator in carrying out its duties under the Administration Agreement. The Administrator also provides transfer agent services pursuant to a Transfer Agent Servicing Agreement for additional fees.
Certain officers of the Company are also officers of the Adviser and/or Needham & Company, LLC (the ‘‘Distributor’’). Such officers receive no fees from the Company for serving as officers of the Company. Each of the three Independent Directors receives a quarterly retainer of $3,000 and a per-meeting fee of $500. Each Independent Director is also a member of the Board’s Audit Committee and receives a fee of $500 per meeting attended. The Adviser provides an employee to serve as Chief Compliance Officer for the Company and to provide certain related services. An affiliate of the Adviser pays the Chief Compliance Officer’s compensation and the Company reimburses this affiliate for the Company’s portion of the expense.
The Company has adopted an Amended and Restated Plan of Distribution pursuant to Rule 12b-1 under the 1940 Act. Under the Plan, each Portfolio pays the Distributor and any other distributor or financial institution with which the Company has an agreement with respect to each Portfolio, a fee at an annual rate of 0.25% of each Portfolio’s daily average net assets. For the six months ended June 30, 2011, NGF, NAGF and NSCGF incurred distribution fees in the amount of $226,933, $191,942 and $186,604, respectively. For the six months ended June 30, 2011, NGF, NAGF and NSCGF paid 12b-1 fees to the Distributor in the amount of $50,925, $14,435 and $5,938, respectively.
During the six months ended June 30, 2011, NGF, NAGF and NSCGF incurred and paid brokerage commissions to the Distributor in the amount of $18,230, $23,455 and $57,083, respectively.
The Company has entered into an agreement with JPMorgan Chase Bank, N.A. (formerly Custodial Trust Company) for temporary borrowing purposes, including the meeting of redemption requests that otherwise might require the untimely disposition of securities. Interest is calculated daily based on the Federal Funds Rate plus one percent. Each Portfolio may borrow from banks up to 25% of its total assets and may pledge its assets in connection with these borrowings, provided that no additional investments shall be made while borrowings exceed 5% of total assets.
The Portfolios did not engage in any temporary borrowings during the six months ended June 30, 2011.
| 7. | Short Sale Transactions |
During the six months ended June 30, 2011, each Portfolio sold securities short. Upon selling a security short, the Portfolios record a receivable for the settlement amount and a corresponding liability, which is marked-to-market to reflect current value. Certain securities owned by each respective Portfolio are segregated as collateral while the short sales are outstanding. At June 30, 2011, the market value of securities separately segregated to cover short positions was $7,093,000, $3,827,145 and $6,181,400 for NGF, NAGF and NSCGF, respectively.
Additionally, the Portfolios had receivables for Deposit with Broker for Securities Sold Short of $5,150,626, $3,950,931 and $2,560,025 pledged as collateral with brokers in connection with open short positions for NGF, NAGF and NSCGF, respectively. Securities sold short at June 30, 2011 and their related market values and proceeds are set forth in the preceding Schedule of Securities Sold Short for each Portfolio.
8. | Investment Transactions |
The following summarizes the aggregate amount of purchases and sales of investment securities and securities sold short, excluding short-term securities, during the six months ended June 30, 2011:
| | Purchases | Sales |
| NGF | $ 57,545,478 | $43,636,615 |
| NAGF | 83,245,209 | 22,516,008 |
| NSCGF | 140,709,045 | 73,659,320 |
| 9. | Financial Instruments With Off-Balance Sheet Risk |
In the normal course of their business, the Portfolios may trade various financial instruments with off-balance sheet risk. These financial instruments include securities sold short, written options, futures, and forward currency contracts. Generally, these financial instruments represent future commitments to purchase or sell other financial instruments at specific terms at specified future dates. Each of these financial instruments contains varying degrees of off-balance sheet risk whereby changes in the market values of the securities underlying the financial instruments may be in excess of the amounts recognized in the financial statements.
Notes to Financial Statements (Unaudited) (Continued)
Securities sold short represent obligations of the Portfolios to make future delivery of specific securities and, correspondingly, create an obligation to purchase the securities at market prices prevailing at a later delivery date (or to deliver the securities if already owned by the Portfolios). As a result, short sales create the risk that the Portfolios’ ultimate obligation to satisfy the delivery requirements may exceed the amount of the proceeds initially received on the liability recorded in the financial statements.
Under the Company’s organizational documents, its directors and officers are indemnified against certain liabilities arising out of the performance of their duties to the Company. In addition, in the ordinary course of business, the Company enters into contracts that contain a variety of indemnifications. The Company’s maximum exposure under these arrangements is unknown. However, the Company has not had prior claims or losses pursuant to these contracts and expects the risk of loss to be remote.
No provision for federal income taxes is required since the Company intends to continue to qualify as a regulated investment company under Subchapter M of the Internal Revenue Code and distribute substantially all of its taxable income and capital gains to shareholders. Because income tax regulations differ from GAAP, the timing and character of income and capital gain distributions determined in accordance with tax regulations can differ from income and capital gains recognized for financial reporting purposes. Accordingly, the character of distributions and the composition of net assets for tax purposes can differ from those reflected in the financial statements. These book/tax differences may be temporary or permanent in nature. Temporary differences are generally due to differing book and tax treatment for the timing of the recognition of gains and losses on securities, including post-October losses (as described below). Permanent differences are generally due to differing treatment of net investment losses. To the extent these differences are permanent, they are charged or credited to paid-in capital, accumulated net realized gain (loss), or accumulated net investment income (loss), as appropriate, in the period in which the differences arise. These reclassifications have no effect on net assets or net asset value per share of each Portfolio.
As of December 31, 2010, the cost, gross unrealized appreciation, gross unrealized depreciation, and the net unrealized appreciation (depreciation) on securities, including proceeds from securities sold short for federal income tax purposes, were as follows:
| | | Gross | Gross | Net |
| | | Unrealized | Unrealized | Unrealized |
| | Cost | Appreciation | Depreciation | Appreciation |
| NGF | $109,961,129 | $53,638,945 | $(4,894,408) | $48,744,537 |
| NAGF | 86,177,024 | 19,799,022 | (268,398) | 19,530,624 |
| NSCGF | 84,884,615 | 13,525,476 | (490,320) | 13,035,156 |
The difference between the tax cost of investments and the cost of investments for GAAP purposes is primarily due to the tax treatment for wash sale losses.
As of December 31, 2010, the components of distributable earnings (loss) on a tax basis were as follows:
| | | NGF | | NAGF | | NSCGF |
| Undistributed | | | | | | |
| ordinary income | $ | 52,091 | $ | 30,729 | $ | — |
| Undistributed long- | | | | | | |
| term capital gains | | 4,969,179 | | 149,184 | | 682,092 |
| Unrealized | | | | | | |
| appreciation | | 46,611,993 | | 19,545,687 | | 13,021,197 |
| Total accumulated | | | | | | |
| earnings | $ | 51,633,263 | $ | 19,725,600 | $ | 13,703,289 |
| | | | | | | |
| The tax character of distributions paid during the year ended December 31, 2010 was as follows: |
| | | | | |
| | | | | | | |
| | | NGF | | NAGF | | NSCGF |
| Ordinary Income | $ | — | $ | — | $ | 48,085 |
| Net long-term | | | | | | |
| capital gains | $ | — | $ | 434,554 | $ | 1,909,607 |
| Total distributions | | | | | | |
| paid | $ | — | $ | 434,554 | $ | 1,957,692 |
Under current tax law, capital and currency losses realized after October 31 of a Portfolio’s fiscal year may be deferred and treated as occurring on the first business day of the following fiscal year for tax purposes. None of the Portfolios had deferred post-October capital or currency losses, which would have been treated as arising on the first business day of the fiscal year ending December 31, 2011.
The Regulated Investment Company Modernization Act of 2010 (the ‘‘Act’’) was enacted on December 22, 2010. The Act makes changes to several tax rules impacting the Portfolios. In general, the provisions of the Act will be effective for the Company’s fiscal year ending December 31, 2011. Although the Act provides several benefits, including the unlimited carryover of future capital losses, there may be a greater likelihood that all or a portion of each Portfolio’s pre-enactment capital loss carryovers may expire without being utilized due to the fact that post-enactment capital losses get utilized before pre-enactment capital loss carryovers. Relevant information regarding the impact of the Act on the Company, if any, will be contained within the ‘‘Federal Income Taxes’’ section of the notes to the financial statements for the fiscal year ending December 31, 2011.
Notes to Financial Statements (Unaudited) (Continued)
Management has evaluated subsequent events through the date of this filing. This evaluation did not result in any subsequent events that necessitated recognition or disclosures.
| 13. | New Accounting Pronouncements |
In May 2011, the Financial Accounting Standards Board issued Accounting Standards Update (‘‘ASU’’) No. 2011-04 ‘‘Amendments to Achieve Common Fair Value Measurement and Disclosure Requirements in U.S. GAAP and IFRSs.’’ ASU No. 2011-04 requires additional disclosures regarding fair value measurements. Effective for fiscal years beginning after December 15, 2011, and for interim periods within those fiscal years, entities will need to disclose the following:
1) the amounts of any transfers between Level 1 and Level 2 and the reasons for those transfers, and
2) for Level 3 fair value measurements, quantitative information about the significant unobservable inputs used, a description of the entity’s valuation processes, and a narrative description of the sensitivity of the fair value measurement to changes in the unobservable inputs and the interrelationship between inputs.
Management is currently evaluating the impact ASU No. 2011-04 will have on the Company’s financial statement disclosures.
Supplementary Information (Unaudited)
June 30, 2011
| Disclosure of Portfolio Holdings |
The Fund files a Form N-Q with the Securities and Exchange Commission (the ‘‘SEC’’) no more than sixty days after the Fund’s first and third fiscal quarters. For the Fund, this would be for the fiscal quarters ending March 31 and September 30. Form N-Q includes a complete schedule of the Fund’s portfolio holdings as of the end of those fiscal quarters. The Fund’s N-Q filings can be found free of charge on the SEC’s website at http://www.sec.gov, or they may be reviewed and copied at the SEC’s Public Reference Room in Washington, D.C. (call 800-SEC-0330 for information on the operation of the Public Reference Room). |
| |
| Voting Proxies on Fund Portfolio Securities |
| |
| A description of the policies and procedures that the Fund uses to determine how to vote proxies relating to portfolio securities and information regarding how the Fund voted proxies relating to portfolio securities during the most recent 12-month period ended June 30 are available without charge, upon request, by calling 800-625-7071 or on the SEC’s website at http://www.sec.gov. |
Item 2. Code of Ethics.
Not applicable for semi-annual reports.
Item 3. Audit Committee Financial Expert.
Not applicable for semi-annual reports.
Item 4. Principal Accountant Fees and Services.
Not applicable for semi-annual reports.
Item 5. Audit Committee of Listed Registrants.
Not applicable to registrants who are not listed issuers (as defined in Rule 10A-3 under the Securities Exchange Act of 1934).
Item 6. Investments.
Item 7. Disclosure of Proxy Voting Policies and Procedures for Closed-End Management Investment Companies.
Not applicable to open-end investment companies.
Item 8. Portfolio Managers of Closed-End Management Investment Companies.
Not applicable to open-end investment companies.
Item 9. Purchases of Equity Securities by Closed-End Management Investment Company and Affiliated Purchasers.
Not applicable to open-end investment companies.
Item 10. Submission of Matters to a Vote of Security Holders.
Not Applicable.
Item 11. Controls and Procedures.
Item 12. Exhibits.
Pursuant to the requirements of the Securities Exchange Act of 1934 and the Investment Company Act of 1940, the registrant has duly caused this report to be signed on its behalf by the undersigned, thereunto duly authorized.
George A. Needham, President (Chief Executive Officer)
Pursuant to the requirements of the Securities Exchange Act of 1934 and the Investment Company Act of 1940, this report has been signed below by the following persons on behalf of the registrant and in the capacities and on the dates indicated.
George A. Needham, President (Chief Executive Officer)
James W. Giangrasso, Treasurer and Secretary (Chief Financial Officer)