As filed with the Securities and Exchange Commission on September 6, 2013
UNITED STATES
SECURITIES AND EXCHANGE COMMISSION
Washington, D.C. 20549
FORM N-CSR
CERTIFIED SHAREHOLDER REPORT OF REGISTERED
MANAGEMENT INVESTMENT COMPANIES
Investment Company Act file number 811-09114
The Needham Funds, Inc.
(Exact name of registrant as specified in charter)
445 Park Avenue, New York, NY 10022-2606
(Address of principal executive offices) (Zip code)
Mr. George A. Needham, 445 Park Avenue, New York, NY 10022-2606
(Name and address of agent for service)
1-800-625-7071
Registrant's telephone number, including area code
Date of fiscal year end: December 31, 2013
Date of reporting period: June 30, 2013
Item 1. Reports to Stockholders.
445 Park Avenue
New York, New York 10022-2606
1-800-625-7071
www.needhamfunds.com
Semi-Annual Report
June 30, 2013
Contents
| Letter from the Adviser | 1 |
| | |
| Portfolio Characteristics | |
| Needham Growth Fund | 5 |
| Needham Aggressive Growth Fund | 6 |
| Needham Small Cap Growth Fund | 7 |
| Disclosure of Fund Expenses | 8 |
| | |
| Schedule of Investments | |
| Needham Growth Fund | 9 |
| Needham Aggressive Growth Fund | 12 |
| Needham Small Cap Growth Fund | 15 |
| | |
| Schedule of Securities Sold Short | |
| Needham Growth Fund | 11 |
| Needham Aggressive Growth Fund | 14 |
| Needham Small Cap Growth Fund | 16 |
| | |
| Statements of Assets and Liabilities | 17 |
| | |
| Statements of Operations | 18 |
| | |
| Statements of Changes in Net Assets | 19 |
| | |
| Financial Highlights | |
| Needham Growth Fund | 20 |
| Needham Aggressive Growth Fund | 21 |
| Needham Small Cap Growth Fund | 22 |
| | |
| Notes to Financial Statements | 23 |
| | |
| Supplementary Information | 28 |
This report is authorized for distribution to prospective investors only when preceded or accompanied by a current prospectus. The prospectus contains more complete information, including investment objectives, risks, expenses and charges and should be read carefully before investing or sending any money. To obtain a prospectus, please call 1-800-625-7071.
Portfolios of The Needham Funds, Inc., like all mutual funds:
| | ● | Are NOT FDIC insured |
| | ● | Have no bank guarantee |
| | ● | May lose value |
The Needham Funds, Inc. are distributed by Needham & Company, LLC.
| Needham Funds | Semi-Annual Report 2013 |
August 2013
Dear Shareholders, Friends of Needham and Prospective Shareholders,
We are pleased to report results for the first half of 2013 for the Needham Growth Fund, Needham Aggressive Growth Fund, and Needham Small Cap Growth Fund.
Needham Funds’ Semiannual Review
The Needham Growth Fund was up 17.0%, the Needham Aggressive Growth Fund was up 16.2%, and the Needham Small Cap Growth Fund was up 10.8%. The S&P 500 Total Return Index was up 13.8%, the NASDAQ Composite was up 13.4%, and the Russell 2000 Total Return Index was up 15.9%. May was our strongest month in the half—the funds were up 5-10%, while the popular averages were up 2-4%. The funds benefitted from strong earnings and resurgence in mergers and acquisition activity.
As we’ve previously written, we believe in TINA—there is no alternative—to equities. During the second quarter, the bond market cracked and pushed the 10-year Treasury bond from 1.6% yield to 2.6% on talk of the Federal Reserve tapering QE-3, its $85 billion per month bond-buying program. Treasury bondholders lost 5% of their principal on a mark-to-market basis. Commodities were weak on China’s slowing growth and attempts to reign in its shadow banking system. Emerging markets also suffered due to the strengthening U.S. dollar.
The U.S. has been a place of stable, albeit disappointing growth in 2013. In mid-June, the market interpreted Chairman Bernanke as suggesting the Fed could ‘‘taper’’ the amount of Treasury and mortgage-backed security purchases, which sent all of these markets, including U.S. equities, lower. We believe the Fed will stay accommodative for a long time.
We See a Big Opportunity in SMALL CAPS in 2013
We believe the market has not yet recognized the small cap opportunity that we see. The Needham Small Cap Growth Fund has at least 80% of its investable assets in stocks with under a $3 billion market cap. As of June 30, 2013, the Needham Aggressive Growth Fund had 61% of net assets in small and microcap stocks and the Needham Growth Fund had 37%.
| 1) | Valuations in our funds are attractive. Morningstar shows valuation and growth metrics comparing our portfolios with the Russell 2000. Our stocks have greater sales growth. They are valued at a discount to price/ book and at a discount or in-line on price/sales. Our small cap companies have lower operating margins for now, but with revenue growth, they should show higher earnings. |
| | |
| 2) | Among the small cap stocks, we have a number of companies which we think have a promising future, but underperformed in the first half. We believe that II-VI (IIVI), Emulex (ELX) and Entropic Communications (ENTR), which were all negative contributors, have the potential to be winners in 2013. |
| | |
| 3) | When these small cap stocks turn, the turn can be rapid. During the first half, E2Open (EOPN, +23.6%), Edwards Group (EVAC, +39.8%), and Ultra Clean Holdings (UCTT, +23.2%) showed how our patience was rewarded with rapid price appreciation. |
Strong Earnings and M&A in the Second Quarter
We saw a high level of M&A and shareholder activism in the small cap equity universe. We believe this activity illustrates the value that we see in many of our small cap holdings. We’ve written and spoken extensively about SoundBite Communications (SDBT). In May, privately-held Genesys Telecommunications Laboratories announced an agreement to acquire SoundBite Communications for $5.00 cash per share, a near 70% premium. SoundBite was held in all three Needham funds.
True Religion Apparel (TRLG), held by the Needham Small Cap Growth Fund, announced plans last October to explore strategic alternatives, and on May 10, announced an agreement to be acquired by TowerBrook Capital for $32.00 per share, representing a 23% premium to the March 31 closing price.
We’ve also seen shareholder activist activity with Emulex (ELX), which is held in all three Needham funds. During the second quarter, shareholder activist Altai Capital accelerated their activity in the stock. In early July, Starboard Value Fund became the third activist shareholder and the press reported that an M&A process was underway. Elliott Associates has a standstill agreement with Emulex which expires in August 2013. Emulex was down 10.7% in the half, but was up 23% in July.
In May, Vintage Capital, an Anaren (ANEN) shareholder, proposed to buy the company for $23.00 per share. Anaren created a special committee of the board to analyze strategic alternatives, and press reports now indicate that they’ve received multiple offers. Anaren was up 17.9% in the first half and is owned by all three Needham funds.
Needham Growth Fund
The Needham Growth Fund gained 17.0% in the first half of 2013. The largest contributor was ViaSat (VSAT), +83.7%. ViaSat is in the early stages of offering its Exede high-speed broadband service, which utilizes the high capacity, high performance ViaSat-1 satellite. Express Scripts (ESRX), which is the Fund’s largest holding, Gilead Sciences (GILD) and Thermo Fisher Scientific (TMO) were also major contributors in the first half.
The Fund’s largest detractor was Entropic Communications (ENTR), as the company reduced guidance due to customer inventory. Entropic supplies semiconductors used by cable and telecommunications companies in home routers, media gateways and set-top boxes. These boxes are becoming more sophisticated and Entropic’s semiconductors are key components. Entropic is the only significant competitor to Broadcom (BRCM) in these markets and the customers know it.
Over the last three years, we have gradually increased the market cap exposure of the Needham Growth Fund, while maintaining significant exposure to the opportunity we see in small cap stocks. Thus far in 2013, the Needham Growth Fund increased its mid cap exposure to 19% of its invested position from 9%, and decreased small cap exposure to 33% from 44%.
Needham Aggressive Growth Fund
The Needham Aggressive Growth Fund was up 16.2% in the first half of 2013. The Aggressive Growth Fund was cited in the July 8th Barron’s as the ‘‘top-performing mid cap core fund’’ and in the Wall Street Journal as one of the top performing funds for the second quarter. Eight of our top-ten holdings were positive contributors in the first half.
The Fund’s top contributor so far this year was its largest holding, PDF Solutions (PDFS), +33.8% year-to-date through June 30. PDF Solutions reported two good quarters with new contract signings and record gain-share revenues. Most importantly, PDF should benefit as more 28nm semiconductors start to ship in the second half of 2013 from its largest customers, GlobalFoundries and Samsung.
SoundBite Communications entered 2013 as the Fund’s seventh largest position at 3.0% of net assets and gained 72.6% in the first half. Other major contributors were top holdings Gilead Sciences and FormFactor (FORM).
The largest detractors were long-time holdings Entropic Communications and Apple (AAPL), down 7%. We believe Apple’s new phone and tablet products could provide a catalyst for the stock in the second half of 2013.
At June 30, the Fund remained fully invested with under 1% cash and short positions were 6.7%. In the third quarter, we will look to redeploy the cash received from the SoundBite acquisition, which closed in early July.
Highlighting a New Short Position: The Federal Home Loan Mortgage Corporation (FMCC)
In the second quarter, the Needham Aggressive Growth Fund added a new short position that has already become a top contributor so far in 2013: Freddie Mac, the Federal Home Loan Mortgage Corporation (FMCC). During the second quarter, the stock spiked to $5 on positive housing results and first quarter ‘‘earnings.’’ The stock currently trades around $1.25 per share, which we believe is a generous valuation for a company with no means of generating earnings for its shareholders.
The Federal government guaranteed and funded all of Freddie’s losses for the last 4 years, which amounted to $72 billion of a senior preferred purchase. We believe that without this funding, Freddie Mac would have failed, providing no return for its preferred or common shareholders, and causing damage throughout the economy. This guarantee also lowers Freddie’s cost of borrowing, which improves its margins and operating earnings. Freddie also has $14 billion of junior preferred stock outstanding and the common stock is now worth approximately $5 billion. To put the $86 billion of preferred stock in context, over its 37-year lifetime, Freddie Mac ‘‘earned’’ about $30 billion.
In exchange for this guaranteed funding, the Treasury sweeps all positive net worth above a nominal level as a dividend. Absent an act of Congress, Freddie cannot pay down this senior preferred, ever. At the end of June, Senators Corker (R, TN) and Warner (D, VA) introduced a bipartisan Senate bill which winds down Freddie Mac and its peer, The Federal National Mortgage Association, Fannie Mae, with no return to the common or preferred equity holders, and creates a new Federal Mortgage Insurance Corp., which would provide deep insurance for mortgage investors. It would be funded by premiums on mortgage packagers, not by the government. The Obama administration supports the plan.
The July 29, 2013, Barron’s cover story was ‘‘Why Fannie and Freddie Will Fade Away … Why Shareholders Could Get Wiped Out.’’ The Fund’s risk is that the Congress will fail to reach agreement on a broader housing finance bill. In the meantime, Fannie and Freddie continue to benefit from their near monopoly and favored status. In the end, the politicians could decide anything, including throwing the equity holders some value to quiet them. For now, Freddie Mac is a tool of the penny stock day traders. The final resolution of Freddie may take time, but we believe the ultimate fate is no equity value.
Needham Small Cap Growth Fund
The Needham Small Cap Growth Fund was up 10.8% in the first half. Our patience was rewarded as small cap technology companies recovered nicely after underperforming in the first quarter. As we have mentioned in the past, small cap stock prices can move quickly and it is therefore important to have a longer term investment horizon to benefit from these rapid moves of thinly-traded names. We spent a significant amount of time traveling to visit our management teams at their corporate headquarters and manufacturing facilities. In most cases, our long-term investment outlook remains intact, and we look forward to future positive announcements.
Our top performer was one that we visited in the second quarter, long-term holding FormFactor (FORM). Form-Factor is a turnaround story since the management team has repositioned the company to diversify away from its dependence on the DRAM market. We believe the transformation is nearly complete and should return the company to profitability and cash flow-positive results.
Another stock to highlight for first half performance is WageWorks (WAGE), an administrator of pre-tax consumer benefit services such as health savings accounts and transit benefits. We believe trends are in favor of consumer-directed benefits. The company’s SaaS (Software as a Service) platform is scalable, and the company has a 90% revenue retention rate with its corporate clients. The company went public in May 2012, gained 97.8% last year, and gained 93.5% year-to-date through June 30.
Market Commentary
The first half brought a nice recovery for many of our small cap technology names after trailing the markets earlier this year. Technology companies suffered from the anxieties created in 2012 from the combination of European uncertainty, U.S. elections, and the sequestration and budget debates. As greater clarity developed around budgets in both the public and private sectors, customers were able to make decisions with regard to spending levels for IT and capital investment. We expect that this moderate improvement will continue into the second half of 2013 and 2014.
We have traveled across the country over the past six months to visit with many of our current holdings in California, Minnesota, Texas, Massachusetts, Connecticut, Virginia, New Hampshire, Rhode Island and Idaho. A happy receptionist, a full parking lot, new campus construction or an excited plant manager are all keys to understanding our investments better. Due diligence can be a fun and exciting process, as we believe the best research is done outside the office. Our portfolio companies are usually excited to have us visit, as our focus is generally on strategy and long-term goals. Understanding these fundamentals is the basis for our investment approach.
As we have said for awhile, much of today’s equity movements are a result of the accommodative programs from the U.S. Federal Reserve and its international counterparts. The monetary authorities believe that these programs will provide economic stimulus. They also hope to weaken their currencies to promote economic activity. We continue to believe that equity prices will benefit from the ongoing liquidity even if economic activity remains muted. The current mantra on Wall Street is ‘‘TINA,’’ which means ‘‘there is no alternative’’ but to invest in equities. In our view, small cap equities, which typically do not pay out substantial dividends, remain a very attractive and undervalued asset class.
In this era of managed, low interest rates, we believe that growth equities have a role to play in a portfolio. Growth companies are managed by smart entrepreneurs always looking for ways to improve earnings and cash generation. Bonds are still near an all-time low yield and are subject to the risk of higher interest rates. Our investment thesis remains intact, and we continue to find and own stocks within our growth universe that are attractively valued and should benefit us in 2013.
The Growth Factor Commentary Volume 7: The WOW Factor – Game Changers
In our travels, we visit many public companies that are investment candidates for the funds. We also visit many interesting people and places that inform our thoughts on leadership, technology and investing. In July, we wrote about nine people, each of whom left us with a sense of WOW: The founders of HubSpot, a private company changing the way companies do marketing; Tom Foillard, CEO of CarMax, and his drive to change the way people buy used cars; Nathan Harding, the founder of Ekso Bionics and Chris Tagatac, Ambassador, who are changing the lives of wheelchair-bound patients; the management of Entergis (ENTG) and their new i2M Center for Advanced Materials Science in Bedford, MA; Adam Duritz of Counting Crows; and an injured Marine Corp veteran of Afghanistan and his wife and what they have done wounded veterans. Our successful investments are full of great stories like these.
Please check out our website, www.needhamfunds.com, and sign up for The Growth Factor.
Closing
We see opportunity in our strategy of investing in companies that we know well and that we believe are positioned with secular growth drivers. We welcome our new investors and thank all of our investors for their continued support. If you have any questions, thoughts or concerns, please contact us at (800) 625-7071 or send us an email at cretzler@needhamco.com or jbarr@needhamco.com. For information about the funds, please visit our website at www.needhamfunds.com.
Sincerely,
 |  |
| Chris Retzler | John O. Barr |
| Portfolio Manager | Portfolio Manager |
| NEEDHAM GROWTH FUND (Unaudited) | TICKER: NEEGX |
| Comparative Performance Statistics as of June 30, 2013 |
| | | | | | | | | | | | | | | | | | | | | | | | |
| | | | | | | | | | | | | | | | | | | Since | | Gross Expense | |
| | | | 6 Months(7) | | 1 Year | | 3 Years(8) | | 5 Years(8) | | 10 Years(8) | | Inception(8)(12) | | Ratio(14) | |
| | Needham Growth Fund(1) | | 17.02 | % | | 23.81 | % | | 15.55 | %(9) | | 9.17 | %(10) | | 9.37 | %(11) | | 13.81 | %(13) | | 1.95 | % | |
| | S&P 500 Index(2)(3) | | 13.82 | % | | 20.60 | % | | 18.45 | % | | 7.01 | % | | 7.30 | % | | 7.59 | % | | | | |
| | NASDAQ Composite Index(2)(4) | | 13.42 | % | | 17.85 | % | | 18.77 | % | | 9.48 | % | | 8.84 | % | | 7.75 | % | | | | |
| | S&P 400 MidCap Index(2)(5) | | 14.59 | % | | 25.18 | % | | 19.45 | % | | 8.91 | % | | 10.74 | % | | 11.49 | % | | | | |
| | Russell 2000 Index(2)(6) | | 15.86 | % | | 24.21 | % | | 18.67 | % | | 8.77 | % | | 9.53 | % | | 8.09 | % | | | | |
| | Past performance does not guarantee future results. The performance data quoted represents past performance, and current returns may be lower or higher. The investment return and net asset value will fluctuate so that an investor’s shares, when redeemed, may be worth more or less than the original cost. To obtain performance information current to the most recent month-end, please call 1-800-625-7071. The returns shown in the above table and accompanying footnotes are net of expenses. The table above does not reflect the deduction of taxes that a shareholder would have paid on Fund distributions or on the redemption of Fund shares. | |
| | 1. | Investment results calculated after reinvestment of dividends. | |
| | 2. | It is not possible to invest directly in an index. The performance of the index does not include the deduction of expenses associated with a mutual fund, such as investment management fees. | |
| | 3. | The S&P 500 Index is a broad unmanaged measure of the U.S. stock market. | |
| | 4. | The NASDAQ Composite Index is a broad-based capitalization-weighted index of all NASDAQ Global Market and Small Cap stocks. | |
| | 5. | The S&P 400 MidCap Index is a broad unmanaged measure of the U.S. stock market. | |
| | 6. | The Russell 2000 Index is a broad unmanaged index composed of the smallest 2,000 companies in the Russell 3000 Index. | |
| | 7. | Not annualized. | |
| | 8. | Compound annual growth rate (annualized return). Assumes all dividends were reinvested in shares of the Fund. | |
| | 9. | Cumulative return for the three year period was 54.29%, assuming all dividends were reinvested in shares of the Fund. | |
| | 10. | Cumulative return for the five year period was 55.05%, assuming all dividends were reinvested in shares of the Fund. | |
| | 11. | Cumulative return for the ten year period was 144.84%, assuming all dividends were reinvested in shares of the Fund. | |
| | 12. | The inception date of the Fund was 1/1/96. | |
| | 13. | Cumulative return since inception was 861.22%, assuming all dividends were reinvested in shares of the Fund. | |
| | 14. | Gross expense ratio is from the Fund’s prospectus dated May 1, 2013. Additional information pertaining to the Fund’s expense ratios as of June 30, 2013 can be found in the financial highlights. Since January 1, 2009, the investment performance reflects contractually agreed upon fee waivers which expire at the close of business on April 30, 2014. Without these fee waivers, the performance would have been lower. Excluding the indirect costs of investing in acquired funds, total net fund operating expenses would be 1.94%. | |
| | | | |
| Top Ten Holdings* | | |
| (as a % of total investments, as of June 30, 2013) | | |
| | | | | | | % of Total | |
| | | Security | | | | Investments† | |
| 1 | Express Scripts Holding Co. | | | ESRX | | 10.00 | % | |
| 2 | Thermo Fisher Scientific, Inc. | | | TMO | | 8.34 | % | |
| 3 | Gilead Sciences, Inc. | | | GILD | | 6.20 | % | |
| 4 | CarMax, Inc. | | | KMX | | 6.19 | % | |
| 5 | ViaSat, Inc. | | | VSAT | | 6.12 | % | |
| 6 | Becton Dickinson and Co. | | | BDX | | 3.84 | % | |
| 7 | Emulex Corp. | | | ELX | | 3.61 | % | |
| 8 | PDF Solutions, Inc. | | | PDFS | | 3.51 | % | |
| 9 | Hess Corp. | | | HES | | 3.16 | % | |
| 10 | Financial Engines, Inc. | | | FNGN | | 2.76 | % | |
| Top Ten Holdings = 53.73% of Total Investments† | | |
| * | Current portfolio holdings may not be indicative of future portfolio holdings. | | |
| † | Percentage of total investments less cash. | | | | | | | |
| | | | | | | | | |
| Sector Weightings* |
| (as a % of total investments, as of June 30, 2013) |
| | | | | | | | | | | | | |
| | | Sector | | Long(1) | | (Short)(1) | | Total(1)(2) | |
| | Consumer Discretionary | | | 8.9 | % | | — | | | 8.9 | % | |
| | Energy | | | 4.2 | % | | — | | | 4.2 | % | |
| | Exchange Traded Funds | | | — | | | (1.5) | % | | (1.5) | % | |
| | Financials | | | 3.3 | % | | — | | | 3.3 | % | |
| | Health Care | | | 29.1 | % | | (0.2) | % | | 28.9 | % | |
| | Industrials | | | 3.8 | % | | (0.2) | % | | 3.6 | % | |
| | Information Technology | | | 39.6 | % | | (2.3) | % | | 37.3 | % | |
| | Materials | | | 0.1 | % | | — | | | 0.1 | % | |
| | Cash | | | 15.2 | % | | — | | | 15.2 | % | |
| | * | Current portfolio holdings may not be indicative of future portfolio holdings. |
| | (1) | Percentage of total investments includes all stocks, plus cash minus all short positions. |
| | (2) | Total represents the difference between the long exposure and the short exposure, which produces the net exposure. |
| | | |
Comparison of Change in Value of a $10,000 Investment
Past performance does not guarantee future results. The performance data quoted represents past performance, and current returns may be lower or higher. The investment return and net asset value will fluctuate so that an investor’s shares, when redeemed, may be worth more or less than the original cost. To obtain performance information current to the most recent month-end, please call 1-800-625-7071. The graph above does not reflect the deduction of taxes that a shareholder would have paid on Fund distributions or on the redemption of Fund shares. Since inception, the Fund’s adviser has absorbed certain expenses of the Fund, without which returns would have been lower.
The Global Industry Classification Standard (GICS®) was developed by and/or is the exclusive property of MSCI, Inc. and Standard & Poor Financial Services LLC (‘‘S&P’’). GICS is a service mark of MSCI and S&P and has been licensed for use by U.S. Bancorp Fund Services, LLC.
| | |
| NEEDHAM AGGRESSIVE GROWTH FUND (Unaudited) | TICKER: NEAGX |
Comparative Performance Statistics as of June 30, 2013
| | | | 6 Months(6) | | 1 Year | | 3 Years(7) | | 5 Years(7) | | 10 Years(7) | | | | | |
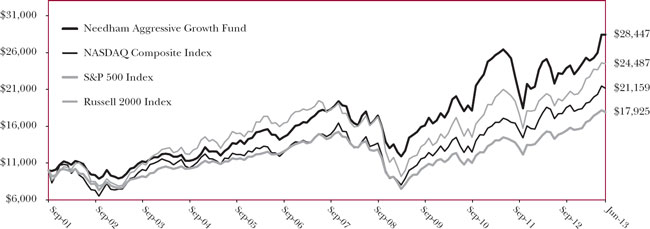
| | Needham Aggressive Growth Fund(1) | | 16.18 | % | | 22.59 | % | | 16.39 | %(8) | | 11.92 | %(9) | | 10.60 | %(10) | | 9.25 | %(12) | | 2.06 | % | |
| | S&P 500 Index(2)(3) | | 13.82 | % | | 20.60 | % | | 18.45 | % | | 7.01 | % | | 7.30 | % | | 5.06 | % | | | | |
| | NASDAQ Composite Index(2)(4) | | 13.42 | % | | 17.85 | % | | 18.77 | % | | 9.48 | % | | 8.84 | % | | 6.54 | % | | | | |
| | Russell 2000 Index(2)(5) | | 15.86 | % | | 24.21 | % | | 18.67 | % | | 8.77 | % | | 9.53 | % | | 7.87 | % | | | | |
| | Past performance does not guarantee future results. The performance data quoted represents past performance, and current returns may be lower or higher. The investment return and net asset value will fluctuate so that an investor’s shares, when redeemed, may be worth more or less than the original cost. To obtain performance information current to the most recent month-end, please call 1-800-625-7071. The returns shown in the above table and accompanying footnotes are net of expenses. The table above does not reflect the deduction of taxes that a shareholder would have paid on Fund distributions or on the redemption of Fund shares. | |
| | 1. | Investment results calculated after reinvestment of dividends. | |
| | 2. | It is not possible to invest directly in an index. The performance of the index does not include the deduction of expenses associated with a mutual fund, such as investment management fees. | |
| | 3. | The S&P 500 Index is a broad unmanaged measure of the U.S. stock market. | |
| | 4. | The NASDAQ Composite Index is a broad-based capitalization-weighted index of all NASDAQ Global Market and Small Cap stocks. | |
| | 5. | The Russell 2000 Index is a broad unmanaged index composed of the smallest 2,000 companies in the Russell 3000 Index. | |
| | 6. | Not annualized. | |
| | 7. | Compound annual growth rate (annualized return). Assumes all dividends were reinvested in shares of the Fund. | |
| | 8. | Cumulative return for the three year period was 57.65%, assuming all dividends were reinvested in shares of the Fund. | |
| | 9. | Cumulative return for the five year period was 75.61%, assuming all dividends were reinvested in shares of the Fund. | |
| | 10. | Cumulative return for the ten year period was 173.82%, assuming all dividends were reinvested in shares of the Fund. | |
| | 11. | The inception date of the Fund was 9/4/2001. | |
| | 12. | Cumulative return since inception was 184.47% assuming all dividends were reinvested in shares of the Fund. | |
| | 13. | Gross expense ratio is from the Fund’s prospectus dated May 1, 2013. Additional information pertaining to the Fund’s expense ratios as of June 30, 2013 can be found in the financial highlights. Since inception, the investment performance reflects contractually agreed upon fee waivers which expire at the close of business on April 30, 2014. Without these fee waivers, the performance would have been lower. Excluding the indirect costs of investing in acquired funds, total net fund operating expenses would be 2.06%. | |
| | | | |
| Top Ten Holdings* |
| (as a % of total investments, as of June 30, 2013) |
| | | | | | % of Total | |
| | | Security | | | | Investments† | |
| 1 | PDF Solutions, Inc. | | | PDFS | | 11.95 | % | |
| 2 | Akamai Technologies, Inc. | | | AKAM | | 8.86 | % | |
| 3 | Gilead Sciences, Inc. | | | GILD | | 6.22 | % | |
| 4 | Soundbite Communications, Inc. | | | SDBT | | 5.84 | % | |
| 5 | Entropic Communications, Inc. | | | ENTR | | 5.12 | % | |
| 6 | Apple, Inc. | | | AAPL | | 3.50 | % | |
| 7 | Jabil Circuit, Inc. | | | JBL | | 3.30 | % | |
| 8 | FormFactor, Inc. | | | FORM | | 3.06 | % | |
| 9 | Entegris, Inc. | | | ENTG | | 2.81 | % | |
| 10 | Electronics for Imaging, Inc. | | | EFII | | 2.75 | % | |
| Top Ten Holdings = 53.41% of Total Investments† | | |
| * | Current portfolio holdings may not be indicative of future portfolio holdings. | | |
| † | Percentage of total investments less cash. | | |
| | | | |
Sector Weightings*
(as a % of total investments, as of June 30, 2013)
| | | | |
| | | | | | | | | | | | | |
| | | Sector | | Long(1) | | (Short)(1) | | Total(1)(2) | |
| | Consumer Discretionary | | | 3.2 | % | | — | | | 3.2 | % | |
| | Consumer Staples | | | 0.7 | % | | — | | | 0.7 | % | |
| | Energy | | | 1.0 | % | | — | | | 1.0 | % | |
| | Exchange Traded Funds | | | — | | | (0.4) | % | | (0.4) | % | |
| | Financials | | | 2.7 | % | | (1.5) | % | | 1.2 | % | |
| | Health Care | | | 10.6 | % | | (0.3) | % | | 10.3 | % | |
| | Industrials | | | 5.9 | % | | (0.5) | % | | 5.4 | % | |
| | Information Technology | | | 81.3 | % | | (3.7) | % | | 77.6 | % | |
| | Materials | | | 0.5 | % | | (0.2) | % | | 0.3 | % | |
| | Cash | | | 0.7 | % | | — | | | 0.7 | % | |
| | * | Current portfolio holdings may not be indicative of future portfolio holdings. |
| | (1) | Percentage of total investments includes all stocks, plus cash minus all short positions. |
| | (2) | Total represents the difference between the long exposure and the short exposure, which produces the net exposure. |
| | | |
Comparison of Change in Value of a $10,000 Investment
Past performance does not guarantee future results. The performance data quoted represents past performance, and current returns may be lower or higher. The investment return and net asset value will fluctuate so that an investor’s shares, when redeemed, may be worth more or less than the original cost. To obtain performance information current to the most recent month-end, please call 1-800-625-7071. The graph above does not reflect the deduction of taxes that a shareholder would have paid on Fund distributions or on the redemption of Fund shares. Since inception, the Fund’s adviser has absorbed certain expenses of the Fund, without which returns would have been lower.
The Global Industry Classification Standard (GICS®) was developed by and/or is the exclusive property of MSCI, Inc. and Standard & Poor Financial Services LLC (‘‘S&P’’). GICS is a service mark of MSCI and S&P and has been licensed for use by U.S. Bancorp Fund Services, LLC.
| | Semi-Annual Report 2013 |
| | |
| NEEDHAM SMALL CAP GROWTH FUND (Unaudited) | TICKER: NESGX |
Comparative Performance Statistics as of June 30, 2013
| | | | | | | | | | | | | | | | | | Since | | Gross Expense | |
| | | 6 Months(6) | | 1 Year | | 3 Years(7) | | 5 Years(7) | | 10 Years(7) | | Inception(7)(11) | | Ratio(13) | |
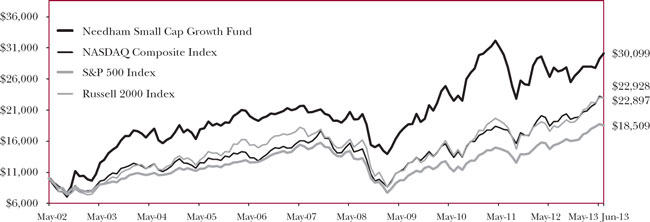
| | Needham Small Cap Growth Fund(1) | 10.80 | % | | 8.15 | % | | 10.21 | %(8) | | 9.07 | %(9) | | 8.76 | %(10) | | 10.43 | %(12) | | 2.05 | % | |
| | S&P 500 Index(2)(3) | 13.82 | % | | 20.60 | % | | 18.45 | % | | 7.01 | % | | 7.30 | % | | 5.70 | % | | | | |
| | NASDAQ Composite Index(2)(4) | 13.42 | % | | 17.85 | % | | 18.77 | % | | 9.48 | % | | 8.84 | % | | 7.74 | % | | | | |
| | Russell 2000 Index(2)(5) | 15.86 | % | | 24.21 | % | | 18.67 | % | | 8.77 | % | | 9.53 | % | | 7.76 | % | | | | |
| | Past performance does not guarantee future results. The performance data quoted represents past performance, and current returns may be lower or higher. The investment return and net asset value will fluctuate so that an investor’s shares, when redeemed, may be worth more or less than the original cost. To obtain performance information current to the most recent month-end, please call 1-800-625-7071. The returns shown in the above table and accompanying footnotes are net of expenses. The table above does not reflect the deduction of taxes that a shareholder would have paid on Fund distributions or on the redemption of Fund shares. | |
| | 1. | Investment results calculated after reinvestment of dividends. | |
| | 2. | It is not possible to invest directly in an index. The performance of the index does not include the deduction of expenses associated with a mutual fund, such as investment management fees. | |
| | 3. | The S&P 500 Index is a broad unmanaged measure of the U.S. stock market. | |
| | 4. | The NASDAQ Composite Index is a broad-based capitalization-weighted index of all NASDAQ Global Market and Small Cap stocks. | |
| | 5. | The Russell 2000 Index is a broad unmanaged index composed of the smallest 2,000 companies in the Russell 3000 Index. | |
| | 6. | Not annualized. | |
| | 7. | Compound annual growth rate (annualized return). Assumes all dividends were reinvested in shares of the Fund. | |
| | 8. | Cumulative return for the three year period was 33.87%, assuming all dividends were reinvested in shares of the Fund. | |
| | 9. | Cumulative return for the five year period was 54.38%, assuming all dividends were reinvested in shares of the Fund. | |
| | 10. | Cumulative return for the ten year period was 131.53%, assuming all dividends were reinvested in shares of the Fund. | |
| | 11. | The inception date of the Fund was 5/22/02. | |
| | 12. | Cumulative return since inception was 200.99%, assuming all dividends were reinvested in shares of the Fund. | |
| | 13. | Gross expense ratio is from the Fund’s prospectus dated May 1, 2013. Additional information pertaining to the Fund’s expense ratios as of June 30, 2013 can be found in the financial highlights. Since inception, the investment performance reflects contractually agreed upon fee waivers which expire at the close of business on April 30, 2014. Without these fee waivers, the performance would have been lower. Excluding the indirect costs of investing in acquired funds, total net fund operating expenses would be 2.04%. | |
| | | | |
Top Ten Holdings*
(as a % of total investments, as of June 30, 2013)
| | | | | | | % of Total | |
| | | Security | | | | Investments† | |
| 1 | Emulex Corp. | | | ELX | | 8.83 | % | |
| 2 | FormFactor, Inc. | | | FORM | | 8.32 | % | |
| 3 | Anaren, Inc. | | | ANEN | | 7.72 | % | |
| 4 | Super Micro Computer, Inc. | | | SMCI | | 6.95 | % | |
| 5 | Electro Scientific Industries, Inc. | | | ESIO | | 6.63 | % | |
| 6 | Ultra Clean Holdings | | | UCTT | | 5.87 | % | |
| 7 | Entropic Communications, Inc. | | | ENTR | | 5.79 | % | |
| 8 | TTM Technologies, Inc. | | | TTMI | | 4.97 | % | |
| 9 | Express Scripts Holding Co. | | | ESRX | | 4.18 | % | |
| 10 | Hess Corp. | | | HES | | 4.10 | % | |
| Top Ten Holdings = 63.36% of Total Investments† | | |
| * | Current portfolio holdings may not be indicative of future portfolio holdings. | | |
| † | Percentage of total investments less cash. |
| | |
Sector Weightings*
(as a % of total investments, as of June 30, 2013)
| | | | | | | | | | | | | |
| | | Sector | | Long(1) | | (Short)(1) | | Total(1)(2) | |
| | Consumer Discretionary | | | 2.9 | % | | — | | | 2.9 | % | |
| | Energy | | | 9.7 | % | | — | | | 9.7 | % | |
| | Exchange Traded Funds | | | — | | | (6.4) | % | | (6.4) | % | |
| | Financials | | | 0.6 | % | | — | | | 0.6 | % | |
| | Health Care | | | 8.2 | % | | — | | | 8.2 | % | |
| | Industrials | | | 5.5 | % | | — | | | 5.5 | % | |
| | Information Technology | | | 68.9 | % | | — | | | 68.9 | % | |
| | Materials | | | 0.5 | % | | — | | | 0.5 | % | |
| | Cash | | | 10.1 | % | | — | | | 10.1 | % | |
| | * | Current portfolio holdings may not be indicative of future portfolio holdings. | |
| | (1) | Percentage of total investments includes all stocks, plus cash minus all short positions. | |
| | (2) | Total represents the difference between the long exposure and the short exposure, which produces the net exposure. | |
| | | | |
Comparison of Change in Value of a $10,000 Investment
Past performance does not guarantee future results. The performance data quoted represents past performance, and current returns may be lower or higher. The investment return and net asset value will fluctuate so that an investor’s shares, when redeemed, may be worth more or less than the original cost. To obtain performance information current to the most recent month-end, please call 1-800-625-7071. The graph above does not reflect the deduction of taxes that a shareholder would have paid on Fund distributions or on the redemption of Fund shares. Since inception, the Fund’s adviser has absorbed certain expenses of the Fund, without which returns would have been lower.
The Global Industry Classification Standard (GICS®) was developed by and/or is the exclusive property of MSCI, Inc. and Standard & Poor Financial Services LLC (‘‘S&P’’). GICS is a service mark of MSCI and S&P and has been licensed for use by U.S. Bancorp Fund Services, LLC.
Disclosure of Fund Expenses (Unaudited)
The following expense table is shown so that you can understand the impact of fees on your investment. All mutual funds have operating expenses. As a shareholder of the Fund, you incur transactional costs, including redemption fees and exchange fees, and ongoing costs, which include costs for portfolio management, administrative services, and shareholder reports, among others. A Fund’s expenses are expressed as a percentage of its average net assets. This figure is known as the expense ratio. The following examples are intended to help you understand the ongoing costs (in dollars) of investing in each fund and to compare these costs with those of other mutual funds. The examples are based on an investment of $1,000 made at the beginning of the period shown and held for the entire period.
The expense example table below illustrates your fund’s cost in two ways:
| ● | Actual Expenses. This section helps you to estimate the actual expenses after fee waivers that you paid over the period. The ‘‘Ending Account Value’’ shown is derived from the Fund’s actual return, and ‘‘Expenses Paid During Period’’ shows the dollar amount that would have been paid by an investor who started with $1,000 in the Fund. You may use the information here, together with the amount you invested, to estimate the expenses that you paid over the period. To do so, simply divide your account value by $1,000 (for example, an $8,600 account value divided by $1,000 = 8.6), then multiply the result by the number given for your fund under the heading entitled ‘‘Expenses Paid During Period’’. |
| | |
| ● | Hypothetical Expenses on a 5% Return. This section is intended to help you compare your Fund’s costs with those of other mutual funds. It assumes that the Fund had a return of 5% before expenses during the period shown, but that the expense ratio is unchanged. In this case, because the return used is not the Fund’s actual return, the results do not apply to your investment. The example is useful in making comparisons because the Securities and Exchange Commission requires all mutual funds to calculate expenses based on a 5% return. You can assess your Fund’s cost by comparing this hypothetical example with the hypothetical examples that appear in shareholders reports of other funds. |
Please note that the expenses shown in the table are meant to highlight your ongoing costs only and do not reflect any transactional costs, such as redemption fees or exchange fees. Therefore, the table is useful in comparing ongoing costs only, and will not help you determine the relative total costs of owning different funds. In addition, if these transactional costs were included, your costs would have been higher.
For the Period January 1, 2013 to June 30, 2013
Expense Example Table
| | | Beginning | | | Ending | | | Expenses | | | Expense | |
| | | Account | | | Account | | | Paid During | | | Ratio During | |
| | | Value | | | Value | | | Period* | | | Period* | |
| | | 1/1/13 | | | 6/30/13 | | | 1/1/13 - 6/30/13 | | | 1/1/13 - 6/30/13 | |
| Needham Growth Fund | | | | | | | | | | | | |
| Actual Expenses | | $ | 1,000.00 | | | $ | 1,170.20 | | | $ | 10.12 | | | 1.88% | |
Hypothetical Example for Comparison Purposes
(5% return before expenses) | | $ | 1,000.00 | | | $ | 1,015.47 | | | $ | 9.39 | | | 1.88% | |
| | | | | | | | | | | | | | | | |
| Needham Aggressive Growth Fund | | | | | | | | | | | | | | | |
| Actual Expenses | | $ | 1,000.00 | | | $ | 1,161.80 | | | $ | 10.67 | | | 1.99% | |
Hypothetical Example for Comparison Purposes
(5% return before expenses) | | $ | 1,000.00 | | | $ | 1,014.93 | | | $ | 9.94 | | | 1.99% | |
| | | | | | | | | | | | | | | | |
| Needham Small Cap Growth Fund | | | | | | | | | | | | | | | |
| Actual Expenses | | $ | 1,000.00 | | | $ | 1,108.00 | | | $ | 10.66 | | | 2.04% | |
Hypothetical Example for Comparison Purposes
(5% return before expenses) | | $ | 1,000.00 | | | $ | 1,014.68 | | | $ | 10.19 | | | 2.04% | |
| * | Expenses are equal to the average account value times the Fund’s annualized expense ratio multiplied by the number of days in the most recent fiscal half-year divided by the number of days in the fiscal year. |
| Needham Growth Fund |
| Schedule of Investments |
| June 30, 2013 (Unaudited) |
| | | Shares | | | Fair Value | |
| | | | | | | |
| Common Stocks (85.3%) | | | | | | |
| | | | | | | |
| Aerospace & Defense (1.4%) | | | | | | |
| Honeywell International, Inc. | | | 15,000 | | | $ | 1,190,100 | |
| Sypris Solutions, Inc. | | | 225,000 | | | | 722,250 | |
| | | | | | | | 1,912,350 | |
| | | | | | | | | |
| Biotechnology (5.3%) | | | | | | | | |
| Gilead Sciences, Inc.* | | | 140,000 | | | | 7,169,400 | |
Quintiles Transnational Holdings, Inc.* | | | 1,108 | | | | 47,157 | |
| | | | | | | | 7,216,557 | |
| | | | | | | | | |
| Capital Markets (3.1%) | | | | | | | | |
| Financial Engines, Inc. | | | 70,000 | | | | 3,191,300 | |
| Oaktree Capital Group LLC | | | 20,000 | | | | 1,051,000 | |
| | | | | | | | 4,242,300 | |
| | | | | | | | | |
| Communications Equipment (10.9%) | | | | | | | | |
| Anaren, Inc.* | | | 96,945 | | | | 2,223,918 | |
| Emulex Corp.* | | | 640,400 | | | | 4,175,408 | |
| Finisar Corp.* | | | 25,000 | | | | 423,750 | |
| KVH Industries, Inc.* | | | 40,000 | | | | 532,400 | |
| QUALCOMM, Inc. | | | 5,000 | | | | 305,400 | |
| ViaSat, Inc.*† | | | 99,000 | | | | 7,074,540 | |
| | | | | | | | 14,735,416 | |
| | | | | | | | | |
| Computers & Peripherals (3.9%) | | | | | | | | |
| Electronics for Imaging, Inc.* | | | 80,000 | | | | 2,263,200 | |
| Super Micro Computer, Inc.* | | | 279,450 | | | | 2,973,348 | |
| | | | | | | | 5,236,548 | |
| | | | | | | | | |
| Electrical Equipment (1.4%) | | | | | | | | |
| II-VI, Inc.* | | | 120,000 | | | | 1,951,200 | |
| | | | | | | | | |
| Electronic Equipment, Instruments & Components (6.8%) | |
| Corning, Inc. | | | 35,000 | | | | 498,050 | |
| Electro Scientific Industries, Inc. | | | 270,000 | | | | 2,905,200 | |
| Jabil Circuit, Inc.† | | | 150,000 | | | | 3,057,000 | |
| Newport Corp.* | | | 95,000 | | | | 1,323,350 | |
| Vishay Intertechnology, Inc.* | | | 100,000 | | | | 1,389,000 | |
| | | | | | | | 9,172,600 | |
| | | | | | | | | |
| Energy Equipment & Services (1.2%) | | | | | | | | |
| Halliburton Co. | | | 5,000 | | | | 208,600 | |
| National Oilwell Varco, Inc. | | | 10,000 | | | | 689,000 | |
| Schlumberger Ltd. | | | 11,000 | | | | 788,260 | |
| | | | | | | | 1,685,860 | |
| | | Shares | | | Fair Value | |
| | | | | | | |
| Common Stocks - Continued | | | | | | |
| | | | | | | |
| Health Care Equipment & Supplies (6.9%) | | | | |
| Becton Dickinson and Co. | | | 45,000 | | | $ | 4,447,350 | |
| CONMED Corp. | | | 50,000 | | | | 1,562,000 | |
| Covidien PLC | | | 27,500 | | | | 1,728,100 | |
| Natus Medical, Inc.* | | | 10,000 | | | | 136,500 | |
| Varian Medical Systems, Inc.* | | | 22,000 | | | | 1,483,900 | |
| | | | | | | | 9,357,850 | |
| | | | | | | | | |
| Health Care Providers & Services (8.5%) | | | | | |
| Express Scripts Holding Co.*† | | | 187,500 | | | | 11,566,875 | |
| | | | | | | | | |
| Internet Software & Services (3.9%) | | | | | | | | |
| Akamai Technologies, Inc.* | | | 60,000 | | | | 2,553,000 | |
| Brightcove, Inc.* | | | 79,780 | | | | 698,873 | |
| QuinStreet, Inc.* | | | 107,500 | | | | 927,725 | |
| Soundbite Communications, Inc. | | | 209,000 | | | | 1,042,910 | |
| | | | | | | | 5,222,508 | |
| | | | | | | | | |
| Leisure Equipment & Products (0.2%) | | | | | | | | |
| Black Diamond, Inc.* | | | 25,000 | | | | 235,000 | |
| | | | | | | | | |
| Life Sciences Tools & Services (7.1%) | | | | | | | | |
| Thermo Fisher Scientific, Inc.† | | | 114,000 | | | | 9,647,820 | |
| | | | | | | | | |
| Media (1.9%) | | | | | | | | |
| Comcast Corp. | | | 60,000 | | | | 2,512,800 | |
| | | | | | | | | |
| Metals & Mining (0.1%) | | | | | | | | |
| Walter Energy, Inc. | | | 11,000 | | | | 114,400 | |
| | | | | | | | | |
| Oil, Gas & Consumable Fuels (2.8%) | | | | | | | | |
| Hess Corp.† | | | 55,000 | | | | 3,656,950 | |
| WPX Energy, Inc.* | | | 10,000 | | | | 189,400 | |
| | | | | | | | 3,846,350 | |
| | | | | | | | | |
| Professional Services (0.8%) | | | | | | | | |
| WageWorks, Inc.* | | | 32,500 | | | | 1,119,625 | |
| | | | | | | | | |
| Semiconductors & Semiconductor Equipment (12.6%) | |
| Brooks Automation, Inc. | | | 220,000 | | | | 2,140,600 | |
| Entegris, Inc.* | | | 210,000 | | | | 1,971,900 | |
| Entropic Communications, Inc.* | | | 655,000 | | | | 2,796,850 | |
| FormFactor, Inc.* | | | 420,000 | | | | 2,835,000 | |
| MKS Instruments, Inc.* | | | 67,500 | | | | 1,791,450 | |
| Nova Measuring Instruments Ltd.* | | | 137,500 | | | | 1,244,375 | |
| PDF Solutions, Inc.* | | | 220,000 | | | | 4,054,600 | |
| Ultra Clean Holdings* | | | 36,250 | | | | 219,313 | |
| | | | | | | | 17,054,088 | |
See accompanying notes to financial statements.
| Needham Growth Fund | |
| Schedule of Investments | |
| June 30, 2013 (Unaudited) | |
| | | Shares | | | Fair Value | |
| | | | | | | |
| Common Stocks - Continued | | | | | | |
| | | | | | | |
| Specialty Retail (6.5%) | | | | | | |
| CarMax, Inc.*† | | | 155,000 | | | $ | 7,154,800 | |
| Dick’s Sporting Goods, Inc.† | | | 30,000 | | | | 1,501,800 | |
| Tiffany & Co. | | | 2,500 | | | | 182,100 | |
| | | | | | | | 8,838,700 | |
| | | | | | | | | |
| Total Common Stocks | | | | | | | | |
| (Cost $65,380,676) | | | | | | | 115,668,847 | |
| | | | | | | | | |
| Short-Term Investment (14.6%) | | | | | | | | |
| | | | | | | | | |
| Money Market Fund (14.6%) | | | | | | | | |
| Dreyfus Treasury Prime Cash Management 0.00% (a) | | | | | | | | |
| (Cost $19,750,068) | | | 19,750,068 | | | $ | 19,750,068 | |
| | | | | | | | | |
| Total Investments (99.9%) | | | | | | | | |
| (Cost $85,130,744) | | | | | | | 135,418,915 | |
| Total Securities Sold Short (-4.0%) | | | | | | | (5,421,305 | ) |
| (Proceeds $4,500,115) | | | | | | | | |
Other Assets in Excess of Liabilities (4.1%) | | | | | | | 5,491,266 | |
| Net Assets (100.0%) | | | | | | $ | 135,488,876 | |
| * | Non-income producing security. |
| | |
| (a) | Rate shown is the seven day yield as of June 30, 2013. |
| | |
| † | Security position is either entirely or partially held in a segregated account as collateral for securities sold short, aggregating a total market value of $6,483,100. |
| | |
| The Global Industry Classification Standard (GICS®) was developed by and/or is the exclusive property of MSCI, Inc. and Standard & Poor’s Financial Services LLC (‘‘S&P’’). GICS is a service mark of MSCI and S&P and has been licensed for use by U.S. Bancorp Fund Services, LLC. |
See accompanying notes to financial statements.
| Needham Growth Fund |
| Schedule of Securities Sold Short |
| June 30, 2013 (Unaudited) |
| | | Shares | | | Fair Value | |
| Securities Sold Short (-2.6%) | | | | | | |
| | | | | | | |
| Airlines (-0.2%) | | | | | | |
| Allegiant Travel Co. | | | 2,500 | | | $ | 264,975 | |
| | | | | | | | | |
| Health Care Technology (-0.2%) | | | | | | | | |
| Medidata Solutions, Inc.* | | | 2,500 | | | | 193,625 | |
| | | | | | | | | |
| Semiconductors & Semiconductor Equipment (-0.8%) | | | | | | | | |
| Advanced Energy Industries, Inc.* | | | 20,000 | | | | 348,200 | |
| EZchip Semiconductor Ltd.* | | | 22,500 | | | | 607,275 | |
| Microsemi Corp.* | | | 7,500 | | | | 170,625 | |
| | | | | | | | 1,126,100 | |
| Software (-1.4%) | | | | | | | | |
| ANSYS, Inc.* | | | 25,000 | | | | 1,827,500 | |
| Informatica Corp.* | | | 2,500 | | | | 87,450 | |
| | | | | | | | 1,914,950 | |
| | | | | | | | | |
| Total Securities Sold Short | | | | | | | | |
| (Proceeds $2,857,088) | | | | | | | 3,499,650 | |
| | | | | | | | | |
| Exchange Traded Funds Sold Short (-1.4%) | | | | | | | | |
| iShares Russell 2000 ETF | | | 5,500 | | | | 534,380 | |
| iShares Russell 2000 Growth ETF | | | 5,500 | | | | 613,305 | |
| iShares Russell 2000 Value ETF | | | 5,500 | | | | 472,450 | |
| Market Vectors Semiconductor ETF | | | 8,000 | | | | 301,520 | |
| | | | | | | | | |
| Total Exchange Traded Funds Sold Short | | | | | | | | |
| (Proceeds $1,643,027) | | | | | | | 1,921,655 | |
| | | | | | | | | |
| Total Securities & Exchange Traded Funds Sold Short | | | | | | | | |
| (Proceeds $4,500,115) | | | | | | | 5,421,305 | |
| | | | | | | | | |
| Total Securities & Exchange Traded | | | | | | | | |
| Funds Sold Short (-4.0%) | | | | | | | (5,421,305 | ) |
| | | | | | | | |
| (Cost $85,130,744) (99.9%) | | | | | | | 135,418,915 | |
Other Assets in Excess of Liabilities (4.1%) | | | | | | | 5,491,266 | |
| Net Assets (100.0%) | | | | | | $ | 135,488,876 | |
| * | Non-income producing security. |
| | |
| The Global Industry Classification Standard (GICS®) was developed by and/or is the exclusive property of MSCI, Inc. and Standard & Poor’s Financial Services LLC (‘‘S&P’’). GICS is a service mark of MSCI and S&P and has been licensed for use by U.S. Bancorp Fund Services, LLC. |
See accompanying notes to financial statements.
| Needham Aggressive Growth Fund |
| Schedule of Investments |
| June 30, 2013 (Unaudited) |
| | | Shares | | | Fair Value | |
| | | | | | | |
| Common Stocks (98.9%) | | | | | | |
| | | | | | | |
| Aerospace & Defense (1.8%) | | | | | | |
| Precision Castparts Corp.† | | | 5,000 | | | $ | 1,130,050 | |
| | | | | | | | | |
| Biotechnology (6.2%) | | | | | | | | |
| Gilead Sciences, Inc.*† | | | 75,000 | | | | 3,840,750 | |
Quintiles Transnational Holdings,Inc.* | | | 536 | | | | 22,812 | |
| | | | | | | | 3,863,562 | |
| Capital Markets (2.6%) | | | | | | | | |
| Financial Engines, Inc. | | | 35,000 | | | | 1,595,650 | |
| | | | | | | | | |
| Chemicals (0.4%) | | | | | | | | |
| AZ Electronic Materials SA | | | 60,000 | | | | 280,343 | |
| | | | | | | | | |
| Commerical Services & Supplies (0.7%) | | | | | | | | |
| AT Cross Co.* | | | 27,500 | | | | 466,125 | |
| | | | | | | | | |
| Communications Equipment (6.8%) | | | | | | | | |
| Anaren, Inc.* | | | 43,890 | | | | 1,006,837 | |
| Emulex Corp.* | | | 202,500 | | | | 1,320,300 | |
| KVH Industries, Inc.* | | | 20,000 | | | | 266,200 | |
| ViaSat, Inc.*† | | | 23,000 | | | | 1,643,580 | |
| | | | | | | | 4,236,917 | |
| Computers & Peripherals (8.2%) | | | | | | | | |
| Apple, Inc.† | | | 5,450 | | | | 2,158,636 | |
| Electronics for Imaging, Inc.* | | | 60,000 | | | | 1,697,400 | |
| Super Micro Computer, Inc.* | | | 120,550 | | | | 1,282,652 | |
| | | | | | | | 5,138,688 | |
| | | | | | | | | |
| Electrical Equipment (0.5%) | | | | | | | | |
| II-VI, Inc.* | | | 18,500 | | | | 300,810 | |
| | | | | | | | | |
| Electronic Equipment, Instruments & Components (7.9%) | |
| Electro Scientific Industries, Inc. | | | 53,000 | | | | 570,280 | |
| FEI Co. | | | 15,000 | | | | 1,094,850 | |
| IPG Photonics Corp. | | | 5,000 | | | | 303,650 | |
| Jabil Circuit, Inc.† | | | 100,000 | | | | 2,038,000 | |
| Multi-Fineline Electronix, Inc.* | | | 52,500 | | | | 777,525 | |
| TTM Technologies, Inc.* | | | 20,000 | | | | 168,000 | |
| | | | | | | | 4,952,305 | |
| | | | | | | | | |
| Health Care Equipment & Supplies (1.5%) | | | | | |
| Becton Dickinson and Co. | | | 6,000 | | | | 592,980 | |
| LeMaitre Vascular, Inc. | | | 50,000 | | | | 327,000 | |
| | | | | | | | 919,980 | |
| | | Shares | | | Fair Value | |
| | | | | | | |
| Common Stocks - Continued | | | | | | |
| | | | | | | |
| Health Care Providers & Services (1.8%) | | | | |
| Express Scripts Holding Co.*† | | | 18,000 | | | $ | 1,110,420 | |
| | | | | | | | | |
| Health Care Technology (0.4%) | | | | | | | | |
| Omnicell, Inc.* | | | 13,000 | | | | 267,150 | |
| | | | | | | | | |
| Household Products (0.7%) | | | | | | | | |
| Oil-Dri Corp. of America | | | 15,000 | | | | 412,050 | |
| | | | | | | | | |
| Internet Software & Services (21.7%) | | | | | | | | |
| Akamai Technologies, Inc.*† | | | 128,500 | | | | 5,467,675 | |
| Brightcove, Inc.* | | | 86,226 | | | | 755,340 | |
| Carbonite, Inc.* | | | 20,000 | | | | 247,800 | |
| ChannelAdvisor Corp.* | | | 3,383 | | | | 53,215 | |
| Constant Contact, Inc.* | | | 45,000 | | | | 723,150 | |
| E2open, Inc.* | | | 30,000 | | | | 525,000 | |
| Equinix, Inc.* | | | 3,750 | | | | 692,700 | |
| Reis, Inc.* | | | 80,000 | | | | 1,479,200 | |
| Soundbite Communications, Inc. | | | 721,750 | | | | 3,601,532 | |
| | | | | | | | 13,545,612 | |
| | | | | | | | | |
| Leisure Equipment & Products (0.2%) | | | | | | | | |
| Black Diamond, Inc.* | | | 10,000 | | | | 94,000 | |
| | | | | | | | | |
| Machinery (0.7%) | | | | | | | | |
| Edwards Group Ltd. - ADR* | | | 50,000 | | | | 425,000 | |
| | | | | | | | | |
| Oil, Gas & Consumable Fuels (0.9%) | | | | | | | | |
| Hess Corp. | | | 8,500 | | | | 565,165 | |
| | | | | | | | | |
| Professional Services (1.8%) | | | | | | | | |
| WageWorks, Inc.* | | | 33,000 | | | | 1,136,850 | |
| | | | | | | | | |
| Semiconductors & Semiconductor Equipment (29.8%) | |
| ATMI, Inc.* | | | 35,000 | | | | 827,750 | |
| Ceva, Inc.* | | | 50,000 | | | | 968,000 | |
| Entegris, Inc.* | | | 185,000 | | | | 1,737,150 | |
| Entropic Communications, Inc.* | | | 740,000 | | | | 3,159,800 | |
| FormFactor, Inc.* | | | 279,650 | | | | 1,887,637 | |
| LTX-Credence Corp.* | | | 25,000 | | | | 149,750 | |
| MKS Instruments, Inc.* | | | 29,100 | | | | 772,314 | |
| Nanometrics, Inc.* | | | 5,000 | | | | 73,350 | |
| Nova Measuring Instruments Ltd.* | | | 107,500 | | | | 972,875 | |
| PDF Solutions, Inc.* | | | 400,000 | | | | 7,372,000 | |
| Photronics, Inc.* | | | 61,000 | | | | 491,660 | |
| Tessera Technologies, Inc. | | | 10,000 | | | | 208,000 | |
| | | | | | | | 18,620,286 | |
See accompanying notes to financial statements.
| Needham Aggressive Growth Fund |
| Schedule of Investments |
| June 30, 2013 (Unaudited) |
| | | Shares | | | Fair Value | |
| | | | | | | |
| Common Stocks - Continued | | | | | | |
| | | | | | | |
| Software (1.4%) | | | | | | |
| Bottomline Technologies, Inc.* | | | 30,000 | | | $ | 758,700 | |
| Exa Corp.* | | | 10,000 | | | | 103,000 | |
| | | | | | | | 861,700 | |
| | | | | | | | | |
| Specialty Retail (2.9%) | | | | | | | | |
| CarMax, Inc.*† | | | 22,500 | | | | 1,038,600 | |
| Dick’s Sporting Goods, Inc.† | | | 15,000 | | | | 750,900 | |
| | | | | | | | 1,789,500 | |
| | | | | | | | | |
| Total Common Stocks | | | | | | | | |
| (Cost $38,940,082) | | | | | | | 61,712,163 | |
| | | | | | | | | |
| Short-Term Investment (0.7%) | | | | | | | | |
| | | | | | | | | |
| Money Market Fund (0.7%) | | | | | | | | |
| Dreyfus Treasury Prime Cash Management 0.00% (a) | | | | | | | | |
| | | 407,918 | | | $ | 407,918 | |
| | | | | | | | | |
| Total Investments (99.6%) | | | | | | | | |
| (Cost $39,348,000) | | | | | | | 62,120,081 | |
| Total Securities Sold Short (-6.2%) | | | | | | | (3,842,615 | ) |
| (Proceeds $3,578,389) | | | | | | | | |
| Other Assets in Excess of Liabilities (6.6%) | | | | | | | 4,118,695 | |
| Net Assets (100.0%) | | | | | | $ | 62,396,161 | |
| * | Non-income producing security. |
| | |
| | Rate shown is the seven day yield as of June 30, 2013. |
| | |
| † | Security position is either entirely or partially held in a segregated account as collateral for securities sold short, aggregating a total market value of $4,419,830. |
| | |
| The Global Industry Classification Standard (GICS®) was developed by and/or is the exclusive property of MSCI, Inc. and Standard & Poor’s Financial Services LLC (‘‘S&P’’). GICS is a service mark of MSCI and S&P and has been licensed for use by U.S. Bancorp Fund Services, LLC. |
See accompanying notes to financial statements.
| Needham Aggressive Growth Fund | | | | |
| Schedule of Securities Sold Short | | | | | | |
| June 30, 2013 (Unaudited) | | | | | | |
| | | Shares | | | Fair Value | |
| | | | | | | |
| Securities Sold Short (-5.8%) | | | | | | |
| | | | | | | |
| Airlines (-0.4%) | | | | | | |
| Allegiant Travel Co. | | | 2,500 | | | $ | 264,975 | |
| | | | | | | | | |
| Chemicals (-0.2%) | | | | | | | | |
| Zoltek Cos., Inc.* | | | 8,000 | | | | 103,280 | |
| | | | | | | | | |
| Electronic Equipment, Instruments & Components (-0.1%) | |
| Maxwell Technologies, Inc.* | | | 8,000 | | | | 57,200 | |
| | | | | | | | | |
| Health Care Technology (-0.3%) | | | | | | | | |
| Medidata Solutions, Inc.* | | | 2,500 | | | | 193,625 | |
| | | | | | | | | |
| IT Services (0.1%) | | | | | | | | |
| ServiceSource International, Inc.* | | | 2,500 | | | | 23,300 | |
| | | | | | | | | |
| Semiconductors & Semiconductor Equipment (-1.2%) | | | | |
| Advanced Energy Industries, Inc.* | | | 10,000 | | | | 174,100 | |
| EZchip Semiconductor Ltd.* | | | 7,500 | | | | 202,425 | |
| Microsemi Corp.* | | | 10,000 | | | | 227,500 | |
| QuickLogic Corp.* | | | 67,500 | | | | 149,175 | |
| | | | | | | | 753,200 | |
| Software (-2.1%) | | | | | | | | |
| ANSYS, Inc.* | | | 12,800 | | | | 935,680 | |
| Informatica Corp.* | | | 5,000 | | | | 174,900 | |
| TIBCO Software, Inc.* | | | 10,000 | | | | 214,000 | |
| | | | | | | | 1,324,580 | |
| | | Shares | | | Fair Value | |
| | | | | | | |
| Thrifts & Mortgage Finance (-1.4%) | | | | | | |
Federal Home Loan Mortgage Corp.* | | | 635,000 | | | $ | 857,250 | |
| | | | | | | | | |
| Total Securities Sold Short | | | | | | | | |
| (Proceeds $3,352,500) | | | | | | | 3,577,410 | |
| | | | | | | | | |
| Exchange Traded Funds Sold Short (-0.4%) | | | | | |
| iShares Russell 2000 ETF | | | 1,000 | | | | 97,160 | |
| iShares Russell 2000 Growth ETF | | | 1,000 | | | | 111,510 | |
| Market Vectors Semiconductor ETF | | | 1,500 | | | | 56,535 | |
| | | | | | | | | |
| Total Exchange Traded Funds Sold Short | | | | | |
| (Proceeds $225,889) | | | | | | | 265,205 | |
| | | | | | | | | |
| Total Securities & Exchange Traded Funds Sold Short | | | | |
| (Proceeds $3,578,389) | | | | | | | 3,842,615 | |
| | | | | | | | | |
| Total Securities & Exchange Traded | | | | | | | | |
| Funds Sold Short (-6.2%) | | | | | | | (3,842,615 | ) |
| Total Investments | | | | | | | | |
(Cost $39,348,000) (99.6%) | | | | | | | 62,120,081 | |
Other Assets in Excess of Liabilities (6.6%) | | | | | | | 4,118,695 | |
| Net Assets (100.0%) | | | | | | $ | 62,396,161 | |
| | |
* Non-income producing security. | |
| | |
The Global Industry Classification Standard (GICS®) was developed by and/or is the exclusive property of MSCI, Inc. and Standard & Poor’s Financial Services LLC (‘‘S&P’’). GICS is a service mark of MSCI and S&P and has been licensed for use by U.S. Bancorp Fund Services, LLC. | |
See accompanying notes to financial statements.
| Needham Small Cap Growth Fund | | | | |
| Schedule of Investments | | | | | | |
| June 30, 2013 (Unaudited) | | | | | | |
| | | Shares | | | Fair Value | |
| Common Stocks (89.0%) | | | | | | |
| Communications Equipment (17.3%) | | | | | | |
| Anaren, Inc.*† | | | 136,665 | | | $ | 3,135,095 | |
| Emulex Corp.*† | | | 550,000 | | | | 3,586,000 | |
| Finisar Corp.* | | | 70,000 | | | | 1,186,500 | |
| | | | | | | | 7,907,595 | |
| Computers & Peripherals (6.2%) | | | | | | | | |
| Super Micro Computer, Inc.*† | | | 265,000 | | | | 2,819,600 | |
| | | | | | | | | |
| Electrical Equipment (3.6%) | | | | | | | | |
| II-VI, Inc.*† | | | 100,000 | | | | 1,626,000 | |
| | | | | | | | | |
| Electronic Equipment, Instruments & Components (10.6%) | |
| Electro Scientific Industries, Inc.† | | | 250,000 | | | | 2,690,000 | |
| Multi-Fineline Electronix, Inc.* | | | 10,000 | | | | 148,100 | |
| TTM Technologies, Inc.*† | | | 240,000 | | | | 2,016,000 | |
| | | | | | | | 4,854,100 | |
| Energy Equipment & Services (4.0%) | | | | | | | | |
| Halliburton Co. | | | 7,500 | | | | 312,900 | |
| National Oilwell Varco, Inc.† | | | 10,000 | | | | 689,000 | |
| Superior Energy Services, Inc.* | | | 32,500 | | | | 843,050 | |
| | | | | | | | 1,844,950 | |
| Health Care Equipment & Supplies (3.9%) | | | | | |
| MAKO Surgical Corp.* | | | 25,000 | | | | 301,250 | |
| Natus Medical, Inc.* | | | 20,000 | | | | 273,000 | |
| NxStage Medical, Inc.* | | | 45,000 | | | | 642,600 | |
| Solta Medical, Inc.* | | | 100,000 | | | | 228,000 | |
| Varian Medical Systems, Inc.* | | | 5,000 | | | | 337,250 | |
| | | | | | | | 1,782,100 | |
| Health Care Providers & Services (3.7%) | | | | | |
| Express Scripts Holding Co.*† | | | 27,500 | | | | 1,696,475 | |
| | | | | | | | | |
| Internet Software & Services (7.0%) | | | | | | | | |
| Brightcove, Inc.* | | | 100,000 | | | | 876,000 | |
| QuinStreet, Inc.*† | | | 182,500 | | | | 1,574,975 | |
| Soundbite Communications, Inc. | | | 149,250 | | | | 744,757 | |
| | | | | | | | 3,195,732 | |
| Metals & Mining (0.5%) | | | | | | | | |
| Walter Energy, Inc.† | | | 20,000 | | | | 208,000 | |
| | | Shares | | | Fair Value | |
| Common Stocks - Continued | | | | | | |
| Oil, Gas & Consumable Fuels (4.9%) | | | | | | |
| Hess Corp.† | | | 25,000 | | | $ | 1,662,250 | |
| WPX Energy, Inc.* | | | 30,000 | | | | 568,200 | |
| | | | | | | | 2,230,450 | |
| | | | | | | | | |
| Professional Services (1.5%) | | | | | | | | |
| WageWorks, Inc.* | | | 20,000 | | | | 689,000 | |
| | | | | | | | | |
| Semiconductors & Semiconductor Equipment (22.5%) | |
| Entropic Communications, Inc.*† | | | 550,000 | | | | 2,348,500 | |
| FormFactor, Inc.* | | | 500,000 | | | | 3,375,000 | |
| MaxLinear, Inc.* | | | 132,500 | | | | 927,500 | |
| MKS Instruments, Inc.* | | | 2,500 | | | | 66,350 | |
| Photronics, Inc.*† | | | 115,000 | | | | 926,900 | |
| Rudolph Technologies, Inc.* | | | 20,000 | | | | 224,000 | |
| Ultra Clean Holdings* | | | 393,750 | | | | 2,382,188 | |
| | | | | | | | 10,250,438 | |
| | | | | | | | | |
| Specialty Retail (0.6%) | | | | | | | | |
| Francesca’s Holdings Corp.* | | | 10,000 | | | | 277,900 | |
| | | | | | | | | |
| Textiles, Apparel & Luxury Goods (2.1%) | | | | | |
| True Religion Apparel, Inc. | | | 30,000 | | | | 949,800 | |
| | | | | | | | | |
| Thrifts & Mortgage Finance (0.6%) | | | | | | | | |
| Tree.com, Inc. | | | 15,000 | | | | 257,100 | |
| | | | | | | | | |
| Total Common Stocks | | | | | | | | |
| (Cost $40,409,965) | | | | | | | 40,589,240 | |
| | | | | | | | | |
| Short-Term Investment (9.3%) | | | | | | | | |
| Money Market Fund (9.3%) | | | | | | | | |
| | | | | | | | | |
Dreyfus Treasury Prime Cash Management 0.00%(a) (Cost $4,260,266) | | | 4,260,266 | | | $ | 4,260,266 | |
| | | | | | | | | |
| Total Investments (98.3%) | | | | | | | | |
| (Cost $44,670,231) | | | | | | | 44,849,506 | |
| Total Securities Sold Short (-5.9%) | | | | | | | (2,695,955 | ) |
| (Proceeds $2,389,958) | | | | | | | | |
Other Assets in Excess of Liabilities (7.6%) | | | | | | | 3,488,490 | |
| Net Assets (100.0%) | | | | | | $ | 45,642,041 | |
| * | Non-income producing security. |
| (a) | Rate shown is the seven day yield as of June 30, 2013. |
| † | Security position is either entirely or partially held in a segregated account as collateral for securities sold short, aggregating a total market value of $6,265,750. |
| | |
The Global Industry Classification Standard (GICS®) was developed by and/or is the exclusive property of MSCI, Inc. and Standard & Poor’s Financial Services LLC (‘‘S&P’’). GICS is a service mark of MSCI and S&P and has been licensed for use by U.S. Bancorp Fund Services, LLC. |
See accompanying notes to financial statements.
| Needham Small Cap Growth Fund | | | | |
| Schedule of Securities Sold Short | | | | | | |
| June 30, 2013 (Unaudited) | | | | | | |
| | | Shares | | | Fair Value | |
| Exchange Traded Funds Sold Short (-5.9%) | | | | |
| iShares Russell 2000 ETF | | | 7,000 | | | $ | 680,120 | |
| iShares Russell 2000 Growth ETF | | | 6,000 | | | | 669,060 | |
| iShares Russell 2000 Value ETF | | | 8,000 | | | | 687,200 | |
| Market Vectors Semiconductor ETF | | | 17,500 | | | | 659,575 | |
| | | | | | | | | |
| Total Exchange Traded Funds Sold Short | | | | | | | | |
| (Proceeds $2,389,958) | | | | | | | 2,695,955 | |
Total Exchange Traded Funds Sold Short (-5.9%) | | | | | | | (2,695,955 | ) |
| Total Investments | | | | | | | | |
(Cost $44,670,231) (98.3%) | | | | | | | 44,849,506 | |
Other Assets in Excess of Liabilities (7.6%) | | | | | | | 3,488,490 | |
| Net Assets (100.0%) | | | | | | $ | 45,642,041 | |
The Global Industry Classification Standard (GICS®) was developed by and/or is the exclusive property of MSCI, Inc. and Standard & Poor’s Financial Services LLC (‘‘S&P’’). GICS is a service mark of MSCI and S&P and has been licensed for use by U.S. Bancorp Fund Services, LLC.
See accompanying notes to financial statements.
Statements of Assets and Liabilities
June 30, 2013 (Unaudited)
| | | | | | Needham | | | Needham | |
| | | Needham | | | Aggressive | | | Small Cap | |
| | | Growth Fund | | | Growth Fund | | | Growth Fund | |
| Assets | | | | | | | | | |
| Investments, at Value | | | | | | | | | | | | |
(Cost $85,130,744, $39,348,000, $44,670,231) | | $ | 135,418,915 | | | $ | 62,120,081 | | | $ | 44,849,506 | |
| Cash | | | 1,125 | | | | 381,570 | | | | 1,650 | |
| Receivables: | | | | | | | | | | | | |
| Deposit with Broker for Securities Sold Short | | | 5,545,736 | | | | 3,793,624 | | | | 3,044,981 | |
| Dividends and Interest | | | 36,888 | | | | 2,657 | | | | — | |
| Fund Shares Sold | | | 33,372 | | | | 24,569 | | | | 8,059 | |
| Investment Securities Sold | | | 444,596 | | | | 396,813 | | | | 790,251 | |
| Prepaid Expenses | | | 12,481 | | | | 16,105 | | | | 18,911 | |
| Total Assets | | | 141,493,113 | | | | 66,735,419 | | | | 48,713,358 | |
| | | | | | | | | | | | | |
| Liabilities | | | | | | | | | | | | |
| Securities Sold Short, at Value | | | | | | | | | | | | |
(Proceeds $4,500,115, $3,578,389, $2,389,958) | | | 5,421,305 | | | | 3,842,615 | | | | 2,695,955 | |
| Payables: | | | | | | | | | | | | |
| Investment Securities Purchased | | | 294,296 | | | | 115,968 | | | | 214,113 | |
| Fund Shares Redeemed | | | 32,325 | | | | 240,797 | | | | 40,203 | |
| Due to Adviser | | | 137,818 | | | | 65,606 | | | | 52,811 | |
| Distribution Fees | | | 27,968 | | | | 13,084 | | | | 9,597 | |
| Administration and Accounting Fees | | | 30,345 | | | | 17,755 | | | | 15,265 | |
| Transfer Agent Fees | | | 14,790 | | | | 14,358 | | | | 15,238 | |
| Accrued Expenses and Other Liabilities | | | 45,390 | | | | 29,075 | | | | 28,135 | |
| Total Liabilities | | | 6,004,237 | | | | 4,339,258 | | | | 3,071,317 | |
| | | | | | | | | | | | | |
| Net Assets | | $ | 135,488,876 | | | $ | 62,396,161 | | | $ | 45,642,041 | |
| Shares Issued and Outstanding $0.001 Par Value | | | | | | | | | | | | |
(Authorized 800,000,000, 100,000,000 and 100,000,000 respectively) | | | 3,439,376 | | | | 3,229,725 | | | | 3,371,208 | |
Net Asset Value, Offering and Redemption Price Per Share(a) | | $ | 39.39 | | | $ | 19.32 | | | $ | 13.54 | |
| | | | | | | | | | | | | |
| Components of Net Assets | | | | | | | | | | | | |
| Paid-in Capital | | | 83,355,773 | | | | 45,853,692 | | | | 47,228,533 | |
| Accumulated Net Investment Loss | | | (764,749 | ) | | | (520,624 | ) | | | (466,899 | ) |
| Accumulated Net Realized Gain (Loss) from Investments, Securities | | | | | | | | | | | | |
| Sold Short, Foreign Currency Transactions and Currency | | | 3,530,871 | | | | (5,444,762 | ) | | | (992,871 | ) |
| Net Unrealized Appreciation (Depreciation) on Investment Securities and | | | | | | | | | | | | |
| Securities Sold Short | | | 49,366,981 | | | | 22,507,855 | | | | (126,722 | ) |
| Total Net Assets | | $ | 135,488,876 | | | $ | 62,396,161 | | | $ | 45,642,041 | |
| (a) | Subject to certain exceptions, a 2% redemption fee is imposed upon shares redeemed within 60 days of their purchase. See Note 2 of the notes to financial statements. |
See accompanying notes to financial statements.
Statements of Operations
For the six months ended June 30, 2013 (Unaudited)
| | | | | | Needham | | | Needham | |
| | | Needham | | | Aggressive | | | Small Cap | |
| | | Growth Fund | | | Growth Fund | | | Growth Fund | |
| Investment Income | | | | | | | | | |
| Dividends | | $ | 362,330 | | | $ | 102,693 | | | $ | 58,775 | |
| Interest | | | 3 | | | | — | | | | 1 | |
| Less: Foreign Taxes Withheld | | | — | | | | (785 | ) | | | — | |
| Total Investment Income | | | 362,333 | | | | 101,908 | | | | 58,776 | |
| | | | | | | | | | | | | |
| Expenses | | | | | | | | | | | | |
| Investment Advisory Fees | | | 769,609 | | | | 391,188 | | | | 322,001 | |
| Distribution Fees | | | 153,922 | | | | 78,237 | | | | 64,400 | |
| Administration and Accounting Fees | | | 60,086 | | | | 34,177 | | | | 29,073 | |
| Audit Fees | | | 15,692 | | | | 10,451 | | | | 10,482 | |
| Chief Compliance Officer Fees | | | 9,570 | | | | 4,920 | | | | 4,106 | |
| Custodian Fees | | | 3,666 | | | | 5,855 | | | | 3,408 | |
| Directors’ Fees | | | 14,469 | | | | 7,542 | | | | 6,381 | |
Dividend Expense(1) | | | 5,478 | | | | 856 | | | | 7,138 | |
| Filing Fees | | | 18,115 | | | | 11,470 | | | | 12,251 | |
Interest Expense(1) | | | 25,868 | | | | 20,344 | | | | 10,826 | |
| Legal Fees | | | 21,857 | | | | 10,676 | | | | 8,929 | |
| Printing Fees | | | 11,821 | | | | 6,172 | | | | 6,393 | |
| Transfer Agent Fees | | | 29,571 | | | | 28,313 | | | | 30,321 | |
| Other Expenses | | | 19,658 | | | | 12,319 | | | | 11,238 | |
| Total Expenses | | | 1,159,382 | | | | 622,520 | | | | 526,947 | |
| Fees Waived by Investment Adviser | | | — | | | | — | | | | (1,272 | ) |
| Net Expenses | | | 1,159,382 | | | | 622,520 | | | | 525,675 | |
| Net Investment Loss | | | (797,049 | ) | | | (520,612 | ) | | | (466,899 | ) |
| | | | | | | | | | | | | |
Net Realized/Unrealized Gain (Loss) from Investments, Securities Sold Short, Foreign Currency Transactions and Currency | | | | | | | | | | | | |
| Net Realized Gain from Investments | | | 4,351,086 | | | | 2,303,407 | | | | (48,119 | ) |
| Net Realized Loss from Securities Sold Short | | | (471,518 | ) | | | (504,449 | ) | | | (563,113 | ) |
| Net Realized Gain from Foreign Currency Transactions | | | — | | | | 38 | | | | — | |
| Net Realized Gain from Currency | | | — | | | | 1 | | | | — | |
Change in Unrealized Appreciation on Investments and Securities Sold Short | | | 15,947,738 | | | | 7,887,461 | | | | 6,232,271 | |
Net Realized/Unrealized Gain from Investments, Securities Sold Short, Foreign Currency Transactions and Currency | | | 19,827,306 | | | | 9,686,458 | | | | 5,621,039 | |
| Change in Net Assets Resulting from Operations | | $ | 19,030,257 | | | $ | 9,165,846 | | | $ | 5,154,140 | |
| (1) | Expense related to securities sold short. |
See accompanying notes to financial statements.
Statements of Changes in Net Assets
| | | | | | | | | Needham Aggressive | | | Needham Small Cap | |
| | | Needham Growth Fund | | | Growth Fund | | | Growth Fund | |
| | | Six months | | | Year Ended | | | Year Ended | | | Year Ended | | | Year Ended | | | Year Ended | |
| | | ended June 30, | | | December 31, | | | June 30, | | | December 31, | | | June 30, | | | December 31, | |
| | | 2013 | | | 2012 | | | 2013 | | | 2012 | | | 2013 | | | 2012 | |
| | | (Unaudited) | | | | | | (Unaudited) | | | | | | (Unaudited) | | | | |
| Change in Net Assets | | | | | | | | | | | | | | | | | | |
| Operations: | | | | | | | | | | | | | | | | | | |
| Net Investment Loss | | $ | (797,049 | ) | | $ | (796,318 | ) | | $ | (520,612 | ) | | $ | (1,153,049 | ) | | $ | (466,899 | ) | | $ | (770,410 | ) |
Net Realized Gain (Loss) from
Investments, Securities Sold
Short, Foreign Currency
Transactions, and Currency | | | 3,879,568 | | | | 7,927,193 | | | | 1,798,997 | | | | (7,165,944 | ) | | | (611,232 | ) | | | 1,502,727 | |
| | | | | | | | | | | | | | | | | | | | | | | | | |
Change in Unrealized
Appreciation on Investments
and Securities Sold Short | | | 15,947,738 | | | | 8,505,697 | | | | 7,887,461 | | | | 20,111,842 | | | | 6,232,271 | | | | 6,357,419 | |
Change in Net Assets Resulting
from Operations | | | 19,030,257 | | | | 15,636,572 | | | | 9,165,846 | | | | 11,792,849 | | | | 5,154,140 | | | | 7,089,736 | |
| | | | | | | | | | | | | | | | | | | | | | | | | |
Distributions to
Shareholders from: | | | | | | | | | | | | | | | | | | | | | | | | |
| Capital Gains | | | — | | | | (10,332,430 | ) | | | — | | | | (42,629 | ) | | | — | | | | — | |
Total Distributions to Shareholders | | | — | | | | (10,332,430 | ) | | | — | | | | (42,629 | ) | | | — | | | | — | |
| | | | | | | | | | | | | | | | | | | | | | | | | |
| Capital Transactions: | | | | | | | | | | | | | | | | | | | | | | | | |
| Shares Issued | | | 14,044,752 | | | | 5,365,652 | | | | 2,836,374 | | | | 8,345,065 | | | | 2,280,920 | | | | 14,664,256 | |
Shares Issued in Reinvestment
of Distribution | | | 1,636,255 | | | | 8,356,672 | | | | — | | | | 42,097 | | | | — | | | | — | |
| Shares Redeemed | | | (12,785,240 | ) | | | (31,433,234 | ) | | | (16,358,016 | ) | | | (43,575,127 | ) | | | (22,410,570 | ) | | | (43,834,450 | ) |
| Redemption Fees | | | 1,672 | | | | 1,961 | | | | 5,678 | | | | 14,166 | | | | 3,119 | | | | 20,159 | |
Change in Net Assets from
Capital Transactions | | | 2,897,439 | | | | (17,708,949 | ) | | | (13,515,964 | ) | | | (35,173,799 | ) | | | (20,126,531 | ) | | | (29,150,035 | ) |
| | | | | | | | | | | | | | | | | | | | | | | | | |
| Change in Net Assets | | | 21,927,696 | | | | (12,404,807 | ) | | | (4,350,118 | ) | | | (23,423,579 | ) | | | (14,972,391 | ) | | | (22,060,299 | ) |
| | | | | | | | | | | | | | | | | | | | | | | | | |
| Net Assets | | | | | | | | | | | | | | | | | | | | | | | | |
| Beginning of Period | | | 113,561,180 | | | | 125,965,987 | | | | 66,746,279 | | | | 90,169,858 | | | | 60,614,432 | | | | 82,674,731 | |
| End of Period | | $ | 135,488,876 | | | $ | 113,561,180 | | | $ | 62,396,161 | | | $ | 66,746,279 | | | $ | 45,642,041 | | | $ | 60,614,432 | |
Accumulated Net
Investment Income (Loss) | | $ | (764,749 | ) | | $ | 32,300 | | | $ | (520,624 | ) | | $ | (12 | ) | | $ | (466,899 | ) | | $ | — | |
| | | | | | | | | | | | | | | | | | | | | | | | | |
| Share Transaction: | | | | | | | | | | | | | | | | | | | | | | | | |
| Number of Shares Issued | | | 370,516 | | | | 149,747 | | | | 157,485 | | | | 513,281 | | | | 180,197 | | | | 1,170,618 | |
| Number of Shares Reinvested | | | 93,402 | | | | 257,922 | | | | — | | | | 2,685 | | | | — | | | | — | |
| Number of Shares Redeemed | | | (398,014 | ) | | | (877,473 | ) | | | (941,655 | ) | | | (2,713,361 | ) | | | (1,770,096 | ) | | | (3,548,660 | ) |
| Change in Shares | | | 65,904 | | | | (469,804 | ) | | | (784,170 | ) | | | (2,197,395 | ) | | | (1,589,899 | ) | | | (2,378,042 | ) |
See accompanying notes to financial statements.
Needham Growth Fund
Financial Highlights
| | | Six Months | | | | | | | | | | | | | | | | |
| | | Ended June 30, | | | | |
| (For a Share Outstanding | | 2013 | | | Year Ended December 31, |
| Throughout each Period) | | (Unaudited) | | | 2012 | | | 2011 | | | 2010 | | | 2009 | | | 2008 | |
| Net Asset Value, Beginning of Period | | $ | 33.66 | | | $ | 32.78 | | | $ | 39.11 | | | $ | 29.77 | | | $ | 20.27 | | | $ | 36.05 | |
| Investment Operations | | | | | | | | | | | | | | | | | | | | | | | | |
| Net Investment Loss | | | (0.23 | ) | | | (0.24 | ) | | | (0.58 | ) | | | (0.60 | ) | | | (0.43 | ) | | | (0.45 | ) |
Net Realized and Unrealized Gain (Loss) on Investments | | | 5.96 | | | | 4.31 | | | | (3.79 | ) | | | 9.94 | | | | 9.93 | | | | (14.10 | ) |
| Total from Investment Operations | | | 5.73 | | | | 4.07 | | | | (4.37 | ) | | | 9.34 | | | | 9.50 | | | | (14.55 | ) |
| | | | | | | | | | | | | | | | | | | | | | | | | |
| Less Distributions | | | | | | | | | | | | | | | | | | | | | | | | |
| Net Realized Gains | | | — | | | | (3.19 | ) | | | (1.97 | ) | | | — | | | | — | | | | (1.23 | ) |
| Total Distributions | | | — | | | | (3.19 | ) | | | (1.97 | ) | | | — | | | | — | | | | (1.23 | ) |
| | | | | | | | | | | | | | | | | | | | | | | | | |
| Capital Contributions | | | | | | | | | | | | | | | | | | | | | | | | |
| Redemption Fees | | | — | (a) | | | — | (a) | | | 0.01 | | | | — | (a) | | | — | (a) | | | — | |
| Total Capital Contributions | | | — | (a) | | | — | (a) | | | 0.01 | | | | — | (a) | | | — | (a) | | | — | |
| Net Asset Value, End of Period | | $ | 39.39 | | | $ | 33.66 | | | $ | 32.78 | | | $ | 39.11 | | | $ | 29.77 | | | $ | 20.27 | |
| | | | | | | | | | | | | | | | | | | | | | | | | |
| Total Return | | | 17.02 | % | | | 12.80 | % | | | (10.94 | )% | | | 31.37 | % | | | 46.87 | % | | | (40.41 | )% |
| Net Assets, End of Period (000’s) | | $ | 135,489 | | | $ | 113,561 | | | $ | 125,966 | | | $ | 159,805 | | | $ | 119,175 | | | $ | 92,818 | |
| Ratios/Supplemental Data | | | | | | | | | | | | | | | | | | | | | | | | |
Ratio of Total Expenses to Average Net Assets | | | 1.88 | % | | | 1.94 | % | | | 1.81 | % | | | 2.11 | % | | | 2.03 | % | | | 2.04 | % |
Ratio of Total Expenses to Average Net Assets (before interest and dividend expense) | | | 1.83 | % | | | 1.82 | % | | | 1.78 | % | | | 2.00 | % | | | 2.00 | % | | | 2.03 | % |
Ratio of Total Expenses to Average Net Assets (before waiver and reimbursement of expenses) | | | 1.88 | % | | | 1.94 | % | | | 1.81 | % | | | 2.11 | % | | | 2.08 | % | | | 2.04 | % |
Ratio of Net Investment Loss to Average Net Assets | | | (1.29 | )% | | | (0.65 | )% | | | (1.41 | )% | | | (1.85 | )% | | | (1.71 | )% | | | (1.37 | )% |
Ratio of Net Investment Loss to Average Net Assets (before waivers and reimbursements of expenses) | | | (1.29 | )% | | | (0.65 | )% | | | (1.41 | )% | | | (1.85 | )% | | | (1.76 | )% | | | (1.37 | )% |
| Portfolio turnover rate | | | 4 | % | | | 17 | % | | | 29 | % | | | 62 | % | | | 29 | % | | | 41 | % |
| (a) | Value is less than $0.005 per share. |
See accompanying notes to financial statements.
Needham Aggressive Growth Fund
Financial Highlights
| | | Six Months | | | | | | | | | | | | | | | | |
| | | Ended June 30, | | | | |
| (For a Share Outstanding | | 2013 | | | Year Ended December 31, |
| Throughout each Period) | | (Unaudited) | | | 2012 | | | 2011 | | | 2010 | | | 2009 | | | 2008 | |
| Net Asset Value, Beginning of Period | | $ | 16.63 | | | $ | 14.52 | | | $ | 17.14 | | | $ | 12.38 | | | $ | 9.45 | | | $ | 14.14 | |
| Investment Operations | | | | | | | | | | | | | | | | | | | | | | | | |
| Net Investment Loss | | | (0.16 | ) | | | (0.29 | ) | | | (0.34 | ) | | | (0.11 | ) | | | (0.19 | ) | | | (0.26 | ) |
Net Realized and Unrealized Gain (Loss) on Investments | | | 2.85 | | | | 2.41 | | | | (2.04 | ) | | | 4.98 | | | | 3.13 | | | | (3.65 | ) |
| Total from Investment Operations | | | 2.69 | | | | 2.12 | | | | (2.38 | ) | | | 4.87 | | | | 2.94 | | | | (3.91 | ) |
| | | | | | | | | | | | | | | | | | | | | | | | | |
| Less Distributions | | | | | | | | | | | | | | | | | | | | | | | | |
| Net Realized Gains | | | — | | | | (0.01 | ) | | | (0.25 | ) | | | (0.11 | ) | | | (0.02 | ) | | | (0.78 | ) |
| Total Distributions | | | — | | | | (0.01 | ) | | | (0.25 | ) | | | (0.11 | ) | | | (0.02 | ) | | | (0.78 | ) |
| | | | | | | | | | | | | | | | | | | | | | | | | |
| Capital Contributions | | | | | | | | | | | | | | | | | | | | | | | | |
| Redemption Fees | | | — | (a) | | | — | (a) | | | 0.01 | | | | — | (a) | | | 0.01 | | | | — | |
| Total Capital Contributions | | | — | (a) | | | — | (a) | | | 0.01 | | | | — | (a) | | | 0.01 | | | | — | |
| Net Asset Value, End of Period | | $ | 19.32 | | | $ | 16.63 | | | $ | 14.52 | | | $ | 17.14 | | | $ | 12.38 | | | $ | 9.45 | |
| | | | | | | | | | | | | | | | | | | | | | | | | |
| Total Return | | | 16.18 | % | | | 14.61 | % | | | (13.77 | )% | | | 39.42 | % | | | 31.18 | % | | | (27.60 | )% |
| Net Assets, End of Period (000’s) | | $ | 62,396 | | | $ | 66,746 | | | $ | 90,170 | | | $ | 106,551 | | | $ | 22,819 | | | $ | 10,202 | |
| Ratios/Supplemental Data | | | | | | | | | | | | | | | | | | | | | | | | |
Ratio of Total Expenses to Average Net Assets | | | 1.99 | % | | | 2.06 | % | | | 1.83 | % | | | 2.09 | % | | | 2.50 | % | | | 2.51 | % |
Ratio of Total Expenses to Average Net Assets (before interest and dividend expense) | | | 1.92 | % | | | 1.89 | % | | | 1.80 | % | | | 2.05 | % | | | 2.49 | % | | | 2.50 | % |
Ratio of Total Expenses to Average Net Assets (before waiver and reimbursement of expenses) | | | 1.99 | % | | | 2.06 | % | | | 1.83 | % | | | 2.09 | % | | | 2.50 | % | | | 2.63 | % |
Ratio of Net Investment Loss to Average Net Assets | | | (1.66 | )% | | | (1.40 | )% | | | (1.62 | )% | | | (1.77 | )% | | | (2.39 | )% | | | (2.04 | )% |
Ratio of Net Investment Loss to Average Net Assets (before waivers and reimbursements of expenses) | | | (1.66 | )% | | | (1.40 | )% | | | (1.62 | )% | | | (1.77 | )% | | | (2.39 | )% | | | (2.15 | )% |
| Portfolio turnover rate | | | 6 | % | | | 15 | % | | | 45 | % | | | 55 | % | | | 70 | % | | | 45 | % |
| (a) | Value is less than $0.005 per share. |
See accompanying notes to financial statements.
Needham Small Cap Growth Fund
Financial Highlights
| | | Six Months | | | | | | | | | | | | | | | | |
| | | Ended June 30, | | | Year Ended December 31, | |
| (For a Share Outstanding | | 2013 | | | | | | | | | | | | | | | | |
| Throughout each Period) | | (Unaudited) | | | 2012 | | | 2011 | | | 2010 | | | 2009 | | | 2008 | |
| Net Asset Value, Beginning of Period | | $ | 12.22 | | | $ | 11.26 | | | $ | 14.21 | | | $ | 10.73 | | | $ | 7.61 | | | $ | 11.29 | |
| Investment Operations | | | | | | | | | | | | | | | | | | | | | | | | |
| Net Investment Loss | | | (0.14 | ) | | | (0.15 | ) | | | (0.27 | ) | | | (0.08 | ) | | | (0.20 | ) | | | (0.19 | ) |
Net Realized and Unrealized Gain (Loss) on Investments | | | 1.46 | | | | 1.11 | | | | (2.04 | ) | | | 3.99 | | | | 3.33 | | | | (2.49 | ) |
| Total from Investment Operations | | | 1.32 | | | | 0.96 | | | | (2.31 | ) | | | 3.91 | | | | 3.13 | | | | (2.68 | ) |
| | | | | | | | | | | | | | | | | | | | | | | | | |
| Less Distributions | | | | | | | | | | | | | | | | | | | | | | | | |
| Net Realized Gains | | | — | | | | — | | | | (0.62 | ) | | | (0.43 | ) | | | (0.01 | ) | | | (0.82 | ) |
| Return of Capital | | | — | | | | — | | | | (0.02 | ) | | | — | | | | — | | | | (0.18 | ) |
| Total Distributions | | | — | | | | — | | | | (0.64 | ) | | | (0.43 | ) | | | (0.01 | ) | | | (1.00 | ) |
| | | | | | | | | | | | | | | | | | | | | | | | | |
| Capital Contributions | | | | | | | | | | | | | | | | | | | | | | | | |
| Redemption Fees | | | — | (a) | | | — | (a) | | | — | (a) | | | — | (a) | | | — | (a) | | | — | |
| Total Capital Contributions | | | — | (a) | | | — | (a) | | | — | (a) | | | — | (a) | | | — | (a) | | | — | |
| Net Asset Value, End of Period | | $ | 13.54 | | | $ | 12.22 | | | $ | 11.26 | | | $ | 14.21 | | | $ | 10.73 | | | $ | 7.61 | |
| | | | | | | | | | | | | | | | | | | | | | | | | |
| Total Return | | | 10.80 | % | | | 8.53 | % | | | (16.10 | )% | | | 36.89 | % | | | 41.18 | % | | | (23.42 | )% |
| Net Assets, End of Period (000’s) | | $ | 45,642 | | | $ | 60,614 | | | $ | 82,675 | | | $ | 98,911 | | | $ | 11,303 | | | $ | 5,309 | |
| Ratios/Supplemental Data | | | | | | | | | | | | | | | | | | | | | | | | |
Ratio of Total Expenses to Average Net Assets | | | 2.04 | % | | | 2.04 | % | | | 1.84 | % | | | 2.16 | % | | | 2.57 | % | | | 2.51 | % |
Ratio of Total Expenses to Average Net Assets (before interest and dividend expense) | | | 1.97 | % | | | 1.92 | % | | | 1.81 | % | | | 2.08 | % | | | 2.50 | % | | | 2.50 | % |
Ratio of Total Expenses to Average Net Assets (before waiver and reimbursement of expenses) | | | 2.05 | % | | | 2.04 | % | | | 1.84 | % | | | 2.16 | % | | | 3.02 | % | | | 3.57 | % |
Ratio of Net Investment Loss to Average Net Assets | | | (1.81 | )% | | | (1.02 | )% | | | (1.57 | )% | | | (1.88 | )% | | | (2.50 | )% | | | (2.02 | )% |
Ratio of Net Investment Loss to Average Net Assets (before waivers and reimbursements of expenses) | | | (1.81 | )% | | | (1.02 | )% | | | (1.57 | )% | | | (1.88 | )% | | | (2.95 | )% | | | (3.09 | )% |
| Portfolio turnover rate | | | 18 | % | | | 72 | % | | | 105 | % | | | 65 | % | | | 154 | % | | | 219 | % |
| (a) | Value is less than $0.005 per share. |
See accompanying notes to financial statements.
Notes to Financial Statements (Unaudited)
Needham Growth Fund (‘‘NGF’’), Needham Aggressive Growth Fund (‘‘NAGF’’) and Needham Small Cap Growth Fund (‘‘NSCGF’’) (each, a ‘‘Portfolio’’ and collectively, the ‘‘Portfolios’’), are portfolios of The Needham Funds, Inc. (the ‘‘Company’’), which is registered under the Investment Company Act of 1940, as amended (the ‘‘1940 Act’’), as a diversified, open-end management investment company. The Company was organized as a Maryland corporation on October 12, 1995.
| 2. | Significant Accounting Policies |
Security Valuation: Portfolio securities for which market quotations are readily available are stated at the last sale price reported by the principal exchange for the security as of the exchange’s close of business. Securities for which no sale has taken place during the day and securities which are not listed on an exchange are valued at the mean of the highest closing bid and lowest asked prices. Exchange traded options are valued at the last reported sale price on any exchange on which the option is principally traded. If no sales are reported on a particular day, the options will be valued at the mean between the highest closing bid and lowest asked prices across the exchanges where the option is traded. Non-exchange traded options will also be valued at the mean between the last bid and asked quotations. For options where market quotations are not readily available, value will be determined in accordance with the fair value procedures described below. All other securities and assets for which (a) market quotations are not readily available, such as in the case of a market or technical disruption that prevents the normal trading of a security held by a Portfolio, (b) market quotations are believed to be unrepresentative of fair market value, such as in the case of a thinly traded security, or (c) valuation is normally made at the last sale price on a foreign exchange and a significant event occurs after the close of that exchange but before the New York Stock Exchange close, are valued at their fair value as determined in good faith by the Board of Directors (the ‘‘Board’’) in accordance with Fair Value Procedures established by the Board. The Company’s Fair Value Procedures are implemented and monitored by a Fair Value Committee (the ‘‘Committee’’) designated by the Board. When a security is valued in accordance with the Fair Value Procedures, the Committee determines a value after taking into consideration any relevant information that is reasonably available to the Committee. Some of the more common reasons that may necessitate that a security be valued pursuant to these Fair Value Procedures include, but are not limited to: the security’s trading has been halted or suspended; the security has been de-listed from a national exchange; the security’s primary trading market is temporarily closed at a time when under normal conditions it would be open; or the security’s primary pricing source is not able or willing to provide a price. The assets of each Portfolio may also be valued on the basis of valuations provided by a pricing service approved by, or on behalf of, the Board.
Portfolio securities listed or traded on securities exchanges, including American Depositary Receipts (‘‘ADRs’’), are valued at the closing price on the exchange or system where the security is principally traded or at the NASDAQ Official Closing Price. If there have been no sales for that day on the exchange or system, a security is valued at the mean of the highest closing bid and lowest asked prices on the exchange or system where the security is principally traded.
The Portfolios did not value any securities in accordance with the Fair Value Procedures as of June 30, 2013.
Investment Transactions: Changes in holdings of portfolio securities for the Portfolios shall be reflected no later than in the first calculation on the first business day following the trade date for purposes of calculating each Portfolio’s daily net asset value per share. However, for financial reporting purposes, portfolio security transactions are reported on the trade date of the last business day of the reporting period. The cost (proceeds) of investments sold (bought to cover) is determined on a specific identification basis for the purpose of determining gains or losses on sales and buys to cover short positions. Dividend income, distributions to shareholders and dividend expense from securities sold short are recorded on the ex-dividend date. Interest income and interest expense from securities sold short is recorded on an accrual basis.
Foreign Currency: Foreign currency amounts are translated into U.S. dollars as follows: (i) assets and liabilities at the rate of exchange at the end of the respective period; and (ii) purchases and sales of securities and income and expenses at the rate of exchange prevailing on the dates of such transactions. The portion of realized gains arising from changes in the exchange rates are included with the net realized and unrealized gain or loss on investments. Principal risks associated with such transactions include the movement in value of the foreign currency relative to the U.S. dollar and the ability of the counterparty to perform.
The Portfolios may also invest in forward currency contracts. Fluctuations in the value of such forward currency transactions are recorded daily as unrealized gain or loss; realized gain or loss includes net gain or loss on transactions that have terminated by settlement. These instruments involve securities and currency market risk, credit risk, or both kinds of risks, in excess of the amount recognized in the statements of assets and liabilities. Risks also arise from the possible inability of counterparties to meet the terms of their contracts. The Portfolios did not enter into forward currency contracts during the six months ended June 30, 2013.
Notes to Financial Statements (Unaudited) (Continued)
Allocation of Expenses: Expenses directly attributable to a Portfolio are charged directly to that Portfolio, while expenses which are attributable to more than one Portfolio are allocated among the respective Portfolios based upon relative net assets or some other reasonable method.
Use of Estimates: The preparation of financial statements in accordance with GAAP requires management to make estimates and assumptions that affect the reported amounts and disclosures in the financial statements. Actual results could differ from those estimates and those differences could be material.
Distributions to Shareholders: Dividends from net investment income, if any, are declared and paid annually for the Portfolios. Distributable net realized gains, if any, are declared and distributed at least annually.
Redemption Fees: The Portfolios reserve the right to assess a redemption fee for shares redeemed within 60 days of purchase. The shareholder will be charged a fee equal to 2.00% of the value of the shares redeemed. The redemption fee is intended to offset excess brokerage commissions and other costs associated with fluctuations in asset levels and cash flows caused by frequent trading by shareholders. The applicability of the redemption fee will be calculated using a first-in first-out method, which means the oldest shares will be redeemed first, followed by the redemption of more recently acquired shares. For the six months ended June 30, 2013, NGF, NAGF and NSCGF had contributions to capital due to redemption fees in the amounts of $1,672, $5,678 and $3,119, respectively.
Federal Income Taxes: It is the policy of each Portfolio to continue to qualify as a regulated investment company, as defined in the Internal Revenue Code, by complying with the provisions available to certain investment companies and to make distributions of net investment income and net realized capital gains sufficient to relieve it from all, or substantially all, federal income taxes. Accordingly, no provision for income taxes has been made in the Portfolios’ financial statements.
As of June 30, 2013, the Portfolios did not have any tax positions that did not meet the ‘‘more-likely-than-not’’ threshold of being sustained by the applicable tax authority. Generally, tax authorities can examine all the tax returns filed for the last three years.
Fair Value Measurements: Valuation inputs used to determine the value of the Portfolios’ investments are summarized in the three broad levels listed below:
| Level 1 — | quoted prices in active markets for identical assets. |
| | |
| Level 2 — | other significant inputs (including quoted prices of similar securities, interest rates, prepayment speeds, credit risk, etc.). |
| | |
| Level 3 — | significant unobservable inputs (which may include the Portfolios’ own assumptions in determining the fair value of investments). |
The inputs or methodology used to value securities are not necessarily an indication of the risk associated with investing in those securities.
Portfolio securities listed or traded on securities exchanges, including ADRs, are valued at the closing price on the exchange or system where the security is principally traded or at the NASDAQ Official Closing Price. If there have been no sales for that day on the exchange or system, a security is valued at the mean of the highest closing bid and lowest asked prices on the exchange or system where the security is principally traded. These valuations are typically categorized as Level 1 in the fair value hierarchy.
In accordance with procedures adopted by the Board, fair value pricing may be used if events materially affecting the value of foreign securities occur between the time the exchange on which they are traded closes and the time the Portfolios’ net asset values are calculated. These valuations are categorized as Level 2 in the fair value hierarchy. As of June 30, 2013, the Portfolios did not hold any level 2 securities.
The following is a summary categorization, as of June 30, 2013, of each Portfolio’s investments based on the level of inputs utilized in determining the value of such investments:
| | | LEVEL 1 - Quoted Prices(1)(3) | |
| | | NGF | | | NAGF | | | NSCGF | |
| Assets | | | | | | | | | |
Common Stocks(2) | | $ | 115,668,847 | | | $ | 61,712,163 | | | $ | 40,589,240 | |
| Short-Term Investments | | | 19,750,068 | | | | 407,918 | | | | 4,260,266 | |
| Liabilities | | | | | | | | | | | | |
Securities Sold Short(2) | | | (5,421,305 | ) | | | (3,842,615 | ) | | | (2,695,955 | ) |
| Total | | $ | 129,997,610 | | | $ | 58,277,466 | | | $ | 42,153,551 | |
| (1) | As of June 30, 2013, the Portfolios did not hold Level 2 or Level 3 investments. |
| | |
| (2) | Please refer to the Schedule of Investments to view segregation by industry. |
| | |
| (3) | There were no transfers into or out of Level 1 or Level 2 during the period. |
Notes to Financial Statements (Unaudited) (Continued)
| 3. | Derivative Instruments and Hedging Activities |
The ‘‘Derivatives and Hedging’’ Topic of the Codification (ASC 815, formerly SFAS 133 and SFAS 161) requires enhanced disclosures about the Portfolios’ derivative and hedging activities, including how such activities are accounted for and their effect on the Portfolios’ financial position, performance and cash flows. The Portfolios did not use derivatives during the six months ended June 30, 2013.
| Investment Advisory and Administrative Services |
The Company has engaged Needham Investment Management L.L.C. (the ‘‘Adviser’’) to manage its investments. The Company pays the Adviser a fee at the annual rate of 1.25% of the average daily net assets of each Portfolio.
The Adviser has entered into agreements with the Portfolios whereby the Adviser has contractually agreed to waive its fee for, and to reimburse expenses (excluding interest, dividends on short positions, acquired fund fees and expenses and extraordinary items) of NGF, NAGF and NSCGF in an amount that limits annual operating expenses to not more than 1.95% of the average daily net assets. The agreement is effective for the period from May 1, 2013 through April 30, 2014. The agreement shall continue in effect from year to year thereafter only upon mutual agreement of the respective Portfolio and the Adviser.
The Company and U.S. Bancorp Fund Services, LLC (the ‘‘Administrator’’) are parties to a Fund Administration Servicing Agreement. The Administrator provides administrative and fund accounting services pursuant to this agreement and, in consideration of these services, receives a fee computed daily and paid monthly at an annual rate based on a percentage of the value of the Company’s assets. The Administrator is also compensated for any out of pocket expenses that are reasonably incurred by the Administrator in carrying out its duties under the Administration Agreement. The Administrator also provides transfer agent services pursuant to a Transfer Agent Servicing Agreement for additional fees.
Certain officers of the Company are also officers of the Adviser and/or Needham & Company, LLC (the ‘‘Distributor’’). Such officers receive no fees from the Company for serving as officers of the Company. Each of the three Directors who is not an ‘‘interested person’’ (as defined in the 1940 Act) of the Company (each, an Independent Director) receives a quarterly retainer of $3,000 and a per-meeting fee of $500. Each Independent Director is also a member of the Audit Committee of the Company’s Board of Directors and receives a fee of $500 per meeting attended. The Adviser provides an employee to serve as Chief Compliance Officer for the Company and to provide certain related services. An affiliate of the Adviser, Needham & Company, LLC, pays the Chief Compliance Officer’s compensation and the Company reimburses this affiliate for the Company’s portion of the expense.
The Company has adopted an Amended and Restated Plan of Distribution pursuant to Rule 12b-1 under the 1940 Act. Under the Plan, each Portfolio pays the Distributor, and any other distributor or financial institution with which the Company has an agreement with respect to each Portfolio, a fee at an annual rate of 0.25% of each Portfolio’s daily average net assets. For the six months ended June 30, 2013, NGF, NAGF and NSCGF paid 12b-1 fees to the Distributor in the amount of $153,922, $78,237, and $64,400, respectively.
During the six months ended June 30, 2013, NGF, NAGF and NSCGF incurred and paid brokerage commissions to the Distributor in the amount of $15,203, $6,239, and $22,645, respectively.
Each Portfolio may borrow from banks up to 25% of its total assets and may pledge its assets in connection with these borrowings, provided that no additional investments shall be made while borrowings exceed 5% of total assets.
The Portfolios did not engage in any temporary borrowings during the six months ended June 30, 2013.
During the six months ended June 30, 2013, each Portfolio sold securities short. Upon selling a security short, the Portfolios record an asset for the settlement amount and a corresponding liability, which is marked-to-market to reflect current value. Certain securities owned by each respective Portfolio are segregated as collateral while the short sales are outstanding. At June 30, 2013, the market value of securities separately segregated to cover short positions was $6,483,100, $4,419,830, and $6,265,750 for NGF, NAGF and NSCGF, respectively.
Additionally, the Portfolios had receivables for Deposit with Broker for Securities Sold Short of $5,545,736, $3,793,624, and $3,044,981 pledged as collateral with brokers in connection with open short positions for NGF, NAGF and NSCGF, respectively. Securities sold short at June 30, 2013 and their related market values and proceeds are set forth in the preceding Schedule of Securities Sold Short for each Portfolio.
Notes to Financial Statements (Unaudited) (Continued)
8. | Investment Transactions |
The following summarizes the aggregate amount of the cost of purchases and proceeds from sales of investment securities and securities sold short, excluding short-term securities, during the six months ended June 30, 2013:
| | | Purchases | | | Sales | |
| NGF | | $ | 4,779,075 | | | $ | 14,173,399 | |
| NAGF | | | 4,063,276 | | | | 17,783,910 | |
| NSCGF | | | 8,163,994 | | | | 26,647,647 | |
There were no purchases or sales of U.S. Government Securities during the six months ended June 30, 2013.
| 9. | Financial Instruments With Off-Balance Sheet Risk |
In the normal course of their business, the Portfolios may trade various financial instruments with off-balance sheet risk. These financial instruments include securities sold short, written options, futures, and forward currency contracts. Generally, these financial instruments represent future commitments to purchase or sell other financial instruments at specific terms at specified future dates. Each of these financial instruments contains varying degrees of off-balance sheet risk whereby changes in the market values of the securities underlying the financial instruments may be in excess of the amounts recognized in the financial statements.
Securities sold short represent obligations of the Portfolios to make future delivery of specific securities and, correspondingly, create an obligation to purchase the securities at market prices prevailing at a later delivery date (or to deliver the securities if already owned by the Portfolios). As a result, short sales create the risk that the Portfolios’ ultimate obligation to satisfy the delivery requirements may exceed the amount of the proceeds initially received on the liability recorded in the financial statements.
Under the Company’s organizational documents, its Directors and officers are indemnified against certain liabilities arising out of the performance of their duties to the Company. In addition, in the ordinary course of business, the Company enters into contracts that contain a variety of indemnifications. The Company’s maximum exposure under these arrangements is unknown. However, the Company has not had prior claims or losses pursuant to these contracts and expects the risk of loss to be remote.
No provision for federal income taxes is required since the Company intends to continue to qualify as a regulated investment company under Subchapter M of the Internal Revenue Code and distribute substantially all of its taxable income and capital gains to shareholders. Because income tax regulations differ from GAAP, the timing and character of income and capital gain distributions determined in accordance with tax regulations can differ from income and capital gains recognized for financial reporting purposes. Accordingly, the character of distributions and the composition of net assets for tax purposes can differ from those reflected in the financial statements. These book/tax differences may be temporary or permanent in nature. Temporary differences are generally due to differing book and tax treatment for the timing of the recognition of gains and losses on securities, including post-October losses (as described below). Permanent differences are generally due to differing treatment of net investment losses. To the extent these differences are permanent, they are charged or credited to paid-in capital, accumulated net realized gain (loss), or accumulated net investment income (loss), as appropriate, in the period in which the differences arise. These reclassifications have no effect on net assets or net asset value per share of each Portfolio.
As of December 31, 2012, the cost, gross unrealized appreciation, gross unrealized depreciation, and the net unrealized appreciation (depreciation) on securities, including proceeds from securities sold short for federal income tax purposes, were as follows:*
| | | | | | | | | | | | Net | |
| | | | | | Gross | | | Gross | | | Unrealized | |
| | | | | | Unrealized | | | Unrealized | | | Appreciation | |
| | | Cost | | | Appreciation | | | Depreciation | | | (depreciation) | |
| NGF | | $ | 81,028,401 | | | $ | 41,016,321 | | | $ | (6,888,932 | ) | | $ | 34,127,389 | |
| NAGF | | | 51,835,589 | | | | 20,490,128 | | | | (5,550,611 | ) | | | 14,939,517 | |
| NSCGF | | | 66,312,787 | | | | 3,574,636 | | | | (9,730,705 | ) | | | (6,156,069 | ) |
| * | Tax adjustments are calculated annually and therefore, the table above does not reflect tax adjustments. For the previous fiscal year’s federal income tax information, please refer to the Notes to Financial Statements in the Company’s most recent semiannual or annual shareholder report. |
The difference between the tax cost of investments and the cost of investments for GAAP purposes is primarily due to the tax treatment for wash sale losses.
As of December 31, 2012, the components of distributable earnings (loss) on a tax basis were as follows:
| | | NGF | | | NAGF | | | NSCGF | |
Undistributed ordinary income | | $ | — | | | $ | — | | | $ | — | |
Undistributed long-term capital gains | | | — | | | | — | | | | — | |
Unrealized appreciation (depreciation) | | | 34,127,389 | | | | 14,939,517 | | | | (6,156,069 | ) |
Total accumulated earnings (loss) | | $ | 34,127,389 | | | $ | 14,939,517 | | | $ | (6,156,069 | ) |
Notes to Financial Statements (Unaudited) (Continued)
The tax character of distributions paid during the year ended December 31, 2012 was as follows:
| | | NGF | | | NAGF | | | NSCGF | |
| Ordinary income | | $ | — | | | $ | — | | | $ | — | |
Net long-term capital gains | | | 10,206,783 | | | | 42,591 | | | | — | |
| Return of capital | | | — | | | | 38 | | | | — | |
| Total distributions paid | | $ | 10,206,783 | | | $ | 42,629 | | | $ | — | |
Under current tax law, capital and currency losses realized after October 31 of a Portfolio’s fiscal year may be deferred and treated as occurring on the first business day of the following fiscal year for tax purposes. The following Portfolios had deferred post-October capital and currency losses, which will be treated as arising on the first business day of the fiscal year ending December 31, 2013.
| | | | | |
| NGF | | $ | 55,077 | |
| NAGF | | | — | |
| NSCGF | | | 222,207 | |
As of December 31, 2012 the Funds had post-December late year losses of:
As of December 31, 2012 the Funds had accumulated capital loss carryovers of:
| | | Capital | | | | | | | |
| | | Loss | | | | | | | |
| | | Carryover | | | Term | | | Expires | |
| NGF | | $ | — | | | | — | | | | — | |
| | | | | | | Short | | | | | |
| NAGF | | | (7,026,204 | ) | | Term | | | Unlimited | |
| | | | | | | Long | | | | | |
| NAGF | | | (58,742 | ) | | Term | | | Unlimited | |
| NSCGF | | | — | | | | — | | | | — | |
The Regulated Investment Company Modernization Act of 2010 (the ‘‘Act’’) was enacted on December 22, 2010. The Act made changes to several tax rules impacting the Portfolios. In general, the provisions of the Act were effective for the Company’s fiscal year ending December 31, 2012. Although the Act provides several benefits, including the unlimited carryover of future capital losses, there may be a greater likelihood that all or a portion of each Portfolio’s pre-enactment capital loss carryovers may expire without being utilized due to the fact that post-enactment capital losses get utilized before pre-enactment capital loss carryovers.
The Act also changed the definition of post-October capital losses eligible for elective deferral to the greatest of a Regulated Investment Company’s (‘‘RIC’s’’) net capital loss attributable to the portion of the RIC’s taxable year after October 31, the RIC’s net long-term capital loss attributable to the portion of the RIC’s taxable year after October 31, or the RIC’s net short-term capital loss attributable to the portion of the RIC’s taxable year after October 31. As such, any post-October capital loss which a RIC has elected to defer is deemed to arise on the first day of the RIC’s following taxable year. The aggregate amount of the RIC’s anticipated deferred post-October capital losses would be included in the RIC’s tax basis accumulated loss carryforward, if applicable.
Management has evaluated subsequent events through the date of this filing. This evaluation did not result in any subsequent events that necessitated recognition or disclosures.
Supplementary Information (Unaudited)
June 30, 2013
Disclosure of Portfolio Holdings
The Company files a Form N-Q with the Securities and Exchange Commission (the ‘‘SEC’’) no more than sixty days after the Company’s first and third fiscal quarters. For the Company, this would be for the fiscal quarters ending March 31 and September 30. Form N-Q includes a complete schedule of the Company’s portfolio holdings as of the end of those fiscal quarters. The Company’s N-Q filings can be found free of charge on the SEC’s website at http://www.sec.gov, or they may be reviewed and copied at the SEC’s Public Reference Room in Washington, D.C. (call 800-SEC-0330 for information on the operation of the Public Reference Room).
Voting Proxies on Company Portfolio Securities
A description of the policies and procedures that the Company uses to determine how to vote proxies relating to portfolio securities and information regarding how the Company voted proxies relating to portfolio securities during the most recent 12-month period ended June 30 are available without charge, upon request, by calling 800-625-7071 or on the SEC’s website at http://www.sec.gov.

Item 2. Code of Ethics.
Not applicable for semi-annual reports.
Item 3. Audit Committee Financial Expert.
Not applicable for semi-annual reports.
Item 4. Principal Accountant Fees and Services.
Not applicable for semi-annual reports.
Item 5. Audit Committee of Listed Registrants.
Not applicable to registrants who are not listed issuers (as defined in Rule 10A-3 under the Securities Exchange Act of 1934).
Item 6. Investments.
| (a) | Schedule of Investments is included as part of the report to shareholders filed under Item 1 of this Form. |
Item 7. Disclosure of Proxy Voting Policies and Procedures for Closed-End Management Investment Companies.
Not applicable to open-end investment companies.
Item 8. Portfolio Managers of Closed-End Management Investment Companies.
Not applicable to open-end investment companies.
Item 9. Purchases of Equity Securities by Closed-End Management Investment Company and Affiliated Purchasers.
Not applicable to open-end investment companies.
Item 10. Submission of Matters to a Vote of Security Holders.
Not Applicable.
Item 11. Controls and Procedures.
| (a) | The Registrant’s Chief Executive Officer and Chief Financial Officer have reviewed the Registrant's disclosure controls and procedures (as defined in Rule 30a-3(c) under the Investment Company Act of 1940 (the “Act”)) as of a date within 90 days of the filing of this report, as required by Rule 30a-3(b) under the Act and Rules 13a-15(b) or 15d-15(b) under the Securities Exchange Act of 1934. Based on their review, such officers have concluded that the disclosure controls and procedures are effective in ensuring that information required to be disclosed in this report is appropriately recorded, processed, summarized and reported and made known to them by others within the Registrant and by the Registrant’s service provider. |
| (b) | There were no changes in the Registrant's internal control over financial reporting (as defined in Rule 30a-3(d) under the Act) that occurred during the Registrant’s first fiscal half-year of the period covered by this report that has materially affected, or is reasonably likely to materially affect, the Registrant's internal control over financial reporting. |
Item 12. Exhibits.
| (a) | (1) Any code of ethics or amendment thereto, that is the subject of the disclosure required by Item 2, to the extent that the registrant intends to satisfy Item 2 requirements through filing an exhibit. Not applicable for semi-annual reports. |
(2) A separate certification for each principal executive and principal financial officer pursuant to Section 302 of the Sarbanes-Oxley Act of 2002. Filed herewith.
(3) Any written solicitation to purchase securities under Rule 23c-1 under the Act sent or given during the period covered by the report by or on behalf of the registrant to 10 or more persons. Not applicable to open-end investment companies.
| (b) | Certifications pursuant to Section 906 of the Sarbanes-Oxley Act of 2002. Furnished herewith. |
SIGNATURES
Pursuant to the requirements of the Securities Exchange Act of 1934 and the Investment Company Act of 1940, the registrant has duly caused this report to be signed on its behalf by the undersigned, thereunto duly authorized.
(Registrant) The Needham Funds, Inc.
By (Signature and Title) /s/ George A. Needham
George A. Needham, President (Chief Executive Officer)
Date 9/5/2013
Pursuant to the requirements of the Securities Exchange Act of 1934 and the Investment Company Act of 1940, this report has been signed below by the following persons on behalf of the registrant and in the capacities and on the dates indicated.
By (Signature and Title) /s/ George A. Needham
George A. Needham, President (Chief Executive Officer)
Date 9/5/2013
By (Signature and Title) /s/ James W. Giangrasso
James W. Giangrasso, Treasurer and Secretary (Chief Financial Officer)
Date 9/5/2013