As filed with the Securities and Exchange Commission on September 8, 2014
UNITED STATES
SECURITIES AND EXCHANGE COMMISSION
Washington, D.C. 20549
FORM N-CSR
CERTIFIED SHAREHOLDER REPORT OF REGISTERED
MANAGEMENT INVESTMENT COMPANIES
Investment Company Act file number 811-09114
The Needham Funds, Inc.
(Exact name of registrant as specified in charter)
445 Park Avenue, New York, NY 10022-2606
(Address of principal executive offices) (Zip code)
Mr. George A. Needham, 445 Park Avenue, New York, NY 10022-2606
(Name and address of agent for service)
1-800-625-7071
Registrant's telephone number, including area code
Date of fiscal year end: December 31, 2014
Date of reporting period: June 30, 2014
Item 1. Reports to Stockholders.

| 445 Park Avenue | |
| New York, New York 10022-2606 | |
| | |
| 1-800-625-7071 | |
www.needhamfunds.com | |
| Semi-Annual Report | |
| June 30, 2014 | |
| | |
| Contents | |
| | |
| Letter from the Adviser | 1 |
| | |
| Portfolio Characteristics | |
| Needham Growth Fund | 6 |
| Needham Aggressive Growth Fund | 7 |
| Needham Small Cap Growth Fund | 8 |
| Disclosure of Fund Expenses | 9 |
| | |
| Schedule of Investments | |
| Needham Growth Fund | 10 |
| Needham Aggressive Growth Fund | 13 |
| Needham Small Cap Growth Fund | 16 |
| | |
| Schedule of Securities Sold Short | |
| Needham Growth Fund | 12 |
| Needham Aggressive Growth Fund | 15 |
| Needham Small Cap Growth Fund | 18 |
| | |
| Statements of Assets and Liabilities | 19 |
| | |
| Statements of Operations | 20 |
| | |
| Statements of Changes in Net Assets | 21 |
| | |
| Financial Highlights | |
| Needham Growth Fund | 22 |
| Needham Aggressive Growth Fund | 23 |
| Needham Small Cap Growth Fund | 24 |
| | |
| Notes to Financial Statements | 25 |
| | |
| Supplementary Information | 30 |
This report is authorized for distribution to prospective investors only when preceded or accompanied by a current prospectus. The prospectus contains more complete information, including investment objectives, risks, expenses and charges and should be read carefully before investing or sending any money. To obtain a prospectus, please call 1-800-625-7071.
Portfolios of The Needham Funds, Inc., like all mutual funds:
| | | |
| | ● | Are NOT FDIC insured |
| | ● | Have no bank guarantee |
| | ● | May lose value |
The Needham Funds, Inc. are distributed by Needham & Company, LLC.
| | |
| Needham Funds | Semi-Annual Report 2014 |
| 445 Park Avenue |
| New York, NY 10022 |
| (800) 625-7071 |
| www.needhamfunds.com |
August 2014
Dear Shareholders, Friends of Needham and Prospective Shareholders,
We are pleased to report results for the second quarter and for the half-year ending June 30, 2014 for the Needham Growth Fund, Needham Aggressive Growth Fund and Needham Small Cap Growth Fund. Our mission is to create wealth for long-term investors.
Needham Funds’ Second Quarter and Semiannual Review
In the second quarter, the Needham Growth Fund (NEEGX) returned 3.1%, the Needham Aggressive Growth Fund (NEAGX) returned 5.1%, and the Needham Small Cap Growth Fund (NESGX) returned 0.3%. The Russell 2000 Total Return Index returned 2.1%, the S&P 500 Total Return Index returned 5.2% and the NASDAQ Composite returned 5.3%.
For the half-year, the Needham Growth Fund (NEEGX) returned 4.0%, the Needham Aggressive Growth Fund (NEAGX) returned 2.3%, and the Needham Small Cap Growth Fund (NESGX) was down 1.5%. The Russell 2000 Total Return Index returned 3.2%, the S&P 500 Total Return Index returned 7.1%, and the NASDAQ Composite returned 6.2%.
The Funds outperformed in January as our more valuation-sensitive growth holdings were not hit as hard as the broader markets. In February, the Funds had positive returns, but trailed the averages, which were led by defensive sectors, including utilities, telecommunications services, food & beverage, tobacco, real estate and energy. March and April were difficult months for the Funds and small-cap stocks as the economic weakness of the first quarter became known. May brought stabilization and June was very good for the markets with outperformance by the Needham Funds.
We Continue to See Opportunities for Growth Equities
Monetary policy remains accommodative and we continue to find opportunities. In her semiannual report, Janet Yellen wrote, “A high degree of monetary accommodation remains appropriate… Too many Americans remain unemployed… Inflation remains below our longer-run objective.” On the other hand, by October the Federal Reserve will complete its Quantitative Easing program of buying Treasuries and mortgage-backed securities. We believe they will continue to find ways to keep policy accommodative.
In September, European Central Bank President Draghi will initiate a program of negative interest rates and $1 trillion of cheap loans for European banks. Japan’s Prime Minister Abe and the Japan Central Bank President Kuroda are driven to depreciate the yen using all types of monetary tools. These central bank policies should be positive for equities.
First quarter United States GDP came in at a weather-induced -2.1%. Second quarter growth is estimated at 4.0%. This first half makes it likely the U.S. economy will grow at approximately 2% for the year; 2% growth supports the Federal Reserve’s continued accommodative monetary policies.
During the second quarter, we added new positions to the Funds, including iRobot Corporation (IRBT), Aruba Networks, Inc. (ARUN), Discovery Communications, Inc. Class A (DISCA), LifeTime Fitness, Inc. (LTM), World Wrestling Entertainment, Inc. Class A (WWE) and Bruker Corporation (BRKR).
Small caps contract in 2014. 2013 was a robust year for small-cap stocks. In the first half of 2014, small-cap stocks have retreated; we think the pullback in January was a necessary correction as the excess valuations were reduced. (See our February 2014 letter and The Growth Factor Volume 10, “Are we in a bubble? We say no, but be careful out there.”)
While international developments are unsettling and the recent loss of life in the Middle East and the Ukraine is tragic, it must be put in perspective. The 1980s and 1990s were full of war in Eastern Europe, Africa, Asia and the Middle East. These conflicts are deeply rooted in the history of Europe and the Middle East; yet, economic development moves forward. Our job is to invest in companies that we believe can grow, despite the difficult backdrop.
In The Growth Factor Volume 16 we wrote about some WOW factor people, including Dr. Joep Lange, a leading AIDs researcher and humanitarian who was killed on Malaysia Air Flight 17.
There is a technological revolution underway. Opportunities abound with the transformation of media, content, the cloud, Software-as-a-Service, low power semiconductors, the Internet of Things, mobile communications, molecular diagnostics, gene sequencing, drug discovery, and healthcare delivery. We have three portfolios full of companies capitalizing on this revolution, including our leading contributors in the second quarter.
Leading Stocks Across The Needham Funds
For the second quarter and the half-year, two stocks held by all three funds were highlights. SuperMicro Computer, Inc. (SMCI) returned 45% for the quarter and 47% for the half-year. The company makes servers and storage systems used in cloud data centers by the leading Internet companies. They’ve also benefited from expanding margins, as they’ve filled their new Taiwan manufacturing and distribution center.
Form Factor, Inc. (FORM) returned 30% in the quarter and 38% for the half-year, as it rebounded from quality and logistics issues and benefited from supplying system-on-chip wafer probe cards to companies such as Intel Corp., Broadcom Corp. and QUALCOMM Inc. These customers design leading edge, low-power semiconductors used in laptop PCs and smartphones to extend battery life. In the future, they are likely to be leaders producing semiconductors for the Internet of Things.
During the quarter, we again benefited from M&A. The acquisition of Zygo Corp. (ZIGO) by AMETEK Inc. (AME) for a 31% premium was announced in April and closed in June. Zygo was a major contributor to all three Funds.
Most acquisitions in The Needham Funds are small-cap companies acquired by larger companies. However, in June, Medtronic, Inc. (MDT) announced it was acquiring Covidien Plc. (COV), a long-term holding of the Needham Growth Fund. Domiciled in Ireland, Covidien had a $40 billion market capitalization and Medtronic a $60 billion market cap. This merger is about creating scale, increasing access to cash in the U.S. and finally the tax inversion due to Covidien’s lower tax rate.
Other acquisitions that closed in the second quarter were ATMI, Inc. (ATMI) by Entegris, Inc. (ENTG), AZ Electronic Materials (AZEM-London) by Atlas-Copco AB (ATCO.A Sweden) and Supertex, Inc. (SUPX) by Microchip Technology Inc. (MCHP.) We believe the M&A thesis will continue throughout 2014.
The leading detractors for the second quarter and the half-year were Electro Scientific Industries, Inc. (ESIO), down 30% in the quarter and 34% for the half-year, and Emulex Corporation (ELX), down 23% for the quarter and 20% for the half-year.
Electro Scientific had a disappointing 2013 and first half of 2014, as revenue from its largest customer, Apple (AAPL), declined and it has yet to develop other customers for its laser cutting and marking systems. In February, ESI unexpectedly announced the resignation of Nick Konidaris and appointed board member Ed Grady as CEO. Mr. Grady’s mandate is to find new markets and customers for ESI’s micromachining laser systems.
At Emulex, Jeff Benck was promoted from COO to CEO in July 2013, and in January 2014, Kyle Westcoat joined as new CFO. Guidance for the June quarter was well below expectations. Emulex has struggled with a product transition toward growth from its newer Ethernet access cards as its fiber channel storage connectivity business has matured.
Needham Growth Fund
The Needham Growth Fund returned 3.1% in the second quarter and 4.0% year-to-date. Major contributors were SuperMicro, FormFactor and Gilead Sciences, Inc. (GILD), which returned 17%. Gilead posted strong results from its new hepatitis C drug, Sovaldi. We note that each of these winners contributed more than any of the detractors.
The leading detractor was Financial Engines, Inc. (FNGN), down 35% in the first half. Financial Engines serves as an independent advisor that uses technology and risk management models to allocate assets in retirement plans. The company started in the defined benefit market and now addresses the 401(k) retirement market, and in the future may address the IRA and Defined Contribution markets. With success in those markets, Financial Engines could be a much larger company.
Financial Engines had been a five-bagger since its 2010 initial public offering. It closed 2013 at $69.48 per share with an enterprise value/2014 estimated revenues of 11.3x. Financial Engines closed June 30 at $45.28 per share as its multiple contracted. It now trades at an EV/2014 estimated revenue of 5.9x. We believe that Financial Engine’s recurring revenue model and new market opportunities make it a good long-term holding, despite the still-high multiple.
Electro Scientific Industries, down 30% in the quarter and 34% year-to-date, and Emulex, down 23% in the quarter and 20% year-to-date, were also leading detractors. Both companies have had disappointing earnings and now have new management teams.
There were a few changes to the portfolio. We added Air Lease Corporation Class A (AL) in the first quarter and World Wrestling Entertainment, Inc. Class A (WWE) in the second quarter on its pullback. We also added to our position in KVH Industries, Inc. (KVHI), which we believe to be the Netflix of the commercial maritime industry; in the same way Netflix offers great subscription content over the internet, KVH’s IP-Mobilecast offers news and entertainment to ships at sea over its satellite network. We trimmed our position in Thermo Fisher Scientific, Inc. (TMO) to an 8.1% position as of June 30, from a 9.5% position as of March 31, 2014, as it reached our first price target.
The Needham Growth Fund closed the half-year with holdings of 51% large cap, 14% mid cap, and 35% small and micro-cap. The Fund had a 3% short position. While Morningstar categorizes the fund as Mid-Cap Growth, we view our mandate to make money through long-term holdings with as little risk as possible.
Needham Aggressive Growth Fund
The Needham Aggressive Growth Fund returned 5.1% in the second quarter and 2.3% year-to-date. The Fund finished in the top 1% of Morningstar’s ranking of Small Cap Growth funds for the second quarter.
Akamai Technologies, Inc. (AKAM) has returned 29% year-to-date and was the top contributor in the second quarter. Akamai reported strong content delivery and security revenue in the first quarter. Other leading contributors for the second quarter and half-year were the previously mentioned Gilead, Form Factor and SuperMicro Computers.
PDF Solutions, Inc. (PDFS) was another major contributor in the second quarter with a return of 17%. PDF reported a good quarter from Samsung and Global Foundries. Most importantly, PDF signed new, multi-year contracts with a major existing customer (we think Samsung) and new customer (perhaps United Microelectronics Corp., 2303-Taiwan). Despite PDF’s strong contribution in the second quarter, it was still the Fund’s leading detractor for the first half.
The second leading detractor for the year-to-date was the short position in Federal Home Loan Mortgage Corp (FMCC), also known as Freddie Mac. We entered this position last year believing that the Senate Banking Committee, supported by the Administration and bipartisan, independent study groups, would gain momentum for a new housing finance bill, which would wind down Fannie Mae (FNMA) and Freddie Mac, leaving their common equity without value. Although the Senate Committee led by Chairman Tim Johnson (D-SD) and ranking member Mike Crapo (R-ID) got a bill out of committee on May 15, the bill lacks momentum. Speaker Reid (D-NV) has no plans to introduce the bill to the floor due to opposition from six senators who believe it does not do enough to support affordable housing.
GSEs (government-sponsored entities) benefit from an explicit guarantee of funding and liabilities from the federal government. GSEs are also not required to maintain a capital reserve or pay a commitment fee to the government. This guarantee lowers their cost to borrow, which improves the GSE’s margins and operating earnings. In exchange for these benefits, the Treasury sweeps all positive net worth above a nominal level as a dividend. A number of hedge and mutual funds have filed suit that the government’s net worth sweep is not proper and resorts to a seizure of private assets. Suits are pending.
The bill was also heavily opposed by hedge (Perry Capital, Bill Ackman of Pershing Square Capital Management) and mutual funds (Bruce Berkowitz of Fairholme Capital) seeking to secure a future for the GSEs with value retained for the equity holders. They have funded an extensive legal, lobbying and press campaign. They allied with the affordable housing advocates. The stock appreciated to $3.90 per share on June 30 from $2.86 on March 31. Mind you, FMCC traded for $0.25 for most of the last four years. The $3.90 price assumes a very optimistic set of assumptions.
Ultimately, we believe our representatives will not base the future housing finance system on two entities with government guarantees and returns to private shareholders, but there is no visibility to when such a future may happen. In the meantime, these stocks are the play toys of powerful forces. During the quarter, we reduced our short position.
By far the largest detractor for the second quarter was World Wrestling Entertainment (WWE), down 59% in the quarter. It was a top contributor and up 75% in the first quarter. When we bought WWE in 2013, it was a sleepy stock that hadn’t moved much in several years.
In the second quarter, the market was disappointed by the new WWE TV rights fees and the increase in the number of WWE Network subscribers required for breakeven. We believe WWE has extensive operating leverage, which should benefit WWE as subscriber numbers increase. We believe WWE produces great content and, over time, it will be monetized.
We sold some WWE shares in the first quarter and bought them back and more in the second quarter. WWE also paid a $0.48 per share dividend in 2013. We continued to build our positions in Crawford & Company Class A (CRD.A), KVH Industries, Inc. (KVHI) and Oil-Dri Corp. of America (ODC).
I’d like to highlight two new positions during the quarter. iRobot Corporation (IRBT) has a consumer robotic vacuum and a defense robot business. When we bought the stock, we believed the market was giving no credit for their defense business. Unfortunately, due to global instability, we think defense electronics is a good place to invest. Another new investment is Bruker Corporation (BRKR), which makes life science instruments and systems. We like their new products and reorganized business lines, which could lead to higher operating margins.
We also added starter positions in Vishay Precision Group, Inc. (VPG), Vicor Corporation (VICR) and GSE Systems, Inc. (GVP). There’s not a single analyst following any of these three companies; we love the lack of interest and competition.
The Fund exited the quarter with 32% large cap, up from 29% on December 31, 10% midcap, and 58% small and microcap, down from 64% on March 31. The Fund also ended the second quarter with a 7% short position, down from 9% at March 31.
Needham Small Cap Growth Fund
The Needham Small Cap Growth Fund returned 0.3% in the second quarter of 2014. We were relatively pleased with the performance of many of our holdings; however, that performance was overshadowed by our long-term investments in Electro Scientific Industries, down 30% in the second quarter and down 34% year-to-date, and Emulex down 23% in the second quarter and down 20% year-to-date. Both companies have had disappointing earnings and now have new management teams. We will review these positions on any recovery in the stock prices. We were pleased to see the recovery in FormFactor, which had been affected by a customer’s fire and a manufacturing mishap last year. We expect FormFactor to return to profitability after six years, and we believe the company is back on track for future growth.
We expect to see continued recovery from the first half 2014 slowdown, although we don’t expect to see robust activity. Mid-year elections will likely grab a substantial portion of news headlines this fall. We also expect to see more geopolitical events around the world that create uncertainty in the markets. We expect the release of new Apple products this fall to drive positive results for many technology companies involved in Apple’s supply chain.
We are also excited about the new Intel server platform launching this fall, which should benefit enterprise and data center sales. Our investment in SuperMicro Computer should benefit from this launch.
We spent nearly a week attending the SEMICON West Conference in San Francisco in early July and remain excited about the long-term prospects for many of the semiconductor capital equipment companies. Although the industry is in the midst of a pause that we believe may continue through the end of 2014, we believe that 2015 is setting up for year-over-year growth.
Moore’s Law, which postulates that the number of transistors in an integrated circuit doubles every two years, has slowed; however, we do not believe it is dead. The slowdown is positive for semiconductor capital equipment companies as substantially more capital expenditures are required to achieve technology transitions to smaller nodes. Simultaneously, more capacity will be required to meet the ever increasing demand for semiconductor chips with the ‘‘Internet of Everything.’’ Semiconductors are finding their way into more and more devices that previously never had them. The aerospace and automotive industries should be large consumers of semiconductor chips. We expect our investments in FormFactor, MKS Instruments (MKSI) and Rudolph Technologies (RTEC) to benefit from this trend.
Our investments in the energy industry have also performed nicely, and we believe the secular growth story remains intact as the U.S. energy renaissance continues. The non-traditional energy plays in the U.S. have required increased use of technology and services and this has driven growth for several of our investments. We remain excited about our investments in C&J Energy Services (CJES), Superior Energy Services (SPN) and WPX Energy (WPX), as we believe they are all levered to the growing energy sector.
Closing
The first half of 2014 brought a correction in January and February. High multiple, small-cap growth stocks were down. We believe the market needed time to consolidate its gains from 2012 and 2013. The second quarter of 2014 saw a return of volatility in the overall market and small-cap stocks in particular. This was exacerbated by lower than normal trading volumes that affected daily stock prices. In the end, however, the second quarter finished strongly as the concerns surrounding the effects of terrible winter weather abated and the economy began to recover. We do not find this economic growth extraordinary, but when compared to the first quarter, most economic activity is stronger.
To reiterate our overall thesis: monetary policy remains accommodative. We continue to see opportunities and have added starter positions in a few stocks. We believe that the international geopolitical situation, while disturbing, needs to be put in historical perspective. We see a revolution happening in technology that has created investment opportunities.
We see opportunity in our strategy of investing in companies that we know well and that we believe are positioned with secular growth drivers. We believe 2014 will be another good year for equities. However, we believe 2014 could bring more volatility to the markets and that our ability to short could dampen the possible volatility.
We welcome our new investors and thank all of our investors for their continued support. If you have any questions, thoughts or concerns, please contact us at (800) 625-7071 or send us an email at cretzler@needhamco.com or jbarr@needhamco.com. For information about the funds, please visit our website at www.needhamfunds.com.
Sincerely,
| | |
 | |
| Chris Retzler | John O. Barr |
| Portfolio Manager | Portfolio Manager |
| Needham Funds |
| | |
| NEEDHAM GROWTH FUND | TICKER: NEEGX |
Comparative Performance Statistics as of June 30, 2014 (unaudited)
| | | | | | | | | | | | | | | | | | | | | | | |
| | | | | | | | | | | | | | | | | | | Since | | Gross Expense | |
| | | | 6 Months(7) | | 1 Year | | 3 Years(8) | | 5 Years(8) | | 10 Years(8) | | Inception(8)(12) | | Ratio(14) | |
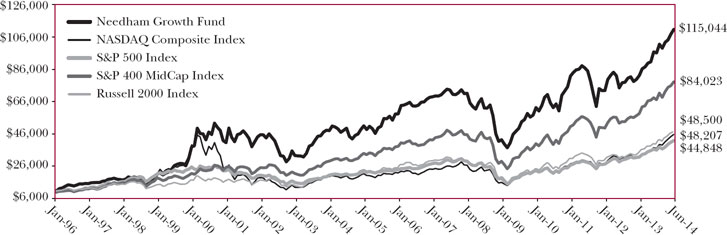
| | Needham Growth Fund(1) | | | 3.99 | % | | | 19.69 | % | | | 10.64 | %(9) | | | 18.41 | %(10) | | | 8.79 | %(11) | | | 14.12 | %(13) | | | 1.89 | % | |
| | S&P 500 Index(2)(3) | | | 7.14 | % | | | 24.61 | % | | | 16.58 | % | | | 18.83 | % | | | 7.78 | % | | | 8.45 | % | | | | | |
| | NASDAQ Composite Index(2)(4) | | | 6.20 | % | | | 31.24 | % | | | 18.29 | % | | | 20.60 | % | | | 9.22 | % | | | 8.91 | % | | | | | |
| | S&P 400 MidCap Index(2)(5) | | | 7.50 | % | | | 25.24 | % | | | 15.26 | % | | | 21.67 | % | | | 10.50 | % | | | 12.20 | % | | | | | |
| | Russell 2000 Index(2)(6) | | | 3.19 | % | | | 23.64 | % | | | 14.57 | % | | | 20.21 | % | | | 8.70 | % | | | 8.88 | % | | | | | |
| | | |
| | Past performance does not guarantee future results. The performance data quoted represents past performance, and current returns may be lower or higher. The investment return and net asset value will fluctuate so that an investor’s shares, when redeemed, may be worth more or less than the original cost. To obtain performance information current to the most recent month-end, please call 1-800-625-7071. The returns shown in the above table and accompanying footnotes are net of expenses. The table above does not reflect the deduction of taxes that a shareholder would have paid on Fund distributions or on the redemption of Fund shares. | |
| | 1. | Investment results calculated after reinvestment of dividends. | |
| | 2. | It is not possible to invest directly in an index. The performance of the index does not include the deduction of expenses associated with a mutual fund, such as investment management fees. | |
| | 3. | The S&P 500 Index is a broad unmanaged measure of the U.S. stock market. | |
| | 4. | The NASDAQ Composite Index is a broad-based capitalization-weighted index of all NASDAQ Global Market and Small Cap stocks. | |
| | 5. | The S&P 400 MidCap Index is a broad unmanaged measure of the U.S. stock market. | |
| | 6. | The Russell 2000 Index is a broad unmanaged index composed of the smallest 2,000 companies in the Russell 3000 Index. | |
| | 7. | Not annualized. | |
| | 8. | Compound annual growth rate (annualized return). Assumes all dividends were reinvested in shares of the Fund. | |
| | 9. | Cumulative return for the three year period was 35.44%, assuming all dividends were reinvested in shares of the Fund. | |
| | 10. | Cumulative return for the five year period was 132.78%, assuming all dividends were reinvested in shares of the Fund. | |
| | 11. | Cumulative return for the ten year period was 132.23%, assuming all dividends were reinvested in shares of the Fund. | |
| | 12. | The inception date of the Fund was 1/1/96. | |
| | 13. | Cumulative return since inception was 1050.44%, assuming all dividends were reinvested in shares of the Fund. | |
| | 14. | Gross expense ratio is from the Fund’s prospectus dated May 1, 2014. Additional information pertaining to the Fund’s expense ratios as of June 30, 2014 can be found in the financial highlights. Since January 1, 2009, the investment performance reflects contractually agreed upon fee waivers which expire at the close of business on April 30, 2015. Without these fee waivers, the performance would have been lower. Excluding the indirect costs of investing in acquired funds, total fund operating expenses would be 1.89%. | |
Top Ten Holdings*
(as a % of total investments, as of June 30, 2014)
| | | | | | |
| | | | | | | % of Total | |
| | | Security | | | | Investments† | |
| | 1 Express Scripts Holding Co. | ESRX | | 9.14 | % | |
| | 2 Thermo Fisher Scientific, Inc. | TMO | | 8.29 | % | |
| | 3 Gilead Sciences, Inc. | GILD | | 8.16 | % | |
| | 4 CarMax, Inc. | KMX | | 5.67 | % | |
| | 5 FormFactor, Inc. | FORM | | 4.24 | % | |
| | 6 ViaSat, Inc. | VSAT | | 4.03 | % | |
| | 7 Super Micro Computer, Inc. | SMCI | | 4.00 | % | |
| | 8 Hess Corp. | HES | | 3.82 | % | |
| | 9 Becton Dickinson and Co. | BDX | | 3.74 | % | |
| | 10 KVH Industries, Inc. | KVHI | | 2.79 | % | |
| | Top Ten Holdings = 53.88% of Total Investments† | |
| | * Current portfolio holdings may not be indicative of future portfolio holdings. | |
| | † Percentage of total investments less cash. | |
Sector Weightings*
(as a % of total investments, as of June 30, 2014)
| | | | | | | | | | | |
| | | Sector | | | Long(1) | | (Short)(1) | | Total(1)(2) | |
| | Consumer Discretionary | | 11.1 | % | | — | | | 11.1 | % | |
| | Energy | | 5.3 | % | | — | | | 5.3 | % | |
| | Exchange Traded Funds | | — | | | (0.3 | )% | | (0.3 | )% | |
| | Financials | | 3.2 | % | | — | | | 3.2 | % | |
| | Health Care | | 34.4 | % | | — | | | 34.4 | % | |
| | Industrials | | 2.9 | % | | (0.2 | )% | | 2.7 | % | |
| | Information Technology | | 43.1 | % | | (2.3 | )% | | 40.8 | % | |
| | Cash | | 2.8 | % | | — | | | 2.8 | % | |
| | * Current portfolio holdings may not be indicative of future portfolio holdings. | | |
| | (1) Percentage of total investments includes all stocks, plus cash minus all short positions. | |
| | (2) Total represents the difference between the long exposure and the short exposure, which produces the net exposure. | |
| | | | | | | | | | |
Comparison of Change in Value of a $10,000 Investment
Past performance does not guarantee future results. The performance data quoted represents past performance, and current returns may be lower or higher. The investment return and net asset value will fluctuate so that an investor’s shares, when redeemed, may be worth more or less than the original cost. To obtain performance information current to the most recent month-end, please call 1-800-625-7071. The graph above does not reflect the deduction of taxes that a shareholder would have paid on Fund distributions or on the redemption of Fund shares. Since inception, the Fund’s adviser has absorbed certain expenses of the Fund, without which returns would have been lower.
The Global Industry Classification Standard (GICS®) was developed by and/or is the exclusive property of MSCI, Inc. and Standard & Poor Financial Services LLC (“S&P”). GICS is a service mark of MSCI and S&P and has been licensed for use by U.S. Bancorp Fund Services, LLC.
Semi-Annual Report 2014 |
| | |
| NEEDHAM AGGRESSIVE GROWTH FUND | TICKER: NEAGX |
Comparative Performance Statistics as of June 30, 2014 (Unaudited)
| | | | | | | | | | | | | | | | | | | | | | | |
| | | | | | | | | | | | | | | | | | | Since | | Gross Expense | |
| | | | 6 Months(6) | | 1 Year | | 3 Years(7) | | 5 Years(7) | | 10 Years(7) | | Inception(7)(11) | | Ratio(13) | |
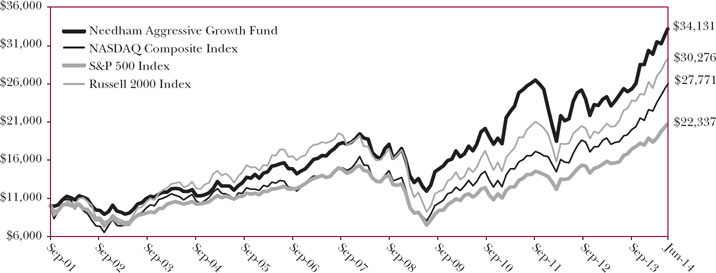
| | Needham Aggressive Growth Fund(1) | | | 2.29 | % | | | 19.98 | % | | | 10.60 | %(8) | | | 17.54 | %(9) | | | 10.93 | %(10) | | | 10.05 | %(12) | | | 2.07 | % | |
| | | | | 7.14 | % | | | 24.61 | % | | | 16.58 | % | | | 18.83 | % | | | 7.78 | % | | | 6.47 | % | | | | | |
| | NASDAQ Composite Index(2)(4) | | | 6.20 | % | | | 31.24 | % | | | 18.29 | % | | | 20.60 | % | | | 9.22 | % | | | 8.29 | % | | | | | |
| | | | | 3.19 | % | | | 23.64 | % | | | 14.57 | % | | | 20.21 | % | | | 8.70 | % | | | 9.03 | % | | | | | |
| | | |
| | Past performance does not guarantee future results. The performance data quoted represents past performance, and current returns may be lower or higher. The investment return and net asset value will fluctuate so that an investor’s shares, when redeemed, may be worth more or less than the original cost. To obtain performance information current to the most recent month-end, please call 1-800-625-7071. The returns shown in the above table and accompanying footnotes are net of expenses. The table above does not reflect the deduction of taxes that a shareholder would have paid on Fund distributions or on the redemption of Fund shares. | |
| | 1. | Investment results calculated after reinvestment of dividends. | |
| | 2. | It is not possible to invest directly in an index. The performance of the index does not include the deduction of expenses associated with a mutual fund, such as investment management fees. | |
| | 3. | The S&P 500 Index is a broad unmanaged measure of the U.S. stock market. | |
| | 4. | The NASDAQ Composite Index is a broad-based capitalization-weighted index of all NASDAQ Global Market and Small Cap stocks. | |
| | 5. | The Russell 2000 Index is a broad unmanaged index composed of the smallest 2,000 companies in the Russell 3000 Index. | |
| | 6. | | |
| | 7. | Compound annual growth rate (annualized return). Assumes all dividends were reinvested in shares of the Fund. | |
| | 8. | Cumulative return for the three year period was 35.31%, assuming all dividends were reinvested in shares of the Fund. | |
| | 9. | Cumulative return for the five year period was 124.39%, assuming all dividends were reinvested in shares of the Fund. | |
| | 10. | Cumulative return for the ten year period was 182.11%, assuming all dividends were reinvested in shares of the Fund. | |
| | 11. | The inception date of the Fund was 9/4/2001. | |
| | 12. | Cumulative return since inception was 241.31% assuming all dividends were reinvested in shares of the Fund. | |
| | 13. | Gross expense ratio is from the Fund’s prospectus dated May 1, 2014. Additional information pertaining to the Fund’s expense ratios as of June 30, 2014 can be found in the financial highlights. Since inception, the investment performance reflects contractually agreed upon fee waivers which expire at the close of business on April 30, 2015. Without these fee waivers, the performance would have been lower. Excluding the indirect costs of investing in acquired funds, total fund operating expenses would be 2.07%. | |
Top Ten Holdings*
(as a % of total investments, as of June 30, 2014)
| | | | | | | |
| | | | | % of Total | |
| | | Security | | | | Investments† | |
| | 1 Gilead Sciences, Inc. | GILD | | 9.52 | % | |
| | 2 PDF Solutions, Inc. | PDFS | | 8.80 | % | |
| | 3 Akamai Technologies, Inc. | AKAM | | 7.87 | % | |
| | 4 FormFactor, Inc. | FORM | | 5.85 | % | |
| | 5 Apple, Inc. | AAPL | | 5.44 | % | |
| | 6 Entegris, Inc. | ENTG | | 4.29 | % | |
| | 7 Super Micro Computer, Inc. | SMCI | | 4.12 | % | |
| | 8 KVH Industries, Inc. | KVHI | | 3.86 | % | |
| | 9 Electronics For Imaging, Inc. | EFII | | 3.71 | % | |
| | 10 Reis, Inc. | REIS | | 3.19 | % | |
| | Top Ten Holdings = 56.65% of Total Investments† | | |
| | * Current portfolio holdings may not be indicative of future portfolio holdings. | | |
| | † Percentage of total investments less cash. | | | | | |
Sector Weightings*
(as a % of total investments, as of June 30, 2014)
| | | | | | | | | | | | |
| | | Sector | | | Long(1) | | (Short)(1) | | Total(1)(2) | |
| | Consumer Discretionary | | 7.1 | % | | — | | | 7.1 | % | |
| | Consumer Staples | | 1.2 | % | | — | | | 1.2 | % | |
| | Energy | | 1.4 | % | | — | | | 1.4 | % | |
| | Exchange Traded Funds | | — | | | (0.1 | )% | | (0.1 | )% | |
| | Financials | | 3.3 | % | | (1.7 | )% | | 1.6 | % | |
| | Health Care | | 14.6 | % | | — | | | 14.6 | % | |
| | Industrials | | 4.9 | % | | (0.5 | )% | | 4.4 | % | |
| | Information Technology | | 73.5 | % | | (4.6 | )% | | 68.9 | % | |
| | Cash | | 0.9 | % | | — | | | 0.9 | % | |
| | * Current portfolio holdings may not be indicative of future portfolio holdings. | | |
| | (1) Percentage of total investments includes all stocks, plus cash minus all short positions. | |
| | (2) Total represents the difference between the long exposure and the short exposure, which produces the net exposure. | |
| | | | | | | | | | |
Comparison of Change in Value of a $10,000 Investment
Past performance does not guarantee future results. The performance data quoted represents past performance, and current returns may be lower or higher. The investment return and net asset value will fluctuate so that an investor’s shares, when redeemed, may be worth more or less than the original cost. To obtain performance information current to the most recent month-end, please call 1-800-625-7071. The graph above does not reflect the deduction of taxes that a shareholder would have paid on Fund distributions or on the redemption of Fund shares. Since inception, the Fund’s adviser has absorbed certain expenses of the Fund, without which returns would have been lower.
The Global Industry Classification Standard (GICS®) was developed by and/or is the exclusive property of MSCI, Inc. and Standard & Poor Financial Services LLC (“S&P”). GICS is a service mark of MSCI and S&P and has been licensed for use by U.S. Bancorp Fund Services, LLC.
| Needham Funds |
| | |
| NEEDHAM SMALL CAP GROWTH FUND | TICKER: NESGX |
Comparative Performance Statistics as of June 30, 2014 (Unaudited)
| | | | | | | | | | | | | | | | | | | | | | | |
| | | | | | | | | | | | | | | | | | | Since | | Gross Expense | |
| | | | 6 Months(6) | | 1 Year | | 3 Years(7) | | 5 Years(7) | | 10 Years(7) | | Inception(7)(11) | | Ratio(13) | |
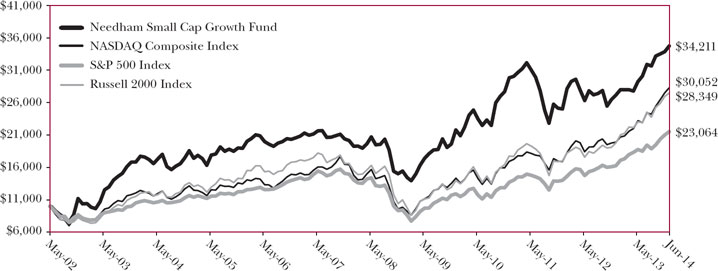
| | Needham Small Cap Growth Fund(1) | | | | % | | | | % | | | | %(8) | | | | %(9) | | | | %(10) | | | | %(12) | | | 2.07 | % | |
| | | | | | % | | | | % | | | | % | | | | % | | | | % | | | | % | | | | | |
| | NASDAQ Composite Index(2)(4) | | | | % | | | | % | | | | % | | | | % | | | | % | | | | % | | | | | |
| | | | | | % | | | | % | | | | % | | | | % | | | 8.70 | % | | | | % | | | | | |
| | | |
| | Past performance does not guarantee future results. The performance data quoted represents past performance, and current returns may be lower or higher. The investment return and net asset value will fluctuate so that an investor’s shares, when redeemed, may be worth more or less than the original cost. To obtain performance information current to the most recent month-end, please call 1-800-625-7071. The returns shown in the above table and accompanying footnotes are net of expenses. The table above does not reflect the deduction of taxes that a shareholder would have paid on Fund distributions or on the redemption of Fund shares. | |
| | 1. | Investment results calculated after reinvestment of dividends. | |
| | 2. | It is not possible to invest directly in an index. The performance of the index does not include the deduction of expenses associated with a mutual fund, such as investment management fees. | |
| | 3. | The S&P 500 Index is a broad unmanaged measure of the U.S. stock market. | |
| | 4. | The NASDAQ Composite Index is a broad-based capitalization-weighted index of all NASDAQ Global Market and Small Cap stocks. | |
| | 5. | The Russell 2000 Index is a broad unmanaged index composed of the smallest 2,000 companies in the Russell 3000 Index. | |
| | 6. | | |
| | 7. | Compound annual growth rate (annualized return). Assumes all dividends were reinvested in shares of the Fund. | |
| | 8. | Cumulative return for the three year period was 14.36%, assuming all dividends were reinvested in shares of the Fund. | |
| | 9. | Cumulative return for the five year period was 88.86%, assuming all dividends were reinvested in shares of the Fund. | |
| | 10. | Cumulative return for the ten year period was 89.85%, assuming all dividends were reinvested in shares of the Fund. | |
| | 11. | The inception date of the Fund was 5/22/02. | |
| | 12. | Cumulative return since inception was 242.11%, assuming all dividends were reinvested in shares of the Fund. | |
| | 13. | Gross expense ratio is from the Fund’s prospectus dated May 1, 2014. Additional information pertaining to the Fund’s expense ratios as of June 30, 2014 can be found in the financial highlights. Since inception, the investment performance reflects contractually agreed upon fee waivers which expire at the close of business on April 30, 2015. Without these fee waivers, the performance would have been lower. Excluding the indirect costs of investing in acquired funds, total fund operating expenses would be 2.06%. | |
| | | | |
Top Ten Holdings*
(as a % of total investments, as of June 30, 2014)
| | | | | | | |
| | | | | % of Total | |
| | | Security | | | | Investments† | |
| | 1 FormFactor, Inc. | FORM | | 13.19 | % | |
| | 2 Emulex Corp. | ELX | | 8.63 | % | |
| | 3 II-VI, Inc. | IIVI | | 6.18 | % | |
| | 4 KVH Industries, Inc. | KVHI | | 6.02 | % | |
| | 5 Electro Scientific Industries, Inc. | ESIO | | 5.32 | % | |
| | 6 Ruckus Wireless, Inc. | RKUS | | 5.30 | % | |
| | 7 Hess Corp. | HES | | 5.29 | % | |
| | 8 Super Micro Computer, Inc. | SMCI | | 5.04 | % | |
| | 9 TTM Technologies, Inc. | TTMI | | 3.80 | % | |
| | 10 Express Scripts Holding Co. | ESRX | | 3.71 | % | |
| | Top Ten Holdings = 62.48% of Total Investments† | | |
| | * Current portfolio holdings may not be indicative of future portfolio holdings. | | |
| | † Percentage of total investments less cash. | | | | | |
Sector Weightings*
(as a % of total investments, as of June 30, 2014)
| | | | | | | | | | | | |
| | | Sector | | | Long(1) | | (Short)(1) | | Total(1)(2) | |
| | Consumer Discretionary | | 3.4 | % | | — | | | 3.4 | % | |
| | Energy | | 7.1 | % | | — | | | 7.1 | % | |
| | Exchange Traded Funds | | 0 | % | | (2.9 | ) | | (2.9 | )% | |
| | Financials | | 2.8 | % | | — | | | 2.8 | % | |
| | Health Care | | 4.5 | % | | — | | | 4.5 | % | |
| | Industrials | | 1.4 | % | | — | | | 1.4 | % | |
| | Information Technology | | 56.4 | % | | (1.1 | ) | | 55.3 | % | |
| | Cash | | 28.4 | % | | — | | | 28.4 | % | |
| | * Current portfolio holdings may not be indicative of future portfolio holdings. | |
| | (1) Percentage of total investments includes all stocks, plus cash minus all short positions. | |
| | (2) Total represents the difference between the long exposure and the short exposure, which produces the net exposure. | |
| | | | | | | | | | |
Comparison of Change in Value of a $10,000 Investment
Past performance does not guarantee future results. The performance data quoted represents past performance, and current returns may be lower or higher. The investment return and net asset value will fluctuate so that an investor’s shares, when redeemed, may be worth more or less than the original cost. To obtain performance information current to the most recent month-end, please call 1-800-625-7071. The graph above does not reflect the deduction of taxes that a shareholder would have paid on Fund distributions or on the redemption of Fund shares. Since inception, the Fund’s adviser has absorbed certain expenses of the Fund, without which returns would have been lower.
The Global Industry Classification Standard (GICS®) was developed by and/or is the exclusive property of MSCI, Inc. and Standard & Poor Financial Services LLC (“S&P”). GICS is a service mark of MSCI and S&P and has been licensed for use by U.S. Bancorp Fund Services, LLC.
Disclosure of Fund Expenses (Unaudited)
The following expense table is shown so that you can understand the impact of fees on your investment. All mutual funds have operating expenses. As a shareholder of the fund, you incur transactional costs, including redemption fees and ongoing costs, which include costs for portfolio management, administrative services, and shareholder reports, among others. A fund’s expenses are expressed as a percentage of its average net assets. This figure is known as the expense ratio. The following examples are intended to help you understand the ongoing costs (in dollars) of investing in each Fund and to compare these costs with those of other mutual funds. The examples are based on an investment of $1,000 made at the beginning of the period shown and held for the entire period. The expense example table below illustrates your fund’s cost in two ways:
| ● | Actual Expenses. This section helps you to estimate the actual expenses after fee waivers that you paid over the period. The “Ending Account Value” shown is derived from the Fund’s actual return, and “Expenses Paid During Period” shows the dollar amount that would have been paid by an investor who started with $1,000 in the Fund. You may use the information here, together with the amount you invested, to estimate the expenses that you paid over the period. To do so, simply divide your account value by $1,000 (for example, an $8,600 account value divided by $1,000 = 8.6), then multiply the result by the number given for your Fund under the heading entitled “Expenses Paid During Period”. |
| ● | Hypothetical Expenses on a 5% Return. This section is intended to help you compare your Fund’s costs with those of other mutual funds. It assumes that the Fund had a return of 5% before expenses during the period shown, but that the expense ratio is unchanged. In this case, because the return used is not the Fund’s actual return, the results do not apply to your investment. The example is useful in making comparisons because the Securities and Exchange Commission requires all mutual funds to calculate expenses based on a 5% return. You can assess your Fund’s cost by comparing this hypothetical example with the hypothetical examples that appear in shareholders reports of other funds. |
Please note that the expenses shown in the table are meant to highlight your ongoing costs only and do not reflect any transactional costs, such as redemption fees or exchange fees. Therefore, the table is useful in comparing ongoing costs only, and will not help you determine the relative total costs of owning different funds. In addition, if these transactional costs were included, your costs would have been higher.
For the Period January 1, 2014 to June 30, 2014
Expense Example Table
| | | Beginning | | Ending | | Expenses | | Expense |
| | | Account | | Account | | Paid During | | Ratio During |
| | | Value | | Value | | Period* | | Period* |
| | | 1/1/14 | | 6/30/14 | | 1/1/14 – 6/30/14 | | 1/1/14 – 6/30/14 |
| Needham Growth Fund | | | | | | | | | | | | |
| Actual Expenses | | $ | 1,000.00 | | | $ | 1,039.90 | | | $ | 9.36 | | | | 1.85 | % |
Hypothetical Example for Comparison Purposes (5% return before expenses) | | $ | 1,000.00 | | | $ | 1,015.62 | | | $ | 9.25 | | | | 1.85 | % |
| | | | | | | | | | | | | | | | | |
| Needham Aggressive Growth Fund | | | | | | | | | | | | | | | | |
| Actual Expenses | | $ | 1,000.00 | | | $ | 1,022.90 | | | $ | 10.58 | | | | 2.11 | % |
Hypothetical Example for Comparison Purposes (5% return before expenses) | | $ | 1,000.00 | | | $ | 1,014.33 | | | $ | 10.54 | | | | 2.11 | % |
| | | | | | | | | | | | | | | | | |
| Needham Small Cap Growth Fund | | | | | | | | | | | | | | | | |
| Actual Expenses | | $ | 1,000.00 | | | $ | 984.60 | | | $ | 9.64 | | | | 1.96 | % |
Hypothetical Example for Comparison Purposes (5% return before expenses) | | $ | 1,000.00 | | | $ | 1,015.08 | | | $ | 9.79 | | | | 1.96 | % |
| * | Expenses are equal to the average account value times the Fund’s annualized expense ratio multiplied by the number of days in the most recent fiscal half-year divided by the number of days in the fiscal year. |
Needham Growth Fund
Schedule of Investments
June 30, 2014 (Unaudited)
| | | Shares | | | Market Value | |
| | | | | | | |
| Common Stocks (97.3%) | | | | | | |
| | | | | | | |
| Aerospace & Defense (0.9%) | | | | | | |
| Honeywell International, Inc. | | | 15,000 | | | $ | 1,394,250 | |
| | | | | | | | | |
| Airlines (0.1%) | | | | | | | | |
| United Continental Holdings, Inc.* | | | 5,000 | | | | 205,350 | |
| | | | | | | | | |
| Auto Components (0.7%) | | | | | | | | |
| Sypris Solutions, Inc. | | | 187,500 | | | | 1,046,250 | |
| | | | | | | | | |
| Biotechnology (7.9%) | | | | | | | | |
| Exact Sciences Corp.* | | | 1,200 | | | | 20,436 | |
| Gilead Sciences, Inc.* | | | 140,000 | | | | 11,607,400 | |
| | | | | | | | 11,627,836 | |
| | | | | | | | | |
| Capital Markets (2.8%) | | | | | | | | |
| Financial Engines, Inc. | | | 67,500 | | | | 3,056,400 | |
| Oaktree Capital Group LLC | | | 20,000 | | | | 999,800 | |
| | | | | | | | 4,056,200 | |
| | | | | | | | | |
| Commercial Services & Supplies (0.6%) | | | | | | | | |
| Clean Harbors, Inc.* | | | 13,000 | | | | 835,250 | |
| | | | | | | | | |
| Communications Equipment (9.3%) | | | | | | | | |
| Emulex Corp.* | | | 610,000 | | | | 3,477,000 | |
| KVH Industries, Inc.* | | | 304,500 | | | | 3,967,635 | |
| QUALCOMM, Inc. | | | 5,000 | | | | 396,000 | |
| ViaSat, Inc.*† | | | 99,000 | | | | 5,738,040 | |
| | | | | | | | 13,578,675 | |
| | | | | | | | | |
| Electronic Equipment, Instruments & Components (8.4%) | |
| Corning, Inc. | | | 35,000 | | | | 768,250 | |
| Electro Scientific Industries, Inc. | | | 418,350 | | | | 2,848,964 | |
| II-VI, Inc.* | | | 145,000 | | | | 2,096,700 | |
| Jabil Circuit, Inc.† | | | 160,000 | | | | 3,344,000 | |
| Newport Corp.* | | | 100,000 | | | | 1,850,000 | |
| TCP International Holdings Ltd.* | | | 14,594 | | | | 149,734 | |
| Vishay Intertechnology, Inc. | | | 75,000 | | | | 1,161,750 | |
| | | | | | | | 12,219,398 | |
| | | | | | | | | |
| Energy Equipment & Services (1.0%) | | | | | | | | |
| Schlumberger Ltd. | | | 12,500 | | | | 1,474,375 | |
| | | | | | | | | |
| Health Care Equipment & Supplies (8.2%) | | | | | |
| Becton Dickinson and Co. | | | 45,000 | | | | 5,323,500 | |
| CONMED Corp. | | | 48,150 | | | | 2,125,823 | |
| Covidien PLC | | | 27,500 | | | | 2,479,950 | |
| Lumenis Ltd.* | | | 8,454 | | | | 82,342 | |
| Natus Medical, Inc.* | | | 10,000 | | | | 251,400 | |
| Varian Medical Systems, Inc.* | | | 20,000 | | | | 1,662,800 | |
| | | | | | | | 11,925,815 | |
| Health Care Providers & Services (8.9%) | | | | |
| Express Scripts Holding Co.*† | | | 187,500 | | | | 12,999,375 | |
| | | | | | | | | |
| Health Care Technology (0.1%) | | | | | | | | |
| Cerner Corp.* | | | 2,500 | | | | 128,950 | |
| | | | | | | | | |
| Hotels, Restaurants & Leisure (0.2%) | | | | | | | | |
| Life Time Fitness, Inc.* | | | 5,000 | | | | 243,700 | |
| | | | | | | | | |
| Internet Software & Services (3.4%) | | | | | | | | |
| Akamai Technologies, Inc.* | | | 50,000 | | | | 3,053,000 | |
| Amber Road, Inc.* | | | 20,000 | | | | 322,600 | |
| Borderfree, Inc.* | | | 19,991 | | | | 331,251 | |
| Brightcove, Inc.* | | | 17,500 | | | | 184,450 | |
| Everyday Health, Inc.* | | | 8,100 | | | | 149,688 | |
| Q2 Holdings, Inc.* | | | 20,000 | | | | 285,200 | |
| QuinStreet, Inc.* | | | 56,558 | | | | 311,634 | |
| Xoom Corp.* | | | 10,000 | | | | 263,600 | |
| YuMe, Inc.* | | | 25,000 | | | | 147,500 | |
| | | | | | | | 5,048,923 | |
| | | | | | | | | |
| Leisure Products (0.4%) | | | | | | | | |
| Black Diamond, Inc.* | | | 50,000 | | | | 561,000 | |
| | | | | | | | | |
| Life Sciences Tools & Services (8.3%) | | | | | | | | |
| Bruker Corp.* | | | 8,500 | | | | 206,295 | |
Quintiles Transnational Holdings, Inc.* | | | 1,108 | | | | 59,045 | |
| Thermo Fisher Scientific, Inc.† | | | 100,000 | | | | 11,800,000 | |
| | | | | | | | 12,065,340 | |
| | | | | | | | | |
| Media (2.9%) | | | | | | | | |
| Comcast Corp. | | | 60,000 | | | | 3,220,800 | |
| Discovery Communications, Inc.* | | | 4,500 | | | | 334,260 | |
| Twenty-First Century Fox, Inc. | | | 10,000 | | | | 351,500 | |
World Wrestling Entertainment, Inc. | | | 25,000 | | | | 298,250 | |
| | | | | | | | 4,204,810 | |
| | | | | | | | | |
| Oil, Gas & Consumable Fuels (4.1%) | | | | | | | | |
| Eclipse Resources Corp.* | | | 1,470 | | | | 36,941 | |
| Hess Corp.† | | | 55,000 | | | | 5,438,950 | |
| WPX Energy, Inc.* | | | 22,000 | | | | 526,020 | |
| | | | | | | | 6,001,911 | |
| | | | | | | | | |
| Pharmaceuticals (0.1%) | | | | | | | | |
| Corium International, Inc.* | | | 21,628 | | | | 168,050 | |
| | | | | | | | | |
| Professional Services (0.8%) | | | | | | | | |
| WageWorks, Inc.* | | | 23,500 | | | | 1,132,935 | |
See accompanying notes to financial statements.
| | Semi-Annual Report 2014 |
| | |
| Needham Growth Fund | |
| Schedule of Investments | |
| June 30, 2014 (Unaudited) | |
| | | Shares | | | Market Value | |
| | | | | | | |
| Common Stocks - Continued | | | | | | |
| | | | | | | |
| Semiconductors & Semiconductor Equipment (12.9%) | | | | |
| Broadcom Corp. | | | 5,000 | | | $ | 185,600 | |
| Brooks Automation, Inc. | | | 100,000 | | | | 1,077,000 | |
| Entegris, Inc.* | | | 210,000 | | | | 2,886,450 | |
| Entropic Communications, Inc.* | | | 389,200 | | | | 1,296,036 | |
| FormFactor, Inc.* | | | 725,000 | | | | 6,032,000 | |
| MKS Instruments, Inc. | | | 67,500 | | | | 2,108,700 | |
| Nova Measuring Instruments Ltd.* | | | 130,000 | | | | 1,561,300 | |
| PDF Solutions, Inc.* | | | 175,000 | | | | 3,713,500 | |
| | | | | | | | 18,860,586 | |
| | | | | | | | | |
| Software (1.6%) | | | | | | | | |
| A10 Networks, Inc.* | | | 1,445 | | | | 19,219 | |
| Barracuda Networks, Inc.* | | | 28,023 | | | | 869,273 | |
| King Digital Entertainment PLC* | | | 28,634 | | | | 588,429 | |
| Mavenir Systems, Inc.* | | | 60,000 | | | | 909,000 | |
| | | | | | | | 2,385,921 | |
| | | | | | | | | |
| Specialty Retail (6.6%) | | | | | | | | |
| CarMax, Inc.* | | | 155,000 | | | | 8,061,550 | |
| Dick’s Sporting Goods, Inc.† | | | 30,000 | | | | 1,396,800 | |
| Tiffany & Co. | | | 2,500 | | | | 250,625 | |
| | | | | | | | 9,708,975 | |
| Technology Hardware, Storage & Peripherals (6.4%) | | | | |
| Electronics For Imaging, Inc.* | | | 80,000 | | | | 3,616,000 | |
| Super Micro Computer, Inc.* | | | 225,000 | | | | 5,685,750 | |
| | | | | | | | 9,301,750 | |
| | | | | | | | | |
| Thrifts & Mortgage Finance (0.3%) | | | | | | | | |
| Ladder Capital Corp.* | | | 28,577 | | | | 516,386 | |
| | | | | | | | | |
| Trading Companies & Distributors (0.4%) | | | | | |
| Air Lease Corp. | | | 15,000 | | | | 578,700 | |
| | | | | | | | | |
| Total Common Stocks | | | | | | | | |
| (Cost $68,419,022) | | | | | | | 142,270,711 | |
| | | | | | | | | |
| Short-Term Investment (2.7%) | | | | | | | | |
| | | | | | | | | |
| Money Market Fund (2.7%) | | | | | | | | |
Dreyfus Treasury Prime Cash Management 0.00% (a) | | | | | | | | |
| (Cost $3,941,314) | | | 3,941,314 | | | $ | 3,941,314 | |
| | | | | | | | | |
| Total Investments (100.0%) | | | | | | | | |
| (Cost $72,360,336) | | | | | | | 146,212,025 | |
| Total Securities Sold Short (-2.6%) | | | | | | | (3,860,884 | ) |
| (Proceeds $2,755,549) | | | | | | | | |
Other Assets in Excess of Liabilities (2.6%) | | | | | | | 3,784,195 | |
| Net Assets (100.0%) | | | | | | $ | 146,135,336 | |
* | Non-income producing security. |
| | |
| (a) | Rate shown is the seven day yield as of June 30, 2014. |
| | |
| † | Security position is either entirely or partially held in a segregated account as collateral for securities sold short, aggregating a total market value of $5,185,200. |
The Global Industry Classification Standard (GICS®) was developed by and/or is the exclusive property of MSCI, Inc. and Standard & Poor’s Financial Services LLC (“S&P”). GICS is a service mark of MSCI and S&P and has been licensed for use by U.S. Bancorp Fund Services, LLC.
See accompanying notes to financial statements.
Needham Growth Fund
Schedule of Securities Sold Short
June 30, 2014 (Unaudited)
| | | Shares | | Market Value | |
| Securities Sold Short (-2.4%) | | | | | | |
| | | | | | | |
| Airlines (-0.2%) | | | | | | |
| Allegiant Travel Co. | | | 2,500 | | | $ | 294,425 | |
| | | | | | | | | |
| Communications Equipment (-1.1%) | | | | | | | | |
| Ubiquiti Networks, Inc.* | | | 35,100 | | | | 1,586,169 | |
| | | | | | | | | |
| Semiconductors & Semiconductor Equipment (-0.1%) | | | | |
| QuickLogic Corp.* | | | 20,000 | | | | 103,400 | |
| | | | | | | | | |
| Software (-1.0%) | | | | | | | | |
| ANSYS, Inc.* | | | 20,000 | | | | 1,516,400 | |
| | | | | | | | | |
| Total Securities Sold Short | | | | | | | | |
| (Proceeds $2,395,854) | | | | | | | 3,500,394 | �� |
| | | | | | | | | |
| Exchange Traded Funds Sold Short (-0.2%) | | | | | |
| iShares Russell 2000 ETF | | | 1,000 | | | | 118,810 | |
| iShares Russell 2000 Growth ETF | | | 1,000 | | | | 138,420 | |
| iShares Russell 2000 Value ETF | | | 1,000 | | | | 103,260 | |
| | | | | | | | | |
| Total Exchange Traded Funds Sold Short | | | | | | | | |
| (Proceeds $359,695) | | | | | | | 360,490 | |
| | | | | | | | | |
| Total Securities & Exchange Traded Funds Sold Short | | | | |
| (Proceeds $2,755,549) | | | | | | | 3,860,884 | |
| | | | | | | | | |
Total Securities & Exchange Traded Funds Sold Short (-2.6%) | | | | | | | (3,860,884 | ) |
| Total Investments (100.0%) | | | | | | | 146,212,025 | |
Other Assets in Excess of Liabilities (2.6%) | | | | | | | 3,784,195 | |
| Net Assets (100.0%) | | | | | | $ | 146,135,336 | |
* | Non-income producing security. |
The Global Industry Classification Standard (GICS®) was developed by and/or is the exclusive property of MSCI, Inc. and Standard & Poor’s Financial Services LLC (“S&P”). GICS is a service mark of MSCI and S&P and has been licensed for use by U.S. Bancorp Fund Services, LLC.
See accompanying notes to financial statements.
| | Semi-Annual Report 2014 |
| | |
| Needham Aggressive Growth Fund | |
| Schedule of Investments | |
| June 30, 2014 (Unaudited) | |
| | | Shares | | | Market Value | |
| | | | | | | |
| Common Stocks (100.1%) | | | | | | |
| | | | | | | |
| Aerospace & Defense (2.0%) | | | | | | |
| Precision Castparts Corp.† | | | 5,000 | | | $ | 1,262,000 | |
| | | | | | | | | |
| Biotechnology (9.5%) | | | | | | | | |
| Gilead Sciences, Inc.*† | | | 73,500 | | | | 6,093,885 | |
| | | | | | | | | |
| Capital Markets (2.1%) | | | | | | | | |
| Financial Engines, Inc.† | | | 30,000 | | | | 1,358,400 | |
| | | | | | | | | |
| Commercial Services & Supplies (0.5%) | | | | | | | | |
| Clean Harbors, Inc.* | | | 5,000 | | | | 321,250 | |
| | | | | | | | | |
| Communications Equipment (6.0%) | | | | | | | | |
| Emulex Corp.* | | | 10,000 | | | | 57,000 | |
| KVH Industries, Inc.* | | | 189,800 | | | | 2,473,094 | |
| ViaSat, Inc.*† | | | 23,000 | | | | 1,333,080 | |
| | | | | | | | 3,863,174 | |
| | | | | | | | | |
| Electrical Equipment (0.1%) | | | | | | | | |
| Vicor Corp.* | | | 5,000 | | | | 41,900 | |
| | | | | | | | | |
| Electronic Equipment, Instruments & Components (4.6%) | |
| Electro Scientific Industries, Inc. | | | 77,300 | | | | 526,413 | |
| FEI Co.† | | | 14,000 | | | | 1,270,220 | |
| II-VI, Inc.* | | | 39,000 | | | | 563,940 | |
| IPG Photonics Corp.*† | | | 5,000 | | | | 344,000 | |
| TCP International Holdings Ltd.* | | | 6,392 | | | | 65,582 | |
| Vishay Precision Group, Inc.* | | | 10,000 | | | | 164,600 | |
| | | | | | | | 2,934,755 | |
| | | | | | | | | |
| Health Care Equipment & Supplies (1.6%) | | | | | |
| Becton Dickinson and Co. | | | 5,000 | | | | 591,500 | |
| LeMaitre Vascular, Inc. | | | 55,000 | | | | 454,850 | |
| | | | | | | | 1,046,350 | |
| | | | | | | | | |
| Health Care Providers & Services (1.4%) | | | | | |
| Express Scripts Holding Co.*† | | | 13,000 | | | | 901,290 | |
| | | | | | | | | |
| Health Care Technology (0.6%) | | | | | | | | |
| Omnicell, Inc.* | | | 13,000 | | | | 373,230 | |
| | | | | | | | | |
| Hotels, Restaurants & Leisure (0.9%) | | | | | | | | |
| Life Time Fitness, Inc.* | | | 250 | | | | 12,185 | |
| Panera Bread Co.* | | | 3,700 | | | | 554,371 | |
| | | | | | | | 566,556 | |
| Household Durables (1.0%) | | | | | | |
| iRobot Corp.* | | | 15,000 | | | | 614,250 | |
| | | | | | | | | |
| Household Products (1.1%) | | | | | | | | |
| Oil-Dri Corp. of America | | | 24,000 | | | | 733,680 | |
| | | | | | | | | |
| Insurance (0.6%) | | | | | | | | |
| Crawford & Co. | | | 46,500 | | | | 376,650 | |
| | | | | | | | | |
| Internet & Catalog Retail (0.1%) | | | | | | | | |
| Coupons.com, Inc.* | | | 671 | | | | 17,654 | |
| RetailMeNot, Inc.* | | | 678 | | | | 18,042 | |
| | | | | | | | 35,696 | |
| | | | | | | | | |
| Internet Software & Services (17.6%) | | | | | | | | |
| Akamai Technologies, Inc.*† | | | 82,500 | | | | 5,037,450 | |
| Amber Road, Inc.* | | | 10,000 | | | | 161,300 | |
| ARI Network Services, Inc.* | | | 15,000 | | | | 45,450 | |
| Borderfree, Inc.* | | | 10,000 | | | | 165,700 | |
| Brightcove, Inc.* | | | 25,000 | | | | 263,500 | |
| ChannelAdvisor Corp.* | | | 3,383 | | | | 89,176 | |
| Constant Contact, Inc.*† | | | 45,000 | | | | 1,444,950 | |
| Equinix, Inc.* | | | 3,500 | | | | 735,315 | |
| Q2 Holdings, Inc.* | | | 12,500 | | | | 178,250 | |
| Reis, Inc. | | | 96,900 | | | | 2,042,652 | |
| TheStreet, Inc. | | | 255,000 | | | | 614,550 | |
| Xoom Corp.* | | | 9,000 | | | | 237,240 | |
| YuMe, Inc.* | | | 40,000 | | | | 236,000 | |
| | | | | | | | 11,251,533 | |
| | | | | | | | | |
| Life Sciences Tools & Services (0.5%) | | | | | | | | |
| Bruker Corp.* | | | 13,000 | | | | 315,510 | |
| | | | | | | | | |
| Media (1.9%) | | | | | | | | |
| Discovery Communications, Inc.* | | | 1,500 | | | | 111,420 | |
| Twenty-First Century Fox, Inc. | | | 1,000 | | | | 35,150 | |
World Wrestling Entertainment, Inc.† | | | 88,500 | | | | 1,055,805 | |
| | | | | | | | 1,202,375 | |
| | | | | | | | | |
| Oil, Gas & Consumable Fuels (1.3%) | | | | | | | | |
| Eclipse Resources Corp.* | | | 645 | | | | 16,209 | |
| Hess Corp.† | | | 8,500 | | | | 840,565 | |
| | | | | | | | 856,774 | |
| | | | | | | | | |
| Pharmaceuticals (0.1%) | | | | | | | | |
| Corium International, Inc.* | | | 9,650 | | | | 74,981 | |
| | | | | | | | | |
| Professional Services (2.1%) | | | | | | | | |
| WageWorks, Inc.*† | | | 28,000 | | | | 1,349,880 | |
See accompanying notes to financial statements.
Needham Aggressive Growth Fund
Schedule of Investments
June 30, 2014 (Unaudited)
| | | Shares | | | Market Value | |
| | | | | | | |
| Common Stocks – Continued | | | | | | |
| | | | | | | |
| Semiconductors & Semiconductor Equipment (24.7%) | | | |
| CEVA, Inc.* | | | 38,000 | | | $ | 561,260 | |
| Entegris, Inc.* | | | 200,000 | | | | 2,749,000 | |
| Entropic Communications, Inc.* | | | 127,150 | | | | 423,409 | |
| FormFactor, Inc.* | | | 450,000 | | | | 3,744,000 | |
| MKS Instruments, Inc.† | | | 29,100 | | | | 909,084 | |
| Nanometrics, Inc.* | | | 3,000 | | | | 54,750 | |
| Nova Measuring Instruments Ltd.* | | | 94,900 | | | | 1,139,749 | |
| PDF Solutions, Inc.*† | | | 265,500 | | | | 5,633,910 | |
| Photronics, Inc.* | | | 61,000 | | | | 524,600 | |
| Xcerra Corp.* | | | 10,000 | | | | 91,000 | |
| | | | | | | | 15,830,762 | |
| | | | | | | | | |
| Software (3.2%) | | | | | | | | |
| A10 Networks, Inc.* | | | 658 | | | | 8,751 | |
| Barracuda Networks, Inc.* | | | 13,539 | | | | 419,980 | |
| Bottomline Technologies, Inc.*† | | | 29,000 | | | | 867,680 | |
| BroadSoft, Inc.* | | | 5,000 | | | | 131,950 | |
| Exa Corp.* | | | 5,000 | | | | 56,300 | |
| GSE Systems, Inc.* | | | 25,000 | | | | 41,500 | |
| Mavenir Systems, Inc.* | | | 32,600 | | | | 493,890 | |
| | | | | | | | 2,020,051 | |
| | | | | | | | | |
| Specialty Retail (2.9%) | | | | | | | | |
| CarMax, Inc.*† | | | 22,500 | | | | 1,170,225 | |
| Dick’s Sporting Goods, Inc.† | | | 15,000 | | | | 698,400 | |
| | | | | | | | 1,868,625 | |
| | | | | | | | | |
| Technology Hardware, Storage & Peripherals (13.3%) | | | | |
| Apple, Inc.† | | | 37,450 | | | | 3,480,228 | |
| Electronics For Imaging, Inc.*† | | | 52,500 | | | | 2,373,000 | |
| Super Micro Computer, Inc.*† | | | 104,500 | | | | 2,640,715 | |
| | | | | | | | 8,493,943 | |
| Thrifts & Mortgage Finance (0.4%) | | | | | | | | |
| Ladder Capital Corp.* | | | 13,318 | | | | 240,656 | |
| | | | | | | | | |
| Total Common Stocks | | | | | | | | |
| (Cost $31,364,131) | | | | | | | 64,028,156 | |
| | | | | | | | | |
| Short-Term Investment (0.8%) | | | | | | | | |
| | | | | | | | | |
| Money Market Fund (0.8%) | | | | | | | | |
Dreyfus Treasury Prime Cash Management 0.00% (a) | | | | | | | | |
| (Cost $530,775) | | | 530,775 | | | $ | 530,775 | |
| | | | | | | | | |
| Total Investments (100.9%) | | | | | | | | |
| (Cost $31,894,906) | | | | | | | 64,558,931 | |
| Total Securities Sold Short (-6.5%) | | | | | | | (4,164,365 | ) |
| (Proceeds $2,310,393) | | | | | | | | |
Other Assets in Excess of Liabilities (5.6%) | | | | | | | 3,605,020 | |
| Net Assets (100.0%) | | | | | | $ | 63,999,586 | |
| * | Non-income producing security. |
| | |
| (a) | Rate shown is the seven day yield as of June 30, 2014. |
| | |
| † | Security position is either entirely or partially held in a segregated account as collateral for securities sold short, aggregating a total market value of $9,926,820. |
The Global Industry Classification Standard (GICS®) was developed by and/or is the exclusive property of MSCI, Inc. and Standard & Poor’s Financial Services LLC (“S&P”). GICS is a service mark of MSCI and S&P and has been licensed for use by U.S. Bancorp Fund Services, LLC.
See accompanying notes to financial statements.
| | Semi-Annual Report 2014 |
| | |
| Needham Aggressive Growth Fund | |
| Schedule of Securities Sold Short | |
| June 30, 2014 (Unaudited) | |
| | | Shares | | Market Value | |
| | | | | | | |
| Securities Sold Short (-6.4%) | | | | | | |
| | | | | | | |
| Airlines (-0.5%) | | | | | | |
| Allegiant Travel Co. | | | 2,500 | | | $ | 294,425 | |
| | | | | | | | | |
| Communications Equipment (-2.9%) | | | | | | | | |
| Ubiquiti Networks, Inc.* | | | 40,500 | | | | 1,830,195 | |
| | | | | | | | | |
| Semiconductors & Semiconductor Equipment (-0.5%) | | | | |
| QuickLogic Corp.* | | | 65,000 | | | | 336,050 | |
| | | | | | | | | |
| Software (-0.9%) | | | | | | | | |
| ANSYS, Inc.* | | | 8,000 | | | | 606,560 | |
| | | | | | | | | |
| Thrifts & Mortgage Finance (-1.6%) | | | | | | | | |
Federal Home Loan Mortgage Corp.* | | | 265,000 | | | | 1,022,900 | |
| | | | | | | | | |
| Total Securities Sold Short | | | | | | | | |
| (Proceeds $2,250,977) | | | | | | | 4,090,130 | |
| | | | | | | | | |
| Exchange Traded Funds Sold Short (-0.1%) | | | | | |
| Market Vectors Semiconductor ETF | | | 1,500 | | | | 74,235 | |
| | | | | | | | | |
| Total Exchange Traded Funds Sold Short | | | | | |
| (Proceeds $59,416) | | | | | | | 74,235 | |
| | | | | | | | | |
| Total Securities & Exchange Traded Funds Sold Short | | | | |
| (Proceeds $2,310,393) | | | | | | | 4,164,365 | |
| | | | | | | | | |
Total Securities & Exchange Traded Funds Sold Short (-6.5%) | | | | | | | (4,164,365 | ) |
| Total Investments (100.9%) | | | | | | | 64,558,931 | |
Other Assets in Excess of Liabilities (5.6%) | | | | | | | 3,605,020 | |
| Net Assets (100.0%) | | | | | | $ | 63,999,586 | |
| * | Non-income producing security. |
The Global Industry Classification Standard (GICS®) was developed by and/or is the exclusive property of MSCI, Inc. and Standard & Poor’s Financial Services LLC (“S&P”). GICS is a service mark of MSCI and S&P and has been licensed for use by U.S. Bancorp Fund Services, LLC.
See accompanying notes to financial statements.
Needham Small Cap Growth Fund
Schedule of Investments
June 30, 2014 (Unaudited)
| | | Shares | | | Market Value |
| Common Stocks (72.2%) | | | | | | |
| | | | | | | |
| Biotechnology (0.8%) | | | | | | |
| Exact Sciences Corp.* | | | 17,300 | | | $ | 294,619 | |
| | | | | | | | | |
| Capital Markets (0.8%) | | | | | | | | |
| FXCM, Inc. | | | 20,000 | | | | 299,200 | |
| | | | | | | | | |
| Commercial Services & Supplies (0.3%) | | | | | | | | |
| Clean Harbors, Inc.* | | | 2,000 | | | | 128,500 | |
| | | | | | | | | |
| Communications Equipment (15.8%) | | | | | | | | |
| Aruba Networks, Inc.* | | | 7,500 | | | | 131,400 | |
| Emulex Corp.* | | | 425,000 | | | | 2,422,500 | |
| KVH Industries, Inc.* | | | 129,700 | | | | 1,689,991 | |
| Riverbed Technology, Inc.* | | | 20,000 | | | | 412,600 | |
| Ruckus Wireless, Inc.* | | | 125,000 | | | | 1,488,750 | |
| | | | | | | | 6,145,241 | |
| | | | | | | | | |
| Electronic Equipment, Instruments & Components (11.2%) |
| Electro Scientific Industries, Inc. | | | 219,350 | | | | 1,493,774 | |
| II-VI, Inc.* † | | | 120,000 | | | | 1,735,200 | |
| TCP International Holdings Ltd.* | | | 3,862 | | | | 39,624 | |
| TTM Technologies, Inc.* † | | | 130,000 | | | | 1,066,000 | |
| | | | | | | | 4,334,598 | |
| | | | | | | | | |
| Energy Equipment & Services (0.4%) | | | | | | | | |
| C&J Energy Services, Inc.* | | | 2,000 | | | | 67,560 | |
| Superior Energy Services, Inc. | | | 2,000 | | | | 72,280 | |
| | | | | | | | 139,840 | |
| | | | | | | | | |
| Health Care Equipment & Supplies (0.6%) | | | | | |
| Cutera, Inc.* | | | 12,500 | | | | 129,875 | |
| Novadaq Technologies, Inc.* | | | 2,500 | | | | 41,200 | |
| Syneron Medical Ltd* | | | 5,000 | | | | 51,600 | |
| | | | | | | | 222,675 | |
| | | | | | | | | |
| Health Care Providers & Services (2.7%) | | | | | |
| Express Scripts Holding Co.* † | | | 15,000 | | | | 1,039,950 | |
| | | | | | | | | |
| Health Care Technology (0.3%) | | | | | | | | |
| Cerner Corp.* | | | 2,500 | | | | 128,950 | |
| | | | | | | | | |
| Hotels, Restaurants & Leisure (0.3%) | | | | | | | | |
| Life Time Fitness, Inc.* | | | 2,500 | | | | 121,850 | |
| | | | | | | | | |
| Internet Software & Services (5.3%) | | | | | | | | |
| Borderfree, Inc.* | | | 4,110 | | | | 68,103 | |
| Everyday Health, Inc.* | | | 9,200 | | | | 170,016 | |
| Reis, Inc. | | | 48,300 | | | | 1,018,164 | |
| TheStreet, Inc. | | | 330,000 | | | | 795,300 | |
| | | | | | | | 2,051,583 | |
| | | | | | | | | |
| Leisure Products (1.2%) | | | | | | | | |
| Black Diamond, Inc.* | | | 42,500 | | | | 476,850 | |
| | | | | | | | | |
| Media (1.2%) | | | | | | | | |
| World Wrestling Entertainment, Inc. | | | 40,000 | | | | 477,200 | |
| | | | | | | | | |
| Oil, Gas & Consumable Fuels (6.4%) | | | | | | | | |
| Eclipse Resources Corp.* | | | 395 | | | | 9,926 | |
| Hess Corp. † | | | 15,000 | | | | 1,483,350 | |
| WPX Energy, Inc.* | | | 42,000 | | | | 1,004,220 | |
| | | | | | | | 2,497,496 | |
| | | | | | | | | |
| Semiconductors & Semiconductor Equipment (17.6%) | |
| Entropic Communications, Inc.* | | | 220,000 | | | | 732,600 | |
| FormFactor, Inc.* | | | 445,000 | | | | 3,702,400 | |
| Mellanox Technologies Ltd* | | | 11,250 | | | | 392,175 | |
| MKS Instruments, Inc. | | | 30,000 | | | | 937,200 | |
| NeoPhotonics Corp.* | | | 96,300 | | | | 400,608 | |
| Peregrine Semiconductor Corp.* | | | 5,000 | | | | 34,300 | |
| Rudolph Technologies, Inc.* | | | 65,000 | | | | 642,200 | |
| | | | | | | | 6,841,483 | |
| | | | | | | | | |
| Software (0.3%) | | | | | | | | |
| BroadSoft, Inc.* | | | 5,000 | | | | 131,950 | |
| | | | | | | | | |
| Specialty Retail (0.5%) | | | | | | | | |
| Aeropostale, Inc.* | | | 10,000 | | | | 34,900 | |
| American Eagle Outfitters, Inc. | | | 12,500 | | | | 140,250 | |
| Francesca’s Holdings Corp.* | | | 2,000 | | | | 29,480 | |
| | | | | | | | 204,630 | |
| | | | | | | | | |
| Technology Hardware, Storage & Peripherals (3.6%) | |
| Super Micro Computer, Inc.* | | | 56,000 | | | | 1,415,120 | |
| | | | | | | | | |
| Thrifts & Mortgage Finance (1.9%) | | | | | | | | |
| Tree.com, Inc.* | | | 25,000 | | | | 728,500 | |
| | | | | | | | | |
| Trading Companies & Distributors (1.0%) | | | | | |
| Air Lease Corp. | | | 10,000 | | | | 385,800 | |
| | | | | | | | | |
| Total Common Stocks | | | | | | | | |
| (Cost $26,965,388) | | | | | | | 28,066,035 | |
See accompanying notes to financial statements.
Needham Small Cap Growth Fund
Schedule of Investments
June 30, 2014 (Unaudited)
| | | Shares | | | Market Value | |
| Common Stocks - Continued | | | | | | |
| Short-Term Investment (27.1%) | | | | | | |
| | | | | | | |
| Money Market Fund (27.1%) | | | | | | |
| Dreyfus Treasury Prime Cash Management 0.00% (a) | | | | | | |
| (Cost $10,545,496) | | | 10,545,496 | | | $ | 10,545,496 | |
| | | | | | | | | |
| Total Investments (99.3%) | | | | | | | | |
| (Cost $37,510,884) | | | | | | | 38,611,531 | |
| Total Securities Sold Short (-3.8%) (Proceeds $1,435,452) | | | | | | | (1,488,180 | ) |
| Other Assets in Excess of Liabilities (4.5%) | | | | | | | 1,742,662 | |
| Net Assets (100.0%) | | | | | | $ | 38,866,013 | |
| * | Non-income producing security. |
| (a) | Rate shown is the seven day yield as of June 30, 2014. |
| † | Security position is either entirely or partially held in a segregated account as collateral for securities sold short, aggregating a total market value of $449,740. |
The Global Industry Classification Standard (GICS®) was developed by and/or is the exclusive property of MSCI, Inc. and Standard & Poor’s Financial Services LLC (“S&P”). GICS is a service mark of MSCI and S&P and has been licensed for use by U.S. Bancorp Fund Services, LLC.
See accompanying notes to financial statements.
Needham Small Cap Growth Fund
Schedule of Securities Sold Short
June 30, 2014 (Unaudited)
| | | Shares | | | Market Value | |
| Securities Sold Short (-1.0%) | | | | | | |
| | | | | | | |
| Communications Equipment (-1.0%) | | | | | | |
| Ubiquiti Networks, Inc.* | | | 9,000 | | | $ | 406,710 | |
| | | | | | | | | |
| Total Securities Sold Short | | | | | | | | |
| (Proceeds $356,367) | | | | | | | 406,710 | |
| | | | | | | | | |
| Exchange Traded Funds Sold Short (-2.8%) | | | | | |
| iShares Russell 2000 ETF | | | 3,000 | | | | 356,430 | |
| iShares Russell 2000 Growth ETF | | | 3,000 | | | | 415,260 | |
| iShares Russell 2000 Value ETF | | | 3,000 | | | | 309,780 | |
| | | | | | | | | |
| Total Exchange Traded Funds Sold Short | | | | | | | | |
| (Proceeds $1,079,085) | | | | | | | 1,081,470 | |
| | | | | | | | | |
| Total Securities & Exchange Traded Funds Sold Short | | | | | |
| (Proceeds $1,435,452) | | | | | | | 1,488,180 | |
| | | | | | | | | |
| Total Securities & Exchange Traded Funds Sold Short (-3.8%) | | | | | | | (1,488,180 | ) |
| Total Investments (99.3%) | | | | | | | 38,611,531 | |
| Other Assets in Excess of Liabilities (4.5%) | | | | | | | 1,742,662 | |
| Net Assets (100.0%) | | | | | | $ | 38,866,013 | |
| * | Non-income producing security. |
The Global Industry Classification Standard (GICS®) was developed by and/or is the exclusive property of MSCI, Inc. and Standard & Poor’s Financial Services LLC (“S&P”). GICS is a service mark of MSCI and S&P and has been licensed for use by U.S. Bancorp Fund Services, LLC.
See accompanying notes to financial statements.
Statements of Assets and Liabilities
June 30, 2014 (Unaudited)
| | | | | | Needham | | | Needham | |
| | | Needham | | | Aggressive | | | Small Cap | |
| | | Growth Fund | | | Growth Fund | | | Growth Fund | |
| Assets | | | | | | | | | |
Investments, at Value
(Cost $72,360,336, $31,894,906, $37,510,884) | | $ | 146,212,025 | | | $ | 64,558,931 | | | $ | 38,611,531 | |
| Receivables: | | | | | | | | | | | | |
| Deposit with Broker for Securities Sold Short | | | 3,669,398 | | | | 3,768,986 | | | | 536,421 | |
| Dividends and Interest | | | 54,680 | | | | 2,300 | | | | 3,063 | |
| Fund Shares Sold | | | 7,262 | | | | 1,551 | | | | 2,947 | |
| Investment Securities Sold | | | 581,231 | | | | 138,143 | | | | 1,333,148 | |
| Prepaid Expenses | | | 25,546 | | | | 13,829 | | | | 22,197 | |
| Total Assets | | | 150,550,142 | | | | 68,483,740 | | | | 40,509,307 | |
| | | | | | | | | | | | | |
| Liabilities | | | | | | | | | | | | |
Securities Sold Short, at Value
(Proceeds $2,755,549, $2,310,393, $1,435,452) | | | 3,860,884 | | | | 4,164,365 | | | | 1,488,180 | |
| Payables: | | | | | | | | | | | | |
| Investment Securities Purchased | | | 234,960 | | | | 142,101 | | | | 62,185 | |
| Fund Shares Redeemed | | | 58,101 | | | | 44,905 | | | | 4,561 | |
| Due to Adviser | | | 146,389 | | | | 64,257 | | | | 40,281 | |
| Distribution Fees | | | 29,560 | | | | 12,960 | | | | 7,956 | |
| Administration and Accounting Fees | | | 24,438 | | | | 12,210 | | | | 7,923 | |
| Transfer Agent Fees | | | 10,071 | | | | 8,787 | | | | 8,384 | |
| Accrued Expenses and Other Liabilities | | | 50,403 | | | | 34,569 | | | | 23,824 | |
| Total Liabilities | | | 4,414,806 | | | | 4,484,154 | | | | 1,643,294 | |
| | | | | | | | | | | | | |
| Net Assets | | $ | 146,135,336 | | | $ | 63,999,586 | | | $ | 38,866,013 | |
Shares Issued and Outstanding $0.001 Par Value
(Authorized 800,000,000,100,000,000 and 100,000,000 respectively) | | | 3,118,852 | | | | 2,760,453 | | | | 2,524,743 | |
Net Asset Value, Offering and Redemption Price Per Share(a) | | $ | 46.86 | | | $ | 23.18 | | | $ | 15.39 | |
| | | | | | | | | | | | | |
| Components of Net Assets | | | | | | | | | | | | |
| Paid-in Capital | | | 68,076,731 | | | | 34,516,035 | | | | 34,611,559 | |
| Accumulated Net Investment Loss | | | (838,312 | ) | | | (538,579 | ) | | | (292,233 | ) |
| Accumulated Net Realized Gain (Loss) from Investments, Securities Sold Short, Foreign Currency Transactions and Currency | | | 6,150,563 | | | | (787,908 | ) | | | 3,498,768 | |
| Net Unrealized Appreciation on Investment Securities and Securities Sold Short | | | 72,746,354 | | | | 30,810,053 | | | | 1,047,919 | |
| Net Unrealized Depreciation on Foreign Currency Transactions and Currency | | | — | | | | (15 | ) | | | — | |
| Total Net Assets | | $ | 146,135,336 | | | $ | 63,999,586 | | | $ | 38,866,013 | |
(a) Subject to certain exceptions, a 2% redemption fee is imposed upon shares redeemed within 60 days of their purchase. See Note 2 of the notes to finanical statements.
See accompanying notes to financial statements.
Statements of Operations
For the six months ended June 30, 2014 (Unaudited)
| | | | | | Needham | | | Needham | |
| | | Needham | | | Aggressive | | | Small Cap | |
| | | Growth Fund | | | Growth Fund | | | Growth Fund | |
| Investment Income | | | | | | | | | |
| Dividends | | $ | 384,374 | | | $ | 135,979 | | | $ | 97,635 | |
| Interest | | | — | | | | — | | | | 1 | |
| Total Investment Income | | | 384,374 | | | | 135,979 | | | | 97,636 | |
| | | | | | | | | | | | | |
| Expenses | | | | | | | | | | | | |
| Investment Advisory Fees | | | 881,620 | | | | 400,103 | | | | 248,175 | |
| Distribution Fees | | | 176,324 | | | | 80,021 | | | | 49,635 | |
| Administration and Accounting Fees | | | 74,842 | | | | 37,347 | | | | 23,888 | |
| Audit Fees | | | 17,843 | | | | 12,517 | | | | 12,543 | |
| Chief Compliance Officer Fees | | | 9,947 | | | | 4,913 | | | | 3,735 | |
| Custodian Fees | | | 4,624 | | | | 3,814 | | | | 4,368 | |
| Directors’ Fees | | | 17,915 | | | | 8,265 | | | | 5,201 | |
Dividend Expense(1) | | | — | | | | 531 | | | | 1,593 | |
| Filing Fees | | | 11,367 | | | | 14,046 | | | | 10,711 | |
Interest Expense(1) | | | 16,162 | | | | 53,735 | | | | 1,064 | |
| Legal Fees | | | 22,223 | | | | 10,047 | | | | 5,737 | |
| Printing Fees | | | 10,712 | | | | 6,861 | | | | 6,963 | |
| Transfer Agent Fees | | | 30,965 | | | | 27,018 | | | | 25,696 | |
| Other Expenses | | | 26,867 | | | | 15,984 | | | | 7,360 | |
| Total Expenses | | | 1,301,411 | | | | 675,202 | | | | 406,669 | |
| Fees Waived by Investment Adviser | | | — | | | | (644 | ) | | | (16,800 | ) |
| Net Expenses | | | 1,301,411 | | | | 674,558 | | | | 389,869 | |
| Net Investment Loss | | | (917,037 | ) | | | (538,579 | ) | | | (292,233 | ) |
| | | | | | | | | | | | | |
| Net Realized/Unrealized Gain (Loss) from Investments, Securities Sold Short, Foreign Currency Transactions and Currency | | | | | | | | | | | | |
| Net Realized Gain from Investments | | | 3,369,309 | | | | 5,622,319 | | | | 3,109,346 | |
| Net Realized Gain (Loss) from Securities Sold Short | | | (572,183 | ) | | | (1,730,070 | ) | | | 18,300 | |
| Net Realized Loss from Foreign Currency Transactions and Currency | | | — | | | | (1,221 | ) | | | — | |
Change in Unrealized Appreciation (Depreciation) on Investments and Securities Sold Short | | | 3,670,349 | | | | (2,036,694 | ) | | | (3,588,573 | ) |
Change in Unrealized Depreciation on Foreign Currency Transactions and Currency | | | — | | | | (2 | ) | | | — | |
| Net Realized/Unrealized Gain (Loss) from Investments, Securities Sold Short, Foreign Currency Transactions and Currency | | | 6,467,475 | | | | 1,854,332 | | | | (460,927 | ) |
| Change in Net Assets Resulting from Operations | | $ | 5,550,438 | | | $ | 1,315,753 | | | $ | (753,160 | ) |
(1) Expense related to securities sold short.
See accompanying notes to financial statements.
Statements of Changes in Net Assets
| | | | | | | | | | | | | |
| | | | | | | | | Needham Aggressive | | | Needham Small Cap | |
| | | Needham Growth Fund | | | Growth Fund | | | Growth Fund | |
| | | Six Months | | | Year Ended | | | Six Months | | | Year Ended | | | Six Months | | | Year Ended | |
| | | Ended June 30, | | | December 31, | | | Ended June 30, | | | December 31, | | | Ended June 30, | | | December 31, | |
| | | 2014 | | | 2013 | | | 2014 | | | 2013 | | | 2014 | | | 2013 | |
| | | (Unaudited) | | | | | | (Unaudited) | | | | | | (Unaudited) | | | | |
| Change in Net Assets | | | | | | | | | | | | | | | | | | |
| Operations: | | | | | | | | | | | | | | | | | | |
| Net Investment Loss | | $ | (917,037 | ) | | $ | (1,714,924 | ) | | $ | (538,579 | ) | | $ | (1,128,271 | ) | | $ | (292,233 | ) | | $ | (884,364 | ) |
| Net Realized Gain from Investments, Securities Sold Short, Foreign Currency Transactions, and Currency | | | 2,797,126 | | | | 4,522,860 | | | | 3,891,028 | | | | 2,564,862 | | | | 3,127,646 | | | | 1,637,125 | |
| Net Change in Unrealized Appreciation (Depreciation) on Investments, Securities Sold Short, Foreign Currency Transactions and Currency | | | 3,670,349 | | | | 35,656,762 | | | | (2,036,696 | ) | | | 18,226,340 | | | | (3,588,573 | ) | | | 10,995,485 | |
| Change in Net Assets Resulting from Operations | | | 5,550,438 | | | | 38,464,698 | | | | 1,315,753 | | | | 19,662,931 | | | | (753,160 | ) | | | 11,748,246 | |
| | | | | | | | | | | | | | | | | | | | | | | | | |
| Distributions to Shareholders from: | | | | | | | | | | | | | | | | | | | | | | | | |
| Capital Gains | | | — | | | | (820,726 | ) | | | — | | | | — | | | | — | | | | — | |
| Total Distributions to Shareholders | | | — | | | | (820,726 | ) | | | — | | | | — | | | | — | | | | — | |
| | | | | | | | | | | | | | | | | | | | | | | | | |
| Capital Transactions: | | | | | | | | | | | | | | | | | | | | | | | | |
| Shares Issued | | | 6,915,020 | | | | 17,889,415 | | | | 1,912,269 | | | | 7,195,084 | | | | 2,914,918 | | | | 4,297,099 | |
| Shares Issued in Reinvestment of Distribution | | | — | | | | 2,426,683 | | | | — | | | | — | | | | — | | | | — | |
| Shares Redeemed | | | (8,023,668 | ) | | | (29,836,034 | ) | | | (7,689,030 | ) | | | (25,160,046 | ) | | | (7,246,090 | ) | | | (32,714,268 | ) |
| Redemption Fees | | | 52 | | | | 8,278 | | | | 1,298 | | | | 15,048 | | | | 49 | | | | 4,787 | |
| Change in Net Assets from Capital Transactions | | | (1,108,596 | ) | | | (9,511,658 | ) | | | (5,775,463 | ) | | | (17,949,914 | ) | | | (4,331,123 | ) | | | (28,412,382 | ) |
| | | | | | | | | | | | | | | | | | | | | | | | | |
| Change in Net Assets | | | 4,441,842 | | | | 28,132,314 | | | | (4,459,710 | ) | | | 1,713,017 | | | | (5,084,283 | ) | | | (16,664,136 | ) |
| | | | | | | | | | | | | | | | | | | | | | | | | |
| Net Assets | | | | | | | | | | | | | | | | | | | | | | | | |
| Beginning of Period | | | 141,693,494 | | | | 113,561,180 | | | | 68,459,296 | | | | 66,746,279 | | | | 43,950,296 | | | | 60,614,432 | |
| End of Period | | $ | 146,135,336 | | | $ | 141,693,494 | | | $ | 63,999,586 | | | $ | 68,459,296 | | | $ | 38,866,013 | | | $ | 43,950,296 | |
| Accumulated Net Investment Gain (Loss) | | $ | (838,312 | ) | | $ | 78,725 | | | $ | (538,579 | ) | | $ | — | | | $ | (292,233 | ) | | $ | — | |
| | | | | | | | | | | | | | | | | | | | | | | | | |
| Share Transaction: | | | | | | | | | | | | | | | | | | | | | | | | |
| Number of Shares Issued | | | 152,606 | | | | 462,075 | | | | 85,245 | | | | 365,831 | | | | 188,473 | | | | 318,218 | |
| Number of Shares Reinvested | | | — | | | | 65,282 | | | | — | | | | — | | | | — | | | | — | |
| Number of Shares Redeemed | | | (178,047 | ) | | | (756,536 | ) | | | (346,161 | ) | | | (1,358,357 | ) | | | (475,856 | ) | | | (2,467,199 | ) |
| Change in Shares | | | (25,441 | ) | | | (229,179 | ) | | | (260,916 | ) | | | (992,526 | ) | | | (287,383 | ) | | | (2,148,981 | ) |
See accompanying notes to financial statements.
Needham Growth Fund
Financial Highlights
| | | | | | | | | | | | | | | | | | | |
| | | Six Months | | | | | | | | | | | | | | | | |
| | | Ended June 30, | | | | |
| (For a Share Outstanding | | 2014 | | | Year Ended December 31, | |
| Throughout each Period) | | (Unaudited) | | | 2013 | | | 2012 | | | 2011 | | | 2010 | | | 2009 | |
| Net Asset Value, Beginning of Year | | $ | 45.06 | | | $ | 33.66 | | | $ | 32.78 | | | $ | 39.11 | | | $ | 29.77 | | | $ | 20.27 | |
| Investment Operations | | | | | | | | | | | | | | | | | | | | | | | | |
| Net Investment Loss | | | (0.29 | ) | | | (0.54 | ) | | | (0.24 | ) | | | (0.58 | ) | | | (0.60 | ) | | | (0.43 | ) |
| Net Realized and Unrealized Gain (Loss) on Investments | | | 2.09 | | | | 12.20 | | | | 4.31 | | | | (3.79 | ) | | | 9.94 | | | | 9.93 | |
| Total from Investment Operations | | | 1.80 | | | | 11.66 | | | | 4.07 | | | | (4.37 | ) | | | 9.34 | | | | 9.50 | |
| | | | | | | | | | | | | | | | | | | | | | | | | |
| Less Distributions | | | | | | | | | | | | | | | | | | | | | | | | |
| Net Realized Gains | | | — | | | | (0.26 | ) | | | (3.19 | ) | | | (1.97 | ) | | | — | | | | — | |
| Total Distributions | | | — | | | | (0.26 | ) | | | (3.19 | ) | | | (1.97 | ) | | | — | | | | — | |
| | | | | | | | | | | | | | | | | | | | | | | | | |
| Capital Contributions | | | | | | | | | | | | | | | | | | | | | | | | |
| Redemption Fees | | | — | (a) | | | — | (a) | | | — | (a) | | | 0.01 | | | | — | (a) | | | — | (a) |
| Total Capital Contributions | | | — | (a) | | | — | (a) | | | — | (a) | | | 0.01 | | | | — | (a) | | | — | (a) |
| Net Asset Value, End of Year | | $ | 46.86 | | | $ | 45.06 | | | $ | 33.66 | | | $ | 32.78 | | | $ | 39.11 | | | $ | 29.77 | |
| | | | | | | | | | | | | | | | | | | | | | | | | |
| Total Return | | | 3.99 | % | | | 34.68 | % | | | 12.80 | % | | | (10.94 | )% | | | 31.37 | % | | | 46.87 | % |
| Net Assets, End of Year (000’s) | | $ | 146,135 | | | $ | 141,693 | | | $ | 113,561 | | | $ | 125,966 | | | $ | 159,805 | | | $ | 119,175 | |
| Ratios/Supplemental Data | | | | | | | | | | | | | | | | | | | | | | | | |
| Ratio of Total Expenses to Average Net Assets | | | 1.85 | %(b) | | | 1.89 | % | | | 1.94 | % | | | 1.81 | % | | | 2.11 | % | | | 2.03 | % |
| Ratio of Total Expenses to Average Net Assets (before interest and dividend expense) | | | 1.82 | %(b) | | | 1.82 | % | | | 1.82 | % | | | 1.78 | % | | | 2.00 | % | | | 2.00 | % |
| Ratio of Total Expenses to Average Net Assets (before waiver and reimbursement of expenses) | | | 1.85 | %(b) | | | 1.89 | % | | | 1.94 | % | | | 1.81 | % | | | 2.11 | % | | | 2.08 | % |
| Ratio of Total Investment Income (Loss) to Average Net Assets | | | (1.30 | )%(b) | | | (1.30 | )% | | | (0.65 | )% | | | (1.41 | )% | | | (1.85 | )% | | | (1.71 | )% |
| Ratio of Total Investment Income (Loss) to Average Net Assets (before waivers and reimbursements of expenses) | | | (1.30 | )%(b) | | | (1.30 | )% | | | (0.65 | )% | | | (1.41 | )% | | | (1.85 | )% | | | (1.76 | )% |
| Portfolio turnover rate | | | 8 | %(c) | | | 12 | % | | | 17 | % | | | 29 | % | | | 62 | % | | | 29 | % |
(a) Value is less than $0.005 per share.
(b) Annualized for periods less than one year.
(c) Not annualized for periods less than one year.
See accompanying notes to financial statements.
Needham Aggressive Growth Fund
Financial Highlights
| | | | | | | | | | | | | | | | | | | |
| | | Six Months | | | | | | | | | | | | | | | | |
| | | Ended June 30, | | | | |
| (For a Share Outstanding | | 2014 | | | Year Ended December 31, | |
| Throughout each Period) | | (Unaudited) | | | 2013 | | | 2012 | | | 2011 | | | 2010 | | | 2009 | |
| Net Asset Value, Beginning of Year | | $ | 22.66 | | | $ | 16.63 | | | $ | 14.52 | | | $ | 17.14 | | | $ | 12.38 | | | $ | 9.45 | |
| Investment Operations | | | | | | | | | | | | | | | | | | | | | | | | |
| Net Investment Loss | | | (0.20 | ) | | | (0.37 | ) | | | (0.29 | ) | | | (0.34 | ) | | | (0.11 | ) | | | (0.19 | ) |
| Net Realized and Unrealized Gain (Loss) on Investments | | | 0.72 | | | | 6.40 | | | | 2.41 | | | | (2.04 | ) | | | 4.98 | | | | 3.13 | |
| Total from Investment Operations | | | 0.52 | | | | 6.03 | | | | 2.12 | | | | (2.38 | ) | | | 4.87 | | | | 2.94 | |
| | | | | | | | | | | | | | | | | | | | | | | | | |
| Less Distributions | | | | | | | | | | | | | | | | | | | | | | | | |
| Net Realized Gains | | | — | | | | — | | | | (0.01 | ) | | | (0.25 | ) | | | (0.11 | ) | | | (0.02 | ) |
| Total Distributions | | | — | | | | — | | | | (0.01 | ) | | | (0.25 | ) | | | (0.11 | ) | | | (0.02 | ) |
| | | | | | | | | | | | | | | | | | | | | | | | | |
| Capital Contributions | | | | | | | | | | | | | | | | | | | | | | | | |
| Redemption Fees | | | — | (a) | | | — | (a) | | | — | (a) | | | 0.01 | | | | — | (a) | | | 0.01 | |
| Total Capital Contributions | | | — | (a) | | | — | (a) | | | — | (a) | | | 0.01 | | | | — | (a) | | | 0.01 | |
| Net Asset Value, End of Year | | $ | 23.18 | | | $ | 22.66 | | | $ | 16.63 | | | $ | 14.52 | | | $ | 17.14 | | | $ | 12.38 | |
| | | | | | | | | | | | | | | | | | | | | | | | | |
| Total Return | | | 2.29 | % | | | 36.26 | % | | | 14.61 | % | | | (13.77 | )% | | | 39.42 | % | | | 31.18 | % |
| Net Assets, End of Year (000’s) | | $ | 64,000 | | | $ | 68,459 | | | $ | 66,746 | | | $ | 90,170 | | | $ | 106,551 | | | $ | 22,819 | |
| Ratios/Supplemental Data | | | | | | | | | | | | | | | | | | | | | | | | |
| Ratio of Total Expenses to Average Net Assets | | | 2.11 | %(b) | | | 2.07 | % | | | 2.06 | % | | | 1.83 | % | | | 2.09 | % | | | 2.50 | % |
| Ratio of Total Expenses to Average Net Assets (before interest and dividend expense) | | | 1.94 | %(b) | | | 1.91 | % | | | 1.89 | % | | | 1.80 | % | | | 2.05 | % | | | 2.49 | % |
| Ratio of Total Expenses to Average Net Assets (before waiver and reimbursement of expenses) | | | 2.11 | %(b) | | | 2.07 | % | | | 2.06 | % | | | 1.83 | % | | | 2.09 | % | | | 2.50 | % |
| Ratio of Total Investment Income (Loss) to Average Net Assets | | | (1.68 | )%(b) | | | (1.74 | )% | | | (1.40 | )% | | | (1.62 | )% | | | (1.77 | )% | | | (2.39 | )% |
| Ratio of Total Investment Income (Loss) to Average Net Assets (before waivers and reimbursements of expenses) | | | (1.68 | )%(b) | | | (1.74 | )% | | | (1.40 | )% | | | (1.62 | )% | | | (1.77 | )% | | | (2.39 | )% |
| Portfolio turnover rate | | | 12 | %(c) | | | 20 | % | | | 15 | % | | | 45 | % | | | 55 | % | | | 70 | % |
(a) Value is less than $0.005 per share.
(b) Annualized for periods less than one year.
(c) Not annualized for periods less than one year.
See accompanying notes to financial statements.
Needham Small Cap Growth Fund
Financial Highlights
| | | | | | | | | | | | | | | | | | | |
| | | Six Months | | | | | | | | | | | | | | | | |
| | | Ended June 30, | | | | |
| (For a Share Outstanding | | 2014 | | | Year Ended December 31, | |
| Throughout each Period) | | (Unaudited) | | | 2013 | | | 2012 | | | 2011 | | | 2010 | | | 2009 | |
| Net Asset Value, Beginning of Year | | $ | 15.63 | | | $ | 12.22 | | | $ | 11.26 | | | $ | 14.21 | | | $ | 10.73 | | | $ | 7.61 | |
| Investment Operations | | | | | | | | | | | | | | | | | | | | | | | | |
| Net Investment Loss | | | (0.12 | ) | | | (0.31 | ) | | | (0.15 | ) | | | (0.27 | ) | | | (0.08 | ) | | | (0.20 | ) |
| Net Realized and Unrealized Gain (Loss) on Investments | | | (0.12 | ) | | | 3.72 | | | | 1.11 | | | | (2.04 | ) | | | 3.99 | | | | 3.33 | |
| Total from Investment Operations | | | (0.24 | ) | | | 3.41 | | | | 0.96 | | | | (2.31 | ) | | | 3.91 | | | | 3.13 | |
| | | | | | | | | | | | | | | | | | | | | | | | | |
| Less Distributions | | | | | | | | | | | | | | | | | | | | | | | | |
| Net Realized Gains | | | — | | | | — | | | | — | | | | (0.62 | ) | | | (0.43 | ) | | | (0.01 | ) |
| Return of Capital | | | — | | | | — | | | | — | | | | (0.02 | ) | | | — | | | | — | |
| Total Distributions | | | — | | | | — | | | | — | | | | (0.64 | ) | | | (0.43 | ) | | | (0.01 | ) |
| | | | | | | | | | | | | | | | | | | | | | | | | |
| Capital Contributions | | | | | | | | | | | | | | | | | | | | | | | | |
| Redemption Fees | | | — | (a) | | | — | (a) | | | — | (a) | | | — | (a) | | | — | (a) | | | — | (a) |
| Total Capital Contributions | | | — | (a) | | | — | (a) | | | — | (a) | | | — | (a) | | | — | (a) | | | — | (a) |
| Net Asset Value, End of Year | | $ | 15.39 | | | $ | 15.63 | | | $ | 12.22 | | | $ | 11.26 | | | $ | 14.21 | | | $ | 10.73 | |
| | | | | | | | | | | | | | | | | | | | | | | | | |
| Total Return | | | (1.54 | )% | | | 27.91 | % | | | 8.53 | % | | | (16.10 | )% | | | 36.89 | % | | | 41.18 | % |
| Net Assets, End of Year (000’s) | | $ | 38,866 | | | $ | 43,950 | | | $ | 60,614 | | | $ | 82,675 | | | $ | 98,911 | | | $ | 11,303 | |
| Ratios/Supplemental Data | | | | | | | | | | | | | | | | | | | | | | | | |
| Ratio of Total Expenses to Average Net Assets | | | 1.96 | %(b) | | | 2.06 | % | | | 2.04 | % | | | 1.84 | % | | | 2.16 | % | | | 2.57 | % |
| Ratio of Total Expenses to Average Net Assets (before interest and dividend expense) | | | 1.95 | %(b) | | | 1.96 | % | | | 1.92 | % | | | 1.81 | % | | | 2.08 | % | | | 2.50 | % |
| Ratio of Total Expenses to Average Net Assets (before waiver and reimbursement of expenses) | | | 2.05 | %(b) | | | 2.09 | % | | | 2.04 | % | | | 1.84 | % | | | 2.16 | % | | | 3.02 | % |
| Ratio of Total Investment Income (Loss) to Average Net Assets | | | (1.47 | )%(b) | | | (1.80 | )% | | | (1.02 | )% | | | (1.57 | )% | | | (1.88 | )% | | | (2.50 | )% |
| Ratio of Total Investment Income (Loss) to Average Net Assets (before waivers and reimbursements of expenses) | | | (1.56 | )%(b) | | | (1.83 | )% | | | (1.02 | )% | | | (1.57 | )% | | | (1.88 | )% | | | (2.95 | )% |
| Portfolio turnover rate | | | 36 | %(c) | | | 58 | % | | | 72 | % | | | 105 | % | | | 65 | % | | | 154 | % |
(a) Value is less than $0.005 per share.
(b) Annualized for periods less than one year.
(c) Not annualized for periods less than one year.
See accompanying notes to financial statements.
| | Semi-Annual Report 2014 |
| | |
| Notes to Financial Statements (Unaudited) | |
Needham Growth Fund (“NGF”), Needham Aggressive Growth Fund (“NAGF”) and Needham Small Cap Growth Fund (“NSCGF”) (each, a “Portfolio” and collectively, the “Portfolios”), are portfolios of The Needham Funds, Inc. (the “Company”), which is registered under the Investment Company Act of 1940, as amended (the “1940 Act”), as a diversified, open-end management investment company. The Company was organized as a Maryland corporation on October 12, 1995.
2. Significant Accounting Policies
The following is a summary of significant accounting policies followed by the Company in the preparation of its financial statements. These policies are in conformity with accounting principles generally accepted in the United States of America (“GAAP”).
Security Valuation: Portfolio securities for which market quotations are readily available are stated at the last sale price reported by the principal exchange for the security as of the exchange’s close of business. Securities for which no sale has taken place during the day and securities which are not listed on an exchange are valued at the mean of the highest closing bid and lowest asked prices. Exchange traded options are valued at the last reported sale price on any exchange on which the option is principally traded. If no sales are reported on a particular day, the options will be valued at the mean between the highest closing bid and lowest asked prices across the exchanges where the option is traded. Non-exchange traded options will also be valued at the mean between the last bid and asked quotations. For options where market quotations are not readily available, value will be determined in accordance with the fair value procedures described below. All other securities and assets for which (a) market quotations are not readily available, such as in the case of a market or technical disruption that prevents the normal trading of a security held by a Portfolio, (b) market quotations are believed to be unrepresentative of fair market value, such as in the case of a thinly traded security, or (c) valuation is normally made at the last sale price on a foreign exchange and a significant event occurs after the close of that exchange but before the New York Stock Exchange closes, are valued at their fair value as determined in good faith by the Board of Directors (the “Board”) in accordance with Fair Value Procedures established by the Board. The Company’s Fair Value Procedures are implemented and monitored by a Fair Value Committee (the “Committee”) designated by the Board. When a security is valued in accordance with the Fair Value Procedures, the Committee determines a value after taking into consideration any relevant information that is reasonably available to the Committee. Some of the more common reasons that may necessitate that a security be valued pursuant to these Fair Value Procedures include, but are not limited to: the security’s trading has been halted or suspended; the security has been de-listed from a national exchange; the security’s primary trading market is temporarily closed at a time when under normal conditions it would be open; or the security’s primary pricing source is not able or willing to provide a price. The assets of each Portfolio may also be valued on the basis of valuations provided by a pricing service approved by, or on behalf of, the Board.
Portfolio securities listed or traded on securities exchanges, including American Depositary Receipts (“ADRs”), are valued at the closing price on the exchange or system where the security is principally traded or at the NASDAQ Official Closing Price. If there have been no sales for that day on the exchange or system, a security is valued at the mean of the highest closing bid and lowest asked prices on the exchange or system where the security is principally traded.
The Portfolios did not value any securities in accordance with the Fair Value Procedures as of June 30, 2014.
Investment Transactions: Changes in holdings of portfolio securities for the Portfolios shall be reflected no later than in the first calculation on the first business day following the trade date for purposes of calculating each Portfolio’s daily net asset value per share. However, for financial reporting purposes, portfolio security transactions are reported on the trade date of the last business day of the reporting period. The cost (proceeds) of investments sold (bought to cover) is determined on a specific identification basis for the purpose of determining gains or losses on sales and buys to cover short positions. Dividend income, distributions to shareholders and dividend expense from securities sold short are recorded on the ex-dividend date. Interest income and interest expense from securities sold short is recorded on an accrual basis.
Foreign Currency: Foreign currency amounts are translated into U.S. dollars as follows: (i) assets and liabilities at the rate of exchange at the end of the respective period; and (ii) purchases and sales of securities and income and expenses at the rate of exchange prevailing on the dates of such transactions. The portion of realized gains arising from changes in the exchange rates are included with the net realized and unrealized gain or loss on investments. Principal risks associated with such transactions include the movement in value of the foreign currency relative to the U.S. dollar and the ability of the counterparty to perform.
The Portfolios may also invest in forward currency contracts. Fluctuations in the value of such forward currency transactions are recorded daily as unrealized gain or loss; realized gain or loss includes net gain or loss on transactions that have terminated by settlement. These instruments involve securities and currency market risk, credit risk, or both kinds of risks, in excess of the amount recognized in the statements of assets and liabilities. Risks also arise from the possible inability of counterparties to meet the terms of their contracts. The Portfolios did not enter into forward currency contracts during the six months ended June 30, 2014.
Notes to Financial Statements (Unaudited) (Continued)
Allocation of Expenses: Expenses directly attributable to a Portfolio are charged directly to that Portfolio, while expenses which are attributable to more than one Portfolio are allocated among the respective Portfolios based upon relative net assets or some other reasonable method.
Use of Estimates: The preparation of financial statements in accordance with GAAP requires management to make estimates and assumptions that affect the reported amounts and disclosures in the financial statements. Actual results could differ from those estimates and those differences could be material.
Distributions to Shareholders: Dividends from net investment income, if any, are declared and paid annually for the Portfolios. Distributable net realized gains, if any, are declared and distributed at least annually.
Redemption Fees: The Portfolios reserve the right to assess a redemption fee for shares held 60 days or less. The shareholder will be charged a fee equal to 2.00% of the value of the shares redeemed. The redemption fee is intended to offset excess brokerage commissions and other costs associated with fluctuations in asset levels and cash flows caused by frequent trading by shareholders. The applicability of the redemption fee will be calculated using a first-in first-out method, which means the oldest shares will be redeemed first, followed by the redemption of more recently acquired shares. For the six months ended June 30, 2014, NGF, NAGF and NSCGF had contributions to capital due to redemption fees in the amounts of $52, $1,298 and $49, respectively.
Federal Income Taxes: It is the policy of each Portfolio to continue to qualify as a regulated investment company, as defined in the Internal Revenue Code, by complying with the provisions available to certain investment companies and to make distributions of net investment income and net realized capital gains sufficient to relieve it from all, or substantially all, federal income taxes. Accordingly, no provision for income taxes has been made in the Portfolios’ financial statements.
As of June 30, 2014, the Portfolios did not have any tax positions that did not meet the “more-likely-than-not” threshold of being sustained by the applicable tax authority. Generally, tax authorities can examine all the tax returns filed for the last three years.
Fair Value Measurements: Valuation inputs used to determine the value of the Portfolios’ investments are summarized in the three broad levels listed below:
Level 1 — quoted prices in active markets for identical assets.
Level 2 — other significant inputs (including quoted prices of similar securities, interest rates, prepayment speeds, credit risk, etc.).
Level 3 — significant unobservable inputs (which may include the Portfolios’ own assumptions in determining the fair value of investments).
The inputs or methodology used to value securities are not necessarily an indication of the risk associated with investing in those securities.
Portfolio securities listed or traded on securities exchanges, including ADRs, are valued at the closing price on the exchange or system where the security is principally traded or at the NASDAQ Official Closing Price. If there have been no sales for that day on the exchange or system, a security is valued at the mean of the highest closing bid and lowest asked prices on the exchange or system where the security is principally traded. These valuations are typically categorized as Level 1 in the fair value hierarchy.
In accordance with procedures adopted by the Board, fair value pricing may be used if events materially affecting the value of foreign securities occur between the time the exchange on which they are traded closes and the time the Portfolios’ net asset values are calculated. These valuations are categorized as Level 2 in the fair value hierarchy. As of June 30, 2014, the Portfolios did not hold any Level 2 securities.
The following is a summary categorization, as of June 30, 2014, of each Portfolio’s investments based on the level of inputs utilized in determining the value of such investments:
| | | LEVEL 1 - Quoted Prices(1)(3) | |
| | | NGF | | | NAGF | | | NSCGF | |
| Assets | | | | | | | | | |
Common Stocks(2) | | $ | 142,270,711 | | | $ | 64,028,156 | | | $ | 28,066,035 | |
| Short-Term Investments | | | 3,941,314 | | | | 530,775 | | | | 10,545,496 | |
| Liabilities | | | | | | | | | | | | |
Securities Sold Short(2) | | | (3,860,884 | ) | | | (4,164,365 | ) | | | (1,488,180 | ) |
| Total | | $ | 142,351,141 | | | $ | 60,394,566 | | | $ | 37,123,351 | |
(1) As of June 30, 2014, the Portfolios did not hold Level 2 or Level 3 investments.
(2) Please refer to the Schedule of Investments and Schedule of Securities Sold Short to view segregation by industry.
(3) There were no transfers into or out of Levels 1, 2 or 3 during the period.
| | Semi-Annual Report 2014 |
| | |
| Notes to Financial Statements (Unaudited) (Continued) | |
3. Derivative Instruments and Hedging Activities
The “Derivatives and Hedging” Topic of the Codification (ASC 815, formerly SFAS 133 and SFAS 161) requires enhanced disclosures about the Portfolios’ derivative and hedging activities, including how such activities are accounted for and their effect on the Portfolios’ financial position, performance and cash flows. The Portfolios did not use derivatives during the six months ended June 30, 2014.
4. Investment Advisory and Administrative Services
The Company has engaged Needham Investment Management L.L.C. (the “Adviser”) to manage its investments. The Company pays the Adviser a fee at the annual rate of 1.25% of the average daily net assets of each Portfolio.
The Adviser has entered into an agreement with the Company (the “Expense Limitation Agreement”) whereby the Adviser has contractually agreed to waive its fee for, and to reimburse expenses (excluding interest, dividends on short positions, acquired fund fees and expenses and extraordinary items) of NGF, NAGF and NSCGF in an amount that limits annual operating expenses to not more than 1.95% of the average daily net assets. The agreement is effective for the period from May 1, 2014 through April 30, 2015. The agreement shall continue in effect from year to year thereafter only upon mutual agreement of the respective Company and the Adviser.
Any reimbursements or fee waivers made by the Adviser in respect of a Portfolio are subject to recoupment by the Adviser, to the extent that the Portfolio is able to make the repayment within the expense limitation established in the Expense Limitation Agreement. Under the Expense Limitation Agreement, such recoupments must be made within three years following the fiscal year in which the Adviser reduced its compensation and/or assumed expenses for the applicable Portfolio. The Adviser did not recoup any fees previously waived or reimbursed under the Expense Limitation Agreement during the six months ended June 30, 2014. The table below indicates the amount of fees that the Adviser has the potential to recoup:
| | | Recovery Expiring on | |
| | | 4/30/2018 | | | 4/30/2017 | | | 4/30/2016 | | | 4/30/2015 | |
| NGF | | $ | — | | | $ | — | | | $ | — | | | $ | — | |
| NAGF | | | 644 | | | | — | | | | — | | | | — | |
| NSCGF | | | 8,285 | | | | 24,636 | | | | 1,464 | | | | — | |
The Company and U.S. Bancorp Fund Services, LLC (the “Administrator”) are parties to a Fund Administration Servicing Agreement. The Administrator provides administrative and fund accounting services pursuant to this agreement and, in consideration of these services, receives a fee computed daily and paid monthly at an annual rate based on a percentage of the value of the each Portfolio’s assets. The Administrator is also compensated for any out of pocket expenses that are reasonably incurred in carrying out its duties under the Administration Agreement. The Administrator also provides transfer agent services pursuant to a Transfer Agent Servicing Agreement for additional fees.
Certain officers of the Company are also officers of the Adviser and/or Needham & Company, LLC (the “Distributor”). Such officers receive no fees from the Company for serving as officers of the Company. Each of the three Directors who is not an “interested person” (as defined in the 1940 Act) of the Company (each, an “Independent Director”) receives a quarterly retainer of $3,000 and a per-meeting fee of $500. Each Independent Director is also a member of the Audit Committee of the Company’s Board of Directors and receives a fee of $500 per meeting attended. The Adviser provides an employee to serve as Chief Compliance Officer for the Company and to provide certain related services. An affiliate of the Adviser, Needham & Company, LLC, pays the Chief Compliance Officer’s compensation and the Company reimburses this affiliate for the Company’s allocated portion of the expense.
The Company has adopted an Amended and Restated Plan of Distribution pursuant to Rule 12b-1 under the 1940 Act. Under the Plan, each Portfolio may pay compensation to the Distributor or any other distributor or financial institution with which the Company has an agreement with respect to each Portfolio, with the amount of such compensation not to exceed an annual rate of 0.25% of each Portfolio’s daily average net assets. For the six months ended June 30, 2014, NGF, NAGF and NSCGF paid 12b-1 fees to the Distributor in the amount of $176,324, $80,021 and $49,635, respectively.
During the six months ended June 30, 2014, NGF, NAGF and NSCGF incurred and paid brokerage commissions to the Distributor in the amount of $5,805, $7,975, and $20,346, respectively.
Each Portfolio may borrow from banks up to 25% of its total assets and may pledge its assets in connection with these borrowings, provided that no additional investments shall be made while borrowings exceed 5% of total assets.
The Portfolios did not engage in any temporary borrowings during the six months ended June 30, 2014.
7. Short Sale Transactions
During the six months ended June 30, 2014, each Portfolio sold securities short. Upon selling a security short, the Portfolios record an asset for the settlement amount and a corresponding liability, which is marked-to-market to reflect current value. Certain securities owned by each respective Portfolio are segregated as collateral while the short sales are outstanding. At June 30, 2014, the market value of securities separately segregated to cover short positions was $5,185,200, $9,926,820, and $449,740 for NGF, NAGF and NSCGF, respectively.
| Needham Funds |
| |
| Notes to Financial Statements (Unaudited) (Continued) |
Additionally, the Portfolios had receivables for Deposit with Broker for Securities Sold Short of $3,669,398, $3,768,986 and $536,421 pledged as collateral with a broker in connection with open short positions for NGF, NAGF and NSCGF, respectively. Securities sold short at June 30, 2014 and their related market values and proceeds are set forth in the preceding Schedule of Securities Sold Short for each Portfolio.
8. Investment Transactions
The following summarizes the aggregate amount of the cost of purchases and proceeds from sales of investment securities and securities sold short, excluding short-term securities, during the six months ended June 30, 2014:
| | | Purchases | | | Sales | |
| NGF | | $ | 11,946,377 | | | $ | 14,699,936 | |
| NAGF | | | 8,131,620 | | | | 15,903,179 | |
| NSCGF | | | 12,366,961 | | | | 27,311,587 | |
There were no purchases or sales of U.S. government securities during the six months ended June 30, 2014.
9. Financial Instruments With Off-Balance Sheet Risk
In the normal course of their business, the Portfolios may engage in transactions with off-balance sheet risk, including securities sold short, written options, futures, and forward currency contracts. Transactions in certain financial instruments represent future commitments to purchase or sell other financial instruments at specific terms at specified future dates. Each of these financial instruments contains varying degrees of off-balance sheet risk whereby changes in the market values of the securities underlying the financial instruments may be in excess of the amounts recognized in the financial statements.
Securities sold short represent obligations of the Portfolios to make future delivery of specific securities and, correspondingly, create an obligation to purchase the securities at market prices prevailing at a later delivery date (or to deliver the securities if already owned by the Portfolios). As a result, short sales create the risk that the Portfolios’ ultimate obligation to satisfy the delivery requirements may exceed the amount of the proceeds initially received on the liability recorded in the financial statements.
10. Indemnification
Under the Company’s organizational documents, its Directors and Officers are indemnified against certain liabilities arising out of the performance of their duties to the Company. In addition, in the ordinary course of business, the Company enters into contracts that contain a variety of indemnifications. The Company’s maximum exposure under these arrangements is unknown. However, the Company has not had prior claims or losses pursuant to these contracts and expects the risk of loss to be remote.
11. Federal Income Taxes
No provision for federal income taxes is required since the Company intends to continue to qualify as a regulated investment company under Subchapter M of the Internal Revenue Code and distribute substantially all of its taxable income and capital gains to shareholders. Because income tax regulations differ from GAAP, the timing and character of income and capital gain distributions determined in accordance with tax regulations can differ from income and capital gains recognized for financial reporting purposes. Accordingly, the character of distributions and the composition of net assets for tax purposes can differ from those reflected in the financial statements. These book/tax differences may be temporary or permanent in nature. Temporary differences are generally due to differing book and tax treatment for the timing of the recognition of gains and losses on securities, including post-October losses (as described below). Permanent differences are generally due to differing treatment of net investment losses. To the extent these differences are permanent, they are charged or credited to paid-in capital, accumulated net realized gain (loss), or accumulated net investment income (loss), as appropriate, in the period in which the differences arise. These reclassifications have no effect on net assets or net asset value per share of each Portfolio.
As of June 30, 2014, the cost, gross unrealized appreciation, gross unrealized depreciation, and the net unrealized appreciation (depreciation) on securities, including proceeds from securities sold short for federal income tax purposes, were as follows:*
| | | | | | Gross | | | Gross | | | Net | |
| | | | | | Unrealized | | | Unrealized | | | Unrealized | |
| | | Cost | | | Appreciation | | | Depreciation | | | Appreciation | |
| NGF | | $ | 70,729,094 | | | $ | 80,048,836 | | | $ | (4,565,906 | ) | | $ | 75,482,930 | |
| NAGF | | | 31,993,518 | | | | 33,786,695 | | | | (1,221,282 | ) | | | 32,565,413 | |
| NSCGF | | | 37,670,317 | | | | 4,433,242 | | | | (3,492,027 | ) | | | 941,215 | |
* Tax adjustments are calculated annually and therefore, the table above reflects the tax adjustments outstanding at the previous fiscal year end. For the previous fiscal year’s federal income tax information, please refer to the Notes to Financial Statements in the Company’s most recent annual shareholder report.
The difference between the tax cost of investments and the cost of investments for GAAP purposes is primarily due to the tax treatment for wash sale losses.
| | Semi-Annual Report 2014 |
| | |
| Notes to Financial Statements (Unaudited) (Continued) | |
As of December 31, 2013, the components of distributable earnings (loss) on a tax basis were as follows:
| | | NGF | | | NAGF | | | NSCGF | |
Undistributed ordinary income | | $ | — | | | $ | — | | | $ | 39,890 | |
Undistributed long-term capital gains | | | 3,618,987 | | | | — | | | | 501,807 | |
Unrealized appreciation (depreciation) | | | 70,932,048 | | | | 35,407,435 | | | | 4,465,917 | |
Total accumulated earnings (loss) | | $ | 74,551,035 | | | $ | 35,407,435 | | | $ | 5,007,614 | |
The tax character of distributions paid during the year ended December 31, 2013 was as follows:
| | | NGF | | | NAGF | | | NSCGF | |
| Ordinary income | | $ | — | | | $ | — | | | $ | — | |
Net long-term capital gains | | | 820,726 | | | | — | | | | — | |
| Return of capital | | | — | | | | — | | | | — | |
| Total distributions paid | | $ | 820,726 | | | $ | — | | | $ | — | |
Under current tax law, capital and currency losses realized after October 31 of a Portfolio’s fiscal year may be deferred and treated as occurring on the first business day of the following fiscal year for tax purposes. None of the Portfolios had deferred post-October capital or currency losses, which would have been treated as arising on the first business day of the fiscal year ending December 31, 2014.
As of December 31, 2013 the Funds had accumulated capital loss carryovers of:
| | Capital | | | | | | | |
| | Loss | | | | | | | |
| | Carryover | | | Term | | | Expires | |
| NGF | | $ | — | | | | — | | | | — | |
| NAGF | | | (4,580,325 | ) | | | | | Unlimited | |
| NSCGF | | | — | | | | — | | | | — | |
The Regulated Investment Company Modernization Act of 2010 (the “Act”) was enacted on December 22, 2010. The Act made changes to several tax rules impacting the Portfolios. In general, the provisions of the Act were effective for the Company’s fiscal year ended December 31, 2013. The Act provides several benefits, including the unlimited carryover of future capital losses.
The Act also changed the definition of post-October capital losses eligible for elective deferral to the greatest of a Regulated Investment Company’s (“RIC’s”) net capital loss attributable to the portion of the RIC’s taxable year after October 31, the RIC’s net long-term capital loss attributable to the portion of the RIC’s taxable year after October 31, or the RIC’s net short-term capital loss attributable to the portion of the RIC’s taxable year after October 31. As such, any post-October capital loss which a RIC has elected to defer is deemed to arise on the first day of the RIC’s following taxable year. The aggregate amount of the RIC’s anticipated deferred post-October capital losses would be included in the RIC’s tax basis accumulated loss carryforward, if applicable.
12. Subsequent Events
Management has evaluated subsequent events through the date of this filing. This evaluation did not result in any subsequent events that necessitated recognition or disclosures.
Supplementary Information (Unaudited)
June 30, 2014
Disclosure of Portfolio Holdings
The Company files a Form N-Q with the Securities and Exchange Commission (the “SEC”) no more than sixty days after the Company’s first and third fiscal quarters. For the Company, this would be for the fiscal quarters ending March 31 and September 30. Form N-Q includes a complete schedule of the Company’s portfolio holdings as of the end of those fiscal quarters. The Company’s N-Q filings can be found free of charge on the SEC’s website at http://www.sec.gov, or they may be reviewed and copied at the SEC’s Public Reference Room in Washington, D.C. (call 800-SEC-0330 for information on the operation of the Public Reference Room).
Voting Proxies on Company Portfolio Securities
A description of the policies and procedures that the Company uses to determine how to vote proxies relating to portfolio securities and information regarding how the Company voted proxies relating to portfolio securities during the most recent 12-month period ended June 30 are available without charge, upon request, by calling 800-625-7071 or on the SEC’s website at http://www.sec.gov.
Household Delivery of Shareholder Documents
To reduce expenses, the Company may mail only one copy of the Funds’ prospectuses, proxy statements, information statements, and each annual and semi-annual report to those addresses shared by two or more accounts. If you wish to receive individual copies of these documents, please call the Funds at 1-800-625-7071 or contact your financial institution. You will begin receiving individual copies thirty days after receiving your request.
Item 2. Code of Ethics.
Not applicable for semi-annual reports.
Item 3. Audit Committee Financial Expert.
Not applicable for semi-annual reports.
Item 4. Principal Accountant Fees and Services.
Not applicable for semi-annual reports.
Item 5. Audit Committee of Listed Registrants.
Not applicable to registrants who are not listed issuers (as defined in Rule 10A-3 under the Securities Exchange Act of 1934).
Item 6. Investments.
| (a) | Schedule of Investments is included as part of the report to shareholders filed under Item 1 of this Form. |
Item 7. Disclosure of Proxy Voting Policies and Procedures for Closed-End Management Investment Companies.
Not applicable to open-end investment companies.
Item 8. Portfolio Managers of Closed-End Management Investment Companies.
Not applicable to open-end investment companies.
Item 9. Purchases of Equity Securities by Closed-End Management Investment Company and Affiliated Purchasers.
Not applicable to open-end investment companies.
Item 10. Submission of Matters to a Vote of Security Holders.
Not Applicable.
Item 11. Controls and Procedures.
| (a) | The Registrant’s Chief Executive Officer and Chief Financial Officer have reviewed the Registrant's disclosure controls and procedures (as defined in Rule 30a-3(c) under the Investment Company Act of 1940 (the “Act”)) as of a date within 90 days of the filing of this report, as required by Rule 30a-3(b) under the Act and Rules 13a-15(b) or 15d-15(b) under the Securities Exchange Act of 1934. Based on their review, such officers have concluded that the disclosure controls and procedures are effective in ensuring that information required to be disclosed in this report is appropriately recorded, processed, summarized and reported and made known to them by others within the Registrant and by the Registrant’s service provider. |
| (b) | There were no changes in the Registrant's internal control over financial reporting (as defined in Rule 30a-3(d) under the Act) that occurred during the Registrant’s first fiscal half-year of the period covered by this report that has materially affected, or is reasonably likely to materially affect, the Registrant's internal control over financial reporting. |
Item 12. Exhibits.
| (a) | (1) Any code of ethics or amendment thereto, that is the subject of the disclosure required by Item 2, to the extent that the registrant intends to satisfy Item 2 requirements through filing an exhibit. Not applicable for semi-annual reports. |
(2) A separate certification for each principal executive and principal financial officer pursuant to Section 302 of the Sarbanes-Oxley Act of 2002. Filed herewith.
(3) Any written solicitation to purchase securities under Rule 23c-1 under the Act sent or given during the period covered by the report by or on behalf of the registrant to 10 or more persons. Not applicable to open-end investment companies.
| (b) | Certifications pursuant to Section 906 of the Sarbanes-Oxley Act of 2002. Furnished herewith. |
SIGNATURES
Pursuant to the requirements of the Securities Exchange Act of 1934 and the Investment Company Act of 1940, the registrant has duly caused this report to be signed on its behalf by the undersigned, thereunto duly authorized.
(Registrant) The Needham Funds, Inc.
By (Signature and Title) /s/ George A. Needham
George A. Needham, President (Chief Executive Officer)
Date 9/3/2014
Pursuant to the requirements of the Securities Exchange Act of 1934 and the Investment Company Act of 1940, this report has been signed below by the following persons on behalf of the registrant and in the capacities and on the dates indicated.
By (Signature and Title) /s/ George A. Needham
George A. Needham, President (Chief Executive Officer)
Date 9/3/2014
By (Signature and Title) /s/ James W. Giangrasso
James W. Giangrasso, Treasurer and Secretary (Chief Financial Officer)
Date 9/3/2014