Semi-Annual
Report
Needham Funds
Seeking to build wealth for long-term investors.
June 30, 2017
Needham Growth Fund
Needham Aggressive Growth Fund
Needham Small Cap Growth Fund
www.needhamfunds.com
445 Park Avenue
New York, New York 10022-2606
1-800-625-7071
www.needhamfunds.com
Semi-Annual Report
June 30, 2017
Contents
| Letter from the Adviser | | | 1 | |
| | | | | |
| Portfolio Characteristics | | | | |
| Needham Growth Fund | | | 10 | |
| Needham Aggressive Growth Fund | | | 12 | |
| Needham Small Cap Growth Fund | | | 14 | |
| Disclosure of Fund Expenses | | | 16 | |
| | | | | |
| Schedules of Investments | | | | |
| Needham Growth Fund | | | 18 | |
| Needham Aggressive Growth Fund | | | 23 | |
| Needham Small Cap Growth Fund | | | 28 | |
| | | | | |
| Schedules of Securities Sold Short | | | | |
| Needham Growth Fund | | | 22 | |
| Needham Aggressive Growth Fund | | | 27 | |
| | | | | |
| Statements of Assets and Liabilities | | | 32 | |
| | | | | |
| Statements of Operations | | | 34 | |
| | | | | |
| Statements of Changes in Net Assets | | | 35 | |
| | | | | |
| Financial Highlights | | | | |
| Needham Growth Fund | | | 38 | |
| Needham Aggressive Growth Fund | | | 40 | |
| Needham Small Cap Growth Fund | | | 42 | |
| | | | | |
| Notes to Financial Statements | | | 44 | |
| | | | | |
| Supplementary Information | | | 53 | |
This report is authorized for distribution to prospective investors only when preceded or accompanied by a current prospectus. The prospectus contains more complete information, including investment objectives, risks, expenses and charges and should be read carefully before investing or sending any money. To obtain a prospectus or summary prospectus, please call 1-800-625-7071.
Portfolios of The Needham Funds, Inc., like all mutual funds:
| | • | Are NOT FDIC insured |
| | • | Have no bank guarantee |
| | • | May lose value |
The Needham Funds, Inc. are distributed by Needham & Company, LLC.
Semi-Annual Report 2017
 | 445 Park Avenue |
| New York, NY 10022 |
| (800) 625-7071 |
| www.needhamfunds.com |
August 2017
Dear Shareholders, Friends of Needham and Prospective Shareholders,
We are pleased to report results for the second quarter and first half of 2017 for the Needham Growth Fund, Needham Aggressive Growth Fund, and Needham Small Cap Growth Fund. Our mission is to create wealth for long-term investors.
Needham Funds’ Second Quarter and Semiannual Review
In the second quarter, the Needham Growth Fund Retail and Institutional classes returned 2.24% and 2.35%, respectively; the Needham Aggressive Growth Fund Retail and Institutional classes returned (0.44)% and (0.26)%, respectively; and the Needham Small Cap Growth Fund Retail and Institutional classes returned 5.43% and 5.55%, respectively. During the same period, the Russell 2000 Total Return Index returned 2.46% and the S&P 500 Total Return Index returned 3.09%.
For the half year, the Needham Growth Fund Retail and Institutional classes returned 4.03% and 4.29%, respectively; the Needham Aggressive Growth Fund Retail and Institutional classes returned 1.17% and 1.48%, respectively; and the Needham Small Cap Growth Fund Retail and Institutional classes returned 7.02 and 7.28%, respectively. For the half year, the Russell 2000 Total Return Index returned 4.99% and the S&P 500 Total Return Index returned 9.34%.
Availability of a New Institutional Share Class
The Needham Funds’ Institutional share class is available for sale. The purpose of this Institutional class is to offer a lower cost option to our investors who have a substantial amount invested in The Needham Funds. Highlights, as detailed in the prospectus1, are:
| | • | $100,000 investment minimum (aggregation permitted); |
| | | |
| | • | No 12b-1 fees; |
| | | |
| | • | An expense ratio capped at 1.40% (not including shorting and interest/dividend expenses); and |
| | | |
| | • | Tax-free conversions from the retail shares. |
Institutional shares are currently available on Fidelity, Schwab, Pershing, Raymond James, Wells Fargo, and LPL platforms, and are also available for direct shareholders of Needham Funds. We are working to broaden distribution of these lower cost shares and encourage you to contact your financial advisor or intermediary about when you might find them available.
The Institutional shares’ ticker symbols are Needham Growth Fund (NEEIX), Needham Aggressive Growth Fund (NEAIX), and Needham Small Cap Growth Fund (NESIX). The Needham Funds’ Retail shares are available as before under the ticker symbols NEEGX, NEAGX, and NESGX, respectively.
1 | Prospectus is available at http://www.needhamfunds.com/literature.html |
Needham Funds
First Half 2017
In January, the market rallied on President Trump’s inauguration and proposals of pro-growth tax reform, infrastructure spending, and a reduced regulatory burden. In February, President Trump promised a “phenomenal tax plan” and to streamline the new drug regulatory process. The markets rallied; however, failure to pass the first attempt to repeal the Affordable Care Act and introduce new healthcare legislation brought worries that tax reform would be delayed. Still, the averages rallied for each month of the quarter. For the quarter, all three Funds were positive, but trailed the averages.
In April, the market was positive and so were the Needham Funds. The preliminary GDP showed just 0.7% economic growth, although that was later revised to a still low 1.2%. The Atlanta Fed’s GDPNow shows preliminary second quarter GDP growth at a slightly higher 2.5%, making the first half of 2017 consistent with the growth of the last 8 years.
In May, the market was mixed, and the Needham Growth Fund and Needham Small Cap Growth Fund outperformed. During the month, we witnessed the firing of FBI Director James Comey and North Korea’s third missile launch.
June saw the market up and the Needham Small Cap Growth Fund outperforming the indices. There was a sell-off in the FANG stocks (Facebook, Amazon, Netflix, Google/Alphabet), which lasted about one week.
Market volatility is currently low as the VIX is close to its lowest on record. We imagine that volatility could increase from this low level.
John Barr’s Second Quarter Commentary — On the Road
“The big money is not in the buying and the selling, but in the waiting.”- Charlie Munger
As Charlie Munger, Vice Chairman of Berkshire Hathaway, said, “The big money is not in the buying and the selling, but in the waiting.” He also said, “Understanding both the power of compound interest and the difficulty of getting it is the heart and soul of understanding a lot of things.” Waiting with the right investments is the key to producing compound returns.
At the end of June, the trailing 12-month turnover for the Needham Aggressive Growth Fund was 3% and for the Needham Growth Fund was 5%. So if there’s limited trading in my Funds, what do I, the portfolio manager, do on a daily basis? From Poor Charlie’s Almanack: “The only way to win is to work, work, work, work and hope to have a few insights.” Having the patience to wait means having confidence in an investment. Each day is an opportunity to learn more about the companies in the Needham Funds and research candidates for future investment. That means reading a lot of SEC filings, earnings call transcripts, blogs and websites. It means traveling to meet with companies at their headquarters, attending industry conferences, and talking to people outside of Wall Street. It means crafting a thesis on whether or not a company has a strong strategic position and if it can earn a superior return on invested capital over the long term.
In the second quarter, I was on the road. I’d like to highlight a few of my recent trips.
Omaha
I started this section with some wisdom from Charlie Munger. In early May, I attended the Berkshire Hathaway, Inc. (BRK.A and BRK.B) annual meeting and associated dinners in Omaha. The day of the meeting, I was up at 4:30am to get in line for a seat in the CenturyLink
Semi-Annual Report 2017
Center. It was amazing to see Warren Buffett and Charlie Munger answer shareholder questions all day long. Perhaps it’s obvious, but I was struck by their steady optimism over long lifetimes of investing. They talk like businesspeople and company owners rather than stock traders.
A shareholder asked what dreams Buffett and Munger have. Ninety-three-year-old Munger answered, “Sometimes when I’m especially wistful, I think—oh to be 90 again.” While Warren Buffett’s quotes and life story are well known, Charlie Munger is just as interesting. There are two Munger biographies that I recommend, Damn Right, by Janet Lowe (Wiley, 2007), and Charlie Munger: The Complete Investor, by Tren Griffin (Columbia University Press, 2015). And the definitive work on Munger is Poor Charlie’s Almanack, compiled by Peter Kaufman and Charlie Munger (Walsworth, 2005).
I think Markel Corporation (MKL), a holding in both the Needham Growth Fund and Needham Aggressive Growth Fund, is like a mini Berkshire Hathaway, Inc.—it is a diverse financial holding company that underwrites specialty insurance products. Markel holds its one and only annual analyst and investor meeting the Sunday after the Berkshire meeting. The company started holding its meeting in Omaha in 1991—the company wanted to attract the Berkshire investors and there’s no better way than going to Omaha the first weekend of May.
Markel applies the earnings and discretionary float from the insurance to: 1) acquire complementary insurance companies; 2) buy operating companies for Markel Ventures; and 3) invest in public equities and debt. Markel has a $13 billion market cap and opportunities for growth. From its IPO in December 1986 at $8.33, Markel has compounded at 16.6% and risen to $975.86 per share as of June 30. The Markel Style defines the corporate culture which has produced these long-term results.
Chicago
In June, I attended the DIRTT Connext User Conference in Chicago. DIRTT Environmental Solutions Ltd. (TSE:DRT) is a small cap holding of the Needham Aggressive Growth Fund. The company has an incredible computer-aided design system used to design building interiors, produce a bill of materials, and then send manufacturing files to DIRTT plants, where they produce the interiors. It saves significant time and waste on a construction site. I believe DIRTT may be the future of interior construction.
I also attended a meeting with the CEO of Oil-Dri Corporation of America (ODC), Dan Jafee. Dan meets with investors twice a year. Oil-Dri had just reported earnings and has continued to make progress with its lightweight cat litter and animal health products. Should lightweight cat litter increase its market share, Oil-Dri is positioned to benefit based on its majority share of the private label market. We urge our cat owner friends and investors to try Oil-Dri’s Cat’s Pride Fresh & Light Ultimate Care cat litter!
San Francisco
In early July, I attended the annual SEMICON West manufacturing conference in San Francisco and met with many semiconductor equipment and services companies, including Needham Funds holdings: PDF Solutions, Inc. (PDFS), MKS Instruments, Inc. (MKSI), Nova Measuring Instruments, Ltd. (NVMI), Applied Materials, Inc. (AMAT), Entegris, Inc. (ENTG) and Form Factor, Inc. (FORM). I believe these companies have years of growth ahead of them.
Needham Funds
The debate in semiconductor industry circles revolves around the question of cyclical versus secular growth. It is always dangerous to say, “This time is different.” I believe consensus is that the semiconductor equipment stocks will suffer in unison, owing to an over-build in capacity. Yet, NAND memory is replacing disk drives in storage systems. Given the growth in data storage and the early stage of this replacement cycle, we believe the NAND memory and equipment makers could see growth for a number of years. Nonetheless, the stocks will have days or weeks when the “top is in” argument will rule.
It was a good quarter of working, and waiting.
Needham Growth Fund (NEEGX/NEEIX)
The Needham Growth Fund Retail class returned 2.24% and the Institutional class returned 2.35% in the second quarter. For the first six months of 2017, The Needham Growth Fund Retail class returned 4.03% and the Institutional class returned 4.29%.
For the second quarter and the half year, long-time holding and largest position Thermo Fisher Scientific Inc. (TMO) was the top contributor, returning 13.7% in the second quarter and 23.7% in the first half. Thermo Fisher develops instruments and consumables used in life science and other research-oriented industries. Thermo Fisher demonstrated solid growth and strong margins in its pharma and biotech markets.
Corium International, Inc. (CORI) was the Fund’s second leading contributor for the quarter and third leading for the half year. Corium returned 78.5% in the second quarter and 83.5% year-to-date through June 30. Corium is developing a patch-based drug-delivery system and plans to address the Alzheimer’s market with a patch-based donepezil drug.
The largest detractor in the quarter and year-to-date was PDF Solutions, Inc. (PDFS), with almost the entire 27.3% decline occurring during the second quarter. In the March quarter, PDF’s gainshare (royalty) revenue was below the estimates of the two Wall Street analysts following the company. However, we are invested in PDF for its new Design-for-Inspection service, which is sold to semiconductor design and manufacturing companies to determine whether leading-edge semiconductors can be manufactured with high yield. In 2017, PDF has made significant progress with DFI. During its July 27 conference call, PDF mentioned that John Chen of NVIDIA Corporation (NVDA) was the keynote speaker at PDF’s User Meeting. This is the first confirmation that NVIDIA, a leader in computer graphics and artificial intelligence industries with a $98 billion market cap, is a Design-for-Inspection customer. We took advantage of the weak stock price and added to our position.
In the first half, the Needham Growth Fund added new positions in Coupa Software Inc. (COUP), Clean Harbors, Inc. (CLH), comScore, Inc. (SCOR) and Markel (MKL). We also took advantage of price weaknesses and added to existing positions in KVH Industries, Inc. (KVHI), Oil-Dri Corporation of America (ODC), Pure Storage, Inc. Class A (PSTG), Amber Road, Inc. (AMBR), Photronics, Inc. (PLAB), and Agile Therapeutics, Inc. (AGRX).
The Needham Growth Fund sold its positions in Jabil Circuit, Inc. (JBL) and UltraClean Holdings, Inc. (UCTT) as both stocks hit our price targets. In the first quarter, we purchased Xactly Corp. (formerly XTLY), a sales compensation tracking and management company, and sold it in the second quarter as the company agreed to sell to Vista Equity. We are sorry to see Xactly go (as we believed it had years of growth ahead as a public company). We sold
Semi-Annual Report 2017
nearly 20% of the Fund’s position in Express Scripts Holding Company (ESRX). We also sold over 15% of the Fund’s positions in Thermo Fisher Scientific, MKS Instruments, and Nova Measuring Instruments (NVMI).
Needham Aggressive Growth Fund (NEAGX/NEAIX)
The Needham Aggressive Growth Fund Retail class lost 0.44% and the Institutional class lost 0.26% in the second quarter. For the first six months of 2017, The Needham Aggressive Growth Fund Retail class returned 1.17% and the Institutional class returned 1.48%.
Corium International was the top contributor for the second quarter and the fourth largest year-to-date as of June 30, 2017. Entegris Inc. (ENTG) was the second leading contributor for the half-year with a return of 22.6%. All of this gain came in the first quarter. Entegris supplies filters and chemicals used in advanced manufacturing processes. Semiconductor plants require the equivalent of capturing one contaminated drop of water in a day’s worth of water flowing over Niagara Falls. Advanced manufacturing is necessary to make low power semiconductors, which are necessary to extend battery life in mobile phones. After several years of investment, Entegris reported a strong 2016, including December quarter results, with margins ahead of expectations.
Four investments were both top ten contributors for the second quarter and the half year: Nova Measuring Instruments, Norsat International (NSAT), Oil-Dri, and IPG Photonics (IPGP).
Nova Measuring Instruments returned 18.8% in the second quarter and 67.9% year-to-date at June 30. Nova Measuring develops and supplies optical critical dimension (OCD) metrology equipment to the semiconductor manufacturing industry. Metrology data is now being used to control manufacturing equipment. Nova Measuring is benefiting from success with advanced logic customers, such as Taiwan Semiconductor Manufacturing Co. Ltd. (2330.TW), and memory customers. It is also benefiting from the sale of high-margin software into their installed base. Nova Measuring reported a strong first quarter.
Norsat supplies communications equipment to commercial and government customers. It returned 44.3% through June 30, as it agreed to a takeover by Hytera Communications Corporation Ltd. (002583.SHE). Norsat was a two-year holding of the Fund and was a micro-cap company. We were very impressed with the management team of CEO Dr. Aimee Chan and CFO Arthur Chin.
Oil-Dri returned 13.4% in the second quarter and 10.0% for the first half. The company continues to make progress with its private label, lightweight cat litter and animal health products.
IPG Photonics returned 20% in the second quarter and 47% for the first half. IPG Photonics is the leading fiber laser company. It is a vertically integrated maker of laser systems used in industrial cutting and welding applications. IPG is replacing the legacy carbon dioxide lasers. The automotive market is early in the adoption of fiber lasers for welding. Fiber lasers use much less power so they’re easier on the operating budgets of users. They are also easier to operate, as carbon dioxide lasers require very sophisticated set-up and support. IPG’s manufacturing scale gives a significant cost advantage. The company has a return on trailing year capital of approximately 20%, and as a supplier ranging from components to systems has good reinvestment opportunities. IPG reported a strong first quarter and the stock rallied.
Needham Funds
Cryoport, Inc. (CYRX) is a new position within the second quarter and was a top ten contributor returning 108.5%. Cyroport supplies coldchain logistics for biopharma, in vitro fertilization and animal health. It ships biological samples at temperatures down to -150C. It has been selected by most of the very high-value CAR-T (chimeric antigen receptors-T cells), which are anti-cancer drugs that the FDA is giving fast track to market. Customers include Kite Pharma, Inc. (KITE) and Novartis AG (NOVN).
The Fund’s leading detractor by far was PDF Solutions, which is also the Fund’s largest position. We took advantage of the stock price weakness to add shares.
Akamai Technologies, Inc. (AKAM) was the second largest detractor and fell 16.6% in the second quarter and 25.3% for the half year. Akamai reported disappointing guidance in its media delivery business and that it will be investing in cloud-based security and enterprise content delivery service offerings, and the market responded negatively. Longer term, the media delivery business should benefit from growth in over-the-top video.
GSE Systems, Inc. (GVP) also detracted from second quarter performance with an 8.9% decline. For the half year, GSE declined 11.4%, despite reporting very good results in the first quarter. First quarter revenue was $16.3 million—the highest total in over a decade and measured 26% growth relative to the first quarter of 2016. GSE also reported $0.8 million of adjusted EBITDA, making the seventh-consecutive quarter of positive adjusted EBITDA. New orders were near $20 million. We believe the need for training and personnel in the nuclear industry remains healthy. GSE has $1.20 per share of cash, no debt, and a $3.10 per share stock price as of June 30. Its total market cap is just $56 million. We believe the stock price decline is a reflection of the inefficiency and vagaries which may happen in microcaps, and we remain enthusiastic about GSE’s prospects.
It was a very light trading half for the Aggressive Growth Fund. In the first half, we added new positions in comScore, Markel, DIRTT Environmental (DRT), Pure Storage, Cryoport, Coupa Software, and Ecology and Environment (EEI).
We added to positions in Oil-Dri, KVH Industries, ViaSat, Inc. (VSAT), PDF Solutions, comScore, Vicor Corporation (VICR), GSE Systems, Akamai and Reis, Inc. (REIS) on their weaknesses. We exited TheStreet Inc. (TST), and also Xactly on M&A. It was an active half for M&A, as takeovers were announced of portfolio companies Xactly, Xcerra Corporation (XCRA), ARI Network Services, Inc. (ARIS) and Norsat.
Needham Small Cap Growth Fund (NESGX/NESIX)
The Needham Small Cap Growth Fund Retail class returned 5.43% and the Institutional class returned 5.55% in the 2Q17. In the first half of 2017, the Fund’s Retail class returned 7.02% and the Institutional class returned 7.28%. The Russell 2000 Total Return Index returned 2.46% in the second quarter and 4.99% in the first half. We were very pleased with the performance of the Fund in the first half of 2017 after great performance from our holdings in 2016. We were concerned regarding a greater correction in many of our stocks; however, that correction was short lived in the first quarter and recovered by the end of the first half. We used our strategic cash position to redeploy cash into both new and existing positions that we believe offer great value. Mergers and acquisitions continued in the small capitalization stocks but slowed over 2016 activity. We believe this trend is a pause until tax reforms are
Semi-Annual Report 2017
established and repatriation of cash occurs. While the first half rewarded many of our stocks, we remain vigilant to any downturn in the multi-year bull run that we have experienced.
The Fund continued to show strength into the second quarter after the short-lived market pullback in the middle of the first quarter. As fears of an economic slowdown subsided and earnings season concluded, meetings with company management teams remained upbeat and stocks recovered. We were able to significantly deploy our cash levels into new and existing positions and ended the quarter with approximately 3% cash. We also were able to return to our more normal concentration with our top ten holdings accounting for over 51% of the Fund. Top holdings at June 30 included Pure Storage (PSTG), Amber Road (AMBR), PDF Solutions (PDFS) and FireEye (FEYE). Our top quarterly contributors included Pure Storage, Corium International, FireEye, Reis, Inc. and Amber Road. Our detractors were PDF Solutions, Frequency Electronics (FEIM), Photronics (PLAB) and Navigator Holdings (NVGS). In general, our technology exposure was able to perform well even during a period of volatile political rhetoric and failure to pass any major policy changes. We continue to believe that some policy change will occur; however, as we have discussed, we believe the timing of these changes is further into the future than originally expected by the market.
We expect consolidation to continue in the enterprise hardware sector and we remain exposed to this potential trend through our investments in Pure Storage (PSTG) and Nutanix (NTNX). Both of these holdings recovered in the quarter and the correction they experienced in the early part of the year allowed us to add to these positions at more reasonable entry points. While we remain confident in their long-term business plans, we recognize that the shortage in memory components and increased pricing for these components may weigh on margins for a more extended period of time while revenue continues to expand near term.
As an update to our long-term investment in Ultra Clean Holdings, Inc. (UCTT), we exited the position as the stock price achieved and surpassed our price target. The company has been a tremendous contributor to the Fund over the past several years and we believed it was time to realize profits in the stock. While the semiconductor capital equipment cycle remains vibrant, we look for better valuation entry points to initiate or add to positions. PDF Solutions (PDFS), FormFactor (FORM) and Photronics (PLAB) are three companies that we believe offer a better risk/reward at their current valuations.
We still believe it is a good environment for investment in equities. We still expect pro-growth policies from the new administration; however, the timing of these policies is the big question mark and may take longer than initially expected. Small cap stocks in particular look more attractive now, as they significantly underperformed relative to large cap companies. The strength in the high-yield market also gives us confidence for now that small caps are in a bullish uptrend. Although a slight slowdown in activity occurred in the first half of the year, mergers and acquisitions should remain active and could accelerate if tax reform and repatriation is passed.
Closing
To reiterate our overall thesis: we believe the U.S. remains the best place in the world to be investing and working. We believe there remains an opportunity to invest in small and mid-cap stocks. Monetary policy remains accommodative. Most importantly, we see a revolution
Needham Funds
happening in technology that has created and continues to create investment opportunities. We see opportunity in our strategy of investing in companies that we know well and that we believe are positioned with secular growth drivers.
We welcome our new investors and thank all of our investors for their continued support. If you have any questions, thoughts or concerns, please contact us at (800) 625-7071 or send us an email at cretzler@needhamco.com or jbarr@needhamco.com. For information about the funds, please visit our website at www.needhamfunds.com.
Sincerely,
 |  |
| | |
| Chris Retzler | John O. Barr |
| Portfolio Manager | Portfolio Manager |
Needham Funds Fact Sheet Links:
Needham Growth Fund
Needham Aggressive Growth Fund
Needham Small Cap Growth Fund
The information presented in this commentary is not intended as personalized investment advice and does not constitute a recommendation to buy or sell a particular security or other investments. Past performance is no guarantee of future results. Not all investments have been profitable.
This message is not an offer of the Needham Growth Fund, the Needham Aggressive Growth Fund or the Needham Small Cap Growth Fund. Shares are sold only through the currently effective prospectus. Please read the prospectus carefully and consider the investment objectives, risks, and charges and expenses of the Fund carefully before you invest. The prospectus contains this and other information about the Fund.
A copy of the prospectus is available at www.needhamfunds.com or by contacting the Fund’s transfer agent, U.S. Bancorp Fund Services, LLC at 1-800-625-7071.
All three of the Needham Funds have substantial exposure to small and micro capitalized companies. Funds holding smaller capitalized companies are subject to greater price fluctuation than those of larger companies.
Needham & Company, LLC, member FINRA/SIPC, is the distributor of The Needham Funds, Inc.
Semi-Annual Report 2017
Portfolio holdings are subject to change. The Needham Funds ownership as a percentage of net assets in the stated securities as of 6/30/17:
| SECURITY | NEEGX | NEAGX | NESGX | SECURITY | NEEGX | NEAGX | NESGX |
| MKL | 0.13% | 0.23% | 0.00% | ENTG | 3.07% | 6.59% | 0.00% |
| TMO | 7.84% | 0.00% | 0.00% | NSAT | 0.00% | 1.53% | 0.00% |
| CORI | 1.41% | 1.65% | 2.98% | IPGP | 0.75% | 1.72% | 0.00% |
| PDFS | 3.55% | 7.86% | 6.17% | CYRX | 0.00% | 0.58% | 0.00% |
| NVDA | 0.00% | 0.00% | 0.00% | KITE | 0.00% | 0.00% | 0.00% |
| COUP | 0.06% | 0.11% | 0.00% | NOVN | 0.00% | 0.00% | 0.00% |
| CLH | 0.14% | 0.35% | 0.00% | AKAM | 2.15% | 5.12% | 0.33% |
| SCOR | 1.59% | 2.65% | 2.65% | GVP | 0.00% | 4.99% | 0.00% |
| MKL | 0.13% | 0.23% | 0.00% | DRT.TF | 0.00% | 0.62% | 0.00% |
| KVHI | 4.42% | 5.44% | 4.32% | EEI | 0.00% | 0.56% | 0.00% |
| ODC | 0.79% | 3.28% | 0.00% | VSAT | 5.00% | 2.62% | 4.41% |
| PSTG | 0.55% | 0.30% | 8.11% | VICR | 0.31% | 2.05% | 0.00% |
| AMBR | 3.28% | 2.39% | 6.43% | REIS | 1.51% | 4.03% | 4.65% |
| PLAB | 1.27% | 1.45% | 3.80% | TST | 0.00% | 0.00% | 0.00% |
| AGRX | 0.34% | 0.50% | 3.00% | XCRA | 0.00% | 0.12% | 0.00% |
| JBL | 0.00% | 0.00% | 0.00% | ARIS | 0.00% | 0.17% | 0.00% |
| UCTT | 0.00% | 0.00% | 0.00% | FEYE | 0.00% | 0.00% | 4.82% |
| XTLY | 0.00% | 0.00% | 0.00% | FEIM | 0.41% | 0.44% | 4.11% |
| ESRX | 5.51% | 0.61% | 0.21% | NVGS | 0.04% | 0.00% | 0.55% |
| MKSI | 1.86% | 2.87% | 0.00% | NTNX | 0.21% | 0.05% | 3.53% |
| NVMI | 1.24% | 2.46% | 0.00% | FORM | 3.89% | 3.58% | 0.75% |
Needham Funds
| NEEDHAM GROWTH FUND | Retail Class |
| | Ticker Symbol: NEEGX |
| | Institutional Class |
| | Ticker Symbol: NEEIX |
Comparative Performance Statistics as of June 30, 2017 (Unaudited)
| | | | | | | | | | | | | | | | | | | | | Gross | |
| | | | 6 | | | 1 | | | 3 | | | 5 | | | 10 | | Since | | Expense | |
| | | Months(9) | | Year | | Years(10) | | Years(10) | | Years(10) | | Inception | | Ratio(16) | |
| Needham Growth Fund |
Retail Class(1)(2) | | | 4.03 | % | | | 14.03 | % | | | 4.60 | %(11) | | | 11.14 | %(12) | | | 6.05 | %(13) | | | 12.74 | %(10)(14) | | | 2.18 | % |
| Needham Growth Fund |
Institutional Class(3) | | | 4.29 | % | | | n/a | | | | n/a | | | | n/a | | | | n/a | | | | 4.29 | %(9) | | | 1.74 | % |
S&P 500 Index(4)(5) | | | 9.34 | % | | | 17.90 | % | | | 9.61 | % | | | 14.63 | % | | | 7.18 | % | | | 8.61 | %(10)(15) | | | | |
NASDAQ Composite Index(4)(6) | | | 14.76 | % | | | 28.40 | % | | | 13.13 | % | | | 17.49 | % | | | 10.25 | % | | | 9.48 | %(10)(15) | | | | |
S&P 400 MidCap Index(4)(7) | | | 5.99 | % | | | 18.57 | % | | | 8.53 | % | | | 14.92 | % | | | 8.56 | % | | | 11.68 | %(10)(15) | | | | |
Russell 2000 Index(4)(8) | | | 4.99 | % | | | 24.60 | % | | | 7.36 | % | | | 13.70 | % | | | 6.92 | % | | | 8.66 | %(10)(15) | | | | |
Past performance does not guarantee future results. The performance data quoted represents past performance, and current returns may be lower or higher. The investment return and net asset value will fluctuate so that an investor’s shares, when redeemed, may be worth more or less than the original cost. To obtain performance information current to the most recent month-end, please call 1-800-625-7071. The returns shown in the above table and accompanying footnotes are net of expenses. The table above does not reflect the deduction of taxes that a shareholder would have paid on Fund distributions or on the redemption of Fund shares.
| 1. | Investment results calculated after reinvestment of dividends. |
| 2. | The inception date of the Retail Class was 1/1/96. |
| 3. | The inception date of the Institutional Class was 12/30/16. |
| 4. | It is not possible to invest directly in an index. The performance of the index does not include the deduction of expenses associated with a mutual fund, such as investment management fees. |
| 5. | The S&P 500 Index is a broad unmanaged measure of the U.S. stock market. |
| 6. | The NASDAQ Composite Index is a broad-based capitalization-weighted index of all NASDAQ Global Market and Small Cap stocks. |
| 7. | The S&P 400 MidCap Index is a broad unmanaged measure of the U.S. stock market. |
| 8. | The Russell 2000 Index is a broad unmanaged index composed of the smallest 2,000 companies in the Russell 3000 Index. |
| 9. | Not annualized. |
| 10. | Compound annual growth rate (annualized return). Assumes all dividends were reinvested in shares of the Retail Class. |
| 11. | Cumulative return for the three year period was 14.43%, assuming all dividends were reinvested in shares of the Retail Class. |
| 12. | Cumulative return for the five year period was 69.56%, assuming all dividends were reinvested in shares of the Retail Class. |
| 13. | Cumulative return for the ten year period was 79.93%, assuming all dividends were reinvested in shares of the Retail Class. |
| 14. | Cumulative return since inception was 1,216.48%, assuming all dividends were reinvested in shares of the Retail Class. |
| 15. | The return shown for the Index is from the Inception date of the Retail Class. |
| 16. | Gross expense ratio is from the Fund’s prospectus dated May 1, 2017. Additional information pertaining to the Fund’s expense ratios as of June 30, 2017 can be found in the financial highlights. Since January 1, 2009, the investment performance reflects contractually agreed upon fee waivers which expire at the close of business on April 30, 2018. Without these fee waivers, the performance would have been lower. Excluding the indirect costs of investing in acquired funds, total class operating expenses would be 2.17% and 1.73% for the Retail Class and Institutional Class, respectively. |
Semi-Annual Report 2017
Top Ten Holdings*
(as a % of total investments,
as of June 30, 2017)
| | | | % of Total | |
Security | | | Investments | |
| Thermo Fisher Scientific, Inc. | TMO | | | 7.88 | % |
| Gilead Sciences, Inc. | GILD | | | 5.69 | % |
| Express Scripts Holding Co. | ESRX | | | 5.55 | % |
| CarMax, Inc. | KMX | | | 5.42 | % |
| ViaSat, Inc. | VSAT | | | 5.03 | % |
| Becton Dickinson and Co. | BDX | | | 5.00 | % |
| KVH Industries, Inc. | KVHI | | | 4.45 | % |
| Super Micro Computer, Inc. | SMCI | | | 3.98 | % |
| Comcast Corp. | CMCSA | | | 3.96 | % |
| FormFactor, Inc. | FORM | | | 3.91 | % |
Top Ten Holdings = 50.87% of Total Investments†
| * | Current portfolio holdings may not be indicative of future portfolio holdings. |
| † | Percentage of total investments less cash. |
Sector Weightings*
(as a % of net investments,
as of June 30, 2017)
Sector | | Long* | | | (Short)(1) | | | Total(1)(2) | |
| Consumer Discretionary | | | 11.1 | % | | | — | | | | 11.1 | % |
| Consumer Staples | | | 0.8 | % | | | — | | | | 0.8 | % |
| Energy | | | 1.7 | % | | | — | | | | 1.7 | % |
| Exchange Traded Funds | | | — | | | | (0.3 | )% | | | (0.3 | )% |
| Financials | | | 2.9 | % | | | (0.9 | )% | | | 2.0 | % |
| Health Care | | | 32.9 | % | | | — | | | | 32.9 | % |
| Industrials | | | 4.2 | % | | | — | | | | 4.2 | % |
| Information Technology | | | 50.4 | % | | | (3.3 | )% | | | 47.1 | % |
| Cash | | | 0.5 | % | | | — | | | | 0.5 | % |
| * | Current portfolio holdings may not be indicative of future portfolio holdings. |
(1) | Percentage of total investments includes all stocks, plus cash minus all short positions. |
(2) | Total represents the difference between the long exposure and the short exposure, which produces the net exposure. |
Comparison of Change in Value of a $10,000 Investment
Past performance does not guarantee future results. The performance data quoted represents past performance, and current returns may be lower or higher. The investment return and net asset value will fluctuate so that an investor’s shares, when redeemed, may be worth more or less than the original cost. To obtain performance information current to the most recent month-end, please call 1-800-625-7071. The graph above does not reflect the deduction of taxes that a shareholder would have paid on Fund distributions or on the redemption of Fund shares. Since inception, the Fund’s adviser has absorbed certain expenses of the Fund, without which returns would have been lower.
The Global Industry Classification Standard (GICS®) was developed by and/or is the exclusive property of MSCI, Inc. and Standard & Poor Financial Services LLC (“S&P”). GICS is a service mark of MSCI and S&P and has been licensed for use by U.S. Bancorp Fund Services, LLC.
Needham Funds
| NEEDHAM AGGRESSIVE GROWTH FUND | Retail Class |
| | Ticker Symbol: NEAGX |
| | Institutional Class |
| | Ticker Symbol: NEAIX |
Comparative Performance Statistics as of June 30, 2017 (Unaudited)
| | | | | | | | | | | | | | | | | | | | | Gross | |
| | | | 6 | | | 1 | | | 3 | | | 5 | | | 10 | | Since | | Expense | |
| | | Months(8) | | Year | | Years(9) | | Years(9) | | Years(9) | | Inception | | Ratio(15) | |
| Needham Aggressive Growth | |
Fund Retail Class(1)(2) | | | 1.17 | % | | | 21.86 | % | | | 6.36 | %(10) | | | 12.09 | %(11) | | | 8.46 | %(12) | | | 9.34 | %(9)(13) | | | 2.71 | % |
| Needham Aggressive Growth | |
Fund Institutional Class(3) | | | 1.48 | % | | | n/a | | | | n/a | | | | n/a | | | | n/a | | | | 1.48 | %(8) | | | 2.16 | % |
S&P 500 Index(4)(5) | | | 9.34 | % | | | 17.90 | % | | | 9.61 | % | | | 14.63 | % | | | 7.18 | % | | | 7.06 | %(9)(14) | | | | |
NASDAQ Composite Index(4)(6) | | | 14.76 | % | | | 28.40 | % | | | 13.13 | % | | | 17.49 | % | | | 10.25 | % | | | 9.19 | %(9)(14) | | | | |
Russell 2000 Index(4)(7) | | | 4.99 | % | | | 24.60 | % | | | 7.36 | % | | | 13.70 | % | | | 6.92 | % | | | 8.71 | %(9)(14) | | | | |
Past performance does not guarantee future results. The performance data quoted represents past performance, and current returns may be lower or higher. The investment return and net asset value will fluctuate so that an investor’s shares, when redeemed, may be worth more or less than the original cost. To obtain performance information current to the most recent month-end, please call 1-800-625-7071. The returns shown in the above table and accompanying footnotes are net of expenses. The table above does not reflect the deduction of taxes that a shareholder would have paid on Fund distributions or on the redemption of Fund shares.
| 1. | Investment results calculated after reinvestment of dividends. |
| 2. | The inception date of the Retail Class was 9/4/01. |
| 3. | The inception date of the Institutional Class was 12/30/16. |
| 4. | It is not possible to invest directly in an index. The performance of the index does not include the deduction of expenses associated with a mutual fund, such as investment management fees. |
| 5. | The S&P 500 Index is a broad unmanaged measure of the U.S. stock market. |
| 6. | The NASDAQ Composite Index is a broad-based capitalization-weighted index of all NASDAQ Global Market and Small Cap stocks. |
| 7. | The Russell 2000 Index is a broad unmanaged index composed of the smallest 2,000 companies in the Russell 3000 Index. |
| 8. | Not annualized. |
| 9. | Compound annual growth rate (annualized return). Assumes all dividends were reinvested in shares of the Retail Class. |
| 10. | Cumulative return for the three year period was 20.33%, assuming all dividends were reinvested in shares of the Retail Class. |
| 11. | Cumulative return for the five year period was 76.98%, assuming all dividends were reinvested in shares of the Retail Class. |
| 12. | Cumulative return for the ten year period was 125.24%, assuming all dividends were reinvested in shares of the Retail Class. |
| 13. | Cumulative return since inception was 310.68% assuming all dividends were reinvested in shares of the Retail Class. |
| 14. | The return shown for the Index is from the Inception date of the Retail Class. |
| 15. | Gross expense ratio is from the Fund’s prospectus dated May 1, 2017. Additional information pertaining to the Fund’s expense ratios as of June 30, 2017 can be found in the financial highlights. Since January 1, 2009, the investment performance reflects contractually agreed upon fee waivers which expire at the close of business on April 30, 2018. Without these fee waivers, the performance would have been lower. Excluding the indirect costs of investing in acquired funds, total class operating expenses would be 2.71% and 2.16% for the Retail Class and Institutional Class, respectively. |
Semi-Annual Report 2017
Top Ten Holdings*
(as a % of total investments,
as of June 30, 2017)
| | | | % of Total | |
Security | | | Investments | |
| PDF Solutions, Inc. | PDFS | | | 7.87 | % |
| Entegris, Inc. | ENTG | | | 6.60 | % |
| KVH Industries, Inc. | KVHI | | | 5.44 | % |
| Akamai Technologies, Inc. | AKAM | | | 5.12 | % |
| Apple, Inc. | AAPL | | | 5.01 | % |
| GSE Systems, Inc. | GVP | | | 4.99 | % |
| Reis, Inc. | REIS | | | 4.03 | % |
| FormFactor, Inc. | FORM | | | 3.58 | % |
| Super Micro Computer, Inc. | SMCI | | | 3.34 | % |
| Oil-Dri Corp. of America | ODC | | | 3.28 | % |
Top Ten Holdings = 49.26% of Total Investments†
| * | Current portfolio holdings may not be indicative of future portfolio holdings. |
| † | Percentage of total investments less cash. |
Sector Weightings*
(as a % of net investments,
as of June 30, 2017)
Sector | | Long* | | | (Short)(1) | | | Total(1)(2) | |
| Consumer Discretionary | | | 3.8 | % | | | — | | | | 3.8 | % |
| Consumer Staples | | | 3.5 | % | | | — | | | | 3.5 | % |
| Energy | | | 0.6 | % | | | — | | | | 0.6 | % |
| Financials | | | 4.3 | % | | | (1.7 | )% | | | 2.6 | % |
| Health Care | | | 11.5 | % | | | — | | | | 11.5 | % |
| Industrials | | | 7.3 | % | | | — | | | | 7.3 | % |
| Information Technology | | | 75.2 | % | | | (4.9 | )% | | | 70.3 | % |
| Cash | | | 0.4 | % | | | — | | | | 0.4 | % |
| * | Current portfolio holdings may not be indicative of future portfolio holdings. |
(1) | Percentage of total investments includes all stocks, plus cash minus all short positions. |
(2) | Total represents the difference between the long exposure and the short exposure, which produces the net exposure. |
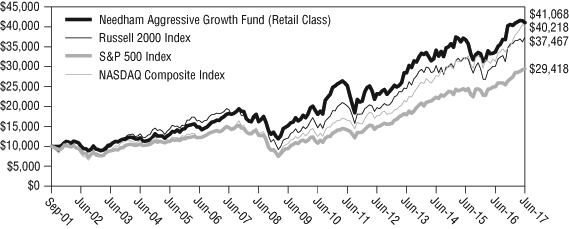
Comparison of Change in Value of a $10,000 Investment
Past performance does not guarantee future results. The performance data quoted represents past performance, and current returns may be lower or higher. The investment return and net asset value will fluctuate so that an investor’s shares, when redeemed, may be worth more or less than the original cost. To obtain performance information current to the most recent month-end, please call 1-800-625-7071. The graph above does not reflect the deduction of taxes that a shareholder would have paid on Fund distributions or on the redemption of Fund shares. Since inception, the Fund’s adviser has absorbed certain expenses of the Fund, without which returns would have been lower.
The Global Industry Classification Standard (GICS®) was developed by and/or is the exclusive property of MSCI, Inc. and Standard & Poor Financial Services LLC (“S&P”). GICS is a service mark of MSCI and S&P and has been licensed for use by U.S. Bancorp Fund Services, LLC.
Needham Funds
| NEEDHAM SMALL CAP GROWTH FUND | Retail Class |
| | Ticker Symbol: NESGX |
| | Institutional Class |
| | Ticker Symbol: NESIX |
Comparative Performance Statistics as of June 30, 2017 (Unaudited)
| | | | | | | | | | | | | | | | | | | | | Gross | |
| | | | 6 | | | 1 | | | 3 | | | 5 | | | 10 | | Since | | Expense | |
| | | Months(8) | | Year | | Years(9) | | Years(9) | | Years(9) | | Inception | | Ratio(15) | |
| Needham Small Cap Growth | |
Fund Retail Class(1)(2) | | | 7.02 | % | | | 29.53 | % | | | 9.39 | %(10) | | | 9.98 | %(11) | | | 7.52 | %(12) | | | 10.43 | %(9)(13) | | | 2.15 | % |
| Needham Small Cap Growth | |
Fund Institutional Class(3) | | | 7.28 | % | | | n/a | | | | n/a | | | | n/a | | | | n/a | | | | 7.28 | %(8) | | | 1.60 | % |
S&P 500 Index(4)(5) | | | 9.34 | % | | | 17.90 | % | | | 9.61 | % | | | 14.63 | % | | | 7.18 | % | | | 7.63 | %(9)(14) | | | | |
NASDAQ Composite Index(4)(6) | | | 14.76 | % | | | 28.40 | % | | | 13.13 | % | | | 17.49 | % | | | 10.25 | % | | | 10.22 | %(9)(14) | | | | |
Russell 2000 Index(4)(7) | | | 4.99 | % | | | 24.60 | % | | | 7.36 | % | | | 13.70 | % | | | 6.92 | % | | | 8.66 | %(9)(14) | | | | |
Past performance does not guarantee future results. The performance data quoted represents past performance, and current returns may be lower or higher. The investment return and net asset value will fluctuate so that an investor’s shares, when redeemed, may be worth more or less than the original cost. To obtain performance information current to the most recent month-end, please call 1-800-625-7071. The returns shown in the above table and accompanying footnotes are net of expenses. The table above does not reflect the deduction of taxes that a shareholder would have paid on Fund distributions or on the redemption of Fund shares.
| 1. | Investment results calculated after reinvestment of dividends. |
| 2. | The inception date of the Retail Class was 5/22/02. |
| 3. | The inception date of the Institutional Class was 12/30/16. |
| 4. | It is not possible to invest directly in an index. The performance of the index does not include the deduction of expenses associated with a mutual fund, such as investment management fees. |
| 5. | The S&P 500 Index is a broad unmanaged measure of the U.S. stock market. |
| 6. | The NASDAQ Composite Index is a broad-based capitalization-weighted index of all NASDAQ Global Market and Small Cap stocks. |
| 7. | The Russell 2000 Index is a broad unmanaged index composed of the smallest 2,000 companies in the Russell 3000 Index. |
| 8. | Not annualized. |
| 9. | Compound annual growth rate (annualized return). Assumes all dividends were reinvested in shares of the Retail Class. |
| 10. | Cumulative return for the three year period was 30.91%, assuming all dividends were reinvested in shares of the Retail Class. |
| 11. | Cumulative return for the five year period was 60.92%, assuming all dividends were reinvested in shares of the Retail Class. |
| 12. | Cumulative return for the ten year period was 106.47%, assuming all dividends were reinvested in shares of the Retail Class. |
| 13. | Cumulative return since inception was 347.85% assuming all dividends were reinvested in shares of the Retail Class. |
| 14. | The return shown for the Index is from the Inception date of the Retail Class. |
| 15. | Gross expense ratio is from the Fund’s prospectus dated May 1, 2017. Additional information pertaining to the Fund’s expense ratios as of June 30, 2017 can be found in the financial highlights. Since January 1, 2009, the investment performance reflects contractually agreed upon fee waivers which expire at the close of business on April 30, 2018. Without these fee waivers, the performance would have been lower. Excluding the indirect costs of investing in acquired funds, total class operating expenses would be 2.09% and 1.54% for the Retail Class and Institutional Class, respectively. |
Semi-Annual Report 2017
Top Ten Holdings*
(as a % of total investments,
as of June 30, 2017)
| | | | % of Total | |
Security | | | Investments | |
| Pure Storage, Inc. | PSTG | | | 8.77 | % |
| Amber Road, Inc. | AMBR | | | 6.95 | % |
| PDF Solutions, Inc. | PDFS | | | 6.67 | % |
| FireEye, Inc. | FEYE | | | 5.21 | % |
| Invuity, Inc. | IVTY | | | 5.09 | % |
| Reis, Inc. | REIS | | | 5.03 | % |
| ViaSat, Inc. | VSAT | | | 4.77 | % |
| KVH Industries, Inc. | KVHI | | | 4.67 | % |
| Frequency Electronics, Inc. | FEIM | | | 4.44 | % |
| Photronics, Inc. | PLAB | | | 4.11 | % |
Top Ten Holdings = 55.71% of Total Investments†
| * | Current portfolio holdings may not be indicative of future portfolio holdings. |
| † | Percentage of total investments less cash. |
Sector Weightings*
(as a % of net investments,
as of June 30, 2017)
Sector | | Long* | | | (Short)(1) | | | Total(1)(2) | |
| Closed-End Funds | | | 4.2 | % | | | — | | | | 4.2 | % |
| Consumer Discretionary | | | 0.2 | % | | | — | | | | 0.2 | % |
| Consumer Staples | | | 1.1 | % | | | — | | | | 1.1 | % |
| Energy | | | 7.7 | % | | | — | | | | 7.7 | % |
| Financials | | | 0.3 | % | | | — | | | | 0.3 | % |
| Health Care | | | 13.5 | % | | | — | | | | 13.5 | % |
| Industrials | | | 3.2 | % | | | — | | | | 3.2 | % |
| Information Technology | | | 66.6 | % | | | — | | | | 66.6 | % |
| Cash | | | 3.2 | % | | | — | | | | 3.2 | % |
| * | Current portfolio holdings may not be indicative of future portfolio holdings. |
(1) | Percentage of total investments includes all stocks, plus cash minus all short positions. |
(2) | Total represents the difference between the long exposure and the short exposure, which produces the net exposure. |
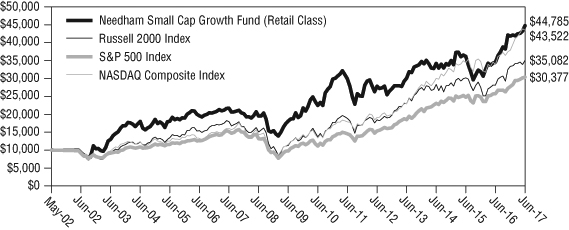
Comparison of Change in Value of a $10,000 Investment
Past performance does not guarantee future results. The performance data quoted represents past performance, and current returns may be lower or higher. The investment return and net asset value will fluctuate so that an investor’s shares, when redeemed, may be worth more or less than the original cost. To obtain performance information current to the most recent month-end, please call 1-800-625-7071. The graph above does not reflect the deduction of taxes that a shareholder would have paid on Fund distributions or on the redemption of Fund shares. Since inception, the Fund’s adviser has absorbed certain expenses of the Fund, without which returns would have been lower.
The Global Industry Classification Standard (GICS®) was developed by and/or is the exclusive property of MSCI, Inc. and Standard & Poor Financial Services LLC (“S&P”). GICS is a service mark of MSCI and S&P and has been licensed for use by U.S. Bancorp Fund Services, LLC.
Needham Funds
Disclosure of Fund Expenses (Unaudited)
The following expense table is shown so that you can understand the impact of fees on your investment. All mutual funds have operating expenses. As a shareholder of a Portfolio, you incur transactional costs, including redemption fees and ongoing costs, which include costs for portfolio management, administrative services, and shareholder reports, among others. A Portfolio’s expenses are expressed as a percentage of its average net assets. This figure is known as the expense ratio. The following examples are intended to help you understand the ongoing costs (in dollars) of investing in each Portfolio and to compare these costs with those of other mutual funds. The examples are based on an investment of $1,000 made at the beginning of the period shown and held for the entire period. The expense example table below illustrates your fund’s cost in two ways:
| • | Actual Expenses. This section helps you to estimate the actual expenses after fee waivers that you paid over the period. The “Ending Account Value” shown is derived from the Portfolio’s actual return, and “Expenses Paid During Period” shows the dollar amount that would have been paid by an investor who started with $1,000 in the Portfolio. You may use the information here, together with the amount you invested, to estimate the expenses that you paid over the period. To do so, simply divide your account value by $1,000 (for example, an $8,600 account value divided by $1,000 = 8.6), then multiply the result by the number given for your Portfolio under the heading entitled “Expenses Paid During Period”. |
| | |
| • | Hypothetical Expenses on a 5% Return. This section is intended to help you compare your Portfolio’s costs with those of other mutual funds. It assumes that the Portfolio had a return of 5% before expenses during the period shown, but that the expense ratio is unchanged. In this case, because the return used is not the Portfolio’s actual return, the results do not apply to your investment. The example is useful in making comparisons because the Securities and Exchange Commission requires all mutual funds to calculate expenses based on a 5% return. You can assess your Portfolio’s cost by comparing this hypothetical example with the hypothetical examples that appear in shareholders reports of other funds. |
Please note that the expenses shown in the table are meant to highlight your ongoing costs only and do not reflect any transactional costs, such as redemption fees or exchange fees. Therefore, the table is useful in comparing ongoing costs only, and will not help you determine the relative total costs of owning different funds. In addition, if these transactional costs were included, your costs would have been higher.
Semi-Annual Report 2017
For the Period January 1, 2017 to June 30, 2017
Expense Example Table (Unaudited)
| | | Beginning | | | Ending | | | Expenses Paid | | | Expense Ratio | |
| | | Account | | | Account | | | During Period* | | | During Period* | |
| | | Value | | | Value | | | 1/1/17 – | | | 1/1/17 – | |
| | | 1/1/17 | | | 6/30/17 | | | 6/30/17 | | | 6/30/17 | |
| Needham Growth Fund | | | | | | | | | | | | |
| Retail Class Actual Expenses | | $ | 1,000.00 | | | $ | 1,040.30 | | | $ | 10.42 | | | | 2.06 | % |
| Retail Class Hypothetical Example | | | | | | | | | | | | | | | | |
| for Comparison Purposes | | | | | | | | | | | | | | | | |
| (5% return before expenses) | | $ | 1,000.00 | | | $ | 1,014.58 | | | $ | 10.29 | | | | 2.06 | % |
| Institutional Class Actual Expenses | | $ | 1,000.00 | | | $ | 1,042.90 | | | $ | 8.05 | | | | 1.59 | % |
| Institutional Class Hypothetical | | | | | | | | | | | | | | | | |
| Example for Comparison Purposes | | | | | | | | | | | | | | | | |
| (5% return before expenses) | | $ | 1,000.00 | | | $ | 1,016.91 | | | $ | 7.95 | | | | 1.59 | % |
| | | | | | | | | | | | | | | | | |
| Needham Aggressive Growth Fund | | | | | | | | | | | | | | | | |
| Retail Class Actual Expenses | | $ | 1,000.00 | | | $ | 1,011.70 | | | $ | 11.42 | | | | 2.29 | % |
| Retail Class Hypothetical Example | | | | | | | | | | | | | | | | |
| for Comparison Purposes | | | | | | | | | | | | | | | | |
| (5% return before expenses) | | $ | 1,000.00 | | | $ | 1,013.44 | | | $ | 11.43 | | | | 2.29 | % |
| Institutional Class Actual Expenses | | $ | 1,000.00 | | | $ | 1,014.80 | | | $ | 8.89 | | | | 1.78 | % |
| Institutional Class Hypothetical | | | | | | | | | | | | | | | | |
| Example for Comparison Purposes | | | | | | | | | | | | | | | | |
| (5% return before expenses) | | $ | 1,000.00 | | | $ | 1,015.97 | | | $ | 8.90 | | | | 1.78 | % |
| | | | | | | | | | | | | | | | | |
| Needham Small Cap Growth Fund | | | | | | | | | | | | | | | | |
| Retail Class Actual Expenses | | $ | 1,000.00 | | | $ | 1,070.20 | | | $ | 10.01 | | | | 1.95 | % |
| Retail Class Hypothetical Example | | | | | | | | | | | | | | | | |
| for Comparison Purposes | | | | | | | | | | | | | | | | |
| (5% return before expenses) | | $ | 1,000.00 | | | $ | 1,015.12 | | | $ | 9.74 | | | | 1.95 | % |
| Institutional Class Actual Expenses | | $ | 1,000.00 | | | $ | 1,072.80 | | | $ | 7.20 | | | | 1.40 | % |
| Institutional Class Hypothetical | | | | | | | | | | | | | | | | |
| Example for Comparison Purposes | | | | | | | | | | | | | | | | |
| (5% return before expenses) | | $ | 1,000.00 | | | $ | 1,017.85 | | | $ | 7.00 | | | | 1.40 | % |
| * | Expenses are equal to the average account value times the Portfolio’s annualized expense ratio multiplied 181/365 (to reflect the one-half-year period). |
Needham Funds
Needham Growth Fund
Schedule of Investments
June 30, 2017 (Unaudited)
| | | Shares | | | Market Value | |
| Common Stocks (99.4%) | | | | | | |
| | | | | | | |
| Airlines (0.3%) | | | | | | |
| United Continental Holdings, Inc.* | | | 5,000 | | | $ | 376,250 | |
| | | | | | | | | |
| Auto Components (0.1%) | | | | | | | | |
| Sypris Solutions, Inc.* | | | 95,000 | | | | 156,750 | |
| | | | | | | | | |
| Biotechnology (5.7%) | | | | | | | | |
| Gilead Sciences, Inc.† | | | 92,500 | | | | 6,547,150 | |
| | | | | | | | | |
| Capital Markets (2.6%) | | | | | | | | |
| Financial Engines, Inc.† | | | 56,000 | | | | 2,049,600 | |
| Oaktree Capital Group LLC | | | 20,000 | | | | 932,000 | |
| | | | | | | | 2,981,600 | |
| | | | | | | | | |
| Commercial Services & Supplies (0.1%) | | | | | | | | |
| Clean Harbors, Inc.* | | | 3,000 | | | | 167,490 | |
| | | | | | | | | |
| Communications Equipment (9.4%) | | | | | | | | |
| KVH Industries, Inc.* | | | 538,750 | | | | 5,118,125 | |
| ViaSat, Inc.*† | | | 87,500 | | | | 5,792,500 | |
| | | | | | | | 10,910,625 | |
| | | | | | | | | |
| Electrical Equipment (0.3%) | | | | | | | | |
| Vicor Corp.* | | | 20,000 | | | | 358,000 | |
| | | | | | | | | |
| Electronic Equipment, Instruments & Components (4.1%) | | | | | | | | |
| Corning, Inc. | | | 35,000 | | | | 1,051,750 | |
| FLIR Systems, Inc. | | | 15,000 | | | | 519,900 | |
| Frequency Electronics, Inc.* | | | 50,000 | | | | 477,000 | |
| IPG Photonics Corp.* | | | 6,000 | | | | 870,600 | |
| National Instruments Corp. | | | 20,800 | | | | 836,576 | |
| Vishay Intertechnology, Inc. | | | 60,000 | | | | 996,000 | |
| | | | | | | | 4,751,826 | |
| | | | | | | | | |
| Energy Equipment & Services (1.2%) | | | | | | | | |
| Aspen Aerogels, Inc.* | | | 57,500 | | | | 255,875 | |
| Core Laboratories NV | | | 3,000 | | | | 303,810 | |
| Schlumberger Ltd. | | | 12,500 | | | | 823,000 | |
| | | | | | | | 1,382,685 | |
See accompanying notes to financial statements.
Semi-Annual Report 2017
Needham Growth Fund
Schedule of Investments (Continued)
June 30, 2017 (Unaudited)
| | | Shares | | | Market Value | |
| | | | | | | |
| Common Stocks – Continued | | | | | | |
| | | | | | | |
| Health Care Equipment & Supplies (10.2%) | | | | | | |
| Analogic Corp. | | | 3,100 | | | $ | 225,215 | |
| Becton Dickinson and Co. | | | 29,500 | | | | 5,755,745 | |
| CONMED Corp. | | | 30,000 | | | | 1,528,200 | |
| Invuity, Inc.* | | | 108,100 | | | | 783,725 | |
| Medtronic PLC | | | 26,290 | | | | 2,333,237 | |
| Varian Medical Systems, Inc.* | | | 11,500 | | | | 1,186,685 | |
| | | | | | | | 11,812,807 | |
| | | | | | | | | |
| Health Care Providers & Services (5.5%) | | | | | | | | |
| Express Scripts Holding Co.*† | | | 100,000 | | | | 6,384,000 | |
| | | | | | | | | |
| Health Care Technology (0.2%) | | | | | | | | |
| Castlight Health, Inc.* | | | 60,000 | | | | 249,000 | |
| | | | | | | | | |
| Household Products (0.8%) | | | | | | | | |
| Oil-Dri Corp. of America | | | 21,800 | | | | 915,818 | |
| | | | | | | | | |
| Industrial Conglomerates (0.3%) | | | | | | | | |
| Honeywell International, Inc. | | | 2,500 | | | | 333,225 | |
| | | | | | | | | |
| Insurance (0.1%) | | | | | | | | |
| Markel Corp.* | | | 150 | | | | 146,379 | |
| | | | | | | | | |
| Internet Software & Services (10.2%) | | | | | | | | |
| The Trade Desk, Inc.* | | | 11,900 | | | | 596,309 | |
| 2U, Inc.* | | | 6,000 | | | | 281,520 | |
| Akamai Technologies, Inc.*† | | | 50,000 | | | | 2,490,500 | |
| Amber Road, Inc.* | | | 443,350 | | | | 3,799,509 | |
| comScore, Inc.* | | | 70,200 | | | | 1,842,750 | |
| Coupa Software, Inc.* | | | 2,500 | | | | 72,450 | |
| Nutanix, Inc.* | | | 12,000 | | | | 241,800 | |
| Q2 Holdings, Inc.* | | | 20,000 | | | | 739,000 | |
| Reis, Inc. | | | 82,500 | | | | 1,753,125 | |
| | | | | | | | 11,816,963 | |
| | | | | | | | | |
| Life Sciences Tools & Services (8.1%) | | | | | | | | |
| Bruker Corp. | | | 10,000 | | | | 288,400 | |
| Thermo Fisher Scientific, Inc.† | | | 52,000 | | | | 9,072,440 | |
| | | | | | | | 9,360,840 | |
See accompanying notes to financial statements.
Needham Funds
Needham Growth Fund
Schedule of Investments (Continued)
June 30, 2017 (Unaudited)
| | | Shares | | | Market Value | |
| | | | | | | |
| Common Stocks – Continued | | | | | | |
| | | | | | | |
| Media (4.2%) | | | | | | |
| Comcast Corp. | | | 117,000 | | | $ | 4,553,640 | |
| World Wrestling Entertainment, Inc. | | | 12,500 | | | | 254,625 | |
| | | | | | | | 4,808,265 | |
| | | | | | | | | |
| Oil, Gas & Consumable Fuels (0.4%) | | | | | | | | |
| Hess Corp. | | | 10,000 | | | | 438,700 | |
| Navigator Holdings Ltd.* | | | 5,000 | | | | 41,500 | |
| | | | | | | | 480,200 | |
| | | | | | | | | |
| Pharmaceuticals (1.7%) | | | | | | | | |
| Agile Therapeutics, Inc.* | | | 105,000 | | | | 393,750 | |
| Corium International, Inc.* | | | 218,400 | | | | 1,629,264 | |
| | | | | | | | 2,023,014 | |
| | | | | | | | | |
| Professional Services (1.3%) | | | | | | | | |
| WageWorks, Inc.* | | | 22,500 | | | | 1,512,000 | |
| | | | | | | | | |
| Semiconductors & Semiconductor Equipment (15.5%) | | | | | | | | |
| Applied Materials, Inc. | | | 7,500 | | | | 309,825 | |
| Entegris, Inc.* | | | 162,000 | | | | 3,555,900 | |
| FormFactor, Inc.* | | | 363,350 | | | | 4,505,540 | |
| Lam Research Corp. | | | 2,500 | | | | 353,575 | |
| MKS Instruments, Inc. | | | 32,000 | | | | 2,153,600 | |
| Nova Measuring Instruments Ltd.* | | | 65,000 | | | | 1,435,850 | |
| PDF Solutions, Inc.* | | | 250,000 | | | | 4,112,500 | |
| Photronics, Inc.* | | | 156,000 | | | | 1,466,400 | |
| | | | | | | | 17,893,190 | |
| | | | | | | | | |
| Software (0.9%) | | | | | | | | |
| Appian Corp.* | | | 1,346 | | | | 24,430 | |
| Red Hat, Inc.* | | | 10,000 | | | | 957,500 | |
| | | | | | | | 981,930 | |
| | | | | | | | | |
| Specialty Retail (6.2%) | | | | | | | | |
| CarMax, Inc.*† | | | 99,000 | | | | 6,242,940 | |
| Dick’s Sporting Goods, Inc. | | | 22,000 | | | | 876,260 | |
| | | | | | | | 7,119,200 | |
See accompanying notes to financial statements.
Semi-Annual Report 2017
Needham Growth Fund
Schedule of Investments (Continued)
June 30, 2017 (Unaudited)
| | | Shares | | | Market Value | |
| | | | | | | |
| Common Stocks – Continued | | | | | | |
| | | | | | | |
| Technology Hardware, Storage & Peripherals (8.1%) | | | | | | |
| Apple, Inc. | | | 7,500 | | | $ | 1,080,150 | |
| Cray, Inc.* | | | 4,450 | | | | 81,880 | |
| Electronics For Imaging, Inc.* | | | 64,000 | | | | 3,032,320 | |
| Pure Storage, Inc.* | | | 50,000 | | | | 640,500 | |
| Super Micro Computer, Inc.* | | | 185,950 | | | | 4,583,668 | |
| | | | | | | | 9,418,518 | |
| | | | | | | | | |
| Textiles, Apparel & Luxury Goods (0.2%) | | | | | | | | |
| Under Armour, Inc.* | | | 12,500 | | | | 256,000 | |
| | | | | | | | | |
| Thrifts & Mortgage Finance (0.1%) | | | | | | | | |
| Ladder Capital Corp. | | | 7,673 | | | | 102,895 | |
| | | | | | | | | |
| Trading Companies & Distributors (1.6%) | | | | | | | | |
| Air Lease Corp. | | | 50,000 | | | | 1,868,000 | |
| | | | | | | | | |
| Total Common Stocks | | | | | | | | |
| (Cost $52,064,518) | | | | | | $ | 115,114,620 | |
| | | | | | | | | |
| Short-Term Investments (0.4%) | | | | | | | | |
| | | | | | | | | |
| Money Market Fund (0.4%) | | | | | | | | |
| Dreyfus Treasury Securities Cash Management – | | | | | | | | |
| Institutional Class 0.75% (a) | | | | | | | | |
| (Cost $443,697) | | | 443,697 | | | $ | 443,697 | |
| | | | | | | | | |
| Total Investments (99.8%) | | | | | | | | |
| (Cost $52,508,215) | | | | | | | 115,558,317 | |
| Total Securities Sold Short (-4.2%) | | | | | | | (4,827,225 | ) |
| (Proceeds $4,060,084) | | | | | | | | |
| Other Assets in Excess of Liabilities (4.4%) | | | | | | | 5,053,728 | |
| Net Assets (100.0%) | | | | | | $ | 115,784,820 | |
| * | Non-income producing security. |
| (a) | Rate shown is the seven day yield as of June 30, 2017. |
| † | Security position is either entirely or partially held in a segregated account as collateral for securities sold short, aggregating a total market value of $4,676,725. |
| | |
| | The Global Industry Classification Standard (GICS®) was developed by and/or is the exclusive property of MSCI, Inc. and Standard & Poor’s Financial Services LLC (“S&P”). GICS is a service mark of MSCI and S&P and has been licensed for use by U.S. Bancorp Fund Services, LLC. |
See accompanying notes to financial statements.
Needham Funds
Needham Growth Fund
Schedule of Securities Sold Short
June 30, 2017 (Unaudited)
| | | Shares | | | Market Value | |
| | | | | | | |
| Securities Sold Short (-3.9%) | | | | | | |
| | | | | | | |
| Capital Markets (-0.6%) | | | | | | |
| Medallion Financial Corp. | | | 310,000 | | | $ | 740,900 | |
| | | | | | | | | |
| Communications Equipment (-3.1%) | | | | | | | | |
| Applied Optoelectronics, Inc.* | | | 1,500 | | | | 92,685 | |
| Ubiquiti Networks, Inc.* | | | 67,500 | | | | 3,507,975 | |
| | | | | | | | 3,600,660 | |
| | | | | | | | | |
| Insurance (-0.2%) | | | | | | | | |
| Health Insurance Innovations, Inc.* | | | 8,750 | | | | 205,625 | |
| | | | | | | | | |
| Total Securities Sold Short (-3.9%) | | | | | | | | |
| (Proceeds $3,805,480) | | | | | | $ | 4,547,185 | |
| | | | | | | | | |
| Exchange Traded Funds Sold Short (-0.3%) | | | | | | | | |
| iShares Core S&P Small-Cap ETF | | | 2,000 | | | | 140,220 | |
| iShares S&P Small-Cap 600 Value ETF | | | 1,000 | | | | 139,820 | |
| | | | | | | | 280,040 | |
| | | | | | | | | |
| Total Exchange Traded Funds Sold Short (-0.3%) | | | | | | | | |
| (Proceeds $254,604) | | | | | | $ | 280,040 | |
| | | | | | | | | |
| Total Securities & Exchange Traded Funds Sold Short (-4.2%) | | | | | | | | |
| (Proceeds $4,060,084) | | | | | | $ | 4,827,225 | |
| * | Non-income producing security. |
See accompanying notes to financial statements.
Semi-Annual Report 2017
Needham Aggressive Growth Fund
Schedule of Investments
June 30, 2017 (Unaudited)
| | | Shares | | | Market Value | |
| | | | | | | |
| Common Stocks (99.9%) | | | | | | |
| | | | | | | |
| Biotechnology (2.6%) | | | | | | |
| Gilead Sciences, Inc.† | | | 23,000 | | | $ | 1,627,940 | |
| | | | | | | | | |
| Building Products (0.6%) | | | | | | | | |
| DIRTT Environmental Solutions* | | | 75,000 | | | | 394,012 | |
| | | | | | | | | |
| Capital Markets (1.4%) | | | | | | | | |
| Financial Engines, Inc. | | | 25,000 | | | | 915,000 | |
| | | | | | | | | |
| Commercial Services & Supplies (0.9%) | | | | | | | | |
| Clean Harbors, Inc.* | | | 4,000 | | | | 223,320 | |
| Ecology and Environment, Inc. | | | 27,869 | | | | 352,543 | |
| | | | | | | | 575,863 | |
| | | | | | | | | |
| Communications Equipment (9.6%) | | | | | | | | |
| KVH Industries, Inc.*† | | | 362,150 | | | | 3,440,425 | |
| Norsat International, Inc.* | | | 85,000 | | | | 966,875 | |
| ViaSat, Inc.*† | | | 25,000 | | | | 1,655,000 | |
| | | | | | | | 6,062,300 | |
| | | | | | | | | |
| Electrical Equipment (2.0%) | | | | | | | | |
| Vicor Corp.* | | | 72,500 | | | | 1,297,750 | |
| | | | | | | | | |
| Electronic Equipment, Instruments & Components (3.4%) | | | | | | | | |
| FLIR Systems, Inc. | | | 7,500 | | | | 259,950 | |
| Frequency Electronics, Inc.* | | | 28,950 | | | | 276,183 | |
| IPG Photonics Corp.* | | | 7,500 | | | | 1,088,250 | |
| National Instruments Corp. | | | 9,000 | | | | 361,980 | |
| Vishay Precision Group, Inc.* | | | 10,000 | | | | 173,000 | |
| | | | | | | | 2,159,363 | |
| | | | | | | | | |
| Energy Equipment & Services (0.6%) | | | | | | | | |
| Aspen Aerogels, Inc.* | | | 80,000 | | | | 356,000 | |
| | | | | | | | | |
| Health Care Equipment & Supplies (4.3%) | | | | | | | | |
| Analogic Corp. | | | 3,100 | | | | 225,215 | |
| Becton Dickinson and Co. | | | 4,500 | | | | 877,995 | |
| CryoPort, Inc.* | | | 75,000 | | | | 369,000 | |
| Invuity, Inc.* | | | 53,350 | | | | 386,788 | |
| LeMaitre Vascular, Inc. | | | 28,000 | | | | 874,160 | |
| | | | | | | | 2,733,158 | |
See accompanying notes to financial statements.
Needham Funds
Needham Aggressive Growth Fund
Schedule of Investments (Continued)
June 30, 2017 (Unaudited)
| | | Shares | | | Market Value | |
| | | | | | | |
| Common Stocks – Continued | | | | | | |
| | | | | | | |
| Health Care Providers & Services (0.9%) | | | | | | |
| Civitas Solutions, Inc.* | | | 9,000 | | | $ | 157,500 | |
| Express Scripts Holding Co.* | | | 6,000 | | | | 383,040 | |
| | | | | | | | 540,540 | |
| | | | | | | | | |
| Health Care Technology (0.9%) | | | | | | | | |
| Omnicell, Inc.* | | | 13,000 | | | | 560,300 | |
| | | | | | | | | |
| Household Durables (0.4%) | | | | | | | | |
| iRobot Corp.* | | | 3,000 | | | | 252,420 | |
| | | | | | | | | |
| Household Products (3.3%) | | | | | | | | |
| Oil-Dri Corp. of America | | | 49,442 | | | | 2,077,058 | |
| | | | | | | | | |
| Insurance (0.2%) | | | | | | | | |
| Markel Corp.* | | | 150 | | | | 146,379 | |
| | | | | | | | | |
| Internet Software & Services (16.3%) | | | | | | | | |
| The Trade Desk, Inc.* | | | 5,000 | | | | 250,550 | |
| 2U, Inc.* | | | 6,000 | | | | 281,520 | |
| Akamai Technologies, Inc.*† | | | 65,000 | | | | 3,237,650 | |
| Amber Road, Inc.*† | | | 176,650 | | | | 1,513,891 | |
| ARI Network Services, Inc.* | | | 15,000 | | | | 105,750 | |
| ChannelAdvisor Corp.* | | | 14,117 | | | | 163,051 | |
| comScore, Inc.* | | | 64,000 | | | | 1,680,000 | |
| Coupa Software, Inc.* | | | 2,500 | | | | 72,450 | |
| Nutanix, Inc.* | | | 1,500 | | | | 30,225 | |
| Q2 Holdings, Inc.* | | | 12,500 | | | | 461,875 | |
| Reis, Inc.† | | | 120,000 | | | | 2,550,000 | |
| | | | | | | | 10,346,962 | |
| | | | | | | | | |
| Media (0.2%) | | | | | | | | |
| World Wrestling Entertainment, Inc. | | | 6,000 | | | | 122,220 | |
| | | | | | | | | |
| Pharmaceuticals (2.2%) | | | | | | | | |
| Agile Therapeutics, Inc.* | | | 85,000 | | | | 318,750 | |
| Corium International, Inc.* | | | 140,000 | | | | 1,044,400 | |
| | | | | | | | 1,363,150 | |
See accompanying notes to financial statements.
Semi-Annual Report 2017
Needham Aggressive Growth Fund
Schedule of Investments (Continued)
June 30, 2017 (Unaudited)
| | | Shares | | | Market Value | |
| | | | | | | |
| Common Stocks – Continued | | | | | | |
| | | | | | | |
| Professional Services (3.3%) | | | | | | |
| CRA International, Inc. | | | 5,000 | | | $ | 181,600 | |
| WageWorks, Inc.*† | | | 28,000 | | | | 1,881,600 | |
| | | | | | | | 2,063,200 | |
| | | | | | | | | |
| Real Estate Investment Trusts (REITs) (2.4%) | | | | | | | | |
| Equinix, Inc. | | | 3,499 | | | | 1,501,631 | |
| | | | | | | | | |
| Semiconductors & Semiconductor Equipment (24.9%) | | | | | | | | |
| Entegris, Inc.* | | | 190,000 | | | | 4,170,500 | |
| FormFactor, Inc.* | | | 182,600 | | | | 2,264,240 | |
| MKS Instruments, Inc. | | | 27,000 | | | | 1,817,100 | |
| Nova Measuring Instruments Ltd.*† | | | 70,500 | | | | 1,557,345 | |
| PDF Solutions, Inc.*† | | | 302,500 | | | | 4,976,125 | |
| Photronics, Inc.* | | | 97,750 | | | | 918,850 | |
| Xcerra Corp.* | | | 7,500 | | | | 73,275 | |
| | | | | | | | 15,777,435 | |
| | | | | | | | | |
| Software (6.7%) | | | | | | | | |
| Appian Corp.* | | | 742 | | | | 13,467 | |
| Bottomline Technologies, Inc.* | | | 18,000 | | | | 462,420 | |
| Exa Corp.* | | | 7,500 | | | | 103,500 | |
| GSE Systems, Inc.*^ | | | 1,070,000 | | | | 3,156,500 | |
| Red Hat, Inc.* | | | 5,000 | | | | 478,750 | |
| | | | | | | | 4,214,637 | |
| | | | | | | | | |
| Specialty Retail (2.8%) | | | | | | | | |
| CarMax, Inc.*† | | | 21,500 | | | | 1,355,790 | |
| Dick’s Sporting Goods, Inc. | | | 10,000 | | | | 398,300 | |
| | | | | | | | 1,754,090 | |
| | | | | | | | | |
| Technology Hardware, Storage & Peripherals (9.8%) | | | | | | | | |
| Apple, Inc.† | | | 22,000 | | | | 3,168,440 | |
| Electronics For Imaging, Inc.* | | | 16,000 | | | | 758,080 | |
| Pure Storage, Inc.* | | | 15,000 | | | | 192,150 | |
| Super Micro Computer, Inc.*† | | | 85,725 | | | | 2,113,121 | |
| | | | | | | | 6,231,791 | |
| | | | | | | | | |
See accompanying notes to financial statements.
Needham Funds
Needham Aggressive Growth Fund
Schedule of Investments (Continued)
June 30, 2017 (Unaudited)
| | | Shares | | | Market Value | |
| | | | | | | |
| Common Stocks – Continued | | | | | | |
| | | | | | | |
| Textiles, Apparel & Luxury Goods (0.2%) | | | | | | |
| Under Armour, Inc.* | | | 7,000 | | | $ | 141,120 | |
| | | | | | | | | |
| Thrifts & Mortgage Finance (0.0%) | | | | | | | | |
| Ladder Capital Corp. | | | 1,627 | | | | 21,818 | |
| | | | | | | | | |
| Total Common Stocks | | | | | | | | |
| (Cost $32,287,648) | | | | | | $ | 63,236,137 | |
| | | | | | | | | |
| Short-Term Investments (0.4%) | | | | | | | | |
| | | | | | | | | |
| Money Market Fund (0.4%) | | | | | | | | |
| Dreyfus Treasury Securities Cash Management – | | | | | | | | |
| Institutional Class 0.75% (a) | | | | | | | | |
| (Cost $245,900) | | | 245,900 | | | $ | 245,900 | |
| | | | | | | | | |
| Total Investments (100.3%) | | | | | | | | |
| (Cost $32,533,548) | | | | | | | 63,482,037 | |
| Total Securities Sold Short (-6.2%) | | | | | | | (3,909,508 | ) |
| (Proceeds $3,249,693) | | | | | | | | |
| Other Assets in Excess of Liabilities (5.9%) | | | | | | | 3,715,792 | |
| Net Assets (100.0%) | | | | | | $ | 63,288,321 | |
| * | Non-income producing security. |
| ^ | Affiliated security. Please refer to Note 11 of the Notes to Financial Statements. |
| (a) | Rate shown is the seven day yield as of June 30, 2017. |
| † | Security position is either entirely or partially held in a segregated account as collateral for securities sold short, aggregating a total market value of $4,956,560. |
| | |
| | The Global Industry Classification Standard (GICS®) was developed by and/or is the exclusive property of MSCI, Inc. and Standard & Poor’s Financial Services LLC (“S&P”). GICS is a service mark of MSCI and S&P and has been licensed for use by U.S. Bancorp Fund Services, LLC. |
| | |
See accompanying notes to financial statements.
Semi-Annual Report 2017
Needham Aggressive Growth Fund
Schedule of Securities Sold Short
June 30, 2017 (Unaudited)
| | | Shares | | | Market Value | |
| | | | | | | |
| Securities Sold Short (-6.2%) | | | | | | |
| | | | | | | |
| Capital Markets (-1.3%) | | | | | | |
| Medallion Financial Corp. | | | 340,000 | | | $ | 812,600 | |
| | | | | | | | | |
| Communications Equipment (-3.9%) | | | | | | | | |
| Applied Optoelectronics, Inc.* | | | 1,000 | | | | 61,790 | |
| Ubiquiti Networks, Inc.* | | | 46,250 | | | | 2,403,613 | |
| | | | | | | | 2,465,403 | |
| | | | | | | | | |
| Insurance (-0.3%) | | | | | | | | |
| Health Insurance Innovations, Inc.* | | | 8,750 | | | | 205,625 | |
| | | | | | | | | |
| Software (-0.7%) | | | | | | | | |
| ANSYS, Inc.* | | | 3,500 | | | | 425,880 | |
| | | | | | | | | |
| Total Securities Sold Short (-6.2%) | | | | | | | | |
| (Proceeds $3,249,693) | | | | | | $ | 3,909,508 | |
| * | Non-income producing security. |
See accompanying notes to financial statements.
Needham Funds
Needham Small Cap Growth Fund
Schedule of Investments
June 30, 2017 (Unaudited)
| | | Shares | | | Market Value | |
| | | | | | | |
| Common Stocks (92.5%) | | | | | | |
| | | | | | | |
| Biotechnology (0.1%) | | | | | | |
| Exact Sciences Corp.* | | | 500 | | | $ | 17,685 | |
| | | | | | | | | |
| Commercial Services & Supplies (1.3%) | | | | | | | | |
| Mobile Mini, Inc. | | | 13,000 | | | | 388,050 | |
| | | | | | | | | |
| Communications Equipment (9.0%) | | | | | | | | |
| Infinera Corp.* | | | 7,500 | | | | 80,025 | |
| KVH Industries, Inc.* | | | 136,500 | | | | 1,296,750 | |
| ViaSat, Inc.* | | | 20,000 | | | | 1,324,000 | |
| | | | | | | | 2,700,775 | |
| | | | | | | | | |
| Electronic Equipment, Instruments & Components (5.3%) | | | | | | | | |
| Frequency Electronics, Inc.* | | | 129,195 | | | | 1,232,520 | |
| Vishay Precision Group, Inc.* | | | 20,000 | | | | 346,000 | |
| | | | | | | | 1,578,520 | |
| | | | | | | | | |
| Energy Equipment & Services (5.2%) | | | | | | | | |
| Aspen Aerogels, Inc.* | | | 180,000 | | | | 801,000 | |
| Core Laboratories NV | | | 6,000 | | | | 607,620 | |
| Independence Contract Drilling, Inc.* | | | 42,500 | | | | 165,325 | |
| | | | | | | | 1,573,945 | |
| | | | | | | | | |
| Food Products (1.1%) | | | | | | | | |
| Lifeway Foods, Inc.* | | | 35,000 | | | | 326,900 | |
| | | | | | | | | |
| Health Care Equipment & Supplies (5.6%) | | | | | | | | |
| Analogic Corp. | | | 3,700 | | | | 268,805 | |
| Invuity, Inc.* | | | 195,000 | | | | 1,413,750 | |
| | | | | | | | 1,682,555 | |
| | | | | | | | | |
| Health Care Providers & Services (0.2%) | | | | | | | | |
| Express Scripts Holding Co.* | | | 1,000 | | | | 63,840 | |
| | | | | | | | | |
| Health Care Technology (1.7%) | | | | | | | | |
| Castlight Health, Inc.* | | | 120,000 | | | | 498,000 | |
| | | | | | | | | |
| Internet Software & Services (21.6%) | | | | | | | | |
| 2U, Inc.* | | | 5,000 | | | | 234,600 | |
| Akamai Technologies, Inc.* | | | 2,000 | | | | 99,620 | |
| Amber Road, Inc.* | | | 225,000 | | | | 1,928,250 | |
| ChannelAdvisor Corp.* | | | 40,000 | | | | 462,000 | |
See accompanying notes to financial statements.
Semi-Annual Report 2017
Needham Small Cap Growth Fund
Schedule of Investments (Continued)
June 30, 2017 (Unaudited)
| | | Shares | | | Market Value | |
| | | | | | | |
| Common Stocks – Continued | | | | | | |
| | | | | | | |
| Internet Software & Services – Continued | | | | | | |
| comScore, Inc.* | | | 30,300 | | | $ | 795,375 | |
| Five9, Inc.* | | | 1,000 | | | | 21,520 | |
| Nutanix, Inc.* | | | 52,500 | | | | 1,057,875 | |
| Reis, Inc. | | | 65,708 | | | | 1,396,295 | |
| Twilio, Inc.* | | | 500 | | | | 14,555 | |
| YuMe, Inc.* | | | 100,000 | | | | 470,000 | |
| | | | | | | | 6,480,090 | |
| | | | | | | | | |
| IT Services (2.6%) | | | | | | | | |
| ServiceSource International, Inc.* | | | 200,000 | | | | 776,000 | |
| | | | | | | | | |
| Oil, Gas & Consumable Fuels (2.5%) | | | | | | | | |
| Approach Resources, Inc.* | | | 110,000 | | | | 370,700 | |
| Hess Corp. | | | 4,750 | | | | 208,382 | |
| Navigator Holdings Ltd.* | | | 20,000 | | | | 166,000 | |
| | | | | | | | 745,082 | |
| | | | | | | | | |
| Pharmaceuticals (6.0%) | | | | | | | | |
| Agile Therapeutics, Inc.* | | | 240,000 | | | | 900,000 | |
| Corium International, Inc.* | | | 120,000 | | | | 895,200 | |
| | | | | | | | 1,795,200 | |
| | | | | | | | | |
| Semiconductors & Semiconductor Equipment (11.4%) | | | | | | | | |
| FormFactor, Inc.* | | | 18,100 | | | | 224,440 | |
| NeoPhotonics Corp.* | | | 27,500 | | | | 212,300 | |
| PDF Solutions, Inc.* | | | 112,500 | | | | 1,850,625 | |
| Photronics, Inc.* | | | 121,300 | | | | 1,140,220 | |
| | | | | | | | 3,427,585 | |
| | | | | | | | | |
| Software (4.8%) | | | | | | | | |
| Appian Corp.* | | | 371 | | | | 6,734 | |
| FireEye, Inc.* | | | 95,000 | | | | 1,444,950 | |
| | | | | | | | 1,451,684 | |
| | | | | | | | | |
| Technology Hardware, Storage & Peripherals (11.8%) | | | | | | | | |
| Cray, Inc.* | | | 7,050 | | | | 129,720 | |
| Pure Storage, Inc.* | | | 190,000 | | | | 2,433,900 | |
| Super Micro Computer, Inc.* | | | 40,000 | | | | 986,000 | |
| | | | | | | | 3,549,620 | |
See accompanying notes to financial statements.
Needham Funds
Needham Small Cap Growth Fund
Schedule of Investments (Continued)
June 30, 2017 (Unaudited)
| | | Shares | | | Market Value | |
| | | | | | | |
| Common Stocks – Continued | | | | | | |
| | | | | | | |
| Textiles, Apparel & Luxury Goods (0.2%) | | | | | | |
| Under Armour, Inc.* | | | 2,500 | | | $ | 50,400 | |
| | | | | | | | | |
| Thrifts & Mortgage Finance (0.3%) | | | | | | | | |
| LendingTree, Inc.* | | | 500 | | | | 86,100 | |
| | | | | | | | | |
| Trading Companies & Distributors (1.9%) | | | | | | | | |
| Air Lease Corp.† | | | 15,000 | | | | 560,400 | |
| | | | | | | | | |
| Total Common Stocks | | | | | | | | |
| (Cost $25,236,698) | | | | | | $ | 27,752,431 | |
| | | | | | | | | |
| Closed-End Funds (4.2%) | | | | | | | | |
| Tekla Healthcare Investors | | | 25,000 | | | | 627,500 | |
| Tekla Life Sciences Investors | | | 30,000 | | | | 625,500 | |
| | | | | | | | | |
| Total Closed-End Funds | | | | | | | | |
| (Cost $1,176,564) | | | | | | $ | 1,253,000 | |
| | | | | | | | | |
| Short-Term Investments (3.2%) | | | | | | | | |
| | | | | | | | | |
| Money Market Fund (3.2%) | | | | | | | | |
| Dreyfus Treasury Securities Cash Management – | | | | | | | | |
| Institutional Class 0.75% (a) | | | | | | | | |
| (Cost $957,880) | | | 957,880 | | | $ | 957,880 | |
| | | | | | | | | |
| Total Investments (99.9%) | | | | | | | | |
| (Cost $27,371,142) | | | | | | | 29,963,311 | |
| Other Assets in Excess of Liabilities (0.1%) | | | | | | | 44,940 | |
| Net Assets (100.0%) | | | | | | $ | 30,008,251 | |
| * | Non-income producing security. |
| (a) | Rate shown is the seven day yield as of June 30, 2017. |
| † | Security position is either entirely or partially held in a segregated account as collateral for securities sold short, aggregating a total market value of $186,800. |
| | |
| | The Global Industry Classification Standard (GICS®) was developed by and/or is the exclusive property of MSCI, Inc. and Standard & Poor’s Financial Services LLC (“S&P”). GICS is a service mark of MSCI and S&P and has been licensed for use by U.S. Bancorp Fund Services, LLC. |
See accompanying notes to financial statements.
Semi-Annual Report 2017
(This Page Intentionally Left Blank.)
Needham Funds
Statements of Assets and Liabilities
June 30, 2017 (Unaudited)
| | | | | | Needham | | | Needham | |
| | | Needham | | | Aggressive | | | Small Cap | |
| | | Growth Fund | | | Growth Fund | | | Growth Fund | |
| Assets | | | | | | | | | |
| Investments, at Value | | | | | | | | | |
| Unaffiliated securities (Cost $52,508,215, | | | | | | | | | |
| $30,398,217, $27,371,142) | | $ | 115,558,317 | | | $ | 60,325,537 | | | $ | 29,963,311 | |
| Affiliated securities (Cost $—, $2,135,331, $—) | | | — | | | | 3,156,500 | | | | — | |
| Cash | | | — | | | | — | | | | 24,800 | |
| Receivables: | | | | | | | | | | | | |
| Deposit with Broker for Securities Sold Short | | | 4,788,808 | | | | 3,862,255 | | | | — | |
| Dividends and Interest | | | 48,730 | | | | 2,467 | | | | 104,742 | |
| Fund Shares Sold | | | 55,421 | | | | 34,949 | | | | 891 | |
| Investment Securities Sold | | | 482,983 | | | | 355,965 | | | | 104,381 | |
| Prepaid Expenses | | | 46,877 | | | | 27,140 | | | | 32,690 | |
| Total Assets | | | 120,981,136 | | | | 67,764,813 | | | | 30,230,815 | |
| | | | | | | | | | | | | |
| Liabilities | | | | | | | | | | | | |
| Securities Sold Short, at Value | | | | | | | | | | | | |
| (Proceeds $4,060,084, $3,249,693, $—) | | | 4,827,225 | | | | 3,909,508 | | | | — | |
| Payables: | | | | | | | | | | | | |
| Investment Securities Purchased | | | 133,290 | | | | 132,002 | | | | 153,535 | |
| Fund Shares Redeemed | | | 19,157 | | | | 301,144 | | | | 300 | |
| Due to Adviser | | | 104,054 | | | | 58,641 | | | | 25,270 | |
| Distribution Fees | | | 17,166 | | | | 10,224 | | | | 4,786 | |
| Administration and Accounting Fees | | | 32,845 | | | | 17,447 | | | | 12,951 | |
| Transfer Agent Fees | | | 6,773 | | | | 4,184 | | | | 9,335 | |
| Accrued Expenses and Other Liabilities | | | 55,806 | | | | 43,342 | | | | 16,387 | |
| Total Liabilities | | | 5,196,316 | | | | 4,476,492 | | | | 222,564 | |
| Total Net Assets | | $ | 115,784,820 | | | $ | 63,288,321 | | | $ | 30,008,251 | |
See accompanying notes to financial statements.
Semi-Annual Report 2017
Statements of Assets and Liabilities (Continued)
June 30, 2017 (Unaudited)
| | | | | | Needham | | | Needham | |
| | | Needham | | | Aggressive | | | Small Cap | |
| | | Growth Fund | | | Growth Fund | | | Growth Fund | |
| Retail Class Shares | | | | | | | | | |
| Net Assets | | $ | 79,136,738 | | | $ | 46,544,241 | | | $ | 21,594,316 | |
| Shares Issued and Outstanding | | | | | | | | | | | | |
| $0.001 Par Value (Authorized | | | | | | | | | | | | |
| 800,000,000,100,000,000 and | | | | | | | | | | | | |
| 100,000,000 respectively) | | | 1,752,725 | | | | 2,064,472 | | | | 1,323,393 | |
| Net Asset Value, Offering and | | | | | | | | | | | | |
| Redemption Price Per Share (a) | | $ | 45.15 | | | $ | 22.55 | | | $ | 16.32 | |
| | | | | | | | | | | | | |
| Institutional Class Shares | | | | | | | | | | | | |
| Net Assets | | $ | 36,648,082 | | | $ | 16,744,080 | | | $ | 8,413,935 | |
| Shares Issued and Outstanding | | | | | | | | | | | | |
| $0.001 Par Value (Authorized | | | | | | | | | | | | |
| 800,000,000,100,000,000 and | | | | | | | | | | | | |
| 100,000,000 respectively) | | | 809,700 | | | | 740,387 | | | | 514,399 | |
| Net Asset Value, Offering and | | | | | | | | | | | | |
| Redemption Price Per Share (a) | | $ | 45.26 | | | $ | 22.62 | | | $ | 16.36 | |
| | | | | | | | | | | | | |
| Components of Net Assets | | | | | | | | | | | | |
| Paid-in Capital | | $ | 41,701,738 | | | $ | 33,196,154 | | | $ | 23,653,908 | |
| Accumulated Net Investment Loss | | | (798,143 | ) | | | (518,714 | ) | | | (133,099 | ) |
| Accumulated Net Realized Gain from | | | | | | | | | | | | |
| Investments, Securities Sold Short, | | | | | | | | | | | | |
| Foreign Currency Transactions and Currency | | | 12,598,264 | | | | 322,207 | | | | 3,895,273 | |
| Net Unrealized Appreciation on | | | | | | | | | | | | |
| Investment Securities and | | | | | | | | | | | | |
| Securities Sold Short | | | 62,282,961 | | | | 30,288,674 | | | | 2,592,169 | |
| Total Net Assets | | $ | 115,784,820 | | | $ | 63,288,321 | | | $ | 30,008,251 | |
(a) | Subject to certain exceptions, a 2% redemption fee is imposed upon shares redeemed within 60 days of their purchase. See Note 2 of the notes to financial statements. |
See accompanying notes to financial statements.
Needham Funds
Statements of Operations
For the six months ended June 30, 2017 (Unaudited)
| | | | | | Needham | | | Needham | |
| | | Needham | | | Aggressive | | | Small Cap | |
| | | Growth Fund | | | Growth Fund | | | Growth Fund | |
| Investment Income | | | | | | | | | |
| Dividend income from unaffiliated securities (net of | | | | | | | | | |
| foreign withholding tax of $454, $0, $825) | | $ | 364,663 | | | $ | 156,207 | | | $ | 164,686 | |
| Interest | | | 3,518 | | | | 3,645 | | | | 12,526 | |
| Total Investment Income | | | 368,181 | | | | 159,852 | | | | 177,212 | |
| | | | | | | | | | | | | |
| Expenses | | | | | | | | | | | | |
| Investment Advisory Fees | | | 736,753 | | | | 386,042 | | | | 207,838 | |
| Distribution Fees | | | 112,035 | | | | 63,124 | | | | 35,525 | |
| Administration and Accounting Fees | | | 67,489 | | | | 37,819 | | | | 29,739 | |
| Audit Fees | | | 18,650 | | | | 12,045 | | | | 11,245 | |
| Chief Compliance Officer Fees | | | 8,416 | | | | 5,949 | | | | 3,954 | |
| Custodian Fees | | | 6,155 | | | | 4,837 | | | | 5,183 | |
| Directors’ Fees | | | 9,909 | | | | 4,814 | | | | 2,840 | |
Dividend Expense(1) | | | 1,891 | | | | — | | | | — | |
| Filing Fees | | | 19,901 | | | | 18,527 | | | | 17,823 | |
Interest Expense(1) | | | 106,403 | | | | 108,239 | | | | — | |
| Legal Fees | | | 24,247 | | | | 16,191 | | | | 9,635 | |
| Printing Fees | | | 4,064 | | | | 3,398 | | | | 2,599 | |
| Transfer Agent Fees | | | 29,968 | | | | 25,941 | | | | 19,884 | |
| Other Expenses | | | 38,114 | | | | 14,738 | | | | 1,398 | |
| Total Expenses | | | 1,183,995 | | | | 701,664 | | | | 347,663 | |
| Fees Waived by Investment Adviser | | | (35,868 | ) | | | (23,098 | ) | | | (37,352 | ) |
| Net Expenses | | | 1,148,127 | | | | 678,566 | | | | 310,311 | |
| Net Investment Loss | | | (779,946 | ) | | | (518,714 | ) | | | (133,099 | ) |
| | | | | | | | | | | | | |
| Net Realized / Unrealized Gain (Loss) | | | | | | | | | | | | |
| from Affiliated and Unaffiliated Securities Sold Short, | | | | | | | | | | | | |
| Foreign Currency Transactions and Currency | | | | | | | | | | | | |
| Net Realized Gain from Unaffiliated Securities | | | 7,956,156 | | | | 484,141 | | | | 3,718,837 | |
| Net Realized Gain (Loss) from Securities Sold Short | | | (72,100 | ) | | | (124,906 | ) | | | 19,407 | |
| Net Realized Loss from Foreign | | | | | | | | | | | | |
| Currency Transactions and Currency | | | (56 | ) | | | (26 | ) | | | (39 | ) |
| Change in Unrealized Appreciation (Depreciation) | | | | | | | | | | | | |
| on Unaffiliated Securities and Securities Sold Short | | | (2,352,107 | ) | | | 1,476,510 | | | | (1,510,102 | ) |
| Change in Unrealized Depreciation | | | | | | | | | | | | |
| on Affiliated Securities | | | — | | | | (548,231 | ) | | | — | |
| Net Realized / Unrealized Gain from Affiliated and | | | | | | | | | | | | |
| Unaffiliated Securities Sold Short, Foreign | | | | | | | | | | | | |
| Currency Transactions and Currency | | | 5,531,893 | | | | 1,287,488 | | | | 2,228,103 | |
| Change in Net Assets Resulting from Operations | | $ | 4,751,947 | | | $ | 768,774 | | | $ | 2,095,004 | |
(1) | Expense related to securities sold short. |
See accompanying notes to financial statements.
Semi-Annual Report 2017
Needham Growth Fund
Statements of Changes in Net Assets
| | | Six Months Ended | | | | |
| | | June 30, 2017 | | | Year Ended | |
| | | (Unaudited) | | | December 31, 2016 | |
| Change in Net Assets | | | | | | |
| Operations: | | | | | | |
| Net Investment Loss | | $ | (779,946 | ) | | $ | (1,616,638 | ) |
| Net Realized Gain from Investments, Securities Sold Short, | | | | | | | | |
| Foreign Currency Transactions, and Currency | | | 7,884,000 | | | | 8,789,434 | |
| Net Change in Unrealized Appreciation (Depreciation) on Investments, | | | | | | | | |
| Securities Sold Short, Foreign Currency Transactions and Currency | | | (2,352,107 | ) | | | 4,521,650 | |
| Change in Net Assets Resulting from Operations | | | 4,751,947 | | | | 11,694,446 | |
| | | | | | | | | |
| Distributions to Shareholders from: | | | | | | | | |
| Net Investment Income | | | — | | | | — | |
| Capital Gains | | | — | | | | (4,983,292 | ) |
| Total Distributions to Shareholders | | | — | | | | (4,983,292 | ) |
| | | | | | | | | |
| Capital Transactions: | | | | | | | | |
| Retail Class: | | | | | | | | |
| Shares Issued | | | 2,200,964 | | | | 3,874,739 | |
| Shares Issued in Reinvestment of Distribution | | | — | | | | 4,388,025 | |
| Shares Exchanged for Institutional Class shares | | | (34,786,282 | ) | | | — | |
| Shares Redeemed | | | (12,009,167 | ) | | | (22,212,309 | ) |
| Redemption Fees | | | 33 | | | | 611 | |
Institutional Class:(1) | | | | | | | | |
| Shares Issued | | | 6,325,486 | | | | 117,442 | |
| Shares Issued in Reinvestment of Distribution | | | — | | | | — | |
| Shares Issued in Exchange for Retail Class shares | | | 34,786,282 | | | | — | |
| Shares Redeemed | | | (5,518,467 | ) | | | — | |
| Redemption Fees | | | — | | | | — | |
| Total Change in Net Assets from Capital Transactions | | | (9,001,151 | ) | | | (13,831,492 | ) |
| | | | | | | | | |
| Change in Net Assets | | | (4,249,204 | ) | | | (7,120,338 | ) |
| | | | | | | | | |
| Total Net Assets | | | | | | | | |
| Beginning of Period | | | 120,034,024 | | | | 127,154,362 | |
| End of Period | | $ | 115,784,820 | | | $ | 120,034,024 | |
| Accumulated Net Investment Loss | | $ | (798,143 | ) | | $ | (18,197 | ) |
| | | | | | | | | |
| Share Transaction: | | | | | | | | |
| Retail Class: | | | | | | | | |
| Number of Shares Issued | | | 50,144 | | | | 94,336 | |
| Number of Shares Reinvested | | | — | | | | 104,402 | |
| Number of Shares Exchanged for Institutional Class shares | | | (794,070 | ) | | | — | |
| Number of Shares Redeemed | | | (266,174 | ) | | | (540,109 | ) |
Institutional Class:(1) | | | | | | | | |
| Number of Shares Issued | | | 137,780 | | | | 2,706 | |
| Number of Shares Reinvested | | | — | | | | — | |
| Number of Shares Issued in Exchange for Retail Class shares | | | 793,772 | | | | — | |
| Number of Shares Redeemed | | | (124,558 | ) | | | — | |
| Total Change in Shares | | | (203,106 | ) | | | (338,665 | ) |
(1) | The class commenced operations on December 30, 2016. |
See accompanying notes to financial statements.
Needham Funds
Needham Aggressive Growth Fund
Statements of Changes in Net Assets
| | | Six Months Ended | | | | |
| | | June 30, 2017 | | | Year Ended | |
| | | (Unaudited) | | | December 31, 2016 | |
| Change in Net Assets | | | | | | |
| Operations: | | | | | | |
| Net Investment Loss | | $ | (518,714 | ) | | $ | (1,001,075 | ) |
| Net Realized Gain from Affiliated and Unaffiliated Securities, | | | | | | | | |
| Securities Sold Short, Foreign Currency Transactions, and Currency | | | 359,209 | | | | 4,659,615 | |
| Net Change in Unrealized Appreciation (Depreciation) on | | | | | | | | |
| Affiliated and Unaffiliated Securities, Securities Sold Short, | | | | | | | | |
| Foreign Currency Transactions and Currency | | | 928,279 | | | | 6,648,259 | |
| Change in Net Assets Resulting from Operations | | | 768,774 | | | | 10,306,799 | |
| | | | | | | | | |
| Distributions to Shareholders from: | | | | | | | | |
| Net Investment Income | | | — | | | | — | |
| Capital Gains | | | — | | | | (3,518,408 | ) |
| Total Distributions to Shareholders | | | — | | | | (3,518,408 | ) |
| | | | | | | | | |
| Capital Transactions: | | | | | | | | |
| Retail Class: | | | | | | | | |
| Shares Issued | | | 7,354,599 | | | | 5,941,597 | |
| Shares Issued in Reinvestment of Distribution | | | — | | | | 3,460,163 | |
| Shares Exchanged for Institutional Class shares | | | (13,407,442 | ) | | | — | |
| Shares Redeemed | | | (6,735,182 | ) | | | (8,401,668 | ) |
| Redemption Fees | | | 3,801 | | | | 1,432 | |
Institutional Class:(1) | | | | | | | | |
| Shares Issued | | | 3,300,427 | | | | 162,046 | |
| Shares Issued in Reinvestment of Distribution | | | — | | | | — | |
| Shares Issued in Exchange for Retail Class shares | | | 13,407,442 | | | | — | |
| Shares Redeemed | | | (261,854 | ) | | | — | |
| Redemption Fees | | | 152 | | | | — | |
| Total Change in Net Assets from Capital Transactions | | | 3,661,943 | | | | 1,163,570 | |
| | | | | | | | | |
| Change in Net Assets | | | 4,430,717 | | | | 7,951,961 | |
| | | | | | | | | |
| Total Net Assets | | | | | | | | |
| Beginning of Period | | | 58,857,604 | | | | 50,905,643 | |
| End of Period | | $ | 63,288,321 | | | $ | 58,857,604 | |
| Accumulated Net Investment Loss | | $ | (518,714 | ) | | $ | — | |
| | | | | | | | | |
| Share Transaction: | | | | | | | | |
| Retail Class: | | | | | | | | |
| Number of Shares Issued | | | 327,603 | | | | 280,053 | |
| Number of Shares Reinvested | | | — | | | | 166,674 | |
| Number of Shares Exchanged for Institutional Class shares | | | (600,435 | ) | | | — | |
| Number of Shares Redeemed | | | (296,375 | ) | | | (415,853 | ) |
Institutional Class:(1) | | | | | | | | |
| Number of Shares Issued | | | 144,799 | | | | 7,270 | |
| Number of Shares Reinvested | | | — | | | | — | |
| Number of Shares Issued in Exchange for Retail Class shares | | | 599,895 | | | | — | |
| Number of Shares Redeemed | | | (11,577 | ) | | | — | |
| Total Change in Shares | | | 163,910 | | | | 38,144 | |
(1) | The class commenced operations on December 30, 2016. |
See accompanying notes to financial statements.
Semi-Annual Report 2017
Needham Small Cap Growth Fund
Statements of Changes in Net Assets
| | | Six Months Ended | | | | |
| | | June 30, 2017 | | | Year Ended | |
| | | (Unaudited) | | | December 31, 2016 | |
| Change in Net Assets | | | | | | |
| Operations: | | | | | | |
| Net Investment Loss | | $ | (133,099 | ) | | $ | (472,659 | ) |
| Net Realized Gain from Investments, Securities Sold Short, | | | | | | | | |
| Foreign Currency Transactions, and Currency | | | 3,738,205 | | | | 2,846,191 | |
| Net Change in Unrealized Appreciation (Depreciation) on Investments, | | | | | | | | |
| Securities Sold Short, Foreign Currency Transactions and Currency | | | (1,510,102 | ) | | | 4,604,040 | |
| Change in Net Assets Resulting from Operations | | | 2,095,004 | | | | 6,977,572 | |
| | | | | | | | | |
| Distributions to Shareholders from: | | | | | | | | |
| Net Investment Income | | | — | | | | — | |
| Capital Gains | | | — | | | | (1,895,460 | ) |
| Total Distributions to Shareholders | | | — | | | | (1,895,460 | ) |
| | | | | | | | | |
| Capital Transactions: | | | | | | | | |
| Retail Class: | | | | | | | | |
| Shares Issued | | | 2,757,190 | | | | 13,166,893 | |
| Shares Issued in Reinvestment of Distribution | | | — | | | | 1,830,167 | |
| Shares Exchanged for Institutional Class shares | | | (4,176,187 | ) | | | — | |
| Shares Redeemed | | | (14,214,370 | ) | | | (8,043,615 | ) |
| Redemption Fees | | | 12,264 | | | | 8,797 | |
Institutional Class:(1) | | | | | | | | |
| Shares Issued | | | 3,739,418 | | | | 139,788 | |
| Shares Issued in Reinvestment of Distribution | | | — | | | | — | |
| Shares Issued in Exchange for Retail Class shares | | | 4,176,187 | | | | — | |
| Shares Redeemed | | | (38,880 | ) | | | — | |
| Redemption Fees | | | 164 | | | | — | |
| Total Change in Net Assets from Capital Transactions | | | (7,744,214 | ) | | | 7,102,030 | |
| | | | | | | | | |
| Change in Net Assets | | | (5,649,210 | ) | | | 12,184,142 | |
| | | | | | | | | |
| Total Net Assets | | | | | | | | |
| Beginning of Period | | | 35,657,461 | | | | 23,473,319 | |
| End of Period | | $ | 30,008,251 | | | $ | 35,657,461 | |
| Accumulated Net Investment Loss | | $ | (133,099 | ) | | $ | — | |
| | | | | | | | | |
| Share Transaction: | | | | | | | | |
| Retail Class: | | | | | | | | |
| Number of Shares Issued | | | 179,060 | | | | 897,839 | |
| Number of Shares Reinvested | | | — | | | | 127,272 | |
| Number of Shares Exchanged for Institutional Class shares | | | (270,386 | ) | | | — | |
| Number of Shares Redeemed | | | (914,620 | ) | | | (582,239 | ) |
Institutional Class:(1) | | | | | | | | |
| Number of Shares Issued | | | 237,372 | | | | 9,166 | |
| Number of Shares Reinvested | | | — | | | | — | |
| Number of Shares Issued in Exchange for Retail Class shares | | | 270,316 | | | | — | |
| Number of Shares Redeemed | | | (2,455 | ) | | | — | |
| Total Change in Shares | | | (500,713 | ) | | | 452,038 | |
(1) | The class commenced operations on December 30, 2016. |
See accompanying notes to financial statements.
Needham Funds
Needham Growth Fund
Financial Highlights
| | | Retail Class |
| | | Six Months | | | | | | | | | | | | | | | | |
| | | Ended | | | | | | | | | | | | | | | | |
| (For a Share Outstanding | | June 30, 2017 | | | Year Ended December 31, | |
| Throughout each Period) | | (unaudited) | | | 2016 | | | 2015 | | | 2014 | | | 2013 | | | 2012 | |
| Net Asset Value, | | | | | | | | | | | | | | | | | | |
| Beginning of Period | | $ | 43.40 | | | $ | 40.96 | | | $ | 46.00 | | | $ | 45.06 | | | $ | 33.66 | | | $ | 32.78 | |
| Investment Operations | | | | | | | | | | | | | | | | | | | | | | | | |
| Net Investment Income (Loss) | | | (0.32 | ) | | | (0.59 | ) | | | (0.68 | ) | | | (0.58 | ) | | | (0.54 | ) | | | (0.24 | ) |
| Net Realized and Unrealized | | | | | | | | | | | | | | | | | | | | | | | | |
| Gain (Loss) on Investments | | | 2.07 | | | | 4.86 | | | | (1.60 | ) | | | 4.59 | | | | 12.20 | | | | 4.31 | |
| Total from | | | | | | | | | | | | | | | | | | | | | | | | |
| Investment Operations | | | 1.75 | | | | 4.27 | | | | (2.28 | ) | | | 4.01 | | | | 11.66 | | | | 4.07 | |
| | | | | | | | | | | | | | | | | | | | | | | | | |
| Less Distributions | | | | | | | | | | | | | | | | | | | | | | | | |
| Net Realized Gains | | | — | | | | (1.83 | ) | | | (2.76 | ) | | | (3.07 | ) | | | (0.26 | ) | | | (3.19 | ) |
| Total Distributions | | | — | | | | (1.83 | ) | | | (2.76 | ) | | | (3.07 | ) | | | (0.26 | ) | | | (3.19 | ) |
| | | | | | | | | | | | | | | | | | | | | | | | | |
| Capital Contributions | | | | | | | | | | | | | | | | | | | | | | | | |
| Redemption Fees | | | — | (a) | | | — | (a) | | | — | (a) | | | — | (a) | | | — | (a) | | | — | (a) |
| Total Capital Contributions | | | — | (a) | | | — | (a) | | | — | (a) | | | — | (a) | | | — | (a) | | | — | (a) |
| Net Asset Value, End of Period | | $ | 45.15 | | | $ | 43.40 | | | $ | 40.96 | | | $ | 46.00 | | | $ | 45.06 | | | $ | 33.66 | |
| | | | | | | | | | | | | | | | | | | | | | | | | |
| Total Return | | | 4.03 | %(c) | | | 10.57 | % | | | (5.07 | )% | | | 8.98 | % | | | 34.68 | % | | | 12.80 | % |
| Net Assets, | | | | | | | | | | | | | | | | | | | | | | | | |
| End of Period (000’s) | | $ | 79,137 | | | $ | 119,117 | | | $ | 127,154 | | | $ | 147,816 | | | $ | 141,693 | | | $ | 113,561 | |
| Ratios/Supplemental Data | | | | | | | | | | | | | | | | | | | | | | | | |
| Ratio of Net Expenses to | | | | | | | | | | | | | | | | | | | | | | | | |
| Average Net Assets | | | 2.06 | %(b) | | | 2.17 | % | | | 2.05 | % | | | 1.84 | % | | | 1.89 | % | | | 1.94 | % |
| Ratio of Net Expenses to | | | | | | | | | | | | | | | | | | | | | | | | |
| Average Net Assets (before | | | | | | | | | | | | | | | | | | | | | | | | |
| interest and dividend expense) | | | 1.88 | %(b) | | | 1.84 | % | | | 1.82 | % | | | 1.80 | % | | | 1.82 | % | | | 1.82 | % |
| Ratio of Total Expenses to | | | | | | | | | | | | | | | | | | | | | | | | |
| Average Net Assets (before waiver | | | | | | | | | | | | | | | | | | | | | | | | |
| and reimbursement of expenses) | | | 2.06 | %(b) | | | 2.17 | % | | | 2.05 | % | | | 1.84 | % | | | 1.89 | % | | | 1.94 | % |
| Ratio of Net Investment Income | | | | | | | | | | | | | | | | | | | | | | | | |
| (Loss) to Average Net Assets | | | (1.44 | )%(b) | | | (1.36 | )% | | | (1.48 | )% | | | (1.32 | )% | | | (1.30 | )% | | | (0.65 | )% |
| Ratio of Net Investment | | | | | | | | | | | | | | | | | | | | | | | | |
| Loss to Average Net Assets | | | | | | | | | | | | | | | | | | | | | | | | |
| (before waivers and | | | | | | | | | | | | | | | | | | | | | | | | |
| reimbursements of expenses) | | | (1.44 | )%(b) | | | (1.36 | )% | | | (1.48 | )% | | | (1.32 | )% | | | (1.30 | )% | | | (0.65 | )% |
| Portfolio turnover rate | | | 5 | %(c) | | | 12 | % | | | 13 | % | | | 12 | % | | | 12 | % | | | 17 | % |
(a) | Value is less than $0.005 per share. |
(b) | Annualized for periods less than one year. |
(c) | Not annualized for periods less than one year. |
See accompanying notes to financial statements.
Semi-Annual Report 2017
Needham Growth Fund
Financial Highlights
| | | Institutional Class | |
| | | Six Months | | | Period from | |
| | | Ended | | | December 30, 2016 | |
| | | June 30, 2017 | | | through | |
| (For a Share Outstanding Throughout each Period) | | (unaudited) | | | December 31, 2016(a) | |
| Net Asset Value, Beginning of Period | | $ | 43.40 | | | $ | 43.40 | |
| Investment Operations | | | | | | | | |
| Net Investment Loss | | | (0.21 | ) | | | — | |
| Net Realized and Unrealized Gain on Investments | | | 2.07 | | | | — | |
| Total from Investment Operations | | | 1.86 | | | | — | |
| | | | | | | | | |
| Less Distributions | | | | | | | | |
| Net Realized Gains | | | — | | | | — | |
| Total Distributions | | | — | | | | — | |
| | | | | | | | | |
| Capital Contributions | | | | | | | | |
| Redemption Fees | | | — | | | | — | |
| Total Capital Contributions | | | — | | | | — | |
| Net Asset Value, End of Period | | $ | 45.26 | | | $ | 43.40 | |
| | | | | | | | | |
Total Return(c) | | | 4.29 | % | | | 0.00 | % |
| Net Assets, End of Period (000’s) | | $ | 36,648 | | | $ | 117 | |
| Ratios/Supplemental Data | | | | | | | | |
| Ratio of Net Expenses to Average Net Assets | | | 1.59 | %(b) | | | 1.40 | %(b) |
| Ratio of Net Expenses to Average Net Assets | | | | | | | | |
| (before interest and dividend expense) | | | 1.40 | %(b) | | | 1.40 | %(b) |
| Ratio of Total Expenses to Average Net Assets | | | | | | | | |
| (before waiver and reimbursement of expenses) | | | 1.85 | %(b) | | | — | %* |
| Ratio of Net Investment Loss to Average Net Assets | | | (0.96 | )%(b) | | | — | %* |
| Ratio of Net Investment Loss to Average Net Assets | | | | | | | | |
| (before waivers and reimbursements of expenses) | | | (1.22 | )%(b) | | | — | %* |
| Portfolio turnover rate | | | 5 | %(c) | | | 0 | % |
| * | Refer to footnote 2 for further description of non-recurring charges related to the issuance of the share class. |
(a) | The Class commenced operations on December 30, 2016. |
(b) | Annualized for periods less than one year. |
(c) | Not annualized for periods less than one year. |
See accompanying notes to financial statements.
Needham Funds
Needham Aggressive Growth Fund
Financial Highlights
| | | Retail Class | |
| | | Six Months | | | | | | | | | | | | | | | | |
| | | Ended | | | | | | | | | | | | | | | | |
| (For a Share Outstanding | | June 30, 2017 | | | Year Ended December 31, | |
| Throughout each Period) | | (unaudited) | | | 2016 | | | 2015 | | | 2014 | | | 2013 | | | 2012 | |
| Net Asset Value, | | | | | | | | | | | | | | | | | | |
| Beginning of Period | | $ | 22.29 | | | $ | 19.56 | | | $ | 23.55 | | | $ | 22.66 | | | $ | 16.63 | | | $ | 14.52 | |
| Investment Operations | | | | | | | | | | | | | | | | | | | | | | | | |
| Net Investment Loss | | | (0.20 | ) | | | (0.38 | ) | | | (0.39 | ) | | | (0.38 | ) | | | (0.37 | ) | | | (0.29 | ) |
| Net Realized and Unrealized | | | | | | | | | | | | | | | | | | | | | | | | |
| Gain (Loss) on Investments | | | 0.46 | | | | 4.61 | | | | (1.28 | ) | | | 1.98 | | | | 6.40 | | | | 2.41 | |
| Total from | | | | | | | | | | | | | | | | | | | | | | | | |
| Investment Operations | | | 0.26 | | | | 4.23 | | | | (1.67 | ) | | | 1.60 | | | | 6.03 | | | | 2.12 | |
| | | | | | | | | | | | | | | | | | | | | | | | | |
| Less Distributions | | | | | | | | | | | | | | | | | | | | | | | | |
| Net Realized Gains | | | — | | | | (1.50 | ) | | | (2.32 | ) | | | (0.71 | ) | | | — | | | | (0.01 | ) |
| Total Distributions | | | — | | | | (1.50 | ) | | | (2.32 | ) | | | (0.71 | ) | | | — | | | | (0.01 | ) |
| | | | | | | | | | | | | | | | | | | | | | | | | |
| Capital Contributions | | | | | | | | | | | | | | | | | | | | | | | | |
| Redemption Fees | | | — | (a) | | | — | (a) | | | — | (a) | | | — | (a) | | | — | (a) | | | — | (a) |
| Total Capital Contributions | | | — | (a) | | | — | (a) | | | — | (a) | | | — | (a) | | | — | (a) | | | — | (a) |
| Net Asset Value, End of Period | | $ | 22.55 | | | $ | 22.29 | | | $ | 19.56 | | | $ | 23.55 | | | $ | 22.66 | | | $ | 16.63 | |
| | | | | | | | | | | | | | | | | | | | | | | | | |
| Total Return | | | 1.17 | %(c) | | | 22.18 | % | | | (7.05 | )% | | | 7.13 | % | | | 36.26 | % | | | 14.61 | % |
| Net Assets, | | | | | | | | | | | | | | | | | | | | | | | | |
| End of Period (000’s) | | $ | 46,544 | | | $ | 58,696 | | | $ | 50,906 | | | $ | 62,353 | | | $ | 68,470 | | | $ | 66,746 | |
| Ratios/Supplemental Data | | | | | | | | | | | | | | | | | | | | | | | | |
| Ratio of Net Expenses to | | | | | | | | | | | | | | | | | | | | | | | | |
| Average Net Assets | | | 2.29 | %(b) | | | 2.71 | % | | | 2.41 | % | | | 2.09 | % | | | 2.07 | % | | | 2.06 | % |
| Ratio of Net Expenses to | | | | | | | | | | | | | | | | | | | | | | | | |
| Average Net Assets (before | | | | | | | | | | | | | | | | | | | | | | | | |
| interest and dividend expense) | | | 1.95 | %(b) | | | 1.95 | % | | | 1.93 | % | | | 1.91 | % | | | 1.91 | % | | | 1.89 | % |
| Ratio of Total Expenses to | | | | | | | | | | | | | | | | | | | | | | | | |
| Average Net Assets (before | | | | | | | | | | | | | | | | | | | | | | | | |
| recoupment, waiver and | | | | | | | | | | | | | | | | | | | | | | | | |
| reimbursement of expenses) | | | 2.28 | %(b) | | | 2.72 | % | | | 2.42 | % | | | 2.09 | % | | | 2.07 | % | | | 2.06 | % |
| Ratio of Net Investment Loss | | | | | | | | | | | | | | | | | | | | | | | | |
| to Average Net Assets | | | (1.77 | )%(b) | | | (1.99 | )% | | | (1.73 | )% | | | (1.60 | )% | | | (1.74 | )% | | | (1.40 | )% |
| Ratio of Net Investment | | | | | | | | | | | | | | | | | | | | | | | | |
| Loss to Average Net Assets | | | | | | | | | | | | | | | | | | | | | | | | |
| (before waivers and | | | | | | | | | | | | | | | | | | | | | | | | |
| reimbursements of expenses) | | | (1.76 | )%(b) | | | (2.00 | )% | | | (1.74 | )% | | | (1.60 | )% | | | (1.74 | )% | | | (1.40 | )% |
| Portfolio turnover rate | | | 3 | %(c) | | | 14 | % | | | 15 | % | | | 19 | % | | | 20 | % | | | 15 | % |
(a) | Value is less than $0.005 per share. |
(b) | Annualized for periods less than one year. |
(c) | Not annualized for periods less than one year. |
See accompanying notes to financial statements.
Semi-Annual Report 2017
Needham Aggressive Growth Fund
Financial Highlights
| | | Institutional Class | |
| | | Six Months | | | Period from | |
| | | Ended | | | December 30, 2016 | |
| | | June 30, 2017 | | | through | |
| (For a Share Outstanding Throughout each Period) | | (unaudited) | | | December 31, 2016(a) | |
| Net Asset Value, Beginning of Period | | $ | 22.29 | | | $ | 22.29 | |
| Investment Operations | | | | | | | | |
| Net Investment Loss | | | (0.14 | ) | | | — | |
| Net Realized and Unrealized Gain on Investments | | | 0.47 | | | | — | |
| Total from Investment Operations | | | 0.33 | | | | — | |
| | | | | | | | | |
| Less Distributions | | | | | | | | |
| Net Realized Gains | | | — | | | | — | |
| Total Distributions | | | — | | | | — | |
| | | | | | | | | |
| Capital Contributions | | | | | | | | |
| Redemption Fees | | | — | (b) | | | — | |
| Total Capital Contributions | | | — | (b) | | | — | |
| Net Asset Value, End of Period | | $ | 22.62 | | | $ | 22.29 | |
| | | | | | | | | |
Total Return(d) | | | 1.48 | % | | | 0.00 | % |
| Net Assets, End of Period (000’s) | | $ | 16,744 | | | $ | 162 | |
| Ratios/Supplemental Data | | | | | | | | |
| Ratio of Net Expenses to Average Net Assets | | | 1.78 | %(c) | | | 1.40 | %(c) |
| Ratio of Net Expenses to Average Net Assets | | | | | | | | |
| (before interest and dividend expense) | | | 1.40 | %(c) | | | 1.40 | %(c) |
| Ratio of Total Expenses to Average Net Assets | | | | | | | | |
| (before waiver and reimbursement of expenses) | | | 2.25 | %(c) | | | — | % |
| Ratio of Net Investment Loss to Average Net Assets | | | (1.26 | )%(c) | | | — | % |
| Ratio of Net Investment Loss to Average Net Assets | | | | | | | | |
| (before waivers and reimbursements of expenses) | | | (1.73 | )%(c) | | | — | % |
| Portfolio turnover rate | | | 3 | %(d) | | | 0 | %(d) |
| * | Refer to footnote 2 for further description of non-recurring charges related to the issuance of the share class. |
(a) | The Class commenced operations on December 30, 2016. |
(b) | Value is less than $0.005 per share. |
(c) | Annualized for periods less than one year. |
(d) | Not annualized for periods less than one year. |
See accompanying notes to financial statements.
Needham Funds
Needham Small Cap Growth Fund
Financial Highlights
| | | Retail Class | |
| | | Six Months | | | | | | | | | | | | | | | | |
| | | Ended | | | | | | | | | | | | | | | | |
| (For a Share Outstanding | | June 30, 2017 | | | Year Ended December 31, |
| Throughout each Period) | | (unaudited) | | | 2016 | | | 2015 | | | 2014 | | | 2013 | | | 2012 | |
| Net Asset Value, | | | | | | | | | | | | | | | | | | |
| Beginning of Period | | $ | 15.25 | | | $ | 12.44 | | | $ | 14.01 | | | $ | 15.63 | | | $ | 12.22 | | | $ | 11.26 | |
| Investment Operations | | | | | | | | | | | | | | | | | | | | | | | | |
| Net Investment Loss | | | (0.07 | ) | | | (0.20 | ) | | | (0.24 | ) | | | (0.24 | ) | | | (0.31 | ) | | | (0.15 | ) |
| Net Realized and Unrealized | | | | | | | | | | | | | | | | | | | | | | | | |
| Gain (Loss) on Investments | | | 1.14 | | | | 4.03 | | | | (1.02 | ) | | | 0.32 | | | | 3.72 | | | | 1.11 | |
| Total from | | | | | | | | | | | | | | | | | | | | | | | | |
| Investment Operations | | | 1.07 | | | | 3.83 | | | | (1.26 | ) | | | 0.08 | | | | 3.41 | | | | 0.96 | |
| | | | | | | | | | | | | | | | | | | | | | | | | |
| Less Distributions | | | | | | | | | | | | | | | | | | | | | | | | |
| Net Realized Gains | | | — | | | | (1.02 | ) | | | (0.31 | ) | | | (1.70 | ) | | | — | | | | — | |
| Total Distributions | | | — | | | | (1.02 | ) | | | (0.31 | ) | | | (1.70 | ) | | | — | | | | — | |
| | | | | | | | | | | | | | | | | | | | | | | | | |
| Capital Contributions | | | | | | | | | | | | | | | | | | | | | | | | |
| Redemption Fees | | | — | (a) | | | — | (a) | | | — | (a) | | | — | (a) | | | — | (a) | | | — | (a) |
| Total Capital Contributions | | | — | (a) | | | — | (a) | | | — | (a) | | | — | (a) | | | — | (a) | | | — | (a) |
| Net Asset Value, End of Period | | $ | 16.32 | | | $ | 15.25 | | | $ | 12.44 | | | $ | 14.01 | | | $ | 15.63 | | | $ | 12.22 | |
| | | | | | | | | | | | | | | | | | | | | | | | | |
| Total Return | | | 7.02 | %(c) | | | 31.26 | % | | | (8.96 | )% | | | 0.80 | % | | | 27.91 | % | | | 8.53 | % |
| Net Assets, | | | | | | | | | | | | | | | | | | | | | | | | |
| End of Period (000’s) | | $ | 21,594 | | | $ | 35,518 | | | $ | 23,473 | | | $ | 32,116 | | | $ | 43,950 | | | $ | 60,614 | |
| Ratios/Supplemental Data | | | | | | | | | | | | | | | | | | | | | | | | |
| Ratio of Net Expenses to | | | | | | | | | | | | | | | | | | | | | | | | |
| Average Net Assets | | | 1.95 | %(b) | | | 2.09 | % | | | 2.05 | % | | | 2.01 | % | | | 2.06 | % | | | 2.04 | % |
| Ratio of Net Expenses to | | | | | | | | | | | | | | | | | | | | | | | | |
| Average Net Assets (before | | | | | | | | | | | | | | | | | | | | | | | | |
| interest and dividend expense) | | | 1.95 | %(b) | | | 1.95 | % | | | 1.95 | % | | | 1.95 | % | | | 1.96 | % | | | 1.92 | % |
| Ratio of Total Expenses to | | | | | | | | | | | | | | | | | | | | | | | | |
| Average Net Assets (before waiver | | | | | | | | | | | | | | | | | | | | | | | | |
| and reimbursement of expenses) | | | 2.06 | %(b) | | | 2.30 | % | | | 2.25 | % | | | 2.11 | % | | | 2.09 | % | | | 2.04 | % |
| Ratio of Net Investment Loss | | | | | | | | | | | | | | | | | | | | | | | | |
| to Average Net Assets | | | (0.88 | )%(b) | | | (1.83 | )% | | | (1.61 | )% | | | (1.49 | )% | | | (1.80 | )% | | | (1.02 | )% |
| Ratio of Net Investment | | | | | | | | | | | | | | | | | | | | | | | | |
| Loss to Average Net Assets | | | | | | | | | | | | | | | | | | | | | | | | |
| (before waivers and | | | | | | | | | | | | | | | | | | | | | | | | |
| reimbursements of expenses) | | | (1.00 | )%(b) | | | (2.04 | )% | | | (1.81 | )% | | | (1.59 | )% | | | (1.83 | )% | | | (1.02 | )% |
| Portfolio turnover rate | | | 50 | %(c) | | | 99 | % | | | 64 | % | | | 69 | % | | | 58 | % | | | 72 | % |
(a) | Value is less than $0.005 per share. |
(b) | Annualized for periods less than one year. |
(c) | Not annualized for periods less than one year. |
See accompanying notes to financial statements.
Semi-Annual Report 2017
Needham Small Cap Growth Fund
Financial Highlights
| | | Institutional Class | |
| | | Six Months | | | Period from | |
| | | Ended | | | December 30, 2016 | |
| | | June 30, 2017 | | | through | |
| (For a Share Outstanding Throughout each Period) | | (unaudited) | | | December 31, 2016(a) | |
| Net Asset Value, Beginning of Period | | $ | 15.25 | | | $ | 15.25 | |
| Investment Operations | | | | | | | | |
| Net Investment Loss | | | (0.02 | ) | | | — | |
| Net Realized and Unrealized Gain on Investments | | | 1.13 | | | | — | |
| Total from Investment Operations | | | 1.11 | | | | — | |
| | | | | | | | | |
| Less Distributions | | | | | | | | |
| Net Realized Gains | | | — | | | | — | |
| Total Distributions | | | — | | | | — | |
| | | | | | | | | |
| Capital Contributions | | | | | | | | |
| Redemption Fees | | | — | (b) | | | — | |
| Total Capital Contributions | | | — | (b) | | | — | |
| Net Asset Value, End of Period | | $ | 16.36 | | | $ | 15.25 | |
| | | | | | | | | |
Total Return(d) | | | 7.28 | % | | | 0.00 | % |
| Net Assets, End of Period (000’s) | | $ | 8,414 | | | $ | 140 | |
| Ratios/Supplemental Data | | | | | | | | |
| Ratio of Net Expenses to Average Net Assets | | | 1.40 | %(c) | | | 1.40 | %(c) |
| Ratio of Net Expenses to Average Net Assets | | | | | | | | |
| (before interest and dividend expense) | | | 1.40 | %(c) | | | 1.40 | %(c) |
| Ratio of Total Expenses to Average Net Assets | | | | | | | | |
| (before waiver and reimbursement of expenses) | | | 2.27 | %(c) | | | — | %* |
| Ratio of Net Investment Income (Loss) to Average Net Assets | | | (0.33 | )%(c) | | | — | %* |
| Ratio of Net Investment Income (Loss) to Average Net Assets | | | | | | | | |
| (before waivers and reimbursements of expenses) | | | (1.20 | )%(c) | | | — | %* |
| Portfolio turnover rate | | | 50 | %(d) | | | 0 | %(d) |
| * | Refer to footnote 2 for further description of non-recurring charges related to the issuance of the share class. |
(a) | The Class commenced operations on December 30, 2016. |
(b) | Value is less than $0.005 per share. |
(c) | Annualized for periods less than one year. |
(d) | Not annualized for periods less than one year. |
See accompanying notes to financial statements.
Needham Funds
Notes to Financial Statements (Unaudited)
Needham Growth Fund (“NGF”), Needham Aggressive Growth Fund (“NAGF”) and Needham Small Cap Growth Fund (“NSCGF”) (each, a “Portfolio” and collectively, the “Portfolios”), are portfolios of The Needham Funds, Inc. (the “Company”), which is registered under the Investment Company Act of 1940, as amended (the “1940 Act”), as a diversified, open-end management investment company. The Company was organized as a Maryland corporation on October 12, 1995. NGF, NAGF, and NSCGF currently offer two classes, the Retail Class and the Institutional Class. The Institutional Class commenced operations on December 30, 2016.
| 2. | Class Specific Expenses |
Class level expenses are allocated daily to each class of shares based upon the ratio of net assets represented by each class as a percentage of the net assets of the Portfolio. Expenses deemed directly attributable to a class of shares are recorded by the specific class. Most Portfolio expenses are allocated by class based on relative net assets. Distribution Fees incurred in connection with the Company’s Amended and Restated Plan of Distribution Pursuant to Rule 12b-1 are expensed at 0.25% of average daily net assets of the Retail class shares, and the specific amounts are detailed in Note 5.
Certain of the Ratios and Supplemental Data presented in the Financial Highlights of the Institutional Class as of December 31, 2016 include non-recurring charges related to the issuance of the class and are not meaningful. Total such non-recurring charges included in the Statements of Operations for the year ended December 31, 2016 (before application of the Expense Limitation Agreement) as a percentage of Institutional Class Net Assets as of December 31, 2016 for NGF, NAGF and NSCGF were 21.03%, 6.39% and 3.77%, respectively. The Expense Limitation Agreement is more fully described in Note 4.
| 3. | Significant Accounting Policies |
The following is a summary of significant accounting policies followed by the Company in the preparation of its financial statements. These policies are in conformity with accounting principles generally accepted in the United States of America (“GAAP”).
Security Valuation: Portfolio securities for which market quotations are readily available are stated at the last sale price reported by the principal exchange for the security as of the exchange’s close of business. Securities for which no sale has taken place during the day and securities which are not listed on an exchange are valued at the mean of the highest closing bid and lowest asked prices. Exchange traded options are valued at the last reported sale price on any exchange on which the option is principally traded. If no sales are reported on a particular day, the options will be valued at the mean between the highest closing bid and lowest asked prices across the exchanges where the option is traded. Non-exchange traded options will also be valued at the mean between the last bid and asked quotations. For options where market quotations are not readily available, value will be determined in accordance with the fair value procedures described below. All other
Semi-Annual Report 2017
Notes to Financial Statements (Unaudited) (Continued)
securities and assets for which (a) market quotations are not readily available, such as in the case of a market or technical disruption that prevents the normal trading of a security held by a Portfolio, (b) market quotations are believed to be unrepresentative of fair market value, such as in the case of a thinly traded security, or (c) valuation is normally made at the last sale price on a foreign exchange and a significant event occurs after the close of that exchange but before the New York Stock Exchange closes, are valued at their fair value as determined in good faith by the Board of Directors (the “Board”) in accordance with Fair Value Procedures established by the Board. The Company’s Fair Value Procedures are implemented and monitored by a Fair Value Committee (the “Committee”) designated by the Board. When a security is valued in accordance with the Fair Value Procedures, the Committee determines a value after taking into consideration any relevant information that is reasonably available to the Committee. Some of the more common reasons that may necessitate that a security be valued pursuant to these Fair Value Procedures include, but are not limited to: the security’s trading has been halted or suspended; the security has been de-listed from a national exchange; the security’s primary trading market is temporarily closed at a time when under normal conditions it would be open; or the security’s primary pricing source is not able or willing to provide a price. The assets of each Portfolio may also be valued on the basis of valuations provided by a pricing service approved by, or on behalf of, the Board.
Portfolio securities listed or traded on securities exchanges, including American Depositary Receipts (“ADRs”), are valued at the closing price on the exchange or system where the security is principally traded or at the NASDAQ Official Closing Price. If there have been no sales for that day on the exchange or system, a security is valued at the mean of the highest closing bid and lowest asked prices on the exchange or system where the security is principally traded.
The Portfolios did not value any securities in accordance with the Fair Value Procedures as of June 30, 2017.
Investment Transactions: Changes in holdings of portfolio securities for the Portfolios shall be reflected no later than in the first calculation on the first business day following the trade date for purposes of calculating each Portfolio’s daily net asset value per share. However, for financial reporting purposes, portfolio security transactions are reported on the trade date of the last business day of the reporting period. The cost (proceeds) of investments sold (bought to cover) is determined on a specific identification basis for the purpose of determining gains or losses on sales and buys to cover short positions. Dividend income, distributions to shareholders and dividend expense from securities sold short are recorded on the ex-dividend date. Interest income and interest expense from securities sold short is recorded on an accrual basis.
Foreign Currency: Foreign currency amounts are translated into U.S. dollars as follows: (i) assets and liabilities at the rate of exchange at the end of the respective period; and (ii) purchases and sales of securities and income and expenses at the rate of exchange
Needham Funds
Notes to Financial Statements (Unaudited) (Continued)
prevailing on the dates of such transactions. The portion of realized gains arising from changes in the exchange rates are included with the net realized and unrealized gain or loss on investments. Principal risks associated with such transactions include the movement in value of the foreign currency relative to the U.S. dollar and the ability of the counterparty to perform.
The Portfolios may also invest in forward currency contracts. Fluctuations in the value of such forward currency transactions are recorded daily as unrealized gain or loss; realized gain or loss includes net gain or loss on transactions that have terminated by settlement. These instruments involve securities and currency market risk, credit risk, or both kinds of risks, in excess of the amount recognized in the statements of assets and liabilities. Risks also arise from the possible inability of counterparties to meet the terms of their contracts. The Portfolios did not enter into forward currency contracts during the period ended June 30, 2017.
Allocation of Expenses: Expenses directly attributable to a Portfolio are charged directly to that Portfolio, while expenses which are attributable to more than one Portfolio are allocated among the respective Portfolios based upon relative net assets or some other reasonable method.
Use of Estimates: The preparation of financial statements in accordance with GAAP requires management to make estimates and assumptions that affect the reported amounts and disclosures in the financial statements. Actual results could differ from those estimates and those differences could be material.
Distributions to Shareholders: Dividends from net investment income, if any, are declared and paid annually for the Portfolios. Distributable net realized gains, if any, are declared and distributed at least annually.
Redemption Fees: As of June 30, 2017, the Portfolios reserve the right to assess a redemption fee for shares held 60 days or less. The shareholder will be charged a fee equal to 2.00% of the value of the shares redeemed. The redemption fee is intended to offset excess brokerage commissions and other costs associated with fluctuations in asset levels and cash flows caused by frequent trading by shareholders. The applicability of the redemption fee will be calculated using a first-in first-out method, which means the oldest shares, will be redeemed first, followed by the redemption of more recently acquired shares. For the six months ended June 30, 2017, NGF, NAGF and NSCGF had contributions to capital due to redemption fees in the amounts of $33, $3,953 and $12,428, respectively. See Note 13 (Subsequent Events).
Federal Income Taxes: It is the policy of each Portfolio to continue to qualify as a regulated investment company, as defined in the Internal Revenue Code, by complying with the provisions available to certain investment companies and to make distributions of net investment income and net realized capital gains sufficient to relieve it from all, or substantially all, federal income taxes. Accordingly, no provision for income taxes has been made in the Portfolios’ financial statements.
As of June 30, 2017, the Portfolios did not have any tax positions that did not meet the “more-likely-than-not” threshold of being sustained by the applicable tax authority. Open
Semi-Annual Report 2017
Notes to Financial Statements (Unaudited) (Continued)
tax years are those that are open for exam by Federal and state taxing authorities. As of June 30, 2017, open Federal tax years include the tax years ended December 31, 2013 through December 30, 2016, open New York tax years include the tax years ended December 31, 2013 through December 31, 2016. The Portfolios have no tax examinations in progress.
Fair Value Measurements: Valuation inputs used to determine the value of the Portfolios’ investments are summarized in the three broad levels listed below:
| | Level 1 — | quoted prices in active markets for identical assets. |
| | | |
| | Level 2 — | other significant inputs (including quoted prices of similar securities, interest rates, prepayment speeds, credit risk, etc.). |
| | | |
| | Level 3 — | significant unobservable inputs (which may include the Portfolios’ own assumptions in determining the fair value of investments). |
The inputs or methodology used to value securities are not necessarily an indication of the risk associated with investing in those securities.
Portfolio securities listed or traded on securities exchanges, including ADRs, are valued at the closing price on the exchange or system where the security is principally traded or at the NASDAQ Official Closing Price. If there have been no sales for that day on the exchange or system, a security is valued at the mean of the highest closing bid and lowest asked prices on the exchange or system where the security is principally traded. These valuations are typically categorized as Level 1 in the fair value hierarchy.
In accordance with procedures adopted by the Board, fair value pricing may be used if events materially affecting the value of foreign securities occur between the times the exchange on which they are traded closes and the time the Portfolios’ net asset values are calculated. These valuations are categorized as Level 2 in the fair value hierarchy. As of June 30, 2017, the Portfolios did not hold any Level 2 or Level 3 securities.
The following is a summary categorization, as of June 30, 2017, of each Portfolio’s investments based on the level of inputs utilized in determining the value of such investments:
| | | LEVEL 1 – Quoted Prices(1)(3) | |
| | | NGF | | | NAGF | | | NSCGF | |
| Assets | | | | | | | | | |
Common Stocks(2) | | $ | 115,114,620 | | | $ | 63,236,137 | | | $ | 27,752,431 | |
| Closed-End Funds | | | — | | | | — | | | | 1,253,000 | |
| Short-Term Investments | | | 443,697 | | | | 245,900 | | | | 957,880 | |
| Liabilities | | | | | | | | | | | | |
Securities Sold Short(2) | | | (4,827,225 | ) | | | (3,909,508 | ) | | | — | |
| Total | | $ | 110,731,092 | | | $ | 59,572,529 | | | $ | 29,963,311 | |
(1) | As of June 30, 2017, the Portfolios did not hold Level 2 or Level 3 investments. |
(2) | Please refer to the Schedule of Investments and Schedule of Securities Sold Short to view segregation by industry. |
(3) | There were no transfers into or out of Levels 1, 2 or 3 during the period. |
Needham Funds
Notes to Financial Statements (Unaudited) (Continued)
| 4. | Investment Advisory and Administrative Services |
The Company has engaged Needham Investment Management L.L.C. (the “Adviser”) to manage its investments pursuant to an Investment Advisory Agreement. The Company pays the Adviser a fee at the annual rate of 1.25% of the average daily net assets of each Portfolio.
The Adviser has entered into agreements with the Company (the “Expense Limitation Agreements”) whereby the Adviser has contractually agreed to waive its management fee for, and to reimburse expenses of, NGF, NAGF and NSCGF in an amount that limits annual operating expenses to not more than 1.40% and 1.95% of the average daily net assets of the Fund’s Institutional Class and Retail Class, respectively (excluding taxes, interest, brokerage, dividends on short positions, acquired fund fees and expenses and extraordinary items, and excluding shareholder redemption fees but including the management fee stated in the Investment Advisory Agreement). The Expense Limitation Agreements are effective for the period from May 1, 2017 through April 30, 2018. The Expense Limitation Agreements shall continue in effect from year to year thereafter only upon mutual agreement of the Company and the Adviser.
Any reimbursements or fee waivers made by the Adviser in respect of a Portfolio are subject to recoupment by the Adviser, to the extent that the Portfolio is able to make the repayment within the expense limitation established in the Expense Limitation Agreements. Under the Expense Limitation Agreements, such recoupments must be made within three years following the fiscal year in which the Adviser reduced its compensation and/or assumed expenses for the applicable Portfolio. The Adviser recouped $3,514 in fees previously waived or reimbursed in NAGF (Retail Class) under the Expense Limitation Agreements during the six months ended June 30, 2017. The table below indicates the amount of fees that the Adviser has the potential to recoup from the Portfolios:
| | | Recovery Expiring on | |
| | | 4/30/2021 | | | 4/30/2020 | | | 4/30/2019 | | | 4/30/2018 | |
| NGF (Retail Class) | | $ | — | | | $ | — | | | $ | — | | | $ | — | |
| NGF (Institutional Class) | | | 22,773 | | | | 13,094 | | | | — | | | | — | |
| NAGF (Retail Class) | | | 2,440 | | | | — | | | | 5,220 | | | | — | |
| NAGF (Institutional Class) | | | 8,782 | | | | 17,829 | | | | — | | | | — | |
| NSCGF (Retail Class) | | | 3,697 | | | | 48,101 | | | | 60,837 | | | | 37,654 | |
| NSCGF (Institutional Class) | | | 8,342 | | | | 12,657 | | | | — | | | | — | |
The Company and U.S. Bancorp Fund Services, LLC (the “Administrator”) are parties to a Fund Administration Servicing Agreement. The Administrator provides administrative and fund accounting services pursuant to this agreement and, in consideration of these services, receives a fee computed daily and paid monthly at an annual rate based on a percentage of the value of each Portfolio’s assets. The Administrator is also compensated for any out of pocket expenses that are reasonably incurred in carrying out its duties under the Administration Agreement. The Administrator also provides transfer agent services pursuant to a Transfer Agent Servicing Agreement for additional fees.
Semi-Annual Report 2017
Notes to Financial Statements (Unaudited) (Continued)
Certain officers of the Company are also officers of the Adviser and/or Needham & Company, LLC (the “Distributor”). Such officers receive no fees from the Company for serving as officers of the Company. Each of the two Directors who is not an “interested person” (as defined in the 1940 Act) of the Company (each, an “Independent Director”) receives a quarterly retainer of $3,000 and a per-meeting fee of $500. Each Independent Director is also a member of the Audit Committee of the Company’s Board of Directors and receives a fee of $500 per meeting attended. The Adviser provides an employee to serve as Chief Compliance Officer for the Company and to provide certain related services. An affiliate of the Adviser, Needham & Company, LLC, pays the Chief Compliance Officer’s compensation and the Company reimburses this affiliate for the Company’s allocated portion of the expense.
The Company has adopted an Amended and Restated Plan of Distribution pursuant to Rule 12b-1 under the 1940 Act. Under the Plan, each Portfolio may pay compensation to the Distributor or any other distributor or financial institution with which the Company has an agreement with respect to the Retail Class of each Portfolio, with the amount of such compensation not to exceed an annual rate of 0.25% of each Portfolio’s daily average net assets. For the six months ended June 30, 2017, NGF, NAGF and NSCGF paid 12b-1 fees to the Distributor in the amount of $112,035, $63,124 and $35,525, respectively.
During the six months ended June 30, 2017, NGF, NAGF and NSCGF incurred and paid brokerage commissions to the Distributor in the amount of $8,289, $7,475, and $15,101, respectively.
Each Portfolio may borrow from banks up to 25% of its total assets and may pledge its assets in connection with these borrowings, provided that no additional investments shall be made while borrowings exceed 5% of total assets.
The Portfolios did not engage in any temporary borrowings during the six months ended June 30, 2017.
| 7. | Short Sale Transactions |
During the six months ended June 30, 2017, each Portfolio sold securities short. Upon selling a security short, the Portfolios record an asset for the settlement amount and a corresponding liability, which is marked-to-market to reflect current value. Certain securities owned by each respective Portfolio are segregated as collateral while the short sales are outstanding. At June 30, 2017, the market value of securities separately segregated to cover short positions was $4,676,725, $4,956,560, and $186,800 for NGF, NAGF and NSCGF, respectively.
Needham Funds
Notes to Financial Statements (Unaudited) (Continued)
Additionally, the Portfolios had receivables for Deposit with Broker for Securities Sold Short of $4,788,808 and $3,862,255 pledged as collateral with a broker in connection with open short positions for NGF and NAGF respectively. Securities sold short at June 30, 2017 and their related market values and proceeds are set forth in the preceding Schedule of Securities Sold Short for NGF and NAGF.
| 8. | Investment Transactions |
The following summarizes the aggregate amount of the cost of purchases and proceeds from sales of investment securities and securities sold short, excluding short-term securities, during the six months ended June 30, 2017:
| | | Purchases | | | Sales | |
| NGF | | $ | 5,594,498 | | | $ | 14,323,758 | |
| NAGF | | | 7,502,966 | | | | 1,550,497 | |
| NSCGF | | | 14,115,356 | | | | 13,419,327 | |
There were no purchases or sales of U.S. government securities during the six months ended June 30, 2017.
| 9. | Financial Instruments With Off-Balance Sheet Risk |
In the normal course of their business, the Portfolios may engage in transactions with off-balance sheet risk, including securities sold short, written options, futures, and forward currency contracts. Transactions in certain financial instruments represent future commitments to purchase or sell other financial instruments at specific terms at specified future dates. Each of these financial instruments contains varying degrees of off-balance sheet risk whereby changes in the market values of the securities underlying the financial instruments may be in excess of the amounts recognized in the financial statements.
Securities sold short represent obligations of the Portfolios to make future delivery of specific securities and, correspondingly, create an obligation to purchase the securities at market prices prevailing at a later delivery date (or to deliver the securities if already owned by the Portfolios). As a result, short sales create the risk that the Portfolios’ ultimate obligation to satisfy the delivery requirements may exceed the amount of the proceeds initially received on the liability recorded in the financial statements.
Under the Company’s organizational documents, its Directors and Officers are indemnified against certain liabilities arising out of the performance of their duties to the Company. In addition, in the ordinary course of business, the Company enters into contracts that contain a variety of indemnifications. The Company’s maximum exposure under these arrangements is unknown. However, the Company has not had prior claims or losses pursuant to these contracts and expects the risk of loss to be remote.
Semi-Annual Report 2017
Notes to Financial Statements (Unaudited) (Continued)
| 11. | Transactions with Affiliates |
NAGF owned 5% or more of the voting securities of the following company during the six months ended June 30, 2017. As a result, this company is deemed to be an affiliate of NAGF as defined by the Investment Company Act of 1940. Transactions during the period in this affiliated company were as follows:
| | | Share | | | | | | | | | Share | | | | | | | | | | |
| | | Balance | | | | | | | | | Balance | | | Realized | | | | | | Value | |
| | | December 31, | | | | | | | | | June 30, | | | Gains | | | Dividend | | | June 30, | |
| Security Name | | 2016 | | | Purchases | | | Sales | | | 2017 | | | (Losses) | | | Income | | | 2017 | |
| GSE Systems, Inc. | | | 960,000 | | | | 110,000 | | | | — | | | | 1,070,000 | | | | — | | | | — | | | $ | 3,156,500 | |
No provision for federal income taxes is required since the Company intends to continue to qualify as a regulated investment company under Subchapter M of the Internal Revenue Code and distribute substantially all of its taxable income and capital gains to shareholders. Because income tax regulations differ from GAAP, the timing and character of income and capital gain distributions determined in accordance with tax regulations can differ from income and capital gains recognized for financial reporting purposes. Accordingly, the character of distributions and the composition of net assets for tax purposes can differ from those reflected in the financial statements. These book/tax differences may be temporary or permanent in nature. Temporary differences are generally due to differing book and tax treatment for the timing of the recognition of gains and losses on securities, including post-October losses (as described below). Permanent differences are generally due to differing treatment of net investment losses. To the extent these differences are permanent, they are charged or credited to paid-in capital, accumulated net realized gain (loss), or accumulated net investment income (loss), as appropriate, in the period in which the differences arise. These reclassifications have no effect on net assets or net asset value per share of each Portfolio.
As of December 30, 2016, the cost, gross unrealized appreciation, gross unrealized depreciation, and the net unrealized appreciation (depreciation) on securities, including proceeds from securities sold short for federal income tax purposes, were as follows:
| | | | | | | | | | | | Net | |
| | | | | | Gross | | | Gross | | | Unrealized | |
| | | | | | Unrealized | | | Unrealized | | | Appreciation | |
| | | Cost | | | Appreciation | | | Depreciation | | | (Depreciation) | |
| NGF | | $ | 55,845,916 | | | $ | 69,523,915 | | | $ | (3,765,613 | ) | | $ | 65,758,302 | |
| NAGF | | | 28,460,879 | | | | 33,053,974 | | | | (2,707,627 | ) | | | 30,346,347 | |
| NSCGF | | | 33,148,629 | | | | 5,199,641 | | | | (1,114,121 | ) | | | 4,085,520 | |
The difference between the tax cost of investments and the cost of investments for GAAP purposes is primarily due to the tax treatment for wash sale losses.
Needham Funds
Notes to Financial Statements (Unaudited) (Continued)
As of December 31, 2016, the components of distributable earnings (loss) on a tax basis were as follows:
| | | NGF | | | NAGF | | | NSCGF | |
| Undistributed ordinary income | | $ | 30,844 | | | $ | — | | | $ | 67,439 | |
| Undistributed long-term capital gains | | | 4,797,557 | | | | — | | | | 106,822 | |
| Unrealized appreciation (depreciation) | | | 65,758,302 | | | | 30,346,347 | | | | 4,085,520 | |
| Other accumulated gains (loss) | | | (1,255,568 | ) | | | (1,022,954 | ) | | | (442 | ) |
| Total accumulated earnings (loss) | | $ | 69,331,135 | | | $ | 29,323,393 | | | $ | 4,259,339 | |
The tax character of distributions paid during the year ended December 31, 2016 was as follows:
| | | NGF | | | NAGF | | | NSCGF | |
| Ordinary income | | $ | — | | | $ | — | | | $ | 548,261 | |
| Net long-term capital gains | | | 4,983,292 | | | | 3,518,408 | | | | 1,347,199 | |
| Return of capital | | | — | | | | — | | | | — | |
| Total distributions paid | | $ | 4,983,292 | | | $ | 3,518,408 | | | $ | 1,895,460 | |
In 2016 a portion of such dividends was distributed in connection with NEEGX, NEAGX, and NESGX redemptions.
The tax character of distributions paid during the year ended December 31, 2015 was as follows:
| | | NGF | | | NAGF | | | NSCGF | |
| Ordinary income | | $ | — | | | $ | — | | | $ | — | |
| Net long-term capital gains | | | 8,209,695 | | | | 5,612,688 | | | | 606,909 | |
| Distribution in excess for | | | | | | | | | | | | |
| required excise distribution | | | — | | | | — | | | | — | |
| Total distributions paid | | $ | 8,209,695 | | | $ | 5,612,688 | | | $ | 606,909 | |
Under current tax law, capital and currency losses realized after October 31 of a Portfolio’s fiscal year may be deferred and treated as occurring on the first business day of the following fiscal year for tax purposes. The following Portfolios had deferred post-October capital and currency losses, which will be treated as arising on the first business day of the year ended of December 31, 2016.
As of December 31, 2016 none of the Portfolios had accumulated capital loss carryovers.
Management has evaluated subsequent events through the date of this filing. The redemption fee for each Portfolio has been removed and will not be charged effective August 25, 2017.
Semi-Annual Report 2017
Supplementary Information (Unaudited)
June 30, 2017
Disclosure of Portfolio Holdings
The Company files a Form N-Q with the Securities and Exchange Commission (the ‘’SEC’’) no more than sixty days after the Company’s first and third fiscal quarters. For the Company, this would be for the fiscal quarters ending March 31 and September 30. Form N-Q includes a complete schedule of the Company’s portfolio holdings as of the end of those fiscal quarters. The Company’s N-Q filings can be found free of charge on the SEC’s website at http://www.sec.gov, or they may be reviewed and copied at the SEC’s Public Reference Room in Washington, D.C. (call 800-SEC-0330 for information on the operation of the Public Reference Room). copied at the SEC’s Public Reference Room in Washington, D.C. (call 800-SEC-0330 for information on the operation of the Public Reference Room).
Voting Proxies on Company Portfolio Securities
A description of the policies and procedures that the Company uses to determine how to vote proxies relating to portfolio securities and information regarding how the Company voted proxies relating to portfolio securities during the most recent 12-month period ended June 30 are available without charge, upon request, by calling 800-625-7071 or on the SEC’s website at http://www.sec.gov.
Household Delivery of Shareholder Documents
To reduce expenses, the Company may mail only one copy of the Portfolios’ prospectuses, proxy statements, information statements, and each annual and semi-annual report to those addresses shared by two or more accounts. If you wish to receive individual copies of these documents, please call the Portfolios at 1-800-625-7071 or contact your financial institution. You will begin receiving individual copies thirty days after receiving your request.
445 Park Avenue
New York, New York 10022-2606
1-800-625-7071
Investment Adviser:
Needham Investment Management L.L.C.
445 Park Avenue
New York, New York 10022-2606
| | President |
| | George A. Needham |
| | |
| | Executive Vice Presidents and Portfolio Managers |
| | John Barr |
| | Needham Growth Fund |
| | Needham Aggressive Growth Fund |
| | Chris Retzler |
| | Needham Growth Fund |
| | Needham Small Cap Growth Fund |
| | |
| | Directors |
| | George A. Needham |
| | John W. Larson |
| | F. Randall Smith |
Distributor:
Needham & Company, LLC
445 Park Avenue
New York, New York 10022-2606
212-371-8300
Administrator, Shareholder Servicing Agent and Transfer Agent:
U.S. Bancorp Fund Services, LLC
615 East Michigan Street
Milwaukee, WI 53202
Custodian:
U.S. Bank, N.A.
1555 North RiverCenter Drive
Milwaukee, WI 53212
Counsel:
Proskauer Rose LLP
Eleven Times Square
New York, NY 10036-8299
Independent Registered Public Accounting Firm:
KPMG LLP
345 Park Avenue
New York, NY 10154
Item 2. Code of Ethics.
Not applicable for semi-annual reports.
Item 3. Audit Committee Financial Expert.
Not applicable for semi-annual reports.
Item 4. Principal Accountant Fees and Services.
Not applicable for semi-annual reports.
Item 5. Audit Committee of Listed Registrants.
Not applicable to registrants who are not listed issuers (as defined in Rule 10A-3 under the Securities Exchange Act of 1934).
Item 6. Investments.
| (a) | Schedule of Investments is included as part of the report to shareholders filed under Item 1 of this Form. |
Item 7. Disclosure of Proxy Voting Policies and Procedures for Closed-End Management Investment Companies.
Not applicable to open-end investment companies.
Item 8. Portfolio Managers of Closed-End Management Investment Companies.
Not applicable to open-end investment companies.
Item 9. Purchases of Equity Securities by Closed‑End Management Investment Company and Affiliated Purchasers.
Not applicable to open-end investment companies.
Item 10. Submission of Matters to a Vote of Security Holders.
Not Applicable.
Item 11. Controls and Procedures.
| (a) | The Registrant’s Chief Executive Officer and Chief Financial Officer have reviewed the Registrant's disclosure controls and procedures (as defined in Rule 30a-3(c) under the Investment Company Act of 1940 (the “Act”)) as of a date within 90 days of the filing of this report, as required by Rule 30a-3(b) under the Act and Rules 13a-15(b) or 15d‑15(b) under the Securities Exchange Act of 1934. Based on their review, such officers have concluded that the disclosure controls and procedures are effective in ensuring that information required to be disclosed in this report is appropriately recorded, processed, summarized and reported and made known to them by others within the Registrant and by the Registrant’s service provider. |
| (b) | There were no changes in the Registrant's internal control over financial reporting (as defined in Rule 30a-3(d) under the Act) that occurred during the Registrant’s first fiscal half-year of the period covered by this report that has materially affected, or is reasonably likely to materially affect, the Registrant's internal control over financial reporting. |
Item 12. Exhibits.
| (a) | (1) Any code of ethics or amendment thereto, that is the subject of the disclosure required by Item 2, to the extent that the registrant intends to satisfy Item 2 requirements through filing an exhibit. Not applicable for semi-annual reports. |
(2) A separate certification for each principal executive and principal financial officer pursuant to Section 302 of the Sarbanes-Oxley Act of 2002. Filed herewith.
(3) Any written solicitation to purchase securities under Rule 23c‑1 under the Act sent or given during the period covered by the report by or on behalf of the registrant to 10 or more persons. Not applicable to open-end investment companies.
| (b) | Certifications pursuant to Section 906 of the Sarbanes‑Oxley Act of 2002. Furnished herewith. |
SIGNATURES
Pursuant to the requirements of the Securities Exchange Act of 1934 and the Investment Company Act of 1940, the registrant has duly caused this report to be signed on its behalf by the undersigned, thereunto duly authorized.
(Registrant) The Needham Funds, Inc.
By (Signature and Title) /s/George A. Needham
George A. Needham, President (Chief Executive Officer)
Date August 31, 2017
Pursuant to the requirements of the Securities Exchange Act of 1934 and the Investment Company Act of 1940, this report has been signed below by the following persons on behalf of the registrant and in the capacities and on the dates indicated.
By (Signature and Title) /s/George A. Needham
George A. Needham, President (Chief Executive Officer)
Date August 31, 2017
By (Signature and Title) /s/James W. Giangrasso
James W. Giangrasso, Treasurer and Secretary (Chief Financial Officer)
Date August 31, 2017