Semi-Annual
Report
Needham Funds
Seeking to build wealth for long-term investors.
June 30, 2018
Needham Growth Fund
Needham Aggressive Growth Fund
Needham Small Cap Growth Fund
www.needhamfunds.com
250 Park Avenue, 10th Floor
New York, New York 10177
1-800-625-7071
www.needhamfunds.com
Semi-Annual Report
June 30, 2018
| Contents | | | |
| Letter from the Adviser | | | 1 | |
| Portfolio Characteristics | | | | |
| Needham Growth Fund | | | 10 | |
| Needham Aggressive Growth Fund | | | 12 | |
| Needham Small Cap Growth Fund | | | 14 | |
| Disclosure of Fund Expenses | | | 16 | |
| Schedules of Investments | | | | |
| Needham Growth Fund | | | 18 | |
| Needham Aggressive Growth Fund | | | 23 | |
| Needham Small Cap Growth Fund | | | 28 | |
| Schedules of Securities Sold Short | | | | |
| Needham Growth Fund | | | 22 | |
| Needham Aggressive Growth Fund | | | 27 | |
| Statements of Assets and Liabilities | | | 32 | |
| Statements of Operations | | | 34 | |
| Statements of Changes in Net Assets | | | 35 | |
| Financial Highlights | | | | |
| Needham Growth Fund | | | 38 | |
| Needham Aggressive Growth Fund | | | 40 | |
| Needham Small Cap Growth Fund | | | 42 | |
| Notes to Financial Statements | | | 44 | |
| Supplementary Information | | | 53 | |
This report is authorized for distribution to prospective investors only when preceded or accompanied by a current prospectus. The prospectus contains more complete information, including investment objectives, risks, expenses and charges and should be read carefully before investing or sending any money. To obtain a prospectus or summary prospectus, please call 1-800-625-7071.
Portfolios of The Needham Funds, Inc., like all mutual funds:
| | • | Are NOT FDIC insured |
| | • | Have no bank guarantee |
| | • | May lose value |
The Needham Funds, Inc. are distributed by Needham & Company, LLC.
Semi-Annual Report 2018
250 Park Avenue, 10th Floor
New York, NY 10177
(800) 625-7071
www.needhamfunds.com
August 2018
Dear Shareholders, Friends of Needham and Prospective Shareholders,
We are pleased to report results for the quarter and half-year ending June 30, 2018 for the Needham Growth Fund, Needham Aggressive Growth Fund, and Needham Small Cap Growth Fund. Our mission is to create wealth for long-term investors.
Needham Funds’ Second Quarter & First Half 2018 Results
In the second quarter, the Needham Growth Fund Institutional and Retail classes returned 4.68% and 4.54%, respectively; the Needham Aggressive Growth Fund Institutional and Retail classes returned 7.28% and 7.12%, respectively; and the Needham Small Cap Growth Fund Institutional and Retail classes returned 4.41% and 4.25%, respectively. The Russell 2000 Total Return Index returned 7.75% and the S&P 500 Total Return Index returned 3.43%.
For the six-month period ended June 30, 2018, the Needham Growth Fund Institutional and Retail classes returned 3.73% and 3.50%, respectively; the Needham Aggressive Growth Fund Institutional and Retail classes returned 6.64% and 6.33%, respectively; and the Needham Small Cap Growth Fund Institutional and Retail classes returned 5.14% and 4.85%, respectively. The Russell 2000 Total Return Index returned 7.66% and the S&P 500 Total Return Index returned 2.65%.
Review of the First Half of 2018
It’s interesting to look back at previous quarterly letters and read the economic and geopolitical concerns that were seen as risks to the markets. We remain focused on our portfolio companies and view much of the macro, event-driven discussion in the media as distraction. Our job is to understand the fundamentals of our companies, their markets, and their competitors.
2018 began as a continuation of the dream market of the last three years. The market and the Needham Funds responded positively to the first sweeping overhaul to the U.S. tax code in over 30 years, the new Tax Cut and Jobs Act of 2017. In the beginning of February, the markets took a sharp downturn as the Federal Reserve raised interest rates and $1.5 trillion in “risk parity” trades, which are short the market’s volatility, began to unravel. (Grant’s Interest Rate Observer published a great write-up on risk parity in its March 10, 2017 issue.) Trading volatility is so far from our investment philosophy. We look to create wealth for long-term investors by investing in companies with strong management teams and attractive valuations. The markets and the Funds ended the first quarter near flat.
Needham Funds underperformed the Russell 2000 and the S&P 500 in April, which were flat. The market’s laundry list of worries at the end of April included the 10-year Treasury yield, which rose above 3% for the first time in 4 years, and trade wars and geopolitical risk
Needham Funds
with Russia, China, North Korea, and Iran. On the other hand, April brought the first meetings between U.S. Secretary of State Mike Pompeo and North Korean leader Kim Jong-un, which raised the prospect of a summit between the two countries. May delivered a strong market and outperformance by the Needham Funds, despite more talk of trade wars. The April employment report once again showed a decline in labor force participation, but it also showed just 3.9% unemployment. The economy and inflation seemed to be not too hot and not too cold. Earnings broadly, and for our portfolio companies, were better than feared.
The markets and the Funds were both positive in June. A strong jobs report was followed by the Federal Open Market Committee’s raise of its target interest rates for the second time in 2018, to 1.75-2.00%. One or two additional rate hikes are expected in 2018. In June, President Trump had a summit with North Korean leader Kim Jong-un and reached broad outlines of a peace agreement—quite a shift from the fears of nuclear war that made headlines earlier in the year. By the end of June, global growth appeared to be robust, answering concerns of earlier in the year.
Our outlook for 2018 remains positive, with the possibilities of stronger economic growth and reward of value recognition in our small cap companies that lagged in 2017. We look forward to a year of patience rewarded.
Needham Growth Fund (NEEGX/NEEIX)
In the second quarter of 2018, the Needham Growth Fund Institutional class returned 4.68% and the Retail class returned 4.54%, compared with the S&P 500 Total Return Index, which returned 3.43%. For the half-year ended June 30, 2018, the Needham Growth Fund Institutional class returned 3.73% and the Retail class returned 3.50%.
The Fund’s top contributor in the second quarter and the first half was KVH Industries, Inc. (KVHI), which returned 29.5% in the second quarter after being flat in the first quarter. On its second quarter conference call in May, KVH announced that Mini-VSAT maritime satellite terminal shipments increased 62% year over year. The recently launched AgilePlans and High Throughput Satellite (HTS) offerings were catalysts for this growth. KVH also announced strong fiber-optic gyroscope (FOG) sales and progress with the new low-cost FOG, which we believe could be in customer trials later this year. Fiber-optic gyroscopes are used for augmenting global-positioning satellite (GPS) location systems. We believe KVH FOGs are used on most autonomous vehicles. The low-cost FOG is positioned to address the much larger autonomous vehicle market of the future.
Super Micro Computer, Inc. (SMCI) was the second-leading contributor for the second quarter and returned 39.1%. Super Micro designs and manufacturers compute servers and storage systems using x86 microprocessors from Intel (INTC) and Advanced Micro Devices, Inc. (AMD). Super Micro’s customers include Hewlett Packard Enterprise (HPE) Nimble Group, Nutanix, Inc. (NTNX), and NetApp Inc. (NTAP). These companies supply leading-edge, NAND memory-based storage systems and their businesses are robust. Super Micro should benefit along with these companies. In May, Super Micro provided revenue guidance for the second quarter with strength in AI machine learning, internet, data center, and cloud storage. The company is facing an August 24 deadline to complete its 10-K filing for its fiscal year end June 2017 with the SEC. If the filing is not completed,
Semi-Annual Report 2018
Super Micro faces delisting by the NASDAQ. Should Super Micro be delisted, it would then trade Over-The-Counter.
CarMax, Inc. (KMX) was the third-leading contributor for the quarter with a 13.6% return and the half year with 13.6% return. CarMax reported better comparable store sales than expected for the quarter ending May 30.
Amber Road, Inc. (AMBR) was another top contributor with a year-to-date return of 28.2%. AMBR provides cloud-based global trade management software, trade content and training that helps companies realize value in their global supply chains. In February, private company E2Open made an unsolicited and, as it turns out, unwanted offer to purchase Amber Road for $10.50 per share. E2Open sees Amber Road’s trade management database as a value-added adjunct to its own trade management offerings, but the board of Amber Road declined E2Open’s offer. We believe Amber Road will either accomplish its business plan in 2018 or E2Open or another acquirer will succeed. Either way, we see value in AMBR.
The leading detractor in the second quarter was the Fund’s short position in Ubiquiti Networks, Inc. (UBNT), as the stock rebounded sharply. On February 20, the company announced that on February 13, “The Securities and Exchange Commission (the “SEC”) issued subpoenas to Ubiquiti Networks, Inc. (the “Company”) and certain of the Company’s officers requesting documents and information relating to a range of topics, including metrics relating to the Ubiquiti Community, accounting practices, financial information, auditors, international trade practices, and relationships with distributors and various other third parties. The Company is in the process of responding to the requests and intends to cooperate fully with the SEC.” The stock fell 21% that day. However, Ubiquiti’s stock price then proceeded to rise, from $71.02 on March 30 to $84.72 on June 29. Ubiquiti continued to execute a $150 million stock buyback announced on February 6. On March 13, Ubiquiti announced a new $200 million stock repurchase plan. As of March 30, Ubiquiti had $467 million of debt from a syndicate led by Wells Fargo. On May 8, the Board approved CEO Robert Pera to pledge up to 28% of his shares to secure a loan. Mr. Pera used that loan to buyout his partners’ ownership of the Memphis Grizzlies NBA basketball team. He owns 56.3 million shares worth $4.7 billion and is pledging up to 15.8 million shares worth $1.3 billion as of June 30. In my career, I have seen CEO margin loans gone bad.
Other detractors in the first half of 2018 included PDF Solutions Inc. (PDFS), ViaSat, Inc. (VSAT), FormFactor, Inc. (FORM), and Comcast Corp. Class A (CMCSA).
PDF Solutions, Inc. has continued to make progress on its new initiatives, but this progress has been masked by the outlook for PDF’s Integrated Yield Ramp services. PDF announced that its Exensio Big Data Analytics platform now has over 130 customers across the semiconductor design, manufacturing, and test industries. The Design-for-Inspection (DFI) initiative has made progress in the first half of 2018. DFI is used by customers to detect electrical failures on semiconductors during the manufacturing process. We think that in the next quarter or two, PDF will renew its agreement with its lead customer, which we believe to be Taiwan Semiconductor Manufacturing Co., Ltd (TSM). Exensio and DFI address markets that might be much larger than PDF’s current market. We own the stock in anticipation of PDF addressing these markets and growing to be a much larger company over the years ahead. Investments like PDF take patience.
Needham Funds
ViaSat provides high-speed satellite broadband and secure networking systems to military and commercial markets. In February, the company reported a mixed quarter and launched the ViaSat 2 high-throughput satellite. In April, Eutelsat Communications S.A. (ETL Paris Euronext) announced that it was withdrawing from its partnership with ViaSat and ordering a satellite from Thales Group (HO Euronext Paris). We note that both Thales and Eutelsat are partially owned by the French Government. They have yet to build a high-throughput satellite and have no experience offering consumer/business broadband service to the masses. We believe ViaSat might find another, even more attractive partner.
In the first half, the Needham Growth Fund exited long-term holdings of CONMED Corp. (CNMD), Dick’s Sporting Goods (DKS), Nutanix, and United Continental Holdings (UAL). Our reduced positions include Becton Dickinson & Co. (BDX), Medtronic Plc (MDT), Akamai Technologies, Inc. (AKAM), and Entegris (ENTG).
The Fund added new positions in Zuora, Inc. Class A (ZUO), Carbon Black, Inc. (CBLK), Pluralsight, Inc. (PS), and nLight, Inc. (LASR). All of these were IPOs and could provide starting positions toward long-term holdings.
As of June 30, 2018, the top 10 positions were 54.8% of net assets. Trailing 12-month turnover was just 7% and the Fund’s Active Share1 vs. the S&P 500 was 107.4%. Once again, the Fund looks nothing like the S&P 500 and its performance is not correlated. Short positions comprised 5.8% of total investments.
Needham Aggressive Growth Fund (NEAGX/NEAIX)
In the second quarter of 2018, the Needham Aggressive Growth Fund Institutional class returned 7.28% and the Retail class returned 7.12%. For the half-year ended June 30, 2018, the Needham Aggressive Growth Fund Institutional class returned 6.64% and the Retail class returned 6.33%.
Like the Needham Growth Fund, the leading contributor during the second quarter and the second-leading contributor for the first half was KVH Industries.
Vicor Corporation (VICR) was the second-leading contributor for the quarter and returned 52.5%. Year to date, Vicor has returned 108.4% and is the Fund’s leading contributor. Vicor is a great example of a successful investment for the Fund. The company makes sophisticated modular power converters used in data centers, on servers and in transportation systems, including automobiles. Vicor announced strong results for its March quarter. We first bought the stock in 2014 at $7 per share. Vicor has continued investment in a new series of products over the last four years.
We increased our position in the first and second quarters of 2015, the first and second quarters of 2016, and the second quarter of 2017. Vicor’s most important commercial advance to date was in the second quarter of 2016, when I wrote in our quarterly letter, “The Fund also added (to) Vicor Corporation. Vicor has worked with Alphabet Inc.’s Google (GOOGL) on its Open Compute data centers to distribute DC (direct current) power throughout the data center
____________
1 | Active Share is a measure of the differentiation of the holdings of a portfolio from the holdings of its appropriate passive benchmark index. Active Share is calculated by taking the sum of the absolute value of the differences of the weight of each holding in the manager’s portfolio versus the weight of each holding in the benchmark index and dividing by two. |
Semi-Annual Report 2018
rather than go through the inefficient conversions to AC (alternating current) and back again to DC.” We believe Vicor’s approach is now being adopted by a number of data center customers. In March 2018, Vicor and NVIDIA (NVDA) announced that they were working together. Many of today’s computing needs require sophisticated power conversion and Vicor is uniquely positioned to meet these conversion needs.
The Fund’s third-largest contributor for the quarter was Super Micro Computer, Inc. The third-largest contributor for the first half was Entegris, which remains the largest position in the Fund at 9.07% of net assets as of June 30, 2018. Entegris reported strong results in January and April. The company is benefiting from the advanced filtration requirements of the semiconductor industry.
For the year to date, the Fund’s leading detractor was PDF Solutions, Inc. The second-leading detractor was the short position in Medallion Financial (MFIN). I continue to believe that Medallion Financial has overstated the value of its Medallion Bank subsidiary, its owned medallions, and its medallion loans. The third-leading detractor was FormFactor.
In the first half, we increased our investment in DIRTT Environmental Solutions Ltd. (DRT) from 100,000 to 207,500 shares. DIRTT supplies semi-custom manufactured office interiors, designed using its incredible ICE virtual reality computer-aided design system. Using DIRTT replaces on-site, sheet-rock construction and eliminates the associated waste. It also reduces the schedule variability of on-site construction. The construction industry has yet to benefit from the technology revolution. I believe DIRTT is a disruptor of the $50 billion interiors construction industry with an opportunity to grow much larger than its current $250 million of sales. I highly recommend the DIRTT website and the ICE virtual reality website to see what digital construction is all about.
Mogens Smed is the charismatic Co-Founder, Executive Chairman and visionary for DIRTT. Until the end of December 2017, he was also CEO. The Board of Directors decided that a change in leadership was necessary and Mogens’ role was changed. He is still responsible for sales and continues to be the company’s visionary leader. This ongoing leadership change has created what I see as an opportunity, since the stock was down 7.1% year-to-date as of June 30. I like the valuation and the company’s long-term opportunity.
The Fund also added new positions in Zuora, Carbon Black, Pluralsight, nLight, and Alpha Pro Tech, Ltd. (APT).
The Fund exited its positions in Xcerra Corporation (XCRA) on its announced merger with Cohu, Inc. (COHU) and Corium International Inc. (CORI). We reduced positions in Akamai (AKAM), comScore, Inc. (SCOR), and Vicor on their strength. We trimmed positions in Entegris (ENTG), MKS Instruments, Inc. (MKSI), TradeDesk, Inc. (TDD), Nova Measuring Instruments, Ltd. (NVMI), Gilead Sciences, Inc. (GILD), and Becton Dickinson (BDX).
At June 30, 2018, the Fund’s top 10 positions were 56.75% of net assets. The Fund had an Active Share of 112.6% versus the Russell 2000 and had trailing 12-month turnover of 7%.
Needham Small Cap Growth Fund (NESGX/NESIX)
The Needham Small Cap Growth Fund Institutional class returned 4.41% and the Retail class returned 4.25% in the quarter ended June 30, 2018. For the half-year ended June 30,
Needham Funds
2018, the Needham Small Cap Growth Fund Institutional class returned 5.14% and the Retail class returned 4.85%.
While volatility may seem to be a bad word for the overall markets, it is a great chance for active managers to find buying opportunities. It is in these volatile markets when a cash position is truly strategic for small cap fund managers. Many small cap investment opportunities “trade by appointment,” and we like to capitalize on these opportunities when liquidity is available to both buy and sell stock positions. The Fund continued its lean toward a concentrated portfolio of stocks, with the top 10 holdings representing 47.92% of net assets at June 30, 2018.
SuperMicro Computer, Inc. was the Fund’s top contributor in the second quarter, as its fundamental operations continue to do well and spending persists in enterprise and data centers. While we wait for its financial filings, the quarterly operational updates the company provides remain upbeat and show the underlying strength in its end markets and partners. We look forward to the conclusion of Super Micro’s financial reporting delays.
Another strong contributor and long-time holding in the Fund was KVH Industries, Inc. The stock recovered in the second quarter as business has improved and offshore energy markets have seen more activity. We expect KVH will continue to make progress in its longer-term investments targeting the autonomous driving industry. We took advantage of the stock price improvement and substantially reduced the Fund’s exposure to KVH, to help reduce volatility in this thinly traded stock.
Our investment in newly public Zscaler, Inc. (ZS) is a not a large share position, but it was the Fund’s third-largest contributor in the quarter. We added to the position after the IPO, as we have known the company for many years and understand the long-term fundamental strengths of the business. Providing security to networks globally will continue to remain a requirement of all participants in the interconnected digital age.
For the half year, Amber Road, Inc., Pure Storage, Inc. (PSTG) and Nutanix, Inc. were the top three contributors to the Fund. As mentioned in the commentary for Needham Growth Fund, Amber Road received a takeover offer of $10.50, but its board of directors decided the offer price was insufficient when compared to its long-term business plan. We will closely monitor the fundamental performance of the company over the next few quarters, as we expect management to significantly improve revenue growth and profitability.
Our investments in Pure Storage and Nutanix both benefited from the ever-evolving enterprise technology industry. Like many new technologies, it took some time for the adoption of their products, but they ultimately recognized an accelerated sales environment. The stocks performed very well and hit our valuation targets. We exited both positions by the end of the second quarter and will continue to monitor their stock performance and any correction that may occur.
While we were more defensive in our positioning versus the markets, we were negatively impacted by stock-specific news that caused the Fund to underperform. Agile Therapeutics (AGRX) continued to face challenges in its approval process and its product partner, Corium International, was also negatively impacted in sympathy. The Fund had substantially reduced its exposure to these companies; however, the negative news was
Semi-Annual Report 2018
significant. At this time, the Fund’s holding in Agile remains an option on a favorable appeals ruling; otherwise the stock may be harvested as a tax loss.
Another major holding that negatively impacted the Fund was NeoPhotonics, Inc. (NPTN). NeoPhotonics is a supplier to the Chinese technology firm ZTE, which was banned from buying U.S. components; however, that penalty has since been resolved. While the ZTE ban was just a temporary cause of volatility to the stock, damage to near-term financials was done. We hope to see NeoPhotonics return to business as usual over the next few quarters.
Our exposure to the semiconductor capital equipment industry was also negatively impacted in the second quarter. However, we believe that we may be nearing a bottom in the cycle and have been deploying capital into stocks within the sector. We have substantial positions in Photronics, Inc. (PLAB) and Ultra Clean Holdings, Inc. (UCTT). Photronics continues to invest in its overseas operations and has been focused on its business within mainland China. We expect the company to start recognizing a return on its investments within the next year, as Chinese semiconductor companies begin operations and require products from Photronics.
We have initiated a small position in Ultra Clean Holdings, and we believe that it is a value investment, as its stock has corrected over the past twelve months. While hard to pick the bottom in the cycle, we believe Ultra Clean is well-positioned for the continued long-term growth semiconductor capital equipment companies have been enjoying.
We added a few new small positions to the Fund, including Advanced Energy Industries (AEIS), Coherent, Inc. (COHR), Hawaiian Holdings, Inc. (HA), nLight, Inc., Zscaler, Inc., and Zuora, Inc. We sold out of our remaining positions in Nutanix, Inc., Pure Storage, Inc., and Channel Advisor Corp. (ECOM). The Fund ended the quarter with a cash position of 12.9%, and we will remain patient as we deploy that capital.
We continue to believe that a good environment remains for investment in equities. Three themes we are focused on include: 1) continuation of the growth in the semiconductor capital equipment industry; 2) cyber-security; and 3) military and defense modernization. These three areas of investment impact much of our portfolio, and we believe that they should create shareholder value in the long term.
We expect the increased volatility to continue throughout 2018. The Federal Reserve continues to raise short-term interest rates, but at a gradual pace. We expect more rate increases this year. The expectation of pro-growth policies has boosted confidence for both individuals and corporations, and this should ultimately translate into higher economic activity for many of our portfolio companies. The high-yield markets remain strong, which is supportive of the small cap asset class valuations. We reiterate from our last quarterly letter that mergers and acquisitions continued in the small cap universe, but have slowed since 2016. We believe this trend is a pause, and we expect to see increased M&A activity. We expect economic growth to improve and benefit our portfolio stocks in the second half of 2018.
Closing
We believe the U.S. remains the best place in the world to be investing, and we continue to see an opportunity to invest in small and mid cap stocks. Most importantly, the continued technology revolution has created and continues to create investment opportunities. We
Needham Funds
see opportunity in our strategy of investing in companies that we know well and that we believe are positioned with secular growth drivers.
We welcome our new investors and thank all of our investors for their continued support. If you have any questions, thoughts or concerns, please contact us at (800) 625-7071 or at cretzler@needhamco.com or jbarr@needhamco.com. For information about the funds, please visit our website at www.needhamfunds.com.
Sincerely,
| | |
 |  |
| | |
| Chris Retzler | John O. Barr |
| Portfolio Manager | Portfolio Manager |
Needham Funds Fact Sheet Links:
Needham Growth Fund
Needham Aggressive Growth Fund
Needham Small Cap Growth Fund
The information presented in this commentary is not intended as personalized investment advice and does not constitute a recommendation to buy or sell a particular security or other investments. Past performance is no guarantee of future results. The views of the Adviser and the securities described in this report are as of June 30, 2018; these views and portfolio holdings may have changed subsequent to this date. The specific securities discussed may, in aggregate, represent only a small percentage of a Portfolio’s holdings. It should not be assumed that securities identified and discussed were, or will be, profitable, or that the investment decisions made in the future will be profitable, or equal the investment performance of the securities discussed herein. There can be no guarantee as to the accuracy of any outlooks for markets, sectors and securities as discussed herein.
This message is not an offer of the Needham Growth Fund, the Needham Aggressive Growth Fund or the Needham Small Cap Growth Fund. Shares are sold only through the currently effective prospectus. Please read the prospectus carefully and consider the investment objectives, risks, and charges and expenses of the Fund carefully before you invest. The prospectus contains this and other information about the Fund. A copy of the prospectus is available at www.needhamfunds.com or by contacting the Fund’s transfer agent, U.S. Bancorp Fund Services, LLC at 1-800-625-7071.
Semi-Annual Report 2018
All three of the Needham Funds have substantial exposure to small and micro capitalized companies. Funds holding smaller capitalized companies are subject to greater price fluctuation than those of larger companies.
Needham & Company, LLC, member FINRA/SIPC, is the distributor of The Needham Funds, Inc.
Portfolio holdings are subject to change. The Needham Funds ownership as a percentage of net assets in the stated securities as of 6/30/18:
| Security | Growth | Aggressive | Small Cap | Security | Growth | Aggressive | Small Cap |
| KVHI | 6.58% | 8.44% | 3.01% | GOOGL | 0.00% | 0.00% | 0.00% |
| SMCI | 4.69% | 3.56% | 5.62% | NVDA | 0.00% | 0.00% | 0.00% |
| INTC | 0.00% | 0.00% | 0.00% | MFIN | -1.29% | -2.57% | 0.00% |
| AMD | 0.00% | 0.00% | 0.00% | DRTTF | 0.00% | 1.77% | 0.00% |
| HPE | 0.00% | 0.00% | 0.00% | APT | 0.00% | 0.12% | 0.00% |
| NTNX | 0.00% | 0.00% | 0.00% | XCRA | 0.00% | 0.00% | 0.00% |
| NTAP | 0.00% | 0.00% | 0.00% | COHU | 0.00% | 0.00% | 0.00% |
| KMX | 6.02% | 2.55% | 0.00% | CORI | 0.57% | 0.00% | 1.49% |
| AMBR | 4.00% | 2.62% | 7.87% | AKAM | 2.52% | 3.49% | 0.00% |
| UBNT | -4.00% | -3.61% | 0.00% | SCOR | 1.04% | 0.92% | 1.75% |
| PDFS | 4.43% | 6.69% | 4.00% | MKSI | 2.26% | 3.75% | 0.00% |
| VSAT | 4.96% | 1.90% | 1.02% | TDD | 0.00% | 0.00% | 0.00% |
| FORM | 4.33% | 3.85% | 0.41% | NVMI | 1.50% | 2.93% | 0.00% |
| CMCSA | 3.56% | 0.00% | 0.00% | GILD | 5.85% | 1.15% | 0.00% |
| TSM | 0.00% | 0.00% | 0.00% | BDX | 5.09% | 0.82% | 0.00% |
| CNMD | 0.00% | 0.00% | 0.00% | ZS | 0.00% | 0.00% | 2.22% |
| DKS | 0.00% | 0.00% | 0.00% | PSTG | 0.00% | 0.00% | 0.00% |
| UAL | 0.00% | 0.00% | 0.00% | AGRX | 0.05% | 0.01% | 0.20% |
| BDX | 5.09% | 0.82% | 0.00% | NPTN | 0.00% | 0.00% | 3.76% |
| MDT | 1.82% | 0.00% | 0.00% | PLAB | 1.22% | 1.33% | 6.18% |
| AKAM | 2.52% | 3.49% | 0.00% | UCTT | 0.00% | 0.00% | 1.54% |
| ENTG | 4.59% | 9.07% | 0.00% | AEIS | 0.00% | 0.00% | 0.90% |
| ZUO | 0.87% | 0.89% | 1.05% | COHR | 0.00% | 0.00% | 1.70% |
| CBLK | 0.03% | 0.03% | 0.03% | HA | 0.00% | 0.00% | 1.11% |
| PS | 0.14% | 0.21% | 0.23% | ECOM | 0.00% | 0.00% | 0.00% |
| VICR | 0.72% | 4.17% | 0.00% | | | | |
Needham Funds
| NEEDHAM GROWTH FUND | Retail Class |
| | Ticker Symbol: NEEGX |
| | Institutional Class |
| | Ticker Symbol: NEEIX |
Comparative Performance Statistics as of June 30, 2018 (Unaudited)
| | | | | | | | Gross |
| | 6 | 1 | 3 | 5 | 10 | Since | Expense |
| | Months(9) | Year | Years(10) | Years(10) | Years(10) | Inception(9) | Ratio(16) |
| Needham Growth Fund | | | | | | | |
Retail Class(1)(2) | 3.50% | 7.76% | 4.37%(11) | 8.10%(12) | 8.63%(13) | 12.51%(14) | 2.34% |
| Needham Growth Fund | | | | | | | |
Institutional Class(1)(3) | 3.73% | 8.31% | n/a | n/a | n/a | 8.46% | 1.90% |
S&P 500 Index(4)(5) | 2.65% | 14.37% | 11.93% | 13.42% | 10.17% | 8.86%(15) | |
NASDAQ Composite Index(4)(6) | 9.38% | 23.64% | 16.02% | 18.62% | 13.96% | 10.08%(15) | |
S&P 400 MidCap Index(4)(7) | 3.49% | 13.50% | 10.89% | 12.69% | 10.78% | 11.76%(15) | |
Russell 2000 Index(4)(8) | 7.66% | 17.57% | 10.96% | 12.46% | 10.60% | 9.04%(15) | |
Past performance does not guarantee future results. The performance data quoted represents past performance, and current returns may be lower or higher. The investment return and net asset value will fluctuate so that an investor’s shares, when redeemed, may be worth more or less than the original cost. To obtain performance information current to the most recent month-end, please call 1-800-625-7071. The returns shown in the above table and accompanying footnotes are net of expenses. The table above does not reflect the deduction of taxes that a shareholder would have paid on Fund distributions or on the redemption of Fund shares.
| 1. | Investment results calculated after reinvestment of dividends. |
| 2. | The inception date of the Retail Class was 1/1/96. |
| 3. | The inception date of the Institutional Class was 12/30/16. |
| 4. | It is not possible to invest directly in an index. The performance of the index does not include the deduction of expenses associated with a mutual fund, such as investment management fees. |
| 5. | The S&P 500 Index is a broad unmanaged measure of the U.S. stock market. |
| 6. | The NASDAQ Composite Index is a broad-based capitalization-weighted index of all NASDAQ Global Market and Small Cap stocks. |
| 7. | The S&P 400 MidCap Index is a broad unmanaged measure of the U.S. stock market. |
| 8. | The Russell 2000 Index is a broad unmanaged index composed of the smallest 2,000 companies in the Russell 3000 Index. |
| 9. | Not annualized. |
| 10. | Compound annual growth rate (annualized return). Assumes all dividends were reinvested in shares of the Retail Class. |
| 11. | Cumulative return for the three year period was 13.69%, assuming all dividends were reinvested in shares of the Retail Class. |
| 12. | Cumulative return for the five year period was 47.59%, assuming all dividends were reinvested in shares of the Retail Class. |
| 13. | Cumulative return for the ten year period was 128.84%, assuming all dividends were reinvested in shares of the Retail Class. |
| 14. | Cumulative return since inception was 1,318.68%, assuming all dividends were reinvested in shares of the Retail Class. |
| 15. | The return shown for the Index is from the Inception date of the Retail Class. |
| 16. | Gross expense ratio is from the Fund’s prospectus dated May 1, 2018. Additional information pertaining to the Fund’s expense ratios as of June 30, 2018 can be found in the financial highlights. Since January 1, 2009, the investment performance reflects contractually agreed upon fee waivers which expire at the close of business on April 30, 2019. Without these fee waivers, the performance would have been lower. Excluding the indirect costs of investing in acquired funds, total class operating expenses would be 2.34% and 1.90% for the Retail Class and Institutional Class, respectively. |
Semi-Annual Report 2018
| Top Ten Holdings* |
| (as a % of total investments, |
| as of June 30, 2018) |
| | | % of Total |
Security | | Investments |
| Thermo Fisher Scientific, Inc. | TMO | 8.22% |
| KVH Industries, Inc. | KVHI | 6.58% |
| CarMax, Inc. | KMX | 6.02% |
| Gilead Sciences, Inc. | GILD | 5.86% |
| Becton Dickinson and Co. | BDX | 5.09% |
| ViaSat, Inc. | VSAT | 4.97% |
| Super Micro Computer, Inc. | SMCI | 4.69% |
| Entegris, Inc. | ENTG | 4.60% |
| PDF Solutions, Inc. | PDFS | 4.44% |
| FormFactor, Inc. | FORM | 4.34% |
Top Ten Holdings = 54.81% of Total Investments†
| * | Current portfolio holdings may not be indicative of future portfolio holdings. |
| † | Percentage of total investments less cash and short-term investments. |
| Sector Weightings* |
| (as a % of net investments, |
| as of June 30, 2018) |
Sector | Long(1) | (Short)(1) | Total(2) |
| Consumer Discretionary | 11.0% | — | 11.0% |
| Consumer Staples | 0.8% | — | 0.8% |
| Energy | 1.8% | — | 1.8% |
| Financials | 1.0% | (1.6)% | (0.6)% |
| Health Care | 25.1% | — | 25.1% |
| Industrials | 4.3% | — | 4.3% |
| Information Technology | 61.5% | (4.2)% | 57.3% |
| Real Estate | 0.1% | — | 0.1% |
| Cash | 0.2% | — | 0.2% |
| * | Current portfolio holdings may not be indicative of future portfolio holdings. |
(1) | Percentage of total investments includes all stocks, plus cash minus all short positions. |
(2) | Total represents the difference between the long exposure and the short exposure, which produces the net exposure. |
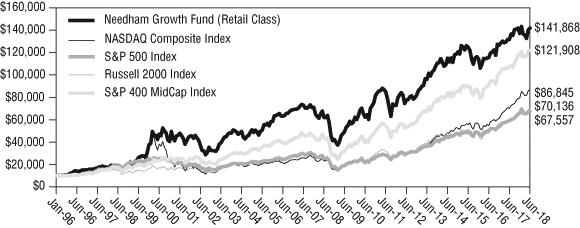
Comparison of Change in Value of a $10,000 Investment
Past performance does not guarantee future results. The performance data quoted represents past performance, and current returns may be lower or higher. The investment return and net asset value will fluctuate so that an investor’s shares, when redeemed, may be worth more or less than the original cost. To obtain performance information current to the most recent month-end, please call 1-800-625-7071. The graph above does not reflect the deduction of taxes that a shareholder would have paid on Fund distributions or on the redemption of Fund shares. Since inception, the Fund’s adviser has absorbed certain expenses of the Fund, without which returns would have been lower.
The Global Industry Classification Standard (GICS®) was developed by and/or is the exclusive property of MSCI, Inc. and Standard & Poor Financial Services LLC (“S&P”). GICS is a service mark of MSCI and S&P and has been licensed for use by U.S. Bancorp Fund Services, LLC.
Needham Funds
| NEEDHAM AGGRESSIVE GROWTH FUND | Retail Class |
| | Ticker Symbol: NEAGX |
| | Institutional Class |
| | Ticker Symbol: NEAIX |
Comparative Performance Statistics as of June 30, 2018 (Unaudited)
| | | | | | | | Gross |
| | 6 | 1 | 3 | 5 | 10 | Since | Expense |
| | Months(8) | Year | Years(9) | Years(9) | Years(9) | Inception(9) | Ratio(15) |
| Needham Aggressive Growth | | | | | | | |
Fund Retail Class(1)(2) | 6.33% | 14.28% | 8.50%(10) | 10.53%(11) | 11.22%(12) | 9.63%(13) | 2.63% |
| Needham Aggressive Growth | | | | | | | |
Fund Institutional Class(1)(3) | 6.64% | 14.92% | n/a | n/a | n/a | 10.80% | 2.22% |
S&P 500 Index(4)(5) | 2.65% | 14.37% | 11.93% | 13.42% | 10.17% | 7.48%(14) | |
NASDAQ Composite Index(4)(6) | 9.38% | 23.64% | 16.02% | 18.62% | 13.96% | 10.00%(14) | |
Russell 2000 Index(4)(7) | 7.66% | 17.57% | 10.96% | 12.46% | 10.60% | 9.22%(14) | |
Past performance does not guarantee future results. The performance data quoted represents past performance, and current returns may be lower or higher. The investment return and net asset value will fluctuate so that an investor’s shares, when redeemed, may be worth more or less than the original cost. To obtain performance information current to the most recent month-end, please call 1-800-625-7071. The returns shown in the above table and accompanying footnotes are net of expenses. The table above does not reflect the deduction of taxes that a shareholder would have paid on Fund distributions or on the redemption of Fund shares.
| 1. | Investment results calculated after reinvestment of dividends. |
| 2. | The inception date of the Retail Class was 9/4/01. |
| 3. | The inception date of the Institutional Class was 12/30/16. |
| 4. | It is not possible to invest directly in an index. The performance of the index does not include the deduction of expenses associated with a mutual fund, such as investment management fees. |
| 5. | The S&P 500 Index is a broad unmanaged measure of the U.S. stock market. |
| 6. | The NASDAQ Composite Index is a broad-based capitalization-weighted index of all NASDAQ Global Market and Small Cap stocks. |
| 7. | The Russell 2000 Index is a broad unmanaged index composed of the smallest 2,000 companies in the Russell 3000 Index. |
| 8. | Not annualized. |
| 9. | Compound annual growth rate (annualized return). Assumes all dividends were reinvested in shares of the Retail Class. |
| 10. | Cumulative return for the three year period was 27.72%, assuming all dividends were reinvested in shares of the Retail Class. |
| 11. | Cumulative return for the five year period was 64.98%, assuming all dividends were reinvested in shares of the Retail Class. |
| 12. | Cumulative return for the ten year period was 189.72%, assuming all dividends were reinvested in shares of the Retail Class. |
| 13. | Cumulative return since inception was 369.32% assuming all dividends were reinvested in shares of the Retail Class. |
| 14. | The return shown for the Index is from the Inception date of the Retail Class. |
| 15. | Gross expense ratio is from the Fund’s prospectus dated May 1, 2018. Additional information pertaining to the Fund’s expense ratios as of June 30, 2018 can be found in the financial highlights. Since January 1, 2009, the investment performance reflects contractually agreed upon fee waivers which expire at the close of business on April 30, 2019. Without these fee waivers, the performance would have been lower. Excluding the indirect costs of investing in acquired funds, total class operating expenses would be 2.63% and 2.22% for the Retail Class and Institutional Class, respectively. |
Semi-Annual Report 2018
| Top Ten Holdings* |
| (as a % of total investments, |
| as of June 30, 2018) |
| | | % of Total |
Security | | Investments |
| Entegris, Inc. | ENTG | 9.07% |
| KVH Industries, Inc. | KVHI | 8.43% |
| PDF Solutions, Inc. | PDFS | 6.68% |
| Apple, Inc. | AAPL | 6.54% |
| GSE Systems, Inc. | GVP | 6.20% |
| Reis, Inc. | REIS | 4.46% |
| Vicor Corp. | VICR | 4.17% |
| FormFactor, Inc. | FORM | 3.85% |
| MKS Instruments, Inc. | MKSI | 3.75% |
| Super Micro Computer, Inc. | SMCI | 3.56% |
Top Ten Holdings = 56.71% of Total Investments†
| * | Current portfolio holdings may not be indicative of future portfolio holdings. |
| † | Percentage of total investments less cash and short-term investments. |
| Sector Weightings* |
| (as a % of net investments, |
as of June 30, 2018) |
Sector | Long(1) | (Short)(1) | Total(2) |
| Consumer Discretionary | 3.4% | — | 3.4% |
| Consumer Staples | 3.4% | — | 3.4% |
| Energy | 0.9% | — | 0.9% |
| Financials | 0.4% | (3.2)% | (2.8)% |
| Health Care | 6.2% | — | 6.2% |
| Industrials | 10.3% | — | 10.3% |
| Information Technology | 80.6% | (3.9)% | 76.7% |
| Real Estate | 1.6% | — | 1.6% |
| Cash | 0.3% | — | 0.3% |
| * | Current portfolio holdings may not be indicative of future portfolio holdings. |
(1) | Percentage of total investments includes all stocks, plus cash minus all short positions. |
(2) | Total represents the difference between the long exposure and the short exposure, which produces the net exposure. |
Comparison of Change in Value of a $10,000 Investment
Past performance does not guarantee future results. The performance data quoted represents past performance, and current returns may be lower or higher. The investment return and net asset value will fluctuate so that an investor’s shares, when redeemed, may be worth more or less than the original cost. To obtain performance information current to the most recent month-end, please call 1-800-625-7071. The graph above does not reflect the deduction of taxes that a shareholder would have paid on Fund distributions or on the redemption of Fund shares. Since inception, the Fund’s adviser has absorbed certain expenses of the Fund, without which returns would have been lower.
The Global Industry Classification Standard (GICS®) was developed by and/or is the exclusive property of MSCI, Inc. and Standard & Poor Financial Services LLC (“S&P”). GICS is a service mark of MSCI and S&P and has been licensed for use by U.S. Bancorp Fund Services, LLC.
Needham Funds
| NEEDHAM SMALL CAP GROWTH FUND | Retail Class |
| | Ticker Symbol: NESGX |
| | Institutional Class |
| | Ticker Symbol: NESIX |
Comparative Performance Statistics as of June 30, 2018 (Unaudited)
| | | | | | | | Gross |
| | 6 | 1 | 3 | 5 | 10 | Since | Expense |
| | Months(8) | Year | Years(9) | Years(9) | Years(9) | Inception(9) | Ratio(15) |
| Needham Small Cap Growth | | | | | | | |
Fund Retail Class(1)(2) | 4.85% | 9.61% | 10.71%(10) | 10.28%(11) | 9.67%(12) | 10.38%(13) | 2.01% |
| Needham Small Cap Growth | | | | | | | |
Fund Institutional Class(1)(3) | 5.14% | 10.23% | n/a | n/a | n/a | 11.84% | 1.46% |
S&P 500 Index(4)(5) | 2.65% | 14.37% | 11.93% | 13.42% | 10.17% | 8.04%(14) | |
NASDAQ Composite Index(4)(6) | 9.38% | 23.64% | 16.02% | 18.62% | 13.96% | 11.00%(14) | |
Russell 2000 Index(4)(7) | 7.66% | 17.57% | 10.96% | 12.46% | 10.60% | 9.20%(14) | |
Past performance does not guarantee future results. The performance data quoted represents past performance, and current returns may be lower or higher. The investment return and net asset value will fluctuate so that an investor’s shares, when redeemed, may be worth more or less than the original cost. To obtain performance information current to the most recent month-end, please call 1-800-625-7071. The returns shown in the above table and accompanying footnotes are net of expenses. The table above does not reflect the deduction of taxes that a shareholder would have paid on Fund distributions or on the redemption of Fund shares.
| 1. | Investment results calculated after reinvestment of dividends. |
| 2. | The inception date of the Retail Class was 5/22/02. |
| 3. | The inception date of the Institutional Class was 12/30/16. |
| 4. | It is not possible to invest directly in an index. The performance of the index does not include the deduction of expenses associated with a mutual fund, such as investment management fees. |
| 5. | The S&P 500 Index is a broad unmanaged measure of the U.S. stock market. |
| 6. | The NASDAQ Composite Index is a broad-based capitalization-weighted index of all NASDAQ Global Market and Small Cap stocks. |
| 7. | The Russell 2000 Index is a broad unmanaged index composed of the smallest 2,000 companies in the Russell 3000 Index. |
| 8. | Not annualized. |
| 9. | Compound annual growth rate (annualized return). Assumes all dividends were reinvested in shares of the Retail Class. |
| 10. | Cumulative return for the three year period was 35.71%, assuming all dividends were reinvested in shares of the Retail Class. |
| 11. | Cumulative return for the five year period was 63.09%, assuming all dividends were reinvested in shares of the Retail Class. |
| 12. | Cumulative return for the ten year period was 151.78%, assuming all dividends were reinvested in shares of the Retail Class. |
| 13. | Cumulative return since inception was 390.88% assuming all dividends were reinvested in shares of the Retail Class. |
| 14. | The return shown for the Index is from the Inception date of the Retail Class. |
| 15. | Gross expense ratio is from the Fund’s prospectus dated May 1, 2018. Additional information pertaining to the Fund’s expense ratios as of June 30, 2018 can be found in the financial highlights. Since January 1, 2009, the investment performance reflects contractually agreed upon fee waivers which expire at the close of business on April 30, 2019. Without these fee waivers, the performance would have been lower. Excluding the indirect costs of investing in acquired funds, total class operating expenses would be 1.95% and 1.40% for the Retail Class and Institutional Class, respectively. |
Semi-Annual Report 2018
| Top Ten Holdings* |
| (as a % of total investments, |
| as of June 30, 2018) |
| | | % of Total |
Security | | Investments |
| Amber Road, Inc. | AMBR | 8.79% |
| Photronics, Inc. | PLAB | 6.90% |
| Super Micro Computer, Inc. | SMCI | 6.27% |
| Invuity, Inc. | IVTY | 5.62% |
| Reis, Inc. | REIS | 4.90% |
| Aspen Aerogels, Inc. | ASPN | 4.64% |
| PDF Solutions, Inc. | PDFS | 4.47% |
| NeoPhotonics Corp. | NPTN | 4.20% |
| Electronics For Imaging, Inc. | EFII | 3.94% |
| Frequency Electronics, Inc. | FEIM | 3.78% |
Top Ten Holdings = 53.51% of Total Investments†
| * | Current portfolio holdings may not be indicative of future portfolio holdings. |
| † | Percentage of total investments less cash and short-term investments. |
| Sector Weightings* |
| (as a % of net investments, |
| as of June 30, 2018) |
Sector | Long(1) | (Short)(1) | Total(2) |
| Closed-End Funds | 3.8% | — | 3.8% |
| Consumer Discretionary | 0.3% | — | 0.3% |
| Consumer Staples | 0.3% | — | 0.3% |
| Energy | 5.2% | — | 5.2% |
| Financials | 0.3% | — | 0.3% |
| Health Care | 9.9% | — | 9.9% |
| Industrials | 2.5% | — | 2.5% |
| Information Technology | 64.4% | — | 64.4% |
| Real Estate | 0.2% | — | 0.2% |
| Cash | 13.1% | — | 13.1% |
| * | Current portfolio holdings may not be indicative of future portfolio holdings. |
(1) | Percentage of total investments includes all stocks, plus cash minus all short positions. |
(2) | Total represents the difference between the long exposure and the short exposure, which produces the net exposure. |
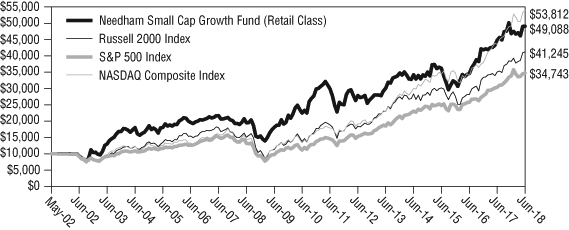
Comparison of Change in Value of a $10,000 Investment
Past performance does not guarantee future results. The performance data quoted represents past performance, and current returns may be lower or higher. The investment return and net asset value will fluctuate so that an investor’s shares, when redeemed, may be worth more or less than the original cost. To obtain performance information current to the most recent month-end, please call 1-800-625-7071. The graph above does not reflect the deduction of taxes that a shareholder would have paid on Fund distributions or on the redemption of Fund shares. Since inception, the Fund’s adviser has absorbed certain expenses of the Fund, without which returns would have been lower.
The Global Industry Classification Standard (GICS®) was developed by and/or is the exclusive property of MSCI, Inc. and Standard & Poor Financial Services LLC (“S&P”). GICS is a service mark of MSCI and S&P and has been licensed for use by U.S. Bancorp Fund Services, LLC.
Needham Funds
Disclosure of Fund Expenses (Unaudited)
The following expense table is shown so that you can understand the impact of fees on your investment. All mutual funds have operating expenses. As a shareholder of a Portfolio, you incur transactional costs, including redemption fees and ongoing costs, which include costs for portfolio management, administrative services, and shareholder reports, among others. A Portfolio’s expenses are expressed as a percentage of its average net assets. This figure is known as the expense ratio. The following examples are intended to help you understand the ongoing costs (in dollars) of investing in each Portfolio and to compare these costs with those of other mutual funds. The examples are based on an investment of $1,000 made at the beginning of the period shown and held for the entire period. The expense example table below illustrates your fund’s cost in two ways:
| • | Actual Expenses. This section helps you to estimate the actual expenses after fee waivers that you paid over the period. The “Ending Account Value” shown is derived from the Portfolio’s actual return, and “Expenses Paid During Period” shows the dollar amount that would have been paid by an investor who started with $1,000 in the Portfolio. You may use the information here, together with the amount you invested, to estimate the expenses that you paid over the period. To do so, simply divide your account value by $1,000 (for example, an $8,600 account value divided by $1,000 = 8.6), then multiply the result by the number given for your Portfolio under the heading entitled “Expenses Paid During Period”. |
| | |
| • | Hypothetical Expenses on a 5% Return. This section is intended to help you compare your Portfolio’s costs with those of other mutual funds. It assumes that the Portfolio had a return of 5% before expenses during the period shown, but that the expense ratio is unchanged. In this case, because the return used is not the Portfolio’s actual return, the results do not apply to your investment. The example is useful in making comparisons because the Securities and Exchange Commission requires all mutual funds to calculate expenses based on a 5% return. You can assess your Portfolio’s cost by comparing this hypothetical example with the hypothetical examples that appear in shareholders reports of other funds. |
Please note that the expenses shown in the table are meant to highlight your ongoing costs only and do not reflect any transactional costs, such as redemption fees or exchange fees. Therefore, the table is useful in comparing ongoing costs only, and will not help you determine the relative total costs of owning different funds. In addition, if these transactional costs were included, your costs would have been higher.
Semi-Annual Report 2018
For the Period January 1, 2018 to June 30, 2018
Expense Example Table
| | Beginning | Ending | Expenses Paid | Expense Ratio |
| | Account | Account | During Period* | During Period* |
| | Value | Value | 1/1/18 – | 1/1/18 – |
| | 1/1/18 | 6/30/18 | 6/30/18 | 6/30/18 |
| Needham Growth Fund | | | | |
| Retail Class Actual Expenses | $1,000.00 | $1,035.00 | $14.88 | 2.95% |
| Retail Class Hypothetical Example | | | | |
| for Comparison Purposes | | | | |
| (5% return before expenses) | $1,000.00 | $1,010.17 | $14.70 | 2.95% |
| Institutional Class Actual Expenses | $1,000.00 | $1,037.30 | $12.38 | 2.45% |
| Institutional Class Hypothetical | | | | |
| Example for Comparison Purposes | | | | |
| (5% return before expenses) | $1,000.00 | $1,012.65 | $12.23 | 2.45% |
| | | | | |
| Needham Aggressive Growth Fund | | | | |
| Retail Class Actual Expenses | $1,000.00 | $1,063.30 | $16.49 | 3.17% |
| Retail Class Hypothetical Example | | | | |
| for Comparison Purposes | | | | |
| (5% return before expenses) | $1,000.00 | $1,009.23 | $16.05 | 3.17% |
| Institutional Class Actual Expenses | $1,000.00 | $1,066.40 | $13.65 | 2.62% |
| Institutional Class Hypothetical | | | | |
| Example for Comparison Purposes | | | | |
| (5% return before expenses) | $1,000.00 | $1,012.00 | $13.29 | 2.62% |
| | | | | |
| Needham Small Cap Growth Fund | | | | |
| Retail Class Actual Expenses | $1,000.00 | $1,048.50 | $10.07 | 1.95% |
| Retail Class Hypothetical Example | | | | |
| for Comparison Purposes | | | | |
| (5% return before expenses) | $1,000.00 | $1,015.38 | $9.91 | 1.95% |
| Institutional Class Actual Expenses | $1,000.00 | $1,051.40 | $7.24 | 1.40% |
| Institutional Class Hypothetical | | | | |
| Example for Comparison Purposes | | | | |
| (5% return before expenses) | $1,000.00 | $1,018.15 | $7.12 | 1.40% |
| * | Expenses are equal to the average account value times the Portfolio’s annualized expense ratio multiplied 181/365 (to reflect the one-half-year period). |
Needham Funds
Needham Growth Fund
Schedule of Investments
June 30, 2018 (Unaudited)
| (Percentage of Net Assets) | | Shares | | | Value | |
| | | | | | | |
| Common Stocks (99.9%) | | | | | | |
| | | | | | | |
| Auto Components (0.1%) | | | | | | |
| Sypris Solutions, Inc.* | | | 31,332 | | | $ | 51,384 | |
| | | | | | | | | |
| Biotechnology (5.9%) | | | | | | | | |
| Gilead Sciences, Inc.† | | | 87,500 | | | | 6,198,500 | |
| | | | | | | | | |
| Capital Markets (0.8%) | | | | | | | | |
| Oaktree Capital Group LLC, Class A | | | 20,000 | | | | 813,000 | |
| | | | | | | | | |
| Commercial Services & Supplies (0.1%) | | | | | | | | |
| Brightview Holdings, Inc.* | | | 276 | | | | 6,058 | |
| Clean Harbors, Inc.* | | | 2,000 | | | | 111,100 | |
| | | | | | | | 117,158 | |
| | | | | | | | | |
| Communications Equipment (11.5%) | | | | | | | | |
| KVH Industries, Inc.* | | | 520,000 | | | | 6,968,000 | |
| ViaSat, Inc.*† | | | 80,000 | | | | 5,257,600 | |
| | | | | | | | 12,225,600 | |
| | | | | | | | | |
| Electrical Equipment (0.7%) | | | | | | | | |
| Vicor Corp.* | | | 17,500 | | | | 762,125 | |
| | | | | | | | | |
| Electronic Equipment, Instruments & Components (5.2%) | | | | | | | | |
| Corning, Inc. | | | 35,000 | | | | 962,850 | |
| FLIR Systems, Inc. | | | 8,500 | | | | 441,745 | |
| Frequency Electronics, Inc.* | | | 50,000 | | | | 403,000 | |
| IPG Photonics Corp.* | | | 6,000 | | | | 1,323,780 | |
| National Instruments Corp. | | | 20,800 | | | | 873,184 | |
| nLight, Inc.* | | | 3,000 | | | | 99,180 | |
| Vishay Intertechnology, Inc. | | | 60,000 | | | | 1,392,000 | |
| | | | | | | | 5,495,739 | |
| | | | | | | | | |
| Energy Equipment & Services (1.1%) | | | | | | | | |
| Aspen Aerogels, Inc.* | | | 165,825 | | | | 812,543 | |
| Core Laboratories NV (Netherlands) | | | 500 | | | | 63,105 | |
| Schlumberger Ltd. (Netherlands) | | | 5,000 | | | | 335,150 | |
| | | | | | | | 1,210,798 | |
| Health Care Equipment & Supplies (8.8%) | | | | | | | | |
| Becton Dickinson and Co. | | | 22,500 | | | | 5,390,100 | |
| CryoPort, Inc.* | | | 62,500 | | | | 986,250 | |
See accompanying notes to financial statements.
Semi-Annual Report 2018
Needham Growth Fund
Schedule of Investments (Continued)
June 30, 2018 (Unaudited)
| | | Shares | | | Value | |
| | | | | | | |
| Common Stocks – Continued | | | | | | |
| | | | | | | |
| Health Care Equipment & Supplies – Continued | | | | | | |
| GenMark Diagnostics, Inc.* | | | 30,000 | | | $ | 191,400 | |
| Invuity, Inc.* | | | 215,000 | | | | 838,500 | |
| Medtronic PLC (Ireland) | | | 22,500 | | | | 1,926,225 | |
| | | | | | | | 9,332,475 | |
| | | | | | | | | |
| Health Care Providers & Services (0.1%) | | | | | | | | |
| CVS Health Corp. | | | 1,500 | | | | 96,525 | |
| | | | | | | | | |
| Household Durables (0.1%) | | | | | | | | |
| Roku, Inc., Class A* | | | 3,000 | | | | 127,860 | |
| | | | | | | | | |
| Household Products (0.7%) | | | | | | | | |
| Oil-Dri Corp. of America | | | 18,500 | | | | 779,590 | |
| | | | | | | | | |
| Industrial Conglomerates (0.3%) | | | | | | | | |
| Honeywell International, Inc. | | | 2,500 | | | | 360,125 | |
| | | | | | | | | |
| Insurance (0.2%) | | | | | | | | |
| Markel Corp.* | | | 150 | | | | 162,653 | |
| | | | | | | | | |
| Internet Software & Services (11.9%) | | | | | | | | |
| The Trade Desk, Inc., Class A* | | | 10,000 | | | | 938,000 | |
| 2U, Inc.* | | | 4,000 | | | | 334,240 | |
| Akamai Technologies, Inc.*† | | | 36,500 | | | | 2,672,895 | |
| Amber Road, Inc.* | | | 450,000 | | | | 4,234,500 | |
| comScore, Inc.* | | | 50,500 | | | | 1,100,900 | |
| Coupa Software, Inc.* | | | 5,500 | | | | 342,320 | |
| NIC, Inc. | | | 1,500 | | | | 23,325 | |
| Q2 Holdings, Inc.* | | | 20,000 | | | | 1,141,000 | |
| Reis, Inc. | | | 82,500 | | | | 1,798,500 | |
| | | | | | | | 12,585,680 | |
| | | | | | | | | |
| Life Sciences Tools & Services (8.4%) | | | | | | | | |
| Bruker Corp. | | | 7,000 | | | | 203,280 | |
| Thermo Fisher Scientific, Inc.† | | | 42,000 | | | | 8,699,880 | |
| | | | | | | | 8,903,160 | |
| | | | | | | | | |
| Media (4.2%) | | | | | | | | |
| Comcast Corp., Class A | | | 115,000 | | | | 3,773,150 | |
See accompanying notes to financial statements.
Needham Funds
Needham Growth Fund
Schedule of Investments (Continued)
June 30, 2018 (Unaudited)
| | | Shares | | | Value | |
| | | | | | | |
| Common Stocks – Continued | | | | | | |
| | | | | | | |
| Media – Continued | | | | | | |
| World Wrestling Entertainment, Inc., Class A | | | 9,500 | | | $ | 691,790 | |
| | | | | | | | 4,464,940 | |
| | | | | | | | | |
| Oil, Gas & Consumable Fuels (0.5%) | | | | | | | | |
| Hess Corp. | | | 7,500 | | | | 501,675 | |
| Navigator Holdings Ltd.* | | | 5,000 | | | | 63,250 | |
| | | | | | | | 564,925 | |
| | | | | | | | | |
| Pharmaceuticals (0.6%) | | | | | | | | |
| Agile Therapeutics, Inc.* | | | 100,000 | | | | 49,400 | |
| Corium International, Inc.* | | | 75,000 | | | | 600,750 | |
| | | | | | | | 650,150 | |
| | | | | | | | | |
| Professional Services (1.1%) | | | | | | | | |
| WageWorks, Inc.* | | | 22,500 | | | | 1,125,000 | |
| | | | | | | | | |
| Real Estate Management & Development (0.1%) | | | | | | | | |
| Redfin Corp.* | | | 2,993 | | | | 69,108 | |
| | | | | | | | | |
| Semiconductors & Semiconductor Equipment (19.5%) | | | | | | | | |
| Applied Materials, Inc. | | | 7,500 | | | | 346,425 | |
| Aquantia Corp.* | | | 38,500 | | | | 445,830 | |
| Entegris, Inc. | | | 143,500 | | | | 4,864,650 | |
| FormFactor, Inc.* | | | 345,000 | | | | 4,588,500 | |
| Lam Research Corp. | | | 2,500 | | | | 432,125 | |
| MKS Instruments, Inc. | | | 25,000 | | | | 2,392,500 | |
| Nova Measuring Instruments Ltd. (Israel)* | | | 58,500 | | | | 1,594,125 | |
| PDF Solutions, Inc.* | | | 392,150 | | | | 4,697,957 | |
| Photronics, Inc.* | | | 162,500 | | | | 1,295,938 | |
| | | | | | | | 20,658,050 | |
| | | | | | | | | |
| Software (2.9%) | | | | | | | | |
| Altair Engineering, Inc., Class A* | | | 2,996 | | | | 102,403 | |
| Appian Corp., Class A* | | | 10,000 | | | | 361,600 | |
| Carbon Black, Inc.* | | | 1,387 | | | | 36,062 | |
| Everbridge, Inc.* | | | 6,500 | | | | 308,230 | |
| Pluralsight, Inc.* | | | 6,000 | | | | 146,700 | |
| Red Hat, Inc.* | | | 9,000 | | | | 1,209,330 | |
See accompanying notes to financial statements.
Semi-Annual Report 2018
Needham Growth Fund
Schedule of Investments (Continued)
June 30, 2018 (Unaudited)
| | | Shares | | | Value | |
| | | | | | | |
| Common Stocks – Continued | | | | | | |
| | | | | | | |
| Software – Continued | | | | | | |
| Zuora, Inc.* | | | 33,700 | | | $ | 916,640 | |
| | | | | | | | 3,080,965 | |
| | | | | | | | | |
| Specialty Retail (6.0%) | | | | | | | | |
| CarMax, Inc.*† | | | 87,500 | | | | 6,376,125 | |
| | | | | | | | | |
| Technology Hardware, Storage & Peripherals (7.2%) | | | | | | | | |
| Apple, Inc. | | | 2,700 | | | | 499,797 | |
| Electronics For Imaging, Inc.* | | | 66,500 | | | | 2,165,240 | |
| Super Micro Computer, Inc.* | | | 210,000 | | | | 4,966,500 | |
| | | | | | | | 7,631,537 | |
| | | | | | | | | |
| Trading Companies & Distributors (1.9%) | | | | | | | | |
| Air Lease Corp., Class A | | | 47,500 | | | | 1,993,575 | |
| | | | | | | | | |
| Total Common Stocks | | | | | | | | |
| (Cost $46,609,485) | | | | | | $ | 105,836,747 | |
| | | | | | | | | |
| Short-Term Investments (0.2%) | | | | | | | | |
| | | | | | | | | |
| Money Market Fund (0.2%) | | | | | | | | |
| Dreyfus Treasury Securities Cash Management – | | | | | | | | |
| Institutional Class 1.68% (a) | | | | | | | | |
| (Cost $239,978) | | | 239,978 | | | $ | 239,978 | |
| | | | | | | | | |
| Total Investments (100.1%) | | | | | | | | |
| (Cost $46,849,463) | | | | | | | 106,076,725 | |
| Total Securities Sold Short (-5.5%) | | | | | | | (5,848,625 | ) |
| (Proceeds $2,401,128) | | | | | | | | |
| Other Assets in Excess of Liabilities (5.4%) | | | | | | | 5,741,105 | |
| Net Assets (100.0%) | | | | | | $ | 105,969,205 | |
| * | Non-income producing security. |
| (a) | Rate shown is the seven-day yield as of June 30, 2018. |
| † | Security position is either entirely or partially held in a segregated account as collateral for securities sold short, aggregating a total market value of $6,225,215. |
| | |
| | The Global Industry Classification Standard (GICS®) was developed by and/or is the exclusive property of MSCI, Inc. and Standard & Poor’s Financial Services LLC (“S&P”). GICS is a service mark of MSCI and S&P and has been licensed for use by U.S. Bancorp Fund Services, LLC |
See accompanying notes to financial statements.
Needham Funds
Needham Growth Fund
Schedule of Securities Sold Short
June 30, 2018 (Unaudited)
| | | Shares | | | Value | |
| | | | | | | |
| Securities Sold Short (-5.5%) | | | | | | |
| | | | | | | |
| Communications Equipment (-4.0%) | | | | | | |
| Ubiquiti Networks, Inc.* | | | 50,000 | | | $ | 4,236,000 | |
| | | | | | | | | |
| Consumer Finance (-1.3%) | | | | | | | | |
| Medallion Financial Corp.* | | | 250,000 | | | | 1,370,000 | |
| | | | | | | | | |
| Insurance (-0.2%) | | | | | | | | |
| Health Insurance Innovations, Inc., Class A* | | | 7,500 | | | | 242,625 | |
| | | | | | | | | |
| Total Securities Sold Short (-5.5%) | | | | | | | | |
| (Proceeds $2,401,128) | | | | | | $ | 5,848,625 | |
| * | Non-income producing security. |
See accompanying notes to financial statements.
Semi-Annual Report 2018
Needham Aggressive Growth Fund
Schedule of Investments
June 30, 2018 (Unaudited)
| (Percentage of Net Assets) | | Shares | | | Value | |
| | | | | | | |
| Common Stocks (100.0%) | | | | | | |
| | | | | | | |
| Biotechnology (1.1%) | | | | | | |
| Gilead Sciences, Inc.† | | | 9,500 | | | $ | 672,980 | |
| | | | | | | | | |
| Building Products (1.9%) | | | | | | | | |
| Alpha Pro Tech Ltd.* | | | 20,637 | | | | 69,134 | |
| DIRTT Environmental Solutions (Canada)* | | | 207,500 | | | | 1,037,500 | |
| | | | | | | | 1,106,634 | |
| | | | | | | | | |
| Commercial Services & Supplies (0.7%) | | | | | | | | |
| Brightview Holdings, Inc.* | | | 153 | | | | 3,358 | |
| Ecology and Environment, Inc., Class A | | | 31,000 | | | | 385,950 | |
| | | | | | | | 389,308 | |
| Communications Equipment (10.3%) | | | | | | | | |
| KVH Industries, Inc.*† | | | 369,400 | | | | 4,949,960 | |
| ViaSat, Inc.*† | | | 17,000 | | | | 1,117,240 | |
| | | | | | | | 6,067,200 | |
| | | | | | | | | |
| Electrical Equipment (4.2%) | | | | | | | | |
| Vicor Corp.* | | | 56,227 | | | | 2,448,686 | |
| | | | | | | | | |
| Electronic Equipment, Instruments & Components (4.1%) | | | | | | | | |
| Frequency Electronics, Inc.* | | | 17,793 | | | | 143,412 | |
| IPG Photonics Corp.* | | | 7,000 | | | | 1,544,410 | |
| National Instruments Corp. | | | 9,000 | | | | 377,820 | |
| nLight, Inc.* | | | 1,523 | | | | 50,350 | |
| Vishay Precision Group, Inc.* | | | 8,000 | | | | 305,200 | |
| | | | | | | | 2,421,192 | |
| | | | | | | | | |
| Energy Equipment & Services (0.9%) | | | | | | | | |
| Aspen Aerogels, Inc.* | | | 104,175 | | | | 510,458 | |
| | | | | | | | | |
| Health Care Equipment & Supplies (3.8%) | | | | | | | | |
| Becton Dickinson and Co. | | | 2,000 | | | | 479,120 | |
| CryoPort, Inc.* | | | 52,500 | | | | 828,450 | |
| Invuity, Inc.* | | | 16,000 | | | | 62,400 | |
| LeMaitre Vascular, Inc. | | | 25,000 | | | | 837,000 | |
| | | | | | | | 2,206,970 | |
See accompanying notes to financial statements.
Needham Funds
Needham Aggressive Growth Fund
Schedule of Investments (Continued)
June 30, 2018 (Unaudited)
| | | Shares | | | Value | |
| | | | | | | |
| Common Stocks – Continued | | | | | | |
| | | | | | | |
| Health Care Technology (0.9%) | | | | | | |
| Omnicell, Inc.* | | | 10,000 | | | $ | 524,500 | |
| | | | | | | | | |
| Household Durables (0.1%) | | | | | | | | |
| iRobot Corp.* | | | 500 | | | | 37,885 | |
| Roku, Inc., Class A* | | | 500 | | | | 21,310 | |
| | | | | | | | 59,195 | |
| | | | | | | | | |
| Household Products (3.2%) | | | | | | | | |
| Oil-Dri Corp. of America | | | 44,100 | | | | 1,858,374 | |
| | | | | | | | | |
| Insurance (0.3%) | | | | | | | | |
| Markel Corp.* | | | 175 | | | | 189,761 | |
| | | | | | | | | |
| Internet Software & Services (14.0%) | | | | | | | | |
| The Trade Desk, Inc., Class A* | | | 5,000 | | | | 469,000 | |
| 2U, Inc.* | | | 2,000 | | | | 167,120 | |
| Akamai Technologies, Inc.*† | | | 28,000 | | | | 2,050,440 | |
| Amber Road, Inc.*† | | | 163,550 | | | | 1,539,006 | |
| comScore, Inc.* | | | 24,700 | | | | 538,460 | |
| Coupa Software, Inc.* | | | 2,500 | | | | 155,600 | |
| NIC, Inc. | | | 1,000 | | | | 15,550 | |
| Q2 Holdings, Inc.* | | | 12,000 | | | | 684,600 | |
| Reis, Inc.† | | | 120,200 | | | | 2,620,360 | |
| | | | | | | | 8,240,136 | |
| | | | | | | | | |
| Media (0.6%) | | | | | | | | |
| World Wrestling Entertainment, Inc., Class A | | | 4,500 | | | | 327,690 | |
| | | | | | | | | |
| Pharmaceuticals (0.0%) | | | | | | | | |
| Agile Therapeutics, Inc.* | | | 15,950 | | | | 7,879 | |
| | | | | | | | | |
| Professional Services (2.8%) | | | | | | | | |
| CRA International, Inc. | | | 5,000 | | | | 254,450 | |
| WageWorks, Inc.*† | | | 28,000 | | | | 1,400,000 | |
| | | | | | | | 1,654,450 | |
| | | | | | | | | |
| Real Estate Investment Trusts (REITs) (1.5%) | | | | | | | | |
| Equinix, Inc. | | | 2,000 | | | | 859,780 | |
See accompanying notes to financial statements.
Semi-Annual Report 2018
Needham Aggressive Growth Fund
Schedule of Investments (Continued)
June 30, 2018 (Unaudited)
| | | Shares | | | Value | |
| | | | | | | |
| Common Stocks – Continued | | | | | | |
| | | | | | | |
| Real Estate Management & Development (0.1%) | | | | | | |
| Redfin Corp.* | | | 1,637 | | | $ | 37,798 | |
| | | | | | | | | |
| Semiconductors & Semiconductor Equipment (27.7%) | | | | | | | | |
| Aquantia Corp.* | | | 6,000 | | | | 69,480 | |
| Entegris, Inc. | | | 157,000 | | | | 5,322,300 | |
| FormFactor, Inc.* | | | 170,000 | | | | 2,261,000 | |
| MKS Instruments, Inc. | | | 23,000 | | | | 2,201,100 | |
| Nova Measuring Instruments Ltd. (Israel)*† | | | 63,000 | | | | 1,716,750 | |
| PDF Solutions, Inc.*† | | | 327,500 | | | | 3,923,450 | |
| Photronics, Inc.* | | | 97,750 | | | | 779,556 | |
| | | | | | | | 16,273,636 | |
| Software (8.2%) | | | | | | | | |
| Altair Engineering, Inc., Class A* | | | 1,620 | | | | 55,372 | |
| Appian Corp., Class A* | | | 7,000 | | | | 253,120 | |
| Carbon Black, Inc.* | | | 777 | | | | 20,202 | |
| Everbridge, Inc.* | | | 4,500 | | | | 213,390 | |
| GSE Systems, Inc.* ^ | | | 1,120,000 | | | | 3,640,000 | |
| Pluralsight, Inc.* | | | 5,000 | | | | 122,250 | |
| Zuora, Inc.* | | | 19,300 | | | | 524,960 | |
| | | | | | | | 4,829,294 | |
| | | | | | | | | |
| Specialty Retail (2.5%) | | | | | | | | |
| CarMax, Inc.*† | | | 20,500 | | | | 1,493,835 | |
| | | | | | | | | |
| Technology Hardware, Storage & Peripherals (11.1%) | | | | | | | | |
| Apple, Inc.† | | | 20,750 | | | | 3,841,032 | |
| Electronics For Imaging, Inc.* | | | 17,500 | | | | 569,800 | |
| Super Micro Computer, Inc.*† | | | 88,350 | | | | 2,089,478 | |
| | | | | | | | 6,500,310 | |
| | | | | | | | | |
| Trading Companies & Distributors (0.0%) | | | | | | | | |
| Air Lease Corp., Class A | | | 500 | | | | 20,985 | |
| | | | | | | | | |
| Total Common Stocks | | | | | | | | |
| (Cost $25,401,310) | | | | | | $ | 58,701,051 | |
See accompanying notes to financial statements.
Needham Funds
Needham Aggressive Growth Fund
Schedule of Investments (Continued)
June 30, 2018 (Unaudited)
| | | Shares | | | Value | |
| | | | | | | |
| Short-Term Investments (0.4%) | | | | | | |
| | | | | | | |
| Money Market Fund (0.4%) | | | | | | |
| Dreyfus Treasury Securities Cash Management – | | | | | | |
| Institutional Class 1.68% (a) | | | | | | |
| (Cost $210,275) | | | 210,275 | | | $ | 210,275 | |
| | | | | | | | | |
| Total Investments (100.4%) | | | | | | | | |
| (Cost $25,611,585) | | | | | | | 58,911,326 | |
| Total Securities Sold Short (-6.6%) | | | | | | | (3,867,625 | ) |
| (Proceeds $1,991,651) | | | | | | | | |
| Other Assets in Excess of Liabilities (6.2%) | | | | | | | 3,626,969 | |
| Net Assets (100.0%) | | | | | | $ | 58,670,670 | |
| * | Non-income producing security. |
| (a) | Rate shown is the seven-day yield as of June 30, 2018. |
| † | Security position is either entirely or partially held in a segregated account as collateral for securities sold short, aggregating a total market value of $5,925,705. |
| | |
| | The Global Industry Classification Standard (GICS®) was developed by and/or is the exclusive property of MSCI, Inc. and Standard & Poor’s Financial Services LLC (“S&P”). GICS is a service mark of MSCI and S&P and has been licensed for use by U.S. Bancorp Fund Services, LLC. |
See accompanying notes to financial statements.
Semi-Annual Report 2018
Needham Aggressive Growth Fund
Schedule of Securities Sold Short
June 30, 2018 (Unaudited)
| | | Shares | | | Value | |
| | | | | | | |
| Securities Sold Short (-6.6%) | | | | | | |
| | | | | | | |
| Communications Equipment (-3.6%) | | | | | | |
| Ubiquiti Networks, Inc.* | | | 25,000 | | | $ | 2,118,000 | |
| | | | | | | | | |
| Consumer Finance (-2.6%) | | | | | | | | |
| Medallion Financial Corp.* | | | 275,000 | | | | 1,507,000 | |
| | | | | | | | | |
| Insurance (-0.4%) | | | | | | | | |
| Health Insurance Innovations, Inc., Class A* | | | 7,500 | | | | 242,625 | |
| | | | | | | | | |
| Total Securities Sold Short (-6.6%) | | | | | | | | |
| (Proceeds $1,991,651) | | | | | | $ | 3,867,625 | |
| * | Non-income producing security. |
See accompanying notes to financial statements.
Needham Funds
Needham Small Cap Growth Fund
Schedule of Investments
June 30, 2018 (Unaudited)
| (Percentage of Net Assets) | | Shares | | | Value | |
| | | | | | | |
| Common Stocks (85.2%) | | | | | | |
| | | | | | | |
| Airlines (1.1%) | | | | | | |
| Hawaiian Holdings, Inc. | | | 10,000 | | | $ | 359,500 | |
| | | | | | | | | |
| Biotechnology (0.1%) | | | | | | | | |
| Exact Sciences Corp.* | | | 500 | | | | 29,895 | |
| | | | | | | | | |
| Commercial Services & Supplies (0.0%) | | | | | | | | |
| Brightview Holdings, Inc.* | | | 84 | | | | 1,844 | |
| | | | | | | | | |
| Communications Equipment (7.7%) | | | | | | | | |
| EMCORE Corp.* | | | 195,000 | | | | 984,750 | |
| KVH Industries, Inc.*† | | | 72,500 | | | | 971,500 | |
| Quantenna Communications, Inc.* | | | 12,500 | | | | 194,250 | |
| ViaSat, Inc.* | | | 5,000 | | | | 328,600 | |
| | | | | | | | 2,479,100 | |
| | | | | | | | | |
| Electronic Equipment, Instruments & Components (7.6%) | | | | | | | | |
| Coherent, Inc.* | | | 3,500 | | | | 547,470 | |
| Frequency Electronics, Inc.* | | | 135,478 | | | | 1,091,953 | |
| II-VI, Inc.* | | | 2,000 | | | | 86,900 | |
| nLight, Inc.* | | | 2,500 | | | | 82,650 | |
| Vishay Precision Group, Inc.* | | | 17,000 | | | | 648,550 | |
| | | | | | | | 2,457,523 | |
| | | | | | | | | |
| Energy Equipment & Services (4.1%) | | | | | | | | |
| Aspen Aerogels, Inc.* | | | 273,800 | | | | 1,341,620 | |
| | | | | | | | | |
| Health Care Equipment & Supplies (8.0%) | | | | | | | | |
| CryoPort, Inc.* | | | 20,000 | | | | 315,600 | |
| GenMark Diagnostics, Inc.* | | | 100,000 | | | | 638,000 | |
| Invuity, Inc.* | | | 416,239 | | | | 1,623,332 | |
| | | | | | | | 2,576,932 | |
| | | | | | | | | |
| Health Care Technology (0.4%) | | | | | | | | |
| Castlight Health, Inc., Class B* | | | 30,000 | | | | 127,500 | |
| | | | | | | | | |
| Household Durables (0.3%) | | | | | | | | |
| Roku, Inc., Class A* | | | 2,000 | | | | 85,240 | |
| | | | | | | | | |
| Household Products (0.3%) | | | | | | | | |
| Oil-Dri Corp. of America | | | 2,500 | | | | 105,350 | |
See accompanying notes to financial statements.
Semi-Annual Report 2018
Needham Small Cap Growth Fund
Schedule of Investments (Continued)
June 30, 2018 (Unaudited)
| | | Shares | | | Value | |
| | | | | | | |
| Common Stocks – Continued | | | | | | |
| | | | | | | |
| Internet Software & Services (15.4%) | | | | | | |
| Amber Road, Inc.*† | | | 270,000 | | | $ | 2,540,700 | |
| comScore, Inc.* | | | 25,850 | | | | 563,530 | |
| Reis, Inc. | | | 65,000 | | | | 1,417,000 | |
| Twilio, Inc., Class A* | | | 8,000 | | | | 448,160 | |
| | | | | | | | 4,969,390 | |
| | | | | | | | | |
| Oil, Gas & Consumable Fuels (1.2%) | | | | | | | | |
| Hess Corp. | | | 2,250 | | | | 150,503 | |
| Navigator Holdings Ltd. (Marshall Islands)* | | | 19,000 | | | | 240,350 | |
| | | | | | | | 390,853 | |
| | | | | | | | | |
| Pharmaceuticals (1.7%) | | | | | | | | |
| Agile Therapeutics, Inc.* | | | 130,375 | | | | 64,405 | |
| Corium International, Inc.* | | | 60,000 | | | | 480,600 | |
| | | | | | | | 545,005 | |
| | | | | | | | | |
| Real Estate Management & Development (0.2%) | | | | | | | | |
| Redfin Corp.* | | | 2,500 | | | | 57,725 | |
| | | | | | | | | |
| Semiconductors & Semiconductor Equipment (19.5%) | | | | | | | | |
| Advanced Energy Industries, Inc.* | | | 5,000 | | | | 290,450 | |
| Aquantia Corp.* | | | 37,000 | | | | 428,460 | |
| FormFactor, Inc.* | | | 10,000 | | | | 133,000 | |
| Ichor Holdings Ltd. (Cayman Islands)* | | | 10,000 | | | | 212,200 | |
| MACOM Technology Solutions Holdings, Inc.* | | | 10,000 | | | | 230,400 | |
| NeoPhotonics Corp.* | | | 195,000 | | | | 1,214,850 | |
| PDF Solutions, Inc.*† | | | 107,850 | | | | 1,292,043 | |
| Photronics, Inc.* | | | 250,000 | | | | 1,993,750 | |
| Ultra Clean Holdings, Inc.* | | | 30,000 | | | | 498,000 | |
| | | | | | | | 6,293,153 | |
| | | | | | | | | |
| Software (6.6%) | | | | | | | | |
| Altair Engineering, Inc., Class A* | | | 752 | | | | 25,703 | |
| Appian Corp., Class A* | | | 3,000 | | | | 108,480 | |
| Carbon Black, Inc.* | | | 430 | | | | 11,180 | |
| FireEye, Inc.* | | | 55,000 | | | | 846,450 | |
| Pluralsight, Inc.* | | | 3,000 | | | | 73,350 | |
| Zscaler, Inc.* | | | 20,000 | | | | 715,000 | |
See accompanying notes to financial statements.
Needham Funds
Needham Small Cap Growth Fund
Schedule of Investments (Continued)
June 30, 2018 (Unaudited)
| | | Shares | | | Value | |
| | | | | | | |
| Common Stocks – Continued | | | | | | |
| | | | | | | |
| Software – Continued | | | | | | |
| Zuora, Inc.* | | | 12,500 | | | $ | 340,000 | |
| | | | | | | | 2,120,163 | |
| | | | | | | | | |
| Technology Hardware, Storage & Peripherals (9.2%) | | | | | | | | |
| Electronics For Imaging, Inc.* | | | 35,000 | | | | 1,139,600 | |
| Super Micro Computer, Inc.*† | | | 76,650 | | | | 1,812,773 | |
| | | | | | | | 2,952,373 | |
| | | | | | | | | |
| Thrifts & Mortgage Finance (0.3%) | | | | | | | | |
| LendingTree, Inc.* | | | 500 | | | | 106,900 | |
| | | | | | | | | |
| Trading Companies & Distributors (1.5%) | | | | | | | | |
| Air Lease Corp., Class A† | | | 11,250 | | | | 472,162 | |
| | | | | | | | | |
| Total Common Stocks | | | | | | | | |
| (Cost $24,341,819) | | | | | | $ | 27,472,228 | |
| | | | | | | | | |
| Closed-End Funds (3.9%) | | | | | | | | |
| Tekla Healthcare Investors | | | 29,000 | | | | 623,500 | |
| Tekla Life Sciences Investors | | | 34,500 | | | | 648,255 | |
| | | | | | | | | |
| Total Closed-End Funds | | | | | | | | |
| (Cost $1,351,566) | | | | | | $ | 1,271,755 | |
| | | | | | | | | |
| Short-Term Investments (13.2%) | | | | | | | | |
| | | | | | | | | |
| Money Market Fund (13.2%) | | | | | | | | |
| Dreyfus Treasury Securities Cash Management – | | | | | | | | |
| Institutional Class 1.68% (a) | | | | | | | | |
| (Cost $4,264,110) | | | 4,264,110 | | | | 4,264,110 | |
| | | | | | | | | |
| Total Investments (102.3%) | | | | | | | | |
| (Cost $29,957,495) | | | | | | | 33,008,093 | |
| Liabilities in Excess of Other Assets (-2.3%) | | | | | | | (743,222 | ) |
| Net Assets (100.0%) | | | | | | $ | 32,264,871 | |
| * | Non-income producing security. |
| (a) | Rate shown is the seven-day yield as of June 30, 2018. |
| † | Security position is either entirely or partially held in a segregated account as collateral for securities sold short, aggregating a total market value of $1,094,375. |
| | |
| | The Global Industry Classification Standard (GICS®) was developed by and/or is the exclusive property of MSCI, Inc. and Standard & Poor’s Financial Services LLC (“S&P”). GICS is a service mark of MSCI and S&P and has been licensed for use by U.S. Bancorp Fund Services, LLC. |
See accompanying notes to financial statements.
Semi-Annual Report 2018
(This Page Intentionally Left Blank.)
Needham Funds
Statements of Assets and Liabilities
June 30, 2018 (Unaudited)
| | | | | | Needham | | | Needham | |
| | | Needham | | | Aggressive | | | Small Cap | |
| | | Growth Fund | | | Growth Fund | | | Growth Fund | |
| Assets | | | | | | | | | |
| Investments, at value: | | | | | | | | | |
| Unaffiliated securities, (Cost $46,849,463, | | | | | | | | | |
| $23,332,467, $29,957,495) | | $ | 106,076,725 | | | $ | 55,271,326 | | | $ | 33,008,093 | |
| Affiliated securities (Cost $—, $2,279,118, $—) | | | — | | | | 3,640,000 | | | | — | |
| Cash | | | — | | | | — | | | | 27,430 | |
| Receivables: | | | | | | | | | | | | |
| Deposit with Broker for Securities Sold Short | | | 6,028,050 | | | | 3,933,501 | | | | 26 | |
| Dividends and Interest | | | 15,278 | | | | 127 | | | | 8,935 | |
| Fund Shares Sold | | | 1,004 | | | | 22,970 | | | | 42 | |
| Investment Securities Sold | | | 41,840 | | | | 23,257 | | | | 9,786 | |
| Prepaid Expenses | | | 30,621 | | | | 21,249 | | | | 24,873 | |
| Total Assets | | | 112,193,518 | | | | 62,912,430 | | | | 33,079,185 | |
| | | | | | | | | | | | | |
| Liabilities | | | | | | | | | | | | |
| Securities Sold Short, at Value | | | | | | | | | | | | |
| (Proceeds $2,401,128, $1,991,651, $—) | | | 5,848,625 | | | | 3,867,625 | | | | — | |
| Payables: | | | | | | | | | | | | |
| Investment Securities Purchased | | | 90,327 | | | | 19,452 | | | | 730,351 | |
| Fund Shares Redeemed | | | 71,583 | | | | 227,282 | | | | 19,261 | |
| Due to Adviser | | | 104,306 | | | | 54,851 | | | | 26,936 | |
| Distribution Fees | | | 15,651 | | | | 8,465 | | | | 4,240 | |
| Administration and Accounting Fees | | | 23,089 | | | | 11,199 | | | | 6,818 | |
| Transfer Agent Fees | | | 9,695 | | | | 8,528 | | | | 6,024 | |
| Accrued Expenses and Other Liabilities | | | 61,037 | | | | 44,358 | | | | 20,684 | |
| Total Liabilities | | | 6,224,313 | | | | 4,241,760 | | | | 814,314 | |
| Total Net Assets | | $ | 105,969,205 | | | $ | 58,670,670 | | | $ | 32,264,871 | |
See accompanying notes to financial statements.
Semi-Annual Report 2018
Statements of Assets and Liabilities (Continued)
June 30, 2018 (Unaudited)
| | | | | | Needham | | | Needham | |
| | | Needham | | | Aggressive | | | Small Cap | |
| | | Growth Fund | | | Growth Fund | | | Growth Fund | |
| Retail Class Shares | | | | | | | | | |
| Net Assets | | $ | 69,731,872 | | | $ | 38,674,268 | | | $ | 19,073,438 | |
| Shares Issued and Outstanding | | | | | | | | | | | | |
| $0.001 Par Value (Authorized | | | | | | | | | | | | |
| 800,000,000,100,000,000 and | | | | | | | | | | | | |
| 100,000,000 respectively) | | | 1,570,134 | | | | 1,576,528 | | | | 1,160,436 | |
| Net Asset Value and | | | | | | | | | | | | |
| Offering Price Per Share | | $ | 44.41 | | | $ | 24.53 | | | $ | 16.44 | |
| | | | | | | | | | | | | |
| Institutional Class Shares | | | | | | | | | | | | |
| Net Assets | | $ | 36,237,333 | | | $ | 19,996,402 | | | $ | 13,191,433 | |
| Shares Issued and Outstanding | | | | | | | | | | | | |
| $0.001 Par Value (Authorized | | | | | | | | | | | | |
| 800,000,000,100,000,000 and | | | | | | | | | | | | |
| 100,000,000 respectively) | | | 809,506 | | | | 807,969 | | | | 795,929 | |
| Net Asset Value and | | | | | | | | | | | | |
| Offering Price Per Share | | $ | 44.76 | | | $ | 24.75 | | | $ | 16.57 | |
| | | | | | | | | | | | | |
| Components of Net Assets | | | | | | | | | | | | |
| Paid-in Capital | | $ | 36,020,049 | | | $ | 23,445,901 | | | $ | 26,747,982 | |
| Accumulated Net Investment Loss | | | (1,147,806 | ) | | | (706,853 | ) | | | (151,651 | ) |
| Accumulated Net Realized Gain from | | | | | | | | | | | | |
| Investments, Securities Sold Short, | | | | | | | | | | | | |
| Foreign Currency Transactions and Currency | | | 15,317,197 | | | | 4,507,855 | | | | 2,617,942 | |
| Net Unrealized Appreciation on | | | | | | | | | | | | |
| Investment Securities and | | | | | | | | | | | | |
| Securities Sold Short | | | 55,779,765 | | | | 31,423,767 | | | | 3,050,598 | |
| Total Net Assets | | $ | 105,969,205 | | | $ | 58,670,670 | | | $ | 32,264,871 | |
See accompanying notes to financial statements.
Needham Funds
Statements of Operations
For the six months ended June 30, 2018 (Unaudited)
| | | | | | Needham | | | Needham | |
| | | Needham | | | Aggressive | | | Small Cap | |
| | | Growth Fund | | | Growth Fund | | | Growth Fund | |
| Investment Income | | | | | | | | | |
| Dividend Income from unaffiliated securities (net of | | | | | | | | | |
| foreign withholding tax of $83, $0, $0) | | $ | 348,766 | | | $ | 171,667 | | | $ | 85,923 | |
| Interest | | | 3,428 | | | | 1,061 | | | | 36,508 | |
| Total Investment Income | | | 352,194 | | | | 172,728 | | | | 122,431 | |
| | | | | | | | | | | | | |
| Expenses | | | | | | | | | | | | |
| Investment Advisory Fees | | | 670,439 | | | | 368,450 | | | | 196,729 | |
| Distribution Fees | | | 93,262 | | | | 49,107 | | | | 24,429 | |
| Administration and Accounting Fees | | | 66,425 | | | | 40,509 | | | | 23,490 | |
| Audit Fees | | | 19,816 | | | | 14,132 | | | | 14,133 | |
| Chief Compliance Officer Fees | | | 10,122 | | | | 5,495 | | | | 2,921 | |
| Custodian Fees | | | 5,037 | | | | 5,514 | | | | 3,407 | |
| Directors’ Fees | | | 9,502 | | | | 4,990 | | | | 2,559 | |
| Filing Fees | | | 22,819 | | | | 23,181 | | | | 22,158 | |
Interest Expense(1) | | | 563,426 | | | | 358,882 | | | | — | |
| Legal Fees | | | 31,461 | | | | 19,788 | | | | 8,966 | |
| Printing Fees | | | 5,436 | | | | 3,342 | | | | 2,273 | |
| Transfer Agent Fees | | | 28,008 | | | | 26,038 | | | | 18,368 | |
| Other Expenses | | | 16,600 | | | | 9,246 | | | | 4,771 | |
| Total Expenses | | | 1,542,353 | | | | 928,674 | | | | 324,204 | |
| Fees Waived by Investment Adviser | | | (42,353 | ) | | | (49,093 | ) | | | (50,122 | ) |
| Net Expenses | | | 1,500,000 | | | | 879,581 | | | | 274,082 | |
| Net Investment Loss | | | (1,147,806 | ) | | | (706,853 | ) | | | (151,651 | ) |
| | | | | | | | | | | | | |
| Net Realized / Unrealized Gain (Loss) from Affiliated | | | | | | | | | | | | |
| and Unaffiliated Securities, Securities Sold Short, | | | | | | | | | | | | |
| Foreign Currency Transactions and Currency | | | | | | | | | | | | |
| Net Realized Gain from Unaffiliated Securities | | | 6,901,715 | | | | 5,130,663 | | | | 2,558,513 | |
| Net Realized Loss from Securities Sold Short | | | (564,896 | ) | | | (604,264 | ) | | | (47,060 | ) |
| Change in Unrealized Depreciation on | | | | | | | | | | | | |
| Unaffiliated Securities and Securities Sold Short | | | (1,336,775 | ) | | | (197,244 | ) | | | (823,378 | ) |
| Net Realized / Unrealized Gain from Affiliated and | | | | | | | | | | | | |
| Unaffiliated Securities, Securities Sold Short, | | | | | | | | | | | | |
| Foreign Currency Transactions and Currency | | | 5,000,044 | | | | 4,329,155 | | | | 1,688,075 | |
| Change in Net Assets Resulting from Operations | | $ | 3,852,238 | | | $ | 3,622,302 | | | $ | 1,536,424 | |
(1) | Expense related to securities sold short. |
See accompanying notes to financial statements.
Semi-Annual Report 2018
Needham Growth Fund
Statements of Changes in Net Assets
| | | Six Months Ended | | | | |
| | | June 30, 2018 | | | Year Ended | |
| | | (Unaudited) | | | December 31, 2017 | |
| Change in Net Assets | | | | | | |
| Operations: | | | | | | |
| Net Investment Loss | | $ | (1,147,806 | ) | | $ | (1,887,080 | ) |
| Net Realized Gain from Securities, Securities Sold Short, | | | | | | | | |
| Foreign Currency Transactions, and Currency | | | 6,336,819 | | �� | | 19,118,249 | |
| Net Change in Unrealized Appreciation (Depreciation) on Investments, | | | | | | | | |
| Securities Sold Short, Foreign Currency Transactions and Currency | | | (1,336,775 | ) | | | (7,518,528 | ) |
| Change in Net Assets Resulting from Operations | | | 3,852,238 | | | | 9,712,641 | |
| | | | | | | | | |
| Distributions to Shareholders from: | | | | | | | | |
| Net Investment Income | | | — | | | | — | |
| Capital Gains | | | — | | | | (10,480,369 | ) |
| Total Distributions to Shareholders | | | — | | | | (10,480,369 | ) |
| | | | | | | | | |
| Capital Transactions: | | | | | | | | |
| Retail Class: | | | | | | | | |
| Shares Issued | | | 482,239 | | | | 3,536,898 | |
| Shares Issued in Reinvestment of Distribution | | | — | | | | 6,546,656 | |
| Shares Exchanged for Institutional Class Shares | | | (3,569,598 | ) | | | (34,786,282 | ) |
| Shares Redeemed | | | (7,923,450 | ) | | | (17,205,930 | ) |
| Redemption Fees | | | — | | | | 137 | |
| Institutional Class: | | | | | | | | |
| Shares Issued | | | 377,313 | | | | 7,117,796 | |
| Shares Issued in Reinvestment of Distribution | | | — | | | | 2,871,221 | |
| Shares Issued in Exchange for Retail Class Shares | | | 3,569,599 | | | | 34,786,282 | |
| Shares Redeemed | | | (1,308,979 | ) | | | (11,643,231 | ) |
| Redemption Fees | | | — | | | | — | |
| Total Change in Net Assets from Capital Transactions | | | (8,372,876 | ) | | | (8,776,453 | ) |
| | | | | | | | | |
| Change in Net Assets | | | (4,520,638 | ) | | | (9,544,181 | ) |
| | | | | | | | | |
| Total Net Assets | | | | | | | | |
| Beginning of Period/Year | | | 110,489,843 | | | | 120,034,024 | |
| End of Period/Year | | $ | 105,969,205 | | | $ | 110,489,843 | |
| Accumulated Net Investment Loss | | $ | (1,147,806 | ) | | $ | — | |
| | | | | | | | | |
| Share Transaction: | | | | | | | | |
| Retail Class: | | | | | | | | |
| Number of Shares Issued | | | 10,807 | | | | 78,824 | |
| Number of Shares Reinvested | | | — | | | | 150,428 | |
| Number of Shares Exchanged for Institutional Class Shares | | | (78,750 | ) | | | (794,070 | ) |
| Number of Shares Redeemed | | | (179,937 | ) | | | (379,993 | ) |
| Institutional Class: | | | | | | | | |
| Number of Shares Issued | | | 8,606 | | | | 154,738 | |
| Number of Shares Reinvested | | | — | | | | 65,673 | |
| Number of Shares Issued in Exchange for Retail Class Shares | | | 78,130 | | | | 793,772 | |
| Number of Shares Redeemed | | | (29,928 | ) | | | (264,191 | ) |
| Total Change in Shares | | | (191,072 | ) | | | (194,819 | ) |
See accompanying notes to financial statements.
Needham Funds
Needham Aggressive Growth Fund
Statements of Changes in Net Assets
| | | Six Months Ended | | | | |
| | | June 30, 2018 | | | Year Ended | |
| | | (Unaudited) | | | December 31, 2017 | |
| Change in Net Assets | | | | | | |
| Operations: | | | | | | |
| Net Investment Loss | | $ | (706,853 | ) | | $ | (1,270,987 | ) |
| Net Realized Gain from Securities, Securities Sold Short, | | | | | | | | |
| Foreign Currency Transactions, and Currency | | | 4,526,399 | | | | 4,441,738 | |
| Net Change in Unrealized Appreciation (Depreciation) on Investments, | | | | | | | | |
| Securities Sold Short, Foreign Currency Transactions and Currency | | | (197,244 | ) | | | 2,260,616 | |
| Change in Net Assets Resulting from Operations | | | 3,622,302 | | | | 5,431,367 | |
| | | | | | | | | |
| Distributions to Shareholders from: | | | | | | | | |
| Net Investment Income | | | — | | | | — | |
| Capital Gains | | | — | | | | (3,108,250 | ) |
| Total Distributions to Shareholders | | | — | | | | (3,108,250 | ) |
| | | | | | | | | |
| Capital Transactions: | | | | | | | | |
| Retail Class: | | | | | | | | |
| Shares Issued | | | 971,960 | | | | 9,199,681 | |
| Shares Issued in Reinvestment of Distribution | | | — | | | | 2,077,588 | |
| Shares Exchanged for Institutional Class Shares | | | (653,727 | ) | | | (15,691,618 | ) |
| Shares Redeemed | | | (5,128,798 | ) | | | (14,977,523 | ) |
| Redemption Fees | | | — | | | | 3,821 | |
| Institutional Class: | | | | | | | | |
| Shares Issued | | | 1,895,441 | | | | 4,358,525 | |
| Shares Issued in Reinvestment of Distribution | | | — | | | | 962,266 | |
| Shares Issued in Exchange for Retail Class Shares | | | 653,727 | | | | 15,691,618 | |
| Shares Redeemed | | | (4,237,947 | ) | | | (1,257,528 | ) |
| Redemption Fees | | | — | | | | 161 | |
| Total Change in Net Assets from Capital Transactions | | | (6,499,344 | ) | | | 366,991 | |
| | | | | | | | | |
| Change in Net Assets | | | (2,877,042 | ) | | | 2,690,108 | |
| | | | | | | | | |
| Total Net Assets | | | | | | | | |
| Beginning of Period/Year | | | 61,547,712 | | | | 58,857,604 | |
| End of Period/Year | | $ | 58,670,670 | | | $ | 61,547,712 | |
| Accumulated Net Investment Loss | | $ | (706,853 | ) | | $ | — | |
| | | | | | | | | |
| Share Transaction: | | | | | | | | |
| Retail Class: | | | | | | | | |
| Number of Shares Issued | | | 41,148 | | | | 405,217 | |
| Number of Shares Reinvested | | | — | | | | 87,996 | |
| Number of Shares Exchanged for Institutional Class Shares | | | (26,306 | ) | | | (696,926 | ) |
| Number of Shares Redeemed | | | (219,865 | ) | | | (648,415 | ) |
| Institutional Class: | | | | | | | | |
| Number of Shares Issued | | | 79,328 | | | | 189,553 | |
| Number of Shares Reinvested | | | — | | | | 40,551 | |
| Number of Shares Issued in Exchange for Retail Class Shares | | | 26,082 | | | | 696,049 | |
| Number of Shares Redeemed | | | (177,953 | ) | | | (52,911 | ) |
| Total Change in Shares | | | (277,566 | ) | | | 21,114 | |
See accompanying notes to financial statements.
Semi-Annual Report 2018
Needham Small Cap Growth Fund
Statements of Changes in Net Assets
| | | Six Months Ended | | | | |
| | | June 30, 2018 | | | Year Ended | |
| | | (Unaudited) | | | December 31, 2017 | |
| Change in Net Assets | | | | | | |
| Operations: | | | | | | |
| Net Investment Loss | | $ | (151,651 | ) | | $ | (310,369 | ) |
| Net Realized Gain from Securities, Securities Sold Short, | | | | | | | | |
| Foreign Currency Transactions, and Currency | | | 2,511,453 | | | | 3,977,538 | |
| Net Change in Unrealized Appreciation (Depreciation) on Investments, | | | | | | | | |
| Securities Sold Short, Foreign Currency Transactions and Currency | | | (823,378 | ) | | | (228,295 | ) |
| Change in Net Assets Resulting from Operations | | | 1,536,424 | | | | 3,438,874 | |
| | | | | | | | | |
| Distributions to Shareholders from: | | | | | | | | |
| Net Investment Income | | | — | | | | — | |
| Capital Gains | | | — | | | | (2,364,563 | ) |
| Total Distributions to Shareholders | | | — | | | | (2,364,563 | ) |
| | | | | | | | | |
| Capital Transactions: | | | | | | | | |
| Retail Class: | | | | | | | | |
| Shares Issued | | | 1,643,299 | | | | 3,127,799 | |
| Shares Issued in Reinvestment of Distribution | | | — | | | | 1,624,010 | |
| Shares Exchanged for Institutional Class Shares | | | (268,747 | ) | | | (4,245,905 | ) |
| Shares Redeemed | | | (2,517,840 | ) | | | (17,706,408 | ) |
| Redemption Fees | | | 82 | | | | 12,314 | |
| Institutional Class: | | | | | | | | |
| Shares Issued | | | 2,761,563 | | | | 6,971,388 | |
| Shares Issued in Reinvestment of Distribution | | | — | | | | 689,541 | |
| Shares Issued in Exchange for Retail Class Shares | | | 268,747 | | | | 4,245,905 | |
| Shares Redeemed | | | (800,829 | ) | | | (1,808,408 | ) |
| Redemption Fees | | | — | | | | 164 | |
| Total Change in Net Assets from Capital Transactions | | | 1,086,275 | | | | (7,089,600 | ) |
| | | | | | | | | |
| Change in Net Assets | | | 2,622,699 | | | | (6,015,289 | ) |
| | | | | | | | | |
| Total Net Assets | | | | | | | | |
| Beginning of Period/Year | | | 29,642,172 | | | | 35,657,461 | |
| End of Period/Year | | $ | 32,264,871 | | | $ | 29,642,172 | |
| Accumulated Net Investment Loss | | $ | (151,651 | ) | | $ | — | |
| | | | | | | | | |
| Share Transaction: | | | | | | | | |
| Retail Class: | | | | | | | | |
| Number of Shares Issued | | | 100,394 | | | | 201,179 | |
| Number of Shares Reinvested | | | — | | | | 102,075 | |
| Number of Shares Exchanged for Institutional Class Shares | | | (16,261 | ) | | | (274,456 | ) |
| Number of Shares Redeemed | | | (156,270 | ) | | | (1,125,564 | ) |
| Institutional Class: | | | | | | | | |
| Number of Shares Issued | | | 173,304 | | | | 434,158 | |
| Number of Shares Reinvested | | | — | | | | 43,151 | |
| Number of Shares Issued in Exchange for Retail Class Shares | | | 16,145 | | | | 274,369 | |
| Number of Shares Redeemed | | | (48,685 | ) | | | (105,679 | ) |
| Total Change in Shares | | | 68,627 | | | | (450,767 | ) |
See accompanying notes to financial statements.
Needham Funds
Needham Growth Fund
Financial Highlights
| | | Retail Class | |
| | | Six Months | | | | | | | | | | | | | | | | |
| | | Ended | | | | | | | | | | | | | | | | |
| (For a Share Outstanding | | June 30, 2018 | | | Year Ended December 31, | |
| Throughout each Period/Year) | | (Unaudited) | | | 2017 | | | 2016 | | | 2015 | | | 2014 | | | 2013 | |
| Net Asset Value, | | | | | | | | | | | | | | | | | | |
| Beginning of Period/Year | | $ | 42.91 | | | $ | 43.40 | | | $ | 40.96 | | | $ | 46.00 | | | $ | 45.06 | | | $ | 33.66 | |
| Investment Operations | | | | | | | | | | | | | | | | | | | | | | | | |
| Net Investment Income (Loss) | | | (0.50 | ) | | | (0.78 | ) | | | (0.59 | ) | | | (0.68 | ) | | | 0.58 | | | | (0.54 | ) |
| Net Realized and Unrealized | | | | | | | | | | | | | | | | | | | | | | | | |
| Gain (Loss) on Investments | | | 2.00 | | | | 4.45 | | | | 4.86 | | | | (1.60 | ) | | | 4.59 | | | | 12.20 | |
| Total from | | | | | | | | | | | | | | | | | | | | | | | | |
| Investment Operations | | | 1.50 | | | | 3.67 | | | | 4.27 | | | | (2.28 | ) | | | 4.01 | | | | 11.66 | |
| | | | | | | | | | | | | | | | | | | | | | | | | |
| Less Distributions | | | | | | | | | | | | | | | | | | | | | | | | |
| Net Realized Gains | | | — | | | | (4.16 | ) | | | (1.83 | ) | | | (2.76 | ) | | | (3.07 | ) | | | (0.26 | ) |
| Total Distributions | | | — | | | | (4.16 | ) | | | (1.83 | ) | | | (2.76 | ) | | | (3.07 | ) | | | (0.26 | ) |
| | | | | | | | | | | | | | | | | | | | | | | | | |
| Capital Contributions | | | | | | | | | | | | | | | | | | | | | | | | |
| Redemption Fees | | | — | | | | — | (a) | | | — | (a) | | | — | (a) | | | — | (a) | | | — | (a) |
| Total Capital Contributions | | | — | | | | — | (a) | | | — | (a) | | | — | (a) | | | — | (a) | | | — | (a) |
| Net Asset Value, | | | | | | | | | | | | | | | | | | | | | | | | |
| End of Period/Year | | $ | 44.41 | | | $ | 42.91 | | | $ | 43.40 | | | $ | 40.96 | | | $ | 46.00 | | | $ | 45.06 | |
| | | | | | | | | | | | | | | | | | | | | | | | | |
| Total Return | | | 3.50 | %(c) | | | 8.32 | % | | | 10.57 | % | | | (5.07 | )% | | | 8.98 | % | | | 34.68 | % |
| Net Assets, | | | | | | | | | | | | | | | | | | | | | | | | |
| End of Period/Year (000’s) | | $ | 69,732 | | | $ | 78,014 | | | $ | 119,117 | | | $ | 127,154 | | | $ | 147,816 | | | $ | 141,693 | |
| Ratios/Supplemental Data | | | | | | | | | | | | | | | | | | | | | | | | |
| Ratio of Net Expenses to | | | | | | | | | | | | | | | | | | | | | | | | |
| Average Net Assets | | | 2.95 | %(b) | | | 2.34 | % | | | 2.17 | % | | | 2.05 | % | | | 1.84 | % | | | 1.89 | % |
| Ratio of Net Expenses to | | | | | | | | | | | | | | | | | | | | | | | | |
| Average Net Assets (before | | | | | | | | | | | | | | | | | | | | | | | | |
| interest and dividend expense) | | | 1.90 | %(b) | | | 1.90 | % | | | 1.84 | % | | | 1.82 | % | | | 1.80 | % | | | 1.82 | % |
| Ratio of Total Expenses to | | | | | | | | | | | | | | | | | | | | | | | | |
| Average Net Assets (before waiver | | | | | | | | | | | | | | | | | | | | | | | | |
| and reimbursement of expenses) | | | 2.95 | %(b) | | | 2.34 | % | | | 2.17 | % | | | 2.05 | % | | | 1.84 | % | | | 1.89 | % |
| Ratio of Net Investment Income | | | | | | | | | | | | | | | | | | | | | | | | |
| (Loss) to Average Net Assets | | | (2.29 | )%(b) | | | (1.73 | )% | | | (1.36 | )% | | | (1.48 | )% | | | (1.32 | )% | | | (1.30 | )% |
| Ratio of Net Investment | | | | | | | | | | | | | | | | | | | | | | | | |
| Loss to Average Net Assets | | | | | | | | | | | | | | | | | | | | | | | | |
| (before waivers and | | | | | | | | | | | | | | | | | | | | | | | | |
| reimbursements of expenses) | | | (2.29 | )%(b) | | | (1.73 | )% | | | (1.36 | )% | | | (1.48 | )% | | | (1.32 | )% | | | (1.30 | )% |
| Portfolio turnover rate | | | 3 | %(c) | | | 9 | % | | | 12 | % | | | 13 | % | | | 12 | % | | | 12 | % |
(a) | Value is less than $0.005 per share. |
(b) | Annualized for periods less than one year. |
(c) | Not annualized for periods less than one year. |
See accompanying notes to financial statements.
Semi-Annual Report 2018
Needham Growth Fund
Financial Highlights
| | | Institutional Class | |
| | | Six Months | | | | | | Period from | |
| | | Ended | | | Year Ended | | | December 30, 2016 | |
| (For a Share Outstanding | | June 30, 2018 | | | December 31, | | | through | |
| Throughout each Period/Year) | | (Unaudited) | | | 2017 | | | December 31, 2016(1) | |
| Net Asset Value, Beginning of Period/Year | | $ | 43.15 | | | $ | 43.40 | | | $ | 43.40 | |
| Investment Operations | | | | | | | | | | | | |
| Net Investment Loss | | | (0.39 | ) | | | (0.56 | ) | | | — | |
| Net Realized and Unrealized Gain on Investments | | | 2.00 | | | | 4.47 | | | | — | |
| Total from Investment Operations | | | 1.61 | | | | 3.91 | | | | — | |
| | | | | | | | | | | | | |
| Less Distributions | | | | | | | | | | | | |
| Net Realized Gains | | | — | | | | (4.16 | ) | | | — | |
| Total Distributions | | | — | | | | (4.16 | ) | | | — | |
| Net Asset Value, End of Period/Year | | $ | 44.76 | | | $ | 43.15 | | | $ | 43.40 | |
| | | | | | | | | | | | | |
| Total Return | | | 3.73 | %(b) | | | 8.89 | % | | | 0.00 | % |
| Net Assets, End of Period/Year (000’s) | | $ | 36,237 | | | $ | 32,476 | | | $ | 117 | |
| Ratios/Supplemental Data | | | | | | | | | | | | |
| Ratio of Net Expenses to Average Net Assets | | | 2.45 | %(a) | | | 1.90 | % | | | 1.40 | % |
| Ratio of Net Expenses to Average Net Assets | | | | | | | | | | | | |
| (before interest and dividend expense) | | | 1.40 | %(a) | | | 1.40 | % | | | 1.40 | % |
| Ratio of Total Expenses to Average Net Assets | | | | | | | | | | | | |
| (before waiver and reimbursement of expenses) | | | 2.71 | %(a) | | | 2.15 | % | | | — | %* |
| Ratio of Net Investment Loss to Average Net Assets | | | (1.79 | )%(a) | | | (1.23 | )% | | | — | %* |
| Ratio of Net Investment Loss to Average Net Assets | | | | | | | | | | | | |
| (before waivers and reimbursements of expenses) | | | (2.05 | )%(a) | | | (1.49 | )% | | | — | %* |
| Portfolio turnover rate | | | 3 | %(b) | | | 9 | % | | | 0 | % |
(1) | The Class commenced operations on December 30, 2016. |
| * | Refer to Note 2 for further description of non-recurring charges related to the issuance of the share class. |
(a) | Annualized for periods less than one year. |
(b) | Not annualized for periods less than one year. |
See accompanying notes to financial statements.
Needham Funds
Needham Aggressive Growth Fund
Financial Highlights
| | | Retail Class | |
| | | Six Months | | | | | | | | | | | | | | | | |
| | | Ended | | | | | | | | | | | | | | | | |
| (For a Share Outstanding | | June 30, 2018 | | | Year Ended December 31, | |
| Throughout each Period/Year) | | (Unaudited) | | | 2017 | | | 2016 | | | 2015 | | | 2014 | | | 2013 | |
| Net Asset Value, | | | | | | | | | | | | | | | | | | |
| Beginning of Period/Year | | $ | 23.07 | | | $ | 22.29 | | | $ | 19.56 | | | $ | 23.55 | | | $ | 22.66 | | | $ | 16.63 | |
| Investment Operations | | | | | | | | | | | | | | | | | | | | | | | | |
| Net Investment Loss | | | (0.30 | ) | | | (0.49 | ) | | | (0.38 | ) | | | (0.39 | ) | | | (0.38 | ) | | | (0.37 | ) |
| Net Realized and Unrealized | | | | | | | | | | | | | | | | | | | | | | | | |
| Gain (Loss) on Investments | | | 1.76 | | | | 2.46 | | | | 4.61 | | | | (1.28 | ) | | | 1.98 | | | | 6.40 | |
| Total from | | | | | | | | | | | | | | | | | | | | | | | | |
| Investment Operations | | | 1.46 | | | | 1.97 | | | | 4.23 | | | | (1.67 | ) | | | 1.60 | | | | 6.03 | |
| | | | | | | | | | | | | | | | | | | | | | | | | |
| Less Distributions | | | | | | | | | | | | | | | | | | | | | | | | |
| Net Realized Gains | | | — | | | | (1.19 | ) | | | (1.50 | ) | | | (2.32 | ) | | | (0.71 | ) | | | — | |
| Total Distributions | | | — | | | | (1.19 | ) | | | (1.50 | ) | | | (2.32 | ) | | | (0.71 | ) | | | — | |
| | | | | | | | | | | | | | | | | | | | | | | | | |
| Capital Contributions | | | | | | | | | | | | | | | | | | | | | | | | |
| Redemption Fees | | | — | | | | — | (a) | | | — | (a) | | | — | (a) | | | — | (a) | | | — | (a) |
| Total Capital Contributions | | | — | | | | — | (a) | | | — | (a) | | | — | (a) | | | — | (a) | | | — | (a) |
| Net Asset Value, | | | | | | | | | | | | | | | | | | | | | | | | |
| End of Period/Year | | $ | 24.53 | | | $ | 23.07 | | | $ | 22.29 | | | $ | 19.56 | | | $ | 23.55 | | | $ | 22.66 | |
| | | | | | | | | | | | | | | | | | | | | | | | | |
| Total Return | | | 6.33 | %(c) | | | 8.73 | % | | | 22.18 | % | | | (7.05 | )% | | | 7.13 | % | | | 36.26 | % |
| Net Assets, | | | | | | | | | | | | | | | | | | | | | | | | |
| End of Period/Year (000’s) | | $ | 38,674 | | | $ | 41,107 | | | $ | 58,696 | | | $ | 50,906 | | | $ | 62,353 | | | $ | 68,470 | |
| Ratios/Supplemental Data | | | | | | | | | | | | | | | | | | | | | | | | |
| Ratio of Net Expenses to | | | | | | | | | | | | | | | | | | | | | | | | |
| Average Net Assets | | | 3.17 | %(b) | | | 2.63 | % | | | 2.71 | % | | | 2.41 | % | | | 2.09 | % | | | 2.07 | % |
| Ratio of Net Expenses to | | | | | | | | | | | | | | | | | | | | | | | | |
| Average Net Assets (before | | | | | | | | | | | | | | | | | | | | | | | | |
| interest and dividend expense) | | | 1.95 | %(b) | | | 1.95 | % | | | 1.95 | % | | | 1.93 | % | | | 1.91 | % | | | 1.91 | % |
| Ratio of Total Expenses to | | | | | | | | | | | | | | | | | | | | | | | | |
| Average Net Assets (before waiver | | | | | | | | | | | | | | | | | | | | | | | | |
| and reimbursement of expenses) | | | 3.22 | %(b) | | | 2.65 | % | | | 2.72 | % | | | 2.42 | % | | | 2.09 | % | | | 2.07 | % |
| Ratio of Net Investment | | | | | | | | | | | | | | | | | | | | | | | | |
| Loss to Average Net Assets | | | (2.58 | )%(b) | | | (2.12 | )% | | | (1.99 | )% | | | (1.73 | )% | | | (1.60 | )% | | | (1.74 | )% |
| Ratio of Net Investment | | | | | | | | | | | | | | | | | | | | | | | | |
| Loss to Average Net Assets | | | | | | | | | | | | | | | | | | | | | | | | |
| (before waivers and | | | | | | | | | | | | | | | | | | | | | | | | |
| reimbursements of expenses) | | | (2.63 | )%(b) | | | (2.14 | )% | | | (2.00 | )% | | | (1.74 | )% | | | (1.60 | )% | | | (1.74 | )% |
| Portfolio turnover rate | | | 3 | %(c) | | | 15 | % | | | 14 | % | | | 15 | % | | | 19 | % | | | 20 | % |
(a) | Value is less than $0.005 per share. |
(b) | Annualized for periods less than one year. |
(c) | Not annualized for periods less than one year. |
See accompanying notes to financial statements.
Semi-Annual Report 2018
Needham Aggressive Growth Fund
Financial Highlights
| | | Institutional Class | |
| | | Six Months | | | | | | Period from | |
| | | Ended | | | Year Ended | | | December 30, 2016 | |
| (For a Share Outstanding | | June 30, 2018 | | | December 31, | | | through | |
| Throughout each Period/Year) | | (Unaudited) | | | 2017 | | | December 31, 2016(1) | |
| Net Asset Value, Beginning of Period/Year | | $ | 23.21 | | | $ | 22.29 | | | $ | 22.29 | |
| Investment Operations | | | | | | | | | | | | |
| Net Investment Loss | | | (0.24 | ) | | | (0.39 | ) | | | — | |
| Net Realized and Unrealized Gain on Investments | | | 1.78 | | | | 2.50 | | | | — | |
| Total from Investment Operations | | | 1.54 | | | | 2.11 | | | | — | |
| | | | | | | | | | | | | |
| Less Distributions | | | | | | | | | | | | |
| Net Realized Gains | | | — | | | | (1.19 | ) | | | — | |
| Total Distributions | | | — | | | | (1.19 | ) | | | — | |
| Net Asset Value, End of Period/Year | | $ | 24.75 | | | $ | 23.21 | | | $ | 22.29 | |
| | | | | | | | | | | | | |
| Total Return | | | 6.64 | %(b) | | | 9.36 | % | | | 0.00 | % |
| Net Assets, End of Period/Year (000’s) | | $ | 19,996 | | | $ | 20,441 | | | $ | 162 | |
| Ratios/Supplemental Data | | | | | | | | | | | | |
| Ratio of Net Expenses to Average Net Assets | | | 2.62 | %(a) | | | 2.22 | % | | | 1.40 | % |
| Ratio of Net Expenses to Average Net Assets | | | | | | | | | | | | |
| (before interest and dividend expense) | | | 1.40 | %(a) | | | 1.40 | % | | | 1.40 | % |
| Ratio of Total Expenses to Average Net Assets | | | | | | | | | | | | |
| (before waiver and reimbursement of expenses) | | | 3.02 | %(a) | | | 2.64 | % | | | — | %* |
| Ratio of Net Investment Loss to Average Net Assets | | | (2.03 | )%(a) | | | (1.69 | )% | | | — | %* |
| Ratio of Net Investment Loss to Average Net Assets | | | | | | | | | | | | |
| (before waivers and reimbursements of expenses) | | | (2.43 | )%(a) | | | (2.11 | )% | | | — | %* |
| Portfolio turnover rate | | | 3 | %(b) | | | 15 | % | | | 0 | % |
(1) | The Class commenced operations on December 30, 2016. |
| * | Refer to Note 2 for further description of non-recurring charges related to the issuance of the share class. |
(a) | Annualized for periods less than one year. |
(b) | Not annualized for periods less than one year. |
See accompanying notes to financial statements.
Needham Funds
Needham Small Cap Growth Fund
Financial Highlights
| | | Retail Class | |
| | | Six Months | | | | | | | | | | | | | | | | |
| | | Ended | | | | | | | | | | | | | | | | |
| (For a Share Outstanding | | June 30, 2018 | | | Year Ended December 31, | |
| Throughout each Period/Year) | | (Unaudited) | | | 2017 | | | 2016 | | | 2015 | | | 2014 | | | 2013 | |
| Net Asset Value, | | | | | | | | | | | | | | | | | | |
| Beginning of Period/Year | | $ | 15.67 | | | $ | 15.25 | | | $ | 12.44 | | | $ | 14.01 | | | $ | 15.63 | | | $ | 12.22 | |
| Investment Operations | | | | | | | | | | | | | | | | | | | | | | | | |
| Net Investment Loss | | | (0.09 | ) | | | (0.18 | ) | | | (0.20 | ) | | | (0.24 | ) | | | (0.24 | ) | | | (0.31 | ) |
| Net Realized and Unrealized | | | | | | | | | | | | | | | | | | | | | | | | |
| Gain (Loss) on Investments | | | 0.86 | | | | 1.99 | | | | 4.03 | | | | (1.02 | ) | | | 0.32 | | | | 3.72 | |
| Total from | | | | | | | | | | | | | | | | | | | | | | | | |
| Investment Operations | | | 0.77 | | | | 1.81 | | | | 3.83 | | | | (1.26 | ) | | | 0.08 | | | | 3.41 | |
| | | | | | | | | | | | | | | | | | | | | | | | | |
| Less Distributions | | | | | | | | | | | | | | | | | | | | | | | | |
| Net Realized Gains | | | — | | | | (1.40 | ) | | | (1.02 | ) | | | (0.31 | ) | | | (1.70 | ) | | | — | |
| Total Distributions | | | — | | | | (1.40 | ) | | | (1.02 | ) | | | (0.31 | ) | | | (1.70 | ) | | | — | |
| | | | | | | | | | | | | | | | | | | | | | | | | |
| Capital Contributions | | | | | | | | | | | | | | | | | | | | | | | | |
| Redemption Fees | | | — | | | | 0.01 | | | | — | (a) | | | — | (a) | | | — | (a) | | | — | (a) |
| Total Capital Contributions | | | — | | | | 0.01 | | | | — | (a) | | | — | (a) | | | — | (a) | | | — | (a) |
| Net Asset Value, | | | | | | | | | | | | | | | | | | | | | | | | |
| End of Period/Year | | $ | 16.44 | | | $ | 15.67 | | | $ | 15.25 | | | $ | 12.44 | | | $ | 14.01 | | | $ | 15.63 | |
| | | | | | | | | | | | | | | | | | | | | | | | | |
| Total Return | | | 4.85 | %(c) | | | 11.81 | % | | | 31.26 | % | | | (8.96 | )% | | | 0.80 | % | | | 27.91 | % |
| Net Assets, | | | | | | | | | | | | | | | | | | | | | | | | |
| End of Period/Year (000’s) | | $ | 19,074 | | | $ | 19,317 | | | $ | 35,518 | | | $ | 23,473 | | | $ | 32,116 | | | $ | 43,950 | |
| Ratios/Supplemental Data | | | | | | | | | | | | | | | | | | | | | | | | |
| Ratio of Net Expenses to | | | | | | | | | | | | | | | | | | | | | | | | |
| Average Net Assets | | | 1.95 | %(b) | | | 1.95 | % | | | 2.09 | % | | | 2.05 | % | | | 2.01 | % | | | 2.06 | % |
| Ratio of Net Expenses to | | | | | | | | | | | | | | | | | | | | | | | | |
| Average Net Assets (before | | | | | | | | | | | | | | | | | | | | | | | | |
| interest and dividend expense) | | | 1.95 | %(b) | | | 1.95 | % | | | 1.95 | % | | | 1.95 | % | | | 1.95 | % | | | 1.96 | % |
| Ratio of Total Expenses to | | | | | | | | | | | | | | | | | | | | | | | | |
| Average Net Assets (before waiver | | | | | | | | | | | | | | | | | | | | | | | | |
| and reimbursement of expenses) | | | 2.16 | %(b) | | | 2.15 | % | | | 2.30 | % | | | 2.25 | % | | | 2.11 | % | | | 2.09 | % |
| Ratio of Net Investment | | | | | | | | | | | | | | | | | | | | | | | | |
| Loss to Average Net Assets | | | (1.18 | )%(b) | | | (1.14 | )% | | | (1.83 | )% | | | (1.61 | )% | | | (1.49 | )% | | | (1.80 | )% |
| Ratio of Net Investment | | | | | | | | | | | | | | | | | | | | | | | | |
| Loss to Average Net Assets | | | | | | | | | | | | | | | | | | | | | | | | |
| (before waivers and | | | | | | | | | | | | | | | | | | | | | | | | |
| reimbursements of expenses) | | | (1.39 | )%(b) | | | (1.34 | )% | | | (2.04 | )% | | | (1.81 | )% | | | (1.59 | )% | | | (1.83 | )% |
| Portfolio turnover rate | | | 39 | %(c) | | | 80 | % | | | 99 | % | | | 64 | % | | | 69 | % | | | 58 | % |
(a) | Value is less than $0.005 per share. |
(b) | Annualized for periods less than one year. |
(c) | Not annualized for periods less than one year. |
See accompanying notes to financial statements.
Semi-Annual Report 2018
Needham Small Cap Growth Fund
Financial Highlights
| | | Institutional Class | |
| | | Six Months | | | | | | Period from | |
| | | Ended | | | Year Ended | | | December 30, 2016 | |
| (For a Share Outstanding | | June 30, 2018 | | | December 31, | | | through | |
| Throughout each Period/Year) | | (Unaudited) | | | 2017 | | | December 31, 2016(1) | |
| Net Asset Value, Beginning of Period/Year | | $ | 15.76 | | | $ | 15.25 | | | $ | 15.25 | |
| Investment Operations | | | | | | | | | | | | |
| Net Investment Loss | | | (0.05 | ) | | | (0.07 | ) | | | — | |
| Net Realized and Unrealized Gain on Investments | | | 0.86 | | | | 1.98 | | | | — | |
| Total from Investment Operations | | | 0.81 | | | | 1.91 | | | | — | |
| | | | | | | | | | | | | |
| Less Distributions | | | | | | | | | | | | |
| Net Realized Gains | | | — | | | | (1.40 | ) | | | — | |
| Total Distributions | | | — | | | | (1.40 | ) | | | — | |
| Net Asset Value, End of Period/Year | | $ | 16.57 | | | $ | 15.76 | | | $ | 15.25 | |
| | | | | | | | | | | | | |
| Total Return | | | 5.14 | %(b) | | | 12.41 | % | | | 0.00 | % |
| Net Assets, End of Period/Year (000’s) | | $ | 13,191 | | | $ | 10,325 | | | $ | 140 | |
| Ratios/Supplemental Data | | | | | | | | | | | | |
| Ratio of Net Expenses to Average Net Assets | | | 1.40 | %(a) | | | 1.40 | % | | | 1.40 | % |
| Ratio of Net Expenses to Average Net Assets | | | | | | | | | | | | |
| (before interest and dividend expense) | | | 1.40 | %(a) | | | 1.40 | % | | | 1.40 | % |
| Ratio of Total Expenses to Average Net Assets | | | | | | | | | | | | |
| (before waiver and reimbursement of expenses) | | | 1.89 | %(a) | | | 2.08 | % | | | — | %* |
| Ratio of Net Investment Loss to Average Net Assets | | | (0.61 | )%(a) | | | (0.41 | )% | | | — | %* |
| Ratio of Net Investment Loss to Average Net Assets | | | | | | | | | | | | |
| (before waivers and reimbursements of expenses) | | | (1.10 | )%(a) | | | (1.09 | )% | | | — | %* |
| Portfolio turnover rate | | | 39 | %(b) | | | 80 | % | | | 0 | % |
(1) | The Class commenced operations on December 30, 2016. |
| * | Refer to Note 2 for further description of non-recurring charges related to the issuance of the share class. |
(a) | Annualized for periods less than one year. |
(b) | Not annualized for periods less than one year. |
See accompanying notes to financial statements.
Needham Funds
Notes to Financial Statements
1. Organization
Needham Growth Fund (“NGF”), Needham Aggressive Growth Fund (“NAGF”) and Needham Small Cap Growth Fund (“NSCGF”) (each, a “Portfolio” and collectively, the “Portfolios”), are portfolios of The Needham Funds, Inc. (the “Company”), which is registered under the Investment Company Act of 1940, as amended (the “1940 Act”), as a diversified, open-end management investment company. The Company was organized as a Maryland corporation on October 12, 1995. NGF, NAGF, and NSCGF currently offer two classes, the Retail Class and the Institutional Class. The Institutional Class commenced operations on December 30, 2016.
2. Class Specific Expenses
Class level expenses are allocated daily to each class of shares based upon the ratio of net assets represented by each class as a percentage of the net assets of the Portfolio. Expenses deemed directly attributable to a class of shares are recorded by the specific class. Most Portfolio expenses are allocated by class based on relative net assets. Distribution Fees incurred in connection with the Company’s Amended and Restated Plan of Distribution Pursuant to Rule 12b-1 are expensed at 0.25% of average daily net assets of the Retail class shares, and the specific amounts are detailed in Note 5.
Certain of the Ratios and Supplemental Data presented in the Financial Highlights of the Institutional Class as of December 31, 2016 include non-recurring charges related to the issuance of the class and are not meaningful.
3. Significant Accounting Policies
The following is a summary of significant accounting policies followed by the Company in the preparation of its financial statements. These policies are in conformity with accounting principles generally accepted in the United States of America (“GAAP”).
Security Valuation: Portfolio securities for which market quotations are readily available are stated at the last sale price reported by the principal exchange for the security as of the exchange’s close of business. Securities for which no sale has taken place during the day and securities which are not listed on an exchange are valued at the mean of the highest closing bid and lowest asked prices. Exchange traded options are valued at the last reported sale price on any exchange on which the option is principally traded. If no sales are reported on a particular day, the options will be valued at the mean between the highest closing bid and lowest asked prices across the exchanges where the option is traded. Non-exchange traded options will also be valued at the mean between the last bid and asked quotations. For options where market quotations are not readily available, value will be determined in accordance with the fair value procedures described below. All other securities and assets for which (a) market quotations are not readily available, such as in the case of a market or technical disruption that prevents the normal trading of a security held by a Portfolio, (b) market quotations are believed to be unrepresentative of fair market value, such as in the case of a thinly traded security, or (c) valuation is normally made at the last sale price on a
Semi-Annual Report 2018
Notes to Financial Statements (Continued)
foreign exchange and a significant event occurs after the close of that exchange but before the New York Stock Exchange closes, are valued at their fair value as determined in good faith by the Board of Directors (the “Board”) in accordance with Fair Value Procedures established by the Board. The Company’s Fair Value Procedures are implemented and monitored by a Fair Value Committee (the “Committee”) designated by the Board. When a security is valued in accordance with the Fair Value Procedures, the Committee determines a value after taking into consideration any relevant information that is reasonably available to the Committee. Some of the more common reasons that may necessitate that a security be valued pursuant to these Fair Value Procedures include, but are not limited to: the security’s trading has been halted or suspended; the security has been delisted from a national exchange; the security’s primary trading market is temporarily closed at a time when under normal conditions it would be open; or the security’s primary pricing source is not able or willing to provide a price. The securities of each Portfolio may also be valued on the basis of valuations provided by a pricing service approved by, or on behalf of, the Board.
Portfolio securities listed or traded on securities exchanges, including American Depositary Receipts (“ADRs”), are valued at the closing price on the exchange or system where the security is principally traded or at the NASDAQ Official Closing Price. If there have been no sales for that day on the exchange or system, a security is valued at the mean of the highest closing bid and lowest asked prices on the exchange or system where the security is principally traded.
The Portfolios did not value any securities in accordance with the Fair Value Procedures as of June 30, 2018.
Investment Transactions: Changes in holdings of portfolio securities for the Portfolios shall be reflected no later than in the first calculation on the first business day following the trade date for purposes of calculating each Portfolio’s daily net asset value per share. However, for financial reporting purposes, portfolio security transactions are reported on the trade date of the last business day of the reporting period. The cost (proceeds) of investments sold (bought to cover) is determined on a specific identification basis for the purpose of determining gains or losses on sales and buys to cover short positions. Dividend income, distributions to shareholders and dividend expense from securities sold short are recorded on the ex-dividend date. Interest income and interest expense from securities sold short is recorded on an accrual basis.
Foreign Currency: Foreign currency amounts are translated into U.S. dollars as follows:(i) assets and liabilities at the rate of exchange at the end of the respective period; and (ii) purchases and sales of securities and income and expenses at the rate of exchange prevailing on the dates of such transactions. The portion of realized gains arising from changes in the exchange rates are included with the net realized and unrealized gain or loss on investments. Principal risks associated with such transactions include the movement in value of the foreign currency relative to the U.S. dollar and the ability of the counterparty to perform.
Needham Funds
Notes to Financial Statements (Continued)
The Portfolios may also invest in forward currency contracts. Fluctuations in the value of such forward currency transactions are recorded daily as unrealized gain or loss; realized gain or loss includes net gain or loss on transactions that have terminated by settlement. These instruments involve securities and currency market risk, credit risk, or both kinds of risks, in excess of the amount recognized in the statements of assets and liabilities. Risks also arise from the possible inability of counterparties to meet the terms of their contracts. The Portfolios did not enter into forward currency contracts during the period ended June 30, 2018.
Allocation of Expenses: Expenses directly attributable to a Portfolio are charged directly to that Portfolio, while expenses which are attributable to more than one Portfolio are allocated among the respective Portfolios based upon relative net assets or some other reasonable method.
Use of Estimates: The preparation of financial statements in conformity with U.S. generally accepted accounting principles (GAAP) requires management to make estimates and assumptions that affect the reported amounts of assets and liabilities and disclosure of contingent assets and liabilities at the date of the financial statements and the reported amounts of increases and decreases in net assets from operations during the reporting period. Actual results could differ from those estimates.
Distributions to Shareholders: Dividends from net investment income, if any, are declared and paid annually for the Portfolios. Distributable net realized gains, if any, are declared and distributed at least annually.
Federal Income Taxes: It is the policy of each Portfolio to continue to qualify as a regulated investment company, as defined in the Internal Revenue Code, by complying with the provisions available to certain investment companies and to make distributions of net investment income and net realized capital gains sufficient to relieve it from all, or substantially all, federal income taxes. Accordingly, no provision for income taxes has been made in the Portfolios’ financial statements.
As of June 30, 2018, the Portfolios did not have any tax positions that did not meet the “more-likely-than-not” threshold of being sustained by the applicable tax authority. Open tax years are those that are open for exam by Federal and state taxing authorities. As of June 30, 2018, open Federal tax years include the tax years ended December 31, 2014 through December 31, 2017, and open New York tax years include the tax years ended December 31, 2014 through December 31, 2017. The Portfolios have no tax examinations in progress.
Fair Value Measurements: Valuation inputs used to determine the value of the Portfolios’ investments are summarized in the three broad levels listed below:
| | Level 1 — | quoted prices in active markets for identical assets. |
| | | |
| | Level 2 — | other significant inputs (including quoted prices of similar securities, interest rates, prepayment speeds, credit risk, etc.). |
| | | |
| | Level 3 — | significant unobservable inputs (which may include the Portfolios’ own assumptions in determining the fair value of investments). |
Semi-Annual Report 2018
Notes to Financial Statements (Continued)
The inputs or methodology used to value securities are not necessarily an indication of the risk associated with investing in those securities.
Portfolio securities listed or traded on securities exchanges, including ADRs, are valued at the closing price on the exchange or system where the security is principally traded or at the NASDAQ Official Closing Price. If there have been no sales for that day on the exchange or system, a security is valued at the mean of the highest closing bid and lowest asked prices on the exchange or system where the security is principally traded. These valuations are typically categorized as Level 1 in the fair value hierarchy.
In accordance with procedures adopted by the Board, fair value pricing may be used if events materially affecting the value of foreign securities occur between the times the exchange on which they are traded closes and the time the Portfolios’ net asset values are calculated. These valuations are categorized as Level 2 in the fair value hierarchy.
The following is a summary categorization, as of June 30, 2018, of each Portfolio’s investments based on the level of inputs utilized in determining the value of such investments:
| | | LEVEL 1 – Quoted Prices(1)(3) | |
| | | NGF | | | NAGF | | | NSCGF | |
| Assets | | | | | | | | | |
Common Stocks(2) | | $ | 105,836,747 | | | $ | 58,701,051 | | | $ | 27,472,228 | |
| Closed-End Funds | | | — | | | | — | | | | 1,271,755 | |
| Short-Term Investments | | | 239,978 | | | | 210,275 | | | | 4,264,110 | |
| Liabilities | | | | | | | | | | | | |
Securities Sold Short(2) | | | (5,848,625 | ) | | | (3,867,625 | ) | | | (— | ) |
| Total | | $ | 100,228,100 | | | $ | 55,043,701 | | | $ | 33,008,093 | |
(1) | As of June 30, 2018, the Portfolios did not hold Level 2 or Level 3 investments. |
(2) | Please refer to the Schedule of Investments and Schedule of Securities Sold Short to view segregation by industry. |
(3) | There were no transfers into or out of Levels 1, 2 or 3 during the period. |
4. Investment Advisory and Administrative Services
The Company has engaged Needham Investment Management L.L.C. (the “Adviser”) to manage its investments pursuant to an Investment Advisory Agreement. The Company pays the Adviser an investment advisory fee at the annual rate of 1.25% of the average daily net assets of each Portfolio.
The Adviser has entered into an agreement with the Company (the “Expense Limitation Agreement”) whereby the Adviser has contractually agreed to waive its investment advisory fee for, and to reimburse expenses of, NGF, NAGF and NSCGF in an amount that limits annual operating expenses to not more than 1.40% and 1.95% of the average daily net assets of the Fund’s Institutional Class and Retail Class, respectively (excluding taxes, interest, brokerage, dividends on short positions, acquired fund fees and expenses and extraordinary items, and excluding shareholder redemption fees but including the
Needham Funds
Notes to Financial Statements (Continued)
investment advisory fee stated in the Investment Advisory Agreement). The Expense Limitation Agreement is effective for the period from May 1, 2018 through April 30, 2019. The Expense Limitation Agreement shall continue in effect from year to year thereafter only upon mutual agreement of the Company and the Adviser. Similar agreements were in effect for certain prior periods.
Any reimbursements or fee waivers made by the Adviser in respect of a Portfolio are subject to recoupment by the Adviser, to the extent that the Portfolio is able to make the repayment within the expense limitation established in the Expense Limitation Agreement. Under the Expense Limitation Agreement, the Adviser has a right to receive from each Portfolio class reimbursement for fee waivers and/or expense reimbursements made pursuant to the Agreement for a period of up to 36 months from the time of any waiver or reimbursement. The table below indicates the amount of fees that the Adviser has the potential to recoup from the Portfolios:
| | | Recovery Expiring on | |
| | | 4/30/2022 | | | 4/30/2021 | | | 4/30/2020 | | | 4/30/2019 | |
| NGF (Retail Class) | | $ | — | | | $ | — | | | $ | — | | | $ | — | |
| NGF (Institutional Class) | | | 14,375 | | | | 98,954 | | | | 13,094 | | | | — | |
| NAGF (Retail Class) | | | 1,910 | | | | 25,106 | | | | — | | | | 3,102 | |
| NAGF (Institutional Class) | | | 13,438 | | | | 74,382 | | | | 17,829 | | | | — | |
| NSCGF (Retail Class) | | | 5,435 | | | | 51,845 | | | | 48,101 | | | | 60,837 | |
| NSCGF (Institutional Class) | | | 9,858 | | | | 55,647 | | | | 12,657 | | | | — | |
The Company and U.S. Bancorp Fund Services, LLC (the “Administrator”) are parties to a Fund Administration Servicing Agreement. The Administrator provides administrative and fund accounting services pursuant to this agreement and, in consideration of these services, receives a fee computed daily and paid monthly at an annual rate based on a percentage of the value of each Portfolio’s assets. The Administrator is also compensated for any out of pocket expenses that are reasonably incurred in carrying out its duties under the Administration Agreement. The Administrator also provides transfer agent services pursuant to a Transfer Agent Servicing Agreement for additional fees.
Certain officers of the Company are also officers of the Adviser and/or Needham & Company, LLC (the “Distributor”). Such officers receive no fees from the Company for serving as officers of the Company. Each of the two Directors who is not an “interested person” (as defined in the 1940 Act) of the Company (each, an “Independent Director”) receives a quarterly retainer of $3,000 and a per-meeting fee of $500. Each Independent Director is also a member of the Audit Committee of the Company’s Board of Directors and receives a fee of $500 per meeting attended. The Adviser provides an employee to serve as Chief Compliance Officer for the Company and to provide certain related services. An affiliate of the Adviser, Needham & Company, LLC, pays the Chief Compliance Officer’s compensation and the Company reimburses this affiliate for the Company’s allocated portion of the expense.
Semi-Annual Report 2018
Notes to Financial Statements (Continued)
5. Distribution Plan
The Company has adopted an Amended and Restated Plan of Distribution pursuant to Rule 12b-1 under the 1940 Act. Under the Plan, each Portfolio may pay compensation to the Distributor or any other distributor or financial institution with which the Company has an agreement with respect to the Retail Class of each Portfolio, with the amount of such compensation not to exceed an annual rate of 0.25% of each Portfolio’s daily average net assets. For the period ended June 30, 2018, NGF, NAGF and NSCGF paid 12b-1 fees to the Distributor in the amount of $93,262, $49,107 and $24,429, respectively.
During the period ended June 30, 2018, NGF, NAGF and NSCGF incurred and paid brokerage commissions to the Distributor in the amount of $3,053, $3,726, and $5,751, respectively.
6. Temporary Borrowings
Each Portfolio may borrow from banks up to 25% of its total assets and may pledge its assets in connection with these borrowings, provided that no additional investments shall be made while borrowings exceed 5% of total assets.
The Portfolios did not engage in any temporary borrowings during the period ended June 30, 2018.
7. Short Sale Transactions
During the period ended June 30, 2018, each Portfolio sold securities short. Upon selling a security short, the Portfolios record an asset for the settlement amount as “Deposit with Broker for Securities Sold Short” and a corresponding liability, which is marked-to-market to reflect current value. The broker for the Portfolios’ short sale transactions requires maintenance by each Portfolio of a minimum amount of collateral at all times, regardless of whether any short sales are outstanding. To the extent necessary to meet the broker’s collateral requirements for open short positions, additional securities will be segregated above the minimum amount to cover the short positions. At June 30, 2018, the market value of securities separately segregated to cover short positions was $6,225,215, $5,925,705, and $1,094,375 for NGF, NAGF and NSCGF, respectively.
Additionally, the Portfolios had receivables for Deposit with Broker for Securities Sold Short of $6,028,050, 3,933,501 and $26 pledged as collateral with a broker in connection with open (or recently settled) short positions for NGF, NAGF, and NSCGF respectively. Securities sold short at June 30, 2018 and their related market values and proceeds are set forth in the preceding Schedule of Securities Sold Short for NGF and NAGF.
Needham Funds
Notes to Financial Statements (Continued)
8. Investment Transactions
The following summarizes the aggregate amount of the cost of purchases and proceeds from sales of investment securities and securities sold short, excluding short-term securities, during the period ended June 30, 2018:
| | | Purchases | | | Sales | |
| NGF | | | | | | |
| Long Transactions | | $ | 3,207,362 | | | $ | 12,858,853 | |
| Short Sale Transactions | | | — | | | | 1,722,362 | |
| NAGF | | | | | | | | |
| Long Transactions | | | 2,045,665 | | | | 9,960,333 | |
| Short Sale Transactions | | | — | | | | 2,023,991 | |
| NAGF | | | | | | | | |
| Long Transactions | | | 10,391,054 | | | | 10,802,877 | |
| Short Sale Transactions | | | — | | | | — | |
There were no purchases or sales of U.S. government securities during the period ended June 30, 2018.
9. Financial Instruments With Off-Balance Sheet Risk
In the normal course of their business, the Portfolios may engage in transactions with off-balance sheet risk, including securities sold short, written options, futures, and forward currency contracts. Transactions in certain financial instruments represent future commitments to purchase or sell other financial instruments at specific terms at specified future dates. Each of these financial instruments contains varying degrees of off-balance sheet risk whereby changes in the market values of the securities underlying the financial instruments may be in excess of the amounts recognized in the financial statements.
Securities sold short represent obligations of the Portfolios to make future delivery of specific securities and, correspondingly, create an obligation to purchase the securities at market prices prevailing at a later delivery date (or to deliver the securities if already owned by the Portfolios). As a result, short sales create the risk that the Portfolios’ ultimate obligation to satisfy the delivery requirements may exceed the amount of the proceeds initially received on the liability recorded in the financial statements.
10. Indemnification
Under the Company’s organizational documents, its Directors and Officers are indemnified against certain liabilities arising out of the performance of their duties to the Company. In addition, in the ordinary course of business, the Company enters into contracts that contain a variety of indemnifications. The Company’s maximum exposure under these arrangements is unknown. However, the Company has not had prior claims or losses pursuant to these contracts and expects the risk of loss to be remote.
Semi-Annual Report 2018
Notes to Financial Statements (Continued)
11. Transactions with Affiliates
NAGF owned 5% or more of the voting securities of the following company during the period ended June 30, 2018. As a result, this company is deemed to be an affiliate of NAGF as defined by the 1940 Act. Transactions during the period in this affiliated company were as follows:
| | Share | | | Share | Net Change | | | |
| | Balance | | | Balance | in Unrealized | Realized | | Value |
| | Dec. 31, | | | June 30, | Appreciation | Gains | Dividend | June 30, |
Security Name | 2017 | Purchases | Sales | 2018 | (Depreciation) | (Losses) | Income | 2018 |
| GSE | | | | | | | | |
| Systems, Inc. | 1,120,000 | — | — | 1,120,000 | $— | — | — | $3,640,000 |
12. Federal Income Taxes
No provision for federal income taxes is required since the Company intends to continue to qualify as a regulated investment company under Subchapter M of the Internal Revenue Code and distribute substantially all of its taxable income and capital gains to shareholders. Because income tax regulations differ from GAAP, the timing and character of income and capital gain distributions determined in accordance with tax regulations can differ from income and capital gains recognized for financial reporting purposes. Accordingly, the character of distributions and the composition of net assets for tax purposes can differ from those reflected in the financial statements. These book/tax differences may be temporary or permanent in nature. Temporary differences are generally due to differing book and tax treatment for the timing of the recognition of gains and losses on securities, including post-October losses (as described below). Permanent differences are generally due to differing treatment of net investment losses. To the extent these differences are permanent, they are charged or credited to paid-in capital, accumulated net realized gain (loss), or accumulated net investment income (loss), as appropriate, in the period in which the differences arise. These reclassifications have no effect on net assets or net asset value per share of each Portfolio.
As of December 31, 2017, the cost, gross unrealized appreciation, gross unrealized depreciation, and the net unrealized appreciation (depreciation) on securities, including proceeds from securities sold short for federal income tax purposes, were as follows:
| | | | | | | | | | | | Net | |
| | | | | | Gross | | | Gross | | | Unrealized | |
| | | | | | Unrealized | | | Unrealized | | | Appreciation | |
| | | Cost | | | Appreciation | | | Depreciation | | | (Depreciation) | |
| NGF | | $ | 47,399,745 | | | $ | 62,139,014 | | | $ | (5,189,413 | ) | | $ | 56,949,601 | |
| NAGF | | | 25,880,329 | | | | 34,818,425 | | | | (3,215,958 | ) | | | 31,602,467 | |
| NSCGF | | | 26,150,660 | | | | 5,023,040 | | | | (1,301,808 | ) | | | 3,721,232 | |
The difference between the tax cost of investments and the cost of investments for GAAP purposes is primarily due to the tax treatment for wash sale losses.
Needham Funds
Notes to Financial Statements (Continued)
As of December 31, 2017, the components of distributable earnings (loss) on a tax basis were as follows:
| | | NGF | | | NAGF | | | NSCGF | |
| Undistributed ordinary income | | $ | — | | | $ | — | | | $ | 259,233 | |
| Undistributed long-term capital gains | | | 9,147,986 | | | | — | | | | — | |
| Unrealized appreciation (depreciation) | | | 56,949,601 | | | | 31,602,467 | | | | 3,721,232 | |
| Other accumulated gains (loss) | | | (669 | ) | | | — | | | | — | |
| Total accumulated earnings (loss) | | $ | 66,096,918 | | | $ | 31,602,467 | | | $ | 3,980,465 | |
The tax character of distributions paid during the year ended December 31, 2017 was as follows:
| | | NGF | | | NAGF | | | NSCGF | |
| Ordinary income | | $ | 66,959 | | | $ | — | | | $ | 2,019,133 | |
| Net long-term capital gains | | | 10,413,410 | | | | 3,108,250 | | | | 345,430 | |
| Return of capital | | | — | | | | — | | | | — | |
| Total distributions paid | | $ | 10,480,369 | | | $ | 3,108,250 | | | $ | 2,364,563 | |
In 2017 a portion of such dividends was distributed in connection with NEEGX, NEAGX, and NESGX redemptions.
The tax character of distributions paid during the year ended December 31, 2016 was as follows:
| | | NGF | | | NAGF | | | NSCGF | |
| Ordinary income | | $ | — | | | $ | — | | | $ | 548,261 | |
| Net long-term capital gains | | | 4,983,292 | | | | 3,518,408 | | | | 1,347,199 | |
| Return of capital | | | — | | | | — | | | | — | |
| Total distributions paid | | $ | 4,983,292 | | | $ | 3,518,408 | | | $ | 1,895,460 | |
Under current tax law, capital and currency losses realized after October 31 of a Portfolio’s fiscal year may be deferred and treated as occurring on the first business day of the following fiscal year for tax purposes. The following Portfolios had deferred post-October capital and currency losses, which will be treated as arising on the first business day of the year ended of December 31, 2017.
As of December 31, 2017, none of the Portfolios had accumulated capital loss carryovers.
13. Subsequent Events
Management has evaluated subsequent events through the date of this filing. This evaluation did not result in any subsequent events that necessitated recognition or disclosures.
Semi-Annual Report 2018
Supplementary Information (Unaudited)
June 30, 2018
Disclosure of Portfolio Holdings
The Company files a Form N-Q with the Securities and Exchange Commission (the “SEC’’) no more than sixty days after the Company’s first and third fiscal quarters. For the Company, this would be for the fiscal quarters ending March 31 and September 30. Form N-Q includes a complete schedule of the Company’s portfolio holdings as of the end of those fiscal quarters. The Company’s N-Q filings can be found free of charge on the SEC’s website at http://www.sec.gov, or they may be reviewed and copied at the SEC’s Public Reference Room in Washington, D.C. (call 800-SEC-0330 for information on the operation of the Public Reference Room). copied at the SEC’s Public Reference Room in Washington, D.C. (call 800-SEC-0330 for information on the operation of the Public Reference Room).
Voting Proxies on Company Portfolio Securities
A description of the policies and procedures that the Company uses to determine how to vote proxies relating to portfolio securities and information regarding how the Company voted proxies relating to portfolio securities during the most recent 12-month period ended June 30 are available without charge, upon request, by calling 800-625-7071 or on the SEC’s website at http://www.sec.gov.
Household Delivery of Shareholder Documents
To reduce expenses, the Company may mail only one copy of the Portfolios’ prospectuses, proxy statements, information statements, and each annual and semi-annual report to those addresses shared by two or more accounts. If you wish to receive individual copies of these documents, please call the Portfolios at 1-800-625-7071 or contact your financial institution. You will begin receiving individual copies thirty days after receiving your request.
250 Park Avenue, 10th Floor
New York, New York 10177
1-800-625-7071
Investment Adviser:
Needham Investment Management L.L.C.
250 Park Avenue, 10th Floor
New York, New York 10177
President
George A. Needham
Executive Vice Presidents and Portfolio Managers
John Barr
Needham Growth Fund
Needham Aggressive Growth Fund
Chris Retzler
Needham Growth Fund
Needham Small Cap Growth Fund
Directors
George A. Needham
John W. Larson
F. Randall Smith
Distributor:
Needham & Company, LLC
250 Park Avenue, 10th Floor
New York, New York 10177
212-371-8300
Administrator, Shareholder Servicing Agent and Transfer Agent:
U.S. Bancorp Fund Services, LLC
615 East Michigan Street
Milwaukee, WI 53202
Custodian:
U.S. Bank, N.A.
1555 North RiverCenter Drive
Milwaukee, WI 53212
Counsel:
Proskauer Rose LLP
Eleven Times Square
New York, NY 10036-8299
Independent Registered Public Accounting Firm:
KPMG LLP
345 Park Avenue
New York, NY 10154
Item 2. Code of Ethics.
Not applicable for semi-annual reports.
Item 3. Audit Committee Financial Expert.
Not applicable for semi-annual reports.
Item 4. Principal Accountant Fees and Services.
Not applicable for semi-annual reports.
Item 5. Audit Committee of Listed Registrants.
Not applicable to registrants who are not listed issuers (as defined in Rule 10A-3 under the Securities Exchange Act of 1934).
Item 6. Investments.
(a) | Schedule of Investments is included as part of the report to shareholders filed under Item 1 of this Form. |
Item 7. Disclosure of Proxy Voting Policies and Procedures for Closed-End Management Investment Companies.
Not applicable to open-end investment companies.
Item 8. Portfolio Managers of Closed-End Management Investment Companies.
Not applicable to open-end investment companies.
Item 9. Purchases of Equity Securities by Closed‑End Management Investment Company and Affiliated Purchasers.
Not applicable to open-end investment companies.
Item 10. Submission of Matters to a Vote of Security Holders.
Not Applicable.
Item 11. Controls and Procedures.
| (a) | The Registrant’s Chief Executive Officer and Chief Financial Officer have reviewed the Registrant's disclosure controls and procedures (as defined in Rule 30a-3(c) under the Investment Company Act of 1940 (the “Act”)) as of a date within 90 days of the filing of this report, as required by Rule 30a-3(b) under the Act and Rules 13a-15(b) or 15d‑15(b) under the Securities Exchange Act of 1934. Based on their review, such officers have concluded that the disclosure controls and procedures are effective in ensuring that information required to be disclosed in this report is appropriately recorded, processed, summarized and reported and made known to them by others within the Registrant and by the Registrant’s service provider. |
| (b) | There were no changes in the Registrant's internal control over financial reporting (as defined in Rule 30a-3(d) under the Act) that occurred during the Registrant’s first fiscal half-year of the period covered by this report that has materially affected, or is reasonably likely to materially affect, the Registrant's internal control over financial reporting. |
Item 12. Disclosure of Securities Lending Activities for Closed-End Management Investment Companies
Not applicable to open-end investment companies.
Item 13. Exhibits.
| (a) | (1) Any code of ethics or amendment thereto, that is the subject of the disclosure required by Item 2, to the extent that the registrant intends to satisfy Item 2 requirements through filing an exhibit. Not applicable for semi-annual reports. |
(2) A separate certification for each principal executive and principal financial officer pursuant to Section 302 of the Sarbanes-Oxley Act of 2002. Filed herewith.
(3) Any written solicitation to purchase securities under Rule 23c‑1 under the Act sent or given during the period covered by the report by or on behalf of the registrant to 10 or more persons. Not applicable to open-end investment companies.
| (b) | Certifications pursuant to Section 906 of the Sarbanes‑Oxley Act of 2002. Furnished herewith. |
SIGNATURES
Pursuant to the requirements of the Securities Exchange Act of 1934 and the Investment Company Act of 1940, the registrant has duly caused this report to be signed on its behalf by the undersigned, thereunto duly authorized.
(Registrant) The Needham Funds, Inc.
By (Signature and Title) /s/ George A. Needham
George A. Needham, President (Chief Executive Officer)
Date August 31, 2018
Pursuant to the requirements of the Securities Exchange Act of 1934 and the Investment Company Act of 1940, this report has been signed below by the following persons on behalf of the registrant and in the capacities and on the dates indicated.
By (Signature and Title) /s/ George A. Needham
George A. Needham, President (Chief Executive Officer)
Date August 31, 2018
By (Signature and Title) /s/ James W. Giangrasso
James W. Giangrasso, Treasurer and Secretary (Chief Financial Officer)
Date August 31, 2018