UNITED STATES
SECURITIES AND EXCHANGE COMMISSION
Washington, D.C. 20549
FORM N-CSR
CERTIFIED SHAREHOLDER REPORT OF REGISTERED
MANAGEMENT INVESTMENT COMPANIES
Investment Company Act file number | 811-09114 |
|
The Needham Funds, Inc. |
(Exact name of registrant as specified in charter) |
|
445 Park Avenue, New York, New York | | 10022-2606 |
(Address of principal executive offices) | | (Zip code) |
|
Citi Fund Services Ohio, Inc., 3435 Stelzer Road, Columbus, OH 43219 |
(Name and address of agent for service) |
|
Registrant’s telephone number, including area code: | 1-800-625-7071 | |
|
Date of fiscal year end: | December 31, 2007 | |
|
Date of reporting period: | December 31, 2007 | |
| | | | | | | | |
Item 1. Reports to Stockholders.
Annual Report
Needham Funds
Seeking to build wealth for long-term investors.
December 31, 2007
Needham Growth Fund
Needham Aggressive Growth Fund
Needham Small Cap Growth Fund

www.needhamfunds.com

445 Park Avenue
New York, New York 10022-2606
1-800-625-7071
www.needhamfunds.com
Annual Report
December 31, 2007
Contents
| Letter from the Adviser | | | 1 | | |
|
| Portfolio Characteristics | |
|
| Needham Growth Fund | | | 4 | | |
|
| Needham Aggressive Growth Fund | | | 5 | | |
|
| Needham Small Cap Growth Fund | | | 6 | | |
|
| Disclosure of Fund Expenses | | | 7 | | |
|
| Schedule of Investments | |
|
| Needham Growth Fund | | | 8 | | |
|
| Needham Aggressive Growth Fund | | | 11 | | |
|
| Needham Small Cap Growth Fund | | | 13 | | |
|
| Schedule of Securities Sold Short | |
|
| Needham Growth Fund | | | 10 | | |
|
| Needham Aggressive Growth Fund | | | 12 | | |
|
| Needham Small Cap Growth Fund | | | 14 | | |
|
| Statements of Assets and Liabilities | | | 15 | | |
|
| Statements of Operations | | | 16 | | |
|
| Statements of Changes in Net Assets | | | 17 | | |
|
| Financial Highlights | |
|
| Needham Growth Fund | | | 18 | | |
|
| Needham Aggressive Growth Fund | | | 19 | | |
|
| Needham Small Cap Growth Fund | | | 20 | | |
|
| Notes to Financial Statements | | | 21 | | |
|
Report of Independent Registered Public
Accounting Firm | | | 26 | | |
|
| Fund Management | | | 27 | | |
|
| Supplemental Data | | | 28 | | |
|
This report is authorized for distribution to prospective investors only when preceded or accompanied by a current prospectus. The prospectus contains more complete information, including investment objectives, risks, expenses and charges and should be read carefully before investing or sending any money. To obtain a prospectus, please call 1-800-625-7071.
Portfolios of The Needham Funds, Inc., like all mutual funds:
• Are NOT FDIC insured
• Have no bank guarantee
• May lose value
The Needham Funds, Inc. are distributed by Needham & Company, LLC.
Needham Funds Annual Report 2007
Dear Shareholders,
We at The Needham Funds, Inc. focus on buying growth stocks at reasonable prices. In the twelve-month period ended December 31, 2007, the Growth Fund was up 3.09%, the Aggressive Growth Fund was up 15.58% and the Small Cap Growth Fund was down 2.01%. By comparison, the S&P 500 Index was up 5.49%, the NASDAQ Composite Index was up 10.66% and the Russell 2000 Index was down 1.56%. While 2007 was a treacherous environment where a number of competing growth funds stumbled, we are not pleased with the mixed performance of the Growth Fund and the Small Cap Growth Fund.
The Needham Growth Fund (the "Growth Fund") seeks to create long-term, tax-efficient capital appreciation for its investors. To this end, the Growth Fund targets companies with products or services that are selling or marketing into growth markets. These companies normally have earnings growth of at least 15-20%, product and market dominance, and the ability to consolidate their market positions. They may also have a competitive advantage by acquiring and retaining more customers or driving costs down and profits up. The Growth Fund also looks for seasoned and motivated managements with records of building shareholder value. Companies with these characteristics sometimes find themselves in a temporary earnings downturn or shortfall or may be in a product transition. This often causes aggressive growth or momentum investors to sell. At this point, the Growth Fund may deem the stock to be reasonably priced and purchase it for long - -term capital appreciation. Hence, the discipline called "Growth At a Reasonable Price," or "GARP."
The Growth Fund was up 3.09% for the 1 year period, up 11.69% for the 3 years, up 16.87% for the 5 years, up 15.03% for the 10 years, and up 17.76% since inception, compounded annually. The Growth Fund received a four-star Overall MorningstarTM Rating in the U.S.-domiciled Mid-Cap Growth Funds category as of December 31, 2007, based on Risk-Adjusted Return, when rated against 811 Mid-Cap Growth Funds. We ended the year with approximately 5.8% of total investments in cash and 4.8% as our short position. 2007 was a mixed year where our larger cap names such as Schlumberger and Express Scripts performed well, but our small cap names struggled, similar to the divergent market returns of the large cap DJIA and the small cap Russell 2000 indices.
The Needham Aggressive Growth Fund (the "Aggressive Growth Fund") seeks to create long-term, tax-efficient capital appreciation for its investors. To this end, the Aggressive Growth Fund targets the equities of companies with strong, above-average prospective growth rates. The Aggressive Growth Fund invests, in general, in markets and industries with strong growth rates, focusing on the market leaders in these areas. These market leaders, especially as they break away from their competitors, tend to garner a disproportionate share of the positive financial returns. Also important is the long-term sustainability of the companies' leadership positions. Thus, the Aggressive Growth Fund looks for companies with strong management teams, superior balance sheets, above-average margins that can generate excess cash, and strong R&D and brand spending in industries with high barriers to entry.
The Aggressive Growth Fund was up 15.58% for the 1 year period, up 12.47% for the 3 years, up 15.00% for the 5 years, and up 10.42% since inception, compounded annually. The Aggressive Growth Fund had a strong year, led by growth names and a favorable M&A environment that saw several of the Fund's core holdings acquired at substantial premiums, in particular Webex, Hyperion Solutions and Kyphon. Healthcare and Information Technology were the two strongest sectors for the Fund during 2007.
1
Needham Funds
The Needham Small Cap Growth Fund (the "Small Cap Growth Fund") seeks long-term, tax-efficient capital appreciation by investing primarily in equity securities of smaller growth companies that the Small Cap Growth Fund believes are trading at a discount to their underlying value yet have the potential for superior long-term growth. Under normal conditions, the Small Cap Growth Fund invests at least 80% of its net assets in equity securities of domestic issuers listed on a nationally recognized securities exchange or traded on the NASDAQ System that have market capitalizations not exceeding $2 billion or the highest market capitalization in the Russell 2000 Index, if greater. As of December 31, the highest market capitalization in the Russell 2000 Index was $8.4 billion. Central to the Small Cap Growth Fund's investment strategy is a sound valuation discipline that seeks to acquire growth companies at reasonable prices. The Small Cap Growth Fund seeks tax efficiency by holding securities for a period of 12 months or more to obtain long-term capital gain treatment and by offsetting capital gains on the sale of securities with capital losses.
The Small Cap Growth Fund was down 2.01% for the 1 year period, up 2.75% for the 3 years, up 14.20% for the 5 years, and up 13.31% since inception, compounded annually. 2007 was a difficult year for small cap stocks, as seen with the Russell 2000 down almost 2% for the year. The Fund's semiconductor capital equipment stocks were especially weak, led by Brooks Automation and Entegris. Among the positive contributors, Dolby Labs was a standout.
The portfolio turnover rate was 41% for the Growth Fund, 64% for the Aggressive Growth Fund and 38% for the Small Cap Growth Fund for the year ended December 31, 2007. The expense ratios for the three funds were 1.86% for the Growth Fund, 2.18% for the Aggressive Growth Fund and 2.50% for the Small Cap Growth Fund for the year ended December 31, 2007.
As I write this letter late January, 2008 has started negatively with investors increasingly risk averse in response to credit and real estate woes, in spite of substantial intervention by the Government, the Federal Reserve and Foreign Sovereign Wealth Funds. While we certainly think the economy slipping into a recession is plausible, our present view is that the U.S. will witness several quarters of slow growth, staying out of recession as our improved export economy makes up for weak housing and consumer spending. Developing nations continue to experience robust growth, but as these economies slow, we will need to keep an eye on overall world GDP growth. We do expect the Federal Reserve to continue to supply liquidity to the U.S. markets, but they will continue to be somewhat constrained by the weak dollar and inflation worries. We would expect the dollar to stabilize in the near term as growth in Europe ebbs, but it could we ll start falling again later in the year. We do not expect the housing market to recover until after 2008. While we expect the elections to give us something to talk about, we think it will have minimal impact on the markets until a winner is declared and a change, if any, to tax policy becomes apparent.
For the markets, volatility should remain elevated and stock selectivity should remain paramount. Given our belief that inflation has been understated by official government statistics, we believe the biggest risk remains the constraints on the Federal Reserve to jumpstart the economy as rapidly as they might like to. Since this will constrain P/E expansion, we will continue to highlight organic growth stories in our new stock purchases. While we plan to put some of our cash resources to work as the market grinds down, we still think it is too early to be overly aggressive. Corporate profits have only begun to come down, and we will need to get more clarity on how much lower they will get. It is also unclear to us if the financial sector has adequately addressed the land mines on their balance sheets. Lastly, we want to see how much the slowing economies in the developed world will impact the fast-growing developing countries.
2
Annual Report 2007
In conclusion, with the prospects for a difficult 2008, at least in the first half, we will continue to emphasize the careful selection of companies with above-average growth potential selling at reasonable prices. In an environment such as today, it does not surprise us to see even our best quality names under pressure, despite their earnings holding up. Nevertheless, when the best stocks get hit hard, that is exactly when we like to invest. It may take some time to get the payoff, but the better companies always recover, and we see the deepening gloom around equities as an opportunity to accumulate tomorrow's winners.
I wanted to inform you personally that I am retiring as portfolio manager of the Funds. After thirty years on Wall Street and the last seven with the Needham Funds, I have decided to take up some new personal challenges. It has been a very rewarding experience and a great honor serving you as manager of the Funds and I want to thank you for your continued support. I have had the pleasure of working with a tremendous team here and I am confident that they, led by my very capable colleagues, Bernard Lirola and Chris Retzler, will continue to earn your trust and respect. Bernard, who will become portfolio manager of the Growth Fund and the Aggressive Growth Fund, is a graduate of École Polytechnique in France and Harvard Business School and has been associated with George Needham for thirty years, initially at First Boston and for the last 14 years at Needham. His varied career on Wall Street (he has been an M&A speciali st, research analyst, banker and head of investment banking), as well as his international background, bring uniquely relevant perspectives to the Funds at this time of increased globalization. Chris, who will become portfolio manager of the Small Cap Growth Fund, joined the Needham Funds in mid- 2005 after nearly a decade of investment banking experience at Merrill Lynch. Chris has an MBA from Columbia University, is a graduate of Bucknell University and was a Fulbright Scholar recipient. We have been diligently preparing for this event and we fully expect it to be a seamless transition. Thank you again.
Sincerely,
James K. Kloppenburg
Portfolio Manager
3
Needham Funds
NEEDHAM GROWTH FUND (Unaudited) TICKER: NEEGX
Comparative Performance Statistics as of December 31, 2007
| | | 6 Months(6) | | 1 Year | | 3 Years(7) | | 5 Years(7) | | 10 Years(7) | | Since Inception(7)(11) | | Gross Expense
Ratio(13) | |
| Needham Growth Fund(1) | | | (2.81 | )% | | | 3.09 | % | | | 11.69 | %(8) | | | 16.87 | %(9) | | | 15.03 | %(10) | | | 17.76 | %(12) | | | 1.82 | % | |
| NASDAQ Composite Index(2) | | | 2.29 | % | | | 10.66 | % | | | 7.97 | % | | | 14.83 | % | | | 5.92 | % | | | 8.51 | % | | | |
| S&P 500 Index(3) | | | (1.37 | )% | | | 5.49 | % | | | 8.89 | % | | | 12.29 | % | | | 5.94 | % | | | 9.30 | % | | | |
| S&P 400 MidCap Index(4) | | | (7.52 | )% | | | 7.98 | % | | | 10.51 | % | | | 15.86 | % | | | 11.31 | % | | | 13.45 | % | | | |
| Russell 2000 Index(5) | | | (3.57 | )% | | | (1.56 | )% | | | 7.13 | % | | | 16.09 | % | | | 7.28 | % | | | 9.11 | % | | | |
Past performance does not guarantee future results. The performance data quoted represents past performance, and current returns may be lower or higher. The investment return and net asset value will fluctuate so that an investor's shares, when redeemed, may be worth more or less than the original cost. To obtain performance information current to the most recent month-end, please visit www.needhamfunds.com. The returns shown in the above table and accompanying footnotes are net of expenses. The table above does not reflect the deduction of taxes that a shareholder would have paid on Fund distributions or on the redemption of Fund shares. Since inception, the Fund's Adviser has absorbed certain expenses of the Fund, without which returns would have been lower.
1. Investment results calculated after reinvestment of dividends.
2. The NASDAQ Composite Index is a broad-based capitalization-weighted index of all NASDAQ Global Market and Small Cap stocks.
3. The S&P 500 Index is a broad unmanaged measure of the U.S. stock market.
4. The S&P 400 MidCap Index is a broad unmanaged measure of the U.S. stock market.
5. The Russell 2000 Index is a broad unmanaged index composed of the smallest 2,000 companies in the Russell 3000 Index.
6. Not annualized.
7. Compound annual growth rate (annualized return). Assumes all dividends were reinvested in shares of the Fund.
8. Cumulative return for the three year period was 39.35%, assuming all dividends were reinvested in shares of the Fund.
9. Cumulative return for the five year period was 118.04%, assuming all dividends were reinvested in shares of the Fund.
10. Cumulative return for the ten year period was 305.66%, assuming all dividends were reinvested in shares of the Fund.
11. The inception date of the Fund was 1/1/96.
12. Cumulative return since inception was 611.08%, assuming all dividends were reinvested in shares of the Fund.
13. The above expense ratio is from the Funds' prospectus dated April 27, 2007. Additional information pertaining to the Funds' expense ratios as of December 31, 2007 can be found in the financial highlights. Excluding the indirect costs of investing in acquired funds, total fund operating expenses would be 1.79%.
Top Ten Holdings*
(as a % of total investments, as of December 31, 2007)
| Security | | | | % of Total
Investments† | |
| 1) Express Scripts, Inc. | | ESRX | | | 6.10 | % | |
| 2) Chesapeake Energy Corp. | | CHK | | | 3.55 | % | |
| 3) Iron Mountain, Inc. | | IRM | | | 3.53 | % | |
| 4) Brooks Automation, Inc. | | BRKS | | | 3.35 | % | |
| 5) Motorola, Inc. | | MOT | | | 3.25 | % | |
| 6) Transocean, Inc. | | RIG | | | 3.25 | % | |
| 7) Johnson & Johnson | | JNJ | | | 3.18 | % | |
| 8) Thermo Fisher Scientific, Inc. | | TMO | | | 3.17 | % | |
| 9) Interactive Brokers Group, Inc. | | IBKR | | | 3.16 | % | |
| 10) Varian Medical Systems, Inc. | | VAR | | | 2.99 | % | |
Top Ten Holdings = 35.53% of Total Investments†
* Current portfolio holdings may not be indicative of future portfolio holdings.
† Percentage of total investments includes all stock and, fixed income securities plus cash minus all short positions.
Sector Weightings*
(as % of total investments, as of December 31, 2007)
| Sector | | Long(1) | | (Short)(1) | | Total(1)(2) | |
| Healthcare | | | 27.7 | % | | | — | | | | 27.7 | % | |
| Energy | | | 8.1 | % | | | — | | | | 8.1 | % | |
| Industrial | | | 5.9 | % | | | — | | | | 5.9 | % | |
| Financial services | | | 6.0 | % | | | — | | | | 6.0 | % | |
| Business services | | | 5.3 | % | | | (0.5 | )% | | | 4.8 | % | |
| Consumer | | | 1.5 | % | | | (2.7 | )% | | | (1.2 | )% | |
| Technology | | | 34.3 | % | | | (1.6 | )% | | | 32.7 | % | |
| Telecommunications/Cable | | | 10.2 | % | | | — | | | | 10.2 | % | |
| Cash | | | 5.8 | % | | | — | | | | 5.8 | % | |
* Current portfolio holdings may not be indicative of future portfolio holdings.
(1) Percentage of total investments includes all stocks and fixed income securities plus cash minus all short positions.
(2) Total represents the difference between the long exposure and the short exposure, which produces the net exposure.
Comparison of Change in Value of a $10,000 Investment

Past performance does not guarantee future results. The performance data quoted represents past performance, and current returns may be lower or higher. The investment return and net asset value will fluctuate so that an investor's shares, when redeemed, may be worth more or less than the original cost. To obtain performance information current to the most recent month-end, please visit www.needhamfunds.com. The graph above does not reflect the deduction of taxes that a shareholder would have paid on Fund distributions or on the redemption of Fund shares. Since inception, the Fund's Adviser has absorbed certain expenses of the Fund, without which returns would have been lower.
4
Annual Report 2007
NEEDHAM AGGRESSIVE GROWTH FUND (Unaudited) TICKER: NEAGX
Comparative Performance Statistics as of December 31, 2007
| | | 6 Months(5) | | 1 Year | | 3 Years(6) | | 5 Years(6) | | Since Inception(6)(9) | | Gross Expense
Ratio(11) | |
| Needham Aggressive Growth Fund(1) | | | 2.64 | % | | | 15.58 | % | | | 12.47 | %(7) | | | 15.00 | %(8) | | | 10.42 | %(10) | | | 2.24 | % | |
| S&P 500 Index(2) | | | (1.37 | )% | | | 5.49 | % | | | 8.89 | % | | | 12.29 | % | | | 6.89 | % | | | |
| NASDAQ Composite Index(3) | | | 2.29 | % | | | 10.66 | % | | | 7.97 | % | | | 14.83 | % | | | 8.23 | % | | | |
| Russell 2000 Index(4) | | | (7.52 | )% | | | (1.56 | )% | | | 7.13 | % | | | 16.09 | % | | | 10.53 | % | | | |
Past performance does not guarantee future results. The performance data quoted represents past performance, and current returns may be lower or higher. The investment return and net asset value will fluctuate so that an investor's shares, when redeemed, may be worth more or less than the original cost. To obtain performance information current to the most recent month-end, please visit www.needhamfunds.com. The returns shown in the above table and accompanying footnotes are net of expenses. The table above does not reflect the deduction of taxes that a shareholder would have paid on Fund distributions or on the redemption of Fund shares. Since inception, the Fund's Adviser has absorbed certain expenses of the Fund, without which returns would have been lower.
1. Investment results calculated after reinvestment of dividends.
2. The S&P 500 Index is a broad unmanaged measure of the U.S. stock market.
3. The NASDAQ Composite Index is a broad-based capitalization-weighted index of all NASDAQ Global Market and Small Cap stocks.
4. The Russell 2000 Index is a broad unmanaged index composed of the smallest 2,000 companies in the Russell 3000 Index.
5. Not annualized.
6. Compound annual growth rate (annualized return). Assumes all dividends were reinvested in shares of the Fund.
7. Cumulative return for the three year period was 42.28%, assuming all dividends were reinvested in shares of the Fund.
8. Cumulative return for the five year period was 101.13%, assuming all dividends were reinvested in shares of the Fund.
9. The inception date of the Fund was 9/4/01.
10. Cumulative return since inception was 87.13%, assuming all dividends were reinvested in shares of the Fund.
11. The above expense ratio is from the Funds' prospectus dated April 27, 2007. Additional information pertaining to the Funds' expense ratios as of December 31, 2007 can be found in the financial highlights. Excluding the indirect costs of investing in acquired funds, total fund operating expenses would be 2.24%.
Top Ten Holdings*
(as a % of total investments, as of December 31, 2007)
| Security | | | | % of Total
Investments† | |
| 1) Express Scripts, Inc. | | ESRX | | | 7.12 | % | |
| 2) Alliance Data Systems Corp. | | ADS | | | 5.48 | % | |
| 3) Precision Castparts Corp, | | PCP | | | 5.07 | % | |
| 4) Iron Mountain, Inc. | | IRM | | | 3.61 | % | |
| 5) Vertex Pharmaceuticals, Inc. | | VRTX | | | 3.40 | % | |
| 6) Interactive Brokers LLC | | IBKR | | | 3.39 | % | |
| 7) FCStone Group, Inc. | | FCSX | | | 3.37 | % | |
| 8) Gilead Sciences, Inc. | | GILD | | | 3.36 | % | |
| 9) Tomotherapy, Inc. | | TOMO | | | 3.34 | % | |
| 10) Dolby Laboratories, Inc. | | DLB | | | 3.15 | % | |
Top Ten Holdings = 41.29% of Total Investments†
* Current portfolio holdings may not be indicative of future portfolio holdings.
† Percentage of total investments includes all stocks plus cash minus all short positions.
Sector Weightings*
(as a % of total investments, as of December 31, 2007)
| Sector | | Long(1) | | (Short)(1) | | Total(1)(2) | |
| Healthcare | | | 28.9 | % | | | — | | | | 28.9 | % | |
| Energy | | | — | | | | — | | | | — | | |
| Industrial | | | 5.9 | % | | | — | | | | 5.9 | % | |
| Financial services | | | 7.6 | % | | | — | | | | 7.6 | % | |
| Business services | | | 16.8 | % | | | (0.3 | )% | | | 16.5 | % | |
| Consumer | | | 3.9 | % | | | (0.8 | )% | | | 3.1 | % | |
| Technology | | | 20.2 | % | | | (0.7 | )% | | | 19.5 | % | |
| Telecommunications/Cable | | | 5.7 | % | | | — | | | | 5.7 | % | |
| Cash | | | 12.8 | % | | | — | | | | 12.8 | % | |
* Current portfolio holdings may not be indicative of future portfolio holdings.
(1) Percentage of total investments includes all stock, plus cash minus all short positions.
(2) Total represents the difference between the long exposure and the short exposure, which produces the net exposure.
Comparison of Change in Value of a $10,000 Investment
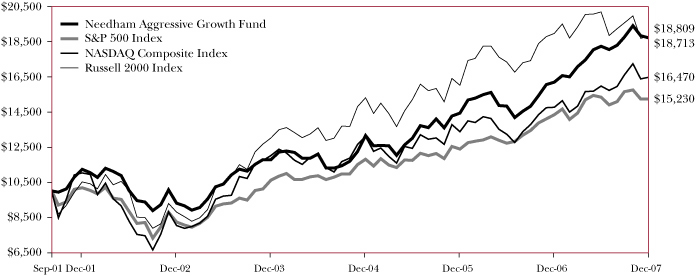
Past performance does not guarantee future results. The performance data quoted represents past performance, and current returns may be lower or higher. The investment return and net asset value will fluctuate so that an investor's shares, when redeemed, may be worth more or less than the original cost. To obtain performance information current to the most recent month-end, please visit www.needhamfunds.com. The graph above does not reflect the deduction of taxes that a shareholder would have paid on Fund distributions or on the redemption of Fund shares. Since inception, the Fund's Adviser has absorbed certain expenses of the Fund, without which returns would have been lower.
5
Needham Funds
NEEDHAM SMALL CAP GROWTH FUND (Unaudited) TICKER: NESGX
Comparative Performance Statistics as of December 31, 2007
| | | 6 Months(5) | | 1 Year | | 3 Years(6) | | 5 Years(6) | | Since Inception(6)(9) | | Gross Expense
Ratio(11) | |
| Needham Small Cap Growth Fund(1) | | | (7.07 | )% | | | (2.01 | )% | | | 2.75 | %(7) | | | 14.20 | %(8) | | | 13.31 | %(10) | | | 2.36 | % | |
| S&P 500 Index(2) | | | (1.37 | )% | | | 5.49 | % | | | 8.89 | % | | | 12.29 | % | | | 6.89 | % | | | |
| NASDAQ Composite Index(3) | | | 2.29 | % | | | 10.66 | % | | | 7.97 | % | | | 14.83 | % | | | 8.23 | % | | | |
| Russell 2000 Index(4) | | | (7.52 | )% | | | (1.56 | )% | | | 7.13 | % | | | 16.09 | % | | | 10.53 | % | | | |
Past performance does not guarantee future results. The performance data quoted represents past performance, and current returns may be lower or higher. The investment return and net asset value will fluctuate so that an investor's shares, when redeemed, may be worth more or less than the original cost. To obtain performance information current to the most recent month-end, please visit www.needhamfunds.com. The returns shown in the above table and accompanying footnotes are net of expenses. The table above does not reflect the deduction of taxes that a shareholder would have paid on Fund distributions or on the redemption of Fund shares. Since inception, the Fund's Adviser has absorbed certain expenses of the Fund, without which returns would have been lower.
1. Investment results calculated after reinvestment of dividends.
2. The S&P 500 Index is a broad unmanaged measure of the U.S. stock market.
3. The NASDAQ Composite Index is a broad-based capitalization-weighted index of all NASDAQ Global Market and Small Cap stocks.
4. The Russell 2000 Index is a broad unmanaged index composed of the smallest 2,000 companies in the Russell 3000 Index.
5. Not annualized.
6. Compound annual growth rate (annualized return). Assumes all dividends were reinvested in shares of the Fund.
7. Cumulative return for the three year period was 8.48%, assuming all dividends were reinvested in shares of the Fund.
8. Cumulative return for the five year period was 94.20%, assuming all dividends were reinvested in shares of the Fund.
9. The inception date of the Fund was 5/22/02.
10. Cumulative return since inception was 101.58%, assuming all dividends were reinvested in shares of the Fund.
11. The above expense ratio is from the Funds' prospectus dated April 27, 2007. Additional information pertaining to the Funds' expense ratios as of December 31, 2007 can be found in the financial highlights. Excluding the indirect costs of investing in acquired funds, total fund operating expenses would be 2.36%.
Top Ten Holdings*
(as a % of total investments, as of December 31, 2007)
| Security | | | | % of Total
Investments† | |
1) Bright Horizons Family
Solutions, Inc. | | BFAM | | | 7.80 | % | |
| 2) FTI Consulting, Inc. | | FCN | | | 6.36 | % | |
| 3) Genesee & Wyoming, Inc. | | GWR | | | 6.24 | % | |
| 4) Brooks Automation, Inc. | | BRKS | | | 5.97 | % | |
| 5) Copart, Inc. | | CPRT | | | 5.49 | % | |
| 6) ViaSat, Inc. | | VSAT | | | 4.44 | % | |
| 7) Dolby Laboratories, Inc. | | DLB | | | 4.17 | % | |
| 8) inVentive Health, Inc. | | VTIV | | | 3.99 | % | |
| 9) Entegris, Inc. | | ENTG | | | 3.90 | % | |
| 10) MKS Instruments, Inc. | | MKSI | | | 3.70 | % | |
Top Ten Holdings = 52.06% of Total Investments†
* Current portfolio holdings may not be indicative of future portfolio holdings.
† Percentage of total investments includes all stocks plus cash minus all short positions.
Sector Weightings*
(as a % of total investments, as of December 31, 2007)
| Sector | | Long(1) | | (Short)(1) | | Total(1)(2) | |
| Healthcare | | | 13.6 | % | | | — | | | | 13.6 | % | |
| Energy | | | — | | | | — | | | | — | | |
| Industrial | | | 11.0 | % | | | — | | | | 11.0 | % | |
| Financial Services | | | 6.4 | % | | | — | | | | 6.4 | % | |
| Business Services | | | 16.9 | % | | | — | | | | 16.9 | % | |
| Consumer | | | — | | | | (4.4 | )% | | | (4.4 | )% | |
| Technology | | | 38.2 | % | | | (2.2 | )% | | | 36.0 | % | |
| Telecommunications/Cable | | | 5.9 | % | | | — | | | | 5.9 | % | |
| Cash | | | 14.6 | % | | | — | | | | 14.6 | % | |
* Current portfolio holdings may not be indicative of future portfolio holdings.
(1) Percentage of total investments includes all stocks plus cash minus all short positions.
(2) Total represents the difference between the long exposure and the short exposure, which produces the net exposure.
Comparison of Change in Value of a $10,000 Investment
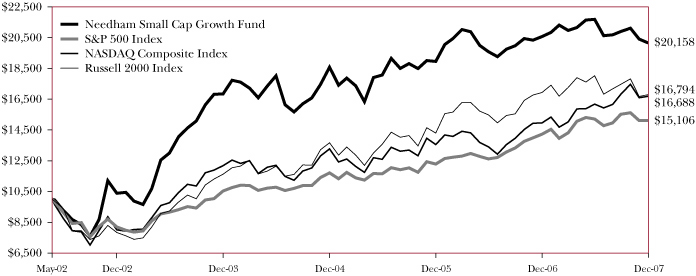
Past performance does not guarantee future results. The performance data quoted represents past performance, and current returns may be lower or higher. The investment return and net asset value will fluctuate so that an investor's shares, when redeemed, may be worth more or less than the original cost. To obtain performance information current to the most recent month-end, please visit www.needhamfunds.com. The graph above does not reflect the deduction of taxes that a shareholder would have paid on Fund distributions or on the redemption of Fund shares. Since inception, the Fund's Adviser has absorbed certain expenses of the Fund, without which returns would have been lower.
6
Annual Report 2007
Disclosure of Fund Expenses (Unaudited)
The following expense table is shown so that you can understand the impact of fees on your investment. All mutual funds have operating expenses. As a shareholder of the fund, you incur ongoing costs, which include costs for portfolio management, administrative services, and shareholder reports, among others. A fund's expenses are expressed as a percentage of its average net assets. This figure is known as the expense ratio. The following examples are intended to help you understand the ongoing costs (in dollars) of investing in each fund and to compare these costs with those of other mutual funds. The examples are based on an investment of $1,000 made at the beginning of the period shown and held for the entire period.
The expense example table below illustrates your fund's costs in two ways:
• Actual Expenses. This section helps you to estimate the actual expenses after fee waivers that you paid over the period. The "Ending Account Value" shown is derived from the fund's actual return, and "Expenses Paid During Period" shows the dollar amount that would have been paid by an investor who started with $1,000 in the fund. You may use the information here, together with the amount you invested, to estimate the expenses that you paid over the period. To do so, simply divide your account value by $1,000 (for example, a $7,500 account value divided by $1,000 = 7.5), then multiply the result by the number given for your fund under the heading entitled "Expenses Paid During Period."
• Hypothetical Expenses on a 5% Return. This section is intended to help you compare your fund's costs with those of other mutual funds. It assumes that the fund had a return of 5% before expenses during the period shown, but that the expense ratio is unchanged. In this case — because the return used is not the fund's actual return — the results do not apply to your investment. The example is useful in making comparisons because the Securities and Exchange Commission requires all mutual funds to calculate expenses based on a 5% return. You can assess your fund's cost by comparing this hypothetical example with the hypothetical examples that appear in shareholders reports of other funds.
Please note that the expenses shown in the table are meant to highlight your ongoing costs only and do not reflect any transactional costs, such as sales charges (loads), redemption fees, or exchange fees. Therefore, the table is useful in comparing ongoing costs only, and will not help you determine the relative total costs of owning different funds. In addition, if these transactional costs were included, your costs would have been higher.
For the Period July 1, 2007 to December 31, 2007
Expense Example Table
| | | Beginning
Account
Value
7/1/07 | | Ending
Account
Value
12/31/07 | | Expenses
Paid During
Period*
7/1/07-
12/31/07 | | Expense Ratio
During
Period
7/1/07-
12/31/07 | |
| Needham Growth Fund | |
| Actual Expenses | | $ | 1,000.00 | | | $ | 971.90 | | | $ | 9.39 | | | | 1.89 | % | |
| Hypothetical Example for Comparison Purposes | | $ | 1,000.00 | | | $ | 1,015.68 | | | $ | 9.60 | | | | 1.89 | % | |
| Needham Aggressive Growth Fund | |
| Actual Expenses | | $ | 1,000.00 | | | $ | 1,026.40 | | | $ | 10.83 | | | | 2.12 | % | |
| Hypothetical Example for Comparison Purposes | | $ | 1,000.00 | | | $ | 1,014.52 | | | $ | 10.76 | | | | 2.12 | % | |
| Needham Small Cap Growth Fund | |
| Actual Expenses | | $ | 1,000.00 | | | $ | 929.30 | | | $ | 12.16 | | | | 2.50 | % | |
| Hypothetical Example for Comparison Purposes | | $ | 1,000.00 | | | $ | 1,012.60 | | | $ | 12.68 | | | | 2.50 | % | |
* Expenses are equal to the average account value times the Fund's annualized expense ratio multiplied by the number of days in the most recent fiscal half-year divided by the number of days in the fiscal year.
7
Needham Funds
Needham Growth Fund
Schedule of Investments
December 31, 2007
| | | Shares | | Value | |
| Common Stocks (99.1%) | |
| Business Services (5.3%) | |
| Corvel Corp.*^ | | | 75,100 | | | $ | 1,728,802 | | |
| Iron Mountain, Inc.* | | | 200,000 | | | | 7,404,000 | | |
| SAIC, Inc.*^ | | | 100,000 | | | | 2,012,000 | | |
| | | | 11,144,802 | | |
| Consumer Services (1.6%) | |
| Avis Budget Group, Inc.* | | | 137,500 | | | | 1,787,500 | | |
| Carmax, Inc.* | | | 75,000 | | | | 1,481,250 | | |
| | | | 3,268,750 | | |
| Energy (8.1%) | |
| Chesapeake Energy Corp. | | | 190,000 | | | | 7,448,000 | | |
| Schlumberger Ltd. | | | 27,500 | | | | 2,705,175 | | |
| Transocean Sedco Forex, Inc.† | | | 47,570 | | | | 6,809,646 | | |
| | | | 16,962,821 | | |
| Financial Services (6.0%) | |
American International
Group, Inc. | | | 60,000 | | | | 3,498,000 | | |
Interactive Brokers
Group, Inc.*^ | | | 205,000 | | | | 6,625,600 | | |
| Western Union Co. | | | 100,000 | | | | 2,428,000 | | |
| | | | 12,551,600 | | |
| Healthcare Services (27.7%) | |
| CONMED Corp.*^ | | | 125,000 | | | | 2,888,750 | | |
| Covidien Ltd. | | | 43,750 | | | | 1,937,687 | | |
| Express Scripts, Inc.* | | | 175,000 | | | | 12,775,000 | | |
| Genentech, Inc.* | | | 30,000 | | | | 2,012,100 | | |
| H&Q Healthcare Investors | | | 187,268 | | | | 3,095,540 | | |
| H&Q Life Sciences Investors | | | 198,019 | | | | 2,623,752 | | |
| HealthSouth Corp.*^ | | | 150,000 | | | | 3,150,000 | | |
| Hologic, Inc.* | | | 40,000 | | | | 2,745,600 | | |
| Johnson & Johnson | | | 100,000 | | | | 6,670,000 | | |
| Merck & Co., Inc. | | | 50,000 | | | | 2,905,500 | | |
| Schering-Plough Corp. | | | 162,000 | | | | 4,315,680 | | |
Thermo Fisher
Scientific, Inc.*^ | | | 115,000 | | | | 6,633,200 | | |
| Varian Medical Systems, Inc.*^ | | | 120,000 | | | | 6,259,200 | | |
| | | | 58,012,009 | | |
| Industrial (5.9%) | |
| Houston Wire & Cable Co.^ | | | 195,000 | | | | 2,757,300 | | |
| Southwall Technologies, Inc.* | | | 728,000 | | | | 582,400 | | |
| Sypris Solutions, Inc. | | | 418,700 | | | | 2,554,070 | | |
| Walter Industries, Inc. | | | 100,000 | | | | 3,593,000 | | |
| X-Rite, Inc.*† | | | 250,000 | | | | 2,905,000 | | |
| | | | 12,391,770 | | |
| | | Shares | | Value | |
| Technology (34.3%) | |
| 3Com Corp.* | | | 475,000 | | | $ | 2,147,000 | | |
| Aspen Technology, Inc.* | | | 250,000 | | | | 4,055,000 | | |
| Atmel Corp.* | | | 750,000 | | | | 3,240,000 | | |
| Brooks Automation, Inc.*^ | | | 531,911 | | | | 7,026,544 | | |
| Datalink Corp.*^ | | | 67,000 | | | | 247,230 | | |
| Dolby Laboratories, Inc.* | | | 90,000 | | | | 4,474,800 | | |
Electro Scientific
Industries, Inc.*^ | | | 175,000 | | | | 3,473,750 | | |
| F5 Networks, Inc.* | | | 120,000 | | | | 3,422,400 | | |
| Foundry Networks, Inc.* | | | 123,750 | | | | 2,168,100 | | |
| FSI International, Inc.* | | | 558,500 | | | | 1,005,300 | | |
| Intuit, Inc.* | | | 125,000 | | | | 3,951,250 | | |
| iRobot Corp.*^ | | | 30,000 | | | | 542,400 | | |
| Merix Corp.* | | | 60,000 | | | | 279,000 | | |
| Microsemi Corp.*^ | | | 150,000 | | | | 3,321,000 | | |
| Microsoft Corp. | | | 100,000 | | | | 3,560,000 | | |
| MKS Instruments, Inc.*^ | | | 100,000 | | | | 1,914,000 | | |
| National Semiconductor Corp. | | | 180,000 | | | | 4,075,200 | | |
| Newport Corp.* | | | 250,000 | | | | 3,197,500 | | |
| Orbotech Ltd.* | | | 148,600 | | | | 2,607,930 | | |
| Parametric Technology Corp.* | | | 175,000 | | | | 3,123,750 | | |
| Progress Software Corp.* | | | 30,050 | | | | 1,012,084 | | |
| RadiSys Corp.* | | | 225,000 | | | | 3,015,000 | | |
| Seagate Technology | | | 225,000 | | | | 5,737,500 | | |
| Semitool, Inc.*^ | | | 100,000 | | | | 868,000 | | |
| Tyco Electronics Ltd.† | | | 43,750 | | | | 1,624,438 | | |
| Vishay Intertechnology, Inc.*† | | | 150,000 | | | | 1,711,500 | | |
| | | | 71,800,676 | | |
| Telecommunications/Cable (10.2%) | |
| Airvana, Inc.*^ | | | 350,000 | | | | 1,900,500 | | |
| Comcast Corp., Class A* | | | 195,000 | | | | 3,560,700 | | |
| EMS Technologies, Inc.* | | | 127,700 | | | | 3,861,648 | | |
| Motorola, Inc. | | | 425,000 | | | | 6,817,000 | | |
| ViaSat, Inc.*^ | | | 150,000 | | | | 5,164,500 | | |
| | | | 21,304,348 | | |
Total Common Stocks
(Cost $157,490,477) | | | | | | | 207,436,776 | | |
See accompanying notes to financial statements.
8
Annual Report 2007
Needham Growth Fund
Schedule of Investments (Continued)
December 31, 2007
| | | Principal
Amount | | Value | |
| Repurchase Agreements (4.2%) | |
Bear Stearns & Companies,
Inc., 1.50%, 1/2/08,
(Purchased on 12/31/07,
proceeds at maturity
$989,688, collateralized
by U.S. Treasury, 8/15/14,
value $1,020,464) | | $ | 989,606 | | | $ | 989,606 | | |
Bear Stearns & Companies,
Inc., 2.25%, 1/2/08,
(Purchased on 12/31/07,
proceeds at maturity
$1,869,081, collateralized
by U.S. Treasury Obligation,
8/15/14, value $1,924,081)
(Held as Collateral for
Securities Lending) | | | 1,868,847 | | | | 1,868,847 | | |
Bear Stearns & Companies,
Inc., 4.50%, 1/2/08,
(Purchased on 12/31/07,
proceeds at maturity
$5,914,265, collateralized
by U.S. Treasury Obligation,
8/15/14, value $6,087,729)
(Held as Collateral for
Securities Lending) | | | 5,912,787 | | | | 5,912,787 | | |
Total Repurchase Agreements
(Cost $8,771,240) | | | | | | | 8,771,240 | | |
Total Investments (103.3%)
(Cost $166,261,717) | | | | | | | 216,208,016 | | |
Total Securities Sold Short
(-4.8%) | | | | | | | (9,966,300 | ) | |
Other Assets in Excess
of Liabilities (1.5%) | | | | | | | 3,154,791 | | |
| Net Assets (100.0%) | | | | | | $ | 209,396,507 | | |
* Non-income producing security.
^ All or a portion of security was on loan as of December 31, 2007. The total value of securities on loan as of December 31, 2007 was $7,519,966.
† Security position is either entirely or partially held in a segregated account as collateral for securities sold short, aggregating a total market value of $8,809,493.
See accompanying notes to financial statements.
9
Needham Funds
Needham Growth Fund
Schedule of Securities Sold Short
December 31, 2007
| | | Shares | | Value | |
| Securities Sold Short (-4.8%) | |
| Business Services (-0.5%) | |
| VistaPrint Ltd.* | | | 25,000 | | | $ | 1,071,250 | | |
| Consumer Services (-2.7%) | |
| Amazon.com, Inc.* | | | 25,000 | | | | 2,316,000 | | |
| Fossil, Inc.* | | | 77,500 | | | | 3,253,450 | | |
| | | | 5,569,450 | | |
| Technology (-1.6%) | |
| salesforce.com, Inc.* | | | 20,000 | | | | 1,253,800 | | |
| Vocus, Inc.* | | | 60,000 | | | | 2,071,800 | | |
| | | | 3,325,600 | | |
Total Securities Sold Short
(Proceeds $5,643,517) | | | | | | | 9,966,300 | | |
| Total Securities Sold Short (-4.8%) | | | | | | | (9,966,300 | ) | |
| Total Investments (103.3%) | | | | | | | 216,208,016 | | |
Other Assets in Excess
of Liabilities (1.5%) | | | | | | | 3,154,791 | | |
| Net Assets (100.0%) | | | | | | $ | 209,396,507 | | |
* Non-income producing security.
See accompanying notes to financial statements.
10
Annual Report 2007
Needham Aggressive Growth Fund
Schedule of Investments
December 31, 2007
| | | Shares | | Value | |
| Common Stocks (89.0%) | |
| Business Services (16.8%) | |
| Alliance Data Systems Corp.* | | | 15,000 | | | $ | 1,124,850 | | |
| ChoicePoint, Inc.* | | | 10,000 | | | | 364,200 | | |
| Constant Contact, Inc.*^ | | | 10,000 | | | | 215,000 | | |
| Euronet Worldwide, Inc.* | | | 20,000 | | | | 600,000 | | |
| Iron Mountain, Inc.* | | | 20,000 | | | | 740,400 | | |
| Portfolio Recovery Associates, Inc. | | | 10,000 | | | | 396,700 | | |
| | | | 3,441,150 | | |
| Consumer Services (3.9%) | |
| Guess?, Inc. | | | 15,000 | | | | 568,350 | | |
| J. Crew Group, Inc.* | | | 5,000 | | | | 241,050 | | |
| | | | 809,400 | | |
| Financial Services (7.6%) | |
| FCStone Group, Inc.*^ | | | 15,000 | | | | 690,450 | | |
Interactive Brokers
Group, Inc.*^ | | | 21,500 | | | | 694,880 | | |
| Western Union Co. | | | 7,500 | | | | 182,100 | | |
| | | | 1,567,430 | | |
| Healthcare Services (28.9%) | |
Community Health
Systems, Inc.* | | | 15,000 | | | | 552,900 | | |
| Crucell N.V. - ADR*^ | | | 25,000 | | | | 413,500 | | |
| Express Scripts, Inc.* | | | 20,000 | | | | 1,460,000 | | |
| Gilead Sciences, Inc.* | | | 15,000 | | | | 690,150 | | |
| Hansen Medical, Inc.*^ | | | 10,000 | | | | 299,400 | | |
| Hologic, Inc.* | | | 7,800 | | | | 535,392 | | |
| NuVasive, Inc.* | | | 15,000 | | | | 592,800 | | |
| TomoTherapy, Inc.*^ | | | 35,000 | | | | 684,600 | | |
| Vertex Pharmaceuticals, Inc.* | | | 30,000 | | | | 696,900 | | |
| | | | 5,925,642 | | |
| Industrial (5.9%) | |
| Houston Wire & Cable Co. | | | 12,500 | | | | 176,750 | | |
| Precision Castparts Corp. | | | 7,500 | | | | 1,040,250 | | |
| | | | 1,217,000 | | |
| Technology (20.2%) | |
| Acme Packet, Inc.* | | | 32,500 | | | | 409,175 | | |
| Apple, Inc.* | | | 3,000 | | | | 594,240 | | |
| Autodesk, Inc.* | | | 10,000 | | | | 497,600 | | |
| Cavium Networks, Inc.*^ | | | 15,000 | | | | 345,300 | | |
| Compellent Technologies, Inc.*^ | | | 203 | | | | 2,442 | | |
| Dolby Laboratories, Inc.* | | | 13,000 | | | | 646,360 | | |
| F5 Networks, Inc.* | | | 20,000 | | | | 570,400 | | |
| Intuit, Inc.* | | | 8,500 | | | | 268,685 | | |
| Microsemi Corp.*^ | | | 20,000 | | | | 442,800 | | |
| Parametric Technology Corp.* | | | 20,000 | | | | 357,000 | | |
| | | | 4,134,002 | | |
| Telecommunications/Cable (5.7%) | |
| Airvana, Inc.*^ | | | 50,000 | | | | 271,500 | | |
| Comcast Corp., Special Class A* | | | 30,000 | | | | 543,600 | | |
| ViaSat, Inc.* | | | 10,000 | | | | 344,300 | | |
| | | | 1,159,400 | | |
Total Common Stocks
(Cost $13,155,456) | | | | | | | 18,254,024 | | |
| | | Principal
Amount | | Value | |
| Repurchase Agreements (17.1%) | |
Bear Stearns & Companies,
Inc., 1.50%, 1/2/08,
(Purchased on 12/31/07,
proceeds at maturity
$2,362,154, colleteralized
by U.S. Treasury
Obligation, 8/15/14,
value $2,434,313) | | $ | 2,361,957 | | | $ | 2,361,957 | | |
Bear Stearns & Companies,
Inc., 4.50%, 1/2/08,
(Purchased on 12/31/07,
proceeds at maturity
$1,093,562, collateralized
by U.S. Treasury
Obligation, 8/15/14,
value $1,125,626)
(Held as Collateral for
Securities Lending) | | | 1,093,289 | | | | 1,093,289 | | |
Bear Stearns & Companies,
Inc., 2.25%, 1/2/08,
(Purchased on 12/31/07,
proceeds at maturity
$57,283, collateralized
by U.S. Treasury
Obligation, 8/15/14,
value $62,318)
(Held as Collateral for
Securities Lending) | | | 57,276 | | | | 57,276 | | |
Total Repurchase Agreements
(Cost $3,512,522) | | | | | | | 3,512,522 | | |
Total Investments (106.1%)
(Cost $16,667,978) | | | | | | | 21,766,546 | | |
| Total Securities Sold Short (-1.8%) | | | | | | | (359,603 | ) | |
Liabilities in Excess of
Other Assets (-4.3%) | | | | | | | (889,397 | ) | |
| Net Assets (100.0%) | | | | | | $ | 20,517,546 | | |
* Non-income producing security.
^ All or a portion of security was on loan as of December 31, 2007. The total value of securities on loan as of December 31, 2007 was $1,117,863.
ADR American Depositary Receipt
See accompanying notes to financial statements.
11
Needham Funds
Needham Aggressive Growth Fund
Schedule of Securities Sold Short
December 31, 2007
| | | Shares | | Value | |
| Securities Sold Short (-1.8%) | |
| Business Services (-0.3%) | |
| VistaPrint Ltd.* | | | 1,250 | | | $ | 53,563 | | |
| Consumer Services (-0.8%) | |
| Fossil, Inc.* | | | 4,000 | | | | 167,920 | | |
| Technology (-0.7%) | |
| Vocus, Inc.* | | | 4,000 | | | | 138,120 | | |
Total Securities Sold Short
(Proceeds $216,033) | | | | | | | 359,603 | | |
| Total Securities Sold Short (-1.8%) | | | | | | | (359,603 | ) | |
| Total Investments (106.1%) | | | | | | | 21,766,546 | | |
Other Assets in Excess
of Liabilities (-4.3%) | | | | | | | (889,397 | ) | |
| Net Assets (100.0%) | | | | | | $ | 20,517,546 | | |
* Non-income producing security.
See accompanying notes to financial statements.
12
Annual Report 2007
Needham Small Cap Growth Fund
Schedule of Investments
December 31, 2007
| | | Shares | | Value | |
| Common Stocks (91.9%) | |
| Business Services (16.9%) | |
Bright Horizons Family
Solutions, Inc.* | | | 17,500 | | | $ | 604,450 | | |
| Copart, Inc.* | | | 10,000 | | | | 425,500 | | |
| Mobile Mini, Inc.* | | | 15,000 | | | | 278,100 | | |
| | | | 1,308,050 | | |
| Financial Services (6.4%) | |
| FTI Consulting, Inc.* | | | 8,000 | | | | 493,120 | | |
| Healthcare Services (13.6%) | |
| Advisory Board Co. (The)* | | | 4,000 | | | | 256,760 | | |
| Crucell N.V. - ADR* | | | 12,000 | | | | 198,480 | | |
| I-trax, Inc.* | | | 25,000 | | | | 88,750 | | |
| inVentiv Health, Inc.* | | | 10,000 | | | | 309,600 | | |
| TomoTherapy, Inc.* | | | 10,000 | | | | 195,600 | | |
| | | | 1,049,190 | | |
| Industrial (10.9%) | |
Genesee & Wyoming, Inc.,
Class A* | | | 20,000 | | | | 483,400 | | |
| Houston Wire & Cable Co. | | | 5,000 | | | | 70,700 | | |
| Sypris Solutions, Inc. | | | 9,815 | | | | 59,872 | | |
| X-Rite, Inc.* | | | 20,000 | | | | 232,400 | | |
| | | | 846,372 | | |
| Technology (38.2%) | |
| Acme Packet, Inc.* | | | 10,000 | | | | 125,900 | | |
| Argon ST, Inc.*^ | | | 12,500 | | | | 232,000 | | |
| Brooks Automation, Inc.* | | | 35,000 | | | | 462,350 | | |
| Callidus Software, Inc.* | | | 15,000 | | | | 77,550 | | |
| Dolby Laboratories, Inc.* | | | 6,500 | | | | 323,180 | | |
| Electro Scientific Industries, Inc.* | | | 10,000 | | | | 198,500 | | |
| Entegris, Inc.* | | | 35,000 | | | | 302,050 | | |
| iRobot Corp.* | | | 6,500 | | | | 117,520 | | |
| MICROS Systems, Inc.* | | | 4,000 | | | | 280,640 | | |
| MKS Instruments, Inc.*^ | | | 15,000 | | | | 287,100 | | |
| Netezza Corp.* | | | 3,900 | | | | 53,820 | | |
| Parametric Technology Corp.* | | | 13,000 | | | | 232,050 | | |
| Semitool, Inc.*^ | | | 30,000 | | | | 260,400 | | |
| | | | 2,953,060 | | |
| Telecommunications/Cable (5.9%) | |
| Airvana, Inc.*^ | | | 20,000 | | | | 108,600 | | |
| ViaSat, Inc.* | | | 10,000 | | | | 344,300 | | |
| | | | 452,900 | | |
Total Common Stocks
(Cost $5,332,825) | | | | | | | 7,102,692 | | |
| | | Principal
Amount | | Value | |
| Repurchase Agreements (8.6%) | |
Bear Stearns & Companies,
Inc., 2.25%, 1/2/08,
(Purchased on 12/31/07,
proceeds at maturity
$4,274, collateralized by
U.S. Treasury Obligations,
8/15/14, value, $7,790)
(Held as Collateral for
Securities Lending) | | $ | 4,274 | | | $ | 4,274 | | |
Bear Stearns & Companies.,
Inc., 1.50%, 1/2/08,
(Purchased on 12/31/07,
proceeds at maturity
$660,453, collateralized
by U.S. Treasury
Obligation, 8/15/14,
value $681,608) | | | 660,399 | | | | 660,399 | | |
Total Repurchase Agreements
(Cost $664,672) | | | | | 664,673 | | |
Total Investments (100.5%)
(Cost $5,997,497) | | | | | 7,767,365 | | |
Total Securities Sold Short
(-6.7%) | | | | | (515,355 | ) | |
Other Assets in Excess
of Liabilities (6.2%) | | | | | 474,260 | | |
| Net Assets (100.0%) | | | | $ | 7,726,270 | | |
* Non-income producing security.
^ All or a portion of security was on loan as of December 31, 2007. The total value of securities on loan as of December 31, 2007 was $4,274.
ADR American Depositary Receipt
See accompanying notes to financial statements.
13
Needham Funds
Needham Small Cap Growth Fund
Schedule of Securities Sold Short
December 31, 2007
| | | Shares | | Value | |
| Securities Sold Short (-6.7%) | |
| Consumer Services (-4.5%) | |
| Amazon.com, Inc.* | | | 2,000 | | | $ | 185,280 | | |
| Fossil, Inc.* | | | 3,750 | | | | 157,425 | | |
| | | | 342,705 | | |
| Technology (-2.2%) | |
| Vocus, Inc.* | | | 5,000 | | | | 172,650 | | |
Total Securities Sold Short
(Proceeds $247,629) | | | | | | | 515,355 | | |
| Total Securities Sold Short (-6.7%) | | | | | | | (515,355 | ) | |
| Total Investments (100.5%) | | | | | | | 7,767,365 | | |
Other Assets in Excess
of Liabilities (6.2%) | | | | | | | 474,260 | | |
| Net Assets (100.0%) | | | | | | $ | 7,726,270 | | |
* Non-income producing security.
See accompanying notes to financial statements.
14
Annual Report 2007
Statements of Assets and Liabilities
December 31, 2007
| | | Needham
Growth Fund | | Needham
Aggressive
Growth Fund | | Needham
Small Cap
Growth Fund | |
| Assets: | |
Investments, at Value (Cost $157,490,477, $13,155,456 and
$5,332,825, respectively)* | | $ | 207,436,776 | | | $ | 18,254,024 | | | $ | 7,102,692 | | |
| Repurchase Agreements, at Cost | | | 8,771,240 | | | | 3,512,522 | | | | 664,673 | | |
| Total Investments | | | 216,208,016 | | | | 21,766,546 | | | | 7,767,365 | | |
| Receivables: | |
| Deposit with Broker for Securities Sold Short | | | 12,722,530 | | | | 717,015 | | | | 536,718 | | |
| Dividends and Interest | | | 100,553 | | | | 9,363 | | | | 3,478 | | |
| Fund Shares Sold | | | 33,211 | | | | 61 | | | | 1,229 | | |
| Investment Securities Sold | | | 3,446,980 | | | | 808,163 | | | | 53,620 | | |
| Prepaid Expenses | | | 66,885 | | | | 12,009 | | | | 7,674 | | |
| Total Assets | | | 232,578,175 | | | | 23,313,157 | | | | 8,370,084 | | |
| Liabilities: | |
Securities Sold Short, at Value (Proceeds $5,643,517,
$216,033 and $247,629, respectively) | | | 9,966,300 | | | | 359,603 | | | | 515,355 | | |
| Payable upon Return of Securities Loaned | | | 7,781,634 | | | | 1,150,565 | | | | 4,274 | | |
| Payables: | |
| Investment Securities Purchased | | | 4,851,340 | | | | 1,226,616 | | | | 54,296 | | |
| Fund Shares Redeemed | | | 187,198 | | | | — | | | | 25,000 | | |
| Due to Adviser | | | 225,254 | | | | 21,975 | | | | 12,657 | | |
| Distribution Fees | | | 45,051 | | | | 4,395 | | | | 1,690 | | |
| Directors' Fees | | | 7,582 | | | | 691 | | | | 350 | | |
| Chief Compliance Officer Fees | | | 22,964 | | | | 1,967 | | | | 1,482 | | |
| Accrued Expenses and Other Liabilities | | | 94,345 | | | | 29,799 | | | | 28,710 | | |
| Total Liabilities | | | 23,181,668 | | | | 2,795,611 | | | | 643,814 | | |
| Net Assets | | $ | 209,396,507 | | | $ | 20,517,546 | | | $ | 7,726,270 | | |
Shares Issued and Outstanding $.001 Par Value
(Authorized 800,000,000, 100,000,000 and 100,000,000,
respectively) | | | 5,808,752 | | | | 1,451,337 | | | | 684,281 | | |
| Net Asset Value, Offering and Redemption Price Per Share | | $ | 36.05 | | | $ | 14.14 | | | $ | 11.29 | | |
| Components of Net Assets | |
| Paid-in Capital | | | 159,868,989 | | | | 15,041,506 | | | | 5,781,140 | | |
| Undistributed Net Investment Loss | | | (119 | ) | | | (11 | ) | | | (6 | ) | |
| Accumulated Net Realized Gains from Investment Transactions | | | 3,904,121 | | | | 521,053 | | | | 442,995 | | |
Net Unrealized Appreciation of Investment Securities and
Securities Sold Short | | | 45,623,516 | | | | 4,954,998 | | | | 1,502,141 | | |
| Total Net Assets | | $ | 209,396,507 | | | $ | 20,517,546 | | | $ | 7,726,270 | | |
* Includes securities on loan with total values of $7,519,966, $1,117,863 and $4,274, respectively.
See accompanying notes to financial statements.
15
Needham Funds
Statements of Operations
For the Year Ended December 31, 2007
| | |
Needham
Growth Fund | | Needham
Aggressive
Growth Fund | | Needham
Small Cap
Growth Fund | |
| Investment Income | |
| Dividends | | $ | 918,115 | | | $ | 16,023 | | | $ | 8,784 | | |
| Interest | | | 1,980,704 | | | | 151,380 | | | | 97,431 | | |
| Securities Lending | | | 102,820 | | | | 29,693 | | | | 4,159 | | |
| Total Investment Income | | | 3,001,639 | | | | 197,096 | | | | 110,374 | | |
| Expenses | |
| Investment Advisory Fees | | | 2,997,821 | | | | 246,893 | | | | 143,486 | | |
| Distribution Fees | | | 599,562 | | | | 49,378 | | | | 28,697 | | |
| Administration and Accounting Fees | | | 175,248 | | | | 21,256 | | | | 16,386 | | |
| Chief Compliance Officer Fees | | | 23,117 | | | | 1,883 | | | | 1,274 | | |
| Audit Fees | | | 47,133 | | | | 39,969 | | | | 39,942 | | |
| Custodian Fees | | | 76,555 | | | | 5,001 | | | | 4,291 | | |
| Dividend Expense on Securities Sold Short | | | 12,000 | | | | — | | | | — | | |
| Interest Expense* | | | 22,584 | | | | 471 | | | | 534 | | |
| Legal Fees | | | 54,429 | | | | 7,246 | | | | 17,334 | | |
| Filing Fees | | | 41,141 | | | | 21,432 | | | | 17,838 | | |
| Transfer Agent Fees | | | 129,544 | | | | 20,406 | | | | 20,452 | | |
| Directors' Fees | | | 45,933 | | | | 3,436 | | | | 1,914 | | |
| Printing Fees | | | 94,183 | | | | 4,666 | | | | 3,860 | | |
| Other Expenses | | | 141,417 | | | | 8,772 | | | | 6,991 | | |
| Total Expenses | | | 4,460,667 | | | | 430,809 | | | | 302,999 | | |
| Fees Waived by Investment Adviser | | | — | | | | — | | | | (16,045 | ) | |
| Net Expenses | | | 4,460,667 | | | | 430,809 | | | | 286,954 | | |
| Net Investment Loss | | | (1,459,028 | ) | | | (233,713 | ) | | | (176,580 | ) | |
Realized and Unrealized Gain (Loss) on Investment
Securities, Securities Sold Short and Distributions
from Underlying Funds | |
| Net Realized Gain on Investment Securities | | | 27,665,337 | | | | 3,328,006 | | | | 2,292,213 | | |
| Net Realized Loss on Securities Sold Short Transactions | | | (1,206,558 | ) | | | (210,958 | ) | | | (82,482 | ) | |
| Net Realized Gain Distributions from Underlying Funds | | | 497,721 | | | | — | | | | — | | |
Change in Unrealized Depreciation of Investment
Securities and Securities Sold Short | | | (17,763,714 | ) | | | (85,369 | ) | | | (2,104,340 | ) | |
Net Realized\Unrealized Gain (Loss) from Investment
Securities, Securities Sold Short and Distributions
from Underlying Funds | | | 9,192,786 | | | | 3,031,679 | | | | 105,391 | | |
| Change in Net Assets Resulting from Operations | | $ | 7,733,758 | | | $ | 2,797,966 | | | $ | (71,189 | ) | |
* Expense consists of interest expense on temporary borrowings and/or interest expense related to Securities Sold Short.
See accompanying notes to financial statements.
16
Annual Report 2007
Statements of Changes in Net Assets
| | | Needham Growth Fund | | Needham Aggressive
Growth Fund | | Needham
Small Cap
Growth Fund | |
| | | Year Ended
December 31,
2007 | | Year Ended
December 31,
2006 | | Year Ended
December 31,
2007 | | Year Ended
December 31,
2006 | | Year Ended
December 31,
2007 | | Year Ended
December 31,
2006 | |
| Change in Net Assets | |
| Operations: | |
| Net Investment Income (Loss) | | $ | (1,459,028 | ) | | $ | 830,281 | | | $ | (233,713 | ) | | $ | (241,717 | ) | | $ | (176,580 | ) | | $ | (281,325 | ) | |
| Net Realized Gain on investments | | | 26,956,500 | | | | 28,325,611 | | | | 3,117,048 | | | | 2,051,548 | | | | 2,209,731 | | | | 3,954,503 | | |
Change in Unrealized Appreciation
(Depreciation) investments | | | (17,763,714 | ) | | | 14,395,942 | | | | (85,369 | ) | | | 86,308 | | | | (2,104,340 | ) | | | (2,282,730 | ) | |
Change in Net Assets
Resulting from Operations | | | 7,733,758 | | | | 43,551,834 | | | | 2,797,966 | | | | 1,896,139 | | | | (71,189 | ) | | | 1,390,448 | | |
| Distributions to Shareholders from: | |
| Net Investment Income | | | (58,037 | ) | | | (773,125 | ) | | | — | | | | — | | | | — | | | | — | | |
| Short-term Gains | | | — | | | | — | | | | (150,962 | ) | | | (122,358 | ) | | | — | | | | — | | |
| Long-term Gains | | | (22,406,825 | ) | | | (25,031,542 | ) | | | (2,396,097 | ) | | | (1,536,150 | ) | | | (1,863,696 | ) | | | (3,853,526 | ) | |
| Total Distributions to Shareholders | | | (22,464,862 | ) | | | (25,804,667 | ) | | | (2,547,059 | ) | | | (1,658,508 | ) | | | (1,863,696 | ) | | | (3,853,526 | ) | |
| Capital Transactions: | |
| Shares Issued | | | 25,488,243 | | | | 158,751,587 | | | | 665,404 | | | | 320,224 | | | | 705,875 | | | | 1,055,680 | | |
| Contribution by Adviser (Note 14) | | | — | | | | 170,390 | | | | — | | | | 9,265 | | | | — | | | | 64,404 | | |
Shares Issued in Reinvestment of
Distributions | | | 21,578,427 | | | | 24,553,593 | | | | 2,543,497 | | | | 1,655,985 | | | | 1,834,244 | | | | 3,784,900 | | |
| Shares Redeemed | | | (131,632,309 | ) | | | (97,153,652 | ) | | | (992,894 | ) | | | (2,297,155 | ) | | | (8,126,667 | ) | | | (5,982,735 | ) | |
Change in Net Assets from
Capital Transactions | | | (84,565,639 | ) | | | 86,321,918 | | | | 2,216,007 | | | | (311,681 | ) | | | (5,586,548 | ) | | | (1,077,751 | ) | |
| Change in Net Assets | | | (99,296,743 | ) | | | 104,069,085 | | | | 2,466,914 | | | | (74,050 | ) | | | (7,521,433 | ) | | | (3,540,829 | ) | |
| Net Assets | |
| Beginning of Period | | | 308,693,250 | | | | 204,624,165 | | | | 18,050,632 | | | | 18,124,682 | | | | 15,247,703 | | | | 18,788,532 | | |
| End of Period | | $ | 209,396,507 | | | $ | 308,693,250 | | | $ | 20,517,546 | | | $ | 18,050,632 | | | $ | 7,726,270 | | | $ | 15,247,703 | | |
Undistributed Net Investment
Income (Loss) | | $ | (119 | ) | | $ | 58,037 | | | $ | (11 | ) | | $ | — | | | $ | (6 | ) | | $ | — | | |
| Share Transactions: | |
| Number of Shares Issued | | | 644,891 | | | | 4,026,551 | | | | 44,038 | | | | 22,425 | | | | 49,799 | | | | 59,385 | | |
| Number of Shares Reinvested | | | 598,740 | | | | 636,210 | | | | 179,499 | | | | 121,318 | | | | 161,750 | | | | 267,107 | | |
| Number of Shares Redeemed | | | (3,347,292 | ) | | | (2,482,957 | ) | | | (65,583 | ) | | | (170,146 | ) | | | (592,125 | ) | | | (360,744 | ) | |
| Change in Shares | | | (2,103,661 | ) | | | 2,179,804 | | | | 157,954 | | | | (26,403 | ) | | | (380,576 | ) | | | (34,252 | ) | |
See accompanying notes to financial statements.
17
Needham Funds
Needham Growth Fund
Financial Highlights
| (For a Share Outstanding | | Year Ended December 31, | |
| Throughout each Period) | | 2007 | | 2006 | | 2005 | | 2004 | | 2003 | |
| Net Asset Value, Beginning of Period | | $ | 39.01 | | | $ | 35.69 | | | $ | 31.17 | | | $ | 29.35 | | | $ | 19.92 | | |
| Investment Operations | |
| Net Investment Income (Loss) | | | (0.25 | ) | | | 0.10 | | | | (0.38 | ) | | | (0.84 | ) | | | (0.38 | ) | |
Net Realized and Unrealized Gains (Losses)
on Investments | | | 1.45 | | | | 6.29 | | | | 4.90 | | | | 2.62 | | | | 9.81 | | |
| Total from Investment Operations | | | 1.20 | | | | 6.39 | | | | 4.52 | | | | 1.78 | | | | 9.43 | | |
| Less Distributions | |
| Net Investment Income | | | (0.01 | ) | | | (0.09 | ) | | | — | | | | — | | | | — | | |
| Net Realized Gains | | | (4.15 | ) | | | (3.00 | ) | | | — | | | | — | | | | — | | |
| Total Distributions | | | (4.16 | ) | | | (3.09 | ) | | | — | | | | — | | | | — | | |
| Contribution by Adviser | | | — | | | | 0.02 | (a) | | | — | | | | 0.04 | (b) | | | — | | |
| Net Asset Value, End of Period | | $ | 36.05 | | | $ | 39.01 | | | $ | 35.69 | | | $ | 31.17 | | | $ | 29.35 | | |
| Total Return | | | 3.09 | % | | | 18.05 | %(a) | | | 14.50 | % | | | 6.20 | %(b) | | | 47.34 | % | |
| Net Assets, End of Period (000's) | | $ | 209,397 | | | $ | 308,693 | | | $ | 204,624 | | | $ | 287,372 | | | $ | 364,320 | | |
| Ratios/Supplemental Data | |
| Ratio of Net Expenses to Average Net Assets | | | 1.86 | % | | | 1.79 | % | | | 1.94 | % | | | 2.21 | % | | | 2.16 | % | |
Ratio of Net Expenses to Average Net Assets
(excluding interest and dividend expense) | | | 1.85 | % | | | 1.78 | % | | | 1.91 | % | | | 1.78 | % | | | 1.77 | % | |
Ratio of Net Investment Income (Loss) to Average
Net Assets | | | (0.61 | )% | | | 0.31 | % | | | (1.01 | )% | | | (1.51 | )% | | | (1.38 | )% | |
| Portfolio Turnover Rate | | | 41 | % | | | 48 | % | | | 16 | % | | | 15 | % | | | 42 | % | |
(a) In May 2006, the Adviser made a payment to the Growth Fund which increased the total return by 0.06%.
(b) In October 2004, the Adviser made a payment to the Growth Fund which increased the total return by 0.14%.
See accompanying notes to financial statements.
18
Annual Report 2007
Needham Aggressive Growth Fund
Financial Highlights
| (For a Share Outstanding | | Year Ended December 31, | |
| Throughout each Period) | | 2007 | | 2006 | | 2005 | | 2004 | | 2003 | |
| Net Asset Value, Beginning of Period | | $ | 13.96 | | | $ | 13.73 | | | $ | 12.85 | | | $ | 11.51 | | | $ | 9.09 | | |
| Investment Operations | |
| Net Investment Loss | | | (0.16 | ) | | | (0.19 | ) | | | (0.26 | ) | | | (0.36 | ) | | | (0.23 | ) | |
Net Realized and Unrealized Gains (Losses)
on Investments | | | 2.34 | | | | 1.83 | | | | 1.49 | | | | 1.70 | | | | 2.65 | | |
| Total from Investment Operations | | | 2.18 | | | | 1.64 | | | | 1.23 | | | | 1.34 | | | | 2.42 | | |
| Less Distributions | |
| Net Realized Gains | | | (2.00 | ) | | | (1.42 | ) | | | (0.35 | ) | | | — | | | | — | | |
| Total Distributions | | | (2.00 | ) | | | (1.42 | ) | | | (0.35 | ) | | | — | | | | — | | |
| Contribution by Adviser | | | — | | | | 0.01 | (a) | | | — | | | | — | | | | — | | |
| Net Asset Value, End of Period | | $ | 14.14 | | | $ | 13.96 | | | $ | 13.73 | | | $ | 12.85 | | | $ | 11.51 | | |
| Total Return | | | 15.58 | % | | | 12.22 | %(a) | | | 9.70 | % | | | 11.64 | % | | | 26.62 | % | |
| Net Assets, End of Period (000's) | | $ | 20,518 | | | $ | 18,051 | | | $ | 18,125 | | | $ | 17,000 | | | $ | 17,719 | | |
| Ratios/Supplemental Data | |
| Ratio of Net Expenses to Average Net Assets | | | 2.18 | % | | | 2.24 | % | | | 2.50 | % | | | 2.61 | % | | | 2.52 | % | |
Ratio of Net Expenses to Average Net Assets
(excluding interest and dividend expense) | | | 2.18 | % | | | 2.23 | % | | | 2.50 | % | | | 2.50 | % | | | 2.50 | % | |
Ratio of Net Expenses to Average Net Assets
(excluding waivers and reimbursement of expenses) | | | 2.18 | % | | | 2.24 | % | | | 2.78 | % | | | 3.15 | % | | | 3.22 | % | |
| Ratio of Net Investment Loss to Average Net Assets | | | (1.18 | )% | | | (1.35 | )% | | | (2.01 | )% | | | (2.25 | )% | | | (2.24 | )% | |
Ratio of Net Investment Loss to Average Net Assets
(excluding waivers and reimbursement of expenses) | | | (1.18 | )% | | | (1.35 | )% | | | (2.29 | )% | | | (2.79 | )% | | | (2.94 | )% | |
| Portfolio Turnover Rate | | | 64 | % | | | 55 | % | | | 69 | % | | | 64 | % | | | 87 | % | |
(a) In May 2006, the Adviser made a payment to the Aggressive Growth Fund which increased the total return by 0.08%.
See accompanying notes to financial statements.
19
Needham Funds
Needham Small Cap Growth Fund
Financial Highlights
| (For a Share Outstanding | | Year Ended December 31, | |
| Throughout each Period) | | 2007 | | 2006 | | 2005 | | 2004 | | 2003 | |
| Net Asset Value, Beginning of Period | | $ | 14.32 | | | $ | 17.09 | | | $ | 18.53 | | | $ | 16.84 | | | $ | 10.38 | | |
| Investment Operations | |
| Net Investment Loss | | | (0.26 | ) | | | (0.26 | ) | | | (0.31 | ) | | | (0.37 | ) | | | (0.06 | ) | |
Net Realized and Unrealized Gains (Losses)
on Investments | | | (0.02 | ) | | | 1.61 | | | | 0.66 | | | | 2.11 | | | | 6.52 | | |
| Total from Investment Operations | | | (0.28 | ) | | | 1.35 | | | | 0.35 | | | | 1.74 | | | | 6.46 | | |
| Less Distributions | |
| Net Realized Gains | | | (2.75 | ) | | | (4.18 | ) | | | (1.79 | ) | | | (0.05 | ) | | | — | | |
| Total Distributions | | | (2.75 | ) | | | (4.18 | ) | | | (1.79 | ) | | | (0.05 | ) | | | — | | |
| Contribution by Adviser | | | — | | | | 0.06 | (a) | | | — | | | | — | | | | — | | |
| Net Asset Value, End of Period | | $ | 11.29 | | | $ | 14.32 | | | $ | 17.09 | | | $ | 18.53 | | | $ | 16.84 | | |
| Total Return | | | (2.01 | )% | | | 8.52 | %(a) | | | 2.01 | % | | | 10.34 | % | | | 62.24 | % | |
| Net Assets, End of Period (000's) | | $ | 7,726 | | | $ | 15,248 | | | $ | 18,789 | | | $ | 25,895 | | | $ | 27,616 | | |
| Ratios/Supplemental Data | |
| Ratio of Net Expenses to Average Net Assets | | | 2.50 | % | | | 2.36 | % | | | 2.44 | % | | | 2.52 | % | | | 2.27 | % | |
Ratio of Net Expenses to Average Net Assets
(excluding interest and dividend expense) | | | 2.50 | % | | | 2.36 | % | | | 2.44 | % | | | 2.50 | % | | | 2.26 | % | |
Ratio of Net Expenses to Average Net Assets
(excluding waivers and reimbursement of expenses) | | | 2.64 | % | | | 2.36 | % | | | 2.58 | % | | | 2.63 | % | | | 3.25 | % | |
| Ratio of Net Investment Loss to Average Net Assets | | | (1.54 | )% | | | (1.61 | )% | | | (1.64 | )% | | | (1.91 | )% | | | (1.68 | )% | |
Ratio of Net Investment Loss to Average Net Assets
(excluding waivers and reimbursement of expenses) | | | (1.68 | )% | | | (1.61 | )% | | | (1.78 | )% | | | (2.02 | )% | | | (2.66 | )% | |
| Portfolio Turnover Rate | | | 38 | % | | | 115 | % | | | 104 | % | | | 68 | % | | | 67 | % | |
(a) In May 2006, the Adviser made a payment to the Small Cap Growth Fund which increased the total return by 0.35%.
See accompanying notes to financial statements.
20
Annual Report 2007
Notes to Financial Statements
1. Organization
Needham Growth Fund ("NGF"), Needham Aggressive Growth Fund ("NAGF") and Needham Small Cap Growth Fund ("NSCGF") (each, a "Portfolio" and collectively the "Portfolios"), are portfolios of The Needham Funds, Inc. (the "Fund"), which is registered under the Investment Company Act of 1940 as a non-diversified, open-end management investment company. The Fund was organized as a Maryland corporation on October 12, 1995.
2. Significant Accounting Policies
The following is a summary of significant accounting policies followed by the Fund in the preparation of its financial statements. These policies are in conformity with accounting principles generally accepted in the United States of America ("GAAP").
Security Valuation: Investments in securities (including options) listed or traded on a nationally recognized securities exchange are valued at the last quoted sales price on the date the valuations are made. Portfolio securities and options positions for which market quotations are readily available are stated at the NASDAQ Official Closing Price or the last sale price reported by the principal exchange for each such security as of the exchange's close of business, as applicable. Securities and options for which no sale has taken place during the day and securities which are not listed on an exchange are valued at the mean of the current closing bid and asked prices. All other securities for which market prices are not readily available are valued at their fair value in accordance with Fair Value Procedures established by the Board of Directors. The Fund's Fair Value Procedures are implemented and monitored by a Fair Value Committee (the "Committee") designated by the Board. When a security is valued in accordance with the Fair Value Procedures, the Committee determines a value after taking into consideration any relevant information that is reasonably available to the Committee. Some of the more common reasons that may necessitate that a security be valued pursuant to these Fair Value Procedures include, but are not limited to: the security's trading has been halted or suspended; the security has been de-listed from a national exchange; the security's primary trading market is temporarily closed at a time when under normal conditions it would be open; or the security's primary pricing source is not able or willing to provide a price. The assets of each Portfolio may also be valued on the basis of valuations provided by a pricing service approved by, or on behalf of, the Board of Directors.
Investment Transactions: Changes in holdings of portfolio securities for the Portfolios shall be reflected no later than in the first calculation on the first business day following the trade date for purposes of calculating the Portfolio's daily net asset value per share. For financial reporting purposes, however, portfolio security transactions are reported on trade date of the last business day of the reporting period. The cost (proceeds) of investments sold (bought to cover) is determined on a specific identification basis for the purpose of determining gains or losses on sales and buys to cover short positions. Dividend income and distributions to shareholders are recorded on the ex-dividend date. Interest income is recorded on an accrual basis.
Allocation of Expenses: Expenses directly attributable to a Portfolio are charged directly to that Portfolio, while expenses which are attributable to more than one Portfolio are allocated among the respective Portfolios based upon relative net assets or some other reasonable method.
Distributions to Shareholders: Dividends from net investment income, if any, are declared and paid annually for the Portfolios. Distributable net realized gains, if any, are declared and distributed at least annually.
Use of Estimates: The preparation of financial statements in accordance with GAAP requires management to make estimates and assumptions that affect the reported amounts and disclosures in the financial statements. Actual results could differ from those estimates and those differences could be material.
Federal Income Taxes: It is the policy of each Portfolio to continue to qualify as a regulated investment company by complying with the provisions available to certain investment companies, as defined in applicable sections of the Internal Revenue Code, and to make distributions of net investment income and net realized capital gains sufficient to relieve it from all, or substantially all, federal income taxes. Accordingly, no provision for federal income tax is required.
Accounting Pronouncements: Effective June 29, 2007, the Fund adopted Financial Accounting Standards Board ("FASB") Interpretation No. 48, Accounting for Uncertainty in Income Taxes ("FIN 48"). FIN 48 provides guidance for how uncertain tax positions should be recognized, measured, presented and disclosed in the financial statements. FIN 48 requires the affirmative evaluation of tax positions taken or expected to be taken in the course of preparing the Fund's tax returns to determine whether it is more-likely-than-not (i.e., greater than 50-percent) that each tax position will be sustained upon examination by a taxing authority based on the technical merits of the position. A tax position that meets the more-likely-than-not recognition threshold is measured to determine the amount of benefit to recognize in the financial statements. Differences between tax positions taken in a tax return and amounts recognized in the financial statements will generally result in an increase in a liability for taxes payable (or a reduction of a tax refund receivable), including the recognition of any related interest and penalties as an operating expense. Implementation of FIN 48 included a review of tax positions taken in tax years that remain subject to examination by tax authorities (i.e., the last four tax year ends and the interim tax period since then, as applicable). The adoption of FIN 48 did not impact the Fund's net assets or result of operations.
In September 2006, the FASB issued Statement of Financial Accounting Standards No. 157 ("SFAS 157"), "Fair Value Measurements." This standard establishes a single
21
Needham Funds
Notes to Financial Statements (Continued)
authoritative definition of fair value, sets out a framework for measuring fair value and requires additional disclosures about fair value measurements. SFAS 157 applies to fair value measurements already required or permitted by existing standards. SFAS 157 is effective for financial statements issued for fiscal years beginning after November 15, 2007 and interim periods within those fiscal years. The changes to current accounting principles generally accepted in the United States of America from the application of this Statement relate to the definition of fair value, the methods used to measure fair value and the expanded disclosures about fair value measurements. As of December 31, 2007, the Fund does not believe the adoption of SFAS 157 will impact the financial statement amounts; however, additional disclosures may be required about the inputs used to develop the measurements and the effect of certain of the measurements o n changes in net assets for the period.
3. Investment Advisory and Administrative Services
The Fund has engaged Needham Investment Management L.L.C. (the "Adviser") to manage its investments. The Fund pays the Adviser a fee at the annual rate of 1.25% of the average daily net assets of each Portfolio.
The Adviser has contractually agreed to waive its fee for, and to reimburse expenses of, NAGF and NSCGF in an amount that limits annual operating expenses (excluding interest expense and dividend expense on securities sold short) to not more than 2.50% of the average daily net assets of NAGF and NSCGF for the year ended December 31, 2007.
For the year ended December 31, 2007, the Adviser waived advisory fees in the amount of $16,045 for NSCGF.
The Fund and Citi Fund Services Ohio, Inc. (the "Administrator" and formerly BISYS Fund Services Ohio, Inc.) are parties to a Master Services Agreement. The Administrator provides administrative and fund accounting services pursuant to this agreement and, in consideration of these services, receives a fee computed daily and paid monthly at an annual rate equal to 0.07% of the first $750 million of the average daily net assets of the Portfolios, and 0.065% of the average daily net assets of the Portfolios in excess of $750 million. The Administrator also provides transfer agent and other services pursuant to this agreement for additional fees.
Certain officers of the Fund are also officers of the Adviser, Administrator, and/or Needham & Company, LLC (the "Distributor"). Such officers receive no fees from the Fund for serving as officers of the Fund. Each of the three Independent Directors receives a quarterly retainer of $3,000 and a per-meeting fee of $500. Each Independent Director is also a member of the Fund's Audit Committee and receives a fee of $500 per meeting attended. The Adviser provides an employee to serve as Chief Compliance Officer for the Fund and to provide certain related services, and receives an annual fee for this service as approved by the Fund's Board of Directors.
4. Distribution Plan
The Fund has adopted a Distribution Plan pursuant to Rule 12b-1 under the Investment Company Act of 1940. Under the plan, each Portfolio pays Needham & Company, LLC and any other distributor or financial institution with which the Fund has an agreement with respect to each Portfolio, a fee at an annual rate of 0.25% of each Portfolio's daily average net assets. For the year ended December 31, 2007, NGF, NAGF and NSCGF incurred distribution fees in the amount of $599,562, $49,378 and $28,697, respectively. For the year ended December 31, 2007, NGF, NAGF and NSCGF each paid 12b-1 fees to Needham & Company, LLC in the amount of $135,106, $32,121 and $13,984, respectively.
5. Temporary Borrowings
The Fund has entered into an agreement with the Custodial Trust Company ("CTC") for temporary borrowing purposes, including the meeting of redemption requests that otherwise might require the untimely disposition of securities. Interest is calculated daily based on the Federal Funds Rate plus one percent. Each Portfolio may borrow from banks up to 25% of its total assets and may pledge its assets in connection with these borrowings, provided that no additional investments shall be made while borrowings exceed 5% of total assets.
There were no outstanding borrowings by the Portfolios at December 31, 2007.
6. Securities Lending
The Portfolios may lend their respective portfolio securities, provided that with regard to each Portfolio (i) the loan is secured continuously by collateral consisting of U.S. Government securities, cash, or cash equivalents adjusted daily to have a market value at least equal to the current market value of the securities loaned, (ii) the Portfolio may at any time call the loan and regain the securities loaned, (iii) the Portfolio receives any interest or dividends paid on the loaned securities, and (iv) the aggregate market value of securities loaned will not at any time exceed such percentage of the total assets of the Portfolio as the Board of Directors may establish, but not to exceed 20%. In addition, it is anticipated that the Portfolio may share with the borrower some of the income received on the collateral for the loan or that it will be paid a premium for the loan. Before a Portfolio enters into a loan, the Adviser co nsiders relevant facts including the creditworthiness of the borrower. The risks in lending portfolio securities consist of possible delay in recovery of the securities and possible loss of rights in the collateral should the borrower fail financially.
As of December 31, 2007:
| | | Value of
Securities on Loan | | Value of
Collateral | |
| NGF | | $ | 7,519,966 | | | $ | 7,781,634 | | |
| NAGF | | | 1,117,863 | | | | 1,150,565 | | |
| NSCGF | | | 4,274 | | | | 4,274 | | |
22
Annual Report 2007
Notes to Financial Statements (Continued)
7. Repurchase Agreements
The Portfolios will only enter into repurchase agreements where (i) the underlying securities are of the type which the Portfolio's investment policies would allow the Portfolio to purchase directly, (ii) the market value of the underlying security, including accrued interest, will at all times be equal to or exceed the fair or market value of the repurchase agreement, and (iii) payment for the underlying securities is made only upon physical delivery or evidence of book-entry transfer to the account of the custodian or a bank acting as agent. A Portfolio will not enter into a repurchase agreement with a maturity of more than seven business days if, as a result, more than 15% of the value of its net assets would then be invested in such repurchase agreements and other illiquid securities.
The repurchase price generally equals the price paid by the Portfolio plus interest negotiated on the basis of current short-term rates, which may be more or less than the rate on the underlying portfolio securities. Repurchase agreements will be fully collateralized at all times.
8. Option Transactions
Each Portfolio may invest in options contracts to reduce its exposure to fluctuations in the prices of portfolio securities and to prevent losses if the prices of such securities decline. Similarly, such investments may protect a Portfolio against fluctuations in the value of securities in which the Portfolio is about to invest.
The Portfolios may write call and put options on securities they own or have the right to acquire, and may purchase put and call options on individual securities and indices written by others. Put and call options give the holder the right to sell or purchase, respectively, a specified amount of a security at a specified price on a certain date.
The Portfolios are subject to market risk associated with changes in the value of the underlying financial instrument, as well as the risk of loss of appreciation if a counterparty fails to perform. For exchange-traded contracts, the exchange acts as the counterparty to specific transactions, and therefore, bears the risk of delivery to and from counterparties of specific positions.
Put and call options purchased are accounted for in the same manner as portfolio securities. The cost of securities acquired through the exercise of call options is increased by the premium paid. The proceeds from securities sold through the exercise of put options are decreased by the premiums paid. Options on stock indices differ from options on securities in that the exercise of an option on a stock index does not involve delivery of the actual underlying security and is settled in cash only.
When a Portfolio writes an option, the premium received by the Portfolio is recorded as a liability and is subsequently adjusted to the current market value of the option written. Premiums received from writing options which have expired are recorded by the Portfolio on the expiration date as realized gains from option transactions. When a Portfolio enters into a closing purchase transaction, the Portfolio realizes a gain or loss equal to the difference between the cost of the closing purchase transaction and the premium received when the option was written. If a written call option is exercised, the premium received is added to the proceeds from the sale of the underlying security in determining whether the Portfolio has a realized gain or loss. If a written put option is exercised, the premium received reduces the cost basis of the securities purchased. In writing an option, the Portfolio bears the market risk of an unfavorable change in the price of the security underlying the written option.
In the normal course of business, certain Portfolios may trade and hold certain fair-valued derivative contracts which constitute guarantees under FASB Interpretation 45. Such contracts include written options where a Portfolio would be obligated to purchase or sell a specified security at a specified price if the option is exercised by the counterparty. The maximum payouts for these contracts are limited to the number of contracts written and the related strike price. The maximum payout amount could be offset by the subsequent sale of assets obtained via the execution of a payout event.
None of NGF, NAGF or NSCGF had purchased or written options for the year ended December 31, 2007.
9. Short Sale Transactions
During the year ended December 31, 2007, each Portfolio sold securities short. Upon selling a security short, the Portfolios record a receivable for the settlement amount and a corresponding liability, which is marked-to-market to reflect current value. Certain securities owned by each respective Portfolio are segregated as collateral while the short sales are outstanding. At December 31, 2007, the market value of securities separately segregated to cover short positions were approximately $8,809,493, $0 and $0 for NGF, NAGF and NSCGF, respectively. Additionally, included in Deposit with Brokers for Securities Sold Short are $6,050,000, $340,000 and $289,089 pledged as collateral with brokers in connection with open short positions for NGF, NAGF and NSCGF, respectively. Securities sold short at December 31, 2007 and their related market values and proceeds are set forth in the preceding Schedule of Securities Sold Short.
10. Investment Transactions
The following summarizes the aggregate amount of purchases and sales of investment securities and securities sold short, excluding short-term securities, during the year ended December 31, 2007:
| | | Purchases | | Sales | |
| NGF | | $ | 83,271,510 | | | $ | 82,474,260 | | |
| NAGF | | | 13,499,684 | | | | 10,582,891 | | |
| NSCGF | | | 3,675,758 | | | | 11,077,249 | | |
During the year ended December 31, 2007, NGF, NAGF and NSCGF each incurred and paid brokerage commissions to
23
Needham Funds
Notes to Financial Statements (Continued)
Needham & Company, LLC in the amount of $8,533, $225 and $1,312, respectively.
11. Financial Instruments
In the normal course of its business, the Portfolios may trade various financial instruments with off-balance sheet risk. These financial instruments include securities sold short and exchange traded options. Generally, these financial instruments represent future commitments to purchase or sell other financial instruments at specific terms at specified future dates. Each of these financial instruments contains varying degrees of off-balance sheet risk whereby changes in the market values of the securities underlying the financial instruments may be in excess of the amounts recognized in the financial statements.
Securities sold short represent obligations of the Portfolios to make future delivery of specific securities and, correspondingly, create an obligation to purchase the securities at market prices prevailing at a later delivery date (or to deliver the securities if already owned by the Portfolios). As a result, short sales create the risk that the Portfolios' ultimate obligation to satisfy the delivery requirements may exceed the amount of the proceeds initially received on the liability recorded in the financial statements.
12. Contractual Obligations
Under the Fund's organizational documents, its officers and Directors are indemnified against certain liabilities arising out of the performance of their duties to the Fund. In addition, in the ordinary course of business, the Fund enters into contracts that contain a variety of indemnifications. The Fund's maximum exposure under these arrangements is unknown. However, the Fund has not had prior claims or losses pursuant to these contracts and expects the risk of loss to be remote.
13. Federal Income Taxes
No provision for federal income taxes is required since the Fund intends to continue to qualify as a regulated investment company under Subchapter M of the Internal Revenue Code and distribute substantially all of its taxable income and capital gains to shareholders. Because income tax regulations differ from generally accepted accounting principles, the timing and character of income and capital gain distributions determined in accordance with tax regulations can differ from income and capital gains recognized for financial reporting purposes. Accordingly, the character of distributions and the composition of net assets for tax purposes can differ from those reflected in the financial statements. These book/tax differences may be temporary or permanent in nature. Temporary differences are generally due to differing book and tax treatment for the timing of the recognition of gains and losses on securities, including post-October losses. Permanent differences are generally due to differing treatment of net investment losses. To the extent these differences are permanent, they are charged or credited to paid-in capital, accumulated net realized gain (loss), or accumulated net investment income (loss), as appropriate, in the period the differences arise. These reclassifications have no effect on net assets or net asset value per share of each Portfolio.
As of December 31, 2007, the cost, gross unrealized appreciation and gross unrealized depreciation on securities, including proceeds from securities sold short, for federal income tax purposes were as follows:
| | | Tax Cost | | Tax
Unrealized
Appreciation | | Tax
Unrealized
Depreciation | | Net
Unrealized
Appreciation
(Depreciation) | |
| NGF | | $ | 159,687,583 | | | $ | 61,783,413 | | | $ | 17,833,729 | | | $ | 43,949,684 | | |
| NAGF | | | 16,290,965 | | | | 5,757,015 | | | | 996,186 | | | | 4,760,829 | | |
| NSCGF | | | 5,761,437 | | | | 1,965,792 | | | | 475,220 | | | | 1,490,572 | | |
As of December 31, 2007, the components of distributable earnings (loss) on a tax basis were as follows:
| | | NGF | | NAGF | | NSCGF | |
Undistributed long-term
capital gains | | $ | 5,577,952 | | | $ | 715,222 | | | $ | 454,564 | | |
Accumulated capital
and other losses | | | (119 | ) | | | (11 | ) | | | (6 | ) | |
Unrealized
appreciation | | | 43,949,684 | | | | 4,760,829 | | | | 1,490,572 | | |
Total accumulated
earnings | | $ | 49,527,517 | | | $ | 5,476,040 | | | $ | 1,945,130 | | |
The tax character of distributions paid during the fiscal year ended December 31, 2007 were as follows:
| | | NGF | | NAGF | | NSCGF | |
| Ordinary income | | $ | 58,037 | | | $ | — | | | $ | — | | |
Net short-term
capital gains | | | — | | | | 150,962 | | | | — | | |
Net long-term
capital gains | | | 22,406,825 | | | | 2,396,097 | | | | 1,863,696 | | |
Total distributions
paid | | $ | 22,464,862 | | | $ | 2,547,059 | | | $ | 1,863,696 | | |
The tax character of distributions paid during the fiscal year ended December 31, 2006 were as follows:
| | | NGF | | NAGF | | NSCGF | |
| Ordinary income | | $ | 773,125 | | | $ | — | | | $ | — | | |
Net short-term
capital gains | | | — | | | | 122,358 | | | | — | | |
Net long-term
capital gains | | | 25,031,542 | | | | 1,536,150 | | | | 3,853,526 | | |
Total distributions
paid | | $ | 25,804,667 | | | $ | 1,658,508 | | | $ | 3,853,526 | | |
Reclassifications during the year ended December 31, 2007 were as follows:
| | | NGF | | NAGF | | NSCGF | |
Undistributed net
investment income | | $ | 1,458,909 | | | $ | 233,702 | | | $ | 176,574 | | |
Accumulated net
realized gains (losses) | | | (1,113,720 | ) | | | (199,898 | ) | | | (115,093 | ) | |
| Paid-in capital | | | (345,189 | ) | | | (33,804 | ) | | | (61,481 | ) | |
24
Annual Report 2007
Notes to Financial Statements (Continued)
Capital losses after October 31 ("post-October losses") within the taxable year are deemed to arise on the first business day of the Portfolios' next taxable year. After October 31, 2007, NGF, NAGF and NSCGF incurred and will elect to defer currency losses in the approximate amount of $119, $11 and $6, respectively.
14. Other Matters
In October 2004, the Adviser made a capital contribution to NGF of $417,668. In May 2006, the Adviser made a capital contribution to NGF of $170,390, to NAGF of $9,265 and to NSCGF of $64,404.
25
Needham Funds
Report of Independent Registered Public Accounting Firm
To the Board of Directors and Shareholders of
The Needham Funds, Inc.:
We have audited the accompanying statements of assets and liabilities of The Needham Funds, Inc. (the "Funds") (comprising the Needham Growth Fund, Needham Aggressive Growth Fund and Needham Small Cap Growth Fund), including the schedules of investments, as of December 31, 2007, and the related statements of operations for the year then ended, the statements of changes in net assets for each of the two years in the period then ended, and the financial highlights for each of the five years in the period then ended. These financial statements and financial highlights are the responsibility of the Funds' management. Our responsibility is to express an opinion on these financial statements and financial highlights based on our audits.
We conducted our audits in accordance with the standards of the Public Company Accounting Oversight Board (United States). Those standards require that we plan and perform the audits to obtain reasonable assurance about whether the financial statements and financial highlights are free of material misstatement. We were not engaged to perform an audit of the Funds' internal control over financial reporting. Our audits included consideration of internal control over financial reporting as a basis for designing audit procedures that are appropriate in the circumstances, but not for the purpose of expressing an opinion on the effectiveness of the Funds' internal control over financial reporting. Accordingly, we express no such opinion. An audit also includes examining, on a test basis, evidence supporting the amounts and disclosures in the financial statements and financial highlights, assessing the accounting principles used and significant est imates made by management, and evaluating the overall financial statement presentation. Our procedures included confirmation of securities owned as of December 31, 2007, by correspondence with the custodian and brokers or by other appropriate auditing procedures where replies from brokers were not received. We believe that our audits provide a reasonable basis for our opinion.
In our opinion, the financial statements and financial highlights referred to above present fairly, in all material respects, the financial position of each of the portfolios constituting The Needham Funds, Inc. at December 31, 2007, the results of their operations for the year then ended, the changes in their net assets for each of the two years in the period then ended, and their financial highlights for each of the five years in the period then ended, in conformity with U.S. generally accepted accounting principles.
Columbus, Ohio
February 21, 2008
26
Annual Report 2007
Fund Management
Information pertaining to the Directors and officers of the fund is set forth below. The Statement of Additional Information (SAI) includes additional information about the Directors and is available without charge, upon request, by calling 800-625-7071.
The address of each individual is 445 Park Avenue, New York, NY 10022-2606. Each Director serves until the next annual shareholders meeting and until his successor is elected and qualified. There is no stated term of office for Directors.
Name, Age and Position
with the Fund | | Term of Office and Length of Term Served by Director/Officer | | Portfolios in the Fund Complex Overseen by Director/Officer | | Principal Occupation(s) During Past 5 Years and Other Directorships Held by Director/Officer | |
| Independent Directors | |
|
John W. Larson, 72,
Director | | Indefinite;
since 2006 | | Three | | Partner at the law firm of Morgan, Lewis & Bockius LLP since 2003. Partner at the law firm of Brobeck, Phleger & Harrison LLP from 1969 until retiring in January 2003. From July 1971 to September 1973 worked in government service as Assistant Secretary of the United States Department of the Interior and Counselor to George P. Shultz, Chairman of the Cost of Living Council. Director of Sangamo BioSciences, Inc. | |
|
James P. Poitras, 65,
Director | | Indefinite;
since 1996 | | Three | | Currently retired. Director/Chairman of four small high-technology firms. Founder, Chairman, President and Chief Executive Officer of Integrated Silicon Systems (a computer software company) from 1985 to 1995. | |
|
F. Randall Smith, 69,
Director | | Indefinite;
since 1996 | | Three | | Founder and Chief Executive and Investment Officer of Capital Counsel LLC (a registered investment adviser) since September 1999. Co-Founder and Managing Partner of Train, Smith Counsel (a registered investment adviser) from 1975 to 1999. | |
|
| Interested Director | |
|
George A. Needham, 64,
Chairman, President and Director | | Indefinite;
since 1996 | | Three | | Chairman of the Board and Chief Executive Officer of The Needham Group, Inc. and Needham Holdings, LLC since December 2004. Chairman of the Board and Chief Executive Officer of Needham Asset Management, LLC since April 2006. Chairman of the Board from 1996 to December 2004 and Chief Executive Officer from 1985 to December 2004 of Needham & Company, LLC. | |
|
| Officers | |
|
James K. Kloppenburg, 52,*
President, Needham Investment
Management L.L.C. | | One year;
since 2001 | | Three | | President, Needham Investment Management L.L.C. since January 2007 and Managing Director of Needham Asset Management, LLC since April 2006. Executive Vice President of Needham Investment Management L.L.C. from April 2001 to January 2007. Managing Director of Needham & Company, LLC from April 2001 to March 2006. Managing Director of Hambrecht & Quist from 1995 to 2001. | |
|
Glen W. Albanese, 36,
Treasurer and Secretary | | One year;
since 1998 | | Three | | Chief Financial Officer of The Needham Group, Inc. and Needham Holdings, LLC since December 2004. Chief Financial Officer and Managing Director of Needham Asset Management, LLC since April 2006 and of Needham & Company, LLC since January 2000. | |
|
James Abbruzzese, 38,
Chief Compliance Officer | | One year;
since 2004 | | Three | | Chief Compliance Officer of Needham Asset Management, LLC since April 2006 and of Needham & Company, LLC since July 1998. | |
|
Mr. Needham is deemed to be an "interested persons", as defined in the Investment Company Act of 1940, because of his affiliation with the Fund's investment adviser, Needham Investment Management L.L.C. and/or because he is an officer of the Fund and may be deemed to be an "affiliated person" of Needham Investment Management L.L.C. and of Needham & Company, LLC.
* Mr. Kloppenburg resigned as President of Needham Investment Management L.L.C. and Managing Director of Needham Asset Management, LLC as of January 2008.
27
Needham Funds
Supplemental Data (Unaudited)
Disclosure of Portfolio Holdings
The Needham Funds, Inc. (the "Fund") files a Form N-Q with the Securities and Exchange Commission (the "SEC") no more than sixty days after the Fund's first and third fiscal quarters. For the Fund, this would be for the fiscal quarters ending March 31 and September 30. Form N-Q includes a complete schedule of the Fund's portfolio holdings as of the end of those fiscal quarters. The Fund's N-Q filings can be found free of charge on the SEC's website at http://www.sec.gov, or they may be reviewed and copied at the SEC's Public Reference Room in Washington, D.C. (call 800-SEC-0330 for information on the operation of the Public Reference Room).
Voting Proxies on Fund Portfolio Securities
A description of the policies and procedures that the Fund uses to determine how to vote proxies relating to portfolio securities and information regarding how the Fund voted proxies relating to portfolio securities during the most recent 12-month period ended June 30 are available without charge, upon request, by calling 800-625-7071 or on the SEC's website at http://www.sec.gov.
Board Consideration and Approval of Investment Advisory Agreement
On October 18, 2007, at a meeting called for the purpose of voting on such approval, the Board of Directors, including all of the Directors who are not parties to the Advisory Agreement or interested persons of any such party (the "Independent Directors"), approved the continuance of the Fund's Restated Investment Advisory Agreement dated October 21, 2004 (the "Advisory Agreement") with Needham Investment Management L.L.C. (the "Adviser"). In so doing, the Board studied materials specifically relating to the Advisory Agreement provided by the Adviser and counsel to the Fund, including peer group comparisons consisting of performance and expense information for other investment companies with the ability to sell securities short. The Board considered a variety of factors, including the following:
The Board considered the nature, extent and quality of the services to be provided by the Adviser to the Fund pursuant to the Advisory Agreement, including the Adviser's competence and integrity; research capabilities; implementation and enforcement of compliance procedures and financial reporting controls; and adherence to the investment objectives, policies and restrictions of each Portfolio. The Board also reviewed information provided by the Adviser as to its methodology, research and analysis, including, but not limited to, its company visits, which it employs in selecting securities for the Fund's Portfolios. The Board considered the qualifications, capabilities and experience of the Fund's portfolio manager, as well as that of other personnel employed by the Adviser who are responsible for providing services to the Fund, including the fact that a sophisticated caliber of personnel was both needed and provided to meet the needs of the shareholders of each Portfolio specifically with respect to investments in securities sold short. The Board concluded that the Adviser fulfilled all of its responsibilities in accordance with its obligations under the Advisory Agreement.
The Board also evaluated the investment performance of each Portfolio and the Adviser relative to the NASDAQ Composite Index, the S&P 500 Index, the S&P 400 MidCap Index and the Russell 2000 Index for the third quarter of 2007, the year-to-date, 1 year, 3 years, 5 years, 10 years (with respect to the Growth Fund) and since inception, as well as peer group expense data provided by the Adviser, as of September 30, 2007, considering the Fund's conservative investment strategy. The Board noted the performance of each Portfolio over the 1-, 3- and 5-year periods on an absolute basis and relative to its peers, with heavier consideration given to 3-year performance.
Additionally, the Board reviewed information on the fee structure of the Advisory Agreement, including the costs of the services to be provided and the profits to be realized by the Adviser and its affiliates from their relationship with the Fund, as evidenced by the Adviser's profitability analysis, including specifically the profitability of the Growth Fund and the unprofitable nature of the Aggressive Growth Fund and the Small Cap Growth Fund. The profitability analysis consisted of revenues and expenses by category and profit or loss for each Portfolio for the year ended December 31, 2006. The Board also reviewed comparisons of the rates of compensation paid to managers of funds in each Portfolio's peer group, including funds with the ability to short, and Lipper data relating to average expenses and advisory fees for funds comparable in size, character and investment strategy to each Portfolio. Based on the information prov ided, the Board determined that, though the Fund's fee structure is slightly higher than the average of its respective peer funds, it is still competitive with its peer group and both fair and reasonable given the services provided by the Adviser.
The Board considered the Fund's net investment advisory fees, 12b-1 fees, marketing expenses, rent expenses, professional fees and other expenses, compensation expenses and total expenses. The Board also considered the amount and nature of fees paid by shareholders. The Board considered the fact that the Adviser has contractually agreed to waive a portion of its fees (for the Aggressive Growth Fund and the Small Cap Growth Fund) and noted that the fee waiver could be discontinued at any time after December 31, 2008.
The Adviser provided information on peer-group comparisons consisting of no load mid-cap core, no load mid-cap growth and no load small-cap growth funds comparable in size to the Portfolios. The materials compared each Portfolio's assets under management; management fee; total expenses; performance for the year-to-date, 1-year and 3-year periods ended September 30, 2007; and overall Morningstar rating as of September 30, 2007. It was noted that the Fund's management fee and expense ratios are within the average range compared to its respective peer funds.
28
Annual Report 2007
The Board considered the issue of economies of scale and noted that, given the small size and lack of growth in assets of each Portfolio, consideration of fee breakpoints was premature.
Based on its evaluation of all material aspects of the Advisory Agreement, including the foregoing factors and such other information believed to be reasonably necessary or relevant in the exercise of their reasonable business judgment to evaluate the terms of the Advisory Agreement, the Board, including all of the Independent Directors voting separately, concluded that the continuation of the Advisory Agreement would be in the best interest of each Portfolio's shareholders, and determined that the compensation to the Adviser provided for in the Advisory Agreement is fair and reasonable in light of the services to be performed.
The Advisory Agreement provides that it shall continue in effect from year to year with respect to each Portfolio after an initial two-year term as long as it is approved at least annually (i) by a vote of a majority of the outstanding voting securities of each Portfolio (as defined in the 1940 Act) or by a vote of a majority of the Directors of The Needham Funds, Inc., on behalf of each Portfolio, and (ii) a vote of a majority of the Directors who are not parties to the Advisory Agreement or "interested persons" of any party thereto, cast in person at a meeting called for the purpose of voting on such approval. The Advisory Agreement may be terminated on 60 days written notice by either party and will terminate automatically if it is assigned within the meaning of the 1940 Act.
Federal Income Tax Information
During the fiscal year ended December 31, 2007, the Funds declared long-term realized gain distributions in the following amounts:
| | | 15% Capital Gains | |
| NGF | | $ | 22,406,825 | | |
| NAGF | | | 2,396,097 | | |
| NSCGF | | | 1,863,696 | | |
For the fiscal year ended December 31, 2007, the following percentage of the total ordinary income distributions paid by the Funds qualify for the distributions received deduction available to corporate shareholders.
| | | Distributions Received Deduction | |
| NGF | | | 94 | % | |
For the fiscal year ended December 31, 2007, distributions paid by the Funds may be subject to a maximum tax rate of 15%, as provided for by the Jobs and Growth Growth Tax Relief Reconciliation Act of 2003. The Funds intend to designate the maximum amount allowable as taxed at a maximum rate of 15%. Complete information will be reported in conjunction with your 2007 Form 1099-DIV.
| | | Qualified Dividend Income | |
| NGF | | | 95 | % | |
| NAGF | | | 2 | % | |
29
[THIS PAGE INTENTIONALLY LEFT BLANK]
[THIS PAGE INTENTIONALLY LEFT BLANK]
[THIS PAGE INTENTIONALLY LEFT BLANK]

445 Park Avenue
New York, New York 10022-2606
1-800-625-7071
Investment Adviser:
Needham Investment Management L.L.C.
445 Park Avenue
New York, NY 10022-2606
President
George A. Needham
Executive Vice President
and Portfolio Manager
James K. Kloppenburg
Needham Growth Fund
Needham Aggressive Growth Fund
Needham Small Cap Growth Fund
Directors
George A. Needham
John W. Larson
James P. Poitras
F. Randall Smith
Distributor:
Needham & Company, LLC
445 Park Avenue
New York, NY 10022-2606
212-371-8300
Administrator, Shareholder Servicing
Agent and Transfer Agent:
Citi Fund Services Ohio, Inc.
3435 Stelzer Road
Columbus, OH 43219
Custodian:
Custodial Trust Company
101 Carnegie Center
Princeton, NJ 08540
Counsel:
Fulbright & Jaworski L.L.P.
666 Fifth Avenue
New York, NY 10103
Independent Registered Public Accounting Firm:
Ernst & Young LLP
1100 Huntington Center
41 South High Street
Columbus, OH 43215
Item 2. Code of Ethics.
(a) The registrant has adopted a code of ethics that applies to the registrant’s principal executive officer, principal financial officer, principal accounting officer or controller, or persons performing similar functions. This code of ethics is included as an Exhibit.
(b) During the period covered by the report, with respect to the registrant’s code of ethics that applies to its principal executive officer, principal financial officer, principal accounting officer or controller, or persons performing similar functions; there have been no amendments to, nor any waivers granted from, a provision that relates to any element of the code of ethics definition enumerated in paragraph (b) of this Item 2.
Item 3. Audit Committee Financial Expert.
3(a)(1) The registrant’s board of directors has determined that the registrant has at least one audit committee financial expert serving on its audit committee.
3(a)(2) The audit committee financial expert is F. Randall Smith, who is “independent” for purposes of this Item 3 of Form N-CSR.
Item 4. Principal Accountant Fees and Services.
| | Current Year | | Previous Year | |
Audit Fees | | $ | 125,000 | | $ | 119,000 | |
Audit-Related Fees | | $ | 0 | | $ | 0 | |
Tax Fees | | $ | 18,900 | | $ | 18,000 | |
All Other Fees | | $ | 0 | | $ | 0 | |
[Disclose the audit committee’s pre-approval policies and procedures described in paragraph (c)(7) of Rule 2-01 of Regulation
S-X.]
[(e) If any of the services were NOT pre-approved, but otherwise approved by the audit committee, disclose the percentage of each catgegory above.]
[(f) If greater than 50 percent, disclose the percentage of hours expended on the principal accountant’s engagement to audit the registrant’s financial statements for the most recent fiscal year that were attributed to work performed by persons other than the principal accountant’s full-time, permanent employees.]
[(g) Disclose the aggregate non-audit fees billed by the registrant’s accountant for services rendered to the registrant, and rendered to the registrant’s investment adviser (not including any sub-adviser whose role is primarily portfolio management and is subcontracted with or overseen by another investment adviser), and any entity controlling, controlled by, or under common control with the adviser that provides ongoing services to the registrant, were $28,770 and $17,000 for each of the last two fiscal years of the registrant.]
[(h) Disclose whether the registrant’s audit committee of the board of directors has considered whether the provision of nonaudit services that were rendered to the registrant’s investment adviser (not including any subadviser whose role is primarily portfolio management and is subcontracted with or overseen by another investment adviser), and any entity controlling, controlled by, or under common control with the investment adviser that provides ongoing services to the registrant that were not pre-approved pursuant to paragraph (c)(7)(ii) of Rule 2-01 of Regulation S-X is compatible with maintaining the principal accountant’s independence.]
Item 5. Audit Committee of Listed Registrants.
Not applicable.
Item 6. Schedule of Investments.
Not applicable.
Item 7. Disclosure of Proxy Voting Policies and Procedures for Closed-End Management Investment Companies.
Not applicable.
Item 8. Portfolio Managers of Closed-End Management Investment Companies.
Not applicable.
Item 9. Purchases of Equity Securities by Closed-End Management Investment Company and Affiliated Purchasers.
Not applicable.
Item 10. Submission of Matters to a Vote of Security Holders.
Not applicable.
Item 11. Controls and Procedures.
(a)The registrant’s principal executive officer and principal financial officer have concluded, based on their evaluation of the registrant’s disclosure controls and procedures as conducted within 90 days of the filing date of this report, that these disclosure controls and procedures are adequately designed and are operating effectively to ensure that information required to be disclosed by the registrant on Form N-CSR is recorded, processed, summarized and reported within the time periods specified in the Securities and Exchange Commission’s rules and forms.
(b)There were no changes in the registrant’s internal control over financial reporting (as defined in Rule 30a-3(d) under the Act (17 CFR 270.30a-3(d)) that occurred during the second fiscal quarter of the period covered by this report that have materially affected or are reasonably likely to materially affect, the registrant’s internal control over financial reporting.
Item 12. Exhibits.
(a)(1) The code of ethics that is the subject of the disclosure required by Item 2 is attached hereto.
(a)(2) Certifications pursuant to Rule 30a-2(a) are attached hereto.
(a)(3) Not applicable.
(b) Certifications pursuant to Rule 30a-2(b) are furnished herewith.
SIGNATURES
Pursuant to the requirements of the Securities Exchange Act of 1934 and the Investment Company Act of 1940, the registrant has duly caused this report to be signed on its behalf by the undersigned, thereunto duly authorized.
(Registrant) | The Needham Funds, Inc. |
| |
By (Signature and Title)* | /s/ George A. Needham, President |
| George A. Needham, President (Principal Executive Officer) |
| |
Date | March 10, 2008 | |
| | | | | |
Pursuant to the requirements of the Securities Exchange Act of 1934 and the Investment Company Act of 1940, this report has been signed below by the following persons on behalf of the registrant and in the capacities and on the dates indicated.
By (Signature and Title)* | /s/ George A. Needham, President |
| George A. Needham, President (Principal Executive Officer) |
| |
Date | March 10, 2008 | |
| | | |
By (Signature and Title)* | /s/ Glen W. Albanese, Treasurer and Secretary |
| Glen W. Albanese, Treasurer and Secretary (Principal Financial Officer) |
| |
Date | March 10, 2008 | |
| | | |
* Print the name and title of each signing officer under his or her signature.