Item 1: Report to Shareholders
 |
| Health Sciences Fund | June 30, 2007 |
The views and opinions in this report were current as of June 30, 2007. They are not guarantees of performance or investment results and should not be taken as investment advice. Investment decisions reflect a variety of factors, and the managers reserve the right to change their views about individual stocks, sectors, and the markets at any time. As a result, the views expressed should not be relied upon as a forecast of the fund’s future investment intent. The report is certified under the Sarbanes-Oxley Act, which requires mutual funds and other public companies to affirm that, to the best of their knowledge, the information in their financial reports is fairly and accurately stated in all material respects.
REPORTS ON THE WEB
Sign up for our E-mail Program, and you can begin to receive updated fund reports and prospectuses online rather than through the mail. Log in to your account at troweprice.com for more information.
Manager’s Letter
Fellow Shareholders
The U.S. stock market and the Health Sciences Fund posted solid first-half gains. Despite a sharp sell-off in late February, strong global economic growth, reasonable corporate earnings expansion, relatively low interest rates, and accelerating merger and acquisition activity fueled a stock market rally. Over the past six months, your fund surpassed the performance of its Lipper peer group and the S&P 500 Index.
HIGHLIGHTS
• Health care stocks, as measured by the health care segment in the S&P 500 Index, underperformed the broad market in the first half.
• The Health Sciences Fund posted solid returns for the past six months that outperformed the S&P 500 and its Lipper peer group average.
• We remain focused on companies with new and important medicines for unmet medical needs.
• We believe that generating outperformance in the health care sector will be increasingly dependent on stock selection, rather than an emphasis on a particular subsector of the health care industry.

We are pleased to report that the Health Sciences Fund generated strong absolute and relative results for the 6- and 12-month periods ended June 30, 2007. As shown in the table, your portfolio’s 8.65% return in the first half was better than the 6.96% result for the broad market as measured by the S&P 500 Index and the 5.77% gain for the Lipper Health/Biotechnology Funds Index. For the 12-month period, the fund posted a 20.30% return, modestly trailing the S&P 500 and easily distancing its Lipper peer group.
The Health Sciences Fund has delivered consistently strong longer-term performance compared with the universe of health care funds. Lipper ranked the fund in the top 6% of the Lipper health care funds universe for the past year and in the top 7% for the 10-year period ended June 30, 2007. Your fund also placed in the top 11% and 12% of its peer group for the three- and five-year periods, respectively. (Based on cumulative total return, Lipper ranked the Health Sciences Fund 9 out of 174, 16 out of 152, 16 out of 135, and 2 out of 32 funds for the 1-, 3-, 5-, and 10-year periods ended June 30, 2007, respectively. Past performance cannot guarantee future results.)
MARKET ENVIRONMENT
The U.S. economy weakened in the first quarter of the year. Ongoing softness in the housing market and faltering consumer spending contributed to the slowdown. However, the economy improved somewhat in the second quarter, as reports of stronger employment and business spending buoyed investor confidence. Over the past six months, inflation remained higher than the Federal Reserve’s 2% target due in part to rising energy and commodity prices. As a result, the Fed decided to keep short-term interest rates unchanged over the period. In this environment, growth stocks—for the first time in many reporting periods—outperformed value shares.
Health care stocks, as measured by the health care segment in the S&P 500 Index, underperformed in the first half due to weakness in biotechnology stocks. Within the Lipper Health/Biotechnology Funds Index, the best performers were life sciences and products and devices, the two smallest segments of the health care sector. The services and pharmaceuticals groups, which account for almost half of the benchmark, generated above-average results, while the biotech segment, which has been volatile, generated modest, below-average gains.
In many years, we see one or two areas of the health care sector that look poised for superior performance but, in our view, there doesn’t appear to be a dominant theme in our sector at this time. As we have written in recent shareholder reports, we continue to believe stock selection will have far more bearing on our performance than sector allocation decisions.
PORTFOLIO REVIEW
BIOTECHNOLOGY AND PHARMACEUTICALS
In many instances, Wall Street refers to smaller, therapeutic-based companies as biotechs. Originally, a firm was classified as a biotech because its research and development focused on large molecules, or proteins, which usually lead to injectable therapeutics. On the other hand, pharmaceutical firms typically work with small molecules and develop pills, tablets, or capsules. However, the labels no longer describe a meaningful distinction.

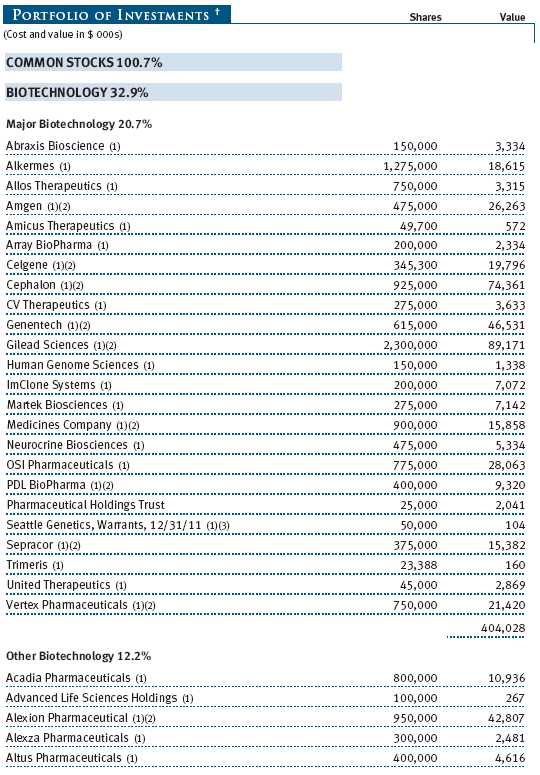
Our significant allocation to the biotechnology sector stems from our belief in the power of the pharmaceutical industry’s business model—the discovery, development, manufacture, and commercialization of medicines or therapeutic devices. Typically, large pharmaceutical companies also have a large base of revenues and income, and one drug—even if it is extremely successful—may not be enough to affect the bottom line significantly. Biotechnology companies, however, tend to be smaller, and the successful introduction of one drug can materially affect its revenues and earnings. We are especially focused on those companies with new and important medicines or treatments for unmet medical needs. Although this strategy encompasses more risk because a firm that is highly dependent on the success of a single drug can decline significantly on bad news, we manage this risk in part by owning a diversified basket of stocks and controlling our position sizes.
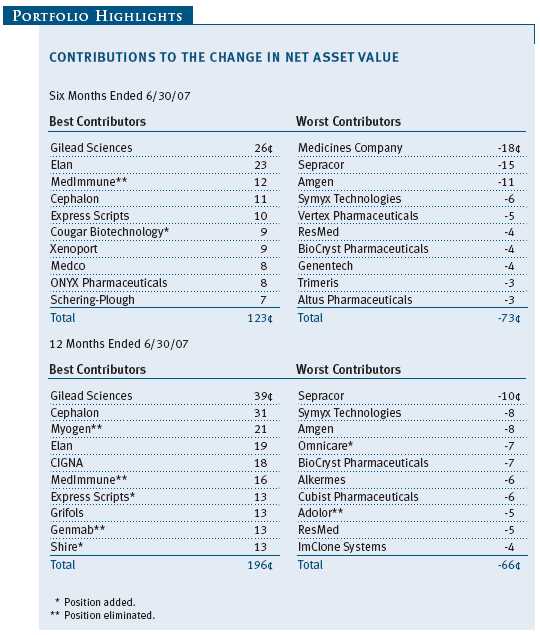
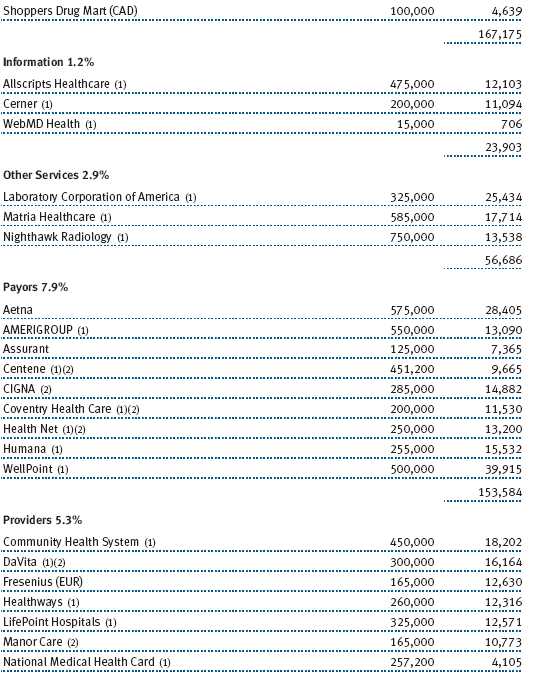
Over the past six months, the portfolio’s largest holding and best contributor was Gilead Sciences, which climbed more than 20%, largely due to the success of its suite of drugs for the treatment of HIV. Gilead and Bristol-Myers Squibb partnered to produce and market Atripla, a once-a-day pill that combines two of Gilead’s HIV medicines and one of Bristol-Myers’. The drug continues to generate robust sales. We are impressed with Gilead’s management team and its history of good execution in all aspects of its business. The company is dominant in its core therapeutics business and continues to generate strong sales and earnings growth. (Please refer to the portfolio of investments for a complete list of holdings and the amount each represents in the portfolio.)
The portfolio’s second-best first-half contributor was Elan. A little over two years ago, its multiple sclerosis medication Tysabri, at that time the most promising drug we had ever evaluated, suffered a near-fatal blow due to revelations that it was associated with a very rare and serious side effect called progressive multifocal leukoen-cephalopathy (PML). Three patients taking Tysabri in combination with other drugs contracted this viral infection while on the drug in clinical trials. After voluntarily withdrawing the drug from the market in 2005, Elan reintroduced it in mid-2006 after the risk of contracting PML was better characterized and a risk management program was implemented to minimize the danger. More than 10,000 commercial patients are currently taking Tysabri, and we believe the drug will enjoy strong sales as long as the risk of PML remains low.
Following a flat stock performance in 2006, Elan’s shares rallied strongly in 2007, as the market came to share our enthusiasm for Elan’s pipeline of drugs to treat Alzheimer’s. The company has partnered with Wyeth to develop AAB-001, a monoclonal antibody to treat Alzheimer’s. While there are still plenty of uncertainties, AAB-001 could become just the type of drug we look for to transform a company.
MedImmune and Cephalon, a pair of major biotechnology companies, were also among our top performers in the first half, but for very different reasons. MedImmune was acquired in a $15.6 billion merger with AstraZeneca, and the shares jumped thanks to a significant takeover premium. Cephalon has been a core portfolio holding for the past several years. Following solid gains in the second half of 2006, the shares continued to trend higher in 2007. The company’s major products, Provigil, Nuvigil, Fentora, and two new cancer compounds expected to launch in late 2008, should generate significant earnings growth for the next several years.
We also had several large performance detractors in the biotech/pharma sector in the first half. Investors tend to view Medicines Company (0.80% of the fund on June 30) as a single-product company. The company’s most significant drug is Angiomax, an anticoagulant for cardiology patients. The stock has a history of volatility surrounding its commercial results and concerns regarding the patent protection for Angiomax. Although the stock declined over the past six months, we see Medicines Company as a core small-cap specialty pharmaceutical holding, and continue to believe that investors are overlooking the company’s progress with its pipeline, specifically Cleviprex, an injectable, rapid-acting anti-hypertensive. Therefore, we intend to be patient with this holding.
Sepracor and Amgen were also among the portfolio’s largest first-half detractors. Sepracor’s recent earnings came in significantly short of projections. We believe Lunesta, a sleep aid, is an innovative product that will generate approximately $600 million in U.S. sales in 2007. However, those results are lower than our earlier forecasts. The other major disappointment for Sepracor in the first half was a negative reimbursement action taken by the Centers for Medicare and Medicaid Services (CMS) that will reduce sales of Xopenex, Sepracor’s drug for the treatment of asthma.
Amgen, one of the portfolio’s larger holdings for the past few years, hit the skids in the first half of this year. The company’s woes stem from the Food and Drug Administration’s new warning labels regarding the safe use of Amgen’s top-selling anti-anemia drugs Aranesp and Epogen. In addition, Amgen also faces the threat of reduced reimbursement coverage from CMS later this year. We decided to take some profits on the stock, but given Amgen’s sharp management team and significant resources, we have maintained a sizable position.
Services
The portfolio generated strong results from our services holdings in the first half due in part to several significant shifts. Within the managed health care segment, two of our three largest holdings at the beginning of the year were UnitedHealth Group and Cigna. Over the past six months we eliminated UnitedHealth. It had been a marvelous investment for many years. However, an options backdating scandal, which led to the resignation of the CEO, and lackluster operating performance made us believe the stock would only be an average performer. Cigna, on the other hand, is a stock that we believe still has plenty of room on the upside. Allowing for the three-for-one split, the stock is up about 50% in a short period of time. Our sales reflect trimming back a significant winner, rather than a fundamental concern.
WellPoint, the portfolio’s other large holding in the services segment, provided a modest six-month contribution, and because we continue to favor its prospects we added modestly to our position. We also added two significant new services holdings during the period, Laboratory Corporation of America and Matria Healthcare, both of which provided modest contributions to first-half returns.
OUTLOOK
We believe that generating outperformance in the health care sector will be increasingly dependent on effective stock selection, rather than an emphasis on a particular subsector of the health care industry. As always, we seek the strongest companies in each of the four main areas of health care: pharmaceuticals, biotechnology, services, and medical devices. Although each subsector offers attractive growth opportunities, we favor therapeutic companies developing novel products for unmet medical needs.
The current environment for health care earnings is good and should remain relatively stable regardless of global economic developments. We believe the relative performance of the stocks in the health care sector is going to be more dependent on the S&P 500’s earnings results than earnings in the health care sector itself. Our reasoning is as follows: If the S&P 500’s earnings slow as Wall Street currently projects, then investors are likely to gravitate toward health care stocks because of their earnings stability. If the market’s earnings expand rapidly, then the health care sector will likely continue to be an average performer.
Because health care is a heavily regulated industry, we think the key risk for the sector is a dramatic change in Washington, especially relating to the industry’s reimbursement and regulatory oversight. Any meaningful shift in what a company can expect to receive when it brings a new medicine to the marketplace would be disruptive. On the flip side, we think the sector holds tremendous opportunity. We have an aging population that demands the best in health care, an explosion in scientific understanding that should lead to better medicines, and many diseases for which we have no therapies. As long as society continues to desire new therapies to soften the impact of disease and government price controls are not imposed, health care should remain an area of significant growth for the long term.
We appreciate your continued confidence and support.
Respectfully submitted,

Kris H. Jenner
President of the fund and chairman of its Investment Advisory Committee
July 26, 2007
The committee chairman has day-to-day responsibility for managing the portfolio and works with committee members in developing and executing the fund’s investment program.
RISK OF GROWTH INVESTING
Growth stocks can be volatile for several reasons. Since these companies usually invest a high portion of earnings in their businesses, they may lack the dividends of value stocks that can cushion stock prices in a falling market. Also, earnings disappointments often lead to sharply falling prices because investors buy growth stocks in anticipation of superior earnings growth.
RISK OF HEALTH SCIENCES FUND INVESTING
Funds that invest only in specific industries will experience greater volatility than funds investing in a broad range of industries. Companies in the health sciences field are subject to special risks such as increased competition within the health care industry, changes in legislation or government regulations, reductions in government funding, product liability or other litigation, and the obsolescence of popular products.
GLOSSARY
Lipper indexes: Fund benchmarks that consist of a small number of the largest mutual funds in a particular category as tracked by Lipper Inc.
Russell 2000 Index: Consists of the smallest 2,000 companies in the Russell 3000 Index. Performance is reported on a total return basis.
S&P 500 Stock Index: An index consisting of 500 stocks chosen for market size, liquidity, and industry group representation. It is a market value-weighted index, with each stock’s weight in the index proportionate to its market value.
Performance and Expenses
| GROWTH OF $10,000 |
This chart shows the value of a hypothetical $10,000 investment in the fund over the past 10 fiscal year periods or since inception (for funds lacking 10-year records). The result is compared with benchmarks, which may include a broad-based market index and a peer group average or index. Market indexes do not include expenses, which are deducted from fund returns as well as mutual fund averages and indexes.

| AVERAGE ANNUAL COMPOUND TOTAL RETURN |
This table shows how the fund would have performed each year if its actual (or cumulative) returns for the periods shown had been earned at a constant rate.

| FUND EXPENSE EXAMPLE |
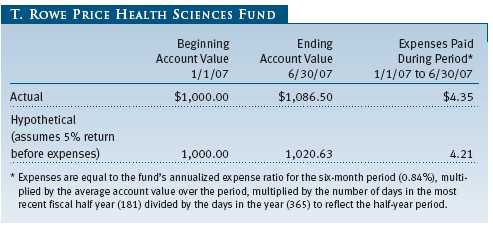
As a mutual fund shareholder, you may incur two types of costs: (1) transaction costs, such as redemption fees or sales loads, and (2) ongoing costs, including management fees, distribution and service (12b-1) fees, and other fund expenses. The following example is intended to help you understand your ongoing costs (in dollars) of investing in the fund and to compare these costs with the ongoing costs of investing in other mutual funds. The example is based on an investment of $1,000 invested at the beginning of the most recent six-month period and held for the entire period.
Actual Expenses
The first line of the following table (“Actual”) provides information about actual account values and expenses based on the fund’s actual returns. You may use the information in this line, together with your account balance, to estimate the expenses that you paid over the period. Simply divide your account value by $1,000 (for example, an $8,600 account value divided by $1,000 = 8.6), then multiply the result by the number in the first line under the heading “Expenses Paid During Period” to estimate the expenses you paid on your account during this period.
Hypothetical Example for Comparison Purposes
The information on the second line of the table (“Hypothetical”) is based on hypothetical account values and expenses derived from the fund’s actual expense ratio and an assumed 5% per year rate of return before expenses (not the fund’s actual return). You may compare the ongoing costs of investing in the fund with other funds by contrasting this 5% hypothetical example and the 5% hypothetical examples that appear in the shareholder reports of the other funds. The hypothetical account values and expenses may not be used to estimate the actual ending account balance or expenses you paid for the period.
Note: T. Rowe Price charges an annual small-account maintenance fee of $10, generally for accounts with less than $2,000 ($500 for UGMA/UTMA). The fee is waived for any investor whose T. Rowe Price mutual fund accounts total $25,000 or more, accounts employing automatic investing, and IRAs and other retirement plan accounts that utilize a prototype plan sponsored by T. Rowe Price (although a separate custodial or administrative fee may apply to such accounts). This fee is not included in the accompanying table. If you are subject to the fee, keep it in mind when you are estimating the ongoing expenses of investing in the fund and when comparing the expenses of this fund with other funds.
You should also be aware that the expenses shown in the table highlight only your ongoing costs and do not reflect any transaction costs, such as redemption fees or sales loads. Therefore, the second line of the table is useful in comparing ongoing costs only and will not help you determine the relative total costs of owning different funds. To the extent a fund charges transaction costs, however, the total cost of owning that fund is higher.
Unaudited

The accompanying notes are an integral part of these financial statements.
Unaudited


The accompanying notes are an integral part of these financial statements.
Unaudited
The accompanying notes are an integral part of these financial statements.
Unaudited

The accompanying notes are an integral part of these financial statements.
Unaudited

The accompanying notes are an integral part of these financial statements.
Unaudited
| NOTES TO FINANCIAL STATEMENTS |
NOTE 1 - SIGNIFICANT ACCOUNTING POLICIES
T. Rowe Price Health Sciences Fund, Inc. (the fund), is registered under the Investment Company Act of 1940 (the 1940 Act) as a diversified, open-end management investment company. The fund commenced operations on December 29, 1995. The fund seeks long-term capital appreciation.
The accompanying financial statements were prepared in accordance with accounting principles generally accepted in the United States of America, which require the use of estimates made by fund management. Fund management believes that estimates and security valuations are appropriate; however, actual results may differ from those estimates, and the security valuations reflected in the financial statements may differ from the value the fund ultimately realizes upon sale of the securities.
Valuation The fund values its investments and computes its net asset value per share at the close of the New York Stock Exchange (NYSE), normally 4 p.m. ET, each day that the NYSE is open for business. Equity securities listed or regularly traded on a securities exchange or in the over-the-counter (OTC) market are valued at the last quoted sale price or, for certain markets, the official closing price at the time the valuations are made, except for OTC Bulletin Board securities, which are valued at the mean of the latest bid and asked prices. A security that is listed or traded on more than one exchange is valued at the quotation on the exchange determined to be the primary market for such security. Listed securities not traded on a particular day are valued at the mean of the latest bid and asked prices for domestic securities and the last quoted sale price for international securities.
Investments in mutual funds are valued at the mutual fund’s closing net asset value per share on the day of valuation. Purchased and written options are valued at the mean of the closing bid and asked prices.
Other investments, including restricted securities, and those for which the above valuation procedures are inappropriate or are deemed not to reflect fair value are stated at fair value as determined in good faith by the T. Rowe Price Valuation Committee, established by the fund’s Board of Directors.
Most foreign markets close before the close of trading on the NYSE. If the fund determines that developments between the close of a foreign market and the close of the NYSE will, in its judgment, materially affect the value of some or all of its portfolio securities, which in turn will affect the fund’s share price, the fund will adjust the previous closing prices to reflect the fair value of the securities as of the close of the NYSE, as determined in good faith by the T. Rowe Price Valuation Committee, established by the fund’s Board of Directors. A fund may also fair value securities in other situations, such as when a particular foreign market is closed but the fund is open. In deciding whether to make fair value adjustments, the fund reviews a variety of factors, including developments in foreign markets, the performance of U.S. securities markets, and the performance of instruments trading in U.S. markets that represent foreign securities and baskets of foreign securities. The fund uses outside pricing services to provide it with closing market prices and information used for adjusting those prices. The fund cannot predict when and how often it will use closing prices and when it will adjust those prices to reflect fair value. As a means of evaluating its fair value process, the fund routinely compares closing market prices, the next day’s opening prices in the same markets, and adjusted prices.
Currency Translation Assets, including investments, and liabilities denominated in foreign currencies are translated into U.S. dollar values each day at the prevailing exchange rate, using the mean of the bid and asked prices of such currencies against U.S. dollars as quoted by a major bank. Purchases and sales of securities, income, and expenses are translated into U.S. dollars at the prevailing exchange rate on the date of the transaction. The effect of changes in foreign currency exchange rates on realized and unrealized security gains and losses is reflected as a component of security gains and losses.
Rebates Subject to best execution, the fund may direct certain security trades to brokers who have agreed to rebate a portion of the related brokerage commission to the fund in cash. Commission rebates are reflected as realized gain on securities in the accompanying financial statements and totaled $39,000 for the six months ended June 30, 2007.
Investment Transactions, Investment Income, and Distributions Income and expenses are recorded on the accrual basis. Dividends received from mutual fund investments are reflected as dividend income; capital gain distributions are reflected as realized gain/loss. Dividend income and capital gain distributions are recorded on the ex-dividend date. Any income tax-related interest and penalties would be classified as income tax expense. Investment transactions are accounted for on the trade date. Realized gains and losses are reported on the identified cost basis. Distributions to shareholders are recorded on the ex-dividend date. Income distributions are declared and paid on an annual basis. Capital gain distributions, if any, are declared and paid by the fund, typically on an annual basis.
New Accounting Pronouncements Effective June 29, 2007, the fund adopted Financial Accounting Standards Board (“FASB”) Interpretation No. 48 (“FIN 48”), Accounting for Uncertainty in Income Taxes, a clarification of FASB Statement No. 109, Accounting for Income Taxes. FIN 48 establishes financial accounting and disclosure requirements for recognition and measurement of tax positions taken or expected to be taken on an income tax return. The adoption of FIN 48 had no impact on the fund’s net assets or results of operations.
In September 2006, the FASB released the Statement of Financial Accounting Standard No. 157 (“FAS 157”), Fair Value Measurements. FAS 157 clarifies the definition of fair value and establishes the framework for measuring fair value, as well as proper disclosure of this methodology in the financial statements. It will be effective for the fund’s fiscal year beginning January 1, 2008. Management is evaluating the effects of FAS 157; however, it is not expected to have a material impact on the fund’s net assets or results of operations.
NOTE 2 - INVESTMENT TRANSACTIONS
Consistent with its investment objective, the fund engages in the following practices to manage exposure to certain risks or to enhance performance. The investment objective, policies, program, and risk factors of the fund are described more fully in the fund’s prospectus and Statement of Additional Information.
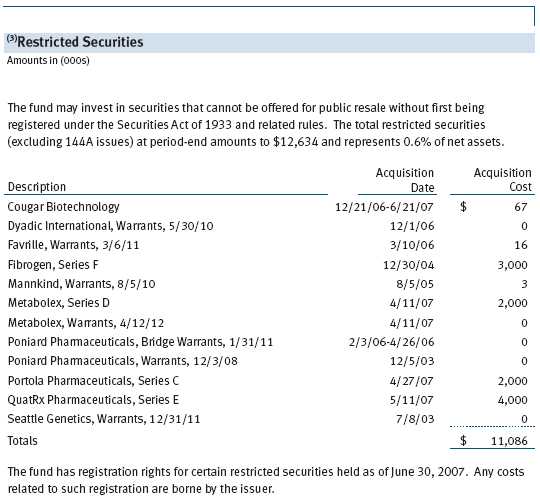
Restricted Securities The fund may invest in securities that are subject to legal or contractual restrictions on resale. Although certain of these securities may be readily sold, for example, under Rule 144A, others may be illiquid, their sale may involve substantial delays and additional costs, and prompt sale at an acceptable price may be difficult.
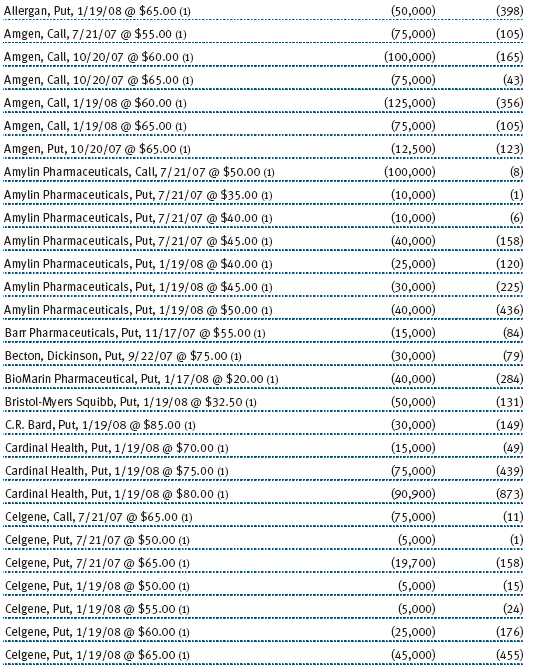
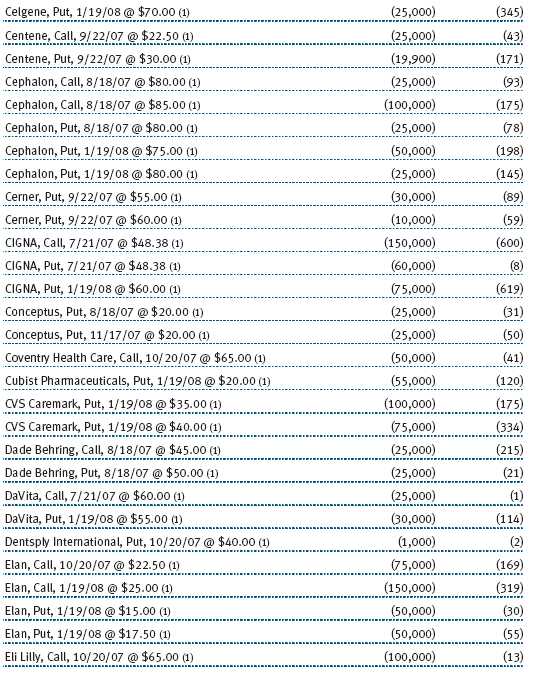
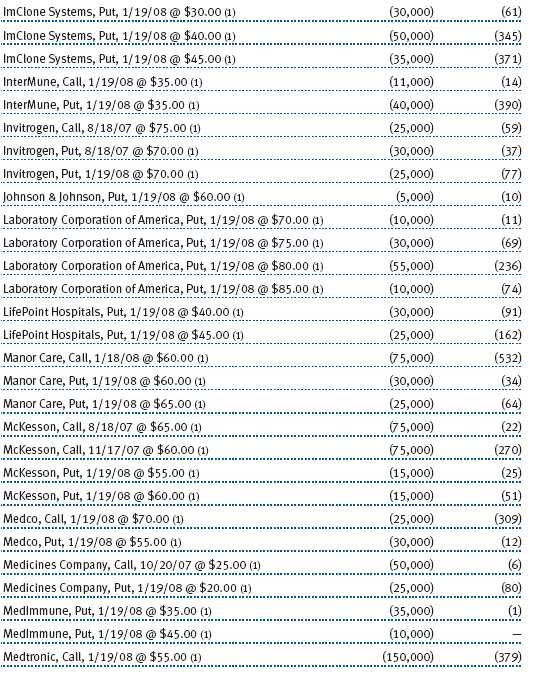
Options Call and put options give the holder the right to purchase or sell, respectively, a security at a specified price on a certain date. Risks arise from possible illiquidity of the options market and from movements in security values. Written options are reflected in the accompanying Statement of Assets and Liabilities at market value. Transactions in options written and related premiums received during the six months ended June 30, 2007, were as follows:
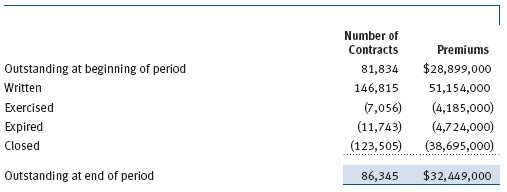
Other Purchases and sales of portfolio securities, other than short-term securities, aggregated $539,559,000 and $443,344,000, respectively, for the six months ended June 30, 2007.
NOTE 3 - FEDERAL INCOME TAXES
No provision for federal income taxes is required since the fund intends to continue to qualify as a regulated investment company under Subchapter M of the Internal Revenue Code and distribute to shareholders all of its taxable income and gains. Federal income tax regulations differ from generally accepted accounting principles; therefore, distributions determined in accordance with tax regulations may differ in amount or character from net investment income and realized gains for financial reporting purposes. Financial reporting records are adjusted for permanent book/tax differences to reflect tax character. Financial records are not adjusted for temporary differences. The amount and character of tax-basis distributions and composition of net assets are finalized at fiscal year-end; accordingly, tax-basis balances have not been determined as of June 30, 2007.
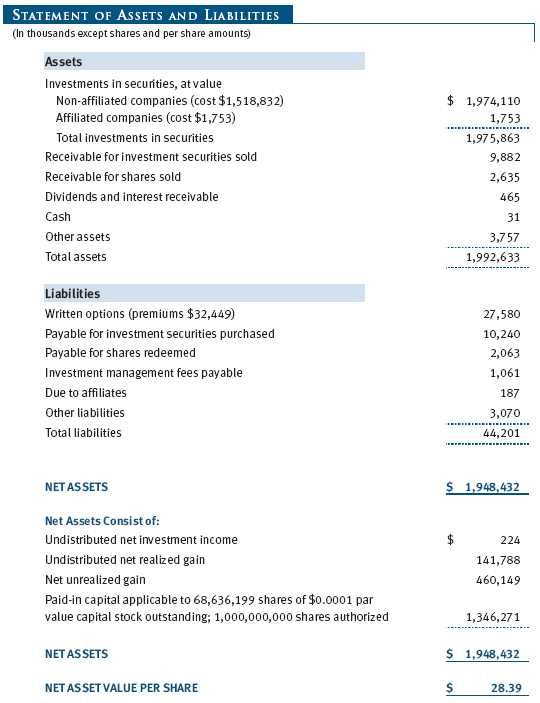
At June 30, 2007, the cost of investments for federal income tax purposes was $1,520,585,000. Net unrealized gain aggregated $460,149,000 at period-end, of which $504,357,000 related to appreciated investments and $44,208,000 related to depreciated investments.
NOTE 4 - RELATED PARTY TRANSACTIONS
The fund is managed by T. Rowe Price Associates, Inc. (the manager or Price Associates), a wholly owned subsidiary of T. Rowe Price Group, Inc. The investment management agreement between the fund and the manager provides for an annual investment management fee, which is computed daily and paid monthly. The fee consists of an individual fund fee, equal to 0.35% of the fund’s average daily net assets, and a group fee. The group fee rate is calculated based on the combined net assets of certain mutual funds sponsored by Price Associates (the group) applied to a graduated fee schedule, with rates ranging from 0.48% for the first $1 billion of assets to 0.285% for assets in excess of $220 billion. The fund’s group fee is determined by applying the group fee rate to the fund’s average daily net assets. At June 30, 2007, the effective annual group fee rate was 0.30%.
In addition, the fund has entered into service agreements with Price Associates and two wholly owned subsidiaries of Price Associates (collectively, Price). Price Associates computes the daily share price and provides certain other administrative services to the fund. T. Rowe Price Services, Inc., provides shareholder and administrative services in its capacity as the fund’s transfer and dividend disbursing agent. T. Rowe Price Retirement Plan Services, Inc., provides subaccounting and recordkeeping services for certain retirement accounts invested in the fund. For the six months ended June 30, 2007, expenses incurred pursuant to these service agreements were $76,000 for Price Associates, $888,000 for T. Rowe Price Services, Inc., and $101,000 for T. Rowe Price Retirement Plan Services, Inc. The total amount payable at period-end pursuant to these service agreements is reflected as Due to Affiliates in the accompanying financial statements.
Additionally, the fund is one of several mutual funds in which certain college savings plans managed by Price Associates may invest. As approved by the fund’s Board of Directors, shareholder servicing costs associated with each college savings plan are borne by the fund in proportion to the average daily value of its shares owned by the college savings plan. For the six months ended June 30, 2007, the fund was charged $22,000 for shareholder servicing costs related to the college savings plans, of which $17,000 was for services provided by Price. The amount payable at period-end pursuant to this agreement is reflected as Due to Affiliates in the accompanying financial statements. At June 30, 2007, approximately 1% of the outstanding shares of the fund were held by college savings plans.
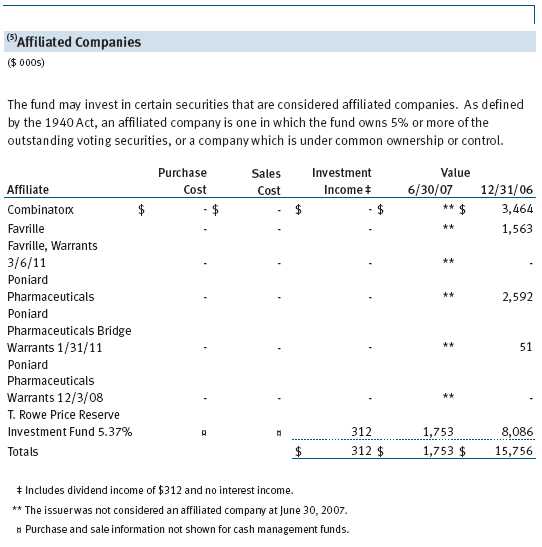
The fund may invest in the T. Rowe Price Reserve Investment Fund and the T. Rowe Price Government Reserve Investment Fund (collectively, the T. Rowe Price Reserve Investment Funds), open-end management investment companies managed by Price Associates and affiliates of the fund. The T. Rowe Price Reserve Investment Funds are offered as cash management options to mutual funds, trusts, and other accounts managed by Price Associates and/or its affiliates, and are not available for direct purchase by members of the public. The T. Rowe Price Reserve Investment Funds pay no investment management fees.
As of June 30, 2007, T. Rowe Price Group, Inc. and/or its wholly owned subsidiaries owned 347,275 shares of the fund, representing less than 1% of the fund’s net assets.
NOTE 5 - INTERFUND BORROWING
Pursuant to its prospectus, the fund may borrow up to 33% of its total assets. The fund is party to an interfund borrowing agreement between itself and other T. Rowe Price-sponsored mutual funds, which permits it to borrow or lend cash at rates beneficial to both the borrowing and lending funds. Loans totaling 10% or more of a borrowing fund’s total assets are collateralized at 102% of the value of the loan; loans of less than 10% are unsecured. During the six months ended June 30, 2007, the fund had outstanding borrowings on three days, in the average amount of $8,233,000, and at an average annual rate of 5.43% . There were no borrowings outstanding at June 30, 2007.
| INFORMATION ON PROXY VOTING POLICIES, PROCEDURES, AND RECORDS |
A description of the policies and procedures used by T. Rowe Price funds and portfolios to determine how to vote proxies relating to portfolio securities is available in each fund’s Statement of Additional Information, which you may request by calling 1-800-225-5132 or by accessing the SEC’s Web site, www.sec.gov. The description of our proxy voting policies and procedures is also available on our Web site, www.troweprice.com. To access it, click on the words “Company Info” at the top of our homepage for individual investors. Then, in the window that appears, click on the “Proxy Voting Policy” navigation button in the top left corner.
Each fund’s most recent annual proxy voting record is available on our Web site and through the SEC’s Web site. To access it through our Web site, follow the directions above, then click on the words “Proxy Voting Record” at the bottom of the Proxy Voting Policy page.
| HOW TO OBTAIN QUARTERLY PORTFOLIO HOLDINGS |
The fund files a complete schedule of portfolio holdings with the Securities and Exchange Commission for the first and third quarters of each fiscal year on Form N-Q. The fund’s Form N-Q is available electronically on the SEC’s Web site (www.sec.gov); hard copies may be reviewed and copied at the SEC’s Public Reference Room, 450 Fifth St. N.W., Washington, DC 20549. For more information on the Public Reference Room, call 1-800-SEC-0330.
| APPROVAL OF INVESTMENT MANAGEMENT AGREEMENT |
On March 7, 2007, the fund’s Board of Directors (Board) unanimously approved the investment advisory contract (Contract) between the fund and its investment manager, T. Rowe Price Associates, Inc. (Manager). The Board considered a variety of factors in connection with its review of the Contract, also taking into account information provided by the Manager during the course of the year, as discussed below:
Services Provided by the Manager
The Board considered the nature, quality, and extent of the services provided to the fund by the Manager. These services included, but were not limited to, management of the fund’s portfolio and a variety of related activities, as well as financial and administrative services, reporting, and communications. The Board also reviewed the background and experience of the Manager’s senior management team and investment personnel involved in the management of the fund. The Board concluded that it was satisfied with the nature, quality, and extent of the services provided by the Manager.
Investment Performance of the Fund
The Board reviewed the fund’s average annual total return over the 1-, 3-, 5-, and 10-year periods as well as the fund’s year-by-year returns and compared these returns with previously agreed upon comparable performance measures and market data, including those supplied by Lipper and Morningstar, which are independent providers of mutual fund data. On the basis of this evaluation and the Board’s ongoing review of investment results, the Board concluded that the fund’s performance was satisfactory.
Costs, Benefits, Profits, and Economies of Scale
The Board reviewed detailed information regarding the revenues received by the Manager under the Contract and other benefits that the Manager (and its affiliates) may have realized from its relationship with the fund, including research received under “soft dollar” agreements. The Board noted that soft dollars were not used to pay for third-party, non-broker research. The Board also received information on the estimated costs incurred and profits realized by the Manager and its affiliates from advising T. Rowe Price mutual funds, as well as estimates of the gross profits realized from managing the fund in particular. The Board concluded that the Manager’s profits were reasonable in light of the services provided to the fund. The Board also considered whether the fund or other funds benefit under the fee levels set forth in the Contract from any economies of scale realized by the Manager. Under the Contract, the fund pays a fee to the Manager composed of two components—a group fee rate based on the aggregate assets of certain T. Rowe Price mutual funds (including the fund) that declines at certain asset levels and an individual fund fee rate that is assessed on the assets of the fund. The Board concluded that the advisory fee structure for the fund continued to provide for a reasonable sharing of benefits from any economies of scale with the fund’s investors.
Fees
The Board reviewed the fund’s management fee rate, operating expenses, and total expense ratio and compared them with fees and expenses of other comparable funds based on information and data supplied by Lipper. The information provided to the Board indicated that the fund’s management fee rate was above the median for certain groups of comparable funds but at or below the median for other groups of comparable funds. The information also indicated that the fund’s expense ratio was below the median for comparable funds. The Board also reviewed the fee schedules for comparable privately managed accounts of the Manager and its affiliates. Management informed the Board that the Manager’s responsibilities for privately managed accounts are more limited than its responsibilities for the fund and other T. Rowe Price mutual funds that it or its affiliates advise. On the basis of the information provided, the Board concluded that the fees paid by the fund under the Contract were reasonable.
Approval of the Contract
As noted, the Board approved the continuation of the Contract. No single factor was considered in isolation or to be determinative to the decision. Rather, the Board concluded, in light of a weighting and balancing of all factors considered, that it was in the best interests of the fund to approve the continuation of the Contract, including the fees to be charged for services thereunder.
Item 2. Code of Ethics.
A code of ethics, as defined in Item 2 of Form N-CSR, applicable to its principal executive officer, principal financial officer, principal accounting officer or controller, or persons performing similar functions is filed as an exhibit to the registrant’s annual Form N-CSR. No substantive amendments were approved or waivers were granted to this code of ethics during the registrant’s most recent fiscal half-year.
Item 3. Audit Committee Financial Expert.
Disclosure required in registrant’s annual Form N-CSR.
Item 4. Principal Accountant Fees and Services.
Disclosure required in registrant’s annual Form N-CSR.
Item 5. Audit Committee of Listed Registrants.
Not applicable.
Item 6. Schedule of Investments.
Not applicable. The complete schedule of investments is included in Item 1 of this Form N-CSR.
Item 7. Disclosure of Proxy Voting Policies and Procedures for Closed-End Management Investment Companies.
Not applicable.
Item 8. Portfolio Managers of Closed-End Management Investment Companies.
Not applicable.
Item 9. Purchases of Equity Securities by Closed-End Management Investment Company and Affiliated Purchasers.
Not applicable.
Item 10. Submission of Matters to a Vote of Security Holders.
Not applicable.
Item 11. Controls and Procedures.
(a) The registrant’s principal executive officer and principal financial officer have evaluated the registrant’s disclosure controls and procedures within 90 days of this filing and have concluded that the registrant’s disclosure controls and procedures were effective, as of that date, in ensuring that information required to be disclosed by the registrant in this Form N-CSR was recorded, processed, summarized, and reported timely.
(b) The registrant’s principal executive officer and principal financial officer are aware of no change in the registrant’s internal control over financial reporting that occurred during the registrant’s second fiscal quarter covered by this report that has materially affected, or is reasonably likely to materially affect, the registrant’s internal control over financial reporting.
Item 12. Exhibits.(a)(1) The registrant’s code of ethics pursuant to Item 2 of Form N-CSR is filed with the registrant’s annual Form N-CSR.
(2) Separate certifications by the registrant's principal executive officer and principal financial officer, pursuant to Section 302 of the Sarbanes-Oxley Act of 2002 and required by Rule 30a-2(a) under the Investment Company Act of 1940, are attached.
(3) Written solicitation to repurchase securities issued by closed-end companies: not applicable.
(b) A certification by the registrant's principal executive officer and principal financial officer, pursuant to Section 906 of the Sarbanes-Oxley Act of 2002 and required by Rule 30a-2(b) under the Investment Company Act of 1940, is attached.
SIGNATURES | |
| Pursuant to the requirements of the Securities Exchange Act of 1934 and the Investment | |
| Company Act of 1940, the registrant has duly caused this report to be signed on its behalf by the | |
| undersigned, thereunto duly authorized. | |
| T. Rowe Price Health Sciences Fund, Inc. | |
| By | /s/ Edward C. Bernard |
| Edward C. Bernard | |
| Principal Executive Officer | |
| Date | August 17, 2007 |
| Pursuant to the requirements of the Securities Exchange Act of 1934 and the Investment | |
| Company Act of 1940, this report has been signed below by the following persons on behalf of | |
| the registrant and in the capacities and on the dates indicated. | |
| By | /s/ Edward C. Bernard |
| Edward C. Bernard | |
| Principal Executive Officer | |
| Date | August 17, 2007 |
| By | /s/ Joseph A. Carrier |
| Joseph A. Carrier | |
| Principal Financial Officer | |
| Date | August 17, 2007 |