UNITED STATES
SECURITIES AND EXCHANGE COMMISSION
WASHINGTON, D.C. 20549
FORM N-CSR
CERTIFIED SHAREHOLDER REPORT OF REGISTERED
MANAGEMENT INVESTMENT COMPANIES
Investment Company Act file number: 811-07391
AB UNCONSTRAINED BOND FUND, INC.
(Exact name of registrant as specified in charter)
1345 Avenue of the Americas, New York, New York 10105
(Address of principal executive offices) (Zip code)
Joseph J. Mantineo
AllianceBernstein L.P.
1345 Avenue of the Americas
New York, New York 10105
(Name and address of agent for service)
Registrant’s telephone number, including area code: (800) 221-5672
Date of fiscal year end: October 31, 2017
Date of reporting period: October 31, 2017
ITEM 1. REPORTS TO STOCKHOLDERS.
OCT 10.31.17
ANNUAL REPORT
AB UNCONSTRAINED BOND FUND


| | |
| |
| Investment Products Offered | | • Are Not FDIC Insured • May Lose Value • Are Not Bank Guaranteed |
Investors should consider the investment objectives, risks, charges and expenses of the Fund carefully before investing. For copies of our prospectus or summary prospectus, which contain this and other information, visit us online at www.abfunds.com or contact your AB representative. Please read the prospectus and/or summary prospectus carefully before investing.
This shareholder report must be preceded or accompanied by the Fund’s prospectus for individuals who are not current shareholders of the Fund.
You may obtain a description of the Fund’s proxy voting policies and procedures, and information regarding how the Fund voted proxies relating to portfolio securities during the most recent 12-month period ended June 30, without charge. Simply visit AB’s website at www.abfunds.com, or go to the Securities and Exchange Commission’s (the “Commission”) website at www.sec.gov, or call AB at (800) 227 4618.
The Fund files its complete schedule of portfolio holdings with the Commission for the first and third quarters of each fiscal year on Form N-Q. The Fund’s Forms N-Q are available on the Commission’s website at www.sec.gov. The Fund’s Forms N-Q may also be reviewed and copied at the Commission’s Public Reference Room in Washington, DC; information on the operation of the Public Reference Room may be obtained by calling (800) SEC 0330. AB publishes full portfolio holdings for the Fund monthly at www.abfunds.com.
AllianceBernstein Investments, Inc. (ABI) is the distributor of the AB family of mutual funds. ABI is a member of FINRA and is an affiliate of AllianceBernstein L.P., the Adviser of the funds.
The [A/B] logo is a registered service mark of AllianceBernstein and AllianceBernstein® is a registered service mark used by permission of the owner, AllianceBernstein L.P.
| | |
| FROM THE PRESIDENT | |  |
Dear Shareholder,
We are pleased to provide this report for AB Unconstrained Bond Fund (the “Fund”). Please review the discussion of Fund performance, the market conditions during the reporting period and the Fund’s investment strategy.
As always, AB strives to keep clients ahead of what’s next by:
| + | | Transforming uncommon insights into uncommon knowledge with a global research scope |
| + | | Navigating markets with seasoned investment experience and sophisticated solutions |
| + | | Providing thoughtful investment insights and actionable ideas |
Whether you’re an individual investor or a multi-billion-dollar institution, we put knowledge and experience to work for you.
AB’s global research organization connects and collaborates across platforms and teams to deliver impactful insights and innovative products. Better insights lead to better opportunities—anywhere in the world.
For additional information about AB’s range of products and shareholder resources, please log on to www.abfunds.com.
Thank you for your investment in the AB Mutual Funds.
Sincerely,

Robert M. Keith
President and Chief Executive Officer, AB Mutual Funds
| | |
| abfunds.com | | AB UNCONSTRAINED BOND FUND | 1 |
ANNUAL REPORT
December 13, 2017
This report provides management’s discussion of fund performance for AB Unconstrained Bond Fund for the annual reporting period ended October 31, 2017.
The Fund’s investment objective is to generate current income consistent with preservation of capital.
NAV RETURNS AS OF OCTOBER 31, 2017 (unaudited)
| | | | | | | | |
| | | 6 Months | | | 12 Months | |
| AB UNCONSTRAINED BOND FUND1 | | | | | | | | |
| Class A Shares2 | | | 0.50% | | | | 4.36% | |
| Class B Shares3 | | | -0.03% | | | | 3.52% | |
| Class C Shares2,4 | | | 0.10% | | | | 3.56% | |
| Advisor Class Shares2,4 | | | 0.51% | | | | 4.52% | |
| Class R Shares4 | | | 0.26% | | | | 4.02% | |
| Class K Shares4 | | | 0.32% | | | | 4.23% | |
| Class I Shares2,4 | | | 0.54% | | | | 4.56% | |
| Class Z Shares4 | | | 0.54% | | | | 4.57% | |
| Primary benchmark: BofA ML 3-Month US T-Bill Index | | | 0.49% | | | | 0.72% | |
Bloomberg Barclays Global Aggregate Bond Index
(USD hedged) | | | 1.51% | | | | 1.23% | |
| 1 | Includes the impact of proceeds received and credited to the Fund resulting from class-action settlements, which enhanced the performance of the Fund for the six- and 12-month periods ended October 31, 2017, by 0.02% and 0.05%, respectively. |
| 2 | The returns shown are based on net asset values calculated for shareholder transactions and may differ from the returns shown in the Financial Highlights, which reflect adjustments made to the net asset values in accordance with accounting principles generally accepted in the United States of America. |
| 3 | Effective January 31, 2009, Class B shares are no longer available for purchase to new investors. Please see Note A for more information. |
| 4 | Please note that these share classes are for investors purchasing shares through accounts established under certain fee-based programs sponsored and maintained by certain broker-dealers and financial intermediaries, institutional pension plans and/or investment advisory clients of, and certain other persons associated with, the Adviser and its affiliates or the Fund. |
INVESTMENT RESULTS
The table above shows the Fund’s performance compared with its primary benchmark, the Bank of America Merrill Lynch (“BofA ML”) 3-Month US Treasury Bill (“T-Bill”) Index, and the Bloomberg Barclays Global Aggregate Bond Index (USD hedged) for the six- and 12-month periods ended October 31, 2017.
| | |
| 2 | AB UNCONSTRAINED BOND FUND | | abfunds.com |
In the 12-month period, all share classes of the Fund outperformed the primary benchmark, before sales charges. Sector and security selection contributed to relative performance, primarily because of positions in high-yield corporates and non-agency mortgages. The protection that the Fund owns on high-yield corporates took back some of these gains. Currency allocation was also positive, as a beneficial long position in the Czech koruna more than offset a detrimental short in the euro. Country allocation (a result of bottom-up security analysis combined with fundamental research) and yield-curve positioning detracted. Negative returns from positions in the US, UK and eurozone outweighed gains from the Fund’s positioning in Brazil.
In the six-month period, Class A, I, Z and Advisor Class shares of the Fund outperformed the primary benchmark, while Class B, C, R and K shares underperformed, before sales charges. Sector and security selection contributed to relative returns, mainly because of the Fund’s positions in high-yield corporates and non-agency mortgages. Currency positioning was also positive, as gains from a long position in the Czech koruna outweighed losses from shorts in the euro and Canadian dollar. Country and yield-curve positioning detracted, primarily because of positions in Canada, the eurozone and the US, while the Fund’s position in the UK contributed.
During both periods, the Fund utilized derivatives in the form of interest rate swaps, futures and interest rate swaptions to manage and hedge duration risk and/or take active yield-curve positioning. It also utilized currency forwards and currency options, both written and purchased, to hedge foreign currency exposure and to take active currency risk. Purchased and written equity options were used in an effort to add alpha (a measure of how the Fund is performing on a risk-adjusted basis versus its benchmark) through different strategies, including but not limited to relative value, put spreads and call spreads. Credit default swaps, both single name and index, were used to take active risk and hedge investment-grade and high-yield credit risk taken through cash bonds. Total return swaps and variance swaps were used to take active risk and as hedging tools against other active equity-like risks in the Fund, which had an immaterial impact on absolute returns.
MARKET REVIEW AND INVESTMENT STRATEGY
Political events and central bank action had a significant impact on bond markets in the six- and 12-month periods ended October 31, 2017. Donald Trump’s US election victory and the promise of fiscal stimulus, a retreat from globalization and relaxed regulation were treated as positive developments by financial markets. However, uncertainty regarding the Trump administration’s ability to implement meaningful change increased through the 12-month period. UK prime minister Theresa May surprised investors when she called for a snap parliamentary election in an effort to firm up the UK’s mandate going into Brexit negotiations. However, the
| | |
| abfunds.com | | AB UNCONSTRAINED BOND FUND | 3 |
results of the vote increased political uncertainty when May’s Conservative Party failed to secure a majority position. Investors were relieved when centrist, pro-EU candidate Emmanuel Macron was elected president of France, as his reformist agenda was seen as more business friendly than the protectionist policies espoused by his opponent. In June, the US Federal Reserve (the “Fed”) raised interest rates for the third consecutive quarter, hikes that were well-telegraphed and universally anticipated by markets. Late in the period, the Fed formally confirmed that its balance sheet reduction program would start in October, while the European Central Bank announced that it would start to taper the pace of its monthly asset purchases in January 2018.
Emerging-market debt rallied over both periods, helped by a positive global growth story and increasing oil prices. Outside of Europe, developed-market treasury yields generally rose; in the eurozone and UK, yields moved in different directions. Emerging-market local-currency government bonds, developed-market treasuries and investment-grade credit securities all rose in both periods, yet trailed the rally in global high yield. Within high yield, performance was almost uniformly positive, led by the transportation and basic industries sectors, while consumer sectors tended to lag the rising market.
INVESTMENT POLICIES
The Fund invests, under normal circumstances, at least 80% of its net assets in fixed-income securities and derivatives related to fixed-income securities. The Fund employs a dynamic risk allocation, meaning that the Fund’s risk profile may vary significantly over time based upon market conditions. The Fund invests in a portfolio that includes fixed-income securities of US and non-US companies and US and non-US government securities and supranational entities, including lower-rated securities.
The Fund may invest in debt securities with a range of maturities from short- to long-term. The Fund expects that its average portfolio duration will vary normally from negative three years to positive seven years, depending upon the Adviser’s forecast of interest rates and assessment of market risks generally. Duration is a measure of a fixed-income security’s sensitivity to changes in interest rates. The value of a fixed-income security with positive duration will decline if interest rates increase. Conversely, the value of a fixed-income security with negative duration will increase as interest rates increase. The Fund will seek to achieve negative duration through the use of derivatives, such as futures and total return swaps.
The Fund typically maintains at least 50% of its net assets in
(continued on next page)
| | |
| 4 | AB UNCONSTRAINED BOND FUND | | abfunds.com |
investment-grade securities. The Fund may invest up to 50% of its net assets in below investment-grade securities, such as corporate high-yield fixed-income securities, sovereign debt obligations and fixed-income securities of issuers located in emerging markets.
The Fund may also invest in mortgage-related and other asset-backed securities, loan participations, inflation-indexed securities, structured securities, variable, floating, and inverse floating-rate instruments and preferred stock, and may use other investment techniques. The Fund may make short sales of securities or currencies or maintain a short position. The Fund may use borrowings or other leverage for investment purposes. The Fund intends, among other things, to enter into transactions such as reverse repurchase agreements and dollar rolls. The Fund may utilize, without limit, derivatives, such as options, futures contracts, forwards or swaps, including those on fixed-income and equity securities and foreign currencies.
| | |
| abfunds.com | | AB UNCONSTRAINED BOND FUND | 5 |
DISCLOSURES AND RISKS
Benchmark Disclosure
The BofA ML® 3-Month US T-Bill Index and the Bloomberg Barclays Global Aggregate Bond Index (USD hedged) are unmanaged and do not reflect fees and expenses associated with the active management of a mutual fund portfolio. The BofA ML 3-Month US T-Bill Index measures the performance of Treasury securities maturing in 90 days. The Bloomberg Barclays Global Aggregate Bond Index represents the performance of the global investment-grade developed fixed-income markets. An investor cannot invest directly in an index or average, and their results are not indicative of the performance for any specific investment, including the Fund.
A Word About Risk
Market Risk: The value of the Fund’s assets will fluctuate as the stock or bond market fluctuates. The value of its investments may decline, sometimes rapidly and unpredictably, simply because of economic changes or other events that affect large portions of the market.
Interest Rate Risk: Changes in interest rates will affect the value of investments in fixed-income securities. When interest rates rise, the value of existing investments in fixed-income securities tends to fall and this decrease in value may not be offset by higher income from new investments. The Fund may be subject to heightened interest rate risk due to rising rates as the current period of historically low interest rates may be ending. Interest rate risk is generally greater for fixed-income securities with longer maturities or durations.
Credit Risk: An issuer or guarantor of a fixed-income security, or the counterparty to a derivatives or other contract, may be unable or unwilling to make timely payments of interest or principal, or to otherwise honor its obligations. The issuer or guarantor may default, causing a loss of the full principal amount of a security and accrued interest. The degree of risk for a particular security may be reflected in its credit rating. There is the possibility that the credit rating of a fixed-income security may be downgraded after purchase, which may adversely affect the value of the security.
Below Investment Grade Securities Risk: Investments in fixed-income securities with lower ratings (commonly known as “junk bonds”) tend to have a higher probability that an issuer will default or fail to meet its payment obligations. These securities may be subject to greater price volatility due to such factors as specific corporate developments, negative perceptions of the junk bond market generally and less secondary market liquidity.
Duration Risk: Duration is a measure that relates the expected price volatility of a fixed-income security to changes in interest rates. The duration of a fixed-income security may be shorter than or equal to the full maturity of a fixed-income security. Fixed-income securities with longer durations have
| | |
| 6 | AB UNCONSTRAINED BOND FUND | | abfunds.com |
DISCLOSURES AND RISKS (continued)
more risk and will decrease in price as interest rates rise. For example, a fixed-income security with a duration of three years will decrease in value by approximately 3% if interest rates increase by 1%.
Inflation Risk: This is the risk that the value of assets or income from investments will be less in the future as inflation decreases the value of money. As inflation increases, the value of the Fund’s assets can decline as can the value of the Fund’s distributions. This risk is significantly greater if the Fund invests a significant portion of its assets in fixed-income securities with longer maturities.
Foreign (Non-US) Risk: Investments in securities of non-US issuers may involve more risk than those of US issuers. These securities may fluctuate more widely in price and may be less liquid due to adverse market, economic, political, regulatory or other factors.
Emerging Market Risk: Investments in emerging-market countries may have more risk because the markets are less developed and less liquid, and because these investments may be subject to increased economic, political, regulatory or other uncertainties.
Currency Risk: Fluctuations in currency exchange rates may negatively affect the value of the Fund’s investments or reduce its returns.
Leverage Risk: To the extent the Fund uses leveraging techniques, its net asset value (“NAV”) may be more volatile because leverage tends to exaggerate the effect of changes in interest rates and any increase or decrease in the value of the Fund’s investments.
Prepayment Risk: The value of mortgage-related or asset-backed securities may be particularly sensitive to changes in prevailing interest rates. Early payments of principal on some mortgage-related securities may occur during periods of falling mortgage interest rates and expose the Fund to a lower rate of return upon reinvestment of principal. Early payments associated with mortgage-related securities cause these securities to experience significantly greater price and yield volatility than is experienced by traditional fixed-income securities. During periods of rising interest rates, a reduction in prepayments may increase the effective life of mortgage-related securities, subjecting them to greater risk of decline in market value in response to rising interest rates. If the life of a mortgage-related security is inaccurately predicted, the Fund may not be able to realize the rate of return it expected.
Derivatives Risk: Derivatives may be illiquid, difficult to price, and leveraged so that small changes may produce disproportionate losses for the Fund, and may be subject to counterparty risk to a greater degree than more traditional investments.
| | |
| abfunds.com | | AB UNCONSTRAINED BOND FUND | 7 |
DISCLOSURES AND RISKS (continued)
Liquidity Risk: Liquidity risk occurs when certain investments become difficult to purchase or sell. Difficulty in selling less liquid securities may result in sales at disadvantageous prices affecting the value of your investment in the Fund. Causes of liquidity risk may include low trading volumes, large positions and heavy redemptions of Fund shares. Over recent years liquidity risk has also increased because the capacity of dealers in the secondary market for fixed-income securities to make markets in these securities has decreased, even as the overall bond market has grown significantly, due to, among other things, structural changes, additional regulatory requirements and capital and risk restraints that have led to reduced inventories. Liquidity risk may be higher in a rising interest rate environment, when the value and liquidity of fixed-income securities generally decline.
Management Risk: The Fund is subject to management risk because it is an actively managed investment fund. The Adviser will apply its investment techniques and risk analyses in making investment decisions, but there is no guarantee that its techniques will produce the intended results.
These risks are fully discussed in the Fund’s prospectus. As with all investments, you may lose money by investing in the Fund.
An Important Note About Historical Performance
The investment return and principal value of an investment in the Fund will fluctuate, so that shares, when redeemed, may be worth more or less than their original cost. Performance shown in this report represents past performance and does not guarantee future results. Current performance may be lower or higher than the performance information shown. You may obtain performance information current to the most recent month-end by visiting www.abfunds.com.
All fees and expenses related to the operation of the Fund have been deducted. NAV returns do not reflect sales charges; if sales charges were reflected, the Fund’s quoted performance would be lower. SEC returns reflect the applicable sales charges for each share class: a 4.25% maximum front-end sales charge for Class A shares; the applicable contingent deferred sales charge for Class B shares (4% year 1, 3% year 2, 2% year 3, 1% year 4) and a 1% 1-year contingent deferred sales charge for Class C shares. Returns for the different share classes will vary due to different expenses associated with each class. Performance assumes reinvestment of distributions and does not account for taxes.
| | |
| 8 | AB UNCONSTRAINED BOND FUND | | abfunds.com |
HISTORICAL PERFORMANCE
GROWTH OF A $10,000 INVESTMENT IN THE FUND (unaudited)
10/31/2007 TO 10/31/2017
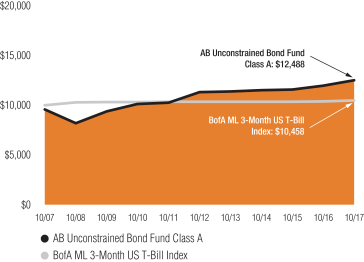
This chart illustrates the total value of an assumed $10,000 investment in AB Unconstrained Bond Fund Class A shares (from 10/31/2007 to 10/31/2017) as compared to the performance of the Fund’s benchmark. The chart reflects the deduction of the maximum 4.25% sales charge from the initial $10,000 investment in the Fund and assumes the reinvestment of dividends and capital gains distributions.
| | |
| abfunds.com | | AB UNCONSTRAINED BOND FUND | 9 |
HISTORICAL PERFORMANCE (continued)
AVERAGE ANNUAL RETURNS AS OF OCTOBER 31, 2017 (unaudited)
| | | | | | | | | | | | |
| | | NAV Returns | | | SEC Returns (reflects applicable sales charges) | | | SEC Yields1 | |
| CLASS A SHARES | | | | | | | | | | | 2.18% | |
| 1 Year | | | 4.36% | | | | -0.05% | | | | | |
| 5 Years | | | 1.99% | | | | 1.12% | | | | | |
| 10 Years | | | 2.69% | | | | 2.25% | | | | | |
| CLASS B SHARES | | | | | | | | | | | 1.49% | |
| 1 Year | | | 3.52% | | | | -0.48% | | | | | |
| 5 Years | | | 1.26% | | | | 1.26% | | | | | |
| 10 Years2 | | | 2.14% | | | | 2.14% | | | | | |
| CLASS C SHARES | | | | | | | | | | | 1.53% | |
| 1 Year | | | 3.56% | | | | 2.56% | | | | | |
| 5 Years | | | 1.25% | | | | 1.25% | | | | | |
| 10 Years | | | 1.99% | | | | 1.99% | | | | | |
| ADVISOR CLASS SHARES3 | | | | | | | | | | | 2.53% | |
| 1 Year | | | 4.52% | | | | 4.52% | | | | | |
| 5 Years | | | 2.24% | | | | 2.24% | | | | | |
| 10 Years | | | 2.97% | | | | 2.97% | | | | | |
| CLASS R SHARES3 | | | | | | | | | | | 1.71% | |
| 1 Year | | | 4.02% | | | | 4.02% | | | | | |
| 5 Years | | | 1.75% | | | | 1.75% | | | | | |
| 10 Years | | | 2.49% | | | | 2.49% | | | | | |
| CLASS K SHARES3 | | | | | | | | | | | 2.05% | |
| 1 Year | | | 4.23% | | | | 4.23% | | | | | |
| 5 Years | | | 2.00% | | | | 2.00% | | | | | |
| 10 Years | | | 2.76% | | | | 2.76% | | | | | |
| CLASS I SHARES3 | | | | | | | | | | | 2.50% | |
| 1 Year | | | 4.56% | | | | 4.56% | | | | | |
| 5 Years | | | 2.26% | | | | 2.26% | | | | | |
| 10 Years | | | 3.01% | | | | 3.01% | | | | | |
| CLASS Z SHARES3 | | | | | | | | | | | 2.49% | |
| 1 Year | | | 4.57% | | | | 4.57% | | | | | |
| Since Inception4 | | | 3.12% | | | | 3.12% | | | | | |
The Fund’s current prospectus fee table shows the Fund’s total annual operating expense ratios as 1.08%, 1.82%, 1.82%, 0.82%, 1.49%, 1.18%, 0.78% and 0.79% for Class A, Class B, Class C, Advisor Class, Class R, Class K, Class I and Class Z shares, respectively, gross of any fee waivers or expense reimbursements. Contractual fee waivers and/or expense reimbursements limit the Fund’s annual operating expenses (exclusive of interest expense) to 0.90%, 1.65%, 1.65%, 0.65%, 1.15%, 0.90%, 0.65% and 0.65% for Class A, Class B, Class C, Advisor Class, Class R, Class K, Class I and Class Z shares, respectively. These
(footnotes continued on next page)
| | |
| 10 | AB UNCONSTRAINED BOND FUND | | abfunds.com |
HISTORICAL PERFORMANCE (continued)
waivers/reimbursements may not be terminated before January 31, 2018 and may be extended by the Adviser for additional one-year terms. Absent reimbursements or waivers, performance would have been lower. The Financial Highlights section of this report sets forth expense ratio data for the current reporting period; the expense ratios shown above may differ from the expense ratios in the Financial Highlights sections since they are based on different time periods.
| 1 | SEC yields are calculated based on SEC guidelines for the 30-day period ended October 31, 2017. |
| 2 | Assumes conversion of Class B shares into Class A shares after eight years. |
| 3 | These share classes are offered at NAV to eligible investors and their SEC returns are the same as their NAV returns. Please note that these share classes are for investors purchasing shares through accounts established under certain fee-based programs sponsored and maintained by certain broker-dealers and financial intermediaries, institutional pension plans and/or investment advisory clients of, and certain other persons associated with, the Adviser and its affiliates or the Fund. |
| 4 | Inception date: 11/4/2014. |
| | |
| abfunds.com | | AB UNCONSTRAINED BOND FUND | 11 |
HISTORICAL PERFORMANCE (continued)
SEC AVERAGE ANNUAL RETURNS
AS OF THE MOST RECENT CALENDAR QUARTER-END
SEPTEMBER 30, 2017 (unaudited)
| | | | |
| | | SEC Returns (reflects applicable sales charges) | |
| CLASS A SHARES | | | | |
| 1 Year | | | 1.57% | |
| 5 Years | | | 1.19% | |
| 10 Years | | | 2.31% | |
| CLASS B SHARES | | | | |
| 1 Year | | | 1.26% | |
| 5 Years | | | 1.34% | |
| 10 Years1 | | | 2.21% | |
| CLASS C SHARES | | | | |
| 1 Year | | | 4.29% | |
| 5 Years | | | 1.33% | |
| 10 Years | | | 2.05% | |
| ADVISOR CLASS SHARES2 | | | | |
| 1 Year | | | 6.25% | |
| 5 Years | | | 2.32% | |
| 10 Years | | | 3.04% | |
| CLASS R SHARES2 | | | | |
| 1 Year | | | 5.76% | |
| 5 Years | | | 1.82% | |
| 10 Years | | | 2.56% | |
| CLASS K SHARES2 | | | | |
| 1 Year | | | 5.97% | |
| 5 Years | | | 2.07% | |
| 10 Years | | | 2.83% | |
| CLASS I SHARES2 | | | | |
| 1 Year | | | 6.30% | |
| 5 Years | | | 2.33% | |
| 10 Years | | | 3.08% | |
| CLASS Z SHARES2 | | | | |
| 1 Year | | | 6.31% | |
| Since Inception3 | | | 3.31% | |
| 1 | Assumes conversion of Class B shares into Class A shares after eight years. |
| 2 | Please note that these share classes are for investors purchasing shares through accounts established under certain fee-based programs sponsored and maintained by certain broker-dealers and financial intermediaries, institutional pension plans and/or investment advisory clients of, and certain other persons associated with, the Adviser and its affiliates or the Fund. |
| 3 | Inception date: 11/4/2014. |
| | |
| 12 | AB UNCONSTRAINED BOND FUND | | abfunds.com |
EXPENSE EXAMPLE
(unaudited)
As a shareholder of the Fund, you incur two types of costs: (1) transaction costs, including sales charges (loads) on purchase payments, contingent deferred sales charges on redemptions and (2) ongoing costs, including management fees; distribution (12b-1) fees; and other Fund expenses. This example is intended to help you understand your ongoing costs (in dollars) of investing in the Fund and to compare these costs with the ongoing costs of investing in other mutual funds.
The Example is based on an investment of $1,000 invested at the beginning of the period and held for the entire period as indicated below.
Actual Expenses
The table below provides information about actual account values and actual expenses. You may use the information, together with the amount you invested, to estimate the expenses that you paid over the period. Simply divide your account value by $1,000 (for example, an $8,600 account value divided by $1,000 = 8.6), then multiply the result by the number under the heading entitled “Expenses Paid During Period” to estimate the expenses you paid on your account during this period.
Hypothetical Example for Comparison Purposes
The table below also provides information about hypothetical account values and hypothetical expenses based on the Fund’s actual expense ratio and an assumed annual rate of return of 5% before expenses, which is not the Fund’s actual return. The hypothetical account values and expenses may not be used to estimate the actual ending account balance or expenses you paid for the period. You may use this information to compare the ongoing costs of investing in the Fund and other funds by comparing this 5% hypothetical example with the 5% hypothetical examples that appear in the shareholder reports of other funds.
Please note that the expenses shown in the table are meant to highlight your ongoing costs only and do not reflect any transactional costs, such as sales charges (loads), or contingent deferred sales charges on redemptions. Therefore, the hypothetical example is useful in comparing ongoing costs only, and will not help you determine the relative total costs of owning different funds. In addition, if these transactional costs were included, your costs would have been higher.
| | | | | | | | | | | | | | | | | | | | | | | | |
| | | Beginning
Account
Value
5/1/2017 | | | Ending
Account
Value
10/31/2017 | | | Expenses
Paid
During
Period* | | | Annualized
Expense
Ratio* | | | Effective
Expenses
Paid
During
Period+ | | | Effective
Annualized
Expense
Ratio+ | |
| Class A | | | | | | | | | | | | | | | | | | | | | | | | |
Actual | | $ | 1,000 | | | $ | 1,005.00 | | | $ | 4.45 | | | | 0.88 | % | | $ | 4.55 | | | | 0.90 | % |
Hypothetical** | | $ | 1,000 | | | $ | 1,020.77 | | | $ | 4.48 | | | | 0.88 | % | | $ | 4.58 | | | | 0.90 | % |
| | |
| abfunds.com | | AB UNCONSTRAINED BOND FUND | 13 |
EXPENSE EXAMPLE (continued)
| | | | | | | | | | | | | | | | | | | | | | | | |
| | | Beginning
Account
Value
5/1/2017 | | | Ending
Account
Value
10/31/2017 | | | Expenses
Paid
During
Period* | | | Annualized
Expense
Ratio* | | | Effective
Expenses
Paid
During
Period+ | | | Effective
Annualized
Expense
Ratio+ | |
| Class B | | | | | | | | | | | | | | | | | | | | | | | | |
Actual | | $ | 1,000 | | | $ | 999.70 | | | $ | 8.17 | | | | 1.62 | % | | $ | 8.27 | | | | 1.64 | % |
Hypothetical** | | $ | 1,000 | | | $ | 1,017.04 | | | $ | 8.24 | | | | 1.62 | % | | $ | 8.34 | | | | 1.64 | % |
| Class C | | | | | | | | | | | | | | | | | | | | | | | | |
Actual | | $ | 1,000 | | | $ | 1,001.00 | | | $ | 8.17 | | | | 1.62 | % | | $ | 8.27 | | | | 1.64 | % |
Hypothetical** | | $ | 1,000 | | | $ | 1,017.04 | | | $ | 8.24 | | | | 1.62 | % | | $ | 8.34 | | | | 1.64 | % |
| Advisor Class | | | | | | | | | | | | | | | | | | | | | | | | |
Actual | | $ | 1,000 | | | $ | 1,005.10 | | | $ | 3.18 | | | | 0.63 | % | | $ | 3.34 | | | | 0.66 | % |
Hypothetical** | | $ | 1,000 | | | $ | 1,022.03 | | | $ | 3.21 | | | | 0.63 | % | | $ | 3.36 | | | | 0.66 | % |
| Class R | | | | | | | | | | | | | | | | | | | | | | | | |
Actual | | $ | 1,000 | | | $ | 1,002.60 | | | $ | 5.70 | | | | 1.13 | % | | $ | 5.80 | | | | 1.15 | % |
Hypothetical** | | $ | 1,000 | | | $ | 1,019.51 | | | $ | 5.75 | | | | 1.13 | % | | $ | 5.85 | | | | 1.15 | % |
| Class K | | | | | | | | | | | | | | | | | | | | | | | | |
Actual | | $ | 1,000 | | | $ | 1,003.20 | | | $ | 4.44 | | | | 0.88 | % | | $ | 4.54 | | | | 0.90 | % |
Hypothetical** | | $ | 1,000 | | | $ | 1,020.77 | | | $ | 4.48 | | | | 0.88 | % | | $ | 4.58 | | | | 0.90 | % |
| Class I | | | | | | | | | | | | | | | | | | | | | | | | |
Actual | | $ | 1,000 | | | $ | 1,005.40 | | | $ | 3.18 | | | | 0.63 | % | | $ | 3.29 | | | | 0.65 | % |
Hypothetical** | | $ | 1,000 | | | $ | 1,022.03 | | | $ | 3.21 | | | | 0.63 | % | | $ | 3.31 | | | | 0.65 | % |
| Class Z | | | | | | | | | | | | | | | | | | | | | | | | |
Actual | | $ | 1,000 | | | $ | 1,005.40 | | | $ | 3.18 | | | | 0.63 | % | | $ | 3.29 | | | | 0.65 | % |
Hypothetical** | | $ | 1,000 | | | $ | 1,022.03 | | | $ | 3.21 | | | | 0.63 | % | | $ | 3.31 | | | | 0.65 | % |
| * | Expenses are equal to the classes’ annualized expense ratios multiplied by the average account value over the period, multiplied by 184/365 (to reflect the one-half year period). |
| + | In connection with the Fund’s investments in affiliated/unaffiliated underlying portfolios, the Fund incurs no direct expenses, but bears proportionate shares of the fees and expenses (i.e., operating, administrative and investment advisory fees) of the affiliated/unaffiliated underlying portfolios. The Adviser has contractually agreed to waive its fees from the Fund in an amount equal to the Fund’s pro rata share of certain acquired fund fees and expenses of the affiliated underlying portfolios. The Fund’s total expenses are equal to the classes’ annualized expense ratio plus the Fund’s pro rata share of the weighted average expense ratio of the affiliated/unaffiliated underlying portfolios in which it invests, multiplied by the average account value over the period, multiplied by 184/365 (to reflect the one-half year period). |
| ** | Assumes 5% annual return before expenses. |
| | |
| 14 | AB UNCONSTRAINED BOND FUND | | abfunds.com |
PORTFOLIO SUMMARY
October 31, 2017 (unaudited)
PORTFOLIO STATISTICS
Net Assets ($mil): $306.7
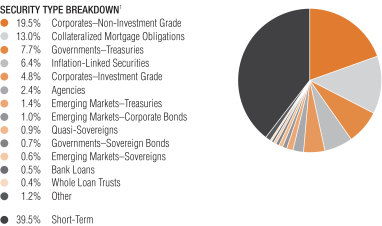
| 1 | All data are as of October 31, 2017. The Fund’s sector type breakdown is expressed as a percentage of total investments and may vary over time. The Fund also enters into derivative transactions, which may be used for hedging or investment purposes (see “Portfolio of Investments” section of the report for additional details). “Other” security type weightings represent 0.3% or less in the following security types: Asset-Backed Securities, Commercial Mortgage-Backed Securities, Common Stocks, Local Governments–Regional Bonds, Local Governments–US Municipal Bonds, Options Purchased–Puts, Preferred Stocks and Warrants. |
| | |
| abfunds.com | | AB UNCONSTRAINED BOND FUND | 15 |
PORTFOLIO SUMMARY (continued)
October 31, 2017 (unaudited)
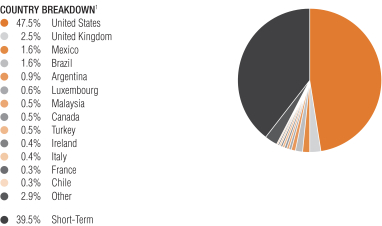
| 1 | All data are as of October 31, 2017. The Fund’s country breakdown is expressed as a percentage of total investments and may vary over time. The Fund also enters into derivative transactions, which may be used for hedging or investment purposes (see “Portfolio of Investments” section of the report for additional details). “Other” country weightings represent 0.3% or less in the following countries or regions: Australia, Dominican Republic, Ecuador, Eurozone, Finland, Gabon, Germany, Hong Kong, Hungary, Israel, Ivory Coast, Jamaica, Japan, Jersey (Channel Islands), Kuwait, Netherlands, New Zealand, Norway, Qatar, South Africa, Spain, Sweden, Switzerland, Uruguay and Zambia. |
| | |
| 16 | AB UNCONSTRAINED BOND FUND | | abfunds.com |
PORTFOLIO OF INVESTMENTS
October 31, 2017
| | | | | | | | | | | | |
| | | | | | Principal
Amount
(000) | | | U.S. $ Value | |
| |
| | | | | | | | | | | | |
CORPORATES – NON-INVESTMENT GRADE – 18.9% | | | | | | | | | | | | |
Industrial – 15.1% | | | | | | | | | | | | |
Basic – 1.4% | | | | | | | | | | | | |
AK Steel Corp.
7.625%, 10/01/21 | | | U.S.$ | | | | 29 | | | $ | 30,034 | |
ArcelorMittal
5.75%, 8/05/20 | | | | | | | 150 | | | | 162,861 | |
7.25%, 3/01/41 | | | | | | | 204 | | | | 250,238 | |
7.50%, 10/15/39 | | | | | | | 120 | | | | 149,755 | |
CF Industries, Inc.
7.125%, 5/01/20 | | | | | | | 150 | | | | 164,950 | |
FMG Resources August 206 Pty Ltd.
5.125%, 5/15/24(a) | | | | | | | 64 | | | | 65,899 | |
Freeport-McMoRan, Inc.
2.375%, 3/15/18 | | | | | | | 149 | | | | 148,958 | |
3.55%, 3/01/22 | | | | | | | 469 | | | | 463,848 | |
Graphic Packaging International, Inc.
4.75%, 4/15/21 | | | | | | | 60 | | | | 63,343 | |
Grinding Media, Inc./Moly-Cop AltaSteel Ltd.
7.375%, 12/15/23(a) | | | | | | | 44 | | | | 47,837 | |
Huntsman International LLC
4.875%, 11/15/20 | | | | | | | 100 | | | | 105,098 | |
Joseph T Ryerson & Son, Inc.
11.00%, 5/15/22(a) | | | | | | | 161 | | | | 181,442 | |
Lecta SA
6.50%, 8/01/23(a) | | | EUR | | | | 104 | | | | 128,306 | |
Momentive Performance Materials, Inc.
3.88%, 10/24/21 | | | U.S.$ | | | | 650 | | | | 675,598 | |
8.875%, 10/15/20(b)(c)(d)(e) | | | | | | | 650 | | | | – 0 | – |
Multi-Color Corp.
4.875%, 11/01/25(a) | | | | | | | 57 | | | | 57,496 | |
NOVA Chemicals Corp.
5.25%, 8/01/23(a) | | | | | | | 12 | | | | 12,377 | |
Novelis Corp.
6.25%, 8/15/24(a) | | | | | | | 90 | | | | 95,176 | |
Peabody Energy Corp.
6.00%, 11/15/18(b)(c)(d)(f) | | | | | | | 396 | | | | – 0 | – |
Plastipak Holdings, Inc.
6.25%, 10/15/25(a) | | | | | | | 42 | | | | 42,836 | |
Reynolds Group Issuer, Inc./Reynolds Group Issuer LLC/Reynolds Group Issuer Lu
5.125%, 7/15/23(a) | | | | | | | 150 | | | | 155,847 | |
7.00%, 7/15/24(a) | | | | | | | 87 | | | | 92,947 | |
Sealed Air Corp.
6.875%, 7/15/33(a) | | | | | | | 442 | | | | 517,140 | |
| | |
| abfunds.com | | AB UNCONSTRAINED BOND FUND | 17 |
PORTFOLIO OF INVESTMENTS (continued)
| | | | | | | | | | | | |
| | | | | | Principal
Amount
(000) | | | U.S. $ Value | |
| |
| | | | | | | | | | | | |
Steel Dynamics, Inc.
5.125%, 10/01/21 | | | U.S.$ | | | | 90 | | | $ | 92,497 | |
Teck Resources Ltd.
5.40%, 2/01/43 | | | | | | | 538 | | | | 545,089 | |
8.50%, 6/01/24(a) | | | | | | | 22 | | | | 25,189 | |
United States Steel Corp.
8.375%, 7/01/21(a) | | | | | | | 134 | | | | 147,090 | |
| | | | | | | | | | | | |
| | | | | | | | | | | 4,421,851 | |
| | | | | | | | | | | | |
Capital Goods – 0.6% | | | | | | | | | | | | |
Apex Tool Group LLC
7.00%, 2/01/21(a) | | | | | | | 70 | | | | 66,140 | |
Ardagh Packaging Finance PLC/Ardagh Holdings USA, Inc.
6.75%, 5/15/24(a) | | | EUR | | | | 280 | | | | 364,889 | |
Ball Corp.
5.00%, 3/15/22 | | | U.S.$ | | | | 120 | | | | 129,316 | |
Bombardier, Inc.
5.75%, 3/15/22(a) | | | | | | | 447 | | | | 443,964 | |
6.00%, 10/15/22(a) | | | | | | | 70 | | | | 69,085 | |
BWAY Holding Co.
5.50%, 4/15/24(a) | | | | | | | 156 | | | | 162,514 | |
Exide Technologies
11.00%, 4/30/22(b)(g)(h) | | | | | | | 110 | | | | 93,500 | |
Gates Global LLC/Gates Global Co.
6.00%, 7/15/22(a) | | | | | | | 62 | | | | 63,738 | |
GFL Environmental, Inc.
5.625%, 5/01/22(a) | | | | | | | 29 | | | | 30,128 | |
9.875%, 2/01/21(a) | | | | | | | 86 | | | | 91,835 | |
KLX, Inc.
5.875%, 12/01/22(a) | | | | | | | 123 | | | | 128,663 | |
TransDigm, Inc.
6.00%, 7/15/22 | | | | | | | 150 | | | | 156,222 | |
6.50%, 7/15/24 | | | | | | | 67 | | | | 69,092 | |
| | | | | | | | | | | | |
| | | | | | | | | | | 1,869,086 | |
| | | | | | | | | | | | |
Communications - Media – 2.2% | | | | | | | | | | | | |
Altice Financing SA
6.625%, 2/15/23(a) | | | | | | | 420 | | | | 442,097 | |
Altice Finco SA
4.75%, 1/15/28 | | | EUR | | | | 100 | | | | 117,795 | |
Altice US Finance I Corp.
5.375%, 7/15/23(a) | | | U.S.$ | | | | 200 | | | | 208,997 | |
AMC Networks, Inc.
5.00%, 4/01/24 | | | | | | | 21 | | | | 21,385 | |
CCO Holdings LLC/CCO Holdings Capital Corp.
4.00%, 3/01/23(a) | | | | | | | 218 | | | | 221,148 | |
5.00%, 2/01/28(a) | | | | | | | 285 | | | | 282,849 | |
| | |
| 18 | AB UNCONSTRAINED BOND FUND | | abfunds.com |
PORTFOLIO OF INVESTMENTS (continued)
| | | | | | | | | | | | |
| | | | | | Principal
Amount
(000) | | | U.S. $ Value | |
| |
| | | | | | | | | | | | |
5.125%, 2/15/23 | | | U.S.$ | | | | 244 | | | $ | 251,637 | |
5.875%, 5/01/27(a) | | | | | | | 91 | | | | 95,361 | |
Clear Channel Worldwide Holdings, Inc.
Series B
6.50%, 11/15/22 | | | | | | | 353 | | | | 365,303 | |
CSC Holdings LLC
5.25%, 6/01/24 | | | | | | | 195 | | | | 194,482 | |
6.75%, 11/15/21 | | | | | | | 116 | | | | 127,849 | |
10.875%, 10/15/25(a) | | | | | | | 173 | | | | 212,404 | |
DISH DBS Corp.
5.875%, 7/15/22 | | | | | | | 520 | | | | 523,826 | |
6.75%, 6/01/21 | | | | | | | 150 | | | | 157,469 | |
iHeartCommunications, Inc.
9.00%, 12/15/19-3/01/21 | | | | | | | 571 | | | | 415,367 | |
Lamar Media Corp.
5.00%, 5/01/23 | | | | | | | 92 | | | | 94,990 | |
McGraw-Hill Global Education Holdings LLC/McGraw-Hill Global Education Finance
7.875%, 5/15/24(a) | | | | | | | 510 | | | | 514,133 | |
Netflix, Inc.
4.375%, 11/15/26(a) | | | | | | | 77 | | | | 75,545 | |
Radiate Holdco LLC/Radiate Finance, Inc.
6.625%, 2/15/25(a) | | | | | | | 43 | | | | 42,028 | |
SFR Group SA
6.00%, 5/15/22(a) | | | | | | | 200 | | | | 208,549 | |
7.375%, 5/01/26(a) | | | | | | | 450 | | | | 484,183 | |
Sirius XM Radio, Inc.
3.875%, 8/01/22(a) | | | | | | | 185 | | | | 188,512 | |
6.00%, 7/15/24(a) | | | | | | | 85 | | | | 90,866 | |
TEGNA, Inc.
6.375%, 10/15/23 | | | | | | | 247 | | | | 262,692 | |
Time, Inc.
5.75%, 4/15/22(a) | | | | | | | 32 | | | | 32,238 | |
7.50%, 10/15/25(a) | | | | | | | 74 | | | | 74,346 | |
Univision Communications, Inc.
5.125%, 5/15/23(a) | | | | | | | 123 | | | | 124,346 | |
Urban One, Inc.
7.375%, 4/15/22(a) | | | | | | | 37 | | | | 37,370 | |
9.25%, 2/15/20(a) | | | | | | | 155 | | | | 146,188 | |
Virgin Media Receivables Financing Notes I DAC
5.50%, 9/15/24(a) | | | GBP | | | | 100 | | | | 138,351 | |
Virgin Media Secured Finance PLC
4.875%, 1/15/27(a) | | | | | | | 166 | | | | 229,260 | |
Ziggo Bond Finance BV
5.875%, 1/15/25(a) | | | U.S.$ | | | | 220 | | | | 227,342 | |
| | | | | | | | | | | | |
| | | | | | | | | | | 6,608,908 | |
| | | | | | | | | | | | |
| | |
| abfunds.com | | AB UNCONSTRAINED BOND FUND | 19 |
PORTFOLIO OF INVESTMENTS (continued)
| | | | | | | | | | | | |
| | | | | | Principal
Amount
(000) | | | U.S. $ Value | |
| |
| | | | | | | | | | | | |
Communications - Telecommunications – 1.8% | | | | | | | | | | | | |
CenturyLink, Inc.
Series S
6.45%, 6/15/21 | | | U.S.$ | | | | 60 | | | $ | 63,358 | |
Series T
5.80%, 3/15/22 | | | | | | | 464 | | | | 470,855 | |
Series U
7.65%, 3/15/42 | | | | | | | 103 | | | | 93,586 | |
Embarq Corp.
7.995%, 6/01/36 | | | | | | | 105 | | | | 105,998 | |
Frontier Communications Corp.
7.625%, 4/15/24 | | | | | | | 630 | | | | 480,554 | |
8.75%, 4/15/22 | | | | | | | 134 | | | | 110,410 | |
10.50%, 9/15/22 | | | | | | | 55 | | | | 48,070 | |
Intelsat Jackson Holdings SA
5.50%, 8/01/23 | | | | | | | 88 | | | | 74,805 | |
7.25%, 10/15/20 | | | | | | | 93 | | | | 89,301 | |
7.50%, 4/01/21 | | | | | | | 266 | | | | 252,646 | |
9.50%, 9/30/22(a) | | | | | | | 119 | | | | 139,867 | |
9.75%, 7/15/25(a) | | | | | | | 129 | | | | 129,118 | |
Level 3 Financing, Inc.
5.375%, 8/15/22 | | | | | | | 144 | | | | 148,349 | |
Qwest Corp.
6.75%, 12/01/21 | | | | | | | 67 | | | | 74,152 | |
SoftBank Group Corp.
4.50%, 4/15/20(a) | | | | | | | 200 | | | | 206,485 | |
Sprint Communications, Inc.
7.00%, 3/01/20(a) | | | | | | | 521 | | | | 564,648 | |
Sprint Corp.
7.25%, 9/15/21 | | | | | | | 58 | | | | 63,213 | |
7.625%, 2/15/25 | | | | | | | 423 | | | | 463,221 | |
7.875%, 9/15/23 | | | | | | | 266 | | | | 297,558 | |
T-Mobile USA, Inc.
6.00%, 4/15/24 | | | | | | | 128 | | | | 137,014 | |
6.375%, 3/01/25 | | | | | | | 153 | | | | 165,204 | |
6.836%, 4/28/23 | | | | | | | 310 | | | | 327,119 | |
Telecom Italia Capital SA
7.20%, 7/18/36 | | | | | | | 313 | | | | 388,685 | |
Wind Acquisition Finance SA
4.75%, 7/15/20(a) | | | | | | | 358 | | | | 362,388 | |
Wind Tre SpA
Series X
5.00%, 1/20/26 | | | | | | | 200 | | | | 201,240 | |
Windstream Services LLC
6.375%, 8/01/23 | | | | | | | 193 | | | | 140,635 | |
7.75%, 10/01/21 | | | | | | | 45 | | | | 34,172 | |
| | |
| 20 | AB UNCONSTRAINED BOND FUND | | abfunds.com |
PORTFOLIO OF INVESTMENTS (continued)
| | | | | | | | | | | | |
| | | | | | Principal
Amount
(000) | | | U.S. $ Value | |
| |
| | | | | | | | | | | | |
Zayo Group LLC/Zayo Capital, Inc.
6.00%, 4/01/23 | | | U.S.$ | | | | 52 | | | $ | 54,793 | |
| | | | | | | | | | | | |
| | | | 5,687,444 | |
| | | | | | | | | | | | |
Consumer Cyclical - Automotive – 0.2% | | | | | | | | | | | | |
Dana Financing Luxembourg SARL
6.50%, 6/01/26(a) | | | | | | | 178 | | | | 193,570 | |
Exide Technologies
7.00%, 4/30/25(b)(g)(h)(i) | | | | | | | 251 | | | | 152,118 | |
Goodyear Tire & Rubber Co. (The)
5.125%, 11/15/23 | | | | | | | 152 | | | | 156,583 | |
Meritor, Inc.
6.25%, 2/15/24 | | | | | | | 70 | | | | 74,805 | |
| | | | | | | | | | | | |
| | | | 577,076 | |
| | | | | | | | | | | | |
Consumer Cyclical - Entertainment – 0.1% | | | | | | | | | | | | |
NCL Corp., Ltd.
4.75%, 12/15/21(a) | | | | | | | 90 | | | | 93,568 | |
Silversea Cruise Finance Ltd.
7.25%, 2/01/25(a) | | | | | | | 84 | | | | 90,139 | |
| | | | | | | | | | | | |
| | | | 183,707 | |
| | | | | | | | | | | | |
Consumer Cyclical - Other – 1.8% | | | | | | | | | | | | |
Beazer Homes USA, Inc.
8.75%, 3/15/22 | | | | | | | 482 | | | | 535,306 | |
CalAtlantic Group, Inc.
5.875%, 11/15/24 | | | | | | | 302 | | | | 335,562 | |
Eldorado Resorts, Inc.
6.00%, 4/01/25 | | | | | | | 38 | | | | 40,177 | |
K. Hovnanian Enterprises, Inc.
10.00%, 7/15/22(a) | | | | | | | 108 | | | | 118,022 | |
10.50%, 7/15/24(a) | | | | | | | 108 | | | | 120,237 | |
Lennar Corp.
4.50%, 6/15/19-4/30/24 | | | | | | | 885 | | | | 908,829 | |
MDC Holdings, Inc.
6.00%, 1/15/43 | | | | | | | 361 | | | | 349,563 | |
Meritage Homes Corp.
7.00%, 4/01/22 | | | | | | | 340 | | | | 389,371 | |
MGM Resorts International
6.75%, 10/01/20 | | | | | | | 172 | | | | 189,509 | |
PulteGroup, Inc.
5.00%, 1/15/27 | | | | | | | 754 | | | | 792,450 | |
7.875%, 6/15/32 | | | | | | | 220 | | | | 272,011 | |
RSI Home Products, Inc.
6.50%, 3/15/23(a) | | | | | | | 280 | | | | 293,681 | |
Scientific Games International, Inc.
7.00%, 1/01/22(a) | | | | | | | 70 | | | | 74,048 | |
| | |
| abfunds.com | | AB UNCONSTRAINED BOND FUND | 21 |
PORTFOLIO OF INVESTMENTS (continued)
| | | | | | | | | | | | |
| | | | | | Principal
Amount
(000) | | | U.S. $ Value | |
| |
| | | | | | | | | | | | |
Shea Homes LP/Shea Homes Funding Corp.
5.875%, 4/01/23(a) | | | U.S.$ | | | | 789 | | | $ | 818,030 | |
Standard Industries, Inc./NJ
5.50%, 2/15/23(a) | | | | | | | 180 | | | | 190,436 | |
Sugarhouse HSP Gaming Prop Mezz LP/Sugarhouse HSP Gaming Finance Corp.
5.875%, 5/15/25(a) | | | | | | | 43 | | | | 41,902 | |
Taylor Morrison Communities, Inc./Taylor Morrison Holdings II, Inc.
5.625%, 3/01/24(a) | | | | | | | 165 | | | | 172,588 | |
| | | | | | | | | | | | |
| | | | | | | | | | | 5,641,722 | |
| | | | | | | | | | | | |
Consumer Cyclical - Retailers – 0.4% | | | | | | | | | | | | |
Dollar Tree, Inc.
5.75%, 3/01/23 | | | | | | | 60 | | | | 63,089 | |
FirstCash, Inc.
5.375%, 6/01/24(a) | | | | | | | 16 | | | | 16,742 | |
Group 1 Automotive, Inc.
5.00%, 6/01/22 | | | | | | | 154 | | | | 158,773 | |
JC Penney Corp., Inc.
5.875%, 7/01/23(a) | | | | | | | 31 | | | | 29,744 | |
L Brands, Inc.
6.875%, 11/01/35 | | | | | | | 73 | | | | 72,479 | |
6.95%, 3/01/33 | | | | | | | 260 | | | | 255,489 | |
Neiman Marcus Group Ltd. LLC
8.00%, 10/15/21(a) | | | | | | | 191 | | | | 112,690 | |
8.75% (8.75% Cash or 9.50% PIK), 10/15/21(a)(g) | | | | | | | 155 | | | | 83,716 | |
Penske Automotive Group, Inc.
3.75%, 8/15/20 | | | | | | | 130 | | | | 132,613 | |
PetSmart, Inc.
7.125%, 3/15/23(a) | | | | | | | 67 | | | | 51,253 | |
Sonic Automotive, Inc.
5.00%, 5/15/23 | | | | | | | 139 | | | | 136,915 | |
6.125%, 3/15/27 | | | | | | | 48 | | | | 49,744 | |
| | | | | | | | | | | | |
| | | | | | | | | | | 1,163,247 | |
| | | | | | | | | | | | |
Consumer Non-Cyclical – 2.0% | | | | | | | | | | | | |
Albertsons Cos. LLC/Safeway, Inc./New Albertson’s, Inc./Albertson’s LLC
6.625%, 6/15/24 | | | | | | | 258 | | | | 241,929 | |
Catalent Pharma Solutions, Inc.
4.875%, 1/15/26(a) | | | | | | | 25 | | | | 25,374 | |
CHS/Community Health Systems, Inc.
5.125%, 8/01/21 | | | | | | | 66 | | | | 64,313 | |
6.875%, 2/01/22 | | | | | | | 230 | | | | 167,427 | |
7.125%, 7/15/20 | | | | | | | 359 | | | | 311,399 | |
| | |
| 22 | AB UNCONSTRAINED BOND FUND | | abfunds.com |
PORTFOLIO OF INVESTMENTS (continued)
| | | | | | | | | | | | |
| | | | | | Principal
Amount
(000) | | | U.S. $ Value | |
| |
| | | | | | | | | | | | |
DaVita, Inc.
5.00%, 5/01/25 | | | U.S.$ | | | | 130 | | | $ | 128,480 | |
5.75%, 8/15/22 | | | | | | | 32 | | | | 32,989 | |
Endo Dac/Endo Finance LLC/Endo Finco, Inc.
6.00%, 7/15/23(a) | | | | | | | 298 | | | | 241,380 | |
Endo Finance LLC/Endo Finco, Inc.
5.375%, 1/15/23(a) | | | | | | | 40 | | | | 32,232 | |
Envision Healthcare Corp.
5.625%, 7/15/22 | | | | | | | 170 | | | | 173,390 | |
HCA Healthcare, Inc.
6.25%, 2/15/21 | | | | | | | 88 | | | | 94,695 | |
HCA, Inc.
4.75%, 5/01/23 | | | | | | | 170 | | | | 177,854 | |
5.875%, 3/15/22 | | | | | | | 655 | | | | 716,674 | |
6.50%, 2/15/20 | | | | | | | 230 | | | | 248,309 | |
7.58%, 9/15/25 | | | | | | | 65 | | | | 72,925 | |
Kinetic Concepts, Inc./KCI USA, Inc.
7.875%, 2/15/21(a) | | | | | | | 461 | | | | 482,754 | |
LifePoint Health, Inc.
5.375%, 5/01/24 | | | | | | | 41 | | | | 41,153 | |
5.875%, 12/01/23 | | | | | | | 127 | | | | 130,826 | |
Mallinckrodt International Finance SA
4.75%, 4/15/23 | | | | | | | 38 | | | | 32,204 | |
Mallinckrodt International Finance SA/Mallinckrodt CB LLC
5.50%, 4/15/25(a) | | | | | | | 278 | | | | 249,902 | |
5.625%, 10/15/23(a) | | | | | | | 20 | | | | 18,708 | |
MEDNAX, Inc.
5.25%, 12/01/23(a) | | | | | | | 185 | | | | 193,113 | |
Post Holdings, Inc.
5.75%, 3/01/27(a) | | | | | | | 190 | | | | 197,712 | |
Spectrum Brands, Inc.
6.625%, 11/15/22 | | | | | | | 90 | | | | 93,691 | |
Tenet Healthcare Corp.
4.50%, 4/01/21 | | | | | | | 313 | | | | 316,194 | |
6.00%, 10/01/20 | | | | | | | 148 | | | | 156,142 | |
6.75%, 6/15/23 | | | | | | | 227 | | | | 213,131 | |
8.125%, 4/01/22 | | | | | | | 130 | | | | 130,598 | |
Valeant Pharmaceuticals International, Inc.
5.375%, 3/15/20(a) | | | | | | | 188 | | | | 184,724 | |
5.50%, 3/01/23-11/01/25(a) | | | | | | | 332 | | | | 303,677 | |
5.625%, 12/01/21(a) | | | | | | | 565 | | | | 516,660 | |
5.875%, 5/15/23(a) | | | | | | | 85 | | | | 71,825 | |
| | | | | | | | | | | | |
| | | | | | | | | | | 6,062,384 | |
| | | | | | | | | | | | |
| | |
| abfunds.com | | AB UNCONSTRAINED BOND FUND | 23 |
PORTFOLIO OF INVESTMENTS (continued)
| | | | | | | | | | | | |
| | | | | | Principal
Amount
(000) | | | U.S. $ Value | |
| |
| | | | | | | | | | | | |
Energy – 2.1% | | | | | | | | | | | | |
Antero Resources Corp.
5.00%, 3/01/25 | | | U.S.$ | | | | 65 | | | $ | 66,158 | |
5.125%, 12/01/22 | | | | | | | 49 | | | | 50,313 | |
5.625%, 6/01/23 | | | | | | | 154 | | | | 161,004 | |
Bill Barrett Corp.
7.00%, 10/15/22 | | | | | | | 43 | | | | 41,873 | |
8.75%, 6/15/25 | | | | | | | 5 | | | | 4,927 | |
California Resources Corp.
5.50%, 9/15/21 | | | | | | | 45 | | | | 26,606 | |
6.00%, 11/15/24 | | | | | | | 51 | | | | 23,651 | |
8.00%, 12/15/22(a) | | | | | | | 223 | | | | 147,180 | |
Carrizo Oil & Gas, Inc.
6.25%, 4/15/23 | | | | | | | 73 | | | | 74,184 | |
8.25%, 7/15/25 | | | | | | | 19 | | | | 20,444 | |
Cheniere Corpus Christi Holdings LLC
5.875%, 3/31/25 | | | | | | | 172 | | | | 186,089 | |
7.00%, 6/30/24 | | | | | | | 180 | | | | 205,692 | |
Cheniere Energy Partners LP
5.25%, 10/01/25(a) | | | | | | | 82 | | | | 84,417 | |
Cheniere Energy, Inc.
4.875%, 5/28/21(a)(b)(g)(i) | | | | | | | 61 | | | | 59,489 | |
Chesapeake Energy Corp.
6.125%, 2/15/21 | | | | | | | 268 | | | | 270,668 | |
6.625%, 8/15/20 | | | | | | | 31 | | | | 32,011 | |
Continental Resources, Inc./OK
3.80%, 6/01/24 | | | | | | | 165 | | | | 160,727 | |
5.00%, 9/15/22 | | | | | | | 85 | | | | 86,127 | |
Denbury Resources, Inc.
5.50%, 5/01/22 | | | | | | | 150 | | | | 93,750 | |
Diamond Offshore Drilling, Inc.
4.875%, 11/01/43 | | | | | | | 154 | | | | 115,885 | |
5.70%, 10/15/39 | | | | | | | 212 | | | | 178,846 | |
7.875%, 8/15/25 | | | | | | | 23 | | | | 24,601 | |
Energy Transfer Equity LP
4.25%, 3/15/23 | | | | | | | 197 | | | | 200,400 | |
5.875%, 1/15/24 | | | | | | | 310 | | | | 336,707 | |
Ensco PLC
4.50%, 10/01/24 | | | | | | | 138 | | | | 113,261 | |
5.20%, 3/15/25 | | | | | | | 138 | | | | 116,162 | |
EP Energy LLC/Everest Acquisition Finance, Inc.
8.00%, 2/15/25(a) | | | | | | | 150 | | | | 110,813 | |
9.375%, 5/01/20 | | | | | | | 103 | | | | 86,554 | |
Genesis Energy LP/Genesis Energy Finance Corp.
6.75%, 8/01/22 | | | | | | | 22 | | | | 22,703 | |
| | |
| 24 | AB UNCONSTRAINED BOND FUND | | abfunds.com |
PORTFOLIO OF INVESTMENTS (continued)
| | | | | | | | | | | | |
| | | | | | Principal
Amount
(000) | | | U.S. $ Value | |
| |
| | | | | | | | | | | | |
Golden Energy Offshore Services AS
5.00%, 12/31/17(b)(h) | | | NOK | | | | 7,579 | | | $ | 417,546 | |
Gulfport Energy Corp.
6.00%, 10/15/24 | | | U.S.$ | | | | 70 | | | | 70,331 | |
6.375%, 5/15/25 | | | | | | | 72 | | | | 72,785 | |
6.375%, 1/15/26(a) | | | | | | | 52 | | | | 52,604 | |
Murphy Oil Corp.
4.00%, 6/01/22 | | | | | | | 59 | | | | 58,725 | |
6.875%, 8/15/24 | | | | | | | 76 | | | | 81,793 | |
Murphy Oil USA, Inc.
5.625%, 5/01/27 | | | | | | | 5 | | | | 5,329 | |
Nabors Industries, Inc.
4.625%, 9/15/21 | | | | | | | 82 | | | | 79,142 | |
5.50%, 1/15/23 | | | | | | | 183 | | | | 175,779 | |
Noble Holding International Ltd.
5.25%, 3/15/42 | | | | | | | 70 | | | | 44,275 | |
6.20%, 8/01/40 | | | | | | | 63 | | | | 42,604 | |
7.70%, 4/01/25(j) | | | | | | | 139 | | | | 121,101 | |
7.75%, 1/15/24 | | | | | | | 143 | | | | 127,584 | |
Oasis Petroleum, Inc.
6.875%, 3/15/22 | | | | | | | 62 | | | | 63,614 | |
QEP Resources, Inc.
5.25%, 5/01/23 | | | | | | | 202 | | | | 199,063 | |
Range Resources Corp.
5.00%, 8/15/22-3/15/23 | | | | | | | 204 | | | | 202,615 | |
5.875%, 7/01/22 | | | | | | | 6 | | | | 6,165 | |
Rowan Cos., Inc.
7.375%, 6/15/25 | | | | | | | 40 | | | | 40,113 | |
Sanchez Energy Corp.
6.125%, 1/15/23 | | | | | | | 69 | | | | 57,846 | |
7.75%, 6/15/21 | | | | | | | 10 | | | | 9,302 | |
SandRidge Energy, Inc.
8.125%, 10/15/22(b)(c)(d)(f) | | | | | | | 665 | | | | – 0 | – |
SemGroup Corp.
6.375%, 3/15/25(a) | | | | | | | 35 | | | | 34,547 | |
7.25%, 3/15/26(a) | | | | | | | 32 | | | | 32,636 | |
SM Energy Co.
5.00%, 1/15/24 | | | | | | | 35 | | | | 33,537 | |
6.50%, 11/15/21-1/01/23 | | | | | | | 194 | | | | 197,063 | |
Targa Resources Partners LP/Targa Resources Partners Finance Corp.
4.125%, 11/15/19 | | | | | | | 96 | | | | 97,085 | |
Transocean, Inc.
6.80%, 3/15/38 | | | | | | | 261 | | | | 212,457 | |
7.50%, 1/15/26(a) | | | | | | | 39 | | | | 40,195 | |
9.00%, 7/15/23(a) | | | | | | | 279 | | | | 303,406 | |
| | |
| abfunds.com | | AB UNCONSTRAINED BOND FUND | 25 |
PORTFOLIO OF INVESTMENTS (continued)
| | | | | | | | | | | | |
| | | | | | Principal
Amount
(000) | | | U.S. $ Value | |
| |
| | | | | | | | | | | | |
Vine Oil & Gas LP/Vine Oil & Gas Finance Corp.
8.75%, 4/15/23(a) | | | U.S.$ | | | | 65 | | | $ | 63,549 | |
Weatherford International Ltd.
5.875%, 7/01/21(i) | | | | | | | 77 | | | | 77,425 | |
7.75%, 6/15/21 | | | | | | | 147 | | | | 151,600 | |
9.875%, 2/15/24 | | | | | | | 34 | | | | 36,376 | |
Whiting Petroleum Corp.
5.75%, 3/15/21 | | | | | | | 34 | | | | 34,145 | |
WPX Energy, Inc.
7.50%, 8/01/20 | | | | | | | 100 | | | | 108,707 | |
| | | | | | | | | | | | |
| | | | | | | | | | | 6,452,286 | |
| | | | | | | | | | | | |
Other Industrial – 0.2% | | | | | | | | | | | | |
American Builders & Contractors Supply Co., Inc.
5.75%, 12/15/23(a) | | | | | | | 68 | | | | 72,282 | |
American Tire Distributors, Inc.
10.25%, 3/01/22(a) | | | | | | | 182 | | | | 189,775 | |
Belden, Inc.
5.50%, 4/15/23(a) | | | EUR | | | | 100 | | | | 122,356 | |
H&E Equipment Services, Inc.
5.625%, 9/01/25(a) | | | U.S.$ | | | | 27 | | | | 28,480 | |
HRG Group, Inc.
7.875%, 7/15/19 | | | | | | | 182 | | | | 183,976 | |
Travis Perkins PLC
4.50%, 9/07/23(a) | | | GBP | | | | 100 | | | | 139,106 | |
| | | | | | | | | | | | |
| | | | | | | | | | | 735,975 | |
| | | | | | | | | | | | |
Services – 0.6% | | | | | | | | | | | | |
ADT Corp. (The)
3.50%, 7/15/22 | | | U.S.$ | | | | 179 | | | | 178,468 | |
APX Group, Inc.
8.75%, 12/01/20 | | | | | | | 450 | | | | 460,992 | |
CSVC Acquisition Corp.
7.75%, 6/15/25(a) | | | | | | | 75 | | | | 73,228 | |
DB Master Finance LLC
Series 2017-1A, Class A2I
3.629%, 11/20/47(a)(b) | | | | | | | 72 | | | | 72,382 | |
GEO Group, Inc. (The)
5.875%, 1/15/22 | | | | | | | 94 | | | | 97,138 | |
iPayment, Inc.
10.75%, 4/15/24(a) | | | | | | | 100 | | | | 112,647 | |
KAR Auction Services, Inc.
5.125%, 6/01/25(a) | | | | | | | 28 | | | | 28,984 | |
Nielsen Finance LLC/Nielsen Finance Co.
5.00%, 4/15/22(a) | | | | | | | 135 | | | | 139,016 | |
| | |
| 26 | AB UNCONSTRAINED BOND FUND | | abfunds.com |
PORTFOLIO OF INVESTMENTS (continued)
| | | | | | | | | | | | |
| | | | | | Principal
Amount
(000) | | | U.S. $ Value | |
| |
| | | | | | | | | | | | |
Prime Security Services Borrower LLC/Prime Finance, Inc.
9.25%, 5/15/23(a) | | | U.S.$ | | | | 313 | | | $ | 346,844 | |
Sabre GLBL, Inc.
5.25%, 11/15/23(a) | | | | | | | 66 | | | | 69,095 | |
Team Health Holdings, Inc.
6.375%, 2/01/25(a) | | | | | | | 207 | | | | 190,741 | |
| | | | | | | | | | | | |
| | | | | | | | | | | 1,769,535 | |
| | | | | | | | | | | | |
Technology – 1.1% | | | | | | | | | | | | |
Ascend Learning LLC
6.875%, 8/01/25(a) | | | | | | | 18 | | | | 18,851 | |
Avaya, Inc.
10.50%, 3/01/21(a)(b)(c)(k) | | | | | | | 1,062 | | | | 63,720 | |
BMC Software Finance, Inc.
8.125%, 7/15/21(a) | | | | | | | 655 | | | | 672,111 | |
Boxer Parent Co., Inc.
9.00% (9.00% Cash or 9.75% PIK), 10/15/19(a)(g) | | | | | | | 175 | | | | 175,086 | |
Conduent Finance, Inc./Conduent Business Services LLC
10.50%, 12/15/24(a) | | | | | | | 135 | | | | 159,701 | |
CURO Financial Technologies Corp.
12.00%, 3/01/22(a) | | | | | | | 56 | | | | 61,290 | |
Dell International LLC/EMC Corp.
5.875%, 6/15/21(a) | | | | | | | 62 | | | | 64,845 | |
7.125%, 6/15/24(a) | | | | | | | 289 | | | | 319,172 | |
First Data Corp.
5.00%, 1/15/24(a) | | | | | | | 96 | | | | 99,839 | |
Infor US, Inc.
6.50%, 5/15/22 | | | | | | | 470 | | | | 489,966 | |
Nokia Oyj
3.375%, 6/12/22 | | | | | | | 38 | | | | 37,872 | |
NXP BV/NXP Funding LLC
4.125%, 6/01/21(a) | | | | | | | 200 | | | | 208,962 | |
Quintiles IMS, Inc.
3.25%, 3/15/25(a) | | | EUR | | | | 213 | | | | 257,453 | |
Solera LLC/Solera Finance, Inc.
10.50%, 3/01/24(a) | | | U.S.$ | | | | 136 | | | | 154,774 | |
Western Digital Corp.
10.50%, 4/01/24 | | | | | | | 411 | | | | 482,240 | |
| | | | | | | | | | | | |
| | | | | | | | | | | 3,265,882 | |
| | | | | | | | | | | | |
Transportation - Services – 0.6% | | | | | | | | | | | | |
Avis Budget Car Rental LLC/Avis Budget Finance, Inc.
5.50%, 4/01/23 | | | | | | | 468 | | | | 469,597 | |
6.375%, 4/01/24(a) | | | | | | | 397 | | | | 412,384 | |
| | |
| abfunds.com | | AB UNCONSTRAINED BOND FUND | 27 |
PORTFOLIO OF INVESTMENTS (continued)
| | | | | | | | | | | | |
| | | | | | Principal
Amount
(000) | | | U.S. $ Value | |
| |
| | | | | | | | | | | | |
CEVA Group PLC
9.00%, 9/01/21(a) | | | U.S.$ | | | | 217 | | | $ | 199,719 | |
Herc Rentals, Inc.
7.50%, 6/01/22(a) | | | | | | | 72 | | | | 77,937 | |
7.75%, 6/01/24(a) | | | | | | | 134 | | | | 147,032 | |
Hertz Corp. (The)
5.50%, 10/15/24(a) | | | | | | | 35 | | | | 31,607 | |
5.875%, 10/15/20 | | | | | | | 24 | | | | 23,853 | |
7.375%, 1/15/21 | | | | | | | 240 | | | | 240,925 | |
Loxam SAS
4.25%, 4/15/24(a) | | | EUR | | | | 100 | | | | 124,977 | |
United Rentals North America, Inc.
5.50%, 7/15/25-5/15/27 | | | U.S.$ | | | | 256 | | | | 274,285 | |
| | | | | | | | | | | | |
| | | | | | | | | | | 2,002,316 | |
| | | | | | | | | | | | |
| | | | | | | | | | | 46,441,419 | |
| | | | | | | | | | | | |
Financial Institutions – 3.4% | | | | | | | | | | | | |
Banking – 2.4% | | | | | | | | | | | | |
Allied Irish Banks PLC
Series E
7.375%, 12/03/20(a)(l) | | | EUR | | | | 200 | | | | 265,586 | |
Ally Financial, Inc.
4.125%, 3/30/20 | | | U.S.$ | | | | 432 | | | | 446,391 | |
8.00%, 11/01/31 | | | | | | | 270 | | | | 355,206 | |
Banco Bilbao Vizcaya Argentaria SA
8.875%, 4/14/21(a)(l) | | | EUR | | | | 200 | | | | 279,880 | |
Barclays PLC
8.00%, 12/15/20(l) | | | | | | | 200 | | | | 269,782 | |
Credit Suisse Group AG
6.25%, 12/18/24(a)(l) | | | U.S.$ | | | | 208 | | | | 227,589 | |
Goldman Sachs Group, Inc. (The)
Series P
5.00%, 11/10/22(l) | | | | | | | 89 | | | | 88,984 | |
Intesa Sanpaolo SpA
3.928%, 9/15/26(a) | | | EUR | | | | 180 | | | | 232,766 | |
National Westminster Bank PLC
1.82% (EURIBOR 3 Month + 2.15%), 1/05/18(l)(m) | | | | | | | 200 | | | | 226,211 | |
Royal Bank of Scotland Group PLC
2.001% (EURIBOR 3 Month + 2.33%), 12/31/17(a)(l)(m) | | | | | | | 50 | | | | 56,714 | |
Series U
3.655% (LIBOR 3 Month + 2.32%), 9/30/27(l)(m) | | | U.S.$ | �� | | | 3,400 | | | | 3,307,670 | |
Standard Chartered PLC
2.888% (LIBOR 3 Month + 1.51%), 1/30/27(a)(l)(m) | | | | | | | 1,200 | | | | 1,040,701 | |
7.50%, 4/02/22(a)(l) | | | | | | | 335 | | | | 367,268 | |
| | |
| 28 | AB UNCONSTRAINED BOND FUND | | abfunds.com |
PORTFOLIO OF INVESTMENTS (continued)
| | | | | | | | | | | | |
| | | | | | Principal
Amount
(000) | | | U.S. $ Value | |
| |
| | | | | | | | | | | | |
UBS Group AG
7.00%, 2/19/25(a)(l) | | | U.S.$ | | | | 200 | | | $ | 229,225 | |
| | | | | | | | | | | | |
| | | | | | | | | | | 7,393,973 | |
| | | | | | | | | | | | |
Brokerage – 0.0% | | | | | | | | | | | | |
Lehman Brothers Holdings, Inc.
Zero Coupon, 1/12/12(b)(c)(n) | | | | | | | 440 | | | | 29,150 | |
Zero Coupon (LIBOR 3 Month + 0.14%), 5/25/10(b)(c)(m)(n) | | | | | | | 435 | | | | 28,819 | |
LPL Holdings, Inc.
5.75%, 9/15/25(a) | | | | | | | 59 | | | | 61,372 | |
| | | | | | | | | | | | |
| | | | | | | | | | | 119,341 | |
| | | | | | | | | | | | |
Finance – 0.7% | | | | | | | | | | | | |
Enova International, Inc.
9.75%, 6/01/21 | | | | | | | 121 | | | | 129,002 | |
goeasy Ltd.
7.875%, 11/01/22(a) | | | | | | | 28 | | | | 28,638 | |
Lincoln Finance Ltd.
7.375%, 4/15/21(a) | | | | | | | 200 | | | | 211,239 | |
Navient Corp.
5.875%, 3/25/21 | | | | | | | 660 | | | | 693,632 | |
6.50%, 6/15/22 | | | | | | | 60 | | | | 63,764 | |
6.625%, 7/26/21 | | | | | | | 752 | | | | 805,550 | |
OneMain Financial Holdings LLC
6.75%, 12/15/19(a) | | | | | | | 60 | | | | 62,136 | |
SLM Corp.
5.125%, 4/05/22 | | | | | | | 31 | | | | 32,126 | |
| | | | | | | | | | | | |
| | | | | | | | | | | 2,026,087 | |
| | | | | | | | | | | | |
Insurance – 0.1% | | | | | | | | | | | | |
Genworth Holdings, Inc.
7.20%, 2/15/21 | | | | | | | 66 | | | | 63,098 | |
Liberty Mutual Group, Inc.
7.80%, 3/15/37(a) | | | | | | | 156 | | | | 197,876 | |
WellCare Health Plans, Inc.
5.25%, 4/01/25 | | | | | | | 61 | | | | 64,380 | |
| | | | | | | | | | | | |
| | | | | | | | | | | 325,354 | |
| | | | | | | | | | | | |
Other Finance – 0.1% | | | | | | | | | | | | |
Intrum Justitia AB
2.75%, 7/15/22(a) | | | EUR | | | | 100 | | | | 119,416 | |
LHC3 PLC
4.125%, 8/15/24(a)(g) | | | | | | | 100 | | | | 120,410 | |
VFH Parent LLC/Orchestra Co-Issuer, Inc.
6.75%, 6/15/22(a) | | | U.S.$ | | | | 8 | | | | 8,315 | |
| | | | | | | | | | | | |
| | | | | | | | | | | 248,141 | |
| | | | | | | | | | | | |
| | |
| abfunds.com | | AB UNCONSTRAINED BOND FUND | 29 |
PORTFOLIO OF INVESTMENTS (continued)
| | | | | | | | | | | | |
| | | | | | Principal
Amount
(000) | | | U.S. $ Value | |
| |
| | | | | | | | | | | | |
REITS – 0.1% | | | | | | | | | | | | |
MPT Operating Partnership LP/MPT Finance Corp.
5.00%, 10/15/27 | | | U.S.$ | | | | 14 | | | $ | 14,357 | |
5.25%, 8/01/26 | | | | | | | 86 | | | | 89,552 | |
5.50%, 5/01/24 | | | | | | | 63 | | | | 66,574 | |
SBA Communications Corp.
4.00%, 10/01/22(a) | | | | | | | 41 | | | | 41,558 | |
| | | | | | | | | | | | |
| | | | | | | | | | | 212,041 | |
| | | | | | | | | | | | |
| | | | | | | | | | | 10,324,937 | |
| | | | | | | | | | | | |
Utility – 0.4% | | | | | | | | | | | | |
Electric – 0.4% | | | | | | | | | | | | |
Calpine Corp.
5.375%, 1/15/23 | | | | | | | 86 | | | | 83,601 | |
5.75%, 1/15/25 | | | | | | | 280 | | | | 265,629 | |
ContourGlobal Power Holdings SA
5.125%, 6/15/21(a) | | | EUR | | | | 164 | | | | 200,301 | |
Dynegy, Inc.
7.375%, 11/01/22 | | | U.S.$ | | | | 236 | | | | 253,371 | |
7.625%, 11/01/24 | | | | | | | 64 | | | | 69,920 | |
Talen Energy Supply LLC
4.625%, 7/15/19(a) | | | | | | | 49 | | | | 49,505 | |
6.50%, 5/01/18 | | | | | | | 180 | | | | 182,701 | |
| | | | | | | | | | | | |
| | | | | | | | | | | 1,105,028 | |
| | | | | | | | | | | | |
Total Corporates – Non-Investment Grade
(cost $56,763,434) | | | | | | | | | | | 57,871,384 | |
| | | | | | | | | | | | |
| | | | | | | | | | | | |
COLLATERALIZED MORTGAGE OBLIGATIONS – 12.6% | | | | | | | | | | | | |
Risk Share Floating Rate – 6.6% | | | | | | | | | | | | |
Bellemeade Re II Ltd.
Series 2016-1A, Class M2B
7.738% (LIBOR 1 Month + 6.50%), 4/25/26(h)(m) | | | | | | | 2,391 | | | | 2,452,076 | |
Federal Home Loan Mortgage Corp. Structured Agency Credit Risk Debt Notes
Series 2014-DN3, Class M3
5.238% (LIBOR 1 Month + 4.00%), 8/25/24(m) | | | | | | | 3,582 | | | | 3,870,748 | |
Series 2015-DNA1, Class B
10.438% (LIBOR 1 Month + 9.20%), 10/25/27(m) | | | | | | | 498 | | | | 657,896 | |
Series 2015-HQ1, Class B
11.988% (LIBOR 1 Month + 10.75%), 3/25/25(m) | | | | | | | 1,161 | | | | 1,579,559 | |
| | |
| 30 | AB UNCONSTRAINED BOND FUND | | abfunds.com |
PORTFOLIO OF INVESTMENTS (continued)
| | | | | | | | | | | | |
| | | | | | Principal
Amount
(000) | | | U.S. $ Value | |
| |
| | | | | | | | | | | | |
Federal National Mortgage Association Connecticut Avenue Securities
Series 2014-C04, Class 2M2
6.238% (LIBOR 1 Month + 5.00%), 11/25/24(m) | | | U.S.$ | | | | 1,191 | | | $ | 1,337,625 | |
Series 2015-C01, Class 1M2
5.538% (LIBOR 1 Month + 4.30%), 2/25/25(m) | | | | | | | 672 | | | | 722,877 | |
Series 2015-C02, Class 1M2
5.238% (LIBOR 1 Month + 4.00%), 5/25/25(m) | | | | | | | 802 | | | | 859,816 | |
Series 2015-C03, Class 1M2
6.238% (LIBOR 1 Month + 5.00%), 7/25/25(m) | | | | | | | 615 | | | | 679,712 | |
Series 2015-C03, Class 2M2
6.238% (LIBOR 1 Month + 5.00%), 7/25/25(m) | | | | | | | 3,929 | | | | 4,295,136 | |
Series 2015-C04, Class 1M2
6.938% (LIBOR 1 Month + 5.70%), 4/25/28(m) | | | | | | | 1,003 | | | | 1,130,261 | |
Series 2015-C04, Class 2M2
6.788% (LIBOR 1 Month + 5.55%), 4/25/28(m) | | | | | | | 1,521 | | | | 1,686,267 | |
Series 2016-C02, Class 1M2
7.238% (LIBOR 1 Month + 6.00%), 9/25/28(m) | | | | | | | 749 | | | | 865,562 | |
| | | | | | | | | | | | |
| | | | | | | | | | | 20,137,535 | |
| | | | | | | | | | | | |
Non-Agency Fixed Rate – 4.1% | | | | | | | | | | | | |
Alternative Loan Trust
Series 2005-11CB, Class 2A7
5.50%, 6/25/35 | | | | | | | 883 | | | | 863,849 | |
Series 2005-86CB, Class A8
5.50%, 2/25/36 | | | | | | | 511 | | | | 471,574 | |
Series 2005-J14, Class A7
5.50%, 12/25/35 | | | | | | | 293 | | | | 248,739 | |
Series 2006-16CB, Class A6
6.00%, 6/25/36 | | | | | | | 1,732 | | | | 1,417,813 | |
Series 2006-24CB, Class A1
6.00%, 6/25/36 | | | | | | | 820 | | | | 702,796 | |
Series 2006-24CB, Class A11
5.75%, 6/25/36 | | | | | | | 456 | | | | 384,808 | |
Series 2006-32CB, Class A5
6.00%, 11/25/36 | | | | | | | 1,198 | | | | 1,079,751 | |
Series 2006-J1, Class 1A11
5.50%, 2/25/36 | | | | | | | 527 | | | | 479,848 | |
| | |
| abfunds.com | | AB UNCONSTRAINED BOND FUND | 31 |
PORTFOLIO OF INVESTMENTS (continued)
| | | | | | | | | | | | |
| | | | | | Principal
Amount
(000) | | | U.S. $ Value | |
| |
| | | | | | | | | | | | |
BCAP LLC Trust
Series 2009-RR10, Class 10A2
6.00%, 1/26/38(a) | | | U.S.$ | | | | 2,571 | | | $ | 2,090,705 | |
CitiMortgage Alternative Loan Trust
Series 2006-A4, Class 1A3
6.00%, 9/25/36 | | | | | | | 239 | | | | 228,962 | |
Countrywide Home Loan Mortgage Pass-Through Trust
Series 2006-6, Class A1
6.00%, 4/25/36 | | | | | | | 492 | | | | 432,802 | |
Series 2006-9, Class A2
6.00%, 5/25/36 | | | | | | | 664 | | | | 562,857 | |
Series 2007-4, Class 1A39
6.00%, 5/25/37 | | | | | | | 372 | | | | 303,669 | |
GSR Mortgage Loan Trust
Series 2006-9F, Class 4A1
6.50%, 10/25/36 | | | | | | | 515 | | | | 462,101 | |
JP Morgan Mortgage Trust
Series 2007-S3, Class 1A45
6.00%, 8/25/37 | | | | | | | 1,430 | | | | 1,264,860 | |
Morgan Stanley Mortgage Loan Trust
Series 2007-6XS, Class 2A5S
6.00%, 2/25/47 | | | | | | | 824 | | | | 570,434 | |
Residential Accredit Loans, Inc. Trust
Series 2005-QA10, Class A31
4.28%, 9/25/35 | | | | | | | 314 | | | | 264,319 | |
Wells Fargo Mortgage Backed Securities Trust
Series 2005-17, Class 2A1
5.50%, 1/25/36 | | | | | | | 401 | | | | 399,597 | |
Series 2007-8, Class 2A6
6.00%, 7/25/37 | | | | | | | 226 | | | | 226,601 | |
Series 2007-10, Class 1A7
6.00%, 7/25/37 | | | | | | | 312 | | | | 310,521 | |
| | | | | | | | | | | | |
| | | | 12,766,606 | |
| | | | | | | | | | | | |
Agency Fixed Rate – 1.3% | | | | | | | | | | | | |
Federal National Mortgage Association REMICs
Series 2016-26, Class IO
5.00%, 5/25/46(o) | | | | | | | 2,914 | | | | 596,195 | |
Series 2016-33, Class NI
5.00%, 7/25/34(o) | | | | | | | 5,774 | | | | 1,216,167 | |
Government National Mortgage Association
Series 2016-47, Class IK
4.00%, 4/20/46(o) | | | | | | | 4,539 | | | | 837,571 | |
Series 2016-111, Class PI
3.50%, 6/20/45(o) | | | | | | | 8,090 | | | | 1,244,143 | |
| | | | | | | | | | | | |
| | | | 3,894,076 | |
| | | | | | | | | | | | |
| | |
| 32 | AB UNCONSTRAINED BOND FUND | | abfunds.com |
PORTFOLIO OF INVESTMENTS (continued)
| | | | | | | | | | | | |
| | | | | | Principal
Amount
(000) | | | U.S. $ Value | |
| |
| | | | | | | | | | | | |
Non-Agency Floating Rate – 0.6% | | | | | | | | | | | | |
Alternative Loan Trust
Series 2006-19CB, Class A3
6.00% (LIBOR 1 Month + 1.00%), 8/25/36(m) | | | U.S.$ | | | | 1,379 | | | $ | 1,234,008 | |
Deutsche Alt-A Securities Mortgage Loan Trust
Series 2006-AR4, Class A2
1.428% (LIBOR 1 Month + 0.19%), 12/25/36(m) | | | | | | | 557 | | | | 350,025 | |
GreenPoint Mortgage Funding Trust
Series 2006-AR2, Class 4A1
2.944% (12MTA + 2.00%), 3/25/36(m) | | | | | | | 223 | | | | 206,336 | |
| | | | | | | | | | | | |
| | | | | | | | | | | 1,790,369 | |
| | | | | | | | | | | | |
Total Collateralized Mortgage Obligations
(cost $37,590,923) | | | | | | | | | | | 38,588,586 | |
| | | | | | | | | | | | |
| | | | | | | | | | | | |
GOVERNMENTS – TREASURIES – 7.5% | | | | | | | | | | | | |
Malaysia – 0.5% | | | | | | | | | | | | |
Malaysia Government Bond
Series 511
3.58%, 9/28/18 | | | MYR | | | | 6,710 | | | | 1,591,818 | |
| | | | | | | | | | | | |
| | | |
South Africa – 0.2% | | | | | | | | | | | | |
Republic of South Africa Government Bond
Series R213
7.00%, 2/28/31 | | | ZAR | | | | 10,492 | | | | 593,530 | |
| | | | | | | | | | | | |
| | | |
United States – 6.7% | | | | | | | | | | | | |
U.S. Treasury Bonds
2.50%, 5/15/46 | | | U.S.$ | | | | 405 | | | | 375,258 | |
3.75%, 11/15/43 | | | | | | | 2,372 | | | | 2,771,767 | |
U.S. Treasury Notes
1.50%, 12/31/18(p) | | | | | | | 5,743 | | | | 5,743,200 | |
1.625%, 5/15/26(p) | | | | | | | 12,185 | | | | 11,518,633 | |
| | | | | | | | | | | | |
| | | | | | | | | | | 20,408,858 | |
| | | | | | | | | | | | |
Uruguay – 0.1% | | | | | | | | | | | | |
Uruguay Government International Bond
8.50%, 3/15/28(a) | | | UYU | | | | 8,615 | | | | 295,387 | |
| | | | | | | | | | | | |
| | | |
Total Governments – Treasuries
(cost $23,303,694) | | | | | | | | | | | 22,889,593 | |
| | | | | | | | | | | | |
| | | | | | | | | | | | |
INFLATION-LINKED SECURITIES – 6.2% | | | | | | | | | | | | |
Brazil – 0.4% | | | | | | | | | | | | |
Brazil Notas do Tesouro Nacional
Series B
6.00%, 8/15/50 | | | BRL | | | | 1,150 | | | | 1,175,233 | |
| | | | | | | | | | | | |
| | |
| abfunds.com | | AB UNCONSTRAINED BOND FUND | 33 |
PORTFOLIO OF INVESTMENTS (continued)
| | | | | | | | | | | | |
| | | | | | Principal
Amount
(000) | | | U.S. $ Value | |
| |
| | | | | | | | | | | | |
United States – 5.8% | | | | | | | | | | | | |
U.S. Treasury Inflation Index
0.375%, 1/15/27 (TIPS) | | | U.S.$ | | | | 17,985 | | | $ | 17,748,398 | |
| | | | | | | | | | | | |
| | | |
Total Inflation-Linked Securities
(cost $18,799,166) | | | | | | | | | | | 18,923,631 | |
| | | | | | | | | | | | |
| | | | | | | | | | | | |
CORPORATES – INVESTMENT GRADE – 4.6% | | | | | | | | | | | | |
Industrial – 2.5% | | | | | | | | | | | | |
Basic – 0.4% | | | | | | | | | | | | |
Anglo American Capital PLC
3.75%, 4/10/22(a) | | | | | | | 220 | | | | 226,536 | |
Equate Petrochemical BV
3.00%, 3/03/22(a) | | | | | | | 653 | | | | 646,797 | |
LYB International Finance II BV
1.875%, 3/02/22 | | | EUR | | | | 100 | | | | 123,146 | |
Monsanto Co.
3.375%, 7/15/24 | | | U.S.$ | | | | 96 | | | | 98,081 | |
Southern Copper Corp.
3.875%, 4/23/25 | | | | | | | 94 | | | | 97,760 | |
| | | | | | | | | | | | |
| | | | | | | | | | | 1,192,320 | |
| | | | | | | | | | | | |
Capital Goods – 0.2% | | | | | | | | | | | | |
CNH Industrial Capital LLC
4.375%, 4/05/22 | | | | | | | 91 | | | | 96,603 | |
4.875%, 4/01/21 | | | | | | | 211 | | | | 225,019 | |
Embraer Netherlands Finance BV
5.40%, 2/01/27 | | | | | | | 99 | | | | 106,079 | |
Republic Services, Inc.
5.25%, 11/15/21 | | | | | | | 200 | | | | 220,534 | |
Rolls-Royce PLC
2.125%, 6/18/21(a) | | | EUR | | | | 129 | | | | 161,264 | |
| | | | | | | | | | | | |
| | | | | | | | | | | 809,499 | |
| | | | | | | | | | | | |
Communications - Media – 0.1% | | | | | | | | | | | | |
21st Century Fox America, Inc.
4.00%, 10/01/23 | | | U.S.$ | | | | 77 | | | | 81,471 | |
CBS Corp.
3.70%, 8/15/24 | | | | | | | 93 | | | | 96,217 | |
Charter Communications Operating LLC/Charter Communications Operating Capital
4.908%, 7/23/25 | | | | | | | 91 | | | | 96,773 | |
Time Warner, Inc.
4.05%, 12/15/23 | | | | | | | 58 | | | | 61,156 | |
Viacom, Inc.
4.375%, 3/15/43 | | | | | | | 150 | | | | 127,661 | |
| | | | | | | | | | | | |
| | | | | | | | | | | 463,278 | |
| | | | | | | | | | | | |
| | |
| 34 | AB UNCONSTRAINED BOND FUND | | abfunds.com |
PORTFOLIO OF INVESTMENTS (continued)
| | | | | | | | | | | | |
| | | | | | Principal
Amount
(000) | | | U.S. $ Value | |
| |
| | | | | | | | | | | | |
Communications - Telecommunications – 0.1% | | | | | | | | | | | | |
AT&T, Inc.
3.90%, 8/14/27 | | | U.S.$ | | | | 61 | | | $ | 60,742 | |
5.45%, 3/01/47 | | | | | | | 93 | | | | 97,021 | |
| | | | | | | | | | | | |
| | | | | | | | | | | 157,763 | |
| | | | | | | | | | | | |
Consumer Cyclical - Automotive – 0.1% | | | | | | | | | | | | |
FCE Bank PLC
1.615%, 5/11/23(a) | | | EUR | | | | 118 | | | | 144,191 | |
General Motors Financial Co., Inc.
0.955%, 9/07/23(a) | | | | | | | 141 | | | | 165,094 | |
Volkswagen International Finance NV
Series 4Y
0.50%, 3/30/21(a) | | | | | | | 100 | | | | 117,888 | |
| | | | | | | | | | | | |
| | | | | | | | | | | 427,173 | |
| | | | | | | | | | | | |
Consumer Cyclical - Entertainment – 0.1% | | | | | | | | | | | | |
Carnival Corp.
1.875%, 11/07/22 | | | | | | | 128 | | | | 160,312 | |
Royal Caribbean Cruises Ltd.
7.25%, 3/15/18 | | | U.S.$ | | | | 91 | | | | 92,720 | |
| | | | | | | | | | | | |
| | | | | | | | | | | 253,032 | |
| | | | | | | | | | | | |
Consumer Cyclical - Retailers – 0.1% | | | | | | | | | | | | |
AutoNation, Inc.
4.50%, 10/01/25 | | | | | | | 130 | | | | 137,597 | |
AutoZone, Inc.
3.25%, 4/15/25 | | | | | | | 165 | | | | 165,708 | |
| | | | | | | | | | | | |
| | | | | | | | | | | 303,305 | |
| | | | | | | | | | | | |
Consumer Non-Cyclical – 0.3% | | | | | | | | | | | | |
Altria Group, Inc.
9.25%, 8/06/19 | | | | | | | 34 | | | | 38,233 | |
Coca-Cola European Partners PLC
0.75%, 2/24/22(a) | | | EUR | | | | 136 | | | | 161,968 | |
Fresenius Medical Care US Finance II, Inc.
4.125%, 10/15/20(a) | | | U.S.$ | | | | 93 | | | | 96,928 | |
General Mills, Inc.
2.10%, 11/16/20 | | | EUR | | | | 155 | | | | 191,240 | |
McKesson Corp.
0.625%, 8/17/21 | | | | | | | 138 | | | | 163,096 | |
Teva Pharmaceutical Finance Netherlands III BV
3.15%, 10/01/26 | | | U.S.$ | | | | 171 | | | | 151,323 | |
Zimmer Biomet Holdings, Inc.
3.55%, 4/01/25 | | | | | | | 126 | | | | 128,174 | |
| | | | | | | | | | | | |
| | | | | | | | | | | 930,962 | |
| | | | | | | | | | | | |
| | |
| abfunds.com | | AB UNCONSTRAINED BOND FUND | 35 |
PORTFOLIO OF INVESTMENTS (continued)
| | | | | | | | | | | | |
| | | | | | Principal
Amount
(000) | | | U.S. $ Value | |
| |
| | | | | | | | | | | | |
Energy – 0.3% | | | | | | | | | | | | |
Andeavor Logistics LP/Tesoro Logistics Finance Corp.
6.25%, 10/15/22 | | | U.S.$ | | | | 26 | | | $ | 27,673 | |
Cenovus Energy, Inc.
4.25%, 4/15/27(a) | | | | | | | 135 | | | | 135,170 | |
EQT Corp.
8.125%, 6/01/19 | | | | | | | 35 | | | | 38,216 | |
Husky Energy, Inc.
7.25%, 12/15/19 | | | | | | | 84 | | | | 92,422 | |
Kinder Morgan, Inc./DE
Series G
7.75%, 1/15/32 | | | | | | | 76 | | | | 97,707 | |
Marathon Oil Corp.
6.80%, 3/15/32 | | | | | | | 77 | | | | 91,048 | |
Marathon Petroleum Corp.
4.75%, 9/15/44 | | | | | | | 98 | | | | 99,139 | |
Plains All American Pipeline LP/PAA Finance Corp.
8.75%, 5/01/19 | | | | | | | 345 | | | | 375,692 | |
Tesoro Logistics LP/Tesoro Logistics Finance Corp.
5.875%, 10/01/20 | | | | | | | 155 | | | | 157,712 | |
| | | | | | | | | | | | |
| | | | | | | | | | | 1,114,779 | |
| | | | | | | | | | | | |
Services – 0.1% | | | | | | | | | | | | |
eBay, Inc.
3.60%, 6/05/27 | | | | | | | 163 | | | | 163,006 | |
Expedia, Inc.
3.80%, 2/15/28(a) | | | | | | | 70 | | | | 68,118 | |
| | | | | | | | | | | | |
| | | | | | | | | | | 231,124 | |
| | | | | | | | | | | | |
Technology – 0.5% | | | | | | | | | | | | |
Agilent Technologies, Inc.
5.00%, 7/15/20 | | | | | | | 28 | | | | 30,000 | |
Dell International LLC/EMC Corp.
6.02%, 6/15/26(a) | | | | | | | 203 | | | | 226,625 | |
8.35%, 7/15/46(a) | | | | | | | 47 | | | | 60,742 | |
Hewlett Packard Enterprise Co.
6.35%, 10/15/45(q) | | | | | | | 59 | | | | 62,835 | |
Micron Technology, Inc.
7.50%, 9/15/23 | | | | | | | 307 | | | | 340,014 | |
Motorola Solutions, Inc.
7.50%, 5/15/25 | | | | | | | 181 | | | | 219,889 | |
Seagate HDD Cayman
4.75%, 1/01/25 | | | | | | | 99 | | | | 98,239 | |
Western Digital Corp.
7.375%, 4/01/23(a) | | | | | | | 321 | | | | 351,001 | |
| | |
| 36 | AB UNCONSTRAINED BOND FUND | | abfunds.com |
PORTFOLIO OF INVESTMENTS (continued)
| | | | | | | | | | | | |
| | | | | | Principal
Amount
(000) | | | U.S. $ Value | |
| |
| | | | | | | | | | | | |
Xerox Corp.
3.625%, 3/15/23 | | | U.S.$ | | | | 130 | | | $ | 128,312 | |
| | | | | | | | | | | | |
| | | | | | | | | | | 1,517,657 | |
| | | | | | | | | | | | |
Transportation - Airlines – 0.1% | | | | | | | | | | | | |
Ryanair DAC
1.125%, 3/10/23(a) | | | EUR | | | | 138 | | | | 164,462 | |
| | | | | | | | | | | | |
| | | |
Transportation - Services – 0.1% | | | | | | | | | | | | |
FedEx Corp.
1.00%, 1/11/23 | | | | | | | 136 | | | | 162,090 | |
| | | | | | | | | | | | |
| | | | | | | | | | | 7,727,444 | |
| | | | | | | | | | | | |
Financial Institutions – 1.7% | | | | | | | | | | | | |
Banking – 1.0% | | | | | | | | | | | | |
American Express Credit Corp.
0.625%, 11/22/21 | | | | | | | 109 | | | | 129,333 | |
BPCE SA
5.70%, 10/22/23(a) | | | U.S.$ | | | | 200 | | | | 223,330 | |
Citigroup, Inc.
0.75%, 10/26/23(a) | | | EUR | | | | 139 | | | | 162,424 | |
Cooperatieve Rabobank UA
11.00%, 6/30/19(a)(l) | | | U.S.$ | | | | 75 | | | | 85,139 | |
Series G
0.50%, 12/06/22(a) | | | EUR | | | | 50 | | | | 59,031 | |
Credit Suisse Group Funding Guernsey Ltd.
1.25%, 4/14/22(a) | | | | | | | 100 | | | | 120,463 | |
Goldman Sachs Group, Inc. (The)
2.00%, 7/27/23(a) | | | | | | | 131 | | | | 162,820 | |
2.35%, 11/15/21 | | | U.S.$ | | | | 693 | | | | 685,547 | |
HSBC Holdings PLC
6.00%, 9/29/23(a)(l) | | | EUR | | | | 200 | | | | 275,464 | |
Lloyds Banking Group PLC
1.00%, 11/09/23(a) | | | | | | | 110 | | | | 130,129 | |
Macquarie Group Ltd.
7.625%, 8/13/19(a) | | | U.S.$ | | | | 115 | | | | 125,430 | |
Morgan Stanley
5.00%, 11/24/25 | | | | | | | 88 | | | | 96,309 | |
Series G
5.50%, 7/24/20 | | | | | | | 175 | | | | 189,740 | |
Santander Holdings USA, Inc.
4.40%, 7/13/27(a) | | | | | | | 64 | | | | 65,925 | |
SMFG Preferred Capital USD 3 Ltd.
9.50%, 7/25/18(a)(l) | | | | | | | 100 | | | | 105,210 | |
Sumitomo Mitsui Banking Corp.
1.966%, 1/11/19 | | | | | | | 358 | | | | 358,115 | |
| | | | | | | | | | | | |
| | | | 2,974,409 | |
| | | | | | | | | | | | |
| | |
| abfunds.com | | AB UNCONSTRAINED BOND FUND | 37 |
PORTFOLIO OF INVESTMENTS (continued)
| | | | | | | | | | | | |
| | | | | | Principal
Amount
(000) | | | U.S. $ Value | |
| |
| | | | | | | | | | | | |
Finance – 0.1% | | | | | | | | | | | | |
International Lease Finance Corp.
5.875%, 4/01/19 | | | U.S.$ | | | | 117 | | | $ | 123,012 | |
Santander Consumer Finance SA
0.90%, 2/18/20(a) | | | EUR | | | | 100 | | | | 118,800 | |
| | | | | | | | | | | | |
| | | | 241,812 | |
| | | | | | | | | | | | |
Insurance – 0.4% | | | | | | | | | | | | |
Aetna, Inc.
6.75%, 12/15/37 | | | U.S.$ | | | | 257 | | | | 341,752 | |
Allied World Assurance Co. Holdings Ltd.
5.50%, 11/15/20 | | | | | | | 180 | | | | 193,441 | |
Anthem, Inc.
7.00%, 2/15/19 | | | | | | | 45 | | | | 47,800 | |
Berkshire Hathaway, Inc.
0.625%, 1/17/23 | | | EUR | | | | 138 | | | | 163,232 | |
Chubb Corp. (The)
3.609% (LIBOR 3 Month + 2.25%), 4/15/37(m) | | | U.S.$ | | | | 98 | | | | 97,554 | |
Cigna Corp.
5.125%, 6/15/20 | | | | | | | 90 | | | | 96,387 | |
Humana, Inc.
6.30%, 8/01/18 | | | | | | | 25 | | | | 25,828 | |
Lincoln National Corp.
8.75%, 7/01/19 | | | | | | | 15 | | | | 16,591 | |
Nationwide Mutual Insurance Co.
9.375%, 8/15/39(a) | | | | | | | 165 | | | | 275,761 | |
Prudential Financial, Inc.
5.625%, 6/15/43 | | | | | | | 57 | | | | 61,899 | |
| | | | | | | | | | | | |
| | | | | | | | | | | 1,320,245 | |
| | | | | | | | | | | | |
REITS – 0.2% | | | | | | | | | | | | |
American Tower Corp.
5.05%, 9/01/20 | | | | | | | 140 | | | | 150,399 | |
DDR Corp.
3.90%, 8/15/24 | | | | | | | 65 | | | | 65,450 | |
Sabra Health Care LP/Sabra Capital Corp.
5.50%, 2/01/21 | | | | | | | 90 | | | | 92,915 | |
VEREIT Operating Partnership LP
4.875%, 6/01/26 | | | | | | | 88 | | | | 94,048 | |
Welltower, Inc.
4.95%, 1/15/21 | | | | | | | 86 | | | | 92,148 | |
Weyerhaeuser Co.
7.375%, 3/15/32 | | | | | | | 204 | | | | 283,336 | |
| | | | | | | | | | | | |
| | | | | | | | | | | 778,296 | |
| | | | | | | | | | | | |
| | | | | | | | | | | 5,314,762 | |
| | | | | | | | | | | | |
| | |
| 38 | AB UNCONSTRAINED BOND FUND | | abfunds.com |
PORTFOLIO OF INVESTMENTS (continued)
| | | | | | | | | | | | |
| | | | | | Principal
Amount
(000) | | | U.S. $ Value | |
| |
| | | | | | | | | | | | |
Utility – 0.4% | | | | | | | | | | | | |
Electric – 0.1% | | | | | | | | | | | | |
Exelon Corp.
5.15%, 12/01/20 | | | U.S.$ | | | | 180 | | | $ | 193,564 | |
TECO Finance, Inc.
5.15%, 3/15/20 | | | | | | | 55 | | | | 58,381 | |
| | | | | | | | | | | | |
| | | | | | | | | | | 251,945 | |
| | | | | | | | | | | | |
Natural Gas – 0.3% | | | | | | | | | | | | |
GNL Quintero SA
4.634%, 7/31/29(a) | | | | | | | 836 | | | | 870,510 | |
| | | | | | | | | | | | |
| | | | | | | | | | | 1,122,455 | |
| | | | | | | | | | | | |
Total Corporates – Investment Grade
(cost $13,473,459) | | | | | | | | | | | 14,164,661 | |
| | | | | | | | | | | | |
| | | | | | | | | | | | |
AGENCIES – 2.4% | | | | | | | | | | | | |
Agency Debentures – 2.4% | | | | | | | | | | | | |
Federal National Mortgage Association
1.875%, 9/24/26
(cost $7,551,754) | | | | | | | 7,595 | | | | 7,202,513 | |
| | | | | | | | | | | | |
| | | | | | | | | | | | |
EMERGING MARKETS – TREASURIES – 1.4% | | | | | | | | | | | | |
Argentina – 0.4% | | | | | | | | | | | | |
Argentine Bonos del Tesoro
15.50%, 10/17/26 | | | ARS | | | | 10,059 | | | | 593,278 | |
16.00%, 10/17/23 | | | | | | | 10,316 | | | | 587,617 | |
| | | | | | | | | | | | |
| | | | | | | | | | | 1,180,895 | |
| | | | | | | | | | | | |
Brazil – 0.3% | | | | | | | | | | | | |
Brazil Notas do Tesouro Nacional
Series F
10.00%, 1/01/21 | | | BRL | | | | 3,105 | | | | 973,857 | |
| | | | | | | | | | | | |
| | | |
Dominican Republic – 0.2% | | | | | | | | | | | | |
Dominican Republic International Bond
15.95%, 6/04/21(h) | | | DOP | | | | 27,000 | | | | 679,540 | |
| | | | | | | | | | | | |
| | | |
Turkey – 0.5% | | | | | | | | | | | | |
Turkey Government Bond
11.00%, 2/24/27 | | | TRY | | | | 5,670 | | | | 1,450,176 | |
| | | | | | | | | | | | |
| | | |
Total Emerging Markets – Treasuries
(cost $4,767,868) | | | | | | | | | | | 4,284,468 | |
| | | | | | | | | | | | |
| | | | | | | | | | | | |
| | |
| abfunds.com | | AB UNCONSTRAINED BOND FUND | 39 |
PORTFOLIO OF INVESTMENTS (continued)
| | | | | | | | | | | | |
| | | | | | Principal
Amount
(000) | | | U.S. $ Value | |
| |
| | | | | | | | | | | | |
EMERGING MARKETS – CORPORATE BONDS – 1.0% | | | | | | | | | | | | |
Industrial – 1.0% | | | | | | | | | | | | |
Basic – 0.1% | | | | | | | | | | | | |
First Quantum Minerals Ltd.
7.25%, 4/01/23(a) | | | U.S.$ | | | | 200 | | | $ | 211,996 | |
| | | | | | | | | | | | |
| | | |
Communications - Telecommunications – 0.1% | | | | | | | | | | | | |
Digicel Group Ltd.
8.25%, 9/30/20(a) | | | | | | | 335 | | | | 331,650 | |
| | | | | | | | | | | | |
| | | |
Consumer Non-Cyclical – 0.0% | | | | | | | | | | | | |
Virgolino de Oliveira Finance SA
10.50%, 1/28/18(c)(h)(k) | | | | | | | 804 | | | | 41,204 | |
| | | | | | | | | | | | |
| | | |
Energy – 0.8% | | | | | | | | | | | | |
Petrobras Global Finance BV
5.999%, 1/27/28(a) | | | | | | | 1,126 | | | | 1,139,941 | |
7.375%, 1/17/27 | | | | | | | 1,130 | | | | 1,256,124 | |
| | | | | | | | | | | | |
| | | | | | | | | | | 2,396,065 | |
| | | | | | | | | | | | |
Other Industrial – 0.0% | | | | | | | | | | | | |
Noble Group Ltd.
6.75%, 1/29/20(a) | | | | | | | 100 | | | | 41,750 | |
| | | | | | | | | | | | |
| | | |
Total Emerging Markets – Corporate Bonds
(cost $3,208,982) | | | | | | | | | | | 3,022,665 | |
| | | | | | | | | | | | |
| | | | | | | | | | | | |
QUASI-SOVEREIGNS – 0.9% | | | | | | | | | | | | |
Quasi-Sovereign Bonds – 0.9% | | | | | | | | | | | | |
Mexico – 0.9% | | | | | | | | | | | | |
Petroleos Mexicanos
5.375%, 3/13/22(a) | | | | | | | 212 | | | | 224,911 | |
Series 14-2
7.47%, 11/12/26 | | | MXN | | | | 55,570 | | | | 2,570,333 | |
| | | | | | | | | | | | |
| | | |
Total Quasi-Sovereigns
(cost $3,980,710) | | | | | | | | | | | 2,795,244 | |
| | | | | | | | | | | | |
| | | | | | | | | | | | |
GOVERNMENTS – SOVEREIGN BONDS – 0.6% | | | | | | | | | | | | |
Hungary – 0.2% | | | | | | | | | | | | |
Hungary Government International Bond
6.375%, 3/29/21 | | | U.S.$ | | | | 510 | | | | 569,925 | |
| | | | | | | | | | | | |
| | | |
Mexico – 0.4% | | | | | | | | | | | | |
Mexico Government International Bond
4.125%, 1/21/26 | | | | | | | 1,233 | | | | 1,284,786 | |
| | | | | | | | | | | | |
| | |
| 40 | AB UNCONSTRAINED BOND FUND | | abfunds.com |
PORTFOLIO OF INVESTMENTS (continued)
| | | | | | | | | | | | |
| | | | | | Principal
Amount
(000) | | | U.S. $ Value | |
| |
| | | | | | | | | | | | |
Qatar – 0.0% | | | | | | | | | | | | |
Qatar Government International Bond
5.25%, 1/20/20(a) | | | U.S.$ | | | | 100 | | | $ | 105,750 | |
| | | | | | | | | | | | |
| | | |
Total Governments – Sovereign Bonds
(cost $1,842,448) | | | | | | | | | | | 1,960,461 | |
| | | | | | | | | | | | |
| | | | | | | | | | | | |
EMERGING MARKETS – SOVEREIGNS – 0.6% | | | | | | | | | | | | |
Argentina – 0.3% | | | | | | | | | | | | |
Argentine Republic Government International Bond
6.875%, 1/26/27 | | | | | | | 945 | | | | 1,030,522 | |
| | | | | | | | | | | | |
| | | |
Ecuador – 0.1% | | | | | | | | | | | | |
Ecuador Government International Bond
9.65%, 12/13/26(a) | | | | | | | 275 | | | | 296,313 | |
| | | | | | | | | | | | |
| | | |
Gabon – 0.1% | | | | | | | | | | | | |
Gabon Government International Bond
6.95%, 6/16/25(a) | | | | | | | 360 | | | | 359,550 | |
| | | | | | | | | | | | |
| | | |
Ivory Coast – 0.1% | | | | | | | | | | | | |
Ivory Coast Government International Bond
5.125%, 6/15/25(a) | | | EUR | | | | 144 | | | | 177,174 | |
| | | | | | | | | | | | |
| | | |
Total Emerging Markets – Sovereigns
(cost $1,696,230) | | | | | | | | | | | 1,863,559 | |
| | | | | | | | | | | | |
| | | | | | | | | | | | |
BANK LOANS – 0.4% | | | | | | | | | | | | |
Industrial – 0.4% | | | | | | | | | | | | |
Energy – 0.3% | | | | | | | | | | | | |
California Resources Corporation
11.612% (LIBOR 1 Month + 10.38%), 12/31/21(r) | | | U.S.$ | | | | 962 | | | | 1,030,355 | |
| | | | | | | | | | | | |
| | | |
Technology – 0.1% | | | | | | | | | | | | |
Avaya Inc.
6.621% (LIBOR 3 Month + 5.25%), 5/29/20(c)(k)(r) | | | | | | | 372 | | | | 308,697 | |
| | | | | | | | | | | | |
| | | |
Total Bank Loans
(cost $1,274,198) | | | | | | | | | | | 1,339,052 | |
| | | | | | | | | | | | |
| | | | | | | | | | | | |
WHOLE LOAN TRUSTS – 0.3% | | | | | | | | | | | | |
Performing Asset – 0.3% | | | | | | | | | | | | |
Deutsche Bank Mexico SA
8.00%, 10/31/34(b)(d)(f)(q) | | | MXN | | | | 18,436 | | | | 591,696 | |
| | |
| abfunds.com | | AB UNCONSTRAINED BOND FUND | 41 |
PORTFOLIO OF INVESTMENTS (continued)
| | | | | | | | | | | | |
| | | | | | Principal
Amount
(000) | | | U.S. $ Value | |
| |
| | | | | | | | | | | | |
Recife Funding
Zero Coupon, 11/05/29(b)(d)(f) | | | U.S.$ | | | | 530 | | | $ | 446,822 | |
| | | | | | | | | | | | |
| | | |
Total Whole Loan Trusts
(cost $1,600,330) | | | | | | | | | | | 1,038,518 | |
| | | | | | | | | | | | |
| | | | | | | | | | | | |
COMMERCIAL MORTGAGE-BACKED SECURITIES – 0.3% | | | | | | | | | | | | |
Non-Agency Fixed Rate CMBS – 0.2% | | | | | | | | | | | | |
Banc of America Commercial Mortgage Trust
Series 2007-5, Class AM
5.772%, 2/10/51(b) | | | | | | | 247 | | | | 247,035 | |
DBUBS Mortgage Trust
Series 2011-LC2A, Class E
5.542%, 7/10/44(a)(b) | | | | | | | 600 | | | | 556,117 | |
| | | | | | | | | | | | |
| | | | | | | | | | | 803,152 | |
| | | | | | | | | | | | |
Non-Agency Floating Rate CMBS – 0.1% | | | | | | | | | | | | |
CLNS Trust
Series 2017-IKPR, Class F
5.737% (LIBOR 1 Month + 4.50%), 6/11/32(a)(b)(m) | | | | | | | 203 | | | | 204,012 | |
| | | | | | | | | | | | |
| | | |
Total Commercial Mortgage-Backed Securities
(cost $1,019,483) | | | | | | | | | | | 1,007,164 | |
| | | | | | | | | | | | |
| | | |
| | | | | | Shares | | | | |
COMMON STOCKS – 0.3% | | | | | | | | | | | | |
Energy – 0.2% | | | | | | | | | | | | |
Oil, Gas & Consumable Fuels – 0.2% | | | | | | | | | | | | |
Carrizo Oil & Gas, Inc.(c) | | | | | | | 2,782 | | | | 49,214 | |
Oasis Petroleum, Inc.(c) | | | | | | | 5,854 | | | | 55,320 | |
Paragon Offshore Ltd. (Trust A)(b)(c)(f) | | | | | | | 3,303 | | | | 3,577 | |
Paragon Offshore Ltd. (Trust B)(b)(c)(f) | | | | | | | 4,955 | | | | 94,145 | |
Paragon Offshore Ltd. (Equity)(b)(c)(f) | | | | | | | 3,302 | | | | 53,931 | |
Peabody Energy Corp.(c) | | | | | | | 6,789 | | | | 209,712 | |
SandRidge Energy, Inc.(c) | | | | | | | 3,719 | | | | 69,806 | |
Whiting Petroleum Corp.(c) | | | | | | | 6,000 | | | | 36,060 | |
| | | | | | | | | | | | |
| | | | | | | | | | | 571,765 | |
| | | | | | | | | | | | |
Consumer Discretionary – 0.1% | | | | | | | | | | | | |
Auto Components – 0.0% | | | | | | | | | | | | |
Exide Technologies(b)(c)(d)(e) | | | | | | | 2,970 | | | | 11,694 | |
| | | | | | | | | | | | |
| | | |
Diversified Consumer Services – 0.0% | | | | | | | | | | | | |
Laureate Education, Inc. – Class A(c) | | | | | | | 8,639 | | | | 115,503 | |
| | | | | | | | | | | | |
| | |
| 42 | AB UNCONSTRAINED BOND FUND | | abfunds.com |
PORTFOLIO OF INVESTMENTS (continued)
| | | | | | | | | | | | |
| Company | | | | | Shares | | | U.S. $ Value | |
| |
| | | | | | | | | | | | |
Media – 0.1% | | | | | | | | | | | | |
Gray Television, Inc.(c) | | | | | | | 3,341 | | | $ | 52,020 | |
Nexstar Media Group, Inc. – Class A | | | | | | | 1,019 | | | | 65,012 | |
| | | | | | | | | | | | |
| | | | | | | | | | | 117,032 | |
| | | | | | | | | | | | |
| | | | | | | | | | | 244,229 | |
| | | | | | | | | | | | |
Health Care – 0.0% | | | | | | | | | | | | |
Pharmaceuticals – 0.0% | | | | | | | | | | | | |
Endo International PLC(c) | | | | | | | 4,607 | | | | 29,393 | |
Horizon Pharma PLC(c) | | | | | | | 1,344 | | | | 18,224 | |
| | | | | | | | | | | | |
| | | | | | | | | | | 47,617 | |
| | | | | | | | | | | | |
Materials – 0.0% | | | | | | | | | | | | |
Paper & Forest Products – 0.0% | | | | | | | | | | | | |
Resolute Forest Products, Inc.(c) | | | | | | | 48 | | | | 286 | |
| | | | | | | | | | | | |
| | | |
Total Common Stocks
(cost $743,912) | | | | | | | | | | | 863,897 | |
| | | | | | | | | | | | |
| | | |
| | | | | | Principal
Amount
(000) | | | | |
ASSET-BACKED SECURITIES – 0.3% | | | | | | | | | | | | |
Other ABS - Fixed Rate – 0.2% | | | | | | | | | | | | |
SoFi Consumer Loan Program LLC
Series 2017-3, Class B
3.85%, 5/25/26(a)(b) | | | U.S.$ | | | | 440 | | | | 443,168 | |
| | | | | | | | | | | | |
| | | |
Autos - Fixed Rate – 0.1% | | | | | | | | | | | | |
Flagship Credit Auto Trust
Series 2016-2, Class D
8.56%, 11/15/23(a) | | | | | | | 350 | | | | 380,195 | |
| | | | | | | | | | | | |
| | | |
Total Asset-Backed Securities
(cost $805,127) | | | | | | | | | | | 823,363 | |
| | | | | | | | | | | | |
| | | | | | | | | | | | |
LOCAL GOVERNMENTS – REGIONAL BONDS – 0.1% | | | | | | | | | | | | |
Argentina – 0.1% | | | | | | | | | | | | |
Provincia de Buenos Aires/Argentina
9.125%, 3/16/24(a)
(cost $327,852) | | | | | | | 388 | | | | 452,020 | |
| | | | | | | | | | | | |
| | | |
| | | | | | Notional
Amount | | | | |
OPTIONS PURCHASED – PUTS – 0.1% | | | | | | | | | | | | |
Options on Indices – 0.1% | | | | | | | | | | | | |
S&P 500 Index 3M5Y
Expiration: Jan 2023; Contracts: 75,390,000; Exercise Price: USD 2,493.00;
Counterparty: Morgan Stanley Capital Services LLC(c) | | | USD | | | | 75,390,000 | | | | 28,045 | |
| | |
| abfunds.com | | AB UNCONSTRAINED BOND FUND | 43 |
PORTFOLIO OF INVESTMENTS (continued)
| | | | | | | | | | | | |
| Company | | | | | Notional
Amount | | | U.S. $ Value | |
| |
| | | | | | | | | | | | |
S&P 500 Index 3M5Y
Expiration: Jan 2023; Contracts: 70,000,000; Exercise Price: USD 2,497.00;
Counterparty: Morgan Stanley Capital Services LLC(c) | | | USD | | | | 70,000,000 | | | $ | 39,620 | |
| | | | | | | | | | | | |
| | | | | | | | | | | 67,665 | |
| | | | | | | | | | | | |
Options on Funds and Investment Trusts – 0.0% | | | | | | | | | | | | |
SPDR S&P 500 ETF Trust
Expiration: Jan 2018; Contracts: 908; Exercise Price: USD 226.00;
Counterparty: Morgan Stanley & Co. LLC(c) | | | | | | | 90,800 | | | | 56,750 | |
| | | | | | | | | | | | |
| | | |
Options on Forward Contracts – 0.0% | | | | | | | | | | | | |
MXN/USD
Expiration: Aug 2018; Contracts: 28,000,000; Exercise Price: MXN 17.50;
Counterparty: Credit Suisse International(c) | | | MXN | | | | 28,000,000 | | | | 7,765 | |
SEK/EUR
Expiration: Mar 2018; Contracts: 50,085,000; Exercise Price: SEK 9.45;
Counterparty: Citibank, NA(c) | | | SEK | | | | 50,085,000 | | | | 26,073 | |
TRY/USD
Expiration: Jan 2018; Contracts: 11,684,000; Exercise Price: TRY 3.68;
Counterparty: Citibank, NA(c) | | | TRY | | | | 11,684,000 | | | | 13,102 | |
TRY/EUR
Expiration: Jan 2018; Contracts: 5,614,953; Exercise Price: TRY 4.24;
Counterparty: Goldman Sachs Bank USA(c) | | | | | | | 5,614,953 | | | | 2,367 | |
ZAR/USD
Expiration: Dec 2017; Contracts: 10,576,000; Exercise Price: ZAR 13.22;
Counterparty: Bank of America, NA(c) | | | ZAR | | | | 10,576,000 | | | | 2,299 | |
ZAR/USD
Expiration: Dec 2017; Contracts: 10,400,000; Exercise Price: ZAR 13.00;
Counterparty: JPMorgan Chase Bank, NA(c) | | | | | | | 10,400,000 | | | | 1,521 | |
| | | | | | | | | | | | |
| | | | | | | | | | | 53,127 | |
| | | | | | | | | | | | |
Total Options Purchased – Puts
(premiums paid $1,653,057) | | | | | | | | | | | 177,542 | |
| | | | | | | | | | | | |
| | |
| 44 | AB UNCONSTRAINED BOND FUND | | abfunds.com |
PORTFOLIO OF INVESTMENTS (continued)
| | | | | | | | | | | | |
| | | | | | Principal
Amount
(000) | | | U.S. $ Value | |
| |
| | | | | | | | | | | | |
LOCAL GOVERNMENTS – US MUNICIPAL BONDS – 0.0% | | | | | | | | | | | | |
United States – 0.0% | | | | | | | | | | | | |
Alameda Corridor Transportation Authority
Series 1999C
6.60%, 10/01/29
(cost $111,258) | | | U.S.$ | | | | 100 | | | $ | 123,413 | |
| | | | | | | | | | | | |
| | | |
| | | | | | Shares | | | | |
PREFERRED STOCKS – 0.0% | | | | | | | | | | | | |
Utility – 0.0% | | | | | | | | | | | | |
Electric – 0.0% | | | | | | | | | | | | |
Dynegy, Inc.
7.00%, 7/01/19(i)
(cost $89,951) | | | | | | | 1,400 | | | | 114,800 | |
| | | | | | | | | | | | |
| | | | | | | | | | | | |
WARRANTS – 0.0% | | | | | | | | | | | | |
SandRidge Energy, Inc., A-CW22,
expiring 10/03/22(c) | | | | | | | 1,292 | | | | 1,163 | |
SandRidge Energy, Inc., B-CW22,
expiring 10/03/22(c) | | | | | | | 544 | | | | 435 | |
| | | | | | | | | | | | |
| | | |
Total Warrants
(cost $688) | | | | | | | | | | | 1,598 | |
| | | | | | | | | | | | |
| | | |
| | | | | | Principal
Amount
(000) | | | | |
SHORT-TERM INVESTMENTS – 38.2% | | | | | | | | | | | | |
U.S. Treasury Bills – 26.2% | | | | | | | | | | | | |
U.S. Treasury Bill
Zero Coupon, 1/11/18 | | | U.S.$ | | | | 39,500 | | | | 39,417,812 | |
Zero Coupon, 12/07/17-12/14/17(p) | | | | | | | 41,000 | | | | 40,958,785 | |
| | | | | | | | | | | | |
| | | |
Total U.S. Treasury Bills
(cost $80,374,985) | | | | | | | | | | | 80,376,597 | |
| | | | | | | | | | | | |
| | | | | | | | | | | | |
Governments – Treasuries – 5.9% | | | | | | | | | | | | |
Japan – 5.9% | | | | | | | | | | | | |
Japan Treasury Discount Bill
Series 713
Zero Coupon, 1/15/18
(cost $18,341,190) | | | JPY | | | | 2,060,000 | | | | 18,121,496 | |
| | | | | | | | | | | | |
| | | |
| | | | | | Shares | | | | |
Investment Companies – 3.3% | | | | | | | | | | | | |
AB Fixed Income Shares, Inc. – Government Money Market Portfolio – Class AB, 0.85%(s)(t)(u)
(cost $10,002,782) | | | | | | | 10,002,782 | | | | 10,002,782 | |
| | | | | | | | | | | | |
| | |
| abfunds.com | | AB UNCONSTRAINED BOND FUND | 45 |
PORTFOLIO OF INVESTMENTS (continued)
| | | | | | | | | | | | |
| | | | | | Principal
Amount
(000) | | | U.S. $ Value | |
| |
| | | | | | | | | | | | |
Time Deposits – 2.4% | | | | | | | | | | | | |
Bank of Montreal, London
0.15%, 11/01/17 | | | CAD | | | | 8,776 | | | $ | 6,802,362 | |
BBH, Grand Cayman
(0.568)%, 11/01/17 | | | EUR | | | | 220 | | | | 256,639 | |
(0.24)%, 11/01/17 | | | JPY | | | | 286 | | | | 2,513 | |
0.05%, 11/01/17 | | | GBP | | | | – 0 | –** | | | 2 | |
0.05%, 11/01/17 | | | NOK | | | | 96 | | | | 11,729 | |
0.491%, 11/01/17 | | | AUD | | | | – 0 | –** | | | 1 | |
0.95%, 11/01/17 | | | NZD | | | | 18 | | | | 11,994 | |
Standard Chartered Bank, London
0.60%, 11/01/17 | | | U.S.$ | | | | 147 | | | | 146,895 | |
| | | | | | | | | | | | |
| | | |
Total Time Deposits
(cost $7,243,165) | | | | | | | | | | | 7,232,135 | |
| | | | | | | | | | | | |
| | | |
Emerging Markets - Sovereigns – 0.4% | | | | | | | | | | | | |
Citigroup Global Markets Holdings, Inc./United States
Series E
Zero Coupon, 3/08/18(a) | | | EGP | | | | 7,627 | | | | 404,520 | |
HSBC Bank PLC
Zero Coupon, 2/01/18 | | | | | | | 7,875 | | | | 427,382 | |
Zero Coupon, 11/02/17(a)(b) | | | | | | | 7,775 | | | | 438,809 | |
| | | | | | | | | | | | |
| | | |
Total Emerging Markets – Sovereigns
(cost $1,264,429) | | | | | | | | | | | 1,270,711 | |
| | | | | | | | | | | | |
| | | |
Total Short-Term Investments
(cost $117,226,551) | | | | | | | | | | | 117,003,721 | |
| | | | | | | | | | | | |
| | | |
Total Investments – 96.7%
(cost $297,831,075) | | | | | | | | | | | 296,511,853 | |
Other assets less liabilities – 3.3% | | | | | | | | | | | 10,225,845 | |
| | | | | | | | | | | | |
| | | |
Net Assets – 100.0% | | | | | | | | | | $ | 306,737,698 | |
| | | | | | | | | | | | |
FUTURES (see Note D)
| | | | | | | | | | | | | | | | | | | | | | | | |
| Description | | Number of
Contracts | | | Expiration
Month | | | Notional
(000) | | | Original
Value | | | Value at
October 31,
2017 | | | Unrealized
Appreciation/
(Depreciation) | |
Purchased Contracts | | | | | | | | | | | | | | | | | |
3 Yr Australian Bond Futures | | | 144 | | | | December 2017 | | | AUD | 14,400 | | | $ | 12,285,153 | | | $ | 12,298,482 | | | $ | 13,329 | |
10 Yr Canadian Bond Futures | | | 223 | | | | December 2017 | | | CAD | 22,300 | | | | 23,475,909 | | | | 23,755,438 | | | | 279,529 | |
| | |
| 46 | AB UNCONSTRAINED BOND FUND | | abfunds.com |
PORTFOLIO OF INVESTMENTS (continued)
| | | | | | | | | | | | | | | | | | | | | | | | |
| Description | | Number of
Contracts | | | Expiration
Month | | | Notional
(000) | | | Original
Value | | | Value at
October 31,
2017 | | | Unrealized
Appreciation/
(Depreciation) | |
Euro STOXX 50 Index Futures | | | 361 | | | | December 2017 | | | EUR | 4 | | | $ | 14,679,403 | | | $ | 15,484,527 | | | $ | 805,124 | |
Nikkei 225 (CME) Futures | | | 88 | | | | December 2017 | | | USD | – 0 | –*** | | | 8,621,800 | | | | 9,860,221 | | | | 1,238,421 | |
STOXX 600 Bank Futures | | | 261 | | | | December 2017 | | | EUR | 13 | | | | 2,762,075 | | | | 2,832,887 | | | | 70,812 | |
U.S. T-Note 2 Yr (CBT) Futures | | | 115 | | | | December 2017 | | | USD | 23,000 | | | | 24,877,766 | | | | 24,766,328 | | | | (111,438 | ) |
U.S. Ultra Bond (CBT) Futures | | | 146 | | | | December 2017 | | | USD | 14,600 | | | | 24,387,625 | | | | 24,058,062 | | | | (329,563 | ) |
| | | | |
Sold Contracts | | | | | | | | | | | | | | | | | |
10 Yr Australian Bond Futures | | | 65 | | | | December 2017 | | | AUD | 6,500 | | | | 6,420,444 | | | | 6,410,149 | | | | 10,295 | |
Euro-BOBL Futures | | | 12 | | | | December 2017 | | | EUR | 1,200 | | | | 1,834,895 | | | | 1,842,047 | | | | (7,152 | ) |
Euro-Bono Futures | | | 93 | | | | December 2017 | | | EUR | 9,300 | | | | 14,905,385 | | | | 15,107,848 | | | | (202,463 | ) |
Euro-Bund Futures | | | 96 | | | | December 2017 | | | EUR | 9,600 | | | | 18,015,104 | | | | 18,199,616 | | | | (184,512 | ) |
Long Gilt Futures | | | 92 | | | | December 2017 | | | GBP | 9,200 | | | | 15,306,822 | | | | 15,191,857 | | | | 114,965 | |
S&P 500 E-mini Futures | | | 91 | | | | December 2017 | | | USD | 5 | | | | 11,214,534 | | | | 11,706,012 | | | | (491,478 | ) |
U.S. 10 Yr Ultra Futures | | | 134 | | | | December 2017 | | | USD | 13,400 | | | | 17,876,938 | | | | 17,945,531 | | | | (68,593 | ) |
U.S. Long Bond (CBT) Futures | | | 6 | | | | December 2017 | | | USD | 6,000 | | | | 926,156 | | | | 914,812 | | | | 11,344 | |
U.S. T-Note 5 Yr (CBT) Futures | | | 35 | | | | December 2017 | | | USD | 3,500 | | | | 4,136,594 | | | | 4,101,562 | | | | 35,032 | |
| | | | | | | | | | | | | | | | | | | | | | | | |
| | | | | | | | | | | | | | | | | | | | | | $ | 1,183,652 | |
| | | | | | | | | | | | | | | | | | | | | | | | |
FORWARD CURRENCY EXCHANGE CONTRACTS (see Note D)
| | | | | | | | | | | | | | | | |
| Counterparty | | Contracts to Deliver (000) | | | In Exchange
For
(000) | | | Settlement
Date | | | Unrealized
Appreciation/
(Depreciation) | |
Australia and New Zealand Banking Group Ltd. | | EUR | 4,699 | | | USD | 5,565 | | | | 11/30/17 | | | $ | 83,042 | |
Bank of America, NA | | USD | 746 | | | AUD | 973 | | | | 11/30/17 | | | | (1,214 | ) |
Bank of America, NA | | USD | 1,787 | | | RUB | 104,014 | | | | 11/30/17 | | | | (12,339 | ) |
| | |
| abfunds.com | | AB UNCONSTRAINED BOND FUND | 47 |
PORTFOLIO OF INVESTMENTS (continued)
| | | | | | | | | | | | | | | | |
| Counterparty | | Contracts to Deliver (000) | | | In Exchange
For
(000) | | | Settlement
Date | | | Unrealized
Appreciation/
(Depreciation) | |
Bank of America, NA | | USD | 800 | | | ZAR | 11,413 | | | | 12/07/17 | | | $ | 2,086 | |
Bank of America, NA | | USD | 133 | | | RUB | 7,747 | | | | 12/11/17 | | | | (915 | ) |
Bank of America, NA | | ZAR | 4,964 | | | USD | 363 | | | | 12/13/17 | | | | 14,576 | |
Bank of America, NA | | BRL | 18,192 | | | USD | 5,616 | | | | 12/15/17 | | | | 85,413 | |
Bank of America, NA | | GBP | 6,219 | | | USD | 8,193 | | | | 12/15/17 | | | | (77,633 | ) |
Bank of America, NA | | KRW | 1,760,808 | | | USD | 1,556 | | | | 12/15/17 | | | | (18,664 | ) |
Bank of America, NA | | RUB | 147,764 | | | USD | 2,519 | | | | 12/15/17 | | | | 5,914 | |
Bank of America, NA | | TWD | 85,780 | | | USD | 2,838 | | | | 12/15/17 | | | | (16,271 | ) |
Barclays Bank PLC | | USD | 3,108 | | | EUR | 2,667 | | | | 11/30/17 | | | | 3,469 | |
Barclays Bank PLC | | ZAR | 25,819 | | | USD | 1,917 | | | | 11/30/17 | | | | 100,428 | |
Barclays Bank PLC | | USD | 4,500 | | | NOK | 36,341 | | | | 12/15/17 | | | | (45,750 | ) |
Barclays Bank PLC | | USD | 3,461 | | | TRY | 13,239 | | | | 12/15/17 | | | | (15,165 | ) |
BNP Paribas SA | | USD | 1,781 | | | ARS | 32,188 | | | | 12/13/17 | | | | (4,051 | ) |
Brown Brothers Harriman & Co. | | CAD | 4,362 | | | USD | 3,523 | | | | 11/30/17 | | | | 141,018 | |
Brown Brothers Harriman & Co. | | GBP | 647 | | | USD | 874 | | | | 11/30/17 | | | | 13,840 | |
Brown Brothers Harriman & Co. | | JPY | 62,825 | | | USD | 561 | | | | 11/30/17 | | | | 7,401 | |
Brown Brothers Harriman & Co. | | MXN | 19,002 | | | USD | 1,045 | | | | 11/30/17 | | | | 58,940 | |
Brown Brothers Harriman & Co. | | USD | 10,521 | | | AUD | 13,737 | | | | 11/30/17 | | | | (11,080 | ) |
Brown Brothers Harriman & Co. | | USD | 447 | | | ZAR | 6,371 | | | | 11/30/17 | | | | 1,264 | |
Brown Brothers Harriman & Co. | | GBP | 103 | | | USD | 140 | | | | 12/01/17 | | | | 3,197 | |
Brown Brothers Harriman��& Co. | | USD | 473 | | | GBP | 349 | | | | 12/01/17 | | | | (8,945 | ) |
Brown Brothers Harriman & Co. | | AUD | 4,204 | | | USD | 3,235 | | | | 12/15/17 | | | | 18,892 | |
Brown Brothers Harriman & Co. | | CAD | 4,021 | | | USD | 3,131 | | | | 12/15/17 | | | | 12,847 | |
Brown Brothers Harriman & Co. | | EUR | 13,648 | | | USD | 15,986 | | | | 12/15/17 | | | | 48,699 | |
Brown Brothers Harriman & Co. | | JPY | 666,889 | | | USD | 5,863 | | | | 12/15/17 | | | | (14,324 | ) |
Brown Brothers Harriman & Co. | | USD | 159 | | | EUR | 136 | | | | 12/15/17 | | | | 151 | |
Citibank, NA | | USD | 1,618 | | | TRY | 5,837 | | | | 11/30/17 | | | | (91,686 | ) |
Citibank, NA | | USD | 3,212 | | | CAD | 4,135 | | | | 12/15/17 | | | | (5,763 | ) |
Citibank, NA | | USD | 6,307 | | | PLN | 23,071 | | | | 12/15/17 | | | | 32,381 | |
Citibank, NA | | NOK | 1,464 | | | CAD | 230 | | | | 1/10/18 | | | | (1,166 | ) |
Citibank, NA | | TRY | 5,521 | | | USD | 1,446 | | | | 1/10/18 | | | | 20,847 | |
Citibank, NA | | TRY | 505 | | | USD | 140 | | | | 3/13/18 | | | | 12,012 | |
Citibank, NA | | SEK | 29,997 | | | EUR | 3,116 | | | | 4/03/18 | | | | 45,372 | |
Credit Suisse International | | CAD | 454 | | | MXN | 6,534 | | | | 11/08/17 | | | | (11,398 | ) |
Credit Suisse International | | CAD | 476 | | | NOK | 2,981 | | | | 11/29/17 | | | | (3,950 | ) |
Credit Suisse International | | CHF | 329 | | | SEK | 2,757 | | | | 11/30/17 | | | | (91 | ) |
Credit Suisse International | | EUR | 834 | | | USD | 983 | | | | 11/30/17 | | | | 10,628 | |
Credit Suisse International | | NZD | 2,287 | | | CAD | 2,000 | | | | 11/30/17 | | | | (12,898 | ) |
Credit Suisse International | | CHF | 329 | | | SEK | 2,734 | | | | 12/01/17 | | | | (2,846 | ) |
Credit Suisse International | | ZAR | 6,041 | | | USD | 423 | | | | 12/07/17 | | | | (1,604 | ) |
Credit Suisse International | | SEK | 5,895 | | | USD | 707 | | | | 12/13/17 | | | | 758 | |
Credit Suisse International | | USD | 363 | | | ZAR | 4,964 | | | | 12/13/17 | | | | (14,576 | ) |
Credit Suisse International | | EUR | 5,180 | | | USD | 6,019 | | | | 12/15/17 | | | | (30,778 | ) |
Credit Suisse International | | USD | 426 | | | ZAR | 5,718 | | | | 12/18/17 | | | | (25,237 | ) |
Credit Suisse International | | AUD | 504 | | | CHF | 367 | | | | 12/19/17 | | | | (16,421 | ) |
Credit Suisse International | | AUD | 209 | | | NOK | 1,329 | | | | 12/27/17 | | | | 3,118 | |
Credit Suisse International | | EUR | 963 | | | TRY | 4,181 | | | | 1/04/18 | | | | (43,953 | ) |
Credit Suisse International | | TRY | 216 | | | EUR | 50 | | | | 1/04/18 | | | | 2,303 | |
Credit Suisse International | | CAD | 421 | | | NZD | 473 | | | | 1/23/18 | | | | (3,110 | ) |
Credit Suisse International | | USD | 140 | | | TRY | 505 | | | | 3/13/18 | | | | (12,011 | ) |
Credit Suisse International | | EUR | 3,116 | | | SEK | 29,997 | | | | 4/03/18 | | | | (45,355 | ) |
Credit Suisse International | | CHF | 518 | | | NOK | 4,285 | | | | 4/30/18 | | | | 1,375 | |
| | |
| 48 | AB UNCONSTRAINED BOND FUND | | abfunds.com |
PORTFOLIO OF INVESTMENTS (continued)
| | | | | | | | | | | | | | | | |
| Counterparty | | Contracts to Deliver (000) | | | In Exchange
For
(000) | | | Settlement
Date | | | Unrealized
Appreciation/
(Depreciation) | |
Credit Suisse International | | USD | 166 | | | MXN | 3,084 | | | | 7/23/18 | | | $ | (11,640 | ) |
Credit Suisse International | | MXN | 13,214 | | | USD | 698 | | | | 8/06/18 | | | | 39,380 | |
Credit Suisse International | | USD | 698 | | | MXN | 13,214 | | | | 8/06/18 | | | | (39,380 | ) |
Deutsche Bank AG | | USD | 162 | | | ZAR | 2,208 | | | | 11/02/17 | | | | (6,219 | ) |
Deutsche Bank AG | | MXN | 733 | | | CAD | 51 | | | | 11/08/17 | | | | 1,273 | |
Deutsche Bank AG | | NOK | 2,981 | | | CAD | 476 | | | | 11/29/17 | | | | 3,949 | |
Deutsche Bank AG | | CAD | 1,919 | | | NZD | 2,200 | | | | 11/30/17 | | | | 17,012 | |
Deutsche Bank AG | | SEK | 2,757 | | | CHF | 329 | | | | 11/30/17 | | | | 94 | |
Deutsche Bank AG | | CHF | 367 | | | AUD | 504 | | | | 12/19/17 | | | | 16,429 | |
Deutsche Bank AG | | NOK | 1,329 | | | AUD | 209 | | | | 12/27/17 | | | | (3,117 | ) |
Deutsche Bank AG | | TRY | 1,012 | | | EUR | 234 | | | | 1/04/18 | | | | 11,660 | |
Deutsche Bank AG | | SEK | 2,849 | | | EUR | 297 | | | | 1/22/18 | | | | 5,517 | |
Deutsche Bank AG | | NOK | 4,285 | | | CHF | 518 | | | | 4/30/18 | | | | (1,375 | ) |
Goldman Sachs Bank USA | | MXN | 5,800 | | | CAD | 403 | | | | 11/08/17 | | | | 10,118 | |
Goldman Sachs Bank USA | | EUR | 5,436 | | | USD | 6,325 | | | | 12/15/17 | | | | (22,977 | ) |
Goldman Sachs Bank USA | | USD | 1,615 | | | BRL | 5,291 | | | | 12/15/17 | | | | (6,694 | ) |
Goldman Sachs Bank USA | | USD | 9,776 | | | CZK | 214,929 | | | | 12/15/17 | | | | 2,120 | |
Goldman Sachs Bank USA | | ZAR | 44,927 | | | USD | 3,127 | | | | 12/15/17 | | | | (26,397 | ) |
Goldman Sachs Bank USA | | TRY | 2,953 | | | EUR | 679 | | | | 1/04/18 | | | | 30,092 | |
HSBC Bank USA | | USD | 5,035 | | | BRL | 15,873 | | | | 11/29/17 | | | | (201,163 | ) |
HSBC Bank USA | | AUD | 13,768 | | | USD | 10,862 | | | | 11/30/17 | | | | 327,844 | |
HSBC Bank USA | | USD | 1,437 | | | BRL | 4,626 | | | | 11/30/17 | | | | (28,038 | ) |
HSBC Bank USA | | MXN | 20,956 | | | USD | 1,082 | | | | 12/15/17 | | | | (2,448 | ) |
JPMorgan Chase Bank, NA | | ZAR | 2,208 | | | USD | 162 | | | | 11/02/17 | | | | 6,219 | |
JPMorgan Chase Bank, NA | | USD | 2,858 | | | TWD | 85,773 | | | | 11/22/17 | | | | (8,726 | ) |
JPMorgan Chase Bank, NA | | SEK | 2,734 | | | CHF | 329 | | | | 12/01/17 | | | | 2,846 | |
JPMorgan Chase Bank, NA | | ZAR | 10,164 | | | USD | 724 | | | | 12/07/17 | | | | 9,700 | |
JPMorgan Chase Bank, NA | | ZAR | 5,909 | | | USD | 414 | | | | 12/07/17 | | | | (875 | ) |
JPMorgan Chase Bank, NA | | RUB | 7,747 | | | USD | 133 | | | | 12/11/17 | | | | 915 | |
JPMorgan Chase Bank, NA | | ZAR | 5,718 | | | USD | 426 | | | | 12/18/17 | | | | 25,238 | |
JPMorgan Chase Bank, NA | | CAD | 230 | | | NOK | 1,464 | | | | 1/10/18 | | | | 1,165 | |
JPMorgan Chase Bank, NA | | EUR | 297 | | | SEK | 2,848 | | | | 1/22/18 | | | | (5,668 | ) |
JPMorgan Chase Bank, NA | | NZD | 473 | | | CAD | 421 | | | | 1/23/18 | | | | 3,126 | |
JPMorgan Chase Bank, NA | | TRY | 982 | | | USD | 274 | | | | 3/08/18 | | | | 24,180 | |
JPMorgan Chase Bank, NA | | USD | 274 | | | TRY | 982 | | | | 3/08/18 | | | | (24,184 | ) |
JPMorgan Chase Bank, NA | | TRY | 508 | | | USD | 138 | | | | 3/20/18 | | | | 9,932 | |
JPMorgan Chase Bank, NA | | USD | 138 | | | TRY | 508 | | | | 3/20/18 | | | | (9,932 | ) |
JPMorgan Chase Bank, NA | | MXN | 3,084 | | | USD | 166 | | | | 7/23/18 | | | | 11,640 | |
Royal Bank of Scotland PLC | | USD | 6,833 | | | CAD | 8,776 | | | | 11/30/17 | | | | (28,606 | ) |
Royal Bank of Scotland PLC | | EUR | 2,103 | | | USD | 2,479 | | | | 12/15/17 | | | | 22,508 | |
Royal Bank of Scotland PLC | | USD | 2,226 | | | RUB | 129,147 | | | | 12/15/17 | | | | (28,964 | ) |
Standard Chartered Bank | | USD | 1,086 | | | JPY | 121,478 | | | | 11/30/17 | | | | (16,330 | ) |
Standard Chartered Bank | | EUR | 1,520 | | | USD | 1,794 | | | | 12/15/17 | | | | 19,277 | |
Standard Chartered Bank | | JPY | 2,011,450 | | | USD | 17,990 | | | | 1/16/18 | | | | 229,022 | |
| | | | | | | | | | | | | | | | |
| | | | | | | | | | | | | | $ | 539,300 | |
| | | | | | | | | | | | | | | | |
| | |
| abfunds.com | | AB UNCONSTRAINED BOND FUND | 49 |
PORTFOLIO OF INVESTMENTS (continued)
CALL OPTIONS WRITTEN (see Note D)
| | | | | | | | | | | | | | | | | | | | | | | | | | | | |
| Description | | Counter-
Party | | | Contracts | | | Exercise
Price | | | Expiration
Month | | | Notional
(000) | | | Premiums
Received | | | U.S. $
Value | |
ProShares Short S&P 500 | |
| Morgan
Stanley &
Co. LLC |
| | | 5,700 | | | | USD 36.00 | | | | January 2018 | | | | USD 570 | | | $ | 1,293,640 | | | $ | (57,000 | ) |
PUT OPTIONS WRITTEN (see Note D)
| | | | | | | | | | | | | | | | | | | | | | | | | | | | |
| Description | | Counter-
Party | | | Contracts | | | Exercise
Price | | | Expiration
Month | | | Notional
(000) | | | Premiums
Received | | | U.S. $
Value | |
Vanguard REIT ETF | |
| Deutsche
Bank AG |
| | | 211,000 | | | | USD 76.00 | | | | January 2018 | | | | USD 211 | | | $ | 99,170 | | | $ | (124,472 | ) |
CREDIT DEFAULT SWAPTIONS WRITTEN (see Note D)
| | | | | | | | | | | | | | | | | | | | | | | | | | | | |
| Description | | Counter-
Party | | | Buy/Sell
Protection | | | Strike
Rate | | | Expiration
Month | | | Notional
Amount
(000) | | | Premiums
Received | | | Market
Value | |
Put | | | | | | | | | | | | | | | | | | | | | | | | | | | | |
CDX-NAHY Series 29, 5 Year Index | |
| Credit
Suisse
International |
| | | Sell | | | | 105.50 | % | | | Nov 2017 | | | $ | 3,100 | | | $ | 3,410 | | | $ | (1,119 | ) |
INTEREST RATE SWAPTIONS WRITTEN (see Note D)
| | | | | | | | | | | | | | | | | | | | | | | | |
| Description | | Index | | Counter-
Party | | Strike
Rate | | | Expiration
Date | | | Notional
Amount
(000) | | | Premiums
Received | | | Market
Value | |
Put | |
OTC -1 Year Interest Rate Swap | | 6 Month
LIBOR | | Barclays
Bank
PLC | | | 1.10 | % | | | 11/06/17 | | | GBP | 1,260 | | | $ | 5,267 | | | $ | (2,511 | ) |
OTC -1 Year Interest Rate Swap | | 6 Month
LIBOR | | Barclays
Bank
PLC | | | 1.53 | | | | 11/17/17 | | | GBP | 240 | | | | 4,872 | | | | (1,551 | ) |
OTC -1 Year Interest Rate Swap | | 6 Month
LIBOR | | Barclays
Bank
PLC | | | 1.10 | | | | 11/20/17 | | | GBP | 1,240 | | | | 5,084 | | | | (4,515 | ) |
OTC -1 Year Interest Rate Swap | | 6 Month
LIBOR | | Barclays
Bank
PLC | | | 1.58 | | | | 11/20/17 | | | GBP | 240 | | | | 4,872 | | | | (3,214 | ) |
OTC -1 Year Interest Rate Swap | | 6 Month
LIBOR | | Citibank,
NA | | | 2.12 | | | | 11/20/17 | | | GBP | 1,625 | | | | 5,281 | | | | (3,076 | ) |
OTC -1 Year Interest Rate Swap | | 6 Month
LIBOR | | Citibank,
NA | | | 1.18 | | | | 11/20/17 | | | GBP | 900 | | | | 5,190 | | | | (2,299 | ) |
OTC -1 Year Interest Rate Swap | | 3 Month
LIBOR | | Citibank,
NA | | | 2.12 | | | | 11/24/17 | | | USD | 1,625 | | | | 5,606 | | | | (3,248 | ) |
OTC -1 Year Interest Rate Swap | | 6 Month
LIBOR | | Citibank,
NA | | | 1.24 | | | | 11/24/17 | | | GBP | 850 | | | | 4,991 | | | | (4,505 | ) |
| | |
| 50 | AB UNCONSTRAINED BOND FUND | | abfunds.com |
PORTFOLIO OF INVESTMENTS (continued)
| | | | | | | | | | | | | | | | | | | | | | | | |
| Description | | Index | | Counter-
Party | | Strike
Rate | | | Expiration
Date | | | Notional
Amount
(000) | | | Premiums
Received | | | Market
Value | |
OTC -1 Year Interest Rate Swap | | 6 Month
LIBOR | | Citibank,
NA | | | 1.12 | % | | | 11/30/17 | | | GBP | 1,200 | | | $ | 4,701 | | | $ | (4,785 | ) |
OTC -1 Year Interest Rate Swap | | 6 Month
LIBOR | | Citibank,
NA | | | 1.39 | | | | 11/30/17 | | | GBP | 625 | | | | 4,772 | | | | (4,870 | ) |
OTC -1 Year Interest Rate Swap | | 3 Month
LIBOR | | Deutsche
Bank AG | | | 2.64 | | | | 11/27/17 | | | USD | 350 | | | | 4,926 | | | | (2,810 | ) |
OTC -1 Year Interest Rate Swap | | 3 Month
LIBOR | | Deutsche
Bank AG | | | 2.64 | | | | 11/27/17 | | | USD | 350 | | | | 4,926 | | | | (6,822 | ) |
OTC -1 Year Interest Rate Swap | | 6 Month
LIBOR | | Goldman
Sachs
International | | | 1.12 | | | | 11/06/17 | | | GBP | 1,260 | | | | 5,214 | | | | (1,768 | ) |
OTC -1 Year Interest Rate Swap | | 3 Month
LIBOR | | Goldman
Sachs
International | | | 2.20 | | | | 11/06/17 | | | USD | 1,230 | | | | 5,560 | | | | (2,017 | ) |
OTC -1 Year Interest Rate Swap | | 3 Month
LIBOR | | Goldman
Sachs
International | | | 2.17 | | | | 11/06/17 | | | USD | 1,230 | | | | 5,720 | | | | (1,055 | ) |
OTC -1 Year Interest Rate Swap | | 6 Month
LIBOR | | Goldman
Sachs
International | | | 1.06 | | | | 11/17/17 | | | GBP | 1,240 | | | | 5,427 | | | | (5,875 | ) |
OTC -1 Year Interest Rate Swap | | 6 Month
LIBOR | | Goldman
Sachs
International | | | 1.06 | | | | 11/20/17 | | | GBP | 1,250 | | | | 5,075 | | | | (6,522 | ) |
OTC -1 Year Interest Rate Swap | | 3 Month
LIBOR | | Goldman
Sachs
International | | | 2.28 | | | | 11/27/17 | | | USD | 1,175 | | | | 5,444 | | | | (2,620 | ) |
OTC -1 Year Interest Rate Swap | | 6 Month
LIBOR | | Goldman
Sachs
International | | | 1.12 | | | | 11/30/17 | | | GBP | 1,200 | | | | 5,142 | | | | (4,710 | ) |
OTC -1 Year Interest Rate Swap | | 6 Month
LIBOR | | Goldman
Sachs
International | | | 1.12 | | | | 11/30/17 | | | GBP | 1,200 | | | | 5,142 | | | | (4,876 | ) |
OTC -1 Year Interest Rate Swap | | 3 Month
LIBOR | | JPMorgan
Chase
Bank, NA | | | 2.10 | | | | 11/24/17 | | | USD | 1,625 | | | | 5,606 | | | | (4,292 | ) |
OTC -1 Year Interest Rate Swap | | 3 Month
LIBOR | | JPMorgan
Chase
Bank, NA | | | 2.32 | | | | 11/27/17 | | | USD | 1,200 | | | | 6,180 | | | | (1,961 | ) |
OTC -1 Year Interest Rate Swap | | 6 Month
LIBOR | | Morgan
Stanley
Capital
Services
LLC | | | 1.24 | | | | 11/20/17 | | | GBP | 860 | | | | 4,987 | | | | (4,048 | ) |
OTC -1 Year Interest Rate Swap | | 6 Month
LIBOR | | Morgan
Stanley
Capital
Services
LLC | | | 1.21 | | | | 11/23/17 | | | GBP | 850 | | | | 4,993 | | | | (3,427 | ) |
| | |
| abfunds.com | | AB UNCONSTRAINED BOND FUND | 51 |
PORTFOLIO OF INVESTMENTS (continued)
| | | | | | | | | | | | | | | | | | | | | | | | | | | | |
| Description | | Index | | | Counter-
Party | | | Strike
Rate | | | Expiration
Date | | | Notional
Amount
(000) | | | Premiums
Received | | | Market
Value | |
OTC -1 Year Interest Rate Swap | |
| 6 Month
LIBOR |
| |
| Morgan
Stanley
Capital
Services
LLC |
| | | 0.29 | % | | | 11/27/17 | | | EUR | 1,300 | | | $ | 2,916 | | | $ | (6,275 | ) |
OTC -1 Year Interest Rate Swap | |
| 6 Month
LIBOR |
| |
| Morgan
Stanley
Capital
Services
LLC |
| | | 0.24 | | | | 11/27/17 | | | EUR | 1,300 | | | | 2,471 | | | | (3,352 | ) |
| | | | | | | | | | | | | | | | | | | | | | | | | | | | |
| | | | | | | | | | | | | | | | | | | | | | $ | 130,365 | | | $ | (97,004 | ) |
| | | | | | | | | | | | | | | | | | | | | | | | | | | | |
CURRENCY OPTIONS WRITTEN (see Note D)
| | | | | | | | | | | | | | | | | | | | | | | | |
Description/
Counterparty | | Exercise
Price | | | Expiration
Month | | | Contracts | | | Notional
Amount
(000) | | | Premiums
Received | | | U.S. $
Value | |
Call | | | | | | | | | | | | | | | | | | | | | | | | |
CHF vs. AUD/ Deutsche Bank AG | | CHF | 0.760 | | | | 12/2017 | | | | 1,596,000 | | | CHF | 1,596 | | | $ | 13,619 | | | $ | (18,932 | ) |
MXN vs. CAD/ Goldman Sachs Bank USA | | MXN | 15.000 | | | | 11/2017 | | | | 30,750,000 | | | MXN | 30,750 | | | | 11,677 | | | | (3,877 | ) |
MXN vs. USD/ Credit Suisse International | | MXN | 21.500 | | | | 07/2018 | | | | 17,737,500 | | | MXN | 17,738 | | | | 14,108 | | | | (22,643 | ) |
MXN vs. USD/ JPMorgan Chase Bank, NA | | MXN | 20.000 | | | | 07/2018 | | | | 16,000,000 | | | MXN | 16,000 | | | | 20,824 | | | | (39,406 | ) |
MXN vs. USD/ Credit Suisse International | | MXN | 22.000 | | | | 08/2018 | | | | 35,200,000 | | | MXN | 35,200 | | | | 31,152 | | | | (39,947 | ) |
MXN vs. USD/ Goldman Sachs Bank USA | | MXN | 22.000 | | | | 08/2018 | | | | 18,260,000 | | | MXN | 18,260 | | | | 15,050 | | | | (21,636 | ) |
NOK vs. AUD/ Deutsche Bank AG | | NOK | 6.700 | | | | 12/2017 | | | | 7,370,000 | | | NOK | 7,370 | | | | 5,726 | | | | (602 | ) |
NOK vs. CAD/ Deutsche Bank AG | | NOK | 6.430 | | | | 11/2017 | | | | 13,083,000 | | | NOK | 13,083 | | | | 9,999 | | | | (3,343 | ) |
NOK vs. CAD/ Citibank, NA | | NOK | 6.525 | | | | 01/2018 | | | | 6,525,000 | | | NOK | 6,525 | | | | 4,528 | | | | (2,284 | ) |
| | |
| 52 | AB UNCONSTRAINED BOND FUND | | abfunds.com |
PORTFOLIO OF INVESTMENTS (continued)
| | | | | | | | | | | | | | | | | | | | | | | | |
Description/
Counterparty | | Exercise
Price | | | Expiration
Month | | | Contracts | | | Notional
Amount
(000) | | | Premiums
Received | | | U.S. $
Value | |
NOK vs. CHF/ Deutsche Bank AG | | NOK | 8.460 | | | | 04/2018 | | | | 13,113,000 | | | NOK | 13,113 | | | $ | 26,991 | | | $ | (20,116 | ) |
NOK vs. EUR/ Goldman Sachs Bank USA | | NOK | 9.590 | | | | 11/2017 | | | | 13,419,000 | | | NOK | 13,419 | | | | 9,138 | | | | (1,712 | ) |
NZD vs. AUD/ JPMorgan Chase Bank, NA | | NZD | 1.120 | | | | 11/2017 | | | | 2,303,000 | | | NZD | 2,303 | | | | 9,596 | | | | (10,445 | ) |
NZD vs. AUD/ Citibank, NA | | NZD | 1.140 | | | | 12/2017 | | | | 2,249,000 | | | NZD | 2,249 | | | | 9,172 | | | | (5,787 | ) |
RUB vs. USD/ JPMorgan Chase Bank, NA | | RUB | 61.500 | | | | 12/2017 | | | | 49,200,000 | | | RUB | 49,200 | | | | 7,184 | | | | (2,897 | ) |
RUB vs. USD/ Credit Suisse International | | RUB | 65.850 | | | | 02/2018 | | | | 54,326,000 | | | RUB | 54,326 | | | | 13,830 | | | | (4,372 | ) |
SEK vs. CHF/ Deutsche Bank AG | | SEK | 8.650 | | | | 11/2017 | | | | 13,400,000 | | | SEK | 13,400 | | | | 10,988 | | | | (1,666 | ) |
SEK vs. CHF/ JPMorgan Chase Bank, NA | | SEK | 8.560 | | | | 11/2017 | | | | 13,279,000 | | | SEK | 13,279 | | | | 10,607 | | | | (3,137 | ) |
SEK vs. EUR/ Bank of America, NA | | SEK | 9.650 | | | | 11/2017 | | | | 13,462,000 | | | SEK | 13,462 | | | | 9,976 | | | | (18,677 | ) |
SEK vs. EUR/ Goldman Sachs Bank USA | | SEK | 9.750 | | | | 12/2017 | | | | 13,163,000 | | | SEK | 13,163 | | | | 7,491 | | | | (10,683 | ) |
SEK vs. EUR/ Deutsche Bank AG | | SEK | 9.780 | | | | 01/2018 | | | | 13,199,000 | | | SEK | 13,199 | | | | 6,848 | | | | (13,685 | ) |
SEK vs. EUR/ Citibank, NA | | SEK | 9.850 | | | | 03/2018 | | | | 52,205,000 | | | SEK | 52,205 | | | | 53,853 | | | | (63,600 | ) |
TRY vs. EUR/ Deutsche Bank AG | | TRY | 4.520 | | | | 01/2018 | | | | 6,219,000 | | | TRY | 6,219 | | | | 16,339 | | | | (32,002 | ) |
TRY vs. EUR/ Goldman Sachs Bank USA | | TRY | 4.550 | | | | 01/2018 | | | | 6,029,000 | | | TRY | 6,029 | | | | 14,423 | | | | (27,760 | ) |
| | |
| abfunds.com | | AB UNCONSTRAINED BOND FUND | 53 |
PORTFOLIO OF INVESTMENTS (continued)
| | | | | | | | | | | | | | | | | | | | | | | | |
Description/
Counterparty | | Exercise
Price | | | Expiration
Month | | | Contracts | | | Notional
Amount
(000) | | | Premiums
Received | | | U.S. $
Value | |
TRY vs. USD/ Citibank, NA | | TRY | 4.050 | | | | 01/2018 | | | | 12,859,000 | | | TRY | 12,859 | | | $ | 30,643 | | | $ | (30,053 | ) |
TRY vs. USD/ JPMorgan Chase Bank, NA | | TRY | 3.840 | | | | 03/2018 | | | | 6,136,000 | | | TRY | 6,136 | | | | 24,320 | | | | (70,027 | ) |
TRY vs. USD/ Citibank, NA | | TRY | 3.860 | | | | 03/2018 | | | | 3,088,000 | | | TRY | 3,088 | | | | 12,268 | | | | (33,322 | ) |
TRY vs. USD/ JPMorgan Chase Bank, NA | | TRY | 3.930 | | | | 03/2018 | | | | 3,144,000 | | | TRY | 3,144 | | | | 12,756 | | | | (28,076 | ) |
TRY vs. USD/ Morgan Stanley Capital Services LLC | | TRY | 4.370 | | | | 07/2018 | | | | 3,604,000 | | | TRY | 3,604 | | | | 21,863 | | | | (22,196 | ) |
ZAR vs. USD/ Bank of America, NA | | ZAR | 14.400 | | | | 12/2017 | | | | 11,520,000 | | | ZAR | 11,520 | | | | 6,849 | | | | (16,404 | ) |
ZAR vs. USD/ JPMorgan Chase Bank, NA | | ZAR | 14.000 | | | | 12/2017 | | | | 11,200,000 | | | ZAR | 11,200 | | | | 8,824 | | | | (28,210 | ) |
ZAR vs. USD/ Bank of America, NA | | ZAR | 16.000 | | | | 04/2018 | | | | 12,800,000 | | | ZAR | 12,800 | | | | 9,476 | | | | (15,638 | ) |
| | | | | | |
| Put | | | | | | | | | | | | | | | | | | | | | | | | |
CAD vs. NZD/ JPMorgan Chase Bank, NA | | CAD | 0.867 | | | | 01/2018 | | | | 1,907,000 | | | CAD | 1,907 | | | | 8,643 | | | | (12,124 | ) |
| | | | | | | | | | | | | | | | | | | | | | | | |
| | | | | | | | | | | | | | | | | | $ | 468,761 | | | $ | (625,259 | ) |
| | | | | | | | | | | | | | | | | | | | | | | | |
| | |
| 54 | AB UNCONSTRAINED BOND FUND | | abfunds.com |
PORTFOLIO OF INVESTMENTS (continued)
CENTRALLY CLEARED CREDIT DEFAULT SWAPS (see Note D)
| | | | | | | | | | | | | | | | | | | | | | | | | | |
| Description | | Fixed
Rate
(Pay)
Receive | | | Payment
Frequency | | Implied
Credit
Spread at
October 31,
2017 | | | Notional
Amount
(000) | | | Market
Value | | | Upfront
Premiums
Paid
(Received) | | | Unrealized
Appreciation/
(Depreciation) | |
Buy Contracts | | | | | | | | | | | | | | | | | | | | |
CDX-NAHY Series 28, 5 Year Index, 6/20/22* | | | (5.00 | )% | | Quarterly | | | 2.80 | % | | USD | 2,146 | | | $ | (204,019 | ) | | $ | (150,802 | ) | | $ | (53,217 | ) |
CDX-NAHY Series 28, 5 Year Index, 6/20/22* | | | (5.00 | ) | | Quarterly | | | 2.80 | | | USD | 1,430 | | | | (135,949 | ) | | | (100,488 | ) | | | (35,461 | ) |
CDX-NAHY Series 28, 5 Year Index, 6/20/22* | | | (5.00 | ) | | Quarterly | | | 2.80 | | | USD | 1,311 | | | | (125,872 | ) | | | (93,167 | ) | | | (32,705 | ) |
CDX-NAHY Series 28, 5 Year Index, 6/20/22* | | | (5.00 | ) | | Quarterly | | | 2.80 | | | USD | 5,120 | | | | (486,756 | ) | | | (282,008 | ) | | | (204,748 | ) |
CDX-NAHY Series 28, 5 Year Index, 6/20/22* | | | (5.00 | ) | | Quarterly | | | 2.80 | | | USD | 3,919 | | | | (376,380 | ) | | | (220,578 | ) | | | (155,802 | ) |
CDX-NAHY Series 28, 5 Year Index, 6/20/22* | | | (5.00 | ) | | Quarterly | | | 2.80 | | | USD | 7,681 | | | | (730,229 | ) | | | (419,362 | ) | | | (310,867 | ) |
CDX-NAHY Series 29, 5 Year Index, 12/20/22* | | | (5.00 | ) | | Quarterly | | | 3.11 | | | USD | 4,310 | | | | (386,442 | ) | | | (315,968 | ) | | | (70,474 | ) |
CDX-NAIG Series 23, 5 Year Index, 12/20/19* | | | (1.00 | ) | | Quarterly | | | 0.27 | | | USD | 37,500 | | | | (621,037 | ) | | | (303,923 | ) | | | (317,114 | ) |
CDX-NAIG Series 25, 5 Year Index, 12/20/20* | | | (1.00 | ) | | Quarterly | | | 0.31 | | | USD | 12,660 | | | | (281,661 | ) | | | (88,553 | ) | | | (193,108 | ) |
CDX-NAIG Series 25, 5 Year Index, 12/20/20* | | | (1.00 | ) | | Quarterly | | | 0.31 | | | USD | 36,570 | | | | (812,597 | ) | | | (173,839 | ) | | | (638,758 | ) |
CDX-NAIG Series 25, 5 Year Index, 12/20/20* | | | (1.00 | ) | | Quarterly | | | 0.31 | | | USD | 16,710 | | | | (371,302 | ) | | | (80,558 | ) | | | (290,744 | ) |
CDX-NAIG Series 26, 5 Year Index, 6/20/21* | | | (1.00 | ) | | Quarterly | | | 0.35 | | | USD | 30,100 | | | | (725,206 | ) | | | (298,543 | ) | | | (426,663 | ) |
CDX-NAIG Series 26, 5 Year Index, 6/20/21* | | | (1.00 | ) | | Quarterly | | | 0.35 | | | USD | 25,820 | | | | (622,087 | ) | | | (262,073 | ) | | | (360,014 | ) |
iTraxx Europe Crossover Series 28, 5 Year Index, 12/20/22* | | | (5.00 | ) | | Quarterly | | | 2.25 | | | EUR | 13,600 | | | | (2,148,800 | ) | | | (1,840,491 | ) | | | (308,309 | ) |
| | |
| abfunds.com | | AB UNCONSTRAINED BOND FUND | 55 |
PORTFOLIO OF INVESTMENTS (continued)
| | | | | | | | | | | | | | | | | | | | | | | | | | | | |
| Description | | Fixed
Rate
(Pay)
Receive | | | Payment
Frequency | | | Implied
Credit
Spread at
October 31,
2017 | | | Notional
Amount
(000) | | | Market
Value | | | Upfront
Premiums
Paid
(Received) | | | Unrealized
Appreciation/
(Depreciation) | |
iTraxx Europe Senior Financials Series 23, 5 Year Index, 6/20/20* | | | (1.00 | )% | | | Quarterly | | | | 0.20 | % | | EUR | 10,160 | | | $ | (266,602 | ) | | $ | (96,081 | ) | | $ | (170,521 | ) |
|
Sale Contracts | |
CDX-NAHY Series 20, 5 Year Index, 6/20/18* | | | 5.00 | | | | Quarterly | | | | 1.03 | | | USD | 1,940 | | | | 56,770 | | | | 8,043 | | | | 48,727 | |
CDX-NAHY Series 20, 5 Year Index, 6/20/18* | | | 5.00 | | | | Quarterly | | | | 1.03 | | | USD | 1,671 | | | | 48,899 | | | | 19,910 | | | | 28,989 | |
CDX-NAHY Series 28, 5 Year Index, 6/20/22* | | | 5.00 | | | | Quarterly | | | | 2.80 | | | USD | 4,310 | | | | 409,750 | | | | 308,412 | | | | 101,338 | |
CDX-NAHY Series 28, 5 Year Index, 6/20/22* | | | 5.00 | | | | Quarterly | | | | 2.80 | | | USD | 4,900 | | | | 465,840 | | | | 331,541 | | | | 134,299 | |
CDX-NAHY Series 28, 5 Year Index, 6/20/22* | | | 5.00 | | | | Quarterly | | | | 2.80 | | | USD | 6,350 | | | | 603,691 | | | | 435,525 | | | | 168,166 | |
CDX-NAHY Series 28, 5 Year Index, 6/20/22* | | | 5.00 | | | | Quarterly | | | | 2.80 | | | USD | 6,100 | | | | 579,923 | | | | 399,205 | | | | 180,718 | |
CDX-NAIG Series 25, 5 Year Index, 12/20/20* | | | 1.00 | | | | Quarterly | | | | 0.31 | | | USD | 39,970 | | | | 888,146 | | | | (6,288 | ) | | | 894,434 | |
CDX-NAIG Series 25, 5 Year Index, 12/20/20* | | | 1.00 | | | | Quarterly | | | | 0.31 | | | USD | 25,970 | | | | 577,782 | | | | 90,390 | | | | 487,392 | |
CDX-NAIG Series 26, 5 Year Index, 6/20/21* | | | 1.00 | | | | Quarterly | | | | 0.35 | | | USD | 55,920 | | | | 1,347,293 | | | | 519,769 | | | | 827,524 | |
| | | | | | | | | | | | | | | | | | | | | | | | | | | | |
| | | | | | | | | | | | | | | | | | $ | (3,316,845 | ) | | $ | (2,619,927 | ) | | $ | (696,918 | ) |
| | | | | | | | | | | | | | | | | | | | | | | | | | | | |
| | |
| 56 | AB UNCONSTRAINED BOND FUND | | abfunds.com |
PORTFOLIO OF INVESTMENTS (continued)
CENTRALLY CLEARED INTEREST RATE SWAPS (see Note D)
| | | | | | | | | | | | | | | | | | | | | | | | |
| | | | | | | Rate Type | | | | | | | | | | | |
Notional Amount (000) | | | Termination
Date | | | Payments
made
by the Fund | | Payments
received
by the
Fund | | Payment
Frequency
Paid/
Received | | Market
Value | | | Upfront
Premiums
Paid
(Received) | | | Unrealized
Appreciation/
(Depreciation) | |
| GBP | 115,320 | | | | 5/21/18 | | | 6 Month
LIBOR | | 0.780% | | Semi-Annual/ Semi-Annual | | $ | 403,293 | | | $ | — | | | $ | 403,293 | |
| BRL | 74,700 | | | | 1/02/19 | | | 7.340% | | 1 Day CDI | | Maturity/ Maturity | | | (3,586 | ) | | | — | | | | (3,586 | ) |
| BRL | 32,500 | | | | 1/02/19 | | | 9.235% | | 1 Day CDI | | Maturity/ Maturity | | | (196,704 | ) | | | — | | | | (196,704 | ) |
| BRL | 32,500 | | | | 1/02/19 | | | 9.180% | | 1 Day CDI | | Maturity/ Maturity | | | (189,957 | ) | | | — | | | | (189,957 | ) |
| GBP | 115,320 | | | | 2/20/19 | | | 0.878% | | 6 Month LIBOR | | Semi-Annual/ Semi-Annual | | | (463,803 | ) | | | — | | | | (463,803 | ) |
| GBP | 119,710 | | | | 10/26/19 | | | 6 Month
LIBOR | | 0.840% | | Semi-Annual/ Semi-Annual | | | 1,464 | | | | — | | | | 1,464 | |
| MXN | 20,011 | | | | 6/22/20 | | | 4 Week
TIIE | | 6.770% | | Monthly/ Monthly | | | (13,395 | ) | | | — | | | | (13,395 | ) |
| USD | 31,700 | | | | 12/14/20 | | | 1.663% | | 3 Month LIBOR | | Semi-Annual/ Quarterly | | | 129,726 | | | | — | | | | 129,726 | |
| BRL | 34,100 | | | | 1/04/21 | | | 1 Day
CDI | | 8.760% | | Maturity/ Maturity | | | (65,045 | ) | | | — | | | | (65,045 | ) |
| BRL | 17,000 | | | | 1/04/21 | | | 1 Day
CDI | | 10.215% | | Maturity/ Maturity | | | 151,725 | | | | — | | | | 151,725 | |
| BRL | 17,000 | | | | 1/04/21 | | | 1 Day
CDI | | 10.165% | | Maturity/ Maturity | | | 145,334 | | | | — | | | | 145,334 | |
| CAD | 44,120 | | | | 11/07/21 | | | 3 Month
CDOR | | 1.050% | | Semi-Annual/ Semi-Annual | | | (1,209,767 | ) | | | — | | | | (1,209,767 | ) |
| CAD | 59,390 | | | | 11/14/21 | | | 3 Month
CDOR | | 1.303% | | Semi-Annual/ Semi-Annual | | | (1,126,444 | ) | | | — | | | | (1,126,444 | ) |
| CAD | 31,880 | | | | 12/05/21 | | | 3 Month
CDOR | | 1.398% | | Semi-Annual/ Semi-Annual | | | (518,300 | ) | | | — | | | | (518,300 | ) |
| GBP | 1,110 | | | | 1/09/22 | | | 6 Month
LIBOR | | 0.911% | | Semi-Annual/ Semi-Annual | | | (5,806 | ) | | | — | | | | (5,806 | ) |
| USD | 36,830 | | | | 7/13/22 | | | 3 Month
LIBOR | | 2.056% | | Quarterly/ Semi-Annual | | | 171,159 | | | | — | | | | 171,159 | |
| GBP | 48,920 | | | | 10/26/22 | | | 1.126% | | 6 Month LIBOR | | Semi-Annual/ Semi-Annual | | | (84,640 | ) | | | — | | | | (84,640 | ) |
| MXN | 117,100 | | | | 9/11/26 | | | 4 Week
TIIE | | 6.290% | | Monthly/ Monthly | | | (454,935 | ) | | | — | | | | (454,935 | ) |
| MXN | 7,347 | | | | 6/14/27 | | | 7.090% | | 4 Week TIIE | | Monthly/ Monthly | | | 9,538 | | | | — | | | | 9,538 | |
| GBP | 33,150 | | | | 7/17/27 | | | 6 Month
LIBOR | | 1.322% | | Semi-Annual/ Semi-Annual | | | (48,372 | ) | | | — | | | | (48,372 | ) |
| EUR | 19,200 | | | | 10/30/27 | | | 6 Month
EURIBOR | | 0.901% | | Semi-Annual/ Annual | | | 147,178 | | | | — | | | | 147,178 | |
| USD | 3,630 | | | | 3/07/46 | | | 2.173% | | 3 Month LIBOR | | Semi-Annual/ Quarterly | | | 340,035 | | | | — | | | | 340,035 | |
| CAD | 8,570 | | | | 11/07/46 | | | 1.868% | | 3 Month CDOR | | Semi-Annual/ Semi-Annual | | | 976,833 | | | | — | | | | 976,833 | |
| CAD | 12,040 | | | | 11/14/46 | | | 2.182% | | 3 Month CDOR | | Semi-Annual/ Semi-Annual | | | 726,563 | | | | — | | | | 726,563 | |
| CAD | 8,010 | | | | 12/05/46 | | | 2.310% | | 3 Month CDOR | | Semi-Annual/ Semi-Annual | | | 312,667 | | | | — | | | | 312,667 | |
| USD | 12,010 | | | | 1/17/47 | | | 2.466% | | 3 Month LIBOR | | Semi-Annual/ Quarterly | | | 331,556 | | | | — | | | | 331,556 | |
| | |
| abfunds.com | | AB UNCONSTRAINED BOND FUND | 57 |
PORTFOLIO OF INVESTMENTS (continued)
| | | | | | | | | | | | | | | | | | | | | | | | | | | | |
| | | | | | | Rate Type | | | | | | | | | | | | |
Notional Amount (000) | | | Termination
Date | | | Payments
made
by the Fund | | | Payments
received
by the
Fund | | | Payment
Frequency
Paid/
Received | | Market
Value | | | Upfront
Premiums
Paid
(Received) | | | Unrealized
Appreciation/
(Depreciation) | |
| USD | 6,370 | | | | 2/03/47 | | | | 2.724% | | |
| 3 Month
LIBOR |
| | Semi-Annual/ Quarterly | | $ | (155,957 | ) | | $ | — | | | $ | (155,957 | ) |
| GBP | 12,920 | | | | 7/17/47 | | | | 1.621% | | |
| 6 Month
LIBOR |
| | Semi-Annual/ Semi-Annual | | | (180,553 | ) | | | — | | | | (180,553 | ) |
| EUR | 16,540 | | | | 9/01/47 | | |
| 6 Month
EURIBOR |
| | | 1.468% | | | Semi-Annual/ Annual | | | (287,220 | ) | | | — | | | | (287,220 | ) |
| GBP | 1,110 | | | | 1/09/22 | | | | 0.981% | | |
| 6 Month
LIBOR |
| | Semi-Annual/ Semi-Annual | | | 1,196 | | | | — | | | | 1,196 | |
| EUR | 230,000 | | | | 10/09/27 | | |
| 6 Month
EURIBOR |
| | | 0.889% | | | Semi-Annual/ Annual | | | 1,740,290 | | | | 1,108,250 | | | | 632,040 | |
| EUR | 230,000 | | | | 10/09/27 | | | | 0.889% | | |
| 6 Month
EURIBOR |
| | Annual/ Semi-Annual | | | (1,734,885 | ) | | | — | | | | (1,734,885 | ) |
| EUR | 115,000 | | | | 10/09/27 | | |
| 6 Month
EURIBOR |
| | | 0.883% | | | Semi-Annual/ Annual | | | 790,408 | | | | — | | | | 790,408 | |
| EUR | 115,000 | | | | 10/09/27 | | |
| 6 Month
EURIBOR |
| | | 0.839% | | | Semi-Annual/ Annual | | | 208,874 | | | | — | | | | 208,874 | |
| EUR | 115,000 | | | | 10/09/27 | | | | 0.839% | | |
| 6 Month
EURIBOR |
| | Annual/ Semi-Annual | | | (206,736 | ) | | | 115,453 | | | | (322,189 | ) |
| EUR | 115,000 | | | | 10/09/27 | | | | 0.883% | | |
| 6 Month
EURIBOR |
| | Annual/ Semi-Annual | | | (788,158 | ) | | | (473,824 | ) | | | (314,334 | ) |
| GBP | 810 | | | | 2/28/24 | | |
| 6 Month
LIBOR |
| | | 1.251% | | | Semi-Annual/ Semi-Annual | | | 6,379 | | | | 22,475 | | | | (16,096 | ) |
| GBP | 810 | | | | 2/29/24 | | | | 1.251% | | |
| 6 Month
LIBOR |
| | Semi-Annual/ Semi-Annual | | | (6,388 | ) | | | — | | | | (6,388 | ) |
| EUR | 250 | | | | 2/08/47 | | |
| 6 Month
EURIBOR |
| | | 1.298% | | | Semi-Annual/ Annual | | | (14,222 | ) | | | — | | | | (14,222 | ) |
| EUR | 250 | | | | 2/08/47 | | |
| 6 Month
EURIBOR |
| | | 1.293% | | | Semi-Annual/ Annual | | | (14,630 | ) | | | — | | | | (14,630 | ) |
| EUR | 250 | | | | 2/08/47 | | | | 1.426% | | |
| 6 Month
EURIBOR |
| | Annual/ Semi-Annual | | | 4,753 | | | | — | | | | 4,753 | |
| EUR | 250 | | | | 2/08/47 | | | | 1.425% | | |
| 6 Month
EURIBOR |
| | Annual/ Semi-Annual | | | 4,827 | | | | — | | | | 4,827 | |
| | | | | | | | | | | | | | | | | | | | | | | | | | | | |
| | | | | | | | | | | | | | | | | | $ | (1,165,705 | ) | | $ | 772,354 | | | $ | (1,938,059 | ) |
| | | | | | | | | | | | | | | | | | | | | | | | | | | | |
CREDIT DEFAULT SWAPS (see Note D)
| | | | | | | | | | | | | | | | | | | | | | | | | | | | |
Swap Counterparty & Referenced
Obligation | | Fixed
Rate
(Pay)
Receive | | | Payment
Frequency | | | Implied
Credit
Spread at
October 31,
2017 | | | Notional
Amount
(000) | | | Market
Value | | | Upfront
Premiums
Paid
(Received) | | | Unrealized
Appreciation/
(Depreciation) | |
Buy Contracts | |
Bank of America, NA | | | | | | | | | | | | | | | | | | | | | | | | | | | | |
LCDX-NA Series 20, 5 Year Index, 6/20/18* | | | (2.50 | )% | | | Quarterly | | | | 0.16 | % | | USD | 9,100 | | | $ | (150,973 | ) | | $ | (35,996 | ) | | $ | (114,977 | ) |
Barclays Bank PLC | | | | | | | | | | | | | | | | | | | | | | | | | | | | |
Malaysia Government International, 12/20/22* | | | (1.00 | ) | | | Quarterly | | | | 0.63 | | | USD | 16,900 | | | | (322,234 | ) | | | (280,509 | ) | | | (41,725 | ) |
| | |
| 58 | AB UNCONSTRAINED BOND FUND | | abfunds.com |
PORTFOLIO OF INVESTMENTS (continued)
| | | | | | | | | | | | | | | | | | | | | | | | | | |
Swap Counterparty & Referenced
Obligation | | Fixed
Rate
(Pay)
Receive | | | Payment
Frequency | | Implied
Credit
Spread at
October 31,
2017 | | | Notional
Amount
(000) | | | Market
Value | | | Upfront
Premiums
Paid
(Received) | | | Unrealized
Appreciation/
(Depreciation) | |
Windstream Services LLC Wind, 7.50%, 6/01/22, 3/20/18* | | | (5.00 | )% | | Quarterly | | | 17.11 | % | | USD | 122 | | | $ | 4,630 | | | $ | 14,558 | | | $ | (9,928 | ) |
Windstream Services LLC Wind, 7.50%, 6/01/22, 6/20/18* | | | (5.00 | ) | | Quarterly | | | 13.87 | | | USD | 128 | | | | 5,884 | | | | 21,607 | | | | (15,723 | ) |
BNP Paribas SA | | | | | | | | | | | | | | | | | | | | | | | | | | |
Kingdom of Thailand, 12/20/22* | | | (1.00 | ) | | Quarterly | | | 0.47 | | | USD | 20,000 | | | | (536,127 | ) | | | (455,312 | ) | | | (80,815 | ) |
Kingdom of Thailand, 12/20/22* | | | (1.00 | ) | | Quarterly | | | 0.47 | | | USD | 20,000 | | | | (536,127 | ) | | | (454,843 | ) | | | (81,284 | ) |
Citibank, NA | | | | | | | | | | | | | | | | | | | | | | | | | | |
iTraxx Japan Series 28, 5 Year Index, 12/20/20* | | | (1.00 | ) | | Quarterly | | | 0.48 | | | JPY | 5,740,190 | | | | (1,399,320 | ) | | | (1,384,234 | ) | | | (15,086 | ) |
Credit Suisse International | | | | | | | | | | | | | | | | | | | | | | | | | | |
BellSouth LLC, 6.55%, 6/15/34, 9/20/19* | | | (1.00 | ) | | Quarterly | | | 0.22 | | | USD | 7,520 | | | | (116,281 | ) | | | (69,557 | ) | | | (46,724 | ) |
Deutsche Bank AG | | | | | | | | | | | | | | | | | | | | | | | | | | |
iTraxx Japan Series 24, 5 Year Index, 12/20/20* | | | (1.00 | ) | | Quarterly | | | 0.31 | | | JPY | 3,720,370 | | | | (746,066 | ) | | | (166,939 | ) | | | (579,127 | ) |
iTraxx Australia Series 25, 5 Year Index, 6/20/21* | | | (1.00 | ) | | Quarterly | | | 0.37 | | | USD | 55,920 | | | | (1,308,813 | ) | | | 708,570 | | | | (2,017,383 | ) |
Goldman Sachs International | | | | | | | | | | | | | | | | | | | | | | | | | | |
Korea International Bond, 7.125%, 4/16/19, 12/20/22* | | | (1.00 | ) | | Quarterly | | | 0.73 | | | USD | 29,585 | | | | (425,379 | ) | | | (379,638 | ) | | | (45,741 | ) |
United Mexican States, 5.95%, 3/19/19, 12/20/19* | | | (1.00 | ) | | Quarterly | | | 0.49 | | | USD | 32,970 | | | | (396,490 | ) | | | (83,690 | ) | | | (312,800 | ) |
| | |
| abfunds.com | | AB UNCONSTRAINED BOND FUND | 59 |
PORTFOLIO OF INVESTMENTS (continued)
| | | | | | | | | | | | | | | | | | | | | | | | | | |
Swap Counterparty & Referenced
Obligation | | Fixed
Rate
(Pay)
Receive | | | Payment
Frequency | | Implied
Credit
Spread at
October 31,
2017 | | | Notional
Amount
(000) | | | Market
Value | | | Upfront
Premiums
Paid
(Received) | | | Unrealized
Appreciation/
(Depreciation) | |
JPMorgan Chase Bank, NA | | | | | | | | | | | | | | | | | | | | | | | | | | |
Malaysia Government International, 12/20/22* | | | (1.00 | )% | | Quarterly | | | 0.63 | % | | USD | 19,000 | | | $ | (362,275 | ) | | $ | (274,089 | ) | | $ | (88,186 | ) |
Morgan Stanley Capital Services LLC | | | | | | | | | | | | | | | | | | | | | | | | | | |
Chile Government International Bond, 3.875%, 8/05/20, 12/20/22* | | | (1.00 | ) | | Quarterly | | | 0.51 | | | USD | 49,030 | | | | (1,238,958 | ) | | | (1,047,063 | ) | | | (191,895 | ) |
| | | | | | |
Sale Contracts | | | | | | | | | | | | | | | | | | | | | | | |
Bank of America, NA | | | | | | | | | | | | | | | | | | | | | | | | | | |
Genworth Holdings, Inc., 6.515%, 5/22/18, 6/20/20* | | | 5.00 | | | Quarterly | | | 5.55 | | | USD | 300 | | | | (2,323 | ) | | | 6,989 | | | | (9,312 | ) |
iTraxx Australia Series 25, 5 Year Index, 6/20/21* | | | 1.00 | | | Quarterly | | | 0.37 | | | USD | 25,820 | | | | 604,322 | | | | (20,011 | ) | | | 624,333 | |
Barclays Bank PLC | | | | | | | | | | | | | | | | | | | | | | | | | | |
Assured Guaranty Municipal Corp., 6/20/20* | | | 5.00 | | | Quarterly | | | 1.22 | | | USD | 300 | | | | 30,354 | | | | 12,482 | | | | 17,872 | |
iTraxx Japan Series 24, 5 Year Index, 12/20/20* | | | 1.00 | | | Quarterly | | | 0.31 | | | JPY | 3,720,370 | | | | 747,884 | | | | 490,017 | | | | 257,867 | |
United Mexican States, 5.95%, 3/19/19, 12/20/19* | | | 1.00 | | | Quarterly | | | 0.49 | | | USD | 14,620 | | | | 175,005 | | | | (47,435 | ) | | | 222,440 | |
| | |
| 60 | AB UNCONSTRAINED BOND FUND | | abfunds.com |
PORTFOLIO OF INVESTMENTS (continued)
| | | | | | | | | | | | | | | | | | | | | | | | | | |
Swap Counterparty & Referenced
Obligation | | Fixed
Rate
(Pay)
Receive | | | Payment
Frequency | | Implied
Credit
Spread at
October 31,
2017 | | | Notional
Amount
(000) | | | Market
Value | | | Upfront
Premiums
Paid
(Received) | | | Unrealized
Appreciation/
(Depreciation) | |
United Mexican States, 5.95%, 3/19/19, 12/20/19* | | | 1.00 | % | | Quarterly | | | 0.49 | % | | USD | 18,350 | | | $ | 220,673 | | | $ | (40,706 | ) | | $ | 261,379 | |
Windstream Services LLC Wind, 7.50%, 6/01/22, 12/20/22* | | | 5.00 | | | Quarterly | | | 15.65 | | | USD | 250 | | | | (74,290 | ) | | | (91,985 | ) | | | 17,695 | |
Citibank, NA | | | | | | | | | | | | | | | | | | | | | | | | | | |
iTraxx Australia Series 25, 5 Year Index, 6/20/21* | | | 1.00 | | | Quarterly | | | 0.37 | | | USD | 30,100 | | | | 704,493 | | | | (108,530 | ) | | | 813,023 | |
Nabors Industries, Inc., 6.15%, 2/15/18, 6/20/20* | | | 1.00 | | | Quarterly | | | 1.53 | | | USD | 300 | | | | (5,450 | ) | | | (18,966 | ) | | | 13,516 | |
Safeway, Inc., 7.25%, 2/01/31, 6/20/20* | | | 1.00 | | | Quarterly | | | 2.13 | | | USD | 300 | | | | (9,231 | ) | | | (13,828 | ) | | | 4,597 | |
Staples, Inc., 2.75%, 1/12/18, 6/20/20* | | | 1.00 | | | Quarterly | | | 3.20 | | | USD | 300 | | | | (17,806 | ) | | | (6,743 | ) | | | (11,063 | ) |
Weatherford International LLC, 4.50%, 4/15/22, 6/20/20* | | | 1.00 | | | Quarterly | | | 3.04 | | | USD | 300 | | | | (16,521 | ) | | | (14,690 | ) | | | (1,831 | ) |
Credit Suisse International | | | | | | | | | | | | | | | | | | | | | | | | | | |
AT&T, Inc., 3.375%, 3/30/20, 9/20/19* | | | 1.00 | | | Quarterly | | | 0.19 | | | USD | 7,520 | | | | 121,201 | | | | 80,739 | | | | 40,462 | |
Avon Products, Inc., 6.50%, 3/01/19, 6/20/20* | | | 1.00 | | | Quarterly | | | 5.41 | | | USD | 300 | | | | (33,536 | ) | | | (29,299 | ) | | | (4,237 | ) |
CDX-CMBX.NA.BBB- Series 6, 5/11/63* | | | 3.00 | | | Monthly | | | 7.25 | | | USD | 8,810 | | | | (1,470,242 | ) | | | 139,119 | | | | (1,609,361 | ) |
Freeport-McMoran, Inc., 3.55%, 3/01/22, 6/20/20* | | | 1.00 | | | Quarterly | | | 0.66 | | | USD | 300 | | | | 2,566 | | | | (12,007 | ) | | | 14,573 | |
Teck Resources Ltd., 3.75%, 2/01/23, 6/20/20* | | | 1.00 | | | Quarterly | | | 0.43 | | | USD | 300 | | | | 4,455 | | | | (12,766 | ) | | | 17,221 | |
| | |
| abfunds.com | | AB UNCONSTRAINED BOND FUND | 61 |
PORTFOLIO OF INVESTMENTS (continued)
| | | | | | | | | | | | | | | | | | | | | | | | | | | | |
Swap Counterparty & Referenced
Obligation | | Fixed
Rate
(Pay)
Receive | | | Payment
Frequency | | | Implied
Credit
Spread at
October 31,
2017 | | | Notional
Amount
(000) | | | Market
Value | | | Upfront
Premiums
Paid
(Received) | | | Unrealized
Appreciation/
(Depreciation) | |
Transocean, Inc., 7.375%, 4/15/18, 6/20/20* | | | 1.00 | % | | | Quarterly | | | | 1.79 | % | | USD | 300 | | | $ | (6,416 | ) | | $ | (35,763 | ) | | $ | 29,347 | |
| | | | | | | | | | | | | | | | | | | | | | | | | | | | |
| | | | | | | | | | | | | | | | | | $ | (6,553,391 | ) | | $ | (3,610,518 | ) | | $ | (2,942,873 | ) |
| | | | | | | | | | | | | | | | | | | | | | | | | | | | |
INTEREST RATE SWAPS (see Note D)
| | | | | | | | | | | | | | | | | | | | | | | | |
| | | | | | | | | Rate Type | | | | | | | |
Swap Counterparty | | Notional
Amount
(000) | | | Termination
Date | | | Payments
made
by the Fund | | | Payments
received
by the
Fund | | | Payment
Frequency
Paid/
Received | | | Unrealized
Appreciation/
(Depreciation) | |
JPMorgan Chase Bank, NA | | USD | 650 | | | | 4/20/20 | | | | 3.738% | | | | 3 Month LIBOR | | |
| Semi-
Annual/
Quarterly |
| | $ | (29,563 | ) |
JPMorgan Chase Bank, NA | | USD | 950 | | | | 4/26/20 | | | | 3.772% | | | | 3 Month LIBOR | | |
| Semi-
Annual/
Quarterly |
| | | (43,907 | ) |
| | | | | | | | | | | | | | | | | | | | | | | | |
| | | | | | | | | | | | | | | | | | | | | | $ | (73,470 | ) |
| | | | | | | | | | | | | | | | | | | | | | | | |
TOTAL RETURN SWAPS (see Note D)
| | | | | | | | | | | | | | | | | | | | | | | | |
Counterparty & Referenced Obligation | | # of Shares
or Units | | | Rate Paid/
Received | | | Payment
Frequency | | | Notional
Amount
(000) | | | Maturity
Date | | | Unrealized
Appreciation/
(Depreciation) | |
Receive Total Return on Reference Obligation | | | | | | | | | |
Citibank, NA | | | | | | | | | | | | | | | | | | | | | | | | |
Euro Stoxx 50 Index | | | 30,009 | | | | — | | | | Maturity | | | EUR | 3,160 | | | | 12/18/20 | | | $ | 681,642 | |
Goldman Sachs International
| | | | | | | | | | | | | | | | | | | | | | | | |
GS Unconstrained Bond Custom Basket Long 1 | | | 114,963 | | | | LIBOR Plus 0.42 | % | | | Quarterly | | | USD | 11,533 | | | | 10/15/18 | | | | (180,492 | ) |
JPMorgan Chase Bank, NA | | | | | | | | | | | | | | | | | | | | | | | | |
Euro Stoxx 50 Index | | | 30,009 | | | | — | | | | Maturity | | | EUR | 3,211 | | | | 12/18/20 | | | | 622,216 | |
| | |
| 62 | AB UNCONSTRAINED BOND FUND | | abfunds.com |
PORTFOLIO OF INVESTMENTS (continued)
| | | | | | | | | | | | | | | | | | | | | | | | |
Counterparty & Referenced Obligation | | # of Shares
or Units | | | Rate Paid/
Received | | | Payment
Frequency | | | Notional
Amount
(000) | | | Maturity
Date | | | Unrealized
Appreciation/
(Depreciation) | |
Pay Total Return on Reference Obligation | | | | | | | | | | | | | |
Citibank, NA | | | | | | | | | | | | | | | | | | | | | | | | |
Euro Stoxx 50 Index | | | 30,009 | | | | — | | | | Maturity | | | EUR | 3,337 | | | | 12/15/17 | | | $ | (199,249 | ) |
iShares J.P. Morgan USD Emerging Markets Bond ETF | | | 52,000 | | | | LIBOR Plus 0.10 | % | | | Monthly | | | USD | 6,043 | | | | 11/15/17 | | | | 1,711 | |
Goldman Sachs International | | | | | | | | | | | | | | | | | | | | | | | | |
Bundesrepublik Deutschland 2.500% 8/2046 | | | 14,000,000 | | | | 0.85 | % | | | Maturity | | | EUR | 18,772 | | | | 12/01/17 | | | | 241,245 | |
GS Unconstrained Bond Custom Basket Long 1 | | | 85,289 | | | | LIBOR Plus 0.28 | % | | | Quarterly | | | USD | 8,597 | | | | 10/15/18 | | | | (52,026 | ) |
JPMorgan Chase Bank, NA | | | | | | | | | | | | | | | | | | | | | | | | |
Euro Stoxx 50 Index | | | 30,009 | | | | — | | | | Maturity | | | EUR | 3,376 | | | | 12/15/17 | | | | (153,806 | ) |
| | | | | | | | | | | | | | | | | | | | | | | | |
| | | | | | | | | | | | | | | | | | | | | | $ | 961,241 | |
| | | | | | | | | | | | | | | | | | | | | | | | |
| ** | Principal amount less than 500. |
| *** | Notional amount less than 500. |
| (a) | Security is exempt from registration under Rule 144A of the Securities Act of 1933. These securities are considered restricted, but liquid and may be resold in transactions exempt from registration, normally to qualified institutional buyers. At October 31, 2017, the aggregate market value of these securities amounted to $36,712,499 or 12.0% of net assets. |
| (b) | Security in which significant unobservable inputs (Level 3) were used in determining fair value. |
| (c) | Non-income producing security. |
| (d) | Fair valued by the Adviser. |
| (e) | Restricted and illiquid security. |
| | | | | | | | | | | | | | | | |
Restricted & Illiquid
Securities | | Acquisition
Date | | | Cost | | | Market
Value | | | Percentage of
Net Assets | |
Exide Technologies | | | 5/23/17 | | | $ | – 0 | – | | $ | 11,694 | | | | 0.00 | % |
Momentive Performance Materials, Inc.
8.875%, 10/15/20 | | | 9/06/16 | | | | 1 | | | | – 0 | – | | | 0.00 | % |
| (g) | Pay-In-Kind Payments (PIK). The issuer may pay cash interest and/or interest in additional debt securities. Rates shown are the rates in effect at October 31, 2017. |
| | |
| abfunds.com | | AB UNCONSTRAINED BOND FUND | 63 |
PORTFOLIO OF INVESTMENTS (continued)
| (h) | Security is exempt from registration under Rule 144A of the Securities Act of 1933. These securities, which represent 1.25% of net assets as of October 31, 2017, are considered illiquid and restricted. Additional information regarding such securities follows: |
| | | | | | | | | | | | | | | | |
144A/Restricted & Illiquid
Securities | | Acquisition
Date | | | Cost | | | Market
Value | | | Percentage of
Net Assets | |
Bellemeade Re II Ltd.
Series 2016-1A, Class M2B
7.738%, 4/25/26 | | | 4/29/16 | | | $ | 2,391,300 | | | $ | 2,452,076 | | | | 0.80 | % |
Dominican Republic International Bond
15.95%, 6/04/21 | | | 6/14/11 | | | | 732,751 | | | | 679,540 | | | | 0.22 | % |
Exide Technologies
7.00%, 4/30/25 | | | 11/10/16 | | | | 146,604 | | | | 152,118 | | | | 0.05 | % |
Exide Technologies
11.00%, 4/30/22 | | | 5/24/17 | | | | 99,707 | | | | 93,500 | | | | 0.03 | % |
Golden Energy Offshore Services AS
5.00%, 12/31/17 | | | 10/31/14 | | | | 1,118,522 | | | | 417,546 | | | | 0.14 | % |
Virgolino de Oliveira Finance SA
10.50%, 1/28/18 | | | 1/23/14 | | | | 477,436 | | | | 41,204 | | | | 0.01 | % |
| (j) | Coupon rate adjusts periodically based upon a predetermined schedule. Stated interest rate in effect at October 31, 2017. |
| (l) | Securities are perpetual and, thus, do not have a predetermined maturity date. The date shown, if applicable, reflects the next call date. |
| (m) | Floating Rate Security. Stated interest/floor rate was in effect at October 31, 2017. |
| (n) | Defaulted matured security. |
| (p) | Position, or a portion thereof, has been segregated to collateralize OTC derivatives outstanding. |
| (q) | Variable rate coupon, rate shown as of October 31, 2017. |
| (r) | The stated coupon rate represents the greater of the LIBOR or the LIBOR floor rate plus a spread at October 31, 2017. |
| (s) | Affiliated investments. |
| (t) | The rate shown represents the 7-day yield as of period end. |
| (u) | To obtain a copy of the fund’s shareholder report, please go to the Securities and Exchange Commission’s website at www.sec.gov, or call AB at (800) 227-4618. |
| | |
Currency Abbreviations: ARS – Argentine Peso AUD – Australian Dollar BRL – Brazilian Real CAD – Canadian Dollar CHF – Swiss Franc CZK – Czech Koruna DOP – Dominican Peso EGP – Egyptian Pound EUR – Euro GBP – Great British Pound JPY – Japanese Yen KRW – South Korean Won | | MXN – Mexican Peso MYR – Malaysian Ringgit NOK – Norwegian Krone NZD – New Zealand Dollar PLN – Polish Zloty RUB – Russian Ruble SEK – Swedish Krona TRY – Turkish Lira TWD – New Taiwan Dollar USD – United States Dollar UYU – Uruguayan Peso ZAR – South African Rand |
| | |
| 64 | AB UNCONSTRAINED BOND FUND | | abfunds.com |
PORTFOLIO OF INVESTMENTS (continued)
Glossary:
12MTA – 12 Month Treasury Average
ABS – Asset-Backed Securities
BOBL – Bundesobligationen
CBT – Chicago Board of Trade
CDI – Brazil CETIP Interbank Deposit Rate
CDOR – Canadian Dealer Offered Rate
CDX-CMBX.NA – North American Commercial Mortgage-Backed Index
CDX-NAHY – North American High Yield Credit Default Swap Index
CDX-NAIG – North American Investment Grade Credit Default Swap Index
CMBS – Commercial Mortgage-Backed Securities
CME – Chicago Mercantile Exchange
ETF – Exchange Traded Fund
EURIBOR – Euro Interbank Offered Rate
INTRCONX – Inter-Continental Exchange
LCDX.NA – North American Loan Credit Default Swap Index
LIBOR – London Interbank Offered Rates
REIT – Real Estate Investment Trust
REMICs – Real Estate Mortgage Investment Conduits
SPDR – Standard & Poor’s Depository Receipt
TIIE – Banco de México Equilibrium Interbank Interest Rate
TIPS – Treasury Inflation Protected Security
The following table represents the 50 largest equity basket holdings underlying the total return swap with GS Unconstrained Bond Custom Basket Long 1 as of October 31, 2017.
| | | | | | | | | | | | |
| Security Description | | Shares | | | Market
Value as of
10/31/17 | | | Percent of
Basket’s
Net Assets | |
GS Unconstrained Bond Custom Basket Long 1 | | | | | | | | | | | | |
Procter & Gamble Co./The | | | 8,154 | | | $ | 727,785 | | | | 7.2 | % |
Coca-Cola Co./The | | | 13,793 | | | | 642,340 | | | | 6.3 | % |
Wal-Mart Stores Inc. | | | 6,315 | | | | 627,894 | | | | 6.2 | % |
PepsiCo. Inc. | | | 5,207 | | | | 599,846 | | | | 5.9 | % |
McDonald’s Corp. | | | 2,940 | | | | 493,861 | | | | 4.9 | % |
Newmont Mining Corp. | | | 11,276 | | | | 406,387 | | | | 4.0 | % |
CVS Health Corp. | | | 5,087 | | | | 357,209 | | | | 3.5 | % |
Kroger Co./The | | | 15,504 | | | | 345,274 | | | | 3.4 | % |
AT&T Inc. | | | 9,934 | | | | 342,475 | | | | 3.4 | % |
Walgreens Boots Alliance Inc. | | | 4,606 | | | | 328,270 | | | | 3.2 | % |
CostCo. Wholesale Corp. | | | 1,913 | | | | 326,970 | | | | 3.2 | % |
Starbucks Corp. | | | 5,251 | | | | 300,567 | | | | 3.0 | % |
Verizon Communications Inc. | | | 6,579 | | | | 293,818 | | | | 2.9 | % |
Colgate-Palmolive Co. | | | 2,842 | | | | 206,443 | | | | 2.0 | % |
Constellation Brands Inc. | | | 621 | | | | 135,043 | | | | 1.3 | % |
NextEra Energy Inc. | | | 834 | | | | 131,063 | | | | 1.3 | % |
Kimberly-Clark Corp. | | | 1,134 | | | | 130,229 | | | | 1.3 | % |
Royal Gold Inc. | | | 1,386 | | | | 118,531 | | | | 1.2 | % |
Duke Energy Corp. | | | 1,254 | | | | 111,838 | | | | 1.1 | % |
Yum! Brands Inc. | | | 1,241 | | | | 97,431 | | | | 1.0 | % |
Dominion Energy Inc. | | | 1,157 | | | | 94,793 | | | | 0.9 | % |
Southern Co./The | | | 1,813 | | | | 94,113 | | | | 0.9 | % |
Monster Beverage Corp. | | | 1,504 | | | | 93,278 | | | | 0.9 | % |
American Tower Corp. | | | 626 | | | | 93,086 | | | | 0.9 | % |
Estee Lauder Cos Inc./The | | | 709 | | | | 89,086 | | | | 0.9 | % |
Casey’s General Stores Inc. | | | 663 | | | | 77,458 | | | | 0.8 | % |
| | |
| abfunds.com | | AB UNCONSTRAINED BOND FUND | 65 |
PORTFOLIO OF INVESTMENTS (continued)
| | | | | | | | | | | | |
| Security Description | | Shares | | | Market
Value as of
10/31/17 | | | Percent of
Basket’s
Net Assets | |
Simon Property Group Inc. | | | 462 | | | $ | 73,929 | | | | 0.7 | % |
Exelon Corp. | | | 1,729 | | | | 71,364 | | | | 0.7 | % |
American Electric Power Co. Inc. | | | 866 | | | | 66,440 | | | | 0.6 | % |
Crown Castle International Corp. | | | 588 | | | | 65,415 | | | | 0.6 | % |
Dr Pepper Snapple Group Inc. | | | 661 | | | | 57,553 | | | | 0.6 | % |
Equinix Inc. | | | 117 | | | | 55,659 | | | | 0.5 | % |
Clorox Co./The | | | 411 | | | | 55,316 | | | | 0.5 | % |
Sempra Energy | | | 453 | | | | 54,306 | | | | 0.5 | % |
Molson Coors Brewing Co. | | | 661 | | | | 52,543 | | | | 0.5 | % |
Prologis Inc. | | | 780 | | | | 52,377 | | | | 0.5 | % |
PG&E Corp. | | | 910 | | | | 50,223 | | | | 0.5 | % |
Consolidated Edison Inc. | | | 550 | | | | 48,070 | | | | 0.5 | % |
Public Storage | | | 224 | | | | 47,884 | | | | 0.5 | % |
Edison International | | | 578 | | | | 47,211 | | | | 0.5 | % |
Public Service Enterprise Group Inc. | | | 915 | | | | 46,907 | | | | 0.5 | % |
Xcel Energy Inc. | | | 900 | | | | 46,053 | | | | 0.4 | % |
Sprouts Farmers Market Inc. | | | 2,254 | | | | 45,914 | | | | 0.4 | % |
PPL Corp. | | | 1,221 | | | | 44,249 | | | | 0.4 | % |
Brown-Forman Corp. | | | 701 | | | | 40,889 | | | | 0.4 | % |
Weyerhaeuser Co. | | | 1,107 | | | | 40,422 | | | | 0.4 | % |
WEC Energy Group Inc. | | | 561 | | | | 38,574 | | | | 0.4 | % |
Welltower Inc. | | | 553 | | | | 37,632 | | | | 0.4 | % |
Equity Residential | | | 541 | | | | 37,502 | | | | 0.4 | % |
Eversource Energy | | | 575 | | | | 37,315 | | | | 0.4 | % |
Other | | | 41,270 | | | | 1,681,466 | | | | 16.6 | % |
| | | | | | | | | | | | |
Total | | | | | | $ | 10,160,301 | | | | 100.0 | % |
| | | | | | | | | | | | |
The following table represents the 50 largest equity basket holdings underlying the total return swap with GS Unconstrained Bond Custom Basket Long 1 as of October 31, 2017.
| | | | | | | | | | | | |
| Security Description | | Shares | | | Market
Value as of
10/31/17 | | | Percent of
Basket’s
Net Assets | |
GS Unconstrained Bond Custom Basket Long 1 | | | | | | | | | | | | |
Caterpillar Inc. | | | 3,970 | | | $ | 541,349 | | | | 5.4 | % |
Union Pacific Corp. | | | 4,105 | | | | 478,479 | | | | 4.8 | % |
Louisiana-Pacific Corp. | | | 17,068 | | | | 452,985 | | | | 4.5 | % |
Johnson Controls International plc | | | 12,119 | | | | 437,981 | | | | 4.4 | % |
General Motors Co | | | 7,511 | | | | 327,555 | | | | 3.3 | % |
Ford Motor Co | | | 22,907 | | | | 275,800 | | | | 2.8 | % |
CSX Corp. | | | 4,720 | | | | 236,614 | | | | 2.4 | % |
Intel Corp. | | | 4,612 | | | | 210,492 | | | | 2.1 | % |
Delta Air Lines Inc. | | | 3,947 | | | | 199,126 | | | | 2.0 | % |
Norfolk Southern Corp. | | | 1,474 | | | | 190,500 | | | | 1.9 | % |
Southwest Airlines Co | | | 3,365 | | | | 185,967 | | | | 1.9 | % |
Cummins Inc. | | | 1,061 | | | | 177,282 | | | | 1.8 | % |
Boise Cascade Co. | | | 4,740 | | | | 173,721 | | | | 1.7 | % |
MasCo. Corp. | | | 4,240 | | | | 166,038 | | | | 1.7 | % |
PACCAR Inc. | | | 2,345 | | | | 163,423 | | | | 1.6 | % |
Jacobs Engineering Group Inc. | | | 2,702 | | | | 157,878 | | | | 1.6 | % |
Delphi Automotive PLC | | | 1,547 | | | | 153,524 | | | | 1.5 | % |
| | |
| 66 | AB UNCONSTRAINED BOND FUND | | abfunds.com |
PORTFOLIO OF INVESTMENTS (continued)
| | | | | | | | | | | | |
| Security Description | | Shares | | | Market
Value as of
10/31/17 | | | Percent of
Basket’s
Net Assets | |
Mohawk Industries Inc. | | | 565 | | | $ | 152,923 | | | | 1.5 | % |
DR Horton Inc. | | | 3,092 | | | | 146,932 | | | | 1.5 | % |
Fluor Corp. | | | 3,150 | | | | 146,223 | | | | 1.5 | % |
Fortune Brands Home & Security Inc. | | | 2,070 | | | | 133,432 | | | | 1.3 | % |
Newell Brands Inc. | | | 4,494 | | | | 126,641 | | | | 1.3 | % |
Deltic Timber Corp. | | | 1,328 | | | | 125,987 | | | | 1.3 | % |
NVIDIA Corp. | | | 587 | | | | 124,215 | | | | 1.2 | % |
American Airlines Group Inc. | | | 2,588 | | | | 123,396 | | | | 1.2 | % |
Quanta Services Inc. | | | 3,427 | | | | 123,269 | | | | 1.2 | % |
AECOM | | | 3,568 | | | | 123,167 | | | | 1.2 | % |
PNC Financial Services Group Inc./The | | | 864 | | | | 114,489 | | | | 1.1 | % |
AO Smith Corp. | | | 1,894 | | | | 111,803 | | | | 1.1 | % |
Whirlpool Corp. | | | 668 | | | | 108,824 | | | | 1.1 | % |
Broadcom Ltd | | | 396 | | | | 107,736 | | | | 1.1 | % |
EMCOR Group Inc. | | | 1,331 | | | | 103,978 | | | | 1.0 | % |
Allegion PLC | | | 1,247 | | | | 102,778 | | | | 1.0 | % |
Lennar Corp. | | | 1,758 | | | | 102,122 | | | | 1.0 | % |
NVR Inc. | | | 30 | | | | 98,146 | | | | 1.0 | % |
QUALCOMM Inc. | | | 1,465 | | | | 96,851 | | | | 1.0 | % |
Lennox International Inc. | | | 491 | | | | 95,750 | | | | 1.0 | % |
Texas Instruments Inc. | | | 963 | | | | 94,673 | | | | 0.9 | % |
United Continental Holdings Inc. | | | 1,538 | | | | 90,250 | | | | 0.8 | % |
Valmont Industries Inc. | | | 508 | | | | 82,677 | | | | 0.8 | % |
PulteGroup Inc. | | | 2,539 | | | | 80,994 | | | | 0.8 | % |
BB&T Corp. | | | 1,469 | | | | 68,705 | | | | 0.7 | % |
Toll Brothers Inc. | | | 1,366 | | | | 63,833 | | | | 0.6 | % |
Applied Materials Inc. | | | 1,067 | | | | 61,715 | | | | 0.6 | % |
Dycom Industries Inc. | | | 702 | | | | 61,706 | | | | 0.6 | % |
Garmin Ltd | | | 1,006 | | | | 61,094 | | | | 0.6 | % |
BorgWarner Inc. | | | 1,165 | | | | 60,615 | | | | 0.6 | % |
KBR Inc. | | | 3,193 | | | | 58,592 | | | | 0.6 | % |
Granite Construction Inc. | | | 907 | | | | 56,171 | | | | 0.6 | % |
Leggett & Platt Inc. | | | 1,211 | | | | 55,682 | | | | 0.6 | % |
Other | | | 56,728 | | | | 2,226,016 | | | | 22.2 | % |
| | | | | | | | | | | | |
Total | | | | | | $ | 10,020,099 | | | | 100.0 | % |
| | | | | | | | | | | | |
See notes to financial statements.
| | |
| abfunds.com | | AB UNCONSTRAINED BOND FUND | 67 |
STATEMENT OF ASSETS & LIABILITIES
October 31, 2017
| | | | |
| Assets | | | | |
Investments in securities, at value | | | | |
Unaffiliated issuers (cost $287,828,293) | | $ | 286,509,071 | |
Affiliated issuers (cost $10,002,782) | | | 10,002,782 | |
Cash collateral due from broker | | | 7,706,202 | |
Foreign currencies, at value (cost $523,083) | | | 518,490 | |
Receivable for investment securities sold | | | 15,641,758 | |
Unrealized appreciation on credit default swaps | | | 2,334,325 | |
Unaffiliated interest receivable | | | 1,718,655 | |
Unrealized appreciation on forward currency exchange contracts | | | 1,561,227 | |
Upfront premiums paid on credit default swaps | | | 1,474,081 | |
Unrealized appreciation on total return swaps | | | 1,546,814 | |
Receivable for capital stock sold | | | 336,102 | |
Receivable for variation margin on futures | | | 209,913 | |
Receivable for variation margin on exchange-traded swaps | | | 65,818 | |
Affiliated dividends receivable | | | 10,468 | |
| | | | |
Total assets | | | 329,635,706 | |
| | | | |
| Liabilities | | | | |
Options written, at value (premiums received $1,861,571) | | | 806,731 | |
Swaptions written, at value (premiums received $133,775) | | | 98,123 | |
Payable for capital stock redeemed | | | 7,369,115 | |
Unrealized depreciation on credit default swaps | | | 5,277,198 | |
Upfront premiums received on credit default swaps | | | 5,084,599 | |
Payable for investment securities purchased and foreign currency transactions | | | 1,019,872 | |
Cash collateral received from broker | | | 1,040,000 | |
Unrealized depreciation on forward currency exchange contracts | | | 1,021,927 | |
Unrealized depreciation on total return swaps | | | 585,573 | |
Advisory fee payable | | | 75,202 | |
Unrealized depreciation on interest rate swaps | | | 73,470 | |
Dividends payable | | | 70,694 | |
Administrative fee payable | | | 22,130 | |
Distribution fee payable | | | 20,605 | |
Transfer Agent fee payable | | | 11,122 | |
Directors fee payable | | | 2,434 | |
Payable for variation margin on exchange-traded swaps | | | 1,743 | |
Accrued expenses and other liabilities | | | 317,470 | |
| | | | |
Total liabilities | | | 22,898,008 | |
| | | | |
Net Assets | | $ | 306,737,698 | |
| | | | |
| Composition of Net Assets | | | | |
Capital stock, at par | | $ | 35,364 | |
Additional paid-in capital | | | 312,911,123 | |
Undistributed net investment income | | | 1,532,597 | |
Accumulated net realized loss on investment and foreign currency transactions | | | (4,544,389 | ) |
Net unrealized depreciation on investments and foreign currency denominated assets and liabilities | | | (3,196,997 | ) |
| | | | |
| | $ | 306,737,698 | |
| | | | |
See notes to financial statements.
| | |
| 68 | AB UNCONSTRAINED BOND FUND | | abfunds.com |
STATEMENT OF ASSETS & LIABILITIES (continued)
Net Asset Value Per Share—27 billion shares of capital stock authorized, $.001 par value
| | | | | | | | | | | | |
| Class | | Net Assets | | | Shares
Outstanding | | | Net Asset
Value | |
| |
| A | | $ | 36,135,864 | | | | 4,160,518 | | | $ | 8.69 | * |
| | | | | | | | | | | | |
| B | | $ | 151,159 | | | | 17,376 | | | $ | 8.70 | |
| | | | | | | | | | | | |
| C | | $ | 13,908,080 | | | | 1,601,004 | | | $ | 8.69 | |
| | | | | | | | | | | | |
| Advisor | | $ | 195,763,606 | | | | 22,568,165 | | | $ | 8.67 | |
| | | | | | | | | | | | |
| R | | $ | 1,377,664 | | | | 158,178 | | | $ | 8.71 | |
| | | | | | | | | | | | |
| K | | $ | 247,546 | | | | 28,375 | | | $ | 8.72 | |
| | | | | | | | | | | | |
| I | | $ | 47,915,374 | | | | 5,532,603 | | | $ | 8.66 | |
| | | | | | | | | | | | |
| Z | | $ | 11,238,405 | | | | 1,298,277 | | | $ | 8.66 | |
| | | | | | | | | | | | |
| * | The maximum offering price per share for Class A shares was $9.08, which reflects a sales charge of 4.25%. |
See notes to financial statements.
| | |
| abfunds.com | | AB UNCONSTRAINED BOND FUND | 69 |
STATEMENT OF OPERATIONS
Year Ended October 31, 2017
| | | | | | | | |
| Investment Income | | | | | | | | |
Interest (net of foreign taxes withheld of $28,488) | | $ | 10,296,889 | | | | | |
Dividends | | | | | | | | |
Unaffiliated issuers | | | 6,591 | | | | | |
Affiliated issuers | | | 183,954 | | | $ | 10,487,434 | |
| | | | | | | | |
| Expenses | | | | | | | | |
Advisory fee (see Note B) | | | 1,507,596 | | | | | |
Distribution fee—Class A | | | 102,874 | | | | | |
Distribution fee—Class B | | | 1,994 | | | | | |
Distribution fee—Class C | | | 178,317 | | | | | |
Distribution fee—Class R | | | 5,064 | | | | | |
Distribution fee—Class K | | | 596 | | | | | |
Transfer agency—Class A | | | 24,351 | | | | | |
Transfer agency—Class B | | | 182 | | | | | |
Transfer agency—Class C | | | 11,105 | | | | | |
Transfer agency—Advisor Class | | | 104,793 | | | | | |
Transfer agency—Class R | | | 2,474 | | | | | |
Transfer agency—Class K | | | 419 | | | | | |
Transfer agency—Class I | | | 9,426 | | | | | |
Transfer agency—Class Z | | | 1,982 | | | | | |
Custodian | | | 166,463 | | | | | |
Audit and tax | | | 139,741 | | | | | |
Registration fees | | | 137,468 | | | | | |
Administrative | | | 58,807 | | | | | |
Printing | | | 51,136 | | | | | |
Legal | | | 36,890 | | | | | |
Directors’ fees | | | 28,079 | | | | | |
Miscellaneous | | | 97,035 | | | | | |
| | | | | | | | |
Total expenses before dividend and interest expense | | | 2,666,792 | | | | | |
Dividend and interest expense | | | 115,548 | | | | | |
| | | | | | | | |
Total expenses | | | 2,782,340 | | | | | |
Less: expenses waived and reimbursed by the Adviser (see Note B) | | | (480,057 | ) | | | | |
| | | | | | | | |
Net expenses | | | | | | | 2,302,283 | |
| | | | | | | | |
Net investment income | | | | | | | 8,185,151 | |
| | | | | | | | |
See notes to financial statements.
| | |
| 70 | AB UNCONSTRAINED BOND FUND | | abfunds.com |
STATEMENT OF OPERATIONS (continued)
| | | | | | | | |
| Realized and Unrealized Gain (Loss) on Investment and Foreign Currency Transactions | | | | | | | | |
Net realized gain (loss) on: | | | | | | | | |
Investment transactions | | | | | | $ | (1,298,666 | ) |
Forward currency exchange contracts | | | | | | | (12,607,837 | ) |
Futures | | | | | | | 4,542,375 | |
Options written | | | | | | | 1,354,731 | |
Swaps | | | | | | | (525,890 | ) |
Swaptions written | | | | | | | 948,327 | |
Foreign currency transactions | | | | | | | (2,709,546 | ) |
Net change in unrealized appreciation/depreciation on: | | | | | | | | |
Investments | | | | | | | 782,193 | |
Forward currency exchange contracts | | | | | | | 13,988,749 | |
Futures | | | | | | | 208,226 | |
Options written | | | | | | | 1,027,712 | |
Swaps | | | | | | | (1,810,100 | ) |
Swaptions written | | | | | | | 62,116 | |
Foreign currency denominated assets and liabilities | | | | | | | (3,721 | ) |
| | | | | | | | |
Net gain on investment and foreign currency transactions | | | | | | | 3,958,669 | |
| | | | | | | | |
Contributions from Affiliates (see Note B) | | | | | | | 851 | |
| | | | | | | | |
Net Increase in Net Assets from Operations | | | | | | $ | 12,144,671 | |
| | | | | | | | |
See notes to financial statements.
| | |
| abfunds.com | | AB UNCONSTRAINED BOND FUND | 71 |
STATEMENT OF CHANGES IN NET ASSETS
| | | | | | | | |
| | | Year Ended
October 31, 2017 | | | Year Ended
October 31, 2016 | |
| Increase (Decrease) in Net Assets from Operations | | | | | | | | |
Net investment income | | $ | 8,185,151 | | | $ | 9,389,308 | |
Net realized gain (loss) on investment and foreign currency transactions | | | (10,296,506 | ) | | | 26,017,024 | |
Net change in unrealized appreciation/depreciation on investments and foreign currency denominated assets and liabilities | | | 14,255,175 | | | | (24,740,796 | ) |
Contributions from Affiliates
(see Note B) | | | 851 | | | | 263,677 | |
| | | | | | | | |
Net increase in net assets from operations | | | 12,144,671 | | | | 10,929,213 | |
| Dividends to Shareholders from | | | | | | | | |
Net investment income | | | | | | | | |
Class A | | | (1,288,080 | ) | | | (833,579 | ) |
Class B | | | (5,262 | ) | | | (3,537 | ) |
Class C | | | (476,767 | ) | | | (275,293 | ) |
Advisor Class | | | (5,847,603 | ) | | | (4,380,674 | ) |
Class R | | | (26,864 | ) | | | (14,229 | ) |
Class K | | | (7,125 | ) | | | (3,680 | ) |
Class I | | | (1,620,260 | ) | | | (985,783 | ) |
Class Z | | | (336,792 | ) | | | (111,885 | ) |
Tax return of capital | | | | | | | | |
Class A | | | (53,442 | ) | | | – 0 | – |
Class B | | | (218 | ) | | | – 0 | – |
Class C | | | (19,781 | ) | | | – 0 | – |
Advisor Class | | | (242,616 | ) | | | – 0 | – |
Class R | | | (1,115 | ) | | | – 0 | – |
Class K | | | (296 | ) | | | – 0 | – |
Class I | | | (67,224 | ) | | | – 0 | – |
Class Z | | | (13,973 | ) | | | – 0 | – |
| Capital Stock Transactions | | | | | | | | |
Net increase (decrease) | | | 23,456,796 | | | | (67,542,791 | ) |
| | | | | | | | |
Total increase (decrease) | | | 25,594,049 | | | | (63,222,238 | ) |
| Net Assets | | | | | | | | |
Beginning of period | | | 281,143,649 | | | | 344,365,887 | |
| | | | | | | | |
End of period (including undistributed net investment income of $1,532,597 and $19,776,148, respectively) | | $ | 306,737,698 | | | $ | 281,143,649 | |
| | | | | | | | |
See notes to financial statements.
| | |
| 72 | AB UNCONSTRAINED BOND FUND | | abfunds.com |
NOTES TO FINANCIAL STATEMENTS
October 31, 2017
NOTE A
Significant Accounting Policies
AB Unconstrained Bond Fund, Inc. (the “Fund”) was incorporated in the State of Maryland on October 25, 1995 and is registered under the Investment Company Act of 1940 as a diversified, open-end management investment company. The Fund has authorized the issuance of Class A, Class B, Class C, Advisor Class, Class R, Class K, Class I and Class Z shares. Class T shares have been authorized but currently are not offered. Class A shares are sold with a front-end sales charge of up to 4.25% for purchases not exceeding $1,000,000. With respect to purchases of $1,000,000 or more, Class A shares redeemed within one year of purchase may be subject to a contingent deferred sales charge of 1%. Class B shares are currently sold with a contingent deferred sales charge which declines from 4% to zero depending on the period of time the shares are held. Effective January 31, 2009, sales of Class B shares of the Fund to new investors were suspended. Class B shares will only be issued (i) upon the exchange of Class B shares from another AB Mutual Fund, (ii) for purposes of dividend reinvestment, (iii) through the Fund’s Automatic Investment Program (the “Program”) for accounts that established the Program prior to January 31, 2009, and (iv) for purchases of additional shares by Class B shareholders as of January 31, 2009. The ability to establish a new Program for accounts containing Class B shares was suspended as of January 31, 2009. Class B shares will automatically convert to Class A shares eight years after the end of the calendar month of purchase. Class C shares are subject to a contingent deferred sales charge of 1% on redemptions made within the first year after purchase, and 0% after the first year of purchase. Effective April 10, 2017, Class C shares will automatically convert to Class A shares ten years after the end of the calendar month of purchase. Class R and Class K shares are sold without an initial or contingent deferred sales charge. Advisor Class, Class I and Class Z shares are sold without an initial or contingent deferred sales charge and are not subject to ongoing distribution expenses. All nine classes of shares have identical voting, dividend, liquidation and other rights and the same terms and conditions, except that the classes bear different distribution and transfer agency expenses. Each class has exclusive voting rights with respect to its distribution plan. The financial statements have been prepared in conformity with U.S. generally accepted accounting principles (“U.S. GAAP”), which require management to make certain estimates and assumptions that affect the reported amounts of assets and liabilities in the financial statements and amounts of income and expenses during the reporting period. Actual results could differ from those estimates. The Fund is an investment company under U.S. GAAP and follows the accounting and reporting guidance applicable to investment companies. The following is a summary of significant accounting policies followed by the Fund.
| | |
| abfunds.com | | AB UNCONSTRAINED BOND FUND | 73 |
NOTES TO FINANCIAL STATEMENTS (continued)
1. Security Valuation
Portfolio securities are valued at their current market value determined on the basis of market quotations or, if market quotations are not readily available or are deemed unreliable, at “fair value” as determined in accordance with procedures established by and under the general supervision of the Fund’s Board of Directors (the “Board”).
In general, the market values of securities which are readily available and deemed reliable are determined as follows: securities listed on a national securities exchange (other than securities listed on the NASDAQ Stock Market, Inc. (“NASDAQ”)) or on a foreign securities exchange are valued at the last sale price at the close of the exchange or foreign securities exchange. If there has been no sale on such day, the securities are valued at the last traded price from the previous day. Securities listed on more than one exchange are valued by reference to the principal exchange on which the securities are traded; securities listed only on NASDAQ are valued in accordance with the NASDAQ Official Closing Price; listed or over the counter (“OTC”) market put or call options are valued at the mid level between the current bid and asked prices. If either a current bid or current ask price is unavailable, AllianceBernstein L.P. (the “Adviser”) will have discretion to determine the best valuation (e.g., last trade price in the case of listed options); open futures are valued using the closing settlement price or, in the absence of such a price, the most recent quoted bid price. If there are no quotations available for the day of valuation, the last available closing settlement price is used; U.S. Government securities and any other debt instruments having 60 days or less remaining until maturity are generally valued at market by an independent pricing vendor, if a market price is available. If a market price is not available, the securities are valued at amortized cost. This methodology is commonly used for short-term securities that have an original maturity of 60 days or less, as well as short-term securities that had an original term to maturity that exceeded 60 days. In instances when amortized cost is utilized, the Valuation Committee (the “Committee”) must reasonably conclude that the utilization of amortized cost is approximately the same as the fair value of the security. Such factors the Committee will consider include, but are not limited to, an impairment of the creditworthiness of the issuer or material changes in interest rates. Fixed-income securities, including mortgage-backed and asset-backed securities, may be valued on the basis of prices provided by a pricing service or at a price obtained from one or more of the major broker-dealers. In cases where broker-dealer quotes are obtained, the Adviser may establish procedures whereby changes in market yields or spreads are used to adjust, on a daily basis, a recently obtained quoted price on a security. Swaps and other derivatives are valued daily, primarily using independent pricing services, independent pricing models using market inputs, as well as third party broker-dealers or counterparties. Open end mutual funds are valued at the closing net asset value per share, while exchange traded funds are valued at the closing market price per share.
| | |
| 74 | AB UNCONSTRAINED BOND FUND | | abfunds.com |
NOTES TO FINANCIAL STATEMENTS (continued)
Securities for which market quotations are not readily available (including restricted securities) or are deemed unreliable are valued at fair value as deemed appropriate by the Adviser. Factors considered in making this determination may include, but are not limited to, information obtained by contacting the issuer, analysts, analysis of the issuer’s financial statements or other available documents. In addition, the Fund may use fair value pricing for securities primarily traded in non-U.S. markets because most foreign markets close well before the Fund values its securities at 4:00 p.m., Eastern Time. The earlier close of these foreign markets gives rise to the possibility that significant events, including broad market moves, may have occurred in the interim and may materially affect the value of those securities. To account for this, the Fund generally values many of its foreign equity securities using fair value prices based on third party vendor modeling tools to the extent available.
2. Fair Value Measurements
In accordance with U.S. GAAP regarding fair value measurements, fair value is defined as the price that the Fund would receive to sell an asset or pay to transfer a liability in an orderly transaction between market participants at the measurement date. U.S. GAAP establishes a framework for measuring fair value, and a three-level hierarchy for fair value measurements based upon the transparency of inputs to the valuation of an asset or liability (including those valued based on their market values as described in Note A.1 above). Inputs may be observable or unobservable and refer broadly to the assumptions that market participants would use in pricing the asset or liability. Observable inputs reflect the assumptions market participants would use in pricing the asset or liability based on market data obtained from sources independent of the Fund. Unobservable inputs reflect the Fund’s own assumptions about the assumptions that market participants would use in pricing the asset or liability based on the best information available in the circumstances. Each investment is assigned a level based upon the observability of the inputs which are significant to the overall valuation. The three-tier hierarchy of inputs is summarized below.
| | • | | Level 1—quoted prices in active markets for identical investments |
| | • | | Level 2—other significant observable inputs (including quoted prices for similar investments, interest rates, prepayment speeds, credit risk, etc.) |
| | • | | Level 3—significant unobservable inputs (including the Fund’s own assumptions in determining the fair value of investments) |
The fair value of debt instruments, such as bonds, and over-the-counter derivatives is generally based on market price quotations, recently executed market transactions (where observable) or industry recognized modeling techniques and are generally classified as Level 2. Pricing vendor inputs to Level 2 valuations may include quoted prices for similar investments in active markets, interest rate curves, coupon rates, currency rates, yield curves, option adjusted spreads, default rates, credit spreads and other
| | |
| abfunds.com | | AB UNCONSTRAINED BOND FUND | 75 |
NOTES TO FINANCIAL STATEMENTS (continued)
unique security features in order to estimate the relevant cash flows which is then discounted to calculate fair values. If these inputs are unobservable and significant to the fair value, these investments will be classified as Level 3. In addition, non-agency rated investments are classified as Level 3.
Where readily available market prices or relevant bid prices are not available for certain equity investments, such investments may be valued based on similar publicly traded investments, movements in relevant indices since last available prices or based upon underlying company fundamentals and comparable company data (such as multiples to earnings or other multiples to equity). Where an investment is valued using an observable input, such as another publicly traded security, the investment will be classified as Level 2. If management determines that an adjustment is appropriate based on restrictions on resale, illiquidity or uncertainty, and such adjustment is a significant component of the valuation, the investment will be classified as Level 3. An investment will also be classified as Level 3 where management uses company fundamentals and other significant inputs to determine the valuation.
Options are valued using market-based inputs to models, broker or dealer quotations, or alternative pricing sources with reasonable levels of price transparency, where such inputs and models are available. Alternatively the values may be obtained through unobservable management determined inputs and/or management’s proprietary models. Where models are used, the selection of a particular model to value an option depends upon the contractual terms of, and specific risks inherent in, the option as well as the availability of pricing information in the market. Valuation models require a variety of inputs, including contractual terms, market prices, measures of volatility and correlations of such inputs. Exchange-traded options generally will be classified as Level 2. For options that do not trade on exchange but trade in liquid markets, inputs can generally be verified and model selection does not involve significant management judgment. Options are classified within Level 2 on the fair value hierarchy when all of the significant inputs can be corroborated to market evidence. Otherwise such instruments are classified as Level 3.
Valuations of mortgage-backed or other asset-backed securities, by pricing vendors, are based on both proprietary and industry recognized models and discounted cash flow techniques. Significant inputs to the valuation of these instruments are value of the collateral, the rates and timing of delinquencies, the rates and timing of prepayments, and default and loss expectations, which are driven in part by housing prices for residential mortgages. Significant inputs are determined based on relative value analyses, which incorporate comparisons to instruments with similar collateral and risk profiles, including relevant indices. Mortgage and asset-backed securities for which management has collected current observable
| | |
| 76 | AB UNCONSTRAINED BOND FUND | | abfunds.com |
NOTES TO FINANCIAL STATEMENTS (continued)
data through pricing services are generally categorized within Level 2. Those investments for which current observable data has not been provided are classified as Level 3.
Bank loan prices are provided by third party pricing services and consist of a composite of the quotes received by the vendor into a consensus price. Certain bank loans are classified as Level 3, as significant input used in the fair value measurement of these instruments is the market quotes that are received by the vendor and these inputs are not observable.
Other fixed income investments, including non-U.S. government and corporate debt, are generally valued using quoted market prices, if available, which are typically impacted by current interest rates, maturity dates and any perceived credit risk of the issuer. Additionally, in the absence of quoted market prices, these inputs are used by pricing vendors to derive a valuation based upon industry or proprietary models which incorporate issuer specific data with relevant yield/spread comparisons with more widely quoted bonds with similar key characteristics. Those investments for which there are observable inputs are classified as Level 2. Where the inputs are not observable, the investments are classified as Level 3.
The following table summarizes the valuation of the Fund’s investments by the above fair value hierarchy levels as of October 31, 2017:
| | | | | | | | | | | | | | | | |
Investments in
Securities | | Level 1 | | | Level 2 | | | Level 3 | | | Total | |
Assets: | | | | | | | | | | | | | | | | |
Corporates – Non-Investment Grade | | $ | – 0 | – | | $ | 56,954,660 | | | $ | 916,724 | # | | $ | 57,871,384 | |
Collateralized Mortgage Obligations | | | – 0 | – | | | 38,588,586 | | | | – 0 | – | | | 38,588,586 | |
Governments – Treasuries | | | – 0 | – | | | 22,889,593 | | | | – 0 | – | | | 22,889,593 | |
Inflation-Linked Securities | | | – 0 | – | | | 18,923,631 | | | | – 0 | – | | | 18,923,631 | |
Corporates – Investment Grade | | | – 0 | – | | | 14,164,661 | | | | – 0 | – | | | 14,164,661 | |
Agencies | | | – 0 | – | | | 7,202,513 | | | | – 0 | – | | | 7,202,513 | |
Emerging Markets – Treasuries | | | – 0 | – | | | 4,284,468 | | | | – 0 | – | | | 4,284,468 | |
Emerging Markets – Corporate Bonds | | | – 0 | – | | | 3,022,665 | | | | – 0 | – | | | 3,022,665 | |
Quasi-Sovereigns | | | – 0 | – | | | 2,795,244 | | | | – 0 | – | | | 2,795,244 | |
Governments – Sovereign Bonds | | | – 0 | – | | | 1,960,461 | | | | – 0 | – | | | 1,960,461 | |
Emerging Markets – Sovereigns | | | – 0 | – | | | 1,863,559 | | | | – 0 | – | | | 1,863,559 | |
Bank Loans | | | – 0 | – | | | 1,339,052 | | | | – 0 | – | | | 1,339,052 | |
Whole Loan Trusts | | | – 0 | – | | | – 0 | – | | | 1,038,518 | | | | 1,038,518 | |
Commercial Mortgage-Backed Securities | | | – 0 | – | | | – 0 | – | | | 1,007,164 | | | | 1,007,164 | |
Common Stocks | | | 700,550 | | | | – 0 | – | | | 163,347 | | | | 863,897 | |
Asset-Backed Securities | | | – 0 | – | | | 380,195 | | | | 443,168 | | | | 823,363 | |
Local Governments – Regional Bonds | | | – 0 | – | | | 452,020 | | | | – 0 | – | | | 452,020 | |
Options Purchased – Puts | | | – 0 | – | | | 177,542 | | | | – 0 | – | | | 177,542 | |
Local Governments – US Municipal Bonds | | | – 0 | – | | | 123,413 | | | | – 0 | – | | | 123,413 | |
Preferred Stocks | | | 114,800 | | | | – 0 | – | | | – 0 | – | | | 114,800 | |
| | |
| abfunds.com | | AB UNCONSTRAINED BOND FUND | 77 |
NOTES TO FINANCIAL STATEMENTS (continued)
| | | | | | | | | | | | | | | | |
Investments in
Securities | | Level 1 | | | Level 2 | | | Level 3 | | | Total | |
Warrants | | $ | 1,598 | | | $ | – 0 | – | | $ | – 0 | – | | $ | 1,598 | |
Short-Term Investments: | | | | | | | | | | | | | | | | |
U.S. Treasury Bills | | | – 0 | – | | | 80,376,597 | | | | – 0 | – | | | 80,376,597 | |
Governments – Treasuries | | | – 0 | – | | | 18,121,496 | | | | – 0 | – | | | 18,121,496 | |
Investment Companies | | | 10,002,782 | | | | – 0 | – | | | – 0 | – | | | 10,002,782 | |
Time Deposits | | | – 0 | – | | | 7,232,135 | | | | – 0 | – | | | 7,232,135 | |
Emerging Markets – Sovereigns | | | – 0 | – | | | 831,902 | | | | 438,809 | | | | 1,270,711 | |
| | | | | | | | | | | | | | | | |
Total Investments in Securities | | | 10,819,730 | | | | 281,684,393 | | | | 4,007,730 | | | | 296,511,853 | |
Other Financial Instruments*: | | | | | | | | | | | | | | | | |
Assets | | | | | | | | | | | | | | | | |
Futures | | | 464,494 | | | | 2,114,357 | | | | – 0 | – | | | 2,578,851 | † |
Forward Currency Exchange Contracts | | | – 0 | – | | | 1,561,227 | | | | – 0 | – | | | 1,561,227 | |
Centrally Cleared Credit Default Swaps | | | – 0 | – | | | 4,978,094 | | | | – 0 | – | | | 4,978,094 | † |
Centrally Cleared Interest Rate Swaps | | | – 0 | – | | | 6,603,798 | | | | – 0 | – | | | 6,603,798 | † |
Credit Default Swaps | | | – 0 | – | | | 2,621,467 | | | | – 0 | – | | | 2,621,467 | |
Total Return Swaps | | | – 0 | – | | | 1,546,814 | | | | – 0 | – | | | 1,546,814 | |
Liabilities | | | | | | | | | | | | | | | | |
Futures | | | (1,395,199 | ) | | | – 0 | – | | | – 0 | – | | | (1,395,199 | )† |
Forward Currency Exchange Contracts | | | – 0 | – | | | (1,021,927 | ) | | | – 0 | – | | | (1,021,927 | ) |
Call Options Written | | | – 0 | – | | | (57,000 | ) | | | – 0 | – | | | (57,000 | ) |
Put Options Written | | | – 0 | – | | | (124,472 | ) | | | – 0 | – | | | (124,472 | ) |
Credit Default Swaptions Written | | | – 0 | – | | | (1,119 | ) | | | – 0 | – | | | (1,119 | ) |
Interest Rate Swaptions Written | | | – 0 | – | | | (97,004 | ) | | | – 0 | – | | | (97,004 | ) |
Currency Options Written | | | – 0 | – | | | (625,259 | ) | | | – 0 | – | | | (625,259 | ) |
Centrally Cleared Credit Default Swaps | | | – 0 | – | | | (8,294,939 | ) | | | – 0 | – | | | (8,294,939 | )† |
Centrally Cleared Interest Rate Swaps | | | – 0 | – | | | (7,769,503 | ) | | | – 0 | – | | | (7,769,503 | )† |
Credit Default Swaps | | | – 0 | – | | | (9,174,858 | ) | | | – 0 | – | | | (9,174,858 | ) |
Interest Rate Swaps | | | – 0 | – | | | (73,470 | ) | | | – 0 | – | | | (73,470 | ) |
Total Return Swaps | | | – 0 | – | | | (585,573 | ) | | | – 0 | – | | | (585,573 | ) |
| | | | | | | | | | | | | | | | |
Total^ | | $ | 9,889,025 | | | $ | 273,285,026 | | | $ | 4,007,730 | | | $ | 287,181,781 | |
| | | | | | | | | | | | | | | | |
| # | The Fund held securities with zero market value at period end. |
| * | Other financial instruments are derivative instruments, such as futures, forwards and swaps, which are valued at the unrealized appreciation/(depreciation) on the instrument. Other financial instruments may also include swaps with upfront premiums, options written and swaptions written which are valued at market value. |
| † | Only variation margin receivable/payable at period end is reported within the statements of assets and liabilities. This amount reflects cumulative unrealized appreciation/(depreciation) on exchange-traded derivatives as reported in the portfolio of investments. Exchange-traded swaps with upfront premiums are presented here as market value. |
| ^ | There were no transfers between Level 1 and Level 2 during the reporting period. |
The Fund recognizes all transfers between levels of the fair value hierarchy assuming the financial instrument was transferred at the beginning of the reporting period.
| | |
| 78 | AB UNCONSTRAINED BOND FUND | | abfunds.com |
NOTES TO FINANCIAL STATEMENTS (continued)
The following is a reconciliation of investments in which significant unobservable inputs (Level 3) were used in determining fair value.
| | | | | | | | | | | | | | | | |
| | | Corporates -
Non-Investment
Grade# | | | Collateralized
Mortgage
Obligations | | | Whole Loan
Trusts | | | Commercial
Mortgage-
Backed
Securities | |
Balance as of 10/31/16 | | $ | 341,866 | | | $ | 4,308,018 | | | $ | 1,327,991 | | | $ | 3,443,874 | |
Accrued discounts/ (premiums) | | | 5,992 | | | | – 0 | – | | | 4,602 | | | | 509 | |
Realized gain (loss) | | | – 0 | – | | | – 0 | – | | | (82,023 | ) | | | (41,566 | ) |
Change in unrealized appreciation/ depreciation | | | (117,531 | ) | | | (14,663 | ) | | | (126,597 | ) | | | 8,242 | |
Purchases | | | 371,986 | | | | – 0 | – | | | – 0 | – | | | 203,000 | |
Sales/Paydowns | | | (62,149 | ) | | | (1,564,071 | ) | | | (85,455 | ) | | | (2,606,895 | ) |
Transfers into Level 3 | | | 376,560 | | | | – 0 | – | | | – 0 | – | | | – 0 | – |
Transfers out of Level 3 | | | – 0 | – | | | (2,729,284 | ) | | | – 0 | – | | | – 0 | – |
| | | | | | | | | | | | | | | | |
Balance as of 10/31/17 | | $ | 916,724 | | | $ | – 0 | – | | $ | 1,038,518 | | | $ | 1,007,164 | |
| | | | | | | | | | | | | | | | |
Net change in unrealized appreciation/depreciation from investments held as of 10/31/17** | | $ | (111,748 | ) | | $ | – 0 | – | | $ | (126,597 | ) | | $ | (9,128 | ) |
| | | | | | | | | | | | | | | | |
| | | | | | | | | | | | | | | | |
| | | Common Stocks | | | Asset-Backed
Securities | | | Short Term
Investments: Emerging
Markets - Sovereigns | | | Total | |
Balance as of 10/31/16 | | $ | – 0 | – | | $ | – 0 | – | | $ | – 0 | – | | $ | 9,421,749 | |
Accrued discounts/ (premiums) | | | – 0 | – | | | 119 | | | | 37,031 | | | | 48,253 | |
Realized gain (loss) | | | – 0 | – | | | 1,154 | | | | – 0 | – | | | (122,435 | ) |
Change in unrealized appreciation/ depreciation | | | 29,875 | | | | 6,488 | | | | 6,705 | | | | (207,481 | ) |
Purchases | | | 133,472 | | | | 874,726 | | | | 395,073 | | | | 1,978,257 | |
Sales/Paydowns | | | – 0 | – | | | (439,319 | ) | | | – 0 | – | | | (4,757,889 | ) |
Transfers into Level 3 | | | – 0 | – | | | – 0 | – | | | – 0 | – | | | 376,560 | |
Transfers out of Level 3 | | | – 0 | – | | | – 0 | – | | | – 0 | – | | | (2,729,284 | ) |
| | | | | | | | | | | | | | | | |
Balance as of 10/31/17 | | $ | 163,347 | | | $ | 443,168 | | | $ | 438,809 | | | $ | 4,007,730 | + |
| | | | | | | | | | | | | | | | |
Net change in unrealized appreciation/depreciation from investments held as of 10/31/17** | | $ | 29,875 | | | $ | 3,187 | | | $ | 6,705 | | | $ | (207,706 | ) |
| | | | | | | | | | | | | | | | |
| # | The Fund held securities with zero market value at period end. |
| ** | The unrealized appreciation/depreciation is included in net change in unrealized appreciation/depreciation on investments and other financial instruments in the accompanying statement of operations. |
| + | There were de minimis transfers between Level 2 and Level 3 during the reporting period. |
| | |
| abfunds.com | | AB UNCONSTRAINED BOND FUND | 79 |
NOTES TO FINANCIAL STATEMENTS (continued)
The following presents information about significant unobservable inputs related to the Fund’s Level 3 investments at October 31, 2017. Securities priced by third party vendors and by brokers are excluded from the following table:
Quantitative Information about Level 3 Fair Value Measurements
| | | | | | | | | | |
| | | Fair
Value at
10/31/17 | | | Valuation
Technique | | Unobservable
Input | | Range/
Weighted
Average |
Whole Loan Trusts | | $ | 446,822 | | | Market Approach | | Underlying NAV of
the Collateral | | $84.32/ N/A |
Generally, a change in the assumptions used in any input in isolation may be accompanied by a change in another input. Significant changes in any of the unobservable inputs may significantly impact the fair value measurement. Significant increases (decreases) in Underlying NAV of the Collateral would be expected to result in a significantly higher (lower) fair value measurement.
The Adviser established the Committee to oversee the pricing and valuation of all securities held in the Fund. The Committee operates under pricing and valuation policies and procedures established by the Adviser and approved by the Board, including pricing policies which set forth the mechanisms and processes to be employed on a daily basis to implement these policies and procedures. In particular, the pricing policies describe how to determine market quotations for securities and other instruments. The Committee’s responsibilities include: 1) fair value and liquidity determinations (and oversight of any third parties to whom any responsibility for fair value and liquidity determinations is delegated), and 2) regular monitoring of the Adviser’s pricing and valuation policies and procedures and modification or enhancement of these policies and procedures (or recommendation of the modification of these policies and procedures) as the Committee believes appropriate.
The Committee is also responsible for monitoring the implementation of the pricing policies by the Adviser’s Pricing Group (the “Pricing Group”) and any third party which performs certain pricing functions in accordance with the pricing policies. The Pricing Group is responsible for the oversight of the third party on a day-to-day basis. The Committee and the Pricing Group perform a series of activities to provide reasonable assurance of the accuracy of prices including: 1) periodic vendor due diligence meetings, review of methodologies, new developments and process at vendors, 2) daily comparison of security valuation versus prior day for all securities that exceeded established thresholds, and 3) daily review of unpriced, stale, and variance reports with exceptions reviewed by senior management and the Committee.
| | |
| 80 | AB UNCONSTRAINED BOND FUND | | abfunds.com |
NOTES TO FINANCIAL STATEMENTS (continued)
In addition, several processes outside of the pricing process are used to monitor valuation issues including: 1) performance and performance attribution reports are monitored for anomalous impacts based upon benchmark performance, and 2) portfolio managers review all portfolios for performance and analytics (which are generated using the Adviser’s prices).
3. Currency Translation
Assets and liabilities denominated in foreign currencies and commitments under forward currency exchange contracts are translated into U.S. dollars at the mean of the quoted bid and ask prices of such currencies against the U.S. dollar. Purchases and sales of portfolio securities are translated into U.S. dollars at the rates of exchange prevailing when such securities were acquired or sold. Income and expenses are translated into U.S. dollars at rates of exchange prevailing when accrued.
Net realized gain or loss on foreign currency transactions represents foreign exchange gains and losses from sales and maturities of foreign fixed income investments, holding of foreign currencies, currency gains or losses realized between the trade and settlement dates on foreign investment transactions, and the difference between the amounts of dividends, interest and foreign withholding taxes recorded on the Fund’s books and the U.S. dollar equivalent amounts actually received or paid. Net unrealized currency gains and losses from valuing foreign currency denominated assets and liabilities at period end exchange rates are reflected as a component of net unrealized appreciation and depreciation on foreign currency denominated assets and liabilities.
4. Taxes
It is the Fund’s policy to meet the requirements of the Internal Revenue Code applicable to regulated investment companies and to distribute all of its investment company taxable income and net realized gains, if any, to shareholders. Therefore, no provisions for federal income or excise taxes are required. The Fund may be subject to taxes imposed by countries in which it invests. Such taxes are generally based on income and/or capital gains earned or repatriated. Taxes are accrued and applied to net investment income, net realized gains and net unrealized appreciation/depreciation as such income and/or gains are earned.
In accordance with U.S. GAAP requirements regarding accounting for uncertainties in income taxes, management has analyzed the Fund’s tax positions taken or expected to be taken on federal and state income tax returns for all open tax years (the current and the prior three tax years) and has concluded that no provision for income tax is required in the Fund’s financial statements.
| | |
| abfunds.com | | AB UNCONSTRAINED BOND FUND | 81 |
NOTES TO FINANCIAL STATEMENTS (continued)
5. Investment Income and Investment Transactions
Dividend income (or dividend expense) is recorded on the ex-dividend date or as soon as the Fund is informed of the dividend. Interest income is accrued daily. Investment transactions are accounted for on the date securities are purchased or sold. Investment gains or losses are determined on the identified cost basis. The Fund amortizes premiums and accretes discounts as adjustments to interest income.
6. Class Allocations
All income earned and expenses incurred by the Fund are borne on a pro-rata basis by each settled class of shares, based on the proportionate interest in the Fund represented by the net assets of such class, except for class specific expenses which are allocated to the respective class. Realized and unrealized gains and losses are allocated among the various share classes based on their respective net assets.
7. Dividends and Distributions
Dividends and distributions to shareholders, if any, are recorded on the ex-dividend date. Income dividends and capital gains distributions are determined in accordance with federal tax regulations and may differ from those determined in accordance with U.S. GAAP. To the extent these differences are permanent, such amounts are reclassified within the capital accounts based on their federal tax basis treatment; temporary differences do not require such reclassification.
8. Repurchase Agreements
It is the Fund’s policy that its custodian or designated sub-custodian take control of securities as collateral under repurchase agreements and to determine on a daily basis that the value of such securities is sufficient to cover the value of the repurchase agreements. If the seller defaults and the value of the collateral declines, or if bankruptcy proceedings are commenced with respect to seller of the security, realization of collateral by the Fund may be delayed or limited. As of October 31, 2017, the Fund did not hold repurchase agreements.
NOTE B
Advisory Fee and Other Transactions with Affiliates
Under the terms of the investment advisory agreement, the Fund pays the Adviser an advisory fee at an annual rate of .50% of the first $2.5 billion, .45% of the next $2.5 billion and .40% in excess of $5 billion, of the Fund’s average daily net assets. The fee is accrued daily and paid monthly. The Adviser has agreed to reimburse its fees and bear certain expenses to the extent necessary to limit total operating expenses on an annual basis to .90%, 1.65%, 1.65%, .65%, 1.15%, .90%, .65% and .65% of the daily average net assets for Class A, Class B, Class C, Advisor Class, Class R,
| | |
| 82 | AB UNCONSTRAINED BOND FUND | | abfunds.com |
NOTES TO FINANCIAL STATEMENTS (continued)
Class K, Class I and Class Z shares, respectively. This fee waiver and/or expense reimbursement agreement extends through January 31, 2018 and then may be extended by the Adviser for additional one-year terms. For the year ended October 31, 2017, such reimbursements/waivers amounted to $418,033. Effective January 29, 2016, the Expense Caps were increased from 1.60% to 1.65%, 1.60% to 1.65%, ..60% to .65%, 1.10% to 1.15%, .85% to .90%, .60% to .65% and .60% to .65% of the daily average net assets for Class B, Class C, Advisor Class, Class R, Class K, Class I and Class Z shares, respectively.
For the years ended October 31, 2017 and October 31, 2016 the Adviser reimbursed the Fund $851 and $263,677, respectively, for trading losses incurred due to trade entry errors and overdraft reimbursement.
Pursuant to the investment advisory agreement, the Fund may reimburse the Adviser for certain legal and accounting services provided to the Fund by the Adviser. For the year ended October 31, 2017, the reimbursement for such services amounted to $58,807.
The Fund compensates AllianceBernstein Investor Services, Inc. (“ABIS”), a wholly-owned subsidiary of the Adviser, under a Transfer Agency Agreement for providing personnel and facilities to perform transfer agency services for the Fund. ABIS may make payments to intermediaries that provide omnibus account services, sub-accounting services and/or networking services. Such compensation retained by ABIS amounted to $56,900 for the year ended October 31, 2017.
AllianceBernstein Investments, Inc. (the “Distributor”), a wholly-owned subsidiary of the Adviser, serves as the distributor of the Fund’s shares. The Distributor has advised the Fund that it has retained front-end sales charges of $658 from the sale of Class A shares and received $366, $38 and $319 in contingent deferred sales charges imposed upon redemptions by shareholders of Class A, Class B and Class C shares, respectively, for the year ended October 31, 2017.
The Fund may invest in AB Government Money Market Portfolio (the “Government Money Market Portfolio”) which has a contractual annual advisory fee rate of .20% of the portfolio’s average daily net assets and bears its own expenses. In connection with the investment by the Fund in the Government Money Market Portfolio, the Adviser has contractually agreed to waive its advisory fee from the Fund in an amount equal to the Fund’s pro rata share of the effective advisory fee of Government Money Market Portfolio, as borne indirectly by the Fund as an acquired fund fee and expense. For the year ended October 31, 2017, such waiver amounted to $62,024.
| | |
| abfunds.com | | AB UNCONSTRAINED BOND FUND | 83 |
NOTES TO FINANCIAL STATEMENTS (continued)
A summary of the Fund’s transactions in shares of the AB mutual funds for the year ended October 31, 2017 is as follows:
| | | | | | | | | | | | | | | | | | | | |
| Fund | | Market Value
October 31, 2016
(000) | | | Purchases
at Cost
(000) | | | Sales
Proceeds
(000) | | | Market Value
October 31, 2017
(000) | | | Dividend
Income
(000) | |
Government Money Market Portfolio | | $ | 40,316 | | | $ | 329,955 | | | $ | 360,268 | | | $ | 10,003 | | | $ | 184 | |
Brokerage commissions paid on investment transactions for the year ended October 31, 2017 amounted to $147,246, of which $0 and $0, respectively, was paid to Sanford C. Bernstein & Co., LLC or Sanford C. Bernstein Limited, affiliates of the Adviser.
NOTE C
Distribution Services Agreement
The Fund has adopted a Distribution Services Agreement (the “Agreement”) pursuant to Rule 12b-1 under the Investment Company Act of 1940. Under the Agreement the Fund pays distribution and servicing fees to the Distributor at an annual rate of up to .30% of the Fund’s average daily net assets attributable to Class A shares, 1% of the Fund’s average daily net assets attributable to Class B and Class C shares, .50% of the Fund’s average daily net assets attributable to Class R shares and .25% of the Fund’s average daily net assets attributable to Class K shares. Effective January 29, 2016, payments under the Agreement in respect of Class A shares are limited to an annual rate of .25% of Class A shares’ average daily net assets. There are no distribution and servicing fees on Advisor Class, Class I and Class Z shares. The fees are accrued daily and paid monthly. The Agreement provides that the Distributor will use such payments in their entirety for distribution assistance and promotional activities. Since the commencement of the Fund’s operations, the Distributor has incurred expenses in excess of the distribution costs reimbursed by the Fund in the amounts of $8,332,798, $2,166,445, $43,730 and $13,172 for Class B, Class C, Class R and Class K shares, respectively. While such costs may be recovered from the Fund in future periods so long as the Agreement is in effect, the rate of the distribution and servicing fees payable under the Agreement may not be increased without a shareholder vote. In accordance with the Agreement, there is no provision for recovery of unreimbursed distribution costs incurred by the Distributor beyond the current fiscal year for Class A shares. The Agreement also provides that the Adviser may use its own resources to finance the distribution of the Fund’s shares.
| | |
| 84 | AB UNCONSTRAINED BOND FUND | | abfunds.com |
NOTES TO FINANCIAL STATEMENTS (continued)
NOTE D
Investment Transactions
Purchases and sales of investment securities (excluding short-term investments) for the year ended October 31, 2017 were as follows:
| | | | | | | | |
| | | Purchases | | | Sales | |
Investment securities (excluding U.S. government securities) | | $ | 113,831,116 | | | $ | 160,113,010 | |
U.S. government securities | | | 17,610,679 | | | | 2,801,863 | |
The cost of investments for federal income tax purposes, gross unrealized appreciation and unrealized depreciation are as follows:
| | | | |
Cost | | $ | 297,983,246 | |
| | | | |
Gross unrealized appreciation | | $ | 26,381,606 | |
Gross unrealized depreciation | | | (28,251,103 | ) |
| | | | |
Net unrealized depreciation | | $ | (1,869,497 | ) |
| | | | |
1. Derivative Financial Instruments
The Fund may use derivatives in an effort to earn income and enhance returns, to replace more traditional direct investments, to obtain exposure to otherwise inaccessible markets (collectively, “investment purposes”), or to hedge or adjust the risk profile of its portfolio.
The principal types of derivatives utilized by the Fund, as well as the methods in which they may be used are:
| | • | | Forward Currency Exchange Contracts |
The Fund may enter into forward currency exchange contracts in order to hedge its exposure to changes in foreign currency exchange rates on its foreign portfolio holdings, to hedge certain firm purchase and sales commitments denominated in foreign currencies and for non-hedging purposes as a means of making direct investments in foreign currencies, as described below under “Currency Transactions”.
A forward currency exchange contract is a commitment to purchase or sell a foreign currency at a future date at a negotiated forward rate. The gain or loss arising from the difference between the original contract and the closing of such contract would be included in net realized gain or loss on forward currency exchange contracts. Fluctuations in the value of open forward currency exchange contracts are recorded for financial reporting purposes as unrealized appreciation and/or depreciation by the Fund. Risks may arise from the potential inability of a counterparty to meet the terms of a contract and from unanticipated movements in the value of a foreign currency relative to the U.S. dollar.
| | |
| abfunds.com | | AB UNCONSTRAINED BOND FUND | 85 |
NOTES TO FINANCIAL STATEMENTS (continued)
During the year ended October 31, 2017, the Fund held forward currency exchange contracts for hedging and non-hedging purposes.
The Fund may buy or sell futures for investment purposes or for the purpose of hedging its portfolio against adverse effects of potential movements in the market. The Fund bears the market risk that arises from changes in the value of these instruments and the imperfect correlation between movements in the price of the futures and movements in the price of the assets, reference rates or indices which they are designed to track. Among other things, the Fund may purchase or sell futures for foreign currencies or options thereon for non-hedging purposes as a means of making direct investment in foreign currencies, as described below under “Currency Transactions”.
At the time the Fund enters into a future, the Fund deposits and maintains as collateral an initial margin with the broker, as required by the exchange on which the transaction is effected. Such amount is shown as cash collateral due from broker on the statement of assets and liabilities. Pursuant to the contract, the Fund agrees to receive from or pay to the broker an amount of cash equal to the daily fluctuation in the value of the contract. Such receipts or payments are known as variation margin and are recorded by the Fund as unrealized gains or losses. Risks may arise from the potential inability of a counter party to meet the terms of the contract. The credit/counterparty risk for exchange-traded futures is generally less than privately negotiated futures, since the clearinghouse, which is the issuer or counterparty to each exchange-traded future, has robust risk mitigation standards including the requirement to provide initial and variation margin. When the contract is closed, the Fund records a realized gain or loss equal to the difference between the value of the contract at the time it was opened and the time it was closed.
Use of long futures subjects the Fund to risk of loss in excess of the amounts shown on the statement of assets and liabilities, up to the notional value of the futures. Use of short futures subjects the Fund to unlimited risk of loss. Under some circumstances, futures exchanges may establish daily limits on the amount that the price of a future can vary from the previous day’s settlement price, which could effectively prevent liquidation of unfavorable positions.
During the year ended October 31, 2017, the Fund held futures for hedging and non-hedging purposes.
For hedging and investment purposes, the Fund may purchase and write (sell) put and call options on U.S. and foreign securities,
| | |
| 86 | AB UNCONSTRAINED BOND FUND | | abfunds.com |
NOTES TO FINANCIAL STATEMENTS (continued)
including government securities, and foreign currencies that are traded on U.S. and foreign securities exchanges and over-the-counter markets. Among other things, the Fund may use options transactions for non-hedging purposes as a means of making direct investments in foreign currencies, as described below under “Currency Transactions” and may use options strategies involving the purchase and/or writing of various combinations of call and/or put options, for hedging and investment purposes.
The risk associated with purchasing an option is that the Fund pays a premium whether or not the option is exercised. Additionally, the Fund bears the risk of loss of the premium and change in market value should the counterparty not perform under the contract. If a put or call option purchased by the Fund were permitted to expire without being sold or exercised, its premium would represent a loss to the Fund. Put and call options purchased are accounted for in the same manner as portfolio securities. The cost of securities acquired through the exercise of call options is increased by premiums paid. The proceeds from securities sold through the exercise of put options are decreased by the premiums paid.
When the Fund writes an option, the premium received by the Fund is recorded as a liability and is subsequently adjusted to the current market value of the option written. At October 31, 2017, the maximum payment for written put options amounted to $17,322,286. In certain circumstances maximum payout amounts may be partially offset by recovery values of the respective referenced assets and upfront premium received upon entering into the contract. Premiums received from written options which expire unexercised are recorded by the Fund on the expiration date as realized gains from options written. The difference between the premium received and the amount paid on effecting a closing purchase transaction, including brokerage commissions, is also treated as a realized gain, or if the premium received is less than the amount paid for the closing purchase transaction, as a realized loss. If a call option is exercised, the premium received is added to the proceeds from the sale of the underlying security or currency in determining whether the Fund has realized a gain or loss. If a put option is exercised, the premium received reduces the cost basis of the security or currency purchased by the Fund. In writing an option, the Fund bears the market risk of an unfavorable change in the price of the security or currency underlying the written option. Exercise of an option written by the Fund could result in the Fund selling or buying a security or currency at a price different from the current market value.
| | |
| abfunds.com | | AB UNCONSTRAINED BOND FUND | 87 |
NOTES TO FINANCIAL STATEMENTS (continued)
The Fund may also invest in options on swaps, also called “swaptions”. A swaption is an option that gives the buyer the right, but not the obligation, to enter into a swap on a future date in exchange for paying a market-based “premium”. A receiver swaption gives the owner the right to receive the total return of a specified asset, reference rate, or index. A payer swaption gives the owner the right to pay the total return of a specified asset, reference rate, or index. Swaptions also include options that allow an existing swap to be terminated or extended by one of the counterparties.
During the year ended October 31, 2017, the Fund held purchased options for hedging and non-hedging purposes.
During the year ended October 31, 2017, the Fund held written options for hedging and non-hedging purposes.
During the year ended October 31, 2017, the Fund held purchased swaptions for hedging and non-hedging purposes.
During the year ended October 31, 2017, the Fund held written swaptions for hedging and non-hedging purposes.
The Fund may enter into swaps to hedge its exposure to interest rates, credit risk, or currencies. The Fund may also enter into swaps for non-hedging purposes as a means of gaining market exposures including by making direct investments in foreign currencies, as described below under “Currency Transactions” or in order to take a “long” or “short” position with respect to an underlying referenced asset described below under “Total Return Swaps”. A swap is an agreement that obligates two parties to exchange a series of cash flows at specified intervals based upon or calculated by reference to changes in specified prices or rates for a specified amount of an underlying asset. The payment flows are usually netted against each other, with the difference being paid by one party to the other. In addition, collateral may be pledged or received by the Fund in accordance with the terms of the respective swaps to provide value and recourse to the Fund or its counterparties in the event of default, bankruptcy or insolvency by one of the parties to the swap.
Risks may arise as a result of the failure of the counterparty to the swap to comply with the terms of the swap. The loss incurred by the failure of a counterparty is generally limited to the net interim payment to be received by the Fund, and/or the termination value at the end of the contract. Therefore, the Fund considers the creditworthiness of each counterparty to a swap in evaluating potential counterparty risk. This risk is mitigated by having a netting arrangement between the
| | |
| 88 | AB UNCONSTRAINED BOND FUND | | abfunds.com |
NOTES TO FINANCIAL STATEMENTS (continued)
Fund and the counterparty and by the posting of collateral by the counterparty to the Fund to cover the Fund’s exposure to the counterparty. Additionally, risks may arise from unanticipated movements in interest rates or in the value of the underlying securities. The Fund accrues for the interim payments on swaps on a daily basis, with the net amount recorded within unrealized appreciation/depreciation of swaps on the statement of assets and liabilities, where applicable. Once the interim payments are settled in cash, the net amount is recorded as realized gain/(loss) on swaps on the statement of operations, in addition to any realized gain/(loss) recorded upon the termination of swaps. Upfront premiums paid or received are recognized as cost or proceeds on the statement of assets and liabilities and are amortized on a straight line basis over the life of the contract. Amortized upfront premiums are included in net realized gain/(loss) from swaps on the statement of operations. Fluctuations in the value of swaps are recorded as a component of net change in unrealized appreciation/depreciation of swaps on the statement of operations.
Certain standardized swaps, including certain interest rate swaps and credit default swaps, are (or soon will be) subject to mandatory central clearing. Cleared swaps are transacted through futures commission merchants (“FCMs”) that are members of central clearinghouses, with the clearinghouse serving as central counterparty, similar to transactions in futures contracts. Centralized clearing will be required for additional categories of swaps on a phased-in basis based on requirements published by the Securities and Exchange Commission and Commodity Futures Trading Commission.
At the time the Fund enters into a centrally cleared swap, the Fund deposits and maintains as collateral an initial margin with the broker, as required by the clearinghouse on which the transaction is effected. Such amount is shown as cash collateral due from broker on the statement of assets and liabilities. Pursuant to the contract, the Fund agrees to receive from or pay to the broker an amount of cash equal to the daily fluctuation in the value of the contract. Such receipts or payments are known as variation margin and are recorded by the Fund as unrealized gains or losses. Risks may arise from the potential inability of a counterparty to meet the terms of the contract. The credit/counterparty risk for centrally cleared swaps is generally less than non-centrally cleared swaps, since the clearinghouse, which is the issuer or counterparty to each centrally cleared swap, has robust risk mitigation standards, including the requirement to provide initial and variation margin. When the contract is closed, the Fund records a realized gain or loss equal to the difference between the value of the contract at the time it was opened and the time it was closed.
| | |
| abfunds.com | | AB UNCONSTRAINED BOND FUND | 89 |
NOTES TO FINANCIAL STATEMENTS (continued)
Interest Rate Swaps:
The Fund is subject to interest rate risk exposure in the normal course of pursuing its investment objectives. Because the Fund holds fixed rate bonds, the value of these bonds may decrease if interest rates rise. To help hedge against this risk and to maintain its ability to generate income at prevailing market rates, the Fund may enter into interest rate swaps. Interest rate swaps are agreements between two parties to exchange cash flows based on a notional amount. The Fund may elect to pay a fixed rate and receive a floating rate, or, receive a fixed rate and pay a floating rate on a notional amount.
In addition, the Fund may also enter into interest rate swap transactions to preserve a return or spread on a particular investment or portion of its portfolio, or protecting against an increase in the price of securities the Fund anticipates purchasing at a later date. Interest rate swaps involve the exchange by a Fund with another party of their respective commitments to pay or receive interest (e.g., an exchange of floating rate payments for fixed rate payments) computed based on a contractually-based principal (or “notional”) amount. Interest rate swaps are entered into on a net basis (i.e., the two payment streams are netted out, with the Fund receiving or paying, as the case may be, only the net amount of the two payments).
During the year ended October 31, 2017, the Fund held interest rate swaps for hedging and non-hedging purposes.
Credit Default Swaps:
The Fund may enter into credit default swaps, including to manage its exposure to the market or certain sectors of the market, to reduce its risk exposure to defaults by corporate and sovereign issuers held by the Fund, or to create exposure to corporate or sovereign issuers to which it is not otherwise exposed. The Fund may purchase credit protection (“Buy Contract”) or provide credit protection (“Sale Contract”) on the referenced obligation of the credit default swap. During the term of the swap, the Fund receives/(pays) fixed payments from/(to) the respective counterparty, calculated at the agreed upon rate applied to the notional amount. If the Fund is a buyer/(seller) of protection and a credit event occurs, as defined under the terms of the swap, the Fund will either (i) receive from the seller/(pay to the buyer) of protection an amount equal to the notional amount of the swap (the “Maximum Payout Amount”) and deliver/(take delivery of) the referenced obligation or (ii) receive/(pay) a net settlement amount in the form of cash or securities equal to the notional amount of the swap less the recovery value of the referenced obligation.
| | |
| 90 | AB UNCONSTRAINED BOND FUND | | abfunds.com |
NOTES TO FINANCIAL STATEMENTS (continued)
In certain circumstances Maximum Payout Amounts may be partially offset by recovery values of the respective referenced obligations, upfront premium received upon entering into the agreement, or net amounts received from settlement of buy protection credit default swaps entered into by the Fund for the same reference obligation with the same counterparty. As of October 31, 2017, the Fund had Buy Contracts outstanding with respect to the same referenced obligation and counterparty as certain Sale Contracts which may partially offset the Maximum Payout Amount in the amount of $113,453,400.
Credit default swaps may involve greater risks than if the Fund had invested in the referenced obligation directly. Credit default swaps are subject to general market risk, liquidity risk, counterparty risk and credit risk. If the Fund is a buyer of protection and no credit event occurs, it will lose the payments it made to its counterpart. If the Fund is a seller of protection and a credit event occurs, the value of the referenced obligation received by the Fund coupled with the periodic payments previously received may be less than the Maximum Payout Amount it pays to the buyer, resulting in a net loss to the Fund.
Implied credit spreads over Treasuries of comparable maturity utilized in determining the market value of credit default swaps on issuers as of period end are disclosed in the portfolio of investments. The implied spreads serve as an indicator of the current status of the payment/ performance risk and typically reflect the market’s assessment of the likelihood of default by the issuer on the referenced obligation. The implied credit spread of a particular reference entity reflects the cost of buying/selling protection and may include upfront payments required to be made to enter into the agreement. Widening credit spreads typically represent a deterioration of the referenced entity’s credit soundness and greater likelihood of default or other credit event occurring as defined under the terms of the agreement. A credit spread identified as “Defaulted” indicates a credit event has occurred for the referenced entity or obligation.
During the year ended October 31, 2017, the Fund held credit default swaps for hedging and non-hedging purposes.
Total Return Swaps:
The Fund may enter into total return swaps in order to take a “long” or “short” position with respect to an underlying referenced asset. The Fund is subject to market price volatility of the underlying referenced asset. A total return swap involves commitments to pay interest in exchange for a market linked return based on a notional amount. To the extent that the total return of the security, group of securities or index underlying the transaction exceeds or falls short of
| | |
| abfunds.com | | AB UNCONSTRAINED BOND FUND | 91 |
NOTES TO FINANCIAL STATEMENTS (continued)
the offsetting interest obligation, the Fund will receive a payment from or make a payment to the counterparty.
During the year ended October 31, 2017, the Fund held total return swaps for hedging and non-hedging purposes.
Variance Swaps:
The Fund may enter into variance swaps to hedge equity market risk or adjust exposure to the equity markets. Variance swaps are contracts in which two parties agree to exchange cash payments based on the difference between the stated level of variance and the actual variance realized on underlying asset(s) or index(es). Actual “variance” as used here is defined as the sum of the square of the returns on the reference asset(s) or index(es) (which in effect is a measure of its “volatility”) over the length of the contract term. So the parties to a variance swap can be said to exchange actual volatility for a contractually stated rate of volatility.
During the year ended October 31, 2017, the Fund held variance swaps for hedging and non-hedging purposes.
The Fund typically enters into International Swaps and Derivatives Association, Inc. Master Agreements (“ISDA Master Agreement”) with its OTC derivative contract counterparties in order to, among other things, reduce its credit risk to OTC counterparties. ISDA Master Agreements include provisions for general obligations, representations, collateral and events of default or termination. Under an ISDA Master Agreement, the Fund typically may offset with the OTC counterparty certain derivative financial instruments’ payables and/or receivables with collateral held and/or posted and create one single net payment (close-out netting) in the event of default or termination. In the event of a default by an OTC counterparty, the return of collateral with market value in excess of the Fund’s net liability, held by the defaulting party, may be delayed or denied.
The Fund’s ISDA Master Agreements may contain provisions for early termination of OTC derivative transactions in the event the net assets of the Fund decline below specific levels (“net asset contingent features”). If these levels are triggered, the Fund’s OTC counterparty has the right to terminate such transaction and require the Fund to pay or receive a settlement amount in connection with the terminated transaction. For additional details, please refer to netting arrangements by the OTC counterparty table below.
| | |
| 92 | AB UNCONSTRAINED BOND FUND | | abfunds.com |
NOTES TO FINANCIAL STATEMENTS (continued)
During the year ended October 31, 2017, the Fund had entered into the following derivatives:
| | | | | | | | | | | | |
| | | Asset Derivatives | | | Liability Derivatives | |
Derivative Type | | Statement of
Assets and
Liabilities
Location | | Fair Value | | | Statement of
Assets and
Liabilities
Location | | Fair Value | |
Interest rate contracts | | Unrealized appreciation on total return swaps | | $ | 242,956 | | | Unrealized depreciation on interest rate swaps | | $ | 73,470 | |
| | | | |
Interest rate contracts | | Receivable/Payable for variation margin on futures | | | 464,494 | * | | Receivable/Payable for variation margin on futures | | | 903,721 | * |
| | | | |
Interest rate contracts | | Receivable/Payable for variation margin on exchange-traded swaps | | | 5,489,169 | * | | Receivable/Payable for variation margin on exchange-traded swaps | | | 7,427,228 | * |
| | | | |
Interest rate contracts | | | | | | | | Swaptions written, at value | | | 97,004 | |
| | | | |
Foreign exchange contracts | | Unrealized appreciation on forward currency exchange contracts | | | 1,561,227 | | | Unrealized depreciation on forward currency exchange contracts | | | 1,021,927 | |
| | | | |
Foreign exchange contracts | | Investments in securities, at value | | | 53,127 | | | | | | | |
| | | | |
Foreign exchange contracts | | | | | | | | Options written, at value | | | 625,259 | |
| | | | |
Credit contracts | | Unrealized appreciation on credit default swaps | | | 2,334,325 | | | Unrealized depreciation on credit default swaps | | | 5,277,198 | |
| | | | |
Credit contracts | | Receivable/Payable for variation margin on exchange-traded swaps | | | 2,871,587 | * | | Receivable/Payable for variation margin on exchange-traded swaps | | | 3,568,505 | * |
| | | | |
Credit contracts | | | | | | | | Swaptions written, at value | | | 1,119 | |
| | | | |
Equity contracts | | Unrealized appreciation on total return swaps | | | 1,303,858 | | | Unrealized depreciation on total rate swaps | | | 585,573 | |
| | |
| abfunds.com | | AB UNCONSTRAINED BOND FUND | 93 |
NOTES TO FINANCIAL STATEMENTS (continued)
| | | | | | | | | | | | |
| | | Asset Derivatives | | | Liability Derivatives | |
Derivative Type | | Statement of
Assets and
Liabilities
Location | | Fair Value | | | Statement of
Assets and
Liabilities
Location | | Fair Value | |
Equity contracts | | Receivable/Payable for variation margin on futures | | $ | 2,114,357 | * | | Receivable/Payable for variation margin on futures | | $ | 491,478 | * |
| | | | |
Equity contracts | | Investment in securities, at value | | | 124,415 | | | Options written, at value | | | 181,472 | |
| | | | | | | | | | | | |
Total | | | | $ | 16,559,515 | | | | | $ | 20,253,954 | |
| | | | | | | | | | | | |
| * | Only variation margin receivable/payable at period end is reported within the statement of assets and liabilities. This amount reflects cumulative unrealized appreciation/depreciation on exchange-traded futures and swaps as reported in the portfolio of investments. |
| | | | | | | | | | |
Derivative Type | | Location of Gain or (Loss) on
Derivatives Within Statement of
Operations | | Realized Gain
or (Loss) on
Derivatives | | | Change in
Unrealized
Appreciation or
(Depreciation) | |
Interest rate contracts | | Net realized gain/(loss) on swaps; Net change in unrealized appreciation/ depreciation on swaps | | $ | (521,790 | ) | | $ | (1,887,897 | ) |
| | | |
Interest rate contracts | | Net realized gain/(loss) on futures; Net change in unrealized appreciation/ depreciation on futures | | | 2,490,177 | | | | (1,115,471 | ) |
| | | |
Interest rate contracts | | Net realized gain/(loss) on investment transactions; Net change in unrealized appreciation/depreciation on investments | | | 1,577,323 | | | | (592,247 | ) |
| | | |
Interest rate contracts | | Net realized gain/(loss) on options written; Net change in unrealized appreciation/depreciation on options written | | | (129,881 | ) | | | 8,527 | |
| | | |
Interest rate contracts | | Net realized gain/(loss) on swaptions written; Net change in unrealized appreciation/depreciation on swaptions written | | | 1,340,405 | | | | 59,825 | |
| | |
| 94 | AB UNCONSTRAINED BOND FUND | | abfunds.com |
NOTES TO FINANCIAL STATEMENTS (continued)
| | | | | | | | | | |
Derivative Type | | Location of Gain or (Loss) on
Derivatives Within Statement of
Operations | | Realized Gain
or (Loss) on
Derivatives | | | Change in
Unrealized
Appreciation or
(Depreciation) | |
Foreign exchange contracts | | Net realized gain/(loss) on forward currency exchange contracts; Net change in unrealized appreciation/depreciation on forward currency exchange contracts | | $ | (12,607,837 | ) | | $ | 13,988,749 | |
| | | |
Foreign exchange contracts | | Net realized gain/(loss) on investment transactions; Net change in unrealized appreciation/depreciation on investments | | | (161,836 | ) | | | (96,370 | ) |
| | | |
Foreign exchange contracts | | Net realized gain/(loss) on options written; Net change in unrealized appreciation/depreciation on options written | | | 692,816 | | | | (156,498 | ) |
| | | |
Credit contracts | | Net realized gain/(loss) on investment transactions; Net change in unrealized appreciation/depreciation on investments | | | (591,066 | ) | | | (13,737 | ) |
| | | |
Credit contracts | | Net realized gain/(loss) on swaps; Net change in unrealized appreciation/ depreciation on swaps | | | (3,392,160 | ) | | | (1,176,244 | ) |
| | | |
Credit Contracts | | Net realized gain/(loss) on swaptions written; Net change in unrealized appreciation/depreciation on swaptions written | | | (392,078 | ) | | | 2,291 | |
| | | |
Equity contracts | | Net realized gain/(loss) on swaps; Net change in unrealized appreciation/depreciation on swaps | | | 3,388,060 | | | | 1,254,041 | |
| | |
| abfunds.com | | AB UNCONSTRAINED BOND FUND | 95 |
NOTES TO FINANCIAL STATEMENTS (continued)
| | | | | | | | | | |
Derivative Type | | Location of Gain or (Loss) on
Derivatives Within Statement of
Operations | | Realized Gain
or (Loss) on
Derivatives | | | Change in
Unrealized
Appreciation or
(Depreciation) | |
Equity contracts | | Net realized gain/(loss) on futures; Net change in unrealized appreciation/depreciation on futures | | $ | 2,052,198 | | | $ | 1,323,697 | |
| | | |
Equity contracts | | Net realized gain/(loss) on investment transactions; Net change in unrealized appreciation/depreciation on investment transactions | | | (652,097 | ) | | | (1,567,444 | ) |
| | | |
Equity contracts | | Net realized gain/(loss) on options written; Net change in unrealized appreciation/depreciation on options written | | | 791,796 | | | | 1,175,683 | |
| | | | | | | | | | |
Total | | | | $ | (6,115,970 | ) | | $ | 11,206,905 | |
| | | | | | | | | | |
The following table represents the average monthly volume of the Fund’s derivative transactions during the year ended October 31, 2017:
| | | | |
Centrally Cleared Credit Default Swaps: | | | | |
Average notional amount of buy contracts. | | $ | 266,132,558 | |
Average notional amount of sale contracts | | $ | 240,959,850 | |
Centrally Cleared Interest Rate Swaps: | | | | |
Average notional amount. | | $ | 730,116,974 | |
Credit Default Swaps: | | | | |
Average notional amount of buy contracts. | | $ | 384,980,316 | |
Average notional amount of sale contracts | | $ | 151,877,244 | |
Forward Currency Exchange Contracts: | | | | |
Average principal amount of buy contracts. | | $ | 63,178,876 | |
Average principal amount of sale contracts | | $ | 139,012,814 | |
Futures: | | | | |
Average original value of buy contracts. | | $ | 264,059,165 | |
Average original value of sale contracts | | $ | 181,156,576 | |
Interest Rate Swaps: | | | | |
Average notional amount | | $ | 1,600,000 | |
Total Return Swaps: | | | | |
Average notional amount | | $ | 34,068,283 | |
Variance Swaps: | | | | |
Average notional amount | | $ | 1,135,409 | (a) |
Options Written: | | | | |
Average notional amount | | $ | 20,291,558 | |
| | |
| 96 | AB UNCONSTRAINED BOND FUND | | abfunds.com |
NOTES TO FINANCIAL STATEMENTS (continued)
| | | | |
Purchased Options: | | | | |
Average cost. | | $ | 1,353,964 | |
Purchased Swaptions: | | | | |
Average cost. | | $ | 633,693 | (b) |
Swaptions Written: | | | | |
Average notional amount | | $ | 110,636,116 | |
| (a) | Positions were open three months during the reporting period. |
| (b) | Positions were open eleven months during the reporting period. |
For financial reporting purposes, the Fund does not offset derivative assets and derivative liabilities that are subject to netting arrangements in the statement of assets and liabilities.
All OTC derivatives held at year end were subject to netting arrangements. The following table presents the Fund’s derivative assets and liabilities by OTC counterparty net of amounts available for offset under ISDA Master Agreements and net of the related collateral received/pledged by the Fund as of October 31, 2017. Exchange-traded derivatives are not subject to netting arrangements and as such are excluded from the table.
| | | | | | | | | | | | | | | | | | | | |
Counterparty | | Derivative
Assets
Subject
to a MA | | | Derivatives
Available
for Offset | | | Cash
Collateral
Received* | | | Security
Collateral
Received* | | | Net
Amount of
Derivatives
Assets | |
OTC Derivatives: | | | | | | | | | | | | | | | | | | | | |
Australia & New Zealand Bank Group Ltd. | | $ | 83,042 | | | $ | – 0 | – | | $ | – 0 | – | | $ | – 0 | – | | $ | 83,042 | |
Bank of America, NA. | | | 714,610 | | | | (331,051 | ) | | | (250,000 | ) | | | – 0 | – | | | 133,559 | |
Barclays Bank PLC | | | 1,288,327 | | | | (469,230 | ) | | | (790,000 | ) | | | – 0 | – | | | 29,097 | |
Brown Brothers Harriman & Co. | | | 306,249 | | | | (34,349 | ) | | | – 0 | – | | | – 0 | – | | | 271,900 | |
Citibank, NA. | | | 1,537,633 | | | | (1,537,633 | ) | | | – 0 | – | | | – 0 | – | | | – 0 | – |
Credit Suisse International. | | | 193,549 | | | | (193,549 | ) | | | – 0 | – | | | – 0 | – | | | – 0 | – |
Deutsche Bank AG | | | 55,934 | | | | (55,934 | ) | | | – 0 | – | | | – 0 | – | | | – 0 | – |
Goldman Sachs Bank USA/Goldman Sachs International | | | 285,942 | | | | (285,942 | ) | | | – 0 | – | | | – 0 | – | | | – 0 | – |
HSBC Bank USA. | | | 327,844 | | | | (231,649 | ) | | | – 0 | – | | | – 0 | – | | | 96,195 | |
JPMorgan Chase Bank, NA. | | | 718,698 | | | | (718,698 | ) | | | – 0 | – | | | – 0 | – | | | – 0 | – |
Morgan Stanley Capital Services LLC. | | | 67,665 | | | | (67,665 | ) | | | – 0 | – | | | – 0 | – | | | – 0 | – |
Royal Bank of Scotland PLC | | | 22,508 | | | | (22,508 | ) | | | – 0 | – | | | – 0 | – | | | – 0 | – |
Standard Chartered Bank. | | | 248,299 | | | | (16,330 | ) | | | – 0 | – | | | – 0 | – | | | 231,969 | |
| | | | | | | | | | | | | | | | | | | | |
Total | | $ | 5,850,300 | | | $ | (3,964,538 | ) | | $ | (1,040,000 | ) | | $ | – 0 | – | | $ | 845,762 | ^ |
| | | | | | | | | | | | | | | | | | | | |
| | |
| abfunds.com | | AB UNCONSTRAINED BOND FUND | 97 |
NOTES TO FINANCIAL STATEMENTS (continued)
| | | | | | | | | | | | | | | | | | | | |
Counterparty | | Derivative
Liabilities
Subject
to a MA | | | Derivatives
Available
for Offset | | | Cash
Collateral
Pledged* | | | Security
Collateral
Pledged* | | | Net
Amount of
Derivatives
Liabilities | |
OTC Derivatives: | | | | | | | | | | | | | | | | | | | | |
Bank of America, NA. | | $ | 331,051 | | | $ | (331,051 | ) | | $ | – 0 | – | | $ | – 0 | – | | $ | – 0 | – |
Barclays Bank PLC | | | 469,230 | | | | (469,230 | ) | | | – 0 | – | | | – 0 | – | | | – 0 | – |
BNP Paribas SA | | | 1,076,305 | | | | – 0 | – | | | – 0 | – | | | (1,076,305 | ) | | | – 0 | – |
Brown Brothers Harriman & Co. | | | 34,349 | | | | (34,349 | ) | | | – 0 | – | | | – 0 | – | | | – 0 | – |
Citibank, NA. | | | 1,904,021 | | | | (1,537,633 | ) | | | – 0 | – | | | (210,899 | ) | | | 155,489 | |
Credit Suisse International. | | | 1,969,804 | | | | (193,549 | ) | | | – 0 | – | | | (1,514,600 | ) | | | 261,655 | |
Deutsche Bank AG | | | 2,290,040 | | | | (55,934 | ) | | | – 0 | – | | | (2,234,106 | ) | | | – 0 | – |
Goldman Sachs Bank USA/Goldman Sachs International | | | 1,205,566 | | | | (285,942 | ) | | | – 0 | – | | | (638,064 | ) | | | 281,560 | |
HSBC Bank USA. | | | 231,649 | | | | (231,649 | ) | | | – 0 | – | | | – 0 | – | | | – 0 | – |
JPMorgan Chase Bank, NA. | | | 839,511 | | | | (718,698 | ) | | | – 0 | – | | | (120,813 | ) | | | – 0 | – |
Morgan Stanley Capital Services LLC | | | 1,278,256 | | | | (67,665 | ) | | | – 0 | – | | | (1,176,046 | ) | | | 34,545 | |
Royal Bank of Scotland PLC. | | | 57,570 | | | | (22,508 | ) | | | – 0 | – | | | – 0 | – | | | 35,062 | |
Standard Chartered Bank | | | 16,330 | | | | (16,330 | ) | | | – 0 | – | | | – 0 | – | | | – 0 | – |
| | | | | | | | | | | | | | | | | | | | |
Total | | $ | 11,703,682 | | | $ | (3,964,538 | ) | | $ | – 0 | – | | $ | (6,970,833 | ) | | $ | 768,311 | ^ |
| | | | | | | | | | | | | | | | | | | | |
| * | The actual collateral received/pledged may be more than the amount reported due to overcollateralization. |
| ^ | Net amount represents the net receivable/payable that would be due from/to the counterparty in the event of default or termination. The net amount from OTC financial derivative instruments can only be netted across transactions governed under the same master agreement with the same counterparty. |
2. Currency Transactions
The Fund may invest in non-U.S. Dollar-denominated securities on a currency hedged or unhedged basis. The Fund may seek investment opportunities by taking long or short positions in currencies through the use of currency-related derivatives, including forward currency exchange contracts, futures and options on futures, swaps, and other options. The Fund may enter into transactions for investment opportunities when it anticipates that a foreign currency will appreciate or depreciate in value but securities denominated in that currency are not held by the Fund and do not present attractive investment opportunities. Such transactions may also be used when the Adviser believes that it may be more efficient than a direct investment in a foreign currency-denominated security. The Fund may also conduct currency exchange contracts on a spot basis (i.e., for cash at the spot rate prevailing in the currency exchange market for buying or selling currencies).
3. Reverse Repurchase Agreements
Under a reverse repurchase agreement, the Fund sells securities and agrees to repurchase them at a mutually agreed upon date and price. At
| | |
| 98 | AB UNCONSTRAINED BOND FUND | | abfunds.com |
NOTES TO FINANCIAL STATEMENTS (continued)
the time the Fund enters into a reverse repurchase agreement, it will establish a segregated account with the custodian containing liquid assets having at least equal to the repurchase price. For the year ended October 31, 2017, the Fund had no transactions in reverse repurchase agreements.
4. Loan Participations and Assignments
The Fund may invest in direct debt instruments which are interests in amounts owed to lenders or lending syndicates by corporate, governmental, or other borrowers, either in the form of participations at the time the loan is originated (“Participations”) or by buying an interest in the loan in the secondary market from a financial institution or institutional investor (“Assignments”). A loan is often administered by a bank or other financial institution (the “Lender”) that acts as agent for all holders. The agent administers the terms of the loan as specified in the loan agreement. When investing in Participations, the Fund generally has no right to enforce compliance with the terms of the loan agreement with the borrower. In addition, when investing in Participations, the Fund has the right to receive payments of principal, interest and any fees to which it is entitled only from the Lender and only upon receipt of payments by the Lender from the borrower. As a result, the Fund may be subject to the credit risk of both the borrower and the Lender. When the Fund purchases Assignments from Lenders, it will typically acquire direct rights against the borrower on the loan. These loans may include participations in “bridge loans”, which are loans taken out by borrowers for a short period (typically less than six months) pending arrangement of more permanent financing through, for example, the issuance of bonds, frequently high-yield bonds issued for the purpose of acquisitions. The Fund may also participate in unfunded loan commitments, which are contractual obligations for investing in future Participations, and may receive a commitment fee based on the amount of the commitment. Under these arrangements, the Fund may receive a fixed rate commitment fee and, if and to the extent the borrower borrows under the facility, the Fund may receive an additional funding fee.
Unfunded loan commitments and funded loans are marked to market daily.
As of October 31, 2017, the Fund had no unfunded loan commitments outstanding or bridge loan commitments outstanding.
During the year ended October 31, 2017, the Fund received no commitment fees or additional funding fees.
| | |
| abfunds.com | | AB UNCONSTRAINED BOND FUND | 99 |
NOTES TO FINANCIAL STATEMENTS (continued)
NOTE E
Capital Stock
Each class consists of 3,000,000,000 authorized shares. Transactions in capital shares for each class were as follows:
| | | | | | | | | | | | | | | | | | | | | | | | |
| | | | | | | | | | | | | | | | | | | | | | | | |
| | | Shares | | | | | | Amount | | | | |
| | | Year Ended
October 31, 2017 | | | Year Ended
October 31, 2016 | | | | | | Year Ended
October 31, 2017 | | | Year Ended
October 31, 2016 | | | | |
| | | | | | | | |
| Class A | | | | | | | | | | | | | | | | | | | | | | | | |
Shares sold | | | 1,220,423 | | | | 713,605 | | | | | | | $ | 10,594,167 | | | $ | 5,994,844 | | | | | |
| | | | | |
Shares issued in reinvestment of dividends | | | 101,813 | | | | 65,862 | | | | | | | | 869,293 | | | | 555,658 | | | | | |
| | | | | |
Shares converted from Class B | | | 6,619 | | | | 17,148 | | | | | | | | 57,585 | | | | 143,731 | | | | | |
| | | | | |
Shares converted from Class C | | | 193,998 | | | | – 0 | – | | | | | | | 1,693,663 | | | | – 0 | – | | | | |
| | | | | |
Shares redeemed | | | (2,128,262 | ) | | | (1,936,836 | ) | | | | | | | (18,468,316 | ) | | | (16,296,831 | ) | | | | |
| | | | | |
Net decrease | | | (605,409 | ) | | | (1,140,221 | ) | | | | | | $ | (5,253,608 | ) | | $ | (9,602,598 | ) | | | | |
| | | | | |
| | | | | | | | | | | | | | | | | | | | | | | | |
| Class B | | | | | | | | | | | | | | | | | | | | | | | | |
Shares sold | | | 1,685 | | | | 1,089 | | | | | | | $ | 14,571 | | | $ | 9,131 | | | | | |
| | | | | |
Shares issued in reinvestment of dividends | | | 580 | | | | 381 | | | | | | | | 4,933 | | | | 3,214 | | | | | |
| | | | | |
Shares converted to Class A | | | (6,609 | ) | | | (17,128 | ) | | | | | | | (57,585 | ) | | | (143,731 | ) | | | | |
| | | | | |
Shares redeemed | | | (5,209 | ) | | | (9,494 | ) | | | | | | | (45,154 | ) | | | (78,726 | ) | | | | |
| | | | | |
Net decrease | | | (9,553 | ) | | | (25,152 | ) | | | | | | $ | (83,235 | ) | | $ | (210,112 | ) | | | | |
| | | | | |
| | | | | | | | | | | | | | | | | | | | | | | | |
| Class C | | | | | | | | | | | | | | | | | | | | | | | | |
Shares sold | | | 207,622 | | | | 278,562 | | | | | | | $ | 1,781,562 | | | $ | 2,330,559 | | | | | |
| | | | | |
Shares issued in reinvestment of dividends | | | 45,573 | | | | 25,515 | | | | | | | | 386,845 | | | | 215,331 | | | | | |
| | | | | |
Shares converted to Class A | | | (193,998 | ) | | | – 0 | – | | | | | | | (1,693,663 | ) | | | – 0 | – | | | | |
| | | | | |
Shares redeemed | | | (924,467 | ) | | | (921,321 | ) | | | | | | | (7,995,906 | ) | | | (7,760,594 | ) | | | | |
| | | | | |
Net decrease | | | (865,270 | ) | | | (617,244 | ) | | | | | | $ | (7,521,162 | ) | | $ | (5,214,704 | ) | | | | |
| | | | | |
| | | | | | | | | | | | | | | | | | | | | | | | |
| Advisor Class | | | | | | | | | | | | | | | | | | | | | | | | |
Shares sold | | | 12,428,633 | | | | 7,453,627 | | | | | | | $ | 107,644,192 | | | $ | 62,641,185 | | | | | |
| | | | | |
Shares issued in reinvestment of dividends | | | 545,245 | | | | 357,345 | | | | | | | | 4,662,441 | | | | 3,009,574 | | | | | |
| | | | | |
Shares redeemed | | | (9,259,079 | ) | | | (14,979,238 | ) | | | | | | | (79,966,458 | ) | | | (126,107,577 | ) | | | | |
| | | | | |
Net increase (decrease) | | | 3,714,799 | | | | (7,168,266 | ) | | | | | | $ | 32,340,175 | | | $ | (60,456,818 | ) | | | | |
| | | | | |
| | |
| 100 | AB UNCONSTRAINED BOND FUND | | abfunds.com |
NOTES TO FINANCIAL STATEMENTS (continued)
| | | | | | | | | | | | | | | | | | | | | | | | |
| | | | | | | | | | | | | | | | | | | | | | | | |
| | | Shares | | | | | | Amount | | | | |
| | | Year Ended
October 31, 2017 | | | Year Ended
October 31, 2016 | | | | | | Year Ended
October 31, 2017 | | | Year Ended
October 31, 2016 | | | | |
| | | | | | | | |
| Class R | | | | | | | | | | | | | | | | | | | | | | | | |
Shares sold | | | 93,737 | | | | 21,604 | | | | | | | $ | 818,994 | | | $ | 182,043 | | | | | |
| | | | | |
Shares issued in reinvestment of dividends | | | 3,277 | | | | 1,687 | | | | | | | | 27,979 | | | | 14,229 | | | | | |
| | | | | |
Shares redeemed | | | (44,485 | ) | | | (50,693 | ) | | | | | | | (388,175 | ) | | | (425,697 | ) | | | | |
| | | | | |
Net increase (decrease) | | | 52,529 | | | | (27,402 | ) | | | | | | $ | 458,798 | | | $ | (229,425 | ) | | | | |
| | | | | |
| | | | | | | | | | | | | | | | | | | | | | | | |
| Class K | | | | | | | | | | | | | | | | | | | | | | | | |
Shares sold | | | 2,846 | | | | 3,861 | | | | | | | $ | 24,712 | | | $ | 32,720 | | | | | |
| | | | | |
Shares issued in reinvestment of dividends | | | 866 | | | | 435 | | | | | | | | 7,420 | | | | 3,679 | | | | | |
| | | | | |
Shares redeemed | | | (917 | ) | | | (1 | ) | | | | | | | (8,055 | ) | | | (8 | ) | | | | |
| | | | | |
Net increase | | | 2,795 | | | | 4,295 | | | | | | | $ | 24,077 | | | $ | 36,391 | | | | | |
| | | | | |
| | | | | | | | | | | | | | | | | | | | | | | | |
| Class I | | | | | | | | | | | | | | | | | | | | | | | | |
Shares sold | | | 44,474 | | | | 2,544 | | | | | | | $ | 381,770 | | | $ | 21,384 | | | | | |
| | | | | |
Shares issued in reinvestment of dividends | | | 197,941 | | | | 117,082 | | | | | | | | 1,687,484 | | | | 985,717 | | | | | |
| | | | | |
Shares redeemed | | | (18,197 | ) | | | (43,942 | ) | | | | | | | (156,984 | ) | | | (365,637 | ) | | | | |
| | | | | |
Net increase | | | 224,218 | | | | 75,684 | | | | | | | $ | 1,912,270 | | | $ | 641,464 | | | | | |
| | | | | |
| | | | | | | | | | | | | | | | | | | | | | | | |
| Class Z | | | | | | | | | | | | | | | | | | | | | | | | |
Shares sold | | | 326,742 | | | | 1,281,581 | | | | | | | $ | 2,828,259 | | | $ | 10,892,012 | | | | | |
| | | | | |
Shares issued in reinvestment of dividends | | | 41,135 | | | | 13,235 | | | | | | | | 350,763 | | | | 111,744 | | | | | |
| | | | | |
Shares redeemed | | | (185,498 | ) | | | (419,268 | ) | | | | | | | (1,599,541 | ) | | | (3,510,745 | ) | | | | |
| | | | | |
Net increase | | | 182,379 | | | | 875,548 | | | | | | | $ | 1,579,481 | | | $ | 7,493,011 | | | | | |
| | | | | |
NOTE F
Risks Involved in Investing in the Fund
Interest Rate Risk and Credit Risk—Interest rate risk is the risk that changes in interest rates will affect the value of the Fund’s investments in fixed-income debt securities such as bonds or notes. Increases in interest rates may cause the value of the Fund’s investments to decline. Credit risk is the risk that the issuer or guarantor of a debt security, or the counterparty to a derivative contract, will be unable or unwilling to make timely principal and/or interest payments, or to otherwise honor its obligations. The degree of risk for a particular security may be reflected in its credit rating. Credit risk is greater for medium quality and lower-rated securities.
| | |
| abfunds.com | | AB UNCONSTRAINED BOND FUND | 101 |
NOTES TO FINANCIAL STATEMENTS (continued)
Lower-rated debt securities and similar unrated securities (commonly known as “junk bonds”) have speculative elements or are predominantly speculative risks.
Below Investment Grade Securities Risk—Investments in fixed-income securities with lower ratings (commonly known as “junk bonds”) tend to have a higher probability that an issuer will default or fail to meet its payment obligations. These securities may be subject to greater price volatility due to such factors as specific corporate developments, negative perceptions of the junk bond market generally and less secondary market liquidity.
Duration Risk—Duration is a measure that relates the expected price volatility of a fixed-income security to changes in interest rates. The duration of a fixed-income security may be shorter than or equal to full maturity of a fixed-income security. Fixed-income securities with longer durations have more risk and will decrease in price as interest rates rise. For example, a fixed-income security with a duration of three years will decrease in value by approximately 3% if interest rates increase by 1%.
Inflation Risk—This is the risk that the value of assets or income from investments will be less in the future as inflation decreases the value of money. As inflation increases, the value of the Fund’s assets can decline as can the value of the Fund’s distributions. This risk is significantly greater if the Fund invests a significant portion of its assets in fixed-income securities with longer maturities.
Foreign (Non-U.S.) Risk—Investments in securities of non-U.S. issuers may involve more risk than those of U.S. issuers. These securities may fluctuate more widely in price and may be less liquid due to adverse market, economic, political, regulatory or other factors.
Emerging Market Risk—Investments in emerging market countries may have more risk because the markets are less developed and less liquid, and because these investments may be subject to increased economic, political, regulatory or other uncertainties.
Currency Risk—Fluctuations in currency exchange rates may negatively affect the value of the Fund’s investments or reduce its returns.
Leverage Risk—When the Fund borrows money or otherwise leverages its investments, its performance may be volatile because leverage tends to exaggerate the effect of any increase or decrease in the value of the Fund’s investments. The Fund may create leverage through the use of reverse repurchase arrangements, forward currency exchange contracts, forward commitments, dollar rolls or futures or by borrowing money. The use of other types of derivative instruments by the Fund, such as options
| | |
| 102 | AB UNCONSTRAINED BOND FUND | | abfunds.com |
NOTES TO FINANCIAL STATEMENTS (continued)
and swaps, may also result in a form of leverage. Leverage may result in higher returns to the Fund than if the Fund were not leveraged, but may also adversely affect returns, particularly if the market is declining.
Prepayment Risk—The value of mortgage-related or asset-backed securities may be particularly sensitive to changes in prevailing interest rates. Early payments of principal on some mortgage-related securities may occur during periods of falling mortgage interest rates and expose the Fund to a lower rate of return upon reinvestment of principal. Early payments associated with mortgage-related securities cause these securities to experience significantly greater price and yield volatility than is experienced by traditional fixed income securities. During periods of rising interest rates, a reduction in prepayments may increase the effective life of mortgage related securities, subjecting them to greater risk of decline in market value in response to rising interest rates. If the life of a mortgage-related security is inaccurately predicted, the Fund may not be able to realize the rate of return it expected.
Derivatives Risk—The Fund may enter into derivative transactions such as forwards, options, futures and swaps. Derivatives may be illiquid, difficult to price, and leveraged so that small changes may produce disproportionate losses for the Fund, and subject to counterparty risk to a greater degree than more traditional investments. Derivatives may result in significant losses, including losses that are far greater than the value of the derivatives reflected on the statement of assets and liabilities.
Liquidity Risk—Liquidity risk occurs when certain investments become difficult to purchase or sell. Difficulty in selling less liquid securities may result in sales at disadvantageous prices affecting the value of your investment in the Fund. Causes of liquidity risk may include low trading volumes, large positions and heavy redemptions of Fund shares. Over recent years liquidity risk has also increased because the capacity of dealers in the secondary market for fixed-income securities to make markets in these securities has decreased, even as the overall bond market has grown significantly, due to, among other things, structural changes, additional regulatory requirements and capital and risk restraints that have led to reduced inventories. Liquidity risk may be higher in a rising interest rate environment, when the value and liquidity of fixed-income securities generally decline.
Indemnification Risk—In the ordinary course of business, the Fund enters into contracts that contain a variety of indemnifications. The Fund’s maximum exposure under these arrangements is unknown. However, the Fund has not had prior claims or losses pursuant to these indemnification
| | |
| abfunds.com | | AB UNCONSTRAINED BOND FUND | 103 |
NOTES TO FINANCIAL STATEMENTS (continued)
provisions and expects the risk of loss thereunder to be remote. Therefore, the Fund has not accrued any liability in connection with these indemnification provisions.
NOTE G
Joint Credit Facility
A number of open-end mutual funds managed by the Adviser, including the Fund, participate in a $280 million revolving credit facility (the “Facility”) intended to provide short-term financing if necessary, subject to certain restrictions in connection with abnormal redemption activity. Commitment fees related to the Facility are paid by the participating funds and are included in miscellaneous expenses in the statement of operations. The Fund did not utilize the Facility during the year ended October 31, 2017.
NOTE H
Distributions to Shareholders
The tax character of distributions paid during the fiscal years ended October 31, 2017 and October 31, 2016 were as follows:
| | | | | | | | |
| | | 2017 | | | 2016 | |
Distributions paid from: | | | | | | | | |
Ordinary income | | $ | 9,608,752 | | | $ | 6,608,660 | |
| | | | | | | | |
Distributions paid | | | 9,608,752 | | | | 6,608,660 | |
Tax return of capital | | | 398,666 | | | | – 0 | – |
Total distributions paid | | $ | 10,007,418 | | | $ | 6,608,660 | |
| | | | | | | | |
As of October 31, 2017, the components of accumulated earnings/(deficit) on a tax basis were as follows:
| | | | |
Accumulated capital and other losses | | $ | (3,829,042 | )(a) |
Unrealized appreciation/(depreciation) | | | (1,870,637 | )(b) |
| | | | |
Total accumulated earnings/(deficit) | | $ | (5,699,679 | )(c) |
| | | | |
| (a) | As of October 31, 2017, the Fund had a net capital loss carryforward of $3,548,673. The Fund also had $1,177,357 of capital loss carryforwards expire during the fiscal year. As of October 31, 2017, the cumulative deferred loss on straddles was $280,369. |
| (b) | The differences between book-basis and tax-basis unrealized appreciation/(depreciation) are attributable primarily to the tax deferral of losses on wash sales, the tax treatment of swaps, the difference between book and tax amortization methods for premium, and the recognition for tax purposes of unrealized gains/losses on certain derivative instruments. |
| (c) | The differences between book-basis and tax-basis components of accumulated earnings/(deficit) are attributable primarily to dividends payable, and the tax treatment of defaulted securities. |
For tax purposes, net capital losses may be carried over to offset future capital gains, if any. Funds are permitted to carry forward capital losses incurred in taxable years beginning after December 22, 2010 for an indefinite period. These post-December 22, 2010 capital losses must be utilized prior
| | |
| 104 | AB UNCONSTRAINED BOND FUND | | abfunds.com |
NOTES TO FINANCIAL STATEMENTS (continued)
to the earlier capital losses, which are subject to expiration. Post-December 22, 2010 capital loss carryforwards will retain their character as either short-term or long-term capital losses rather than being considered short-term as under previous regulation.
As of October 31, 2017 the Fund had a net capital loss carryforward of $3,548,673, which will expire as follows:
| | | | |
Short-Term Amount | | Long-Term Amount | | Expiration |
| $ 1,053,051 | | N/A | | 2018 |
| 1,313,588 | | N/A | | 2019 |
| – 0 – | | 1,182,034 | | No Expiration |
During the current fiscal year, permanent differences primarily due to the tax treatment of swaps, options, and futures, foreign currency reclassifications, paydown gain/loss reclassifications, the expiration of capital loss carryforwards, and contributions from affiliates, resulted in a net decrease in undistributed net investment income, a net decrease in accumulated net realized loss on investment and foreign currency transactions, and a net decrease in additional paid-in capital. These reclassifications had no effect on net assets.
NOTE I
Recent Accounting Pronouncements
In March 2017, the Financial Accounting Standards Board issued an Accounting Standards Update, ASU 2017-08, Receivables—Nonrefundable Fees and Other Costs (Subtopic 310-20), Premium Amortization on Purchased Callable Debt Securities (the “ASU”) which amends the amortization period for certain purchased callable debt securities held at a premium, shortening such period to the earliest call date. The ASU does not require any accounting change for debt securities held at a discount; the discount continues to be amortized to maturity. The ASU is effective for fiscal years, and interim periods within those fiscal years, beginning after December 15, 2018. At this time, management is evaluating the implications of these changes on the financial statements.
NOTE J
Subsequent Events
Management has evaluated subsequent events for possible recognition or disclosure in the financial statements through the date the financial statements are issued. Management has determined that there are no material events that would require disclosure in the Fund’s financial statements through this date.
| | |
| abfunds.com | | AB UNCONSTRAINED BOND FUND | 105 |
FINANCIAL HIGHLIGHTS
Selected Data For A Share Of Capital Stock Outstanding Throughout Each Period
| | | | | | | | | | | | | | | | | | | | |
| | | Class A | |
| | | Year Ended October 31, | |
| | | 2017 | | | 2016 | | | 2015 | | | 2014 | | | 2013 | |
| | | | |
| | | | | | | | | | | | | | | | | | | | |
Net asset value, beginning of period | | | $ 8.62 | | | | $ 8.47 | | | | $ 8.67 | | | | $ 8.68 | | | | $ 9.09 | |
| | | | |
Income From Investment Operations | | | | | | | | | | | | | | | | | | | | |
Net investment income(a)(b) | | | .22 | | | | .24 | | | | .22 | | | | .16 | | | | .06 | |
Net realized and unrealized gain (loss) on investment and foreign currency transactions | | | .14 | | | | .06 | | | | (.19 | ) | | | (.06 | ) | | | (.02 | ) |
Contributions from Affiliates | | | .00 | (c) | | | .01 | | | | .01 | | | | – 0 | – | | | – 0 | – |
| | | | |
Net increase in net asset value from operations | | | .36 | | | | .31 | | | | .04 | | | | .10 | | | | .04 | |
| | | | |
Less: Dividends and Distributions | | | | | | | | | | | | | | | | | | | | |
Dividends from net investment income | | | (.28 | ) | | | (.16 | ) | | | (.24 | ) | | | (.11 | ) | | | (.34 | ) |
Tax return of capital | | | (.01 | ) | | | – 0 | – | | | – 0 | – | | | – 0 | – | | | (.11 | ) |
| | | | |
Total dividends and distributions | | | (.29 | ) | | | (.16 | ) | | | (.24 | ) | | | (.11 | ) | | | (.45 | ) |
| | | | |
Net asset value, end of period | | | $ 8.69 | | | | $ 8.62 | | | | $ 8.47 | | | | $ 8.67 | | | | $ 8.68 | |
| | | | |
Total Return | | | | | | | | | | | | | | | | | | | | |
Total investment return based on net asset value(d) | | | 4.24 | %^ | | | 3.74 | %^*† | | | 0.49 | %† | | | 1.11 | % | | | 0.46 | % |
Ratios/Supplemental Data | | | | | | | | | | | | | | | | | | | | |
Net assets, end of period (000’s omitted) | | | $36,136 | | | | $41,061 | | | | $50,031 | | | | $62,396 | | | | $73,922 | |
Ratio to average net assets of: | | | | | | | | | | | | | | | | | | | | |
Expenses, net of waivers/reimbursements(e)(f) | | | .92 | % | | | .91 | % | | | .90 | % | | | .90 | % | | | .90 | % |
Expenses, before waivers/reimbursements(e)(f) | | | 1.08 | % | | | 1.07 | % | | | 1.06 | % | | | 1.06 | % | | | 1.19 | % |
Net investment income(b) | | | 2.57 | % | | | 2.80 | % | | | 2.51 | % | | | 1.81 | % | | | .68 | % |
Portfolio turnover rate | | | 66 | % | | | 137 | % | | | 149 | % | | | 161 | % | | | 301 | % |
See footnote summary on pages 113-114.
| | |
| 106 | AB UNCONSTRAINED BOND FUND | | abfunds.com |
FINANCIAL HIGHLIGHTS (continued)
Selected Data For A Share Of Capital Stock Outstanding Throughout Each Period
| | | | | | | | | | | | | | | | | | | | |
| | | Class B | |
| | | Year Ended October 31, | |
| | | 2017 | | | 2016 | | | 2015 | | | 2014 | | | 2013 | |
| | | | |
| | | | | | | | | | | | | | | | | | | | |
Net asset value, beginning of period | | | $ 8.62 | | | | $ 8.48 | | | | $ 8.68 | | | | $ 8.68 | | | | $ 9.10 | |
| | | | |
Income From Investment Operations | | | | | | | | | | | | | | | | | | | | |
Net investment income(a)(b) | | | .16 | | | | .15 | | | | .15 | | | | .10 | | | | .00 | (c) |
Net realized and unrealized gain (loss) on investment and foreign currency transactions | | | .14 | | | | .08 | | | | (.18 | ) | | | (.05 | ) | | | (.03 | ) |
Contributions from Affiliates | | | .00 | (c) | | | .01 | | | | .01 | | | | – 0 | – | | | – 0 | – |
| | | | |
Net increase (decrease) in net asset value from operations | | | .30 | | | | .24 | | | | (.02 | ) | | | .05 | | | | (.03 | ) |
| | | | |
Less: Dividends and Distributions | | | | | | | | | | | | | | | | | | | | |
Dividends from net investment income | | | (.21 | ) | | | (.10 | ) | | | (.18 | ) | | | (.05 | ) | | | (.26 | ) |
Tax return of capital | | | (.01 | ) | | | – 0 | – | | | – 0 | – | | | – 0 | – | | | (.13 | ) |
| | | | |
Total dividends and distributions | | | (.22 | ) | | | (.10 | ) | | | (.18 | ) | | | (.05 | ) | | | (.39 | ) |
| | | | |
Net asset value, end of period | | | $ 8.70 | | | | $ 8.62 | | | | $ 8.48 | | | | $ 8.68 | | | | $ 8.68 | |
| | | | |
Total Return | | | | | | | | | | | | | | | | | | | | |
Total investment return based on net asset value(d) | | | 3.52 | % | | | 2.85 | %*† | | | (0.23 | )%† | | | 0.52 | % | | | (0.30 | )% |
Ratios/Supplemental Data | | | | | | | | | | | | | | | | | | | | |
Net assets, end of period (000’s omitted) | | | $151 | | | | $232 | | | | $442 | | | | $828 | | | | $1,406 | |
Ratio to average net assets of: | | | | | | | | | | | | | | | | | | | | |
Expenses, net of waivers/reimbursements(e)(f) | | | 1.66 | % | | | 1.65 | % | | | 1.60 | % | | | 1.60 | % | | | 1.60 | % |
Expenses, before waivers/reimbursements(e)(f) | | | 1.86 | % | | | 1.81 | % | | | 1.76 | % | | | 1.77 | % | | | 1.93 | % |
Net investment income(b) | | | 1.82 | % | | | 1.82 | % | | | 1.71 | % | | | 1.11 | % | | | .05 | % |
Portfolio turnover rate | | | 66 | % | | | 137 | % | | | 149 | % | | | 161 | % | | | 301 | % |
See footnote summary on pages 113-114.
| | |
| abfunds.com | | AB UNCONSTRAINED BOND FUND | 107 |
FINANCIAL HIGHLIGHTS (continued)
Selected Data For A Share Of Capital Stock Outstanding Throughout Each Period
| | | | | | | | | | | | | | | | | | | | |
| | | Class C | |
| | | Year Ended October 31, | |
| | | 2017 | | | 2016 | | | 2015 | | | 2014 | | | 2013 | |
| | | | |
| | | | | | | | | | | | | | | | | | | | |
Net asset value, beginning of period | | | $ 8.62 | | | | $ 8.47 | | | | $ 8.67 | | | | $ 8.68 | | | | $ 9.10 | |
| | | | |
Income From Investment Operations | | | | | | | | | | | | | | | | | | | | |
Net investment income(a)(b) | | | .16 | | | | .18 | | | | .17 | | | | .10 | | | | .00 | (c) |
Net realized and unrealized gain (loss) on investment and foreign currency transactions | | | .13 | | | | .06 | | | | (.19 | ) | | | (.06 | ) | | | (.03 | ) |
Contributions from Affiliates | | | .00 | (c) | | | .01 | | | | .01 | | | | – 0 | – | | | – 0 | – |
| | | | |
Net increase (decrease) in net asset value from operations | | | .29 | | | | .25 | | | | (.01 | ) | | | .04 | | | | (.03 | ) |
| | | | |
Less: Dividends and Distributions | | | | | | | | | | | | | | | | | | | | |
Dividends from net investment income | | | (.21 | ) | | | (.10 | ) | | | (.19 | ) | | | (.05 | ) | | | (.29 | ) |
Tax return of capital | | | (.01 | ) | | | – 0 | – | | | – 0 | – | | | – 0 | – | | | (.10 | ) |
| | | | |
Total dividends and distributions | | | (.22 | ) | | | (.10 | ) | | | (.19 | ) | | | (.05 | ) | | | (.39 | ) |
| | | | |
Net asset value, end of period | | | $ 8.69 | | | | $ 8.62 | | | | $ 8.47 | | | | $ 8.67 | | | | $ 8.68 | |
| | | | |
Total Return | | | | | | | | | | | | | | | | | | | | |
Total investment return based on net asset value(d) | | | 3.43 | %^ | | | 2.98 | %^*† | | | (0.19 | )%† | | | 0.42 | % | | | (0.31 | )% |
Ratios/Supplemental Data | | | | | | | | | | | | | | | | | | | | |
Net assets, end of period (000’s omitted) | | | $13,908 | | | | $21,247 | | | | $26,119 | | | | $20,681 | | | | $18,707 | |
Ratio to average net assets of: | | | | | | | | | | | | | | | | | | | | |
Expenses, net of waivers/reimbursements(e)(f) | | | 1.66 | % | | | 1.65 | % | | | 1.60 | % | | | 1.60 | % | | | 1.60 | % |
Expenses, before waivers/reimbursements(e)(f) | | | 1.83 | % | | | 1.81 | % | | | 1.77 | % | | | 1.77 | % | | | 1.89 | % |
Net investment income(b) | | | 1.85 | % | | | 2.08 | % | | | 1.95 | % | | | 1.14 | % | | | .04 | % |
Portfolio turnover rate | | | 66 | % | | | 137 | % | | | 149 | % | | | 161 | % | | | 301 | % |
See footnote summary on pages 113-114.
| | |
| 108 | AB UNCONSTRAINED BOND FUND | | abfunds.com |
FINANCIAL HIGHLIGHTS (continued)
Selected Data For A Share Of Capital Stock Outstanding Throughout Each Period
| | | | | | | | | | | | | | | | | | | | |
| | | Advisor Class | |
| | | Year Ended October 31, | |
| | | 2017 | | | 2016 | | | 2015 | | | 2014 | | | 2013 | |
| | | | |
| | | | | | | | | | | | | | | | | | | | |
Net asset value, beginning of period | | | $ 8.61 | | | | $ 8.46 | | | | $ 8.66 | | | | $ 8.67 | | | | $ 9.09 | |
| | | | |
Income From Investment Operations | | | | | | | | | | | | | | | | | | | | |
Net investment income(a)(b) | | | .24 | | | | .25 | | | | .25 | | | | .19 | | | | .08 | |
Net realized and unrealized gain (loss) on investment and foreign currency transactions | | | .13 | | | | .07 | | | | (.19 | ) | | | (.07 | ) | | | (.02 | ) |
Contributions from Affiliates | | | .00 | (c) | | | .01 | | | | .01 | | | | – 0 | – | | | – 0 | – |
| | | | |
Net increase in net asset value from operations | | | .37 | | | | .33 | | | | .07 | | | | .12 | | | | .06 | |
| | | | |
Less: Dividends and Distributions | | | | | | | | | | | | | | | | | | | | |
Dividends from net investment income | | | (.30 | ) | | | (.18 | ) | | | (.27 | ) | | | (.13 | ) | | | (.40 | ) |
Tax return of capital | | | (.01 | ) | | | – 0 | – | | | – 0 | – | | | – 0 | – | | | (.08 | ) |
| | | | |
Total dividends and distributions | | | (.31 | ) | | | (.18 | ) | | | (.27 | ) | | | (.13 | ) | | | (.48 | ) |
| | | | |
Net asset value, end of period | | | $ 8.67 | | | | $ 8.61 | | | | $ 8.46 | | | | $ 8.66 | | | | $ 8.67 | |
| | | | |
Total Return | | | | | | | | | | | | | | | | | | | | |
Total investment return based on net asset value(d) | | | 4.39 | %^ | | | 4.02 | %^*† | | | 0.80 | %† | | | 1.42 | % | | | 0.63 | % |
Ratios/Supplemental Data | | | | | | | | | | | | | | | | | | | | |
Net assets, end of period (000’s omitted) | | | $195,764 | | | | $162,255 | | | | $220,195 | | | | $248,510 | | | | $143,980 | |
Ratio to average net assets of: | | | | | | | | | | | | | | | | | | | | |
Expenses, net of waivers/reimbursements(e)(f) | | | .67 | % | | | .65 | % | | | .60 | % | | | .60 | % | | | .60 | % |
Expenses, before waivers/reimbursements(e)(f) | | | .83 | % | | | .81 | % | | | .76 | % | | | .77 | % | | | .87 | % |
Net investment income(b) | | | 2.79 | % | | | 3.02 | % | | | 2.89 | % | | | 2.14 | % | | | .96 | % |
Portfolio turnover rate | | | 66 | % | | | 137 | % | | | 149 | % | | | 161 | % | | | 301 | % |
See footnote summary on pages 113-114.
| | |
| abfunds.com | | AB UNCONSTRAINED BOND FUND | 109 |
FINANCIAL HIGHLIGHTS (continued)
Selected Data For A Share Of Capital Stock Outstanding Throughout Each Period
| | | | | | | | | | | | | | | | | | | | |
| | | Class R | |
| | | Year Ended October 31, | |
| | | 2017 | | | 2016 | | | 2015 | | | 2014 | | | 2013 | |
| | | | |
| | | | | | | | | | | | | | | | | | | | |
Net asset value, beginning of period | | | $ 8.62 | | | | $ 8.46 | | | | $ 8.65 | | | | $ 8.65 | | | | $ 9.07 | |
| | | | |
Income From Investment Operations | | | | | | | | | | | | | | | | | | | | |
Net investment income(a)(b) | | | .20 | | | | .21 | | | | .21 | | | | .14 | | | | .05 | |
Net realized and unrealized gain (loss) on investment and foreign currency transactions | | | .14 | | | | .07 | | | | (.20 | ) | | | (.06 | ) | | | (.04 | ) |
Contributions from Affiliates | | | .00 | (c) | | | .01 | | | | .01 | | | | – 0 | – | | | – 0 | – |
| | | | |
Net increase in net asset value from operations | | | .34 | | | | .29 | | | | .02 | | | | .08 | | | | .01 | |
| | | | |
Less: Dividends and Distributions | | | | | | | | | | | | | | | | | | | | |
Dividends from net investment income | | | (.24 | ) | | | (.13 | ) | | | (.21 | ) | | | (.08 | ) | | | (.28 | ) |
Tax return of capital | | | (.01 | ) | | | – 0 | – | | | – 0 | – | | | – 0 | – | | | (.15 | ) |
| | | | |
Total dividends and distributions | | | (.25 | ) | | | (.13 | ) | | | (.21 | ) | | | (.08 | ) | | | (.43 | ) |
| | | | |
Net asset value, end of period | | | $ 8.71 | | | | $ 8.62 | | | | $ 8.46 | | | | $ 8.65 | | | | $ 8.65 | |
| | | | |
Total Return | | | | | | | | | | | | | | | | | | | | |
Total investment return based on net asset value(d) | | | 4.02 | % | | | 3.43 | %^*† | | | 0.35 | %† | | | 0.98 | % | | | 0.14 | % |
Ratios/Supplemental Data | | | | | | | | | | | | | | | | | | | | |
Net assets, end of period (000’s omitted) | | | $1,378 | | | | $911 | | | | $1,126 | | | | $801 | | | | $911 | |
Ratio to average net assets of: | | | | | | | | | | | | | | | | | | | | |
Expenses, net of waivers/reimbursements(e)(f) | | | 1.16 | % | | | 1.15 | % | | | 1.10 | % | | | 1.10 | % | | | 1.10 | % |
Expenses, before waivers/reimbursements(e)(f) | | | 1.52 | % | | | 1.48 | % | | | 1.46 | % | | | 1.46 | % | | | 1.59 | % |
Net investment income(b) | | | 2.33 | % | | | 2.53 | % | | | 2.48 | % | | | 1.66 | % | | | .52 | % |
Portfolio turnover rate | | | 66 | % | | | 137 | % | | | 149 | % | | | 161 | % | | | 301 | % |
See footnote summary on pages 113-114.
| | |
| 110 | AB UNCONSTRAINED BOND FUND | | abfunds.com |
FINANCIAL HIGHLIGHTS (continued)
Selected Data For A Share Of Capital Stock Outstanding Throughout Each Period
| | | | | | | | | | | | | | | | | | | | |
| | | Class K | |
| | | Year Ended October 31, | |
| | | 2017 | | | 2016 | | | 2015 | | | 2014 | | | 2013 | |
| | | | |
| | | | | | | | | | | | | | | | | | | | |
Net asset value, beginning of period | | | $ 8.64 | | | | $ 8.49 | | | | $ 8.68 | | | | $ 8.68 | | | | $ 9.10 | |
| | | | |
Income From Investment Operations | | | | | | | | | | | | | | | | | | | | |
Net investment income(a)(b) | | | .22 | | | | .25 | | | | .22 | | | | .16 | | | | .07 | |
Net realized and unrealized gain (loss) on investment and foreign currency transactions | | | .14 | | | | .04 | | | | (.18 | ) | | | (.05 | ) | | | (.03 | ) |
Contributions from Affiliates | | | .00 | (c) | | | .01 | | | | .01 | | | | – 0 | – | | | – 0 | – |
| | | | |
Net increase in net asset value from operations | | | .36 | | | | .30 | | | | .05 | | | | .11 | | | | .04 | |
| | | | |
Less: Dividends and Distributions | | | | | | | | | | | | | | | | | | | | |
Dividends from net investment income | | | (.27 | ) | | | (.15 | ) | | | (.24 | ) | | | (.11 | ) | | | (.32 | ) |
Tax return of capital | | | (.01 | ) | | | – 0 | – | | | – 0 | – | | | – 0 | – | | | (.14 | ) |
| | | | |
Total dividends and distributions | | | (.28 | ) | | | (.15 | ) | | | (.24 | ) | | | (.11 | ) | | | (.46 | ) |
| | | | |
Net asset value, end of period | | | $ 8.72 | | | | $ 8.64 | | | | $ 8.49 | | | | $ 8.68 | | | | $ 8.68 | |
| | | | |
Total Return | | | | | | | | | | | | | | | | | | | | |
Total investment return based on net asset value(d) | | | 4.23 | % | | | 3.63 | %*† | | | 0.55 | %† | | | 1.24 | % | | | 0.40 | % |
Ratios/Supplemental Data | | | | | | | | | | | | | | | | | | | | |
Net assets, end of period (000’s omitted) | | | $248 | | | | $221 | | | | $181 | | | | $245 | | | | $48 | |
Ratio to average net assets of: | | | | | | | | | | | | | | | | | | | | |
Expenses, net of waivers/reimbursements(e)(f) | | | .92 | % | | | .90 | % | | | .85 | % | | | .85 | % | | | .85 | % |
Expenses, before waivers/reimbursements(e)(f) | | | 1.20 | % | | | 1.17 | % | | | 1.12 | % | | | 1.14 | % | | | 1.24 | % |
Net investment income(b) | | | 2.54 | % | | | 2.94 | % | | | 2.55 | % | | | 1.87 | % | | | .75 | % |
Portfolio turnover rate | | | 66 | % | | | 137 | % | | | 149 | % | | | 161 | % | | | 301 | % |
See footnote summary on pages 113-114.
| | |
| abfunds.com | | AB UNCONSTRAINED BOND FUND | 111 |
FINANCIAL HIGHLIGHTS (continued)
Selected Data For A Share Of Capital Stock Outstanding Throughout Each Period
| | | | | | | | | | | | | | | | | | | | |
| | | Class I | |
| | | Year Ended October 31, | |
| | | 2017 | | | 2016 | | | 2015 | | | 2014 | | | 2013 | |
| | | | |
| | | | | | | | | | | | | | | | | | | | |
Net asset value, beginning of period | | | $ 8.60 | | | | $ 8.45 | | | | $ 8.65 | | | | $ 8.66 | | | | $ 9.08 | |
| | | | |
Income From Investment Operations | | | | | | | | | | | | | | | | | | | | |
Net investment income(a)(b) | | | .25 | | | | .27 | | | | .25 | | | | .18 | | | | .08 | |
Net realized and unrealized gain (loss) on investment and foreign currency transactions | | | .12 | | | | .06 | | | | (.19 | ) | | | (.06 | ) | | | (.02 | ) |
Contributions from Affiliates | | | .00 | (c) | | | .01 | | | | .01 | | | | – 0 | – | | | – 0 | – |
| | | | |
Net increase in net asset value from operations | | | .37 | | | | .34 | | | | .07 | | | | .12 | | | | .06 | |
| | | | |
Less: Dividends and Distributions | | | | | | | | | | | | | | | | | | | | |
Dividends from net investment income | | | (.30 | ) | | | (.19 | ) | | | (.27 | ) | | | (.13 | ) | | | (.45 | ) |
Tax return of capital | | | (.01 | ) | | | – 0 | – | | | – 0 | – | | | – 0 | – | | | (.03 | ) |
| | | | |
Total dividends and distributions | | | (.31 | ) | | | (.19 | ) | | | (.27 | ) | | | (.13 | ) | | | (.48 | ) |
| | | | |
Net asset value, end of period | | | $ 8.66 | | | | $ 8.60 | | | | $ 8.45 | | | | $ 8.65 | | | | $ 8.66 | |
| | | | |
Total Return | | | | | | | | | | | | | | | | | | | | |
Total investment return based on net asset value(d) | | | 4.44 | %^ | | | 4.07 | %^*† | | | 0.78 | %† | | | 1.42 | % | | | 0.67 | % |
Ratios/Supplemental Data | | | | | | | | | | | | | | | | | | | | |
Net assets, end of period (000’s omitted) | | | $47,915 | | | | $45,629 | | | | $44,242 | | | | $39,782 | | | | $8,036 | |
Ratio to average net assets of: | | | | | | | | | | | | | | | | | | | | |
Expenses, net of waivers/reimbursements(e)(f) | | | .67 | % | | | .65 | % | | | .60 | % | | | .60 | % | | | .60 | % |
Expenses, before waivers/reimbursements(e)(f) | | | .80 | % | | | .77 | % | | | .78 | % | | | .74 | % | | | .80 | % |
Net investment income(b) | | | 2.84 | % | | | 3.17 | % | | | 2.93 | % | | | 2.10 | % | | | .92 | % |
Portfolio turnover rate | | | 66 | % | | | 137 | % | | | 149 | % | | | 161 | % | | | 301 | % |
See footnote summary on pages 113-114.
| | |
| 112 | AB UNCONSTRAINED BOND FUND | | abfunds.com |
FINANCIAL HIGHLIGHTS (continued)
Selected Data For A Share Of Capital Stock Outstanding Throughout Each Period
| | | | | | | | | | | | |
| | | Class Z | |
| | | Year Ended October 31, | | | November 4,
2014(g) to
October 31, 2015 | |
| | 2017 | | | 2016 | | |
| | | | |
| | | | | | | | | | | | |
Net asset value, beginning of period | | | $ 8.59 | | | | $ 8.45 | | | | $ 8.65 | |
| | | | |
Income From Investment Operations | | | | | | | | | | | | |
Net investment income(a)(b) | | | .25 | | | | .28 | | | | .31 | |
Net realized and unrealized gain (loss) on investment and foreign currency transactions | | | .13 | | | | .04 | | | | (.25 | ) |
Contributions from Affiliates | | | .00 | (c) | | | .01 | | | | .01 | |
| | | | |
Net increase in net asset value from operations | | | .38 | | | | .33 | | | | .07 | |
| | | | |
Less: Dividends | | | | | | | | | | | | |
Dividends from net investment income | | | (.30 | ) | | | (.19 | ) | | | (.27 | ) |
Tax return of capital | | | (.01 | ) | | | – 0 | – | | | – 0 | – |
| | | | | | | | | | | | |
Total dividends and distributions | | | (.31 | ) | | | (.19 | ) | | | (.27 | ) |
| | | | |
Net asset value, end of period | | | $ 8.66 | | | | $ 8.59 | | | | $ 8.45 | |
| | | | |
Total Return | | | | | | | | | | | | |
Total investment return based on net asset value(d) | | | 4.57 | % | | | 3.94 | %*† | | | 0.85 | %† |
Ratios/Supplemental Data | | | | | | | | | | | | |
Net assets, end of period (000’s omitted) | | | $11,238 | | | | $9,587 | | | | $2,031 | |
Ratio to average net assets of: | | | | | | | | | | | | |
Expenses, net of waivers/reimbursements(e)(f) | | | .67 | % | | | .65 | % | | | .60 | %(h) |
Expenses, before waivers/reimbursements(e)(f) | | | .80 | % | | | .78 | % | | | .80 | %(h) |
Net investment income(b) | | | 2.86 | % | | | 3.31 | % | | | 3.68 | %(h) |
Portfolio turnover rate | | | 66 | % | | | 137 | % | | | 149 | % |
| (a) | Based on average shares outstanding. |
| (b) | Net of expenses waived/reimbursed by the Adviser. |
| (c) | Amount is less than $0.005. |
| (d) | Total investment return is calculated assuming an initial investment made at the net asset value at the beginning of the period, reinvestment of all dividends and distributions at net asset value during the period, and redemption on the last day of the period. Initial sales charge or contingent deferred sales charge is not reflected in the calculation of total investment return. Total investment return does not reflect the deduction of taxes that a shareholder would pay on fund distributions or the redemption of fund shares. Total investment return for a period of less than one year is not annualized. |
| (e) | In connection with the Fund’s investments in affiliated underlying portfolios, the Fund incurs no direct expenses but bears proportionate shares of the fees and expenses (i.e. operating, administrative and investment advisory fees) of the affiliated underlying portfolios. The Adviser has contractually agreed to waive its fees from the Fund in an amount equal to the Fund’s pro rata share of certain acquired fund fees and expenses, and for the years ended October 31, 2017 and October 31, 2016, such waiver amounted to 0.02% and 0.01%, respectively. |
See notes to financial statements.
| | |
| abfunds.com | | AB UNCONSTRAINED BOND FUND | 113 |
FINANCIAL HIGHLIGHTS (continued)
Selected Data For A Share Of Capital Stock Outstanding Throughout Each Period
| (f) | The expense ratios presented below exclude non-operating expense: |
| | | | | | | | | | | | | | | | | | | | |
| | | Year Ended October 31, | |
| | | 2017 | | | 2016 | | | 2015 | | | 2014 | | | 2013 | |
| | | | |
Class A | | | | | | | | | | | | | | | | | | | | |
Net of waivers/reimbursements | | | .88 | % | | | .89 | % | | | .90 | % | | | .90 | % | | | .90 | % |
Before waivers/reimbursements | | | 1.04 | % | | | 1.05 | % | | | 1.06 | % | | | 1.06 | % | | | 1.19 | % |
Class B | | | | | | | | | | | | | | | | | | | | |
Net of waivers/reimbursements | | | 1.63 | % | | | 1.63 | % | | | 1.60 | % | | | 1.60 | % | | | 1.60 | % |
Before waivers/reimbursements | | | 1.83 | % | | | 1.78 | % | | | 1.76 | % | | | 1.77 | % | | | 1.93 | % |
Class C | | | | | | | | | | | | | | | | | | | | |
Net of waivers/reimbursements | | | 1.63 | % | | | 1.63 | % | | | 1.60 | % | | | 1.60 | % | | | 1.60 | % |
Before waivers/reimbursements | | | 1.80 | % | | | 1.79 | % | | | 1.77 | % | | | 1.77 | % | | | 1.89 | % |
Advisor Class | | | | | | | | | | | | | | | | | | | | |
Net of waivers/reimbursements | | | .63 | % | | | .63 | % | | | .60 | % | | | .60 | % | | | .60 | % |
Before waivers/reimbursements | | | .79 | % | | | .78 | % | | | .76 | % | | | .77 | % | | | .87 | % |
Class R | | | | | | | | | | | | | | | | | | | | |
Net of waivers/reimbursements | | | 1.13 | % | | | 1.13 | % | | | 1.10 | % | | | 1.10 | % | | | 1.10 | % |
Before waivers/reimbursements | | | 1.49 | % | | | 1.46 | % | | | 1.46 | % | | | 1.46 | % | | | 1.59 | % |
Class K | | | | | | | | | | | | | | | | | | | | |
Net of waivers/reimbursements | | | .88 | % | | | .88 | % | | | .85 | % | | | .85 | % | | | .85 | % |
Before waivers/reimbursements | | | 1.16 | % | | | 1.15 | % | | | 1.12 | % | | | 1.14 | % | | | 1.24 | % |
Class I | | | | | | | | | | | | | | | | | | | | |
Net of waivers/reimbursements | | | .63 | % | | | .63 | % | | | .60 | % | | | .60 | % | | | .60 | % |
Before waivers/reimbursements | | | .76 | % | | | .75 | % | | | .78 | % | | | .74 | % | | | .80 | % |
| | | | | | | | | | | | |
| | | Year Ended October 31, | | | November 4, 2014(g) to
October 31,
2015 | |
| | |
| | | 2017 | | | 2016 | | |
| | | | |
Class Z | | | | | | | | | | | | |
Net of waivers/reimbursements | | | .63 | % | | | .63 | % | | | .60 | %(h) |
Before waivers/reimbursements | | | .76 | % | | | .76 | % | | | .80 | %(h) |
| (g) | Commencement of distribution. |
| ^ | The net asset value and total return include adjustments in accordance with accounting principles generally accepted in the United States of America for financial reporting purposes. As such, the net asset value and total return for shareholder transactions may differ from financial statements. |
| * | Includes the impact of proceeds received and credited to the Fund resulting from class action settlements, which enhanced the performance of each share class for the year ended October 31, 2017 by 0.05%. |
| † | Includes the impact of reimbursements from the Adviser which enhanced the Fund’s performance for the years ended October 31, 2016 and October 31, 2015 by 0.08% and 0.08%, respectively. |
See notes to financial statements.
| | |
| 114 | AB UNCONSTRAINED BOND FUND | | abfunds.com |
REPORT OF INDEPENDENT REGISTERED
PUBLIC ACCOUNTING FIRM
To the Board of Directors and Shareholders of
AB Unconstrained Bond Fund, Inc.
We have audited the accompanying statement of assets and liabilities, including the portfolio of investments, of AB Unconstrained Bond Fund, Inc. (the “Fund”), as of October 31, 2017, and the related statement of operations for the year then ended, the statements of changes in net assets for each of the two years in the period then ended, and the financial highlights for each of the periods indicated therein. These financial statements and financial highlights are the responsibility of the Fund’s management. Our responsibility is to express an opinion on these financial statements and financial highlights based on our audits.
We conducted our audits in accordance with the standards of the Public Company Accounting Oversight Board (United States). Those standards require that we plan and perform the audit to obtain reasonable assurance about whether the financial statements and financial highlights are free of material misstatement. We were not engaged to perform an audit of the Fund’s internal control over financial reporting. Our audits included consideration of internal control over financial reporting as a basis for designing audit procedures that are appropriate in the circumstances, but not for the purpose of expressing an opinion on the effectiveness of the Fund’s internal control over financial reporting. Accordingly, we express no such opinion. An audit also includes examining, on a test basis, evidence supporting the amounts and disclosures in the financial statements and financial highlights, assessing the accounting principles used and significant estimates made by management, and evaluating the overall financial statement presentation. Our procedures included confirmation of securities owned as of October 31, 2017, by correspondence with the custodian and others or by other appropriate auditing procedures where replies from others were not received. We believe that our audits provide a reasonable basis for our opinion.
In our opinion, the financial statements and financial highlights referred to above present fairly, in all material respects, the financial position of AB Unconstrained Bond Fund, Inc. at October 31, 2017, the results of its operations for the year then ended, the changes in its net assets for each of the two years in the period then ended, and the financial highlights for each of the periods indicated therein, in conformity with U.S. generally accepted accounting principles.

New York, New York
December 29, 2017
| | |
| abfunds.com | | AB UNCONSTRAINED BOND FUND | 115 |
2017 FEDERAL TAX INFORMATION
(unaudited)
For Federal income tax purposes, the following information is furnished with respect to the distributions paid by the Fund during the taxable period ended October 31, 2017. For individual shareholders, the Fund designates 0.08% of dividends paid as qualified dividend income. For corporate shareholders, 0.08% of dividends paid qualify for the dividends received deduction. For foreign shareholders, 25.09% of ordinary dividends paid may be considered to be qualifying to be taxed as interest-related dividends.
Shareholders should not use the above information to prepare their income tax returns. The information necessary to complete your income tax returns will be included with your Form 1099-DIV which will be sent to you separately in January 2018.
| | |
| 116 | AB UNCONSTRAINED BOND FUND | | abfunds.com |
BOARD OF DIRECTORS
| | |
Marshall C. Turner, Jr.(1), Chairman John H. Dobkin(1)(2) Michael J. Downey(1) William H. Foulk, Jr.(1) D. James Guzy(1)(2) | | Nancy P. Jacklin(1) Robert M. Keith, President and Chief Executive Officer Carol C. McMullen(1) Garry L. Moody(1) Earl D. Weiner(1) |
OFFICERS
| | |
Philip L. Kirstein(3), Senior Vice President and Independent Compliance Officer Scott DiMaggio(4), Vice President Gershon Distenfeld(4), Vice President Douglas J. Peebles(4), Vice President Dimitri Silva(4), Vice President | | John Taylor(4), Vice President Emilie D. Wrapp, Secretary Joseph J. Mantineo, Treasurer and Chief Financial Officer Stephen M. Woetzel, Controller Vincent S. Noto, Chief Compliance Officer |
| | |
Principal Underwriter AllianceBernstein Investments, Inc. 1345 Avenue of the Americas New York, NY 10105 Custodian and Accounting Agent Brown Brothers Harriman & Co. 50 Post Office Square Boston, MA 02110 Legal Counsel Seward & Kissel LLP One Battery Park Plaza New York, NY 10004 | | Transfer Agent AllianceBernstein Investor Services, Inc. P.O. Box 786003 San Antonio, TX 78278-6003 Toll-Free (800) 221-5672 Independent Registered Public Accounting Firm Ernst & Young LLP 5 Times Square New York, NY 10036 |
| 1 | Member of the Audit Committee, the Governance and Nominating Committee and the Independent Directors Committee. |
| 2 | Messrs. Dobkin and Guzy are expected to retire on or about December 31, 2017. |
| 3 | Mr. Kirstein is expect to retire on or about December 31, 2017. |
| 4 | The day-to-day management of, and investment decisions for, the Fund’s portfolio are made by the Global Fixed Income Investment Team and the Global Credit Investment Team. Messrs. DiMaggio, Distenfeld, Peebles, Silva and Taylor are the investment professionals with the most significant responsibility for the day-to-day management of the Fund’s portfolio. |
| | |
| abfunds.com | | AB UNCONSTRAINED BOND FUND | 117 |
MANAGEMENT OF THE FUND
Board of Directors Information
The business and affairs of the Fund are managed under the direction of the Board of Directors. Certain information concerning the Fund’s Directors is set forth below.
| | | | | | | | |
NAME,
ADDRESS*, AGE,
(FIRST YEAR ELECTED**) | | PRINCIPAL
OCCUPATION(S)
DURING PAST FIVE YEARS
AND OTHER INFORMATION*** | | PORTFOLIOS
IN FUND
COMPLEX
OVERSEEN BY
DIRECTOR | | | OTHER PUBLIC DIRECTORSHIPS CURRENTLY HELD
BY DIRECTOR |
| INTERESTED DIRECTOR | | | | | | |
Robert M. Keith,†
1345 Avenue of the Americas
New York, NY 10105
57
(2010) | | Senior Vice President of AllianceBernstein L.P. (the “Adviser”), and the head of AllianceBernstein Investments, Inc. (“ABI”), since July 2008; Director of ABI and President of the AB Mutual Funds. Previously, he served as Executive Managing Director of ABI from December 2006 to June 2008. Prior to joining ABI in 2006, Executive Managing Director of Bernstein Global Wealth Management, and prior thereto, Senior Managing Director and Global Head of Client Service and Sales of the Adviser’s institutional investment management business since 2004. Prior thereto, he was Managing Director and Head of North American Client Service and Sales in the Adviser’s institutional investment management business, with which he had been associated since prior to 2004. | | | 96 | | | None |
| | |
| 118 | AB UNCONSTRAINED BOND FUND | | abfunds.com |
MANAGEMENT OF THE FUND (continued)
| | | | | | | | |
NAME,
ADDRESS*, AGE,
(FIRST YEAR ELECTED**) | | PRINCIPAL
OCCUPATION(S)
DURING PAST FIVE YEARS
AND OTHER INFORMATION*** | | PORTFOLIOS
IN FUND
COMPLEX
OVERSEEN BY
DIRECTOR | | | OTHER PUBLIC DIRECTORSHIPS CURRENTLY HELD
BY DIRECTOR |
| DISINTERESTED DIRECTORS | | | | | | |
Marshall C. Turner, Jr.#
Chairman of the Board 76 (2014) | | Private Investor since prior to 2012. Former Chairman and CEO of Dupont Photomasks, Inc. (components of semi- conductor manufacturing). He has extensive operating leadership and venture capital investing experience, including five interim or full-time CEO roles, and prior service as general partner of institutional venture capital partnerships. He also has extensive non- profit board leadership experience, and currently serves on the boards of two education and science-related non-profit organizations. He has served as a director of one AB fund since 1992, and director or trustee of multiple AB Funds since 2005. He has been Chairman of the AB Funds since January 2014, and the Chairman of the Independent Directors Committees of such AB Funds since February 2014. | | | 96 | | | Xilinx, Inc.
(programmable logic semi-conductors) since 2007 |
| | | | | | | | |
John H. Dobkin,#,## 75 (1995) | | Independent Consultant since prior to 2012. Formerly, President of Save Venice, Inc. (preservation organization) from 2001–2002; Senior Advisor from June 1999-June 2000 and President of Historic Hudson Valley (historic preservation) from December 1989-May 1999. Previously, Director of the National Academy of Design. He has served as a director or trustee of various AB Funds since 1992, and as Chairman of the Audit Committees of a number of such AB Funds from 2001-2008. | | | 95 | | | None |
| | |
| abfunds.com | | AB UNCONSTRAINED BOND FUND | 119 |
MANAGEMENT OF THE FUND (continued)
| | | | | | | | |
NAME,
ADDRESS*, AGE,
(FIRST YEAR ELECTED**) | | PRINCIPAL
OCCUPATION(S)
DURING PAST FIVE YEARS
AND OTHER INFORMATION*** | | PORTFOLIOS
IN FUND
COMPLEX
OVERSEEN BY
DIRECTOR | | | OTHER PUBLIC DIRECTORSHIPS CURRENTLY HELD
BY DIRECTOR |
DISINTERESTED DIRECTORS (continued) | | | | | | |
Michael J. Downey,# 73 (2005) | | Private Investor since prior to 2012. Formerly, managing partner of Lexington Capital, LLC (investment advisory firm) from December 1997 until December 2003. He served as Director of Prospect Acquisition Corp. (financial services) from 2007 until 2009. From 1987 until 1993, Chairman and CEO of Prudential Mutual Fund Management, director of the Prudential mutual funds, and member of the Executive Committee of Prudential Securities Inc. He has served as a director or trustee of the AB Funds since 2005 and is a director and Chairman of one other registered investment company. | | | 96 | | | The Asia Pacific Fund, Inc. (registered investment company) since prior to 2012 |
| | | | | | | | |
William H. Foulk, Jr.,# 85 (1995) | | Investment Adviser and an Independent Consultant since prior to 2012. Previously, he was Senior Manager of Barrett Associates, Inc., a registered investment adviser. He was formerly Deputy Comptroller and Chief Investment Officer of the State of New York and, prior thereto, Chief Investment Officer of the New York Bank for Savings. He has served as a director or trustee of various AB Funds since 1983, and was Chairman of the Independent Directors Committees of the AB Funds from 2003 until early February 2014. He served as Chairman of such AB Funds from 2003 through December 2013. He is also active in a number of mutual fund related organizations and committees. | | | 96 | | | None |
| | |
| 120 | AB UNCONSTRAINED BOND FUND | | abfunds.com |
MANAGEMENT OF THE FUND (continued)
| | | | | | | | |
NAME,
ADDRESS*, AGE,
(FIRST YEAR ELECTED**) | | PRINCIPAL
OCCUPATION(S)
DURING PAST FIVE YEARS
AND OTHER INFORMATION*** | | PORTFOLIOS
IN FUND
COMPLEX
OVERSEEN BY
DIRECTOR | | | OTHER PUBLIC DIRECTORSHIPS CURRENTLY HELD
BY DIRECTOR |
DISINTERESTED DIRECTORS (continued) | | | | | | |
D. James Guzy,#,## 81 (2005) | | Chairman of the Board of SRC Computers, Inc. (semi-conductors), with which he has been associated since prior to 2012. He served as Chairman of the Board of PLX Technology (semi-conductors) since prior to 2012 until November 2013. He was a director of Intel Corporation (semi-conductors) from 1969 until 2008, and served as Chairman of the Finance Committee of such company for several years until May 2008. He has served as a director or trustee of one or more of the AB Funds since 1982. | | | 93 | | | None |
| | | | | | | | |
Nancy P. Jacklin,#
69
(2006) | | Private Investor since prior to 2012. Professorial Lecturer at the Johns Hopkins School of Advanced International Studies (2008-2015). U.S. Executive Director of the International Monetary Fund (which is responsible for ensuring the stability of the international monetary system), (December 2002-May 2006); Partner, Clifford Chance (1992-2002); Sector Counsel, International Banking and Finance, and Associate General Counsel, Citicorp (1985-1992); Assistant General Counsel (International), Federal Reserve Board of Governors (1982-1985); and Attorney Advisor, U.S. Department of the Treasury (1973-1982). Member of the Bar of the District of Columbia and of New York; and member of the Council on Foreign Relations. She has served as a director or trustee of the AB Funds since 2006 and has been Chairman of the Governance and Nominating Committees of the Funds since August 2014. | | | 96 | | | None |
| | |
| abfunds.com | | AB UNCONSTRAINED BOND FUND | 121 |
MANAGEMENT OF THE FUND (continued)
| | | | | | | | |
NAME,
ADDRESS*, AGE,
(FIRST YEAR ELECTED**) | | PRINCIPAL
OCCUPATION(S)
DURING PAST FIVE YEARS
AND OTHER INFORMATION*** | | PORTFOLIOS
IN FUND
COMPLEX
OVERSEEN BY
DIRECTOR | | | OTHER PUBLIC DIRECTORSHIPS CURRENTLY HELD
BY DIRECTOR |
DISINTERESTED DIRECTORS (continued) | | | | | | |
Carol C. McMullen,# 62 (2016) | | Managing Director of Slalom Consulting (consulting) since 2014 and private investor; and member of the Partners Healthcare Investment Committee. Formerly, Director of Norfolk & Dedham Group (mutual property and casualty insurance) from 2011 until November 2016; and Director of Partners Community Physicians Organization (healthcare) from 2014 until December 2016, and Managing Director of The Crossland Group (consulting) from 2012 to 2013. She has held a number of senior positions in the asset and wealth management industries, including at Eastern Bank (where her roles included President of Eastern Wealth Management), Thomson Financial (Global Head of Sales for Investment Management), and Putnam Investments (where her roles included Head of Global Investment Research). She has served on a number of private company and nonprofit boards, and as a director or trustee of the AB Funds since June 2016. | | | 96 | | | None |
| | |
| 122 | AB UNCONSTRAINED BOND FUND | | abfunds.com |
MANAGEMENT OF THE FUND (continued)
| | | | | | | | |
NAME,
ADDRESS*, AGE,
(FIRST YEAR ELECTED**) | | PRINCIPAL
OCCUPATION(S)
DURING PAST FIVE YEARS
AND OTHER INFORMATION*** | | PORTFOLIOS
IN FUND
COMPLEX
OVERSEEN BY
DIRECTOR | | | OTHER PUBLIC DIRECTORSHIPS CURRENTLY HELD
BY DIRECTOR |
DISINTERESTED DIRECTORS (continued) | | | | | | |
Garry L. Moody,#
65
(2008) | | Independent Consultant. Formerly, Partner, Deloitte & Touche LLP (1995-2008) where he held a number of senior positions, including Vice Chairman, and U.S. and Global Investment Management Practice Managing Partner; President, Fidelity Accounting and Custody Services Company (1993-1995), where he was responsible for accounting, pricing custody and reporting for the Fidelity mutual funds; and Partner, Ernst & Young LLP (1975-1993), where he served as the National Director of Mutual Fund Tax Services and Managing Partner of its Chicago Office Tax department. He is a member of the Trustee Advisory Board of BoardIQ, a biweekly publication focused on issues and news affecting directors of mutual funds. He has served as a director or trustee, and as Chairman of the Audit Committees, of the AB Funds since 2008. | | | 96 | | | None |
| | | | | | | | |
Earl D. Weiner,#
78
(2007) | | Of Counsel, and Partner prior to January 2007, of the law firm Sullivan & Cromwell LLP and is a former member of the ABA Federal Regulation of Securities Committee Task Force to draft editions of the Fund Director’s Guidebook. He also serves as a director or trustee of various non-profit organizations and has served as Chairman or Vice Chairman of a number of them. He has served as a director or trustee of the AB Funds since 2007 and served as Chairman of the Governance and Nominating Committees of the AB Funds from 2007 until August 2014. | | | 96 | | | None |
| | |
| abfunds.com | | AB UNCONSTRAINED BOND FUND | 123 |
MANAGEMENT OF THE FUND (continued)
| * | The address for each of the Fund’s disinterested Directors is c/o AllianceBernstein L.P., Attention: Office of the Senior Officer, 1345 Avenue of the Americas, New York, NY 10105. |
| ** | There is no stated term of office for the Fund’s Directors. |
| *** | The information above includes each Director’s principal occupation during the last five years and other information relating to the experience, attributes, and skills relevant to each Director’s qualifications to serve as a Director, which led to the conclusion that each Director should serve as a Director for the Fund. |
| † | Mr. Keith is an “interested person” of the Fund, as defined in the 1940 Act, due to his position as a Senior Vice President of the Adviser. |
| # | Member of the Audit Committee, the Governance and Nominating Committee and the Independent Directors Committee. |
| ## | Messrs. Dobkin and Guzy are expected to retire on or about December 31, 2017. |
| | |
| 124 | AB UNCONSTRAINED BOND FUND | | abfunds.com |
MANAGEMENT OF THE FUND (continued)
Officer Information
Certain information concerning the Fund’s Officers is listed below.
| | | | |
NAME, ADDRESS*
AND AGE | | POSITION(S)
HELD WITH FUND | | PRINCIPAL OCCUPATION
DURING PAST FIVE YEARS |
Robert M. Keith 57 | | President and Chief Executive Officer | | See biography above. |
| | | | |
Philip L. Kirstein# 72 | | Senior Vice President and Independent Compliance Officer | | Senior Vice President and Independent Compliance Officer of the AB Funds, with which he has been associated since October 2004. Prior thereto, he was Of Counsel to Kirkpatrick & Lockhart, LLP from October 2003 to October 2004, and General Counsel of Merrill Lynch Investment Managers, L.P. since prior to March 2003. |
| | | | |
Scott A. DiMaggio 46 | | Vice President | | Senior Vice President of the Adviser,** with which he has been associated since prior to 2012. |
| | | | |
Gershon M. Distenfeld 41 | | Vice President | | Senior Vice President of the Adviser,** with which he has been associated since prior to 2012. |
| | | | |
Douglas J. Peebles 52 | | Vice President | | Senior Vice President of the Adviser**, with which he has been associated since prior to 2012. |
| | | | |
Dimitri Silva 35 | | Vice President | | Vice President of the Adviser,** with which he has been associated since prior to 2012. |
| | | | |
John Taylor 40 | | Vice President | | Senior Vice President of the Adviser,** with which he has been associated since prior to 2012. |
| | | | |
Emilie D. Wrapp 62 | | Secretary | | Senior Vice President, Assistant General Counsel and Assistant Secretary of ABI**, with which she has been associated since prior to 2012. |
| | | | |
Joseph J. Mantineo 58 | | Treasurer and Chief Financial Officer | | Senior Vice President of AllianceBernstein Investor Services, Inc. (“ABIS”)**, with which he has been associated since prior to 2012. |
| | | | |
Stephen M. Woetzel 46 | | Controller | | Vice President of ABIS**, with which he has been associated since prior to 2012. |
| | | | |
Vincent S. Noto 53 | | Chief Compliance Officer | | Senior Vice President since 2015 and Mutual Fund Chief Compliance Officer of the Adviser** since 2014. Prior thereto, he was Vice President and Director of Mutual Fund Compliance of the Adviser** since 2012. |
| * | The address for each of the Fund’s Officers is 1345 Avenue of the Americas, New York, NY 10105. |
| ** | The Adviser, ABI and ABIS are affiliates of the Fund. |
| # | Mr. Kirstein is expected to retire on or about December 31, 2017. |
The Fund’s Statement of Additional Information (SAI) has additional information about the Fund’s Directors and Officers and is available without charge upon request. Contact your financial representative or AB at (800) 227-4618, or visit www.abfunds.com, for a free prospectus or SAI.
| | |
| abfunds.com | | AB UNCONSTRAINED BOND FUND | 125 |
Information Regarding the Review and Approval of the Fund’s Advisory Agreement
The disinterested directors (the “directors”) of AB Unconstrained Bond Fund, Inc. (formerly named AllianceBernstein Diversified Yield Fund, Inc.) (the “Fund”) unanimously approved the continuance of the Fund’s Advisory Agreement with the Adviser at a meeting held on November 1-3, 2016 (the “Meeting”).
Prior to approval of the continuance of the Advisory Agreement, the directors had requested from the Adviser, and received and evaluated, extensive materials. They reviewed the proposed continuance of the Advisory Agreement with the Adviser and with experienced counsel who are independent of the Adviser, who advised on the relevant legal standards. The directors also reviewed an independent evaluation prepared by the Fund’s Senior Officer (who is also the Fund’s Independent Compliance Officer) of the reasonableness of the advisory fee, in which the Senior Officer concluded that the contractual fee for the Fund was reasonable. The directors also discussed the proposed continuance in private sessions with counsel and the Fund’s Senior Officer.
The directors considered their knowledge of the nature and quality of the services provided by the Adviser to the Fund gained from their experience as directors or trustees of most of the registered investment companies advised by the Adviser, their overall confidence in the Adviser’s integrity and competence they have gained from that experience, the Adviser’s initiative in identifying and raising potential issues with the directors and its responsiveness, frankness and attention to concerns raised by the directors in the past, including the Adviser’s willingness to consider and implement organizational and operational changes designed to improve investment results and the services provided to the AB Funds. The directors noted that they have four regular meetings each year, at each of which they receive presentations from the Adviser on the investment results of the Fund and review extensive materials and information presented by the Adviser.
The directors also considered all other factors they believed relevant, including the specific matters discussed below. In their deliberations, the directors did not identify any particular information that was all-important or controlling, and different directors may have attributed different weights to the various factors. The directors determined that the selection of the Adviser to manage the Fund and the overall arrangements between the Fund and the Adviser, as provided in the Advisory Agreement, including the advisory fee, were fair and reasonable in light of the services performed, expenses incurred and such other matters as the directors considered relevant in the exercise of their business judgment. The
| | |
| 126 | AB UNCONSTRAINED BOND FUND | | abfunds.com |
material factors and conclusions that formed the basis for the directors’ determinations included the following:
Nature, Extent and Quality of Services Provided
The directors considered the scope and quality of services provided by the Adviser under the Advisory Agreement, including the quality of the investment research capabilities of the Adviser and the other resources it has dedicated to performing services for the Fund. They also noted the professional experience and qualifications of the Fund’s portfolio management team and other senior personnel of the Adviser. The directors also considered that the Advisory Agreement provides that the Fund will reimburse the Adviser for the cost to it of providing certain clerical, accounting, administrative and other services to the Fund by employees of the Adviser or its affiliates. Requests for these reimbursements are made on a quarterly basis and subject to approval by the directors. Reimbursements, to the extent requested and paid, result in a higher rate of total compensation from the Fund to the Adviser than the fee rate stated in the Advisory Agreement. The directors noted that the methodology used to determine the reimbursement amounts had been reviewed by an independent consultant retained by the Fund’s Senior Officer. The quality of administrative and other services, including the Adviser’s role in coordinating the activities of the Fund’s other service providers, also was considered. The directors concluded that, overall, they were satisfied with the nature, extent and quality of services provided to the Fund under the Advisory Agreement.
Costs of Services Provided and Profitability
The directors reviewed a schedule of the revenues and expenses and related notes indicating the profitability of the Fund to the Adviser for calendar years 2014 and 2015 that had been prepared with an expense allocation methodology arrived at in consultation with an independent consultant retained by the Fund’s Senior Officer. The directors noted the assumptions and methods of allocation used by the Adviser in preparing fund-specific profitability data and understood that there are a number of potentially acceptable allocation methodologies for information of this type. The directors noted that the profitability information reflected all revenues and expenses of the Adviser’s relationship with the Fund, including those relating to its subsidiaries that provide transfer agency and distribution services to the Fund. The directors recognized that it is difficult to make comparisons of the profitability of the Advisory Agreement with the profitability of fund advisory contracts for unaffiliated funds because comparative information is not generally publicly available and is affected by numerous factors. The directors focused on the profitability of the Adviser’s relationship with the Fund before taxes and distribution expenses. The directors noted that the Fund was not profitable to the Adviser in the periods reviewed.
| | |
| abfunds.com | | AB UNCONSTRAINED BOND FUND | 127 |
Fall-Out Benefits
The directors considered the other benefits to the Adviser and its affiliates from their relationships with the Fund, including, but not limited to, benefits relating to 12b-1 fees and sales charges received by the Fund’s principal underwriter (which is a wholly owned subsidiary of the Adviser) in respect of certain classes of the Fund’s shares; and transfer agency fees paid by the Fund to a wholly owned subsidiary of the Adviser. The directors recognized that the Fund’s unprofitability to the Adviser would be exacerbated without these benefits. The directors understood that the Adviser also might derive reputational and other benefits from its association with the Fund.
Investment Results
In addition to the information reviewed by the directors in connection with the Meeting, the directors receive detailed performance information for the Fund at each regular Board meeting during the year.
At the Meeting, the directors reviewed information prepared by Broadridge Financial Solutions, Inc. (“Broadridge”), an analytical service that is not affiliated with the Adviser, showing the performance of the Class A Shares of the Fund against a peer group and a peer universe selected by Broadridge, and information prepared by the Adviser showing performance of the Class A Shares against a broad-based securities market index, in each case for the 1-, 3-, 5- and 10-year periods ended July 31, 2016 and (in the case of comparisons with the broad-based securities market index) for the period from inception. Based on their review, the directors concluded that the Fund’s investment performance was acceptable.
Advisory Fees and Other Expenses
The directors considered the advisory fee rate paid by the Fund to the Adviser and information prepared by Broadridge concerning advisory fee rates paid by other funds in the same Broadridge category as the Fund at a common asset level. The directors recognized that it is difficult to make comparisons of advisory fees because there are variations in the services that are included in the fees paid by other funds. The directors compared the Fund’s contractual effective advisory fee rate with a peer group median and took into account the impact on the advisory fee rate of the administrative expense reimbursement paid to the Adviser in the latest fiscal year.
The directors also considered the Adviser’s fee schedule for institutional clients pursuing a similar investment style. For this purpose, they reviewed the relevant advisory fee information from the Adviser’s Form ADV and the evaluation from the Fund’s Senior Officer and noted the differences between the Fund’s fee schedule, on the one hand, and the institutional fee schedule and the schedule of fees charged to any offshore funds and any sub-advised funds, on the other. The directors noted that the Adviser
| | |
| 128 | AB UNCONSTRAINED BOND FUND | | abfunds.com |
may, in some cases, agree to fee rates with large institutional clients that are lower than those reviewed by the directors and that they had previously discussed with the Adviser its policies in respect of such arrangements.
The Adviser reviewed with the directors the significantly greater scope of the services it provides to the Fund relative to institutional, offshore fund and sub-advised fund clients. In light of the substantial differences in services rendered by the Adviser to institutional, offshore fund and sub-advised fund clients as compared to funds such as the Fund, the directors considered these fee comparisons inapt and did not place significant weight on them in their deliberations.
The directors also considered the total expense ratio of the Class A shares of the Fund in comparison to a peer group and a peer universe selected by Broadridge. The Class A expense ratio of the Fund was based on the Fund’s latest fiscal year. The directors noted the effects of any fee waivers and/or expense reimbursements as a result of an undertaking by the Adviser. The directors noted that it was likely that the expense ratios of some of the other funds in the Fund’s Broadridge category were lowered by waivers or reimbursements by those funds’ investment advisers, which in some cases might be voluntary or temporary. The directors view expense ratio information as relevant to their evaluation of the Adviser’s services because the Adviser is responsible for coordinating services provided to the Fund by others. Based on their review, the directors concluded that the Fund’s expense ratio was acceptable.
Economies of Scale
The directors noted that the advisory fee schedule for the Fund contains breakpoints that reduce the fee rates on assets above specified levels. The directors took into consideration prior presentations by an independent consultant on economies of scale in the mutual fund industry and for the AB Funds, and by the Adviser concerning certain of its views on economies of scale. The directors also had requested and received from the Adviser certain updates on economies of scale in advance of the Meeting. The directors believe that economies of scale may be realized (if at all) by the Adviser across a variety of products and services, and not only in respect of a single fund. The directors noted that there is no established methodology for setting breakpoints that give effect to the fund-specific services provided by a fund’s adviser and to the economies of scale that an adviser may realize in its overall mutual fund business or those components of it which directly or indirectly affect a fund’s operations. The directors observed that in the mutual fund industry as a whole, as well as among funds similar to the Fund, there is no uniformity or pattern in the fees and asset levels at which breakpoints (if any) apply. The directors also noted that the advisory agreements for many funds do not have breakpoints at all. Having taken these factors into account, the directors concluded that the Fund’s shareholders would benefit from a sharing of economies of scale in the event the Fund’s net assets exceed a breakpoint in the future.
| | |
| abfunds.com | | AB UNCONSTRAINED BOND FUND | 129 |
This page is not part of the Shareholder Report or the Financial Statements.
AB FAMILY OF FUNDS
US EQUITY
US CORE
Core Opportunities Fund
FlexFee™ US Thematic Portfolio
Select US Equity Portfolio
US GROWTH
Concentrated Growth Fund
Discovery Growth Fund
FlexFee™ Large Cap Growth Portfolio
Growth Fund
Large Cap Growth Fund
Small Cap Growth Portfolio
US VALUE
Discovery Value Fund
Equity Income Fund
Relative Value Fund1
Small Cap Value Portfolio
Value Fund
INTERNATIONAL/ GLOBAL EQUITY
INTERNATIONAL/ GLOBAL CORE
Global Core Equity Portfolio
International Portfolio
International Strategic Core Portfolio
Sustainable Global Thematic Fund1
Tax-Managed International Portfolio
Tax-Managed Wealth Appreciation Strategy
Wealth Appreciation Strategy
INTERNATIONAL/ GLOBAL GROWTH
Concentrated International Growth Portfolio
International Growth Fund
INTERNATIONAL/ GLOBAL EQUITY (continued)
INTERNATIONAL/ GLOBAL VALUE
Asia ex-Japan Equity Portfolio
International Value Fund
FIXED INCOME
MUNICIPAL
High Income Municipal Portfolio
Intermediate California Municipal Portfolio
Intermediate Diversified Municipal Portfolio
Intermediate New York Municipal Portfolio
Municipal Bond Inflation Strategy
Tax-Aware Fixed Income Portfolio
National Portfolio
Arizona Portfolio
California Portfolio
Massachusetts Portfolio
Minnesota Portfolio
New Jersey Portfolio
New York Portfolio
Ohio Portfolio
Pennsylvania Portfolio
Virginia Portfolio
TAXABLE
Bond Inflation Strategy
FlexFee™ International Bond Portfolio
Global Bond Fund
High Income Fund
High Yield Portfolio
Income Fund
Intermediate Bond Portfolio
Limited Duration High Income Portfolio
Short Duration Portfolio
ALTERNATIVES
All Market Real Return Portfolio
Credit Long/Short Portfolio
Global Real Estate Investment Fund
Select US Long/Short Portfolio
Unconstrained Bond Fund
MULTI-ASSET
All Market Income Portfolio
All Market Total Return Portfolio1
Conservative Wealth Strategy
Emerging Markets Multi-Asset Portfolio
Global Risk Allocation Fund
Tax-Managed All Market Income Portfolio1
TARGET-DATE
Multi-Manager Select Retirement Allocation Fund
Multi-Manager Select 2010 Fund
Multi-Manager Select 2015 Fund
Multi-Manager Select 2020 Fund
Multi-Manager Select 2025 Fund
Multi-Manager Select 2030 Fund
Multi-Manager Select 2035 Fund
Multi-Manager Select 2040 Fund
Multi-Manager Select 2045 Fund
Multi-Manager Select 2050 Fund
Multi-Manager Select 2055 Fund
CLOSED-END FUNDS
Alliance California Municipal Income Fund
AllianceBernstein Global High Income Fund
AllianceBernstein National Municipal Income Fund
We also offer Government Money Market Portfolio1, which serves as the money market fund exchange vehicle for the AB mutual funds. An investment in Government Money Market Portfolio is not a deposit in a bank and is not insured or guaranteed by the Federal Deposit Insurance Corporation or any other government agency. Although the Fund seeks to preserve the value of your investment at $1.00 per share, it is possible to lose money by investing in the Fund.
Investors should consider the investment objectives, risks, charges and expenses of the Fund carefully before investing. For copies of our prospectus or summary prospectus, which contain this and other information, visit us online at www.abfunds.com or contact your AB representative. Please read the prospectus and/or summary prospectus carefully before investing.
| 1 | Prior to January 9, 2017, Relative Value Fund was named Growth & Income Fund; prior to April 17, 2017, Tax-Managed All Market Income Portfolio was named Tax-Managed Balanced Wealth Strategy; prior to April 24, 2017, All Market Total Return Portfolio was named Balanced Wealth Strategy; prior to November 10, 2017, Government Money Market Portfolio was named Government Exchange Reserves. |
| | |
| 130 | AB UNCONSTRAINED BOND FUND | | abfunds.com |
NOTES
| | |
| abfunds.com | | AB UNCONSTRAINED BOND FUND | 131 |
NOTES
| | |
| 132 | AB UNCONSTRAINED BOND FUND | | abfunds.com |

AB UNCONSTRAINED BOND FUND
1345 Avenue of the Americas
New York, NY 10105
800 221 5672
UB-0151-1017 
ITEM 2. CODE OF ETHICS.
(a) The registrant has adopted a code of ethics that applies to its principal executive officer, principal financial officer and principal accounting officer. A copy of the registrant’s code of ethics is filed herewith as Exhibit 12(a)(1).
(b) During the period covered by this report, no material amendments were made to the provisions of the code of ethics adopted in 2(a) above.
(c) During the period covered by this report, no implicit or explicit waivers to the provisions of the code of ethics adopted in 2(a) above were granted.
ITEM 3. AUDIT COMMITTEE FINANCIAL EXPERT.
The registrant’s Board of Directors has determined that independent directors Garry L. Moody, William H. Foulk, Jr. and Marshall C. Turner, Jr. qualify as audit committee financial experts.
ITEM 4. PRINCIPAL ACCOUNTANT FEES AND SERVICES.
(a) - (c) The following table sets forth the aggregate fees billed by the independent registered public accounting firm Ernst & Young LLP, for the Fund’s last two fiscal years for professional services rendered for: (i) the audit of the Fund’s annual financial statements included in the Fund’s annual report to stockholders; (ii) assurance and related services that are reasonably related to the performance of the audit of the Fund’s financial statements and are not reported under (i), which include advice and education related to accounting and auditing issues and quarterly press release review (for those Funds which issue press releases), and preferred stock maintenance testing (for those Funds that issue preferred stock); and (iii) tax compliance, tax advice and tax return preparation.
| | | | | | | | | | | | | | | | |
| | | | | | Audit Fees | | | Audit-Related
Fees | | | Tax Fees | |
AB Unconstrained Bond Fund | | | 2016 | | | $ | 107,809 | | | $ | 16 | | | $ | 27,772 | |
| | | 2017 | | | $ | 107,809 | | | $ | 41 | | | $ | 29,902 | |
(d) Not applicable.
(e) (1) Beginning with audit and non-audit service contracts entered into on or after May 6, 2003, the Fund’s Audit Committee policies and procedures require the pre-approval of all audit and non-audit services provided to the Fund by the Fund’s independent registered public accounting firm. The Fund’s Audit Committee policies and procedures also require pre-approval of all audit and non-audit services provided to the Adviser and Service Affiliates to the extent that these services are directly related to the operations or financial reporting of the Fund.
(e) (2) All of the amounts for Audit Fees, Audit-Related Fees and Tax Fees in the table under Item 4 (a) – (c) are for services pre-approved by the Fund’s Audit Committee.
(f) Not applicable.
(g) The following table sets forth the aggregate non-audit services provided to the Fund, the Fund’s Adviser and entities that control, are controlled by or under common control with the Adviser that provide ongoing services to the Fund:
| | | | | | | | | | | | |
| | | | | | All Fees for
Non-Audit Services
Provided to the
Portfolio, the Adviser
and Service Affiliates | | | Total Amount of
Foregoing Column Pre-
approved by the Audit
Committee
(Portion Comprised of
Audit Related Fees)
(Portion Comprised of
Tax Fees) | |
AB Unconstrained Bond Fund | | | 2016 | | | $ | 463,608 | | | $ | 27,788 | |
| | | | | | | | | | $ | (16 | ) |
| | | | | | | | | | $ | (27,772 | ) |
| | | |
| | | 2017 | | | $ | 753,058 | | | $ | 29,943 | |
| | | | | | | | | | $ | (41 | ) |
| | | | | | | | | | $ | (29,902 | ) |
(h) The Audit Committee of the Fund has considered whether the provision of any non-audit services not pre-approved by the Audit Committee provided by the Fund’s independent registered public accounting firm to the Adviser and Service Affiliates is compatible with maintaining the auditor’s independence.
ITEM 5. AUDIT COMMITTEE OF LISTED REGISTRANTS.
Not applicable to the registrant.
ITEM 6. SCHEDULE OF INVESTMENTS.
Please see Schedule of Investments contained in the Report to Shareholders included under Item 1 of this Form N-CSR.
ITEM 7. DISCLOSURE OF PROXY VOTING POLICIES AND PROCEDURES FOR CLOSED-END MANAGEMENT INVESTMENT COMPANIES.
Not applicable to the registrant.
ITEM 8. PORTFOLIO MANAGERS OF CLOSED-END MANAGEMENT INVESTMENT COMPANIES.
Not applicable to the registrant.
ITEM 9. PURCHASES OF EQUITY SECURITIES BY CLOSED-END MANAGEMENT INVESTMENT COMPANY AND AFFILIATED PURCHASERS.
Not applicable to the registrant.
ITEM 10. SUBMISSION OF MATTERS TO A VOTE OF SECURITY HOLDERS.
There have been no material changes to the procedures by which shareholders may recommend nominees to the Fund’s Board of Directors since the Fund last provided disclosure in response to this item.
ITEM 11. CONTROLS AND PROCEDURES.
(a) The registrant’s principal executive officer and principal financial officer have concluded that the registrant’s disclosure controls and procedures (as defined in Rule 30a-3 (c) under the Investment Company Act of 1940, as amended) are effective at the reasonable assurance level based on their evaluation of these controls and procedures as of a date within 90 days of the filing date of this document.
(b) There were no changes in the registrant’s internal controls over financial reporting that occurred during the second fiscal quarter of the period that has materially affected, or is reasonably likely to materially affect, the registrant’s internal control over financial reporting.
ITEM 12. EXHIBITS.
The following exhibits are attached to this Form N-CSR:
| | |
EXHIBIT NO. | | DESCRIPTION OF EXHIBIT |
| |
| 12 (a) (1) | | Code of Ethics that is subject to the disclosure of Item 2 hereof |
| |
| 12 (b) (1) | | Certification of Principal Executive Officer Pursuant to Section 302 of the Sarbanes-Oxley Act of 2002 |
| |
| 12 (b) (2) | | Certification of Principal Financial Officer Pursuant to Section 302 of the Sarbanes-Oxley Act of 2002 |
| |
| 12 (c) | | Certification of Principal Executive Officer and Principal Financial Officer Pursuant to Section 906 of the Sarbanes-Oxley Act of 2002 |
SIGNATURES
Pursuant to the requirements of the Securities Exchange Act of 1934 and the Investment Company Act of 1940, the registrant has duly caused this report to be signed on its behalf by the undersigned, thereunto duly authorized.
(Registrant): AB Unconstrained Bond Fund, Inc.
| | |
| By: | | /s/ Robert M. Keith |
| | Robert M. Keith |
| | President |
Date: December 29, 2017
Pursuant to the requirements of the Securities Exchange Act of 1934 and the Investment Company Act of 1940, this report has been signed below by the following persons on behalf of the registrant and in the capacities and on the dates indicated.
| | |
| By: | | /s/ Robert M. Keith |
| | Robert M. Keith |
| | President |
Date: December 29, 2017
| | |
| By: | | /s/ Joseph J. Mantineo |
| | Joseph J. Mantineo |
| | Treasurer and Chief Financial Officer |
Date: December 29, 2017