                                  UNITED STATES
                       SECURITIES AND EXCHANGE COMMISSION
                             Washington, D.C. 20549

                                   FORM N-CSR
                   CERTIFIED SHAREHOLDER REPORT OF REGISTERED
                         MANAGEMENT INVESTMENT COMPANIES


Investment Company Act file number           811-0816
                                   ---------------------------------------------


                       AMERICAN CENTURY MUTUAL FUNDS, INC.
- --------------------------------------------------------------------------------
               (Exact name of registrant as specified in charter)


      4500 MAIN STREET, KANSAS CITY, MISSOURI              64111
- --------------------------------------------------------------------------------
     (Address of principal executive offices)            (Zip code)


         WILLIAM M. LYONS, 4500 MAIN STREET, KANSAS CITY, MISSOURI 64111
- --------------------------------------------------------------------------------
                    (Name and address of agent for service)


Registrant's telephone number, including area code:    816-531-5575
                                                    ----------------------------

Date of fiscal year end:      10-31
                          ------------------------------------------------------

Date of reporting period:     10-31-2006
                          ------------------------------------------------------


ITEM 1.  REPORTS TO STOCKHOLDERS.


[front cover]

American Century Investments
Annual Report

October 31, 2006

[photo of winter scene]

Ultra(reg.sm) Fund

[american century investments logo and text logo]


Our Message to You

[photo of James E. Stowers III and James E. Stowers, Jr.]

/s/James E. Stowers, Jr.
James E. Stowers, Jr.
FOUNDER
AMERICAN CENTURY COMPANIES, INC.

/s/James E. Stowers III
James E. Stowers III
CHAIRMAN OF THE BOARD
AMERICAN CENTURY COMPANIES, INC.

We are pleased to provide you with the annual report for the American Century
Ultra Fund for the 12 months ended October 31, 2006. We hope you find this
information helpful in monitoring your investment. Another useful resource we
offer is our website, americancentury.com, where we post quarterly portfolio
commentaries, the views of senior investment officers and analysts, and other
communications about investments, portfolio strategy, personal finance, and the
markets.

In its most recent rankings, Dalbar -- which issues customer satisfaction
ratings and rankings based on website functionality -- ranked
americancentury.com seventh out of the sites provided by the top 25 fund
companies that it believes lead the industry in web-based technology. Our
website earned an "Excellent" rating, Dalbar's highest designation.

For most of 2006, our website has linked visitors to information explaining our
strategic collaboration with Lance Armstrong and the Lance Armstrong Foundation
(LAF). This campaign, featuring Lance, is designed to encourage investors to
take a more active role in planning their financial futures and make every
investment decision count. To learn more about the collaboration and the LAF,
please visit americancentury.com or www.lanceface.com on the Web and click on
the links to related sites.

With the approach of year end and the 2006 tax season, you can also find out
more about December fund distributions and tax information via a link from our
website. We've posted December distribution estimates for over 50 funds, answers
to frequent distribution questions, and online descriptions of all of the tax
information we provide to investors.

If you haven't visited americancentury.com yet, we encourage you to do so...it's
there to serve you. And so are we. As always, we deeply appreciate your
commitment to American Century Investments.


Table of Contents

Market Perspective. . . . . . . . . . . . . . . . . . . . . . . . . . . . . 2
   One-Year Total Returns . . . . . . . . . . . . . . . . . . . . . . . . . 2

ULTRA
Performance . . . . . . . . . . . . . . . . . . . . . . . . . . . . . . . . 3
Portfolio Commentary. . . . . . . . . . . . . . . . . . . . . . . . . . . . 5
   Top Ten Holdings . . . . . . . . . . . . . . . . . . . . . . . . . . . . 5
   Top Five Industries  . . . . . . . . . . . . . . . . . . . . . . . . . . 6
   Types of Investments in Portfolio  . . . . . . . . . . . . . . . . . . . 6
Shareholder Fee Example . . . . . . . . . . . . . . . . . . . . . . . . . . 7
Schedule of Investments . . . . . . . . . . . . . . . . . . . . . . . . . . 9

FINANCIAL STATEMENTS
Statement of Assets and Liabilities . . . . . . . . . . . . . . . . . . . .12
Statement of Operations . . . . . . . . . . . . . . . . . . . . . . . . . .14
Statement of Changes in Net Assets. . . . . . . . . . . . . . . . . . . . .15
Notes to Financial Statements . . . . . . . . . . . . . . . . . . . . . . .16
Financial Highlights. . . . . . . . . . . . . . . . . . . . . . . . . . . .23
Report of Independent Registered Public Accounting Firm . . . . . . . . . .28

OTHER INFORMATION
Management. . . . . . . . . . . . . . . . . . . . . . . . . . . . . . . . .29
Approval of Management Agreement for Ultra. . . . . . . . . . . . . . . . .32
Share Class Information . . . . . . . . . . . . . . . . . . . . . . . . . .37
Additional Information. . . . . . . . . . . . . . . . . . . . . . . . . . .38
Index Definitions . . . . . . . . . . . . . . . . . . . . . . . . . . . . .39

The opinions expressed in the Market Perspective and the Portfolio Commentary
reflect those of the portfolio management team as of the date of the report, and
do not necessarily represent the opinions of American Century or any other
person in the American Century organization. Any such opinions are subject to
change at any time based upon market or other conditions and American Century
disclaims any responsibility to update such opinions. These opinions may not be
relied upon as investment advice and, because investment decisions made by
American Century funds are based on numerous factors, may not be relied upon as
an indication of trading intent on behalf of any American Century fund. Security
examples are used for representational purposes only and are not intended as
recommendations to purchase or sell securities. Performance information for
comparative indices and securities is provided to American Century by third
party vendors. To the best of American Century's knowledge, such information is
accurate at the time of printing.


Market Perspective

[photo of Mark Mallon]

BY MARK MALLON, CHIEF INVESTMENT OFFICER, AMERICAN CENTURY INVESTMENTS

ECONOMIC GROWTH SURGED, THEN MODERATED

Economic growth -- along with commodity prices, short-term interest rates, and
inflation -- surged early in the 12-month period ended October 31, 2006. But
growth and inflation moderated in the period's second half, which saw the
Federal Reserve end its two-year string of interest rate hikes.

After a hurricane-related slowdown in the fourth quarter of 2005, U.S. gross
domestic product grew in the first quarter of 2006 at a 5.6% annualized pace,
the highest level in more than two years. The Fed steadily raised short-term
interest rates through June to keep inflation in check, including pressures from
soaring commodity prices. The Fed finally snapped its string of rate hikes in
August 2006, leaving its target at 5.25%, a five-year high. By then, economic
growth had slowed, dragged down in part by a cooling housing market.

BEST FISCAL-YEAR STOCK RETURNS SINCE 2003

The Fed's pause and expectations for lower interest rates and mild inflation
going forward helped produce the best U.S. stock returns for a 12-month fiscal
period ended October 31 since 2003. Market rallies beginning and ending the
period offset a late-spring/early-summer selloff. Growth stocks flourished in
the latter rally, but value stocks outperformed growth for the full reporting
period. Likewise, though large-cap stocks gained ground late in the period,
small-caps posted higher returns for the entire 12-month stretch.

In the first half of the 12-month period, investors celebrated a dip in crude
oil prices and strong economic growth by pushing stock prices higher. The
small-cap Russell 2000 Index led the way, surging 18.91%. Sentiment changed in
early May, however, when the Fed made it clear that more interest rate hikes
might be necessary to control inflation. Between April 30 and July 15, the S&P
500 fell 5.28%, and the Russell 2000 more than doubled that loss as investors
desired larger, more stable companies.

The selloff ended in late July after Fed chairman Ben Bernanke predicted
inflation would moderate. The Fed's subsequent rate pause in August and plunging
energy prices allowed stocks to rebound nicely in the last three months of the
reporting period.

ONE-YEAR TOTAL RETURNS AS OF OCTOBER 31, 2006
- --------------------------------------------------------------------------------
S&P 500 Index                                                     16.34%
- --------------------------------------------------------------------------------
Dow Jones Industrial Average                                      18.47%
- --------------------------------------------------------------------------------
Nasdaq Composite Index                                            12.48%
- --------------------------------------------------------------------------------


- ------
2


Ultra - Performance

TOTAL RETURNS AS OF OCTOBER 31, 2006
                                         ------------------------------
                                             AVERAGE ANNUAL RETURNS
- ------------------------------------------------------------------------------------
                                                               SINCE       INCEPTION
                                1 YEAR   5 YEARS   10 YEARS   INCEPTION       DATE
- ------------------------------------------------------------------------------------
INVESTOR CLASS                  -1.51%    2.70%      5.28%     12.56%        11/2/81
- ------------------------------------------------------------------------------------
RUSSELL 1000 GROWTH INDEX(1)    10.84%    4.07%      5.76%     11.42%(2)       --
- ------------------------------------------------------------------------------------
S&P 500 INDEX(1)                16.34%    7.26%      8.64%     13.29%(2)       --
- ------------------------------------------------------------------------------------
Institutional Class             -1.33%    2.91%        --       5.07%       11/14/96
- ------------------------------------------------------------------------------------
Advisor Class                   -1.75%    2.45%      5.03%      4.98%        10/2/96
- ------------------------------------------------------------------------------------
C Class                         -2.50%    1.67%        --       1.32%       10/29/01
- ------------------------------------------------------------------------------------
R Class                         -1.98%      --         --       3.98%        8/29/03
- ------------------------------------------------------------------------------------

(1) Data provided by Lipper Inc. -- A Reuters Company. (c) 2006 Reuters. All
    rights reserved. Any copying, republication or redistribution of Lipper
    content, including by caching, framing or similar means, is expressly
    prohibited without the prior written consent of Lipper. Lipper shall not be
    liable for any errors or delays in the content, or for any actions taken in
    reliance thereon.

    The data contained herein has been obtained from company reports, financial
    reporting services, periodicals and other resources believed to be reliable.
    Although carefully verified, data on compilations is not guaranteed by
    Lipper and may be incomplete. No offer or solicitations to buy or sell any
    of the securities herein is being made by Lipper.

(2) Since 10/31/81, the date nearest the Investor Class's inception for which
    data are available.

Data presented reflect past performance. Past performance is no guarantee of
future results. Current performance may be higher or lower than the performance
shown. Investment return and principal value will fluctuate, and redemption
value may be more or less than original cost. To obtain performance data current
to the most recent month end, please call 1-800-345-2021 or visit
americancentury.com.

Unless otherwise indicated, performance reflects Investor Class shares;
performance for other share classes will vary due to differences in fee
structure. For information about other share classes available, please consult
the prospectus. Data assumes reinvestment of dividends and capital gains, and
none of the charts reflect the deduction of taxes that a shareholder would pay
on fund distributions or the redemption of fund shares. Returns for the indices
are provided for comparison. The fund's total returns include operating expenses
(such as transaction costs and management fees) that reduce returns, while the
total returns of the indices do not.

(continued)


- ------
3


Ultra - Performance

GROWTH OF $10,000 OVER 10 YEARS

$10,000 investment made October 31, 1996
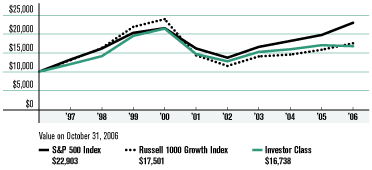
ONE-YEAR RETURNS OVER 10 YEARS
Periods ended October 31
- -------------------------------------------------------------------------------------------------------
1997 1998 1999 2000 2001 2002 2003 2004 2005 2006
- -------------------------------------------------------------------------------------------------------
Investor Class 19.95% 17.61% 37.94% 9.81% -31.44% -12.99% 19.50% 4.46% 6.81% -1.51%
- -------------------------------------------------------------------------------------------------------
Russell 1000
Growth Index 30.47% 24.64% 34.25% 9.33% -39.95% -19.62% 21.81% 3.38% 8.81% 10.84%
- -------------------------------------------------------------------------------------------------------
S&P 500 Index 32.11% 21.99% 25.67% 6.09% -24.90% -15.11% 20.80% 9.42% 8.72% 16.34%
- -------------------------------------------------------------------------------------------------------
Data presented reflect past performance. Past performance is no guarantee of
future results. Current performance may be higher or lower than the performance
shown. Investment return and principal value will fluctuate, and redemption
value may be more or less than original cost. To obtain performance data current
to the most recent month end, please call 1-800-345-2021 or visit
americancentury.com.
Unless otherwise indicated, performance reflects Investor Class shares;
performance for other share classes will vary due to differences in fee
structure. For information about other share classes available, please consult
the prospectus. Data assumes reinvestment of dividends and capital gains, and
none of the charts reflect the deduction of taxes that a shareholder would pay
on fund distributions or the redemption of fund shares. Returns for the indices
are provided for comparison. The fund's total returns include operating expenses
(such as transaction costs and management fees) that reduce returns, while the
total returns of the indices do not.
- ------
4
Ultra - Portfolio Commentary
PORTFOLIO MANAGERS: TOM TELFORD, WADE SLOME, AND JERRY SULLIVAN
PERFORMANCE SUMMARY
Ultra declined 1.51%* during the 12 months ended October 31, 2006, trailing the
10.84% return of its benchmark, the Russell 1000 Growth Index, and the 16.34%
return of the S&P 500 Index.
As outlined in the Market Perspective on page 2, a pause in the Federal
Reserve's interest rate hikes and expectations for lower interest rates and mild
inflation going forward helped produce U.S. stock index returns in the 10-25%
range for the 12-month period. We'll discuss why Ultra didn't match those
returns and what we're doing to address that issue.
MANAGEMENT CHANGES, PROCESS ENHANCEMENTS
Tom Telford joined Ultra as co-portfolio manager at the beginning of July,
replacing Bruce Wimberly. A 10-year American Century veteran, Tom previously
served as co-manager on three of the company's growth portfolios. He continues
managing the American Century Technology Fund but has relinquished his previous
portfolio management roles. Wade Slome and Jerry Sullivan remained co-managers
of Ultra in the reporting period.
Upon reviewing our investment strategy, we have developed several process
enhancements to more successfully identify and invest in companies exhibiting
improving fundamentals and stock price momentum. Ultra built its reputation by
focusing on those two factors; the process enhancements simply provide a more
sophisticated means of capturing the upside performance potential those factors
offer.
REASONS ULTRA UNDERPERFORMED
Ultra's underperformance in the 12-month period largely reflected an overweight
portfolio allocation and unfavorable security selection in two traditional
growth-stock sectors -- information technology and consumer discretionary --
that performed relatively poorly until late in the period. It also reflected
underweight allocations in industrials and materials, sectors the market favored
in the first half of the reporting period, when they benefited from rising
commodity prices and capital investment.
The same sectors that caused most of Ultra's relative underperformance also
detracted from its total return. However,
TOP TEN HOLDINGS AS OF OCTOBER 31, 2006
- --------------------------------------------------------------------------------
% OF % OF
NET ASSETS NET ASSETS
AS OF AS OF
10/31/06 4/30/06
- --------------------------------------------------------------------------------
Cisco Systems Inc. 3.2% 0.9%
- --------------------------------------------------------------------------------
Google Inc. Cl A 3.1% 1.6%
- --------------------------------------------------------------------------------
UnitedHealth
Group Incorporated 3.0% 2.7%
- --------------------------------------------------------------------------------
International
Game Technology 2.9% 2.7%
- --------------------------------------------------------------------------------
Electronic Arts Inc. 2.5% 2.9%
- --------------------------------------------------------------------------------
Fisher Scientific
International 2.4% 0.6%
- --------------------------------------------------------------------------------
Wells Fargo & Co. 2.2% 1.1%
- --------------------------------------------------------------------------------
Kohl's Corp. 2.1% --
- --------------------------------------------------------------------------------
Apple Computer, Inc. 2.0% 0.4%
- --------------------------------------------------------------------------------
Procter &
Gamble Co. (The) 2.0% 0.9%
- --------------------------------------------------------------------------------
*All fund returns referenced in this commentary
are for Investor Class shares. (continued)
- ------
5
Ultra - Portfolio Commentary
the portfolio realized positive contributions from financial stocks, primarily
commercial banks and diversified financial services firms that benefited from
relatively stable interest rates in a growing economy. Stakes in wireless
telecommunications companies also limited the portfolio's absolute losses, as
did its few investments in the industrials sector.
LAGGING -- AND LEADING -- INDIVIDUAL PERFORMERS
During the latest reporting period, Internet-related businesses accounted for
three of our four worst relative individual performers. Those stocks -- eBay,
Yahoo! and Amazon.com -- all encountered mounting revenue and competition
concerns. With our focus on stocks exhibiting price momentum and accelerating
financial features, we reduced or eliminated our stakes in those companies.
Ultra's second-biggest individual overweight holding, Teva Pharmaceuticals, also
ranked among its top five leading detractors. The generic drug maker's stock
fell 13% in the period as larger branded-drug rivals, including Merck,
introduced generic versions of their own drugs to limit Teva's market presence.
Fortunately, Ultra's largest average overweight holding, International Game
Technology, topped its list of best, not worst, performers. Shares in the
slot-machine maker surged 63% as global demand for gaming machines continued to
expand.
PORTFOLIO OBJECTIVE & EXPECTATIONS
Ultra seeks long-term capital appreciation for investors who can tolerate
short-term share price fluctuation. As part of a diversified investment
portfolio, Ultra provides consistent exposure to large-cap growth stocks. We
pursue our objective by investing in companies with improving business
fundamentals and the ability to sustain above-average growth rates over time.
Our approach seeks industry leaders with competitive advantages, strong
management, and a solid financial picture that can support continued improvement
and growth. We believe investments in such firms will generate long-term
benefits for investors.
TOP FIVE INDUSTRIES AS OF OCTOBER 31, 2006
- --------------------------------------------------------------------------------
% OF % OF
NET ASSETS NET ASSETS
AS OF AS OF
10/31/06 4/30/06
- --------------------------------------------------------------------------------
Hotels, Restaurants
& Leisure 7.8% 7.1%
- --------------------------------------------------------------------------------
Capital Markets 7.5% 2.8%
- --------------------------------------------------------------------------------
Communications
Equipment 5.8% 3.5%
- --------------------------------------------------------------------------------
Software 5.6% 6.1%
- --------------------------------------------------------------------------------
Internet Software
& Services 4.6% 8.5%
- --------------------------------------------------------------------------------
TYPES OF INVESTMENTS IN PORTFOLIO
- --------------------------------------------------------------------------------
% OF % OF
NET ASSETS NET ASSETS
AS OF AS OF
10/31/06 4/30/06
- --------------------------------------------------------------------------------
Domestic Common Stocks 89.8% 91.6%
- --------------------------------------------------------------------------------
Foreign Common Stocks 8.6% 7.3%
- --------------------------------------------------------------------------------
TOTAL EQUITY EXPOSURE 98.4% 98.9%
- --------------------------------------------------------------------------------
Temporary
Cash Investments 2.2% 1.2%
- --------------------------------------------------------------------------------
Other Assets
and Liabilities(1) (0.6)% (0.1)%
- --------------------------------------------------------------------------------
(1) Includes collateral received for securities lending and other assets
and liabilities.
- ------
6
Shareholder Fee Example (Unaudited)
Fund shareholders may incur two types of costs: (1) transaction costs, including
sales charges (loads) on purchase payments and redemption/exchange fees; and (2)
ongoing costs, including management fees; distribution and service (12b-1) fees;
and other fund expenses. This example is intended to help you understand your
ongoing costs (in dollars) of investing in your fund and to compare these costs
with the ongoing cost of investing in other mutual funds.
The example is based on an investment of $1,000 made at the beginning of the
period and held for the entire period from May 1, 2006 to October 31, 2006.
ACTUAL EXPENSES
The table provides information about actual account values and actual expenses
for each class. You may use the information, together with the amount you
invested, to estimate the expenses that you paid over the period. First,
identify the share class you own. Then simply divide your account value by
$1,000 (for example, an $8,600 account value divided by $1,000 = 8.6), then
multiply the result by the number under the heading "Expenses Paid During
Period" to estimate the expenses you paid on your account during this period.
If you hold Investor Class shares of any American Century fund, or Institutional
Class shares of the American Century Diversified Bond Fund, in an American
Century account (i.e., not a financial intermediary or retirement plan account),
American Century may charge you a $12.50 semiannual account maintenance fee if
the value of those shares is less than $10,000. We will redeem shares
automatically in one of your accounts to pay the $12.50 fee. In determining your
total eligible investment amount, we will include your investments in all
PERSONAL ACCOUNTS (including American Century Brokerage accounts) registered
under your Social Security number. PERSONAL ACCOUNTS include individual
accounts, joint accounts, UGMA/UTMA accounts, personal trusts, Coverdell
Education Savings Accounts and IRAs (including traditional, Roth, Rollover,
SEP-, SARSEP- and SIMPLE-IRAs), and certain other retirement accounts. If you
have only business, business retirement, employer-sponsored or American Century
Brokerage accounts, you are currently not subject to this fee. We will not
charge the fee as long as you choose to manage your accounts exclusively online.
If you are subject to the Account Maintenance Fee, your account value could be
reduced by the fee amount.
HYPOTHETICAL EXAMPLE FOR COMPARISON PURPOSES
The table also provides information about hypothetical account values and
hypothetical expenses based on the actual expense ratio of each class of your
fund and an assumed rate of return of 5% per year before expenses, which is not
the actual return of a fund's share class. The hypothetical account values and
expenses may not be used to estimate the actual ending account balance or
expenses you paid for the period. You may use this information to compare the
ongoing costs of investing in your fund and other funds. To do so, compare this
5% hypothetical example with the 5% hypothetical examples that appear in the
shareholder reports of the other funds.
(continued)
- ------
7
Shareholder Fee Example (Unaudited)
Please note that the expenses shown in the table are meant to highlight your
ongoing costs only and do not reflect any transactional costs, such as sales
charges (loads) or redemption/exchange fees. Therefore, the table is useful in
comparing ongoing costs only, and will not help you determine the relative total
costs of owning different funds. In addition, if these transactional costs were
included, your costs would have been higher.
- -----------------------------------------------------------------------------------
EXPENSES PAID
BEGINNING ENDING DURING PERIOD* ANNUALIZED
ACCOUNT VALUE ACCOUNT VALUE 5/1/06 - EXPENSE
5/1/06 10/31/06 10/31/06 RATIO*
- -----------------------------------------------------------------------------------
ULTRA SHAREHOLDER FEE EXAMPLE
- -----------------------------------------------------------------------------------
ACTUAL
- -----------------------------------------------------------------------------------
Investor Class $1,000 $954.80 $4.88 0.99%
- -----------------------------------------------------------------------------------
Institutional Class $1,000 $956.00 $3.89 0.79%
- -----------------------------------------------------------------------------------
Advisor Class $1,000 $953.90 $6.11 1.24%
- -----------------------------------------------------------------------------------
C Class $1,000 $949.80 $9.78 1.99%
- -----------------------------------------------------------------------------------
R Class $1,000 $952.60 $7.33 1.49%
- -----------------------------------------------------------------------------------
HYPOTHETICAL
- -----------------------------------------------------------------------------------
Investor Class $1,000 $1,020.21 $5.04 0.99%
- -----------------------------------------------------------------------------------
Institutional Class $1,000 $1,021.22 $4.02 0.79%
- -----------------------------------------------------------------------------------
Advisor Class $1,000 $1,018.95 $6.31 1.24%
- -----------------------------------------------------------------------------------
C Class $1,000 $1,015.17 $10.11 1.99%
- -----------------------------------------------------------------------------------
R Class $1,000 $1,017.69 $7.58 1.49%
- -----------------------------------------------------------------------------------
*Expenses are equal to the class's annualized expense ratio listed in the table
above, multiplied by the average account value over the period, multiplied by
184, the number of days in the most recent fiscal half-year, divided by 365, to
reflect the one-half year period.
- ------
8
Ultra - Schedule of Investments
OCTOBER 31, 2006
Shares ($ IN THOUSANDS) Value
- --------------------------------------------------------------------------------
COMMON STOCKS -- 98.4%
AEROSPACE & DEFENSE -- 2.9%
- --------------------------------------------------------------------------------
2,419,000 Boeing Co. $ 193,181
- --------------------------------------------------------------------------------
3,634,000 United Technologies Corp. 238,827
- --------------------------------------------------------------------------------
432,008
- --------------------------------------------------------------------------------
AIR FREIGHT & LOGISTICS -- 1.8%
- --------------------------------------------------------------------------------
1,811,000 C.H. Robinson Worldwide Inc.(1) 75,591
- --------------------------------------------------------------------------------
1,628,600 FedEx Corporation 186,540
- --------------------------------------------------------------------------------
262,131
- --------------------------------------------------------------------------------
AIRLINES -- 0.9%
- --------------------------------------------------------------------------------
2,721,000 US Airways Group Inc.(2) 135,669
- --------------------------------------------------------------------------------
BEVERAGES -- 1.8%
- --------------------------------------------------------------------------------
4,166,000 PepsiCo, Inc. 264,291
- --------------------------------------------------------------------------------
BIOTECHNOLOGY -- 2.6%
- --------------------------------------------------------------------------------
3,043,000 Amgen Inc.(2) 230,994
- --------------------------------------------------------------------------------
1,903,000 Genentech, Inc.(1)(2) 158,520
- --------------------------------------------------------------------------------
389,514
- --------------------------------------------------------------------------------
CAPITAL MARKETS -- 7.5%
- --------------------------------------------------------------------------------
1,733,000 Franklin Resources, Inc. 197,493
- --------------------------------------------------------------------------------
1,069,000 Goldman Sachs
Group, Inc. (The) 202,886
- --------------------------------------------------------------------------------
3,165,000 Morgan Stanley 241,901
- --------------------------------------------------------------------------------
5,931,000 T. Rowe Price Group Inc. 280,595
- --------------------------------------------------------------------------------
12,584,000 TD Ameritrade Holding Corp.(1) 207,258
- --------------------------------------------------------------------------------
1,130,133
- --------------------------------------------------------------------------------
CHEMICALS -- 2.2%
- --------------------------------------------------------------------------------
3,204,000 Ecolab Inc.(1) 145,301
- --------------------------------------------------------------------------------
4,255,000 Monsanto Co. 188,157
- --------------------------------------------------------------------------------
333,458
- --------------------------------------------------------------------------------
COMMERCIAL BANKS -- 2.2%
- --------------------------------------------------------------------------------
9,232,000 Wells Fargo & Co.(1) 335,029
- --------------------------------------------------------------------------------
COMMUNICATIONS EQUIPMENT -- 5.8%
- --------------------------------------------------------------------------------
19,724,000 Cisco Systems Inc.(2) 475,940
- --------------------------------------------------------------------------------
6,935,000 Motorola, Inc. 159,921
- --------------------------------------------------------------------------------
6,505,000 QUALCOMM Inc. 236,717
- --------------------------------------------------------------------------------
872,578
- --------------------------------------------------------------------------------
COMPUTERS & PERIPHERALS -- 2.0%
- --------------------------------------------------------------------------------
3,713,000 Apple Computer, Inc.(2) 301,050
- --------------------------------------------------------------------------------
CONSUMER FINANCE -- 1.9%
- --------------------------------------------------------------------------------
5,816,000 SLM Corporation 283,123
- --------------------------------------------------------------------------------
DIVERSIFIED -- 0.6%
- --------------------------------------------------------------------------------
1,026,000 iShares FTSE/Xinhua
China 25 Index Fund(1) 87,672
- --------------------------------------------------------------------------------
Shares ($ IN THOUSANDS) Value
- --------------------------------------------------------------------------------
DIVERSIFIED FINANCIAL SERVICES -- 2.8%
- --------------------------------------------------------------------------------
333,000 Chicago Mercantile Exchange
Holdings Inc.(1) $ 166,833
- --------------------------------------------------------------------------------
3,727,000 Moody's Corp. 247,100
- --------------------------------------------------------------------------------
413,933
- --------------------------------------------------------------------------------
ENERGY EQUIPMENT & SERVICES -- 0.6%
- --------------------------------------------------------------------------------
1,511,000 Schlumberger Ltd. 95,314
- --------------------------------------------------------------------------------
FOOD & STAPLES RETAILING -- 3.8%
- --------------------------------------------------------------------------------
2,663,000 Costco Wholesale Corporation 142,151
- --------------------------------------------------------------------------------
22,611,000 Wal-Mart de Mexico
SA de CV, Series V ORD(2) 78,510
- --------------------------------------------------------------------------------
2,373,000 Wal-Mart Stores, Inc. 116,941
- --------------------------------------------------------------------------------
5,375,000 Walgreen Co. 234,780
- --------------------------------------------------------------------------------
572,382
- --------------------------------------------------------------------------------
HEALTH CARE EQUIPMENT & SUPPLIES -- 4.6%
- --------------------------------------------------------------------------------
4,865,000 Baxter International, Inc. 223,644
- --------------------------------------------------------------------------------
4,983,000 Stryker Corp. 260,562
- --------------------------------------------------------------------------------
2,153,412 Varian Medical Systems, Inc.(2) 118,136
- --------------------------------------------------------------------------------
1,132,000 Zimmer Holdings Inc.(1)(2) 81,515
- --------------------------------------------------------------------------------
683,857
- --------------------------------------------------------------------------------
HEALTH CARE PROVIDERS & SERVICES -- 4.2%
- --------------------------------------------------------------------------------
2,788,000 Express Scripts, Inc.(2) 177,651
- --------------------------------------------------------------------------------
9,350,000 UnitedHealth
Group Incorporated 456,093
- --------------------------------------------------------------------------------
633,744
- --------------------------------------------------------------------------------
HOTELS, RESTAURANTS & LEISURE -- 7.8%
- --------------------------------------------------------------------------------
3,340,000 Carnival Corporation 163,059
- --------------------------------------------------------------------------------
457,361 Chipotle Mexican
Grill Inc. Cl A(1)(2) 27,396
- --------------------------------------------------------------------------------
10,163,000 International Game Technology 432,029
- --------------------------------------------------------------------------------
3,757,000 McDonald's Corporation 157,493
- --------------------------------------------------------------------------------
5,925,000 Starbucks Corporation(2) 223,669
- --------------------------------------------------------------------------------
2,777,000 Yum! Brands, Inc. 165,120
- --------------------------------------------------------------------------------
1,168,766
- --------------------------------------------------------------------------------
HOUSEHOLD PRODUCTS -- 2.0%
- --------------------------------------------------------------------------------
4,655,000 Procter & Gamble Co. (The) 295,080
- --------------------------------------------------------------------------------
INSURANCE -- 3.9%
- --------------------------------------------------------------------------------
4,311,000 Aflac Inc. 193,650
- --------------------------------------------------------------------------------
2,622,000 Ambac Financial Group, Inc. 218,910
- --------------------------------------------------------------------------------
1,075 Berkshire Hathaway Inc. Cl A(1)(2) 113,386
- --------------------------------------------------------------------------------
15,858 Berkshire Hathaway Inc. Cl B(1)(2) 55,741
- --------------------------------------------------------------------------------
581,687
- --------------------------------------------------------------------------------
INTERNET SOFTWARE & SERVICES -- 4.6%
- --------------------------------------------------------------------------------
2,256,000 Digital River Inc.(1)(2)(3) 130,510
- --------------------------------------------------------------------------------
2,933,000 eBay Inc.(2) 94,237
- --------------------------------------------------------------------------------
968,000 Google Inc. Cl A(2) 461,145
- --------------------------------------------------------------------------------
685,892
- --------------------------------------------------------------------------------
See Notes to Financial Statements. (continued)
- ------
9
Ultra - Schedule of Investments
OCTOBER 31, 2006
Shares ($ IN THOUSANDS) Value
- --------------------------------------------------------------------------------
IT SERVICES -- 3.0%
- --------------------------------------------------------------------------------
4,812,000 First Data Corp. $ 116,691
- --------------------------------------------------------------------------------
1,294,921 Fiserv, Inc.(2) 63,969
- --------------------------------------------------------------------------------
6,729,000 Paychex, Inc. 265,661
- --------------------------------------------------------------------------------
446,321
- --------------------------------------------------------------------------------
LIFE SCIENCES TOOLS & SERVICES -- 2.4%
- --------------------------------------------------------------------------------
4,230,000 Fisher Scientific International(2) 362,173
- --------------------------------------------------------------------------------
MACHINERY -- 2.0%
- --------------------------------------------------------------------------------
4,099,000 Danaher Corp.(1) 294,185
- --------------------------------------------------------------------------------
METALS & MINING -- 0.6%
- --------------------------------------------------------------------------------
1,505,000 Rio Tinto plc ORD 83,028
- --------------------------------------------------------------------------------
MULTILINE RETAIL -- 3.7%
- --------------------------------------------------------------------------------
4,385,000 Kohl's Corp.(2) 309,581
- --------------------------------------------------------------------------------
4,151,000 Target Corp. 245,656
- --------------------------------------------------------------------------------
555,237
- --------------------------------------------------------------------------------
OIL, GAS & CONSUMABLE FUELS -- 3.2%
- --------------------------------------------------------------------------------
2,650,000 EnCana Corp. 125,849
- --------------------------------------------------------------------------------
2,128,000 Exxon Mobil Corp. 151,982
- --------------------------------------------------------------------------------
2,699,000 Suncor Energy Inc.(1) 206,878
- --------------------------------------------------------------------------------
484,709
- --------------------------------------------------------------------------------
PHARMACEUTICALS -- 2.2%
- --------------------------------------------------------------------------------
4,397,000 Abbott Laboratories 208,902
- --------------------------------------------------------------------------------
3,658,000 Teva Pharmaceutical
Industries Ltd. ADR(1) 120,604
- --------------------------------------------------------------------------------
329,506
- --------------------------------------------------------------------------------
SEMICONDUCTORS &
SEMICONDUCTOR EQUIPMENT -- 2.6%
- --------------------------------------------------------------------------------
3,124,500 ASML Holding N.V.
New York Shares(1)(2) 71,364
- --------------------------------------------------------------------------------
5,704,000 ASML Holding N.V. ORD(2) 130,504
- --------------------------------------------------------------------------------
5,682,000 Microchip Technology Inc.(1) 187,108
- --------------------------------------------------------------------------------
388,976
- --------------------------------------------------------------------------------
SOFTWARE -- 5.6%
- --------------------------------------------------------------------------------
6,076,000 Adobe Systems Inc.(2) 232,407
- --------------------------------------------------------------------------------
7,063,000 Electronic Arts Inc.(2) 373,562
- --------------------------------------------------------------------------------
12,780,000 Oracle Corp.(2) 236,047
- --------------------------------------------------------------------------------
842,016
- --------------------------------------------------------------------------------
SPECIALTY RETAIL -- 4.1%
- --------------------------------------------------------------------------------
5,574,000 Bed Bath & Beyond Inc.(2) 224,577
- --------------------------------------------------------------------------------
5,052,195 CarMax, Inc.(1)(2)(3) 223,812
- --------------------------------------------------------------------------------
2,672,000 Lowe's Companies, Inc. 80,534
- --------------------------------------------------------------------------------
3,131,000 PETsMART, Inc.(1) 90,110
- --------------------------------------------------------------------------------
619,033
- --------------------------------------------------------------------------------
Shares ($ IN THOUSANDS) Value
- --------------------------------------------------------------------------------
WIRELESS TELECOMMUNICATION SERVICES -- 2.5%
- --------------------------------------------------------------------------------
6,396,000 America Movil SA de CV
Series L ADR $ 274,196
- --------------------------------------------------------------------------------
1,563,000 Rogers Communications Inc.
Cl B ORD 93,616
- --------------------------------------------------------------------------------
367,812
- --------------------------------------------------------------------------------
TOTAL COMMON STOCKS
(Cost $11,375,872) 14,730,307
- --------------------------------------------------------------------------------
TEMPORARY CASH INVESTMENTS -- 2.2%
Repurchase Agreement, Credit Suisse
First Boston Corp., (collateralized by
various U.S. Treasury obligations,
7.25%, 8/15/22, valued at $109,628),
in a joint trading account at 5.22%,
dated 10/31/06, due 11/1/06
(Delivery value $107,416) 107,400
- --------------------------------------------------------------------------------
Repurchase Agreement, Merrill Lynch
& Co., Inc., (collateralized by various
U.S. Treasury obligations, 8.75%,
8/15/20, valued at $233,502),
in a joint trading account at 5.22%,
dated 10/31/06, due 11/1/06
(Delivery value $227,933) 227,900
- --------------------------------------------------------------------------------
TOTAL TEMPORARY CASH INVESTMENTS
(Cost $335,300) 335,300
- --------------------------------------------------------------------------------
COLLATERAL RECEIVED
FOR SECURITIES LENDING(4) -- 2.8%
REPURCHASE AGREEMENTS -- 2.8%
- --------------------------------------------------------------------------------
Repurchase Agreement, Citigroup
Global Markets Inc., (collateralized
by various U.S. Government Agency
obligations in a pooled account at
the lending agent), 5.31%,
dated 10/31/06, due 11/1/06
(Delivery value $297,873) 297,829
- --------------------------------------------------------------------------------
Repurchase Agreement, UBS AG,
(collateralized by various U.S.
Government Agency obligations
in a pooled account at the lending
agent), 5.31%, dated 10/31/06,
due 11/1/06 (Delivery value $115,958) 115,941
- --------------------------------------------------------------------------------
TOTAL COLLATERAL RECEIVED
FOR SECURITIES LENDING
(Cost $413,770) 413,770
- --------------------------------------------------------------------------------
TOTAL INVESTMENT SECURITIES -- 103.4%
(Cost $12,124,942) 15,479,377
- --------------------------------------------------------------------------------
OTHER ASSETS AND LIABILITIES -- (3.4)% (506,483)
- --------------------------------------------------------------------------------
TOTAL NET ASSETS -- 100.0% $ 14,972,894
================================================================================
See Notes to Financial Statements. (continued)
- ------
10
Ultra - Schedule of Investments
OCTOBER 31, 2006
FORWARD FOREIGN CURRENCY EXCHANGE CONTRACTS
($ IN THOUSANDS)
Contracts to Sell Settlement Date Value Unrealized Gain (Loss)
- ----------------------------------------------------------------------------------
49,500,210 CAD for USD 11/30/06 $ 44,162 $ 121
- ----------------------------------------------------------------------------------
51,050,800 Euro for USD 11/30/06 65,284 (173)
- ----------------------------------------------------------------------------------
21,506,450 GBP for USD 11/30/06 41,036 (216)
- ----------------------------------------------------------------------------------
408,806,880 MXN for USD 11/30/06 37,901 221
- ----------------------------------------------------------------------------------
$ 188,383 $ (47)
=====================================
(Value on Settlement Date $188,336)
NOTES TO SCHEDULE OF INVESTMENTS
ADR = American Depositary Receipt
CAD = Canadian Dollar
FTSE = Financial Times Stock Exchange
GBP = British Pound
MXN = Mexican Nuevo Peso
ORD = Foreign Ordinary Share
USD = United States Dollar
(1) Security, or a portion thereof, was on loan as of October 31, 2006.
(2) Non-income producing.
(3) Affiliated Company: the fund's holding represents ownership of 5% or more
of the voting securities of the company; therefore, the company is
affiliated as defined in the Investment Company Act of 1940. (See Note 6
in Notes to Financial Statements for a summary of transactions for each
company which is or was an affiliate at or during the year ended October
31, 2006.)
(4) Investments represent purchases made by the lending agent with cash
collateral received through securities lending transactions. (See Note 7 in
Notes to Financial Statements.)
See Notes to Financial Statements.
- ------
11
Statement of Assets and Liabilities
OCTOBER 31, 2006 (AMOUNTS IN THOUSANDS)
- --------------------------------------------------------------------------------
ASSETS
- --------------------------------------------------------------------------------
Investment securities -- unaffiliated,
at value (cost of $11,495,706) --
including $53,822 of securities on loan $14,711,285
- --------------------------------------------------------------
Investment securities -- affiliated,
at value (cost of $215,466) -- including
$354,322 of securities on loan 354,322
- --------------------------------------------------------------
Investments made with cash collateral
received for securities on loan,
at value (cost of $413,770) 413,770
- --------------------------------------------------------------------------------
Total investment securities,
at value (cost of $12,124,942) 15,479,377
- --------------------------------------------------------------
Receivable for investments sold 164,756
- --------------------------------------------------------------
Receivable for capital shares sold 4
- --------------------------------------------------------------
Receivable for forward foreign
currency exchange contracts 342
- --------------------------------------------------------------
Dividends and interest receivable 5,596
- --------------------------------------------------------------------------------
15,650,075
- --------------------------------------------------------------------------------
LIABILITIES
- --------------------------------------------------------------------------------
Payable for collateral received
for securities on loan 413,770
- --------------------------------------------------------------
Disbursements in excess of demand deposit cash 19,907
- --------------------------------------------------------------
Payable for investments purchased 230,524
- --------------------------------------------------------------
Payable for capital shares redeemed 8
- --------------------------------------------------------------
Payable for forward foreign currency exchange contracts 389
- --------------------------------------------------------------
Accrued management fees 12,400
- --------------------------------------------------------------
Distribution fees payable 90
- --------------------------------------------------------------
Service fees (and distribution fees -- R Class) payable 93
- --------------------------------------------------------------------------------
677,181
- --------------------------------------------------------------------------------
NET ASSETS $14,972,894
================================================================================
See Notes to Financial Statements. (continued)
- ------
12
Statement of Assets and Liabilities
OCTOBER 31, 2006 (AMOUNTS IN THOUSANDS EXCEPT AS NOTED)
- --------------------------------------------------------------------------------
NET ASSETS CONSIST OF:
- --------------------------------------------------------------------------------
Capital (par value and paid-in surplus) $10,629,914
- --------------------------------------------------------------
Undistributed net investment income 47
- --------------------------------------------------------------
Undistributed net realized gain on investment
and foreign currency transactions 988,545
- --------------------------------------------------------------
Net unrealized appreciation on investments
and translation of assets and
liabilities in foreign currencies 3,354,388
- --------------------------------------------------------------------------------
$14,972,894
================================================================================
INVESTOR CLASS, $0.01 PAR VALUE ($ AND SHARES IN FULL)
- --------------------------------------------------------------------------------
Net assets $13,481,690,720
- --------------------------------------------------------------
Shares outstanding 472,211,762
- --------------------------------------------------------------
Net asset value per share $28.55
- --------------------------------------------------------------------------------
INSTITUTIONAL CLASS, $0.01 PAR VALUE ($ AND SHARES IN FULL)
- --------------------------------------------------------------------------------
Net assets $1,073,766,809
- --------------------------------------------------------------
Shares outstanding 37,154,883
- --------------------------------------------------------------
Net asset value per share $28.90
- --------------------------------------------------------------------------------
ADVISOR CLASS, $0.01 PAR VALUE ($ AND SHARES IN FULL)
- --------------------------------------------------------------------------------
Net assets $405,172,650
- --------------------------------------------------------------
Shares outstanding 14,415,495
- --------------------------------------------------------------
Net asset value per share $28.11
- --------------------------------------------------------------------------------
C CLASS, $0.01 PAR VALUE ($ AND SHARES IN FULL)
- --------------------------------------------------------------------------------
Net assets $3,342,048
- --------------------------------------------------------------
Shares outstanding 122,578
- --------------------------------------------------------------
Net asset value per share $27.26
- --------------------------------------------------------------------------------
R CLASS, $0.01 PAR VALUE ($ AND SHARES IN FULL)
- --------------------------------------------------------------------------------
Net assets $8,921,877
- --------------------------------------------------------------
Shares outstanding 316,957
- --------------------------------------------------------------
Net asset value per share $28.15
- --------------------------------------------------------------------------------
See Notes to Financial Statements.
- ------
13
Statement of Operations
YEAR ENDED OCTOBER 31, 2006 (AMOUNTS IN THOUSANDS)
- --------------------------------------------------------------------------------
INVESTMENT INCOME (LOSS)
- --------------------------------------------------------------------------------
INCOME:
- --------------------------------------------------------------
Dividends (including $7,741 from affiliates
and net of foreign taxes withheld of $789) $ 142,555
- --------------------------------------------------------------
Interest 11,772
- --------------------------------------------------------------
Securities lending 948
- --------------------------------------------------------------------------------
155,275
- --------------------------------------------------------------------------------
EXPENSES:
- --------------------------------------------------------------
Management fees 178,209
- --------------------------------------------------------------
Distribution fees:
- --------------------------------------------------------------
Advisor Class 1,339
- --------------------------------------------------------------
C Class 35
- --------------------------------------------------------------
Service fees:
- --------------------------------------------------------------
Advisor Class 1,339
- --------------------------------------------------------------
C Class 12
- --------------------------------------------------------------
Distribution and service fees -- R Class 48
- --------------------------------------------------------------
Directors' fees and expenses 292
- --------------------------------------------------------------
Other expenses 23
- --------------------------------------------------------------------------------
181,297
- --------------------------------------------------------------------------------
NET INVESTMENT INCOME (LOSS) (26,022)
- --------------------------------------------------------------------------------
REALIZED AND UNREALIZED GAIN (LOSS)
- --------------------------------------------------------------------------------
Net realized gain (loss) on investment
and foreign currency transactions
(including $(25,198) from affiliates) 1,792,838
- --------------------------------------------------------------
Change in net unrealized appreciation
(depreciation) on investments and translation
of assets and liabilities in foreign currencies (1,994,803)
- --------------------------------------------------------------------------------
NET REALIZED AND UNREALIZED GAIN (LOSS) (201,965)
- --------------------------------------------------------------------------------
NET INCREASE (DECREASE) IN NET ASSETS
RESULTING FROM OPERATIONS $ (227,987)
================================================================================
See Notes to Financial Statements.
- ------
14
Statement of Changes in Net Assets
YEARS ENDED OCTOBER 31, 2006 AND OCTOBER 31, 2005 (AMOUNTS IN THOUSANDS)
- --------------------------------------------------------------------------------
INCREASE (DECREASE) IN NET ASSETS 2006 2005
- --------------------------------------------------------------------------------
OPERATIONS
- --------------------------------------------------------------------------------
Net investment income (loss) $ (26,022) $ 19,579
- ------------------------------------------------
Net realized gain (loss) 1,792,838 2,243,496
- ------------------------------------------------
Change in net unrealized
appreciation (depreciation) (1,994,803) (769,938)
- --------------------------------------------------------------------------------
Net increase (decrease) in net assets
resulting from operations (227,987) 1,493,137
- --------------------------------------------------------------------------------
DISTRIBUTIONS TO SHAREHOLDERS
- --------------------------------------------------------------------------------
From net investment income:
- ------------------------------------------------
Investor Class (22,728) --
- ------------------------------------------------
Institutional Class (4,891) --
- --------------------------------------------------------------------------------
Decrease in net assets from distributions (27,619) --
- --------------------------------------------------------------------------------
CAPITAL SHARE TRANSACTIONS
- --------------------------------------------------------------------------------
Net increase (decrease) in net assets
from capital share transactions (5,789,519) (2,985,926)
- --------------------------------------------------------------------------------
NET INCREASE (DECREASE) IN NET ASSETS (6,045,125) (1,492,789)
NET ASSETS
- --------------------------------------------------------------------------------
Beginning of period 21,018,019 22,510,808
- --------------------------------------------------------------------------------
End of period $14,972,894 $21,018,019
================================================================================
Undistributed net investment income $47 $26,470
================================================================================
See Notes to Financial Statements.
- ------
15
Notes to Financial Statements
OCTOBER 31, 2006 (AMOUNTS IN THOUSANDS)
1. ORGANIZATION AND SUMMARY OF SIGNIFICANT ACCOUNTING POLICIES
ORGANIZATION -- American Century Mutual Funds, Inc. (the corporation) is
registered under the Investment Company Act of 1940 (the 1940 Act) as an
open-end management investment company. Ultra Fund (the fund) is one fund in a
series issued by the corporation. The fund is diversified under the 1940 Act.
The fund's investment objective is to seek long-term capital growth. The fund
pursues this objective by investing primarily in equity securities. The fund
generally invests in equity securities of large companies, but may invest in
companies of any size. The following is a summary of the fund's significant
accounting policies.
MULTIPLE CLASS -- The fund is authorized to issue the Investor Class, the
Institutional Class, the Advisor Class, the C Class and the R Class. The C Class
may be subject to a contingent deferred sales charge. The share classes differ
principally in their respective sales charges and distribution and shareholder
servicing expenses and arrangements. All shares of the fund represent an equal
pro rata interest in the net assets of the class to which such shares belong,
and have identical voting, dividend, liquidation and other rights and the same
terms and conditions, except for class specific expenses and exclusive rights to
vote on matters affecting only individual classes. Income, non-class specific
expenses, and realized and unrealized capital gains and losses of the fund are
allocated to each class of shares based on their relative net assets.
SECURITY VALUATIONS -- Securities traded primarily on a principal securities
exchange are valued at the last reported sales price, or at the mean of the
latest bid and asked prices where no last sales price is available. Depending on
local convention or regulation, securities traded over-the-counter are valued at
the mean of the latest bid and asked prices, the last sales price, or the
official close price. Debt securities not traded on a principal securities
exchange are valued through a commercial pricing service or at the mean of the
most recent bid and asked prices. Discount notes may be valued through a
commercial pricing service or at amortized cost, which approximates fair value.
Securities traded on foreign securities exchanges and over-the-counter markets
are normally completed before the close of business on days that the New York
Stock Exchange (the Exchange) is open and may also take place on days when the
Exchange is not open. If an event occurs after the value of a security was
established but before the net asset value per share was determined that was
likely to materially change the net asset value, that security would be valued
at fair value as determined in accordance with procedures adopted by the Board
of Directors. If the fund determines that the market price of a portfolio
security is not readily available, or that the valuation methods mentioned above
do not reflect the security's fair value, such security is valued at its fair
value as determined by, or in accordance with procedures adopted by, the Board
of Directors or its designee if such fair value determination would materially
impact a fund's net asset value. Certain other circumstances may cause the fund
to fair value a security such as: a security has been declared in default; or
trading in a security has been halted during the trading day; or there is a
foreign market holiday and no trading will commence.
SECURITY TRANSACTIONS -- Security transactions are accounted for as of the trade
date. Net realized gains and losses are determined on the identified cost basis,
which is also used for federal income tax purposes.
INVESTMENT INCOME -- Dividend income less foreign taxes withheld, if any, is
recorded as of the ex-dividend date. Interest income is recorded on the accrual
basis and includes accretion of discounts and amortization of premiums.
SECURITIES ON LOAN -- The fund may lend portfolio securities through its lending
agent to certain approved borrowers in order to earn additional income. The fund
continues to recognize any gain or loss in the market price of the securities
loaned and records any interest earned or dividends declared.
FUTURES CONTRACTS -- The fund may enter into futures contracts in order to
manage the fund's exposure to changes in market conditions. One of the risks of
entering into futures contracts is the possibility that the change in value of
the contract may not correlate with the changes in value of the underlying
securities. Upon entering into a futures contract, the fund is required to
deposit either cash or securities in an amount equal to a certain percentage of
the contract value (initial margin). Subsequent payments (variation margin) are
made or received daily, in cash, by the fund. The variation margin is equal to
the daily change in the contract value and is recorded as unrealized gains and
losses. The fund recognizes a realized gain or loss when the contract is closed
or expires. Net realized and unrealized gains or losses occurring during the
holding period of futures contracts are a component of realized gain (loss) on
investment transactions and unrealized appreciation (depreciation) on
investments, respectively.
(continued)
- ------
16
Notes to Financial Statements
OCTOBER 31, 2006 (AMOUNTS IN THOUSANDS)
1. ORGANIZATION AND SUMMARY OF SIGNIFICANT ACCOUNTING POLICIES (CONTINUED)
FOREIGN CURRENCY TRANSACTIONS -- All assets and liabilities initially expressed
in foreign currencies are translated into U.S. dollars at prevailing exchange
rates at period end. Purchases and sales of investment securities, dividend and
interest income, and certain expenses are translated at the rates of exchange
prevailing on the respective dates of such transactions. For assets and
liabilities, other than investments in securities, net realized and unrealized
gains and losses from foreign currency translations arise from changes in
currency exchange rates.
Net realized and unrealized foreign currency exchange gains or losses occurring
during the holding period of investment securities are a component of realized
gain (loss) on investment transactions and unrealized appreciation
(depreciation) on investments, respectively. Certain countries may impose taxes
on the contract amount of purchases and sales of foreign currency contracts in
their currency. The fund records the foreign tax expense, if any, as a reduction
to the net realized gain (loss) on foreign currency transactions.
FORWARD FOREIGN CURRENCY EXCHANGE CONTRACTS -- The fund may enter into forward
foreign currency exchange contracts to facilitate transactions of securities
denominated in a foreign currency or to hedge the fund's exposure to foreign
currency exchange rate fluctuations. The net U.S. dollar value of foreign
currency underlying all contractual commitments held by the fund and the
resulting unrealized appreciation or depreciation are determined daily using
prevailing exchange rates. The fund bears the risk of an unfavorable change in
the foreign currency exchange rate underlying the forward contract.
Additionally, losses may arise if the counterparties do not perform under the
contract terms.
REPURCHASE AGREEMENTS -- The fund may enter into repurchase agreements with
institutions that American Century Investment Management, Inc. (ACIM) (the
investment advisor) has determined are creditworthy pursuant to criteria adopted
by the Board of Directors. Each repurchase agreement is recorded at cost. The
fund requires that the collateral, represented by securities, received in a
repurchase transaction be transferred to the custodian in a manner sufficient to
enable the fund to obtain those securities in the event of a default under the
repurchase agreement. ACIM monitors, on a daily basis, the securities
transferred to ensure the value, including accrued interest, of the securities
under each repurchase agreement is equal to or greater than amounts owed to the
fund under each repurchase agreement.
JOINT TRADING ACCOUNT -- Pursuant to an Exemptive Order issued by the Securities
and Exchange Commission, the fund, along with other registered investment
companies having management agreements with ACIM or American Century Global
Investment Management, Inc. (ACGIM), may transfer uninvested cash balances into
a joint trading account. These balances are invested in one or more repurchase
agreements that are collateralized by U.S. Treasury or Agency obligations.
INCOME TAX STATUS -- It is the fund's policy to distribute substantially all net
investment income and net realized gains to shareholders and to otherwise
qualify as a regulated investment company under provisions of the Internal
Revenue Code. Accordingly, no provision has been made for federal or state
income taxes.
DISTRIBUTIONS TO SHAREHOLDERS -- Distributions to shareholders are recorded on
the ex-dividend date. Distributions from net investment income and net realized
gains, if any, are generally declared and paid annually.
INDEMNIFICATIONS -- Under the corporation's organizational documents, its
officers and directors are indemnified against certain liabilities arising out
of the performance of their duties to the fund. In addition, in the normal
course of business, the fund enters into contracts that provide general
indemnifications. The fund's maximum exposure under these arrangements is
unknown as this would involve future claims that may be made against the fund.
The risk of material loss from such claims is considered by management to be
remote.
USE OF ESTIMATES -- The financial statements are prepared in conformity with
accounting principles generally accepted in the United States of America, which
may require management to make certain estimates and assumptions at the date of
the financial statements. Actual results could differ from these estimates.
(continued)
- ------
17
Notes to Financial Statements
OCTOBER 31, 2006 (AMOUNTS IN THOUSANDS)
2. FEES AND TRANSACTIONS WITH RELATED PARTIES
MANAGEMENT FEES -- The corporation has entered into a Management Agreement with
ACIM, under which ACIM provides the fund with investment advisory and management
services in exchange for a single, unified management fee (the fee). The
Agreement provides that all expenses of the fund, except brokerage commissions,
taxes, interest, fees and expenses of those directors who are not considered
"interested persons" as defined in the 1940 Act (including counsel fees) and
extraordinary expenses, will be paid by ACIM. The fee is computed and accrued
daily based on the daily net assets of the fund and paid monthly in arrears. For
funds with a stepped fee schedule, the rate of the fee is determined by applying
a fee rate calculation formula. This formula takes into account all of the
investment advisor's assets under management in the fund's investment strategy
(strategy assets) to calculate the appropriate fee rate for the fund. The
strategy assets include the fund's assets and the assets of other clients of the
investment advisor that are not in the American Century family of funds, but
that have the same investment team and investment strategy.
Effective August 1, 2006, the fund modified its management fee schedule,
resulting in lower fee rates. There was no significant impact on the effective
annual management fee for the year ended October 31, 2006 resulting from this
change.
The annual management fee schedule for each class of the fund is as follows:
- --------------------------------------------------------------------------------
INVESTOR, C
AND R INSTITUTIONAL ADVISOR
- --------------------------------------------------------------------------------
STRATEGY ASSETS
- --------------------------------------------------------------------------------
First $5 billion 1.000% 0.800% 0.750%
- --------------------------------------------------------------------------------
Next $5 billion 0.980% 0.780% 0.730%
- --------------------------------------------------------------------------------
Next $5 billion 0.970% 0.770% 0.720%
- --------------------------------------------------------------------------------
Next $5 billion 0.960% 0.760% 0.710%
- --------------------------------------------------------------------------------
Next $5 billion 0.950% 0.750% 0.700%
- --------------------------------------------------------------------------------
Next $5 billion 0.900% 0.700% 0.650%
- --------------------------------------------------------------------------------
Over $30 billion 0.800% 0.600% 0.550%
- --------------------------------------------------------------------------------
The effective annual management fee for each class of the fund for the year
ended October 31, 2006 was 0.99%, 0.79%, 0.74%, 0.99% and 0.99% for the Investor
Class, Institutional Class, Advisor Class, C Class and R Class, respectively.
DISTRIBUTION AND SERVICE FEES -- The Board of Directors has adopted a Master
Distribution and Shareholder Services Plan for the Advisor Class (the Advisor
Class plan) and a separate Master Distribution and Individual Shareholder
Services Plan for each of the C Class and R Class (collectively with the Advisor
Class plan, the plans), pursuant to Rule 12b-1 of the 1940 Act. The plans
provide that the Advisor Class and C Class will pay American Century Investment
Services, Inc. (ACIS) the following annual distribution and service fees:
- --------------------------------------------------------------------------------
ADVISOR C
- --------------------------------------------------------------------------------
Distribution Fee 0.25% 0.75%
- --------------------------------------------------------------------------------
Service Fee 0.25% 0.25%
- --------------------------------------------------------------------------------
The plans provide that the R Class will pay ACIS an annual distribution and
service fee of 0.50%. The fees are computed and accrued daily based on each
class's daily net assets and paid monthly in arrears. The distribution fee
provides compensation for expenses incurred in connection with distributing
shares of the classes including, but not limited to, payments to brokers,
dealers, and financial institutions that have entered into sales agreements with
respect to shares of the fund. The service fee provides compensation for
shareholder and administrative services rendered by ACIS, its affiliates or
independent third party providers for Advisor Class shares and for individual
shareholder services rendered by broker/dealers or other independent financial
intermediaries for C Class and R Class shares. Fees incurred under the plans
during the year ended October 31, 2006, are detailed in the Statement of
Operations.
(continued)
- ------
18
Notes to Financial Statements
OCTOBER 31, 2006 (AMOUNTS IN THOUSANDS)
2. FEES AND TRANSACTIONS WITH RELATED PARTIES (CONTINUED)
RELATED PARTIES -- Certain officers and directors of the corporation are also
officers and/or directors, and, as a group, controlling stockholders of American
Century Companies, Inc. (ACC), the parent of the corporation's investment
advisor, ACIM, the distributor of the corporation, ACIS, and the corporation's
transfer agent, American Century Services, LLC.
The fund has a bank line of credit agreement and securities lending agreement
with JPMorgan Chase Bank (JPMCB). JPMCB is a custodian of the fund and a wholly
owned subsidiary of JPMorgan Chase & Co. (JPM). JPM is an equity investor in
ACC.
3. INVESTMENT TRANSACTIONS
Purchases and sales of investment securities, excluding short-term investments,
for the year ended October 31, 2006, were $11,330,795 and $17,217,382,
respectively.
For the year ended October 31, 2006, the fund incurred net realized gains of
$195,535 from a redemption in kind. A redemption in kind occurs when a fund
delivers securities from its portfolio in lieu of cash as payment to a redeeming
shareholder.
4. CAPITAL SHARE TRANSACTIONS
Transactions in shares of the fund were as follows:
- --------------------------------------------------------------------------------
SHARES AMOUNT
- --------------------------------------------------------------------------------
INVESTOR CLASS
- --------------------------------------------------------------------------------
YEAR ENDED OCTOBER 31, 2006
SHARES AUTHORIZED 3,500,000
================================================================================
Sold 29,695 $ 873,712
- ------------------------------------------------
Issued in reinvestment of distributions 700 21,649
- ------------------------------------------------
Redeemed (209,516) (6,089,943)
- --------------------------------------------------------------------------------
Net increase (decrease) (179,121) $(5,194,582)
================================================================================
YEAR ENDED OCTOBER 31, 2005
SHARES AUTHORIZED 3,500,000
================================================================================
Sold 41,530 $ 1,184,069
- ------------------------------------------------
Redeemed (152,379) (4,366,071)
- --------------------------------------------------------------------------------
Net increase (decrease) (110,849) $(3,182,002)
================================================================================
INSTITUTIONAL CLASS
- --------------------------------------------------------------------------------
YEAR ENDED OCTOBER 31, 2006
SHARES AUTHORIZED 200,000
================================================================================
Sold 9,336 $ 278,796
- ------------------------------------------------
Issued in reinvestment of distributions 152 4,743
- ------------------------------------------------
Redeemed (22,047) (649,002)
- --------------------------------------------------------------------------------
Net increase (decrease) (12,559) $(365,463)
================================================================================
YEAR ENDED OCTOBER 31, 2005
SHARES AUTHORIZED 200,000
================================================================================
Sold 21,128 $ 615,833
- ------------------------------------------------
Redeemed (9,862) (284,976)
- --------------------------------------------------------------------------------
Net increase (decrease) 11,266 $ 330,857
================================================================================
(continued)
- ------
19
Notes to Financial Statements
OCTOBER 31, 2006 (AMOUNTS IN THOUSANDS)
4. CAPITAL SHARE TRANSACTIONS (CONTINUED)
- --------------------------------------------------------------------------------
SHARES AMOUNT
- --------------------------------------------------------------------------------
ADVISOR CLASS
- --------------------------------------------------------------------------------
YEAR ENDED OCTOBER 31, 2006
SHARES AUTHORIZED 100,000
================================================================================
Sold 3,456 $ 100,324
- ------------------------------------------------
Redeemed (11,402) (328,494)
- --------------------------------------------------------------------------------
Net increase (decrease) (7,946) $(228,170)
================================================================================
YEAR ENDED OCTOBER 31, 2005
SHARES AUTHORIZED 300,000
================================================================================
Sold 7,767 $ 219,363
- ------------------------------------------------
Redeemed (12,891) (358,139)
- --------------------------------------------------------------------------------
Net increase (decrease) (5,124) $(138,776)
================================================================================
C CLASS
- --------------------------------------------------------------------------------
YEAR ENDED OCTOBER 31, 2006
SHARES AUTHORIZED 100,000
================================================================================
Sold 23 $ 663
- ------------------------------------------------
Redeemed (100) (2,821)
- --------------------------------------------------------------------------------
Net increase (decrease) (77) $(2,158)
================================================================================
YEAR ENDED OCTOBER 31, 2005
SHARES AUTHORIZED 100,000
================================================================================
Sold 73 $ 2,036
- ------------------------------------------------
Redeemed (56) (1,563)
- --------------------------------------------------------------------------------
Net increase (decrease) 17 $ 473
================================================================================
R CLASS
- --------------------------------------------------------------------------------
YEAR ENDED OCTOBER 31, 2006
SHARES AUTHORIZED 50,000
================================================================================
Sold 164 $ 4,791
- ------------------------------------------------
Redeemed (138) (3,937)
- --------------------------------------------------------------------------------
Net increase (decrease) 26 $ 854
================================================================================
YEAR ENDED OCTOBER 31, 2005
SHARES AUTHORIZED 50,000
================================================================================
Sold 188 $ 5,384
- ------------------------------------------------
Redeemed (65) (1,862)
- --------------------------------------------------------------------------------
Net increase (decrease) 123 $ 3,522
================================================================================
5. BANK LINE OF CREDIT
The fund, along with certain other funds managed by ACIM or ACGIM, has a $500
million unsecured bank line of credit agreement with JPMCB. The fund may borrow
money for temporary or emergency purposes to fund shareholder redemptions.
Borrowings under the agreement bear interest at the Federal Funds rate plus
0.50%. The fund did not borrow from the line during the year ended October 31,
2006.
(continued)
- ------
20
Notes to Financial Statements
OCTOBER 31, 2006 (AMOUNTS IN THOUSANDS)
6. AFFILIATED COMPANY TRANSACTIONS
If a fund's holding represents ownership of 5% or more of the voting securities
of a company, the company is affiliated as defined in the 1940 Act. A summary of
transactions for each company which is or was an affiliate at or during the year
ended October 31, 2006 follows:
- ------------------------------------------------------------------------------------------------------------------
SHARE BALANCE PURCHASE SALES REALIZED DIVIDEND OCTOBER 31, 2006
10/31/05 COST COST GAIN (LOSS) INCOME SHARE BALANCE MARKET VALUE
- ------------------------------------------------------------------------------------------------------------------
Apollo Group Inc.
Cl A(1)(2) 7,599,000 $ 74,095 $ 560,735 $(154,400) -- -- --
- -------------------------
Carmax, Inc.(2)(3) 8,328,000 23,087 120,002 39,044 -- 5,052,195 $223,812
- -------------------------
Checkfree Corp.(1)(2) 6,813,000 -- 170,517 95,200 -- -- --
- -------------------------
Digital River Inc.(2)(3) -- 101,064 10,583 1,503 -- 2,256,000 130,510
- -------------------------
International
Game Technology(1) 16,671,000 19,604 235,964 28,446 $6,908 10,163,000 432,029
- -------------------------
PETsMART, Inc.(1)(3) 7,529,000 28,168 148,171 (11,847) 833 3,131,000 90,110
- -------------------------
PF Chang's China
Bistro, Inc.(1)(2) 875,000 55,503 87,380 (23,144) -- -- --
- ------------------------------------------------------------------------------------------------------------------
$301,521 $1,333,352 $ (25,198) $7,741 $876,461
==================================================================================================================
(1) Company was not an affiliate at October 31,
2006.
(2) Non-income
producing.
(3) Security, or a portion thereof, was on loan as of October 31,
2006.
7. SECURITIES LENDING
As of October 31, 2006, securities in the fund valued at $408,144 were on loan
through the lending agent, JPMCB, to certain approved borrowers. JPMCB receives
and maintains collateral in the form of cash and/or acceptable securities as
approved by ACIM. Cash collateral is invested in authorized investments by the
lending agent in a pooled account. The value of cash collateral received at
period end is disclosed in the Statement of Assets and Liabilities and
investments made with the cash by the lending agent are listed in the Schedule
of Investments. Any deficiencies or excess of collateral must be delivered or
transferred by the member firms no later than the close of business on the next
business day. The total value of all collateral received, at this date, was
$413,770. The fund's risks in securities lending are that the borrower may not
provide additional collateral when required or return the securities when due.
If the borrower defaults, receipt of the collateral by the fund may be delayed
or limited.
8. FEDERAL TAX INFORMATION
The tax character of distributions paid during the years ended October 31, 2006
and October 31, 2005 were as follows:
- --------------------------------------------------------------------------------
2006 2005
- --------------------------------------------------------------------------------
DISTRIBUTIONS PAID FROM
- --------------------------------------------------------------------------------
Ordinary income $27,619 --
- --------------------------------------------------------------------------------
Long-term capital gains -- --
- --------------------------------------------------------------------------------
The book-basis character of distributions made during the year from net
investment income or net realized gains may differ from their ultimate
characterization for federal income tax purposes. These differences reflect the
differing character of certain income items and net realized gains and losses
for financial statement and tax purposes, and may result in reclassification
among certain capital accounts on the financial statements. Reclassification of
$27,218, $(325,473), and $298,255 between undistributed net investment income,
net realized gain (loss), and capital, respectively, include the difference in
character of realized gains on redemptions in kind and net operating losses.
(continued)
- ------
21
Notes to Financial Statements
OCTOBER 31, 2006 (AMOUNTS IN THOUSANDS)
8. FEDERAL TAX INFORMATION (CONTINUED)
As of October 31, 2006, the components of distributable earnings on a tax-basis
and the federal tax cost of investments were as follows:
- --------------------------------------------------------------------------------
Federal tax cost of investments $12,137,552
================================================================================
Gross tax appreciation of investments $3,390,282
- ----------------------------------------------------------
Gross tax depreciation of investments (48,457)
- --------------------------------------------------------------------------------
Net tax appreciation (depreciation) of investments $3,341,825
================================================================================
Net tax appreciation (depreciation) of
derivatives and translation of assets and
liabilities on foreign currencies --
- --------------------------------------------------------------------------------
Net tax appreciation (depreciation) $3,341,825
================================================================================
Undistributed ordinary income --
- ----------------------------------------------------------
Accumulated long-term gains $1,001,155
- --------------------------------------------------------------------------------
The difference between book-basis and tax-basis cost and unrealized appreciation
(depreciation) is attributable primarily to the tax deferral of losses on wash
sales, the realization for tax purposes of unrealized gains on certain forward
foreign currency contracts and return of capital dividends.
9. RECENTLY ISSUED ACCOUNTING STANDARDS
In June 2006, the Financial Accounting Standards Board (FASB) issued
Interpretation No. 48, "Accounting for Uncertainty in Income Taxes - an
Interpretation of FASB Statement No. 109" (FIN 48). FIN 48 establishes a minimum
threshold for financial statement recognition of the benefit of positions taken
in filing tax returns (including whether an entity is taxable in a particular
jurisdiction), and requires certain expanded tax disclosures. FIN 48 is
effective for fiscal years beginning after December 15, 2006, and is to be
applied to all open tax years as of the date of effectiveness. The FASB issued
Statement of Financial Accounting Standards No. 157, "Fair Value Measurements"
(FAS 157), in September 2006, which is effective for fiscal years beginning
after November 15, 2007. FAS 157 defines fair value, establishes a framework for
measuring fair value and expands the required financial statement disclosures
about fair value measurements. Management is currently evaluating the impact of
adopting FIN 48 and FAS 157.
10. OTHER TAX INFORMATION (UNAUDITED) ($ IN FULL)
The following information is provided pursuant to provisions of the Internal
Revenue Code.
The fund hereby designates $27,619,159 of qualified dividend income for the
fiscal year ended October 31, 2006.
The fund hereby designates $135,176,180 of capital gain distributions for the
fiscal year ended October 31, 2006.
For corporate taxpayers, ordinary income distributions paid during the fiscal
year ended October 31, 2006, of $27,619,159 qualify for the corporate dividends
received deduction.
- ------
22
Ultra - Financial Highlights
For a Share Outstanding Throughout the Years Ended October 31
- --------------------------------------------------------------------------------
INVESTOR CLASS
- --------------------------------------------------------------------------------
2006 2005 2004 2003 2002
- --------------------------------------------------------------------------------
PER-SHARE DATA
- --------------------------------------------------------------------------------
Net Asset Value,
Beginning of Period $29.02 $27.17 $26.01 $21.83 $25.09
- --------------------------------------------------------------------------------
Income From
Investment Operations
- --------------------------
Net Investment
Income (Loss)(1) (0.06) 0.02 (0.05) (0.02) 0.06
- --------------------------
Net Realized and
Unrealized Gain (Loss) (0.37) 1.83 1.21 4.26 (3.32)
- --------------------------------------------------------------------------------
Total From
Investment Operations (0.43) 1.85 1.16 4.24 (3.26)
- --------------------------------------------------------------------------------
Distributions
- --------------------------
From Net
Investment Income (0.04) -- -- (0.06) --
- --------------------------------------------------------------------------------
Net Asset Value,
End of Period $28.55 $29.02 $27.17 $26.01 $21.83
================================================================================
TOTAL RETURN(2) (1.51)% 6.81% 4.46% 19.50% (12.99)%
- --------------------------------------------------------------------------------
RATIOS/SUPPLEMENTAL DATA
- --------------------------------------------------------------------------------
Ratio of Operating
Expenses to Average
Net Assets 0.99% 0.99% 0.99% 1.00% 0.99%
- --------------------------
Ratio of Net
Investment Income (Loss)
to Average Net Assets (0.15)% 0.09% (0.20)% (0.09)% 0.24%
- --------------------------
Portfolio
Turnover Rate 62% 33% 34% 82% 92%
- --------------------------
Net Assets,
End of Period
(in millions) $13,482 $18,904 $20,708 $21,341 $18,616
- --------------------------------------------------------------------------------
(1) Computed using average shares outstanding throughout the period.
(2) Total return assumes reinvestment of net investment income and capital
gains distributions, if any. The total return of the classes may not
precisely reflect the class expense differences because of the impact of
calculating the net asset value to two decimal places. If net asset values
were calculated to three decimal places, the total return differences would
more closely reflect the class expense differences. The calculation of net
asset values to two decimal places is made in accordance with SEC guidelines
and does not result in any gain or loss of value between one class and
another.
See Notes to Financial Statements.
- ------
23
Ultra - Financial Highlights
For a Share Outstanding Throughout the Years Ended October 31
- --------------------------------------------------------------------------------------------
INSTITUTIONAL CLASS
- --------------------------------------------------------------------------------------------
2006 2005 2004 2003 2002
- --------------------------------------------------------------------------------------------
PER-SHARE DATA
- --------------------------------------------------------------------------------------------
Net Asset Value,
Beginning of Period $29.38 $27.44 $26.22 $22.02 $25.24
- --------------------------------------------------------------------------------------------
Income From
Investment Operations
- -------------------------
Net Investment
Income (Loss)(1) --(2) 0.07 --(2) 0.02 0.11
- -------------------------
Net Realized and
Unrealized Gain (Loss) (0.38) 1.87 1.22 4.29 (3.33)
- --------------------------------------------------------------------------------------------
Total From
Investment Operations (0.38) 1.94 1.22 4.31 (3.22)
- --------------------------------------------------------------------------------------------
Distributions
- -------------------------
From Net
Investment Income (0.10) -- -- (0.11) --
- --------------------------------------------------------------------------------------------
Net Asset Value,
End of Period $28.90 $29.38 $27.44 $26.22 $22.02
============================================================================================
TOTAL RETURN(3) (1.33)% 7.07% 4.65% 19.66% (12.76)%
- --------------------------------------------------------------------------------------------
RATIOS/SUPPLEMENTAL DATA
- --------------------------------------------------------------------------------------------
Ratio of Operating
Expenses to Average
Net Assets 0.79% 0.79% 0.79% 0.80% 0.79%
- -------------------------
Ratio of Net
Investment Income (Loss)
to Average Net Assets 0.05% 0.29% 0.00% 0.11% 0.44%
- -------------------------
Portfolio
Turnover Rate 62% 33% 34% 82% 92%
- -------------------------
Net Assets,
End of Period
(in thousands) $1,073,767 $1,460,343 $1,055,145 $822,333 $556,316
- --------------------------------------------------------------------------------------------
(1) Computed using average shares outstanding throughout the period.
(2) Per-share amount was less than $0.005.
(3) Total return assumes reinvestment of net investment income and capital
gains distributions, if any. The total return of the classes may not
precisely reflect the class expense differences because of the impact of
calculating the net asset value to two decimal places. If net asset values
were calculated to three decimal places, the total return differences would
more closely reflect the class expense differences. The calculation of net
asset values to two decimal places is made in accordance with SEC guidelines
and does not result in any gain or loss of value between one class and
another.
See Notes to Financial Statements.
- ------
24
Ultra - Financial Highlights
For a Share Outstanding Throughout the Years Ended October 31
- ---------------------------------------------------------------------------------
ADVISOR CLASS
- ---------------------------------------------------------------------------------
2006 2005 2004 2003 2002
- ---------------------------------------------------------------------------------
PER-SHARE DATA
- ---------------------------------------------------------------------------------
Net Asset Value,
Beginning of Period $28.61 $26.85 $25.77 $21.62 $24.92
- ---------------------------------------------------------------------------------
Income From
Investment Operations
- -------------------------
Net Investment
Income (Loss)(1) (0.13) (0.05) (0.12) (0.08) --(2)
- -------------------------
Net Realized and
Unrealized Gain (Loss) (0.37) 1.81 1.20 4.24 (3.30)
- ---------------------------------------------------------------------------------
Total From
Investment Operations (0.50) 1.76 1.08 4.16 (3.30)
- ---------------------------------------------------------------------------------
Distributions
- -------------------------
From Net
Investment Income -- -- -- (0.01) --
- ---------------------------------------------------------------------------------
Net Asset Value,
End of Period $28.11 $28.61 $26.85 $25.77 $21.62
=================================================================================
TOTAL RETURN(3) (1.75)% 6.55% 4.19% 19.24% (13.24)%
- ---------------------------------------------------------------------------------
RATIOS/SUPPLEMENTAL DATA
- ---------------------------------------------------------------------------------
Ratio of Operating
Expenses to
Average Net Assets 1.24% 1.24% 1.24% 1.25% 1.24%
- -------------------------
Ratio of Net
Investment Income (Loss)
to Average Net Assets (0.40)% (0.16)% (0.45)% (0.34)% (0.01)%
- -------------------------
Portfolio
Turnover Rate 62% 33% 34% 82% 92%
- -------------------------
Net Assets,
End of Period
(in thousands) $405,173 $639,792 $738,032 $643,144 $391,968
- ---------------------------------------------------------------------------------
(1) Computed using average shares outstanding throughout the
period.
(2) Per-share amount was less than
$0.005.
(3) Total return assumes reinvestment of net investment income and capital
gains distributions, if any. The total return of the classes may not
precisely reflect the class expense differences because of the impact of
calculating the net asset value to two decimal places. If net asset values
were calculated to three decimal places, the total return differences would
more closely reflect the class expense differences. The calculation of net
asset values to two decimal places is made in accordance with SEC guidelines
and does not result in any gain or loss of value between one class and
another.
See Notes to Financial Statements.
- ------
25
Ultra - Financial Highlights
For a Share Outstanding Throughout the Years Ended October 31
- --------------------------------------------------------------------------------
C CLASS
- --------------------------------------------------------------------------------
2006 2005 2004 2003 2002
- --------------------------------------------------------------------------------
PER-SHARE DATA
- --------------------------------------------------------------------------------
Net Asset Value,
Beginning of Period $27.96 $26.44 $25.57 $21.59 $25.09
- --------------------------------------------------------------------------------
Income From
Investment Operations
- --------------------------
Net Investment
Income (Loss)(1) (0.34) (0.26) (0.32) (0.26) (0.19)
- --------------------------
Net Realized and
Unrealized Gain (Loss) (0.36) 1.78 1.19 4.24 (3.31)
- --------------------------------------------------------------------------------
Total From
Investment Operations (0.70) 1.52 0.87 3.98 (3.50)
- --------------------------------------------------------------------------------
Net Asset Value,
End of Period $27.26 $27.96 $26.44 $25.57 $21.59
================================================================================
TOTAL RETURN(2) (2.50)% 5.75% 3.40% 18.43% (13.95)%
- --------------------------------------------------------------------------------
RATIOS/SUPPLEMENTAL DATA
- --------------------------------------------------------------------------------
Ratio of Operating
Expenses to Average
Net Assets 1.99% 1.99% 1.99% 2.00% 1.99%
- --------------------------
Ratio of Net
Investment Income (Loss)
to Average Net Assets (1.15)% (0.91)% (1.20)% (1.09)% (0.76)%
- --------------------------
Portfolio
Turnover Rate 62% 33% 34% 82% 92%
- --------------------------
Net Assets,
End of Period
(in thousands) $3,342 $5,601 $4,836 $2,232 $502
- --------------------------------------------------------------------------------
(1) Computed using average shares outstanding throughout the
period.
(2) Total return assumes reinvestment of net investment income and capital
gains distributions, if any, and does not reflect applicable sales charges.
The total return of the classes may not precisely reflect the class expense
differences because of the impact of calculating the net asset value to two
decimal places. If net asset values were calculated to three decimal places,
the total return differences would more closely reflect the class expense
differences. The calculation of net asset values to two decimal places is
made in accordance with SEC guidelines and does not result in any gain or
loss of value between one class and another.
See Notes to Financial Statements.
- ------
26
Ultra - Financial Highlights
For a Share Outstanding Throughout the Years Ended October 31 (except as noted)
- ------------------------------------------------------------------------------------------
R CLASS
- ------------------------------------------------------------------------------------------
2006 2005 2004 2003(1)
- ------------------------------------------------------------------------------------------
PER-SHARE DATA
- ------------------------------------------------------------------------------------------
Net Asset Value, Beginning of Period $28.72 $27.01 $25.99 $24.87
- ------------------------------------------------------------------------------------------
Income From Investment Operations
- ------------------------------------------
Net Investment Income (Loss)(2) (0.21) (0.12) (0.22) (0.04)
- ------------------------------------------
Net Realized and Unrealized Gain (Loss) (0.36) 1.83 1.24 1.16
- ------------------------------------------------------------------------------------------
Total From Investment Operations (0.57) 1.71 1.02 1.12
- ------------------------------------------------------------------------------------------
Net Asset Value, End of Period $28.15 $28.72 $27.01 $25.99
==========================================================================================
TOTAL RETURN(3) (1.98)% 6.33% 3.92% 4.50%
- ------------------------------------------------------------------------------------------
RATIOS/SUPPLEMENTAL DATA
- ------------------------------------------------------------------------------------------
Ratio of Operating Expenses
to Average Net Assets 1.49% 1.44%(4) 1.49% 1.50%(5)
- ------------------------------------------
Ratio of Net Investment Income (Loss)
to Average Net Assets (0.65)% (0.36)%(4) (0.70)% (0.81)%(5)
- ------------------------------------------
Portfolio Turnover Rate 62% 33% 34% 82%(6)
- ------------------------------------------
Net Assets, End of Period
(in thousands) $8,922 $8,367 $4,545 $3
- ------------------------------------------------------------------------------------------
(1) August 29, 2003 (commencement of sale) through October 31,
2003.
(2) Computed using average shares outstanding throughout the
period.
(3) Total return assumes reinvestment of net investment income and capital
gains distributions, if any. Total returns for periods less than one year
are not annualized. The total return of the classes may not precisely
reflect the class expense differences because of the impact of calculating
the net asset value to two decimal places. If net asset values were
calculated to three decimal places, the total return differences would more
closely reflect the class expense differences. The calculation of net asset
values to two decimal places is made in accordance with SEC guidelines and
does not result in any gain or loss of value between one class and another.
(4) During the year ended October 31, 2005, the class received a partial
reimbursement of its distribution and service fee. Had fees not been
reimbursed the annualized ratio of operating expenses to average net assets
and annualized ratio of net investment income (loss) to average net assets
would have been 1.49% and (0.41)%, respectively.
(5) Annualized.
(6) Portfolio turnover is calculated at the fund level. Percentage indicated
was calculated for the year ended October 31, 2003.
See Notes to Financial Statements.
- ------
27
Report of Independent Registered Public Accounting Firm
The Board of Directors and Shareholders,
American Century Mutual Funds, Inc.:
We have audited the accompanying statement of assets and liabilities, including
the schedule of investments, of Ultra Fund, (the "Fund"), one of the mutual
funds comprising American Century Mutual Funds, Inc., as of October 31, 2006,
and the related statement of operations for the year then ended, the statements
of changes in net assets for each of the two years in the period then ended, and
the financial highlights for the periods presented. These financial statements
and financial highlights are the responsibility of the Fund's management. Our
responsibility is to express an opinion on these financial statements and
financial highlights based on our audits.
We conducted our audits in accordance with the standards of the Public Company
Accounting Oversight Board (United States). Those standards require that we plan
and perform the audit to obtain reasonable assurance about whether the financial
statements and financial highlights are free of material misstatement. The Fund
is not required to have, nor were we engaged to perform, an audit of its
internal control over financial reporting. Our audits included consideration of
internal control over financial reporting as a basis for designing audit
procedures that are appropriate in the circumstances, but not for the purpose of
expressing an opinion on the effectiveness of the Fund's internal control over
financial reporting. Accordingly, we express no such opinion. An audit also
includes examining, on a test basis, evidence supporting the amounts and
disclosures in the financial statements, assessing the accounting principles
used and significant estimates made by management, as well as evaluating the
overall financial statement presentation. Our procedures included confirmation
of securities owned as of October 31, 2006, by correspondence with the custodian
and brokers; where replies were not received from brokers, we performed other
auditing procedures. We believe that our audits provide a reasonable basis for
our opinion.
In our opinion, the financial statements and financial highlights referred to
above present fairly, in all material respects, the financial position of Ultra
Fund as of October 31, 2006, the results of its operations for the year then
ended, the changes in its net assets for each of the two years in the period
then ended, and the financial highlights for the periods presented, in
conformity with accounting principles generally accepted in the United States of
America.
Deloitte & Touche LLP
Kansas City, Missouri
December 11, 2006
- ------
28
Management
The individuals listed below serve as directors or officers of the fund. Each
director serves until his or her successor is duly elected and qualified or
until he or she retires. Mandatory retirement age for independent directors is
72. Those listed as interested directors are "interested" primarily by virtue of
their engagement as officers of American Century Companies, Inc. (ACC) or its
wholly owned, direct or indirect, subsidiaries, including the fund's investment
advisor, American Century Investment Management, Inc. (ACIM); the fund's
principal underwriter, American Century Investment Services, Inc. (ACIS); and
the fund's transfer agent, American Century Services, LLC (ACS).
The other directors (more than three-fourths of the total number) are
independent; that is, they have never been employees or officers of, and have no
financial interest in, ACC or any of its wholly owned subsidiaries, including
ACIM, ACIS, and ACS. The directors serve in this capacity for seven registered
investment companies in the American Century family of funds.
All persons named as officers of the fund also serve in a similar capacity for
the other 14 investment companies advised by ACIM or American Century Global
Investment Management, Inc. (ACGIM), unless otherwise noted. Only officers with
policy-making functions are listed. No officer is compensated for his or her
service as an officer of the funds. The listed officers are interested persons
of the funds and are appointed or re-appointed on an annual basis.
INDEPENDENT DIRECTORS
- --------------------------------------------------------------------------------
THOMAS A. BROWN, 4500 Main Street, Kansas City, MO 64111
YEAR OF BIRTH: 1940
POSITION(S) HELD WITH FUND: Director
FIRST YEAR OF SERVICE: 1980
PRINCIPAL OCCUPATION(S) DURING PAST 5 YEARS: Retired, Formerly Chief Executive
Officer/Treasurer, Associated Bearings Company
NUMBER OF PORTFOLIOS IN FUND COMPLEX OVERSEEN BY DIRECTOR: 66
OTHER DIRECTORSHIPS HELD BY DIRECTOR: None
- --------------------------------------------------------------------------------
ANDREA C. HALL, PH.D., 4500 Main Street, Kansas City, MO 64111
YEAR OF BIRTH: 1945
POSITION(S) HELD WITH FUND: Director
FIRST YEAR OF SERVICE: 1997
PRINCIPAL OCCUPATION(S) DURING PAST 5 YEARS: Senior Vice President, Midwest
Research Institute
NUMBER OF PORTFOLIOS IN FUND COMPLEX OVERSEEN BY DIRECTOR: 66
OTHER DIRECTORSHIPS HELD BY DIRECTOR: None
- --------------------------------------------------------------------------------
D.D. (DEL) HOCK, 4500 Main Street, Kansas City, MO 64111
YEAR OF BIRTH: 1935
POSITION(S) HELD WITH FUND: Director
FIRST YEAR OF SERVICE: 1996
PRINCIPAL OCCUPATION(S) DURING PAST 5 YEARS: Retired, formerly Chairman, Public
Service Company of Colorado
NUMBER OF PORTFOLIOS IN FUND COMPLEX OVERSEEN BY DIRECTOR: 66
OTHER DIRECTORSHIPS HELD BY DIRECTOR: Director, Allied Motion Technologies, Inc.
- --------------------------------------------------------------------------------
(continued)
- ------
29
Management
INDEPENDENT DIRECTORS (CONTINUED)
- --------------------------------------------------------------------------------
JAMES A. OLSON, 4500 Main Street, Kansas City, MO 64111
YEAR OF BIRTH: 1942
POSITION(S) HELD WITH FUND: Advisory Board Member
FIRST YEAR OF SERVICE: 2006
PRINCIPAL OCCUPATION(S) DURING PAST 5 YEARS: Principal, Plaza Belmont LLC; Chief
Financial Officer, Plaza Belmont LLC (September 1999 to July 2006)
NUMBER OF PORTFOLIOS IN FUND COMPLEX OVERSEEN BY DIRECTOR: 66
OTHER DIRECTORSHIPS HELD BY DIRECTOR: Director, Saia, Inc. and Entertainment
Properties Trust
- --------------------------------------------------------------------------------
DONALD H. PRATT, 4500 Main Street, Kansas City, MO 64111
YEAR OF BIRTH: 1937
POSITION(S) HELD WITH FUND: Director, Chairman of the Board
FIRST YEAR OF SERVICE: 1995
PRINCIPAL OCCUPATION(S) DURING PAST 5 YEARS: Chairman, Western Investments,
Inc.; Retired Chairman of the Board, Butler Manufacturing Company
NUMBER OF PORTFOLIOS IN FUND COMPLEX OVERSEEN BY DIRECTOR: 66
OTHER DIRECTORSHIPS HELD BY DIRECTOR: None
- --------------------------------------------------------------------------------
GALE E. SAYERS, 4500 Main Street, Kansas City, MO 64111
YEAR OF BIRTH: 1943
POSITION(S) HELD WITH FUND: Director
FIRST YEAR OF SERVICE: 2000
PRINCIPAL OCCUPATION(S) DURING PAST 5 YEARS: President, Chief Executive Officer
and Founder, Sayers40, Inc., a technology products and service provider
NUMBER OF PORTFOLIOS IN FUND COMPLEX OVERSEEN BY DIRECTOR: 66
OTHER DIRECTORSHIPS HELD BY DIRECTOR: Director, Triad Hospitals, Inc.
- --------------------------------------------------------------------------------
M. JEANNINE STRANDJORD, 4500 Main Street, Kansas City, MO 64111
YEAR OF BIRTH: 1945
POSITION(S) HELD WITH FUND: Director
FIRST YEAR OF SERVICE: 1994
PRINCIPAL OCCUPATION(S) DURING PAST 5 YEARS: Retired, formerly Senior Vice
President, Sprint Corporation
NUMBER OF PORTFOLIOS IN FUND COMPLEX OVERSEEN BY DIRECTOR: 66
OTHER DIRECTORSHIPS HELD BY DIRECTOR: Director, DST Systems, Inc.; Director,
Euronet Worldwide, Inc.
- --------------------------------------------------------------------------------
TIMOTHY S. WEBSTER, 4500 Main Street, Kansas City, MO 64111
YEAR OF BIRTH: 1961
POSITION(S) HELD WITH FUND: Director
FIRST YEAR OF SERVICE: 2001
PRINCIPAL OCCUPATION(S) DURING PAST 5 YEARS: President and Chief Executive
Officer, American Italian Pasta Company (1992 to December 2005)
NUMBER OF PORTFOLIOS IN FUND COMPLEX OVERSEEN BY DIRECTOR: 66
OTHER DIRECTORSHIPS HELD BY DIRECTOR: None
- --------------------------------------------------------------------------------
INTERESTED DIRECTORS
- --------------------------------------------------------------------------------
JAMES E. STOWERS, JR.(1), 4500 Main Street, Kansas City, MO 64111
YEAR OF BIRTH: 1924
POSITION(S) HELD WITH FUND: Director, Co-Vice Chairman
FIRST YEAR OF SERVICE: 1958
PRINCIPAL OCCUPATION(S) DURING PAST 5 YEARS: Founder, Director and Controlling
Shareholder, ACC; Chairman, ACC (January 1995 to December 2004); Director, ACIM,
ACGIM, ACS, ACIS and other ACC subsidiaries
NUMBER OF PORTFOLIOS IN FUND COMPLEX OVERSEEN BY DIRECTOR: 66
OTHER DIRECTORSHIPS HELD BY DIRECTOR: None
- --------------------------------------------------------------------------------
JAMES E. STOWERS III(1), 4500 Main Street, Kansas City, MO 64111
YEAR OF BIRTH: 1959
POSITION(S) HELD WITH FUND: Director, Co-Vice Chairman
FIRST YEAR OF SERVICE: 1990
PRINCIPAL OCCUPATION(S) DURING PAST 5 YEARS: Chairman, ACC (January 2005 to
present); Co-Chairman, ACC (September 2000 to December 2004); Chairman, ACS and
other ACC subsidiaries (April 2005 to September 2006); Director, ACC, ACIM,
ACGIM, ACS, ACIS and other ACC subsidiaries
NUMBER OF PORTFOLIOS IN FUND COMPLEX OVERSEEN BY DIRECTOR: 66
OTHER DIRECTORSHIPS HELD BY DIRECTOR: None
- --------------------------------------------------------------------------------
(1) James E. Stowers, Jr. is the father of James E. Stowers III. (continued)
- ------
30
Management
OFFICERS
- --------------------------------------------------------------------------------
WILLIAM M. LYONS, 4500 Main Street, Kansas City, MO 64111
YEAR OF BIRTH: 1955
POSITION(S) HELD WITH FUND: President
FIRST YEAR OF SERVICE: 2000
PRINCIPAL OCCUPATION(S) DURING PAST 5 YEARS: Chief Executive Officer, ACC
(September 2000 to present); President, ACC (June 1997 to present); Also serves
as: Chairman, ACIM, ACGIM, ACS, ACIS and other ACC subsidiaries; Chief Executive
Officer, ACIM, ACGIM, ACIS and other ACC subsidiaries (October 2000 to October
2006); President, ACIM, ACGIM and other ACC subsidiaries (September 2002 to
September 2006); Executive Vice President, ACS (January 2005 to September 2006);
Director, ACC, ACIM, ACGIM, ACS, ACIS and other ACC subsidiaries
- --------------------------------------------------------------------------------
JONATHAN THOMAS, 4500 Main Street, Kansas City, MO 64111
YEAR OF BIRTH: 1963
POSITION(S) HELD WITH FUND: Executive Vice President
FIRST YEAR OF SERVICE: 2005
PRINCIPAL OCCUPATION(S) DURING PAST 5 YEARS: Chief Administrative Officer, ACC
(February 2006 to present); Executive Vice President, ACC (November 2005 to
present); Also serves as: President and Chief Executive Officer, ACS; Chief
Financial Officer and Chief Accounting Officer, ACIM, ACGIM, ACS, ACIS and other
ACC subsidiaries; Managing Director, Morgan Stanley (March 2000 to November
2005)
- --------------------------------------------------------------------------------
MARYANNE ROEPKE, 4500 Main Street, Kansas City, MO 64111
YEAR OF BIRTH: 1956
POSITION(S) HELD WITH FUND: Chief Compliance Officer and Senior Vice President
FIRST YEAR OF SERVICE: 2000
PRINCIPAL OCCUPATION(S) DURING PAST 5 YEARS: Chief Compliance Officer, ACIM,
ACGIM and ACS (August 2006 to present); Assistant Treasurer, ACC (January 1995
to August 2006); Treasurer and Chief Financial Officer, various American Century
funds (July 2000 to August 2006); Also serves as: Senior Vice President, ACS
- --------------------------------------------------------------------------------
DAVID C. TUCKER, 4500 Main Street, Kansas City, MO 64111
YEAR OF BIRTH: 1958
POSITION(S) HELD WITH FUND: Senior Vice President and General Counsel
FIRST YEAR OF SERVICE: 2000
PRINCIPAL OCCUPATION(S) DURING PAST 5 YEARS: Vice President, ACC (February 2001
to present); General Counsel, ACC (June 1998 to present); Also serves as: Senior
Vice President and General Counsel, ACIM, ACGIM, ACS, ACIS and other ACC
subsidiaries
- --------------------------------------------------------------------------------
ROBERT LEACH, 4500 Main Street, Kansas City, MO 64111
YEAR OF BIRTH: 1966
POSITION(S) HELD WITH FUND: Vice President, Treasurer and Chief Financial
Officer
FIRST YEAR OF SERVICE: 1997
PRINCIPAL OCCUPATION(S) DURING PAST 5 YEARS: Vice President, ACS (February 2000
to present); Controller, various American Century funds (June 1997 to September
2006)
- --------------------------------------------------------------------------------
C. JEAN WADE, 4500 Main Street, Kansas City, MO 64111
YEAR OF BIRTH: 1964
POSITION(S) HELD WITH FUND: Controller
FIRST YEAR OF SERVICE: 2006
PRINCIPAL OCCUPATION(S) DURING PAST 5 YEARS: Vice President, ACS (February 2000
to present)
- --------------------------------------------------------------------------------
JON ZINDEL, 4500 Main Street, Kansas City, MO 64111
YEAR OF BIRTH: 1967
POSITION(S) HELD WITH FUND: Tax Officer
FIRST YEAR OF SERVICE: 1997
PRINCIPAL OCCUPATION(S) DURING PAST 5 YEARS: Senior Vice President, ACC (August
2006 to present); Vice President, ACC and certain ACC subsidiaries (October 2001
to August 2006); Vice President, Corporate Tax, ACS (April 1998 to August 2006);
Also serves as: Senior Vice President, ACIM, ACGIM, ACS, ACIS and other ACC
subsidiaries
- --------------------------------------------------------------------------------
The SAI has additional information about the fund's directors and is available
without charge, upon request, by calling 1-800-345-2021.
- ------
31
Approval of Management Agreement for Ultra
Under Section 15(c) of the Investment Company Act, contracts for investment
advisory services are required to be reviewed, evaluated and approved by a
majority of a fund's independent directors or trustees (the "Directors") each
year. At American Century, this process is referred to as the "15(c) Process."
As a part of this process, the board reviews fund performance, shareholder
services, audit and compliance information, and a variety of other reports from
the advisor concerning fund operations. In addition to this annual review, the
board of directors oversees and evaluates on a continuous basis at its quarterly
meetings the nature and quality of significant services performed by the
advisor, fund performance, audit and compliance information, and a variety of
other reports relating to fund operations. The board, or committees of the
board, also holds special meetings as needed.
Under a Securities and Exchange Commission rule, each fund is required to
disclose in its annual or semiannual report, as appropriate, the material
factors and conclusions that formed the basis for the board's approval or
renewal of any advisory agreements within the fund's most recently completed
fiscal half-year period.
ANNUAL CONTRACT REVIEW PROCESS
As part of the annual 15(c) Process undertaken during the most recent fiscal
half-year period, the Directors reviewed extensive data and information compiled
by the advisor and certain independent providers of evaluative data (the "15(c)
Providers") concerning Ultra (the "fund") and the services provided to the fund
under the management agreement. The information considered and the discussions
held at the meetings included, but were not limited to:
* the nature, extent and quality of investment management, shareholder
services and other services provided to the fund under the management
agreement;
* reports on the advisor's activities relating to the wide range of
programs and services the advisor provides to the fund and its shareholders
on a routine and non-routine basis;
* data comparing the cost of owning the fund to the cost of owning a
similar fund;
* data comparing the fund's performance to appropriate benchmarks
and/or a peer group of other mutual funds with similar investment
objectives and strategies;
* financial data showing the profitability of the fund to the advisor
and the overall profitability of the advisor; and
* data comparing services provided and charges to other investment
management clients of the advisor.
In keeping with its practice, the fund's board of directors held two regularly
scheduled meetings and one special meeting to review and discuss the information
provided by the advisor and to complete its negotiations with the advisor
regarding the renewal of the management agreement, including the setting of the
applicable advisory fee. The board also had the benefit of the advice of its
independent counsel throughout the period.
(continued)
- ------
32
Approval of Management Agreement for Ultra
FACTORS CONSIDERED
The Directors considered all of the information provided by the advisor, the
15(c) Providers, and the board's independent counsel, and evaluated such
information for each fund for which the board has responsibility. The Directors
did not identify any single factor as being all-important or controlling, and
each Director may have attributed different levels of importance to different
factors. In deciding to renew the agreement under the terms ultimately
determined by the board to be appropriate, the Directors' decision was based on
the following factors.
NATURE, EXTENT AND QUALITY OF SERVICES -- GENERALLY. Under the management
agreement, the advisor is responsible for providing or arranging for all
services necessary for the operation of the fund. The board noted that under the
management agreement, the advisor provides or arranges at its own expense a wide
variety of services including:
* fund construction and design
* portfolio security selection
* initial capitalization/funding
* securities trading
* custody of fund assets
* daily valuation of the fund's portfolio
* shareholder servicing and transfer agency, including shareholder
confirmations, recordkeeping and communications
* legal services
* regulatory and portfolio compliance
* financial reporting
* marketing and distribution
The Directors noted that many of these services have expanded over time both in
terms of quantity and complexity in response to shareholder demands, competition
in the industry and the changing regulatory environment. In performing their
evaluation, the Directors considered information received in connection with the
annual review, as well as information provided on an ongoing basis at their
regularly scheduled board and committee meetings.
INVESTMENT MANAGEMENT SERVICES. The nature of the investment management services
provided is quite complex and allows fund shareholders access to professional
money management, instant diversification of their investments within an asset
class, the opportunity to easily diversify among asset classes, and liquidity.
In evaluating investment performance, the board expects the advisor to manage
the fund in accordance with its investment objectives and approved strategies.
In providing these services, the advisor utilizes teams of investment
professionals (portfolio managers, analysts, research assistants, and securities
traders) who require extensive information technology, research, training,
compliance and other systems to conduct their business. At each quarterly
meeting the Directors review investment performance information for the fund,
together with comparative information for appropriate benchmarks and peer groups
of funds managed similarly to the fund. The Directors also review detailed
performance information during the 15(c) Process comparing the fund's
performance with that of similar funds not managed by the advisor. If
performance concerns are identified, the Directors discuss with the advisor the
reasons for such results (e.g., market conditions, security selection) and any
efforts being undertaken to improve performance. The fund's performance
(continued)
- ------
33
Approval of Management Agreement for Ultra
fell below the median for both the one and three year periods during part of the
past year. The board discussed the fund's performance with the advisor and was
satisfied with the efforts being undertaken by the advisor.
SHAREHOLDER AND OTHER SERVICES. The advisor provides the fund with a
comprehensive package of transfer agency, shareholder, and other services. The
Directors review reports and evaluations of such services at their regular
quarterly meetings, including the annual meeting concerning contract review, and
reports to the board. These reports include, but are not limited to, information
regarding the operational efficiency and accuracy of the shareholder and
transfer agency services provided, staffing levels, shareholder satisfaction (as
measured by external as well as internal sources), technology support, new
products and services offered to fund shareholders, securities trading
activities, portfolio valuation services, auditing services, and legal and
operational compliance activities. Certain aspects of shareholder and transfer
agency service level efficiency and the quality of securities trading activities
are measured by independent third party providers and are presented in
comparison to other fund groups not managed by the advisor.
COSTS OF SERVICES PROVIDED AND PROFITABILITY TO THE ADVISOR. The advisor
provides detailed information concerning its cost of providing various services
to the fund, its profitability in managing the fund, its overall profitability,
and its financial condition. The Directors have reviewed with the advisor the
methodology used to prepare this financial information. This financial
information regarding the advisor is considered in order to evaluate the
advisor's financial condition, its ability to continue to provide services under
the management agreement, and the reasonableness of the current management fee.
ETHICS OF THE ADVISOR. The Directors generally consider the advisor's commitment
to providing quality services to shareholders and to conducting its business
ethically. They noted that the advisor's practices generally meet or exceed
industry best practices and that the advisor was not implicated in the industry
scandals of 2003 and 2004.
ECONOMIES OF SCALE. The Directors review reports provided by the advisor on
economies of scale for the complex as a whole and the year-over-year changes in
revenue, costs, and profitability. The Directors concluded that economies of
scale are difficult to measure and predict with precision, especially on a
fund-by-fund basis. This analysis is also complicated by the additional services
and content provided by the advisor and its reinvestment in its ability to
provide and expand those services. Accordingly, the Directors also seek to
evaluate economies of scale by reviewing other information, such as
year-over-year profitability of the advisor generally, the profitability of its
management of the fund specifically, the expenses incurred by the advisor in
providing various functions to the fund, and the breakpoint fees of competitive
funds not managed by the advisor. The Directors believe the advisor is
appropriately sharing economies of scale through its competitive fee structure,
fee breakpoints as the fund increases in size, and through reinvestment in its
business to provide shareholders additional content and services.
(continued)
- ------
34
Approval of Management Agreement for Ultra
COMPARISON TO OTHER FUNDS' FEES. The fund pays the advisor a single,
all-inclusive (or unified) management fee for providing all services necessary
for the management and operation of the fund, other than brokerage expenses,
taxes, interest, extraordinary expenses, and the fees and expenses of the fund's
independent directors (including their independent legal counsel). Under the
unified fee structure, the advisor is responsible for providing all investment
advisory, custody, audit, administrative, compliance, recordkeeping, marketing
and shareholder services, or arranging and supervising third parties to provide
such services. By contrast, most other funds are charged a variety of fees,
including an investment advisory fee, a transfer agency fee, an administrative
fee, distribution charges and other expenses. Other than their investment
advisory fees and Rule 12b-1 distribution fees, all other components of the
total fees charged by these other funds may be increased without shareholder
approval. The board believes the unified fee structure is a benefit to fund
shareholders because it clearly discloses to shareholders the cost of owning
fund shares, and, since the unified fee cannot be increased without a vote of
fund shareholders, it shifts to the advisor the risk of increased costs of
operating the fund and provides a direct incentive to minimize administrative
inefficiencies. Part of the Directors' analysis of fee levels involves reviewing
certain evaluative data compiled by a 15(c) Provider comparing the fund's
unified fee to the total expense ratio of other funds in the fund's peer group.
The unified fee charged to shareholders of the fund was below the median of the
total expense ratios of its peer group.
COMPARISON TO FEES AND SERVICES PROVIDED TO OTHER CLIENTS OF THE ADVISOR. The
Directors also requested and received information from the advisor concerning
the nature of the services, fees, and profitability of its advisory services to
advisory clients other than the fund. They observed that these varying types of
client accounts require different services and involve different regulatory and
entrepreneurial risks than the management of the fund. The Directors analyzed
this information and concluded that the fees charged and services provided to
the fund were reasonable by comparison.
COLLATERAL BENEFITS DERIVED BY THE ADVISOR. The Directors reviewed information
from the advisor concerning collateral benefits it receives as a result of its
relationship with the fund. They concluded that the advisor's primary business
is managing mutual funds and it generally does not use the fund or shareholder
information to generate profits in other lines of business, and therefore does
not derive any significant collateral benefits from them. The Directors noted
that the advisor receives proprietary research from broker dealers that execute
fund portfolio transactions and concluded that this research is likely to
benefit fund shareholders. The Directors also determined that the advisor is
able to provide investment management services to certain clients other than the
fund, at least in part, due to its existing infrastructure built to serve the
fund complex. The Directors concluded, however, that the assets of those other
clients are not material to the analysis and, in any event, are included with
the assets of the fund to determine breakpoints in the fund's fee schedule,
(continued)
- ------
35
Approval of Management Agreement for Ultra
provided they are managed using the same investment team and strategy.
CONCLUSIONS OF THE DIRECTORS
As a result of this process, the independent directors, assisted by the advice
of legal counsel independent of the advisor, taking into account all of the
factors discussed above and the information provided by the advisor, negotiated
changes to the breakpoint schedule used to calculate the management fee. These
changes were proposed by the Directors based on their review of the competitive
changes in the mutual fund marketplace and their review of financial information
provided by the advisor. The new schedule, effective August 1, 2006, contains
lower management fees at certain asset levels than under the existing structure.
Following these negotiations with the advisor, the independent directors
concluded that the investment management agreement between the fund and the
advisor is fair and reasonable in light of the services provided and should be
renewed.
- ------
36
Share Class Information
Five classes of shares are authorized for sale by the fund: Investor Class,
Institutional Class, Advisor Class, C Class and R Class. The total expense ratio
of Institutional Class shares is lower than that of Investor Class shares. The
total expense ratios of Advisor Class, C Class and R Class shares are higher
than that of Investor Class shares.
INVESTOR CLASS shares are available for purchase in two ways: 1) directly from
American Century without any commissions or other fees; or 2) through certain
financial intermediaries (such as banks, broker-dealers, insurance companies and
investment advisors), which may require payment of a transaction fee to the
financial intermediary.
INSTITUTIONAL CLASS shares are available to large investors such as endowments,
foundations, and retirement plans, and to financial intermediaries serving these
investors. This class recognizes the relatively lower cost of serving
institutional customers and others who invest at least $5 million ($3 million
for endowments and foundations) in an American Century fund or at least $10
million in multiple funds. In recognition of the larger investments and account
balances and comparatively lower transaction costs, the unified management fee
of Institutional Class shares is 0.20% less than the unified management fee of
Investor Class shares.
ADVISOR CLASS shares are sold primarily through institutions such as investment
advisors, banks, broker-dealers, insurance companies, and financial advisors.
Advisor Class shares are subject to a 0.50% annual Rule 12b-1 distribution and
service fee. The total expense ratio of Advisor Class shares is 0.25% higher
than the total expense ratio of Investor Class shares.
C CLASS shares are sold primarily through employer-sponsored retirement plans
and through institutions such as investment advisors, banks, broker-dealers, and
insurance companies. C Class shares redeemed within 12 months of purchase are
subject to a contingent deferred sales charge (CDSC) of 1.00%. There is no CDSC
on shares acquired through reinvestment of dividends or capital gains. The
unified management fee for C Class shares is the same as for Investor Class
shares. C Class shares also are subject to a Rule 12b-1 distribution and service
fee of 1.00%.
R CLASS shares are sold primarily through employer-sponsored retirement plans
and through institutions such as investment advisors, banks, broker-dealers, and
insurance companies. The unified management fee for R Class shares is the same
as for Investor Class shares. R Class shares are subject to a 0.50% annual Rule
12b-1 distribution and service fee.
All classes of shares represent a pro rata interest in the fund and generally
have the same rights and preferences.
- ------
37
Additional Information
RETIREMENT ACCOUNT INFORMATION
As required by law, any distributions you receive from an IRA or certain 403(b),
457 and qualified plans [those not eligible for rollover to an IRA or to another
qualified plan] are subject to federal income tax withholding, unless you elect
not to have withholding apply. Tax will be withheld on the total amount
withdrawn even though you may be receiving amounts that are not subject to
withholding, such as nondeductible contributions. In such case, excess amounts
of withholding could occur. You may adjust your withholding election so that a
greater or lesser amount will be withheld.
If you don't want us to withhold on this amount, you must notify us to not
withhold the federal income tax. Even if you plan to roll over the amount you
withdraw to another tax-deferred account, the withholding rate still applies to
the withdrawn amount unless we have received notice not to withhold federal
income tax prior to the withdrawal. You may notify us in writing or in certain
situations by telephone or through other electronic means. You have the right to
revoke your withholding election at any time and any election you make may
remain in effect until revoked by filing a new election.
Remember, even if you elect not to have income tax withheld, you are liable for
paying income tax on the taxable portion of your withdrawal. If you elect not to
have income tax withheld or you don't have enough income tax withheld, you may
be responsible for payment of estimated tax. You may incur penalties under the
estimated tax rules if your withholding and estimated tax payments are not
sufficient.
State tax will be withheld if, at the time of your distribution, your address is
within one of the mandatory withholding states and you have federal income tax
withheld. State taxes will be withheld from your distribution in accordance with
the respective state rules.
PROXY VOTING GUIDELINES
American Century Investment Management, Inc., the fund's investment advisor, is
responsible for exercising the voting rights associated with the securities
purchased and/or held by the fund. A description of the policies and procedures
the advisor uses in fulfilling this responsibility is available without charge,
upon request, by calling 1-800-345-2021. It is also available on American
Century's website at americancentury.com and on the Securities and Exchange
Commission's website at sec.gov. Information regarding how the investment
advisor voted proxies relating to portfolio securities during the most recent
12-month period ended June 30 is available on the "About Us" page at
americancentury.com. It is also available at sec.gov.
QUARTERLY PORTFOLIO DISCLOSURE
The fund files its complete schedule of portfolio holdings with the Securities
and Exchange Commission (SEC) for the first and third quarters of each fiscal
year on Form N-Q. The fund's Form N-Q is available on the SEC's website at
sec.gov, and may be reviewed and copied at the SEC's Public Reference Room in
Washington, DC. Information on the operation of the Public Reference Room may be
obtained by calling 1-800-SEC-0330. The fund also makes its complete schedule of
portfolio holdings for the most recent quarter of its fiscal year available on
its website at americancentury.com and, upon request, by calling 1-800-345-2021.
- ------
38
Index Definitions
The following indices are used to illustrate investment market, sector, or style
performance or to serve as fund performance comparisons. They are not investment
products available for purchase.
The DOW JONES INDUSTRIAL AVERAGE (DJIA) is a price-weighted average of 30
actively traded blue chip stocks, primarily industrials but including
service-oriented firms. Prepared and published by Dow Jones & Co., it is the
oldest and most widely quoted of all the market indicators.
The NASDAQ COMPOSITE INDEX is a market value-weighted index of all domestic and
international common stocks listed on the Nasdaq stock market.
The RUSSELL 1000(reg.sm) GROWTH INDEX measures the performance of those Russell
1000 Index companies (the 1,000 largest of the 3,000 largest publicly traded
U.S. companies, based on total market capitalization) with higher price-to-book
ratios and higher forecasted growth rates.
The RUSSELL 2000(reg.sm) INDEX is a market-capitalization weighted index created
by Frank Russell Company to measure the performance of the 2,000 smallest of the
3,000 largest publicly traded U.S. companies, based on total market
capitalization.
The S&P 500 INDEX is a market value-weighted index of the stocks of 500 publicly
traded U.S. companies chosen for market size, liquidity, and industry group
representation that are considered to be leading firms in dominant industries.
Each stock's weight in the index is proportionate to its market value. Created
by Standard & Poor's, it is considered to be a broad measure of U.S. stock
market performance.
- ------
39
Notes
- ------
40
CONTACT US
AMERICANCENTURY.COM
AUTOMATED INFORMATION LINE:
1-800-345-8765
INVESTOR SERVICES REPRESENTATIVE:
1-800-345-2021 or 816-531-5575
BUSINESS, NOT-FOR-PROFIT,
EMPLOYER-SPONSORED RETIREMENT PLANS:
1-800-345-3533
BANKS AND TRUST COMPANIES, BROKER-DEALERS,
FINANCIAL PROFESSIONALS, INSURANCE COMPANIES:
1-800-345-6488
TELECOMMUNICATIONS DEVICE FOR THE DEAF:
1-800-634-4113 or 816-444-3485
AMERICAN CENTURY MUTUAL FUNDS, INC.
INVESTMENT ADVISOR:
American Century Investment Management, Inc.
Kansas City, Missouri
THIS REPORT AND THE STATEMENTS IT CONTAINS ARE SUBMITTED FOR THE GENERAL
INFORMATION OF OUR SHAREHOLDERS. THE REPORT IS NOT AUTHORIZED FOR DISTRIBUTION
TO PROSPECTIVE INVESTORS UNLESS PRECEDED OR ACCOMPANIED BY AN EFFECTIVE
PROSPECTUS.
American Century Investments PRSRT STD
P.O. Box 419200 U.S. POSTAGE PAID
Kansas City, MO 64141-6200 AMERICAN CENTURY
COMPANIES
The American Century Investments logo, American Century
and American Century Investments are service marks
of American Century Proprietary Holdings, Inc.
0612
SH-ANN-52276S
American Century Investment Services, Inc., Distributor
(c)2006 American Century Proprietary Holdings, Inc. All rights reserved.
AMERICAN CENTURY INVESTMENTS
Annual Report
October 31, 2006
[photo of winter scene]
Growth Fund
Focused Growth Fund
Heritage Fund
Vista(reg.sm) Fund
[american century investments logo and text logo]
Our Message to You
[photo of James E. Stowers III and James E. Stowers, Jr.]
/s/James E. Stowers, Jr.
James E. Stowers, Jr.
Founder
American Century Companies, Inc.
/s/James E. Stowers III
James E. Stowers III
Chairman of the Board
American Century Companies, Inc.
We are pleased to provide you with the annual report for the American Century
Growth, Focused Growth, Heritage, and Vista funds for the year ended October 31,
2006. We hope you find this information helpful in monitoring your investment.
Another useful resource we offer is our website, americancentury.com, where we
post quarterly portfolio commentaries, the views of senior investment officers
and analysts, and other communications about investments, portfolio strategy,
personal finance, and the markets.
In its most recent rankings, Dalbar -- which issues customer satisfaction
ratings and rankings based on website functionality -- ranked
americancentury.com seventh out of the sites provided by the top 25 fund
companies that it believes lead the industry in web-based technology. Our
website earned an "Excellent" rating, Dalbar's highest designation.
For most of 2006, our website has linked visitors to information explaining our
strategic collaboration with Lance Armstrong and the Lance Armstrong Foundation
(LAF). This campaign, featuring Lance, is designed to encourage investors to
take a more active role in planning their financial futures and make every
investment decision count. To learn more about the collaboration and the LAF,
please visit americancentury.com or www.lanceface.com on the Web and click on
the links to related sites.
With the approach of year end and the 2006 tax season, you can also find out
more about December fund distributions and tax information via a link from our
website. We've posted December distribution estimates for over 50 funds, answers
to frequent distribution questions, and online descriptions of all of the tax
information we provide to investors.
If you haven't visited americancentury.com yet, we encourage you to do so...it's
there to serve you. And so are we. As always, we deeply appreciate your
commitment to American Century Investments.
Table of Contents
Market Perspective . . . . . . . . . . . . . . . . . . . . . . . . . . . . 2
One-Year Total Returns. . . . . . . . . . . . . . . . . . . . . . . . . 2
GROWTH
Performance. . . . . . . . . . . . . . . . . . . . . . . . . . . . . . . . 3
Portfolio Commentary . . . . . . . . . . . . . . . . . . . . . . . . . . . 5
Schedule of Investments. . . . . . . . . . . . . . . . . . . . . . . . . . 7
FOCUSED GROWTH
Performance. . . . . . . . . . . . . . . . . . . . . . . . . . . . . . . . 10
Portfolio Commentary . . . . . . . . . . . . . . . . . . . . . . . . . . . 12
Schedule of Investments. . . . . . . . . . . . . . . . . . . . . . . . . . 14
HERITAGE
Performance. . . . . . . . . . . . . . . . . . . . . . . . . . . . . . . . 16
Portfolio Commentary . . . . . . . . . . . . . . . . . . . . . . . . . . . 18
Schedule of Investments. . . . . . . . . . . . . . . . . . . . . . . . . . 20
VISTA
Performance. . . . . . . . . . . . . . . . . . . . . . . . . . . . . . . . 22
Portfolio Commentary . . . . . . . . . . . . . . . . . . . . . . . . . . . 24
Schedule of Investments. . . . . . . . . . . . . . . . . . . . . . . . . . 26
Shareholder Fee Examples . . . . . . . . . . . . . . . . . . . . . . . . . 29
FINANCIAL STATEMENTS
Statement of Assets and Liabilities. . . . . . . . . . . . . . . . . . . . 32
Statement of Operations. . . . . . . . . . . . . . . . . . . . . . . . . . 34
Statement of Changes in Net Assets . . . . . . . . . . . . . . . . . . . . 35
Notes to Financial Statements. . . . . . . . . . . . . . . . . . . . . . . 37
Financial Highlights . . . . . . . . . . . . . . . . . . . . . . . . . . . 46
Report of Independent Registered Public Accounting Firm. . . . . . . . . . 61
OTHER INFORMATION
Management . . . . . . . . . . . . . . . . . . . . . . . . . . . . . . . . 62
Approval of Management Agreements for Growth,
Focused Growth, Heritage, and Vista. . . . . . . . . . . . . . . . . . . . 65
Share Class Information. . . . . . . . . . . . . . . . . . . . . . . . . . 70
Additional Information . . . . . . . . . . . . . . . . . . . . . . . . . . 71
Index Definitions. . . . . . . . . . . . . . . . . . . . . . . . . . . . . 73
The opinions expressed in the Market Perspective and each of the Portfolio
Commentaries reflect those of the portfolio management team as of the date of
the report, and do not necessarily represent the opinions of American Century or
any other person in the American Century organization. Any such opinions are
subject to change at any time based upon market or other conditions and American
Century disclaims any responsibility to update such opinions. These opinions may
not be relied upon as investment advice and, because investment decisions made
by American Century funds are based on numerous factors, may not be relied upon
as an indication of trading intent on behalf of any American Century fund.
Security examples are used for representational purposes only and are not
intended as recommendations to purchase or sell securities. Performance
information for comparative indices and securities is provided to American
Century by third party vendors. To the best of American Century's knowledge,
such information is accurate at the time of printing.
Market Perspective
[photo of Mark Mallon]
BY MARK MALLON, CHIEF INVESTMENT OFFICER, AMERICAN CENTURY INVESTMENTS
ECONOMIC GROWTH SURGED, THEN MODERATED
Economic growth -- along with commodity prices, short-term interest rates, and
inflation -- surged early in the 12-month period ended October 31, 2006. But
growth and inflation moderated in the period's second half, which saw the
Federal Reserve end its two-year string of interest rate hikes.
After a hurricane-related slowdown in the fourth quarter of 2005, U.S. gross
domestic product grew in the first quarter of 2006 at a 5.6% annualized pace,
the highest level in more than two years. The Fed steadily raised short-term
interest rates through June to keep inflation in check, including pressures from
soaring commodity prices. The Fed finally snapped its string of rate hikes in
August 2006, leaving its target at 5.25%, a five-year high. By then, economic
growth had slowed, dragged down in part by a cooling housing market.
BEST FISCAL-YEAR STOCK RETURNS SINCE 2003
The Fed's pause and expectations for lower interest rates and mild inflation
going forward helped produce the best U.S. stock returns for a 12-month fiscal
period ended October 31 since 2003. Market rallies beginning and ending the
period offset a late-spring/early-summer selloff. Growth stocks flourished in
the latter rally, but value stocks outperformed growth for the full reporting
period. Likewise, though large-cap stocks gained ground late in the period,
small-caps posted higher returns for the entire 12-month stretch.
In the first half of the 12-month period, investors celebrated a dip in crude
oil prices and strong economic growth by pushing stock prices higher. The
small-cap Russell 2000 Index led the way, surging 18.91%. Sentiment changed in
early May, however, when the Fed made it clear that more interest rate hikes
might be necessary to control inflation. Between April 30 and July 15, the S&P
500 fell 5.28%, and the Russell 2000 more than doubled that loss as investors
desired larger, more stable companies.
The selloff ended in late July after Fed chairman Ben Bernanke predicted
inflation would moderate. The Fed's subsequent rate pause in August and plunging
energy prices allowed stocks to rebound nicely in the last three months of the
reporting period.
ONE-YEAR TOTAL RETURNS
AS OF OCTOBER 31, 2006
- --------------------------------------------------------------------------------
S&P 500 Index 16.34%
- --------------------------------------------------------------------------------
Dow Jones Industrial Average 18.47%
- --------------------------------------------------------------------------------
Nasdaq Composite Index 12.48%
- --------------------------------------------------------------------------------
- ------
2
Growth - Performance
TOTAL RETURNS AS OF OCTOBER 31, 2006
----------------------------------
AVERAGE ANNUAL RETURNS
- ------------------------------------------------------------------------------------------
SINCE INCEPTION
1 YEAR 5 YEARS 10 YEARS INCEPTION DATE
- ------------------------------------------------------------------------------------------
INVESTOR CLASS 11.51% 4.35% 6.49% 14.71% 6/30/71(1)
- ------------------------------------------------------------------------------------------
RUSSELL 1000 GROWTH INDEX(2) 10.84% 4.07% 5.76% N/A(3) --
- ------------------------------------------------------------------------------------------
Institutional Class 11.70% 4.56% -- 5.28% 6/16/97
- ------------------------------------------------------------------------------------------
Advisor Class 11.23% 4.09% -- 5.38% 6/4/97
- ------------------------------------------------------------------------------------------
C Class 10.39% -- -- 1.68% 11/28/01
- ------------------------------------------------------------------------------------------
R Class 10.97% -- -- 8.95% 8/29/03
- ------------------------------------------------------------------------------------------
(1) Although the fund's actual inception date was 10/31/58, this inception date
corresponds with the investment advisor's implementation of its current
investment philosophy and practices.
(2) Data provided by Lipper Inc. - A Reuters Company. (c) 2006 Reuters. All
rights reserved. Any copying, republication or redistribution of Lipper
content, including by caching, framing or similar means, is expressly
prohibited without the prior written consent of Lipper. Lipper shall not be
liable for any errors or delays in the content, or for any actions taken in
reliance thereon.
The data contained herein has been obtained from company reports, financial
reporting services, periodicals and other resources believed to be reliable.
Although carefully verified, data on compilations is not guaranteed by
Lipper and may be incomplete. No offer or solicitations to buy or sell any
of the securities herein is being made by Lipper.
(3) Benchmark began 12/29/78.
Data presented reflect past performance. Past performance is no guarantee of
future results. Current performance may be higher or lower than the performance
shown. Investment return and principal value will fluctuate, and redemption
value may be more or less than original cost. To obtain performance data current
to the most recent month end, please call 1-800-345-2021 or visit
americancentury.com.
Unless otherwise indicated, performance reflects Investor Class shares;
performance for other share classes will vary due to differences in fee
structure. For information about other share classes available, please consult
the prospectus. Data assumes reinvestment of dividends and capital gains, and
none of the charts reflect the deduction of taxes that a shareholder would pay
on fund distributions or the redemption of fund shares. Returns for the index
are provided for comparison. The fund's total returns include operating expenses
(such as transaction costs and management fees) that reduce returns, while the
total returns of the index do not.
(continued)
- ------
3
Growth - Performance
GROWTH OF $10,000 OVER 10 YEARS
$10,000 investment made October 31, 1996
ONE-YEAR RETURNS OVER 10 YEARS
Periods ended October 31
- ------------------------------------------------------------------------------------------------
1997 1998 1999 2000 2001 2002 2003 2004 2005 2006
- ------------------------------------------------------------------------------------------------
Investor Class 27.85% 18.53% 36.31% 11.49% -34.14% -17.09% 16.62% 6.78% 7.47% 11.51%
- ------------------------------------------------------------------------------------------------
Russell 1000
Growth Index 30.47% 24.64% 34.25% 9.33% -39.95% -19.62% 21.81% 3.38% 8.81% 10.84%
- ------------------------------------------------------------------------------------------------
Data presented reflect past performance. Past performance is no guarantee of
future results. Current performance may be higher or lower than the performance
shown. Investment return and principal value will fluctuate, and redemption
value may be more or less than original cost. To obtain performance data current
to the most recent month end, please call 1-800-345-2021 or visit
americancentury.com.
Unless otherwise indicated, performance reflects Investor Class shares;
performance for other share classes will vary due to differences in fee
structure. For information about other share classes available, please consult
the prospectus. Data assumes reinvestment of dividends and capital gains, and
none of the charts reflect the deduction of taxes that a shareholder would pay
on fund distributions or the redemption of fund shares. Returns for the index
are provided for comparison. The fund's total returns include operating expenses
(such as transaction costs and management fees) that reduce returns, while the
total returns of the index do not.
- ------
4
Growth - Portfolio Commentary
PORTFOLIO MANAGERS: PRESCOTT LEGARD AND GREGORY WOODHAMS
PERFORMANCE SUMMARY
Growth returned 11.51%* for the 12 months ended October 31, 2006, compared with
the 10.84% return of its benchmark, the Russell 1000 Growth Index and the
9.05%** average return of the 1,686 funds in the Morningstar Large Growth Funds
category.
Growth's longer-term performance also remained solid, with average annual
returns in excess of its benchmark (see page 3) and the Morningstar category
average, which were 4.24% and 5.93% for the five- and 10-year periods ended
October 31, 2006, respectively.
As outlined in the Market Perspective on page 2, a pause in Federal Reserve
interest rate hikes and expectations for lower interest rates and mild inflation
going forward helped produce U.S. stock index returns in the 10-25% range for
the 12-month period. On an absolute basis, every sector contributed to Growth's
return except utilities, a tiny portion (less than 1%) of the fund and the
index.
Relative to its benchmark, Growth's outperformance resulted largely from
effective stock selection across a wide range of sectors, including information
technology, industrials, and energy, among others. Indeed, the portfolio's
positions outperformed in all but two of the index's sectors -- financial stocks
and utilities.
INFORMATION TECHNOLOGY LED OUTPERFORMANCE
Information technology stocks were the leading source of the portfolio's
outperformance during the fiscal year. Stock selection in semiconductors
contributed significantly, especially an overweight position in Freescale
Semiconductor, a spin-off from Motorola producing chips for a number of wireless
and industrial applications. Freescale performed well overall, and received an
additional boost near the end of the period after agreeing to be acquired at a
significant premium to its existing share price. Coupled with an underweight
position in Intel, which performed poorly, these were two of the top-three
contributors to relative returns.
Growth also benefited from good stock selection in industrials. For the year,
the industrial names in the portfolio were up 19% during the period, compared
with 15% for those in the index.
TOP TEN HOLDINGS
AS OF OCTOBER 31, 2006
- --------------------------------------------------------------------------------
% OF % OF
NET ASSETS NET ASSETS
AS OF AS OF
10/31/06 4/30/06
- --------------------------------------------------------------------------------
Bank of America Corp. 3.3% --
- --------------------------------------------------------------------------------
Cisco Systems Inc. 3.0% 3.1%
- --------------------------------------------------------------------------------
Intel Corp. 2.8% --
- --------------------------------------------------------------------------------
PepsiCo, Inc. 2.7% 2.9%
- --------------------------------------------------------------------------------
Oracle Corp. 2.6% 1.0%
- --------------------------------------------------------------------------------
General Electric Co. 2.6% 4.2%
- --------------------------------------------------------------------------------
Google Inc. Cl A 2.6% 1.5%
- --------------------------------------------------------------------------------
Schering-Plough Corp. 2.5% --
- --------------------------------------------------------------------------------
Emerson Electric Co. 2.5% 2.4%
- --------------------------------------------------------------------------------
Wal-Mart Stores, Inc. 2.2% --
- --------------------------------------------------------------------------------
* All fund returns referenced in this commentary are for Investor Class shares.
** (c) 2006 Morningstar, Inc. All Rights Reserved. The information contained
herein: (1) is proprietary to Morningstar and/or its content providers:
(2) may not be copied or distributed; and (3) is not warranted
to be accurate, complete or timely. Neither Morningstar
nor its content providers are responsible for any damages
or losses arising from any use of this information. (continued)
- ------
5
Growth - Portfolio Commentary
Stock selection also had a positive effect in the energy sector, where
performance was quite volatile quarter-to-quarter. In general, we avoided firms
with exposure to the volatile North American natural gas market; instead, we
favored service companies more closely tied to oil companies with well-financed
capital expenditure budgets. As a result, Growth's energy holdings were up 20%,
compared with 8% for this segment of the index. The portfolio's top contributor
in this space was Schlumberger, a global oil-field-services provider that
benefited from increased exploration for oil and gas given higher energy prices
overall. That helped Schlumberger return 40% for the 12-month period.
Finally, our top contributor for the 12 months was an overweight position in
Archer-Daniels-Midland (ADM), which performed well on the strength of its
oilseed and corn processing businesses. ADM drew additional investor interest
during the period because it is a leading producer of ethanol, an alternative
and additive to gasoline made from corn.
FINANCIALS DETRACTED
The portfolio's performance would have been even better relative to its
benchmark but for positioning among financials shares. For the year, Growth's
financial holdings were up 14%, compared with 18% for this portion of the index.
Despite an overweight position in this sector, which was among the
best-performing segments of the market for the year, disappointing stock
selection limited Growth's relative return. In particular, positioning among
capital markets shares -- the leading contributor to index returns from the
financials sector -- detracted from relative performance.
PORTFOLIO OBJECTIVE & EXPECTATIONS
American Century Growth seeks long-term capital appreciation for investors who
can tolerate short-term share price fluctuations. We pursue our objective by
continuing to remain fully invested in large companies that are exhibiting
sustainable improvement in their businesses. It is our belief that owning such
companies will generate outperformance over time versus the Russell 1000 Growth
Index and the other funds in our large-growth peer group.
TOP FIVE INDUSTRIES
AS OF OCTOBER 31, 2006
- --------------------------------------------------------------------------------
% OF % OF
NET ASSETS NET ASSETS
AS OF AS OF
10/31/06 4/30/06
- --------------------------------------------------------------------------------
Pharmaceuticals 7.4% 3.2%
- --------------------------------------------------------------------------------
Software 6.7% 5.3%
- --------------------------------------------------------------------------------
Specialty Retail 5.4% 4.2%
- --------------------------------------------------------------------------------
Diversified
Financial Services 5.3% --
- --------------------------------------------------------------------------------
Semiconductors & Semiconductor
Equipment 5.1% 4.6%
- --------------------------------------------------------------------------------
TYPES OF INVESTMENTS IN PORTFOLIO
- --------------------------------------------------------------------------------
% OF % OF
NET ASSETS NET ASSETS
AS OF AS OF
10/31/06 4/30/06
- --------------------------------------------------------------------------------
Domestic
Common Stocks 90.4% 87.9%
- --------------------------------------------------------------------------------
Foreign Common Stocks* 9.3% 9.8%
- --------------------------------------------------------------------------------
TOTAL COMMON STOCKS 99.7% 97.7%
- --------------------------------------------------------------------------------
Temporary
Cash Investments 0.4% 1.5%
- --------------------------------------------------------------------------------
Other Assets
and Liabilities (0.1)% 0.8%
- --------------------------------------------------------------------------------
* Includes depositary shares, dual listed securities and foreign ordinary
shares.
- ------
6
Growth - Schedule of Investments
OCTOBER 31, 2006
Shares ($ IN THOUSANDS) Value
- --------------------------------------------------------------------------------
COMMON STOCKS -- 99.7%
AEROSPACE & DEFENSE -- 3.6%
- --------------------------------------------------------------------------------
1,000,700 Boeing Co. $ 79,916
- --------------------------------------------------------------------------------
1,381,200 United Technologies Corp. 90,772
- --------------------------------------------------------------------------------
170,688
- --------------------------------------------------------------------------------
AIRLINES -- 1.1%
- --------------------------------------------------------------------------------
1,430,600 Continental Airlines Inc. Cl B(1) 52,761
- --------------------------------------------------------------------------------
BEVERAGES -- 3.1%
- --------------------------------------------------------------------------------
407,200 Anheuser-Busch Companies, Inc. 19,309
- --------------------------------------------------------------------------------
2,012,700 PepsiCo, Inc. 127,686
- --------------------------------------------------------------------------------
146,995
- --------------------------------------------------------------------------------
BIOTECHNOLOGY -- 4.5%
- --------------------------------------------------------------------------------
1,321,500 Amgen Inc.(1) 100,316
- --------------------------------------------------------------------------------
540,400 Genentech, Inc.(1) 45,015
- --------------------------------------------------------------------------------
987,800 Gilead Sciences, Inc.(1) 68,059
- --------------------------------------------------------------------------------
213,390
- --------------------------------------------------------------------------------
CAPITAL MARKETS -- 2.4%
- --------------------------------------------------------------------------------
253,100 Bear Stearns Companies Inc. (The) 38,307
- --------------------------------------------------------------------------------
413,900 Goldman Sachs Group, Inc. (The) 78,554
- --------------------------------------------------------------------------------
116,861
- --------------------------------------------------------------------------------
CHEMICALS -- 0.3%
- --------------------------------------------------------------------------------
319,500 Monsanto Co. 14,128
- --------------------------------------------------------------------------------
COMMERCIAL BANKS -- 1.6%
- --------------------------------------------------------------------------------
380,500 SunTrust Banks, Inc. 30,056
- --------------------------------------------------------------------------------
1,260,000 Wells Fargo & Co. 45,725
- --------------------------------------------------------------------------------
75,781
- --------------------------------------------------------------------------------
COMMUNICATIONS EQUIPMENT -- 5.0%
- --------------------------------------------------------------------------------
5,952,000 Cisco Systems Inc.(1) 143,622
- --------------------------------------------------------------------------------
4,072,200 Motorola, Inc. 93,905
- --------------------------------------------------------------------------------
237,527
- --------------------------------------------------------------------------------
COMPUTERS & PERIPHERALS -- 3.8%
- --------------------------------------------------------------------------------
622,600 Apple Computer, Inc.(1) 50,480
- --------------------------------------------------------------------------------
2,394,000 Hewlett-Packard Co. 92,744
- --------------------------------------------------------------------------------
1,114,500 Network Appliance, Inc.(1) 40,679
- --------------------------------------------------------------------------------
183,903
- --------------------------------------------------------------------------------
DIVERSIFIED FINANCIAL SERVICES -- 5.3%
- --------------------------------------------------------------------------------
2,918,800 Bank of America Corp. 157,235
- --------------------------------------------------------------------------------
1,995,100 JPMorgan Chase & Co. 94,648
- --------------------------------------------------------------------------------
251,883
- --------------------------------------------------------------------------------
DIVERSIFIED TELECOMMUNICATION
SERVICES -- 1.5%
- --------------------------------------------------------------------------------
2,133,100 AT&T Inc. 73,059
- --------------------------------------------------------------------------------
Shares ($ IN THOUSANDS) Value
- --------------------------------------------------------------------------------
ELECTRICAL EQUIPMENT -- 4.9%
- --------------------------------------------------------------------------------
849,000 Cooper Industries, Ltd. Cl A $ 75,943
- --------------------------------------------------------------------------------
1,397,100 Emerson Electric Co. 117,915
- --------------------------------------------------------------------------------
891,200 Roper Industries Inc. 42,644
- --------------------------------------------------------------------------------
236,502
- --------------------------------------------------------------------------------
ELECTRONIC EQUIPMENT
& INSTRUMENTS -- 0.4%
- --------------------------------------------------------------------------------
619,100 Tektronix, Inc. 18,802
- --------------------------------------------------------------------------------
ENERGY EQUIPMENT & SERVICES -- 2.0%
- --------------------------------------------------------------------------------
545,100 Cameron International Corp.(1) 27,310
- --------------------------------------------------------------------------------
1,099,000 Schlumberger Ltd. 69,324
- --------------------------------------------------------------------------------
96,634
- --------------------------------------------------------------------------------
FOOD & STAPLES RETAILING -- 2.2%
- --------------------------------------------------------------------------------
2,173,100 Wal-Mart Stores, Inc. 107,090
- --------------------------------------------------------------------------------
HEALTH CARE EQUIPMENT & SUPPLIES -- 4.1%
- --------------------------------------------------------------------------------
186,700 Alcon Inc. 19,805
- --------------------------------------------------------------------------------
1,071,800 Baxter International, Inc. 49,271
- --------------------------------------------------------------------------------
1,349,600 Becton Dickinson & Co. 94,511
- --------------------------------------------------------------------------------
343,400 Cytyc Corp.(1) 9,073
- --------------------------------------------------------------------------------
303,200 DJO Inc.(1) 12,198
- --------------------------------------------------------------------------------
253,500 Edwards Lifesciences Corporation(1) 10,883
- --------------------------------------------------------------------------------
16,800 Idexx Laboratories, Inc.(1) 1,398
- --------------------------------------------------------------------------------
197,139
- --------------------------------------------------------------------------------
HEALTH CARE PROVIDERS & SERVICES -- 1.2%
- --------------------------------------------------------------------------------
445,400 Caremark Rx Inc. 21,927
- --------------------------------------------------------------------------------
437,400 Laboratory Corp.
of America Holdings(1) 29,958
- --------------------------------------------------------------------------------
217,800 VCA Antech Inc.(1) 7,050
- --------------------------------------------------------------------------------
58,935
- --------------------------------------------------------------------------------
HOTELS, RESTAURANTS & LEISURE -- 3.7%
- --------------------------------------------------------------------------------
906,500 Brinker International, Inc. 42,089
- --------------------------------------------------------------------------------
504,700 Chipotle Mexican Grill Inc. Cl B(1) 29,474
- --------------------------------------------------------------------------------
475,400 Darden Restaurants, Inc. 19,919
- --------------------------------------------------------------------------------
1,093,900 Hilton Hotels Corporation 31,636
- --------------------------------------------------------------------------------
1,428,800 Starbucks Corporation(1) 53,937
- --------------------------------------------------------------------------------
177,055
- --------------------------------------------------------------------------------
HOUSEHOLD DURABLES -- 2.0%
- --------------------------------------------------------------------------------
493,200 Mohawk Industries Inc.(1) 35,856
- --------------------------------------------------------------------------------
2,140,000 Newell Rubbermaid Inc. 61,589
- --------------------------------------------------------------------------------
97,445
- --------------------------------------------------------------------------------
INDEPENDENT POWER PRODUCERS
& ENERGY TRADERS -- 0.7%
- --------------------------------------------------------------------------------
516,200 TXU Corp. 32,588
- --------------------------------------------------------------------------------
See Notes to Financial Statements. (continued)
- ------
7
Growth - Schedule of Investments
OCTOBER 31, 2006
Shares ($ IN THOUSANDS) Value
- --------------------------------------------------------------------------------
INDUSTRIAL CONGLOMERATES -- 4.7%
- --------------------------------------------------------------------------------
3,505,900 General Electric Co. $ 123,092
- --------------------------------------------------------------------------------
1,106,100 Textron Inc. 100,578
- --------------------------------------------------------------------------------
223,670
- --------------------------------------------------------------------------------
INSURANCE -- 2.0%
- --------------------------------------------------------------------------------
222,200 Endurance Specialty Holdings Ltd. 7,921
- --------------------------------------------------------------------------------
227,500 PartnerRe Ltd. 15,907
- --------------------------------------------------------------------------------
1,410,700 St. Paul Travelers
Companies, Inc. (The) 72,129
- --------------------------------------------------------------------------------
95,957
- --------------------------------------------------------------------------------
INTERNET SOFTWARE & SERVICES -- 2.6%
- --------------------------------------------------------------------------------
256,800 Google Inc. Cl A(1) 122,337
- --------------------------------------------------------------------------------
IT SERVICES -- 4.5%
- --------------------------------------------------------------------------------
1,107,600 Accenture Ltd. Cl A 36,451
- --------------------------------------------------------------------------------
1,009,100 International Business
Machines Corp. 93,171
- --------------------------------------------------------------------------------
3,925,600 Western Union Co. (The)(1) 86,559
- --------------------------------------------------------------------------------
216,181
- --------------------------------------------------------------------------------
MACHINERY -- 0.4%
- --------------------------------------------------------------------------------
219,300 Deere & Co. 18,669
- --------------------------------------------------------------------------------
MEDIA -- 0.8%
- --------------------------------------------------------------------------------
676,000 Lamar Advertising Co. Cl A(1) 38,992
- --------------------------------------------------------------------------------
METALS & MINING -- 1.9%
- --------------------------------------------------------------------------------
889,500 Allegheny Technologies Inc. 70,031
- --------------------------------------------------------------------------------
204,900 Carpenter Technology 21,922
- --------------------------------------------------------------------------------
91,953
- --------------------------------------------------------------------------------
MULTILINE RETAIL -- 1.5%
- --------------------------------------------------------------------------------
510,700 J.C. Penney Co. Inc. 38,420
- --------------------------------------------------------------------------------
600,400 Target Corp. 35,532
- --------------------------------------------------------------------------------
73,952
- --------------------------------------------------------------------------------
OIL, GAS & CONSUMABLE FUELS -- 1.6%
- --------------------------------------------------------------------------------
124,100 Apache Corp. 8,106
- --------------------------------------------------------------------------------
1,428,600 Occidental Petroleum Corp. 67,059
- --------------------------------------------------------------------------------
75,165
- --------------------------------------------------------------------------------
PERSONAL PRODUCTS -- 0.3%
- --------------------------------------------------------------------------------
401,100 Bare Escentuals Inc.(1) 12,286
- --------------------------------------------------------------------------------
PHARMACEUTICALS -- 7.4%
- --------------------------------------------------------------------------------
208,600 Allergan, Inc. 24,093
- --------------------------------------------------------------------------------
1,171,000 Novartis AG ORD 71,112
- --------------------------------------------------------------------------------
476,800 Novo Nordisk AS Cl B ORD 36,014
- --------------------------------------------------------------------------------
401,900 Roche Holding AG ORD 70,375
- --------------------------------------------------------------------------------
5,486,600 Schering-Plough Corp. 121,473
- --------------------------------------------------------------------------------
990,100 Teva Pharmaceutical
Industries Ltd. ADR 32,644
- --------------------------------------------------------------------------------
355,711
- --------------------------------------------------------------------------------
Shares ($ IN THOUSANDS) Value
- --------------------------------------------------------------------------------
SEMICONDUCTORS &
SEMICONDUCTOR EQUIPMENT -- 5.1%
- --------------------------------------------------------------------------------
872,200 Broadcom Corp. Cl A(1) $ 26,401
- --------------------------------------------------------------------------------
6,197,300 Intel Corp. 132,251
- --------------------------------------------------------------------------------
2,396,600 STMicroelectronics N.V.
New York Shares 41,605
- --------------------------------------------------------------------------------
1,539,900 Texas Instruments Inc. 46,474
- --------------------------------------------------------------------------------
246,731
- --------------------------------------------------------------------------------
SOFTWARE -- 6.7%
- --------------------------------------------------------------------------------
2,911,200 BEA Systems Inc.(1) 47,365
- --------------------------------------------------------------------------------
711,100 Business Objects SA ADR(1) 26,339
- --------------------------------------------------------------------------------
449,900 Cognos, Inc.(1) 16,412
- --------------------------------------------------------------------------------
585,900 Electronic Arts Inc.(1) 30,988
- --------------------------------------------------------------------------------
1,257,700 Microsoft Corporation 36,109
- --------------------------------------------------------------------------------
6,845,500 Oracle Corp.(1) 126,437
- --------------------------------------------------------------------------------
1,983,100 Symantec Corp.(1) 39,345
- --------------------------------------------------------------------------------
322,995
- --------------------------------------------------------------------------------
SPECIALTY RETAIL -- 5.4%
- --------------------------------------------------------------------------------
614,800 Abercrombie & Fitch Co. 47,124
- --------------------------------------------------------------------------------
1,862,000 Gap, Inc. (The) 39,139
- --------------------------------------------------------------------------------
1,572,800 Lowe's Companies, Inc. 47,404
- --------------------------------------------------------------------------------
1,674,200 Office Depot, Inc.(1) 70,300
- --------------------------------------------------------------------------------
1,847,700 TJX Companies, Inc. (The) 53,491
- --------------------------------------------------------------------------------
257,458
- --------------------------------------------------------------------------------
TEXTILES, APPAREL & LUXURY GOODS -- 0.9%
- --------------------------------------------------------------------------------
601,100 Polo Ralph Lauren Corp. 42,678
- --------------------------------------------------------------------------------
WIRELESS TELECOMMUNICATION SERVICES -- 0.5%
- --------------------------------------------------------------------------------
646,800 American Tower Corp. Cl A(1) 23,298
- --------------------------------------------------------------------------------
TOTAL COMMON STOCKS
(Cost $4,070,009) 4,777,199
- --------------------------------------------------------------------------------
TEMPORARY CASH INVESTMENTS -- 0.4%
- --------------------------------------------------------------------------------
Repurchase Agreement, Bank of America
Securities, LLC, (collateralized by various
U.S. Treasury obligations, 4.875%, 10/31/08,
valued at $21,028), in a joint trading account
at 5.24%, dated 10/31/06, due 11/1/06
(Delivery Value $20,603)
(Cost $20,600) 20,600
- --------------------------------------------------------------------------------
TOTAL INVESTMENT SECURITIES -- 100.1%
(Cost $4,090,609) 4,797,799
- --------------------------------------------------------------------------------
OTHER ASSETS AND
LIABILITIES -- (0.1)% (4,757)
- --------------------------------------------------------------------------------
TOTAL NET ASSETS -- 100.0% $4,793,042
================================================================================
See Notes to Financial Statements. (continued)
- ------
8
Growth - Schedule of Investments
OCTOBER 31, 2006
FORWARD FOREIGN CURRENCY EXCHANGE CONTRACTS
($ IN THOUSANDS)
Contracts to Sell Settlement Date Value Unrealized Gain (Loss)
- --------------------------------------------------------------------------------
105,832,452 CHF for USD 11/30/06 $85,378 $(406)
- --------------------------------------------------------------------------------
125,016,960 DKK for USD 11/30/06 21,445 (79)
- --------------------------------------------------------------------------------
$106,823 $(485)
===================================
(Value on Settlement Date $106,338)
NOTES TO SCHEDULE OF INVESTMENTS
ADR = American Depositary Receipt
CHF = Swiss Franc
DKK = Danish Krone
ORD = Foreign Ordinary Share
USD = United States Dollar
(1) Non-income producing.
See Notes to Financial Statements.
- ------
9
Focused Growth - Performance
TOTAL RETURNS AS OF OCTOBER 31, 2006
--------------
AVERAGE ANNUAL
RETURNS
- --------------------------------------------------------------------------------
SINCE INCEPTION
1 YEAR INCEPTION DATE
- --------------------------------------------------------------------------------
INVESTOR CLASS 9.13% 8.68% 2/28/05
- --------------------------------------------------------------------------------
BLENDED INDEX 13.57% 9.56% --
- --------------------------------------------------------------------------------
RUSSELL 1000 GROWTH INDEX(1) 10.84% 8.66% --
- --------------------------------------------------------------------------------
S&P 500 INDEX(1) 16.34% 10.45% --
- --------------------------------------------------------------------------------
(1) Data provided by Lipper Inc. - A Reuters Company. (c) 2006 Reuters. All
rights reserved. Any copying, republication or redistribution of Lipper
content, including by caching, framing or similar means, is expressly
prohibited without the prior written consent of Lipper. Lipper shall not be
liable for any errors or delays in the content, or for any actions taken in
reliance thereon.
The data contained herein has been obtained from company reports, financial
reporting services, periodicals and other resources believed to be reliable.
Although carefully verified, data on compilations is not guaranteed by
Lipper and may be incomplete. No offer or solicitations to buy or sell any
of the securities herein is being made by Lipper.
Data presented reflect past performance. Past performance is no guarantee of
future results. Current performance may be higher or lower than the performance
shown. Investment return and principal value will fluctuate, and redemption
value may be more or less than original cost. To obtain performance data current
to the most recent month end, please call 1-800-345-2021 or visit
americancentury.com. The fund is considered non-diversified and has the
potential for wide performance swings, both up and down. The fund's investment
approach may also result in high portfolio turnover, which could mean high
transaction costs, affecting both performance and capital gains tax liabilities
to investors.
Data assumes reinvestment of dividends and capital gains, and none of the charts
reflect the deduction of taxes that a shareholder would pay on fund
distributions or the redemption of fund shares. Returns for the indices are
provided for comparison. The fund's total returns include operating expenses
(such as transaction costs and management fees) that reduce returns, while the
total returns of the indices do not.
(continued)
- ------
10
Focused Growth - Performance
GROWTH OF $10,000 OVER LIFE OF CLASS
$10,000 investment made February 28, 2005
ONE-YEAR RETURNS OVER LIFE OF CLASS
Periods ended October 31
- --------------------------------------------------------------------------------
2005* 2006
- --------------------------------------------------------------------------------
Investor Class 5.30% 9.13%
- --------------------------------------------------------------------------------
Blended index 2.53% 13.57%
- --------------------------------------------------------------------------------
Russell 1000 Growth Index 3.62% 10.84%
- --------------------------------------------------------------------------------
S&P 500 Index 1.44% 16.34%
- --------------------------------------------------------------------------------
* From 2/28/05, the Investor Class's inception date. Not annualized.
Data presented reflect past performance. Past performance is no guarantee of
future results. Current performance may be higher or lower than the performance
shown. Investment return and principal value will fluctuate, and redemption
value may be more or less than original cost. To obtain performance data current
to the most recent month end, please call 1-800-345-2021 or visit
americancentury.com. The fund is considered non-diversified and has the
potential for wide performance swings, both up and down. The fund's investment
approach may also result in high portfolio turnover, which could mean high
transaction costs, affecting both performance and capital gains tax liabilities
to investors.
Data assumes reinvestment of dividends and capital gains, and none of the charts
reflect the deduction of taxes that a shareholder would pay on fund
distributions or the redemption of fund shares. Returns for the indices are
provided for comparison. The fund's total returns include operating expenses
(such as transaction costs and management fees) that reduce returns, while the
total returns of the indices do not.
- ------
11
Focused Growth - Portfolio Commentary
PORTFOLIO MANAGERS: JOE REILAND AND GREGORY WOODHAMS.
PERFORMANCE SUMMARY
Focused Growth returned 9.13% for the 12 months ended October 31, 2006, compared
with the 13.57% return of its blended benchmark. The blended index's return
reflects the performance of its equally weighted components, the Russell 1000
Growth Index and the S&P 500 Index, which rose 10.84% and 16.34%, respectively.
At the same time, the 1,686 funds in the Morningstar Large Growth Funds category
had an average return of 9.05%.*
As outlined in the Market Perspective on page 2, a pause in Federal Reserve
interest rate hikes and expectations for lower interest rates and mild inflation
going forward helped produce U.S. stock index returns in the 10-25% range for
the 12-month period. In absolute terms, every stock sector made a positive
contribution to Focused Growth's return for the year. But in relative terms, the
portfolio trailed its benchmark primarily because of positioning among
information technology and consumer discretionary shares.
TOP CONTRIBUTORS
One of the key contributors to both absolute and relative performance was
Schlumberger, the largest position in the Focused Growth portfolio. This leading
global oil-field-services provider benefited from increased exploration for oil
and gas given higher energy prices overall. That helped Schlumberger return 40%
for the 12-month period.
Another of the portfolio's top contributors was food products firm
Archer-Daniels-Midland (ADM), up almost 60% for the year. The company continued
to perform well on the strength of its oilseed and corn processing businesses.
ADM drew additional investor interest because it is a leading producer of the
fossil fuel alternatives biodiesel and ethanol.
In industrials, we favored stocks of companies that typically perform better
late in economic cycles and that have less interest rate sensitivity, such as
capital goods and aerospace and defense firms. Continental Airlines was among
the portfolio's biggest contributors to both relative and absolute returns. The
company is experiencing good yield and traffic trends, and has a relatively
young, efficient fleet of planes. For the year, the stock was up 185%.
INFORMATION TECHNOLOGY, CONSUMER DISCRETIONARY MIXED
Despite positive stock selection in the information technology sector overall,
Focused Growth's relative return was negatively impacted by some of our
TOP TEN HOLDINGS
AS OF OCTOBER 31, 2006
- --------------------------------------------------------------------------------
% OF % OF
NET ASSETS NET ASSETS
AS OF AS OF
10/31/06 4/30/06
- --------------------------------------------------------------------------------
Cisco Systems Inc. 4.4% 4.1%
- --------------------------------------------------------------------------------
Textron Inc. 4.4% 4.2%
- --------------------------------------------------------------------------------
Hewlett-Packard Co. 4.3% 4.1%
- --------------------------------------------------------------------------------
Schering-Plough Corp. 4.3% --
- --------------------------------------------------------------------------------
Emerson Electric Co. 4.3% 4.3%
- --------------------------------------------------------------------------------
Baxter International, Inc. 4.2% --
- --------------------------------------------------------------------------------
Wells Fargo & Co. 4.1% 1.3%
- --------------------------------------------------------------------------------
St. Paul Travelers
Companies, Inc. (The) 4.1% --
- --------------------------------------------------------------------------------
Roche Holding AG ORD 3.9% --
- --------------------------------------------------------------------------------
Oracle Corp. 3.9% --
- --------------------------------------------------------------------------------
* (c) 2006 Morningstar, Inc. All Rights Reserved. The information contained
herein: (1) is proprietary to Morningstar and/or its content providers:
(2) may not be copied or distributed; and (3) is not warranted to be
accurate, complete or timely. Neither Morningstar nor its content
providers are responsible for any damages or losses arising
from any use of this information. (continued)
- ------
12
Focused Growth - Portfolio Commentary
security selections. The two biggest detractors from performance were anti-virus
software maker McAfee and communications equipment firm QUALCOMM Inc. McAfee's
shares were hurt by concerns that Microsoft would enter the business. Our
optimism about QUALCOMM Inc. and other holdings in the communications equipment
industry due to the increasing adoption of high-volume wireless communications
and rising global usage of the Internet was not rewarded during the period.
However, the portfolio's top contributor to both relative and absolute returns
also resided in the information technology space -- Broadcom, a leading chip
manufacturer experiencing strong growth in wireless networking. Its products are
used in everything from consumer electronics to Internet communications gear.
Mixed returns were also the theme in the consumer discretionary sector, which
was home to such significant detractors as Ross Stores, Target Corp., and Weight
Watchers International. At the same time, such stocks as J.C. Penney and Polo
Ralph Lauren were leading contributors on both a relative and absolute basis.
Polo performed well during the period, announcing better-than-expected earnings
and operating margin figures, as well as a share buyback plan. J.C. Penney
continued to benefit from a decision to close underperforming stores. The firm
announced better-than-expected same-store sales figures, as well as rapid growth
in Internet sales, and lifted its earnings guidance.
PORTFOLIO OBJECTIVE & EXPECTATIONS
Focused Growth seeks long-term growth and is designed for investors who can
tolerate short-term share price fluctuation as they seek to complement current
holdings with an aggressive, concentrated growth investment. The portfolio
remains fully invested in larger-sized companies that are exhibiting sustainable
improvement in their business. We believe this approach will lead to
outperformance over time.
That said, shareholders should understand that Focused Growth is a
non-diversified fund, meaning its holdings are typically limited to a core group
of approximately 25-45 stocks. Stocks advancing in this concentrated portfolio,
where a single holding may account for more than 5% of assets, will have a
positive impact on performance. However, investors need to be prepared for the
other side of the coin: if a large position stumbles, the effect is magnified.
TYPES OF INVESTMENTS IN PORTFOLIO
- --------------------------------------------------------------------------------
% OF % OF
NET ASSETS NET ASSETS
AS OF AS OF
10/31/06 4/30/06
- --------------------------------------------------------------------------------
Domestic
Common Stocks 91.9% 87.3%
- --------------------------------------------------------------------------------
Foreign Common Stocks* 7.1% 10.9%
- --------------------------------------------------------------------------------
TOTAL COMMON STOCKS 99.0% 98.2%
- --------------------------------------------------------------------------------
Temporary Cash
Investments 0.6% 0.6%
- --------------------------------------------------------------------------------
Other Assets
and Liabilities 0.4% 1.2%
- --------------------------------------------------------------------------------
* Includes depositary shares, dual listed securities and foreign ordinary
shares.
TOP FIVE INDUSTRIES
AS OF OCTOBER 31, 2006
- --------------------------------------------------------------------------------
% OF % OF
NET ASSETS NET ASSETS
AS OF AS OF
10/31/06 4/30/06
- --------------------------------------------------------------------------------
Pharmaceuticals 8.2% 4.3%
- --------------------------------------------------------------------------------
Electrical Equipment 7.9% 4.4%
- --------------------------------------------------------------------------------
Health Care
Equipment & Supplies 7.5% 7.9%
- --------------------------------------------------------------------------------
Specialty Retail 6.7% --
- --------------------------------------------------------------------------------
Communications
Equipment 6.6% 6.5%
- --------------------------------------------------------------------------------
Focused Growth - Schedule of Investments
- ------
13
OCTOBER 31, 2006
Shares ($ IN THOUSANDS) Value
- --------------------------------------------------------------------------------
COMMON STOCKS -- 99.0%
AIRLINES -- 1.5%
- --------------------------------------------------------------------------------
6,447 Continental Airlines Inc. Cl B(1) $ 238
- --------------------------------------------------------------------------------
BEVERAGES -- 5.9%
- --------------------------------------------------------------------------------
7,861 Anheuser-Busch Companies, Inc. 373
- --------------------------------------------------------------------------------
8,796 PepsiCo, Inc. 558
- --------------------------------------------------------------------------------
931
- --------------------------------------------------------------------------------
BIOTECHNOLOGY -- 0.8%
- --------------------------------------------------------------------------------
1,587 Genentech, Inc.(1) 132
- --------------------------------------------------------------------------------
CHEMICALS -- 3.3%
- --------------------------------------------------------------------------------
11,859 Monsanto Co. 524
- --------------------------------------------------------------------------------
COMMERCIAL BANKS -- 4.1%
- --------------------------------------------------------------------------------
18,104 Wells Fargo & Co. 657
- --------------------------------------------------------------------------------
COMMUNICATIONS EQUIPMENT -- 6.6%
- --------------------------------------------------------------------------------
29,074 Cisco Systems Inc.(1) 701
- --------------------------------------------------------------------------------
14,827 Motorola, Inc. 342
- --------------------------------------------------------------------------------
1,043
- --------------------------------------------------------------------------------
COMPUTERS & PERIPHERALS -- 5.3%
- --------------------------------------------------------------------------------
17,752 Hewlett-Packard Co. 688
- --------------------------------------------------------------------------------
4,200 Network Appliance, Inc.(1) 153
- --------------------------------------------------------------------------------
841
- --------------------------------------------------------------------------------
DIVERSIFIED FINANCIAL SERVICES -- 5.4%
- --------------------------------------------------------------------------------
11,096 Bank of America Corp. 598
- --------------------------------------------------------------------------------
5,273 JPMorgan Chase & Co. 250
- --------------------------------------------------------------------------------
848
- --------------------------------------------------------------------------------
ELECTRICAL EQUIPMENT -- 7.9%
- --------------------------------------------------------------------------------
6,332 Cooper Industries, Ltd. Cl A 566
- --------------------------------------------------------------------------------
8,021 Emerson Electric Co. 678
- --------------------------------------------------------------------------------
1,244
- --------------------------------------------------------------------------------
ENERGY EQUIPMENT & SERVICES -- 3.1%
- --------------------------------------------------------------------------------
7,922 Schlumberger Ltd. 500
- --------------------------------------------------------------------------------
HEALTH CARE EQUIPMENT & SUPPLIES -- 7.5%
- --------------------------------------------------------------------------------
14,624 Baxter International, Inc. 672
- --------------------------------------------------------------------------------
12,134 Edwards Lifesciences
Corporation(1) 521
- --------------------------------------------------------------------------------
1,193
- --------------------------------------------------------------------------------
HEALTH CARE PROVIDERS & SERVICES -- 3.1%
- --------------------------------------------------------------------------------
7,165 Laboratory Corp.
of America Holdings(1) 491
- --------------------------------------------------------------------------------
HOUSEHOLD DURABLES -- 1.8%
- --------------------------------------------------------------------------------
9,700 Newell Rubbermaid Inc. 279
- --------------------------------------------------------------------------------
INDUSTRIAL CONGLOMERATES -- 4.4%
- --------------------------------------------------------------------------------
7,581 Textron Inc. 689
- --------------------------------------------------------------------------------
INSURANCE -- 4.1%
- --------------------------------------------------------------------------------
12,722 St. Paul Travelers
Companies, Inc. (The) 650
- --------------------------------------------------------------------------------
Shares ($ IN THOUSANDS) Value
- --------------------------------------------------------------------------------
INTERNET SOFTWARE & SERVICES -- 1.7%
- --------------------------------------------------------------------------------
549 Google Inc. Cl A(1) $ 262
- --------------------------------------------------------------------------------
METALS & MINING -- 1.9%
- --------------------------------------------------------------------------------
527 Allegheny Technologies Inc. 41
- --------------------------------------------------------------------------------
2,418 Carpenter Technology 259
- --------------------------------------------------------------------------------
300
- --------------------------------------------------------------------------------
MULTILINE RETAIL -- 3.4%
- --------------------------------------------------------------------------------
7,073 J.C. Penney Co. Inc. 532
- --------------------------------------------------------------------------------
OIL, GAS & CONSUMABLE FUELS -- 0.5%
- --------------------------------------------------------------------------------
2,062 Occidental Petroleum Corp. 97
- --------------------------------------------------------------------------------
PHARMACEUTICALS -- 8.2%
- --------------------------------------------------------------------------------
3,520 Roche Holding AG ORD 616
- --------------------------------------------------------------------------------
30,712 Schering-Plough Corp. 681
- --------------------------------------------------------------------------------
1,297
- --------------------------------------------------------------------------------
SEMICONDUCTORS & SEMICONDUCTOR
EQUIPMENT -- 3.6%
- --------------------------------------------------------------------------------
12,673 Intel Corp. 270
- --------------------------------------------------------------------------------
10,000 Texas Instruments Inc. 302
- --------------------------------------------------------------------------------
572
- --------------------------------------------------------------------------------
SOFTWARE -- 5.3%
- --------------------------------------------------------------------------------
33,286 Oracle Corp.(1) 615
- --------------------------------------------------------------------------------
11,306 Symantec Corp.(1) 224
- --------------------------------------------------------------------------------
839
- --------------------------------------------------------------------------------
SPECIALTY RETAIL -- 6.7%
- --------------------------------------------------------------------------------
13,574 Office Depot, Inc.(1) 570
- --------------------------------------------------------------------------------
17,045 TJX Companies, Inc. (The) 493
- --------------------------------------------------------------------------------
1,063
- --------------------------------------------------------------------------------
TEXTILES, APPAREL & LUXURY GOODS -- 2.9%
- --------------------------------------------------------------------------------
6,394 Polo Ralph Lauren Corp. 454
- --------------------------------------------------------------------------------
TOTAL COMMON STOCKS
(Cost $14,496) 15,676
- --------------------------------------------------------------------------------
TEMPORARY CASH INVESTMENTS -- 0.6%
- --------------------------------------------------------------------------------
Repurchase Agreement, Bank of America
Securities, LLC, (collateralized by various
U.S. Treasury obligations, 4.875%, 10/31/08,
valued at $102), in a joint trading account
at 5.24%, dated 10/31/06, due 11/1/06
(Delivery Value $100)
(Cost $100) 100
- --------------------------------------------------------------------------------
TOTAL INVESTMENT
SECURITIES -- 99.6%
(Cost $14,596) 15,776
- --------------------------------------------------------------------------------
OTHER ASSETS AND
LIABILITIES -- 0.4% 61
- --------------------------------------------------------------------------------
TOTAL NET ASSETS -- 100.0% $15,837
================================================================================
FORWARD FOREIGN CURRENCY EXCHANGE CONTRACTS
See Notes to Financial Statements. (continued)
- ------
14
Focused Growth - Schedule of Investments
OCTOBER 31, 2006
FORWARD FOREIGN CURRENCY EXCHANGE CONTRACTS
($ IN THOUSANDS)
Contracts to Sell Settlement Date Value Unrealized Gain (Loss)
- --------------------------------------------------------------------------------
458,937 CHF for USD 11/30/06 $370 $(2)
=====================================
(Value on Settlement Date $368)
NOTES TO SCHEDULE OF INVESTMENTS
CHF = Swiss Franc
ORD = Foreign Ordinary Share
USD = United States Dollar
(1) Non-income producing.
See Notes to Financial Statements.
- ------
15
Heritage - Performance
TOTAL RETURNS AS OF OCTOBER 31, 2006
-------------------------------
AVERAGE ANNUAL RETURNS
- ----------------------------------------------------------------------------------------
SINCE INCEPTION
1 YEAR 5 YEARS 10 YEARS INCEPTION DATE
- ----------------------------------------------------------------------------------------
INVESTOR CLASS 16.26% 9.11% 9.14% 12.13% 11/10/87
- ----------------------------------------------------------------------------------------
RUSSELL MIDCAP GROWTH INDEX(1) 14.51% 10.62% 8.73% 12.26%(2) --
- ----------------------------------------------------------------------------------------
RUSSELL MIDCAP INDEX(1) 17.41% 14.80% 12.29% 14.12%(2) --
- ----------------------------------------------------------------------------------------
Institutional Class 16.59% 9.33% -- 8.04% 6/16/97
- ----------------------------------------------------------------------------------------
Advisor Class 15.96% 8.84% -- 7.07% 7/11/97
- ----------------------------------------------------------------------------------------
C Class 15.11% 8.03% -- 3.39% 6/26/01
- ----------------------------------------------------------------------------------------
(1) Data provided by Lipper Inc. - A Reuters Company. (c) 2006 Reuters. All
rights reserved. Any copying, republication or redistribution of Lipper
content, including by caching, framing or similar means, is expressly
prohibited without the prior written consent of Lipper. Lipper shall not be
liable for any errors or delays in the content, or for any actions taken in
reliance thereon.
The data contained herein has been obtained from company reports, financial
reporting services, periodicals and other resources believed to be reliable.
Although carefully verified, data on compilations is not guaranteed by
Lipper and may be incomplete. No offer or solicitations to buy or sell any
of the securities herein is being made by Lipper.
(2) Since 10/31/87, the date nearest the Investor Class's inception for which
data are available.
Data presented reflect past performance. Past performance is no guarantee of
future results. Current performance may be higher or lower than the performance
shown. Investment return and principal value will fluctuate, and redemption
value may be more or less than original cost. To obtain performance data current
to the most recent month end, please call 1-800-345-2021 or visit
americancentury.com.
Unless otherwise indicated, performance reflects Investor Class shares;
performance for other share classes will vary due to differences in fee
structure. For information about other share classes available, please consult
the prospectus. Data assumes reinvestment of dividends and capital gains, and
none of the charts reflect the deduction of taxes that a shareholder would pay
on fund distributions or the redemption of fund shares. Returns for the indices
are provided for comparison. The fund's total returns include operating expenses
(such as transaction costs and management fees) that reduce returns, while the
total returns of the indices do not.
(continued)
- ------
16
Heritage - Performance
GROWTH OF $10,000 OVER 10 YEARS
$10,000 investment made October 31, 1996
ONE-YEAR RETURNS OVER 10 YEARS
Periods ended October 31
- -------------------------------------------------------------------------------------------------------
1997 1998 1999 2000 2001 2002 2003 2004 2005 2006
- -------------------------------------------------------------------------------------------------------
Investor Class 29.56% -15.87% 30.71% 62.61% -33.08% -10.07% 18.33% -0.09% 25.16% 16.26%
- -------------------------------------------------------------------------------------------------------
Russell Midcap
Growth Index 24.61% 2.43% 37.66% 38.67% -42.78% -17.61% 39.30% 8.77% 15.91% 14.51%
- -------------------------------------------------------------------------------------------------------
Russell Midcap Index 28.77% 4.46% 17.12% 23.73% -18.02% -8.02% 35.88% 15.09% 18.09% 17.41%
- -------------------------------------------------------------------------------------------------------
Data presented reflect past pformance. Past performance is no guarantee of
future results. Current performance may be higher or lower than the performance
shown. Investment return and principal value will fluctuate, and redemption
value may be more or less than original cost. To obtain performance data current
to the most recent month end, please call 1-800-345-2021 or visit
americancentury.com.
Unless otherwise indicated, performance reflects Investor Class shares;
performance for other share classes will vary due to differences in fee
structure. For information about other share classes available, please consult
the prospectus. Data assumes reinvestment of dividends and capital gains, and
none of the charts reflect the deduction of taxes that a shareholder would pay
on fund distributions or the redemption of fund shares. Returns for the indices
are provided for comparison. The fund's total returns include operating expenses
(such as transaction costs and management fees) that reduce returns, while the
total returns of the indices do not.
- ------
17
Heritage - Portfolio Commentary
PORTFOLIO MANAGERS: KURT STALZER AND DAVID ROSE
PERFORMANCE SUMMARY
Heritage gained 16.26%* during the 12 months ended October 31, 2006, trailing
the 17.41% return of the Russell Midcap Index but surpassing the 14.51% return
of the Russell Midcap Growth Index.
As outlined in the Market Perspective on page 2, a pause in Federal Reserve
interest rate hikes and expectations for lower interest rates and mild inflation
going forward helped produce U.S. stock index returns in the 10-25% range for
the 12-month period. An overweight position in the wireless telecommunication
industry and well-timed sector position shifts in industrials and information
technology helped the portfolio outperform the Russell Midcap Growth Index.
Relatively weaker returns in the health care and financials sectors contributed
to modest underperformance compared with the overall Russell Midcap Index.
It's worth noting that Heritage ranked in the top 18th (out of 997 funds), 35th
(651 funds), and 37th (241 funds) percentiles among its Morningstar Mid-Cap
Growth category, for the one-, five- and 10-year periods ended October 31,
2006,** respectively.
INVESTMENT PROCESS PAID OFF
For the second straight fiscal year, we reaped our biggest relative and absolute
gains from an overweight stake in the wireless telecommunications industry. The
portfolio's investments in that industry -- centered on two cellular providers
in the Latin American market -- composed a significant share of the portfolio's
total return.
Meanwhile, our focus on companies with accelerating financial growth and share
price momentum helped us adjust our weighting of two key sectors at opportune
times. We raised our stake in industrials in the first half of the period, when
rising commodity prices and capital investment boosted stocks in that sector.
Later, in accordance with our investment process, we reduced our industrials
exposure in the second half of the period, when the sector lost steam as the
economy slowed.
Likewise, we reduced our stake in information technology early in the reporting
period, when the sector was out of favor. But as technology gained favor late in
the period, we increased our exposure to the sector. For the full 12-month
period, our underweight position in technology benefited the portfolio.
WIRELESS STOCKS LED PERFORMANCE
The portfolio's five biggest overweight stocks also ranked as its top five
TOP TEN HOLDINGS
AS OF OCTOBER 31, 2006
- --------------------------------------------------------------------------------
% OF % OF
NET ASSETS NET ASSETS
AS OF AS OF
10/31/06 4/30/06
- --------------------------------------------------------------------------------
NII Holdings, Inc. Cl B 10.4% 6.5%
- --------------------------------------------------------------------------------
Precision Castparts Corp. 5.7% 3.9%
- --------------------------------------------------------------------------------
Alliance Data Systems Corp. 4.9% 3.1%
- --------------------------------------------------------------------------------
America Movil SA de CV
Series L ADR 4.6% 3.2%
- --------------------------------------------------------------------------------
Aker Kvaerner ASA ORD 4.4% 2.8%
- --------------------------------------------------------------------------------
Las Vegas Sands Corp. 3.8% 2.1%
- --------------------------------------------------------------------------------
National Oilwell
Varco, Inc. 3.4% 0.8%
- --------------------------------------------------------------------------------
Hologic, Inc. 3.1% 0.5%
- --------------------------------------------------------------------------------
Caremark Rx Inc. 3.0% --
- --------------------------------------------------------------------------------
BE Aerospace, Inc. 2.8% 0.8%
- --------------------------------------------------------------------------------
* All fund returns referenced in this commentary are for Investor Class shares.
** (c) 2006 Morningstar, Inc. All Rights Reserved. The information contained
herein: (1) is proprietary to Morningstar and/or its content providers:
(2) may not be copied or distributed; and (3) is not warranted to be
accurate, complete or timely. Neither Morningstar nor its content
providers are responsible for any damages or losses arising from
any use of this information. Morningstar Rankings are based
on risk adjusted returns. (continued)
- ------
18
Heritage - Portfolio Commentary
contributors. The two cellular providers focused on the Latin American market,
NII Holdings and America Movil SA de CV, accounted for a combined 11% of the
portfolio's average weight in the 12-month period and represented the largest
and third-largest overweight individual positions, respectively. They also
finished first and second on the portfolio's list of top contributors, with
NII's shares gaining 57% and America Movil's rising 68%.
In addition to the cellular investments, top contributors included a stake in
Aker Kvaerner ASA, a Norway-based maker of processing equipment for oil and gas
companies. They also included a stake in Precision Castparts, a manufacturer of
metal components for aerospace and industrial applications. Precision benefited
from a rebound in aircraft industry orders.
HEALTH CARE INFECTED RETURNS
Five of the portfolio's 10 worst relative performers resided in the health care
sector, where we maintained a detrimental overweight position. Prescription
manager Caremark and managed care provider Aetna led the list of the sector's
leading detractors. Shares in both declined as the entire health care services
industry battled concerns about tightening profit margins and slowing increases
in managed care premiums.
An underweight stake in financials and weak security selection in that sector
also reduced relative returns. Most of the sector benefited from relatively
stable long-term interest rates, expectations of declining short-term interest
rates in 2007, and sound market returns that bolstered interest in capital
markets.
Shares of Heritage's leading underperformer and one of its top 10 overweight
positions, National Oilwell Varco, mostly reflected a downward trend in crude
oil prices late in the 12-month period.
PORTFOLIO OBJECTIVE & EXPECTATIONS
Heritage is designed as a long-term growth component of a diversified investment
portfolio. It's best suited for investors who are seeking to diversify
larger-cap holdings and who can tolerate significant short-term price
fluctuations. Our process focuses on medium-sized and smaller companies with
accelerating earnings growth rates and share price momentum.
We believe that active investing in such companies will generate outperformance
over time compared with the Russell Midcap and Midcap Growth Indices.
TYPES OF INVESTMENTS IN PORTFOLIO
- --------------------------------------------------------------------------------
% OF % OF
NET ASSETS NET ASSETS
AS OF AS OF
10/31/06 4/30/06
- --------------------------------------------------------------------------------
Domestic
Common Stocks 79.5% 80.6%
- --------------------------------------------------------------------------------
Foreign Common Stocks* 20.4% 19.3%
- --------------------------------------------------------------------------------
TOTAL COMMON STOCKS 99.9% 99.9%
- --------------------------------------------------------------------------------
Temporary
Cash Investments 0.3% 1.5%
- --------------------------------------------------------------------------------
Other Assets
and Liabilities (0.2)% (1.4)%
- --------------------------------------------------------------------------------
* Includes depositary shares, dual listed securities and foreign ordinary
shares.
TOP FIVE INDUSTRIES
AS OF OCTOBER 31, 2006
- --------------------------------------------------------------------------------
% OF % OF
NET ASSETS NET ASSETS
AS OF AS OF
10/31/06 4/30/06
- --------------------------------------------------------------------------------
Wireless Telecommunication
Services 17.3% 9.6%
- --------------------------------------------------------------------------------
Energy Equipment
& Services 9.5% 13.8%
- --------------------------------------------------------------------------------
Aerospace & Defense 9.0% 6.4%
- --------------------------------------------------------------------------------
Hotels, Restaurants
& Leisure 5.3% 7.9%
- --------------------------------------------------------------------------------
Health Care Equipment
& Supplies 5.1% 0.7%
- --------------------------------------------------------------------------------
- ------
19
Heritage - Schedule of Investments
OCTOBER 31, 2006
Shares ($ IN THOUSANDS) Value
- --------------------------------------------------------------------------------
COMMON STOCKS -- 99.9%
AEROSPACE & DEFENSE -- 9.0%
- --------------------------------------------------------------------------------
1,266,885 BE Aerospace, Inc.(1) $ 32,027
- --------------------------------------------------------------------------------
73,200 Boeing Co. 5,846
- --------------------------------------------------------------------------------
966,000 Precision Castparts Corp. 65,746
- --------------------------------------------------------------------------------
103,619
- --------------------------------------------------------------------------------
AIR FREIGHT & LOGISTICS -- 0.2%
- --------------------------------------------------------------------------------
72,468 UTI Worldwide Inc. 1,873
- --------------------------------------------------------------------------------
BEVERAGES -- 0.2%
- --------------------------------------------------------------------------------
132,800 C&C Group plc ORD 2,208
- --------------------------------------------------------------------------------
BIOTECHNOLOGY -- 4.0%
- --------------------------------------------------------------------------------
239,500 CSL Ltd. ORD 10,406
- --------------------------------------------------------------------------------
136,700 Digene Corp.(1) 6,347
- --------------------------------------------------------------------------------
425,400 Gilead Sciences, Inc.(1) 29,310
- --------------------------------------------------------------------------------
46,063
- --------------------------------------------------------------------------------
CHEMICALS -- 1.8%
- --------------------------------------------------------------------------------
473,060 Monsanto Co. 20,919
- --------------------------------------------------------------------------------
COMMERCIAL SERVICES & SUPPLIES -- 1.3%
- --------------------------------------------------------------------------------
317,826 Corrections Corp. of America(1) 14,521
- --------------------------------------------------------------------------------
COMMUNICATIONS EQUIPMENT -- 0.7%
- --------------------------------------------------------------------------------
73,600 Research In Motion Ltd.(1) 8,647
- --------------------------------------------------------------------------------
COMPUTERS & PERIPHERALS -- 2.0%
- --------------------------------------------------------------------------------
288,227 Apple Computer, Inc.(1) 23,369
- --------------------------------------------------------------------------------
CONSTRUCTION & ENGINEERING -- 1.8%
- --------------------------------------------------------------------------------
465,155 Foster Wheeler Ltd.(1) 20,909
- --------------------------------------------------------------------------------
ELECTRONIC EQUIPMENT
& INSTRUMENTS -- 1.5%
- --------------------------------------------------------------------------------
526,424 Daktronics Inc. 12,482
- --------------------------------------------------------------------------------
145,500 FLIR Systems, Inc.(1) 4,647
- --------------------------------------------------------------------------------
17,129
- --------------------------------------------------------------------------------
ENERGY EQUIPMENT & SERVICES -- 9.5%
- --------------------------------------------------------------------------------
211,800 Acergy SA ORD(1) 3,832
- --------------------------------------------------------------------------------
487,540 Aker Kvaerner ASA ORD 50,725
- --------------------------------------------------------------------------------
113,479 Cameron International Corp.(1) 5,685
- --------------------------------------------------------------------------------
652,356 National Oilwell Varco, Inc.(1) 39,402
- --------------------------------------------------------------------------------
112,400 Noble Corp. 7,879
- --------------------------------------------------------------------------------
64,900 Oceaneering International, Inc.(1) 2,336
- --------------------------------------------------------------------------------
109,859
- --------------------------------------------------------------------------------
FOOD & STAPLES RETAILING -- 2.4%
- --------------------------------------------------------------------------------
624,392 CVS Corp. 19,594
- --------------------------------------------------------------------------------
291,775 Great Atlantic & Pacific Tea Co.(1) 8,073
- --------------------------------------------------------------------------------
27,667
- --------------------------------------------------------------------------------
FOOD PRODUCTS -- 0.5%
- --------------------------------------------------------------------------------
144,200 Archer-Daniels-Midland Co. 5,552
- --------------------------------------------------------------------------------
Shares ($ IN THOUSANDS) Value
- --------------------------------------------------------------------------------
HEALTH CARE EQUIPMENT & SUPPLIES -- 5.1%
- --------------------------------------------------------------------------------
190,150 Conceptus Inc.(1) $ 3,769
- --------------------------------------------------------------------------------
736,832 Hologic, Inc.(1) 35,478
- --------------------------------------------------------------------------------
152,779 Inverness Medical
Innovations, Inc.(1) 5,758
- --------------------------------------------------------------------------------
224,900 Mentor Corp. 10,525
- --------------------------------------------------------------------------------
86,600 West Pharmaceutical
Services Inc. 3,641
- --------------------------------------------------------------------------------
59,171
- --------------------------------------------------------------------------------
HEALTH CARE PROVIDERS & SERVICES -- 4.9%
- --------------------------------------------------------------------------------
253,700 AMN Healthcare Services, Inc.(1) 6,416
- --------------------------------------------------------------------------------
706,600 Caremark Rx Inc. 34,787
- --------------------------------------------------------------------------------
40,900 Healthways, Inc.(1) 1,732
- --------------------------------------------------------------------------------
277,492 Quest Diagnostics Inc. 13,802
- --------------------------------------------------------------------------------
56,737
- --------------------------------------------------------------------------------
HOTELS, RESTAURANTS & LEISURE -- 5.3%
- --------------------------------------------------------------------------------
93,700 Harrah's Entertainment, Inc. 6,965
- --------------------------------------------------------------------------------
154,800 InterContinental Hotels
Group plc ORD 2,980
- --------------------------------------------------------------------------------
185,300 International Game Technology 7,877
- --------------------------------------------------------------------------------
573,750 Las Vegas Sands Corp.(1) 43,719
- --------------------------------------------------------------------------------
61,541
- --------------------------------------------------------------------------------
HOUSEHOLD DURABLES -- 0.2%
- --------------------------------------------------------------------------------
496,627 Consorcio ARA SA de CV ORD 2,815
- --------------------------------------------------------------------------------
INDUSTRIAL CONGLOMERATES -- 2.2%
- --------------------------------------------------------------------------------
574,737 McDermott International, Inc.(1) 25,691
- --------------------------------------------------------------------------------
INSURANCE -- 4.0%
- --------------------------------------------------------------------------------
76,300 CNA Financial Corp.(1) 2,857
- --------------------------------------------------------------------------------
40,100 Everest Re Group, Ltd. 3,977
- --------------------------------------------------------------------------------
269,100 HCC Insurance Holdings, Inc. 9,058
- --------------------------------------------------------------------------------
776,830 Loews Corp. 30,235
- --------------------------------------------------------------------------------
46,127
- --------------------------------------------------------------------------------
INTERNET & CATALOG RETAIL -- 0.7%
- --------------------------------------------------------------------------------
214,641 Priceline.com Inc.(1) 8,648
- --------------------------------------------------------------------------------
INTERNET SOFTWARE & SERVICES -- 2.2%
- --------------------------------------------------------------------------------
307,575 Digital River Inc.(1) 17,793
- --------------------------------------------------------------------------------
384,588 ValueClick Inc.(1) 7,230
- --------------------------------------------------------------------------------
25,023
- --------------------------------------------------------------------------------
IT SERVICES -- 4.9%
- --------------------------------------------------------------------------------
934,789 Alliance Data Systems Corp.(1) 56,760
- --------------------------------------------------------------------------------
LIFE SCIENCES TOOLS & SERVICES -- 4.9%
- --------------------------------------------------------------------------------
347,854 Covance Inc.(1) 20,349
- --------------------------------------------------------------------------------
262,298 ICON plc ADR(1) 9,411
- --------------------------------------------------------------------------------
830,246 Pharmaceutical Product
Development, Inc. 26,278
- --------------------------------------------------------------------------------
56,038
- --------------------------------------------------------------------------------
- ------
20
See Notes to Financial Statements. (continued)
Heritage - Schedule of Investments
OCTOBER 31, 2006
Shares ($ IN THOUSANDS) Value
- --------------------------------------------------------------------------------
MEDIA -- 1.0%
- --------------------------------------------------------------------------------
225,282 Focus Media
Holding Ltd. ADR(1) $ 11,915
- --------------------------------------------------------------------------------
METALS & MINING -- 1.5%
- --------------------------------------------------------------------------------
94,875 Allegheny Technologies Inc. 7,470
- --------------------------------------------------------------------------------
93,300 RTI International Metals, Inc.(1) 5,721
- --------------------------------------------------------------------------------
127,216 Titanium Metals Corp.(1) 3,750
- --------------------------------------------------------------------------------
16,941
- --------------------------------------------------------------------------------
MULTI-UTILITIES -- 0.9%
- --------------------------------------------------------------------------------
186,700 Sempra Energy 9,903
- --------------------------------------------------------------------------------
MULTILINE RETAIL -- 1.8%
- --------------------------------------------------------------------------------
298,394 Kohl's Corp.(1) 21,067
- --------------------------------------------------------------------------------
PERSONAL PRODUCTS -- 0.6%
- --------------------------------------------------------------------------------
207,599 Bare Escentuals Inc.(1) 6,359
- --------------------------------------------------------------------------------
PHARMACEUTICALS -- 2.6%
- --------------------------------------------------------------------------------
121,185 Forest Laboratories, Inc.(1) 5,931
- --------------------------------------------------------------------------------
48,400 Medicis Pharmaceutical
Corp. Cl A 1,696
- --------------------------------------------------------------------------------
205,200 Shire plc ADR 11,255
- --------------------------------------------------------------------------------
569,597 Shire plc ORD 10,393
- --------------------------------------------------------------------------------
29,275
- --------------------------------------------------------------------------------
SOFTWARE -- 2.9%
- --------------------------------------------------------------------------------
103,968 Micros Systems, Inc.(1) 5,165
- --------------------------------------------------------------------------------
125,800 Nintendo Co., Ltd. ORD 25,736
- --------------------------------------------------------------------------------
146,700 Parametric Technology Corp.(1) 2,867
- --------------------------------------------------------------------------------
33,768
- --------------------------------------------------------------------------------
Shares ($ IN THOUSANDS) Value
- --------------------------------------------------------------------------------
SPECIALTY RETAIL -- 2.0%
- --------------------------------------------------------------------------------
329,100 GameStop Corp. Cl A(1) $ 16,804
- --------------------------------------------------------------------------------
212,600 Rent-A-Center Inc.(1) 6,114
- --------------------------------------------------------------------------------
22,918
- --------------------------------------------------------------------------------
WIRELESS TELECOMMUNICATION SERVICES -- 17.3%
- --------------------------------------------------------------------------------
1,249,840 America Movil SA de CV
Series L ADR 53,581
- --------------------------------------------------------------------------------
454,402 Millicom International
Cellular SA(1) 22,666
- --------------------------------------------------------------------------------
1,849,928 NII Holdings, Inc. Cl B(1) 120,300
- --------------------------------------------------------------------------------
53,300 Rogers Communications Inc.
Cl B ORD 3,192
- --------------------------------------------------------------------------------
199,739
- --------------------------------------------------------------------------------
TOTAL COMMON STOCKS
(Cost $930,169) 1,152,771
- --------------------------------------------------------------------------------
TEMPORARY CASH INVESTMENTS -- 0.3%
- --------------------------------------------------------------------------------
Repurchase Agreement, Bank of America
Securities, LLC, (collateralized by various
U.S. Treasury obligations, 4.875%, 10/31/08,
valued at $4,083), in a joint trading account
at 5.24%, dated 10/31/06, due 11/1/06
(Delivery Value $4,001)
(Cost $4,000) 4,000
- --------------------------------------------------------------------------------
TOTAL INVESTMENT SECURITIES -- 100.2%
(Cost $934,169) 1,156,771
- --------------------------------------------------------------------------------
OTHER ASSETS
AND LIABILITIES -- (0.2)% (2,106)
- --------------------------------------------------------------------------------
TOTAL NET ASSETS -- 100.0% $1,154,665
================================================================================
FORWARD FOREIGN CURRENCY EXCHANGE CONTRACTS
($ IN THOUSANDS)
Contracts to Sell Settlement Date Value Unrealized Gain (Loss)
- -------------------------------------------------------------------------------------
8,478,300 AUD for USD 11/30/06 $6,563 $(50)
- -------------------------------------------------------------------------------------
830,558 Euro for USD 11/30/06 1,062 (2)
- -------------------------------------------------------------------------------------
4,179,015 GBP for USD 11/30/06 7,974 (42)
- -------------------------------------------------------------------------------------
1,826,616,000 JPY for USD 11/30/06 15,687 (84)
- -------------------------------------------------------------------------------------
69,587,476 MXN for USD 11/30/06 6,452 42
- -------------------------------------------------------------------------------------
191,054,910 NOK for USD 11/30/06 29,279 (11)
- -------------------------------------------------------------------------------------
$67,017 $(147)
=====================================
(Value on Settlement Date $66,870)
NOTES TO SCHEDULE OF INVESTMENTS
ADR = American Depositary Receipt
AUD = Australian Dollar
GBP = British Pound
JPY = Japanese Yen
MXN = Mexican Nuevo Peso
NOK = Norwegian Krona
ORD = Foreign Ordinary Share
USD = United States Dollar
(1) Non-income producing.
See Notes to Financial Statements.
- ------
21
Vista - Performance
TOTAL RETURNS AS OF OCTOBER 31, 2006
--------------------------------
AVERAGE ANNUAL RETURNS
- -----------------------------------------------------------------------------------------
SINCE INCEPTION
1 YEAR 5 YEARS 10 YEARS INCEPTION DATE
- -----------------------------------------------------------------------------------------
INVESTOR CLASS 9.07% 9.01% 6.14% 10.48% 11/25/83
- -----------------------------------------------------------------------------------------
RUSSELL MIDCAP GROWTH INDEX(1) 14.51% 10.62% 8.73% N/A(2) --
- -----------------------------------------------------------------------------------------
Institutional Class 9.33% 9.23% -- 6.34% 11/14/96
- -----------------------------------------------------------------------------------------
Advisor Class 8.83% 8.76% 5.90% 5.08% 10/2/96
- -----------------------------------------------------------------------------------------
C Class 8.00% 7.94% -- 4.87% 7/18/01
- -----------------------------------------------------------------------------------------
R Class 8.55% -- -- 4.80% 7/29/05
- -----------------------------------------------------------------------------------------
(1) Data provided by Lipper Inc. - A Reuters Company. (c) 2006 Reuters. All
rights reserved. Any copying, republication or redistribution of Lipper
content, including by caching, framing or similar means, is expressly
prohibited without the prior written consent of Lipper. Lipper shall not be
liable for any errors or delays in the content, or for any actions taken in
reliance thereon.
The data contained herein has been obtained from company reports, financial
reporting services, periodicals and other resources believed to be reliable.
Although carefully verified, data on compilations is not guaranteed by
Lipper and may be incomplete. No offer or solicitations to buy or sell any
of the securities herein is being made by Lipper.
(2) Benchmark began 12/31/85.
Data presented reflect past performance. Past performance is no guarantee of
future results. Current performance may be higher or lower than the performance
shown. Investment return and principal value will fluctuate, and redemption
value may be more or less than original cost. To obtain performance data current
to the most recent month end, please call 1-800-345-2021 or visit
americancentury.com.
Unless otherwise indicated, performance reflects Investor Class shares;
performance for other share classes will vary due to differences in fee
structure. For information about other share classes available, please consult
the prospectus. Data assumes reinvestment of dividends and capital gains, and
none of the charts reflect the deduction of taxes that a shareholder would pay
on fund distributions or the redemption of fund shares. Returns for the index
are provided for comparison. The fund's total returns include operating expenses
(such as transaction costs and management fees) that reduce returns, while the
total returns of the index do not.
(continued)
- ------
22
Vista - Performance
GROWTH OF $10,000 OVER 10 YEARS
$10,000 investment made October 31, 1996
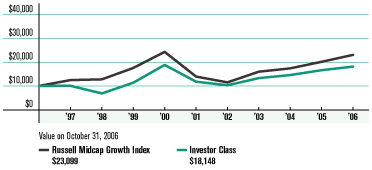
ONE-YEAR RETURNS OVER 10 YEARS
Periods ended October 31
- -------------------------------------------------------------------------------------------------
1997 1998 1999 2000 2001 2002 2003 2004 2005 2006
- -------------------------------------------------------------------------------------------------
Investor Class 0.29% -31.94% 66.24% 66.16% -37.48% -12.90% 29.41% 9.77% 14.08% 9.07%
- -------------------------------------------------------------------------------------------------
Russell Midcap
Growth Index 24.61% 2.43% 37.66% 38.67% -42.78% -17.61% 39.30% 8.77% 15.91% 14.51%
- -------------------------------------------------------------------------------------------------
Data presented reflect past performance. Past performance is no guarantee of
future results. Current performance may be higher or lower than the performance
shown. Investment return and principal value will fluctuate, and redemption
value may be more or less than original cost. To obtain performance data current
to the most recent month end, please call 1-800-345-2021 or visit
americancentury.com.
Unless otherwise indicated, performance reflects Investor Class shares;
performance for other share classes will vary due to differences in fee
structure. For information about other share classes available, please consult
the prospectus. Data assumes reinvestment of dividends and capital gains, and
none of the charts reflect the deduction of taxes that a shareholder would pay
on fund distributions or the redemption of fund shares. Returns for the index
are provided for comparison. The fund's total returns include operating expenses
(such as transaction costs and management fees) that reduce returns, while the
total returns of the index do not.
- ------
23
Vista - Portfolio Commentary
PORTFOLIO MANAGERS: GLENN FOGLE AND DAVID HOLLOND
PERFORMANCE SUMMARY
Vista gained 9.07%* during the 12 months ended October 31, 2006, trailing the
14.51% return of its benchmark, the Russell Midcap Growth Index.
Vista outperformed its benchmark in the first half of the reporting period as
market returns moved higher and the portfolio benefited from overweight stakes
in industrials, materials, and telecommunications. Those sectors exhibited
attractive price momentum and improving financial returns, two factors crucial
to Vista's investment process.
However, the portfolio struggled on both an absolute and relative basis after
the market sold off in May 2006. The broad market rebounded late in the
reporting period after the Federal Reserve paused its two-year, interest
rate-hike campaign in August.
But the portfolio missed the rebound's gains. That's because the market's favor
swung toward consumer-oriented and technology stocks, and our picks in those
sectors did not perform well. Our underweight positions in energy, health care,
and consumer discretionary further detracted from absolute and relative
performance.
SECTOR OVERWEIGHTS WORKED WELL
The overweight positions that worked so well for the portfolio in early 2006
accounted for most of its positive contributions for the full 12-month reporting
period.
In telecom, Vista's entire stake centered on the wireless industry, including
positions in two cellular providers, NII Holdings and America Movil SA de CV,
focused on the Latin American market. Both stocks ranked among the portfolio's
top three positions in the period, and they also ranked as the two leading
individual contributors to its total return.
Vista's biggest contributor to its relative return came from the materials
sector. A large overweight position in the metals and mining industry benefited
the portfolio, and no individual stock helped more than Titanium Metals. Shares
in the maker of lightweight titanium materials surged 149%, reflecting ongoing
strong demand from the aircraft industry. Vista also enjoyed solid returns from
investments in steelmakers.
TOP TEN HOLDINGS
AS OF OCTOBER 31, 2006
- --------------------------------------------------------------------------------
% OF % OF
NET ASSETS NET ASSETS
AS OF AS OF
10/31/06 4/30/06
- --------------------------------------------------------------------------------
NII Holdings, Inc. Cl B 6.2% 4.6%
- --------------------------------------------------------------------------------
Thermo Electron Corp. 4.0% --
- --------------------------------------------------------------------------------
America Movil SA de CV
Series L ADR 3.5% 2.4%
- --------------------------------------------------------------------------------
Alliance Data
Systems Corp. 3.0% 1.0%
- --------------------------------------------------------------------------------
Leap Wireless
International, Inc. 3.0% --
- --------------------------------------------------------------------------------
SBA Communications
Corp. Cl A 2.9% 2.1%
- --------------------------------------------------------------------------------
Precision Castparts Corp. 2.8% 2.0%
- --------------------------------------------------------------------------------
BE Aerospace, Inc. 2.7% 1.8%
- --------------------------------------------------------------------------------
American Tower
Corp. Cl A 2.7% 2.2%
- --------------------------------------------------------------------------------
Las Vegas Sands Corp. 2.6% 0.9%
- --------------------------------------------------------------------------------
* All fund returns referenced in this commentary are
for Investor Class shares. (continued)
- ------
24
Vista - Portfolio Commentary
The portfolio's early 2006 focus on companies poised to benefit from increased
business spending also led to solid returns in the industrials sector,
specifically from an overweight position in construction and engineering. A
stake in Foster Wheeler, one of the portfolio's top five overweight positions,
performed well as shares in the builder of power plants and refineries advanced
59%.
SECURITY SELECTION REDUCED RETURNS
The portfolio's underperformance versus its benchmark stemmed primarily from
stocks picks in health care, consumer discretionary and information technology.
In financials, a sector that boosted the portfolio's total return, security
selection also trimmed relative performance.
In health care, an overweight position and poor security selection in health
care providers and services hurt the portfolio, as did several stakes in makers
of health care equipment and supplies. Meanwhile, weakness in technology spread
across a number of industries and included a stake in Intergraph Corp., whose
shares plunged in late January after the maker of operational software for
businesses and governments reported a decline in quarterly revenue.
The portfolio's worst performer, Houston-based natural gas producer Southwestern
Energy, suffered from a substantial decline in natural gas prices.
PORTFOLIO OBJECTIVE & EXPECTATIONS
Vista is designed as a long-term growth component of a diversified investment
portfolio for investors who can tolerate significant short-term price
fluctuations. The portfolio adheres to an investment process that identifies
mid-sized and smaller companies with accelerating earnings and revenue. We
believe this selection strategy will produce solid, long-term gains for
investors.
We think the portfolio will perform well in a consistent, directional market,
and we're encouraged by the market's behavior since the Fed paused its
interest-rate hike campaign. Growth stocks traditionally have performed well
after the Fed stops raising rates, and we believe our process works well in such
an environment.
TYPES OF INVESTMENTS IN PORTFOLIO
- --------------------------------------------------------------------------------
% OF % OF
NET ASSETS NET ASSETS
AS OF AS OF
10/31/06 4/30/06
- --------------------------------------------------------------------------------
Domestic
Common Stocks 84.8% 91.2%
- --------------------------------------------------------------------------------
Foreign Common Stocks* 13.6% 8.8%
- --------------------------------------------------------------------------------
TOTAL COMMON STOCKS 98.4% 100.0%
- --------------------------------------------------------------------------------
Temporary
Cash Investments 1.9% 2.3%
- --------------------------------------------------------------------------------
Other Assets
and Liabilities (0.3)% (2.3)%
- --------------------------------------------------------------------------------
* Includes depositary shares, dual listed securities and foreign ordinary
shares.
TOP FIVE INDUSTRIES
AS OF OCTOBER 31, 2006
- --------------------------------------------------------------------------------
% OF % OF
NET ASSETS NET ASSETS
AS OF AS OF
10/31/06 4/30/06
- --------------------------------------------------------------------------------
Wireless Telecommunication
Services 19.9% 11.9%
- --------------------------------------------------------------------------------
Life Sciences
Tools & Services 6.9% --
- --------------------------------------------------------------------------------
Specialty Retail 6.4% 3.6%
- --------------------------------------------------------------------------------
Software 5.7% 1.0%
- --------------------------------------------------------------------------------
Aerospace & Defense 5.4% 3.9%
- --------------------------------------------------------------------------------
- ------
25
Vista - Schedule of Investments
OCTOBER 31, 2006
Shares ($ IN THOUSANDS) Value
- --------------------------------------------------------------------------------
COMMON STOCKS -- 98.4%
AEROSPACE & DEFENSE -- 5.4%
- --------------------------------------------------------------------------------
2,440,000 BE Aerospace, Inc.(1) $ 61,683
- --------------------------------------------------------------------------------
938,000 Precision Castparts Corp. 63,840
- --------------------------------------------------------------------------------
125,523
- --------------------------------------------------------------------------------
AUTOMOBILES -- 2.0%
- --------------------------------------------------------------------------------
683,000 Harley-Davidson, Inc. 46,874
- --------------------------------------------------------------------------------
BIOTECHNOLOGY -- 1.3%
- --------------------------------------------------------------------------------
562,000 Celgene Corp.(1) 30,033
- --------------------------------------------------------------------------------
CAPITAL MARKETS -- 3.0%
- --------------------------------------------------------------------------------
2,120,000 Amvescap plc ORD 24,244
- --------------------------------------------------------------------------------
809,000 SEI Investments Co. 45,531
- --------------------------------------------------------------------------------
69,775
- --------------------------------------------------------------------------------
CHEMICALS -- 2.8%
- --------------------------------------------------------------------------------
1,039,000 Monsanto Co. 45,945
- --------------------------------------------------------------------------------
312,000 OM Group, Inc.(1) 17,784
- --------------------------------------------------------------------------------
63,729
- --------------------------------------------------------------------------------
COMMERCIAL SERVICES
& SUPPLIES -- 0.6%
- --------------------------------------------------------------------------------
282,000 Corrections Corp. of America(1) 12,885
- --------------------------------------------------------------------------------
COMMUNICATIONS EQUIPMENT -- 1.1%
- --------------------------------------------------------------------------------
354,000 CommScope Inc.(1) 11,296
- --------------------------------------------------------------------------------
114,000 Research In Motion Ltd.(1) 13,393
- -------------------------------------------------------------------------------
24,689
- --------------------------------------------------------------------------------
COMPUTERS & PERIPHERALS -- 0.8%
- --------------------------------------------------------------------------------
216,000 Apple Computer, Inc.(1) 17,513
- --------------------------------------------------------------------------------
CONSTRUCTION & ENGINEERING -- 2.2%
- --------------------------------------------------------------------------------
765,000 Foster Wheeler Ltd.(1) 34,387
- --------------------------------------------------------------------------------
941,000 Quanta Services, Inc.(1) 17,220
- --------------------------------------------------------------------------------
51,607
- --------------------------------------------------------------------------------
DIVERSIFIED FINANCIAL SERVICES -- 1.1%
- --------------------------------------------------------------------------------
153,000 IntercontinentalExchange Inc.(1) 12,916
- --------------------------------------------------------------------------------
232,000 International Securities
Exchange Inc. 11,913
- --------------------------------------------------------------------------------
24,829
- --------------------------------------------------------------------------------
ELECTRIC UTILITIES -- 1.0%
- --------------------------------------------------------------------------------
563,000 Allegheny Energy, Inc.(1) 24,226
- --------------------------------------------------------------------------------
ELECTRICAL EQUIPMENT -- 2.1%
- --------------------------------------------------------------------------------
953,000 ABB Ltd. ORD 14,181
- --------------------------------------------------------------------------------
273,000 Alstom RGPT ORD(1) 25,201
- --------------------------------------------------------------------------------
272,000 General Cable Corp.(1) 10,227
- --------------------------------------------------------------------------------
49,609
- --------------------------------------------------------------------------------
Shares ($ IN THOUSANDS) Value
- --------------------------------------------------------------------------------
ELECTRONIC EQUIPMENT & INSTRUMENTS -- 1.3%
- --------------------------------------------------------------------------------
259,000 Amphenol Corp. Cl A $ 17,586
- --------------------------------------------------------------------------------
216,000 Anixter International Inc.(1) 12,908
- --------------------------------------------------------------------------------
30,494
- --------------------------------------------------------------------------------
ENERGY EQUIPMENT & SERVICES -- 2.2%
- --------------------------------------------------------------------------------
645,000 Acergy SA ORD(1) 11,670
- --------------------------------------------------------------------------------
181,000 Core Laboratories N.V.(1) 13,193
- --------------------------------------------------------------------------------
971,000 TETRA Technologies, Inc.(1) 25,149
- --------------------------------------------------------------------------------
50,012
- --------------------------------------------------------------------------------
FOOD & STAPLES RETAILING -- 0.5%
- --------------------------------------------------------------------------------
409,000 Safeway Inc. 12,008
- --------------------------------------------------------------------------------
HEALTH CARE PROVIDERS
& SERVICES -- 3.0%
- --------------------------------------------------------------------------------
449,000 Caremark Rx Inc. 22,104
- --------------------------------------------------------------------------------
370,000 Humana Inc.(1) 22,200
- --------------------------------------------------------------------------------
360,000 Laboratory Corp.
of America Holdings(1) 24,657
- --------------------------------------------------------------------------------
68,961
- --------------------------------------------------------------------------------
HOTELS, RESTAURANTS & LEISURE -- 4.6%
- --------------------------------------------------------------------------------
1,095,000 International Game Technology 46,548
- --------------------------------------------------------------------------------
796,000 Las Vegas Sands Corp.(1) 60,656
- --------------------------------------------------------------------------------
107,204
- --------------------------------------------------------------------------------
HOUSEHOLD DURABLES -- 1.3%
- --------------------------------------------------------------------------------
402,000 Newell Rubbermaid Inc. 11,570
- --------------------------------------------------------------------------------
908,000 Tempur-Pedic International Inc.(1) 17,923
- --------------------------------------------------------------------------------
29,493
- --------------------------------------------------------------------------------
INDUSTRIAL CONGLOMERATES -- 2.1%
- --------------------------------------------------------------------------------
1,085,000 McDermott International, Inc.(1) 48,500
- --------------------------------------------------------------------------------
INSURANCE -- 2.4%
- --------------------------------------------------------------------------------
263,000 American Financial Group, Inc. 12,587
- --------------------------------------------------------------------------------
192,000 Arch Capital Group Ltd.(1) 12,344
- --------------------------------------------------------------------------------
332,000 Axis Capital Holdings Limited 10,906
- --------------------------------------------------------------------------------
362,067 RenaissanceRe Holdings Ltd. 19,697
- --------------------------------------------------------------------------------
55,534
- --------------------------------------------------------------------------------
INTERNET SOFTWARE & SERVICES -- 1.0%
- --------------------------------------------------------------------------------
486,000 Akamai Technologies, Inc.(1) 22,774
- --------------------------------------------------------------------------------
IT SERVICES -- 4.0%
- --------------------------------------------------------------------------------
1,156,000 Alliance Data Systems Corp.(1) 70,192
- --------------------------------------------------------------------------------
306,000 Cognizant Technology Solutions
Corporation Cl A(1) 23,036
- --------------------------------------------------------------------------------
93,228
- --------------------------------------------------------------------------------
See Notes to Financial Statements. (continued)
- ------
26
Vista - Schedule of Investments
OCTOBER 31, 2006
Shares ($ IN THOUSANDS) Value
- --------------------------------------------------------------------------------
LIFE SCIENCES TOOLS & SERVICES -- 6.9%
- --------------------------------------------------------------------------------
376,000 Covance Inc.(1) $ 21,996
- --------------------------------------------------------------------------------
257,000 Illumina, Inc.(1) 11,298
- --------------------------------------------------------------------------------
1,005,000 Pharmaceutical Product
Development, Inc. 31,808
- --------------------------------------------------------------------------------
2,182,000 Thermo Electron Corp.(1) 93,542
- --------------------------------------------------------------------------------
158,644
- --------------------------------------------------------------------------------
MACHINERY -- 1.3%
- --------------------------------------------------------------------------------
220,000 Manitowoc Co., Inc. (The) 12,074
- --------------------------------------------------------------------------------
219,000 Terex Corp.(1) 11,335
- --------------------------------------------------------------------------------
160,000 Trinity Industries, Inc. 5,770
- --------------------------------------------------------------------------------
29,179
- --------------------------------------------------------------------------------
MARINE -- 0.9%
- --------------------------------------------------------------------------------
341,000 American Commercial
Lines Inc.(1) 21,875
- --------------------------------------------------------------------------------
MEDIA -- 0.3%
- --------------------------------------------------------------------------------
112,519 Focus Media Holding Ltd. ADR(1) 5,951
- --------------------------------------------------------------------------------
METALS & MINING -- 2.2%
- --------------------------------------------------------------------------------
154,000 Allegheny Technologies Inc. 12,124
- --------------------------------------------------------------------------------
478,000 Oregon Steel Mills, Inc.(1) 26,004
- --------------------------------------------------------------------------------
405,000 Titanium Metals Corp.(1) 11,939
- --------------------------------------------------------------------------------
50,067
- --------------------------------------------------------------------------------
MULTILINE RETAIL -- 3.1%
- --------------------------------------------------------------------------------
567,000 Big Lots Inc.(1) 11,952
- --------------------------------------------------------------------------------
834,000 Kohl's Corp.(1) 58,881
- --------------------------------------------------------------------------------
70,833
- --------------------------------------------------------------------------------
REAL ESTATE INVESTMENT TRUSTS -- 2.6%
- --------------------------------------------------------------------------------
626,000 Archstone-Smith Trust 37,692
- --------------------------------------------------------------------------------
288,000 Camden Property Trust 23,247
- --------------------------------------------------------------------------------
60,939
- --------------------------------------------------------------------------------
REAL ESTATE MANAGEMENT
& DEVELOPMENT -- 1.0%
- --------------------------------------------------------------------------------
259,000 Jones Lang LaSalle Inc. 23,828
- --------------------------------------------------------------------------------
SEMICONDUCTORS & SEMICONDUCTOR
EQUIPMENT -- 1.5%
- --------------------------------------------------------------------------------
451,000 MEMC Electronic Materials Inc.(1) 16,011
- --------------------------------------------------------------------------------
530,000 NVIDIA Corp.(1) 18,481
- --------------------------------------------------------------------------------
34,492
- --------------------------------------------------------------------------------
SOFTWARE -- 5.7%
- --------------------------------------------------------------------------------
295,000 Amdocs Ltd.(1) 11,434
- ---------------------------------------------------------------------------------
1,480,000 BEA Systems Inc.(1) 24,080
- ---------------------------------------------------------------------------------
1,094,100 Mentor Graphics Corp.(1) 18,457
- ---------------------------------------------------------------------------------
247,000 Nintendo Co., Ltd. ORD 50,532
- ---------------------------------------------------------------------------------
588,000 Parametric Technology Corp.(1) 11,490
- ---------------------------------------------------------------------------------
550,000 THQ Inc.(1) 16,539
- ---------------------------------------------------------------------------------
132,532
- ---------------------------------------------------------------------------------
Shares ($ IN THOUSANDS) Value
- --------------------------------------------------------------------------------
SPECIALTY RETAIL -- 6.4%
- --------------------------------------------------------------------------------
997,000 American Eagle Outfitters, Inc. $ 45,662
- --------------------------------------------------------------------------------
281,000 AnnTaylor Stores Corporation(1) 12,370
- --------------------------------------------------------------------------------
783,000 GameStop Corp. Cl A(1) 39,979
- --------------------------------------------------------------------------------
290,000 Men's Wearhouse, Inc. (The) 11,557
- --------------------------------------------------------------------------------
315,000 Office Depot, Inc.(1) 13,227
- --------------------------------------------------------------------------------
859,000 Rent-A-Center Inc.(1) 24,705
- --------------------------------------------------------------------------------
147,500
- --------------------------------------------------------------------------------
TEXTILES, APPAREL & LUXURY GOODS -- 0.8%
- --------------------------------------------------------------------------------
434,000 Coach Inc.(1) 17,204
- --------------------------------------------------------------------------------
WIRELESS TELECOMMUNICATION
SERVICES -- 19.9%
- --------------------------------------------------------------------------------
1,871,000 America Movil SA
de CV Series L ADR 80,209
- --------------------------------------------------------------------------------
1,703,000 American Tower Corp. Cl A(1) 61,342
- --------------------------------------------------------------------------------
331,000 Crown Castle
International Corp.(1) 11,138
- --------------------------------------------------------------------------------
1,245,000 Leap Wireless
International, Inc.(1) 69,048
- --------------------------------------------------------------------------------
257,357 Millicom International
Cellular SA(1) 12,837
- --------------------------------------------------------------------------------
2,198,000 NII Holdings, Inc. Cl B(1) 142,935
- --------------------------------------------------------------------------------
267,500 Rogers Communications Inc.
Cl B ORD 16,022
- --------------------------------------------------------------------------------
2,499,212 SBA Communications
Corp. Cl A(1) 66,754
- --------------------------------------------------------------------------------
460,285
- --------------------------------------------------------------------------------
TOTAL COMMON STOCKS
(Cost $1,887,228) 2,272,829
- --------------------------------------------------------------------------------
TEMPORARY CASH INVESTMENTS -- 1.9%
- --------------------------------------------------------------------------------
Repurchase Agreement, Goldman
Sachs & Co., (collateralized by various
U.S. Treasury obligations, 3.125% -- 4.98%,
4/19/07 -- 8/15/07, valued at $45,182),
in a joint trading account at 5.13%,
dated 10/31/06, due 11/1/06
(Delivery value $44,306)
(Cost $44,300) 44,300
- --------------------------------------------------------------------------------
TOTAL INVESTMENT SECURITIES -- 100.3%
(Cost $1,931,528) 2,317,129
- --------------------------------------------------------------------------------
OTHER ASSETS
AND LIABILITIES -- (0.3)% (5,824)
- --------------------------------------------------------------------------------
TOTAL NET ASSETS -- 100.0% $2,311,305
================================================================================
See Notes to Financial Statements. (continued)
- ------
27
Vista - Schedule of Investments
OCTOBER 31, 2006
FORWARD FOREIGN CURRENCY EXCHANGE CONTRACTS
($ IN THOUSANDS)
Contracts to Sell Settlement Date Value Unrealized Gain (Loss)
- ----------------------------------------------------------------------------------------
7,347,440 CAD for USD 11/30/06 $6,555 $18
- ----------------------------------------------------------------------------------------
8,791,425 CHF for USD 11/30/06 7,092 (34)
- ----------------------------------------------------------------------------------------
10,066,875 Euro for USD 11/30/06 12,874 (34)
- ----------------------------------------------------------------------------------------
6,333,500 GBP for USD 11/30/06 12,085 (64)
- ----------------------------------------------------------------------------------------
2,988,700,000 JPY for USD 11/30/06 25,667 (137)
- ----------------------------------------------------------------------------------------
37,732,500 NOK for USD 11/30/06 5,783 (1)
- ----------------------------------------------------------------------------------------
$70,056 $(252)
=====================================
(Value on Settlement Date $69,804)
NOTES TO SCHEDULE OF INVESTMENTS
ADR = American Depositary Receipt
CAD = Canadian Dollar
CHF = Swiss Franc
GBP = British Pound
JPY = Japanese Yen
NOK = Norwegian Krona
ORD = Foreign Ordinary Share
USD = United States Dollar
(1) Non-income producing.
See Notes to Financial Statements.
- ------
28
Shareholder Fee Examples (Unaudited)
Fund shareholders may incur two types of costs: (1) transaction costs, including
sales charges (loads) on purchase payments and redemption/exchange fees; and (2)
ongoing costs, including management fees; distribution and service (12b-1) fees;
and other fund expenses. This example is intended to help you understand your
ongoing costs (in dollars) of investing in your fund and to compare these costs
with the ongoing cost of investing in other mutual funds.
The example is based on an investment of $1,000 made at the beginning of the
period and held for the entire period from May 1, 2006 to October 31, 2006.
ACTUAL EXPENSES
The table provides information about actual account values and actual expenses
for each class. You may use the information, together with the amount you
invested, to estimate the expenses that you paid over the period. First,
identify the share class you own. Then simply divide your account value by
$1,000 (for example, an $8,600 account value divided by $1,000 = 8.6), then
multiply the result by the number under the heading "Expenses Paid During
Period" to estimate the expenses you paid on your account during this period.
If you hold Investor Class shares of any American Century fund, or Institutional
Class shares of the American Century Diversified Bond Fund, in an American
Century account (i.e., not a financial intermediary or retirement plan account),
American Century may charge you a $12.50 semiannual account maintenance fee if
the value of those shares is less than $10,000. We will redeem shares
automatically in one of your accounts to pay the $12.50 fee. In determining your
total eligible investment amount, we will include your investments in all
PERSONAL ACCOUNTS (including American Century Brokerage accounts) registered
under your Social Security number. PERSONAL ACCOUNTS include individual
accounts, joint accounts, UGMA/UTMA accounts, personal trusts, Coverdell
Education Savings Accounts and IRAs (including traditional, Roth, Rollover,
SEP-, SARSEP- and SIMPLE-IRAs), and certain other retirement accounts. If you
have only business, business retirement, employer-sponsored or American Century
Brokerage accounts, you are currently not subject to this fee. We will not
charge the fee as long as you choose to manage your accounts exclusively online.
If you are subject to the Account Maintenance Fee, your account value could be
reduced by the fee amount.
HYPOTHETICAL EXAMPLE FOR COMPARISON PURPOSES
The table also provides information about hypothetical account values and
hypothetical expenses based on the actual expense ratio of each class of your
fund and an assumed rate of return of 5% per year before expenses, which is not
the actual return of a fund's share class. The hypothetical account values and
expenses may not be used to estimate the actual ending account balance or
expenses you paid for the period. You may use this information to compare the
ongoing costs of investing in your fund and other funds. To do so, compare this
5% hypothetical example with the 5% hypothetical examples that appear in the
shareholder reports of the other funds.
(continued)
- ------
29
Shareholder Fee Examples (Unaudited)
Please note that the expenses shown in the table are meant to highlight your
ongoing costs only and do not reflect any transactional costs, such as sales
charges (loads) or redemption/exchange fees. Therefore, the table is useful in
comparing ongoing costs only, and will not help you determine the relative total
costs of owning different funds. In addition, if these transactional costs were
included, your costs would have been higher.
- ------------------------------------------------------------------------------------------------
EXPENSES PAID
BEGINNING ENDING DURING PERIOD* ANNUALIZED
ACCOUNT VALUE ACCOUNT VALUE 5/1/06 - EXPENSE
5/1/06 10/31/06 10/31/06 RATIO*
- ------------------------------------------------------------------------------------------------
GROWTH SHAREHOLDER FEE EXAMPLE
- ------------------------------------------------------------------------------------------------
ACTUAL
- ------------------------------------------------------------------------------------------------
Investor Class $1,000 $1,045.60 $5.16 1.00%
- ------------------------------------------------------------------------------------------------
Institutional Class $1,000 $1,046.70 $4.13 0.80%
- ------------------------------------------------------------------------------------------------
Advisor Class $1,000 $1,044.30 $6.44 1.25%
- ------------------------------------------------------------------------------------------------
C Class $1,000 $1,040.00 $10.28 2.00%
- ------------------------------------------------------------------------------------------------
R Class $1,000 $1,043.20 $7.72 1.50%
- ------------------------------------------------------------------------------------------------
HYPOTHETICAL
- ------------------------------------------------------------------------------------------------
Investor Class $1,000 $1,020.16 $5.09 1.00%
- ------------------------------------------------------------------------------------------------
Institutional Class $1,000 $1,021.17 $4.08 0.80%
- ------------------------------------------------------------------------------------------------
Advisor Class $1,000 $1,018.90 $6.36 1.25%
- ------------------------------------------------------------------------------------------------
C Class $1,000 $1,015.12 $10.16 2.00%
- ------------------------------------------------------------------------------------------------
R Class $1,000 $1,017.64 $7.63 1.50%
- ------------------------------------------------------------------------------------------------
FOCUSED GROWTH SHAREHOLDER FEE EXAMPLE
- ------------------------------------------------------------------------------------------------
ACTUAL
- ------------------------------------------------------------------------------------------------
Investor Class $1,000 $1,017.80 $5.09 1.00%
- ------------------------------------------------------------------------------------------------
HYPOTHETICAL
- ------------------------------------------------------------------------------------------------
Investor Class $1,000 $1,020.16 $5.09 1.00%
- ------------------------------------------------------------------------------------------------
* Expenses are equal to the class's annualized expense ratio listed in the table
above, multiplied by the average account value over the period, multiplied by
184, the number of days in the most recent fiscal half-year, divided by 365,
to reflect the one-half year period.
(continued)
- ------
30
Shareholder Fee Examples (Unaudited)
- ------------------------------------------------------------------------------------------------
EXPENSES PAID
BEGINNING ENDING DURING PERIOD* ANNUALIZED
ACCOUNT VALUE ACCOUNT VALUE 5/1/06 - EXPENSE
5/1/06 10/31/06 10/31/06 RATIO*
- ------------------------------------------------------------------------------------------------
HERITAGE SHAREHOLDER FEE EXAMPLE
- ------------------------------------------------------------------------------------------------
ACTUAL
- ------------------------------------------------------------------------------------------------
Investor Class $1,000 $938.00 $4.88 1.00%
- ------------------------------------------------------------------------------------------------
Institutional Class $1,000 $939.40 $3.91 0.80%
- ------------------------------------------------------------------------------------------------
Advisor Class $1,000 $936.40 $6.10 1.25%
- ------------------------------------------------------------------------------------------------
C Class $1,000 $933.00 $9.74 2.00%
- ------------------------------------------------------------------------------------------------
HYPOTHETICAL
- ------------------------------------------------------------------------------------------------
Investor Class $1,000 $1,020.16 $5.09 1.00%
- ------------------------------------------------------------------------------------------------
Institutional Class $1,000 $1,021.17 $4.08 0.80%
- ------------------------------------------------------------------------------------------------
Advisor Class $1,000 $1,018.90 $6.36 1.25%
- ------------------------------------------------------------------------------------------------
C Class $1,000 $1,015.12 $10.16 2.00%
- ------------------------------------------------------------------------------------------------
VISTA SHAREHOLDER FEE EXAMPLE
- ------------------------------------------------------------------------------------------------
ACTUAL
- ------------------------------------------------------------------------------------------------
Investor Class $1,000 $917.50 $4.83 1.00%
- ------------------------------------------------------------------------------------------------
Institutional Class $1,000 $918.30 $3.87 0.80%
- ------------------------------------------------------------------------------------------------
Advisor Class $1,000 $917.00 $6.04 1.25%
- ------------------------------------------------------------------------------------------------
C Class $1,000 $912.90 $9.64 2.00%
- ------------------------------------------------------------------------------------------------
R Class $1,000 $915.50 $7.24 1.50%
- ------------------------------------------------------------------------------------------------
HYPOTHETICAL
- ------------------------------------------------------------------------------------------------
Investor Class $1,000 $1,020.16 $5.09 1.00%
- ------------------------------------------------------------------------------------------------
Institutional Class $1,000 $1,021.17 $4.08 0.80%
- ------------------------------------------------------------------------------------------------
Advisor Class $1,000 $1,018.90 $6.36 1.25%
- ------------------------------------------------------------------------------------------------
C Class $1,000 $1,015.12 $10.16 2.00%
- ------------------------------------------------------------------------------------------------
R Class $1,000 $1,017.64 $7.63 1.50%
- ------------------------------------------------------------------------------------------------
* Expenses are equal to the class's annualized expense ratio listed in the table
above, multiplied by the average account value over the period, multiplied by
184, the number of days in the most recent fiscal half-year, divided by 365,
to reflect the one-half year period.
- ------
31
Statement of Assets and Liabilities
OCTOBER 31, 2006
- ------------------------------------------------------------------------------------------------
(AMOUNTS IN THOUSANDS) GROWTH FOCUSED GROWTH HERITAGE VISTA
- ------------------------------------------------------------------------------------------------
ASSETS
- ------------------------------------------------------------------------------------------------
Investment securities - at value
(cost of $4,090,609, $14,596,
$934,169 and $1,931,528, respectively) $4,797,799 $15,776 $1,156,771 $2,317,129
- ----------------------------------------
Cash -- 69 -- --
- ----------------------------------------
Receivable for investments sold 39,564 2 28,031 64,606
- ----------------------------------------
Receivable for forward foreign currency
exchange contracts -- -- 42 18
- ----------------------------------------
Receivable for capital shares sold -- -- 3 --
- ----------------------------------------
Dividends and interest receivable 2,217 6 80 201
- ------------------------------------------------------------------------------------------------
4,839,580 15,853 1,184,927 2,381,954
- ------------------------------------------------------------------------------------------------
LIABILITIES
- ------------------------------------------------------------------------------------------------
Disbursements in excess of
demand deposit cash 1,504 -- 1,344 3,576
- ----------------------------------------
Payable for investments purchased 40,600 -- 27,744 64,805
- ----------------------------------------
Payable for forward foreign currency
exchange contracts 485 2 189 270
- ----------------------------------------
Accrued management fees 3,912 14 958 1,905
- ----------------------------------------
Distribution fees payable 19 -- 14 47
- ----------------------------------------
Service fees (and distribution
fees -- R Class) payable 18 -- 13 46
- ------------------------------------------------------------------------------------------------
46,538 16 30,262 70,649
- ------------------------------------------------------------------------------------------------
NET ASSETS $4,793,042 $15,837 $1,154,665 $2,311,305
================================================================================================
See Notes to Financial Statements.
(continued)
- ------
32
Statement of Assets and Liabilities
OCTOBER 31, 2006
- --------------------------------------------------------------------------------------------------------
(AMOUNTS IN THOUSANDS AS NOTED) GROWTH FOCUSED GROWTH HERITAGE VISTA
- --------------------------------------------------------------------------------------------------------
NET ASSETS CONSIST OF:
- --------------------------------------------------------------------------------------------------------
Capital (par value and paid-in surplus) $4,860,589 $14,345 $859,469 $1,912,111
- ---------------------------------------
Undistributed net investment income 4,582 12 87 252
- ---------------------------------------
Accumulated undistributed
net realized gain (loss)
on investment and foreign
currency transactions (778,853) 301 72,656 13,594
- ---------------------------------------
Net unrealized appreciation
on investments and translation
of assets and liabilities
in foreign currencies 706,724 1,179 222,453 385,348
- --------------------------------------------------------------------------------------------------------
$4,793,042 $15,837 $1,154,665 $2,311,305
========================================================================================================
INVESTOR CLASS, $0.01 PAR VALUE
($ AND SHARES IN FULL)
- --------------------------------------------------------------------------------------------------------
Net assets $3,946,027,431 $15,836,830 $1,037,296,508 $1,965,068,966
- ---------------------------------------
Shares outstanding 179,484,137 1,386,310 66,569,256 120,172,725
- ---------------------------------------
Net asset value per share $21.99 $11.42 $15.58 $16.35
- --------------------------------------------------------------------------------------------------------
INSTITUTIONAL CLASS, $0.01 PAR VALUE
($ AND SHARES IN FULL)
- --------------------------------------------------------------------------------------------------------
Net assets $759,815,710 N/A $57,039,498 $132,324,851
- ---------------------------------------
Shares outstanding 34,242,034 N/A 3,611,197 7,951,046
- ---------------------------------------
Net asset value per share $22.19 N/A $15.80 $16.64
- --------------------------------------------------------------------------------------------------------
ADVISOR CLASS, $0.01 PAR VALUE
($ AND SHARES IN FULL)
- --------------------------------------------------------------------------------------------------------
Net assets $85,953,154 N/A $57,995,359 $210,575,818
- ---------------------------------------
Shares outstanding 3,964,354 N/A 3,784,844 13,139,487
- ---------------------------------------
Net asset value per share $21.68 N/A $15.32 $16.03
- --------------------------------------------------------------------------------------------------------
C CLASS, $0.01 PAR VALUE
($ AND SHARES IN FULL)
- --------------------------------------------------------------------------------------------------------
Net assets $947,134 N/A $2,333,983 $2,998,490
- ---------------------------------------
Shares outstanding 45,007 N/A 157,989 193,195
- ---------------------------------------
Net asset value per share $21.04 N/A $14.77 $15.52
- --------------------------------------------------------------------------------------------------------
R CLASS, $0.01 PAR VALUE
($ AND SHARES IN FULL)
- --------------------------------------------------------------------------------------------------------
Net assets $298,434 N/A N/A $337,149
- ---------------------------------------
Shares outstanding 13,730 N/A N/A 20,743
- ---------------------------------------
Net asset value per share $21.74 N/A N/A $16.25
- --------------------------------------------------------------------------------------------------------
See Notes to Financial Statements.
- ------
33
Statement of Operations
YEAR ENDED OCTOBER 31, 2006
- ------------------------------------------------------------------------------------------
(AMOUNTS IN THOUSANDS) GROWTH FOCUSED GROWTH HERITAGE VISTA
- ------------------------------------------------------------------------------------------
INVESTMENT INCOME (LOSS)
- ------------------------------------------------------------------------------------------
INCOME:
- -----------------------------------------
Dividends (net of foreign taxes withheld
of $447, $2, $91 and $85, respectively) $48,990 $160 $8,225 $16,657
- -----------------------------------------
Interest 3,179 10 706 1,952
- ------------------------------------------------------------------------------------------
52,169 170 8,931 18,609
- ------------------------------------------------------------------------------------------
EXPENSES:
- -----------------------------------------
Management fees 46,259 159 11,270 23,255
- -----------------------------------------
Distribution fees:
- -----------------------------------------
Advisor Class 206 -- 102 549
- -----------------------------------------
C Class 7 -- 15 21
- -----------------------------------------
Service fees:
- -----------------------------------------
Advisor Class 206 -- 102 549
- -----------------------------------------
C Class 2 -- 5 7
- -----------------------------------------
Distribution and service fees -- R Class 1 -- -- 1
- -----------------------------------------
Directors' fees and expenses 72 -- 18 41
- -----------------------------------------
Other expenses 32 -- 13 15
- ------------------------------------------------------------------------------------------
46,785 159 11,525 24,438
- ------------------------------------------------------------------------------------------
NET INVESTMENT INCOME (LOSS) 5,384 11 (2,594) (5,829)
- ------------------------------------------------------------------------------------------
REALIZED AND UNREALIZED GAIN (LOSS)
- ------------------------------------------------------------------------------------------
NET REALIZED GAIN (LOSS) ON:
- -----------------------------------------
Investment transactions 480,909 300 77,351 90,301
- -----------------------------------------
Foreign currency transactions 418 8 (318) (337)
- ------------------------------------------------------------------------------------------
481,327 308 77,033 89,964
- ------------------------------------------------------------------------------------------
CHANGE IN NET UNREALIZED
APPRECIATION (DEPRECIATION) ON:
- -----------------------------------------
Investments 36,206 878 61,485 111,250
- -----------------------------------------
Translation of assets and liabilities
in foreign currencies (1,368) (6) (408) (1,221)
- ------------------------------------------------------------------------------------------
34,838 872 61,077 110,029
- ------------------------------------------------------------------------------------------
NET REALIZED AND UNREALIZED GAIN (LOSS) 516,165 1,180 138,110 199,993
- ------------------------------------------------------------------------------------------
NET INCREASE (DECREASE) IN NET ASSETS
RESULTING FROM OPERATIONS $521,549 $1,191 $135,516 $194,164
==========================================================================================
See Notes to Financial Statements.
- ------
34
Statement of Changes in Net Assets
YEARS ENDED OCTOBER 31, 2006 AND OCTOBER 31, 2005 (EXCEPT AS NOTED)
- -------------------------------------------------------------------------------------------------
(AMOUNTS IN THOUSANDS) GROWTH FOCUSED GROWTH
- -------------------------------------------------------------------------------------------------
INCREASE (DECREASE) IN NET ASSETS 2006 2005 2006 2005(1)
- -------------------------------------------------------------------------------------------------
OPERATIONS
- -------------------------------------------------------------------------------------------------
Net investment income (loss) $5,384 $19,679 $11 --
- --------------------------------------------
Net realized gain (loss) 481,327 314,159 308 $88
- --------------------------------------------
Change in net unrealized
appreciation (depreciation) 34,838 26,871 872 307
- -------------------------------------------------------------------------------------------------
Net increase (decrease) in net assets
resulting from operations 521,549 360,709 1,191 395
- -------------------------------------------------------------------------------------------------
DISTRIBUTIONS TO SHAREHOLDERS
- -------------------------------------------------------------------------------------------------
From net investment income:
- --------------------------------------------
Investor Class (17,117) (1,613) (4) --
- --------------------------------------------
Institutional Class (4,228) (1,650) -- --
- --------------------------------------------
Advisor Class (173) -- -- --
- --------------------------------------------
From net realized gains:
- --------------------------------------------
Investor Class -- -- (90) --
- -------------------------------------------------------------------------------------------------
Decrease in net assets from distributions (21,518) (3,263) (94) --
- -------------------------------------------------------------------------------------------------
CAPITAL SHARE TRANSACTIONS
- -------------------------------------------------------------------------------------------------
Net increase (decrease) in net assets
from capital share transactions (491,814) (510,824) 2,565 11,780
- -------------------------------------------------------------------------------------------------
NET INCREASE (DECREASE) IN NET ASSETS 8,217 (153,378) 3,662 12,175
NET ASSETS
- -------------------------------------------------------------------------------------------------
Beginning of period 4,784,825 4,938,203 12,175 --
- -------------------------------------------------------------------------------------------------
End of period $4,793,042 $4,784,825 $15,837 $12,175
=================================================================================================
Undistributed net investment income $4,582 $20,790 $12 --
=================================================================================================
(1) February 28, 2005 (fund inception) through October 31, 2005.
See Notes to Financial Statements.
(continued)
- ------
35
Statement of Changes in Net Assets
YEARS ENDED OCTOBER 31, 2006 AND OCTOBER 31, 2005
- -------------------------------------------------------------------------------------------------
(AMOUNTS IN THOUSANDS) HERITAGE VISTA
- -------------------------------------------------------------------------------------------------
INCREASE (DECREASE) IN NET ASSETS 2006 2005 2006 2005
- -------------------------------------------------------------------------------------------------
OPERATIONS
- -------------------------------------------------------------------------------------------------
Net investment income (loss) $(2,594) $(5,104) $(5,829) $(5,545)
- -------------------------------------------
Net realized gain (loss) 77,033 225,287 89,964 176,328
- -------------------------------------------
Change in net unrealized
appreciation (depreciation) 61,077 18,373 110,029 68,352
- -------------------------------------------------------------------------------------------------
Net increase (decrease) in net assets
resulting from operations 135,516 238,556 194,164 239,135
- -------------------------------------------------------------------------------------------------
DISTRIBUTIONS TO SHAREHOLDERS
- -------------------------------------------------------------------------------------------------
From net realized gains:
- -------------------------------------------
Investor Class (5,148) -- -- --
- -------------------------------------------
Institutional Class (271) -- -- --
- -------------------------------------------
Advisor Class (151) -- -- --
- -------------------------------------------
C Class (6) -- -- --
- -------------------------------------------------------------------------------------------------
Decrease in net assets from distributions (5,576) -- -- --
- -------------------------------------------------------------------------------------------------
CAPITAL SHARE TRANSACTIONS
- -------------------------------------------------------------------------------------------------
Net increase (decrease) in net assets
from capital share transactions 160,050 (596,469) (76,189) 384,953
- -------------------------------------------------------------------------------------------------
NET INCREASE (DECREASE) IN NET ASSETS 289,990 (357,913) 117,975 624,088
NET ASSETS
- -------------------------------------------------------------------------------------------------
Beginning of period 864,675 1,222,588 2,193,330 1,569,242
- -------------------------------------------------------------------------------------------------
End of period $1,154,665 $864,675 $2,311,305 $2,193,330
=================================================================================================
Undistributed net investment income $87 -- $252 --
=================================================================================================
See Notes to Financial Statements.
- ------
36
Notes to Financial Statements
OCTOBER 31, 2006 (AMOUNTS IN THOUSANDS)
1. ORGANIZATION AND SUMMARY OF SIGNIFICANT ACCOUNTING POLICIES
ORGANIZATION -- American Century Mutual Funds, Inc. (the corporation) is
registered under the Investment Company Act of 1940 (the 1940 Act) as an
open-end management investment company. Growth Fund (Growth), Focused Growth
Fund (Focused Growth), Heritage Fund (Heritage) and Vista Fund (Vista)
(collectively, the funds) are four funds in a series issued by the corporation.
Growth, Heritage and Vista are diversified under the 1940 Act. Focused Growth is
nondiversified and normally limits its investments to a core group of
approximately 25-45 common stocks. The funds' investment objective is to seek
long-term capital growth. The funds pursue this objective by investing primarily
in equity securities. Growth and Focused Growth generally invest in larger
companies but may purchase companies of any size. Heritage and Vista generally
invest in companies that are medium-sized and smaller at the time of purchase.
The following is a summary of the funds' significant accounting policies.
MULTIPLE CLASS -- Growth and Vista are authorized to issue the Investor Class,
the Institutional Class, the Advisor Class, the C Class and the R Class. Focused
Growth is authorized to issue the Investor Class. Heritage is authorized to
issue the Investor Class, the Institutional Class, the Advisor Class and the C
Class. The C Class may be subject to a contingent deferred sales charge. The
share classes differ principally in their respective sales charges and
distribution and shareholder servicing expenses and arrangements. All shares of
each fund represent an equal pro rata interest in the assets of the class to
which such shares belong, and have identical voting, dividend, liquidation and
other rights and the same terms and conditions, except for class specific
expenses and exclusive rights to vote on matters affecting only individual
classes. Income, non-class specific expenses, and realized and unrealized
capital gains and losses of the funds are allocated to each class of shares
based on their relative net assets. Sale of the Investor Class for Focused
Growth commenced February 28, 2005. Sale of R Class for Vista commenced July 29,
2005.
SECURITY VALUATIONS -- Securities traded primarily on a principal securities
exchange are valued at the last reported sales price, or at the mean of the
latest bid and asked prices where no last sales price is available. Depending on
local convention or regulation, securities traded over-the-counter are valued at
the mean of the latest bid and asked prices, the last sales price, or the
official close price. Debt securities not traded on a principal securities
exchange are valued through a commercial pricing service or at the mean of the
most recent bid and asked prices. Discount notes may be valued through a
commercial pricing service or at amortized cost, which approximates fair value.
Securities traded on foreign securities exchanges and over-the-counter markets
are normally completed before the close of business on days that the New York
Stock Exchange (the Exchange) is open and may also take place on days when the
Exchange is not open. If an event occurs after the value of a security was
established but before the net asset value per share was determined that was
likely to materially change the net asset value, that security would be valued
at fair value as determined in accordance with procedures adopted by the Board
of Directors. If the funds determine that the market price of a portfolio
security is not readily available, or that the valuation methods mentioned above
do not reflect the security's fair value, such security is valued at its fair
value as determined by, or in accordance with procedures adopted by, the Board
of Directors or its designee if such fair value determination would materially
impact a fund's net asset value. Certain other circumstances may cause the funds
to fair value a security such as: a security has been declared in default;
trading in a security has been halted during the trading day; or there is a
foreign market holiday and no trading will commence.
SECURITY TRANSACTIONS -- Security transactions are accounted for as of the trade
date. Net realized gains and losses are determined on the identified cost basis,
which is also used for federal income tax purposes.
INVESTMENT INCOME -- Dividend income less foreign taxes withheld, if any, is
recorded as of the ex-dividend date. Distributions received on securities that
represent a return of capital or capital gain are recorded as a reduction of
cost of investments and/or as a realized gain. The funds estimate the components
of distributions received that may be considered nontaxable distributions or
capital gain distributions for income tax purposes. Interest income is recorded
on the accrual basis and includes accretion of discounts and amortization of
premiums.
FUTURES CONTRACTS -- The funds may enter into futures contracts in order to
manage the funds' exposure to changes in market conditions. One of the risks of
entering into futures contracts is the possibility that the change in value of
the contract may not correlate with the changes in value of the underlying
securities. Upon entering into a futures contract, the funds are required to
deposit either cash or securities in an amount equal to a certain percentage of
the contract value (initial margin). Subsequent payments (variation
(continued)
- ------
37
Notes to Financial Statements
OCTOBER 31, 2006 (AMOUNTS IN THOUSANDS)
1. ORGANIZATION AND SUMMARY OF SIGNIFICANT ACCOUNTING POLICIES (CONTINUED)
margin) are made or received daily, in cash, by the funds. The variation margin
is equal to the daily change in the contract value and is recorded as unrealized
gains and losses. The funds recognize a realized gain or loss when the contract
is closed or expires. Net realized and unrealized gains or losses occurring
during the holding period of futures contracts are a component of realized gain
(loss) on investment transactions and unrealized appreciation (depreciation) on
investments, respectively.
FOREIGN CURRENCY TRANSACTIONS -- All assets and liabilities initially expressed
in foreign currencies are translated into U.S. dollars at prevailing exchange
rates at period end. Purchases and sales of investment securities, dividend and
interest income, and certain expenses are translated at the rates of exchange
prevailing on the respective dates of such transactions. For assets and
liabilities, other than investments in securities, net realized and unrealized
gains and losses from foreign currency translations arise from changes in
currency exchange rates.
Net realized and unrealized foreign currency exchange gains or losses occurring
during the holding period of investment securities are a component of realized
gain (loss) on investment transactions and unrealized appreciation
(depreciation) on investments, respectively. Certain countries may impose taxes
on the contract amount of purchases and sales of foreign currency contracts in
their currency. The funds record the foreign tax expense, if any, as a reduction
to the net realized gain (loss) on foreign currency transactions.
FORWARD FOREIGN CURRENCY EXCHANGE CONTRACTS -- The funds may enter into forward
foreign currency exchange contracts to facilitate transactions of securities
denominated in a foreign currency or to hedge the funds' exposure to foreign
currency exchange rate fluctuations. The net U.S. dollar value of foreign
currency underlying all contractual commitments held by the funds and the
resulting unrealized appreciation or depreciation are determined daily using
prevailing exchange rates. The funds bear the risk of an unfavorable change in
the foreign currency exchange rate underlying the forward contract.
Additionally, losses may arise if the counterparties do not perform under the
contract terms.
REPURCHASE AGREEMENTS -- The funds may enter into repurchase agreements with
institutions that American Century Investment Management, Inc. (ACIM) (the
investment advisor) has determined are creditworthy pursuant to criteria adopted
by the Board of Directors. Each repurchase agreement is recorded at cost. Each
fund requires that the collateral, represented by securities, received in a
repurchase transaction be transferred to the custodian in a manner sufficient to
enable each fund to obtain those securities in the event of a default under the
repurchase agreement. ACIM monitors, on a daily basis, the securities
transferred to ensure the value, including accrued interest, of the securities
under each repurchase agreement is equal to or greater than amounts owed to each
fund under each repurchase agreement.
JOINT TRADING ACCOUNT -- Pursuant to an Exemptive Order issued by the Securities
and Exchange Commission, each fund, along with other registered investment
companies having management agreements with ACIM or American Century Global
Investment Management, Inc. (ACGIM), may transfer uninvested cash balances into
a joint trading account. These balances are invested in one or more repurchase
agreements that are collateralized by U.S. Treasury or Agency obligations.
INCOME TAX STATUS -- It is each fund's policy to distribute substantially all
net investment income and net realized gains to shareholders and to otherwise
qualify as a regulated investment company under provisions of the Internal
Revenue Code. Accordingly, no provision has been made for federal or state
income taxes.
DISTRIBUTIONS TO SHAREHOLDERS -- Distributions to shareholders are recorded on
the ex-dividend date. Distributions from net investment income and net realized
gains, if any, are generally declared and paid annually.
INDEMNIFICATIONS -- Under the corporation's organizational documents, its
officers and directors are indemnified against certain liabilities arising out
of the performance of their duties to the funds. In addition, in the normal
course of business, the funds enter into contracts that provide general
indemnifications. The funds' maximum exposure under these arrangements is
unknown as this would involve future claims that may be made against the funds.
The risk of material loss from such claims is considered by management to be
remote.
USE OF ESTIMATES -- The financial statements are prepared in conformity with
accounting principles generally accepted in the United States of America, which
may require management to make certain estimates and assumptions at the date of
the financial statements. Actual results could differ from these estimates.
(continued)
- ------
38
Notes to Financial Statements
OCTOBER 31, 2006 (AMOUNTS IN THOUSANDS)
2. FEES AND TRANSACTIONS WITH RELATED PARTIES
MANAGEMENT FEES -- The corporation has entered into a Management Agreement with
ACIM, under which ACIM provides the funds with investment advisory and
management services in exchange for a single, unified management fee (the fee)
per class. The Agreement provides that all expenses of the funds, except
brokerage commissions, taxes, interest, fees and expenses of those directors who
are not considered "interested persons" as defined in the 1940 Act (including
counsel fees) and extraordinary expenses, will be paid by ACIM. The fee is
computed and accrued daily based on the daily net assets of each specific class
of shares of each fund and paid monthly in arrears. For funds with a stepped fee
schedule, the rate of the fee is determined by applying a fee rate calculation
formula. This formula takes into account all of the investment advisor's assets
under management in each fund's investment strategy (strategy assets) to
calculate the appropriate fee rate for each fund. The strategy assets include
each fund's assets and the assets of other clients of the investment advisor
that are not in the American Century family of funds, but that have the same
investment team and investment strategy. The annual management fee for each
class of Focused Growth, Heritage and Vista was 1.00%, 0.80%, 0.75%, 1.00% and
1.00%, for the Investor Class, Institutional Class, Advisor Class, C Class and R
Class, respectively, as applicable.
The annual management fee schedule for each class of Growth is as follows:
- --------------------------------------------------------------------------------
INVESTOR, C & R INSTITUTIONAL ADVISOR
- --------------------------------------------------------------------------------
STRATEGY ASSETS
- --------------------------------------------------------------------------------
First $5 billion 1.000% 0.800% 0.750%
- --------------------------------------------------------------------------------
Next $5 billion 0.980% 0.780% 0.730%
- --------------------------------------------------------------------------------
Next $5 billion 0.970% 0.770% 0.720%
- --------------------------------------------------------------------------------
Next $5 billion 0.960% 0.760% 0.710%
- --------------------------------------------------------------------------------
Next $5 billion 0.950% 0.750% 0.700%
- --------------------------------------------------------------------------------
Next $5 billion 0.900% 0.700% 0.650%
- --------------------------------------------------------------------------------
Over $30 billion 0.800% 0.600% 0.550%
- --------------------------------------------------------------------------------
The effective annual management fee for each class of Growth for the year ended
October 31, 2006 was 1.00%, 0.80%, 0.75%, 1.00% and 1.00%, for the Investor
Class, Institutional Class, Advisor Class, C Class and R Class, respectively.
DISTRIBUTION AND SERVICE FEES -- The Board of Directors has adopted a Master
Distribution and Shareholder Services Plan for the Advisor Class (the Advisor
Class plan) and a separate Master Distribution and Individual Shareholder
Services Plan for each of the C Class and R Class (collectively with the Advisor
Class Plan, the plans), pursuant to Rule 12b-1 of the 1940 Act. The plans
provide that the Advisor Class and C Class will pay American Century Investment
Services, Inc. (ACIS) the following annual distribution and service fees:
- --------------------------------------------------------------------------------
ADVISOR C
- --------------------------------------------------------------------------------
Distribution Fee 0.25% 0.75%
- --------------------------------------------------------------------------------
Service Fee 0.25% 0.25%
- --------------------------------------------------------------------------------
The plans provide that the R Class will pay ACIS an annual distribution and
service fee of 0.50%. The fees are computed and accrued daily based on each
class's daily net assets and paid monthly in arrears. The distribution fee
provides compensation for expenses incurred in connection with distributing
shares of the classes including, but not limited to, payments to brokers,
dealers, and financial institutions that have entered into sales agreements with
respect to shares of the funds. The service fee provides compensation for
shareholder and administrative services rendered by ACIS, its affiliates or
independent third party providers for Advisor Class shares and for individual
shareholder services rendered by broker/dealers or other independent financial
intermediaries for C Class and R Class shares. Fees incurred under the plans
during the year ended October 31, 2006, are detailed in the Statement of
Operations.
(continued)
- ------
39
Notes to Financial Statements
OCTOBER 31, 2006 (AMOUNTS IN THOUSANDS)
2. FEES AND TRANSACTIONS WITH RELATED PARTIES (CONTINUED)
RELATED PARTIES -- Certain officers and directors of the corporation are also
officers and/or directors, and, as a group, controlling stockholders of American
Century Companies, Inc. (ACC), the parent of the corporation's investment
advisor, ACIM, the distributor of the corporation, ACIS, and the corporation's
transfer agent, American Century Services, LLC.
The funds have a bank line of credit agreement with JPMorgan Chase Bank (JPMCB).
JPMCB is a custodian of the funds and a wholly owned subsidiary of JPMorgan
Chase & Co. (JPM). JPM is an equity investor in ACC.
3. INVESTMENT TRANSACTIONS
Investment transactions, excluding short-term investments, for the year ended
October 31, 2006, were as follows:
- --------------------------------------------------------------------------------
GROWTH FOCUSED GROWTH HERITAGE VISTA
- --------------------------------------------------------------------------------
Purchases $6,005,786 $51,910 $2,761,812 $5,530,807
- --------------------------------------------------------------------------------
Proceeds from sales $6,412,536 $49,337 $2,611,521 $5,619,599
- --------------------------------------------------------------------------------
For the year ended October 31, 2006, Vista incurred net realized gains of $4,237
from redemptions in kind. A redemption in kind occurs when a fund delivers
securities from its portfolio in lieu of cash as payment to a redeeming
shareholder.
4. CAPITAL SHARE TRANSACTIONS
Transactions in shares of the funds were as follows:
- --------------------------------------------------------------------------------
GROWTH FOCUSED GROWTH
- --------------------------------------------------------------------------------
SHARES AMOUNT SHARES AMOUNT
- --------------------------------------------------------------------------------
INVESTOR CLASS
- --------------------------------------------------------------------------------
YEAR ENDED OCTOBER 31, 2006
SHARES AUTHORIZED 800,000 100,000
================================================================================
Sold 14,450 $302,102 976 $10,784
- ---------------------------------
Issued in reinvestment
of distributions 775 16,259 8 89
- ---------------------------------
Redeemed (38,164) (795,254) (755) (8,308)
- --------------------------------------------------------------------------------
Net increase (decrease) (22,939) $(476,893) 229 $2,565
================================================================================
YEAR ENDED OCTOBER 31, 2005(1)
SHARES AUTHORIZED 800,000 300,000
================================================================================
Sold 10,990 $212,907 1,271 $12,943
- ---------------------------------
Issued in reinvestment
of distributions 78 1,548 -- --
- ---------------------------------
Redeemed (35,261) (684,014) (114) (1,163)
- --------------------------------------------------------------------------------
Net increase (decrease) (24,193) $(469,559) 1,157 $11,780
================================================================================
(1) February 28, 2005 (fund inception) through October 31, 2005 for
Focused Growth.
(continued)
- ------
40
Notes to Financial Statements
OCTOBER 31, 2006 (AMOUNTS IN THOUSANDS)
4. CAPITAL SHARE TRANSACTIONS (CONTINUED)
- --------------------------------------------------------------------------------
GROWTH FOCUSED GROWTH
- --------------------------------------------------------------------------------
SHARES AMOUNT SHARES AMOUNT
- --------------------------------------------------------------------------------
INSTITUTIONAL CLASS
- --------------------------------------------------------------------------------
YEAR ENDED OCTOBER 31, 2006
SHARES AUTHORIZED 150,000 N/A
================================================================================
Sold 5,106 $107,366
- ------------------------------
Issued in reinvestment
of distributions 200 4,228
- ------------------------------
Redeemed (5,605) (117,555)
- --------------------------------------------------------------------------------
Net increase (decrease) (299) $(5,961)
================================================================================
YEAR ENDED OCTOBER 31, 2005
SHARES AUTHORIZED 150,000 N/A
================================================================================
Sold 3,162 $61,972
- ------------------------------
Issued in reinvestment
of distributions 83 1,650
- ------------------------------
Redeemed (5,559) (108,738)
- --------------------------------------------------------------------------------
Net increase (decrease) (2,314) $(45,116)
================================================================================
ADVISOR CLASS
- --------------------------------------------------------------------------------
YEAR ENDED OCTOBER 31, 2006
SHARES AUTHORIZED 210,000 N/A
================================================================================
Sold 1,219 $25,034
- ------------------------------
Issued in reinvestment
of distributions 8 162
- ------------------------------
Redeemed (1,681) (34,467)
- --------------------------------------------------------------------------------
Net increase (decrease) (454) $(9,271)
================================================================================
YEAR ENDED OCTOBER 31, 2005
SHARES AUTHORIZED 210,000 N/A
================================================================================
Sold 1,575 $30,169
- ------------------------------
Redeemed (1,382) (26,458)
- --------------------------------------------------------------------------------
Net increase (decrease) 193 $3,711
================================================================================
C CLASS
- --------------------------------------------------------------------------------
YEAR ENDED OCTOBER 31, 2006
SHARES AUTHORIZED 100,000 N/A
================================================================================
Sold 16 $327
- ------------------------------
Redeemed (12) (247)
- --------------------------------------------------------------------------------
Net increase (decrease) 4 $80
================================================================================
YEAR ENDED OCTOBER 31, 2005
SHARES AUTHORIZED 100,000 N/A
================================================================================
Sold 9 $159
- ------------------------------
Redeemed (3) (55)
- --------------------------------------------------------------------------------
Net increase (decrease) 6 $104
================================================================================
(continued)
- ------
41
Notes to Financial Statements
OCTOBER 31, 2006 (AMOUNTS IN THOUSANDS)
4. CAPITAL SHARE TRANSACTIONS (CONTINUED)
- --------------------------------------------------------------------------------
GROWTH FOCUSED GROWTH
- --------------------------------------------------------------------------------
SHARES AMOUNT SHARES AMOUNT
- --------------------------------------------------------------------------------
R CLASS
- --------------------------------------------------------------------------------
YEAR ENDED OCTOBER 31, 2006
SHARES AUTHORIZED 50,000 N/A
================================================================================
Sold 13 $264
- -----------------------------
Redeemed (2) (33)
- --------------------------------------------------------------------------------
Net increase (decrease) 11 $231
================================================================================
YEAR ENDED OCTOBER 31, 2005
SHARES AUTHORIZED 50,000 N/A
================================================================================
Sold 3 $54
- -----------------------------
Redeemed (1) (18)
- --------------------------------------------------------------------------------
Net increase (decrease) 2 $36
================================================================================
HERITAGE VISTA
- --------------------------------------------------------------------------------
SHARES AMOUNT SHARES AMOUNT
- --------------------------------------------------------------------------------
INVESTOR CLASS
- --------------------------------------------------------------------------------
YEAR ENDED OCTOBER 31, 2006
SHARES AUTHORIZED 400,000 800,000
================================================================================
Sold 25,740 $398,913 19,234 $320,240
- -----------------------------
Issued in reinvestment
of distributions 340 4,950 -- --
- -----------------------------
Redeemed (18,926) (286,672) (25,947) (425,992)
- --------------------------------------------------------------------------------
Net increase (decrease) 7,154 $117,191 (6,713) $(105,752)
================================================================================
YEAR ENDED OCTOBER 31, 2005
SHARES AUTHORIZED 400,000 800,000
================================================================================
Sold 11,012 $135,331 46,432 $667,482
- -----------------------------
Redeemed (58,227) (702,050) (27,449) (399,867)
- --------------------------------------------------------------------------------
Net increase (decrease) (47,215) $(566,719) 18,983 $267,615
================================================================================
INSTITUTIONAL CLASS
- --------------------------------------------------------------------------------
YEAR ENDED OCTOBER 31, 2006
SHARES AUTHORIZED 40,000 80,000
================================================================================
Sold 1,462 $22,561 5,478 $94,126
- -----------------------------
Issued in reinvestment
of distributions 18 271 -- --
- -----------------------------
Redeemed (1,038) (15,839) (3,993) (68,624)
- --------------------------------------------------------------------------------
Net increase (decrease) 442 $6,993 1,485 $25,502
================================================================================
YEAR ENDED OCTOBER 31, 2005
SHARES AUTHORIZED 40,000 80,000
================================================================================
Sold 553 $6,941 4,660 $68,796
- -----------------------------
Redeemed (2,745) (37,194) (1,402) (20,697)
- --------------------------------------------------------------------------------
Net increase (decrease) (2,192) $(30,253) 3,258 $48,099
================================================================================
(continued)
- ------
42
Notes to Financial Statements
OCTOBER 31, 2006 (AMOUNTS IN THOUSANDS)
4. CAPITAL SHARE TRANSACTIONS (CONTINUED)
- --------------------------------------------------------------------------------
HERITAGE VISTA
- --------------------------------------------------------------------------------
SHARES AMOUNT SHARES AMOUNT
- --------------------------------------------------------------------------------
ADVISOR CLASS
- --------------------------------------------------------------------------------
YEAR ENDED OCTOBER 31, 2006
SHARES AUTHORIZED 100,000 210,000
================================================================================
Sold 3,672 $55,416 4,866 $78,643
- --------------------------------
Issued in reinvestment
ofdistributions 11 151 -- --
- --------------------------------
Redeemed (1,400) (20,981) (4,673) (75,163)
- --------------------------------------------------------------------------------
Net increase (decrease) 2,283 $34,586 193 $3,480
================================================================================
YEAR ENDED OCTOBER 31, 2005
SHARES AUTHORIZED 100,000 210,000
================================================================================
Sold 592 $7,356 11,360 $161,446
- --------------------------------
Redeemed (558) (6,665) (6,659) (93,106)
- --------------------------------------------------------------------------------
Net increase (decrease) 34 $691 4,701 $68,340
================================================================================
C CLASS
- --------------------------------------------------------------------------------
YEAR ENDED OCTOBER 31, 2006
SHARES AUTHORIZED 100,000 100,000
================================================================================
Sold 161 $2,333 75 $1,172
- --------------------------------
Issued in reinvestment
of distributions -- 6 -- --
- --------------------------------
Redeemed (73) (1,059) (57) (904)
- --------------------------------------------------------------------------------
Net increase (decrease) 88 $1,280 18 $268
================================================================================
YEAR ENDED OCTOBER 31, 2005
SHARES AUTHORIZED 100,000 100,000
================================================================================
Sold 16 $184 124 $1,742
- --------------------------------
Redeemed (31) (372) (62) (868)
- --------------------------------------------------------------------------------
Net increase (decrease) (15) $(188) 62 $874
================================================================================
R CLASS
- --------------------------------------------------------------------------------
YEAR ENDED OCTOBER 31, 2006
SHARES AUTHORIZED N/A 10,000
================================================================================
Sold 23 $371
- --------------------------------
Redeemed (4) (58)
- --------------------------------------------------------------------------------
Net increase (decrease) 19 $313
================================================================================
PERIOD ENDED OCTOBER 31, 2005(1)
SHARES AUTHORIZED N/A 60,000
================================================================================
Sold 2 $25
================================================================================
(1) July 29, 2005 (commencement of sale) through October 31, 2005 for Vista.
(continued)
- ------
43
Notes to Financial Statements
OCTOBER 31, 2006 (AMOUNTS IN THOUSANDS)
5. BANK LINE OF CREDIT
The funds, along with certain other funds managed by ACIM or ACGIM, have a $500
million unsecured bank line of credit agreement with JPMCB. The funds may borrow
money for temporary or emergency purposes to fund shareholder redemptions.
Borrowings under the agreement bear interest at the Federal Funds rate plus
0.50%. The funds did not borrow from the line during the year ended October 31,
2006.
6. RISK FACTORS
Focused Growth is considered nondiversified which may subject the fund to the
following risks: a price change in one security may have a greater impact than
would be the case if the fund were diversified; the fund's nondiversification
could result in high portfolio turnover which could mean increased transaction
costs, affecting both the fund's performance and capital gains tax liabilities
to investors.
7. FEDERAL TAX INFORMATION
The tax character of distributions paid during the years ended October 31, 2006
and October 31, 2005 were as follows:
- ----------------------------------------------------------------------------------
GROWTH FOCUSED GROWTH
- ----------------------------------------------------------------------------------
2006 2005 2006 2005(1)
- ----------------------------------------------------------------------------------
DISTRIBUTIONS PAID FROM
- ----------------------------------------------------------------------------------
Ordinary income $21,518 $3,263 $94 --
- ----------------------------------------------------------------------------------
(1) February 28, 2005 (fund inception) through October 31, 2005.
- ----------------------------------------------------------------------------------
HERITAGE VISTA
- ----------------------------------------------------------------------------------
2006 2005 2006 2005
- ----------------------------------------------------------------------------------
DISTRIBUTIONS PAID FROM
- ----------------------------------------------------------------------------------
Long-term capital gains $5,576 -- -- --
- ----------------------------------------------------------------------------------
The book-basis character of distributions made during the year from net
investment income or net realized gains may differ from their ultimate
characterization for federal income tax purposes. These differences reflect the
differing character of certain income items and net realized gains and losses
for financial statement and tax purposes, and may result in reclassification
among certain capital accounts on the financial statements.
(continued)
- ------
44
Notes to Financial Statements
OCTOBER 31, 2006 (AMOUNTS IN THOUSANDS)
7. FEDERAL TAX INFORMATION (CONTINUED)
As of October 31, 2006, the components of distributable earnings on a tax-basis
and the federal tax cost of investments were as follows:
- ---------------------------------------------------------------------------------------------
GROWTH FOCUSED GROWTH HERITAGE VISTA
- ---------------------------------------------------------------------------------------------
Federal tax cost of investments $4,092,382 $14,597 $939,934 $1,936,164
=============================================================================================
Gross tax appreciation of investments $720,552 $1,278 $227,204 $388,352
- ----------------------------------------
Gross tax depreciation of investments (15,135) (99) (10,367) (7,387)
- ---------------------------------------------------------------------------------------------
Net tax appreciation (depreciation)
of investments $705,417 $1,179 $216,837 $380,965
=============================================================================================
Net tax appreciation (depreciation)
of derivatives and translation of
assets and liabilities
in foreign currencies (60) 1 (3) --
- ---------------------------------------------------------------------------------------------
Net tax appreciation (depreciation) $705,357 $1,180 $216,834 $380,965
=============================================================================================
Undistributed ordinary income $4,668 $312 -- --
- ----------------------------------------
Accumulated long-term gains -- -- $78,362 $18,229
- ----------------------------------------
Accumulated capital losses $(777,572) -- -- --
- ---------------------------------------------------------------------------------------------
The difference between book-basis and tax-basis cost and unrealized appreciation
(depreciation) is attributable primarily to the tax deferral of losses on wash
sales.
The accumulated capital losses listed above represent net capital loss
carryovers that may be used to offset future realized capital gains for federal
income tax purposes. The capital loss carryovers expire in 2011 for Growth.
8. RECENTLY ISSUED ACCOUNTING STANDARDS
In June 2006, the Financial Accounting Standards Board (FASB) issued
Interpretation No. 48, "Accounting for Uncertainty in Income Taxes - an
Interpretation of FASB Statement No. 109" (FIN 48). FIN 48 establishes a minimum
threshold for financial statement recognition of the benefit of positions taken
in filing tax returns (including whether an entity is taxable in a particular
jurisdiction), and requires certain expanded tax disclosures. FIN 48 is
effective for fiscal years beginning after December 15, 2006, and is to be
applied to all open tax years as of the date of effectiveness. The FASB issued
Statement of Financial Accounting Standards No. 157, "Fair Value Measurements"
(FAS 157), in September 2006, which is effective for fiscal years beginning
after November 15, 2007. FAS 157 defines fair value, establishes a framework for
measuring fair value and expands the required financial statement disclosures
about fair value measurements. Management is currently evaluating the impact of
adopting FIN 48 and FAS 157.
9. OTHER TAX INFORMATION (UNAUDITED) ($ IN FULL)
The following information is provided pursuant to provisions of the Internal
Revenue Code.
Growth and Focused Growth hereby designate $21,517,695 and $35,207,
respectively, of qualified dividend income for the fiscal year ended October 31,
2006.
For corporate taxpayers, ordinary income distributions paid by Growth and
Focused Growth during the fiscal year ended October 31, 2006 of $21,517,695 and
$36,154, respectively, qualify for the corporate dividends received deduction.
Focused Growth designates $89,993 of distributions as qualified short term
capital gains for purposes of Internal Revenue Code Section 871.
Heritage and Vista hereby designate $5,576,742 and $12 of long term capital gain
distributions, respectively, for the fiscal year ended October 31, 2006.
- ------
45
Growth - Financial Highlights
For a Share Outstanding Throughout the Years Ended October 31
- -------------------------------------------------------------------------------------
INVESTOR CLASS
- -------------------------------------------------------------------------------------
2006 2005 2004 2003 2002
- -------------------------------------------------------------------------------------
PER-SHARE DATA
- -------------------------------------------------------------------------------------
Net Asset Value,
Beginning of Period $19.80 $18.43 $17.26 $14.80 $17.85
- -------------------------------------------------------------------------------------
Income From Investment Operations
- -----------------------------------
Net Investment Income (Loss)(1) 0.02 0.08 (0.01) 0.01 (0.01)
- -----------------------------------
Net Realized and Unrealized
Gain (Loss) 2.26 1.30 1.18 2.45 (3.04)
- -------------------------------------------------------------------------------------
Total From Investment Operations 2.28 1.38 1.17 2.46 (3.05)
- -------------------------------------------------------------------------------------
Distributions
- -----------------------------------
From Net Investment Income (0.09) (0.01) -- -- --
- -------------------------------------------------------------------------------------
Net Asset Value, End of Period $21.99 $19.80 $18.43 $17.26 $14.80
=====================================================================================
TOTAL RETURN(2) 11.51% 7.47% 6.78% 16.62% (17.09)%
RATIOS/SUPPLEMENTAL DATA
- -------------------------------------------------------------------------------------
Ratio of Operating Expenses
to Average Net Assets 1.00% 1.00% 1.00% 1.00% 1.00%
- -----------------------------------
Ratio of Net Investment
Income (Loss)
to Average Net Assets 0.09% 0.38% (0.07)% 0.05% (0.04)%
- -----------------------------------
Portfolio Turnover Rate 127% 77% 131% 159% 135%
- -----------------------------------
Net Assets, End of Period
(in millions) $3,946 $4,008 $4,176 $4,350 $3,951
- -------------------------------------------------------------------------------------
(1) Computed using average shares outstanding throughout the period.
(2) Total return assumes reinvestment of net investment income and capital
gains distributions, if any. The total return of the classes may not
precisely reflect the class expense differences because of the impact of
calculating the net asset values to two decimal places. If net asset values
were calculated to three decimal places, the total return differences would
more closely reflect the class expense differences. The calculation of net
asset values to two decimal places is made in accordance with SEC guidelines
and does not result in any gain or loss of value between one class and
another.
See Notes to Financial Statements.
- ------
46
Growth - Financial Highlights
For a Share Outstanding Throughout the Years Ended October 31
- --------------------------------------------------------------------------------------
INSTITUTIONAL CLASS
- --------------------------------------------------------------------------------------
2006 2005 2004 2003 2002
- --------------------------------------------------------------------------------------
PER-SHARE DATA
- --------------------------------------------------------------------------------------
Net Asset Value,
Beginning of Period $19.98 $18.59 $17.38 $14.87 $17.90
- --------------------------------------------------------------------------------------
Income From Investment Operations
- -----------------------------------
Net Investment Income (Loss)(1) 0.06 0.11 0.02 0.04 0.02
- -----------------------------------
Net Realized and
Unrealized Gain (Loss) 2.27 1.33 1.19 2.47 (3.05)
- --------------------------------------------------------------------------------------
Total From Investment Operations 2.33 1.44 1.21 2.51 (3.03)
- --------------------------------------------------------------------------------------
Distributions
- -----------------------------------
From Net Investment Income (0.12) (0.05) -- -- --
- --------------------------------------------------------------------------------------
Net Asset Value, End of Period $22.19 $19.98 $18.59 $17.38 $14.87
======================================================================================
TOTAL RETURN(2) 11.70% 7.72% 6.96% 16.88% (16.93)%
RATIOS/SUPPLEMENTAL DATA
- --------------------------------------------------------------------------------------
Ratio of Operating Expenses
to Average Net Assets 0.80% 0.80% 0.80% 0.80% 0.80%
- -----------------------------------
Ratio of Net
Investment Income (Loss)
to Average Net Assets 0.29% 0.58% 0.13% 0.25% 0.16%
- -----------------------------------
Portfolio Turnover Rate 127% 77% 131% 159% 135%
- -----------------------------------
Net Assets, End of Period
(in thousands) $759,816 $689,983 $685,090 $618,569 $455,807
- --------------------------------------------------------------------------------------
(1) Computed using average shares outstanding throughout the period.
(2) Total return assumes reinvestment of net investment income and capital
gains distributions, if any. The total return of the classes may not
precisely reflect the class expense differences because of the impact of
calculating the net asset values to two decimal places. If net asset values
were calculated to three decimal places, the total return differences would
more closely reflect the class expense differences. The calculation of net
asset values to two decimal places is made in accordance with SEC guidelines
and does not result in any gain or loss of value between one class and
another.
See Notes to Financial Statements.
- ------
47
Growth - Financial Highlights
For a Share Outstanding Throughout the Years Ended October 31
- --------------------------------------------------------------------------------------
ADVISOR CLASS
- --------------------------------------------------------------------------------------
2006 2005 2004 2003 2002
- --------------------------------------------------------------------------------------
PER-SHARE DATA
- --------------------------------------------------------------------------------------
Net Asset Value,
Beginning of Period $19.53 $18.22 $17.11 $14.70 $17.78
- --------------------------------------------------------------------------------------
Income From Investment Operations
- -----------------------------------
Net Investment Income (Loss)(1) (0.03) 0.02 (0.06) (0.03) (0.05)
- -----------------------------------
Net Realized and
Unrealized Gain (Loss) 2.22 1.29 1.17 2.44 (3.03)
- --------------------------------------------------------------------------------------
Total From Investment Operations 2.19 1.31 1.11 2.41 (3.08)
- --------------------------------------------------------------------------------------
Distributions
- -----------------------------------
From Net Investment Income (0.04) -- -- -- --
- --------------------------------------------------------------------------------------
Net Asset Value, End of Period $21.68 $19.53 $18.22 $17.11 $14.70
======================================================================================
TOTAL RETURN(2) 11.23% 7.19% 6.49% 16.39% (17.32)%
RATIOS/SUPPLEMENTAL DATA
- --------------------------------------------------------------------------------------
Ratio of Operating Expenses
to Average Net Assets 1.25% 1.25% 1.25% 1.25% 1.25%
- -----------------------------------
Ratio of Net
Investment Income (Loss)
to Average Net Assets (0.16)% 0.13% (0.32)% (0.20)% (0.29)%
- -----------------------------------
Portfolio Turnover Rate 127% 77% 131% 159% 135%
- -----------------------------------
Net Assets, End of Period
(in thousands) $85,953 $86,303 $76,962 $55,010 $32,530
- --------------------------------------------------------------------------------------
(1) Computed using average shares outstanding throughout the period.
(2) Total return assumes reinvestment of net investment income and capital
gains distributions, if any. The total return of the classes may not
precisely reflect the class expense differences because of the impact of
calculating the net asset values to two decimal places. If net asset values
were calculated to three decimal places, the total return differences would
more closely reflect the class expense differences. The calculation of net
asset values to two decimal places is made in accordance with SEC guidelines
and does not result in any gain or loss of value between one class and
another.
See Notes to Financial Statements.
- ------
48
Growth - Financial Highlights
For a Share Outstanding Throughout the Years Ended October 31 (except as noted)
- -------------------------------------------------------------------------------------
C CLASS
- -------------------------------------------------------------------------------------
2006 2005 2004 2003 2002(1)
- -------------------------------------------------------------------------------------
PER-SHARE DATA
- -------------------------------------------------------------------------------------
Net Asset Value,
Beginning of Period $19.06 $17.91 $16.95 $14.66 $19.38
- -------------------------------------------------------------------------------------
Income From Investment Operations
- -----------------------------------
Net Investment Income (Loss)(2) (0.18) (0.12) (0.19) (0.15) (0.16)
- -----------------------------------
Net Realized and
Unrealized Gain (Loss) 2.16 1.27 1.15 2.44 (4.56)
- -------------------------------------------------------------------------------------
Total From Investment Operations 1.98 1.15 0.96 2.29 (4.72)
- -------------------------------------------------------------------------------------
Net Asset Value, End of Period $21.04 $19.06 $17.91 $16.95 $14.66
=====================================================================================
TOTAL RETURN(3) 10.39% 6.42% 5.66% 15.62% (24.36)%
RATIOS/SUPPLEMENTAL DATA
- -------------------------------------------------------------------------------------
Ratio of Operating Expenses
to Average Net Assets 2.00% 2.00% 2.00% 2.00% 2.00%(4)
- -----------------------------------
Ratio of Net Investment
Income (Loss)
to Average Net Assets (0.91)% (0.62)% (1.07)% (0.95)% (0.99)%(4)
- -----------------------------------
Portfolio Turnover Rate 127% 77% 131% 159% 135%(5)
- -----------------------------------
Net Assets, End of Period
(in thousands) $947 $779 $632 $623 $482
- -------------------------------------------------------------------------------------
(1) November 28, 2001 (commencement of sale) through October 31, 2002.
(2) Computed using average shares outstanding throughout the period.
(3) Total return assumes reinvestment of net investment income and capital
gains distributions, if any, and does not reflect applicable sales charges.
Total returns for periods less than one year are not annualized. The total
return of the classes may not precisely reflect the class expense
differences because of the impact of calculating the net asset values to
two decimal places. If net asset values were calculated to three decimal
places, the total return differences would more closely reflect the class
expense differences. The calculation of net asset values to two decimal
places is made in accordance with SEC guidelines and does not result in any
gain or loss of value between one class and another.
(4) Annualized.
(5) Portfolio turnover is calculated at the fund level. Percentage indicated
was calculated for the year ended October 31, 2002.
See Notes to Financial Statements.
- ------
49
Growth - Financial Highlights
For a Share Outstanding Throughout the Years Ended October 31 (except as noted)
- --------------------------------------------------------------------------------
R CLASS
- --------------------------------------------------------------------------------
2006 2005 2004 2003(1)
- --------------------------------------------------------------------------------
PER-SHARE DATA
- --------------------------------------------------------------------------------
Net Asset Value, Beginning of Period $19.59 $18.32 $17.25 $16.56
- --------------------------------------------------------------------------------
Income From Investment Operations
- -----------------------------------------
Net Investment Income (Loss)(2) (0.11) (0.07) (0.13) (0.02)
- -----------------------------------------
Net Realized and Unrealized Gain (Loss) 2.26 1.34 1.20 0.71
- --------------------------------------------------------------------------------
Total From Investment Operations 2.15 1.27 1.07 0.69
- --------------------------------------------------------------------------------
Net Asset Value, End of Period $21.74 $19.59 $18.32 $17.25
================================================================================
TOTAL RETURN(3) 10.97% 6.93% 6.20% 4.17%
RATIOS/SUPPLEMENTAL DATA
- --------------------------------------------------------------------------------
Ratio of Operating Expenses
to Average Net Assets 1.50% 1.50% 1.50% 1.50%(4)
- -----------------------------------------
Ratio of Net Investment Income (Loss)
to Average Net Assets (0.41)% (0.12)% (0.57)% (0.58)%(4)
- -----------------------------------------
Portfolio Turnover Rate 127% 77% 131% 159%(5)
- -----------------------------------------
Net Assets, End of Period (in thousands) $298 $49 $12 $3
- --------------------------------------------------------------------------------
(1) August 29, 2003 (commencement of sale) through October 31, 2003.
(2) Computed using average shares outstanding throughout the period.
(3) Total return assumes reinvestment of net investment income and capital
gains distributions, if any. Total returns for periods less than one year
are not annualized. The total return of the classes may not precisely
reflect the class expense differences becuause of the impact of calculating
the net asset value to two decimal places. If net asset values were
calculated to three decimal places, the total return differences would more
closely reflect the class expense differences. The calculation of net asset
values to two decimal places is made in accordance with SEC guidelines and
does not result in any gain or loss of value between one class and another.
(4) Annualized.
(5) Portfolio turnover is calculated at the fund level. Percentage indicated
was calculated for the year ended October 31, 2003.
See Notes to Financial Statements.
- ------
50
Focused Growth - Financial Highlights
For a Share Outstanding Throughout the Years Ended October 31 (except as noted)
- --------------------------------------------------------------------------------
INVESTOR CLASS
- --------------------------------------------------------------------------------
2006 2005(1)
- --------------------------------------------------------------------------------
PER-SHARE DATA
- --------------------------------------------------------------------------------
Net Asset Value, Beginning of Period $10.53 $10.00
- --------------------------------------------------------------------------------
Income From Investment Operations
- ------------------------------------------
Net Investment Income (Loss)(2) 0.01 --(3)
- ------------------------------------------
Net Realized and Unrealized Gain (Loss) 0.95 0.53
- --------------------------------------------------------------------------------
Total From Investment Operations 0.96 0.53
- --------------------------------------------------------------------------------
Distributions
- ------------------------------------------
From Net Investment Income --(3) --
- ------------------------------------------
From Net Realized Gains (0.07) --
- --------------------------------------------------------------------------------
Total Distributions (0.07) --
- --------------------------------------------------------------------------------
Net Asset Value, End of Period $11.42 $10.53
================================================================================
TOTAL RETURN(4) 9.13% 5.30%
RATIOS/SUPPLEMENTAL DATA
- --------------------------------------------------------------------------------
Ratio of Operating Expenses
to Average Net Assets 1.00% 1.00%(5)
- ------------------------------------------
Ratio of Net Investment Income (Loss)
to Average Net Assets 0.07% 0.00%(5)
- ------------------------------------------
Portfolio Turnover Rate 313% 95%
- ------------------------------------------
Net Assets, End of Period (in thousands) $15,837 $12,175
- --------------------------------------------------------------------------------
(1) February 28, 2005 (fund inception) through October 31, 2005.
(2) Computed using average shares outstanding throughout the period.
(3) Per-share amount was less than $0.005.
(4) Total return assumes reinvestment of net investment income and capital
gains distributions, if any. Total returns for periods less than one year
are not annualized.
(5) Annualized.
See Notes to Financial Statements.
- ------
51
Heritage - Financial Highlights
For a Share Outstanding Throughout the Years Ended October 31
- -------------------------------------------------------------------------------------
INVESTOR CLASS
- -------------------------------------------------------------------------------------
2006 2005 2004 2003 2002
- -------------------------------------------------------------------------------------
PER-SHARE DATA
- -------------------------------------------------------------------------------------
Net Asset Value,
Beginning of Period $13.48 $10.76 $10.78 $9.11 $10.13
- -------------------------------------------------------------------------------------
Income From Investment Operations
- -----------------------------------
Net Investment Income (Loss)(1) (0.03) (0.06) (0.05) (0.04) (0.04)
- -----------------------------------
Net Realized and
Unrealized Gain (Loss) 2.22 2.78 0.03 1.71 (0.98)
- -------------------------------------------------------------------------------------
Total From Investment Operations 2.19 2.72 (0.02) 1.67 (1.02)
- -------------------------------------------------------------------------------------
Distributions
- -----------------------------------
From Net Realized Gains (0.09) -- -- -- --
- -------------------------------------------------------------------------------------
Net Asset Value, End of Period $15.58 $13.48 $10.76 $10.78 $9.11
=====================================================================================
TOTAL RETURN(2) 16.26% 25.16% (0.09)% 18.33% (10.07)%
RATIOS/SUPPLEMENTAL DATA
- -------------------------------------------------------------------------------------
Ratio of Operating Expenses
to Average Net Assets 1.00% 1.00% 1.00% 1.00% 1.00%
- -----------------------------------
Ratio of Net Investment
Income (Loss)
to Average Net Assets (0.22)% (0.46)% (0.44)% (0.39)% (0.37)%
- -----------------------------------
Portfolio Turnover Rate 230% 236% 264% 129% 128%
- -----------------------------------
Net Assets, End of Period
(in millions) $1,037 $801 $1,148 $1,227 $1,010
- -------------------------------------------------------------------------------------
(1) Computed using average shares outstanding throughout the period.
(2) Total return assumes reinvestment of net investment income and capital
gains distributions, if any. The total return of the classes may not
precisely reflect the class expense differences because of the impact of
calculating the net asset values to two decimal places. If net asset values
were calculated to three decimal places, the total return differences would
more closely reflect the class expense differences. The calculation of net
asset values to two decimal places is made in accordance with SEC guidelines
and does not result in any gain or loss of value between one class and
another.
See Notes to Financial Statements.
- ------
52
Heritage - Financial Highlights
For a Share Outstanding Throughout the Years Ended October 31
- ---------------------------------------------------------------------------------------
INSTITUTIONAL CLASS
- ---------------------------------------------------------------------------------------
2006 2005 2004 2003 2002
- ---------------------------------------------------------------------------------------
PER-SHARE DATA
- ---------------------------------------------------------------------------------------
Net Asset Value,
Beginning of Period $13.63 $10.87 $10.86 $9.17 $10.17
- ---------------------------------------------------------------------------------------
Income From Investment Operations
- -----------------------------------
Net Investment Income (Loss)(1) --(2) (0.03) (0.03) (0.01) (0.02)
- -----------------------------------
Net Realized and
Unrealized Gain (Loss) 2.26 2.79 0.04 1.70 (0.98)
- ---------------------------------------------------------------------------------------
Total From Investment Operations 2.26 2.76 0.01 1.69 (1.00)
- ---------------------------------------------------------------------------------------
Distributions
- -----------------------------------
From Net Realized Gains (0.09) -- -- -- --
- ---------------------------------------------------------------------------------------
Net Asset Value, End of Period $15.80 $13.63 $10.87 $10.86 $9.17
=======================================================================================
TOTAL RETURN(3) 16.59% 25.39% 0.09% 18.43% (9.83)%
RATIOS/SUPPLEMENTAL DATA
- ---------------------------------------------------------------------------------------
Ratio of Operating Expenses
to Average Net Assets 0.80% 0.80% 0.80% 0.80% 0.80%
- -----------------------------------
Ratio of Net Investment
Income (Loss)
to Average Net Assets (0.02)% (0.26)% (0.24)% (0.19)% (0.17)%
- -----------------------------------
Portfolio Turnover Rate 230% 236% 264% 129% 128%
- -----------------------------------
Net Assets, End of Period
(in thousands) $57,039 $43,192 $58,259 $73,735 $152,256
- ---------------------------------------------------------------------------------------
(1) Computed using average shares outstanding throughout the period.
(2) Per-share amount was less than $0.005.
(3) Total return assumes reinvestment of net investment income and capital
gains distributions, if any. The total return of the classes may not
precisely reflect the class expense differences because of the impact of
calculating the net asset values to two decimal places. If net asset values
were calculated to three decimal places, the total return differences would
more closely reflect the class expense differences. The calculation of net
asset values to two decimal places is made in accordance with SEC guidelines
and does not result in any gain or loss of value between one class and
another.
See Notes to Financial Statements.
- ------
53
Heritage - Financial Highlights
For a Share Outstanding Throughout the Years Ended October 31
- ---------------------------------------------------------------------------------------
ADVISOR CLASS
- ---------------------------------------------------------------------------------------
2006 2005 2004 2003 2002
- ---------------------------------------------------------------------------------------
PER-SHARE DATA
- ---------------------------------------------------------------------------------------
Net Asset Value,
Beginning of Period $13.29 $10.64 $10.68 $9.05 $10.09
- ---------------------------------------------------------------------------------------
Income From Investment Operations
- -----------------------------------
Net Investment Income (Loss)(1) (0.08) (0.09) (0.07) (0.06) (0.06)
- -----------------------------------
Net Realized and
Unrealized Gain (Loss) 2.20 2.74 0.03 1.69 (0.98)
- ---------------------------------------------------------------------------------------
Total From Investment Operations 2.12 2.65 (0.04) 1.63 (1.04)
- ---------------------------------------------------------------------------------------
Distributions
- -----------------------------------
From Net Realized Gains (0.09) -- -- -- --
- ---------------------------------------------------------------------------------------
Net Asset Value, End of Period $15.32 $13.29 $10.64 $10.68 $9.05
=======================================================================================
TOTAL RETURN(2) 15.96% 24.91% (0.37)% 18.01% (10.31)%
RATIOS/SUPPLEMENTAL DATA
- ---------------------------------------------------------------------------------------
Ratio of Operating Expenses
to Average Net Assets 1.25% 1.25% 1.25% 1.25% 1.25%
- -----------------------------------
Ratio of Net Investment
Income (Loss)
to Average Net Assets (0.47)% (0.71)% (0.69)% (0.64)% (0.62)%
- -----------------------------------
Portfolio Turnover Rate 230% 236% 264% 129% 128%
- -----------------------------------
Net Assets, End of Period
(in thousands) $57,995 $19,953 $15,623 $13,668 $3,737
- ---------------------------------------------------------------------------------------
(1) Computed using average shares outstanding throughout the period.
(2) Total return assumes reinvestment of net investment income and capital
gains distributions, if any. The total return of the classes may not
precisely reflect the class expense differences because of the impact of
calculating the net asset values to two decimal places. If net asset values
were calculated to three decimal places, the total return differences would
more closely reflect the class expense differences. The calculation of net
asset values to two decimal places is made in accordance with SEC guidelines
and does not result in any gain or loss of value between one class and
another.
See Notes to Financial Statements.
- ------
54
Heritage - Financial Highlights
For a Share Outstanding Throughout the Years Ended October 31
- ------------------------------------------------------------------------------------
C CLASS
- ------------------------------------------------------------------------------------
2006 2005 2004 2003 2002
- ------------------------------------------------------------------------------------
PER-SHARE DATA
- ------------------------------------------------------------------------------------
Net Asset Value,
Beginning of Period $12.91 $10.41 $10.54 $8.99 $10.10
- ------------------------------------------------------------------------------------
Income From Investment Operations
- -----------------------------------
Net Investment Income (Loss)(1) (0.18) (0.17) (0.15) (0.13) (0.13)
- -----------------------------------
Net Realized and
Unrealized Gain (Loss) 2.13 2.67 0.02 1.68 (0.98)
- ------------------------------------------------------------------------------------
Total From Investment Operations 1.95 2.50 (0.13) 1.55 (1.11)
- ------------------------------------------------------------------------------------
Distributions
- -----------------------------------
From Net Realized Gains (0.09) -- -- -- --
- ------------------------------------------------------------------------------------
Net Asset Value, End of Period $14.77 $12.91 $10.41 $10.54 $8.99
====================================================================================
TOTAL RETURN(2) 15.11% 24.02% (1.23)% 17.24% (10.99)%
RATIOS/SUPPLEMENTAL DATA
- ------------------------------------------------------------------------------------
Ratio of Operating Expenses
to Average Net Assets 2.00% 2.00% 2.00% 2.00% 2.00%
- -----------------------------------
Ratio of Net Investment
Income (Loss)
to Average Net Assets (1.22)% (1.46)% (1.44)% (1.39)% (1.37)%
- -----------------------------------
Portfolio Turnover Rate 230% 236% 264% 129% 128%
- -----------------------------------
Net Assets, End of Period
(in thousands) $2,334 $898 $889 $872 $146
- ------------------------------------------------------------------------------------
(1) Computed using average shares outstanding throughout the period.
(2) Total return assumes reinvestment of net investment income and capital
gains distributions, if any, and does not reflect applicable sales charges.
The total return of the classes may not precisely reflect the class expense
differences because of the impact of calculating the net asset values to two
decimal places. If net asset values were calculated to three decimal places,
the total return differences would more closely reflect the class expense
differences. The calculation of net asset values to two decimal places is
made in accordance with SEC guidelines and does not result in any gain or
loss of value between one class and another.
See Notes to Financial Statements.
- ------
55
Vista - Financial Highlights
For a Share Outstanding Throughout the Years Ended October 31
- ----------------------------------------------------------------------------------
INVESTOR CLASS
- ----------------------------------------------------------------------------------
2006 2005 2004 2003 2002
- ----------------------------------------------------------------------------------
PER-SHARE DATA
- ----------------------------------------------------------------------------------
Net Asset Value,
Beginning of Period $14.99 $13.14 $11.97 $9.25 $10.62
- ----------------------------------------------------------------------------------
Income From Investment Operations
- -----------------------------------
Net Investment Income (Loss)(1) (0.04) (0.04) (0.06) (0.06) (0.04)
- -----------------------------------
Net Realized and
Unrealized Gain (Loss) 1.40 1.89 1.23 2.78 (1.33)
- ----------------------------------------------------------------------------------
Total From Investment Operations 1.36 1.85 1.17 2.72 (1.37)
- ----------------------------------------------------------------------------------
Net Asset Value, End of Period $16.35 $14.99 $13.14 $11.97 $9.25
==================================================================================
TOTAL RETURN(2) 9.07% 14.08% 9.77% 29.41% (12.90)%
RATIOS/SUPPLEMENTAL DATA
- ----------------------------------------------------------------------------------
Ratio of Operating Expenses
to Average Net Assets 1.00% 1.00% 1.00% 1.00% 1.00%
- -----------------------------------
Ratio of Net Investment
Income (Loss)
to Average Net Assets (0.23)% (0.26)% (0.48)% (0.57)% (0.34)%
- -----------------------------------
Portfolio Turnover Rate 234% 284% 255% 280% 293%
- -----------------------------------
Net Assets, End of Period
(in millions) $1,965 $1,902 $1,418 $1,240 $966
- ----------------------------------------------------------------------------------
(1) Computed using average shares outstanding throughout the period.
(2) Total return assumes reinvestment of net investment income and capital
gains distributions, if any. The total return of the classes may not
precisely reflect the class expense differences because of the impact of
calculating the net asset values to two decimal places. If net asset values
were calculated to three decimal places, the total return differences would
more closely reflect the class expense differences. The calculation of net
asset values to two decimal places is made in accordance with SEC guidelines
and does not result in any gain or loss of value between one class and
another.
See Notes to Financial Statements.
- ------
56
Vista - Financial Highlights
For a Share Outstanding Throughout the Years Ended October 31
- -------------------------------------------------------------------------------------
INSTITUTIONAL CLASS
- -------------------------------------------------------------------------------------
2006 2005 2004 2003 2002
- -------------------------------------------------------------------------------------
PER-SHARE DATA
- -------------------------------------------------------------------------------------
Net Asset Value,
Beginning of Period $15.22 $13.32 $12.11 $9.34 $10.70
- -------------------------------------------------------------------------------------
Income From Investment Operations
- -----------------------------------
Net Investment Income (Loss)(1) (0.01) (0.01) (0.04) (0.03) (0.02)
- -----------------------------------
Net Realized and
Unrealized Gain (Loss) 1.43 1.91 1.25 2.80 (1.34)
- -------------------------------------------------------------------------------------
Total From Investment Operations 1.42 1.90 1.21 2.77 (1.36)
- -------------------------------------------------------------------------------------
Net Asset Value, End of Period $16.64 $15.22 $13.32 $12.11 $9.34
=====================================================================================
TOTAL RETURN(2) 9.33% 14.26% 9.99% 29.66% (12.71)%
RATIOS/SUPPLEMENTAL DATA
- -------------------------------------------------------------------------------------
Ratio of Operating Expenses
to Average Net Assets 0.80% 0.80% 0.80% 0.80% 0.80%
- -----------------------------------
Ratio of Net Investment
Income (Loss)
to Average Net Assets (0.03)% (0.06)% (0.28)% (0.37)% (0.14)%
- -----------------------------------
Portfolio Turnover Rate 234% 284% 255% 280% 293%
- -----------------------------------
Net Assets, End of Period
(in thousands) $132,325 $98,439 $42,747 $34,177 $37,743
- -------------------------------------------------------------------------------------
(1) Computed using average shares outstanding throughout the period.
(2) Total return assumes reinvestment of net investment income and capital
gains distributions, if any. The total return of the classes may not
precisely reflect the class expense differences because of the impact of
calculating the net asset values to two decimal places. If net asset values
were calculated to three decimal places, the total return differences would
more closely reflect the class expense differences. The calculation of net
asset values to two decimal places is made in accordance with SEC guidelines
and does not result in any gain or loss of value between one class and
another.
See Notes to Financial Statements.
- ------
57
Vista - Financial Highlights
For a Share Outstanding Throughout the Years Ended October 31
- ---------------------------------------------------------------------------------------
ADVISOR CLASS
- ---------------------------------------------------------------------------------------
2006 2005 2004 2003 2002
- ---------------------------------------------------------------------------------------
PER-SHARE DATA
- ---------------------------------------------------------------------------------------
Net Asset Value,
Beginning of Period $14.73 $12.95 $11.82 $9.15 $10.53
- ---------------------------------------------------------------------------------------
Income From Investment Operations
- -----------------------------------
Net Investment Income (Loss)(1) (0.08) (0.08) (0.11) (0.08) (0.06)
- -----------------------------------
Net Realized and
Unrealized Gain (Loss) 1.38 1.86 1.24 2.75 (1.32)
- ---------------------------------------------------------------------------------------
Total From Investment Operations 1.30 1.78 1.13 2.67 (1.38)
- ---------------------------------------------------------------------------------------
Net Asset Value, End of Period $16.03 $14.73 $12.95 $11.82 $9.15
=======================================================================================
TOTAL RETURN(2) 8.83% 13.75% 9.56% 29.18% (13.11)%
RATIOS/SUPPLEMENTAL DATA
- ---------------------------------------------------------------------------------------
Ratio of Operating Expenses
to Average Net Assets 1.25% 1.25% 1.25% 1.25% 1.25%
- -----------------------------------
Ratio of Net Investment
Income (Loss)
to Average Net Assets (0.48)% (0.51)% (0.73)% (0.82)% (0.59)%
- -----------------------------------
Portfolio Turnover Rate 234% 284% 255% 280% 293%
- -----------------------------------
Net Assets, End of Period
(in thousands) $210,576 $190,635 $106,750 $17,060 $11,333
- ---------------------------------------------------------------------------------------
(1) Computed using average shares outstanding throughout the period.
(2) Total return assumes reinvestment of net investment income and capital
gains distributions, if any. The total return of the classes may not
precisely reflect the class expense differences because of the impact of
calculating the net asset values to two decimal places. If net asset values
were calculated to three decimal places, the total return differences would
more closely reflect the class expense differences. The calculation of net
asset values to two decimal places is made in accordance with SEC guidelines
and does not result in any gain or loss of value between one class and
another.
See Notes to Financial Statements.
- ------
58
Vista - Financial Highlights
For a Share Outstanding Throughout the Years Ended October 31
- -------------------------------------------------------------------------------------
C CLASS
- -------------------------------------------------------------------------------------
2006 2005 2004 2003 2002
- -------------------------------------------------------------------------------------
PER-SHARE DATA
- -------------------------------------------------------------------------------------
Net Asset Value,
Beginning of Period $14.37 $12.73 $11.71 $9.12 $10.59
- -------------------------------------------------------------------------------------
Income From Investment Operations
- -----------------------------------
Net Investment Income (Loss)(1) (0.19) (0.18) (0.19) (0.16) (0.15)
- -----------------------------------
Net Realized and
Unrealized Gain (Loss) 1.34 1.82 1.21 2.75 (1.32)
- -------------------------------------------------------------------------------------
Total From Investment Operations 1.15 1.64 1.02 2.59 (1.47)
- -------------------------------------------------------------------------------------
Net Asset Value, End of Period $15.52 $14.37 $12.73 $11.71 $9.12
=====================================================================================
TOTAL RETURN(2) 8.00% 12.88% 8.71% 28.40% (13.88)%
RATIOS/SUPPLEMENTAL DATA
- -------------------------------------------------------------------------------------
Ratio of Operating Expenses
to Average Net Assets 2.00% 2.00% 2.00% 2.00% 2.00%
- -----------------------------------
Ratio of Net Investment
Income (Loss)
to Average Net Assets (1.23)% (1.26)% (1.48)% (1.57)% (1.34)%
- -----------------------------------
Portfolio Turnover Rate 234% 284% 255% 280% 293%
- -----------------------------------
Net Assets, End of Period
(in thousands) $2,998 $2,515 $1,439 $333 $110
- -------------------------------------------------------------------------------------
(1) Computed using average shares outstanding throughout the period.
(2) Total return assumes reinvestment of net investment income and capital
gains distributions, if any, and does not reflect applicable sales charges.
The total return of the classes may not precisely reflect the class expense
differences because of the impact of calculating the net asset values to two
decimal places. If net asset values were calculated to three decimal places,
the total return differences would more closely reflect the class expense
differences. The calculation of net asset values to two decimal places is
made in accordance with SEC guidelines and does not result in any gain or
loss of value between one class and another.
See Notes to Financial Statements.
- ------
59
Vista - Financial Highlights
For a Share Outstanding Throughout the Years Ended October 31 (except as noted)
- --------------------------------------------------------------------------------
R CLASS
- --------------------------------------------------------------------------------
2006 2005(1)
- --------------------------------------------------------------------------------
PER-SHARE DATA
- --------------------------------------------------------------------------------
Net Asset Value, Beginning of Period $14.97 $15.32
- --------------------------------------------------------------------------------
Income From Investment Operations
- -------------------------------------------
Net Investment Income (Loss)(2) (0.16) (0.04)
- -------------------------------------------
Net Realized and Unrealized Gain (Loss) 1.44 (0.31)
- --------------------------------------------------------------------------------
Total From Investment Operations 1.28 (0.35)
- --------------------------------------------------------------------------------
Net Asset Value, End of Period $16.25 $14.97
================================================================================
TOTAL RETURN(3) 8.55% (2.28)%
RATIOS/SUPPLEMENTAL DATA
- --------------------------------------------------------------------------------
Ratio of Operating Expenses
to Average Net Assets 1.50% 1.50%(4)
- -------------------------------------------
Ratio of Net Investment Income (Loss)
to Average Net Assets (0.73)% (0.92)(4)
- -------------------------------------------
Portfolio Turnover Rate 234% 284%(5)
- -------------------------------------------
Net Assets, End of Period (in thousands) $337 $24
- --------------------------------------------------------------------------------
(1) July 29, 2005 (commencement of sale) through October 31, 2005.
(2) Computed using average shares outstanding throughout the period.
(3) Total return assumes reinvestment of net investment income and capital
gains distributions, if any. Total returns for periods less than one year
are not annualized. The total return of the classes may not precisely
reflect the class expense differences because of the impact of calculating
the net asset values to two decimal places. If net asset values were
calculated to three decimal places, the total return differences would more
closely reflect the class expense differences. The calculation of net asset
values to two decimal places is made in accordance with SEC guidelines and
does not result in any gain or loss of value between one class and another.
(4) Annualized.
(5) Portfolio turnover is calculated at the fund level. Percentage indicated
was calculated for the year ended October 31, 2005.
See Notes to Financial Statements.
- ------
60
Report of Independent Registered Public Accounting Firm
The Board of Directors and Shareholders,
American Century Mutual Funds, Inc.:
We have audited the accompanying statements of assets and liabilities, including
the schedules of investments, of Growth Fund, Focused Growth Fund, Heritage
Fund, and Vista Fund (collectively the "Funds"), four of the mutual funds
comprising American Century Mutual Funds, Inc., as of October 31, 2006, and the
related statements of operations for the year then ended, the statements of
changes in net assets for the periods presented, and the financial highlights
for the periods presented. These financial statements and financial highlights
are the responsibility of the Funds' management. Our responsibility is to
express an opinion on these financial statements and financial highlights based
on our audits.
We conducted our audits in accordance with the standards of the Public Company
Accounting Oversight Board (United States). Those standards require that we plan
and perform the audit to obtain reasonable assurance about whether the financial
statements and financial highlights are free of material misstatement. The Funds
are not required to have, nor were we engaged to perform, an audit of their
internal control over financial reporting. Our audits included consideration of
internal control over financial reporting as a basis for designing audit
procedures that are appropriate in the circumstances, but not for the purpose of
expressing an opinion on the effectiveness of the Funds' internal control over
financial reporting. Accordingly, we express no such opinion. An audit also
includes examining, on a test basis, evidence supporting the amounts and
disclosures in the financial statements, assessing the accounting principles
used and significant estimates made by management, as well as evaluating the
overall financial statement presentation. Our procedures included confirmation
of securities owned as of October 31, 2006, by correspondence with the custodian
and brokers; where replies were not received from brokers, we performed other
auditing procedures. We believe that our audits provide a reasonable basis for
our opinion.
In our opinion, the financial statements and financial highlights referred to
above present fairly, in all material respects, the financial position of each
of the respective Funds, as of October 31, 2006, the results of their operations
for the year then ended, the changes in their net assets for periods presented,
and the financial highlights for the periods presented, in conformity with
accounting principles generally accepted in the United States of America.
Deloitte & Touche LLP
Kansas City, Missouri
December 14, 2006
- ------
61
Management
The individuals listed below serve as directors or officers of the funds. Each
director serves until his or her successor is duly elected and qualified or
until he or she retires. Mandatory retirement age for independent directors is
72. Those listed as interested directors are "interested" primarily by virtue of
their engagement as officers of American Century Companies, Inc. (ACC) or its
wholly owned, direct or indirect, subsidiaries, including the funds' investment
advisor, American Century Investment Management, Inc. (ACIM); the funds'
principal underwriter, American Century Investment Services, Inc. (ACIS); and
the funds' transfer agent, American Century Services, LLC (ACS).
The other directors (more than three-fourths of the total number) are
independent; that is, they have never been employees or officers of, and have no
financial interest in, ACC or any of its wholly owned subsidiaries, including
ACIM, ACIS, and ACS. The directors serve in this capacity for seven registered
investment companies in the American Century family of funds.
All persons named as officers of the funds also serve in a similar capacity for
the other 14 investment companies advised by ACIM or American Century Global
Investment Management, Inc. (ACGIM), unless otherwise noted. Only officers with
policy-making functions are listed. No officer is compensated for his or her
service as an officer of the funds. The listed officers are interested persons
of the funds and are appointed or re-appointed on an annual basis.
INDEPENDENT DIRECTORS
- --------------------------------------------------------------------------------
THOMAS A. BROWN, 4500 Main Street, Kansas City, MO 64111
YEAR OF BIRTH: 1940
POSITION(S) HELD WITH FUND: Director
FIRST YEAR OF SERVICE: 1980
PRINCIPAL OCCUPATION(S) DURING PAST 5 YEARS: Retired, Formerly Chief Executive
Officer/Treasurer, Associated Bearings Company
NUMBER OF PORTFOLIOS IN FUND COMPLEX OVERSEEN BY DIRECTOR: 66
OTHER DIRECTORSHIPS HELD BY DIRECTOR: None
- --------------------------------------------------------------------------------
ANDREA C. HALL, PH.D., 4500 Main Street, Kansas City, MO 64111
YEAR OF BIRTH: 1945
POSITION(S) HELD WITH FUND: Director
FIRST YEAR OF SERVICE: 1997
PRINCIPAL OCCUPATION(S) DURING PAST 5 YEARS: Senior Vice President, Midwest
Research Institute
NUMBER OF PORTFOLIOS IN FUND COMPLEX OVERSEEN BY DIRECTOR: 66
OTHER DIRECTORSHIPS HELD BY DIRECTOR: None
- --------------------------------------------------------------------------------
D.D. (DEL) HOCK, 4500 Main Street, Kansas City, MO 64111
YEAR OF BIRTH: 1935
POSITION(S) HELD WITH FUND: Director
FIRST YEAR OF SERVICE: 1996
PRINCIPAL OCCUPATION(S) DURING PAST 5 YEARS: Retired, formerly Chairman, Public
Service Company of Colorado
NUMBER OF PORTFOLIOS IN FUND COMPLEX OVERSEEN BY DIRECTOR: 66
OTHER DIRECTORSHIPS HELD BY DIRECTOR: Director, Allied Motion Technologies, Inc.
- --------------------------------------------------------------------------------
JAMES A. OLSON, 4500 Main Street, Kansas City, MO 64111
YEAR OF BIRTH: 1942
POSITION(S) HELD WITH FUND: Advisory Board Member
FIRST YEAR OF SERVICE: 2006
PRINCIPAL OCCUPATION(S) DURING PAST 5 YEARS: Principal, Plaza Belmont LLC; Chief
Financial Officer, Plaza Belmont LLC (September 1999 to July 2006)
NUMBER OF PORTFOLIOS IN FUND COMPLEX OVERSEEN BY DIRECTOR: 66
OTHER DIRECTORSHIPS HELD BY DIRECTOR: Director, Saia, Inc. and Entertainment
Properties Trust
- --------------------------------------------------------------------------------
(continued)
- ------
62
Management
INDEPENDENT DIRECTORS (CONTINUED)
- --------------------------------------------------------------------------------
DONALD H. PRATT, 4500 Main Street, Kansas City, MO 64111
YEAR OF BIRTH: 1937
POSITION(S) HELD WITH FUND: Director, Chairman of the Board
FIRST YEAR OF SERVICE: 1995
PRINCIPAL OCCUPATION(S) DURING PAST 5 YEARS: Chairman, Western Investments,
Inc.; Retired Chairman of the Board, Butler Manufacturing Company
NUMBER OF PORTFOLIOS IN FUND COMPLEX OVERSEEN BY DIRECTOR: 66
OTHER DIRECTORSHIPS HELD BY DIRECTOR: None
- --------------------------------------------------------------------------------
GALE E. SAYERS, 4500 Main Street, Kansas City, MO 64111
YEAR OF BIRTH: 1943
POSITION(S) HELD WITH FUND: Director
FIRST YEAR OF SERVICE: 2000
PRINCIPAL OCCUPATION(S) DURING PAST 5 YEARS: President, Chief Executive Officer
and Founder, Sayers40, Inc., a technology products and service provider
NUMBER OF PORTFOLIOS IN FUND COMPLEX OVERSEEN BY DIRECTOR: 66
OTHER DIRECTORSHIPS HELD BY DIRECTOR: Director, Triad Hospitals, Inc.
- --------------------------------------------------------------------------------
M. JEANNINE STRANDJORD, 4500 Main Street, Kansas City, MO 64111
YEAR OF BIRTH: 1945
POSITION(S) HELD WITH FUND: Director
FIRST YEAR OF SERVICE: 1994
PRINCIPAL OCCUPATION(S) DURING PAST 5 YEARS: Retired, formerly Senior Vice
President, Sprint Corporation
NUMBER OF PORTFOLIOS IN FUND COMPLEX OVERSEEN BY DIRECTOR: 66
OTHER DIRECTORSHIPS HELD BY DIRECTOR: Director, DST Systems, Inc.; Director,
Euronet Worldwide, Inc.
- --------------------------------------------------------------------------------
TIMOTHY S. WEBSTER, 4500 Main Street, Kansas City, MO 64111
YEAR OF BIRTH: 1961
POSITION(S) HELD WITH FUND: Director
FIRST YEAR OF SERVICE: 2001
PRINCIPAL OCCUPATION(S) DURING PAST 5 YEARS: President and Chief Executive
Officer, American Italian Pasta Company (1992 to December 2005)
NUMBER OF PORTFOLIOS IN FUND COMPLEX OVERSEEN BY DIRECTOR: 66
OTHER DIRECTORSHIPS HELD BY DIRECTOR: None
- --------------------------------------------------------------------------------
INTERESTED DIRECTORS
- --------------------------------------------------------------------------------
JAMES E. STOWERS, JR.(1), 4500 Main Street, Kansas City, MO 64111
YEAR OF BIRTH: 1924
POSITION(S) HELD WITH FUND: Director, Co-Vice Chairman
FIRST YEAR OF SERVICE: 1958
PRINCIPAL OCCUPATION(S) DURING PAST 5 YEARS: Founder, Director and Controlling
Shareholder, ACC; Chairman, ACC (January 1995 to December 2004); Director, ACIM,
ACGIM, ACS, ACIS and other ACC subsidiaries
NUMBER OF PORTFOLIOS IN FUND COMPLEX OVERSEEN BY DIRECTOR: 66
OTHER DIRECTORSHIPS HELD BY DIRECTOR: None
- --------------------------------------------------------------------------------
JAMES E. STOWERS III(1), 4500 Main Street, Kansas City, MO 64111
YEAR OF BIRTH: 1959
POSITION(S) HELD WITH FUND: Director, Co-Vice Chairman
FIRST YEAR OF SERVICE: 1990
PRINCIPAL OCCUPATION(S) DURING PAST 5 YEARS: Chairman, ACC (January 2005 to
present); Co-Chairman, ACC (September 2000 to December 2004); Chairman, ACS and
other ACC subsidiaries (April 2005 to September 2006); Director, ACC, ACIM,
ACGIM, ACS, ACIS and other ACC subsidiaries
NUMBER OF PORTFOLIOS IN FUND COMPLEX OVERSEEN BY DIRECTOR: 66
OTHER DIRECTORSHIPS HELD BY DIRECTOR: None
- --------------------------------------------------------------------------------
(1) James E. Stowers, Jr. is the father of James E. Stowers III.
(continued)
- ------
63
Management
OFFICERS
- --------------------------------------------------------------------------------
WILLIAM M. LYONS, 4500 Main Street, Kansas City, MO 64111
YEAR OF BIRTH: 1955
POSITION(S) HELD WITH FUND: President
FIRST YEAR OF SERVICE: 2000
PRINCIPAL OCCUPATION(S) DURING PAST 5 YEARS: Chief Executive Officer, ACC
(September 2000 to present); President, ACC (June 1997 to present); Also serves
as: Chairman, ACIM, ACGIM, ACS, ACIS and other ACC subsidiaries; Chief Executive
Officer, ACIM, ACGIM, ACIS and other ACC subsidiaries (October 2000 to October
2006); President, ACIM, ACGIM and other ACC subsidiaries (September 2002 to
September 2006); Executive Vice President, ACS (January 2005 to September 2006);
Director, ACC, ACIM, ACGIM, ACS, ACIS and other ACC subsidiaries
- --------------------------------------------------------------------------------
JONATHAN THOMAS, 4500 Main Street, Kansas City, MO 64111
YEAR OF BIRTH: 1963
POSITION(S) HELD WITH FUND: Executive Vice President
FIRST YEAR OF SERVICE: 2005
PRINCIPAL OCCUPATION(S) DURING PAST 5 YEARS: Chief Administrative Officer, ACC
(February 2006 to present); Executive Vice President, ACC (November 2005 to
present); Also serves as: President and Chief Executive Officer, ACS; Chief
Financial Officer and Chief Accounting Officer, ACIM, ACGIM, ACS, ACIS and other
ACC subsidiaries; Managing Director, Morgan Stanley (March 2000 to November
2005)
- --------------------------------------------------------------------------------
MARYANNE ROEPKE, 4500 Main Street, Kansas City, MO 64111
YEAR OF BIRTH: 1956
POSITION(S) HELD WITH FUND: Chief Compliance Officer and Senior Vice President
FIRST YEAR OF SERVICE: 2000
PRINCIPAL OCCUPATION(S) DURING PAST 5 YEARS: Chief Compliance Officer, ACIM,
ACGIM and ACS (August 2006 to present); Assistant Treasurer, ACC (January 1995
to August 2006); Treasurer and Chief Financial Officer, various American Century
funds (July 2000 to August 2006); Also serves as: Senior Vice President, ACS
- --------------------------------------------------------------------------------
DAVID C. TUCKER, 4500 Main Street, Kansas City, MO 64111
YEAR OF BIRTH: 1958
POSITION(S) HELD WITH FUND: Senior Vice President and General Counsel
FIRST YEAR OF SERVICE: 2000
PRINCIPAL OCCUPATION(S) DURING PAST 5 YEARS: Vice President, ACC (February 2001
to present); General Counsel, ACC (June 1998 to present); Also serves as: Senior
Vice President and General Counsel, ACIM, ACGIM, ACS, ACIS and other ACC
subsidiaries
- --------------------------------------------------------------------------------
ROBERT LEACH, 4500 Main Street, Kansas City, MO 64111
YEAR OF BIRTH: 1966
POSITION(S) HELD WITH FUND: Vice President, Treasurer and Chief Financial
Officer
FIRST YEAR OF SERVICE: 1997
PRINCIPAL OCCUPATION(S) DURING PAST 5 YEARS: Vice President, ACS (February 2000
to present); Controller, various American Century funds (June 1997 to September
2006)
- --------------------------------------------------------------------------------
C. JEAN WADE, 4500 Main Street, Kansas City, MO 64111
YEAR OF BIRTH: 1964
POSITION(S) HELD WITH FUNDS: Controller
FIRST YEAR OF SERVICE: 2006
PRINCIPAL OCCUPATION(S) DURING PAST 5 YEARS: Vice President, ACS (February 2000
to present)
- --------------------------------------------------------------------------------
JON ZINDEL, 4500 Main Street, Kansas City, MO 64111
YEAR OF BIRTH: 1967
POSITION(S) HELD WITH FUND: Tax Officer
FIRST YEAR OF SERVICE: 1997
PRINCIPAL OCCUPATION(S) DURING PAST 5 YEARS: Senior Vice President, ACC (August
2006 to present); Vice President, ACC and certain ACC subsidiaries (October 2001
to August 2006); Vice President, Corporate Tax, ACS (April 1998 to August 2006);
Also serves as: Senior Vice President, ACIM, ACGIM, ACS, ACIS and other ACC
subsidiaries
- --------------------------------------------------------------------------------
The SAI has additional information about the funds' directors and is available
without charge, upon request, by calling 1-800-345-2021.
- ------
64
Approval of Management Agreements for Growth, Focused Growth, Heritage, and
Vista
Under Section 15(c) of the Investment Company Act, contracts for investment
advisory services are required to be reviewed, evaluated and approved by a
majority of a fund's independent directors or trustees (the "Directors") each
year. At American Century, this process is referred to as the "15(c) Process."
As a part of this process, the board reviews fund performance, shareholder
services, audit and compliance information, and a variety of other reports from
the advisor concerning fund operations. In addition to this annual review, the
board of directors oversees and evaluates on a continuous basis at its quarterly
meetings the nature and quality of significant services performed by the
advisor, fund performance, audit and compliance information, and a variety of
other reports relating to fund operations. The board, or committees of the
board, also holds special meetings as needed.
Under a Securities and Exchange Commission rule, each fund is required to
disclose in its annual or semiannual report, as appropriate, the material
factors and conclusions that formed the basis for the board's approval or
renewal of any advisory agreements within the fund's most recently completed
fiscal half-year period.
ANNUAL CONTRACT REVIEW PROCESS
As part of the annual 15(c) Process undertaken during the most recent fiscal
half-year period, the Directors reviewed extensive data and information compiled
by the advisor and certain independent providers of evaluative data (the "15(c)
Providers") concerning Growth, Focused Growth, Heritage and Vista (the "funds")
and the services provided to the funds under the management agreement. The
information considered and the discussions held at the meetings included, but
were not limited to:
* the nature, extent and quality of investment management, shareholder
services and other services provided to the funds under the management
agreement;
* reports on the advisor's activities relating to the wide range of
programs and services the advisor provides to the funds and their
shareholders on a routine and non-routine basis;
* data comparing the cost of owning the funds to the cost of owning
similar funds;
* data comparing the funds' performance to appropriate benchmarks
and/or a peer group of other mutual funds with similar investment
objectives and strategies;
* financial data showing the profitability of the funds to the advisor
and the overall profitability of the advisor; and
* data comparing services provided and charges to other investment
management clients of the advisor.
In keeping with its practice, the funds' board of directors held two regularly
scheduled meetings and one special meeting to review and discuss the information
provided by the advisor and to complete its negotiations with the advisor
regarding the renewal of the management agreement, including the setting of the
applicable advisory fee. The board also had the benefit of the advice of its
independent counsel throughout the period.
(continued)
- ------
65
Approval of Management Agreements for Growth, Focused Growth, Heritage, and
Vista
FACTORS CONSIDERED
The Directors considered all of the information provided by the advisor, the
15(c) Providers, and the board's independent counsel, and evaluated such
information for each fund for which the board has responsibility. The Directors
did not identify any single factor as being all-important or controlling, and
each Director may have attributed different levels of importance to different
factors. In deciding to renew the agreement under the terms ultimately
determined by the board to be appropriate, the Directors' decision was based on
the following factors.
NATURE, EXTENT AND QUALITY OF SERVICES -- GENERALLY. Under the management
agreement, the advisor is responsible for providing or arranging for all
services necessary for the operation of the funds. The board noted that under
the management agreement, the advisor provides or arranges at its own expense a
wide variety of services including:
* fund construction and design
* portfolio security selection
* initial capitalization/funding
* securities trading
* custody of fund assets
* daily valuation of the funds' portfolio
* shareholder servicing and transfer agency, including shareholder
confirmations, recordkeeping and communications
* legal services
* regulatory and portfolio compliance
* financial reporting
* marketing and distribution
The Directors noted that many of these services have expanded over time both in
terms of quantity and complexity in response to shareholder demands, competition
in the industry and the changing regulatory environment. In performing their
evaluation, the Directors considered information received in connection with the
annual review, as well as information provided on an ongoing basis at their
regularly scheduled board and committee meetings.
INVESTMENT MANAGEMENT SERVICES. The nature of the investment management services
provided is quite complex and allows fund shareholders access to professional
money management, instant diversification of their investments within an asset
class, the opportunity to easily diversify among asset classes, and liquidity.
In evaluating investment performance, the board expects the advisor to manage
the funds in accordance with their investment objectives and approved
strategies. In providing these services, the advisor utilizes teams of
investment professionals (portfolio managers, analysts, research assistants, and
securities traders) who require extensive information technology, research,
training, compliance and other systems to conduct their business. At each
quarterly meeting, the Directors review investment performance information for
the funds, together with comparative information for appropriate benchmarks and
peer groups of funds managed similarly to the funds. The Directors also review
detailed performance information during the 15(c) Process comparing the funds'
performance with that of similar funds not
(continued)
- ------
66
Approval of Management Agreements for Growth, Focused Growth, Heritage, and
Vista
managed by the advisor. If performance concerns are identified, the Directors
discuss with the advisor the reasons for such results (e.g., market conditions,
security selection) and any efforts being undertaken to improve performance.
Growth's performance fell below the median for both the one and three year
periods during the past year. Heritage's performance for the one year period was
in the highest quartile for its peer group and below the median for the three
year period during part of the past year. Vista's performance for the one year
period was below the median for its peer group and above the median for the
three year period during part of the past year. The board discussed the fund's
performance with the advisor and was satisfied with the efforts being undertaken
by the advisor.
SHAREHOLDER AND OTHER SERVICES. The advisor provides the funds with a
comprehensive package of transfer agency, shareholder, and other services. The
Directors review reports and evaluations of such services at their regular
quarterly meetings, including the annual meeting concerning contract review, and
reports to the board. These reports include, but are not limited to, information
regarding the operational efficiency and accuracy of the shareholder and
transfer agency services provided, staffing levels, shareholder satisfaction (as
measured by external as well as internal sources), technology support, new
products and services offered to fund shareholders, securities trading
activities, portfolio valuation services, auditing services, and legal and
operational compliance activities. Certain aspects of shareholder and transfer
agency service level efficiency and the quality of securities trading activities
are measured by independent third party providers and are presented in
comparison to other fund groups not managed by the advisor.
COSTS OF SERVICES PROVIDED AND PROFITABILITY TO THE ADVISOR. The advisor
provides detailed information concerning its cost of providing various services
to the funds, its profitability in managing the funds, its overall
profitability, and its financial condition. The Directors have reviewed with the
advisor the methodology used to prepare this financial information. This
financial information regarding the advisor is considered in order to evaluate
the advisor's financial condition, its ability to continue to provide services
under the management agreement, and the reasonableness of the current management
fee.
ETHICS OF THE ADVISOR. The Directors generally consider the advisor's commitment
to providing quality services to shareholders and to conducting its business
ethically. They noted that the advisor's practices generally meet or exceed
industry best practices and that the advisor was not implicated in the industry
scandals of 2003 and 2004.
ECONOMIES OF SCALE. The Directors review reports provided by the advisor on
economies of scale for the complex as a whole and the year-over-year changes in
revenue, costs, and profitability. The Directors concluded that economies of
scale are difficult to measure and predict with precision, especially on a
fund-by-fund basis. This analysis is also complicated by the additional services
and content provided by the advisor and its
(continued)
- ------
67
Approval of Management Agreements for Growth, Focused Growth, Heritage, and
Vista
reinvestment in its ability to provide and expand those services. Accordingly,
the Directors also seek to evaluate economies of scale by reviewing other
information, such as year-over-year profitability of the advisor generally, the
profitability of its management of the funds specifically, the expenses incurred
by the advisor in providing various functions to the funds, and the breakpoint
fees of competitive funds not managed by the advisor. The Directors believe the
advisor is appropriately sharing economies of scale through its competitive fee
structure, fee breakpoints as the funds increase in size, and through
reinvestment in its business to provide shareholders additional content and
services.
COMPARISON TO OTHER FUNDS' FEES. The funds pay the advisor a single,
all-inclusive (or unified) management fee for providing all services necessary
for the management and operation of the funds, other than brokerage expenses,
taxes, interest, extraordinary expenses, and the fees and expenses of the funds'
independent directors (including their independent legal counsel). Under the
unified fee structure, the advisor is responsible for providing all investment
advisory, custody, audit, administrative, compliance, recordkeeping, marketing
and shareholder services, or arranging and supervising third parties to provide
such services. By contrast, most other funds are charged a variety of fees,
including an investment advisory fee, a transfer agency fee, an administrative
fee, distribution charges and other expenses. Other than their investment
advisory fees and Rule 12b-1 distribution fees, all other components of the
total fees charged by these other funds may be increased without shareholder
approval. The board believes the unified fee structure is a benefit to fund
shareholders because it clearly discloses to shareholders the cost of owning
fund shares, and, since the unified fee cannot be increased without a vote of
fund shareholders, it shifts to the advisor the risk of increased costs of
operating the funds and provides a direct incentive to minimize administrative
inefficiencies. Part of the Directors' analysis of fee levels involves reviewing
certain evaluative data compiled by a 15(c) Provider comparing the funds'
unified fee to the total expense ratio of other funds in the funds' peer groups.
The unified fee charged to shareholders of each of Growth and Focused Growth was
below the median of the total expense ratios of its peer group. The unified fee
charged to shareholders of each of Heritage and Vista was in the lowest quartile
of the total expense ratios of its peer group.
COMPARISON TO FEES AND SERVICES PROVIDED TO OTHER CLIENTS OF THE ADVISOR. The
Directors also requested and received information from the advisor concerning
the nature of the services, fees, and profitability of its advisory services to
advisory clients other than the funds. They observed that these varying types of
client accounts require different services and involve different regulatory and
entrepreneurial risks than the management of the funds. The Directors analyzed
this information and concluded that the fees charged and services provided to
the funds were reasonable by comparison.
(continued)
- ------
68
Approval of Management Agreements for Growth, Focused Growth, Heritage, and
Vista
COLLATERAL BENEFITS DERIVED BY THE ADVISOR. The Directors reviewed information
from the advisor concerning collateral benefits it receives as a result of its
relationship with the funds. They concluded that the advisor's primary business
is managing mutual funds and it generally does not use the funds or shareholder
information to generate profits in other lines of business, and therefore does
not derive any significant collateral benefits from them. The Directors noted
that the advisor receives proprietary research from broker dealers that execute
fund portfolio transactions and concluded that this research is likely to
benefit fund shareholders. The Directors also determined that the advisor is
able to provide investment management services to certain clients other than the
funds, at least in part, due to its existing infrastructure built to serve the
fund complex. The Directors concluded, however, that the assets of those other
clients are not material to the analysis and, in any event, are included with
the assets of the funds to determine breakpoints in the funds' fee schedules,
provided they are managed using the same investment team and strategy.
CONCLUSIONS OF THE DIRECTORS
As a result of this process, the independent directors, in the absence of
particular circumstances and assisted by the advice of legal counsel that is
independent of the advisor, taking into account all of the factors discussed
above and the information provided by the advisor concluded that the investment
management agreement between each of Focused Growth, Heritage and Vista and the
advisor is fair and reasonable in light of the services provided and should be
renewed.
The independent directors of Growth negotiated changes to the breakpoint
schedule used to calculate Growth's management fee. These changes were proposed
by the Directors based on their review of the competitive changes in the mutual
fund marketplace and their review of financial information provided by the
advisor. The new schedule, effective August 1, 2006, contains lower management
fees at certain asset levels than under the existing structure. Following these
negotiations with the advisor, the independent directors concluded that the
investment management agreement between Growth and the advisor is fair and
reasonable in light of the services provided and should be renewed.
- ------
69
Share Class Information
Five classes of shares are authorized for sale by Growth and Vista: Investor
Class, Institutional Class, Advisor Class, C Class, and R Class. Focused Growth
offers the Investor Class. Four classes of shares are authorized for sale by
Heritage: Investor Class, Institutional Class, Advisor Class, and C Class. The
total expense ratio of Institutional Class shares is lower than that of Investor
Class shares. The total expense ratios of Advisor Class, C Class, and R Class
shares are higher than that of Investor Class shares.
INVESTOR CLASS shares are available for purchase in two ways: 1) directly from
American Century without any commissions or other fees; or 2) through certain
financial intermediaries (such as banks, broker-dealers, insurance companies and
investment advisors), which may require payment of a transaction fee to the
financial intermediary.
INSTITUTIONAL CLASS shares are available to large investors such as endowments,
foundations, and retirement plans, and to financial intermediaries serving these
investors. This class recognizes the relatively lower cost of serving
institutional customers and others who invest at least $5 million ($3 million
for endowments and foundations) in an American Century fund or at least $10
million in multiple funds. In recognition of the larger investments and account
balances and comparatively lower transaction costs, the unified management fee
of Institutional Class shares is 0.20% less than the unified management fee of
Investor Class shares.
ADVISOR CLASS shares are sold primarily through institutions such as investment
advisors, banks, broker-dealers, insurance companies, and financial advisors.
Advisor Class shares are subject to a 0.50% annual Rule 12b-1 distribution and
service fee. The total expense ratio of Advisor Class shares is 0.25% higher
than the total expense ratio of Investor Class shares.
C CLASS shares are sold primarily through employer sponsored retirement plans
and through institutions such as investment advisors, banks, broker-dealers, and
insurance companies. C Class shares redeemed within 12 months of purchase are
subject to a contingent deferred sales charge (CDSC) of 1.00%. There is no CDSC
on shares acquired through reinvestment of dividends or capital gains. The
unified management fee for C Class shares is the same as for Investor Class
shares. C Class shares also are subject to a Rule 12b-1 distribution and service
fee of 1.00%.
R CLASS shares are sold primarily through employer-sponsored retirement plans
and through institutions such as investment advisors, banks, broker-dealers, and
insurance companies. The unified management fee for R Class shares is the same
as for Investor Class shares. R Class shares are subject to a 0.50% annual Rule
12b-1 distribution and service fee.
All classes of shares represent a pro rata interest in the funds and generally
have the same rights and preferences.
- ------
70
Additional Information
RETIREMENT ACCOUNT INFORMATION
As required by law, any distributions you receive from an IRA or certain 403(b),
457 and qualified plans [those not eligible for rollover to an IRA or to another
qualified plan] are subject to federal income tax withholding, unless you elect
not to have withholding apply. Tax will be withheld on the total amount
withdrawn even though you may be receiving amounts that are not subject to
withholding, such as nondeductible contributions. In such case, excess amounts
of withholding could occur. You may adjust your withholding election so that a
greater or lesser amount will be withheld.
If you don't want us to withhold on this amount, you must notify us to not
withhold the federal income tax. Even if you plan to roll over the amount you
withdraw to another tax-deferred account, the withholding rate still applies to
the withdrawn amount unless we have received notice not to withhold federal
income tax prior to the withdrawal. You may notify us in writing or in certain
situations by telephone or through other electronic means. You have the right to
revoke your withholding election at any time and any election you make may
remain in effect until revoked by filing a new election.
Remember, even if you elect not to have income tax withheld, you are liable for
paying income tax on the taxable portion of your withdrawal. If you elect not to
have income tax withheld or you don't have enough income tax withheld, you may
be responsible for payment of estimated tax. You may incur penalties under the
estimated tax rules if your withholding and estimated tax payments are not
sufficient.
State tax will be withheld if, at the time of your distribution, your address is
within one of the mandatory withholding states and you have federal income tax
withheld. State taxes will be withheld from your distribution in accordance with
the respective state rules.
PROXY VOTING GUIDELINES
American Century Investment Management, Inc., the funds' investment advisor, is
responsible for exercising the voting rights associated with the securities
purchased and/or held by the funds. A description of the policies and procedures
the advisor uses in fulfilling this responsibility is available without charge,
upon request, by calling 1-800-345-2021. It is also available on American
Century's website at americancentury.com and on the Securities and Exchange
Commission's website at sec.gov. Information regarding how the investment
advisor voted proxies relating to portfolio securities during the most recent
12-month period ended June 30 is available on the "About Us" page at
americancentury.com. It is also available at sec.gov.
(continued)
- ------
71
Additional Information
QUARTERLY PORTFOLIO DISCLOSURE
The funds file their complete schedule of portfolio holdings with the Securities
and Exchange Commission (SEC) for the first and third quarters of each fiscal
year on Form N-Q. The funds' Forms N-Q are available on the SEC's website at
sec.gov, and may be reviewed and copied at the SEC's Public Reference Room in
Washington, DC. Information on the operation of the Public Reference Room may be
obtained by calling 1-800-SEC-0330. The funds also make their complete schedule
of portfolio holdings for the most recent quarter of their fiscal year available
on their website at americancentury.com and, upon request, by calling
1-800-345-2021.
- ------
72
Index Definitions
The following indices are used to illustrate investment market, sector, or style
performance or to serve as fund performance comparisons. They are not investment
products available for purchase.
The BLENDED INDEX is considered the benchmark for Focused Growth. It combines
two widely known indices, the S&P 500 Index and the Russell 1000 Growth Index,
which are both weighted at 50%.
The DOW JONES INDUSTRIAL AVERAGE (DJIA) is a price-weighted average of 30
actively traded blue chip stocks, primarily industrials but including
service-oriented firms. Prepared and published by Dow Jones & Co., it is the
oldest and most widely quoted of all the market indicators.
The NASDAQ COMPOSITE INDEX is a market value-weighted index of all domestic and
international common stocks listed on the Nasdaq stock market.
The RUSSELL 1000(reg.tm) INDEX is a market-capitalization weighted, large-cap
index created by Frank Russell Company to measure the performance of the 1,000
largest companies in the Russell 3000 Index (the 3,000 largest publicly traded
U.S. companies, based on total market capitalization).
The RUSSELL 1000(reg.tm) GROWTH INDEX measures the performance of those Russell
1000 Index companies (the 1,000 largest of the 3,000 largest publicly traded
U.S. companies, based on total market capitalization) with higher price-to-book
ratios and higher forecasted growth rates.
The RUSSELL 2000(reg.tm) INDEX is a market-capitalization weighted index created
by Frank Russell Company to measure the performance of the 2,000 smallest of the
3,000 largest publicly traded U.S. companies, based on total market
capitalization.
The RUSSELL MIDCAP(reg.tm) INDEX measures the performance of the 800 smallest of
the 1,000 largest publicly traded U.S. companies, based on total market
capitalization.
The RUSSELL MIDCAP(reg.tm) GROWTH INDEX measures the performance of those
Russell Midcap Index companies (the 800 smallest of the 1,000 largest publicly
traded U.S. companies, based on total market capitalization) with higher
price-to-book ratios and higher forecasted growth values.
The S&P 500 INDEX is a market value-weighted index of the stocks of 500 publicly
traded U.S. companies chosen for market size, liquidity, and industry group
representation that are considered to be leading firms in dominant industries.
Each stock's weight in the index is proportionate to its market value. Created
by Standard & Poor's, it is considered to be a broad measure of U.S. stock
market performance.
- ------
73
Notes
- ------
74
Notes
- ------
75
Notes
- ------
76
CONTACT US
AMERICANCENTURY.COM
AUTOMATED INFORMATION LINE:
1-800-345-8765
INVESTOR SERVICES REPRESENTATIVE:
1-800-345-2021 or 816-531-5575
BUSINESS, NOT-FOR-PROFIT,
EMPLOYER-SPONSORED RETIREMENT PLANS:
1-800-345-3533
BANKS AND TRUST COMPANIES, BROKER-DEALERS,
FINANCIAL PROFESSIONALS, INSURANCE COMPANIES:
1-800-345-6488
TELECOMMUNICATIONS DEVICE FOR THE DEAF:
1-800-634-4113 or 816-444-3485
AMERICAN CENTURY MUTUAL FUNDS, INC.
INVESTMENT ADVISOR:
American Century Investment Management, Inc.
Kansas City, Missouri
THIS REPORT AND THE STATEMENTS IT CONTAINS ARE SUBMITTED FOR THE GENERAL
INFORMATION OF OUR SHAREHOLDERS. THE REPORT IS NOT AUTHORIZED FOR DISTRIBUTION
TO PROSPECTIVE INVESTORS UNLESS PRECEDED OR ACCOMPANIED BY AN EFFECTIVE
PROSPECTUS.
American Century Investments PRSRT STD
P.O. Box 419200 U.S. POSTAGE PAID
Kansas City, MO 64141-6200 AMERICAN CENTURY
COMPANIES
The American Century Investments logo,
American Century and American Century
Investments are service marks of American Century Investment
American Century Proprietary Holdings, Inc. Services, Inc., Distributor
0612 (c)2006 American Century
SH-ANN-52278S Proprietary Holdings, Inc.
All rights reserved.
AMERICAN CENTURY INVESTMENTS
Annual Report
October 31, 2006
[photo of winter scene]
Giftrust(reg.tm) Fund
[american century investments logo and text logo]
Our Message to You
[photo of James E. Stowers III and James E. Stowers, Jr.]
/s/James E. Stowers, Jr.
James E. Stowers, Jr.
Founder
American Century Companies, Inc.
/s/James E. Stowers III
James E. Stowers III
Chairman of the Board
American Century Companies, Inc.
We are pleased to provide you with the annual report for the American Century
Giftrust Fund for the year ended October 31, 2006. We hope you find this
information helpful in monitoring your investment. Another useful resource we
offer is our website, americancentury.com, where we post quarterly portfolio
commentaries, the views of senior investment officers and analysts, and other
communications about investments, portfolio strategy, personal finance, and the
markets.
In its most recent rankings, Dalbar -- which issues customer satisfaction
ratings and rankings based on website functionality -- ranked
americancentury.com seventh out of the sites provided by the top 25 fund
companies that it believes lead the industry in web-based technology. Our
website earned an "Excellent" rating, Dalbar's highest designation.
For most of 2006, our website has linked visitors to information explaining our
strategic collaboration with Lance Armstrong and the Lance Armstrong Foundation
(LAF). This campaign, featuring Lance, is designed to encourage investors to
take a more active role in planning their financial futures and make every
investment decision count. To learn more about the collaboration and the LAF,
please visit americancentury.com or www.lanceface.com on the Web and click on
the links to related sites.
With the approach of year end and the 2006 tax season, you can also find out
more about December fund distributions and tax information via a link from our
website. We've posted December distribution estimates for over 50 funds, answers
to frequent distribution questions, and online descriptions of all of the tax
information we provide to investors.
If you haven't visited americancentury.com yet, we encourage you to do so...it's
there to serve you. And so are we. As always, we deeply appreciate your
commitment to American Century Investments.
Table of Contents
Market Perspective . . . . . . . . . . . . . . . . . . . . . . . . . . . . 2
One-Year Total Returns. . . . . . . . . . . . . . . . . . . . . . . . . 2
GIFTRUST
Performance. . . . . . . . . . . . . . . . . . . . . . . . . . . . . . . . 3
Portfolio Commentary . . . . . . . . . . . . . . . . . . . . . . . . . . . 5
Top Ten Holdings. . . . . . . . . . . . . . . . . . . . . . . . . . . . 5
Top Five Industries . . . . . . . . . . . . . . . . . . . . . . . . . . 6
Types of Investments in Portfolio . . . . . . . . . . . . . . . . . . . 6
Shareholder Fee Example. . . . . . . . . . . . . . . . . . . . . . . . . . 7
Schedule of Investments. . . . . . . . . . . . . . . . . . . . . . . . . . 9
FINANCIAL STATEMENTS
Statement of Assets and Liabilities. . . . . . . . . . . . . . . . . . . . 12
Statement of Operations. . . . . . . . . . . . . . . . . . . . . . . . . . 13
Statement of Changes in Net Assets . . . . . . . . . . . . . . . . . . . . 14
Notes to Financial Statements. . . . . . . . . . . . . . . . . . . . . . . 15
Financial Highlights . . . . . . . . . . . . . . . . . . . . . . . . . . . 19
Report of Independent Registered Public Accounting Firm. . . . . . . . . . 20
OTHER INFORMATION
Management . . . . . . . . . . . . . . . . . . . . . . . . . . . . . . . . 21
Approval of Management Agreement for Giftrust. . . . . . . . . . . . . . . 24
Additional Information . . . . . . . . . . . . . . . . . . . . . . . . . . 29
The opinions expressed in the Market Perspective and the Portfolio Commentary
reflect those of the portfolio management team as of the date of the report, and
do not necessarily represent the opinions of American Century or any other
person in the American Century organization. Any such opinions are subject to
change at any time based upon market or other conditions and American Century
disclaims any responsibility to update such opinions. These opinions may not be
relied upon as investment advice and, because investment decisions made by
American Century funds are based on numerous factors, may not be relied upon as
an indication of trading intent on behalf of any American Century fund. Security
examples are used for representational purposes only and are not intended as
recommendations to purchase or sell securities. Performance information for
comparative indices and securities is provided to American Century by third
party vendors. To the best of American Century's knowledge, such information is
accurate at the time of printing.
Market Perspective
[photo of Mark Mallon]
Market Perspective
BY MARK MALLON, CHIEF INVESTMENT OFFICER, AMERICAN CENTURY INVESTMENTS
ECONOMIC GROWTH SURGED, THEN MODERATED
Economic growth -- along with commodity prices, short-term interest rates, and
inflation -- surged early in the 12-month period ended October 31, 2006. But
growth and inflation moderated in the period's second half, which saw the
Federal Reserve end its two-year string of interest rate hikes.
After a hurricane-related slowdown in the fourth quarter of 2005, U.S. gross
domestic product grew in the first quarter of 2006 at a 5.6% annualized pace,
the highest level in more than two years. The Fed steadily raised short-term
interest rates through June to keep inflation in check, including pressures from
soaring commodity prices. The Fed finally snapped its string of rate hikes in
August 2006, leaving its target at 5.25%, a five-year high. By then, economic
growth had slowed, dragged down in part by a cooling housing market.
BEST FISCAL-YEAR STOCK RETURNS SINCE 2003
The Fed's pause and expectations for lower interest rates and mild inflation
going forward helped produce the best U.S. stock returns for a 12-month fiscal
period ended October 31 since 2003. Market rallies beginning and ending the
period offset a late-spring/early-summer selloff. Growth stocks flourished in
the latter rally, but value stocks outperformed growth for the full reporting
period. Likewise, though large-cap stocks gained ground late in the period,
small-caps posted higher returns for the entire 12-month stretch.
In the first half of the 12-month period, investors celebrated a dip in crude
oil prices and strong economic growth by pushing stock prices higher. The
small-cap Russell 2000 Index led the way, surging 18.91%. Sentiment changed in
early May, however, when the Fed made it clear that more interest rate hikes
might be necessary to control inflation. Between April 30 and July 15, the S&P
500 fell 5.28%, and the Russell 2000 more than doubled that loss as investors
desired larger, more stable companies.
The selloff ended in late July after Fed chairman Ben Bernanke predicted
inflation would moderate. The Fed's subsequent rate pause in August and plunging
energy prices allowed stocks to rebound nicely in the last three months of the
reporting period.
ONE-YEAR TOTAL RETURNS
AS OF OCTOBER 31, 2006
- --------------------------------------------------------------------------------
S&P 500 Index 16.34%
- --------------------------------------------------------------------------------
Dow Jones Industrial Average 18.47%
- --------------------------------------------------------------------------------
Nasdaq Composite Index 12.48%
- --------------------------------------------------------------------------------
- ------
2
Giftrust - Performance
TOTAL RETURNS AS OF OCTOBER 31, 2006
-----------------------------------
AVERAGE ANNUAL RETURNS
- --------------------------------------------------------------------------------
SINCE INCEPTION
1 YEAR 5 YEARS 10 YEARS INCEPTION DATE
- --------------------------------------------------------------------------------
GIFTRUST 16.49% 7.47%(1) 1.25%(1) 12.08%(1) 11/25/83
- --------------------------------------------------------------------------------
RUSSELL MIDCAP
GROWTH INDEX(2) 14.51% 10.62% 8.73% N/A(3) --
- --------------------------------------------------------------------------------
(1) Returns would have been lower if management fees had not been waived
from 2/1/04 to 7/31/04.
(2) Data provided by Lipper Inc. - A Reuters Company. (c) 2006 Reuters. All
rights reserved. Any copying, republication or redistribution of Lipper
content, including by caching, framing or similar means, is expressly
prohibited without the prior written consent of Lipper. Lipper shall not be
liable for any errors or delays in the content, or for any actions taken in
reliance thereon.
The data contained herein has been obtained from company reports, financial
reporting services, periodicals and other resources believed to be reliable.
Although carefully verified, data on compilations is not guaranteed by
Lipper and may be incomplete. No offer or solicitations to buy or sell any
of the securities herein is being made by Lipper.
(3) Benchmark began 12/31/85.
Data presented reflect past performance. Past performance is no guarantee of
future results. Current performance may be higher or lower than the performance
shown. Investment return and principal value will fluctuate, and redemption
value may be more or less than original cost. To obtain performance data current
to the most recent month end, please call 1-800-345-2021 or visit
americancentury.com.
Data assumes reinvestment of dividends and capital gains, and none of the charts
reflect the deduction of taxes that a shareholder would pay on fund
distributions or the redemption of fund shares. Returns for the index are
provided for comparison. The fund's total returns include operating expenses
(such as transaction costs and management fees) that reduce returns, while the
total returns of the index do not.
(continued)
- ------
3
Giftrust - Performance
GROWTH OF $10,000 OVER 10 YEARS
$10,000 investment made October 31, 1996
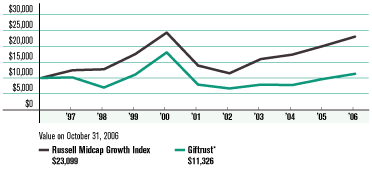
ONE-YEAR RETURNS OVER 10 YEARS
Periods ended October 31
- ---------------------------------------------------------------------------------------------------
1997 1998 1999 2000 2001 2002 2003 2004 2005 2006
- ---------------------------------------------------------------------------------------------------
Giftrust 1.95% -31.55% 59.05% 63.10% -56.36% -15.38% 18.18% -1.64%* 25.13% 16.49%
- ---------------------------------------------------------------------------------------------------
Russell Midcap
Growth Index 24.61% 2.43% 37.66% 38.67% -42.78% -17.61% 39.30% 8.77% 15.91% 14.51%
- ---------------------------------------------------------------------------------------------------
* Returns would have been lower, along with the ending value, if management fees
had not been waived from 2/1/04 to 7/31/04.
Data presented reflect past performance. Past performance is no guarantee of
future results. Current performance may be higher or lower than the performance
shown. Investment return and principal value will fluctuate, and redemption
value may be more or less than original cost. To obtain performance data current
to the most recent month end, please call 1-800-345-2021 or visit
americancentury.com.
Data assumes reinvestment of dividends and capital gains, and none of the charts
reflect the deduction of taxes that a shareholder would pay on fund
distributions or the redemption of fund shares. Returns for the index are
provided for comparison. The fund's total returns include operating expenses
(such as transaction costs and management fees) that reduce returns, while the
total returns of the index do not.
- ------
4
Giftrust - Portfolio Commentary
PORTFOLIO MANAGERS: KURT STALZER AND DAVID ROSE
PERFORMANCE SUMMARY
Giftrust gained 16.49% during the 12 months ended October 31, 2006, surpassing
the 14.51% return of its benchmark, the Russell Midcap Growth Index.
As outlined in the Market Perspective on page 2, a pause in Federal Reserve
interest rate hikes and expectations for lower interest rates and mild inflation
going forward helped produce U.S. stock index returns in the 10-25% range for
the 12-month period.
An overweight position in the wireless telecommunication industry and well-timed
sector position shifts in industrials and information technology helped the
portfolio outperform the Russell Midcap Growth Index. Relatively weaker returns
in the health care and financials sectors reduced relative performance.
INVESTMENT PROCESS PAID OFF
For the second straight fiscal year, we reaped our biggest relative and absolute
gains from an overweight stake in the wireless telecommunications industry. The
portfolio's investments in that industry, centered on two cellular providers in
the Latin American market, composed a significant share of the portfolio's total
return in the 12-month period.
Meanwhile, our focus on companies with accelerating financial growth and share
price momentum helped us adjust our weighting of two key at opportune times. We
raised our stake in the industrials sector in the first half of the period, when
rising commodity prices and capital investment boosted stocks in that sector.
Later, in accordance with our investment process, we reduced our industrials
exposure in the second half of the period, when the sector lost steam as the
economy slowed.
Likewise, we reduced our stake in information technology early in the reporting
period, when the sector was out of favor. But as growth and technology shares
gained favor late in the period, we increased our exposure to the sector. For
the full 12-month period, our underweight position in technology benefited the
portfolio.
WIRELESS STOCKS LED PERFORMANCE
The portfolio's five biggest overweight stocks also ranked as its top five
contributors. Two cellular providers in the
TOP TEN HOLDINGS
AS OF OCTOBER 31, 2006
- --------------------------------------------------------------------------------
% OF % OF
NET ASSETS NET ASSETS
AS OF AS OF
10/31/06 4/30/06
- --------------------------------------------------------------------------------
NII Holdings, Inc. Cl B 10.5% 6.7%
- --------------------------------------------------------------------------------
Precision Castparts Corp. 5.7% 3.9%
- --------------------------------------------------------------------------------
Alliance Data
Systems Corp. 4.9% 3.1%
- --------------------------------------------------------------------------------
America Movil SA de CV
Series L ADR 4.6% 3.3%
- --------------------------------------------------------------------------------
Aker Kvaerner ASA ORD 4.4% 2.9%
- --------------------------------------------------------------------------------
Las Vegas Sands Corp. 3.8% 2.1%
- --------------------------------------------------------------------------------
National Oilwell
Varco, Inc. 3.4% 0.8%
- --------------------------------------------------------------------------------
Hologic, Inc. 3.0% 0.5%
- --------------------------------------------------------------------------------
Caremark Rx Inc. 3.0% --
- --------------------------------------------------------------------------------
BE Aerospace, Inc. 2.8% 0.8%
- --------------------------------------------------------------------------------
(continued)
- ------
5
Giftrust - Portfolio Commentary
Latin American Market, NII Holdings and America Movil SA de CV, accounted for a
combined 11% of the portfolio's average weight in the 12-month period and
represented the largest and third-largest overweight individual positions,
respectively. They also finished first and second on the portfolio's list of top
contributors, with NII's shares gaining 57% and America Movil's rising 68%.
In addition to the cellular investments, top contributors included a stake in
Aker Kvaerner ASA, a Norway-based maker of processing equipment for oil and gas
companies. Precision Castparts, a manufacturer of metal components for aerospace
and industrial applications, was another top contributor. Precision benefited
from a rebound in aircraft industry orders.
HEALTH CARE INFECTED RETURNS
Five of the portfolio's 10 worst relative performers resided in the health care
sector, where we maintained a detrimental overweight position. Prescription
manager Caremark and managed care provider Aetna topped the list of the sector's
leading detractors. Shares in both declined as the entire health care services
industry battled concerns about tightening profit margins and slowing increases
in managed care premiums.
An underweight stake in financials, combined with weak security selection in
that sector, also reduced relative returns. Most of the sector benefited from
relatively stable long-term interest rates, expectations of declining short-term
interest rates sometime in 2007, and sound market returns that bolstered
interest in capital markets.
PORTFOLIO OBJECTIVE & EXPECTATIONS
Giftrust is an irrevocable trust designed to be given as a gift to those seeking
long-term growth who can tolerate high share price fluctuation; it must be held
for at least 18 years. Our process focuses on medium-sized and smaller companies
with accelerating earnings growth rates and share price momentum. We believe
that active investing in such companies will generate outperformance over time
compared with the Russell Midcap Growth Index.
TOP FIVE INDUSTRIES
AS OF OCTOBER 31, 2006
- --------------------------------------------------------------------------------
% OF % OF
NET ASSETS NET ASSETS
AS OF AS OF
10/31/06 4/30/06
- --------------------------------------------------------------------------------
Wireless Telecommunication
Services 17.4% 9.9%
- --------------------------------------------------------------------------------
Energy Equipment
& Services 9.5% 13.9%
- --------------------------------------------------------------------------------
Aerospace & Defense 8.9% 6.4%
- --------------------------------------------------------------------------------
Hotels, Restuarants
& Leisure 5.3% 7.9%
- --------------------------------------------------------------------------------
Health Care Equipment
& Supplies 5.1% 0.7%
- --------------------------------------------------------------------------------
TYPES OF INVESTMENTS IN PORTFOLIO
- --------------------------------------------------------------------------------
% OF % OF
NET ASSETS NET ASSETS
AS OF AS OF
10/31/06 4/30/06
- --------------------------------------------------------------------------------
Domestic Common Stocks 79.4% 80.4%
- --------------------------------------------------------------------------------
Foreign Common Stocks* 20.3% 19.5%
- --------------------------------------------------------------------------------
TOTAL COMMON STOCKS 99.7% 99.9%
- --------------------------------------------------------------------------------
Temporary Cash Investments 0.7% 0.7%
- --------------------------------------------------------------------------------
Other Assets and Liabilities (0.4)% (0.6)%
- --------------------------------------------------------------------------------
* Includes depositary shares, dual listed securities and foreign
ordinary shares.
- ------
6
Shareholder Fee Example (Unaudited)
Fund shareholders may incur two types of costs: (1) transaction costs, including
sales charges (loads) on purchase payments and redemption/exchange fees; and (2)
ongoing costs, including management fees; distribution and service (12b-1) fees;
and other fund expenses. This example is intended to help you understand your
ongoing costs (in dollars) of investing in your fund and to compare these costs
with the ongoing cost of investing in other mutual funds.
The example is based on an investment of $1,000 made at the beginning of the
period and held for the entire period from May 1, 2006 to October 31, 2006.
ACTUAL EXPENSES
The table provides information about actual account values and actual expenses
for each class. You may use the information, together with the amount you
invested, to estimate the expenses that you paid over the period. First,
identify the share class you own. Then simply divide your account value by
$1,000 (for example, an $8,600 account value divided by $1,000 = 8.6), then
multiply the result by the number under the heading "Expenses Paid During
Period" to estimate the expenses you paid on your account during this period.
If you hold Investor Class shares of any American Century fund, or Institutional
Class shares of the American Century Diversified Bond Fund, in an American
Century account (i.e., not a financial intermediary or retirement plan account),
American Century may charge you a $12.50 semiannual account maintenance fee if
the value of those shares is less than $10,000. We will redeem shares
automatically in one of your accounts to pay the $12.50 fee. In determining your
total eligible investment amount, we will include your investments in all
PERSONAL ACCOUNTS (including American Century Brokerage accounts) registered
under your Social Security number. PERSONAL ACCOUNTS include individual
accounts, joint accounts, UGMA/UTMA accounts, personal trusts, Coverdell
Education Savings Accounts and IRAs (including traditional, Roth, Rollover,
SEP-, SARSEP- and SIMPLE-IRAs), and certain other retirement accounts. If you
have only business, business retirement, employer-sponsored or American Century
Brokerage accounts, you are currently not subject to this fee. We will not
charge the fee as long as you choose to manage your accounts exclusively online.
If you are subject to the Account Maintenance Fee, your account value could be
reduced by the fee amount.
HYPOTHETICAL EXAMPLE FOR COMPARISON PURPOSES
The table also provides information about hypothetical account values and
hypothetical expenses based on the actual expense ratio of each class of your
fund and an assumed rate of return of 5% per year before expenses, which is not
the actual return of a fund's share class. The hypothetical account values and
expenses may not be used to estimate the actual ending account balance or
expenses you paid for the period. You may use this information to compare the
ongoing costs of investing in your fund and other funds. To do so, compare this
5% hypothetical
(continued)
- ------
7
Shareholder Fee Example (Unaudited)
example with the 5% hypothetical examples that appear in the shareholder reports
of the other funds.
Please note that the expenses shown in the table are meant to highlight your
ongoing costs only and do not reflect any transactional costs, such as sales
charges (loads) or redemption/exchange fees. Therefore, the table is useful in
comparing ongoing costs only, and will not help you determine the relative total
costs of owning different funds. In addition, if these transactional costs were
included, your costs would have been higher.
- -----------------------------------------------------------------------------------------
EXPENSES PAID
BEGINNING ENDING DURING PERIOD* ANNUALIZED
ACCOUNT VALUE ACCOUNT VALUE 5/1/06 - EXPENSE
5/1/06 10/31/06 10/31/06 RATIO*
- -----------------------------------------------------------------------------------------
GIFTRUST SHAREHOLDER FEE EXAMPLE
- -----------------------------------------------------------------------------------------
Actual $1,000 $938.50 $4.89 1.00%
- -----------------------------------------------------------------------------------------
Hypothetical $1,000 $1,020.16 $5.09 1.00%
- -----------------------------------------------------------------------------------------
* Expenses are equal to the fund's annualized expense ratio listed in the table
above, multiplied by the average account value over the period, multiplied by
184, the number of days in the most recent fiscal half-year, divided by 365,
to reflect the one-half year period.
- ------
8
Giftrust - Schedule of Investments
OCTOBER 31, 2006
Shares ($ IN THOUSANDS) Value
- --------------------------------------------------------------------------------
COMMON STOCKS -- 99.7%
AEROSPACE & DEFENSE -- 8.9%
- --------------------------------------------------------------------------------
1,079,393 BE Aerospace, Inc.(1) $ 27,287
- --------------------------------------------------------------------------------
62,200 Boeing Co. 4,967
- --------------------------------------------------------------------------------
819,200 Precision Castparts Corp. 55,755
- --------------------------------------------------------------------------------
88,009
- --------------------------------------------------------------------------------
AIR FREIGHT & LOGISTICS -- 0.2%
- --------------------------------------------------------------------------------
61,697 UTI Worldwide Inc. 1,595
- --------------------------------------------------------------------------------
BEVERAGES -- 0.2%
- --------------------------------------------------------------------------------
118,900 C&C Group plc ORD 1,977
- --------------------------------------------------------------------------------
BIOTECHNOLOGY -- 4.0%
- --------------------------------------------------------------------------------
202,799 CSL Ltd. ORD 8,812
- --------------------------------------------------------------------------------
118,000 Digene Corp.(1) 5,479
- --------------------------------------------------------------------------------
362,700 Gilead Sciences, Inc.(1) 24,989
- --------------------------------------------------------------------------------
39,280
- --------------------------------------------------------------------------------
CHEMICALS -- 1.8%
- --------------------------------------------------------------------------------
401,688 Monsanto Co. 17,763
- --------------------------------------------------------------------------------
COMMERCIAL SERVICES & SUPPLIES -- 1.3%
- --------------------------------------------------------------------------------
268,780 Corrections Corp. of America(1) 12,281
- --------------------------------------------------------------------------------
COMMUNICATIONS EQUIPMENT -- 0.8%
- --------------------------------------------------------------------------------
62,700 Research In Motion Ltd.(1) 7,366
- --------------------------------------------------------------------------------
COMPUTERS & PERIPHERALS -- 2.0%
- --------------------------------------------------------------------------------
246,430 Apple Computer, Inc.(1) 19,981
- --------------------------------------------------------------------------------
CONSTRUCTION & ENGINEERING -- 1.8%
- --------------------------------------------------------------------------------
392,501 Foster Wheeler Ltd.(1) 17,643
- --------------------------------------------------------------------------------
ELECTRONIC EQUIPMENT & INSTRUMENTS -- 1.5%
- --------------------------------------------------------------------------------
449,568 Daktronics Inc. 10,659
- --------------------------------------------------------------------------------
124,000 FLIR Systems, Inc.(1) 3,961
- --------------------------------------------------------------------------------
14,620
- --------------------------------------------------------------------------------
ENERGY EQUIPMENT & SERVICES -- 9.5%
- --------------------------------------------------------------------------------
176,300 Acergy SA ORD(1) 3,190
- --------------------------------------------------------------------------------
415,820 Aker Kvaerner ASA ORD 43,262
- --------------------------------------------------------------------------------
95,745 Cameron International Corp.(1) 4,797
- --------------------------------------------------------------------------------
556,696 National Oilwell Varco, Inc.(1) 33,624
- --------------------------------------------------------------------------------
95,400 Noble Corp. 6,688
- --------------------------------------------------------------------------------
54,800 Oceaneering International, Inc.(1) 1,972
- --------------------------------------------------------------------------------
93,533
- --------------------------------------------------------------------------------
FOOD & STAPLES RETAILING -- 2.4%
- --------------------------------------------------------------------------------
529,469 CVS Corp. 16,615
- ---------------------------------------------------------------------------------
251,821 Great Atlantic & Pacific Tea Co.(1) 6,968
- ---------------------------------------------------------------------------------
23,583
- ---------------------------------------------------------------------------------
Shares ($ IN THOUSANDS) Value
- --------------------------------------------------------------------------------
FOOD PRODUCTS -- 0.5%
- --------------------------------------------------------------------------------
125,200 Archer-Daniels-Midland Co. $ 4,820
- --------------------------------------------------------------------------------
HEALTH CARE EQUIPMENT & SUPPLIES -- 5.1%
- --------------------------------------------------------------------------------
166,672 Conceptus Inc.(1) 3,303
- --------------------------------------------------------------------------------
623,552 Hologic, Inc.(1) 30,025
- --------------------------------------------------------------------------------
131,769 Inverness Medical
Innovations, Inc.(1) 4,966
- --------------------------------------------------------------------------------
190,300 Mentor Corp. 8,906
- --------------------------------------------------------------------------------
74,600 West Pharmaceutical
Services Inc. 3,136
- --------------------------------------------------------------------------------
50,336
- --------------------------------------------------------------------------------
HEALTH CARE PROVIDERS & SERVICES -- 4.9%
- --------------------------------------------------------------------------------
214,600 AMN Healthcare Services, Inc.(1) 5,427
- --------------------------------------------------------------------------------
599,600 Caremark Rx Inc. 29,519
- --------------------------------------------------------------------------------
34,900 Healthways, Inc.(1) 1,478
- --------------------------------------------------------------------------------
238,098 Quest Diagnostics Inc. 11,843
- --------------------------------------------------------------------------------
48,267
- --------------------------------------------------------------------------------
HOTELS, RESTAURANTS & LEISURE -- 5.3%
- --------------------------------------------------------------------------------
79,900 Harrah's Entertainment, Inc. 5,939
- --------------------------------------------------------------------------------
131,000 InterContinental Hotels
Group plc ORD 2,521
- --------------------------------------------------------------------------------
158,300 International Game Technology 6,729
- --------------------------------------------------------------------------------
488,550 Las Vegas Sands Corp.(1) 37,228
- --------------------------------------------------------------------------------
52,417
- --------------------------------------------------------------------------------
HOUSEHOLD DURABLES -- 0.2%
- --------------------------------------------------------------------------------
420,048 Consorcio ARA SA de CV ORD 2,381
- --------------------------------------------------------------------------------
INDUSTRIAL CONGLOMERATES -- 2.2%
- --------------------------------------------------------------------------------
487,695 McDermott International, Inc.(1) 21,800
- --------------------------------------------------------------------------------
INSURANCE -- 3.9%
- --------------------------------------------------------------------------------
63,800 CNA Financial Corp.(1) 2,389
- --------------------------------------------------------------------------------
29,000 Everest Re Group, Ltd. 2,876
- --------------------------------------------------------------------------------
225,600 HCC Insurance Holdings, Inc. 7,594
- --------------------------------------------------------------------------------
659,209 Loews Corp. 25,657
- --------------------------------------------------------------------------------
38,516
- --------------------------------------------------------------------------------
INTERNET & CATALOG RETAIL -- 0.7%
- --------------------------------------------------------------------------------
181,608 Priceline.com Inc.(1) 7,317
- --------------------------------------------------------------------------------
INTERNET SOFTWARE & SERVICES -- 2.2%
- --------------------------------------------------------------------------------
262,419 Digital River Inc.(1) 15,181
- --------------------------------------------------------------------------------
336,280 ValueClick Inc.(1) 6,322
- --------------------------------------------------------------------------------
21,503
- --------------------------------------------------------------------------------
IT SERVICES -- 4.9%
- --------------------------------------------------------------------------------
793,282 Alliance Data Systems Corp.(1) 48,168
- --------------------------------------------------------------------------------
See Notes to Financial Statements. (continued)
- ------
9
Giftrust - Schedule of Investments
OCTOBER 31, 2006
Shares ($ IN THOUSANDS) Value
- --------------------------------------------------------------------------------
LIFE SCIENCES TOOLS & SERVICES -- 4.9%
- --------------------------------------------------------------------------------
297,680 Covance Inc.(1) $ 17,414
- -------------------------------------------------------------------------------
224,374 ICON plc ADR(1) 8,051
- -------------------------------------------------------------------------------
712,406 Pharmaceutical Product
Development, Inc. 22,547
- -------------------------------------------------------------------------------
48,012
- -------------------------------------------------------------------------------
MEDIA -- 1.0%
- --------------------------------------------------------------------------------
193,635 Focus Media Holding Ltd. ADR(1) 10,241
- --------------------------------------------------------------------------------
METALS & MINING -- 1.5%
- --------------------------------------------------------------------------------
80,525 Allegheny Technologies Inc. 6,340
- -------------------------------------------------------------------------------
79,500 RTI International Metals, Inc.(1) 4,875
- -------------------------------------------------------------------------------
108,006 Titanium Metals Corp.(1) 3,184
- -------------------------------------------------------------------------------
14,399
- -------------------------------------------------------------------------------
MULTI-UTILITIES -- 0.8%
- --------------------------------------------------------------------------------
148,700 Sempra Energy 7,887
- --------------------------------------------------------------------------------
MULTILINE RETAIL -- 1.8%
- --------------------------------------------------------------------------------
251,828 Kohl's Corp.(1) 17,779
- --------------------------------------------------------------------------------
PERSONAL PRODUCTS -- 0.6%
- --------------------------------------------------------------------------------
176,323 Bare Escentuals Inc.(1) 5,401
- --------------------------------------------------------------------------------
PHARMACEUTICALS -- 2.5%
- --------------------------------------------------------------------------------
102,893 Forest Laboratories, Inc.(1) 5,036
- -------------------------------------------------------------------------------
41,100 Medicis Pharmaceutical
Corp. Cl A 1,440
- -------------------------------------------------------------------------------
173,900 Shire plc ADR 9,538
- -------------------------------------------------------------------------------
493,600 Shire plc ORD 9,006
- -------------------------------------------------------------------------------
25,020
- -------------------------------------------------------------------------------
SOFTWARE -- 2.9%
- --------------------------------------------------------------------------------
87,996 Micros Systems, Inc.(1) 4,372
- --------------------------------------------------------------------------------
106,100 Nintendo Co., Ltd. ORD 21,706
- --------------------------------------------------------------------------------
123,400 Parametric Technology Corp.(1) 2,411
- --------------------------------------------------------------------------------
28,489
- --------------------------------------------------------------------------------
Shares ($ IN THOUSANDS) Value
- --------------------------------------------------------------------------------
SPECIALTY RETAIL -- 2.0%
- --------------------------------------------------------------------------------
282,200 GameStop Corp. Cl A(1) $ 14,409
- --------------------------------------------------------------------------------
184,200 Rent-A-Center Inc.(1) 5,298
- --------------------------------------------------------------------------------
19,707
- --------------------------------------------------------------------------------
WIRELESS TELECOMMUNICATION SERVICES -- 17.4%
- --------------------------------------------------------------------------------
1,064,875 America Movil
SA de CV Series L ADR 45,651
- --------------------------------------------------------------------------------
383,816 Millicom International
Cellular SA(1) 19,145
- --------------------------------------------------------------------------------
1,591,307 NII Holdings, Inc. Cl B(1) 103,482
- --------------------------------------------------------------------------------
45,300 Rogers Communications Inc.
Cl B ORD 2,713
- --------------------------------------------------------------------------------
170,991
- --------------------------------------------------------------------------------
TOTAL COMMON STOCKS
(Cost $817,158) 981,082
- --------------------------------------------------------------------------------
TEMPORARY CASH INVESTMENTS -- 0.7%
- --------------------------------------------------------------------------------
Repurchase Agreement, Bank of America
Securities, LLC, (collateralized by various
U.S. Treasury obligations, 4.875%, 10/31/08,
valued at $7,452), in a joint trading account
at 5.24%, dated 10/31/06, due 11/1/06
(Delivery Value $7,301)
(Cost $7,300) 7,300
- --------------------------------------------------------------------------------
TOTAL INVESTMENT SECURITIES -- 100.4%
(Cost $824,458) 988,382
- --------------------------------------------------------------------------------
OTHER ASSETS AND LIABILITIES -- (0.4)% (3,803)
- --------------------------------------------------------------------------------
TOTAL NET ASSETS -- 100.0% $984,579
================================================================================
See Notes to Financial Statements. (continued)
- ------
10
Giftrust - Schedule of Investments
OCTOBER 31, 2006
FORWARD FOREIGN CURRENCY EXCHANGE CONTRACTS
($ IN THOUSANDS)
Settlement Unrealized
Contracts to Sell Date Value Gain (Loss)
- --------------------------------------------------------------------------------
7,179,084 AUD for USD 11/30/06 $5,557 $(42)
- --------------------------------------------------------------------------------
706,443 Euro for USD 11/30/06 904 (2)
- --------------------------------------------------------------------------------
3,602,214 GBP for USD 11/30/06 6,873 (36)
- --------------------------------------------------------------------------------
1,540,572,000 JPY for USD 11/30/06 13,230 (71)
- --------------------------------------------------------------------------------
59,147,258 MXN for USD 11/30/06 5,484 35
- --------------------------------------------------------------------------------
162,661,335 NOK for USD 11/30/06 24,928 (9)
- --------------------------------------------------------------------------------
$56,976 $(125)
==================================
(Value on Settlement Date $56,851)
NOTES TO SCHEDULE OF INVESTMENTS
ADR = American Depositary Receipt
AUD = Australian Dollar
BP = British Pound
JPY = Japanese Yen
MXN = Mexican Nuevo Peso
NOK = Norwegian Krona
ORD = Foreign Ordinary Share
USD = United States Dollar
(1) Non-income producing.
See Notes to Financial Statements.
- ------
11
Statement of Assets and Liabilities
OCTOBER 31, 2006 (AMOUNTS IN THOUSANDS EXCEPT PER-SHARE AMOUNTS)
- --------------------------------------------------------------------------------
ASSETS
- --------------------------------------------------------------------------------
Investment securities, at value (cost of $824,458) $988,382
- ----------------------------------------------------------
Receivable for investments sold 23,406
- ----------------------------------------------------------
Receivable for forward foreign currency exchange contracts 35
- ----------------------------------------------------------
Dividends and interest receivable 68
- --------------------------------------------------------------------------------
1,011,891
- --------------------------------------------------------------------------------
LIABILITIES
- --------------------------------------------------------------------------------
Disbursements in excess of demand deposit cash 277
- ----------------------------------------------------------
Payable for investments purchased 26,049
- ----------------------------------------------------------
Payable for forward foreign currency exchange contracts 160
- ----------------------------------------------------------
Accrued management fees 826
- --------------------------------------------------------------------------------
27,312
- --------------------------------------------------------------------------------
NET ASSETS $984,579
================================================================================
CAPITAL SHARES, $0.01 PAR VALUE
- --------------------------------------------------------------------------------
Authorized 200,000
================================================================================
Outstanding 48,901
================================================================================
NET ASSET VALUE PER SHARE $20.13
================================================================================
NET ASSETS CONSIST OF:
- --------------------------------------------------------------------------------
Capital (par value and paid-in surplus) $1,083,114
- ----------------------------------------------------------
Undistributed net investment income 120
- ----------------------------------------------------------
Accumulated net realized loss on investment
and foreign currency transactions (262,453)
- ----------------------------------------------------------
Net unrealized appreciation on investments
and translation of assets and
liabilities in foreign currencies 163,798
- --------------------------------------------------------------------------------
$984,579
================================================================================
See Notes to Financial Statements.
- ------
12
Statement of Operations
YEAR ENDED OCTOBER 31, 2006 (AMOUNTS IN THOUSANDS)
- --------------------------------------------------------------------------------
INVESTMENT INCOME (LOSS)
- --------------------------------------------------------------------------------
INCOME:
- -----------------------------------------------------------
Dividends (net of foreign taxes withheld of $83) $7,341
- -----------------------------------------------------------
Interest 473
- -----------------------------------------------------------
Securities lending 71
- --------------------------------------------------------------------------------
7,885
- --------------------------------------------------------------------------------
EXPENSES:
- -----------------------------------------------------------
Management fees 10,066
- -----------------------------------------------------------
Directors' fees and expenses 15
- -----------------------------------------------------------
Other expenses 16
- --------------------------------------------------------------------------------
10,097
- --------------------------------------------------------------------------------
NET INVESTMENT INCOME (LOSS) (2,212)
- --------------------------------------------------------------------------------
REALIZED AND UNREALIZED GAIN (LOSS)
- --------------------------------------------------------------------------------
Net realized gain (loss) on investment
and foreign currency transactions 151,426
- -----------------------------------------------------------
Change in net unrealized appreciation (depreciation)
on investments and translation of assets and
liabilities in foreign currencies 1,285
- --------------------------------------------------------------------------------
NET REALIZED AND UNREALIZED GAIN (LOSS) 152,711
- --------------------------------------------------------------------------------
NET INCREASE (DECREASE) IN NET ASSETS RESULTING FROM OPERATIONS $150,499
================================================================================
See Notes to Financial Statements.
- ------
13
Statement of Changes in Net Assets
YEARS ENDED OCTOBER 31, 2006 AND OCTOBER 31, 2005 (AMOUNTS IN THOUSANDS)
- --------------------------------------------------------------------------------
INCREASE (DECREASE) IN NET ASSETS 2006 2005
- --------------------------------------------------------------------------------
OPERATIONS
- -----------------------------------------------------
Net investment income (loss) $(2,212) $(4,249)
- -----------------------------------------------------
Net realized gain (loss) 151,426 149,744
- -----------------------------------------------------
Change in net unrealized appreciation (depreciation) 1,285 58,896
- --------------------------------------------------------------------------------
Net increase (decrease) in net assets
resulting from operations 150,499 204,391
- --------------------------------------------------------------------------------
CAPITAL SHARE TRANSACTIONS
- --------------------------------------------------------------------------------
Proceeds from shares sold 11,179 11,226
- -----------------------------------------------------
Payments for shares redeemed (104,138) (153,289)
- --------------------------------------------------------------------------------
Net increase (decrease) in net assets
from capital share transactions (92,959) (142,063)
- --------------------------------------------------------------------------------
NET INCREASE (DECREASE) IN NET ASSETS 57,540 62,328
================================================================================
NET ASSETS
- --------------------------------------------------------------------------------
Beginning of period 927,039 864,711
- --------------------------------------------------------------------------------
End of period $984,579 $927,039
================================================================================
Undistributed net investment income $120 --
================================================================================
TRANSACTIONS IN SHARES OF THE FUND
- --------------------------------------------------------------------------------
Sold 571 720
- -----------------------------------------------------
Redeemed (5,308) (9,693)
- --------------------------------------------------------------------------------
Net increase (decrease) in shares of the fund (4,737) (8,973)
================================================================================
See Notes to Financial Statements.
- ------
14
Notes to Financial Statements
OCTOBER 31, 2006 (AMOUNTS IN THOUSANDS)
1. ORGANIZATION AND SUMMARY OF SIGNIFICANT ACCOUNTING POLICIES
ORGANIZATION -- American Century Mutual Funds, Inc. (the corporation) is
registered under the Investment Company Act of 1940 (the 1940 Act) as an
open-end management investment company. Giftrust Fund (the fund) is one fund in
a series issued by the corporation. The fund is diversified under the 1940 Act.
The fund's investment objective is to seek long-term capital growth. The fund
pursues its objective by investing primarily in equity securities of medium- and
small-sized companies. The following is a summary of the fund's significant
accounting policies.
SECURITY VALUATIONS -- Securities traded primarily on a principal securities
exchange are valued at the last reported sales price, or at the mean of the
latest bid and asked prices where no last sales price is available. Depending on
local convention or regulation, securities traded over-the-counter are valued at
the mean of the latest bid and asked prices, the last sales price, or the
official close price. Debt securities not traded on a principal securities
exchange are valued through a commercial pricing service or at the mean of the
most recent bid and asked prices. Discount notes may be valued through a
commercial pricing service or at amortized cost, which approximates fair value.
Securities traded on foreign securities exchanges and over-the-counter markets
are normally completed before the close of business on days that the New York
Stock Exchange (the Exchange) is open and may also take place on days when the
Exchange is not open. If an event occurs after the value of a security was
established but before the net asset value per share was determined that was
likely to materially change the net asset value, that security would be valued
at fair value as determined in accordance with procedures adopted by the Board
of Directors. If the fund determines that the market price of a portfolio
security is not readily available, or that the valuation methods mentioned above
do not reflect the security's fair value, such security is valued at its fair
value as determined by, or in accordance with procedures adopted by, the Board
of Directors or its designee if such fair value determination would materially
impact a fund's net asset value. Certain other circumstances may cause the fund
to fair value a security such as: a security has been declared in default;
trading in a security has been halted during the trading day; or there is a
foreign market holiday and no trading will commence.
SECURITY TRANSACTIONS -- Security transactions are accounted for as of the trade
date. Net realized gains and losses are determined on the identified cost basis,
which is also used for federal income tax purposes.
INVESTMENT INCOME -- Dividend income less foreign taxes withheld, if any, is
recorded as of the ex-dividend date. Interest income is recorded on the accrual
basis and includes accretion of discounts and amortization of premiums.
SECURITIES ON LOAN -- The fund may lend portfolio securities through its lending
agent to certain approved borrowers in order to earn additional income. The fund
continues to recognize any gain or loss in the market price of the securities
loaned and records any interest earned or dividends declared.
FOREIGN CURRENCY TRANSACTIONS -- All assets and liabilities initially expressed
in foreign currencies are translated into U.S. dollars at prevailing exchange
rates at period end. Purchases and sales of investment securities, dividend and
interest income, and certain expenses are translated at the rates of exchange
prevailing on the respective dates of such transactions. For assets and
liabilities, other than investments in securities, net realized and unrealized
gains and losses from foreign currency translations arise from changes in
currency exchange rates.
Net realized and unrealized foreign currency exchange gains or losses occurring
during the holding period of investment securities are a component of realized
gain (loss) on investment transactions and unrealized appreciation
(depreciation) on investments, respectively. Certain countries may impose taxes
on the contract amount of purchases and sales of foreign currency contracts in
their currency. The fund records the foreign tax expense, if any, as a reduction
to the net realized gain (loss) on foreign currency transactions.
FORWARD FOREIGN CURRENCY EXCHANGE CONTRACTS -- The fund may enter into forward
foreign currency exchange contracts to facilitate transactions of securities
denominated in a foreign currency or to hedge the fund's exposure to foreign
currency exchange rate fluctuations. The net U.S. dollar value of foreign
currency underlying all contractual commitments held by the fund and the
resulting unrealized appreciation or depreciation are determined daily using
prevailing exchange rates. The fund bears the risk of an unfavorable change in
the foreign currency exchange rate underlying the forward contract.
Additionally, losses may arise if the counterparties do not perform under the
contract terms.
REPURCHASE AGREEMENTS -- The fund may enter into repurchase agreements with
institutions that American Century Investment Management, Inc. (ACIM) (the
investment advisor) has determined are creditworthy pursuant to criteria adopted
by
(continued)
- ------
15
Notes to Financial Statements
OCTOBER 31, 2006 (AMOUNTS IN THOUSANDS)
1. ORGANIZATION AND SUMMARY OF SIGNIFICANT ACCOUNTING POLICIES (CONTINUED)
the Board of Directors. Each repurchase agreement is recorded at cost. The fund
requires that the collateral, represented by securities, received in a
repurchase transaction be transferred to the custodian in a manner sufficient to
enable the fund to obtain those securities in the event of a default under the
repurchase agreement. ACIM monitors, on a daily basis, the securities
transferred to ensure the value, including accrued interest, of the securities
under each repurchase agreement is equal to or greater than amounts owed to the
fund under each repurchase agreement.
JOINT TRADING ACCOUNT -- Pursuant to an Exemptive Order issued by the Securities
and Exchange Commission, the fund, along with other registered investment
companies having management agreements with ACIM or American Century Global
Investment Management, Inc. (ACGIM), may transfer uninvested cash balances into
a joint trading account. These balances are invested in one or more repurchase
agreements that are collateralized by U.S. Treasury or Agency obligations.
INCOME TAX STATUS -- It is the fund's policy to distribute substantially all net
investment income and net realized gains to shareholders and to otherwise
qualify as a regulated investment company under provisions of the Internal
Revenue Code. Accordingly, no provision has been made for federal or state
income taxes.
DISTRIBUTIONS TO SHAREHOLDERS -- Distributions to shareholders are recorded on
the ex-dividend date. Distributions from net investment income and net realized
gains, if any, are generally declared and paid annually.
INDEMNIFICATIONS -- Under the corporation's organizational documents, its
officers and directors are indemnified against certain liabilities arising out
of the performance of their duties to the fund. In addition, in the normal
course of business, the fund enters into contracts that provide general
indemnifications. The fund's maximum exposure under these arrangements is
unknown as this would involve future claims that may be made against the fund.
The risk of material loss from such claims is considered by management to be
remote.
USE OF ESTIMATES -- The financial statements are prepared in conformity with
accounting principles generally accepted in the United States of America, which
may require management to make certain estimates and assumptions at the date of
the financial statements. Actual results could differ from these estimates.
2. FEES AND TRANSACTIONS WITH RELATED PARTIES
MANAGEMENT FEES -- The corporation has entered into a Management Agreement with
ACIM, under which ACIM provides the fund with investment advisory and management
services in exchange for a single, unified management fee (the fee). The
Agreement provides that all expenses of the fund, except brokerage commissions,
taxes, interest, fees and expenses of those directors who are not considered
"interested persons" as defined in the 1940 Act (including counsel fees) and
extraordinary expenses, will be paid by ACIM. The fee is computed and accrued
daily based on the daily net assets of the fund and paid monthly in arrears. The
annual management fee for the fund is 1.00%.
RELATED PARTIES -- Certain officers and directors of the corporation are also
officers and/or directors, and, as a group, controlling stockholders of American
Century Companies, Inc. (ACC), the parent of the corporation's investment
advisor, ACIM, the distributor of the corporation, American Century Investment
Services, Inc., and the corporation's transfer agent, American Century Services,
LLC.
The fund has a bank line of credit agreement and securities lending agreement
with JPMorgan Chase Bank (JPMCB). JPMCB is a custodian of the fund and a wholly
owned subsidiary of J.P. Morgan Chase & Co. (JPM). JPM is an equity investor in
ACC.
3. INVESTMENT TRANSACTIONS
Purchase and sales of investment securities, excluding short-term investments,
for the year ended October 31, 2006, were $2,283,153 and $2,383,387,
respectively.
(continued)
- ------
16
Notes to Financial Statements
OCTOBER 31, 2006 (AMOUNTS IN THOUSANDS)
4. SECURITIES LENDING
As of October 31, 2006, the fund had no securities on loan. In the case of
securities lending transactions, JPMCB receives and maintains collateral in the
form of cash, and/or acceptable securities as approved by ACIM. Cash collateral
is invested in authorized investments by the lending agent in a pooled account.
Any deficiencies or excess of collateral must be delivered or transferred by the
member firms no later than the close of business on the next business day. The
fund's risks in securities lending are that the borrower may not provide
additional collateral when required or return the securities when due. If the
borrower defaults, receipt of the collateral by the fund may be delayed or
limited.
5. BANK LINE OF CREDIT
The fund, along with certain other funds managed by ACIM or ACGIM, has a $500
million unsecured bank line of credit agreement with JPMCB. The fund may borrow
money for temporary or emergency purposes to fund shareholder redemptions.
Borrowings under the agreement bear interest at the Federal Funds rate plus
0.50%. The fund did not borrow from the line during the year ended October 31,
2006.
6. FEDERAL TAX INFORMATION
The book-basis character of distributions made during the year from net
investment income or net realized gains may differ from their ultimate
characterization for federal income tax purposes. These differences reflect the
differing character of certain income items and net realized gains and losses
for financial statement and tax purposes, and may result in reclassification
among certain capital accounts on the financial statements. There were no
distributions paid by the fund during the years ended October 31, 2006 and
October 31, 2005.
As of October 31, 2006, the components of distributable earnings on a tax-basis
and the federal tax cost of investments were as follows:
Federal tax cost of investments $825,869
================================================================================
Gross tax appreciation of investments $176,570
- ------------------------------------------------------
Gross tax depreciation of investments (14,057)
- --------------------------------------------------------------------------------
Net tax appreciation (depreciation) of investments $162,513
================================================================================
Net tax appreciation (depreciation) on derivatives
and translation of assets and
liabilities in foreign currencies (7)
- --------------------------------------------------------------------------------
Net tax appreciation (depreciation) $162,506
================================================================================
Undistributed ordinary income --
- ------------------------------------------------------
Accumulated capital losses $(261,041)
- --------------------------------------------------------------------------------
The difference between book-basis and tax-basis cost and unrealized appreciation
(depreciation) is attributable primarily to the tax deferral of losses on wash
sales and the realization for tax purposes of unrealized gains on certain
forward foreign currency exchange contracts.
The accumulated capital losses listed above represent net capital loss
carryovers that may be used to offset future realized capital gains for federal
income tax purposes. The capital loss carryovers expire as follows:
- --------------------------------------------------------------------------------
2009 2010 2011
- --------------------------------------------------------------------------------
$(116,339) $(138,462) $(6,240)
- --------------------------------------------------------------------------------
(continued)
- ------
17
Notes to Financial Statements
OCTOBER 31, 2006 (AMOUNTS IN THOUSANDS)
7. RECENTLY ISSUED ACCOUNTING STANDARDS
In June 2006, the Financial Accounting Standards Board (FASB) issued
Interpretation No. 48, "Accounting for Uncertainty in Income Taxes -- an
Interpretation of FASB Statement No. 109" (FIN 48). FIN 48 establishes a minimum
threshold for financial statement recognition of the benefit of positions taken
in filing tax returns (including whether an entity is taxable in a particular
jurisdiction), and requires certain expanded tax disclosures. FIN 48 is
effective for fiscal years beginning after December 15, 2006, and is to be
applied to all open tax years as of the date of effectiveness. The FASB issued
Statement of Financial Accounting Standards No. 157, "Fair Value Measurements"
(FAS 157), in September 2006, which is effective for fiscal years beginning
after November 15, 2007. FAS 157 defines fair value, establishes a framework for
measuring fair value and expands the required financial statement disclosures
about fair value measurements. Management is currently evaluating the impact of
adopting FIN 48 and FAS 157.
- ------
18
Giftrust - Financial Highlights
For a Share Outstanding Throughout the Years Ended October 31
- ---------------------------------------------------------------------------------------------------
2006 2005 2004 2003 2002
- ---------------------------------------------------------------------------------------------------
PER-SHARE DATA
- ---------------------------------------------------------------------------------------------------
Net Asset Value, Beginning of Period $17.28 $13.81 $14.04 $11.88 $14.04
- ---------------------------------------------------------------------------------------------------
Income From Investment Operations
- ------------------------------------------
Net Investment Income (Loss) (0.05) (0.08) (0.01)(1) (0.07)(1) (0.06)(1)
- ------------------------------------------
Net Realized and Unrealized Gain (Loss) 2.90 3.55 (0.22) 2.23 (2.10)
- ---------------------------------------------------------------------------------------------------
Total From Investment Operations 2.85 3.47 (0.23) 2.16 (2.16)
- ---------------------------------------------------------------------------------------------------
Net Asset Value, End of Period $20.13 $17.28 $13.81 $14.04 $11.88
===================================================================================================
TOTAL RETURN(2) 16.49% 25.13% (1.64)% 18.18% (15.38)%
RATIOS/SUPPLEMENTAL DATA
- ---------------------------------------------------------------------------------------------------
Ratio of Operating Expenses
to Average Net Assets 1.00% 1.00% 0.49%(3) 1.00% 1.00%
- ------------------------------------------
Ratio of Net Investment Income (Loss)
to Average Net Assets (0.22)% (0.46)% (0.09)%(3) (0.55)% (0.42)%
- ------------------------------------------
Portfolio Turnover Rate 229% 223% 260% 140% 140%
- ------------------------------------------
Net Assets, End of Period (in millions) $985 $927 $865 $896 $756
- ---------------------------------------------------------------------------------------------------
(1) Computed using average shares outstanding throughout the period.
(2) Total return assumes reinvestment of net investment income and capital
gains distributions, if any.
(3) During a portion of the year ended October 31, 2004, the investment advisor
voluntarily agreed to waive its management fee. The waiver was in effect
from February 1, 2004 through July 31, 2004. Had fees not been waived the
annualized ratio of operating expenses to average net assets and annualized
ratio of net investment income (loss) to average net assets would have been
1.00% and (0.60)%, respectively.
See Notes to Financial Statements.
- ------
19
Report of Independent Registered Public Accounting Firm
The Board of Directors and Shareholders,
American Century Mutual Funds, Inc.:
We have audited the accompanying statement of assets and liabilities, including
the schedule of investments, of Giftrust Fund, (the "Fund"), one of the mutual
funds comprising American Century Mutual Funds, Inc., as of October 31, 2006,
and the related statement of operations for the year then ended, the statements
of changes in net assets for each of the two years in the period then ended, and
the financial highlights for each of the five years in the period then ended.
These financial statements and financial highlights are the responsibility of
the Fund's management. Our responsibility is to express an opinion on these
financial statements and financial highlights based on our audits.
We conducted our audits in accordance with the standards of the Public Company
Accounting Oversight Board (United States). Those standards require that we plan
and perform the audit to obtain reasonable assurance about whether the financial
statements and financial highlights are free of material misstatement. The Fund
is not required to have, nor were we engaged to perform, an audit of its
internal control over financial reporting. Our audits included consideration of
internal control over financial reporting as a basis for designing audit
procedures that are appropriate in the circumstances, but not for the purpose of
expressing an opinion on the effectiveness of the Fund's internal control over
financial reporting. Accordingly, we express no such opinion. An audit also
includes examining, on a test basis, evidence supporting the amounts and
disclosures in the financial statements, assessing the accounting principles
used and significant estimates made by management, as well as evaluating the
overall financial statement presentation. Our procedures included confirmation
of securities owned as of October 31, 2006, by correspondence with the custodian
and brokers; where replies were not received from brokers, we performed other
auditing procedures. We believe that our audits provide a reasonable basis for
our opinion.
In our opinion, the financial statements and financial highlights referred to
above present fairly, in all material respects, the financial position of
Giftrust Fund as of October 31, 2006, the results of its operations for the year
then ended, the changes in its net assets for each of the two years in the
period then ended, and the financial highlights for each of the five years in
the period then ended, in conformity with accounting principles generally
accepted in the United States of America.
Deloitte & Touche LLP
Kansas City, Missouri
December 14, 2006
- ------
20
Management
The individuals listed below serve as directors or officers of the fund. Each
director serves until his or her successor is duly elected and qualified or
until he or she retires. Mandatory retirement age for independent directors is
72. Those listed as interested directors are "interested" primarily by virtue of
their engagement as officers of American Century Companies, Inc. (ACC) or its
wholly owned, direct or indirect, subsidiaries, including the fund's investment
advisor, American Century Investment Management, Inc. (ACIM); the fund's
principal underwriter, American Century Investment Services, Inc. (ACIS); and
the fund's transfer agent, American Century Services, LLC (ACS).
The other directors (more than three-fourths of the total number) are
independent; that is, they have never been employees or officers of, and have no
financial interest in, ACC or any of its wholly owned subsidiaries, including
ACIM, ACIS, and ACS. The directors serve in this capacity for seven registered
investment companies in the American Century family of funds.
All persons named as officers of the fund also serve in a similar capacity for
the other 14 investment companies advised by ACIM or American Century Global
Investment Management, Inc. (ACGIM), unless otherwise noted. Only officers with
policy-making functions are listed. No officer is compensated for his or her
service as an officer of the fund. The listed officers are interested persons of
the fund and are appointed or re-appointed on an annual basis.
INDEPENDENT DIRECTORS
- --------------------------------------------------------------------------------
THOMAS A. BROWN, 4500 Main Street, Kansas City, MO 64111
YEAR OF BIRTH: 1940
POSITION(S) HELD WITH FUND: Director
FIRST YEAR OF SERVICE: 1980
PRINCIPAL OCCUPATION(S) DURING PAST 5 YEARS: Retired, Formerly Chief Executive
Officer/Treasurer, Associated Bearings Company
NUMBER OF PORTFOLIOS IN FUND COMPLEX OVERSEEN BY DIRECTOR: 66
OTHER DIRECTORSHIPS HELD BY DIRECTOR: None
- --------------------------------------------------------------------------------
ANDREA C. HALL, PH.D., 4500 Main Street, Kansas City, MO 64111
YEAR OF BIRTH: 1945
POSITION(S) HELD WITH FUND: Director
FIRST YEAR OF SERVICE: 1997
PRINCIPAL OCCUPATION(S) DURING PAST 5 YEARS: Senior Vice President, Midwest
Research Institute
NUMBER OF PORTFOLIOS IN FUND COMPLEX OVERSEEN BY DIRECTOR: 66
OTHER DIRECTORSHIPS HELD BY DIRECTOR: None
- --------------------------------------------------------------------------------
D.D. (DEL) HOCK, 4500 Main Street, Kansas City, MO 64111
YEAR OF BIRTH: 1935
POSITION(S) HELD WITH FUND: Director
FIRST YEAR OF SERVICE: 1996
PRINCIPAL OCCUPATION(S) DURING PAST 5 YEARS: Retired, formerly Chairman, Public
Service Company of Colorado
NUMBER OF PORTFOLIOS IN FUND COMPLEX OVERSEEN BY DIRECTOR: 66
OTHER DIRECTORSHIPS HELD BY DIRECTOR: Director, Allied Motion Technologies, Inc.
- --------------------------------------------------------------------------------
JAMES A. OLSON, 4500 Main Street, Kansas City, MO 64111
YEAR OF BIRTH: 1942
POSITION(S) HELD WITH FUND: Advisory Board Member
FIRST YEAR OF SERVICE: 2006
PRINCIPAL OCCUPATION(S) DURING PAST 5 YEARS: Principal, Plaza Belmont LLC; Chief
Financial Officer, Plaza Belmont LLC (September 1999 to July 2006)
NUMBER OF PORTFOLIOS IN FUND COMPLEX OVERSEEN BY DIRECTOR: 66
OTHER DIRECTORSHIPS HELD BY DIRECTOR: Director, Saia, Inc. and Entertainment
Properties Trust
- --------------------------------------------------------------------------------
(continued)
- ------
21
Management
INDEPENDENT DIRECTORS (CONTINUED)
- --------------------------------------------------------------------------------
DONALD H. PRATT, 4500 Main Street, Kansas City, MO 64111
YEAR OF BIRTH: 1937
POSITION(S) HELD WITH FUND: Director, Chairman of the Board
FIRST YEAR OF SERVICE: 1995
PRINCIPAL OCCUPATION(S) DURING PAST 5 YEARS: Chairman, Western Investments,
Inc.; Retired Chairman of the Board, Butler Manufacturing Company
NUMBER OF PORTFOLIOS IN FUND COMPLEX OVERSEEN BY DIRECTOR: 66
OTHER DIRECTORSHIPS HELD BY DIRECTOR: None
- --------------------------------------------------------------------------------
GALE E. SAYERS, 4500 Main Street, Kansas City, MO 64111
YEAR OF BIRTH: 1943
POSITION(S) HELD WITH FUND: Director
FIRST YEAR OF SERVICE: 2000
PRINCIPAL OCCUPATION(S) DURING PAST 5 YEARS: President, Chief Executive Officer
and Founder, Sayers40, Inc., a technology products and service provider
NUMBER OF PORTFOLIOS IN FUND COMPLEX OVERSEEN BY DIRECTOR: 66
OTHER DIRECTORSHIPS HELD BY DIRECTOR: Director, Triad Hospitals, Inc.
- --------------------------------------------------------------------------------
M. JEANNINE STRANDJORD, 4500 Main Street, Kansas City, MO 64111
YEAR OF BIRTH: 1945
POSITION(S) HELD WITH FUND: Director
FIRST YEAR OF SERVICE: 1994
PRINCIPAL OCCUPATION(S) DURING PAST 5 YEARS: Retired, formerly Senior Vice
President, Sprint Corporation
NUMBER OF PORTFOLIOS IN FUND COMPLEX OVERSEEN BY DIRECTOR: 66
OTHER DIRECTORSHIPS HELD BY DIRECTOR: Director, DST Systems, Inc.; Director,
Euronet Worldwide, Inc.
- --------------------------------------------------------------------------------
TIMOTHY S. WEBSTER, 4500 Main Street, Kansas City, MO 64111
YEAR OF BIRTH: 1961
POSITION(S) HELD WITH FUND: Director
FIRST YEAR OF SERVICE: 2001
PRINCIPAL OCCUPATION(S) DURING PAST 5 YEARS: President and Chief Executive
Officer, American Italian Pasta Company (1992 to December 2005)
NUMBER OF PORTFOLIOS IN FUND COMPLEX OVERSEEN BY DIRECTOR: 66
OTHER DIRECTORSHIPS HELD BY DIRECTOR: None
- --------------------------------------------------------------------------------
INTERESTED DIRECTORS
- --------------------------------------------------------------------------------
JAMES E. STOWERS, JR.(1), 4500 Main Street, Kansas City, MO 64111
YEAR OF BIRTH: 1924
POSITION(S) HELD WITH FUND: Director, Co-Vice Chairman
FIRST YEAR OF SERVICE: 1958
PRINCIPAL OCCUPATION(S) DURING PAST 5 YEARS: Founder, Director and Controlling
Shareholder, ACC; Chairman, ACC (January 1995 to December 2004); Director, ACIM,
ACGIM, ACS, ACIS and other ACC subsidiaries
NUMBER OF PORTFOLIOS IN FUND COMPLEX OVERSEEN BY DIRECTOR: 66
OTHER DIRECTORSHIPS HELD BY DIRECTOR: None
- --------------------------------------------------------------------------------
JAMES E. STOWERS III(1), 4500 Main Street, Kansas City, MO 64111
YEAR OF BIRTH: 1959
POSITION(S) HELD WITH FUND: Director, Co-Vice Chairman
FIRST YEAR OF SERVICE: 1990
PRINCIPAL OCCUPATION(S) DURING PAST 5 YEARS: Chairman, ACC (January 2005 to
present); Co-Chairman, ACC (September 2000 to December 2004); Chairman, ACS and
other ACC subsidiaries (April 2005 to September 2006); Director, ACC, ACIM,
ACGIM, ACS, ACIS and other ACC subsidiaries
NUMBER OF PORTFOLIOS IN FUND COMPLEX OVERSEEN BY DIRECTOR: 66
OTHER DIRECTORSHIPS HELD BY DIRECTOR: None
- --------------------------------------------------------------------------------
(1) James E. Stowers, Jr. is the father of James E. Stowers III.
(continued)
- ------
22
Management
OFFICERS
- --------------------------------------------------------------------------------
WILLIAM M. LYONS, 4500 Main Street, Kansas City, MO 64111
YEAR OF BIRTH: 1955
POSITION(S) HELD WITH FUND: President
FIRST YEAR OF SERVICE: 2000
PRINCIPAL OCCUPATION(S) DURING PAST 5 YEARS: Chief Executive Officer, ACC
(September 2000 to present); President, ACC (June 1997 to present); Also serves
as: Chairman, ACIM, ACGIM, ACS, ACIS and other ACC subsidiaries; Chief Executive
Officer, ACIM, ACGIM, ACIS and other ACC subsidiaries (October 2000 to October
2006); President, ACIM, ACGIM and other ACC subsidiaries (September 2002 to
September 2006); Executive Vice President, ACS (January 2005 to September 2006);
Director, ACC, ACIM, ACGIM, ACS, ACIS and other ACC subsidiaries
- --------------------------------------------------------------------------------
JONATHAN THOMAS, 4500 Main Street, Kansas City, MO 64111
YEAR OF BIRTH: 1963
POSITION(S) HELD WITH FUND: Executive Vice President
FIRST YEAR OF SERVICE: 2005
PRINCIPAL OCCUPATION(S) DURING PAST 5 YEARS: Chief Administrative Officer, ACC
(February 2006 to present); Executive Vice President, ACC (November 2005 to
present); Also serves as: President and Chief Executive Officer, ACS; Chief
Executive Officer, Chief Financial Officer and Chief Accounting Officer, ACIM,
ACGIM, ACS, ACIS and other ACC subsidiaries; Managing Director, Morgan Stanley
(March 2000 to November 2005)
- --------------------------------------------------------------------------------
MARYANNE ROEPKE, 4500 Main Street, Kansas City, MO 64111
YEAR OF BIRTH: 1956
POSITION(S) HELD WITH FUND: Chief Compliance Officer and Senior Vice President
FIRST YEAR OF SERVICE: 2000
PRINCIPAL OCCUPATION(S) DURING PAST 5 YEARS: Chief Compliance Officer, ACIM,
ACGIM and ACS (August 2006 to present); Assistant Treasurer, ACC (January 1995
to August 2006); Treasurer and Chief Financial Officer, various American Century
funds (July 2000 to August 2006); Also serves as: Senior Vice President, ACS
- --------------------------------------------------------------------------------
DAVID C. TUCKER, 4500 Main Street, Kansas City, MO 64111
YEAR OF BIRTH: 1958
POSITION(S) HELD WITH FUND: Senior Vice President and General Counsel
FIRST YEAR OF SERVICE: 2000
PRINCIPAL OCCUPATION(S) DURING PAST 5 YEARS: Vice President, ACC (February 2001
to present); General Counsel, ACC (June 1998 to present); Also serves as: Senior
Vice President and General Counsel, ACIM, ACGIM, ACS, ACIS and other ACC
subsidiaries
- --------------------------------------------------------------------------------
ROBERT LEACH, 4500 Main Street, Kansas City, MO 64111
YEAR OF BIRTH: 1966
POSITION(S) HELD WITH FUND: Vice President, Treasurer and Chief Financial
Officer
FIRST YEAR OF SERVICE: 1997
PRINCIPAL OCCUPATION(S) DURING PAST 5 YEARS: Vice President, ACS (February 2000
to present); Controller, various American Century funds (June 1997 to September
2006)
- --------------------------------------------------------------------------------
C. JEAN WADE, 4500 Main Street, Kansas City, MO 64111
YEAR OF BIRTH: 1964
POSITION(S) HELD WITH FUNDS: Controller
FIRST YEAR OF SERVICE: 2006
PRINCIPAL OCCUPATION(S) DURING PAST 5 YEARS: Vice President, ACS (February 2000
to present)
- --------------------------------------------------------------------------------
JON ZINDEL, 4500 Main Street, Kansas City, MO 64111
YEAR OF BIRTH: 1967
POSITION(S) HELD WITH FUND: Tax Officer
FIRST YEAR OF SERVICE: 1997
PRINCIPAL OCCUPATION(S) DURING PAST 5 YEARS: Senior Vice President, ACC (August
2006 to present); Vice President, ACC and certain ACC subsidiaries (October 2001
to August 2006); Vice President, Corporate Tax, ACS (April 1998 to August 2006);
Also serves as: Senior Vice President, ACIM, ACGIM, ACS, ACIS and other ACC
subsidiaries
- --------------------------------------------------------------------------------
The SAI has additional information about the fund's directors and is available
without charge, upon request, by calling 1-800-345-2021.
- ------
23
Approval of Management Agreement for Giftrust
Under Section 15(c) of the Investment Company Act, contracts for investment
advisory services are required to be reviewed, evaluated and approved by a
majority of a fund's independent directors or trustees (the "Directors") each
year. At American Century, this process is referred to as the "15(c) Process."
As a part of this process, the board reviews fund performance, shareholder
services, audit and compliance information, and a variety of other reports from
the advisor concerning fund operations. In addition to this annual review, the
board of directors oversees and evaluates on a continuous basis at its quarterly
meetings the nature and quality of significant services performed by the
advisor, fund performance, audit and compliance information, and a variety of
other reports relating to fund operations. The board, or committees of the
board, also holds special meetings as needed.
Under a Securities and Exchange Commission rule, each fund is required to
disclose in its annual or semiannual report, as appropriate, the material
factors and conclusions that formed the basis for the board's approval or
renewal of any advisory agreements within the fund's most recently completed
fiscal half-year period.
ANNUAL CONTRACT REVIEW PROCESS
As part of the annual 15(c) Process undertaken during the most recent fiscal
half-year period, the Directors reviewed extensive data and information compiled
by the advisor and certain independent providers of evaluative data (the "15(c)
Providers") concerning Giftrust (the "fund") and the services provided to the
fund under the management agreement. The information considered and the
discussions held at the meetings included, but were not limited to:
* the nature, extent and quality of investment management, shareholder
services and other services provided to the fund under the management
agreement;
* reports on the advisor's activities relating to the wide range of
programs and services the advisor provides to the fund and its shareholders
on a routine and non-routine basis;
* data comparing the cost of owning the fund to the cost of owning a
similar fund;
* data comparing the fund's performance to appropriate benchmarks
and/or a peer group of other mutual funds with similar investment
objectives and strategies;
* financial data showing the profitability of the fund to the advisor
and the overall profitability of the advisor; and
* data comparing services provided and charges to other investment
management clients of the advisor.
In keeping with its practice, the fund's board of directors held two regularly
scheduled meetings and one special meeting to review and discuss the information
provided by the advisor and to complete its negotiations with the advisor
regarding the renewal of the management agreement, including the setting of the
applicable advisory fee. The board also had the benefit of the advice of its
independent counsel throughout the period.
(continued)
- ------
24
Approval of Management Agreement for Giftrust
FACTORS CONSIDERED
The Directors considered all of the information provided by the advisor, the
15(c) Providers, and the board's independent counsel, and evaluated such
information for each fund for which the board has responsibility. The Directors
did not identify any single factor as being all-important or controlling, and
each Director may have attributed different levels of importance to different
factors. In deciding to renew the agreement under the terms ultimately
determined by the board to be appropriate, the Directors' decision was based on
the following factors.
Nature, Extent and Quality of Services - Generally. Under the management
agreement, the advisor is responsible for providing or arranging for all
services necessary for the operation of the fund. The board noted that under the
management agreement, the advisor provides or arranges at its own expense a wide
variety of services including:
* fund construction and design
* portfolio security selection
* initial capitalization/funding
* securities trading
* custody of fund assets
* daily valuation of the fund's portfolio
* shareholder servicing and transfer agency, including shareholder
confirmations, recordkeeping and communications
* legal services
* regulatory and portfolio compliance
* financial reporting
* marketing and distribution
The Directors noted that many of these services have expanded over time both in
terms of quantity and complexity in response to shareholder demands, competition
in the industry and the changing regulatory environment. In performing their
evaluation, the Directors considered information received in connection with the
annual review, as well as information provided on an ongoing basis at their
regularly scheduled board and committee meetings.
INVESTMENT MANAGEMENT SERVICES. The nature of the investment management services
provided is quite complex and allows fund shareholders access to professional
money management, instant diversification of their investments within an asset
class, the opportunity to easily diversify among asset classes, and liquidity.
In evaluating investment performance, the board expects the advisor to manage
the fund in accordance with its investment objectives and approved strategies.
In providing these services, the advisor utilizes teams of investment
professionals (portfolio managers, analysts, research assistants, and securities
traders) who require extensive information technology, research, training,
compliance and other systems to conduct their business. At each quarterly
meeting the Directors review investment performance information for the fund,
together with comparative information for appropriate benchmarks and peer groups
of funds managed similarly to the fund. The Directors also review detailed
performance information during the 15(c) Process comparing the fund's
performance with that of similar funds not
(continued)
- ------
25
Approval of Management Agreement for Giftrust
managed by the advisor. If performance concerns are identified, the Directors
discuss with the advisor the reasons for such results (e.g., market conditions,
security selection) and any efforts being undertaken to improve performance.
The fund's performance for the one year period was in the highest quartile for
its peer group and below the median for the three year period during part of the
past year. The board discussed the fund's performance with the advisor and was
satisfied with the efforts being undertaken by the advisor.
SHAREHOLDER AND OTHER SERVICES. The advisor provides the fund with a
comprehensive package of transfer agency, shareholder, and other services. The
Directors review reports and evaluations of such services at their regular
quarterly meetings, including the annual meeting concerning contract review, and
reports to the board. These reports include, but are not limited to, information
regarding the operational efficiency and accuracy of the shareholder and
transfer agency services provided, staffing levels, shareholder satisfaction (as
measured by external as well as internal sources), technology support, new
products and services offered to fund shareholders, securities trading
activities, portfolio valuation services, auditing services, and legal and
operational compliance activities. Certain aspects of shareholder and transfer
agency service level efficiency and the quality of securities trading activities
are measured by independent third party providers and are presented in
comparison to other fund groups not managed by the advisor.
COSTS OF SERVICES PROVIDED AND PROFITABILITY TO THE ADVISOR. The advisor
provides detailed information concerning its cost of providing various services
to the fund, its profitability in managing the fund, its overall profitability,
and its financial condition. The Directors have reviewed with the advisor the
methodology used to prepare this financial information. This financial
information regarding the advisor is considered in order to evaluate the
advisor's financial condition, its ability to continue to provide services under
the management agreement, and the reasonableness of the current management fee.
ETHICS OF THE ADVISOR. The Directors generally consider the advisor's commitment
to providing quality services to shareholders and to conducting its business
ethically. They noted that the advisor's practices generally meet or exceed
industry best practices and that the advisor was not implicated in the industry
scandals of 2003 and 2004.
ECONOMIES OF SCALE. The Directors review reports provided by the advisor on
economies of scale for the complex as a whole and the year-over-year changes in
revenue, costs, and profitability. The Directors concluded that economies of
scale are difficult to measure and predict with precision, especially on a
fund-by-fund basis. This analysis is also complicated by the additional services
and content provided by the advisor and its reinvestment in its ability to
provide and expand those services. Accordingly, the Directors also seek to
evaluate economies of scale by reviewing other
(continued)
- ------
26
Approval of Management Agreement for Giftrust
information, such as year-over-year profitability of the advisor generally, the
profitability of its management of the fund specifically, the expenses incurred
by the advisor in providing various functions to the fund, and the breakpoint
fees of competitive funds not managed by the advisor. The Directors believe the
advisor is appropriately sharing economies of scale through its competitive fee
structure, fee breakpoints as the fund increases in size, and through
reinvestment in its business to provide shareholders additional content and
services.
COMPARISON TO OTHER FUNDS' FEES. The fund pays the advisor a single,
all-inclusive (or unified) management fee for providing all services necessary
for the management and operation of the fund, other than brokerage expenses,
taxes, interest, extraordinary expenses, and the fees and expenses of the fund's
independent directors (including their independent legal counsel). Under the
unified fee structure, the advisor is responsible for providing all investment
advisory, custody, audit, administrative, compliance, recordkeeping, marketing
and shareholder services, or arranging and supervising third parties to provide
such services. By contrast, most other funds are charged a variety of fees,
including an investment advisory fee, a transfer agency fee, an administrative
fee, distribution charges and other expenses. Other than their investment
advisory fees and Rule 12b-1 distribution fees, all other components of the
total fees charged by these other funds may be increased without shareholder
approval. The board believes the unified fee structure is a benefit to fund
shareholders because it clearly discloses to shareholders the cost of owning
fund shares, and, since the unified fee cannot be increased without a vote of
fund shareholders, it shifts to the advisor the risk of increased costs of
operating the fund and provides a direct incentive to minimize administrative
inefficiencies. Part of the Directors' analysis of fee levels involves reviewing
certain evaluative data compiled by a 15(c) Provider comparing the fund's
unified fee to the total expense ratio of other funds in the fund's peer group.
The unified fee charged to shareholders of the fund was in the lowest quartile
of the total expense ratios of its peer group.
COMPARISON TO FEES AND SERVICES PROVIDED TO OTHER CLIENTS OF THE ADVISOR. The
Directors also requested and received information from the advisor concerning
the nature of the services, fees, and profitability of its advisory services to
advisory clients other than the fund. They observed that these varying types of
client accounts require different services and involve different regulatory and
entrepreneurial risks than the management of the fund. The Directors analyzed
this information and concluded that the fees charged and services provided to
the fund were reasonable by comparison.
COLLATERAL BENEFITS DERIVED BY THE ADVISOR. The Directors reviewed information
from the advisor concerning collateral benefits it receives as a result of its
relationship with the fund. They concluded that the advisor's primary business
is managing mutual funds and it generally does not use the fund or
(continued)
- ------
27
Approval of Management Agreement for Giftrust
shareholder information to generate profits in other lines of business, and
therefore does not derive any significant collateral benefits from them. The
Directors noted that the advisor receives proprietary research from broker
dealers that execute fund portfolio transactions and concluded that this
research is likely to benefit fund shareholders. The Directors also determined
that the advisor is able to provide investment management services to certain
clients other than the fund, at least in part, due to its existing
infrastructure built to serve the fund complex. The Directors concluded,
however, that the assets of those other clients are not material to the analysis
and, in any event, are included with the assets of the fund to determine
breakpoints in the fund's fee schedule, provided they are managed using the same
investment team and strategy.
CONCLUSIONS OF THE DIRECTORS
As a result of this process, the independent directors, in the absence of
particular circumstances and assisted by the advice of legal counsel that is
independent of the advisor, taking into account all of the factors discussed
above and the information provided by the advisor concluded that the investment
management agreement between the fund and the advisor is fair and reasonable in
light of the services provided and should be renewed.
- ------
28
Additional Information
INDEX DEFINITIONS
The following indices are used to illustrate investment market, sector, or style
performance or to serve as fund performance comparisons. They are not investment
products available for purchase.
The DOW JONES INDUSTRIAL AVERAGE (DJIA) is a price-weighted average of 30
actively traded blue chip stocks, primarily industrials but including
service-oriented firms. Prepared and published by Dow Jones & Co., it is the
oldest and most widely quoted of all the market indicators.
The NASDAQ COMPOSITE INDEX is a market value-weighted index of all domestic and
international common stocks listed on the Nasdaq stock market.
The RUSSELL 2000(reg.tm) INDEX is a market-capitalization weighted index
created by Frank Russell Company to measure the performance of the 2,000
smallest of the 3,000 largest publicly traded U.S. companies, based on total
market capitalization.
The RUSSELL MIDCAP(reg.tm) INDEX measures the performance of the 800 smallest of
the 1,000 largest publicly traded U.S. companies, based on total market
capitalization.
The RUSSELL MIDCAP(reg.tm) GROWTH INDEX measures the performance of those
Russell Midcap Index companies (the 800 smallest of the 1,000 largest publicly
traded U.S. companies, based on total market capitalization) with higher
price-to-book ratios and higher forecasted growth values.
The S&P 500 INDEX is a market value-weighted index of the stocks of 500 publicly
traded U.S. companies chosen for market size, liquidity, and industry group
representation that are considered to be leading firms in dominant industries.
Each stock's weight in the index is proportionate to its market value. Created
by Standard & Poor's, it is considered to be a broad measure of U.S. stock
market performance.
PROXY VOTING GUIDELINES
American Century Investment Management, Inc., the fund's investment advisor, is
responsible for exercising the voting rights associated with the securities
purchased and/or held by the fund. A description of the policies and procedures
the advisor uses in fulfilling this responsibility is available without charge,
upon request, by calling 1-800-345-2021. It is also available on American
Century's website at americancentury.com and on the Securities and Exchange
Commission's website at sec.gov. Information regarding how the investment
advisor voted proxies relating to portfolio securities during the most recent
12-month period ended June 30 is available on the "About Us" page at
americancentury.com. It is also available at sec.gov.
QUARTERLY PORTFOLIO DISCLOSURE
The fund files its complete schedule of portfolio holdings with the Securities
and Exchange Commission (SEC) for the first and third quarters of each fiscal
year on Form N-Q. The fund's Form N-Q is available on the SEC's website at
sec.gov, and may be reviewed and copied at the SEC's Public Reference Room in
Washington, DC. Information on the operation of the Public Reference Room may be
obtained by calling 1-800-SEC-0330. The fund also makes its complete schedule of
portfolio holdings for the most recent quarter of its fiscal year available on
its website at americancentury.com and, upon request, by calling 1-800-345-2021.
- ------
29
Notes
- ------
30
Notes
- ------
31
Notes
- ------
32
CONTACT US
AMERICANCENTURY.COM
AUTOMATED INFORMATION LINE:
1-800-345-8765
INVESTOR SERVICES REPRESENTATIVE:
1-800-345-2021 or 816-531-5575
BUSINESS, NOT-FOR-PROFIT,
EMPLOYER-SPONSORED RETIREMENT PLANS:
1-800-345-3533
BANKS AND TRUST COMPANIES, BROKER-DEALERS,
FINANCIAL PROFESSIONALS, INSURANCE
COMPANIES: 1-800-345-6488
TELECOMMUNICATIONS DEVICE FOR THE DEAF:
1-800-634-4113 or 816-444-3485
AMERICAN CENTURY MUTUAL FUNDS, INC.
INVESTMENT ADVISOR:
American Century Investment Management, Inc.
Kansas City,
Missouri
THIS REPORT AND THE STATEMENTS IT CONTAINS ARE SUBMITTED FOR THE GENERAL
INFORMATION OF OUR SHAREHOLDERS. THE REPORT IS NOT AUTHORIZED FOR DISTRIBUTION
TO PROSPECTIVE INVESTORS UNLESS PRECEDED OR ACCOMPANIED BY AN EFFECTIVE
PROSPECTUS.
American Century Investments PRSRT STD
P.O. Box 419200 U.S. POSTAGE PAID
Kansas City, MO 64141-6200 AMERICAN CENTURY
COMPANIES
The American Century Investments logo,
American Century and American Century
Investments are service marks of American Century Investment
American Century Proprietary Holdings, Inc. Services, Inc., Distributor
0612 (c)2006 American Century
SH-ANN-52274S Proprietary Holdings, Inc.
All rights reserved.
[front cover]
American Century Investments
Annual Report
October 31, 2006
[photo of winter scene]
Select Fund
Capital Growth Fund
Fundamental Equity Fund
New Opportunities II Fund
[american century investments logo and text logo]
Our Message to You
[photo of James E. Stowers III and James E. Stowers, Jr.]
/s/James E. Stowers, Jr.
James E. Stowers, Jr.
FOUNDER
AMERICAN CENTURY COMPANIES, INC.
/s/James E. Stowers III
James E. Stowers III
CHAIRMAN OF THE BOARD
AMERICAN CENTURY COMPANIES, INC.
We are pleased to provide you with the annual report for the American Century
Select, Capital Growth, Fundamental Equity, and New Opportunities II funds for
the 12 months ended October 31, 2006. We hope you find this information helpful
in monitoring your investment. Another useful resource we offer is our website,
americancentury.com, where we post quarterly portfolio commentaries, the views
of senior investment officers and analysts, and other communications about
investments, portfolio strategy, personal finance, and the markets.
In its most recent rankings, Dalbar -- which issues customer satisfaction
ratings and rankings based on website functionality -- ranked
americancentury.com seventh out of the sites provided by the top 25 fund
companies that it believes lead the industry in web-based technology. Our
website earned an "Excellent" rating, Dalbar's highest designation.
For most of 2006, our website has linked visitors to information explaining our
strategic collaboration with Lance Armstrong and the Lance Armstrong Foundation
(LAF). This campaign, featuring Lance, is designed to encourage investors to
take a more active role in planning their financial futures and make every
investment decision count. To learn more about the collaboration and the LAF,
please visit americancentury.com or www.lanceface.com on the Web and click on
the links to related sites.
With the approach of year end and the 2006 tax season, you can also find out
more about December fund distributions and tax information via a link from our
website. We've posted December distribution estimates for over 50 funds, answers
to frequent distribution questions, and online descriptions of all of the tax
information we provide to investors.
If you haven't visited americancentury.com yet, we encourage you to do so...it's
there to serve you. And so are we. As always, we deeply appreciate your
commitment to American Century Investments.
Table of Contents
Market Perspective. . . . . . . . . . . . . . . . . . . . . . . . . . . . . 2
One-Year Total Returns . . . . . . . . . . . . . . . . . . . . . . . . . 2
SELECT
Performance . . . . . . . . . . . . . . . . . . . . . . . . . . . . . . . . 3
Portfolio Commentary. . . . . . . . . . . . . . . . . . . . . . . . . . . . 5
Schedule of Investments . . . . . . . . . . . . . . . . . . . . . . . . . . 7
CAPITAL GROWTH
Performance . . . . . . . . . . . . . . . . . . . . . . . . . . . . . . . .10
Portfolio Commentary. . . . . . . . . . . . . . . . . . . . . . . . . . . .12
Schedule of Investments . . . . . . . . . . . . . . . . . . . . . . . . . .14
FUNDAMENTAL EQUITY
Performance . . . . . . . . . . . . . . . . . . . . . . . . . . . . . . . .17
Portfolio Commentary. . . . . . . . . . . . . . . . . . . . . . . . . . . .19
Schedule of Investments . . . . . . . . . . . . . . . . . . . . . . . . . .21
NEW OPPORTUNITIES II
Performance . . . . . . . . . . . . . . . . . . . . . . . . . . . . . . . .24
Portfolio Commentary. . . . . . . . . . . . . . . . . . . . . . . . . . . .26
Schedule of Investments . . . . . . . . . . . . . . . . . . . . . . . . . .28
Shareholder Fee Examples. . . . . . . . . . . . . . . . . . . . . . . . . .31
FINANCIAL STATEMENTS
Statement of Assets and Liabilities . . . . . . . . . . . . . . . . . . . .35
Statement of Operations . . . . . . . . . . . . . . . . . . . . . . . . . .37
Statement of Changes in Net Assets. . . . . . . . . . . . . . . . . . . . .38
Notes to Financial Statements . . . . . . . . . . . . . . . . . . . . . . .40
Financial Highlights. . . . . . . . . . . . . . . . . . . . . . . . . . . .52
Report of Independent Registered Public Accounting Firm . . . . . . . . . .75
OTHER INFORMATION
Management. . . . . . . . . . . . . . . . . . . . . . . . . . . . . . . . .76
Approval of Management Agreements for Select,
Capital Growth, Fundamental Equity and New Opportunities II. . . . . . . . 80
Share Class Information . . . . . . . . . . . . . . . . . . . . . . . . . .85
Additional Information. . . . . . . . . . . . . . . . . . . . . . . . . . .87
Index Definitions . . . . . . . . . . . . . . . . . . . . . . . . . . . . .88
The opinions expressed in the Market Perspective and each of the Portfolio
Commentaries reflect those of the portfolio management team as of the date of
the report, and do not necessarily represent the opinions of American Century or
any other person in the American Century organization. Any such opinions are
subject to change at any time based upon market or other conditions and American
Century disclaims any responsibility to update such opinions. These opinions may
not be relied upon as investment advice and, because investment decisions made
by American Century funds are based on numerous factors, may not be relied upon
as an indication of trading intent on behalf of any American Century fund.
Security examples are used for representational purposes only and are not
intended as recommendations to purchase or sell securities. Performance
information for comparative indices and securities is provided to American
Century by third party vendors. To the best of American Century's knowledge,
such information is accurate at the time of printing.
Market Perspective
[photo of Chief Investment Officer]
BY MARK MALLON, CHIEF INVESTMENT OFFICER, AMERICAN CENTURY INVESTMENTS
ECONOMIC GROWTH SURGED, THEN MODERATED
Economic growth -- along with commodity prices, short-term interest rates, and
inflation -- surged early in the 12-month period ended October 31, 2006. But
growth and inflation moderated in the period's second half, which saw the
Federal Reserve end its two-year string of interest rate hikes.
After a hurricane-related slowdown in the fourth quarter of 2005, U.S. gross
domestic product grew in the first quarter of 2006 at a 5.6% annualized pace,
the highest level in more than two years. The Fed steadily raised short-term
interest rates through June to keep inflation in check, including pressures from
soaring commodity prices. The Fed finally snapped its string of rate hikes in
August 2006, leaving its target at 5.25%, a five-year high. By then, economic
growth had slowed, dragged down in part by a cooling housing market.
BEST FISCAL-YEAR STOCK RETURNS SINCE 2003
The Fed's pause and expectations for lower interest rates and mild inflation
going forward helped produce the best U.S. stock returns for a 12-month fiscal
period ended October 31 since 2003. Market rallies beginning and ending the
period offset a late-spring/early-summer selloff. Growth stocks flourished in
the latter rally, but value stocks outperformed growth for the full reporting
period. Likewise, though large-cap stocks gained ground late in the period,
small-caps posted higher returns for the entire 12-month stretch.
In the first half of the 12-month period, investors celebrated a dip in crude
oil prices and strong economic growth by pushing stock prices higher. The
small-cap Russell 2000 Index led the way, surging 18.91%. Sentiment changed in
early May, however, when the Fed made it clear that more interest rate hikes
might be necessary to control inflation. Between April 30 and July 15, the S&P
500 fell 5.28%, and the Russell 2000 more than doubled that loss as investors
desired larger, more stable companies.
The selloff ended in late July after Fed chairman Ben Bernanke predicted
inflation would moderate. The Fed's subsequent rate pause in August and plunging
energy prices allowed stocks to rebound nicely in the last three months of the
reporting period.
ONE-YEAR TOTAL RETURNS
AS OF OCTOBER 31, 2006
- --------------------------------------------------------------------------------
S&P 500 Index 16.34%
- --------------------------------------------------------------------------------
Dow Jones Industrial Average 18.47%
- --------------------------------------------------------------------------------
Nasdaq Composite Index 12.48%
- --------------------------------------------------------------------------------
- ------
2
Select - Performance
TOTAL RETURNS AS OF OCTOBER 31, 2006
--------------------------------
AVERAGE ANNUAL RETURNS
- --------------------------------------------------------------------------------
SINCE INCEPTION
1 YEAR 5 YEARS 10 YEARS INCEPTION DATE
- --------------------------------------------------------------------------------
INVESTOR CLASS -1.55% 0.99% 5.18% 13.23% 6/30/71(1)
- --------------------------------------------------------------------------------
S&P 500 INDEX(2) 16.34% 7.26% 8.64% 11.27% --
- --------------------------------------------------------------------------------
Institutional Class -1.35% 1.19% -- 4.79% 3/13/97
- --------------------------------------------------------------------------------
Advisor Class -1.79% 0.74% -- 2.32% 8/8/97
- --------------------------------------------------------------------------------
A Class 1/31/03
No sales charge* -1.81% -- -- 7.35%(3)
With sales charge* -7.45% -- -- 5.67%(3)
- --------------------------------------------------------------------------------
B Class 1/31/03
No sales charge* -2.52% -- -- 6.55%(3)
With sales charge* -6.52% -- -- 5.88%(3)
- --------------------------------------------------------------------------------
C Class -2.52% -- -- 6.58%(3) 1/31/03
- --------------------------------------------------------------------------------
R Class -2.04% -- -- -4.37% 7/29/05
- --------------------------------------------------------------------------------
*Sales charges include initial sales charges and contingent deferred sales
charges (CDSCs), as applicable. A Class shares have a maximum 5.75% initial
sales charge for equity funds and may be subject to a maximum CDSC of 1.00%. B
Class shares redeemed within six years of purchase are subject to a CDSC that
declines from 5.00% during the first year after purchase to 0.00% the sixth year
after purchase. C Class shares redeemed within 12 months of purchase are subject
to a maximum CDSC of 1.00%. Please see the Share Class Information pages for
more about the applicable sales charges for each share class. The SEC requires
that mutual funds provide performance information net of maximum sales charges
in all cases where charges could be applied.
(1) Although the fund's actual inception date was 10/31/58, this inception date
corresponds with the investment advisor's implementation of its current
investment philosophy and practices.
(2) Data provided by Lipper Inc. - A Reuters Company. (c) 2006 Reuters. All
rights reserved. Any copying, republication or redistribution of Lipper
content, including by caching, framing or similar means, is expressly
prohibited without the prior written consent of Lipper. Lipper shall not be
liable for any errors or delays in the content, or for any actions taken in
reliance thereon.
The data contained herein has been obtained from company reports, financial
reporting services, periodicals and other resources believed to be reliable.
Although carefully verified, data on compilations is not guaranteed by Lipper
and may be incomplete. No offer or solicitations to buy or sell any of the
securities herein is being made by Lipper.
(3) Class returns would have been lower if service and distribution fees had
not been waived from 2/1/03 to 3/11/03, 2/1/03 to 2/11/03, and 2/1/03 to
3/11/03 for the A Class, B Class, and C Class shares, respectively.
Data presented reflect past performance. Past performance is no guarantee of
future results. Current performance may be higher or lower than the performance
shown. Investment return and principal value will fluctuate, and redemption
value may be more or less than original cost. To obtain performance data current
to the most recent month end, please call 1-800-345-2021 or visit
americancentury.com.
Unless otherwise indicated, performance reflects Investor Class shares;
performance for other share classes will vary due to differences in fee
structure. For information about other share classes available, please consult
the prospectus. Data assumes reinvestment of dividends and capital gains, and
none of the charts reflect the deduction of taxes that a shareholder would pay
on fund distributions or the redemption of fund shares. Returns for the index
are provided for comparison. The fund's total returns include operating expenses
(such as transaction costs and management fees) that reduce returns, while the
total returns of the index do not.
(continued)
- ------
3
Select - Performance
GROWTH OF $10,000 OVER 10 YEARS
$10,000 investment made October 31, 1996
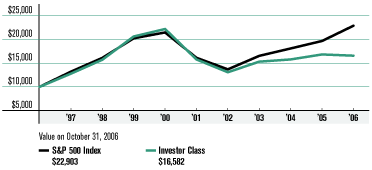
ONE-YEAR RETURNS OVER 10 YEARS
Periods ended October 31
- --------------------------------------------------------------------------------------------------------
1997 1998 1999 2000 2001 2002 2003 2004 2005 2006
- --------------------------------------------------------------------------------------------------------
Investor Class 27.89% 22.96% 31.22% 7.64% -28.93% -17.11% 17.11% 3.05% 6.67% -1.55%
- --------------------------------------------------------------------------------------------------------
S&P 500 Index 32.11% 21.99% 25.67% 6.09% -24.90% -15.11% 20.80% 9.42% 8.72% 16.34%
- --------------------------------------------------------------------------------------------------------
Data presented reflect past performance. Past performance is no guarantee of
future results. Current performance may be higher or lower than the performance
shown. Investment return and principal value will fluctuate, and redemption
value may be more or less than original cost. To obtain performance data current
to the most recent month end, please call 1-800-345-2021 or visit
americancentury.com.
Unless otherwise indicated, performance reflects Investor Class shares;
performance for other share classes will vary due to differences in fee
structure. For information about other share classes available, please consult
the prospectus. Data assumes reinvestment of dividends and capital gains, and
none of the charts reflect the deduction of taxes that a shareholder would pay
on fund distributions or the redemption of fund shares. Returns for the index
are provided for comparison. The fund's total returns include operating expenses
(such as transaction costs and management fees) that reduce returns, while the
total returns of the index do not.
- ------
4
Select - Portfolio Commentary
PORTFOLIO MANAGERS: HAROLD BRADLEY, KEITH LEE, AND MICHAEL LI
PERFORMANCE SUMMARY
Select declined 1.55%* in the 12 months ended October 31, 2006, trailing the
16.34% return of its benchmark, the S&P 500 Index, and the 10.84% gain of the
Russell 1000 Growth Index.**
As outlined in the Market Perspective on page 2, a pause in the Federal
Reserve's interest rate hikes and expectations for lower interest rates and mild
inflation going forward helped produce U.S. stock index returns in the 10-25%
range for the 12-month period. We'll discuss why Select didn't match those
returns and what we're doing to address that issue.
INVESTMENT PROCESS ENHANCEMENTS
Harold Bradley joined the Select team as co-portfolio manager in April 2006.
With his arrival, and as part of our ongoing effort to improve performance, we
have enhanced the portfolio's investment process with a multi-factor model that
we believe can better identify stocks with price momentum and improving
fundamentals. The portfolio retains its bias toward high-quality stocks and
stocks that have attractive risk/reward characteristics within the large-cap
growth space. But the multi-factor model now employs a more systematic and
rigorous screening process that takes into account factors such as earnings
quality and relative valuation levels.
CHALLENGING MARKET FACTORS
The portfolio's relative underperformance for the entire reporting period
resulted from an overweight in health care and consumer staples stocks, in
addition to security selection in each of those sectors. Underweight stakes and
security selection in energy and financials further contributed to relative
underperformance. On a total return basis, the portfolio received solid gains
from stakes in technology and consumer discretionary stocks, but not enough to
offset losses in energy and health care.
In addition, shifting market conditions caused the application of our process
enhancements to detract from performance. Select suffered in the first half of
the reporting period from underweight stakes in non-traditional growth sectors
such as energy and materials.
Our process enhancements took effect in spring 2006, refocusing the portfolio on
large-cap stocks exhibiting classic price momentum and growth characteristics.
However, the market shortly thereafter steered away from the type of stocks we
prefer, further damaging the portfolio's performance. Investment team leader
TOP TEN HOLDINGS
AS OF OCTOBER 31, 2006
- --------------------------------------------------------------------------------
% OF % OF
NET ASSETS NET ASSETS
AS OF AS OF
10/31/06 4/30/06
- --------------------------------------------------------------------------------
Johnson & Johnson 2.8% 0.8%
- --------------------------------------------------------------------------------
Diageo plc ORD 2.7% 2.0%
- --------------------------------------------------------------------------------
Baxter International, Inc. 2.7% --
- --------------------------------------------------------------------------------
Bank of America Corp. 2.6% --
- --------------------------------------------------------------------------------
St. Paul Travelers
Companies, Inc. (The) 2.6% --
- --------------------------------------------------------------------------------
Loews Corp. 2.5% --
- --------------------------------------------------------------------------------
Phelps Dodge Corp. 2.5% 1.9%
- --------------------------------------------------------------------------------
MEMC Electronics
Materials Inc. 2.5% 0.6%
- --------------------------------------------------------------------------------
Verizon Communications Inc. 2.5% --
- --------------------------------------------------------------------------------
Colgate-Palmolive Co. 2.4% 0.4%
- --------------------------------------------------------------------------------
* All fund returns referenced in this commentary are for Investor Class shares.
**The Russell 1000 Growth Index returned 4.07% and 5.76% for the 5- and 10-year
periods ended October 31, 2006, respectively.
(continued)
- ------
5
Select - Portfolio Commentary
Harold Bradley described what happened in the summer of 2006: "The market
pummeled growth and pummeled momentum. If you were looking for a harsh
environment for what we do in this fund, this was the harshest environment
possible."
ENERGY, HEALTH CARE LED DETRACTORS
Energy and health care accounted for four of Select's 10 biggest relative
detractors in the reporting period. Shares in the portfolio's worst performer,
coal mine operator Peabody Energy Corp., followed crude oil and natural gas
prices lower throughout the summer. Coal competes with natural gas as an energy
source for power plants, among other uses. As a result, it becomes less
attractive for energy users when natural gas prices dip. We sold our position in
Peabody.
Select's health care losses spread across various industries in the sector.
Shares of the portfolio's worst individual performer in the sector, medical
equipment maker Hospira, plunged in early August after its second-quarter
earnings report missed consensus market forecasts.
LARGEST HOLDING LED TOP PERFORMERS
Select's top average overweight holding, International Game Technology, also
topped the portfolio's list of best performers in the period. Shares in the
slot-machine maker surged 63% as global demand for gaming machines continued
expanding. Another substantial overweight position in the gaming sector, a stake
in Las Vegas Sands Corp., also ranked among the portfolio's leading stocks. The
company's shares more than doubled in value during the period as its new casino
in Macau produced strong earnings growth.
PORTFOLIO OBJECTIVE & EXPECTATIONS
Select seeks long-term growth and is designed as a core holding for a
diversified portfolio. We seek large, established companies with attractive
risk/reward characteristics. Within that framework, we specifically desire
companies that have accelerating growth in earnings and revenue and appear
capable of sustaining such growth over time. We believe that owning such
companies will generate outperformance over time compared with the S&P 500.
TOP FIVE INDUSTRIES
AS OF OCTOBER 31, 2006
- --------------------------------------------------------------------------------
% OF % OF
NET ASSETS NET ASSETS
AS OF AS OF
10/31/06 4/30/06
- --------------------------------------------------------------------------------
Pharmaceuticals 6.5% 2.8%
- --------------------------------------------------------------------------------
Hotels, Restaurants
& Leisure 6.4% 5.5%
- --------------------------------------------------------------------------------
Semiconductors &
Semiconductor Equipment 6.1% 3.4%
- --------------------------------------------------------------------------------
Capital Markets 5.7% 10.3%
- --------------------------------------------------------------------------------
Insurance 5.1% 1.1%
- --------------------------------------------------------------------------------
TYPES OF INVESTMENTS IN PORTFOLIO
- --------------------------------------------------------------------------------
% OF % OF
NET ASSETS NET ASSETS
AS OF AS OF
10/31/06 4/30/06
- --------------------------------------------------------------------------------
Domestic Common Stocks 78.7% 71.6%
- --------------------------------------------------------------------------------
Foreign Common Stocks(1) 20.6% 27.2%
- --------------------------------------------------------------------------------
TOTAL COMMON STOCKS 99.3% 98.8%
- --------------------------------------------------------------------------------
Temporary
Cash Investments -- 0.3%
- --------------------------------------------------------------------------------
Other Assets
and Liabilities(2) 0.7% 0.9%
- --------------------------------------------------------------------------------
(1) Includes depositary shares, dual listed securities and foreign ordinary
shares.
(2) Includes collateral received for securities lending and other assets and
liabilities.
- ------
6
Select - Schedule of Investments
OCTOBER 31, 2006
Shares Value
- --------------------------------------------------------------------------------
COMMON STOCKS -- 99.3%
- --------------------------------------------------------------------------------
AEROSPACE & DEFENSE - 4.9%
- --------------------------------------------------------------------------------
668,273 Boeing Co. $ 53,368,281
- --------------------------------------------------------------------------------
745,477 General Dynamics Corp. 53,003,415
- --------------------------------------------------------------------------------
515,924 Rockwell Collins 29,964,866
- --------------------------------------------------------------------------------
136,336,562
- --------------------------------------------------------------------------------
BEVERAGES - 2.7%
- --------------------------------------------------------------------------------
4,125,000 Diageo plc ORD 76,327,845
- --------------------------------------------------------------------------------
BIOTECHNOLOGY - 2.1%
- --------------------------------------------------------------------------------
864,726 Genzyme Corp.(1) 58,377,652
- --------------------------------------------------------------------------------
CAPITAL MARKETS - 5.7%
- --------------------------------------------------------------------------------
808,048 Bank of New York Co., Inc. (The) 27,772,610
- --------------------------------------------------------------------------------
255,831 Goldman Sachs Group, Inc. (The) 48,554,165
- --------------------------------------------------------------------------------
1,370,976 Janus Capital Group Inc. 27,529,198
- --------------------------------------------------------------------------------
701,668 Morgan Stanley 53,628,486
- --------------------------------------------------------------------------------
157,484,459
- --------------------------------------------------------------------------------
COMMERCIAL BANKS - 3.5%
- --------------------------------------------------------------------------------
703,250 PNC Financial Services Group 49,248,598
- --------------------------------------------------------------------------------
1,456,777 U.S. Bancorp 49,297,333
- --------------------------------------------------------------------------------
98,545,931
- --------------------------------------------------------------------------------
COMMUNICATIONS EQUIPMENT - 4.0%
- --------------------------------------------------------------------------------
2,460,486 Cisco Systems Inc.(1) 59,371,527
- --------------------------------------------------------------------------------
2,280,720 Motorola, Inc. 52,593,403
- --------------------------------------------------------------------------------
111,964,930
- --------------------------------------------------------------------------------
DIVERSIFIED FINANCIAL SERVICES - 2.6%
- --------------------------------------------------------------------------------
1,341,902 Bank of America Corp. 72,288,261
- --------------------------------------------------------------------------------
DIVERSIFIED TELECOMMUNICATION
SERVICES - 2.5%
- --------------------------------------------------------------------------------
1,846,325 Verizon Communications Inc. 68,314,025
- --------------------------------------------------------------------------------
ELECTRIC UTILITIES - 0.5%
- --------------------------------------------------------------------------------
310,977 Pinnacle West Capital Corp. 14,867,810
- --------------------------------------------------------------------------------
ELECTRICAL EQUIPMENT - 3.0%
- --------------------------------------------------------------------------------
4,345,248 ABB Ltd. ADR(2) 64,831,101
- --------------------------------------------------------------------------------
479,350 Q-Cells AG ORD(1) 18,972,313
- --------------------------------------------------------------------------------
83,803,414
- --------------------------------------------------------------------------------
ELECTRONIC EQUIPMENT
& INSTRUMENTS - 2.1%
- --------------------------------------------------------------------------------
453,186 Amphenol Corp. Cl A 30,771,329
- --------------------------------------------------------------------------------
790,385 Molex Inc. 27,584,437
- --------------------------------------------------------------------------------
58,355,766
- --------------------------------------------------------------------------------
FOOD & STAPLES RETAILING - 0.8%
- --------------------------------------------------------------------------------
627,933 Sysco Corp. 21,965,096
- --------------------------------------------------------------------------------
HEALTH CARE EQUIPMENT
& SUPPLIES - 2.7%
- --------------------------------------------------------------------------------
1,606,966 Baxter International, Inc. 73,872,227
- --------------------------------------------------------------------------------
Shares Value
- --------------------------------------------------------------------------------
HEALTH CARE PROVIDERS & SERVICES - 2.8%
- --------------------------------------------------------------------------------
251,310 Laboratory Corp.
of America Holdings(1) $ 17,212,222
- --------------------------------------------------------------------------------
694,710 Manor Care, Inc.(2) 33,339,133
- --------------------------------------------------------------------------------
367,837 WellPoint Inc.(1) 28,073,320
- --------------------------------------------------------------------------------
78,624,675
- --------------------------------------------------------------------------------
HOTELS, RESTAURANTS & LEISURE - 6.4%
- --------------------------------------------------------------------------------
1,172,663 Carnival Corporation 57,249,408
- --------------------------------------------------------------------------------
842,730 Las Vegas Sands Corp.(1)(2) 64,216,026
- --------------------------------------------------------------------------------
673,599 Starwood Hotels
& Resorts Worldwide, Inc. 40,240,804
- --------------------------------------------------------------------------------
288,928 Yum! Brands, Inc. 17,179,659
- --------------------------------------------------------------------------------
178,885,897
- --------------------------------------------------------------------------------
HOUSEHOLD DURABLES - 1.1%
- --------------------------------------------------------------------------------
583,254 Garmin Ltd.(1)(2) 31,151,596
- --------------------------------------------------------------------------------
HOUSEHOLD PRODUCTS - 3.7%
- --------------------------------------------------------------------------------
1,040,811 Colgate-Palmolive Co. 66,580,680
- --------------------------------------------------------------------------------
471,486 Energizer Holdings Inc.(1)(2) 36,846,631
- --------------------------------------------------------------------------------
103,427,311
- --------------------------------------------------------------------------------
INDEPENDENT POWER PRODUCERS
& ENERGY TRADERS - 0.8%
- --------------------------------------------------------------------------------
1,023,156 AES Corp. (The)(1) 22,499,200
- --------------------------------------------------------------------------------
INDUSTRIAL CONGLOMERATES - 2.0%
- --------------------------------------------------------------------------------
1,934,323 Tyco International Ltd. 56,927,126
- --------------------------------------------------------------------------------
INSURANCE - 5.1%
- --------------------------------------------------------------------------------
1,822,034 Loews Corp. 70,913,563
- --------------------------------------------------------------------------------
1,407,120 St. Paul Travelers
Companies, Inc. (The) 71,946,046
- --------------------------------------------------------------------------------
142,859,609
- --------------------------------------------------------------------------------
INTERNET SOFTWARE & SERVICES - 1.8%
- --------------------------------------------------------------------------------
102,353 Google Inc. Cl A(1) 48,759,946
- --------------------------------------------------------------------------------
IT SERVICES - 2.3%
- --------------------------------------------------------------------------------
1,211,536 Infosys Technologies Ltd. ADR(2) 63,121,026
- --------------------------------------------------------------------------------
MEDIA - 4.5%
- --------------------------------------------------------------------------------
1,445,459 Comcast Corporation Cl A(1) 58,786,818
- --------------------------------------------------------------------------------
655,181 Omnicom Group Inc. 66,468,112
- --------------------------------------------------------------------------------
125,254,930
- --------------------------------------------------------------------------------
METALS & MINING - 4.7%
- --------------------------------------------------------------------------------
1,384,508 Mittal Steel Co. N.V.
New York Shares(2) 59,187,717
- --------------------------------------------------------------------------------
705,056 Phelps Dodge Corp. 70,773,521
- --------------------------------------------------------------------------------
129,961,238
- --------------------------------------------------------------------------------
MULTILINE RETAIL - 1.3%
- --------------------------------------------------------------------------------
1,002,479 Next plc ORD 35,951,784
- --------------------------------------------------------------------------------
See Notes to Financial Statements.
(continued)
- ------
7
Select - Schedule of Investments
OCTOBER 31, 2006
Shares Value
- --------------------------------------------------------------------------------
OIL, GAS & CONSUMABLE FUELS - 4.2%
- --------------------------------------------------------------------------------
1,496,877 Frontier Oil Corp.(2) $ 44,008,186
- --------------------------------------------------------------------------------
939,192 Occidental Petroleum Corp. 44,085,672
- --------------------------------------------------------------------------------
1,147,856 Statoil ASA ADR(2) 29,109,628
- --------------------------------------------------------------------------------
117,203,486
- --------------------------------------------------------------------------------
PHARMACEUTICALS - 6.5%
- --------------------------------------------------------------------------------
1,143,146 Johnson & Johnson 77,048,041
- --------------------------------------------------------------------------------
242,125 Roche Holding AG ORD 42,397,436
- --------------------------------------------------------------------------------
1,401,816 Schering-Plough Corp. 31,036,206
- --------------------------------------------------------------------------------
600,820 Wyeth 30,659,845
- --------------------------------------------------------------------------------
181,141,528
- --------------------------------------------------------------------------------
SEMICONDUCTORS &
SEMICONDUCTOR EQUIPMENT - 6.1%
- --------------------------------------------------------------------------------
1,848,266 ASML Holding N.V. ORD(1) 42,287,143
- --------------------------------------------------------------------------------
2,740,024 Intel Corp. 58,472,112
- --------------------------------------------------------------------------------
1,933,699 MEMC Electronic
Materials Inc.(1) 68,646,315
- --------------------------------------------------------------------------------
169,405,570
- --------------------------------------------------------------------------------
SOFTWARE - 4.9%
- --------------------------------------------------------------------------------
1,110,045 Adobe Systems Inc.(1) 42,459,221
- --------------------------------------------------------------------------------
850,537 Hyperion Solutions Corp.(1)(2) 31,810,084
- --------------------------------------------------------------------------------
2,120,593 Microsoft Corporation 60,882,225
- --------------------------------------------------------------------------------
135,151,530
- --------------------------------------------------------------------------------
SPECIALTY RETAIL - 2.1%
- --------------------------------------------------------------------------------
1,945,144 Limited Brands, Inc. 57,323,394
- --------------------------------------------------------------------------------
TRANSPORTATION INFRASTRUCTURE - 0.9%
- --------------------------------------------------------------------------------
3,042,932 China Merchants Holdings
International Co. Ltd. ORD 8,901,008
- --------------------------------------------------------------------------------
21,950,000 Hopewell Highway
Infrastructure Ltd. ORD 16,341,001
- --------------------------------------------------------------------------------
25,242,009
- --------------------------------------------------------------------------------
WIRELESS TELECOMMUNICATION SERVICES - 1.0%
- --------------------------------------------------------------------------------
441,711 Rogers Communications
Inc. Cl B ORD 26,456,197
- --------------------------------------------------------------------------------
TOTAL COMMON STOCKS
Cost $2,566,714,734) 2,761,852,030
- --------------------------------------------------------------------------------
Value
- --------------------------------------------------------------------------------
COLLATERAL RECEIVED
FOR SECURITIES LENDING(3) - 7.4%
- --------------------------------------------------------------------------------
REPURCHASE AGREEMENTS
- --------------------------------------------------------------------------------
Repurchase Agreement, BNP Paribas,
(collateralized by various U.S. Government
Agency obligations in a pooled account at
the lending agent), 5.30%, dated 10/31/06,
due 11/1/06 (Delivery value $30,238,051) $ 30,233,600
- --------------------------------------------------------------------------------
Repurchase Agreement, UBS AG,
(collateralized by various U.S. Government
Agency obligations in a pooled account at
the lending agent), 5.31%, dated 10/31/06,
due 11/1/06 (Delivery value $174,859,981) 174,834,193
- --------------------------------------------------------------------------------
TOTAL COLLATERAL RECEIVED FOR SECURITIES LENDING
(Cost $205,067,793) 205,067,793
- --------------------------------------------------------------------------------
TOTAL INVESTMENT SECURITIES - 106.7%
(Cost $2,771,782,527) 2,966,919,823
- --------------------------------------------------------------------------------
OTHER ASSETS
AND LIABILITIES - (6.7)% (185,106,223)
- --------------------------------------------------------------------------------
TOTAL NET ASSETS - 100.0% $2,781,813,600
================================================================================
See Notes to Financial Statements.
(continued)
- ------
8
Select - Schedule of Investments
OCTOBER 31, 2006
FORWARD FOREIGN CURRENCY EXCHANGE CONTRACTS
- --------------------------------------------------------------------------------
Contracts to Sell Settlement Date Value Unrealized Gain (Loss)
- --------------------------------------------------------------------------------
13,210,655 CAD for USD 11/30/06 $ 11,785,861 $ (7,355)
- --------------------------------------------------------------------------------
26,306,881 CHF for USD 11/30/06 21,222,571 (100,944)
- --------------------------------------------------------------------------------
24,173,232 Euro for USD 11/30/06 30,912,864 (81,720)
- --------------------------------------------------------------------------------
29,604,865 GBP for USD 11/30/06 56,488,566 (298,532)
- --------------------------------------------------------------------------------
$120,409,862 $(488,551)
========================================
(Value on Settlement Date $119,921,311)
NOTES TO SCHEDULE OF INVESTMENTS
- --------------------------------------------------------------------------------
ADR = American Depositary Receipt
CAD = Canadian Dollar
CHF = Swiss Franc
GBP = British Pound
ORD = Foreign Ordinary Share
USD = United States Dollar
(1) Non-income producing.
(2) Security, or a portion thereof, was on loan as of October 31, 2006.
(3) Investments represent purchases made by the lending agent with cash
collateral received through securities lending transactions. (See Note 5 in
Notes to Financial Statements.)
See Notes to Financial Statements.
- ------
9
Capital Growth - Performance
TOTAL RETURNS AS OF OCTOBER 31, 2006
------------------------
AVERAGE ANNUAL RETURNS
- -------------------------------------------------------------------------------
SINCE INCEPTION
1 YEAR INCEPTION DATE
- -------------------------------------------------------------------------------
A CLASS 2/27/04
No sales charge* 11.24% 6.31%
With sales charge* 4.80% 3.99%
- -------------------------------------------------------------------------------
RUSSELL 1000 GROWTH INDEX(1) 10.84% 5.76% --
- -------------------------------------------------------------------------------
Investor Class 11.42% 7.37% 7/29/05
- -------------------------------------------------------------------------------
Institutional Class 11.59% 7.58% 7/29/05
- -------------------------------------------------------------------------------
B Class 2/27/04
No sales charge* 10.33% 5.50%
With sales charge* 6.33% 4.46%
- -------------------------------------------------------------------------------
C Class 10.33% 5.50% 2/27/04
- -------------------------------------------------------------------------------
R Class 10.86% 6.86% 7/29/05
- -------------------------------------------------------------------------------
*Sales charges include initial sales charges and contingent deferred sales
charges (CDSCs), as applicable. A Class shares have a maximum 5.75% initial
sales charge for equity funds and may be subject to a maximum CDSC of 1.00%. B
Class shares redeemed within six years of purchase are subject to a CDSC that
declines from 5.00% during the first year after purchase to 0.00% the sixth year
after purchase. C Class shares redeemed within 12 months of purchase are subject
to a maximum CDSC of 1.00%. Please see the Share Class Information pages for
more about the applicable sales charges for each share class. The SEC requires
that mutual funds provide performance information net of maximum sales charges
in all cases where charges could be applied.
(1) Data provided by Lipper Inc. - A Reuters Company. (c) 2006 Reuters. All
rights reserved. Any copying, republication or redistribution of Lipper
content, including by caching, framing or similar means, is expressly
prohibited without the prior written consent of Lipper. Lipper shall not be
liable for any errors or delays in the content, or for any actions taken in
reliance thereon.
The data contained herein has been obtained from company reports, financial
reporting services, periodicals and other resources believed to be reliable.
Although carefully verified, data on compilations is not guaranteed by
Lipper and may be incomplete. No offer or solicitations to buy or sell any
of the securities herein is being made by Lipper.
Data presented reflect past performance. Past performance is no guarantee of
future results. Current performance may be higher or lower than the performance
shown. Investment return and principal value will fluctuate, and redemption
value may be more or less than original cost. To obtain performance data current
to the most recent month end, please call 1-800-345-2021 or visit
americancentury.com.
Unless otherwise indicated, performance reflects A Class shares; performance for
other share classes will vary due to differences in fee structure. For
information about other share classes available, please consult the prospectus.
Data assumes reinvestment of dividends and capital gains, and none of the charts
reflect the deduction of taxes that a shareholder would pay on fund
distributions or the redemption of fund shares. Returns for the index are
provided for comparison. The fund's total returns include operating expenses
(such as transaction costs and management fees) that reduce returns, while the
total returns of the index do not.
(continued)
- ------
10
Capital Growth - Performance
GROWTH OF $10,000 OVER LIFE OF CLASS
$10,000 investment made February 27, 2004
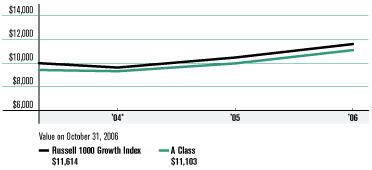
ONE-YEAR RETURNS OVER LIFE OF CLASS
Periods ended October 31
- --------------------------------------------------------------------------------
2004* 2005 2006
- --------------------------------------------------------------------------------
A Class (no sales charge) -1.10% 7.08% 11.24%
- --------------------------------------------------------------------------------
Russell 1000 Growth Index -3.70% 8.81% 10.84%
- --------------------------------------------------------------------------------
*From 2/27/04, the A Class's inception date. Not annualized. Capital Growth A
Class's initial investment is $9,425 to reflect the maximum 5.75% initial sales
charge.
Data presented reflect past performance. Past performance is no guarantee of
future results. Current performance may be higher or lower than the performance
shown. Investment return and principal value will fluctuate, and redemption
value may be more or less than original cost. To obtain performance data current
to the most recent month end, please call 1-800-345-2021 or visit
americancentury.com.
Unless otherwise indicated, performance reflects A Class shares; performance for
other share classes will vary due to differences in fee structure. For
information about other share classes available, please consult the prospectus.
Data assumes reinvestment of dividends and capital gains, and none of the charts
reflect the deduction of taxes that a shareholder would pay on fund
distributions or the redemption of fund shares. Returns for the index are
provided for comparison. The fund's total returns include operating expenses
(such as transaction costs and management fees) that reduce returns, while the
total returns of the index do not.
- ------
11
Capital Growth - Portfolio Commentary
PORTFOLIO MANAGERS: GREG WOODHAMS AND PRESCOTT LEGARD
PERFORMANCE SUMMARY
Capital Growth returned 11.24%* for the 12 months ended October 31, 2006,
outperforming its benchmark, the Russell 1000 Growth Index and the 9.05% average
return of the 1,686 funds in the Morningstar Large Growth Funds category.**
As outlined in the Market Perspective on page 2, a pause in Federal Reserve
interest rate hikes and expectations for lower interest rates and mild inflation
going forward helped produce U.S. stock index returns in the 10-25% range for
the 12-month period. On an absolute basis, every stock sector contributed to
Capital Growth's return except utilities, a tiny portion (less than 1%) of the
fund and the index. Relative to its benchmark, Capital Growth's outperformance
resulted largely from effective stock selection across a wide range of sectors,
including information technology, industrials, and energy, among others. Indeed,
the portfolio's positions outperformed in all but two of the index's sectors --
financial stocks and utilities.
INFORMATION TECHNOLOGY LED OUTPERFORMANCE
Information technology stocks were the leading source of the portfolio's
outperformance during the fiscal year. Stock selection in semiconductors
contributed significantly, especially an overweight in Freescale Semiconductor,
a spin-off from Motorola producing chips for a number of wireless and industrial
applications. Freescale performed well overall, and received an additional boost
near the end of the period after agreeing to be acquired at a significant
premium to its existing share price. Coupled with an underweight to Intel, which
performed poorly, these were two of the top-three contributors to relative
returns.
Capital Growth also benefited from good stock selection in industrials. For the
year, the industrial names in the portfolio were up 19% during the period,
compared with 15% for those in the index.
Stock selection also had a positive effect in the energy sector, where
performance was quite volatile quarter-to-quarter. In general, we avoided firms
with exposure to the volatile North
TOP TEN HOLDINGS
AS OF OCTOBER 31, 2006
- --------------------------------------------------------------------------------
% OF % OF
NET ASSETS NET ASSETS
AS OF AS OF
10/31/06 4/30/06
- --------------------------------------------------------------------------------
Bank of America Corp. 3.3% --
- --------------------------------------------------------------------------------
Cisco Systems Inc. 3.0% 3.1%
- --------------------------------------------------------------------------------
Intel Corp. 2.8% --
- --------------------------------------------------------------------------------
PepsiCo, Inc. 2.6% 2.9%
- --------------------------------------------------------------------------------
Oracle Corp. 2.6% 1.0%
- --------------------------------------------------------------------------------
Google Inc. Cl A 2.6% 1.5%
- --------------------------------------------------------------------------------
General Electric Co. 2.5% 4.2%
- --------------------------------------------------------------------------------
Schering-Plough Corp. 2.5% --
- --------------------------------------------------------------------------------
Emerson Electric Co. 2.4% 2.4%
- --------------------------------------------------------------------------------
Wal-Mart Stores, Inc. 2.2% --
- --------------------------------------------------------------------------------
*All fund returns referenced in this commentary are for A Class shares. A
Class shares are subject to a maximum sales charge of 5.75%. Had the sales
charges been applied, returns would be lower than those shown.
**(c) 2006 Morningstar, Inc. All Rights Reserved. The information contained
herein: (1) is proprietary to Morningstar and/or its content providers: (2) may
not be copied or distributed; and (3) is not warranted to be accurate, complete
or timely. Neither Morningstar nor its content providers are responsible for any
damages or losses arising from any use of this information. Morningstar Rankings
are based on risk adjusted returns.
(continued)
- ------
12
Capital Growth - Portfolio Commentary
American natural gas market; instead, we favored service companies more closely
tied to oil companies with well-financed capital expenditure budgets. As a
result, Capital Growth's energy holdings were up 20%, compared with 8% for this
segment of the index. The portfolio's top contributor in this space was
Schlumberger, a global oil-field-services provider benefiting from increased
exploration for oil and gas given higher energy prices overall. That helped
Schlumberger return 40% for the 12-month period.
Finally, our top contributor for the 12 months was an overweight position in
Archer Daniels Midland (ADM), which performed well on the strength of its
oilseed and corn processing businesses. ADM drew additional investor interest
during the period because it is a leading producer of ethanol, an alternative
and additive to gasoline made from corn.
FINANCIALS DETRACTED
The portfolio's performance would have been even better relative to its
benchmark but for positioning among financials shares. For the year, Capital
Growth's financial holdings were up 14%, compared with 18% for this portion of
the index. Despite an overweight position in this sector, which was among the
best-performing segments of the market for the year, disappointing stock
selection limited Capital Growth's relative return. In particular, positioning
among capital markets shares -- the leading contributor to index returns from
the financials sector -- detracted from relative performance.
PORTFOLIO OBJECTIVE & EXPECTATIONS
Capital Growth seeks long-term capital appreciation. We pursue our objective by
continuing to remain fully invested in large companies that are exhibiting
sustainable improvement in their businesses. It is our belief that owning such
companies will generate outperformance over time versus the Russell 1000 Growth
Index and the other funds in our large-growth peer group.
TOP FIVE INDUSTRIES
AS OF OCTOBER 31, 2006
- --------------------------------------------------------------------------------
% OF % OF
NET ASSETS NET ASSETS
AS OF AS OF
10/31/06 4/30/06
- --------------------------------------------------------------------------------
Pharmaceuticals 7.3% 3.1%
- --------------------------------------------------------------------------------
Software 6.7% 5.3%
- --------------------------------------------------------------------------------
Specialty Retail 5.3% 4.0%
- --------------------------------------------------------------------------------
Diversified
Financial Services 5.2% --
- --------------------------------------------------------------------------------
Semiconductors &
Semiconductor Equipment 5.1% 4.6%
- --------------------------------------------------------------------------------
TYPES OF INVESTMENTS IN PORTFOLIO
- --------------------------------------------------------------------------------
% OF % OF
NET ASSETS NET ASSETS
AS OF AS OF
10/31/06 4/30/06
- --------------------------------------------------------------------------------
Domestic Common Stocks 90.5% 88.0%
- --------------------------------------------------------------------------------
Foreign Common Stocks(1) 9.1% 9.7%
- --------------------------------------------------------------------------------
TOTAL COMMON STOCKS 99.6% 97.7%
- --------------------------------------------------------------------------------
Other Assets
and Liabilities 0.4% 2.3%
- --------------------------------------------------------------------------------
(1) Includes depositary shares, dual listed securities and foreign ordinary
shares.
- ------
13
Capital Growth - Schedule of Investments
OCTOBER 31, 2006
Shares Value
- -------------------------------------------------------------------------------
COMMON STOCKS -- 99.6%
- -------------------------------------------------------------------------------
AEROSPACE & DEFENSE - 3.5%
- -------------------------------------------------------------------------------
833 Boeing Co. $ 66,523
- -------------------------------------------------------------------------------
1,162 United Technologies Corp. 76,367
- -------------------------------------------------------------------------------
142,890
- -------------------------------------------------------------------------------
AIRLINES - 1.1%
- -------------------------------------------------------------------------------
1,220 Continental Airlines Inc. Cl B(1) 44,994
- -------------------------------------------------------------------------------
BEVERAGES - 3.0%
- -------------------------------------------------------------------------------
344 Anheuser-Busch Companies, Inc. 16,312
- -------------------------------------------------------------------------------
1,706 PepsiCo, Inc. 108,229
- -------------------------------------------------------------------------------
124,541
- -------------------------------------------------------------------------------
BIOTECHNOLOGY - 4.4%
- -------------------------------------------------------------------------------
1,112 Amgen Inc.(1) 84,411
- -------------------------------------------------------------------------------
455 Genentech, Inc.(1) 37,902
- -------------------------------------------------------------------------------
825 Gilead Sciences, Inc.(1) 56,843
- -------------------------------------------------------------------------------
179,156
- -------------------------------------------------------------------------------
CAPITAL MARKETS - 2.4%
- -------------------------------------------------------------------------------
213 Bear Stearns Companies Inc. (The) 32,238
- -------------------------------------------------------------------------------
350 Goldman Sachs Group, Inc. (The) 66,427
- -------------------------------------------------------------------------------
98,665
- -------------------------------------------------------------------------------
CHEMICALS - 0.3%
- -------------------------------------------------------------------------------
264 Monsanto Co. 11,674
- -------------------------------------------------------------------------------
COMMERCIAL BANKS - 1.5%
- -------------------------------------------------------------------------------
315 SunTrust Banks, Inc. 24,882
- -------------------------------------------------------------------------------
1,032 Wells Fargo & Co. 37,451
- -------------------------------------------------------------------------------
62,333
- -------------------------------------------------------------------------------
COMMUNICATIONS EQUIPMENT - 4.9%
- -------------------------------------------------------------------------------
5,031 Cisco Systems Inc.(1) 121,398
- -------------------------------------------------------------------------------
3,442 Motorola, Inc. 79,373
- -------------------------------------------------------------------------------
200,771
- -------------------------------------------------------------------------------
COMPUTERS & PERIPHERALS - 3.8%
- -------------------------------------------------------------------------------
515 Apple Computer, Inc.(1) 41,756
- -------------------------------------------------------------------------------
2,024 Hewlett-Packard Co. 78,410
- -------------------------------------------------------------------------------
938 Network Appliance, Inc.(1) 34,237
- -------------------------------------------------------------------------------
154,403
- -------------------------------------------------------------------------------
DIVERSIFIED - 1.3%
- -------------------------------------------------------------------------------
996 iShares Russell 1000
Growth Index Fund 53,774
- -------------------------------------------------------------------------------
DIVERSIFIED FINANCIAL SERVICES - 5.2%
- -------------------------------------------------------------------------------
2,467 Bank of America Corp. 132,897
- -------------------------------------------------------------------------------
1,679 JPMorgan Chase & Co. 79,652
- -------------------------------------------------------------------------------
212,549
- -------------------------------------------------------------------------------
DIVERSIFIED TELECOMMUNICATION
SERVICES - 1.5%
- -------------------------------------------------------------------------------
1,816 AT&T Inc. 62,198
- -------------------------------------------------------------------------------
Shares Value
- -------------------------------------------------------------------------------
ELECTRICAL EQUIPMENT - 4.9%
- -------------------------------------------------------------------------------
723 Cooper Industries, Ltd. Cl A $ 64,672
- -------------------------------------------------------------------------------
1,176 Emerson Electric Co. 99,254
- -------------------------------------------------------------------------------
750 Roper Industries Inc. 35,888
- -------------------------------------------------------------------------------
199,814
- -------------------------------------------------------------------------------
ELECTRONIC EQUIPMENT
& INSTRUMENTS - 0.4%
- -------------------------------------------------------------------------------
517 Tektronix, Inc. 15,701
- -------------------------------------------------------------------------------
ENERGY EQUIPMENT & SERVICES - 2.0%
- -------------------------------------------------------------------------------
438 Cameron International Corp.(1) 21,944
- -------------------------------------------------------------------------------
931 Schlumberger Ltd. 58,727
- -------------------------------------------------------------------------------
80,671
- -------------------------------------------------------------------------------
FOOD & STAPLES RETAILING - 2.2%
- -------------------------------------------------------------------------------
1,837 Wal-Mart Stores, Inc. 90,527
- -------------------------------------------------------------------------------
HEALTH CARE EQUIPMENT & SUPPLIES - 4.0%
- -------------------------------------------------------------------------------
149 Alcon Inc. 15,806
- -------------------------------------------------------------------------------
912 Baxter International, Inc. 41,925
- -------------------------------------------------------------------------------
1,136 Becton Dickinson & Co. 79,553
- -------------------------------------------------------------------------------
286 Cytyc Corp.(1) 7,556
- -------------------------------------------------------------------------------
234 DJO Inc.(1) 9,414
- -------------------------------------------------------------------------------
216 Edwards Lifesciences Corporation(1) 9,273
- -------------------------------------------------------------------------------
14 Idexx Laboratories, Inc.(1) 1,165
- -------------------------------------------------------------------------------
164,692
- -------------------------------------------------------------------------------
HEALTH CARE PROVIDERS & SERVICES - 1.2%
- -------------------------------------------------------------------------------
365 Caremark Rx Inc. 17,969
- -------------------------------------------------------------------------------
354 Laboratory Corp.
of America Holdings(1) 24,245
- -------------------------------------------------------------------------------
186 VCA Antech Inc.(1) 6,021
- -------------------------------------------------------------------------------
48,235
- -------------------------------------------------------------------------------
HOTELS, RESTAURANTS & LEISURE - 3.6%
- -------------------------------------------------------------------------------
766 Brinker International, Inc. 35,565
- -------------------------------------------------------------------------------
417 Chipotle Mexican Grill Inc. Cl B(1) 24,353
- -------------------------------------------------------------------------------
400 Darden Restaurants, Inc. 16,760
- -------------------------------------------------------------------------------
933 Hilton Hotels Corporation 26,982
- -------------------------------------------------------------------------------
1,183 Starbucks Corporation(1) 44,659
- -------------------------------------------------------------------------------
148,319
- -------------------------------------------------------------------------------
HOUSEHOLD DURABLES - 2.0%
- -------------------------------------------------------------------------------
411 Mohawk Industries Inc.(1) 29,880
- -------------------------------------------------------------------------------
1,782 Newell Rubbermaid Inc. 51,286
- -------------------------------------------------------------------------------
81,166
- -------------------------------------------------------------------------------
INDEPENDENT POWER PRODUCERS
& ENERGY TRADERS - 0.7%
- -------------------------------------------------------------------------------
423 TXU Corp. 26,704
- -------------------------------------------------------------------------------
INDUSTRIAL CONGLOMERATES - 4.6%
- -------------------------------------------------------------------------------
2,951 General Electric Co. 103,610
- -------------------------------------------------------------------------------
942 Textron Inc. 85,656
- -------------------------------------------------------------------------------
189,266
- -------------------------------------------------------------------------------
See Notes to Financial Statements.
(continued)
- ------
14
Capital Growth - Schedule of Investments
OCTOBER 31, 2006
Shares Value
- -------------------------------------------------------------------------------
INSURANCE - 2.0%
- -------------------------------------------------------------------------------
189 Endurance Specialty Holdings Ltd. $ 6,738
- -------------------------------------------------------------------------------
183 PartnerRe Ltd. 12,795
- -------------------------------------------------------------------------------
1,195 St. Paul Travelers
Companies, Inc. (The) 61,101
- -------------------------------------------------------------------------------
80,634
- -------------------------------------------------------------------------------
INTERNET SOFTWARE & SERVICES - 2.6%
- -------------------------------------------------------------------------------
219 Google Inc. Cl A(1) 104,329
- -------------------------------------------------------------------------------
IT SERVICES - 4.5%
- -------------------------------------------------------------------------------
922 Accenture Ltd. Cl A 30,343
- -------------------------------------------------------------------------------
853 International Business
Machines Corp. 78,758
- -------------------------------------------------------------------------------
3,343 Western Union Co. (The)(1) 73,713
- -------------------------------------------------------------------------------
182,814
- -------------------------------------------------------------------------------
MACHINERY - 0.3%
- -------------------------------------------------------------------------------
170 Deere & Co. 14,472
- -------------------------------------------------------------------------------
MEDIA - 0.8%
- -------------------------------------------------------------------------------
571 Lamar Advertising Co. Cl A(1) 32,935
- -------------------------------------------------------------------------------
METALS & MINING - 1.9%
- -------------------------------------------------------------------------------
741 Allegheny Technologies Inc. 58,339
- -------------------------------------------------------------------------------
175 Carpenter Technology 18,723
- -------------------------------------------------------------------------------
77,062
- -------------------------------------------------------------------------------
MULTILINE RETAIL - 1.5%
- -------------------------------------------------------------------------------
435 J.C. Penney Co. Inc. 32,725
- -------------------------------------------------------------------------------
508 Target Corp. 30,063
- -------------------------------------------------------------------------------
62,788
- -------------------------------------------------------------------------------
OIL, GAS & CONSUMABLE FUELS - 1.5%
- -------------------------------------------------------------------------------
106 Apache Corp. 6,924
- -------------------------------------------------------------------------------
1,190 Occidental Petroleum Corp. 55,859
- -------------------------------------------------------------------------------
62,783
- -------------------------------------------------------------------------------
PERSONAL PRODUCTS - 0.2%
- -------------------------------------------------------------------------------
319 Bare Escentuals Inc.(1) 9,771
- -------------------------------------------------------------------------------
PHARMACEUTICALS - 7.3%
- -------------------------------------------------------------------------------
169 Allergan, Inc. 19,520
- -------------------------------------------------------------------------------
997 Novartis AG ORD 60,546
- -------------------------------------------------------------------------------
403 Novo Nordisk AS Cl B ORD 30,440
- -------------------------------------------------------------------------------
333 Roche Holding AG ORD 58,310
- -------------------------------------------------------------------------------
4,670 Schering-Plough Corp. 103,393
- -------------------------------------------------------------------------------
827 Teva Pharmaceutical
Industries Ltd. ADR 27,266
- -------------------------------------------------------------------------------
299,475
- -------------------------------------------------------------------------------
Shares Value
- -------------------------------------------------------------------------------
SEMICONDUCTORS & SEMICONDUCTOR EQUIPMENT - 5.1%
- -------------------------------------------------------------------------------
691 Broadcom Corp. Cl A(1) $ 20,917
- -------------------------------------------------------------------------------
5,275 Intel Corp. 112,568
- -------------------------------------------------------------------------------
2,027 STMicroelectronics N.V.
New York Shares 35,189
- -------------------------------------------------------------------------------
1,302 Texas Instruments Inc. 39,294
- -------------------------------------------------------------------------------
207,968
- -------------------------------------------------------------------------------
SOFTWARE - 6.7%
- -------------------------------------------------------------------------------
2,461 BEA Systems Inc.(1) 40,040
- -------------------------------------------------------------------------------
606 Business Objects SA ADR(1) 22,446
- -------------------------------------------------------------------------------
383 Cognos, Inc.(1) 13,972
- -------------------------------------------------------------------------------
499 Electronic Arts Inc.(1) 26,392
- -------------------------------------------------------------------------------
1,031 Microsoft Corporation 29,600
- -------------------------------------------------------------------------------
5,761 Oracle Corp.(1) 106,406
- -------------------------------------------------------------------------------
1,690 Symantec Corp.(1) 33,530
- -------------------------------------------------------------------------------
272,386
- -------------------------------------------------------------------------------
SPECIALTY RETAIL - 5.3%
- -------------------------------------------------------------------------------
524 Abercrombie & Fitch Co. 40,165
- -------------------------------------------------------------------------------
1,587 Gap, Inc. (The) 33,359
- -------------------------------------------------------------------------------
1,289 Lowe's Companies, Inc. 38,850
- -------------------------------------------------------------------------------
1,425 Office Depot, Inc.(1) 59,836
- -------------------------------------------------------------------------------
1,555 TJX Companies, Inc. (The) 45,017
- -------------------------------------------------------------------------------
217,227
- -------------------------------------------------------------------------------
TEXTILES, APPAREL & LUXURY GOODS - 0.9%
- -------------------------------------------------------------------------------
506 Polo Ralph Lauren Corp. 35,926
- -------------------------------------------------------------------------------
WIRELESS TELECOMMUNICATION
SERVICES - 0.5%
- -------------------------------------------------------------------------------
530 American Tower Corp. Cl A(1) 19,091
- -------------------------------------------------------------------------------
TOTAL INVESTMENT SECURITIES - 99.6%
(Cost $3,640,974) 4,072,704
- -------------------------------------------------------------------------------
OTHER ASSETS AND LIABILITIES - 0.4% 14,314
- -------------------------------------------------------------------------------
TOTAL NET ASSETS - 100.0% $4,087,018
===============================================================================
See Notes to Financial Statements.
(continued)
- ------
15
Capital Growth - Schedule of Investments
OCTOBER 31, 2006
- -------------------------------------------------------------------------------
FORWARD FOREIGN CURRENCY EXCHANGE CONTRACTS
- -------------------------------------------------------------------------------
Contracts to Sell Settlement Date Value Unrealized Gain (Loss)
- -------------------------------------------------------------------------------
88,909 CHF for USD 11/30/06 $71,726 $ (341)
- -------------------------------------------------------------------------------
105,667 DKK for USD 11/30/06 18,125 (67)
- -------------------------------------------------------------------------------
$89,851 $ (408)
===================================
(Value on Settlement Date $89,443)
NOTES TO SCHEDULE OF INVESTMENTS
- -------------------------------------------------------------------------------
ADR = American Depositary Receipt
CHF = Swiss Franc
DKK = Danish Krone
ORD = Foreign Ordinary Share
USD = United States Dollar
(1) Non-income producing.
See Notes to Financial Statements.
- ------
16
Fundamental Equity - Performance
TOTAL RETURNS AS OF OCTOBER 31, 2006
----------------------
AVERAGE ANNUAL RETURNS
- --------------------------------------------------------------------------------
SINCE INCEPTION
1 YEAR INCEPTION DATE
- --------------------------------------------------------------------------------
A CLASS 11/30/04
No sales charge* 20.12% 15.80%
With sales charge* 13.24% 12.28%
- --------------------------------------------------------------------------------
S&P 500 INDEX(1) 16.34% 10.73% --
- --------------------------------------------------------------------------------
Investor Class 20.37% 17.24% 7/29/05
- --------------------------------------------------------------------------------
Institutional Class 20.51% 17.43% 7/29/05
- --------------------------------------------------------------------------------
B Class 11/30/04
No sales charge* 19.04% 14.87%
With sales charge* 15.04% 13.02%
- --------------------------------------------------------------------------------
C Class 19.13% 14.92% 11/30/04
- --------------------------------------------------------------------------------
R Class 19.67% 16.61% 7/29/05
- --------------------------------------------------------------------------------
*Sales charges include initial sales charges and contingent deferred sales
charges (CDSCs), as applicable. A Class shares have a maximum 5.75% initial
sales charge for equity funds and may be subject to a maximum CDSC of 1.00%. B
Class shares redeemed within six years of purchase are subject to a CDSC that
declines from 5.00% during the first year after purchase to 0.00% the sixth year
after purchase. C Class shares redeemed within 12 months of purchase are subject
to a maximum CDSC of 1.00%. Please see the Share Class Information pages for
more about the applicable sales charges for each share class. The SEC requires
that mutual funds provide performance information net of maximum sales charges
in all cases where charges could be applied.
(1) Data provided by Lipper Inc. - A Reuters Company. (c) 2006 Reuters. All
rights reserved. Any copying, republication or redistribution of Lipper
content, including by caching, framing or similar means, is expressly
prohibited without the prior written consent of Lipper. Lipper shall not be
liable for any errors or delays in the content, or for any actions taken in
reliance thereon.
The data contained herein has been obtained from company reports, financial
reporting services, periodicals and other resources believed to be reliable.
Although carefully verified, data on compilations is not guaranteed by
Lipper and may be incomplete. No offer or solicitations to buy or sell any
of the securities herein is being made by Lipper.
Data presented reflect past performance. Past performance is no guarantee of
future results. Current performance may be higher or lower than the performance
shown. Investment return and principal value will fluctuate, and redemption
value may be more or less than original cost. To obtain performance data current
to the most recent month end, please call 1-800-345-2021 or visit
americancentury.com.
Unless otherwise indicated, performance reflects A Class shares; performance for
other share classes will vary due to differences in fee structure. For
information about other share classes available, please consult the prospectus.
Data assumes reinvestment of dividends and capital gains, and none of the charts
reflect the deduction of taxes that a shareholder would pay on fund
distributions or the redemption of fund shares. Returns for the index are
provided for comparison. The fund's total returns include operating expenses
(such as transaction costs and management fees) that reduce returns, while the
total returns of the index do not.
(continued)
- ------
17
Fundamental Equity - Performance
GROWTH OF $10,000 OVER LIFE OF CLASS
$10,000 investment made November 30, 2004
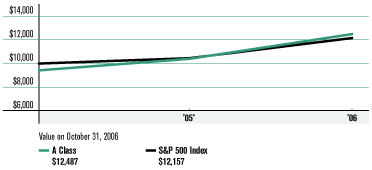
ONE-YEAR RETURNS OVER LIFE OF CLASS
Periods ended October 31
- --------------------------------------------------------------------------------
2005* 2006
- --------------------------------------------------------------------------------
A Class (no sales charge) 10.30% 20.12%
- --------------------------------------------------------------------------------
S&P 500 Index 4.49% 16.34%
- --------------------------------------------------------------------------------
*From 11/30/04, the A Class's inception date. Not annualized. Capital Growth A
Class's initial investment is $9,425 to reflect the maximum 5.75% initial sales
charge.
Data presented reflect past performance. Past performance is no guarantee of
future results. Current performance may be higher or lower than the performance
shown. Investment return and principal value will fluctuate, and redemption
value may be more or less than original cost. To obtain performance data current
to the most recent month end, please call 1-800-345-2021 or visit
americancentury.com.
Unless otherwise indicated, performance reflects A Class shares; performance for
other share classes will vary due to differences in fee structure. For
information about other share classes available, please consult the prospectus.
Data assumes reinvestment of dividends and capital gains, and none of the charts
reflect the deduction of taxes that a shareholder would pay on fund
distributions or the redemption of fund shares. Returns for the index are
provided for comparison. The fund's total returns include operating expenses
(such as transaction costs and management fees) that reduce returns, while the
total returns of the index do not.
- ------
18
Fundamental Equity - Portfolio Commentary
PORTFOLIO MANAGERS: JERRY SULLIVAN AND ROB BROOKBY
PERFORMANCE SUMMARY
Fundamental Equity gained 20.12%* during the 12 months ended October 31, 2006,
surpassing the 16.34% return of its benchmark, the S&P 500 Index. The
portfolio's return ranked in the third percentile of its Morningstar Large-Cap
Blend category (37th out of 1,932 funds).**
As outlined in the Market Perspective on page 2, a pause in Federal Reserve
interest rate hikes and expectations for lower interest rates and mild inflation
going forward helped produce U.S. stock index returns in the 10-25% range for
the 12-month period. Fundamental Equity enjoyed positive total returns from all
but one market sector in the reporting period, as we successfully maneuvered the
market's broad transition away from industrials and materials stocks to
technology and consumer discretionary stocks beginning in May 2006.
The portfolio's relative return also benefited from our efforts to avoid weak
internet stocks and remain in an underweight position in the struggling home
building industry. That helped overcome detrimental relative results in
telecommunications -- the only sector that didn't contribute to the portfolio's
absolute return -- and financials.
The latest fiscal-year performance bolstered Fundamental Equity's longer-term
track record. Since its November 30, 2004, inception, the portfolio has returned
an annual average of 15.80%, exceeding the benchmark's annual return of 10.73%
in the same time frame.
OUR BIG STAKES WORKED
Our stakes in industrials and materials -- along with an advantageous
underweight position in utilities -- contributed the lion's share of the
portfolio's outperformance. The first two of those sectors performed
particularly well as the economy surged in the first half of the reporting
period.
Shares in the portfolio's leading individual relative performer, H&E Equipment
Services, rose 57% in the three months after its early February initial public
offering. As with many other industrial stocks, though, shares in the
distributor of heavy construction equipment fell as the market sold off in May
2006. But we avoided the stock's downturn by selling our stake beforehand.
TOP TEN HOLDINGS
AS OF OCTOBER 31, 2006
- --------------------------------------------------------------------------------
% OF % OF
NET ASSETS NET ASSETS
AS OF AS OF
10/31/06 4/30/06
- --------------------------------------------------------------------------------
General Electric Co. 3.0% 0.9%
- --------------------------------------------------------------------------------
Citigroup Inc. 2.9% 3.2%
- --------------------------------------------------------------------------------
Exxon Mobil Corp. 2.8% 3.8%
- --------------------------------------------------------------------------------
Bank of America Corp. 2.7% 2.7%
- --------------------------------------------------------------------------------
iShares S&P 100
Index Fund 1.9% --
- --------------------------------------------------------------------------------
JPMorgan Chase & Co. 1.9% 2.4%
- --------------------------------------------------------------------------------
International Business
Machines Corp. 1.8% 0.5%
- --------------------------------------------------------------------------------
Cisco Systems Inc. 1.6% 0.9%
- --------------------------------------------------------------------------------
Chevron Corp. 1.6% --
- --------------------------------------------------------------------------------
American International
Group, Inc. 1.6% 1.5%
- --------------------------------------------------------------------------------
*All fund returns referenced in this commentary are for A Class shares. A
Class shares are subject to a maximum sales charge of 5.75%. Had the sales
charge been applied, returns would be lower than those shown.
**(c) 2006 Morningstar, Inc. All Rights Reserved. The information contained
herein: (1) is proprietary to Morningstar and/or its content providers: (2) may
not be copied or distributed; and (3) is not warranted to be accurate, complete
or timely. Neither Morningstar nor its content providers are responsible for any
damages or losses arising from any use of this information. Morningstar Rankings
are based on risk adjusted returns.
(continued)
- ------
19
Fundamental Equity - Portfolio Commentary
Fundamental Equity's biggest individual overweight position, a stake in
technology consulting firm Accenture, also ranked among its best performers. The
company benefited as the market favored technology stocks late in the reporting
period.
In addition, a position in Merck also benefited the portfolio. Part of the
portfolio's process involves finding underappreciated stocks, and we suspected
investors may have punished the company's stock too much in late 2005 and early
2006 for its Vioxx-related lawsuits. In mid-July, Merck successfully defended a
Vioxx suit, its fourth victory in seven such cases. The company's shares rose
24% between the date of that verdict and the end of the reporting period.
MISSED CALLS IN TELECOM
We applied the bulk of our underweight stake in the telecommunications sector to
wireless providers. As a result, the portfolio suffered on a relative basis from
a limited exposure to diversified providers, whose 46% total return within the
benchmark ranked second among all market industries. We totally avoided
investments in AT&T and BellSouth, which both rallied after the former agreed to
buy the latter.
Our focus on areas of the market we perceive as undervalued led us early in the
period to the financials sector, which had experienced somewhat sluggish returns
in 2005 as the Federal Reserve continued raising interest rates. Financials
accounted for almost a fifth of our total holdings, and no other sector
contributed more to the portfolio's total return. But a slight underweight stake
in the sector and unfavorable security selection within it trimmed relative
results.
PORTFOLIO OBJECTIVES & EXPECTATIONS
We manage Fundamental Equity as a large-cap core portfolio that seeks capital
growth and current income. We target investments in large companies we perceive
as attractively valued relative to their prospects for earnings growth and
income production. Our focus on bellwether large-cap stocks should put the
portfolio in position for solid returns in 2007 if the market's shift toward
large-caps in the last six months of the reporting period persists.
TOP FIVE INDUSTRIES
AS OF OCTOBER 31, 2006
- --------------------------------------------------------------------------------
% OF % OF
NET ASSETS NET ASSETS
AS OF AS OF
10/31/06 4/30/06
- --------------------------------------------------------------------------------
Diversified
Financial Services 7.5% 5.6%
- --------------------------------------------------------------------------------
Oil, Gas &
Consumable Fuels 7.3% 8.4%
- --------------------------------------------------------------------------------
Insurance 6.4% 9.7%
- --------------------------------------------------------------------------------
Aerospace & Defense 5.8% 2.3%
- --------------------------------------------------------------------------------
Pharmaceuticals 5.7% 5.9%
- --------------------------------------------------------------------------------
TYPES OF INVESTMENTS IN PORTFOLIO
- --------------------------------------------------------------------------------
% OF % OF
NET ASSETS NET ASSETS
AS OF AS OF
10/31/06 4/30/06
- --------------------------------------------------------------------------------
Domestic Common Stocks 89.0% 88.6%
- --------------------------------------------------------------------------------
Foreign Common Stocks(1) 6.9% 6.8%
- --------------------------------------------------------------------------------
TOTAL COMMON STOCKS 95.9% 95.4%
- --------------------------------------------------------------------------------
Temporary
Cash Investments 7.4% 4.1%
- --------------------------------------------------------------------------------
Other Assets
and Liabilities (3.3)% 0.5%
- --------------------------------------------------------------------------------
(1) Includes depositary shares, dual listed securities and foreign
ordinary shares.
- ------
20
Fundamental Equity - Schedule of Investments
OCTOBER 31, 2006
Shares Value
- --------------------------------------------------------------------------------
COMMON STOCKS -- 95.9%
- --------------------------------------------------------------------------------
AEROSPACE & DEFENSE - 5.8%
- --------------------------------------------------------------------------------
4,463 Boeing Co. $ 356,415
- --------------------------------------------------------------------------------
13,707 Honeywell International Inc. 577,339
- --------------------------------------------------------------------------------
7,575 Lockheed Martin Corp. 658,495
- --------------------------------------------------------------------------------
11,537 Raytheon Company 576,273
- --------------------------------------------------------------------------------
8,837 United Technologies Corp. 580,768
- --------------------------------------------------------------------------------
2,749,290
- --------------------------------------------------------------------------------
BEVERAGES - 3.5%
- --------------------------------------------------------------------------------
10,343 Coca-Cola Company (The) 483,226
- --------------------------------------------------------------------------------
4,025 Fomento Economico
Mexicano SA de CV ADR 389,177
- --------------------------------------------------------------------------------
10,079 Pepsi Bottling Group Inc. 318,698
- --------------------------------------------------------------------------------
7,176 PepsiCo, Inc. 455,245
- --------------------------------------------------------------------------------
1,646,346
- --------------------------------------------------------------------------------
BIOTECHNOLOGY - 0.9%
- --------------------------------------------------------------------------------
5,848 Amgen Inc.(1) 443,922
- --------------------------------------------------------------------------------
BUILDING PRODUCTS - 0.1%
- --------------------------------------------------------------------------------
1,508 OAO TMK GDR(1) 38,650
- --------------------------------------------------------------------------------
CAPITAL MARKETS - 2.7%
- --------------------------------------------------------------------------------
1,711 Bear Stearns
Companies Inc. (The) 258,960
- --------------------------------------------------------------------------------
1,607 Goldman Sachs Group, Inc. (The) 304,993
- --------------------------------------------------------------------------------
2,094 Lehman Brothers Holdings Inc. 162,997
- --------------------------------------------------------------------------------
6,125 Merrill Lynch & Co., Inc. 535,447
- --------------------------------------------------------------------------------
1,262,397
- --------------------------------------------------------------------------------
CHEMICALS - 1.7%
- --------------------------------------------------------------------------------
3,493 Air Products & Chemicals, Inc. 243,357
- --------------------------------------------------------------------------------
4,626 Monsanto Co. 204,562
- --------------------------------------------------------------------------------
4,919 PPG Industries, Inc. 336,460
- --------------------------------------------------------------------------------
784,379
- --------------------------------------------------------------------------------
COMMERCIAL BANKS - 1.3%
- --------------------------------------------------------------------------------
4,132 First Horizon National Corp. 162,470
- --------------------------------------------------------------------------------
257,900 Industrial & Commercial
Bank of China Cl H ORD(1) 115,397
- --------------------------------------------------------------------------------
10,111 U.S. Bancorp 342,157
- --------------------------------------------------------------------------------
620,024
- --------------------------------------------------------------------------------
COMMERCIAL SERVICES & SUPPLIES - 1.9%
- --------------------------------------------------------------------------------
9,019 ICF International Inc.(1) 132,128
- --------------------------------------------------------------------------------
3,796 Resources Connection, Inc.(1) 109,856
- --------------------------------------------------------------------------------
18,031 Waste Management, Inc. 675,802
- --------------------------------------------------------------------------------
917,786
- --------------------------------------------------------------------------------
COMMUNICATIONS EQUIPMENT - 3.1%
- --------------------------------------------------------------------------------
10,903 Acme Packet Inc.(1) 187,532
- --------------------------------------------------------------------------------
31,880 Cisco Systems Inc.(1) 769,264
- --------------------------------------------------------------------------------
9,372 Corning Inc.(1) 191,470
- --------------------------------------------------------------------------------
15,000 Optium Corp.(1) 303,750
- --------------------------------------------------------------------------------
1,452,016
- --------------------------------------------------------------------------------
Shares Value
- --------------------------------------------------------------------------------
COMPUTERS & PERIPHERALS - 2.4%
- --------------------------------------------------------------------------------
4,317 Apple Computer, Inc.(1) $ 350,022
- --------------------------------------------------------------------------------
14,490 Hewlett-Packard Co. 561,343
- --------------------------------------------------------------------------------
3,306 Lexmark International, Inc. Cl A(1) 210,229
- --------------------------------------------------------------------------------
1,121,594
- --------------------------------------------------------------------------------
CONSUMER FINANCE - 0.8%
- --------------------------------------------------------------------------------
7,311 SLM Corporation 355,899
- --------------------------------------------------------------------------------
CONTAINERS & PACKAGING - 0.6%
- --------------------------------------------------------------------------------
14,718 Crown Holdings Inc.(1) 286,118
- --------------------------------------------------------------------------------
DIVERSIFIED - 4.6%
- --------------------------------------------------------------------------------
14,006 iShares S&P 100 Index Fund 898,205
- --------------------------------------------------------------------------------
8,728 Nasdaq-100 Trust, Series 1 371,638
- --------------------------------------------------------------------------------
5,400 Semiconductor HOLDRS Trust 183,600
- --------------------------------------------------------------------------------
5,225 Standard and Poor's 500
Depositary Receipt 720,162
- --------------------------------------------------------------------------------
2,173,605
- --------------------------------------------------------------------------------
DIVERSIFIED FINANCIAL SERVICES - 7.5%
- --------------------------------------------------------------------------------
23,907 Bank of America Corp. 1,287,869
- --------------------------------------------------------------------------------
27,741 Citigroup Inc. 1,391,488
- --------------------------------------------------------------------------------
18,447 JPMorgan Chase & Co. 875,126
- --------------------------------------------------------------------------------
3,554,483
- --------------------------------------------------------------------------------
DIVERSIFIED TELECOMMUNICATION
SERVICES - 0.3%
- --------------------------------------------------------------------------------
21,587 Qwest Communications
International Inc.(1) 186,296
- --------------------------------------------------------------------------------
ELECTRIC UTILITIES - 0.6%
- --------------------------------------------------------------------------------
11,485 Pepco Holdings, Inc. 291,949
- --------------------------------------------------------------------------------
ENERGY EQUIPMENT & SERVICES - 1.4%
- --------------------------------------------------------------------------------
7,322 Schlumberger Ltd. 461,872
- --------------------------------------------------------------------------------
2,711 Transocean Inc.(1) 196,656
- --------------------------------------------------------------------------------
658,528
- --------------------------------------------------------------------------------
FOOD & STAPLES RETAILING - 1.5%
- --------------------------------------------------------------------------------
10,410 Kroger Co. (The) 234,121
- --------------------------------------------------------------------------------
14,358 Supervalu Inc. 479,557
- --------------------------------------------------------------------------------
713,678
- --------------------------------------------------------------------------------
FOOD PRODUCTS - 0.9%
- --------------------------------------------------------------------------------
7,840 General Mills, Inc. 445,469
- --------------------------------------------------------------------------------
GAS UTILITIES - 0.3%
- --------------------------------------------------------------------------------
3,635 ONEOK, Inc. 151,325
- --------------------------------------------------------------------------------
HEALTH CARE EQUIPMENT
& SUPPLIES - 1.5%
- --------------------------------------------------------------------------------
11,000 LeMaitre Vascular Inc.(1) 66,550
- --------------------------------------------------------------------------------
4,910 Medtronic, Inc. 239,019
- --------------------------------------------------------------------------------
5,845 Zimmer Holdings Inc.(1) 420,898
- --------------------------------------------------------------------------------
726,467
- --------------------------------------------------------------------------------
See Notes to Financial Statements.
(continued)
- ------
21
Fundamental Equity - Schedule of Investments
OCTOBER 31, 2006
Shares Value
- --------------------------------------------------------------------------------
HEALTH CARE PROVIDERS & SERVICES - 3.6%
- --------------------------------------------------------------------------------
8,104 AmerisourceBergen Corp. $ 382,509
- --------------------------------------------------------------------------------
6,508 Cardinal Health, Inc. 425,948
- --------------------------------------------------------------------------------
4,391 Caremark Rx Inc. 216,169
- --------------------------------------------------------------------------------
1,568 Humana Inc.(1) 94,080
- --------------------------------------------------------------------------------
4,353 Laboratory Corp. of
America Holdings(1) 298,137
- --------------------------------------------------------------------------------
5,434 McKesson Corp. 272,189
- --------------------------------------------------------------------------------
1,689,032
- --------------------------------------------------------------------------------
HEALTH CARE TECHNOLOGY - 0.7%
- --------------------------------------------------------------------------------
11,387 IMS Health Inc. 317,128
- --------------------------------------------------------------------------------
HOTELS, RESTAURANTS & LEISURE - 1.8%
- --------------------------------------------------------------------------------
7,341 Scientific Games Corp. Cl A(1) 205,768
- --------------------------------------------------------------------------------
10,560 Yum! Brands, Inc. 627,898
- --------------------------------------------------------------------------------
833,666
- --------------------------------------------------------------------------------
HOUSEHOLD PRODUCTS - 0.5%
- --------------------------------------------------------------------------------
3,315 Kimberly-Clark Corp. 220,514
- --------------------------------------------------------------------------------
INDUSTRIAL CONGLOMERATES - 3.0%
- --------------------------------------------------------------------------------
40,608 General Electric Co. 1,425,747
- --------------------------------------------------------------------------------
INSURANCE - 6.4%
- --------------------------------------------------------------------------------
11,395 Ace, Ltd. 652,363
- --------------------------------------------------------------------------------
6,079 Ambac Financial Group, Inc. 507,536
- --------------------------------------------------------------------------------
11,030 American International
Group, Inc. 740,884
- --------------------------------------------------------------------------------
4,375 Chubb Corp. 232,531
- --------------------------------------------------------------------------------
8,053 First Mercury Financial Corp.(1) 166,697
- --------------------------------------------------------------------------------
4,522 Hartford Financial Services
Group Inc. (The) 394,183
- --------------------------------------------------------------------------------
5,180 Lincoln National Corp. 327,946
- --------------------------------------------------------------------------------
3,022,140
- --------------------------------------------------------------------------------
INTERNET SOFTWARE & SERVICES - 1.1%
- --------------------------------------------------------------------------------
772 Google Inc. Cl A(1) 367,773
- --------------------------------------------------------------------------------
2,790 Traffic.com Inc.(1) 15,010
- --------------------------------------------------------------------------------
5,500 Yahoo! Inc.(1) 144,870
- --------------------------------------------------------------------------------
527,653
- --------------------------------------------------------------------------------
IT SERVICES - 4.8%
- --------------------------------------------------------------------------------
19,944 Accenture Ltd. Cl A 656,357
- --------------------------------------------------------------------------------
10,550 Ceridian Corp.(1) 248,664
- --------------------------------------------------------------------------------
10,437 First Data Corp. 253,097
- --------------------------------------------------------------------------------
9,352 International Business
Machines Corp. 863,470
- --------------------------------------------------------------------------------
10,317 Western Union Co. (The)(1) 227,490
- --------------------------------------------------------------------------------
2,249,078
- --------------------------------------------------------------------------------
LIFE SCIENCES TOOLS & SERVICES - 1.1%
- --------------------------------------------------------------------------------
5,864 Fisher Scientific International(1) 502,076
- --------------------------------------------------------------------------------
Shares Value
- --------------------------------------------------------------------------------
MACHINERY - 1.0%
- --------------------------------------------------------------------------------
4,858 Caterpillar Inc. $ 294,929
- --------------------------------------------------------------------------------
856 Cummins Inc. 108,695
- --------------------------------------------------------------------------------
1,909 Dover Corp. 90,678
- --------------------------------------------------------------------------------
494,302
- --------------------------------------------------------------------------------
MEDIA - 2.2%
- --------------------------------------------------------------------------------
5,042 Omnicom Group Inc. 511,511
- --------------------------------------------------------------------------------
16,834 Walt Disney Co. (The) 529,598
- --------------------------------------------------------------------------------
1,041,109
- --------------------------------------------------------------------------------
METALS & MINING - 0.7%
- --------------------------------------------------------------------------------
3,752 Nucor Corp. 219,155
- --------------------------------------------------------------------------------
964 Phelps Dodge Corp. 96,766
- --------------------------------------------------------------------------------
315,921
- --------------------------------------------------------------------------------
MULTI-UTILITIES - 1.0%
- --------------------------------------------------------------------------------
4,534 Sempra Energy 240,484
- --------------------------------------------------------------------------------
9,492 XCEL Energy Inc. 209,488
- --------------------------------------------------------------------------------
449,972
- --------------------------------------------------------------------------------
MULTILINE RETAIL - 2.2%
- --------------------------------------------------------------------------------
7,235 J.C. Penney Co. Inc. 544,289
- --------------------------------------------------------------------------------
8,327 Target Corp. 492,792
- --------------------------------------------------------------------------------
1,037,081
- --------------------------------------------------------------------------------
OIL, GAS & CONSUMABLE FUELS - 7.3%
- --------------------------------------------------------------------------------
11,111 Chevron Corp. 746,659
- --------------------------------------------------------------------------------
9,120 Devon Energy Corporation 609,581
- --------------------------------------------------------------------------------
5,705 EnCana Corp. 270,930
- --------------------------------------------------------------------------------
18,395 Exxon Mobil Corp. 1,313,771
- --------------------------------------------------------------------------------
11,197 Occidental Petroleum Corp. 525,587
- --------------------------------------------------------------------------------
3,466,528
- --------------------------------------------------------------------------------
PAPER & FOREST PRODUCTS - 0.3%
- --------------------------------------------------------------------------------
5,962 MeadWestvaco Corp. 164,074
- --------------------------------------------------------------------------------
PHARMACEUTICALS - 5.7%
- --------------------------------------------------------------------------------
14,824 Abbott Laboratories 704,289
- --------------------------------------------------------------------------------
3,686 AstraZeneca plc ADR 216,368
- --------------------------------------------------------------------------------
12,384 Merck & Co., Inc. 562,481
- --------------------------------------------------------------------------------
7,344 Novartis AG ADR 446,001
- --------------------------------------------------------------------------------
18,848 Pfizer Inc. 502,299
- --------------------------------------------------------------------------------
4,807 Wyeth 245,301
- --------------------------------------------------------------------------------
2,676,739
- --------------------------------------------------------------------------------
ROAD & RAIL - 0.9%
- --------------------------------------------------------------------------------
1,570 Burlington Northern
Santa Fe Corp. 121,722
- --------------------------------------------------------------------------------
8,503 CSX Corporation 303,302
- --------------------------------------------------------------------------------
425,024
- --------------------------------------------------------------------------------
See Notes to Financial Statements.
(continued)
- ------
22
Fundamental Equity - Schedule of Investments
OCTOBER 31, 2006
Shares Value
- --------------------------------------------------------------------------------
SEMICONDUCTORS & SEMICONDUCTOR EQUIPMENT - 2.1%
- --------------------------------------------------------------------------------
20,000 Entegris, Inc.(1) $ 224,200
- --------------------------------------------------------------------------------
7,442 Microchip Technology Inc. 245,065
- --------------------------------------------------------------------------------
11,600 Micron Technology, Inc.(1) 167,620
- --------------------------------------------------------------------------------
5,000 NVIDIA Corp.(1) 174,350
- --------------------------------------------------------------------------------
6,003 Texas Instruments Inc. 181,171
- --------------------------------------------------------------------------------
992,406
- --------------------------------------------------------------------------------
SOFTWARE - 1.7%
- --------------------------------------------------------------------------------
4,600 Adobe Systems Inc.(1) 175,950
- --------------------------------------------------------------------------------
17,790 Microsoft Corporation 510,751
- --------------------------------------------------------------------------------
7,300 Oracle Corp.(1) 134,831
- --------------------------------------------------------------------------------
821,532
- --------------------------------------------------------------------------------
SPECIALTY RETAIL - 2.0%
- --------------------------------------------------------------------------------
6,623 Home Depot, Inc. (The) 247,237
- --------------------------------------------------------------------------------
9,059 Office Depot, Inc.(1) 380,387
- --------------------------------------------------------------------------------
4,989 Sherwin-Williams Co. 295,498
- --------------------------------------------------------------------------------
923,122
- --------------------------------------------------------------------------------
TEXTILES, APPAREL & LUXURY GOODS - 0.5%
- --------------------------------------------------------------------------------
2,735 NIKE, Inc. Cl B 251,292
- --------------------------------------------------------------------------------
THRIFTS & MORTGAGE FINANCE - 0.9%
- --------------------------------------------------------------------------------
8,598 Countrywide Financial Corporation 327,755
- --------------------------------------------------------------------------------
4,125 Sovereign Bancorp Inc. 98,423
- --------------------------------------------------------------------------------
426,178
- --------------------------------------------------------------------------------
TOBACCO - 1.0%
- --------------------------------------------------------------------------------
7,348 Reynolds American Inc. 464,100
- --------------------------------------------------------------------------------
TOTAL COMMON STOCKS
(Cost $42,254,724) 45,316,635
- --------------------------------------------------------------------------------
Value
- --------------------------------------------------------------------------------
TEMPORARY CASH INVESTMENTS - 7.4%
- --------------------------------------------------------------------------------
Repurchase Agreement, Bank of America
Securities, LLC, (collateralized by various
U.S. Treasury obligations, 4.875%, 10/31/08,
valued at $2,347,801), in a joint trading
account at 5.24%, dated 10/31/06, due
11/1/06 (Delivery Value $2,300,335) $ 2,300,000
- --------------------------------------------------------------------------------
Repurchase Agreement, Morgan Stanley
Group, Inc., (collateralized by various
U.S. Treasury obligations, 6.375% - 8.125%,
11/15/16 - 8/15/27, valued at $1,229,912),
in a joint trading account at 5.23%, dated
10/31/06, due 11/1/06 (Delivery value $1,200,174) 1,200,000
- --------------------------------------------------------------------------------
TOTAL TEMPORARY CASH INVESTMENTS
(Cost $3,500,000) 3,500,000
- --------------------------------------------------------------------------------
TOTAL INVESTMENT SECURITIES - 103.3%
(Cost $45,754,724) 48,816,635
- --------------------------------------------------------------------------------
OTHER ASSETS AND LIABILITIES - (3.3)% (1,576,848)
- --------------------------------------------------------------------------------
TOTAL NET ASSETS - 100.0% $47,239,787
================================================================================
NOTES TO SCHEDULE OF INVESTMENTS
- --------------------------------------------------------------------------------
ADR = American Depositary Receipt
GDR = Global Depositary Receipt
HOLDRS = Holding Company Depositary Receipts
ORD = Foreign Ordinary Share
(1) Non-income producing.
See Notes to Financial Statements.
- ------
23
New Opportunities II - Performance
TOTAL RETURNS AS OF OCTOBER 31, 2006
-------------------------
AVERAGE ANNUAL RETURNS
- --------------------------------------------------------------------------------
SINCE INCEPTION
1 YEAR 5 YEARS INCEPTION DATE
- --------------------------------------------------------------------------------
INVESTOR CLASS 16.52% 12.29% 9.24% 6/1/01
- --------------------------------------------------------------------------------
RUSSELL 2000 GROWTH INDEX(1) 17.07% 9.51% 4.60%(2) --
- --------------------------------------------------------------------------------
A Class 1/31/03
No sales charge* 16.22% -- 19.11%
With sales charge* 9.54% -- 17.27%
- --------------------------------------------------------------------------------
B Class 1/31/03
No sales charge* 15.46% -- 18.24%
With sales charge* 11.46% -- 17.73%
- --------------------------------------------------------------------------------
C Class 15.24% -- 18.32%(3) 1/31/03
- --------------------------------------------------------------------------------
*Sales charges include initial sales charges and contingent deferred sales
charges (CDSCs), as applicable. A Class shares have a maximum 5.75% initial
sales charge for equity funds and may be subject to a maximum CDSC of 1.00%. B
Class shares redeemed within six years of purchase are subject to a CDSC that
declines from 5.00% during the first year after purchase to 0.00% the sixth year
after purchase. C Class shares redeemed within 12 months of purchase are subject
to a maximum CDSC of 1.00%. Please see the Share Class Information pages for
more about the applicable sales charges for each share class. The SEC requires
that mutual funds provide performance information net of maximum sales charges
in all cases where charges could be applied.
(1) Data provided by Lipper Inc. - A Reuters Company. (c) 2006 Reuters. All
rights reserved. Any copying, republication or redistribution of Lipper
content, including by caching, framing or similar means, is expressly
prohibited without the prior written consent of Lipper. Lipper shall not be
liable for any errors or delays in the content, or for any actions taken in
reliance thereon.
The data contained herein has been obtained from company reports, financial
reporting services, periodicals and other resources believed to be reliable.
Although carefully verified, data on compilations is not guaranteed by
Lipper and may be incomplete. No offer or solicitations to buy or sell any
of the securities herein is being made by Lipper.
(2) Since 5/31/01, the date nearest the Investor Class's inception for which
data are available.
(3) Class returns would have been lower if distribution and service fees had
not been waived from 2/1/03 to 6/30/03 for the C Class shares.
Data presented reflect past performance. Past performance is no guarantee of
future results. Current performance may be higher or lower than the performance
shown. Investment return and principal value will fluctuate, and redemption
value may be more or less than original cost. To obtain performance data current
to the most recent month end, please call 1-800-345-2021 or visit
americancentury.com. Historically small company stocks have been more volatile
than the stocks of larger, more established companies.
Unless otherwise indicated, performance reflects Investor Class shares;
performance for other share classes will vary due to differences in fee
structure. For information about other share classes available, please consult
the prospectus. Data assumes reinvestment of dividends and capital gains, and
none of the charts reflect the deduction of taxes that a shareholder would pay
on fund distributions or the redemption of fund shares. Returns for the index
are provided for comparison. The fund's total returns include operating expenses
(such as transaction costs and management fees) that reduce returns, while the
total returns of the index do not.
(continued)
- ------
24
New Opportunities II - Performance
GROWTH OF $10,000 OVER LIFE OF CLASS
$10,000 investment made June 1, 2001
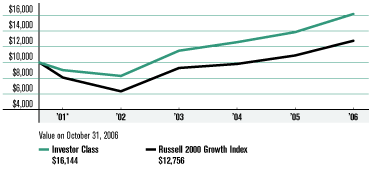
ONE-YEAR RETURNS OVER LIFE OF CLASS
Periods ended October 31
- --------------------------------------------------------------------------------
2001* 2002 2003 2004 2005 2006
- --------------------------------------------------------------------------------
Investor Class -9.60% -8.19% 38.55% 9.39% 10.14% 16.52%
- --------------------------------------------------------------------------------
Russell 2000
Growth Index -19.01% -21.57% 46.56% 5.53% 10.91% 17.07%
- --------------------------------------------------------------------------------
*From 6/1/01, the Investor Class's inception date. Index data from 5/31/01, the
date nearest the Investor Class's inception for which data are available. Not
annualized.
Data presented reflect past performance. Past performance is no guarantee of
future results. Current performance may be higher or lower than the performance
shown. Investment return and principal value will fluctuate, and redemption
value may be more or less than original cost. To obtain performance data current
to the most recent month end, please call 1-800-345-2021 or visit
americancentury.com. Historically small company stocks have been more volatile
than the stocks of larger, more established companies.
Unless otherwise indicated, performance reflects Investor Class shares;
performance for other share classes will vary due to differences in fee
structure. For information about other share classes available, please consult
the prospectus. Data assumes reinvestment of dividends and capital gains, and
none of the charts reflect the deduction of taxes that a shareholder would pay
on fund distributions or the redemption of fund shares. Returns for the index
are provided for comparison. The fund's total returns include operating expenses
(such as transaction costs and management fees) that reduce returns, while the
total returns of the index do not.
- ------
25
New Opportunities II - Portfolio Commentary
PORTFOLIO MANAGERS: HAROLD BRADLEY, STAFFORD SOUTHWICK, AND MATT FERRETTI
PERFORMANCE SUMMARY
New Opportunities II advanced 16.52%* during the 12 months ended October 31,
2006, compared with the 17.07% return of its benchmark, the Russell 2000 Growth
Index.
As outlined in the Market Perspective on page 2, a pause in the Federal
Reserve's interest rate hikes and expectations for lower interest rates and mild
inflation going forward helped New Opportunities II post its highest fiscal-year
return since 2003. Small-cap stocks outpaced large-cap stocks for the period,
particularly in the first six months. The portfolio outperformed its benchmark
during that time, as the directional trend in the market suited the portfolio's
focus on share-price momentum and earnings growth acceleration.
In the second half of the period, though, the performance of large-cap stocks
improved as economic growth slowed. Small-caps lagged, with the Russell 2000
Index falling 10.27% between May 1 and July 15. The portfolio struggled to
adjust to this quick transition, especially as growth and momentum factors that
fit our investment style fell out of favor late in the period.
The June-September time period was the most adverse for growth and momentum
investment factors in 11 quarters. The fund typically does not generate excess
returns during market cycles when growth and momentum factors rotate out of
favor. Also, stock selection in the health care and technology sectors hurt
relative performance.
Despite its recent challenges, the portfolio ranked in the 19th percentile of
its Morningstar category (81st out of 529 funds)** in the five-year period ended
October 31, 2006. In that five-year period, the portfolio returned an annual
average of 12.29%, compared with 9.51% for its benchmark.
MANAGEMENT CHANGES
In April 2006, Stafford Southwick, formerly an investment analyst on the New
Opportunities II team, was named co-portfolio manager of the fund. On June 30,
2006, portfolio manager Tom Telford switched responsibilities, leaving New
Opportunities II to co-manage another American Century mutual fund. Matt
Ferretti, a four-year American Century veteran and investment analyst for New
TOP TEN HOLDINGS
AS OF OCTOBER 31, 2006
- --------------------------------------------------------------------------------
% OF % OF
NET ASSETS NET ASSETS
AS OF AS OF
10/31/06 4/30/06
- --------------------------------------------------------------------------------
World Acceptance Corp. 2.2% --
- --------------------------------------------------------------------------------
Omnicell Inc. 2.0% --
- --------------------------------------------------------------------------------
OM Group, Inc. 1.9% --
- --------------------------------------------------------------------------------
Illumina, Inc. 1.8% --
- --------------------------------------------------------------------------------
Digital River Inc. 1.6% 0.9%
- --------------------------------------------------------------------------------
RenaissanceRe
Holdings Ltd. 1.5% --
- --------------------------------------------------------------------------------
Priceline.com Inc. 1.4% --
- --------------------------------------------------------------------------------
WellCare Health
Plans Inc. 1.4% --
- --------------------------------------------------------------------------------
Watson Wyatt
Worldwide Inc. 1.4% 1.1%
- --------------------------------------------------------------------------------
i2 Technologies Inc. 1.4% --
- --------------------------------------------------------------------------------
*All fund returns referenced in this commentary are for Investor Class shares
**(c) 2006 Morningstar, Inc. All Rights Reserved. The information contained
herein: (1) is proprietary to Morningstar and/or its content providers: (2) may
not be copied or distributed; and (3) is not warranted to be accurate, complete
or timely. Neither Morningstar nor its content providers are responsible for any
damages or losses arising from any use of this information. Morningstar Rankings
are based on risk adjusted returns.
(continued)
- ------
26
New Opportunities II - Portfolio Commentary
Opportunities II, succeeded Telford as co-manager of the portfolio.
MATERIALS ROLLED
New Opportunities II took advantage of an upward trend in the materials sector
early in the 12-month period, as that sector surged with commodity prices. For
the full period, both an overweight position and sound security selection in
that sector boosted the portfolio's relative performance considerably.
The materials sector contained the portfolio's largest average overweight
position in the reporting period, Titanium Metals. For the second consecutive
fiscal year, this maker of lightweight titanium materials for the aircraft
industry topped the portfolio's list of leading individual stock performers, as
its shares surged 149%. Two other companies in the sector, Zoltek and OM Group,
also ranked among the portfolio's top five relative contributors.
TROUBLE IN HEALTH CARE, TECHNOLOGY
The bulk of New Opportunities II's relative underperformance stemmed from our
stock choices in health care and technology, including the portfolio's leading
detractor, Quidel Corp. Quidel makes diagnostic test kits, including one for
detecting the flu. Its share price plunged in late 2005, and we sold our stake
in the company.
The portfolio also suffered from security selection in the industrials sector,
primarily from a stake in GrafTech International, an Ohio-based maker of fuel
cells. The company lost more than a third of its market value in one trading
session in early February 2006, a month before it reported a significant decline
in its fourth-quarter 2005 operating profit.
PORTFOLIO OBJECTIVE & EXPECTATIONS
New Opportunities II seeks long-term growth and is designed to provide small-cap
exposure to a diversified investment portfolio. The portfolio is best suited for
investors who can tolerate high levels of share price fluctuation in exchange
for compelling long-term return potential. To achieve our objective, we pursue
an investment approach of 1) identifying small companies that appear to have
accelerating earnings and revenue growth and 2) buying those companies when
potential rewards appear greatest.
TOP FIVE INDUSTRIES
AS OF OCTOBER 31, 2006
- --------------------------------------------------------------------------------
% OF % OF
NET ASSETS NET ASSETS
AS OF AS OF
10/31/06 4/30/06
- --------------------------------------------------------------------------------
Internet Software
& Services 6.9% 1.9%
- --------------------------------------------------------------------------------
Insurance 5.6% --
- --------------------------------------------------------------------------------
Commercial Services
& Supplies 5.5% 4.9%
- --------------------------------------------------------------------------------
Software 5.3% 2.2%
- --------------------------------------------------------------------------------
Semiconductors &
Semiconductor Equipment 4.1% 6.6%
- --------------------------------------------------------------------------------
TYPES OF INVESTMENTS IN PORTFOLIO
- --------------------------------------------------------------------------------
% OF % OF
NET ASSETS NET ASSETS
AS OF AS OF
10/31/06 4/30/06
- --------------------------------------------------------------------------------
Domestic Common Stocks 86.8% 79.0%
- --------------------------------------------------------------------------------
Foreign Common Stocks(1) 11.6% 17.0%
- --------------------------------------------------------------------------------
TOTAL COMMON STOCKS 98.4% 96.0%
- --------------------------------------------------------------------------------
Temporary
Cash Investments 5.2% 0.4%
- --------------------------------------------------------------------------------
Other Assets
and Liabilities (3.6)% 3.6%
- --------------------------------------------------------------------------------
(1) Includes depositary shares, dual listed securities and foreign
ordinary shares.
- ------
27
New Opportunities II - Schedule of Investments
OCTOBER 31, 2006
Shares Value
- --------------------------------------------------------------------------------
COMMON STOCKS -- 98.4%
- --------------------------------------------------------------------------------
AEROSPACE & DEFENSE - 1.1%
- --------------------------------------------------------------------------------
81,181 Orbital Sciences Corp.(1) $ 1,474,247
- --------------------------------------------------------------------------------
AIRLINES - 2.0%
- --------------------------------------------------------------------------------
35,084 Copa Holdings SA Cl A 1,329,684
- --------------------------------------------------------------------------------
165,901 Frontier Airlines Holdings, Inc.(1) 1,333,844
- --------------------------------------------------------------------------------
2,663,528
- --------------------------------------------------------------------------------
AUTO COMPONENTS - 1.2%
- --------------------------------------------------------------------------------
69,620 LKQ Corporation(1) 1,611,007
- --------------------------------------------------------------------------------
BIOTECHNOLOGY - 1.0%
- --------------------------------------------------------------------------------
29,254 Digene Corp.(1) 1,358,263
- --------------------------------------------------------------------------------
CAPITAL MARKETS - 1.0%
- --------------------------------------------------------------------------------
72,664 Ares Capital Corp. 1,346,464
- --------------------------------------------------------------------------------
CHEMICALS - 2.9%
- --------------------------------------------------------------------------------
44,238 OM Group, Inc.(1) 2,521,566
- --------------------------------------------------------------------------------
49,770 Zoltek Companies, Inc.(1) 1,247,734
- --------------------------------------------------------------------------------
3,769,300
- --------------------------------------------------------------------------------
COMMERCIAL BANKS - 2.3%
- --------------------------------------------------------------------------------
25,252 Ameris Bancorp 704,783
- --------------------------------------------------------------------------------
42,017 Cascade Bancorp 1,531,940
- --------------------------------------------------------------------------------
24,424 Enterprise Financial
Services Corp. 827,241
- --------------------------------------------------------------------------------
3,063,964
- --------------------------------------------------------------------------------
COMMERCIAL SERVICES & SUPPLIES - 5.5%
- --------------------------------------------------------------------------------
30,804 Homeserve plc ORD 1,045,371
- --------------------------------------------------------------------------------
68,551 Knoll Inc. 1,357,310
- --------------------------------------------------------------------------------
76,173 Korn/Ferry International(1) 1,684,185
- --------------------------------------------------------------------------------
43,055 Mobile Mini Inc.(1) 1,385,079
- --------------------------------------------------------------------------------
41,425 Watson Wyatt Worldwide Inc. 1,870,339
- --------------------------------------------------------------------------------
7,342,284
- --------------------------------------------------------------------------------
COMMUNICATIONS EQUIPMENT - 2.5%
- --------------------------------------------------------------------------------
78,046 Oplink Communications Inc.(1) 1,545,311
- --------------------------------------------------------------------------------
21,203 SafeNet Inc.(1) 453,744
- --------------------------------------------------------------------------------
161,451 Symmetricom Inc.(1) 1,367,490
- --------------------------------------------------------------------------------
3,366,545
- --------------------------------------------------------------------------------
COMPUTERS & PERIPHERALS - 2.0%
- --------------------------------------------------------------------------------
71,340 QLogic Corp.(1) 1,468,177
- --------------------------------------------------------------------------------
132,320 SimpleTech, Inc.(1) 1,145,891
- --------------------------------------------------------------------------------
2,614,068
- --------------------------------------------------------------------------------
CONSUMER FINANCE - 3.5%
- --------------------------------------------------------------------------------
24,880 First Marblehead Corp. (The) 1,678,156
- --------------------------------------------------------------------------------
59,194 World Acceptance Corp.(1) 2,959,108
- --------------------------------------------------------------------------------
4,637,264
- --------------------------------------------------------------------------------
CONTAINERS & PACKAGING - 2.1%
- --------------------------------------------------------------------------------
74,356 Myers Industries Inc. 1,347,331
- --------------------------------------------------------------------------------
35,758 Silgan Holdings Inc. 1,479,308
- --------------------------------------------------------------------------------
2,826,639
- --------------------------------------------------------------------------------
Shares Value
- --------------------------------------------------------------------------------
DIVERSIFIED TELECOMMUNICATION
SERVICES - 0.8%
- --------------------------------------------------------------------------------
72,462 Nortel Inversora SA Cl B ADR(1) $ 655,781
- --------------------------------------------------------------------------------
25,551 Telecom Argentina SA ADR(1) 385,820
- --------------------------------------------------------------------------------
1,041,601
- --------------------------------------------------------------------------------
ELECTRIC UTILITIES - 1.2%
- --------------------------------------------------------------------------------
48,210 Great Plains Energy Inc. 1,568,753
- --------------------------------------------------------------------------------
ELECTRICAL EQUIPMENT - 1.3%
- --------------------------------------------------------------------------------
17,180 AZZ Inc.(1) 649,576
- --------------------------------------------------------------------------------
35,436 LSI Industries Inc. 636,076
- --------------------------------------------------------------------------------
40,691 Ultralife Batteries Inc.(1) 487,885
- --------------------------------------------------------------------------------
1,773,537
- --------------------------------------------------------------------------------
ELECTRONIC EQUIPMENT
& INSTRUMENTS - 2.4%
- --------------------------------------------------------------------------------
207,836 Bell Microproducts Inc.(1) 1,400,815
- --------------------------------------------------------------------------------
26,040 Rogers Corp.(1) 1,822,018
- --------------------------------------------------------------------------------
3,222,833
- --------------------------------------------------------------------------------
ENERGY EQUIPMENT & SERVICES - 1.4%
- --------------------------------------------------------------------------------
61,080 Acergy SA ADR(1) 1,108,602
- --------------------------------------------------------------------------------
25,743 Gulf Island Fabrication Inc. 757,359
- --------------------------------------------------------------------------------
1,865,961
- --------------------------------------------------------------------------------
FOOD & STAPLES RETAILING - 1.1%
- --------------------------------------------------------------------------------
69,382 Spartan Stores, Inc. 1,434,820
- --------------------------------------------------------------------------------
FOOD PRODUCTS - 1.2%
- --------------------------------------------------------------------------------
43,328 Corn Products International Inc. 1,568,040
- --------------------------------------------------------------------------------
HEALTH CARE EQUIPMENT
& SUPPLIES - 3.5%
- --------------------------------------------------------------------------------
25,165 China Medical
Technologies Inc. ADR(1) 639,191
- --------------------------------------------------------------------------------
26,540 Cooper Companies, Inc. (The) 1,529,500
- --------------------------------------------------------------------------------
53,530 Cynosure Inc. Cl A(1) 984,952
- --------------------------------------------------------------------------------
95,807 I-Flow Corp.(1) 1,485,967
- --------------------------------------------------------------------------------
4,639,610
- --------------------------------------------------------------------------------
HEALTH CARE PROVIDERS
& SERVICES - 3.9%
- --------------------------------------------------------------------------------
44,430 Matria Healthcare Inc.(1) 1,252,926
- --------------------------------------------------------------------------------
108,122 Option Care Inc. 1,369,906
- --------------------------------------------------------------------------------
74,475 Rural/Metro Corp.(1) 651,656
- --------------------------------------------------------------------------------
32,130 WellCare Health Plans Inc.(1) 1,887,637
- --------------------------------------------------------------------------------
5,162,125
- --------------------------------------------------------------------------------
HEALTH CARE TECHNOLOGY - 3.0%
- --------------------------------------------------------------------------------
55,700 Allscripts Healthcare
Solutions Inc.(1) 1,313,963
- --------------------------------------------------------------------------------
142,953 Omnicell Inc.(1) 2,677,510
- --------------------------------------------------------------------------------
3,991,473
- --------------------------------------------------------------------------------
HOTELS, RESTAURANTS & LEISURE - 1.3%
- --------------------------------------------------------------------------------
33,120 Life Time Fitness Inc.(1) 1,706,674
- --------------------------------------------------------------------------------
See Notes to Financial Statements.
(continued)
- ------
28
New Opportunities II - Schedule of Investments
OCTOBER 31, 2006
Shares Value
- --------------------------------------------------------------------------------
HOUSEHOLD DURABLES - 2.1%
- --------------------------------------------------------------------------------
276,776 Syntax-Brillian Corp.(1) $ 1,757,528
- --------------------------------------------------------------------------------
42,830 Universal Electronics Inc.(1) 926,413
- --------------------------------------------------------------------------------
2,683,941
- --------------------------------------------------------------------------------
INSURANCE - 5.6%
- --------------------------------------------------------------------------------
48,748 IPC Holdings, Ltd. 1,464,390
- --------------------------------------------------------------------------------
29,763 Navigators Group Inc.(1) 1,400,944
- --------------------------------------------------------------------------------
29,829 Reinsurance Group of America 1,682,356
- --------------------------------------------------------------------------------
35,384 RenaissanceRe Holdings Ltd. 1,924,890
- --------------------------------------------------------------------------------
102,753 Specialty Underwriters'
Alliance Inc.(1) 956,630
- --------------------------------------------------------------------------------
7,429,210
- --------------------------------------------------------------------------------
INTERNET & CATALOG RETAIL - 3.7%
- --------------------------------------------------------------------------------
37,770 Blue Nile Inc.(1) 1,443,192
- --------------------------------------------------------------------------------
52,340 Coldwater Creek Inc.(1) 1,595,847
- --------------------------------------------------------------------------------
47,028 Priceline.com Inc.(1) 1,894,757
- --------------------------------------------------------------------------------
4,933,796
- --------------------------------------------------------------------------------
INTERNET SOFTWARE & SERVICES - 6.9%
- --------------------------------------------------------------------------------
140,011 24/7 Real Media, Inc.(1) 1,386,109
- --------------------------------------------------------------------------------
36,577 Digital River Inc.(1) 2,115,980
- --------------------------------------------------------------------------------
116,676 Interwoven Inc.(1) 1,484,119
- --------------------------------------------------------------------------------
167,014 SonicWALL, Inc.(1) 1,753,647
- --------------------------------------------------------------------------------
82,718 Valueclick Inc.(1) 1,555,098
- --------------------------------------------------------------------------------
55,671 Vocus Inc.(1) 902,984
- --------------------------------------------------------------------------------
9,197,937
- --------------------------------------------------------------------------------
IT SERVICES - 1.1%
- --------------------------------------------------------------------------------
56,722 Syntel Inc. 1,420,886
- --------------------------------------------------------------------------------
LIFE SCIENCES TOOLS & SERVICES - 1.8%
- --------------------------------------------------------------------------------
53,303 Illumina, Inc.(1) 2,343,200
- --------------------------------------------------------------------------------
MACHINERY - 3.9%
- --------------------------------------------------------------------------------
41,156 CIRCOR International Inc. 1,356,913
- --------------------------------------------------------------------------------
109,775 Deutz AG ORD(1) 1,105,825
- --------------------------------------------------------------------------------
28,174 Manitowoc Co., Inc. (The) 1,546,189
- --------------------------------------------------------------------------------
88,577 TurboChef Technologies Inc.(1) 1,098,355
- --------------------------------------------------------------------------------
5,107,282
- --------------------------------------------------------------------------------
MARINE - 2.3%
- --------------------------------------------------------------------------------
106,942 Diana Shipping Inc. 1,598,783
- --------------------------------------------------------------------------------
82,910 Eagle Bulk Shipping Inc. 1,424,394
- --------------------------------------------------------------------------------
3,023,177
- --------------------------------------------------------------------------------
METALS & MINING - 1.1%
- --------------------------------------------------------------------------------
23,302 RTI International Metals, Inc.(1) 1,428,879
- --------------------------------------------------------------------------------
PHARMACEUTICALS - 3.2%
- --------------------------------------------------------------------------------
105,246 Dr. Reddy's
Laboratories Ltd. ADR 1,768,133
- --------------------------------------------------------------------------------
73,263 Matrixx Initiatives Inc.(1) 1,605,192
- --------------------------------------------------------------------------------
113,977 Santarus Inc.(1) 876,483
- --------------------------------------------------------------------------------
4,249,808
- --------------------------------------------------------------------------------
Shares Value
- --------------------------------------------------------------------------------
REAL ESTATE INVESTMENT TRUSTS - 2.7%
- --------------------------------------------------------------------------------
30,806 Entertainment Properties Trust $ 1,694,330
- --------------------------------------------------------------------------------
63,940 Highland Hospitality Corp. 883,651
- --------------------------------------------------------------------------------
54,557 JER Investors Trust Inc. 979,844
- --------------------------------------------------------------------------------
3,557,825
- --------------------------------------------------------------------------------
REAL ESTATE MANAGEMENT
& DEVELOPMENT - 0.9%
- --------------------------------------------------------------------------------
81,641 IRSA Inversiones y
Representaciones SA GDR(1) 1,173,181
- --------------------------------------------------------------------------------
SEMICONDUCTORS &
SEMICONDUCTOR EQUIPMENT - 4.1%
- --------------------------------------------------------------------------------
19,153 NVE Corp.(1) 851,351
- --------------------------------------------------------------------------------
75,804 Rudolph Technologies Inc.(1) 1,338,698
- --------------------------------------------------------------------------------
79,561 Silicon Motion
Technology Corp. ADR(1) 1,222,853
- --------------------------------------------------------------------------------
26,460 Standard Microsystems Corp.(1) 815,762
- --------------------------------------------------------------------------------
36,030 Tessera Technologies Inc.(1) 1,257,807
- --------------------------------------------------------------------------------
5,486,471
- --------------------------------------------------------------------------------
SOFTWARE - 5.3%
- --------------------------------------------------------------------------------
65,641 Altiris Inc.(1) 1,477,579
- --------------------------------------------------------------------------------
91,790 Applix Inc.(1) 972,056
- --------------------------------------------------------------------------------
36,091 Hyperion Solutions Corp.(1) 1,349,803
- --------------------------------------------------------------------------------
90,638 i2 Technologies Inc.(1) 1,831,794
- --------------------------------------------------------------------------------
123,966 VASCO Data Security
International, Inc.(1) 1,436,766
- --------------------------------------------------------------------------------
7,067,998
- --------------------------------------------------------------------------------
SPECIALTY RETAIL - 2.2%
- --------------------------------------------------------------------------------
65,114 Cache Inc.(1) 1,396,695
- --------------------------------------------------------------------------------
245,374 Wet Seal, Inc. (The) Cl A(1) 1,531,134
- --------------------------------------------------------------------------------
2,927,829
- --------------------------------------------------------------------------------
TEXTILES, APPAREL & LUXURY GOODS - 3.3%
- --------------------------------------------------------------------------------
25,802 Deckers Outdoor Corp.(1) 1,371,892
- --------------------------------------------------------------------------------
80,813 Maidenform Brands, Inc.(1) 1,790,008
- --------------------------------------------------------------------------------
91,795 Xerium Technologies, Inc. 1,136,422
- --------------------------------------------------------------------------------
4,298,322
- --------------------------------------------------------------------------------
TOTAL COMMON STOCKS
(Cost $115,249,471) 130,378,742
- --------------------------------------------------------------------------------
See Notes to Financial Statements.
(continued)
- ------
29
New Opportunities II - Schedule of Investments
OCTOBER 31, 2006
Value
- --------------------------------------------------------------------------------
TEMPORARY CASH INVESTMENTS - 5.2%
- --------------------------------------------------------------------------------
Repurchase Agreement, Merrill Lynch & Co., Inc.,
(collateralized by various U.S. Treasury obligations,
8.75%, 8/15/20, valued at $307,375), in a joint
trading account at 5.22%, dated 10/31/06,
due 11/1/06 (Delivery value $300,044) $ 300,000
- --------------------------------------------------------------------------------
Repurchase Agreement, Morgan Stanley
Group, Inc., (collateralized by various
U.S. Treasury obligations, 6.375% - 8.125%,
11/15/16 - 8/15/27, valued at $6,764,517),
in a joint trading account at 5.23%,
dated 10/31/06, due 11/1/06
(Delivery value $6,600,959) 6,600,000
- --------------------------------------------------------------------------------
TOTAL TEMPORARY CASH INVESTMENTS
(Cost $6,900,000) 6,900,000
- --------------------------------------------------------------------------------
Value
- --------------------------------------------------------------------------------
TOTAL INVESTMENT SECURITIES - 103.6%
(Cost $122,149,471) $137,278,742
- --------------------------------------------------------------------------------
OTHER ASSETS AND
LIABILITIES - (3.6)% (4,752,714)
- --------------------------------------------------------------------------------
TOTAL NET ASSETS - 100.0% $132,526,028
================================================================================
NOTES TO SCHEDULE OF INVESTMENTS
- --------------------------------------------------------------------------------
ADR = American Depositary Receipt
GDR = Global Depositary Receipt
ORD = Foreign Ordinary Share
(1) Non-income producing.
See Notes to Financial Statements.
- ------
30
Shareholder Fee Examples (Unaudited)
Fund shareholders may incur two types of costs: (1) transaction costs, including
sales charges (loads) on purchase payments and redemption/exchange fees; and (2)
ongoing costs, including management fees; distribution and service (12b-1) fees;
and other fund expenses. This example is intended to help you understand your
ongoing costs (in dollars) of investing in your fund and to compare these costs
with the ongoing cost of investing in other mutual funds.
The example is based on an investment of $1,000 made at the beginning of the
period and held for the entire period from May 1, 2006 to October 31, 2006.
ACTUAL EXPENSES
The table provides information about actual account values and actual expenses
for each class. You may use the information, together with the amount you
invested, to estimate the expenses that you paid over the period. First,
identify the share class you own. Then simply divide your account value by
$1,000 (for example, an $8,600 account value divided by $1,000 = 8.6), then
multiply the result by the number under the heading "Expenses Paid During
Period" to estimate the expenses you paid on your account during this period.
If you hold Investor Class shares of any American Century fund, or Institutional
Class shares of the American Century Diversified Bond Fund, in an American
Century account (i.e., not a financial intermediary or retirement plan account),
American Century may charge you a $12.50 semiannual account maintenance fee if
the value of those shares is less than $10,000. We will redeem shares
automatically in one of your accounts to pay the $12.50 fee. In determining your
total eligible investment amount, we will include your investments in all
PERSONAL ACCOUNTS (including American Century Brokerage accounts) registered
under your Social Security number. PERSONAL ACCOUNTS include individual
accounts, joint accounts, UGMA/UTMA accounts, personal trusts, Coverdell
Education Savings Accounts and IRAs (including traditional, Roth, Rollover,
SEP-, SARSEP- and SIMPLE-IRAs), and certain other retirement accounts. If you
have only business, business retirement, employer-sponsored or American Century
Brokerage accounts, you are currently not subject to this fee. We will not
charge the fee as long as you choose to manage your accounts exclusively online.
If you are subject to the Account Maintenance Fee, your account value could be
reduced by the fee amount.
HYPOTHETICAL EXAMPLE FOR COMPARISON PURPOSES
The table also provides information about hypothetical account values and
hypothetical expenses based on the actual expense ratio of each class of your
fund and an assumed rate of return of 5% per year before expenses, which is not
the actual return of a fund's share class. The hypothetical account values and
expenses may not be used to estimate the actual ending account balance or
expenses you paid for the period. You may use this information to compare the
ongoing costs of investing in your fund and other funds. To do so, compare this
5% hypothetical example with the 5% hypothetical examples that appear in the
shareholder reports of the other funds.
(continued)
- ------
31
Shareholder Fee Examples (Unaudited)
Please note that the expenses shown in the table are meant to highlight your
ongoing costs only and do not reflect any transactional costs, such as sales
charges (loads) or redemption/exchange fees. Therefore, the table is useful in
comparing ongoing costs only, and will not help you determine the relative total
costs of owning different funds. In addition, if these transactional costs were
included, your costs would have been higher.
- --------------------------------------------------------------------------------
EXPENSES PAID
BEGINNING ENDING DURING PERIOD* ANNUALIZED
ACCOUNT VALUE ACCOUNT VALUE 5/1/06 -- EXPENSE
5/1/06 10/31/06 10/31/06 RATIO*
- --------------------------------------------------------------------------------
SELECT SHAREHOLDER FEE EXAMPLE
- --------------------------------------------------------------------------------
ACTUAL
- --------------------------------------------------------------------------------
Investor Class $1,000 $964.80 $4.95 1.00%
- --------------------------------------------------------------------------------
Institutional
Class $1,000 $965.90 $3.96 0.80%
- --------------------------------------------------------------------------------
Advisor Class $1,000 $963.90 $6.19 1.25%
- --------------------------------------------------------------------------------
A Class $1,000 $963.60 $6.19 1.25%
- --------------------------------------------------------------------------------
B Class $1,000 $960.20 $9.88 2.00%
- --------------------------------------------------------------------------------
C Class $1,000 $960.20 $9.88 2.00%
- --------------------------------------------------------------------------------
R Class $1,000 $962.60 $7.42 1.50%
- --------------------------------------------------------------------------------
HYPOTHETICAL
- --------------------------------------------------------------------------------
Investor Class $1,000 $1,020.16 $5.09 1.00%
- --------------------------------------------------------------------------------
Institutional
Class $1,000 $1,021.17 $4.08 0.80%
- --------------------------------------------------------------------------------
Advisor Class $1,000 $1,018.90 $6.36 1.25%
- --------------------------------------------------------------------------------
A Class $1,000 $1,018.90 $6.36 1.25%
- --------------------------------------------------------------------------------
B Class $1,000 $1,015.12 $10.16 2.00%
- --------------------------------------------------------------------------------
C Class $1,000 $1,015.12 $10.16 2.00%
- --------------------------------------------------------------------------------
R Class $1,000 $1,017.64 $7.63 1.50%
- --------------------------------------------------------------------------------
*Expenses are equal to the class's annualized expense ratio listed in the
table above, multiplied by the average account value over the period, multiplied
by 184, the number of days in the most recent fiscal half-year, divided by 365,
to reflect the one-half year period.
(continued)
- ------
32
Shareholder Fee Examples (Unaudited)
- --------------------------------------------------------------------------------
EXPENSES PAID
BEGINNING ENDING DURING PERIOD* ANNUALIZED
ACCOUNT VALUE ACCOUNT VALUE 5/1/06 -- EXPENSE
5/1/06 10/31/06 10/31/06 RATIO*
- --------------------------------------------------------------------------------
CAPITAL GROWTH SHAREHOLDER FEE EXAMPLE
- --------------------------------------------------------------------------------
ACTUAL
- --------------------------------------------------------------------------------
Investor Class $1,000 $1,045.10 $5.15 1.00%
- --------------------------------------------------------------------------------
Institutional Class $1,000 $1,045.90 $4.13 0.80%
- --------------------------------------------------------------------------------
A Class $1,000 $1,044.30 $6.44 1.25%
- --------------------------------------------------------------------------------
B Class $1,000 $1,040.60 $10.29 2.00%
- --------------------------------------------------------------------------------
C Class $1,000 $1,040.60 $10.29 2.00%
- --------------------------------------------------------------------------------
R Class $1,000 $1,042.60 $7.72 1.50%
- --------------------------------------------------------------------------------
HYPOTHETICAL
- --------------------------------------------------------------------------------
Investor Class $1,000 $1,020.16 $5.09 1.00%
- --------------------------------------------------------------------------------
Institutional Class $1,000 $1,021.17 $4.08 0.80%
- --------------------------------------------------------------------------------
A Class $1,000 $1,018.90 $6.36 1.25%
- --------------------------------------------------------------------------------
B Class $1,000 $1,015.12 $10.16 2.00%
- --------------------------------------------------------------------------------
C Class $1,000 $1,015.12 $10.16 2.00%
- --------------------------------------------------------------------------------
R Class $1,000 $1,017.64 $7.63 1.50%
- --------------------------------------------------------------------------------
FUNDAMENTAL EQUITY SHAREHOLDER FEE EXAMPLE
- --------------------------------------------------------------------------------
ACTUAL
- --------------------------------------------------------------------------------
Investor Class $1,000 $1,072.40 $5.22 1.00%
- --------------------------------------------------------------------------------
Institutional Class $1,000 $1,073.20 $4.18 0.80%
- --------------------------------------------------------------------------------
A Class $1,000 $1,070.80 $6.52 1.25%
- --------------------------------------------------------------------------------
B Class $1,000 $1,066.10 $10.42 2.00%
- --------------------------------------------------------------------------------
C Class $1,000 $1,066.90 $10.42 2.00%
- --------------------------------------------------------------------------------
R Class $1,000 $1,069.30 $7.82 1.50%
- --------------------------------------------------------------------------------
HYPOTHETICAL
- --------------------------------------------------------------------------------
Investor Class $1,000 $1,020.16 $5.09 1.00%
- --------------------------------------------------------------------------------
Institutional Class $1,000 $1,021.17 $4.08 0.80%
- --------------------------------------------------------------------------------
A Class $1,000 $1,018.90 $6.36 1.25%
- --------------------------------------------------------------------------------
B Class $1,000 $1,015.12 $10.16 2.00%
- --------------------------------------------------------------------------------
C Class $1,000 $1,015.12 $10.16 2.00%
- --------------------------------------------------------------------------------
R Class $1,000 $1,017.64 $7.63 1.50%
- --------------------------------------------------------------------------------
*Expenses are equal to the class's annualized expense ratio listed in the
table above, multiplied by the average account value over the period, multiplied
by 184, the number of days in the most recent fiscal half-year, divided by 365,
to reflect the one-half year period.
(continued)
- ------
33
Shareholder Fee Examples (Unaudited)
- --------------------------------------------------------------------------------
EXPENSES PAID
BEGINNING ENDING DURING PERIOD* ANNUALIZED
ACCOUNT VALUE ACCOUNT VALUE 5/1/06 -- EXPENSE
5/1/06 10/31/06 10/31/06 RATIO*
- --------------------------------------------------------------------------------
NEW OPPORTUNITIES II SHAREHOLDER FEE EXAMPLE
- --------------------------------------------------------------------------------
ACTUAL
- --------------------------------------------------------------------------------
Investor Class $1,000 $943.10 $7.35 1.50%
- --------------------------------------------------------------------------------
A Class $1,000 $941.70 $8.56 1.75%
- --------------------------------------------------------------------------------
B Class $1,000 $938.70 $12.22 2.50%
- --------------------------------------------------------------------------------
C Class $1,000 $937.70 $12.21 2.50%
- --------------------------------------------------------------------------------
HYPOTHETICAL
- --------------------------------------------------------------------------------
Investor Class $1,000 $1,017.64 $7.63 1.50%
- --------------------------------------------------------------------------------
A Class $1,000 $1,016.38 $8.89 1.75%
- --------------------------------------------------------------------------------
B Class $1,000 $1,012.60 $12.68 2.50%
- --------------------------------------------------------------------------------
C Class $1,000 $1,012.60 $12.68 2.50%
- --------------------------------------------------------------------------------
*Expenses are equal to the class's annualized expense ratio listed in the
table above, multiplied by the average account value over the period, multiplied
by 184, the number of days in the most recent fiscal half-year, divided by 365,
to reflect the one-half year period.
- ------
34
Statement of Assets and Liabilities
OCTOBER 31, 2006
- -----------------------------------------------------------------------------------------
CAPITAL FUNDAMENTAL NEW
SELECT GROWTH EQUITY OPPORTUNITIES II
- -----------------------------------------------------------------------------------------
ASSETS
- -----------------------------------------------------------------------------------------
Investment securities -- at
value (cost of $2,566,714,734,
$3,640,974, $45,754,724 and
$122,149,471, respectively) --
including $202,251,274, $-- ,
$-- and $-- of securities
on loan, respectively $2,761,852,030 $4,072,704 $48,816,635 $137,278,742
- ------------------------------
Investments made with cash
collateral received for
securities on loan, at value
(cost of $205,067,793, $--,
$-- and $--, respectively) 205,067,793 -- -- --
- -----------------------------------------------------------------------------------------
Total investment securities,
at value (cost of
$2,771,782,527, $3,640,974,
$45,754,724 and
$122,149,471, respectively) 2,966,919,823 4,072,704 48,816,635 137,278,742
- ------------------------------
Cash -- 26,759 320,996 775,865
- ------------------------------
Receivable for
investments sold 51,889,942 32,170 426,585 3,656,987
- ------------------------------
Receivable for
capital shares sold 2,276 200 129,228 78,578
- ------------------------------
Dividends and
interest receivable 2,233,501 1,884 24,409 48,885
- -----------------------------------------------------------------------------------------
3,021,045,542 4,133,717 49,717,853 141,839,057
- -----------------------------------------------------------------------------------------
LIABILITIES
- -----------------------------------------------------------------------------------------
Payable for collateral
received for securities
on loan 205,067,793 -- -- --
- ------------------------------
Disbursements in excess
of demand deposit cash 5,740,885 -- -- --
- ------------------------------
Payable for
investments purchased 25,562,783 40,992 2,431,834 9,106,773
- ------------------------------
Payable for forward foreign
currency exchange contracts 488,551 408 -- --
- ------------------------------
Payable for capital
shares redeemed 7,926 -- -- 23,027
- ------------------------------
Accrued management fees 2,342,411 3,359 34,524 161,839
- ------------------------------
Distribution fees payable 9,323 1,114 3,597 4,842
- ------------------------------
Service fees (and distribution
fees -- A Class and
R Class) payable 12,270 826 8,111 16,548
- -----------------------------------------------------------------------------------------
239,231,942 46,699 2,478,066 9,313,029
- -----------------------------------------------------------------------------------------
NET ASSETS $2,781,813,600 $4,087,018 $47,239,787 $132,526,028
=========================================================================================
See Notes to Financial Statements.
(continued)
- ------
35
Statement of Assets and Liabilities
OCTOBER 31, 2006
- -----------------------------------------------------------------------------------------
CAPITAL FUNDAMENTAL NEW
SELECT GROWTH EQUITY OPPORTUNITIES II
- -----------------------------------------------------------------------------------------
NET ASSETS CONSIST OF:
- -----------------------------------------------------------------------------------------
Capital (par value and
paid-in surplus) $2,542,667,785 $3,614,013 $43,360,425 $105,495,855
- ------------------------------
Undistributed net
investment income 12,433,503 334 64,169 --
- ------------------------------
Undistributed net realized
gain on investment and
foreign currency transactions 32,037,767 41,346 753,283 11,900,903
- ------------------------------
Net unrealized appreciation
on investments and
translation of assets and
liabilities in
foreign currencies 194,674,545 431,325 3,061,910 15,129,270
- -----------------------------------------------------------------------------------------
$2,781,813,600 $4,087,018 $47,239,787 $132,526,028
=========================================================================================
INVESTOR CLASS,
$0.01 PAR VALUE
- -----------------------------------------------------------------------------------------
Net assets $2,575,827,754 $85,622 $3,836,460 $51,335,701
- ------------------------------
Shares outstanding 71,108,631 7,247 297,965 6,730,840
- ------------------------------
Net asset value per share $36.22 $11.81 $12.88 $7.63
- -----------------------------------------------------------------------------------------
INSTITUTIONAL CLASS,
$0.01 PAR VALUE
- -----------------------------------------------------------------------------------------
Net assets $148,716,552 $27,417 $30,590 --
- ------------------------------
Shares outstanding 4,070,548 2,315 2,372 --
- ------------------------------
Net asset value per share $36.53 $11.84 $12.90 --
- -----------------------------------------------------------------------------------------
ADVISOR CLASS, $0.01 PAR VALUE
- -----------------------------------------------------------------------------------------
Net assets $21,455,426 N/A N/A N/A
- ------------------------------
Shares outstanding 599,321 N/A N/A N/A
- ------------------------------
Net asset value per share $35.80 N/A N/A N/A
- -----------------------------------------------------------------------------------------
A CLASS, $0.01 PAR VALUE
- -----------------------------------------------------------------------------------------
Net assets $28,370,869 $2,155,111 $37,314,259 $73,382,881
- ------------------------------
Shares outstanding 787,345 182,998 2,904,013 9,669,110
- ------------------------------
Net asset value per share $36.03 $11.78 $12.85 $7.59
- ------------------------------
Maximum offering price
(net asset value
divided by 0.9425) $38.23 $12.50 $13.63 $8.05
- -----------------------------------------------------------------------------------------
B CLASS, $0.01 PAR VALUE
- -----------------------------------------------------------------------------------------
Net assets $5,879,828 $959,859 $1,498,184 $3,383,061
- ------------------------------
Shares outstanding 167,009 83,159 117,573 451,376
- ------------------------------
Net asset value per share $35.21 $11.54 $12.74 $7.49
- -----------------------------------------------------------------------------------------
C CLASS, $0.01 PAR VALUE
- -----------------------------------------------------------------------------------------
Net assets $1,539,525 $831,831 $4,529,971 $4,424,385
- ------------------------------
Shares outstanding 43,693 72,066 355,416 587,990
- ------------------------------
Net asset value per share $35.24 $11.54 $12.75 $7.52
- -----------------------------------------------------------------------------------------
R CLASS, $0.01 PAR VALUE
- -----------------------------------------------------------------------------------------
Net assets $23,646 $27,178 $30,323 N/A
- ------------------------------
Shares outstanding 656 2,315 2,368 N/A
- ------------------------------
Net asset value per share $36.05 $11.74 $12.81 N/A
- -----------------------------------------------------------------------------------------
See Notes to Financial Statements.
- ------
36
Statement of Operations
YEAR ENDED OCTOBER 31, 2006
- -----------------------------------------------------------------------------------------
CAPITAL FUNDAMENTAL NEW
SELECT GROWTH EQUITY OPPORTUNITIES II
- -----------------------------------------------------------------------------------------
INVESTMENT INCOME (LOSS)
- -----------------------------------------------------------------------------------------
INCOME:
- ------------------------------
Dividends (net of foreign
taxes withheld of $933,906,
$297, $768 and $2,271,
respectively) $ 47,539,197 $ 33,920 $ 260,041 $ 704,437
- ------------------------------
Interest 2,534,418 860 54,278 83,580
- ------------------------------
Securities lending 726,484 -- -- --
- -----------------------------------------------------------------------------------------
50,800,099 34,780 314,319 788,017
- -----------------------------------------------------------------------------------------
EXPENSES:
- ------------------------------
Management fees 31,941,131 33,211 180,758 1,686,269
- ------------------------------
Distribution fees:
- ------------------------------
Advisor Class 65,313 -- -- --
- ------------------------------
B Class 37,557 6,539 7,189 21,615
- ------------------------------
C Class 19,799 5,290 20,218 28,578
- ------------------------------
Service fees:
- ------------------------------
Advisor Class 65,313 -- -- --
- ------------------------------
B Class 12,519 2,180 2,396 7,205
- ------------------------------
C Class 6,600 1,763 6,739 9,526
- ------------------------------
Distribution and service fees:
- ------------------------------
A Class 94,257 4,135 34,530 145,495
- ------------------------------
R Class 120 129 138 --
- ------------------------------
Directors' fees and expenses 49,349 115 473 2,599
- ------------------------------
Other expenses 19,943 10 139 2,496
- -----------------------------------------------------------------------------------------
32,311,901 53,372 252,580 1,903,783
- -----------------------------------------------------------------------------------------
NET INVESTMENT INCOME (LOSS) 18,488,198 (18,592) 61,739 (1,115,766)
- -----------------------------------------------------------------------------------------
REALIZED AND
UNREALIZED GAIN (LOSS)
- -----------------------------------------------------------------------------------------
NET REALIZED GAIN (LOSS) ON:
- ------------------------------
Investment transactions 314,248,035 116,257 764,880 13,317,275
- ------------------------------
Foreign currency transactions (5,823,384) 359 2,430 (27,051)
- -----------------------------------------------------------------------------------------
308,424,651 116,616 767,310 13,290,224
- -----------------------------------------------------------------------------------------
CHANGE IN NET UNREALIZED
APPRECIATION (DEPRECIATION) ON:
- ------------------------------
Investments (375,747,682) 236,552 3,015,872 4,065,418
- ------------------------------
Translation of assets and
liabilities in
foreign currencies (626,612) (910) -- --
- -----------------------------------------------------------------------------------------
(376,374,294) 235,642 3,015,872 4,065,418
- -----------------------------------------------------------------------------------------
NET REALIZED AND
UNREALIZED GAIN (LOSS) (67,949,643) 352,258 3,783,182 17,355,642
- -----------------------------------------------------------------------------------------
NET INCREASE (DECREASE)
IN NET ASSETS
RESULTING FROM OPERATIONS $(49,461,445) $333,666 $3,844,921 $16,239,876
=========================================================================================
See Notes to Financial Statements.
- ------
37
Statement of Changes in Net Assets
YEARS ENDED OCTOBER 31, 2006 AND OCTOBER 31, 2005
- ------------------------------------------------------------------------------------------------------
SELECT CAPITAL GROWTH
- ---------------------------------------------------------------------------------------------------
INCREASE (DECREASE) IN NET ASSETS 2006 2005 2006 2005
- ---------------------------------------------------------------------------------------------------
OPERATIONS
- ---------------------------------------------------------------------------------------------------
Net investment income (loss) $ 18,488,198 $ 16,221,792 $ (18,592) $ (9,094)
- ------------------------------
Net realized gain (loss) 308,424,651 374,124,251 116,616 (35,967)
- ------------------------------
Change in net unrealized
appreciation (depreciation) (376,374,294) (132,726,740) 235,642 155,191
- ---------------------------------------------------------------------------------------------------
Net increase (decrease)
in net assets
resulting from operations (49,461,445) 257,619,303 333,666 110,130
- ---------------------------------------------------------------------------------------------------
DISTRIBUTIONS TO SHAREHOLDERS
- ---------------------------------------------------------------------------------------------------
From net investment income:
- ------------------------------
Investor Class (23,121,134) (8,222,603) -- --
- ------------------------------
Institutional Class (1,850,095) (906,228) -- --
- ------------------------------
Advisor Class (141,382) -- -- --
- ------------------------------
A Class (197,118) -- -- --
- ------------------------------
R Class (138) -- -- --
- ---------------------------------------------------------------------------------------------------
Decrease in net assets
from distributions (25,309,867) (9,128,831) -- --
- ---------------------------------------------------------------------------------------------------
CAPITAL SHARE TRANSACTIONS
- ---------------------------------------------------------------------------------------------------
Net increase (decrease)
in net assets from
capital share transactions (743,988,986) (509,449,921) 1,082,556 1,075,137
- ---------------------------------------------------------------------------------------------------
NET INCREASE (DECREASE)
IN NET ASSETS (818,760,298) (260,959,449) 1,416,222 1,185,267
- ---------------------------------------------------------------------------------------------------
NET ASSETS
- ---------------------------------------------------------------------------------------------------
Beginning of period 3,600,573,898 3,861,533,347 2,670,796 1,485,529
- ---------------------------------------------------------------------------------------------------
End of period $2,781,813,600 $3,600,573,898 $4,087,018 $2,670,796
===================================================================================================
Undistributed net
investment income $12,433,503 $25,079,614 $334 --
===================================================================================================
See Notes to Financial Statements.
(continued)
- ------
38
Statement of Changes in Net Assets
YEARS ENDED OCTOBER 31, 2006 AND OCTOBER 31, 2005 (EXCEPT AS NOTED)
- ---------------------------------------------------------------------------------------------------
FUNDAMENTAL EQUITY NEW OPPORTUNITIES II
- ---------------------------------------------------------------------------------------------------
INCREASE (DECREASE)
IN NET ASSETS 2006 2005(1) 2006 2005
- ---------------------------------------------------------------------------------------------------
OPERATIONS
- ---------------------------------------------------------------------------------------------------
Net investment income (loss) $ 61,739 $ (3,454) $ (1,115,766) $ (939,415)
- ------------------------------
Net realized gain (loss) 767,310 112,336 13,290,224 3,652,851
- ------------------------------
Change in net unrealized
appreciation (depreciation) 3,015,872 46,038 4,065,418 4,324,566
- ---------------------------------------------------------------------------------------------------
Net increase (decrease)
in net assets
resulting from operations 3,844,921 154,920 16,239,876 7,038,002
- ---------------------------------------------------------------------------------------------------
DISTRIBUTIONS TO SHAREHOLDERS
- ---------------------------------------------------------------------------------------------------
From net realized gains:
- ------------------------------
Investor Class (1,402) -- (1,390,699) (1,089,667)
- ------------------------------
Institutional Class (841) -- -- --
- ------------------------------
A Class (84,337) -- (1,464,541) (642,139)
- ------------------------------
B Class (13,834) -- (52,347) (23,007)
- ------------------------------
C Class (19,272) -- (75,960) (25,472)
- ------------------------------
R Class (793) -- -- --
- ---------------------------------------------------------------------------------------------------
Decrease in net assets
from distributions (120,479) -- (2,983,547) (1,780,285)
- ---------------------------------------------------------------------------------------------------
CAPITAL SHARE TRANSACTIONS
- ---------------------------------------------------------------------------------------------------
Net increase (decrease)
in net assets from
capital share transactions 40,641,105 2,719,320 22,395,246 29,905,813
- ---------------------------------------------------------------------------------------------------
NET INCREASE (DECREASE)
IN NET ASSETS 44,365,547 2,874,240 35,651,575 35,163,530
- ---------------------------------------------------------------------------------------------------
NET ASSETS
- ---------------------------------------------------------------------------------------------------
Beginning of period 2,874,240 -- 96,874,453 61,710,923
- ---------------------------------------------------------------------------------------------------
End of period $47,239,787 $2,874,240 $132,526,028 $96,874,453
===================================================================================================
Undistributed net
investment income $64,169 -- -- --
===================================================================================================
(1) November 30, 2004 (fund inception) through October 31, 2005.
See Notes to Financial Statements.
- ------
39
Notes to Financial Statements
OCTOBER 31, 2006
1. ORGANIZATION AND SUMMARY OF SIGNIFICANT ACCOUNTING POLICIES
ORGANIZATION -- American Century Mutual Funds, Inc. (the corporation) is
registered under the Investment Company Act of 1940 (the 1940 Act) as an
open-end management investment company. Select Fund (Select), Capital Growth
Fund (Capital Growth), Fundamental Equity Fund (Fundamental Equity) and New
Opportunities II Fund (New Opportunities II) (collectively, the funds) are four
funds in a series issued by the corporation. The funds are diversified under the
1940 Act. The funds' investment objective is to seek long-term capital growth.
Income is a secondary objective of Fundamental Equity. Select and Capital Growth
pursue this objective by purchasing stocks of larger-sized companies that they
believe will increase in value over time. Fundamental Equity looks for common
stocks that the fund's managers believe are attractively priced relative to the
companies' earnings growth potential and dividend yields. New Opportunities II
pursues its objective by purchasing stocks of smaller-sized companies that it
believes will increase in value over time. The following is a summary of the
funds' significant accounting policies.
MULTIPLE CLASS -- Select is authorized to issue the Investor Class, the
Institutional Class, the Advisor Class, the A Class, the B Class, the C Class
and the R Class. Capital Growth and Fundamental Equity are authorized to issue
the Investor Class, the Institutional Class, the A Class, the B Class, the C
Class and the R Class. New Opportunities II is authorized to issue the Investor
Class, the Institutional Class, the A Class, the B Class and the C Class. The A
Class may incur an initial sales charge. The A Class, B Class and C Class may be
subject to a contingent deferred sales charge. The share classes differ
principally in their respective sales charges and distribution and shareholder
servicing expenses and arrangements. All shares of each fund represent an equal
pro rata interest in the net assets of the class to which such shares belong,
and have identical voting, dividend, liquidation and other rights and the same
terms and conditions, except for class specific expenses and exclusive rights to
vote on matters affecting only individual classes. Income, non-class specific
expenses, and realized and unrealized capital gains and losses of the funds are
allocated to each class of shares based on their relative net assets. Sale of
Fundamental Equity's A Class, B Class and C Class commenced on November 30,
2004. Sale of Fundamental Equity's and Capital Growth's Investor Class,
Institutional Class and R Class commenced on July 29, 2005. Sale of Select's R
Class commenced on July 29, 2005. Sale of New Opportunities II's Institutional
Class had not commenced as of October 31, 2006.
SECURITY VALUATIONS -- Securities traded primarily on a principal securities
exchange are valued at the last reported sales price, or at the mean of the
latest bid and asked prices where no last sales price is available. Depending on
local convention or regulation, securities traded over-the-counter are valued at
the mean of the latest bid and asked prices, the last sales price, or the
official close price. Debt securities not traded on a principal securities
exchange are valued through a commercial pricing service or at the mean of the
most recent bid and asked prices. Discount notes may be valued through a
commercial pricing service or at amortized cost, which approximates fair value.
Securities traded on foreign securities exchanges and over-the-counter markets
are normally completed before the close of business on days that the New York
Stock Exchange (the Exchange) is open and may also take place on days when the
Exchange is not open. If an event occurs after the value of a security was
established but before the net asset value per share was determined that was
likely to materially change the net asset value, that security would be valued
at fair value as determined in accordance with procedures adopted by the Board
of Directors. If the funds determine that the market price of a portfolio
security is not readily available, or that the valuation methods mentioned above
do not reflect the security's fair value, such security is valued at its fair
value as determined by, or in accordance with procedures adopted by, the Board
of Directors or its designee if such fair value determination would materially
impact a fund's net asset value. Certain other circumstances may cause the funds
to fair value a security such as: a security has been declared in default;
trading in a security has been halted during the trading day: or there is a
foreign market holiday and no trading will commence.
SECURITY TRANSACTIONS -- Security transactions are accounted for as of the trade
date. Net realized gains and losses are determined on the identified cost basis,
which is also used for federal income tax purposes.
INVESTMENT INCOME -- Dividend income less foreign taxes withheld, if any, is
recorded as of the ex-dividend date. Distributions received on securities that
represent a return of capital or capital gain are recorded as a reduction of
cost of investments and/or as a realized gain. The funds estimate the components
of distributions received that may be considered nontaxable distributions or
capital gain distributions for income tax purposes. Interest income is recorded
on the accrual basis and includes accretion of discounts and amortization of
premiums.
(continued)
- ------
40
Notes to Financial Statements
OCTOBER 31, 2006
1. ORGANIZATION AND SUMMARY OF SIGNIFICANT ACCOUNTING POLICIES (CONTINUED)
SECURITIES ON LOAN -- Select may lend portfolio securities through their lending
agent to certain approved borrowers in order to earn additional income. Select
continues to recognize any gain or loss in the market price of the securities
loaned and record any interest earned or dividends declared.
FOREIGN CURRENCY TRANSACTIONS -- All assets and liabilities initially expressed
in foreign currencies are translated into U.S. dollars at prevailing exchange
rates at period end. Purchases and sales of investment securities, dividend and
interest income, and certain expenses are translated at the rates of exchange
prevailing on the respective dates of such transactions. Realized and unrealized
gains and losses from foreign currency translations arise from changes in
currency exchange rates.
Net realized and unrealized foreign currency exchange gains or losses occurring
during the holding period of investment securities are a component of realized
gain (loss) on investment transactions and unrealized appreciation
(depreciation) on investments, respectively. Certain countries may impose taxes
on the contract amount of purchases and sales of foreign currency contracts in
their currency. The funds record the foreign tax expense, if any, as a reduction
to the net realized gain (loss) on foreign currency transactions.
FORWARD FOREIGN CURRENCY EXCHANGE CONTRACTS -- The funds may enter into forward
foreign currency exchange contracts to facilitate transactions of securities
denominated in a foreign currency or to hedge the funds' exposure to foreign
currency exchange rate fluctuations. The net U.S. dollar value of foreign
currency underlying all contractual commitments held by the funds and the
resulting unrealized appreciation or depreciation are determined daily using
prevailing exchange rates. The funds bear the risk of an unfavorable change in
the foreign currency exchange rate underlying the forward contract.
Additionally, losses may arise if the counterparties do not perform under the
contract terms.
REPURCHASE AGREEMENTS -- The funds may enter into repurchase agreements with
institutions that American Century Investment Management, Inc. (ACIM) (the
investment advisor) has determined are creditworthy pursuant to criteria adopted
by the Board of Directors. Each repurchase agreement is recorded at cost. Each
fund requires that the collateral, represented by securities, received in a
repurchase transaction be transferred to the custodian in a manner sufficient to
enable each fund to obtain those securities in the event of a default under the
repurchase agreement. ACIM monitors, on a daily basis, the securities
transferred to ensure the value, including accrued interest, of the securities
under each repurchase agreement is equal to or greater than amounts owed to each
fund under each repurchase agreement.
JOINT TRADING ACCOUNT -- Pursuant to an Exemptive Order issued by the Securities
and Exchange Commission, each fund, along with other registered investment
companies having management agreements with ACIM or American Century Global
Investment Management, Inc. (ACGIM), may transfer uninvested cash balances into
a joint trading account. These balances are invested in one or more repurchase
agreements that are collateralized by U.S. Treasury or Agency obligations.
INCOME TAX STATUS -- It is each fund's policy to distribute substantially all
net investment income and net realized gains to shareholders and to otherwise
qualify as a regulated investment company under provisions of the Internal
Revenue Code. Accordingly, no provision has been made for federal or state
income taxes.
DISTRIBUTIONS TO SHAREHOLDERS -- Distributions to shareholders are recorded on
the ex-dividend date. Distributions from net investment income and net realized
gains, if any, are generally declared and paid annually.
INDEMNIFICATIONS -- Under the corporation's organizational documents, its
officers and directors are indemnified against certain liabilities arising out
of the performance of their duties to the funds. In addition, in the normal
course of business, the funds enter into contracts that provide general
indemnifications. The funds' maximum exposure under these arrangements is
unknown as this would involve future claims that may be made against the funds.
The risk of material loss from such claims is considered by management to be
remote.
USE OF ESTIMATES -- The financial statements are prepared in conformity with
accounting principles generally accepted in the United States of America, which
may require management to make certain estimates and assumptions at the date of
the financial statements. Actual results could differ from these estimates.
(continued)
- ------
41
Notes to Financial Statements
OCTOBER 31, 2006
2. FEES AND TRANSACTIONS WITH RELATED PARTIES
MANAGEMENT FEES -- The corporation has entered into a Management Agreement with
ACIM, under which ACIM provides the funds with investment advisory and
management services in exchange for a single, unified management fee (the fee)
per class. The Agreement provides that all expenses of the funds, except
brokerage commissions, taxes, interest, fees and expenses of those directors who
are not considered "interested persons" as defined in the 1940 Act (including
counsel fees) and extraordinary expenses, will be paid by ACIM. The fee is
computed and accrued daily based on the daily net assets of each specific class
of shares of each fund and paid monthly in arrears. For funds with a stepped fee
schedule, the rate of the fee is determined by applying a fee rate calculation
formula. This formula takes into account all of the investment advisor's assets
under management in each fund's investment strategy (strategy assets) to
calculate the appropriate fee rate for each fund. The strategy assets include
each fund's assets and the assets of other clients of the investment advisor
that are not in the American Century family of funds, but that have the same
investment team and investment strategy.
The annual management fee schedule for each class of Select, Capital Growth and
Fundamental Equity, as applicable, is as follows:
- --------------------------------------------------------------------------------
INVESTOR,
A, B, C & R INSTITUTIONAL ADVISOR
- --------------------------------------------------------------------------------
STRATEGY ASSETS
- --------------------------------------------------------------------------------
First $5 billion 1.000% 0.800% 0.750%
- --------------------------------------------------------------------------------
Next $5 billion 0.980% 0.780% 0.730%
- --------------------------------------------------------------------------------
Next $5 billion 0.970% 0.770% 0.720%
- --------------------------------------------------------------------------------
Next $5 billion 0.960% 0.760% 0.710%
- --------------------------------------------------------------------------------
Next $5 billion 0.950% 0.750% 0.700%
- --------------------------------------------------------------------------------
Next $5 billion 0.900% 0.700% 0.650%
- --------------------------------------------------------------------------------
Over $30 billion 0.800% 0.600% 0.550%
- --------------------------------------------------------------------------------
The annual management fee schedule for each class of New Opportunities II is as
follows:
- --------------------------------------------------------------------------------
INVESTOR,
A, B, C & R INSTITUTIONAL
- --------------------------------------------------------------------------------
STRATEGY ASSETS
- --------------------------------------------------------------------------------
First $250 million 1.50% 1.30%
- --------------------------------------------------------------------------------
Next $250 million 1.25% 1.05%
- --------------------------------------------------------------------------------
Next $250 million 1.15% 0.95%
- --------------------------------------------------------------------------------
Over $750 million 1.10% 0.90%
- --------------------------------------------------------------------------------
The effective annual management fee for each class of each fund for the year
ended October 31, 2006 was as follows:
- --------------------------------------------------------------------------------
INVESTOR,
A, B, C & R INSTITUTIONAL ADVISOR R
- --------------------------------------------------------------------------------
Select 1.00% 0.80% 0.75% 1.00%
- --------------------------------------------------------------------------------
Capital Growth 1.00% 0.80% N/A 1.00%
- --------------------------------------------------------------------------------
Fundamental Equity 1.00% 0.80% N/A 1.00%
- --------------------------------------------------------------------------------
New Opportunities II 1.50% -- N/A N/A
- --------------------------------------------------------------------------------
(continued)
- ------
42
Notes to Financial Statements
OCTOBER 31, 2006
2. FEES AND TRANSACTIONS WITH RELATED PARTIES (CONTINUED)
DISTRIBUTION AND SERVICE FEES -- The Board of Directors has adopted a Master
Distribution and Shareholder Services Plan for the Advisor Class (the Advisor
Class plan) and a separate Master Distribution and Individual Shareholder
Services Plan for each of the A Class, B Class, C Class and R Class
(collectively with the Advisor Class plan, the plans), pursuant to Rule 12b-1 of
the 1940 Act. The plans provide that the Advisor Class, B Class and C Class will
pay American Century Investment Services, Inc. (ACIS) the following annual
distribution and service fees:
- --------------------------------------------
ADVISOR B & C
- --------------------------------------------
Distribution Fee 0.25% 0.75%
- --------------------------------------------
Service Fee 0.25% 0.25%
- --------------------------------------------
The plans provide that the A Class and the R Class will pay ACIS an annual
distribution and service fee of 0.25% for the A Class and 0.50% for the R Class.
The fees are computed and accrued daily based on each class's daily net assets
and paid monthly in arrears. The distribution fee provides compensation for
expenses incurred in connection with distributing shares of the classes
including, but not limited to, payments to brokers, dealers, and financial
institutions that have entered into sales agreements with respect to shares of
the funds. The service fee provides compensation for shareholder and
administrative services rendered by ACIS, its affiliates or independent third
party providers for Advisor Class shares and for individual shareholder services
rendered by broker/dealers or other independent financial intermediaries for A
Class, B Class, C Class and R Class shares. Fees incurred under the plans during
the year ended October 31, 2006, are detailed in the Statement of Operations.
RELATED PARTIES -- Certain officers and directors of the corporation are also
officers and/or directors, and, as a group, controlling stockholders of American
Century Companies, Inc. (ACC), the parent of the corporation's investment
advisor, ACIM, the distributor of the corporation, ACIS, and the corporation's
transfer agent, American Century Services, LLC. As of October 31, 2006 the
outstanding shares owned by the investment advisor of Capital Growth is 31%.
The funds have a bank line of credit agreement and Select has a securities
lending agreement with JPMorgan Chase Bank (JPMCB). JPMCB is a custodian of the
funds and a wholly owned subsidiary of JPMorgan Chase & Co. (JPM). JPM is an
equity investor in ACC.
3. INVESTMENT TRANSACTIONS
Investment transactions, excluding short-term investments, for the year ended
October 31, 2006, were as follows:
- --------------------------------------------------------------------------------
CAPITAL FUNDAMENTAL NEW
SELECT GROWTH EQUITY OPPORTUNITIES II
- --------------------------------------------------------------------------------
Purchases $6,533,538,590 $5,718,372 $69,172,132 $348,830,591
- --------------------------------------------------------------------------------
Proceeds from sales $7,380,169,916 $4,603,791 $30,361,873 $332,665,923
- --------------------------------------------------------------------------------
(continued)
- ------
43
Notes to Financial Statements
OCTOBER 31, 2006
4. CAPITAL SHARE TRANSACTIONS
Transactions in shares of the funds were as follows:
- -------------------------------------------------------------------------------------
SELECT CAPITAL GROWTH
- -------------------------------------------------------------------------------------
SHARES AMOUNT SHARES AMOUNT
- -------------------------------------------------------------------------------------
INVESTOR CLASS
- ----------------------------
YEAR ENDED OCTOBER 31, 2006
SHARES AUTHORIZED 300,000,000 300,000,000
=====================================================================================
Sold 1,651,576 $61,030,222 4,932 $56,817
- ----------------------------
Issued in reinvestment
of distributions 566,800 22,042,836 -- --
- ----------------------------
Redeemed (20,992,994) (771,821,071) -- --
- -------------------------------------------------------------------------------------
Net increase (decrease) (18,774,618) $(688,748,013) 4,932 $56,817
=====================================================================================
YEAR ENDED OCTOBER 31, 2005(1)
SHARES AUTHORIZED 400,000,000 200,000,000
=====================================================================================
Sold 2,329,186 $ 86,028,299 2,315 $25,000
- ----------------------------
Issued in reinvestment
of distributions 205,594 7,839,288 -- --
- ----------------------------
Redeemed (15,105,345) (559,650,047) -- --
- -------------------------------------------------------------------------------------
Net increase (decrease) (12,570,565) $(465,782,460) 2,315 $25,000
=====================================================================================
INSTITUTIONAL CLASS
- -------------------------------------------------------------------------------------
YEAR ENDED OCTOBER 31, 2006
SHARES AUTHORIZED 40,000,000 50,000,000
=====================================================================================
Sold 3,570,233 $136,803,638 -- --
- ----------------------------
Issued in reinvestment
of distributions 47,217 1,849,034 -- --
- ----------------------------
Redeemed (4,853,683) (180,423,638) -- --
- -------------------------------------------------------------------------------------
Net increase (decrease) (1,236,233) $(41,770,966) -- --
=====================================================================================
YEAR ENDED OCTOBER 31, 2005(1)
SHARES AUTHORIZED 40,000,000 50,000,000
=====================================================================================
Sold 787,845 $ 29,427,489 2,315 $25,000
- ----------------------------
Issued in reinvestment
of distributions 23,580 904,984 -- --
- ----------------------------
Redeemed (2,196,445) (82,020,207) -- --
- -------------------------------------------------------------------------------------
Net increase (decrease) (1,385,020) $(51,687,734) 2,315 $25,000
=====================================================================================
ADVISOR CLASS
- -------------------------------------------------------------------------------------
YEAR ENDED OCTOBER 31, 2006
SHARES AUTHORIZED 50,000,000 N/A
=====================================================================================
Sold 279,821 $10,298,858
- ----------------------------
Issued in reinvestment
of distributions 3,366 129,641
- ----------------------------
Redeemed (441,221) (15,986,365)
- -------------------------------------------------------------------------------------
Net increase (decrease) (158,034) $(5,557,866)
=====================================================================================
YEAR ENDED OCTOBER 31, 2005
SHARES AUTHORIZED 100,000,000 N/A
=====================================================================================
Sold 370,390 $13,556,620
- ----------------------------
Redeemed (270,260) (9,880,731)
- -------------------------------------------------------------------------------------
Net increase (decrease) 100,130 $ 3,675,889
=====================================================================================
(1) July 29, 2005 (commencement of sale) through October 31, 2005 for Capital Growth.
(continued)
- ------
44
Notes to Financial Statements
OCTOBER 31, 2006
4. CAPITAL SHARE TRANSACTIONS (CONTINUED)
- --------------------------------------------------------------------------------------
SELECT CAPITAL GROWTH
- --------------------------------------------------------------------------------------
SHARES AMOUNT SHARES AMOUNT
- --------------------------------------------------------------------------------------
A CLASS
- --------------------------------------------------------------------------------------
YEAR ENDED OCTOBER 31, 2006
SHARES AUTHORIZED 25,000,000 100,000,000
======================================================================================
Sold 97,074 $3,560,583 126,608 $1,407,752
- ----------------------------
Issued in connection
with acquisition (Note 9) 3,570,242 135,355,199 -- --
- ----------------------------
Issued in reinvestment
of distributions 4,961 192,384 -- --
- ----------------------------
Redeemed (3,952,810) (148,882,449) (58,426) (637,593)
- --------------------------------------------------------------------------------------
Net increase (decrease) (280,533) $(9,774,283) 68,182 $770,159
======================================================================================
YEAR ENDED OCTOBER 31, 2005
SHARES AUTHORIZED 25,000,000 100,000,000
======================================================================================
Sold 387,713 $14,274,351 74,965 $ 781,912
- ----------------------------
Redeemed (261,180) (9,636,831) (30,129) (315,023)
- --------------------------------------------------------------------------------------
Net increase (decrease) 126,533 4,637,520 44,836 $ 466,889
======================================================================================
B CLASS
- --------------------------------------------------------------------------------------
YEAR ENDED OCTOBER 31, 2006
SHARES AUTHORIZED 25,000,000 100,000,000
======================================================================================
Sold 5,936 $204,532 19,755 $217,231
- ----------------------------
Issued in connection with
acquisition (Note 9) 155,909 5,800,482 -- --
- ----------------------------
Redeemed (64,071) (2,234,279) (10,357) (112,753)
- --------------------------------------------------------------------------------------
Net increase (decrease) 97,774 $3,770,735 9,398 $104,478
======================================================================================
YEAR ENDED OCTOBER 31, 2005
SHARES AUTHORIZED 25,000,000 100,000,000
======================================================================================
Sold 12,793 $ 462,676 29,996 $310,296
- ----------------------------
Redeemed (9,993) (361,099) (1,968) (20,033)
- --------------------------------------------------------------------------------------
Net increase (decrease) 2,800 $ 101,577 28,028 $290,263
======================================================================================
C CLASS
- ----------------------------
YEAR ENDED OCTOBER 31, 2006
SHARES AUTHORIZED 25,000,000 100,000,000
======================================================================================
Sold 9,425 $348,877 14,375 $157,223
- ----------------------------
Redeemed (62,851) (2,257,608) (568) (6,121)
- --------------------------------------------------------------------------------------
Net increase (decrease) (53,426) $(1,908,731) 13,807 $151,102
======================================================================================
YEAR ENDED OCTOBER 31, 2005
SHARES AUTHORIZED 25,000,000 100,000,000
======================================================================================
Sold 34,085 $ 1,240,344 23,437 $243,705
- ----------------------------
Redeemed (46,000) (1,660,057) (69) (720)
- --------------------------------------------------------------------------------------
Net increase (decrease) (11,915) $ (419,713) 23,368 $242,985
======================================================================================
(continued)
- ------
45
Notes to Financial Statements
OCTOBER 31, 2006
4. CAPITAL SHARE TRANSACTIONS (CONTINUED)
- --------------------------------------------------------------------------------------
SELECT CAPITAL GROWTH
- --------------------------------------------------------------------------------------
SHARES AMOUNT SHARES AMOUNT
- --------------------------------------------------------------------------------------
R CLASS
- --------------------------------------------------------------------------------------
YEAR ENDED OCTOBER 31, 2006
SHARES AUTHORIZED 50,000,000 60,000,000
======================================================================================
Sold -- -- -- --
- ----------------------------
Issued in reinvestment
of distributions 4 $138 -- --
- ----------------------------
Redeemed -- -- -- --
- --------------------------------------------------------------------------------------
Net increase (decrease) 4 $138 -- --
======================================================================================
PERIOD ENDED OCTOBER 31, 2005(1)
SHARES AUTHORIZED 60,000,000 60,000,000
======================================================================================
Sold 652 $25,000 2,315 $25,000
======================================================================================
(1) July 29, 2005 (commencement of sale) through October 31, 2005.
- ---------------------------------------------------------------------------------------
FUNDAMENTAL EQUITY NEW OPPORTUNITIES II
- ---------------------------------------------------------------------------------------
SHARES AMOUNT SHARES AMOUNT
- ---------------------------------------------------------------------------------------
INVESTOR CLASS
- ---------------------------------------------------------------------------------------
YEAR ENDED OCTOBER 31, 2006
SHARES AUTHORIZED 200,000,000 250,000,000
=======================================================================================
Sold 298,990 $3,668,107 1,441,400 $10,692,358
- ----------------------------
Issued in reinvestment
of distributions 123 1,402 170,452 1,227,252
- ----------------------------
Redeemed (3,446) (40,059) (1,274,866) (9,437,141)
- ---------------------------------------------------------------------------------------
Net increase (decrease) 295,667 $3,629,450 336,986 $2,482,469
=======================================================================================
YEAR ENDED OCTOBER 31, 2005(2)
SHARES AUTHORIZED 200,000,000 250,000,000
=======================================================================================
Sold 2,298 $25,000 1,455,830 $9,655,038
- ----------------------------
Issued in reinvestment
of distributions -- -- 149,816 991,781
- ----------------------------
Redeemed -- -- (1,401,320) (9,196,936)
- ---------------------------------------------------------------------------------------
Net increase (decrease) 2,298 $25,000 204,326 $ 1,449,883
=======================================================================================
(2) July 29, 2005 (commencement of sale) through October 31, 2005 for
Fundamental Equity.
(continued)
- ------
46
Notes to Financial Statements
OCTOBER 31, 2006
4. CAPITAL SHARE TRANSACTIONS (CONTINUED)
- ----------------------------------------------------------------------------------------
FUNDAMENTAL EQUITY NEW OPPORTUNITIES II
- ----------------------------------------------------------------------------------------
SHARES AMOUNT SHARES AMOUNT
- ----------------------------------------------------------------------------------------
INSTITUTIONAL CLASS
- ----------------------------------------------------------------------------------------
YEAR ENDED OCTOBER 31, 2006
SHARES AUTHORIZED 50,000,000 50,000,000
========================================================================================
Issued in reinvestment
of distributions 74 $841 -- --
========================================================================================
YEAR ENDED OCTOBER 31, 2005(1)
SHARES AUTHORIZED 50,000,000 50,000,000
========================================================================================
Sold 2,298 $25,000 -- --
========================================================================================
A CLASS
- ----------------------------------------------------------------------------------------
YEAR ENDED OCTOBER 31, 2006
SHARES AUTHORIZED 50,000,000 25,000,000
========================================================================================
Sold 2,957,105 $35,087,633 4,510,446 $33,269,039
- ----------------------------
Issued in reinvestment
of distributions 6,893 78,235 200,465 1,439,338
- ----------------------------
Redeemed (208,307) (2,445,261) (2,174,195) (16,057,123)
- ----------------------------------------------------------------------------------------
Net increase (decrease) 2,755,691 $32,720,607 2,536,716 $18,651,254
========================================================================================
YEAR ENDED OCTOBER 31, 2005(2)
SHARES AUTHORIZED 50,000,000 25,000,000
========================================================================================
Sold 150,138 $1,576,978 5,225,025 $34,107,420
- ----------------------------
Issued in reinvestment
of distributions -- -- 95,581 631,788
- ----------------------------
Redeemed (1,816) (18,703) (1,436,356) (9,368,616)
- ----------------------------------------------------------------------------------------
Net increase (decrease) 148,322 $1,558,275 3,884,250 $25,370,592
========================================================================================
B CLASS
- ----------------------------------------------------------------------------------------
YEAR ENDED OCTOBER 31, 2006
SHARES AUTHORIZED 50,000,000 25,000,000
========================================================================================
Sold 111,780 $1,311,393 125,112 $916,866
- ----------------------------
Issued in reinvestment
of distributions 1,179 13,357 6,983 49,789
- ----------------------------
Redeemed (38,179) (439,569) (37,490) (268,592)
- ----------------------------------------------------------------------------------------
Net increase (decrease) 74,780 $885,181 94,605 $698,063
========================================================================================
YEAR ENDED OCTOBER 31, 2005(2)
SHARES AUTHORIZED 50,000,000 25,000,000
========================================================================================
Sold 42,793 $434,494 174,231 $1,127,541
- ----------------------------
Issued in reinvestment
of distributions -- -- 3,232 21,235
- ----------------------------
Redeemed -- -- (8,896) (58,520)
- ----------------------------------------------------------------------------------------
Net increase (decrease) 42,793 $434,494 168,567 $1,090,256
========================================================================================
(1) July 29, 2005 (commencement of sale) through October 31, 2005 for
Fundamental Equity.
(2) November 30, 2004 (fund inception) through October 31, 2005 for
Fundamental Equity.
(continued)
- ------
47
Notes to Financial Statements
OCTOBER 31, 2006
4. CAPITAL SHARE TRANSACTIONS (CONTINUED)
- ----------------------------------------------------------------------------------------
FUNDAMENTAL EQUITY NEW OPPORTUNITIES II
- ----------------------------------------------------------------------------------------
SHARES AMOUNT SHARES AMOUNT
- ----------------------------------------------------------------------------------------
C CLASS
- ----------------------------------------------------------------------------------------
YEAR ENDED OCTOBER 31, 2006
SHARES AUTHORIZED 50,000,000 25,000,000
========================================================================================
Sold 342,058 $3,979,820 224,661 $1,650,605
- ----------------------------
Issued in reinvestment
of distributions 1,422 16,128 7,017 50,239
- ----------------------------
Redeemed (51,320) (591,715) (156,369) (1,137,384)
- ----------------------------------------------------------------------------------------
Net increase (decrease) 292,160 $3,404,233 75,309 $563,460
========================================================================================
YEAR ENDED OCTOBER 31, 2005(1)
SHARES AUTHORIZED 50,000,000 25,000,000
========================================================================================
Sold 63,517 $654,278 370,046 $2,417,865
- ----------------------------
Issued in reinvestment
of distributions -- -- 2,993 19,722
- ----------------------------
Redeemed (261) (2,727) (68,888) (442,505)
- ----------------------------------------------------------------------------------------
Net increase (decrease) 63,256 $651,551 304,151 $1,995,082
========================================================================================
R CLASS
- ----------------------------------------------------------------------------------------
YEAR ENDED OCTOBER 31, 2006
SHARES AUTHORIZED 60,000,000 N/A
========================================================================================
Issued in reinvestment
of distributions 70 $793
========================================================================================
PERIOD ENDED OCTOBER 31, 2005(2)
SHARES AUTHORIZED 60,000,000 N/A
========================================================================================
Sold 2,298 $25,000
========================================================================================
(1) November 30, 2004 (fund inception) through October 31, 2005 for
Fundamental Equity.
(2) July 29, 2005 (commencement of sale) through October 31, 2005 for
Fundamental Equity.
5. SECURITIES LENDING
As of October 31, 2006, securities in Select valued at $202,251,274, were on
loan through the lending agent, JPMCB, to certain approved borrowers. JPMCB
receives and maintains collateral in the form of cash, and/or acceptable
securities as approved by ACIM. Cash collateral is invested in authorized
investments by the lending agent in a pooled account. The value of cash
collateral received at period end is disclosed in the Statement of Assets and
Liabilities and investments made with the cash by the lending agent are listed
in the Schedule of Investments. Any deficiencies or excess of collateral must be
delivered or transferred by the member firms no later than the close of business
on the next business day. The total value of all collateral received, at this
date, was $205,067,793. Select's risks in securities lending are that the
borrower may not provide additional collateral when required or return the
securities when due. If the borrower defaults, receipt of the collateral by
Select may be delayed or limited.
6. BANK LINE OF CREDIT
The funds, along with certain other funds managed by ACIM or ACGIM, have a
$500,000,000 unsecured bank line of credit agreement with JPMCB. The funds may
borrow money for temporary or emergency purposes to fund shareholder
redemptions. Borrowings under the agreement bear interest at the Federal Funds
rate plus 0.50%. The funds did not borrow from the line during the year ended
October 31, 2006.
(continued)
- ------
48
Notes to Financial Statements
OCTOBER 31, 2006
7. RISK FACTORS
New Opportunities II concentrates its investments in common stocks of small
companies. Because of this, New Opportunities II may be subject to greater risk
and market fluctuations than a fund investing in larger, more established
companies.
8. FEDERAL TAX INFORMATION
The tax character of distributions paid during the years ended October 31, 2006
and October 31, 2005 were as follows:
- --------------------------------------------------------------------------------
SELECT CAPITAL GROWTH
- --------------------------------------------------------------------------------
2006 2005 2006 2005
- --------------------------------------------------------------------------------
DISTRIBUTIONS PAID FROM
- --------------------------------------------------------------------------------
Ordinary income $25,309,867 $9,128,831 -- --
- --------------------------------------------------------------------------------
Long-term capital gains -- -- -- --
- --------------------------------------------------------------------------------
- --------------------------------------------------------------------------------
FUNDAMENTAL EQUITY NEW OPPORTUNITIES II
- --------------------------------------------------------------------------------
2006 2005(1) 2006 2005
- --------------------------------------------------------------------------------
DISTRIBUTIONS PAID FROM
- --------------------------------------------------------------------------------
Ordinary income $120,479 -- $1,381,083 $995,034
- --------------------------------------------------------------------------------
Long-term capital gains -- -- $1,602,464 $785,251
- --------------------------------------------------------------------------------
(1) November 30, 2004 (fund inception) through October 31, 2005.
The book-basis character of distributions made during the year from net
investment income or net realized gains may differ from their ultimate
characterization for federal income tax purposes. These differences reflect the
differing character of certain income items and net realized gains and losses
for financial statement and tax purposes, and may result in reclassification
among certain capital accounts on the financial statements.
As of October 31, 2006, the components of distributable earnings on a tax-basis
and the federal tax cost of investments were as follows:
- --------------------------------------------------------------------------------------
CAPITAL FUNDAMENTAL NEW
SELECT GROWTH EQUITY OPPORTUNITIES II
- --------------------------------------------------------------------------------------
Federal tax cost
of investments $2,782,626,469 $3,650,765 $45,827,612 $122,181,241
======================================================================================
Gross tax appreciation
of investments $227,643,417 $433,949 $3,283,324 $15,766,059
- ------------------------
Gross tax depreciation
of investments (43,350,063) (12,010) (294,301) (668,558)
- --------------------------------------------------------------------------------------
Net tax appreciation
(depreciation)
of investments $184,293,354 $421,939 $2,989,023 $15,097,501
======================================================================================
Net tax appreciation
(depreciation) on
derivatives and
translation of assets
and liabilities in
foreign currencies $(2,390) $(71) -- --
- --------------------------------------------------------------------------------------
Net tax appreciation
(depreciation) $184,290,964 $421,868 $2,989,023 $15,097,501
======================================================================================
Undistributed
ordinary income $11,973,143 -- $871,053 $2,458,338
- ------------------------
Accumulated
long-term gains $42,881,708 $51,137 $ 19,286 $9,474,334
- --------------------------------------------------------------------------------------
The difference between book-basis and tax-basis cost and unrealized appreciation
(depreciation) is attributable primarily to the tax deferral of losses on wash
sales, the realization for tax purposes of unrealized gains on certain forward
foreign currency contracts and return of capital dividends.
(continued)
- ------
49
Notes to Financial Statements
OCTOBER 31, 2006
9. REORGANIZATION PLAN
On December 14, 2005, the Board of Directors of Mason Street Growth Stock Fund
(Growth Stock), one fund in a series issued by Mason Street Funds, Inc.,
approved a plan of reorganization (the reorganization) pursuant to which Select
acquired all of the assets of Growth Stock in exchange for shares of equal value
of Select and the assumption by Select of all liabilities of Growth Stock. The
financial statements and performance history of Select will be carried over in
the post-reorganization. The reorganization was approved by shareholders on
March 23, 2006. The reorganization was effective at the close of business on
March 31, 2006. New shares in connection with the reorganization were issued by
Select on April 3, 2006.
The acquisition was accomplished by a tax-free exchange of shares. On April 3,
2006, Growth Stock exchanged its shares for shares of Select as follows:
- --------------------------------------------------------------------------------
ORIGINAL FUND/CLASS SHARES EXCHANGED NEW FUND/CLASS SHARES RECEIVED
- --------------------------------------------------------------------------------
Growth Stock Fund - A 9,879,722 Select - A Class 3,564,222
- --------------------------------------------------------------------------------
Growth Stock Fund - C 17,465 Select - A Class 6,020
- --------------------------------------------------------------------------------
Growth Stock Fund - B 443,869 Select - B Class 155,909
- --------------------------------------------------------------------------------
The net assets of Growth Stock and Select immediately before the acquisition
were $141,155,681 and $3,336,122,073, respectively. Growth Stock's unrealized
appreciation of $26,507,502 was combined with that of Select. Immediately after
the acquisition, the combined net assets were $3,477,277,754.
10. RECENTLY ISSUED ACCOUNTING STANDARDS
In June 2006, the Financial Accounting Standards Board (FASB) issued
Interpretation No. 48, "Accounting for Uncertainty in Income Taxes - an
Interpretation of FASB Statement No. 109" (FIN 48). FIN 48 establishes a minimum
threshold for financial statement recognition of the benefit of positions taken
in filing tax returns (including whether an entity is taxable in a particular
jurisdiction), and requires certain expanded tax disclosures. FIN 48 is
effective for fiscal years beginning after December 15, 2006, and is to be
applied to all open tax years as of the date of effectiveness. The FASB issued
Statement of Financial Accounting Standards No. 157, "Fair Value Measurements"
(FAS 157), in September 2006, which is effective for fiscal years beginning
after November 15, 2007. FAS 157 defines fair value, establishes a framework for
measuring fair value and expands the required financial statement disclosures
about fair value measurements. Management is currently evaluating the impact of
adopting FIN 48 and FAS 157.
(continued)
- ------
50
Notes to Financial Statements
OCTOBER 31, 2006
11. OTHER TAX INFORMATION (UNAUDITED)
The following information is provided pursuant to provision of the Internal
Revenue Code.
For corporate taxpayers, the following ordinary income distributions paid during
the fiscal year ended October 31, 2006, qualify for the corporate dividends
received deduction.
- --------------------------------------------------------------------------------
SELECT CAPITAL GROWTH FUNDAMENTAL EQUITY NEW OPPORTUNITIES II
- --------------------------------------------------------------------------------
$25,309,867 -- $27,574 $313,505
- --------------------------------------------------------------------------------
The funds hereby designate qualified dividend income for the fiscal year ended
October 31, 2006, as follows:
- --------------------------------------------------------------------------------
SELECT CAPITAL GROWTH FUNDAMENTAL EQUITY NEW OPPORTUNITIES II
- --------------------------------------------------------------------------------
$25,309,867 -- $27,923 $296,858
- --------------------------------------------------------------------------------
The funds hereby designate capital gain dividends for the fiscal year ended
October 31, 2006, as follows:
- --------------------------------------------------------------------------------
SELECT CAPITAL GROWTH FUNDAMENTAL EQUITY NEW OPPORTUNITIES II
- --------------------------------------------------------------------------------
-- -- -- $1,602,464
- --------------------------------------------------------------------------------
The funds hereby designate qualified short-term capital gains distributions for
purposes of Internal Revenue Code Section 871 for the fiscal year ended October
31, 2006, as follows:
- --------------------------------------------------------------------------------
SELECT CAPITAL GROWTH FUNDAMENTAL EQUITY NEW OPPORTUNITIES II
- --------------------------------------------------------------------------------
-- -- $120,479 $1,381,083
- --------------------------------------------------------------------------------
- ------
51
Select - Financial Highlights
FOR A SHARE OUTSTANDING THROUGHOUT THE YEARS ENDED OCTOBER 31
- --------------------------------------------------------------------------------
INVESTOR CLASS
- --------------------------------------------------------------------------------
2006 2005 2004 2003 2002
- --------------------------------------------------------------------------------
PER-SHARE DATA
- --------------------------------------------------------------------------------
Net Asset Value,
Beginning of Period $37.04 $34.80 $33.77 $28.91 $34.94
- --------------------------------------------------------------------------------
Income From
Investment Operations
- ------------------------
Net Investment
Income (Loss)(1) 0.21 0.15 --(2) 0.01 0.07
- ------------------------
Net Realized and
Unrealized Gain (Loss) (0.77) 2.17 1.03 4.92 (6.04)
- --------------------------------------------------------------------------------
Total From
Investment Operations (0.56) 2.32 1.03 4.93 (5.97)
- --------------------------------------------------------------------------------
Distributions
- ------------------------
From Net
Investment Income (0.26) (0.08) -- (0.07) (0.06)
- --------------------------------------------------------------------------------
Net Asset Value,
End of Period $36.22 $37.04 $34.80 $33.77 $28.91
================================================================================
TOTAL RETURN(3) (1.55)% 6.67% 3.05% 17.11% (17.11)%
- --------------------------------------------------------------------------------
RATIOS/SUPPLEMENTAL DATA
- --------------------------------------------------------------------------------
Ratio of Operating
Expenses to Average
Net Assets 1.00% 1.00% 1.00% 1.00% 1.00%
- ------------------------
Ratio of Net
Investment Income (Loss)
to Average Net Assets 0.57% 0.42% (0.01)% 0.03% 0.21%
- ------------------------
Portfolio Turnover Rate 206% 55% 48% 84% 168%
- ------------------------
Net Assets,
End of Period
(in millions) $2,576 $3,329 $3,565 $3,828 $3,522
- --------------------------------------------------------------------------------
(1) Computed using average shares outstanding throughout the period.
(2) Per-share amount is less than $0.005.
(3) Total return assumes reinvestment of net investment income and capital
gains distributions, if any. The total return of the classes may not
precisely reflect the class expense differences because of the impact of
calculating the net asset values to two decimal places. If net asset values
were calculated to three decimal places, the total return differences would
more closely reflect the class expense differences. The calculation of net
asset values to two decimal places is made in accordance with SEC guidelines
and does not result in any gain or loss of value between one class and
another.
See Notes to Financial Statements.
- ------
52
Select - Financial Highlights
FOR A SHARE OUTSTANDING THROUGHOUT THE YEARS ENDED OCTOBER 31
- --------------------------------------------------------------------------------
INSTITUTIONAL CLASS
- --------------------------------------------------------------------------------
2006 2005 2004 2003 2002
- --------------------------------------------------------------------------------
PER-SHARE DATA
- --------------------------------------------------------------------------------
Net Asset Value,
Beginning of Period $37.35 $35.09 $33.99 $29.10 $35.16
- --------------------------------------------------------------------------------
Income From
Investment Operations
- ------------------------
Net Investment
Income (Loss)(1) 0.30 0.24 0.07 0.07 0.13
- ------------------------
Net Realized and
Unrealized Gain (Loss) (0.78) 2.18 1.03 4.95 (6.06)
- --------------------------------------------------------------------------------
Total From
Investment Operations (0.48) 2.42 1.10 5.02 (5.93)
- --------------------------------------------------------------------------------
Distributions
- ------------------------
From Net
Investment Income (0.34) (0.16) -- (0.13) (0.13)
- --------------------------------------------------------------------------------
Net Asset Value,
End of Period $36.53 $37.35 $35.09 $33.99 $29.10
================================================================================
TOTAL RETURN(2) (1.35)% 6.87% 3.24% 17.34% (16.93)%
- --------------------------------------------------------------------------------
RATIOS/SUPPLEMENTAL DATA
- --------------------------------------------------------------------------------
Ratio of Operating
Expenses to
Average Net Assets 0.80% 0.80% 0.80% 0.80% 0.80%
- ------------------------
Ratio of Net
Investment Income (Loss)
to Average Net Assets 0.77% 0.62% 0.19% 0.23% 0.41%
- ------------------------
Portfolio Turnover Rate 206% 55% 48% 84% 168%
- ------------------------
Net Assets,
End of Period
(in thousands) $148,717 $198,212 $234,815 $229,596 $185,897
- --------------------------------------------------------------------------------
(1) Computed using average shares outstanding throughout the period.
(2) Total return assumes reinvestment of net investment income and capital
gains distributions, if any. The total return of the classes may not
precisely reflect the class expense differences because of the impact of
calculating the net asset values to two decimal places. If net asset values
were calculated to three decimal places, the total return differences would
more closely reflect the class expense differences. The calculation of net
asset values to two decimal places is made in accordance with SEC guidelines
and does not result in any gain or loss of value between one class and
another.
See Notes to Financial Statements.
- ------
53
Select - Financial Highlights
FOR A SHARE OUTSTANDING THROUGHOUT THE YEARS ENDED OCTOBER 31
- --------------------------------------------------------------------------------
ADVISOR CLASS
- --------------------------------------------------------------------------------
2006 2005 2004 2003 2002
- --------------------------------------------------------------------------------
PER-SHARE DATA
- --------------------------------------------------------------------------------
Net Asset Value,
Beginning of Period $36.63 $34.43 $33.49 $28.66 $34.68
- --------------------------------------------------------------------------------
Income From
Investment Operations
- ------------------------
Net Investment
Income (Loss)(1) 0.12 0.04 (0.09) (0.07) (0.02)
- ------------------------
Net Realized and
Unrealized Gain (Loss) (0.76) 2.16 1.03 4.90 (6.00)
- --------------------------------------------------------------------------------
Total From
Investment Operations (0.64) 2.20 0.94 4.83 (6.02)
- --------------------------------------------------------------------------------
Distributions
- ------------------------
From Net
Investment Income (0.19) -- -- --(2) --
- --------------------------------------------------------------------------------
Net Asset Value,
End of Period $35.80 $36.63 $34.43 $33.49 $28.66
================================================================================
TOTAL RETURN(3) (1.79)% 6.39% 2.81% 16.86% (17.36)%
- --------------------------------------------------------------------------------
RATIOS/SUPPLEMENTAL DATA
- --------------------------------------------------------------------------------
Ratio of Operating
Expenses to Average
Net Assets 1.25% 1.25% 1.25% 1.25% 1.25%
- ------------------------
Ratio of Net
Investment Income (Loss)
to Average Net Assets 0.32% 0.17% (0.26)% (0.22)% (0.04)%
- ------------------------
Portfolio Turnover Rate 206% 55% 48% 84% 168%
- ------------------------
Net Assets,
End of Period
(in thousands) $21,455 $27,741 $22,626 $29,152 $20,432
- --------------------------------------------------------------------------------
(1) Computed using average shares outstanding throughout the period.
(2) Per-share amount is less than $0.005.
(3) Total return assumes reinvestment of net investment income and capital
gains distributions, if any. The total return of the classes may not
precisely reflect the class expense differences because of the impact of
calculating the net asset values to two decimal places. If net asset values
were calculated to three decimal places, the total return differences would
more closely reflect the class expense differences. The calculation of net
asset values to two decimal places is made in accordance with SEC guidelines
and does not result in any gain or loss of value between one class and
another.
See Notes to Financial Statements.
- ------
54
Select - Financial Highlights
FOR A SHARE OUTSTANDING THROUGHOUT THE YEARS ENDED OCTOBER 31 (EXCEPT AS NOTED)
- --------------------------------------------------------------------------------
A CLASS
- --------------------------------------------------------------------------------
2006 2005 2004 2003(1)
PER-SHARE DATA
- --------------------------------------------------------------------------------
Net Asset Value,
Beginning of Period $36.87 $34.66 $33.72 $27.75
- --------------------------------------------------------------------------------
Income From
Investment Operations
- ------------------------
Net Investment
Income (Loss)(2) 0.10 0.04 (0.10) (0.14)
- ------------------------
Net Realized and
Unrealized Gain (Loss) (0.75) 2.17 1.04 6.11
- --------------------------------------------------------------------------------
Total From
Investment Operations (0.65) 2.21 0.94 5.97
- --------------------------------------------------------------------------------
Distributions
- ------------------------
From Net
Investment Income (0.19) -- -- --
- --------------------------------------------------------------------------------
Net Asset Value,
End of Period $36.03 $36.87 $34.66 $33.72
================================================================================
TOTAL RETURN(3) (1.81)% 6.38% 2.79% 21.51%
- --------------------------------------------------------------------------------
RATIOS/SUPPLEMENTAL DATA
- --------------------------------------------------------------------------------
Ratio of Operating
Expenses to
Average Net Assets 1.25% 1.25% 1.25% 1.25%(4)
- ------------------------
Ratio of Net
Investment Income
(Loss) to Average
Net Assets 0.32% 0.17% (0.26)% (0.56)%(4)
- ------------------------
Portfolio Turnover Rate 206% 55% 48% 84%(5)
- ------------------------
Net Assets,
End of Period
(in thousands) $28,371 $39,376 $32,624 $10,305
- --------------------------------------------------------------------------------
(1) January 31, 2003 (commencement of sale) through October 31, 2003.
(2) Computed using average shares outstanding throughout the period.
(3) Total return assumes reinvestment of net investment income and capital
gains distributions, if any, and does not reflect applicable sales charges.
Total returns for periods less than one year are not annualized. The total
return of the classes may not precisely reflect the class expense
differences because of the impact of calculating the net asset values to
two decimal places. If net asset values were calculated to three decimal
places, the total return differences would more closely reflect the class
expense differences. The calculation of net asset values to two decimal
places is made in accordance with SEC guidelines and does not result in any
gain or loss of value between one class and another.
(4) Annualized.
(5) Portfolio turnover is calculated at the fund level. Percentage indicated
was calculated for the year ended October 31, 2003.
See Notes to Financial Statements.
- ------
55
Select - Financial Highlights
FOR A SHARE OUTSTANDING THROUGHOUT THE YEARS ENDED OCTOBER 31 (EXCEPT AS NOTED)
- --------------------------------------------------------------------------------
B CLASS
- --------------------------------------------------------------------------------
2006 2005 2004 2003(1)
- --------------------------------------------------------------------------------
PER-SHARE DATA
- --------------------------------------------------------------------------------
Net Asset Value,
Beginning of Period $36.12 $34.21 $33.53 $27.75
- --------------------------------------------------------------------------------
Income From
Investment Operations
- ------------------------
Net Investment
Income (Loss)(2) (0.12) (0.22) (0.35) (0.31)
- ------------------------
Net Realized and
Unrealized Gain (Loss) (0.79) 2.13 1.03 6.09
- --------------------------------------------------------------------------------
Total From
Investment Operations (0.91) 1.91 0.68 5.78
- --------------------------------------------------------------------------------
Net Asset Value,
End of Period $35.21 $36.12 $34.21 $33.53
================================================================================
TOTAL RETURN(3) (2.52)% 5.58% 2.03% 20.83%
- --------------------------------------------------------------------------------
RATIOS/SUPPLEMENTAL DATA
- --------------------------------------------------------------------------------
Ratio of Operating
Expenses to
Average Net Assets 2.00% 2.00% 2.00% 2.00%(4)
- ------------------------
Ratio of Net Investment
Income (Loss) to
Average Net Assets (0.43)% (0.58)% (1.01)% (1.28)%(4)
- ------------------------
Portfolio Turnover Rate 206% 55% 48% 84%(5)
- ------------------------
Net Assets, End of
Period (in thousands) $5,880 $2,501 $2,273 $1,032
- --------------------------------------------------------------------------------
(1) January 31, 2003 (commencement of sale) through October 31, 2003.
(2) Computed using average shares outstanding throughout the period.
(3) Total return assumes reinvestment of net investment income and capital
gains distributions, if any, and does not reflect applicable sales charges.
Total returns for periods less than one year are not annualized. The total
return of the classes may not precisely reflect the class expense
differences because of the impact of calculating the net asset values to two
decimal places. If net asset values were calculated to three decimal places,
the total return differences would more closely reflect the class expense
differences. The calculation of net asset values to two decimal places is
made in accordance with SEC guidelines and does not result in any gain or
loss of value between one class and another.
(4) Annualized.
(5) Portfolio turnover is calculated at the fund level. Percentage indicated
was calculated for the year ended October 31, 2003.
See Notes to Financial Statements.
- ------
56
Select - Financial Highlights
FOR A SHARE OUTSTANDING THROUGHOUT THE YEARS ENDED OCTOBER 31 (EXCEPT AS NOTED)
- --------------------------------------------------------------------------------
C CLASS
- --------------------------------------------------------------------------------
2006 2005 2004 2003(1)
- --------------------------------------------------------------------------------
PER-SHARE DATA
- --------------------------------------------------------------------------------
Net Asset Value,
Beginning of Period $36.15 $34.23 $33.56 $27.75
- --------------------------------------------------------------------------------
Income From
Investment Operations
- -------------------------
Net Investment
Income (Loss)(2) (0.16) (0.22) (0.36) (0.31)
- -------------------------
Net Realized and
Unrealized Gain (Loss) (0.75) 2.14 1.03 6.12
- --------------------------------------------------------------------------------
Total From
Investment Operations (0.91) 1.92 0.67 5.81
- --------------------------------------------------------------------------------
Net Asset Value,
End of Period $35.24 $36.15 $34.23 $33.56
================================================================================
TOTAL RETURN(3) (2.52)% 5.58% 2.03% 20.94%
- --------------------------------------------------------------------------------
RATIOS/SUPPLEMENTAL DATA
- --------------------------------------------------------------------------------
Ratio of Operating
Expenses to
Average Net Assets 2.00% 2.00% 2.00% 2.00%(4)
- -------------------------
Ratio of Net Investment
Income (Loss) to
Average Net Assets (0.43)% (0.58)% (1.01)% (1.28)%(4)
- -------------------------
Portfolio Turnover Rate 206% 55% 48% 84%(5)
- -------------------------
Net Assets,
End of Period
(in thousands) $1,540 $3,511 $3,733 $1,136
- --------------------------------------------------------------------------------
(1) January 31, 2003 (commencement of sale) through October 31, 2003.
(2) Computed using average shares outstanding throughout the period.
(3) Total return assumes reinvestment of net investment income and capital
gains distributions, if any, and does not reflect applicable sales charges.
Total returns for periods less than one year are not annualized. The total
return of the classes may not precisely reflect the class expense
differences because of the impact of calculating the net asset values to two
decimal places. If net asset values were calculated to three decimal places,
the total return differences would more closely reflect the class expense
differences. The calculation of net asset values to two decimal places is
made in accordance with SEC guidelines and does not result in any gain or
loss of value between one class and another.
(4) Annualized.
(5) Portfolio turnover is calculated at the fund level. Percentage indicated
was calculated for the year ended October 31, 2003.
See Notes to Financial Statements.
- ------
57
Select - Financial Highlights
FOR A SHARE OUTSTANDING THROUGHOUT THE YEARS ENDED OCTOBER 31 (EXCEPT AS NOTED)
- --------------------------------------------------------------------------------
R CLASS
- --------------------------------------------------------------------------------
2006 2005(1)
- --------------------------------------------------------------------------------
PER-SHARE DATA
- --------------------------------------------------------------------------------
Net Asset Value, Beginning of Period $37.00 $38.34
- --------------------------------------------------------------------------------
Income From Investment Operations
- -----------------------------------------
Net Investment Income (Loss)(2) 0.03 (0.05)
- -----------------------------------------
Net Realized and Unrealized Gain (Loss) (0.77) (1.29)
- --------------------------------------------------------------------------------
Total From Investment Operations (0.74) (1.34)
- --------------------------------------------------------------------------------
Distributions
- -----------------------------------------
From Net Investment Income (0.21) --
- --------------------------------------------------------------------------------
Net Asset Value, End of Period $36.05 $37.00
================================================================================
TOTAL RETURN(3) (2.04)% (3.50)%
- --------------------------------------------------------------------------------
RATIOS/SUPPLEMENTAL DATA
- --------------------------------------------------------------------------------
Ratio of Operating Expenses
to Average Net Assets 1.50% 1.50%(4)
- -----------------------------------------
Ratio of Net Investment Income (Loss)
to Average Net Assets 0.07% (0.50)%(4)
- -----------------------------------------
Portfolio Turnover Rate 206% 55%(5)
- -----------------------------------------
Net Assets, End of Period (in thousands) $24 $24
- --------------------------------------------------------------------------------
(1) July 29, 2005 (commencement of sale) through October 31, 2005.
(2) Computed using average shares outstanding throughout the period.
(3) Total return assumes reinvestment of net investment income and capital
gains distributions, if any. Total returns for periods less than one year
are not annualized. The total return of the classes may not precisely
reflect the class expense differences because of the impact of calculating
the net asset values to two decimal places. If net asset values were
calculated to three decimal places, the total return differences would more
closely reflect the class expense differences. The calculation of net asset
values to two decimal places is made in accordance with SEC guidelines and
does not result in any gain or loss of value between one class and another.
(4) Annualized.
(5) Portfolio turnover is calculated at the fund level. Percentage indicated
was calculated for the year ended October 31, 2005.
See Notes to Financial Statements.
- ------
58
Capital Growth - Financial Highlights
FOR A SHARE OUTSTANDING THROUGHOUT THE YEARS ENDED OCTOBER 31 (EXCEPT AS NOTED)
- --------------------------------------------------------------------------------
INVESTOR CLASS
- --------------------------------------------------------------------------------
2006 2005(1)
- --------------------------------------------------------------------------------
PER-SHARE DATA
- --------------------------------------------------------------------------------
Net Asset Value, Beginning of Period $10.60 $10.80
- --------------------------------------------------------------------------------
Income From Investment Operations
- --------------------------------------------
Net Investment Income (Loss)(2) --(3) --(3)
- --------------------------------------------
Net Realized and Unrealized Gain (Loss) 1.21 (0.20)
- --------------------------------------------------------------------------------
Total From Investment Operations 1.21 (0.20)
- --------------------------------------------------------------------------------
Net Asset Value, End of Period $11.81 $10.60
================================================================================
TOTAL RETURN(4) 11.42% (1.85)%
- --------------------------------------------------------------------------------
RATIOS/SUPPLEMENTAL DATA
- --------------------------------------------------------------------------------
Ratio of Operating Expenses
to Average Net Assets 1.00% 1.00%(5)
- --------------------------------------------
Ratio of Net Investment Income
(Loss) to Average Net Assets 0.05% (0.12)%(5)
- --------------------------------------------
Portfolio Turnover Rate 140% 110%(6)
- --------------------------------------------
Net Assets, End of Period (in thousands) $86 $25
- --------------------------------------------------------------------------------
(1) July 29, 2005 (commencement of sale) through October 31, 2005.
(2) Computed using average shares outstanding throughout the period.
(3) Per-share amount was less than $0.005.
(4) Total return assumes reinvestment of net investment income and capital
gains distributions, if any. Total returns for periods less than one year
are not annualized. The total return of the classes may not precisely
reflect the class expense differences because of the impact of calculating
the net asset values to two decimal places. If net asset values were
calculated to three decimal places, the total return differences would more
closely reflect the class expense differences. The calculation of net asset
values to two decimal places is made in accordance with SEC guidelines and
does not result in any gain or loss of value between one class and another.
(5) Annualized.
(6) Portfolio turnover is calculated at the fund level. Percentage indicated
was calculated for the year ended October 31, 2005.
See Notes to Financial Statements.
- ------
59
Capital Growth - Financial Highlights
FOR A SHARE OUTSTANDING THROUGHOUT THE YEARS ENDED OCTOBER 31 (EXCEPT AS NOTED)
- --------------------------------------------------------------------------------
INSTITUTIONAL CLASS
- --------------------------------------------------------------------------------
2006 2005(1)
- --------------------------------------------------------------------------------
PER-SHARE DATA
- --------------------------------------------------------------------------------
Net Asset Value, Beginning of Period $10.61 $10.80
- --------------------------------------------------------------------------------
Income From Investment Operations
- --------------------------------------------
Net Investment Income (Loss)(2) 0.03 --(3)
- --------------------------------------------
Net Realized and Unrealized Gain (Loss) 1.20 (0.19)
- --------------------------------------------------------------------------------
Total From Investment Operations 1.23 (0.19)
- --------------------------------------------------------------------------------
Net Asset Value, End of Period $11.84 $10.61
================================================================================
TOTAL RETURN(4) 11.59% (1.76)%
- --------------------------------------------------------------------------------
RATIOS/SUPPLEMENTAL DATA
- --------------------------------------------------------------------------------
Ratio of Operating Expenses
to Average Net Assets 0.80% 0.80%(5)
- --------------------------------------------
Ratio of Net Investment Income
(Loss) to Average Net Assets 0.25% 0.08%(5)
- --------------------------------------------
Portfolio Turnover Rate 140% 110%(6)
- --------------------------------------------
Net Assets, End of Period (in thousands) $27 $25
- --------------------------------------------------------------------------------
(1) July 29, 2005 (commencement of sale) through October 31, 2005.
(2) Computed using average shares outstanding throughout the period.
(3) Per-share amount was less than $0.005.
(4) Total return assumes reinvestment of net investment income and capital
gains distributions, if any. Total returns for periods less than one year
are not annualized. The total return of the classes may not precisely
reflect the class expense differences because of the impact of calculating
the net asset values to two decimal places. If net asset values were
calculated to three decimal places, the total return differences would more
closely reflect the class expense differences. The calculation of net asset
values to two decimal places is made in accordance with SEC guidelines and
does not result in any gain or loss of value between one class and another.
(5) Annualized.
(6) Portfolio turnover is calculated at the fund level. Percentage indicated
was calculated for the year ended October 31, 2005.
See Notes to Financial Statements.
- ------
60
Capital Growth - Financial Highlights
FOR A SHARE OUTSTANDING THROUGHOUT THE YEARS ENDED OCTOBER 31 (EXCEPT AS NOTED)
- --------------------------------------------------------------------------------
A CLASS
- --------------------------------------------------------------------------------
2006 2005 2004(1)
- --------------------------------------------------------------------------------
PER-SHARE DATA
- --------------------------------------------------------------------------------
Net Asset Value, Beginning of Period $10.59 $9.89 $10.00
- --------------------------------------------------------------------------------
Income From Investment Operations
- --------------------------------------
Net Investment Income (Loss)(2) (0.02) --(3) (0.03)
- --------------------------------------
Net Realized and
Unrealized Gain (Loss) 1.21 0.70 (0.08)
- --------------------------------------------------------------------------------
Total From Investment Operations 1.19 0.70 (0.11)
- --------------------------------------------------------------------------------
Net Asset Value, End of Period $11.78 $10.59 $9.89
================================================================================
TOTAL RETURN(4) 11.24% 7.08% (1.10)%
- --------------------------------------------------------------------------------
RATIOS/SUPPLEMENTAL DATA
- --------------------------------------------------------------------------------
Ratio of Operating Expenses
to Average Net Assets 1.25% 1.27% 1.25%(5)
- --------------------------------------
Ratio of Net Investment Income
(Loss) to Average Net Assets (0.20)% (0.03)% (0.43)%(5)
- --------------------------------------
Portfolio Turnover Rate 140% 110% 87%
- --------------------------------------
Net Assets, End of Period
(in thousands) $2,155 $1,216 $692
- --------------------------------------------------------------------------------
(1) February 27, 2004 (fund inception) through October 31, 2004.
(2) Computed using average shares outstanding throughout the period.
(3) Per-share amount was less than $0.005.
(4) Total return assumes reinvestment of net investment income and capital
gains distributions, if any, and does not reflect applicable sales charges.
Total returns for periods less than one year are not annualized. The total
return of the classes may not precisely reflect the class expense
differences because of the impact of calculating the net asset values to
two decimal places. If net asset values were calculated to three decimal
places, the total return differences would more closely reflect the class
expense differences. The calculation of net asset values to two decimal
places is made in accordance with SEC guidelines and does not result in any
gain or loss of value between one class and another.
(5) Annualized.
See Notes to Financial Statements.
- ------
61
Capital Growth - Financial Highlights
FOR A SHARE OUTSTANDING THROUGHOUT THE YEARS ENDED OCTOBER 31 (EXCEPT AS NOTED)
- --------------------------------------------------------------------------------
B CLASS
- --------------------------------------------------------------------------------
2006 2005 2004(1)
- --------------------------------------------------------------------------------
PER-SHARE DATA
- --------------------------------------------------------------------------------
Net Asset Value, Beginning of Period $10.46 $9.84 $10.00
- --------------------------------------------------------------------------------
Income From Investment Operations
- -----------------------------------
Net Investment Income (Loss)(2) (0.10) (0.08) (0.08)
- -----------------------------------
Net Realized and
Unrealized Gain (Loss) 1.18 0.70 (0.08)
- --------------------------------------------------------------------------------
Total From Investment Operations 1.08 0.62 (0.16)
- --------------------------------------------------------------------------------
Net Asset Value, End of Period $11.54 $10.46 $9.84
================================================================================
TOTAL RETURN(3) 10.33% 6.30% (1.60)%
- --------------------------------------------------------------------------------
RATIOS/SUPPLEMENTAL DATA
- --------------------------------------------------------------------------------
Ratio of Operating Expenses
to Average Net Assets 2.00% 2.02% 2.00%(4)
- -----------------------------------
Ratio of Net Investment
Income (Loss) to Average Net Assets (0.95)% (0.78)% (1.17)%(4)
- -----------------------------------
Portfolio Turnover Rate 140% 110% 87%
- -----------------------------------
Net Assets, End of Period
(in thousands) $960 $772 $450
- --------------------------------------------------------------------------------
(1) February 27, 2004 (fund inception) through October 31, 2004.
(2) Computed using average shares outstanding throughout the period.
(3) Total return assumes reinvestment of net investment income and capital
gains distributions, if any, and does not reflect applicable sales charges.
Total returns for periods less than one year are not annualized. The total
return of the classes may not precisely reflect the class expense
differences because of the impact of calculating the net asset values to
two decimal places. If net asset values were calculated to three decimal
places, the total return differences would more closely reflect the class
expense differences. The calculation of net asset values to two decimal
places is made in accordance with SEC guidelines and does not result in any
gain or loss of value between one class and another.
(4) Annualized.
See Notes to Financial Statements.
- ------
62
Capital Growth - Financial Highlights
FOR A SHARE OUTSTANDING THROUGHOUT THE YEARS ENDED OCTOBER 31 (EXCEPT AS NOTED)
- --------------------------------------------------------------------------------
C CLASS
- --------------------------------------------------------------------------------
2006 2005 2004(1)
- --------------------------------------------------------------------------------
PER-SHARE DATA
- --------------------------------------------------------------------------------
Net Asset Value, Beginning of Period $10.46 $9.84 $10.00
- --------------------------------------------------------------------------------
Income From Investment Operations
- -------------------------------------
Net Investment Income (Loss)(2) (0.10) (0.08) (0.08)
- -------------------------------------
Net Realized and
Unrealized Gain (Loss) 1.18 0.70 (0.08)
- --------------------------------------------------------------------------------
Total From Investment Operations 1.08 0.62 (0.16)
- --------------------------------------------------------------------------------
Net Asset Value, End of Period $11.54 $10.46 $9.84
================================================================================
TOTAL RETURN(3) 10.33% 6.30% (1.60)%
- --------------------------------------------------------------------------------
RATIOS/SUPPLEMENTAL DATA
- --------------------------------------------------------------------------------
Ratio of Operating Expenses
to Average Net Assets 2.00% 2.02% 2.00%(4)
- -------------------------------------
Ratio of Net Investment Income
(Loss) to Average Net Assets (0.95)% (0.78)% (1.18)%(4)
- -------------------------------------
Portfolio Turnover Rate 140% 110% 87%
- -------------------------------------
Net Assets, End of Period
(in thousands) $832 $609 $343
- --------------------------------------------------------------------------------
(1) February 27, 2004 (fund inception) through October 31, 2004.
(2) Computed using average shares outstanding throughout the period.
(3) Total return assumes reinvestment of net investment income and capital
gains distributions, if any, and does not reflect applicable sales charges.
Total returns for periods less than one year are not annualized. The total
return of the classes may not precisely reflect the class expense
differences because of the impact of calculating the net asset values to two
decimal places. If net asset values were calculated to three decimal places,
the total return differences would more closely reflect the class expense
differences. The calculation of net asset values to two decimal places is
made in accordance with SEC guidelines and does not result in any gain or
loss of value between one class and another.
(4) Annualized.
See Notes to Financial Statements.
- ------
63
Capital Growth - Financial Highlights
FOR A SHARE OUTSTANDING THROUGHOUT THE YEARS ENDED OCTOBER 31 (EXCEPT AS NOTED)
- --------------------------------------------------------------------------------
R CLASS
- --------------------------------------------------------------------------------
2006 2005(1)
- --------------------------------------------------------------------------------
PER-SHARE DATA
- --------------------------------------------------------------------------------
Net Asset Value, Beginning of Period $10.59 $10.80
- --------------------------------------------------------------------------------
Income From Investment Operations
- ---------------------------------------------------
Net Investment Income (Loss)(2) (0.05) (0.02)
- ---------------------------------------------------
Net Realized and Unrealized Gain (Loss) 1.20 (0.19)
- --------------------------------------------------------------------------------
Total From Investment Operations 1.15 (0.21)
- --------------------------------------------------------------------------------
Net Asset Value, End of Period $11.74 $10.59
================================================================================
TOTAL RETURN(3) 10.86% (1.94)%
- --------------------------------------------------------------------------------
RATIOS/SUPPLEMENTAL DATA
- --------------------------------------------------------------------------------
Ratio of Operating Expenses to Average Net Assets 1.50% 1.50%(4)
- ---------------------------------------------------
Ratio of Net Investment Income (Loss)
to Average Net Assets (0.45)% (0.62)%(4)
- ---------------------------------------------------
Portfolio Turnover Rate 140% 110%(5)
- ---------------------------------------------------
Net Assets, End of Period (in thousands) $27 $25
- --------------------------------------------------------------------------------
(1) July 29, 2005 (commencement of sale) through October 31, 2005.
(2) Computed using average shares outstanding throughout the period.
(3) Total return assumes reinvestment of net investment income and capital
gains distributions, if any. Total returns for periods less than one year
are not annualized. The total return of the classes may not precisely
reflect the class expense differences because of the impact of calculating
the net asset values to two decimal places. If net asset values were
calculated to three decimal places, the total return differences would more
closely reflect the class expense differences. The calculation of net asset
values to two decimal places is made in accordance with SEC guidelines and
does not result in any gain or loss of value between one class and another.
(4) Annualized.
(5) Portfolio turnover is calculated at the fund level. Percentage indicated
was calculated for the year ended October 31, 2005.
See Notes to Financial Statements.
- ------
64
Fundamental Equity - Financial Highlights
FOR A SHARE OUTSTANDING THROUGHOUT THE YEARS ENDED OCTOBER 31 (EXCEPT AS NOTED)
- --------------------------------------------------------------------------------
INVESTOR CLASS
- --------------------------------------------------------------------------------
2006 2005(1)
- --------------------------------------------------------------------------------
PER-SHARE DATA
- --------------------------------------------------------------------------------
Net Asset Value, Beginning of Period $11.04 $10.88
- --------------------------------------------------------------------------------
Income From Investment Operations
- -----------------------------------------------------
Net Investment Income (Loss)(2) 0.08 0.02
- -----------------------------------------------------
Net Realized and Unrealized Gain (Loss) 2.12 0.14
- --------------------------------------------------------------------------------
Total From Investment Operations 2.20 0.16
- --------------------------------------------------------------------------------
Distributions
- -----------------------------------------------------
From Net Realized Gains (0.36) --
- --------------------------------------------------------------------------------
Net Asset Value, End of Period $12.88 $11.04
================================================================================
TOTAL RETURN(3) 20.37% 1.47%
- --------------------------------------------------------------------------------
RATIOS/SUPPLEMENTAL DATA
- --------------------------------------------------------------------------------
Ratio of Operating Expenses to Average Net Assets 1.00% 1.00%(4)
- -----------------------------------------------------
Ratio of Net Investment Income (Loss)
to Average Net Assets 0.74% 0.59%(4)
- -----------------------------------------------------
Portfolio Turnover Rate 174% 101%(5)
- -----------------------------------------------------
Net Assets, End of Period (in thousands) $3,836 $25
- --------------------------------------------------------------------------------
(1) July 29, 2005 (commencement of sale) through October 31, 2005.
(2) Computed using average shares outstanding throughout the period.
(3) Total return assumes reinvestment of net investment income and capital
gains distributions, if any. Total returns for periods less than one year
are not annualized. The total return of the classes may not precisely
reflect the class expense differences because of the impact of calculating
the net asset values to two decimal places. If net asset values were
calculated to three decimal places, the total return differences would more
closely reflect the class expense differences. The calculation of net asset
values to two decimal places is made in accordance with SEC guidelines and
does not result in any gain or loss of value between one class and another.
(4) Annualized.
(5) Portfolio turnover is calculated at the fund level. Percentage indicated
was calculated for the period November 30, 2004 (fund inception) through
October 31, 2005.
See Notes to Financial Statements.
- ------
65
Fundamental Equity - Financial Highlights
FOR A SHARE OUTSTANDING THROUGHOUT THE YEARS ENDED OCTOBER 31 (EXCEPT AS NOTED)
- --------------------------------------------------------------------------------
INSTITUTIONAL CLASS
- --------------------------------------------------------------------------------
2006 2005(1)
- --------------------------------------------------------------------------------
PER-SHARE DATA
- --------------------------------------------------------------------------------
Net Asset Value, Beginning of Period $11.05 $10.88
- --------------------------------------------------------------------------------
Income From Investment Operations
- -------------------------------------------------
Net Investment Income (Loss)(2) 0.12 0.02
- -------------------------------------------------
Net Realized and Unrealized Gain (Loss) 2.10 0.15
- --------------------------------------------------------------------------------
Total From Investment Operations 2.22 0.17
- --------------------------------------------------------------------------------
Distributions
- -------------------------------------------------
From Net Realized Gains (0.37) --
- --------------------------------------------------------------------------------
Net Asset Value, End of Period $12.90 $11.05
================================================================================
TOTAL RETURN(3) 20.51% 1.56%
- --------------------------------------------------------------------------------
RATIOS/SUPPLEMENTAL DATA
- --------------------------------------------------------------------------------
Ratio of Operating Expenses to Average Net Assets 0.80% 0.80%(4)
- -------------------------------------------------
Ratio of Net Investment Income (Loss)
to Average Net Assets 0.94% 0.79%(4)
- -------------------------------------------------
Portfolio Turnover Rate 174% 101%(5)
- -------------------------------------------------
Net Assets, End of Period (in thousands) $31 $25
- --------------------------------------------------------------------------------
(1) July 29, 2005 (commencement of sale) through October 31, 2005.
(2) Computed using average shares outstanding throughout the period.
(3) Total return assumes reinvestment of net investment income and capital
gains distributions, if any. Total returns for periods less than one year
are not annualized. The total return of the classes may not precisely
reflect the class expense differences because of the impact of calculating
the net asset values to two decimal places. If net asset values were
calculated to three decimal places, the total return differences would more
closely reflect the class expense differences. The calculation of net asset
values to two decimal places is made in accordance with SEC guidelines and
does not result in any gain or loss of value between one class and another.
(4) Annualized.
(5) Portfolio turnover is calculated at the fund level. Percentage indicated
was calculated for the period November 30, 2004 (fund inception) through
October 31, 2005.
See Notes to Financial Statements.
- ------
66
Fundamental Equity - Financial Highlights
FOR A SHARE OUTSTANDING THROUGHOUT THE YEARS ENDED OCTOBER 31 (EXCEPT AS NOTED)
- --------------------------------------------------------------------------------
A CLASS
- --------------------------------------------------------------------------------
2006 2005(1)
- --------------------------------------------------------------------------------
PER-SHARE DATA
- --------------------------------------------------------------------------------
Net Asset Value, Beginning of Period $11.03 $10.00
- --------------------------------------------------------------------------------
Income From Investment Operations
- ---------------------------------------------
Net Investment Income (Loss)(2) 0.06 0.02
- ---------------------------------------------
Net Realized and Unrealized Gain (Loss) 2.11 1.01
- --------------------------------------------------------------------------------
Total From Investment Operations 2.17 1.03
- --------------------------------------------------------------------------------
Distributions
- ---------------------------------------------
From Net Realized Gains (0.35) --
- --------------------------------------------------------------------------------
Net Asset Value, End of Period $12.85 $11.03
================================================================================
TOTAL RETURN(3) 20.12% 10.30%
- --------------------------------------------------------------------------------
RATIOS/SUPPLEMENTAL DATA
- --------------------------------------------------------------------------------
Ratio of Operating Expenses
to Average Net Assets 1.25% 1.28%(4)
- ---------------------------------------------
Ratio of Net Investment Income (Loss)
to Average Net Assets 0.49% 0.17%(4)
- ---------------------------------------------
Portfolio Turnover Rate 174% 101%
- ---------------------------------------------
Net Assets, End of Period (in thousands) $37,314 $1,636
- --------------------------------------------------------------------------------
(1) November 30, 2004 (fund inception) through October 31, 2005.
(2) Computed using average shares outstanding throughout the period.
(3) Total return assumes reinvestment of net investment income and capital
gains distributions, if any, and does not reflect applicable sales charges.
Total returns for periods less than one year are not annualized. The total
return of the classes may not precisely reflect the class expense
differences because of the impact of calculating the net asset values to two
decimal places. If net asset values were calculated to three decimal places,
the total return differences would more closely reflect the class expense
differences. The calculation of net asset values to two decimal places is
made in accordance with SEC guidelines and does not result in any gain or
loss of value between one class and another.
(4) Annualized.
See Notes to Financial Statements.
- ------
67
Fundamental Equity - Financial Highlights
FOR A SHARE OUTSTANDING THROUGHOUT THE YEARS ENDED OCTOBER 31 (EXCEPT AS NOTED)
- --------------------------------------------------------------------------------
B CLASS
- --------------------------------------------------------------------------------
2006 2005(1)
- --------------------------------------------------------------------------------
PER-SHARE DATA
- --------------------------------------------------------------------------------
Net Asset Value, Beginning of Period $10.96 $10.00
- --------------------------------------------------------------------------------
Income From Investment Operations
- -----------------------------------------------
Net Investment Income (Loss)(2) (0.02) (0.06)
- -----------------------------------------------
Net Realized and Unrealized Gain (Loss) 2.07 1.02
- --------------------------------------------------------------------------------
Total From Investment Operations 2.05 0.96
- --------------------------------------------------------------------------------
Distributions
- -----------------------------------------------
From Net Realized Gains (0.27) --
- --------------------------------------------------------------------------------
Net Asset Value, End of Period $12.74 $10.96
================================================================================
TOTAL RETURN(3) 19.04% 9.60%
- --------------------------------------------------------------------------------
RATIOS/SUPPLEMENTAL DATA
- --------------------------------------------------------------------------------
Ratio of Operating Expenses
to Average Net Assets 2.00% 2.03%(4)
- -----------------------------------------------
Ratio of Net Investment Income (Loss)
to Average Net Assets (0.26)% (0.58)%(4)
- -----------------------------------------------
Portfolio Turnover Rate 174% 101%
- -----------------------------------------------
Net Assets, End of Period (in thousands) $1,498 $469
- --------------------------------------------------------------------------------
(1) November 30, 2004 (fund inception) through October 31, 2005.
(2) Computed using average shares outstanding throughout the period.
(3) Total return assumes reinvestment of net investment income and capital
gains distributions, if any, and does not reflect applicable sales charges.
Total returns for periods less than one year are not annualized. The total
return of the classes may not precisely reflect the class expense
differences because of the impact of calculating the net asset values to two
decimal places. If net asset values were calculated to three decimal places,
the total return differences would more closely reflect the class expense
differences. The calculation of net asset values to two decimal places is
made in accordance with SEC guidelines and does not result in any gain or
loss of value between one class and another.
(4) Annualized.
See Notes to Financial Statements.
- ------
68
Fundamental Equity - Financial Highlights
FOR A SHARE OUTSTANDING THROUGHOUT THE YEARS ENDED OCTOBER 31 (EXCEPT AS NOTED)
- --------------------------------------------------------------------------------
C CLASS
- --------------------------------------------------------------------------------
2006 2005(1)
- --------------------------------------------------------------------------------
PER-SHARE DATA
- --------------------------------------------------------------------------------
Net Asset Value, Beginning of Period $10.96 $10.00
- --------------------------------------------------------------------------------
Income From Investment Operations
- -------------------------------------------------
Net Investment Income (Loss)(2) (0.03) (0.06)
- -------------------------------------------------
Net Realized and Unrealized Gain (Loss) 2.09 1.02
- --------------------------------------------------------------------------------
Total From Investment Operations 2.06 0.96
- --------------------------------------------------------------------------------
Distributions
- -------------------------------------------------
From Net Realized Gains (0.27) --
- --------------------------------------------------------------------------------
Net Asset Value, End of Period $12.75 $10.96
================================================================================
TOTAL RETURN(3) 19.13% 9.60%
- --------------------------------------------------------------------------------
RATIOS/SUPPLEMENTAL DATA
- --------------------------------------------------------------------------------
Ratio of Operating Expenses
to Average Net Assets 2.00% 2.03%(4)
- -------------------------------------------------
Ratio of Net Investment Income (Loss)
to Average Net Assets (0.26)% (0.58)%(4)
- -------------------------------------------------
Portfolio Turnover Rate 174% 101%
- -------------------------------------------------
Net Assets, End of Period (in thousands) $4,530 $693
- --------------------------------------------------------------------------------
(1) November 30, 2004 (fund inception) through October 31, 2005.
(2) Computed using average shares outstanding throughout the period.
(3) Total return assumes reinvestment of net investment income and capital
gains distributions, if any, and does not reflect applicable sales charges.
Total returns for periods less than one year are not annualized. The total
return of the classes may not precisely reflect the class expense
differences because of the impact of calculating the net asset values to two
decimal places. If net asset values were calculated to three decimal places,
the total return differences would more closely reflect the class expense
differences. The calculation of net asset values to two decimal places is
made in accordance with SEC guidelines and does not result in any gain or
loss of value between one class and another.
(4) Annualized.
See Notes to Financial Statements.
- ------
69
Fundamental Equity - Financial Highlights
FOR A SHARE OUTSTANDING THROUGHOUT THE YEARS ENDED OCTOBER 31 (EXCEPT AS NOTED)
- --------------------------------------------------------------------------------
R CLASS
- --------------------------------------------------------------------------------
2006 2005(1)
- --------------------------------------------------------------------------------
PER-SHARE DATA
- --------------------------------------------------------------------------------
Net Asset Value, Beginning of Period $11.03 $10.88
- --------------------------------------------------------------------------------
Income From Investment Operations
- ------------------------------------------------
Net Investment Income (Loss)(2) 0.04 --(3)
- ------------------------------------------------
Net Realized and Unrealized Gain (Loss) 2.08 0.15
- --------------------------------------------------------------------------------
Total From Investment Operations 2.12 0.15
- --------------------------------------------------------------------------------
Distributions
- ------------------------------------------------
From Net Realized Gains (0.34) --
- --------------------------------------------------------------------------------
Net Asset Value, End of Period $12.81 $11.03
================================================================================
TOTAL RETURN(4) 19.67% 1.38%
- --------------------------------------------------------------------------------
RATIOS/SUPPLEMENTAL DATA
- --------------------------------------------------------------------------------
Ratio of Operating Expenses
to Average Net Assets 1.50% 1.50%(5)
- ------------------------------------------------
Ratio of Net Investment Income (Loss)
to Average Net Assets 0.24% 0.09%(5)
- ------------------------------------------------
Portfolio Turnover Rate 174% 101%(6)
- ------------------------------------------------
Net Assets, End of Period (in thousands) $30 $25
- --------------------------------------------------------------------------------
(1) July 29, 2005 (commencement of sale) through October 31, 2005.
(2) Computed using average shares outstanding throughout the period.
(3) Per-share amount is less than $0.005.
(4) Total return assumes reinvestment of net investment income and capital
gains distributions, if any. Total returns for periods less than one year
are not annualized. The total return of the classes may not precisely
reflect the class expense differences because of the impact of calculating
the net asset values to two decimal places. If net asset values were
calculated to three decimal places, the total return differences would more
closely reflect the class expense differences. The calculation of net asset
values to two decimal places is made in accordance with SEC guidelines and
does not result in any gain or loss of value between one class and another.
(5) Annualized.
(6) Portfolio turnover is calculated at the fund level. Percentage indicated
was calculated for the period November 30, 2004 (fund inception) through
October 31, 2005.
See Notes to Financial Statements.
- ------
70
New Opportunities II - Financial Highlights
FOR A SHARE OUTSTANDING THROUGHOUT THE YEARS ENDED OCTOBER 31
- --------------------------------------------------------------------------------
INVESTOR CLASS
- --------------------------------------------------------------------------------
2006 2005 2004 2003 2002
- --------------------------------------------------------------------------------
PER-SHARE DATA
- --------------------------------------------------------------------------------
Net Asset Value,
Beginning of Period $6.75 $6.29 $5.75 $4.15 $4.52
- --------------------------------------------------------------------------------
Income From
Investment Operations
- --------------------------
Net Investment
Income (Loss)(1) (0.06) (0.06) (0.07) (0.05) (0.05)
- --------------------------
Net Realized and
Unrealized Gain (Loss) 1.16 0.69 0.61 1.65 (0.32)
- --------------------------------------------------------------------------------
Total From
Investment Operations 1.10 0.63 0.54 1.60 (0.37)
- --------------------------------------------------------------------------------
Distributions
- --------------------------
From Net
Realized Gains (0.22) (0.17) -- -- --
- --------------------------------------------------------------------------------
Net Asset Value,
End of Period $7.63 $6.75 $6.29 $5.75 $4.15
================================================================================
TOTAL RETURN(2) 16.52% 10.14% 9.39% 38.55% (8.19)%
- --------------------------------------------------------------------------------
RATIOS/SUPPLEMENTAL DATA
- --------------------------------------------------------------------------------
Ratio of Operating
Expenses to
Average Net Assets 1.50% 1.50% 1.50% 1.50% 1.50%
- --------------------------
Ratio of Net
Investment Income (Loss)
to Average Net Assets (0.80)% (0.93)% (1.09)% (1.11)% (1.02)%
- --------------------------
Portfolio Turnover Rate 299% 269% 255% 236% 182%
- --------------------------
Net Assets,
End of Period
(in thousands) $51,336 $43,157 $38,917 $32,512 $25,479
- --------------------------------------------------------------------------------
(1) Computed using average shares outstanding throughout the period.
(2) Total return assumes reinvestment of net investment income and capital
gains distributions, if any. The total return of the classes may not
precisely reflect the class expense differences because of the impact of
calculating the net asset values to two decimal places. If net asset values
were calculated to three decimal places, the total return differences would
more closely reflect the class expense differences. The calculation of net
asset values to two decimal places is made in accordance with SEC guidelines
and does not result in any gain or loss of value between one class and
another.
See Notes to Financial Statements.
- ------
71
New Opportunities II - Financial Highlights
FOR A SHARE OUTSTANDING THROUGHOUT THE YEARS ENDED OCTOBER 31 (EXCEPT AS NOTED)
- --------------------------------------------------------------------------------
A CLASS
- --------------------------------------------------------------------------------
2006 2005 2004 2003(1)
- --------------------------------------------------------------------------------
PER-SHARE DATA
- --------------------------------------------------------------------------------
Net Asset Value,
Beginning of Period $6.72 $6.26 $5.74 $4.15
- --------------------------------------------------------------------------------
Income From
Investment Operations
- --------------------------
Net Investment
Income (Loss)(2) (0.08) (0.08) (0.08) (0.05)
- --------------------------
Net Realized and
Unrealized Gain (Loss) 1.16 0.70 0.60 1.64
- --------------------------------------------------------------------------------
Total From
Investment Operations 1.08 0.62 0.52 1.59
- --------------------------------------------------------------------------------
Distributions
- --------------------------
From Net
Realized Gains (0.21) (0.16) -- --
- --------------------------------------------------------------------------------
Net Asset Value,
End of Period $7.59 $6.72 $6.26 $5.74
================================================================================
TOTAL RETURN(3) 16.22% 9.91% 9.06% 38.31%
- --------------------------------------------------------------------------------
RATIOS/SUPPLEMENTAL DATA
- --------------------------------------------------------------------------------
Ratio of Operating
Expenses to
Average Net Assets 1.75% 1.75% 1.75% 1.75%(4)
- --------------------------
Ratio of Net Investment
Income (Loss) to
Average Net Assets (1.05)% (1.18)% (1.34)% (1.47)%(4)
- --------------------------
Portfolio Turnover Rate 299% 269% 255% 236%(5)
- --------------------------
Net Assets, End of
Period (in thousands) $73,383 $47,937 $20,337 $891
- --------------------------------------------------------------------------------
(1) January 31, 2003 (commencement of sale) through October 31, 2003.
(2) Computed using average shares outstanding throughout the period.
(3) Total return assumes reinvestment of net investment income and capital
gains distributions, if any, and does not reflect applicable sales charges.
Total returns for periods less than one year are not annualized. The total
return of the classes may not precisely reflect the class expense
differences because of the impact of calculating the net asset values to two
decimal places. If net asset values were calculated to three decimal places,
the total return differences would more closely reflect the class expense
differences. The calculation of net asset values to two decimal places is
made in accordance with SEC guidelines and does not result in any gain or
loss of value between one class and another.
(4) Annualized.
(5) Portfolio turnover is calculated at the fund level. Percentage indicated
was calculated for the year ended October 31, 2003.
See Notes to Financial Statements.
- ------
72
New Opportunities II - Financial Highlights
FOR A SHARE OUTSTANDING THROUGHOUT THE YEARS ENDED OCTOBER 31 (EXCEPT AS NOTED)
- --------------------------------------------------------------------------------
B CLASS
- --------------------------------------------------------------------------------
2006 2005 2004 2003(1)
- --------------------------------------------------------------------------------
PER-SHARE DATA
- --------------------------------------------------------------------------------
Net Asset Value,
Beginning of Period $6.63 $6.18 $5.71 $4.15
- --------------------------------------------------------------------------------
Income From
Investment Operations
- ---------------------------
Net Investment
Income (Loss)(2) (0.14) (0.13) (0.13) (0.08)
- ---------------------------
Net Realized and
Unrealized Gain (Loss) 1.15 0.69 0.60 1.64
- --------------------------------------------------------------------------------
Total From
Investment Operations 1.01 0.56 0.47 1.56
- --------------------------------------------------------------------------------
Distributions
- ---------------------------
From Net
Realized Gains (0.15) (0.11) -- --
- --------------------------------------------------------------------------------
Net Asset Value,
End of Period $7.49 $6.63 $6.18 $5.71
================================================================================
TOTAL RETURN(3) 15.46% 9.03% 8.23% 37.59%
- --------------------------------------------------------------------------------
RATIOS/SUPPLEMENTAL DATA
- --------------------------------------------------------------------------------
Ratio of Operating Expenses
to Average Net Assets 2.50% 2.50% 2.50% 2.50%(4)
- ---------------------------
Ratio of Net Investment
Income (Loss) to
Average Net Assets (1.80)% (1.93)% (2.09)% (2.20)%(4)
- ---------------------------
Portfolio Turnover Rate 299% 269% 255% 236%(5)
- ---------------------------
Net Assets, End of
Period (in thousands) $3,383 $2,367 $1,163 $215
- --------------------------------------------------------------------------------
(1) January 31, 2003 (commencement of sale) through October 31, 2003.
(2) Computed using average shares outstanding throughout the period.
(3) Total return assumes reinvestment of net investment income and capital
gains distributions, if any, and does not reflect applicable sales charges.
Total returns for periods less than one year are not annualized. Returns are
calculated based on the net asset value on the last business day. The total
return of the classes may not precisely reflect the class expense
differences because of the impact of calculating the net asset values to two
decimal places. If net asset values were calculated to three decimal places,
the total return differences would more closely reflect the class expense
differences. The calculation of net asset values to two decimal places is
made in accordance with SEC guidelines and does not result in any gain or
loss of value between one class and another.
(4) Annualized.
(5) Portfolio turnover is calculated at the fund level. Percentage indicated
was calculated for the year ended October 31, 2003.
See Notes to Financial Statements.
- ------
73
New Opportunities II - Financial Highlights
FOR A SHARE OUTSTANDING THROUGHOUT THE YEARS ENDED OCTOBER 31 (EXCEPT AS NOTED)
- --------------------------------------------------------------------------------
C CLASS
- --------------------------------------------------------------------------------
2006 2005 2004 2003(1)
- --------------------------------------------------------------------------------
PER-SHARE DATA
- --------------------------------------------------------------------------------
Net Asset Value,
Beginning of Period $6.66 $6.20 $5.73 $4.15
- --------------------------------------------------------------------------------
Income From
Investment Operations
- --------------------------
Net Investment
Income (Loss)(2) (0.14) (0.13) (0.13) (0.07)
- --------------------------
Net Realized and
Unrealized Gain (Loss) 1.15 0.70 0.60 1.65
- --------------------------------------------------------------------------------
Total From
Investment Operations 1.01 0.57 0.47 1.58
- --------------------------------------------------------------------------------
Distributions
- --------------------------
From Net
Realized Gains (0.15) (0.11) -- --
- --------------------------------------------------------------------------------
Net Asset Value,
End of Period $7.52 $6.66 $6.20 $5.73
================================================================================
TOTAL RETURN(3) 15.24% 9.16% 8.20% 38.07%
- --------------------------------------------------------------------------------
RATIOS/SUPPLEMENTAL DATA
- --------------------------------------------------------------------------------
Ratio of Operating
Expenses to
Average Net Assets 2.50% 2.50% 2.50% 2.22%(4)(5)
- --------------------------
Ratio of Net Investment
Income (Loss)
to Average Net Assets (1.80)% (1.93)% (2.09)% (1.97)%(4)(5)
- --------------------------
Portfolio Turnover Rate 299% 269% 255% 236%(6)
- --------------------------
Net Assets, End of
Period (in thousands) $4,424 $3,414 $1,294 $34
- --------------------------------------------------------------------------------
(1) January 31, 2003 (commencement of sale) through October 31, 2003.
(2) Computed using average shares outstanding throughout the period.
(3) Total return assumes reinvestment of net investment income and capital
gains distributions, if any, and does not reflect applicable sales charges.
Total returns for periods less than one year are not annualized. The total
return of the classes may not precisely reflect the class expense
differences because of the impact of calculating the net asset values to two
decimal places. If net asset values were calculated to three decimal places,
the total return differences would more closely reflect the class expense
differences. The calculation of net asset values to two decimal places is
made in accordance with SEC guidelines and does not result in any gain or
loss of value between one class and another.
(4) Annualized.
(5) During a portion of the period ended October 31, 2003, the distributor
agreed to voluntarily waive the distribution and service fees. Had fees not
been waived the annualized ratio of operating expenses to average net assets
and the annualized ratio of net investment income (loss) to average net
assets would have been 2.50% and (2.25)%, respectively.
(6) Portfolio turnover is calculated at the fund level. Percentage indicated
was calculated for the year ended October 31, 2003.
See Notes to Financial Statements.
- ------
74
Report of Independent Registered Public Accounting Firm
The Board of Directors and Shareholders,
American Century Mutual Funds, Inc.:
We have audited the accompanying statements of assets and liabilities, including
the schedules of investments, of Select Fund, Capital Growth Fund, Fundamental
Equity Fund and New Opportunities II Fund, (collectively the "Funds"), four of
the mutual funds comprising American Century Mutual Funds, Inc., as of October
31, 2006, and the related statements of operations for the year then ended, the
statements of changes in net assets for the periods presented, and the financial
highlights for the periods presented. These financial statements and financial
highlights are the responsibility of the Funds' management. Our responsibility
is to express an opinion on these financial statements and financial highlights
based on our audits.
We conducted our audits in accordance with the standards of the Public Company
Accounting Oversight Board (United States). Those standards require that we plan
and perform the audit to obtain reasonable assurance about whether the financial
statements and financial highlights are free of material misstatement. The Funds
are not required to have, nor were we engaged to perform, an audit of their
internal control over financial reporting. Our audits included consideration of
internal control over financial reporting as a basis for designing audit
procedures that are appropriate in the circumstances, but not for the purpose of
expressing an opinion on the effectiveness of the Funds' internal control over
financial reporting. Accordingly, we express no such opinion. An audit also
includes examining, on a test basis, evidence supporting the amounts and
disclosures in the financial statements, assessing the accounting principles
used and significant estimates made by management, as well as evaluating the
overall financial statement presentation. Our procedures included confirmation
of securities owned as of October 31, 2006, by correspondence with the custodian
and brokers; where replies were not received from brokers, we performed other
auditing procedures. We believe that our audits provide a reasonable basis for
our opinion.
In our opinion, the financial statements and financial highlights referred to
above present fairly, in all material respects, the financial position of each
of the respective Funds as of October 31, 2006, the results of their operations
for the year then ended, the changes in their net assets for periods presented,
and the financial highlights for the periods presented, in conformity with
accounting principles generally accepted in the United States of America.
Deloitte & Touche LLP
Kansas City, Missouri
December 14, 2006
- ------
75
Management
The individuals listed below serve as directors or officers of the funds. Each
director serves until his or her successor is duly elected and qualified or
until he or she retires. Mandatory retirement age for independent directors is
72. Those listed as interested directors are "interested" primarily by virtue of
their engagement as officers of American Century Companies, Inc. (ACC) or its
wholly owned, direct or indirect, subsidiaries, including the funds' investment
advisor, American Century Investment Management, Inc. (ACIM); the funds'
principal underwriter, American Century Investment Services, Inc. (ACIS); and
the funds' transfer agent, American Century Services, LLC (ACS).
The other directors (more than three-fourths of the total number) are
independent; that is, they have never been employees or officers of, and have no
financial interest in, ACC or any of its wholly owned subsidiaries, including
ACIM, ACIS, and ACS. The directors serve in this capacity for seven registered
investment companies in the American Century family of funds.
All persons named as officers of the funds also serve in a similar capacity for
the other 14 investment companies advised by ACIM or American Century Global
Investment Management, Inc. (ACGIM), unless otherwise noted. Only officers with
policy-making functions are listed. No officer is compensated for his or her
service as an officer of the funds. The listed officers are interested persons
of the funds and are appointed or re-appointed on an annual basis.
INDEPENDENT DIRECTORS
- --------------------------------------------------------------------------------
THOMAS A. BROWN
4500 Main Street, Kansas City, MO 64111
YEAR OF BIRTH: 1940
POSITION(S) HELD WITH FUND: Director
FIRST YEAR OF SERVICE: 1980
PRINCIPAL OCCUPATION(S) DURING PAST 5 YEARS: Retired, Formerly Chief Executive
Officer/Treasurer, Associated Bearings Company
NUMBER OF PORTFOLIOS IN FUND COMPLEX OVERSEEN BY DIRECTOR: 66
OTHER DIRECTORSHIPS HELD BY DIRECTOR: None
- --------------------------------------------------------------------------------
ANDREA C. HALL, PH.D.
4500 Main Street, Kansas City, MO 64111
YEAR OF BIRTH: 1945
POSITION(S) HELD WITH FUND: Director
FIRST YEAR OF SERVICE: 1997
PRINCIPAL OCCUPATION(S) DURING PAST 5 YEARS: Senior Vice President, Midwest
Research Institute
NUMBER OF PORTFOLIOS IN FUND COMPLEX OVERSEEN BY DIRECTOR: 66
OTHER DIRECTORSHIPS HELD BY DIRECTOR: None
- --------------------------------------------------------------------------------
D.D. (DEL) HOCK
4500 Main Street, Kansas City, MO 64111
YEAR OF BIRTH: 1935
POSITION(S) HELD WITH FUND: Director
FIRST YEAR OF SERVICE: 1996
PRINCIPAL OCCUPATION(S) DURING PAST 5 YEARS: Retired, formerly Chairman, Public
Service Company of Colorado
NUMBER OF PORTFOLIOS IN FUND COMPLEX OVERSEEN BY DIRECTOR: 66
OTHER DIRECTORSHIPS HELD BY DIRECTOR: Director, Allied Motion Technologies, Inc.
- --------------------------------------------------------------------------------
(continued)
- ------
76
Management
INDEPENDENT DIRECTORS (CONTINUED)
- --------------------------------------------------------------------------------
JAMES A. OLSON
4500 Main Street, Kansas City, MO 64111
YEAR OF BIRTH: 1942
POSITION(S) HELD WITH FUND: Advisory Board Member
FIRST YEAR OF SERVICE: 2006
PRINCIPAL OCCUPATION(S) DURING PAST 5 YEARS: Principal, Plaza Belmont LLC; Chief
Financial Officer, Plaza Belmont LLC (September 1999 to July 2006)
NUMBER OF PORTFOLIOS IN FUND COMPLEX OVERSEEN BY DIRECTOR: 66
OTHER DIRECTORSHIPS HELD BY DIRECTOR: Director, Saia, Inc. and Entertainment
Properties Trust
- --------------------------------------------------------------------------------
DONALD H. PRATT
4500 Main Street, Kansas City, MO 64111
YEAR OF BIRTH: 1937
POSITION(S) HELD WITH FUND: Director, Chairman of the Board
FIRST YEAR OF SERVICE: 1995
PRINCIPAL OCCUPATION(S) DURING PAST 5 YEARS: Chairman, Western Investments,
Inc.; Retired Chairman of the Board, Butler Manufacturing Company
NUMBER OF PORTFOLIOS IN FUND COMPLEX OVERSEEN BY DIRECTOR: 66
OTHER DIRECTORSHIPS HELD BY DIRECTOR: None
- --------------------------------------------------------------------------------
GALE E. SAYERS
4500 Main Street, Kansas City, MO 64111
YEAR OF BIRTH: 1943
POSITION(S) HELD WITH FUND: Director
FIRST YEAR OF SERVICE: 2000
PRINCIPAL OCCUPATION(S) DURING PAST 5 YEARS: President, Chief Executive Officer
and Founder, Sayers40, Inc., a technology products and service provider
NUMBER OF PORTFOLIOS IN FUND COMPLEX OVERSEEN BY DIRECTOR: 66
OTHER DIRECTORSHIPS HELD BY DIRECTOR: Director, Triad Hospitals, Inc.
- --------------------------------------------------------------------------------
M. JEANNINE STRANDJORD
4500 Main Street, Kansas City, MO 64111
YEAR OF BIRTH: 1945
POSITION(S) HELD WITH FUND: Director
FIRST YEAR OF SERVICE: 1994
PRINCIPAL OCCUPATION(S) DURING PAST 5 YEARS: Retired, formerly Senior Vice
President, Sprint Corporation
NUMBER OF PORTFOLIOS IN FUND COMPLEX OVERSEEN BY DIRECTOR: 66
OTHER DIRECTORSHIPS HELD BY DIRECTOR: Director, DST Systems, Inc.; Director,
Euronet Worldwide, Inc.
- --------------------------------------------------------------------------------
TIMOTHY S. WEBSTER
4500 Main Street, Kansas City, MO 64111
YEAR OF BIRTH: 1961
POSITION(S) HELD WITH FUND: Director
FIRST YEAR OF SERVICE: 2001
PRINCIPAL OCCUPATION(S) DURING PAST 5 YEARS: President and Chief Executive
Officer, American Italian Pasta Company (1992 to December 2005)
NUMBER OF PORTFOLIOS IN FUND COMPLEX OVERSEEN BY DIRECTOR: 66
OTHER DIRECTORSHIPS HELD BY DIRECTOR: None
- --------------------------------------------------------------------------------
INTERESTED DIRECTORS
- --------------------------------------------------------------------------------
JAMES E. STOWERS, JR.(1)
4500 Main Street, Kansas City, MO 64111
YEAR OF BIRTH: 1924
POSITION(S) HELD WITH FUND: Director, Co-Vice Chairman
FIRST YEAR OF SERVICE: 1958
PRINCIPAL OCCUPATION(S) DURING PAST 5 YEARS: Founder, Director and Controlling
Shareholder, ACC; Chairman, ACC (January 1995 to December 2004); Director, ACIM,
ACGIM, ACS, ACIS and other ACC subsidiaries
NUMBER OF PORTFOLIOS IN FUND COMPLEX OVERSEEN BY DIRECTOR: 66
OTHER DIRECTORSHIPS HELD BY DIRECTOR: None
- --------------------------------------------------------------------------------
(1) James E. Stowers, Jr. is the father of James E. Stowers III.
(continued)
- ------
77
Management
INTERESTED DIRECTORS (CONTINUED)
- --------------------------------------------------------------------------------
JAMES E. STOWERS III(1)
4500 Main Street, Kansas City, MO 64111
YEAR OF BIRTH: 1959
POSITION(S) HELD WITH FUND: Director, Co-Vice Chairman
FIRST YEAR OF SERVICE: 1990
PRINCIPAL OCCUPATION(S) DURING PAST 5 YEARS: Chairman, ACC (January 2005 to
present); Co-Chairman, ACC (September 2000 to December 2004); Chairman, ACS and
other ACC subsidiaries (April 2005 to September 2006); Director, ACC, ACIM,
ACGIM, ACS, ACIS and other ACC subsidiaries
NUMBER OF PORTFOLIOS IN FUND COMPLEX OVERSEEN BY DIRECTOR: 66
OTHER DIRECTORSHIPS HELD BY DIRECTOR: None
- --------------------------------------------------------------------------------
(1) James E. Stowers, Jr. is the father of James E. Stowers III.
- --------------------------------------------------------------------------------
OFFICERS
- --------------------------------------------------------------------------------
WILLIAM M. LYONS
4500 Main Street, Kansas City, MO 64111
YEAR OF BIRTH: 1955
POSITION(S) HELD WITH FUND: President
FIRST YEAR OF SERVICE: 2000
PRINCIPAL OCCUPATION(S) DURING PAST 5 YEARS: Chief Executive Officer, ACC
(September 2000 to present); President, ACC (June 1997 to present); Also serves
as: Chairman, ACIM, ACGIM, ACS, ACIS and other ACC subsidiaries; Chief Executive
Officer, ACIM, ACGIM, ACIS and other ACC subsidiaries (October 2000 to October
2006); President, ACIM, ACGIM and other ACC subsidiaries (September 2002 to
September 2006); Executive Vice President, ACS (January 2005 to September 2006);
Director, ACC, ACIM, ACGIM, ACS, ACIS and other ACC subsidiaries
- --------------------------------------------------------------------------------
JONATHAN THOMAS
4500 Main Street, Kansas City, MO 64111
YEAR OF BIRTH: 1963
POSITION(S) HELD WITH FUND: Executive Vice President
FIRST YEAR OF SERVICE: 2005
PRINCIPAL OCCUPATION(S) DURING PAST 5 YEARS: Chief Administrative Officer, ACC
(February 2006 to present); Executive Vice President, ACC (November 2005 to
present); Also serves as: President and Chief Executive Officer, ACS; Chief
Financial Officer and Chief Accounting Officer, ACIM, ACGIM, ACS, ACIS and other
ACC subsidiaries; Managing Director, Morgan Stanley (March 2000 to November
2005)
- --------------------------------------------------------------------------------
MARYANNE ROEPKE
4500 Main Street, Kansas City, MO 64111
YEAR OF BIRTH: 1956
POSITION(S) HELD WITH FUND: Chief Compliance Officer and Senior Vice President
FIRST YEAR OF SERVICE: 2000
PRINCIPAL OCCUPATION(S) DURING PAST 5 YEARS: Chief Compliance Officer, ACIM,
ACGIM and ACS (August 2006 to present); Assistant Treasurer, ACC (January 1995
to August 2006); Treasurer and Chief Financial Officer, various American Century
funds (July 2000 to August 2006); Also serves as: Senior Vice President, ACS
- --------------------------------------------------------------------------------
DAVID C. TUCKER
4500 Main Street, Kansas City, MO 64111
YEAR OF BIRTH: 1958
POSITION(S) HELD WITH FUND: Senior Vice President and General Counsel
FIRST YEAR OF SERVICE: 2000
PRINCIPAL OCCUPATION(S) DURING PAST 5 YEARS: Vice President, ACC (February 2001
to present); General Counsel, ACC (June 1998 to present); Also serves as: Senior
Vice President and General Counsel, ACIM, ACGIM, ACS, ACIS and other ACC
subsidiaries
- --------------------------------------------------------------------------------
(continued)
- ------
78
Management
OFFICERS (CONTINUED)
- --------------------------------------------------------------------------------
ROBERT LEACH
4500 Main Street, Kansas City, MO 64111
YEAR OF BIRTH: 1966
POSITION(S) HELD WITH FUND: Vice President, Treasurer and Chief Financial
Officer
FIRST YEAR OF SERVICE: 1997
PRINCIPAL OCCUPATION(S) DURING PAST 5 YEARS: Vice President, ACS (February 2000
to present); Controller, various American Century funds (June 1997 to September
2006)
- --------------------------------------------------------------------------------
C. JEAN WADE
4500 Main Street, Kansas City, MO 64111
YEAR OF BIRTH: 1964
POSITION(S) HELD WITH FUND: Controller
FIRST YEAR OF SERVICE: 2006
PRINCIPAL OCCUPATION(S) DURING PAST 5 YEARS: Vice President, ACS (February 2000
to present)
- --------------------------------------------------------------------------------
JON ZINDEL
4500 Main Street, Kansas City, MO 64111
YEAR OF BIRTH: 1967
POSITION(S) HELD WITH FUND: Tax Officer
FIRST YEAR OF SERVICE: 1997
PRINCIPAL OCCUPATION(S) DURING PAST 5 YEARS: Senior Vice President, ACC (August
2006 to present); Vice President, ACC and certain ACC subsidiaries (October 2001
to August 2006); Vice President, Corporate Tax, ACS (April 1998 to August 2006);
Also serves as: Senior Vice President, ACIM, ACGIM, ACS, ACIS and other ACC
subsidiaries
- --------------------------------------------------------------------------------
The SAI has additional information about the funds' directors and is available
without charge, upon request, by calling 1-800-345-2021.
- ------
79
Approval of Management Agreements for Select, Capital Growth, Fundamental Equity
and New Opportunities II
Under Section 15(c) of the Investment Company Act, contracts for investment
advisory services are required to be reviewed, evaluated and approved by a
majority of a fund's independent directors or trustees (the "Directors") each
year. At American Century, this process is referred to as the "15(c) Process."
As a part of this process, the board reviews fund performance, shareholder
services, audit and compliance information, and a variety of other reports from
the advisor concerning fund operations. In addition to this annual review, the
board of directors oversees and evaluates on a continuous basis at its quarterly
meetings the nature and quality of significant services performed by the
advisor, fund performance, audit and compliance information, and a variety of
other reports relating to fund operations. The board, or committees of the
board, also holds special meetings as needed.
Under a Securities and Exchange Commission rule, each fund is required to
disclose in its annual or semiannual report, as appropriate, the material
factors and conclusions that formed the basis for the board's approval or
renewal of any advisory agreements within the fund's most recently completed
fiscal half-year period.
ANNUAL CONTRACT REVIEW PROCESS
As part of the annual 15(c) Process undertaken during the most recent fiscal
half-year period, the Directors reviewed extensive data and information compiled
by the advisor and certain independent providers of evaluative data (the "15(c)
Providers") concerning Select, Capital Growth, Fundamental Equity and New
Opportunities II (the "funds") and the services provided to the funds under the
management agreement. The information considered and the discussions held at the
meetings included, but were not limited to:
* the nature, extent and quality of investment management, shareholder
services and other services provided to the funds under the management
agreement;
* reports on the advisor's activities relating to the wide range of programs
and services the advisor provides to the funds and its shareholders on a
routine and non-routine basis;
* data comparing the cost of owning the funds to the cost of owning similar
funds;
* data comparing the funds' performance to appropriate benchmarks and/or a
peer group of other mutual funds with similar investment objectives and
strategies;
* financial data showing the profitability of the funds to the advisor and the
overall profitability of the advisor; and
* data comparing services provided and charges to other investment management
clients of the advisor.
In keeping with its practice, the funds' board of directors held two regularly
scheduled meetings and one special meeting to review and discuss the information
provided by the advisor and to complete its negotiations with the advisor
regarding the renewal of the management agreement, including the setting of the
applicable advisory fee. The board also had the benefit of the advice of its
independent counsel throughout the period.
(continued)
- ------
80
Approval of Management Agreements for Select, Capital Growth, Fundamental Equity
and New Opportunities II
FACTORS CONSIDERED
The Directors considered all of the information provided by the advisor, the
15(c) Providers, and the board's independent counsel, and evaluated such
information for each fund for which the board has responsibility. The Directors
did not identify any single factor as being all-important or controlling, and
each Director may have attributed different levels of importance to different
factors. In deciding to renew the agreement under the terms ultimately
determined by the board to be appropriate, the Directors' decision was based on
the following factors.
NATURE, EXTENT AND QUALITY OF SERVICES -- GENERALLY. Under the management
agreement, the advisor is responsible for providing or arranging for all
services necessary for the operation of the funds. The board noted that under
the management agreement, the advisor provides or arranges at its own expense a
wide variety of services including:
* fund construction and design
* portfolio security selection
* initial capitalization/funding
* securities trading
* custody of fund assets
* daily valuation of the funds' portfolio
* shareholder servicing and transfer agency, including shareholder
confirmations, recordkeeping and communications
* legal services
* regulatory and portfolio compliance
* financial reporting
* marketing and distribution
The Directors noted that many of these services have expanded over time both in
terms of quantity and complexity in response to shareholder demands, competition
in the industry and the changing regulatory environment. In performing their
evaluation, the Directors considered information received in connection with the
annual review, as well as information provided on an ongoing basis at their
regularly scheduled board and committee meetings.
INVESTMENT MANAGEMENT SERVICES. The nature of the investment management services
provided is quite complex and allows fund shareholders access to professional
money management, instant diversification of their investments within an asset
class, the opportunity to easily diversify among asset classes, and liquidity.
In evaluating investment performance, the board expects the advisor to manage
the funds in accordance with its investment objectives and approved strategies.
In providing these services, the advisor utilizes teams of investment
professionals (portfolio managers, analysts, research assistants, and securities
traders) who require extensive information technology, research, training,
compliance and other systems to conduct their business. At each quarterly
meeting the Directors review investment performance information for the funds,
together with comparative information for appropriate benchmarks and peer groups
of funds managed similarly to the funds. The Directors also review detailed
performance information
(continued)
- ------
81
Approval of Management Agreements for Select, Capital Growth, Fundamental Equity
and New Opportunities II
during the 15(c) Process comparing the funds' performance with that of similar
funds not managed by the advisor. If performance concerns are identified, the
Directors discuss with the advisor the reasons for such results (e.g., market
conditions, security selection) and any efforts being undertaken to improve
performance. Select's, Capital Growth's and New Opportunities II's performance
fell below the median for both the one and three year periods during the past
year. The board discussed the funds' performance with the advisor and was
satisfied with the efforts being undertaken by the advisor. Fundamental Equity's
performance for both the one and three year periods was above the median for its
peer group.
SHAREHOLDER AND OTHER SERVICES. The advisor provides the funds with a
comprehensive package of transfer agency, shareholder, and other services. The
Directors review reports and evaluations of such services at their regular
quarterly meetings, including the annual meeting concerning contract review, and
reports to the board. These reports include, but are not limited to, information
regarding the operational efficiency and accuracy of the shareholder and
transfer agency services provided, staffing levels, shareholder satisfaction (as
measured by external as well as internal sources), technology support, new
products and services offered to fund shareholders, securities trading
activities, portfolio valuation services, auditing services, and legal and
operational compliance activities. Certain aspects of shareholder and transfer
agency service level efficiency and the quality of securities trading activities
are measured by independent third party providers and are presented in
comparison to other fund groups not managed by the advisor.
COSTS OF SERVICES PROVIDED AND PROFITABILITY TO THE ADVISOR. The advisor
provides detailed information concerning its cost of providing various services
to the funds, its profitability in managing the funds, its overall
profitability, and its financial condition. The Directors have reviewed with the
advisor the methodology used to prepare this financial information. This
financial information regarding the advisor is considered in order to evaluate
the advisor's financial condition, its ability to continue to provide services
under the management agreement, and the reasonableness of the current management
fee.
ETHICS OF THE ADVISOR. The Directors generally consider the advisor's commitment
to providing quality services to shareholders and to conducting its business
ethically. They noted that the advisor's practices generally meet or exceed
industry best practices and that the advisor was not implicated in the industry
scandals of 2003 and 2004.
ECONOMIES OF SCALE. The Directors review reports provided by the advisor on
economies of scale for the complex as a whole and the year-over-year changes in
revenue, costs, and profitability. The Directors concluded that economies of
scale are difficult to measure and predict with precision, especially on a
fund-by-fund basis. This analysis is also complicated by the additional services
and content provided by the advisor and its reinvestment in its
(continued)
- ------
82
Approval of Management Agreements for Select, Capital Growth, Fundamental Equity
and New Opportunities II
ability to provide and expand those services. Accordingly, the Directors also
seek to evaluate economies of scale by reviewing other information, such as
year-over-year profitability of the advisor generally, the profitability of its
management of the funds specifically, the expenses incurred by the advisor in
providing various functions to the funds, and the breakpoint fees of competitive
funds not managed by the advisor. The Directors believe the advisor is
appropriately sharing economies of scale through its competitive fee structure,
fee breakpoints as the funds increase in size, and through reinvestment in its
business to provide shareholders additional content and services.
COMPARISON TO OTHER FUNDS' FEES. The funds pay the advisor a single,
all-inclusive (or unified) management fee for providing all services necessary
for the management and operation of the funds, other than brokerage expenses,
taxes, interest, extraordinary expenses, and the fees and expenses of the funds'
independent directors (including their independent legal counsel). Under the
unified fee structure, the advisor is responsible for providing all investment
advisory, custody, audit, administrative, compliance, recordkeeping, marketing
and shareholder services, or arranging and supervising third parties to provide
such services. By contrast, most other funds are charged a variety of fees,
including an investment advisory fee, a transfer agency fee, an administrative
fee, distribution charges and other expenses. Other than their investment
advisory fees and Rule 12b-1 distribution fees, all other components of the
total fees charged by these other funds may be increased without shareholder
approval. The board believes the unified fee structure is a benefit to fund
shareholders because it clearly discloses to shareholders the cost of owning
fund shares, and, since the unified fee cannot be increased without a vote of
fund shareholders, it shifts to the advisor the risk of increased costs of
operating the funds and provides a direct incentive to minimize administrative
inefficiencies. Part of the Directors' analysis of fee levels involves reviewing
certain evaluative data compiled by a 15(c) Provider comparing the funds'
unified fee to the total expense ratio of other funds in the funds' peer group.
The unified fee charged to shareholders of each of Select and Capital Growth was
below the median of the total expense ratios of its peer group. The unified fee
charged to shareholders of Fundamental Equity was near the median of the total
expense ratios of its peer group. The unified fee charged to shareholders of New
Opportunity II was above the total expense ratios of its peer group.
COMPARISON TO FEES AND SERVICES PROVIDED TO OTHER CLIENTS OF THE ADVISOR. The
Directors also requested and received information from the advisor concerning
the nature of the services, fees, and profitability of its advisory services to
advisory clients other than the funds. They observed that these varying types of
client accounts require different services and involve different regulatory and
entrepreneurial risks than the management of the funds. The Directors analyzed
this information and concluded that the fees charged and services provided to
the funds were reasonable by comparison.
COLLATERAL BENEFITS DERIVED BY THE ADVISOR. The Directors reviewed infor-
(continued)
- ------
83
Approval of Management Agreements for Select, Capital Growth, Fundamental Equity
and New Opportunities II
mation from the advisor concerning collateral benefits it receives as a result
of its relationship with the funds. They concluded that the advisor's primary
business is managing mutual funds and it generally does not use the fund or
shareholder information to generate profits in other lines of business, and
therefore does not derive any significant collateral benefits from them. The
Directors noted that the advisor receives proprietary research from broker
dealers that execute fund portfolio transactions and concluded that this
research is likely to benefit fund shareholders. The Directors also determined
that the advisor is able to provide investment management services to certain
clients other than the funds, at least in part, due to its existing
infrastructure built to serve the fund complex. The Directors concluded,
however, that the assets of those other clients are not material to the analysis
and, in any event, are included with the assets of the funds to determine
breakpoints in the funds' fee schedule, provided they are managed using the same
investment team and strategy.
CONCLUSIONS OF THE DIRECTORS
As a result of this process, the independent directors, assisted by the advice
of legal counsel independent of the advisor, taking into account all of the
factors discussed above and the information provided by the advisor, negotiated
changes to the breakpoint schedule used to calculate the fund's management fee.
These changes were proposed by the Directors based on their review of the
competitive changes in the mutual fund marketplace and their review of financial
information provided by the advisor. The new schedule, effective August 1, 2006,
contains lower management fees at certain asset levels than under the existing
structure. Following these negotiations with the advisor, the independent
directors concluded that the investment management agreement between the funds
and the advisor is fair and reasonable in light of the services provided and
should be renewed.
- ------
84
Share Class Information
Seven classes of shares are authorized for sale by Select: Investor Class,
Institutional Class, Advisor Class, A Class, B Class, C Class and R Class. Six
classes of shares are authorized for sale by Capital Growth and Fundamental
Equity: Investor Class, Institutional Class, A Class, B Class, C Class and R
Class. Five classes of shares are authorized for sale by New Opportunities II:
Investor Class, Institutional Class, A Class, B Class and C Class. The total
expense ratio of Institutional Class shares is lower than that of Investor Class
shares. The total expense ratios of Advisor Class, A Class, B Class, C Class and
R Class shares are higher than that of Investor Class shares. Select and New
Opportunities II are available for purchase only through financial
intermediaries by investors who seek advice from them. The funds are closed to
other investors, but those with open accounts may make additional investments
and reinvest dividends and capital gains distributions as long as such accounts
remain open.
INVESTOR CLASS shares are available for purchase in two ways: 1) directly from
American Century without any commissions or other fees; or 2) through certain
financial intermediaries (such as banks, broker-dealers, insurance companies and
investment advisors), which may require payment of a transaction fee to the
financial intermediary.
INSTITUTIONAL CLASS shares are available to large investors such as endowments,
foundations, and retirement plans, and to financial intermediaries serving these
investors. This class recognizes the relatively lower cost of serving
institutional customers and others who invest at least $5 million ($3 million
for endowments and foundations) in an American Century fund or at least $10
million in multiple funds. In recognition of the larger investments and account
balances and comparatively lower transaction costs, the unified management fee
of Institutional Class shares is 0.20% less than the unified management fee of
Investor Class shares.
ADVISOR CLASS shares are sold primarily through institutions such as investment
advisors, banks, broker-dealers, insurance companies, and financial advisors.
Advisor Class shares are subject to a 0.50% annual Rule 12b-1 distribution and
service fee. The total expense ratio of Advisor Class shares is 0.25% higher
than the total expense ratio of Investor Class shares.
A CLASS shares are sold primarily through employer-sponsored retirement plans
through institutions such as investment advisors, banks, broker-dealers, and
insurance companies. A Class shares are sold at their offering price, which is
net asset value plus an initial sales charge that ranges from 5.75% to 0.00% for
equity funds, depending on the amount invested. The initial sales charge is
deducted from the purchase amount before it is invested. A Class shares may be
subject to a contingent deferred sales charge (CDSC). There is no CDSC on shares
acquired through reinvestment of dividends or capital gains. The prospectus
contains information regarding reductions and waivers of sales charges for A
Class shares. The unified management fee for A Class shares is the same as for
Investor Class shares. A Class shares also are subject to a 0.25% annual Rule
12b-1 distribution and service fee.
(continued)
- ------
85
Share Class Information
B CLASS shares are sold primarily through employer-sponsored retirement plans
through institutions such as investment advisors, banks, broker-dealers, and
insurance companies. B Class shares redeemed within six years of purchase are
subject to a CDSC that declines from 5.00% during the first year after purchase
to 0.00% after the sixth year. There is no CDSC on shares acquired through
reinvestment of dividends or capital gains. The unified management fee for B
Class shares is the same as for Investor Class shares. B Class shares also are
subject to a 1.00% annual Rule 12b-1 distribution and service fee. B Class
shares automatically convert to A Class shares (with lower expenses) eight years
after their purchase date.
C CLASS shares are sold primarily through employer-sponsored retirement plans
through institutions such as investment advisors, banks, broker-dealers, and
insurance companies. C Class shares redeemed within 12 months of purchase are
subject to a CDSC of 1.00%. There is no CDSC on shares acquired through
reinvestment of dividends or capital gains. The unified management fee for C
Class shares is the same as for Investor Class shares. C Class shares also are
subject to a Rule 12b-1 distribution and service fee of 1.00%.
R CLASS shares are sold primarily through employer-sponsored retirement plans
and through institutions such as investment advisors, banks, broker-dealers, and
insurance companies. The unified management fee for R Class shares is the same
as for Investor Class shares. R Class shares are subject to a 0.50% annual Rule
12b-1 distribution and service fee.
All classes of shares represent a pro rata interest in the funds and generally
have the same rights and preferences.
- ------
86
Additional Information
RETIREMENT ACCOUNT INFORMATION
As required by law, any distributions you receive from an IRA or certain 403(b),
457 and qualified plans [those not eligible for rollover to an IRA or to another
qualified plan] are subject to federal income tax withholding, unless you elect
not to have withholding apply. Tax will be withheld on the total amount
withdrawn even though you may be receiving amounts that are not subject to
withholding, such as nondeductible contributions. In such case, excess amounts
of withholding could occur. You may adjust your withholding election so that a
greater or lesser amount will be withheld.
If you don't want us to withhold on this amount, you must notify us to not
withhold the federal income tax. Even if you plan to roll over the amount you
withdraw to another tax-deferred account, the withholding rate still applies to
the withdrawn amount unless we have received notice not to withhold federal
income tax prior to the withdrawal. You may notify us in writing or in certain
situations by telephone or through other electronic means. You have the right to
revoke your withholding election at any time and any election you make may
remain in effect until revoked by filing a new election.
Remember, even if you elect not to have income tax withheld, you are liable for
paying income tax on the taxable portion of your withdrawal. If you elect not to
have income tax withheld or you don't have enough income tax withheld, you may
be responsible for payment of estimated tax. You may incur penalties under the
estimated tax rules if your withholding and estimated tax payments are not
sufficient.
State tax will be withheld if, at the time of your distribution, your address is
within one of the mandatory withholding states and you have federal income tax
withheld. State taxes will be withheld from your distribution in accordance with
the respective state rules.
PROXY VOTING GUIDELINES
American Century Investment Management, Inc., the funds' investment advisor, is
responsible for exercising the voting rights associated with the securities
purchased and/or held by the funds. A description of the policies and procedures
the advisor uses in fulfilling this responsibility is available without charge,
upon request, by calling 1-800-345-2021. It is also available on American
Century's website at americancentury.com and on the Securities and Exchange
Commission's website at sec.gov. Information regarding how the investment
advisor voted proxies relating to portfolio securities during the most recent
12-month period ended June 30 is available on the "About Us" page at
americancentury.com. It is also available at sec.gov.
QUARTERLY PORTFOLIO DISCLOSURE
The funds file their complete schedule of portfolio holdings with the Securities
and Exchange Commission (SEC) for the first and third quarters of each fiscal
year on Form N-Q. The funds' Forms N-Q are available on the SEC's website at
sec.gov, and may be reviewed and copied at the SEC's Public Reference Room in
Washington, DC. Information on the operation of the Public Reference Room may be
obtained by calling 1-800-SEC-0330. The funds also make their complete schedule
of portfolio holdings for the most recent quarter of their fiscal year available
on their website at americancentury.com and, upon request, by calling
1-800-345-2021.
- ------
87
Index Definitions
The following indices are used to illustrate investment market, sector, or style
performance or to serve as fund performance comparisons. They are not investment
products available for purchase.
The DOW JONES INDUSTRIAL AVERAGE (DJIA) is a price-weighted average of 30
actively traded blue chip stocks, primarily industrials but including
service-oriented firms. Prepared and published by Dow Jones & Co., it is the
oldest and most widely quoted of all the market indicators.
The NASDAQ COMPOSITE INDEX is a market value-weighted index of all domestic and
international common stocks listed on the Nasdaq stock market.
The RUSSELL 1000(reg.tm) INDEX is a market-capitalization weighted, large-cap
index created by Frank Russell Company to measure the performance of the 1,000
largest companies in the Russell 3000 Index (the 3,000 largest publicly traded
U.S. companies, based on total market capitalization).
The RUSSELL 1000(reg.tm) GROWTH INDEX measures the performance of those Russell
1000 Index companies (the 1,000 largest of the 3,000 largest publicly traded
U.S. companies, based on total market capitalization) with higher price-to-book
ratios and higher forecasted growth rates.
The RUSSELL 2000(reg.tm) INDEX is a market-capitalization weighted index created
by Frank Russell Company to measure the performance of the 2,000 smallest of the
3,000 largest publicly traded U.S. companies, based on total market
capitalization.
The RUSSELL 2000(reg.tm) GROWTH INDEX measures the performance of those Russell
2000 Index companies (the 2,000 smallest of the 3,000 largest publicly traded
U.S. companies, based on total market capitalization) with higher price-to-book
ratios and higher forecasted growth rates.
The S&P 500 INDEX is a market value-weighted index of the stocks of 500 publicly
traded U.S. companies chosen for market size, liquidity, and industry group
representation that are considered to be leading firms in dominant industries.
Each stock's weight in the index is proportionate to its market value. Created
by Standard & Poor's, it is considered to be a broad measure of U.S. stock
market performance.
- ------
88
CONTACT US
AMERICANCENTURY.COM
AUTOMATED INFORMATION LINE:
1-800-345-8765
INVESTOR SERVICES REPRESENTATIVE:
1-800-345-2021 or 816-531-5575
INVESTORS USING ADVISORS:
1-800-378-9878
BUSINESS, NOT-FOR-PROFIT,
EMPLOYER-SPONSORED RETIREMENT PLANS:
1-800-345-3533
BANKS AND TRUST COMPANIES, BROKER-DEALERS,
FINANCIAL PROFESSIONALS, INSURANCE COMPANIES:
1-800-345-6488
TELECOMMUNICATIONS DEVICE FOR THE DEAF:
1-800-634-4113 or 816-444-3485
AMERICAN CENTURY MUTUAL FUNDS, INC.
INVESTMENT ADVISOR:
American Century Investment Management, Inc.
Kansas City, Missouri
THIS REPORT AND THE STATEMENTS IT CONTAINS ARE SUBMITTED FOR THE GENERAL
INFORMATION OF OUR SHAREHOLDERS. THE REPORT IS NOT AUTHORIZED FOR DISTRIBUTION
TO PROSPECTIVE INVESTORS UNLESS PRECEDED OR ACCOMPANIED BY AN EFFECTIVE
PROSPECTUS.
American Century Investments PRSRT STD
P.O. Box 419200 U.S. POSTAGE PAID
Kansas City, MO 64141-6200 AMERICAN CENTURY COMPANIES
The American Century Investments logo, American Century and American Century
Investments are service marks of American Century Proprietary Holdings, Inc.
American Century Investment Services, Inc., Distributor
(c)2006 American Century Proprietary Holdings, Inc. All rights reserved.
0612
SH-ANN-52271S
AMERICAN CENTURY INVESTMENTS
Annual Report
October 31, 2006
[photo of winter scene]
New Opportunities Fund
[american century investments logo and text logo]
Our Message to You
[photo of James E. Stowers III and James E. Stowers, Jr.]
/s/James E. Stowers, Jr.
James E. Stowers, Jr.
FOUNDER
AMERICAN CENTURY COMPANIES, INC.
/s/James E. Stowers III
James E. Stowers III
CHAIRMAN OF THE BOARD
AMERICAN CENTURY COMPANIES, INC.
We are pleased to provide you with the annual report for the American Century
New Opportunities Fund for the year ended October 31, 2006. We hope you find
this information helpful in monitoring your investment. Another useful resource
we offer is our website, americancentury.com, where we post quarterly portfolio
commentaries, the views of senior investment officers and analysts, and other
communications about investments, portfolio strategy, personal finance, and the
markets.
In its most recent rankings, Dalbar -- which issues customer satisfaction
ratings and rankings based on website functionality -- ranked
americancentury.com seventh out of the sites provided by the top 25 fund
companies that it believes lead the industry in web-based technology. Our
website earned an "Excellent" rating, Dalbar's highest designation.
For most of 2006, our website has linked visitors to information explaining our
strategic collaboration with Lance Armstrong and the Lance Armstrong Foundation
(LAF). This campaign, featuring Lance, is designed to encourage investors to
take a more active role in planning their financial futures and make every
investment decision count. To learn more about the collaboration and the LAF,
please visit americancentury.com or www.lanceface.com on the Web and click on
the links to related sites.
With the approach of year end and the 2006 tax season, you can also find out
more about December fund distributions and tax information via a link from our
website. We've posted December distribution estimates for over 50 funds, answers
to frequent distribution questions, and online descriptions of all of the tax
information we provide to investors.
If you haven't visited americancentury.com yet, we encourage you to do so . . .
it's there to serve you. And so are we. As always, we deeply appreciate your
commitment to American Century Investments.
Table of Contents
Market Perspective . . . . . . . . . . . . . . . . . . . . . . . . . . . . 2
One-Year Total Returns . . . . . . . . . . . . . . . . . . . . . . . . . 2
NEW OPPORTUNITIES
Performance . . . . . . . . . . . . . . . . . . . . . . . . . . . . . . . . 3
Portfolio Commentary . . . . . . . . . . . . . . . . . . . . . . . . . . . 5
Top Ten Holdings . . . . . . . . . . . . . . . . . . . . . . . . . . . . 5
Top Five Industries . . . . . . . . . . . . . . . . . . . . . . . . . . 6
Types of Investments in Portfolio . . . . . . . . . . . . . . . . . . . 6
Shareholder Fee Example . . . . . . . . . . . . . . . . . . . . . . . . . . 7
Schedule of Investments . . . . . . . . . . . . . . . . . . . . . . . . . . 9
FINANCIAL STATEMENTS
Statement of Assets and Liabilities . . . . . . . . . . . . . . . . . . . 11
Statement of Operations . . . . . . . . . . . . . . . . . . . . . . . . . 12
Statement of Changes in Net Assets . . . . . . . . . . . . . . . . . . . . 13
Notes to Financial Statements . . . . . . . . . . . . . . . . . . . . . . 14
Financial Highlights . . . . . . . . . . . . . . . . . . . . . . . . . . . 18
Report of Independent Registered Public Accounting Firm . . . . . . . . . 19
OTHER INFORMATION
Management . . . . . . . . . . . . . . . . . . . . . . . . . . . . . . . . 20
Approval of Management Agreement for New Opportunities . . . . . . . . . . 23
Additional Information . . . . . . . . . . . . . . . . . . . . . . . . . . 28
Index Definitions . . . . . . . . . . . . . . . . . . . . . . . . . . . . 29
The opinions expressed in the Market Perspective and the Portfolio Commentary
reflect those of the portfolio management team as of the date of the report, and
do not necessarily represent the opinions of American Century or any other
person in the American Century organization. Any such opinions are subject to
change at any time based upon market or other conditions and American Century
disclaims any responsibility to update such opinions. These opinions may not be
relied upon as investment advice and, because investment decisions made by
American Century funds are based on numerous factors, may not be relied upon as
an indication of trading intent on behalf of any American Century fund. Security
examples are used for representational purposes only and are not intended as
recommendations to purchase or sell securities. Performance information for
comparative indices and securities is provided to American Century by third
party vendors. To the best of American Century's knowledge, such information is
accurate at the time of printing.
Market Perspective
[photo of Mark Mallon]
BY MARK MALLON, CHIEF INVESTMENT OFFICER, AMERICAN CENTURY INVESTMENTS
ECONOMIC GROWTH SURGED, THEN MODERATED
Economic growth -- along with commodity prices, short-term interest rates, and
inflation -- surged early in the 12-month period ended October 31, 2006. But
growth and inflation moderated in the period's second half, which saw the
Federal Reserve end its two-year string of interest rate hikes.
After a hurricane-related slowdown in the fourth quarter of 2005, U.S. gross
domestic product grew in the first quarter of 2006 at a 5.6% annualized pace,
the highest level in more than two years. The Fed steadily raised short-term
interest rates through June to keep inflation in check, including pressures from
soaring commodity prices. The Fed finally snapped its string of rate hikes in
August 2006, leaving its target at 5.25%, a five-year high. By then, economic
growth had slowed, dragged down in part by a cooling housing market.
BEST FISCAL-YEAR STOCK RETURNS SINCE 2003
The Fed's pause and expectations for lower interest rates and mild inflation
going forward helped produce the best U.S. stock returns for a 12-month fiscal
period ended October 31 since 2003. Market rallies beginning and ending the
period offset a late-spring/early-summer selloff. Growth stocks flourished in
the latter rally, but value stocks outperformed growth for the full reporting
period. Likewise, though large-cap stocks gained ground late in the period,
small-caps posted higher returns for the entire 12-month stretch.
In the first half of the 12-month period, investors celebrated a dip in crude
oil prices and strong economic growth by pushing stock prices higher. The
small-cap Russell 2000 Index led the way, surging 18.91%. Sentiment changed in
early May, however, when the Fed made it clear that more interest rate hikes
might be necessary to control inflation. Between April 30 and July 15, the S&P
500 fell 5.28%, and the Russell 2000 more than doubled that loss as investors
desired larger, more stable companies.
The selloff ended in late July after Fed chairman Ben Bernanke predicted
inflation would moderate. The Fed's subsequent rate pause in August and plunging
energy prices allowed stocks to rebound nicely in the last three months of the
reporting period.
ONE-YEAR TOTAL RETURNS
AS OF OCTOBER 31, 2006
- --------------------------------------------------------------------------------
S&P 500 Index 16.34%
- --------------------------------------------------------------------------------
Dow Jones Industrial Average 18.47%
- --------------------------------------------------------------------------------
Nasdaq Composite Index 12.48%
- --------------------------------------------------------------------------------
- ------
2
New Opportunities - Performance
TOTAL RETURNS AS OF OCTOBER 31, 2006
----------------------
AVERAGE ANNUAL RETURNS
- -----------------------------------------------------------------------------
SINCE INCEPTION
1 YEAR 5 YEARS INCEPTION DATE
- -----------------------------------------------------------------------------
NEW OPPORTUNITIES 14.39% 6.05% 7.72% 12/26/96
- -----------------------------------------------------------------------------
RUSSELL 2000 GROWTH INDEX(1) 17.07% 9.51% 4.74%(2) --
- -----------------------------------------------------------------------------
(1) Data provided by Lipper Inc. - A Reuters Company. (c) 2006 Reuters. All
rights reserved. Any copying, republication or redistribution of Lipper
content, including by caching, framing or similar means, is expressly
prohibited without the prior written consent of Lipper. Lipper shall not be
liable for any errors or delays in the content, or for any actions taken in
reliance thereon.
The data contained herein has been obtained from company reports, financial
reporting services, periodicals and other resources believed to be reliable.
Although carefully verified, data on compilations is not guaranteed by
Lipper and may be incomplete. No offer or solicitations to buy or sell any
of the securities herein is being made by Lipper.
(2) Since 12/31/96, the date nearest the fund's inception for which data are
available.
Data presented reflect past performance. Past performance is no guarantee of
future results. Current performance may be higher or lower than the performance
shown. Investment return and principal value will fluctuate, and redemption
value may be more or less than original cost. To obtain performance data current
to the most recent month end, please call 1-800-345-2021 or visit
americancentury.com. Historically, small company stocks have been more volatile
than the stocks of larger, more established companies.
Data assumes reinvestment of dividends and capital gains, and none of the charts
reflect the deduction of taxes that a shareholder would pay on fund
distributions or the redemption of fund shares. Returns for the index are
provided for comparison. The fund's total returns include operating expenses
(such as transaction costs and management fees) that reduce returns, while the
total returns of the index do not.
(continued)
- ------
3
New Opportunities - Performance
GROWTH OF $10,000 OVER LIFE OF FUND
$10,000 investment made December 26, 1996
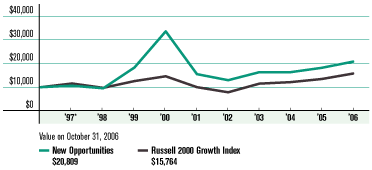
ONE-YEAR RETURNS OVER LIFE OF FUND
Periods ended October 31
- --------------------------------------------------------------------------------------------------------------
1997* 1998 1999 2000 2001 2002 2003 2004 2005 2006
- --------------------------------------------------------------------------------------------------------------
New Opportunities 6.20% -10.17% 92.03% 83.28% -53.81% -16.46% 26.18% 0.00% 11.26% 14.39%
- --------------------------------------------------------------------------------------------------------------
Russell 2000
Growth Index 15.64% -15.86% 29.28% 16.16% -31.50% -21.57% 46.56% 5.53% 10.91% 17.07%
- --------------------------------------------------------------------------------------------------------------
*From 12/26/96, the fund's inception date. Index data from 12/31/96, the date
nearest the fund's inception for which data are available.
Data presented reflect past performance. Past performance is no guarantee of
future results. Current performance may be higher or lower than the performance
shown. Investment return and principal value will fluctuate, and redemption
value may be more or less than original cost. To obtain performance data current
to the most recent month end, please call 1-800-345-2021 or visit
americancentury.com. Historically, small company stocks have been more volatile
than the stocks of larger, more established companies.
Data assumes reinvestment of dividends and capital gains, and none of the charts
reflect the deduction of taxes that a shareholder would pay on fund
distributions or the redemption of fund shares. Returns for the index are
provided for comparison. The fund's total returns include operating expenses
(such as transaction costs and management fees) that reduce returns, while the
total returns of the index do not.
- ------
4
New Opportunities - Portfolio Commentary
PORTFOLIO MANAGERS: HAROLD BRADLEY, STAFFORD SOUTHWICK, AND MATT FERRETTI
PERFORMANCE SUMMARY
New Opportunities advanced 14.39% during the 12 months ended October 31, 2006,
compared with the 17.07% return of its small-cap growth benchmark, the Russell
2000 Growth Index.
As outlined in the Market Perspective on page 2, a pause in the Federal
Reserve's interest rate hikes and expectations for lower interest rates and mild
inflation going forward helped New Opportunities post its highest fiscal-year
return since 2003. Small-cap stocks outpaced large-cap stocks for the period,
particularly in the first six months. The portfolio outperformed its benchmark
during that time, as the directional trend in the market suited the portfolio's
focus on share-price momentum and earnings growth acceleration.
In the second half of the period, though, the performance of large-cap stocks
improved as economic growth slowed. Small-caps lagged, with the Russell 2000
Index falling 10.27% between May 1 and July 15. The portfolio struggled to
adjust to this quick transition, especially as growth and momentum factors that
fit our investment style fell out of favor late in the period.
The June-September time period was the most adverse for growth and momentum
investment factors in 11 quarters. The fund typically does not generate excess
returns during market cycles when growth and momentum factors rotate out of
favor. Also, stock selection in the health care and technology sectors hurt
relative performance.
Despite its recent underperformance, New Opportunities has returned an annual
average of 7.72% since its December 26, 1996, inception, compared with 4.74% for
its benchmark*.
MANAGEMENT CHANGES
In April 2006, Stafford Southwick, formerly an investment analyst on the New
Opportunities team, was named co-portfolio manager of the fund. On June 30,
2006, portfolio manager Tom Telford switched responsibilities, leaving New
Opportunities to co-manage another American Century mutual fund. Matt Ferretti,
a four-year American Century veteran and investment analyst for New
Opportunities, succeeded Telford as co-manager of the portfolio.
MATERIALS ROLLED
New Opportunities took advantage of an upward trend in the materials sector
early in the 12-month period, as that sector surged with commodity prices. For
the full period, both an overweight
TOP TEN HOLDINGS
AS OF OCTOBER 31, 2006
- -------------------------------------------------------------------------------
% OF % OF
NET ASSETS NET ASSETS
AS OF AS OF
10/31/06 4/30/06
- --------------------------------------------------------------------------------
World Acceptance Corp. 2.8% --
- --------------------------------------------------------------------------------
Omnicell Inc. 2.5% --
- --------------------------------------------------------------------------------
Illumina, Inc. 2.0% --
- --------------------------------------------------------------------------------
Digital River Inc. 2.0% 0.9%
- --------------------------------------------------------------------------------
OM Group, Inc. 2.0% --
- --------------------------------------------------------------------------------
RenaissanceRe
Holdings Ltd. 1.8% --
- --------------------------------------------------------------------------------
Watson Wyatt
Worldwide Inc. 1.7% 1.2%
- --------------------------------------------------------------------------------
SonicWALL, Inc. 1.7% --
- --------------------------------------------------------------------------------
WellCare Health
Plans Inc. 1.6% --
- --------------------------------------------------------------------------------
Priceline.com Inc. 1.6% --
- --------------------------------------------------------------------------------
*Since 12/31/96, the date nearest the fund's inception for which data are
available. (continued)
- ------
5
New Opportunities - Portfolio Commentary
position and sound security selection in that sector boosted the portfolio's
relative performance considerably.
The materials sector contained the portfolio's largest average overweight
position in the reporting period, Titanium Metals. For the second consecutive
fiscal year, this maker of lightweight titanium materials for the aircraft
industry topped the portfolio's list of leading individual stock performers, as
its shares surged 149%. Two other companies in the sector, Zoltek and OM Group,
also ranked among the portfolio's top five relative contributors.
TROUBLE IN HEALTH CARE, TECHNOLOGY
The bulk of New Opportunities' relative underperformance stemmed from our stock
choices in health care and technology, including the portfolio's leading
detractor, Quidel Corp. Quidel makes diagnostic test kits, including one for
detecting the flu. Its share price plunged in late 2005, and we sold our stake
in the company.
The portfolio also suffered from security selection in the industrials sector,
primarily from a stake in GrafTech International, an Ohio-based maker of fuel
cells. The company lost more than a third of its market value in one trading
session in early February 2006, a month before it reported a significant decline
in its fourth-quarter 2005 operating profit.
PORTFOLIO OBJECTIVE & EXPECTATIONS
New Opportunities seeks long-term growth and is designed to provide small-cap
exposure to a diversified investment portfolio. The portfolio is best suited for
investors who can tolerate high levels of share price fluctuation in exchange
for compelling long-term return potential. To achieve our objective, we pursue
an investment approach of 1) identifying small companies that appear to have
accelerating earnings and revenue growth and 2) buying those companies when
potential rewards appear greatest.
TOP FIVE INDUSTRIES
AS OF OCTOBER 31, 2006
- --------------------------------------------------------------------------------
% OF % OF
NET ASSETS NET ASSETS
AS OF AS OF
10/31/06 4/30/06
- --------------------------------------------------------------------------------
Internet Software
& Services 7.8% 2.3%
- --------------------------------------------------------------------------------
Commercial Services
& Supplies 6.1% 5.3%
- --------------------------------------------------------------------------------
Insurance 5.6% --
- --------------------------------------------------------------------------------
Software 4.9% 2.1%
- --------------------------------------------------------------------------------
Semiconductors &
Semiconductor Equipment 4.4% 5.9%
- --------------------------------------------------------------------------------
TYPES OF INVESTMENTS IN PORTFOLIO
- --------------------------------------------------------------------------------
% OF % OF
NET ASSETS NET ASSETS
AS OF AS OF
10/31/06 4/30/06
- --------------------------------------------------------------------------------
Domestic
Common Stocks 86.7% 79.7%
- --------------------------------------------------------------------------------
Foreign Common Stocks(1) 12.3% 17.5%
- --------------------------------------------------------------------------------
TOTAL COMMON STOCKS 99.0% 97.2%
- --------------------------------------------------------------------------------
Temporary Cash
Investments 4.1% 0.7%
- --------------------------------------------------------------------------------
Other Assets
and Liabilities (3.1)% 2.1%
- --------------------------------------------------------------------------------
(1) Includes depositary shares, dual listed securities and foreign ordinary
shares.
- -----
6
Shareholder Fee Example (Unaudited)
Fund shareholders may incur two types of costs: (1) transaction costs, including
sales charges (loads) on purchase payments and redemption/exchange fees; and (2)
ongoing costs, including management fees; distribution and service (12b-1) fees;
and other fund expenses. This example is intended to help you understand your
ongoing costs (in dollars) of investing in your fund and to compare these costs
with the ongoing cost of investing in other mutual funds.
The example is based on an investment of $1,000 made at the beginning of the
period and held for the entire period from May 1, 2006 to October 31, 2006.
ACTUAL EXPENSES
The table provides information about actual account values and actual expenses
for each class. You may use the information, together with the amount you
invested, to estimate the expenses that you paid over the period. First,
identify the share class you own. Then simply divide your account value by
$1,000 (for example, an $8,600 account value divided by $1,000 = 8.6), then
multiply the result by the number under the heading "Expenses Paid During
Period" to estimate the expenses you paid on your account during this period.
If you hold Investor Class shares of any American Century fund, or Institutional
Class shares of the American Century Diversified Bond Fund, in an American
Century account (i.e., not a financial intermediary or retirement plan account),
American Century may charge you a $12.50 semiannual account maintenance fee if
the value of those shares is less than $10,000. We will redeem shares
automatically in one of your accounts to pay the $12.50 fee. In determining your
total eligible investment amount, we will include your investments in all
PERSONAL ACCOUNTS (including American Century Brokerage accounts) registered
under your Social Security number. PERSONAL ACCOUNTS include individual
accounts, joint accounts, UGMA/UTMA accounts, personal trusts, Coverdell
Education Savings Accounts and IRAs (including traditional, Roth, Rollover,
SEP-, SARSEP- and SIMPLE-IRAs), and certain other retirement accounts. If you
have only business, business retirement, employer-sponsored or American Century
Brokerage accounts, you are currently not subject to this fee. We will not
charge the fee as long as you choose to manage your accounts exclusively online.
If you are subject to the Account Maintenance Fee, your account value could be
reduced by the fee amount.
HYPOTHETICAL EXAMPLE FOR COMPARISON PURPOSES
The table also provides information about hypothetical account values and
hypothetical expenses based on the actual expense ratio of each class of your
fund and an assumed rate of return of 5% per year before expenses, which is not
the actual return of a fund's share class. The hypothetical account values and
expenses may not be used to estimate the actual ending account balance or
expenses you paid for the period. You may use this information to compare the
ongoing costs of investing in your fund and other funds. To do so, compare this
5% hypothetical example with the 5% hypothetical examples that appear in the
shareholder reports of the other funds.
(continued)
- ------
7
Shareholder Fee Example (Unaudited)
Please note that the expenses shown in the table are meant to highlight your
ongoing costs only and do not reflect any transactional costs, such as sales
charges (loads) or redemption/exchange fees. Therefore, the table is useful in
comparing ongoing costs only, and will not help you determine the relative total
costs of owning different funds. In addition, if these transactional costs were
included, your costs would have been higher.
- -------------------------------------------------------------------------------
EXPENSES PAID
BEGINNING ENDING DURING PERIOD* ANNUALIZED
ACCOUNT VALUE ACCOUNT VALUE 5/1/06 - EXPENSE
5/1/06 10/31/06 10/31/06 RATIO*
- -------------------------------------------------------------------------------
NEW OPPORTUNITIES
SHAREHOLDER
FEE EXAMPLE
- -------------------------------------------------------------------------------
Actual $1,000 $924.00 $7.27 1.50%
- -------------------------------------------------------------------------------
Hypothetical $1,000 $1,017.64 $7.63 1.50%
- -------------------------------------------------------------------------------
*Expenses are equal to the fund's annualized expense ratio listed in the table
above, multiplied by the average account value over the period, multiplied by
184, the number of days in the most recent fiscal half-year, divided by 365,
to reflect the one-half year period.
- ------
8
New Opportunities - Schedule of Investments
OCTOBER 31, 2006
Shares ($ IN THOUSANDS) Value
- --------------------------------------------------------------------------------
COMMON STOCKS -- 99.0%
AEROSPACE & DEFENSE -- 1.1%
- --------------------------------------------------------------------------------
143,836 Orbital Sciences Corp.(1) $ 2,612
- --------------------------------------------------------------------------------
AIRLINES - 1.9%
- --------------------------------------------------------------------------------
59,538 Copa Holdings SA Cl A 2,256
- --------------------------------------------------------------------------------
304,322 Frontier Airlines Holdings, Inc.(1) 2,447
- --------------------------------------------------------------------------------
4,703
- --------------------------------------------------------------------------------
AUTO COMPONENTS - 1.2%
- --------------------------------------------------------------------------------
133,813 LKQ Corporation(1) 3,096
- --------------------------------------------------------------------------------
BIOTECHNOLOGY - 0.8%
- --------------------------------------------------------------------------------
41,144 Digene Corp.(1) 1,910
- --------------------------------------------------------------------------------
CAPITAL MARKETS - 1.3%
- --------------------------------------------------------------------------------
169,693 Ares Capital Corp. 3,144
- --------------------------------------------------------------------------------
CHEMICALS - 3.0%
- --------------------------------------------------------------------------------
85,471 OM Group, Inc.(1) 4,871
- --------------------------------------------------------------------------------
97,512 Zoltek Companies, Inc.(1) 2,445
- --------------------------------------------------------------------------------
7,316
- --------------------------------------------------------------------------------
COMMERCIAL BANKS - 2.1%
- --------------------------------------------------------------------------------
57,570 Ameris Bancorp 1,607
- --------------------------------------------------------------------------------
97,946 Cascade Bancorp 3,571
- --------------------------------------------------------------------------------
5,178
- --------------------------------------------------------------------------------
COMMERCIAL SERVICES & SUPPLIES - 6.1%
- --------------------------------------------------------------------------------
74,071 Homeserve plc ORD 2,514
- --------------------------------------------------------------------------------
125,025 Knoll Inc. 2,475
- --------------------------------------------------------------------------------
137,713 Korn/Ferry International(1) 3,045
- --------------------------------------------------------------------------------
83,071 Mobile Mini Inc.(1) 2,672
- --------------------------------------------------------------------------------
96,015 Watson Wyatt Worldwide Inc. 4,336
- --------------------------------------------------------------------------------
15,042
- --------------------------------------------------------------------------------
COMMUNICATIONS EQUIPMENT - 2.6%
- --------------------------------------------------------------------------------
152,705 Oplink Communications Inc.(1) 3,024
- --------------------------------------------------------------------------------
35,982 SafeNet Inc.(1) 770
- --------------------------------------------------------------------------------
305,786 Symmetricom Inc.(1) 2,590
- --------------------------------------------------------------------------------
6,384
- --------------------------------------------------------------------------------
COMPUTERS & PERIPHERALS - 1.2%
- --------------------------------------------------------------------------------
138,704 QLogic Corp.(1) 2,855
- --------------------------------------------------------------------------------
CONSUMER FINANCE - 4.1%
- --------------------------------------------------------------------------------
46,771 First Marblehead Corp. (The) 3,155
- --------------------------------------------------------------------------------
138,786 World Acceptance Corp.(1) 6,938
- --------------------------------------------------------------------------------
10,093
- --------------------------------------------------------------------------------
CONTAINERS & PACKAGING - 2.1%
- --------------------------------------------------------------------------------
143,511 Myers Industries Inc. 2,600
- --------------------------------------------------------------------------------
65,959 Silgan Holdings Inc. 2,729
- --------------------------------------------------------------------------------
5,329
- --------------------------------------------------------------------------------
Shares ($ IN THOUSANDS) Value
- --------------------------------------------------------------------------------
DIVERSIFIED TELECOMMUNICATION SERVICES - 0.6%
- --------------------------------------------------------------------------------
103,963 Telecom Argentina SA ADR(1) $ 1,570
- --------------------------------------------------------------------------------
ELECTRIC UTILITIES - 1.4%
- --------------------------------------------------------------------------------
105,888 Great Plains Energy Inc. 3,446
- --------------------------------------------------------------------------------
ELECTRICAL EQUIPMENT - 0.7%
- --------------------------------------------------------------------------------
66,751 LSI Industries Inc. 1,198
- --------------------------------------------------------------------------------
51,233 Ultralife Batteries Inc.(1) 614
- --------------------------------------------------------------------------------
1,812
- --------------------------------------------------------------------------------
ELECTRONIC EQUIPMENT & INSTRUMENTS - 2.6%
- --------------------------------------------------------------------------------
393,639 Bell Microproducts Inc.(1) 2,653
- --------------------------------------------------------------------------------
55,265 Rogers Corp.(1) 3,867
- --------------------------------------------------------------------------------
6,520
- --------------------------------------------------------------------------------
ENERGY EQUIPMENT & SERVICES - 1.3%
- --------------------------------------------------------------------------------
101,059 Acergy SA ADR(1) 1,834
- --------------------------------------------------------------------------------
44,555 Gulf Island Fabrication Inc. 1,311
- --------------------------------------------------------------------------------
3,145
- --------------------------------------------------------------------------------
FOOD & STAPLES RETAILING - 1.0%
- --------------------------------------------------------------------------------
120,178 Spartan Stores, Inc. 2,485
- --------------------------------------------------------------------------------
FOOD PRODUCTS - 1.3%
- --------------------------------------------------------------------------------
92,072 Corn Products International Inc. 3,332
- --------------------------------------------------------------------------------
HEALTH CARE EQUIPMENT & SUPPLIES - 3.1%
- --------------------------------------------------------------------------------
47,449 China Medical
Technologies Inc. ADR(1) 1,205
- --------------------------------------------------------------------------------
49,844 Cooper Companies, Inc. (The) 2,872
- --------------------------------------------------------------------------------
46,690 Cynosure Inc. Cl A(1) 859
- --------------------------------------------------------------------------------
184,818 I-Flow Corp.(1) 2,867
- --------------------------------------------------------------------------------
7,803
- --------------------------------------------------------------------------------
HEALTH CARE PROVIDERS & SERVICES - 3.6%
- --------------------------------------------------------------------------------
84,151 Matria Healthcare Inc.(1) 2,373
- --------------------------------------------------------------------------------
199,146 Option Care Inc. 2,523
- --------------------------------------------------------------------------------
68,615 WellCare Health Plans Inc.(1) 4,031
- --------------------------------------------------------------------------------
8,927
- --------------------------------------------------------------------------------
HEALTH CARE TECHNOLOGY - 3.6%
- --------------------------------------------------------------------------------
120,951 Allscripts Healthcare
Solutions Inc.(1) 2,853
- --------------------------------------------------------------------------------
329,611 Omnicell Inc.(1) 6,174
- --------------------------------------------------------------------------------
9,027
- --------------------------------------------------------------------------------
HOTELS, RESTAURANTS & LEISURE - 1.3%
- --------------------------------------------------------------------------------
63,201 Life Time Fitness Inc.(1) 3,257
- --------------------------------------------------------------------------------
HOUSEHOLD DURABLES - 1.4%
- --------------------------------------------------------------------------------
564,536 Syntax-Brillian Corp.(1) 3,585
- --------------------------------------------------------------------------------
INSURANCE - 5.6%
- --------------------------------------------------------------------------------
92,893 IPC Holdings, Ltd. 2,791
- --------------------------------------------------------------------------------
57,499 Navigators Group Inc.(1) 2,706
- --------------------------------------------------------------------------------
65,918 Reinsurance Group of America 3,718
- --------------------------------------------------------------------------------
84,140 RenaissanceRe Holdings Ltd. 4,577
- --------------------------------------------------------------------------------
13,792
- --------------------------------------------------------------------------------
See Notes to Financial Statements. (continued)
- ------
9
New Opportunities - Schedule of Investments
OCTOBER 31, 2006
Shares ($ IN THOUSANDS) Value
- --------------------------------------------------------------------------------
INTERNET & CATALOG RETAIL - 3.9%
- --------------------------------------------------------------------------------
70,909 Blue Nile Inc.(1) $ 2,709
- --------------------------------------------------------------------------------
99,951 Coldwater Creek Inc.(1) 3,048
- --------------------------------------------------------------------------------
97,001 Priceline.com Inc.(1) 3,908
- --------------------------------------------------------------------------------
9,665
- --------------------------------------------------------------------------------
INTERNET SOFTWARE & SERVICES - 7.8%
- --------------------------------------------------------------------------------
270,091 24/7 Real Media, Inc.(1) 2,674
- --------------------------------------------------------------------------------
85,538 Digital River Inc.(1) 4,949
- --------------------------------------------------------------------------------
234,913 Interwoven Inc.(1) 2,988
- --------------------------------------------------------------------------------
394,054 SonicWALL, Inc.(1) 4,138
- --------------------------------------------------------------------------------
157,941 ValueClick Inc.(1) 2,969
- --------------------------------------------------------------------------------
105,430 Vocus Inc.(1) 1,710
- --------------------------------------------------------------------------------
19,428
- --------------------------------------------------------------------------------
IT SERVICES - 1.1%
- --------------------------------------------------------------------------------
111,709 Syntel Inc. 2,798
- --------------------------------------------------------------------------------
LIFE SCIENCES TOOLS & SERVICES - 2.0%
- --------------------------------------------------------------------------------
113,439 Illumina, Inc.(1) 4,987
- --------------------------------------------------------------------------------
MACHINERY - 3.9%
- --------------------------------------------------------------------------------
81,227 CIRCOR International Inc. 2,678
- --------------------------------------------------------------------------------
277,166 Deutz AG ORD(1) 2,792
- --------------------------------------------------------------------------------
52,901 Manitowoc Co., Inc. (The) 2,904
- --------------------------------------------------------------------------------
95,765 TurboChef Technologies Inc.(1) 1,187
- --------------------------------------------------------------------------------
9,561
- --------------------------------------------------------------------------------
MARINE - 2.5%
- --------------------------------------------------------------------------------
194,037 Diana Shipping Inc. 2,901
- --------------------------------------------------------------------------------
184,885 Eagle Bulk Shipping Inc. 3,176
- --------------------------------------------------------------------------------
6,077
- --------------------------------------------------------------------------------
MEDIA - 0.6%
- --------------------------------------------------------------------------------
109,736 Rentrak Corp.(1) 1,425
- --------------------------------------------------------------------------------
METALS & MINING - 1.1%
- --------------------------------------------------------------------------------
44,555 RTI International Metals, Inc.(1) 2,732
- --------------------------------------------------------------------------------
PHARMACEUTICALS - 3.3%
- --------------------------------------------------------------------------------
200,905 Dr. Reddy's Laboratories Ltd. ADR 3,375
- --------------------------------------------------------------------------------
140,981 Matrixx Initiatives Inc.(1) 3,089
- --------------------------------------------------------------------------------
218,947 Santarus Inc.(1) 1,684
- --------------------------------------------------------------------------------
8,148
- --------------------------------------------------------------------------------
REAL ESTATE INVESTMENT TRUSTS - 1.6%
- --------------------------------------------------------------------------------
154,790 Highland Hospitality Corp. 2,139
- --------------------------------------------------------------------------------
104,708 JER Investors Trust Inc. 1,881
- --------------------------------------------------------------------------------
4,020
- --------------------------------------------------------------------------------
REAL ESTATE MANAGEMENT & DEVELOPMENT - 0.9%
- --------------------------------------------------------------------------------
151,515 IRSA Inversiones y
Representaciones SA GDR(1) 2,177
- --------------------------------------------------------------------------------
Shares ($ IN THOUSANDS) Value
- --------------------------------------------------------------------------------
SEMICONDUCTORS & SEMICONDUCTOR EQUIPMENT - 4.4%
- --------------------------------------------------------------------------------
38,153 NVE Corp.(1) $ 1,696
- --------------------------------------------------------------------------------
147,430 Rudolph Technologies Inc.(1) 2,604
- --------------------------------------------------------------------------------
154,439 Silicon Motion
Technology Corp. ADR(1) 2,374
- --------------------------------------------------------------------------------
50,898 Standard Microsystems Corp.(1) 1,569
- --------------------------------------------------------------------------------
77,186 Tessera Technologies Inc.(1) 2,694
- --------------------------------------------------------------------------------
10,937
- --------------------------------------------------------------------------------
SOFTWARE - 4.9%
- --------------------------------------------------------------------------------
131,957 Altiris Inc.(1) 2,970
- --------------------------------------------------------------------------------
69,775 Hyperion Solutions Corp.(1) 2,610
- --------------------------------------------------------------------------------
181,548 i2 Technologies Inc.(1) 3,669
- --------------------------------------------------------------------------------
242,925 VASCO Data Security
International, Inc.(1) 2,816
- --------------------------------------------------------------------------------
12,065
- --------------------------------------------------------------------------------
SPECIALTY RETAIL - 2.3%
- --------------------------------------------------------------------------------
129,763 Cache Inc.(1) 2,783
- --------------------------------------------------------------------------------
480,761 Wet Seal, Inc. (The) Cl A(1) 3,000
- --------------------------------------------------------------------------------
5,783
- --------------------------------------------------------------------------------
TEXTILES, APPAREL & LUXURY GOODS - 3.7%
- --------------------------------------------------------------------------------
51,088 Deckers Outdoor Corp.(1) 2,716
- --------------------------------------------------------------------------------
159,268 Maidenform Brands, Inc.(1) 3,528
- --------------------------------------------------------------------------------
238,041 Xerium Technologies, Inc. 2,947
- --------------------------------------------------------------------------------
9,191
- --------------------------------------------------------------------------------
TOTAL COMMON STOCKS
(Cost $215,317) 245,357
- --------------------------------------------------------------------------------
TEMPORARY CASH INVESTMENTS -- 4.1%
Repurchase Agreement, Morgan Stanley
Group, Inc. (collateralized by various
U.S. Treasury obligations, 6.375% - 8.125%,
11/15/16 - 8/15/27, valued at $10,352),
in a joint trading account at 5.23%,
dated 10/31/06, due 11/1/06
(Delivery value $10,101)
(Cost $10,100) 10,100
- --------------------------------------------------------------------------------
TOTAL INVESTMENT SECURITIES -- 103.1%
(Cost $225,417) 255,457
- --------------------------------------------------------------------------------
OTHER ASSETS AND LIABILITIES -- (3.1)% (7,581)
- --------------------------------------------------------------------------------
TOTAL NET ASSETS -- 100.0% $247,876
================================================================================
NOTES TO SCHEDULE OF INVESTMENTS
ADR = American Depositary Receipt
GDR = Global Depositary Receipt
ORD = Foreign Ordinary Share
(1) Non-income producing.
See Notes to Financial Statements.
- ------
10
Statement of Assets and Liabilities
OCTOBER 31, 2006
(AMOUNTS IN THOUSANDS EXCEPT PER-SHARE AMOUNTS)
- --------------------------------------------------------------------------------
ASSETS
- --------------------------------------------------------------------------------
Investment securities, at value (cost of $225,417) $255,457
- --------------------------------------------------------------------
Cash 15
- --------------------------------------------------------------------
Receivable for investments sold 8,169
- --------------------------------------------------------------------
Dividends and interest receivable 109
- --------------------------------------------------------------------------------
263,750
- --------------------------------------------------------------------------------
LIABILITIES
- --------------------------------------------------------------------------------
Payable for investments purchased 15,560
- --------------------------------------------------------------------
Accrued management fees 314
- --------------------------------------------------------------------------------
15,874
- --------------------------------------------------------------------------------
NET ASSETS $247,876
================================================================================
CAPITAL SHARES, $0.01 PAR VALUE
- --------------------------------------------------------------------
Authorized 300,000
================================================================================
Outstanding 38,505
================================================================================
NET ASSET VALUE PER SHARE $6.44
================================================================================
NET ASSETS CONSIST OF:
- --------------------------------------------------------------------
Capital (par value and paid-in surplus) $338,159
- --------------------------------------------------------------------
Accumulated net realized loss on investment
and foreign currency transactions (120,323)
- --------------------------------------------------------------------
Net unrealized appreciation on
investments and translation of assets
and liabilities in foreign currencies 30,040
- --------------------------------------------------------------------------------
$247,876
================================================================================
See Notes to Financial Statements.
- ------
11
Statement of Operations
YEAR ENDED OCTOBER 31, 2006
(AMOUNTS IN THOUSANDS)
- --------------------------------------------------------------------------------
INVESTMENT INCOME (LOSS)
- --------------------------------------------------------------------------------
INCOME:
- --------------------------------------------------------------------
Dividends $ 1,542
- --------------------------------------------------------------------
Interest 157
- --------------------------------------------------------------------------------
1,699
- --------------------------------------------------------------------------------
EXPENSES:
- --------------------------------------------------------------------
Management fees 3,863
- --------------------------------------------------------------------
Directors' fees and expenses 4
- --------------------------------------------------------------------
Other expenses 8
- --------------------------------------------------------------------------------
3,875
- --------------------------------------------------------------------------------
NET INVESTMENT INCOME (LOSS) (2,176)
- --------------------------------------------------------------------------------
REALIZED AND UNREALIZED GAIN (LOSS)
- --------------------------------------------------------------------
Net realized gain (loss) on investment
and foreign currency transactions 35,957
- --------------------------------------------------------------------
Change in net unrealized
appreciation (depreciation) on
investments and translation of
assets liabilities in foreign currencies (894)
- --------------------------------------------------------------------------------
NET REALIZED AND UNREALIZED GAIN (LOSS) 35,063
- --------------------------------------------------------------------------------
NET INCREASE (DECREASE) IN
NET ASSETS RESULTING FROM OPERATIONS $32,887
================================================================================
See Notes to Financial Statements.
- ------
12
Statement of Changes in Net Assets
YEARS ENDED OCTOBER 31, 2006 AND OCTOBER 31, 2005
(AMOUNTS IN THOUSANDS)
- --------------------------------------------------------------------------------
INCREASE (DECREASE) IN NET ASSETS 2006 2005
- --------------------------------------------------------------------------------
OPERATIONS
- --------------------------------------------------------------------------------
Net investment income (loss) $ (2,176) $ (2,518)
- ---------------------------------------------------------
Net realized gain (loss) 35,957 29,887
- ---------------------------------------------------------
Change in net unrealized
appreciation (depreciation) (894) 120
- --------------------------------------------------------------------------------
Net increase (decrease) in
net assets resulting from operations 32,887 27,489
- --------------------------------------------------------------------------------
CAPITAL SHARE TRANSACTIONS
- --------------------------------------------------------------------------------
Proceeds from shares sold 25,292 12,549
- ---------------------------------------------------------
Payments for shares redeemed(1) (50,767) (73,129)
- --------------------------------------------------------------------------------
Net increase (decrease) in
net assets from capital share transactions (25,475) (60,580)
- --------------------------------------------------------------------------------
NET INCREASE (DECREASE) IN NET ASSETS 7,412 (33,091)
- --------------------------------------------------------------------------------
NET ASSETS
- --------------------------------------------------------------------------------
Beginning of period 240,464 273,555
- --------------------------------------------------------------------------------
End of period $247,876 $240,464
================================================================================
TRANSACTIONS IN SHARES OF THE FUND
- --------------------------------------------------------------------------------
Sold 3,875 2,284
- ---------------------------------------------------------
Redeemed (8,088) (13,618)
- --------------------------------------------------------------------------------
Net increase (decrease) in shares of the fund (4,213) (11,334)
================================================================================
(1) Net of redemption fees of $62 and $10, respectively.
See Notes to Financial Statements.
- ------
13
Notes to Financial Statements
OCTOBER 31, 2006 (AMOUNTS IN THOUSANDS)
1. ORGANIZATION AND SUMMARY OF SIGNIFICANT ACCOUNTING POLICIES
ORGANIZATION -- American Century Mutual Funds, Inc. (the corporation) is
registered under the Investment Company Act of 1940 (the 1940 Act) as an
open-end management investment company. New Opportunities Fund (the fund) is one
fund in a series issued by the corporation. The fund is diversified under the
1940 Act. The fund's investment objective is to seek long-term capital growth.
The fund pursues its objective by investing primarily in common stocks of
smaller-sized companies that management believes will increase in value over
time. The following is a summary of the fund's significant accounting policies.
SECURITY VALUATIONS -- Securities traded primarily on a principal securities
exchange are valued at the last reported sales price, or at the mean of the
latest bid and asked prices where no last sales price is available. Depending on
local convention or regulation, securities traded over-the-counter are valued at
the mean of the latest bid and asked prices, the last sales price, or the
official close price. Debt securities not traded on a principal securities
exchange are valued through a commercial pricing service or at the mean of the
most recent bid and asked prices. Discount notes may be valued through a
commercial pricing service or at amortized cost, which approximates fair value.
Securities traded on foreign securities exchanges and over-the-counter markets
are normally completed before the close of business on days that the New York
Stock Exchange (the Exchange) is open and may also take place on days when the
Exchange is not open. If an event occurs after the value of a security was
established but before the net asset value per share was determined that was
likely to materially change the net asset value, that security would be valued
at fair value as determined in accordance with procedures adopted by the Board
of Directors. If the fund determines that the market price of a portfolio
security is not readily available, or that the valuation methods mentioned above
do not reflect the security's fair value, such security is valued at its fair
value as determined by, or in accordance with procedures adopted by, the Board
of Directors or its designee if such fair value determination would materially
impact a fund's net asset value. Certain other circumstances may cause the fund
to fair value a security such as: a security has been declared in default;
trading in a security has been halted during the trading day; or there is a
foreign market holiday and no trading will commence.
SECURITY TRANSACTIONS -- Security transactions are accounted for as of the trade
date. Net realized gains and losses are determined on the identified cost basis,
which is also used for federal income tax purposes.
INVESTMENT INCOME -- Dividend income less foreign taxes withheld, if any, is
recorded as of the ex-dividend date. Distributions received on securities that
represent a return of capital or capital gain are recorded as a reduction of
cost of investments and/or as a realized gain. The fund estimates the components
of distributions received that may be considered nontaxable distributions or
capital gain distributions for income tax purposes. Interest income is recorded
on the accrual basis and includes accretion of discounts and amortization of
premiums.
FOREIGN CURRENCY TRANSACTIONS -- All assets and liabilities initially expressed
in foreign currencies are translated into U.S. dollars at prevailing exchange
rates at period end. Purchases and sales of investment securities, dividend and
interest income, and certain expenses are translated at the rates of exchange
prevailing on the respective dates of such transactions. For assets and
liabilities, other than investments in securities, net realized and unrealized
gains and losses from foreign currency translations arise from changes in
currency exchange rates.
Net realized and unrealized foreign currency exchange gains or losses occurring
during the holding period of investment securities are a component of realized
gain (loss) on investment transactions and unrealized appreciation
(depreciation) on investments, respectively. Certain countries may impose taxes
on the contract amount of purchases and sales of foreign currency contracts in
their currency. The fund records the foreign tax expense, if any, as a reduction
to the net realized gain (loss) on foreign currency transactions.
REPURCHASE AGREEMENTS -- The fund may enter into repurchase agreements with
institutions that American Century Investment Management, Inc. (ACIM) (the
investment advisor) has determined are creditworthy pursuant to criteria adopted
by the Board of Directors. Each repurchase agreement is recorded at cost. The
fund requires that the collateral, represented by securities, received in a
repurchase transaction be transferred to the custodian in a manner sufficient to
enable the fund to obtain those securities in the event of a default under the
repurchase agreement. ACIM monitors, on a daily basis, the securities
transferred to ensure the value, including accrued interest, of the securities
under each repurchase agreement is equal to or greater than amounts owed to the
fund under each repurchase agreement.
JOINT TRADING ACCOUNT -- Pursuant to an Exemptive Order issued by the Securities
and Exchange Commission, the fund, along with
(continued)
- ------
14
Notes to Financial Statements
OCTOBER 31, 2006 (AMOUNTS IN THOUSANDS)
1. ORGANIZATION AND SUMMARY OF SIGNIFICANT ACCOUNTING POLICIES (CONTINUED)
other registered investment companies having management agreements with ACIM
or American Century Global Investment Management, Inc. (ACGIM), may transfer
uninvested cash balances into a joint trading account. These balances are
invested in one or more repurchase agreements that are collateralized by
U.S. Treasury or Agency obligations.
INCOME TAX STATUS -- It is the fund's policy to distribute substantially all net
investment income and net realized gains to shareholders and to otherwise
qualify as a regulated investment company under provisions of the Internal
Revenue Code. Accordingly, no provision has been made for federal or state
income taxes.
DISTRIBUTIONS TO SHAREHOLDERS -- Distributions to shareholders are recorded on
the ex-dividend date. Distributions from net investment income and net realized
gains, if any, are generally declared and paid annually.
REDEMPTION -- The fund may impose a 2% redemption fee on shares held less than
180 days. The redemption fee is recorded as a reduction in the cost of shares
redeemed. The redemption fee is retained by the fund and helps cover transaction
costs that long-term investors may bear when a fund sells securities to meet
investor redemptions.
INDEMNIFICATIONS -- Under the corporation's organizational documents, its
officers and directors are indemnified against certain liabilities arising out
of the performance of their duties to the fund. In addition, in the normal
course of business, the fund enters into contracts that provide general
indemnifications. The fund's maximum exposure under these arrangements is
unknown as this would involve future claims that may be made against the fund.
The risk of material loss from such claims is considered by management to be
remote.
USE OF ESTIMATES -- The financial statements are prepared in conformity with
accounting principles generally accepted in the United States of America, which
may require management to make certain estimates and assumptions at the date of
the financial statements. Actual results could differ from these estimates.
2. FEES AND TRANSACTIONS WITH RELATED PARTIES
MANAGEMENT FEES -- The corporation has entered into a Management Agreement with
ACIM, under which ACIM provides the fund with investment advisory and management
services in exchange for a single, unified management fee (the fee). The
Agreement provides that all expenses of the fund, except brokerage commissions,
taxes, interest, fees and expenses of those directors who are not considered
"interested persons" as defined in the 1940 Act (including counsel fees) and
extraordinary expenses, will be paid by ACIM. The fee is computed and accrued
daily based on the daily net assets and paid monthly in arrears. For funds with
a stepped fee schedule, the rate of the fee is determined by applying a fee rate
calculation formula. This formula takes into account all of the investment
advisor's assets under management in the fund's investment strategy (strategy
assets) to calculate the appropriate fee rate for the fund. The strategy assets
include the fund's assets and the assets of other clients of the investment
advisor that are not in the American Century family of funds, but that have the
same investment team and investment strategy.
Effective August 1, 2006, the fund modified its management fee schedule,
resulting in lower fee rates and breakpoints. There was no significant impact on
the effective annual management fee for the year ended October 31, 2006
resulting from this change.
Effective August 1, 2006, the annual management fee schedule for the fund is as
follows:
- -----------------------------------------------------
INVESTOR CLASS
- -----------------------------------------------------
STRATEGY ASSETS
- -----------------------------------------------------
First $250 million 1.50%
- -----------------------------------------------------
Next $250 million 1.25%
- -----------------------------------------------------
Next $250 million 1.15%
- -----------------------------------------------------
Over $750 million 1.10%
- -----------------------------------------------------
(continued)
- ------
15
Notes to Financial Statements
OCTOBER 31, 2006 (AMOUNTS IN THOUSANDS)
2. FEES AND TRANSACTIONS WITH RELATED PARTIES (CONTINUED)
The effective annual management fee for the fund for the year ended October 31,
2006 was 1.50%.
RELATED PARTIES -- Certain officers and directors of the corporation are also
officers and/or directors, and, as a group, controlling stockholders of American
Century Companies, Inc. (ACC), the parent of the corporation's investment
advisor, ACIM, the distributor of the corporation, American Century Investment
Services, Inc., and the corporation's transfer agent, American Century Services,
LLC.
The fund has a bank line of credit agreement with JPMorgan Chase Bank (JPMCB).
JPMCB is a custodian of the fund and a wholly owned subsidiary of JPMorgan Chase
& Co. (JPM). JPM is an equity investor in ACC.
3. INVESTMENT TRANSACTIONS
Purchases and sales of investment securities, excluding short-term investments,
for the year ended October 31, 2006, were $763,464 and $788,284, respectively.
4. BANK LINE OF CREDIT
The fund, along with certain other funds managed by ACIM or ACGIM, has a $500
million unsecured bank line of credit agreement with JPMCB. The fund may borrow
money for temporary or emergency purposes to fund shareholder redemptions.
Borrowings under the agreement bear interest at the Federal Funds rate plus
0.50%. The fund did not borrow from the line during the year ended October 31,
2006.
5. RISK FACTORS
The fund concentrates its investments in common stocks of small companies.
Because of this, the fund may be subject to greater risk and market fluctuations
than a fund investing in larger, more established companies.
6. FEDERAL TAX INFORMATION
The book-basis character of distributions made during the year from net
investment income or net realized gains may differ from their ultimate
characterization for federal income tax purposes. These differences reflect the
differing character of certain income items and net realized gains and losses
for financial statement and tax purposes, and may result in reclassification
among certain capital accounts on the financial statements. There were no
distributions paid by the fund during the years ended October 31, 2006 and
October 31, 2005.
As of October 31, 2006, the components of distributable earnings on a tax-basis
and the federal tax cost of investments were as follows:
- --------------------------------------------------------------------------------
Federal tax cost of investments $ 225,450
================================================================================
Gross tax appreciation of investments $ 31,216
- -----------------------------------------------------------------
Gross tax depreciation of investments (1,209)
- --------------------------------------------------------------------------------
Net tax appreciation (depreciation) of investments $ 30,007
================================================================================
Undistributed ordinary income --
- -----------------------------------------------------------------
Accumulated capital losses $(120,290)
- --------------------------------------------------------------------------------
The difference between book-basis and tax-basis cost and unrealized appreciation
(depreciation) is attributable primarily to the tax deferral of losses on wash
sales and return of capital dividends.
The accumulated capital losses listed above represent net capital loss
carryovers that may be used to offset future realized capital gains for federal
income tax purposes. The capital loss carryovers of $82,591 and $37,699 expire
in 2009 through 2010, respectively.
(continued)
- ------
16
Notes to Financial Statements
OCTOBER 31, 2006 (AMOUNTS IN THOUSANDS)
7. RECENTLY ISSUED ACCOUNTING STANDARDS
In June 2006, the Financial Accounting Standards Board (FASB) issued
Interpretation No. 48, "Accounting for Uncertainty in Income Taxes - an
Interpretation of FASB Statement No. 109" (FIN 48). FIN 48 establishes a minimum
threshold for financial statement recognition of the benefit of positions taken
in filing tax returns (including whether an entity is taxable in a particular
jurisdiction), and requires certain expanded tax disclosures. FIN 48 is
effective for fiscal years beginning after December 15, 2006, and is to be
applied to all open tax years as of the date of effectiveness. The FASB issued
Statement of Financial Accounting Standards No. 157, "Fair Value Measurements"
(FAS 157), in September 2006, which is effective for fiscal years beginning
after November 15, 2007. FAS 157 defines fair value, establishes a framework for
measuring fair value and expands the required financial statement disclosures
about fair value measurements. Management is currently evaluating the impact of
adopting FIN 48 and FAS 157.
- ------
17
New Opportunities - Financial Highlights
For a Share Outstanding Throughout the Years Ended October 31
- --------------------------------------------------------------------------------
2006 2005 2004 2003 2002
- --------------------------------------------------------------------------------
PER-SHARE DATA
- --------------------------------------------------------------------------------
Net Asset Value,
Beginning of Period $5.63 $5.06 $5.06 $4.01 $4.80
- --------------------------------------------------------------------------------
Income From
Investment Operations
- -------------------------
Net Investment
Income (Loss) (0.06) (0.06) (0.06) (0.04) (0.05)
- -------------------------
Net Realized and
Unrealized Gain (Loss) 0.87 0.63 0.06 1.09 (0.74)
- --------------------------------------------------------------------------------
Total From
Investment Operations 0.81 0.57 -- 1.05 (0.79)
- --------------------------------------------------------------------------------
Net Asset Value,
End of Period $6.44 $5.63 $5.06 $5.06 $4.01
================================================================================
TOTAL RETURN(1) 14.39% 11.26% 0.00% 26.18% (16.46)%
- --------------------------------------------------------------------------------
RATIOS/SUPPLEMENTAL DATA
- --------------------------------------------------------------------------------
Ratio of Operating
Expenses to
Average Net Assets 1.50% 1.50% 1.49% 1.50% 1.50%
- -------------------------
Ratio of Net Investment
Income (Loss) to
Average Net Assets (0.84)% (0.98)% (1.04)% (0.98)% (1.02)%
- -------------------------
Portfolio Turnover Rate 298% 260% 269% 217% 175%
- -------------------------
Net Assets, End of Period
(in thousands) $247,876 $240,464 $273,555 $318,226 $297,180
- --------------------------------------------------------------------------------
(1) Total return assumes reinvestment of net investment income and capital
gains distributions, if any.
See Notes to Financial Statements.
- ------
18
Report of Independent Registered Public Accounting Firm
The Board of Directors and Shareholders,
American Century Mutual Funds, Inc.:
We have audited the accompanying statement of assets and liabilities, including
the schedule of investments, of New Opportunities Fund, (the "Fund"), one of the
mutual funds comprising American Century Mutual Funds, Inc., as of October 31,
2006, and the related statement of operations for the year then ended, the
statements of changes in net assets for each of the two years in the period then
ended, and the financial highlights for each of the five years in the period
then ended. These financial statements and financial highlights are the
responsibility of the Fund's management. Our responsibility is to express an
opinion on these financial statements and financial highlights based on our
audits.
We conducted our audits in accordance with the standards of the Public Company
Accounting Oversight Board (United States). Those standards require that we plan
and perform the audit to obtain reasonable assurance about whether the financial
statements and financial highlights are free of material misstatement. The Fund
is not required to have, nor were we engaged to perform, an audit of its
internal control over financial reporting. Our audits included consideration of
internal control over financial reporting as a basis for designing audit
procedures that are appropriate in the circumstances, but not for the purpose of
expressing an opinion on the effectiveness of the Fund's internal control over
financial reporting. Accordingly, we express no such opinion. An audit also
includes examining, on a test basis, evidence supporting the amounts and
disclosures in the financial statements, assessing the accounting principles
used and significant estimates made by management, as well as evaluating the
overall financial statement presentation. Our procedures included confirmation
of securities owned as of October 31, 2006, by correspondence with the custodian
and brokers; where replies were not received from brokers, we performed other
auditing procedures. We believe that our audits provide a reasonable basis for
our opinion.
In our opinion, the financial statements and financial highlights referred to
above present fairly, in all material respects, the financial position of New
Opportunities Fund as of October 31, 2006, the results of its operations for the
year then ended, the changes in its net assets for each of the two years in the
period then ended, and the financial highlights for each of the five years in
the period then ended, in conformity with accounting principles generally
accepted in the United States of America.
Deloitte & Touche LLP
Kansas City, Missouri
December 14, 2006
- ------
19
Management
The individuals listed below serve as directors or officers of the fund. Each
director serves until his or her successor is duly elected and qualified or
until he or she retires. Mandatory retirement age for independent directors is
72. Those listed as interested directors are "interested" primarily by virtue of
their engagement as officers of American Century Companies, Inc. (ACC) or its
wholly owned, direct or indirect, subsidiaries, including the fund's investment
advisor, American Century Investment Management, Inc. (ACIM); the fund's
principal underwriter, American Century Investment Services, Inc. (ACIS); and
the fund's transfer agent, American Century Services, LLC (ACS).
The other directors (more than three-fourths of the total number) are
independent; that is, they have never been employees or officers of, and have no
financial interest in, ACC or any of its wholly owned subsidiaries, including
ACIM, ACIS, and ACS. The directors serve in this capacity for seven registered
investment companies in the American Century family of funds.
All persons named as officers of the fund also serve in a similar capacity for
the other 14 investment companies advised by ACIM or American Century Global
Investment Management, Inc. (ACGIM), unless otherwise noted. Only officers with
policy-making functions are listed. No officer is compensated for his or her
service as an officer of the fund. The listed officers are interested persons of
the fund and are appointed or re-appointed on an annual basis.
- --------------------------------------------------------------------------------
INDEPENDENT DIRECTORS
- --------------------------------------------------------------------------------
THOMAS A. BROWN, 4500 Main Street, Kansas City, MO 64111
YEAR OF BIRTH: 1940
POSITION(S) HELD WITH FUND: Director
FIRST YEAR OF SERVICE: 1980
PRINCIPAL OCCUPATION(S) DURING PAST 5 YEARS: Retired, Formerly Chief Executive
Officer/Treasurer, Associated Bearings Company
NUMBER OF PORTFOLIOS IN FUND COMPLEX OVERSEEN BY DIRECTOR: 66
OTHER DIRECTORSHIPS HELD BY DIRECTOR: None
- --------------------------------------------------------------------------------
ANDREA C. HALL, Ph.D., 4500 Main Street, Kansas City, MO 64111
YEAR OF BIRTH: 1945
POSITION(S) HELD WITH FUND: Director
FIRST YEAR OF SERVICE: 1997
PRINCIPAL OCCUPATION(S) DURING PAST 5 YEARS: Senior Vice President, Midwest
Research Institute
NUMBER OF PORTFOLIOS IN FUND COMPLEX OVERSEEN BY DIRECTOR: 66
OTHER DIRECTORSHIPS HELD BY DIRECTOR: None
- --------------------------------------------------------------------------------
D.D. (DEL) HOCK, 4500 Main Street, Kansas City, MO 64111
YEAR OF BIRTH: 1935
POSITION(S) HELD WITH FUND: Director
FIRST YEAR OF SERVICE: 1996
PRINCIPAL OCCUPATION(S) DURING PAST 5 YEARS: Retired, formerly Chairman, Public
Service Company of Colorado
NUMBER OF PORTFOLIOS IN FUND COMPLEX OVERSEEN BY DIRECTOR: 66
OTHER DIRECTORSHIPS HELD BY DIRECTOR: Director, Allied Motion Technologies, Inc
- --------------------------------------------------------------------------------
(continued)
- ------
20
Management
- --------------------------------------------------------------------------------
INDEPENDENT DIRECTORS (CONTINUED)
- --------------------------------------------------------------------------------
JAMES A. OLSON, 4500 Main Street, Kansas City, MO 64111
YEAR OF BIRTH: 1942
POSITION(S) HELD WITH FUND: Advisory Board Member
FIRST YEAR OF SERVICE: 2006
PRINCIPAL OCCUPATION(S) DURING PAST 5 YEARS: Principal, Plaza Belmont LLC; Chief
Financial Officer, Plaza Belmont LLC (September 1999 to July 2006)
NUMBER OF PORTFOLIOS IN FUND COMPLEX OVERSEEN BY DIRECTOR: 66
OTHER DIRECTORSHIPS HELD BY DIRECTOR: Director, Saia, Inc. and Entertainment
Properties Trust
- --------------------------------------------------------------------------------
DONALD H. PRATT, 4500 Main Street, Kansas City, MO 64111
YEAR OF BIRTH: 1937
POSITION(S) HELD WITH FUND: Director, Chairman of the Board
FIRST YEAR OF SERVICE: 1995
PRINCIPAL OCCUPATION(S) DURING PAST 5 YEARS: Chairman, Western Investments,
Inc.; Retired Chairman of the Board, Butler Manufacturing Company
NUMBER OF PORTFOLIOS IN FUND COMPLEX OVERSEEN BY DIRECTOR: 66
OTHER DIRECTORSHIPS HELD BY DIRECTOR: None
- --------------------------------------------------------------------------------
GALE E. SAYERS, 4500 Main Street, Kansas City, MO 64111
YEAR OF BIRTH: 1943
POSITION(S) HELD WITH FUND: Director
FIRST YEAR OF SERVICE: 2000
PRINCIPAL OCCUPATION(S) DURING PAST 5 YEARS: President, Chief Executive Officer
and Founder, Sayers40, Inc., a technology products and service provider
NUMBER OF PORTFOLIOS IN FUND COMPLEX OVERSEEN BY DIRECTOR: 66
OTHER DIRECTORSHIPS HELD BY DIRECTOR: Director, Triad Hospitals, Inc.
- --------------------------------------------------------------------------------
M. JEANNINE STRANDJORD, 4500 Main Street, Kansas City, MO 64111
YEAR OF BIRTH: 1945
POSITION(S) HELD WITH FUND: Director
FIRST YEAR OF SERVICE: 1994
PRINCIPAL OCCUPATION(S) DURING PAST 5 YEARS: Retired, formerly Senior Vice
President, Sprint Corporation
NUMBER OF PORTFOLIOS IN FUND COMPLEX OVERSEEN BY DIRECTOR: 66
OTHER DIRECTORSHIPS HELD BY DIRECTOR: Director, DST Systems, Inc.; Director,
Euronet Worldwide, Inc.
- --------------------------------------------------------------------------------
TIMOTHY S. WEBSTER, 4500 Main Street, Kansas City, MO 64111
YEAR OF BIRTH: 1961
POSITION(S) HELD WITH FUND: Director
FIRST YEAR OF SERVICE: 2001
PRINCIPAL OCCUPATION(S) DURING PAST 5 YEARS: President and Chief Executive
Officer, American Italian Pasta Company (1992 to December 2005)
NUMBER OF PORTFOLIOS IN FUND COMPLEX OVERSEEN BY DIRECTOR: 66
OTHER DIRECTORSHIPS HELD BY DIRECTOR: None
- --------------------------------------------------------------------------------
INTERESTED DIRECTORS
- --------------------------------------------------------------------------------
JAMES E. STOWERS, JR.(1), 4500 Main Street, Kansas City, MO 64111
YEAR OF BIRTH: 1924
POSITION(S) HELD WITH FUND: Director, Co-Vice Chairman
FIRST YEAR OF SERVICE: 1958
PRINCIPAL OCCUPATION(S) DURING PAST 5 YEARS: Founder, Director and Controlling
Shareholder, ACC; Chairman, ACC (January 1995 to December 2004); Director, ACIM,
ACGIM, ACS, ACIS and other ACC subsidiaries
NUMBER OF PORTFOLIOS IN FUND COMPLEX OVERSEEN BY DIRECTOR: 66
OTHER DIRECTORSHIPS HELD BY DIRECTOR: None
- --------------------------------------------------------------------------------
JAMES E. STOWERS III(1), 4500 Main Street, Kansas City, MO 64111
YEAR OF BIRTH: 1959
POSITION(S) HELD WITH FUND: Director, Co-Vice Chairman
FIRST YEAR OF SERVICE: 1990
PRINCIPAL OCCUPATION(S) DURING PAST 5 YEARS: Chairman, ACC (January 2005 to
present); Co-Chairman, ACC (September 2000 to December 2004); Chairman, ACS and
other ACC subsidiaries (April 2005 to September 2006); Director, ACC, ACIM,
ACGIM, ACS, ACIS and other ACC subsidiaries
NUMBER OF PORTFOLIOS IN FUND COMPLEX OVERSEEN BY DIRECTOR: 66
OTHER DIRECTORSHIPS HELD BY DIRECTOR: None
- --------------------------------------------------------------------------------
(1) James E. Stowers, Jr. is the father of James E. Stowers III.
(continued)
- ------
21
Management
- --------------------------------------------------------------------------------
OFFICERS
- --------------------------------------------------------------------------------
WILLIAM M. LYONS, 4500 Main Street, Kansas City, MO 64111
YEAR OF BIRTH: 1955
POSITION(S) HELD WITH FUND: President
FIRST YEAR OF SERVICE: 2000
PRINCIPAL OCCUPATION(S) DURING PAST 5 YEARS: Chief Executive Officer, ACC
(September 2000 to present); President, ACC (June 1997 to present); Also serves
as: Chairman, ACIM, ACGIM, ACS, ACIS and other ACC subsidiaries; Chief Executive
Officer, ACIM, ACGIM, ACIS and other ACC subsidiaries (October 2000 to October
2006); President, ACIM, ACGIM and other ACC subsidiaries (September 2002 to
September 2006); Executive Vice President, ACS (January 2005 to September 2006);
Director, ACC, ACIM, ACGIM, ACS, ACIS and other ACC subsidiaries
- --------------------------------------------------------------------------------
JONATHAN THOMAS, 4500 Main Street, Kansas City, MO 64111
YEAR OF BIRTH: 1963
POSITION(S) HELD WITH FUND: Executive Vice President
FIRST YEAR OF SERVICE: 2005
PRINCIPAL OCCUPATION(S) DURING PAST 5 YEARS: Chief Administrative Officer, ACC
(February 2006 to present); Executive Vice President, ACC (November 2005 to
present); Also serves as: President and Chief Executive Officer, ACS; Chief
Financial Officer and Chief Accounting Officer, ACIM, ACGIM, ACS, ACIS and other
ACC subsidiaries; Managing Director, Morgan Stanley (March 2000 to November
2005)
- --------------------------------------------------------------------------------
MARYANNE ROEPKE, 4500 Main Street, Kansas City, MO 64111
YEAR OF BIRTH: 1956
POSITION(S) HELD WITH FUND: Chief Compliance Officer and Senior Vice President
FIRST YEAR OF SERVICE: 2000
PRINCIPAL OCCUPATION(S) DURING PAST 5 YEARS: Chief Compliance Officer, ACIM,
ACGIM and ACS (August 2006 to present); Assistant Treasurer, ACC (January 1995
to August 2006); Treasurer and Chief Financial Officer, various American Century
funds (July 2000 to August 2006); Also serves as: Senior Vice President, ACS
- --------------------------------------------------------------------------------
DAVID C. TUCKER, 4500 Main Street, Kansas City, MO 64111
YEAR OF BIRTH: 1958
POSITION(S) HELD WITH FUND: Senior Vice President and General Counsel
FIRST YEAR OF SERVICE: 2000
PRINCIPAL OCCUPATION(S) DURING PAST 5 YEARS: Vice President, ACC (February 2001
to present); General Counsel, ACC (June 1998 to present); Also serves as: Senior
Vice President and General Counsel, ACIM, ACGIM, ACS, ACIS and other ACC
subsidiaries
- --------------------------------------------------------------------------------
ROBERT LEACH, 4500 Main Street, Kansas City, MO 64111
YEAR OF BIRTH: 1966
POSITION(S) HELD WITH FUND: Vice President, Treasurer and Chief Financial
Officer
FIRST YEAR OF SERVICE: 1997
PRINCIPAL OCCUPATION(S) DURING PAST 5 YEARS: Vice President, ACS (February 2000
to present); Controller, various American Century funds (June 1997 to September
2006)
- --------------------------------------------------------------------------------
C. JEAN WADE, 4500 Main Street, Kansas City, MO 64111
YEAR OF BIRTH: 1964
POSITION(S) HELD WITH FUNDS: Controller
FIRST YEAR OF SERVICE: 2006
PRINCIPAL OCCUPATION(S) DURING PAST 5 YEARS: Vice President, ACS (February 2000
to present)
- --------------------------------------------------------------------------------
JON ZINDEL, 4500 Main Street, Kansas City, MO 64111
YEAR OF BIRTH: 1967
POSITION(S) HELD WITH FUND: Tax Officer
FIRST YEAR OF SERVICE: 1997
PRINCIPAL OCCUPATION(S) DURING PAST 5 YEARS: Senior Vice President, ACC (August
2006 to present); Vice President, ACC and certain ACC subsidiaries (October 2001
to August 2006); Vice President, Corporate Tax, ACS (April 1998 to August 2006);
Also serves as: Senior Vice President, ACIM, ACGIM, ACS, ACIS and other ACC
subsidiaries
- --------------------------------------------------------------------------------
The SAI has additional information about the fund's directors and is available
without charge, upon request, by calling 1-800-345-2021.
- ------
22
Approval of Management Agreement for New Opportunties
Under Section 15(c) of the Investment Company Act, contracts for investment
advisory services are required to be reviewed, evaluated and approved by a
majority of a fund's independent directors or trustees (the "Directors") each
year. At American Century, this process is referred to as the "15(c) Process."
As a part of this process, the board reviews fund performance, shareholder
services, audit and compliance information, and a variety of other reports from
the advisor concerning fund operations. In addition to this annual review, the
board of directors oversees and evaluates on a continuous basis at its quarterly
meetings the nature and quality of significant services performed by the
advisor, fund performance, audit and compliance information, and a variety of
other reports relating to fund operations. The board, or committees of the
board, also holds special meetings as needed.
Under a Securities and Exchange Commission rule, each fund is required to
disclose in its annual or semiannual report, as appropriate, the material
factors and conclusions that formed the basis for the board's approval or
renewal of any advisory agreements within the fund's most recently completed
fiscal half-year period.
ANNUAL CONTRACT REVIEW PROCESS
As part of the annual 15(c) Process undertaken during the most recent fiscal
half-year period, the Directors reviewed extensive data and information compiled
by the advisor and certain independent providers of evaluative data (the "15(c)
Providers") concerning New Opportunities (the "fund") and the services provided
to the fund under the management agreement. The information considered and the
discussions held at the meetings included, but were not limited to:
* the nature, extent and quality of investment management, shareholder services
and other services provided to the fund under the management agreement;
* reports on the advisor's activities relating to the wide range of programs and
services the advisor provides to the fund and its shareholders on a routine
and non-routine basis;
* data comparing the cost of owning the fund to the cost of owning a similar
fund;
* data comparing the fund's performance to appropriate benchmarks and/or a peer
group of other mutual funds with similar investment objectives and strategies;
* financial data showing the profitability of the fund to the advisor and the
overall profitability of the advisor; and
* data comparing services provided and charges to other investment management
clients of the advisor.
In keeping with its practice, the fund's board of directors held two regularly
scheduled meetings and one special meeting to review and discuss the information
provided by the advisor and to complete its negotiations with the advisor
regarding the renewal of the management agreement, including the setting of the
applicable advisory fee. The board also had the benefit of
(continued)
- ------
23
Approval of Management Agreement for New Opportunties
the advice of its independent counsel throughout the period.
FACTORS CONSIDERED
The Directors considered all of the information provided by the advisor, the
15(c) Providers, and the board's independent counsel, and evaluated such
information for each fund for which the board has responsibility. The Directors
did not identify any single factor as being all-important or controlling, and
each Director may have attributed different levels of importance to different
factors. In deciding to renew the agreement under the terms ultimately
determined by the board to be appropriate, the Directors' decision was based on
the following factors.
NATURE, EXTENT AND QUALITY OF SERVICES -- GENERALLY. Under the management
agreement, the advisor is responsible for providing or arranging for all
services necessary for the operation of the fund. The board noted that under the
management agreement, the advisor provides or arranges at its own expense a wide
variety of services including:
* fund construction and design
* portfolio security selection
* initial capitalization/funding
* securities trading
* custody of fund assets
* daily valuation of the fund's portfolio
* shareholder servicing and transfer agency, including shareholder
confirmations, recordkeeping and communications
* legal services
* regulatory and portfolio compliance
* financial reporting
* marketing and distribution
The Directors noted that many of these services have expanded over time both in
terms of quantity and complexity in response to shareholder demands, competition
in the industry and the changing regulatory environment. In performing their
evaluation, the Directors considered information received in connection with the
annual review, as well as information provided on an ongoing basis at their
regularly scheduled board and committee meetings.
INVESTMENT MANAGEMENT SERVICES. The nature of the investment management services
provided is quite complex and allows fund shareholders access to professional
money management, instant diversification of their investments within an asset
class, the opportunity to easily diversify among asset classes, and liquidity.
In evaluating investment performance, the board expects the advisor to manage
the fund in accordance with its investment objectives and approved strategies.
In providing these services, the advisor utilizes teams of investment
professionals (portfolio managers, analysts, research assistants, and securities
traders) who require extensive information technology, research, training,
compliance and other systems to conduct their business. At each quarterly
meeting the Directors review investment performance information for the fund,
together with comparative information for appropriate benchmarks and peer groups
of funds managed similarly to the fund. The
(continued)
- ------
24
Approval of Management Agreement for New Opportunties
Directors also review detailed performance information during the 15(c) Process
comparing the fund's performance with that of similar funds not managed by the
advisor. If performance concerns are identified, the Directors discuss with the
advisor the reasons for such results (e.g., market conditions, security
selection) and any efforts being undertaken to improve performance. The fund's
performance for the one year period was above the median for its peer group and
below the median for the three year period during the past year. The board
discussed the fund's performance with the advisor and was satisfied with the
efforts being undertaken by the advisor.
SHAREHOLDER AND OTHER SERVICES. The advisor provides the fund with a
comprehensive package of transfer agency, shareholder, and other services. The
Directors review reports and evaluations of such services at their regular
quarterly meetings, including the annual meeting concerning contract review, and
reports to the board. These reports include, but are not limited to, information
regarding the operational efficiency and accuracy of the shareholder and
transfer agency services provided, staffing levels, shareholder satisfaction (as
measured by external as well as internal sources), technology support, new
products and services offered to fund shareholders, securities trading
activities, portfolio valuation services, auditing services, and legal and
operational compliance activities. Certain aspects of shareholder and transfer
agency service level efficiency and the quality of securities trading activities
are measured by independent third party providers and are presented in
comparison to other fund groups not managed by the advisor.
COSTS OF SERVICES PROVIDED AND PROFITABILITY TO THE ADVISOR. The advisor
provides detailed information concerning its cost of providing various services
to the fund, its profitability in managing the fund, its overall profitability,
and its financial condition. The Directors have reviewed with the advisor the
methodology used to prepare this financial information. This financial
information regarding the advisor is considered in order to evaluate the
advisor's financial condition, its ability to continue to provide services under
the management agreement, and the reasonableness of the current management fee.
ETHICS OF THE ADVISOR. The Directors generally consider the advisor's commitment
to providing quality services to shareholders and to conducting its business
ethically. They noted that the advisor's practices generally meet or exceed
industry best practices and that the advisor was not implicated in the industry
scandals of 2003 and 2004.
ECONOMIES OF SCALE. The Directors review reports provided by the advisor on
economies of scale for the complex as a whole and the year-over-year changes in
revenue, costs, and profitability. The Directors concluded that economies of
scale are difficult to measure and predict with precision, especially on a
fund-by-fund basis. This analysis is also complicated by the additional services
and content provided by the advisor and its reinvestment in its ability to
provide and
(continued)
- ------
25
Approval of Management Agreement for New Opportunties
expand those services. Accordingly, the Directors also seek to evaluate
economies of scale by reviewing other information, such as year-over-year
profitability of the advisor generally, the profitability of its management of
the fund specifically, the expenses incurred by the advisor in providing various
functions to the fund, and the breakpoint fees of competitive funds not managed
by the advisor. The Directors believe the advisor is appropriately sharing
economies of scale through its competitive fee structure, fee breakpoints as the
fund increases in size, and through reinvestment in its business to provide
shareholders additional content and services.
COMPARISON TO OTHER FUNDS' FEES. The fund pays the advisor a single,
all-inclusive (or unified) management fee for providing all services necessary
for the management and operation of the fund, other than brokerage expenses,
taxes, interest, extraordinary expenses, and the fees and expenses of the fund's
independent directors (including their independent legal counsel). Under the
unified fee structure, the advisor is responsible for providing all investment
advisory, custody, audit, administrative, compliance, recordkeeping, marketing
and shareholder services, or arranging and supervising third parties to provide
such services. By contrast, most other funds are charged a variety of fees,
including an investment advisory fee, a transfer agency fee, an administrative
fee, distribution charges and other expenses. Other than their investment
advisory fees and Rule 12b-1 distribution fees, all other components of the
total fees charged by these other funds may be increased without shareholder
approval. The board believes the unified fee structure is a benefit to fund
shareholders because it clearly discloses to shareholders the cost of owning
fund shares, and, since the unified fee cannot be increased without a vote of
fund shareholders, it shifts to the advisor the risk of increased costs of
operating the fund and provides a direct incentive to minimize administrative
inefficiencies. Part of the Directors' analysis of fee levels involves reviewing
certain evaluative data compiled by a 15(c) Provider comparing the fund's
unified fee to the total expense ratio of other funds in the fund's peer group.
The unified fee charged to shareholders of the fund was above the median of the
total expense ratios of its peer group.
COMPARISON TO FEES AND SERVICES PROVIDED TO OTHER CLIENTS OF THE ADVISOR. The
Directors also requested and received information from the advisor concerning
the nature of the services, fees, and profitability of its advisory services to
advisory clients other than the fund. They observed that these varying types of
client accounts require different services and involve different regulatory and
entrepreneurial risks than the management of the fund. The Directors analyzed
this information and concluded that the fees charged and services provided to
the fund were reasonable by comparison.
COLLATERAL BENEFITS DERIVED BY THE ADVISOR. The Directors reviewed information
from the advisor concerning collateral benefits it receives as a result of its
relationship with the fund. They concluded that the advisor's primary business
is managing mutual funds and
(continued)
- ------
26
Approval of Management Agreement for New Opportunties
it generally does not use the fund or shareholder information to generate
profits in other lines of business, and therefore does not derive any
significant collateral benefits from them. The Directors noted that the advisor
receives proprietary research from broker dealers that execute fund portfolio
transactions and concluded that this research is likely to benefit fund
shareholders. The Directors also determined that the advisor is able to provide
investment management services to certain clients other than the fund, at least
in part, due to its existing infrastructure built to serve the fund complex. The
Directors concluded, however, that the assets of those other clients are not
material to the analysis and, in any event, are included with the assets of the
fund to determine breakpoints in the fund's fee schedule, provided they are
managed using the same investment team and strategy.
CONCLUSIONS OF THE DIRECTORS
As a result of this process, the independent directors, assisted by the advice
of legal counsel independent of the advisor, taking into account all of the
factors discussed above and the information provided by the advisor, negotiated
changes to the breakpoint schedule used to calculate the fund's management fee.
These changes were proposed by the Directors based on their review of the
competitive changes in the mutual fund marketplace and their review of financial
information provided by the advisor. The new schedule, effective August 1, 2006,
contains lower management fees at certain asset levels than under the existing
structure. Following these negotiations with the advisor, the independent
directors concluded that the investment management agreement between the fund
and the advisor is fair and reasonable in light of the services provided and
should be renewed.
- ------
27
Additional Information
RETIREMENT ACCOUNT INFORMATION
As required by law, any distributions you receive from an IRA or certain 403(b),
457 and qualified plans [those not eligible for rollover to an IRA or to another
qualified plan] are subject to federal income tax withholding, unless you elect
not to have withholding apply. Tax will be withheld on the total amount
withdrawn even though you may be receiving amounts that are not subject to
withholding, such as nondeductible contributions. In such case, excess amounts
of withholding could occur. You may adjust your withholding election so that a
greater or lesser amount will be withheld.
If you don't want us to withhold on this amount, you must notify us to not
withhold the federal income tax. Even if you plan to roll over the amount you
withdraw to another tax-deferred account, the withholding rate still applies to
the withdrawn amount unless we have received notice not to withhold federal
income tax prior to the withdrawal. You may notify us in writing or in certain
situations by telephone or through other electronic means. You have the right to
revoke your withholding election at any time and any election you make may
remain in effect until revoked by filing a new election.
Remember, even if you elect not to have income tax withheld, you are liable for
paying income tax on the taxable portion of your withdrawal. If you elect not to
have income tax withheld or you don't have enough income tax withheld, you may
be responsible for payment of estimated tax. You may incur penalties under the
estimated tax rules if your withholding and estimated tax payments are not
sufficient.
State tax will be withheld if, at the time of your distribution, your address is
within one of the mandatory withholding states and you have federal income tax
withheld. State taxes will be withheld from your distribution in accordance with
the respective state rules.
PROXY VOTING GUIDELINES
American Century Investment Management, Inc., the fund's investment advisor, is
responsible for exercising the voting rights associated with the securities
purchased and/or held by the fund. A description of the policies and procedures
the advisor uses in fulfilling this responsibility is available without charge,
upon request, by calling 1-800-345-2021. It is also available on American
Century's website at americancentury.com and on the Securities and Exchange
Commission's website at sec.gov. Information regarding how the investment
advisor voted proxies relating to portfolio securities during the most recent
12-month period ended June 30 is available on the "About Us" page at
americancentury.com. It is also available at sec.gov.
QUARTERLY PORTFOLIO DISCLOSURE
The fund files its complete schedule of portfolio holdings with the Securities
and Exchange Commission (SEC) for the first and third quarters of each fiscal
year on Form N-Q. The fund's Form N-Q is available on the SEC's website at
sec.gov, and may be reviewed and copied at the SEC's Public Reference Room in
Washington, DC. Information on the operation of the Public Reference Room may be
obtained by calling 1-800-SEC-0330. The fund also makes its complete schedule of
portfolio holdings for the most recent quarter of its fiscal year available on
its website at americancentury.com and, upon request, by calling 1-800-345-2021.
- ------
28
Index Definitions
The following indices are used to illustrate investment market, sector, or style
performance or to serve as fund performance comparisons. They are not investment
products available for purchase.
The DOW JONES INDUSTRIAL AVERAGE (DJIA) is a price-weighted average of 30
actively traded blue chip stocks, primarily industrials but including
service-oriented firms. Prepared and published by Dow Jones & Co., it is the
oldest and most widely quoted of all the market indicators.
The NASDAQ COMPOSITE INDEX is a market value-weighted index of all domestic and
international common stocks listed on the Nasdaq stock market.
The RUSSELL 2000(reg.tm) INDEX is a market-capitalization weighted index created
by Frank Russell Company to measure the performance of the 2,000 smallest of the
3,000 largest publicly traded U.S. companies, based on total market
capitalization.
The RUSSELL 2000(reg.tm) GROWTH INDEX measures the performance of those Russell
2000 Index companies (the 2,000 smallest of the 3,000 largest publicly traded
U.S. companies, based on total market capitalization) with higher price-to-book
ratios and higher forecasted growth rates.
The S&P 500 INDEX is a market value-weighted index of the stocks of 500 publicly
traded U.S. companies chosen for market size, liquidity, and industry group
representation that are considered to be leading firms in dominant industries.
Each stock's weight in the index is proportionate to its market value. Created
by Standard & Poor's, it is considered to be a broad measure of U.S. stock
market performance.
- ------
29
Notes
- ------
30
Notes
- ------
31
Notes
- ------
32
CONTACT US
AMERICANCENTURY.COM
AUTOMATED INFORMATION LINE:
1-800-345-8765
INVESTOR SERVICES REPRESENTATIVE:
1-800-345-2021 or 816-531-5575
BUSINESS, NOT-FOR-PROFIT,
EMPLOYER-SPONSORED RETIREMENT PLANS:
1-800-345-3533
BANKS AND TRUST COMPANIES, BROKER-DEALERS,
FINANCIAL PROFESSIONALS, INSURANCE COMPANIES:
1-800-345-6488
TELECOMMUNICATIONS DEVICE FOR THE DEAF:
1-800-634-4113 or 816-444-3485
AMERICAN CENTURY MUTUAL FUNDS, INC.
INVESTMENT ADVISOR:
American Century Investment Management, Inc.
Kansas City, Missouri
THIS REPORT AND THE STATEMENTS IT CONTAINS ARE SUBMITTED FOR THE GENERAL
INFORMATION OF OUR SHAREHOLDERS. THE REPORT IS NOT AUTHORIZED FOR DISTRIBUTION
TO PROSPECTIVE INVESTORS UNLESS PRECEDED OR ACCOMPANIED BY AN EFFECTIVE
PROSPECTUS.
American Century Investments
P.O. Box 419200
Kansas City, MO 64141-6200
PRSRT STD
U.S. POSTAGE PAID
AMERICAN CENTURY
COMPANIES
The American Century Investments logo, American Century
and American Century Investments are service marks
of American Century Proprietary Holdings, Inc.
American Century Investment Services, Inc., Distributor
(c)2006 American Century Proprietary Holdings, Inc. All rights reserved.
0612
SH-ANN-52275S
[front cover]
AMERICAN CENTURY INVESTMENTS
Annual Report
October 31, 2006
[photo of winter scene]
Balanced Fund
[american century investments logo and text logo]
Our Message to You
[photo of James E. Stowers III and James E. Stowers, Jr.]
/s/James E. Stowers, Jr.
James E. Stowers, Jr.
FOUNDER
AMERICAN CENTURY COMPANIES, INC.
/s/James E. Stowers III
James E. Stowers III
CHAIRMAN OF THE BOARD
AMERICAN CENTURY COMPANIES, INC.
We are pleased to provide you with the annual report for the American Century
Balanced Fund for the year ended October 31, 2006. We hope you find this
information helpful in monitoring your investment. Another useful resource we
offer is our website, americancentury.com, where we post quarterly portfolio
commentaries, the views of senior investment officers and analysts, and other
communications about investments, portfolio strategy, personal finance, and the
markets.
In its most recent rankings, Dalbar--which issues customer satisfaction ratings
and rankings based on website functionality--ranked americancentury.com seventh
out of the sites provided by the top 25 fund companies that it believes lead the
industry in web-based technology. Our website earned an "Excellent" rating,
Dalbar's highest designation.
For most of 2006, our website has linked visitors to information explaining our
strategic collaboration with Lance Armstrong and the Lance Armstrong Foundation
(LAF). This campaign, featuring Lance, is designed to encourage investors to
take a more active role in planning their financial futures and make every
investment decision count. To learn more about the collaboration and the LAF,
please visit americancentury.com or www.lanceface.com on the Web and click on
the links to related sites.
With the approach of year end and the 2006 tax season, you can also find out
more about December fund distributions and tax information via a link from our
website. We've posted December distribution estimates for over 50 funds, answers
to frequent distribution questions, and online descriptions of all of the tax
information we provide to investors.
If you haven't visited americancentury.com yet, we encourage you to do so . . .
it's there to serve you. And so are we. As always, we deeply appreciate your
commitment to American Century Investments.
Table of Contents
Market Perspective 2
U.S. Market Returns . . . . . . . . . . . . . . . . . . . . . . . . . . . . 2
BALANCED
Performance . . . . . . . . . . . . . . . . . . . . . . . . . . . . . . . . . .3
Portfolio Commentary . . . . . . . . . . . . . . . . . . . . . . . . . . . . . 5
Top Ten Stock Holdings . . . . . . . . . . . . . . . . . . . . . . . . . . .5
Top Five Stock Industries . . . . . . . . . . . . . . . . . . . . . . . . . 5
Types of Investments in Portfolio . . . . . . . . . . . . . . . . . . . . . 6
Key Fixed-Income Portfolio Statistics . . . . . . . . . . . . . . . . . . . 6
Shareholder Fee Example . . . . . . . . . . . . . . . . . . . . . . . . . . . .7
Schedule of Investments . . . . . . . . . . . . . . . . . . . . . . . . . . . .9
FINANCIAL STATEMENTS
Statement of Assets and Liabilities . . . . . . . . . . . . . . . . . . . . . 19
Statement of Operations . . . . . . . . . . . . . . . . . . . . . . . . . . . 20
Statement of Changes in Net Assets . . . . . . . . . . . . . . . . . . . . . .21
Notes to Financial Statements . . . . . . . . . . . . . . . . . . . . . . . . 22
Financial Highlights . . . . . . . . . . . . . . . . . . . . . . . . . . . . .28
Report of Independent Registered Public Accounting Firm . . . . . . . . . . . 31
OTHER INFORMATION
Management . . . . . . . . . . . . . . . . . . . . . . . . . . . . . . . . . .32
Approval of Management Agreement for Balanced . . . . . . . . . . . . . . . . 35
Share Class Information . . . . . . . . . . . . . . . . . . . . . . . . . . . 40
Additional Information . . . . . . . . . . . . . . . . . . . . . . . . . . . .41
Index Definitions . . . . . . . . . . . . . . . . . . . . . . . . . . . . . . 42
The opinions expressed in the Market Perspective and the Portfolio Commentary
reflect those of the portfolio management team as of the date of the report, and
do not necessarily represent the opinions of American Century or any other
person in the American Century organization. Any such opinions are subject to
change at any time based upon market or other conditions and American Century
disclaims any responsibility to update such opinions. These opinions may not be
relied upon as investment advice and, because investment decisions made by
American Century funds are based on numerous factors, may not be relied upon as
an indication of trading intent on behalf of any American Century fund. Security
examples are used for representational purposes only and are not intended as
recommendations to purchase or sell securities. Performance information for
comparative indices and securities is provided to American Century by third
party vendors. To the best of American Century's knowledge, such information is
accurate at the time of printing.
Market Perspective
[photo of Mark Mallon]
BY MARK MALLON, CHIEF INVESTMENT OFFICER, AMERICAN CENTURY INVESTMENTS
ECONOMIC GROWTH SURGED, THEN MODERATED
Economic growth--along with commodity prices, short-term interest rates, and
inflation--surged early in the 12-month period ended October 31, 2006. But
growth and inflation moderated in the period's second half, which saw the
Federal Reserve (the Fed) end its two-year string of interest rate hikes.
After a hurricane-related slowdown in the fourth quarter of 2005, U.S. gross
domestic product grew in the first quarter of 2006 at a 5.6% annualized pace,
the highest level in more than two years. The Fed steadily raised short-term
interest rates through June to keep inflation in check, including pressures from
soaring commodity prices. The Fed finally snapped its string of rate hikes in
August 2006, leaving its target at 5.25%, a five-year high. By then, economic
growth had slowed, dragged down in part by a cooling housing market.
BEST FISCAL-YEAR STOCK RETURNS SINCE 2003
The Fed's pause and expectations for lower interest rates and mild inflation
going forward helped produce the best U.S. stock returns for a 12-month fiscal
period ended October 31 since 2003. Market rallies beginning and ending the
period offset a late-spring/early-summer selloff. Growth stocks flourished in
the latter rally, but value stocks outperformed growth for the full reporting
period. Likewise, though large-cap stocks gained ground late in the period,
small-caps posted higher returns for the entire 12-month stretch.
In the first half of the 12-month period, investors celebrated a dip in crude
oil prices and strong economic growth by pushing stock prices higher. The
small-cap Russell 2000 Index led the way, surging 18.91%. Sentiment changed in
early May, however, when the Fed made it clear that more interest rate hikes
might be necessary to control inflation. Between April 30 and July 15, the S&P
500 fell 5.28%, and the Russell 2000 more than doubled that loss as investors
desired larger, more stable companies.
The selloff ended in late July after Fed chairman Ben Bernanke predicted
inflation would moderate. The Fed's subsequent rate pause in August and plunging
energy prices allowed stocks to rebound nicely in the last three months of the
reporting period.
U.S. MARKET RETURNS
For the 12 months ended October 31, 2006
- --------------------------------------------------------------------------------
STOCK INDICES
- --------------------------------------------------------------------------------
S&P 500 16.34%
- --------------------------------------------------------------------------------
Dow Jones Industrial Average 18.47%
- --------------------------------------------------------------------------------
Nasdaq Composite 12.48%
- --------------------------------------------------------------------------------
LEHMAN BROTHERS BOND INDICES
- --------------------------------------------------------------------------------
Aggregate (multi-sector, combined) 5.19%
- --------------------------------------------------------------------------------
Fixed-Rate Mortgage-Backed 5.68%
- --------------------------------------------------------------------------------
Treasury 4.43%
- --------------------------------------------------------------------------------
Corporate (investment-grade) 5.40%
- --------------------------------------------------------------------------------
Agency 4.93%
- --------------------------------------------------------------------------------
- ------
2
Balanced - Performance
TOTAL RETURNS AS OF OCTOBER 31, 2006
--------------------------------
AVERAGE ANNUAL RETURNS
- --------------------------------------------------------------------------------
SINCE INCEPTION
1 YEAR 5 YEARS 10 YEARS INCEPTION DATE
- --------------------------------------------------------------------------------
INVESTOR CLASS 11.04% 6.82% 6.62% 9.07% 10/20/88
- --------------------------------------------------------------------------------
NEW BLENDED INDEX(1) 11.83% 6.44% 8.03% 10.28%(2) --
- --------------------------------------------------------------------------------
OLD BLENDED INDEX 11.80% 6.42% 8.02% 10.26%(2) --
- --------------------------------------------------------------------------------
S&P 500 INDEX(3) 16.34% 7.26% 8.64% 11.73%(2) --
- --------------------------------------------------------------------------------
CITIGROUP US BROAD
INVESTMENT-GRADE
BOND INDEX(1) 5.24% 4.57% 6.28% 7.52%(2) --
- --------------------------------------------------------------------------------
LEHMAN BROTHERS U.S.
AGGREGATE INDEX(3) 5.19% 4.51% 6.26% 7.48%(2) --
- --------------------------------------------------------------------------------
Institutional Class 11.26% 7.04% -- 3.53% 5/1/00
- --------------------------------------------------------------------------------
Advisor Class 10.71% 6.56% -- 6.23% 1/6/97
- --------------------------------------------------------------------------------
(1) In September of 2006, the fund's blended index changed. The old blended
index was represented by 60% of the S&P 500 Index and the remaining 40% was
represented by the Lehman Brothers U.S. Aggregate Index. The new blended
index is represented by 60% of the S&P 500 Index and the remaining 40% is
represented by the Citigroup US Broad Investment-Grade Bond Index. The
fund's investment advisor believes this index better represents the fund's
portfolio composition.
(2) Since 10/31/88, the date nearest the Investor Class's inception for which
data are available.
(3) Data provided by Lipper Inc. - A Reuters Company. (c)2006 Reuters. All
rights reserved. Any copying, republication or redistribution of Lipper
content, including by caching, framing or similar means, is expressly
prohibited without the prior written consent of Lipper. Lipper shall not be
liable for any errors or delays in the content, or for any actions taken in
reliance thereon.
The data contained herein has been obtained from company reports, financial
reporting services, periodicals and other resources believed to be reliable.
Although carefully verified, data on compilations is not guaranteed by
Lipper and may be incomplete. No offer or solicitations to buy or sell any
of the securities herein is being made by Lipper.
Data presented reflect past performance. Past performance is no guarantee of
future results. Current performance may be higher or lower than the performance
shown. Investment return and principal value will fluctuate, and redemption
value may be more or less than original cost. To obtain performance data current
to the most recent month end, please call 1-800-345-2021 or visit
americancentury.com. As interest rates rise, bond values will decline.
Unless otherwise indicated, performance reflects Investor Class shares;
performance for other share classes will vary due to differences in fee
structure. For information about other share classes available, please consult
the prospectus. Data assumes reinvestment of dividends and capital gains, and
none of the charts reflect the deduction of taxes that a shareholder would pay
on fund distributions or the redemption of fund shares. Returns for the indices
are provided for comparison. The fund's total returns include operating expenses
(such as transaction costs and management fees) that reduce returns, while the
total returns of the indices do not.
(continued)
- ------
3
Balanced - Performance
GROWTH OF $10,000 OVER 10 YEARS
$10,000 investment made October 31, 1996
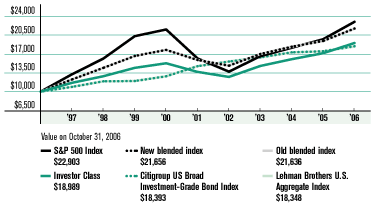
ONE-YEAR RETURNS OVER 10 YEARS
Periods ended October 31
- ---------------------------------------------------------------------------------------------------------
1997 1998 1999 2000 2001 2002 2003 2004 2005 2006
- ---------------------------------------------------------------------------------------------------------
Investor Class 16.34% 10.46% 12.03% 5.90% -10.46% -6.80% 15.92% 8.46% 6.89% 11.04%
- ---------------------------------------------------------------------------------------------------------
New blended
index 22.57% 17.47% 15.17% 6.84% -10.54% -6.64% 14.57% 7.99% 5.78% 11.83%
- ---------------------------------------------------------------------------------------------------------
Old blended
index 22.60% 17.45% 15.19% 6.85% -10.56% -6.59% 14.53% 7.92% 5.74% 11.80%
- ---------------------------------------------------------------------------------------------------------
S&P 500 Index 32.11% 21.99% 25.67% 6.09% -24.90% -15.11% 20.80% 9.42% 8.72% 16.34%
- ---------------------------------------------------------------------------------------------------------
Citigroup
US Broad
Investment-Grade
Bond Index 8.82% 9.40% 0.49% 7.28% 14.61% 5.75% 4.99% 5.70% 1.24% 5.24%
- ---------------------------------------------------------------------------------------------------------
Lehman Brothers
U.S. Aggregate
Index 8.89% 9.34% 0.53% 7.30% 14.56% 5.89% 4.90% 5.53% 1.13% 5.19%
- ---------------------------------------------------------------------------------------------------------
Data presented reflect past performance. Past performance is no guarantee of
future results. Current performance may be higher or lower than the performance
shown. Investment return and principal value will fluctuate, and redemption
value may be more or less than original cost. To obtain performance data current
to the most recent month end, please call 1-800-345-2021 or visit
americancentury.com. As interest rates rise, bond values will decline.
Unless otherwise indicated, performance reflects Investor Class shares;
performance for other share classes will vary due to differences in fee
structure. For information about other share classes available, please consult
the prospectus. Data assumes reinvestment of dividends and capital gains, and
none of the charts reflect the deduction of taxes that a shareholder would pay
on fund distributions or the redemption of fund shares. Returns for the indices
are provided for comparison. The fund's total returns include operating expenses
(such as transaction costs and management fees) that reduce returns, while the
total returns of the indices do not.
- ------
4
Balanced - Portfolio Commentary
EQUITY PORTFOLIO MANAGERS: BILL MARTIN, TOM VAIANA, FEI ZOU
FIXED-INCOME PORTFOLIO MANAGERS: DAVE MACEWEN, BOB GAHAGAN, JIM KEEGAN, JEFF
HOUSTON, HANDO AGUILAR, BRIAN HOWELL, JOHN WALSH, DAN SHIFFMAN
PERFORMANCE SUMMARY
Balanced returned 11.04%* for the 12 months ended October 31, 2006. By
comparison, its new and old benchmarks (blended indices of 60% S&P 500 Index for
both, and 40% Citigroup US Broad Investment-Grade Bond Index (BIG) for the new
benchmark and 40% Lehman Brothers U.S. Aggregate Index for the old) rose 11.83%
and 11.80%, respectively. We believe the new benchmark better represents the
portfolio's composition.
Strong stock market returns--resulting from a pause in the Federal Reserve's
interest rate hikes and expectations for lower interest rates and mild inflation
going forward--were the main driver behind the fund's and the benchmarks'
absolute gains. Relative investment returns between the portfolio and its
benchmarks were similar; the fund's results reflected operating expenses, while
the benchmark returns did not.
EQUITY PERFORMANCE & POSITIONING
Net of operating expenses, Balanced's equity portfolio returned approximately
16% for the reporting period, compared with 16.34% for the S&P 500 (index
returns are not reduced by expenses). Chief contributors to portfolio
performance compared with the index included overweight positions in steel
manufacturer Nucor Corp. (up 103%), engine-maker Cummins Inc. (up 51%), and
health insurance provider Humana Inc. (up 35%). The biggest detractors from
relative performance included overweight positions in poultry products producer
Pilgrim's Pride (down 18%) and managed health care organization Sierra Health
Services (down 9%).
FIXED-INCOME PERFORMANCE & POSITIONING
Net of operating expenses, Balanced's fixed-income portfolio returned
approximately 4.7% for the reporting period, compared with 5.2% for the Lehman
BALANCED'S TOP TEN STOCK HOLDINGS
AS OF OCTOBER 31, 2006
- --------------------------------------------------------------------------------
% OF EQUITY % OF S&P
HOLDINGS 500 INDEX
- --------------------------------------------------------------------------------
Exxon Mobil Corp. 5.0% 3.4%
- --------------------------------------------------------------------------------
Citigroup Inc. 3.5% 2.0%
- --------------------------------------------------------------------------------
International Business
Machines Corp. 2.8% 1.1%
- --------------------------------------------------------------------------------
JPMorgan Chase & Co. 2.8% 1.3%
- --------------------------------------------------------------------------------
Bank of America Corp. 2.6% 2.0%
- --------------------------------------------------------------------------------
Hewlett-Packard Co. 2.6% 0.9%
- --------------------------------------------------------------------------------
Merck & Co., Inc. 2.4% 0.8%
- --------------------------------------------------------------------------------
Amgen Inc. 2.2% 0.7%
- --------------------------------------------------------------------------------
Goldman Sachs Group,
Inc. (The) 2.1% 0.7%
- --------------------------------------------------------------------------------
Chevron Corp. 2.0% 1.2%
- --------------------------------------------------------------------------------
BALANCED'S TOP FIVE STOCK INDUSTRIES
AS OF OCTOBER 31, 2006
- --------------------------------------------------------------------------------
% OF EQUITY % OF S&P
HOLDINGS 500 INDEX
- --------------------------------------------------------------------------------
Oil, Gas &
Consumable Fuels 11.1% 7.8%
- --------------------------------------------------------------------------------
Diversified Financial
Services 10.3% 5.8%
- --------------------------------------------------------------------------------
Health Care
Providers & Services 6.6% 2.6%
- --------------------------------------------------------------------------------
Capital Markets 6.3% 3.8%
- --------------------------------------------------------------------------------
IT Services 5.0% 2.1%
- --------------------------------------------------------------------------------
*All fund returns referenced in this commentary are for Investor Class shares.
(continued)
- ------
5
Balanced - Portfolio Commentary
Aggregate and Citigroup BIG (index returns are not reduced by expenses). The
returns of the portfolio and these indices are typically generated by
mortgage-backed securities (MBS), commercial MBS (CMBS), asset-backed securities
(ABS, backed by payments from credit card debt, auto loans, and home-equity
lines of credit), high- and medium-grade corporate bonds, and U.S. government
securities, including Treasurys and government agency bonds.
During the period, longer-duration positions were rewarded. When bonds rallied
in the third quarter of 2006, the bond portfolio's duration was slightly longer
than neutral, giving performance a boost. Our strategy to overweight "spread"
products (non-Treasury securities such as corporates, MBS, ABS, and CMBS) also
benefited the fund since these sectors outperformed Treasurys during the
reporting period.
PORTFOLIO OBJECTIVES & EXPECTATIONS
Balanced seeks long-term capital growth and current income by investing in
diversified U.S. stock and bond portfolios, with an approximately 60/40
stock/bond mix. The equity portfolio's objective is to surpass the S&P 500
without taking on significant additional risk. We use a two-step approach for
stock selection and portfolio construction, relying on computer models as key
decision-making tools. The fixed-income portfolio is also index-oriented,
providing a broad, roughly market capitalization-based mix of income-producing
investment-grade debt securities. We use an active, multi-step process that
seeks to identify the best relative value among bond sectors. We then apply
appropriate yield curve/ duration positioning, security selection, and portfolio
construction.
Balanced is designed to serve as a core holding for investors seeking
"ready-made" stock/bond diversification. It's also for investors seeking
long-term growth with less volatility than pure growth-stock portfolios. The
bond portfolio is designed to help cushion and offset the stock portfolio's
performance swings while providing income; meanwhile the stock portfolio
provides long-term growth potential, which is important to investors who wish to
guard against inflation.
KEY FIXED-INCOME PORTFOLIO STATISTICS
- --------------------------------------------------------------------------------
AS OF AS OF
10/31/06 4/30/06
- --------------------------------------------------------------------------------
Weighted Average
Maturity 5.4 years 6.4 years
- --------------------------------------------------------------------------------
Average Duration
(Effective) 4.6 years 4.7 years
- --------------------------------------------------------------------------------
TYPES OF INVESTMENTS IN PORTFOLIO*
- --------------------------------------------------------------------------------
% OF FUND % OF FUND
INVESTMENTS INVESTMENTS
AS OF AS OF
10/31/06 4/30/06
- --------------------------------------------------------------------------------
Common Stocks 52.9% 51.2%
- --------------------------------------------------------------------------------
Mortgage- & Asset-
Backed Securities 20.6% 19.0%
- --------------------------------------------------------------------------------
Corporate Bonds 6.3% 6.7%
- --------------------------------------------------------------------------------
U.S. Government
Agency Securities 6.2% 6.5%
- --------------------------------------------------------------------------------
U.S. Treasury Securities 4.6% 3.6%
- --------------------------------------------------------------------------------
Other 0.9% 0.3%
- --------------------------------------------------------------------------------
Temporary Cash
Investments 2.1% 1.7%
- --------------------------------------------------------------------------------
Collateral Received for
Securities Lending 6.4% 11.0%
- --------------------------------------------------------------------------------
*See Schedule of Investments for a presentation of the types of investments in
the portfolio based on net assets.
- ------
6
Shareholder Fee Example (Unaudited)
Fund shareholders may incur two types of costs: (1) transaction costs, including
sales charges (loads) on purchase payments and redemption/exchange fees; and (2)
ongoing costs, including management fees; distribution and service (12b-1) fees;
and other fund expenses. This example is intended to help you understand your
ongoing costs (in dollars) of investing in your fund and to compare these costs
with the ongoing cost of investing in other mutual funds.
The example is based on an investment of $1,000 made at the beginning of the
period and held for the entire period from May 1, 2006 to October 31, 2006.
ACTUAL EXPENSES
The table provides information about actual account values and actual expenses
for each class. You may use the information, together with the amount you
invested, to estimate the expenses that you paid over the period. First,
identify the share class you own. Then simply divide your account value by
$1,000 (for example, an $8,600 account value divided by $1,000 = 8.6), then
multiply the result by the number under the heading "Expenses Paid During
Period" to estimate the expenses you paid on your account during this period.
If you hold Investor Class shares of any American Century fund, or Institutional
Class shares of the American Century Diversified Bond Fund, in an American
Century account (i.e., not a financial intermediary or retirement plan account),
American Century may charge you a $12.50 semiannual account maintenance fee if
the value of those shares is less than $10,000. We will redeem shares
automatically in one of your accounts to pay the $12.50 fee. In determining your
total eligible investment amount, we will include your investments in all
PERSONAL ACCOUNTS (including American Century Brokerage accounts) registered
under your Social Security number. PERSONAL ACCOUNTS include individual
accounts, joint accounts, UGMA/UTMA accounts, personal trusts, Coverdell
Education Savings Accounts and IRAs (including traditional, Roth, Rollover,
SEP-, SARSEP- and SIMPLE-IRAs), and certain other retirement accounts. If you
have only business, business retirement, employer-sponsored or American Century
Brokerage accounts, you are currently not subject to this fee. We will not
charge the fee as long as you choose to manage your accounts exclusively online.
If you are subject to the Account Maintenance Fee, your account value could be
reduced by the fee amount.
HYPOTHETICAL EXAMPLE FOR COMPARISON PURPOSES
The table also provides information about hypothetical account values and
hypothetical expenses based on the actual expense ratio of each class of your
fund and an assumed rate of return of 5% per year before expenses, which is not
the actual return of a fund's share class. The hypothetical account values and
expenses may not be used to estimate the actual ending account balance or
expenses you paid for the period. You may use this information to compare the
ongoing costs of investing in your fund and other funds. To do so, compare this
5% hypothetical example with the 5% hypothetical examples that appear in the
shareholder reports of the other funds.
(continued)
- ------
7
Shareholder Fee Example (Unaudited)
Please note that the expenses shown in the table are meant to highlight your
ongoing costs only and do not reflect any transactional costs, such as sales
charges (loads) or redemption/exchange fees. Therefore, the table is useful in
comparing ongoing costs only, and will not help you determine the relative total
costs of owning different funds. In addition, if these transactional costs were
included, your costs would have been higher.
- --------------------------------------------------------------------------------
EXPENSES PAID
BEGINNING ENDING DURING PERIOD* ANNUALIZED
ACCOUNT VALUE ACCOUNT VALUE 5/1/06 - EXPENSE
5/1/06 10/31/06 10/31/06 RATIO*
- --------------------------------------------------------------------------------
BALANCED SHAREHOLDER FEE EXAMPLE
- --------------------------------------------------------------------------------
ACTUAL
- --------------------------------------------------------------------------------
Investor Class $1,000 $1,047.60 $4.64 0.90%
- --------------------------------------------------------------------------------
Institutional Class $1,000 $1,049.30 $3.62 0.70%
- --------------------------------------------------------------------------------
Advisor Class $1,000 $1,046.40 $5.93 1.15%
- --------------------------------------------------------------------------------
HYPOTHETICAL
- --------------------------------------------------------------------------------
Investor Class $1,000 $1,020.67 $4.58 0.90%
- --------------------------------------------------------------------------------
Institutional Class $1,000 $1,021.68 $3.57 0.70%
- --------------------------------------------------------------------------------
Advisor Class $1,000 $1,019.41 $5.85 1.15%
- --------------------------------------------------------------------------------
*Expenses are equal to the class's annualized expense ratio listed in the table
above, multiplied by the average account value over the period, multiplied by
184, the number of days in the most recent fiscal half-year, divided by 365, to
reflect the one-half year period.
- ------
8
Balanced - Schedule of Investments
OCTOBER 31, 2006
Shares ($ IN THOUSANDS) Value
- --------------------------------------------------------------------------------
COMMON STOCKS -- 60.1%
AEROSPACE & DEFENSE -- 1.2%
- --------------------------------------------------------------------------------
8,571 Boeing Co. $ 684
- --------------------------------------------------------------------------------
79,011 Lockheed Martin Corp. 6,869
- --------------------------------------------------------------------------------
7,553
- --------------------------------------------------------------------------------
AIR FREIGHT & LOGISTICS -- 0.3%
- --------------------------------------------------------------------------------
3,554 FedEx Corporation 407
- --------------------------------------------------------------------------------
19,638 United Parcel Service, Inc. Cl B 1,480
- --------------------------------------------------------------------------------
1,887
- --------------------------------------------------------------------------------
AIRLINES(1)
- --------------------------------------------------------------------------------
17,232 Southwest Airlines Co. 259
- --------------------------------------------------------------------------------
AUTO COMPONENTS(1)
- --------------------------------------------------------------------------------
10,394 ArvinMeritor Inc. 156
- --------------------------------------------------------------------------------
AUTOMOBILES -- 0.5%
- --------------------------------------------------------------------------------
49,727 Harley-Davidson, Inc. 3,413
- --------------------------------------------------------------------------------
BEVERAGES -- 1.5%
- --------------------------------------------------------------------------------
139,063 Coca-Cola Company (The) 6,497
- --------------------------------------------------------------------------------
79,516 Pepsi Bottling Group Inc. 2,514
- --------------------------------------------------------------------------------
11,709 PepsiCo, Inc. 743
- --------------------------------------------------------------------------------
9,754
- --------------------------------------------------------------------------------
BIOTECHNOLOGY -- 1.4%
- --------------------------------------------------------------------------------
115,782 Amgen Inc.(2)(3) 8,789
- --------------------------------------------------------------------------------
3,993 Biogen Idec Inc.(2) 190
- --------------------------------------------------------------------------------
8,979
- --------------------------------------------------------------------------------
BUILDING PRODUCTS -- 0.2%
- --------------------------------------------------------------------------------
31,881 USG Corp.(2)(4) 1,559
- --------------------------------------------------------------------------------
CAPITAL MARKETS -- 3.8%
- --------------------------------------------------------------------------------
44,509 Goldman Sachs Group, Inc. (The) 8,448
- --------------------------------------------------------------------------------
55,581 Lehman Brothers Holdings Inc. 4,326
- --------------------------------------------------------------------------------
80,386 Mellon Financial Corp. 3,119
- --------------------------------------------------------------------------------
100,433 Morgan Stanley 7,676
- --------------------------------------------------------------------------------
17,230 State Street Corp. 1,107
- --------------------------------------------------------------------------------
24,676
- --------------------------------------------------------------------------------
CHEMICALS -- 1.6%
- --------------------------------------------------------------------------------
12,594 Albemarle Corp. 819
- --------------------------------------------------------------------------------
186,644 Celanese Corp., Series A 3,847
- --------------------------------------------------------------------------------
33,162 Georgia Gulf Corporation 709
- --------------------------------------------------------------------------------
15,528 H.B. Fuller Company 385
- --------------------------------------------------------------------------------
170,855 Lyondell Chemical Co. 4,386
- --------------------------------------------------------------------------------
10,146
- --------------------------------------------------------------------------------
COMMERCIAL BANKS -- 0.7%
- --------------------------------------------------------------------------------
2,593 KeyCorp 96
- --------------------------------------------------------------------------------
6,346 PNC Financial Services Group 444
- --------------------------------------------------------------------------------
2,524 U.S. Bancorp 85
- --------------------------------------------------------------------------------
115,072 Wells Fargo & Co. 4,177
- --------------------------------------------------------------------------------
4,802
- --------------------------------------------------------------------------------
Shares ($ IN THOUSANDS) Value
- --------------------------------------------------------------------------------
COMMERCIAL SERVICES & SUPPLIES -- 0.6%
- --------------------------------------------------------------------------------
45,404 Covanta Holding Corp.(2)(4) $ 923
- --------------------------------------------------------------------------------
83,334 Waste Management, Inc. 3,123
- --------------------------------------------------------------------------------
4,046
- --------------------------------------------------------------------------------
COMMUNICATIONS EQUIPMENT -- 0.9%
- --------------------------------------------------------------------------------
202,224 Cisco Systems Inc.(2) 4,880
- --------------------------------------------------------------------------------
13,434 Interdigital Communications
Corp.(2)(4) 480
- --------------------------------------------------------------------------------
22,294 Motorola, Inc. 514
- --------------------------------------------------------------------------------
5,874
- --------------------------------------------------------------------------------
COMPUTERS & PERIPHERALS -- 2.0%
- --------------------------------------------------------------------------------
259,078 Hewlett-Packard Co. 10,036
- --------------------------------------------------------------------------------
47,331 Lexmark International, Inc. Cl A(2) 3,010
- --------------------------------------------------------------------------------
13,046
- --------------------------------------------------------------------------------
CONSTRUCTION & ENGINEERING -- 0.8%
- --------------------------------------------------------------------------------
96,519 Granite Construction Inc. 5,029
- --------------------------------------------------------------------------------
CONSUMER FINANCE -- 0.7%
- --------------------------------------------------------------------------------
78,594 American Express Co. 4,544
- --------------------------------------------------------------------------------
CONTAINERS & PACKAGING -- 0.5%
- --------------------------------------------------------------------------------
81,346 Temple-Inland Inc. 3,208
- --------------------------------------------------------------------------------
DIVERSIFIED CONSUMER SERVICES -- 0.2%
- --------------------------------------------------------------------------------
30,820 Apollo Group Inc. Cl A(2) 1,139
- --------------------------------------------------------------------------------
DIVERSIFIED FINANCIAL SERVICES -- 6.2%
- --------------------------------------------------------------------------------
188,313 Bank of America Corp. 10,144
- --------------------------------------------------------------------------------
275,726 Citigroup Inc. 13,829
- --------------------------------------------------------------------------------
231,125 JPMorgan Chase & Co. 10,965
- --------------------------------------------------------------------------------
85,142 McGraw-Hill Companies, Inc. (The) 5,464
- --------------------------------------------------------------------------------
40,402
- --------------------------------------------------------------------------------
DIVERSIFIED TELECOMMUNICATION SERVICES -- 1.2%
- --------------------------------------------------------------------------------
122,154 AT&T Inc. 4,183
- --------------------------------------------------------------------------------
34,692 BellSouth Corp. 1,565
- --------------------------------------------------------------------------------
1,661 CenturyTel Inc. 67
- --------------------------------------------------------------------------------
61,232 Verizon Communications Inc. 2,266
- --------------------------------------------------------------------------------
8,081
- --------------------------------------------------------------------------------
ELECTRICAL EQUIPMENT(1)
- --------------------------------------------------------------------------------
942 Acuity Brands Inc.(4) 47
- --------------------------------------------------------------------------------
ELECTRONIC EQUIPMENT & INSTRUMENTS(1)
- --------------------------------------------------------------------------------
10,340 AVX Corp. 163
- --------------------------------------------------------------------------------
ENERGY EQUIPMENT & SERVICES -- 0.2%
- --------------------------------------------------------------------------------
159,487 Grey Wolf Inc.(2)(4) 1,116
- --------------------------------------------------------------------------------
FOOD & STAPLES RETAILING -- 0.3%
- --------------------------------------------------------------------------------
88,375 Kroger Co. (The) 1,988
- --------------------------------------------------------------------------------
FOOD PRODUCTS -- 1.0%
- --------------------------------------------------------------------------------
39,904 Campbell Soup Co. 1,492
- --------------------------------------------------------------------------------
27,863 ConAgra Foods, Inc. 729
- --------------------------------------------------------------------------------
7,167 Delta and Pine Land Company 290
- --------------------------------------------------------------------------------
See Notes to Financial Statements. (continued)
- ------
9
Balanced - Schedule of Investments
OCTOBER 31, 2006
Shares ($ IN THOUSANDS) Value
- --------------------------------------------------------------------------------
64,117 General Mills, Inc. $ 3,643
- --------------------------------------------------------------------------------
280 Seaboard Corp.(4) 395
- --------------------------------------------------------------------------------
6,549
- --------------------------------------------------------------------------------
HEALTH CARE EQUIPMENT & SUPPLIES -- 1.2%
- --------------------------------------------------------------------------------
1,220 Alcon Inc. New York Shares(4) 129
- --------------------------------------------------------------------------------
2,259 Baxter International, Inc. 104
- --------------------------------------------------------------------------------
75,062 Becton Dickinson & Co. 5,257
- --------------------------------------------------------------------------------
40,328 Hillenbrand Industries, Inc.(4) 2,366
- --------------------------------------------------------------------------------
7,856
- --------------------------------------------------------------------------------
HEALTH CARE PROVIDERS & SERVICES -- 4.0%
- --------------------------------------------------------------------------------
76,986 AmerisourceBergen Corp. 3,634
- --------------------------------------------------------------------------------
39,171 Cardinal Health, Inc. 2,564
- --------------------------------------------------------------------------------
91,307 Humana Inc.(2) 5,478
- --------------------------------------------------------------------------------
126,352 McKesson Corp. 6,328
- --------------------------------------------------------------------------------
66,448 Sierra Health Services, Inc.(2) 2,275
- --------------------------------------------------------------------------------
78,049 UnitedHealth Group Incorporated 3,807
- --------------------------------------------------------------------------------
34,647 WellCare Health Plans Inc.(2) 2,036
- --------------------------------------------------------------------------------
26,122
- --------------------------------------------------------------------------------
HOTELS, RESTAURANTS & LEISURE -- 0.3%
- --------------------------------------------------------------------------------
11,108 Choice Hotels International Inc.(4) 466
- --------------------------------------------------------------------------------
32,739 McDonald's Corporation 1,372
- --------------------------------------------------------------------------------
1,838
- --------------------------------------------------------------------------------
HOUSEHOLD PRODUCTS -- 1.0%
- --------------------------------------------------------------------------------
99,518 Colgate-Palmolive Co. 6,366
- --------------------------------------------------------------------------------
INDEPENDENT POWER PRODUCERS
& ENERGY TRADERS -- 1.9%
- --------------------------------------------------------------------------------
220,580 AES Corp. (The)(2) 4,851
- --------------------------------------------------------------------------------
117,251 TXU Corp. 7,402
- --------------------------------------------------------------------------------
12,253
- --------------------------------------------------------------------------------
INDUSTRIAL CONGLOMERATES -- 0.2%
- --------------------------------------------------------------------------------
35,789 McDermott International, Inc.(2)(4) 1,600
- --------------------------------------------------------------------------------
INSURANCE -- 1.9%
- --------------------------------------------------------------------------------
53,704 Arch Capital Group Ltd.(2) 3,453
- --------------------------------------------------------------------------------
114,928 Berkley (W.R.) Corp. 4,235
- --------------------------------------------------------------------------------
49,685 Chubb Corp. 2,641
- --------------------------------------------------------------------------------
32,705 HCC Insurance Holdings, Inc. 1,101
- --------------------------------------------------------------------------------
19,653 Philadelphia Consolidated
Holding Co.(2)(4) 769
- --------------------------------------------------------------------------------
12,199
- --------------------------------------------------------------------------------
INTERNET & CATALOG RETAIL -- 0.1%
- --------------------------------------------------------------------------------
40,472 Expedia Inc.(2) 658
- --------------------------------------------------------------------------------
INTERNET SOFTWARE & SERVICES -- 0.2%
- --------------------------------------------------------------------------------
89,696 RealNetworks Inc.(2)(4) 985
- --------------------------------------------------------------------------------
IT SERVICES -- 3.0%
- --------------------------------------------------------------------------------
178,823 Accenture Ltd. Cl A 5,885
- --------------------------------------------------------------------------------
108,351 Acxiom Corp. 2,682
- --------------------------------------------------------------------------------
Shares ($ IN THOUSANDS) Value
- --------------------------------------------------------------------------------
120,906 International Business Machines
Corp. $ 11,163
- --------------------------------------------------------------------------------
19,730
- --------------------------------------------------------------------------------
LEISURE EQUIPMENT & PRODUCTS -- 0.1%
- --------------------------------------------------------------------------------
22,730 Hasbro, Inc. 590
- --------------------------------------------------------------------------------
14,116 Mattel, Inc. 319
- --------------------------------------------------------------------------------
909
- --------------------------------------------------------------------------------
LIFE SCIENCES TOOLS & SERVICES -- 0.5%
- --------------------------------------------------------------------------------
87,305 Applera Corporation - Applied
Biosystems Group 3,256
- --------------------------------------------------------------------------------
MACHINERY -- 0.9%
- --------------------------------------------------------------------------------
44,777 Cummins Inc.(4) 5,686
- --------------------------------------------------------------------------------
MEDIA -- 1.9%
- --------------------------------------------------------------------------------
251,131 DIRECTV Group, Inc. (The)(2) 5,595
- --------------------------------------------------------------------------------
18,137 John Wiley & Sons Inc. Cl A 640
- --------------------------------------------------------------------------------
18,556 Liberty Media Holding Corp. -
Capital, Series A(2) 1,653
- --------------------------------------------------------------------------------
5,086 Omnicom Group Inc. 516
- --------------------------------------------------------------------------------
125,271 Walt Disney Co. (The) 3,941
- --------------------------------------------------------------------------------
12,345
- --------------------------------------------------------------------------------
METALS & MINING -- 1.7%
- --------------------------------------------------------------------------------
38,455 Freeport-McMoRan Copper &
Gold, Inc. Cl B 2,326
- --------------------------------------------------------------------------------
56,777 Nucor Corp. 3,316
- --------------------------------------------------------------------------------
24,530 Phelps Dodge Corp. 2,462
- --------------------------------------------------------------------------------
48,254 Steel Dynamics Inc.(4) 2,901
- --------------------------------------------------------------------------------
11,005
- --------------------------------------------------------------------------------
MULTILINE RETAIL -- 2.5%
- --------------------------------------------------------------------------------
183,461 Big Lots Inc.(2)(4) 3,867
- --------------------------------------------------------------------------------
102,145 Dollar Tree Stores Inc.(2) 3,176
- --------------------------------------------------------------------------------
117,961 Federated Department Stores, Inc. 5,180
- --------------------------------------------------------------------------------
63,024 Kohl's Corp.(2) 4,449
- --------------------------------------------------------------------------------
16,672
- --------------------------------------------------------------------------------
OFFICE ELECTRONICS(1)
- --------------------------------------------------------------------------------
19,759 Xerox Corp.(2) 336
- --------------------------------------------------------------------------------
OIL, GAS & CONSUMABLE FUELS -- 6.6%
- --------------------------------------------------------------------------------
115,589 Chevron Corp. 7,768
- --------------------------------------------------------------------------------
121,893 EnCana Corp. 5,789
- --------------------------------------------------------------------------------
273,975 Exxon Mobil Corp. 19,567
- --------------------------------------------------------------------------------
48,407 Marathon Oil Corp. 4,182
- --------------------------------------------------------------------------------
38,082 Sunoco, Inc. 2,518
- --------------------------------------------------------------------------------
12,659 Tesoro Corporation 809
- --------------------------------------------------------------------------------
53,839 Valero Energy Corp. 2,817
- --------------------------------------------------------------------------------
43,450
- --------------------------------------------------------------------------------
PERSONAL PRODUCTS(1)
- --------------------------------------------------------------------------------
1,585 NBTY Inc.(2) 44
- --------------------------------------------------------------------------------
See Notes to Financial Statements. (continued)
- ------
10
Balanced - Schedule of Investments
OCTOBER 31, 2006
Shares ($ IN THOUSANDS) Value
- --------------------------------------------------------------------------------
PHARMACEUTICALS -- 1.9%
- --------------------------------------------------------------------------------
5,557 Abbott Laboratories $ 264
- --------------------------------------------------------------------------------
44,063 Biovail Corp. 682
- --------------------------------------------------------------------------------
22,685 Johnson & Johnson 1,529
- --------------------------------------------------------------------------------
204,385 Merck & Co., Inc. 9,282
- --------------------------------------------------------------------------------
19,006 Pfizer Inc. 507
- --------------------------------------------------------------------------------
12,264
- --------------------------------------------------------------------------------
ROAD & RAIL(1)
- --------------------------------------------------------------------------------
698 Burlington Northern Santa Fe Corp. 54
- --------------------------------------------------------------------------------
3,030 Norfolk Southern Corp. 159
- --------------------------------------------------------------------------------
4,287 Union Pacific Corp. 389
- --------------------------------------------------------------------------------
602
- --------------------------------------------------------------------------------
SEMICONDUCTORS & SEMICONDUCTOR
EQUIPMENT -- 1.2%
- --------------------------------------------------------------------------------
35,087 Freescale Semiconductor Inc. Cl B(2) 1,380
- --------------------------------------------------------------------------------
18,278 Lam Research Corp.(2) 904
- --------------------------------------------------------------------------------
209,105 Micron Technology, Inc.(2) 3,022
- --------------------------------------------------------------------------------
2,865 National Semiconductor Corp.(4) 70
- --------------------------------------------------------------------------------
3,818 Novellus Systems, Inc.(2) 106
- --------------------------------------------------------------------------------
159,518 ON Semiconductor Corp.(2)(4) 992
- --------------------------------------------------------------------------------
47,629 Texas Instruments Inc. 1,437
- --------------------------------------------------------------------------------
2,475 Zoran Corp.(2) 34
- --------------------------------------------------------------------------------
7,945
- --------------------------------------------------------------------------------
SOFTWARE -- 0.5%
- --------------------------------------------------------------------------------
66,358 BMC Software Inc.(2) 2,012
- --------------------------------------------------------------------------------
13,667 Cadence Design Systems Inc.(2) 244
- --------------------------------------------------------------------------------
2,811 Microsoft Corporation 81
- --------------------------------------------------------------------------------
49,131 Oracle Corp.(2) 907
- --------------------------------------------------------------------------------
3,244
- --------------------------------------------------------------------------------
SPECIALTY RETAIL -- 1.4%
- --------------------------------------------------------------------------------
13,005 American Eagle Outfitters, Inc.(4) 596
- --------------------------------------------------------------------------------
19,972 AnnTaylor Stores Corporation(2) 879
- --------------------------------------------------------------------------------
38,860 Group 1 Automotive, Inc. 2,227
- --------------------------------------------------------------------------------
106,763 Office Depot, Inc.(2) 4,483
- --------------------------------------------------------------------------------
14,964 OfficeMax Inc. 712
- --------------------------------------------------------------------------------
8,897
- --------------------------------------------------------------------------------
THRIFTS & MORTGAGE FINANCE -- 1.3%
- --------------------------------------------------------------------------------
43,624 Corus Bankshares Inc.(4) 896
- --------------------------------------------------------------------------------
3,574 Downey Financial Corp.(4) 246
- --------------------------------------------------------------------------------
39,966 FirstFed Financial Corp.(2)(4) 2,469
- --------------------------------------------------------------------------------
22,598 Freddie Mac 1,559
- --------------------------------------------------------------------------------
30,825 IndyMac Bancorp, Inc.(4) 1,401
- --------------------------------------------------------------------------------
41,165 Washington Mutual, Inc. 1,741
- --------------------------------------------------------------------------------
8,312
- --------------------------------------------------------------------------------
TOTAL COMMON STOCKS
(Cost $328,215) 392,990
- --------------------------------------------------------------------------------
Principal Amount ($ IN THOUSANDS) Value
- --------------------------------------------------------------------------------
U.S. GOVERNMENT AGENCY
MORTGAGE-BACKED SECURITIES(5) -- 13.6%
$ 173 FHLMC, 7.00%, 10/1/12(3) $ 177
- --------------------------------------------------------------------------------
2,679 FHLMC, 4.50%, 1/1/19(3) 2,595
- --------------------------------------------------------------------------------
172 FHLMC, 6.50%, 1/1/28(3) 176
- --------------------------------------------------------------------------------
1,344 FHLMC, 5.50%, 12/1/33(3) 1,334
- --------------------------------------------------------------------------------
1,250 FNMA, 5.50%, settlement date
11/16/06(6) 1,252
- --------------------------------------------------------------------------------
22,802 FNMA, 5.50%, settlement date
12/12/06(6) 22,532
- --------------------------------------------------------------------------------
10,936 FNMA, 6.00%, settlement date
12/12/06(6) 10,998
- --------------------------------------------------------------------------------
9,841 FNMA, 6.50%, settlement date
12/12/06(6) 10,026
- --------------------------------------------------------------------------------
274 FNMA, 6.00%, 2/1/09(3) 275
- --------------------------------------------------------------------------------
22 FNMA, 6.50%, 5/1/11(3) 22
- --------------------------------------------------------------------------------
282 FNMA, 7.50%, 11/1/11(3) 291
- --------------------------------------------------------------------------------
2 FNMA, 6.50%, 10/1/12(3) 2
- --------------------------------------------------------------------------------
21 FNMA, 6.50%, 5/1/13(3) 21
- --------------------------------------------------------------------------------
11 FNMA, 6.50%, 5/1/13(3) 11
- --------------------------------------------------------------------------------
22 FNMA, 6.50%, 6/1/13(3) 22
- --------------------------------------------------------------------------------
11 FNMA, 6.50%, 6/1/13(3) 11
- --------------------------------------------------------------------------------
55 FNMA, 6.50%, 6/1/13(3) 56
- --------------------------------------------------------------------------------
44 FNMA, 6.50%, 6/1/13(3) 45
- --------------------------------------------------------------------------------
9 FNMA, 6.50%, 6/1/13(3) 9
- --------------------------------------------------------------------------------
159 FNMA, 6.00%, 1/1/14(3) 162
- --------------------------------------------------------------------------------
557 FNMA, 6.00%, 4/1/14(3) 566
- --------------------------------------------------------------------------------
2,095 FNMA, 4.50%, 5/1/19(3) 2,029
- --------------------------------------------------------------------------------
1,069 FNMA, 4.50%, 5/1/19 1,035
- --------------------------------------------------------------------------------
4,347 FNMA, 5.00%, 9/1/20(3) 4,284
- --------------------------------------------------------------------------------
29 FNMA, 6.50%, 1/1/28(3) 30
- --------------------------------------------------------------------------------
134 FNMA, 7.00%, 1/1/28(3) 139
- --------------------------------------------------------------------------------
210 FNMA, 6.50%, 1/1/29(3) 216
- --------------------------------------------------------------------------------
209 FNMA, 7.50%, 7/1/29(3) 218
- --------------------------------------------------------------------------------
97 FNMA, 7.00%, 5/1/30(3) 100
- --------------------------------------------------------------------------------
113 FNMA, 7.50%, 9/1/30(3) 118
- --------------------------------------------------------------------------------
176 FNMA, 6.50%, 9/1/31(3) 181
- --------------------------------------------------------------------------------
57 FNMA, 7.00%, 9/1/31(3) 59
- --------------------------------------------------------------------------------
302 FNMA, 6.50%, 1/1/32(3) 309
- --------------------------------------------------------------------------------
649 FNMA, 7.00%, 6/1/32(3) 670
- --------------------------------------------------------------------------------
316 FNMA, 6.50%, 8/1/32(3) 324
- --------------------------------------------------------------------------------
1,773 FNMA, 5.50%, 6/1/33(3) 1,758
- --------------------------------------------------------------------------------
2,400 FNMA, 5.50%, 7/1/33 2,379
- --------------------------------------------------------------------------------
1,899 FNMA, 5.50%, 8/1/33(3) 1,882
- --------------------------------------------------------------------------------
1,172 FNMA, 5.50%, 9/1/33(3) 1,162
- --------------------------------------------------------------------------------
3,731 FNMA, 5.00%, 11/1/33 3,612
- --------------------------------------------------------------------------------
8,409 FNMA, 5.50%, 1/1/34(3) 8,335
- --------------------------------------------------------------------------------
6,327 FNMA, 5.00%, 2/1/36 6,112
- --------------------------------------------------------------------------------
See Notes to Financial Statements. (continued)
- ------
11
Balanced - Schedule of Investments
OCTOBER 31, 2006
Principal Amount ($ IN THOUSANDS) Value
- --------------------------------------------------------------------------------
$ 276 GNMA, 7.00%, 4/20/26(3) $ 285
- --------------------------------------------------------------------------------
157 GNMA, 7.50%, 8/15/26(3) 165
- --------------------------------------------------------------------------------
51 GNMA, 7.00%, 2/15/28(3) 53
- --------------------------------------------------------------------------------
131 GNMA, 7.50%, 2/15/28(3) 136
- --------------------------------------------------------------------------------
62 GNMA, 7.00%, 12/15/28(3) 64
- --------------------------------------------------------------------------------
57 GNMA, 8.00%, 12/15/29(3) 60
- --------------------------------------------------------------------------------
343 GNMA, 7.00%, 5/15/31(3) 355
- --------------------------------------------------------------------------------
2,035 GNMA, 5.50%, 11/15/32(3) 2,030
- --------------------------------------------------------------------------------
TOTAL U.S. GOVERNMENT AGENCY
MORTGAGE-BACKED SECURITIES
(Cost $88,977) 88,683
- --------------------------------------------------------------------------------
CORPORATE BONDS -- 7.1%
AEROSPACE & DEFENSE -- 0.3%
- --------------------------------------------------------------------------------
630 Honeywell International Inc.,
5.70%, 3/15/36(3) 637
- --------------------------------------------------------------------------------
145 Lockheed Martin Corp., 6.19%,
9/1/36 (Acquired 8/30/06,
Cost $146)(3)(7) 155
- --------------------------------------------------------------------------------
610 United Technologies Corp.,
4.375%, 5/1/10(3) 597
- --------------------------------------------------------------------------------
570 United Technologies Corp.,
6.05%, 6/1/36(3) 613
- --------------------------------------------------------------------------------
2,002
- --------------------------------------------------------------------------------
BEVERAGES -- 0.3%
- --------------------------------------------------------------------------------
580 Diageo Capital plc, 5.875%,
9/30/36(3) 574
- --------------------------------------------------------------------------------
750 Miller Brewing Co., 4.25%,
8/15/08 (Acquired 1/6/04,
Cost $762)(3)(7) 736
- --------------------------------------------------------------------------------
830 SABMiller plc, 6.20%, 7/1/11
(Acquired 6/27/06, Cost $829)(7) 853
- --------------------------------------------------------------------------------
2,163
- --------------------------------------------------------------------------------
BIOTECHNOLOGY -- 0.1%
- --------------------------------------------------------------------------------
530 Genentech, Inc., 4.75%, 7/15/15 511
- --------------------------------------------------------------------------------
CAPITAL MARKETS -- 0.5%
- --------------------------------------------------------------------------------
570 Lehman Brothers Holdings Inc.,
5.00%, 1/14/11(3) 566
- --------------------------------------------------------------------------------
385 Merrill Lynch & Co., Inc., 4.25%,
2/8/10(3) 375
- --------------------------------------------------------------------------------
705 Merrill Lynch & Co., Inc., 4.79%,
8/4/10(3) 696
- --------------------------------------------------------------------------------
650 Merrill Lynch & Co., Inc., 6.05%,
5/16/16(3) 676
- --------------------------------------------------------------------------------
420 Morgan Stanley, 4.00%, 1/15/10(3) 406
- --------------------------------------------------------------------------------
350 Morgan Stanley, 4.25%, 5/15/10(3) 339
- --------------------------------------------------------------------------------
430 Morgan Stanley, 5.05%, 1/21/11(3)(4) 428
- --------------------------------------------------------------------------------
3,486
- --------------------------------------------------------------------------------
CHEMICALS(1)
- --------------------------------------------------------------------------------
145 Dow Chemical Co. (The), 7.375%,
11/1/29(3) 171
- --------------------------------------------------------------------------------
Principal Amount ($ IN THOUSANDS) Value
- --------------------------------------------------------------------------------
COMMERCIAL BANKS -- 0.6%
- --------------------------------------------------------------------------------
$ 145 Abbey National plc, 7.95%,
10/26/29(3) $ 184
- --------------------------------------------------------------------------------
550 Capital One Financial Corp.,
5.70%, 9/15/11(3) 558
- --------------------------------------------------------------------------------
670 PNC Bank N.A., 4.875%, 9/21/17(3) 641
- --------------------------------------------------------------------------------
380 PNC Funding Corp., 5.125%,
12/14/10(3) 380
- --------------------------------------------------------------------------------
435 Wachovia Bank N.A., 4.80%,
11/1/14(3)(4) 419
- --------------------------------------------------------------------------------
680 Wachovia Bank N.A., 4.875%,
2/1/15(3) 656
- --------------------------------------------------------------------------------
550 Wachovia Corp., 5.625%,
10/15/16(3) 556
- --------------------------------------------------------------------------------
600 Wells Fargo & Co., 4.625%,
8/9/10(3)(4) 592
- --------------------------------------------------------------------------------
3,986
- --------------------------------------------------------------------------------
COMMERCIAL SERVICES & SUPPLIES -- 0.1%
- --------------------------------------------------------------------------------
540 Waste Management, Inc., 7.00%,
7/15/28(3) 596
- --------------------------------------------------------------------------------
CONSUMER FINANCE(1)
- --------------------------------------------------------------------------------
290 American Express Centurion Bank,
4.375%, 7/30/09(3) 285
- --------------------------------------------------------------------------------
DIVERSIFIED FINANCIAL SERVICES -- 0.7%
- --------------------------------------------------------------------------------
960 Bank of America Corp., 4.375%,
12/1/10(3) 936
- --------------------------------------------------------------------------------
420 Bank of America N.A., 6.00%,
10/15/36(3) 435
- --------------------------------------------------------------------------------
840 Citigroup Inc., 5.00%, 9/15/14(3) 822
- --------------------------------------------------------------------------------
325 Citigroup Inc., 6.125%, 8/25/36(3) 339
- --------------------------------------------------------------------------------
395 General Electric Capital Corp.,
6.125%, 2/22/11(3) 410
- --------------------------------------------------------------------------------
800 JPMorgan Chase & Co., 6.75%,
2/1/11(3) 847
- --------------------------------------------------------------------------------
830 John Deere Capital Corp., 4.50%,
8/25/08(3) 820
- --------------------------------------------------------------------------------
4,609
- --------------------------------------------------------------------------------
DIVERSIFIED TELECOMMUNICATION SERVICES -- 0.4%
- --------------------------------------------------------------------------------
732 AT&T Corp., 7.30%, 11/15/11(3) 797
- --------------------------------------------------------------------------------
450 AT&T Inc., 6.80%, 5/15/36(4) 487
- --------------------------------------------------------------------------------
145 BellSouth Corp., 6.875%,
10/15/31(3) 156
- --------------------------------------------------------------------------------
280 Embarq Corp., 7.08%, 6/1/16(4) 287
- --------------------------------------------------------------------------------
220 Sprint Capital Corp., 6.875%,
11/15/28(3) 226
- --------------------------------------------------------------------------------
490 Telecom Italia Capital SA, 4.00%,
1/15/10(3) 467
- --------------------------------------------------------------------------------
220 Verizon Communications Inc.,
5.55%, 2/15/16(3) 219
- --------------------------------------------------------------------------------
2,639
- --------------------------------------------------------------------------------
ELECTRIC UTILITIES -- 0.4%
- --------------------------------------------------------------------------------
420 Carolina Power & Light Co.,
5.15%, 4/1/15(3) 413
- --------------------------------------------------------------------------------
See Notes to Financial Statements. (continued)
- ------
12
Balanced - Schedule of Investments
OCTOBER 31, 2006
Principal Amount ($ IN THOUSANDS) Value
- --------------------------------------------------------------------------------
$ 614 CenterPoint Energy Resources
Corp., 6.50%, 2/1/08 $ 622
- --------------------------------------------------------------------------------
375 FirstEnergy Corp., 7.375%,
11/15/31(3) 440
- --------------------------------------------------------------------------------
450 Florida Power Corp., 4.50%,
6/1/10(3) 439
- --------------------------------------------------------------------------------
480 Southern California Edison Co.,
5.625%, 2/1/36(3) 474
- --------------------------------------------------------------------------------
2,388
- --------------------------------------------------------------------------------
FOOD & STAPLES RETAILING -- 0.2%
- --------------------------------------------------------------------------------
520 Wal-Mart Stores, Inc., 4.125%,
7/1/10(3) 505
- --------------------------------------------------------------------------------
145 Wal-Mart Stores, Inc., 7.55%,
2/15/30(3)(4) 180
- --------------------------------------------------------------------------------
640 Wal-Mart Stores, Inc., 5.25%,
9/1/35 603
- --------------------------------------------------------------------------------
1,288
- --------------------------------------------------------------------------------
FOOD PRODUCTS -- 0.2%
- --------------------------------------------------------------------------------
800 Cadbury Schweppes U.S. Finance
LLC, 3.875%, 10/1/08 (Acquired
6/14/05-10/17/06, Cost $784)(3)(7) 780
- --------------------------------------------------------------------------------
145 Kellogg Co., 7.45%, 4/1/31(3) 176
- --------------------------------------------------------------------------------
145 Kraft Foods Inc., 6.50%, 11/1/31(3) 158
- --------------------------------------------------------------------------------
1,114
- --------------------------------------------------------------------------------
HEALTH CARE EQUIPMENT & SUPPLIES -- 0.2%
- --------------------------------------------------------------------------------
710 Baxter Finco BV, 4.75%, 10/15/10(3) 699
- --------------------------------------------------------------------------------
350 Boston Scientific Corp., 6.40%,
6/15/16(3) 356
- --------------------------------------------------------------------------------
1,055
- --------------------------------------------------------------------------------
HOTELS, RESTAURANTS & LEISURE -- 0.1%
- --------------------------------------------------------------------------------
540 Royal Caribbean Cruises Ltd.,
7.00%, 6/15/13(3) 551
- --------------------------------------------------------------------------------
HOUSEHOLD DURABLES -- 0.1%
- --------------------------------------------------------------------------------
550 D.R. Horton, Inc., 7.875%, 8/15/11 593
- --------------------------------------------------------------------------------
INDUSTRIAL CONGLOMERATES -- 0.2%
- --------------------------------------------------------------------------------
1,400 General Electric Co., 5.00%,
2/1/13(3) 1,390
- --------------------------------------------------------------------------------
INSURANCE -- 0.3%
- --------------------------------------------------------------------------------
750 Allstate Financial Global Funding,
4.25%, 9/10/08 (Acquired 9/3/03,
Cost $749)(3)(7) 738
- --------------------------------------------------------------------------------
145 AXA SA, 8.60%, 12/15/30(3) 191
- --------------------------------------------------------------------------------
400 Genworth Financial Inc., 4.95%,
10/1/15(3) 388
- --------------------------------------------------------------------------------
450 Prudential Financial, Inc., 5.40%,
6/13/35(3) 426
- --------------------------------------------------------------------------------
1,743
- --------------------------------------------------------------------------------
MEDIA -- 0.5%
- --------------------------------------------------------------------------------
1,020 Comcast Corp., 5.90%, 3/15/16(3) 1,028
- --------------------------------------------------------------------------------
970 Cox Communications, Inc., 7.125%,
10/1/12 1,039
- --------------------------------------------------------------------------------
Principal Amount ($ IN THOUSANDS) Value
- --------------------------------------------------------------------------------
$ 560 Knight-Ridder, Inc., 7.125%,
6/1/11(3) $ 585
- --------------------------------------------------------------------------------
550 News America Holdings, 7.75%,
1/20/24(3) 619
- --------------------------------------------------------------------------------
145 Time Warner Inc., 7.625%,
4/15/31(3) 164
- --------------------------------------------------------------------------------
3,435
- --------------------------------------------------------------------------------
METALS & MINING(1)
- --------------------------------------------------------------------------------
220 Alcan Inc., 4.50%, 5/15/13(3) 208
- --------------------------------------------------------------------------------
MULTI-UTILITIES -- 0.4%
- --------------------------------------------------------------------------------
550 Consolidated Edison Co. of New
York, 5.50%, 9/15/16(3) 554
- --------------------------------------------------------------------------------
750 Dominion Resources Inc., 4.125%,
2/15/08(3) 738
- --------------------------------------------------------------------------------
420 Dominion Resources Inc., 4.75%,
12/15/10 411
- --------------------------------------------------------------------------------
360 Nisource Finance Corp., 5.25%,
9/15/17(3) 340
- --------------------------------------------------------------------------------
315 Pacific Gas & Electric Co., 6.05%,
3/1/34(3) 323
- --------------------------------------------------------------------------------
2,366
- --------------------------------------------------------------------------------
MULTILINE RETAIL -- 0.1%
- --------------------------------------------------------------------------------
350 May Department Stores Co. (The),
3.95%, 7/15/07(3) 346
- --------------------------------------------------------------------------------
145 Target Corp., 7.00%, 7/15/31(3) 171
- --------------------------------------------------------------------------------
517
- --------------------------------------------------------------------------------
OIL, GAS & CONSUMABLE FUELS -- 0.6%
- --------------------------------------------------------------------------------
360 Anadarko Petroleum Corp., 5.95%,
9/15/16(3) 366
- --------------------------------------------------------------------------------
230 Anadarko Petroleum Corp., 6.45%,
9/15/36(3) 239
- --------------------------------------------------------------------------------
145 Conoco Inc., 6.95%, 4/15/29(3) 168
- --------------------------------------------------------------------------------
375 Devon Financing Corp., ULC,
7.875%, 9/30/31(3) 462
- --------------------------------------------------------------------------------
910 Enterprise Products Operating L.P.,
4.95%, 6/1/10 895
- --------------------------------------------------------------------------------
360 Enterprise Products Operating L.P.,
6.65%, 10/15/34 370
- --------------------------------------------------------------------------------
860 Premcor Refining Group Inc.
(The), 6.125%, 5/1/11(3) 880
- --------------------------------------------------------------------------------
395 XTO Energy Inc., 5.30%, 6/30/15(3) 385
- --------------------------------------------------------------------------------
380 XTO Energy Inc., 6.10%, 4/1/36(3) 381
- --------------------------------------------------------------------------------
4,146
- --------------------------------------------------------------------------------
PHARMACEUTICALS -- 0.2%
- --------------------------------------------------------------------------------
570 Abbott Laboratories, 5.875%,
5/15/16(3) 594
- --------------------------------------------------------------------------------
400 Schering-Plough Corp., 5.55%,
12/1/13(3) 403
- --------------------------------------------------------------------------------
997
- --------------------------------------------------------------------------------
REAL ESTATE INVESTMENT TRUSTS -- 0.1%
- --------------------------------------------------------------------------------
380 ERP Operating L.P., 5.125%,
3/15/16(3) 369
- --------------------------------------------------------------------------------
See Notes to Financial Statements. (continued)
- ------
13
Balanced - Schedule of Investments
OCTOBER 31, 2006
Principal Amount ($ IN THOUSANDS) Value
- --------------------------------------------------------------------------------
ROAD & RAIL -- 0.1%
- --------------------------------------------------------------------------------
$ 580 Burlington Northern Santa Fe
Corp., 6.20%, 8/15/36(3) $ 612
- --------------------------------------------------------------------------------
362 Norfolk Southern Corp., 5.64%,
5/17/29(3) 357
- --------------------------------------------------------------------------------
969
- --------------------------------------------------------------------------------
SOFTWARE -- 0.1%
- --------------------------------------------------------------------------------
770 Oracle Corp., 5.00%, 1/15/11(3) 765
- --------------------------------------------------------------------------------
THRIFTS & MORTGAGE FINANCE -- 0.2%
- --------------------------------------------------------------------------------
1,025 HSBC Finance Corp., 4.75%,
4/15/10(3)(4) 1,012
- --------------------------------------------------------------------------------
415 HSBC Finance Corp., 4.625%,
9/15/10(3)(4) 408
- --------------------------------------------------------------------------------
1,420
- --------------------------------------------------------------------------------
WIRELESS TELECOMMUNICATION SERVICES -- 0.1%
- --------------------------------------------------------------------------------
880 Nextel Communications Inc.,
5.95%, 3/15/14 865
- --------------------------------------------------------------------------------
TOTAL CORPORATE BONDS
(Cost $46,390) 46,627
- --------------------------------------------------------------------------------
U.S. GOVERNMENT AGENCY
SECURITIES -- 7.1%
3,200 FHLB, 4.875%, 8/22/07(3) 3,192
- --------------------------------------------------------------------------------
3,800 FHLB, 4.625%, 2/1/08(3)(4) 3,782
- --------------------------------------------------------------------------------
8,370 FHLB, 5.125%, 9/29/10(3) 8,443
- --------------------------------------------------------------------------------
4,000 FHLB, 5.00%, 10/13/11(3) 4,025
- --------------------------------------------------------------------------------
2,475 FHLMC, 5.00%, 9/16/08(3) 2,480
- --------------------------------------------------------------------------------
2,300 FHLMC, 5.50%, 3/28/16(3) 2,322
- --------------------------------------------------------------------------------
6,000 FHLMC, 5.30%, 5/12/20(3) 5,801
- --------------------------------------------------------------------------------
4,970 FNMA, 4.75%, 8/3/07(3) 4,953
- --------------------------------------------------------------------------------
3,800 FNMA, 6.625%, 9/15/09(3) 3,979
- --------------------------------------------------------------------------------
7,200 FNMA, 5.80%, 2/9/26(3) 7,185
- --------------------------------------------------------------------------------
TOTAL U.S. GOVERNMENT AGENCY
SECURITIES
(Cost $45,972) 46,162
- --------------------------------------------------------------------------------
COLLATERALIZED MORTGAGE
OBLIGATIONS(5) -- 6.1%
14,063 Banc of America Commercial
Mortgage Inc. STRIPS - COUPON,
Series 2004-1, Class XP, VRN,
0.82%, 11/1/06(3) 303
- --------------------------------------------------------------------------------
17,687 Bear Stearns Commercial
Mortgage Securities STRIPS -
COUPON, Series 2004 T16,
Class X2, VRN, 0.93%, 11/1/06(3) 576
- --------------------------------------------------------------------------------
1,780 Bear Stearns Commercial
Mortgage Securities, Series 2006
BBA7, Class A1, VRN, 5.43%,
11/15/06, resets monthly off the
1-month LIBOR plus 0.11% with
no caps (Acquired 6/5/06,
Cost $1,780)(3)(7) 1,782
- --------------------------------------------------------------------------------
Principal Amount ($ IN THOUSANDS) Value
- --------------------------------------------------------------------------------
$ 675 Commercial Mortgage
Pass-Through Certificates, Series
2005 F10A, Class A1, VRN, 5.42%,
11/15/06, resets monthly off the
1-month LIBOR plus 0.10% with
no caps (Acquired 3/18/05,
Cost $675)(3)(7) $ 675
- --------------------------------------------------------------------------------
701 Commercial Mortgage
Pass-Through Certificates, Series
2005 FL11, Class A1, VRN, 5.47%,
11/15/06, resets monthly off the
1-month LIBOR plus 0.15% with
no caps (Acquired 11/18/05,
Cost $701)(3)(7) 701
- --------------------------------------------------------------------------------
723 FHLMC, Series 2541, Class EA,
5.00%, 3/1/16 719
- --------------------------------------------------------------------------------
2,600 FHLMC, Series 2567, Class OD,
5.00%, 8/15/15 2,587
- --------------------------------------------------------------------------------
1,732 FHLMC, Series 2937, Class KA,
4.50%, 12/15/14 1,715
- --------------------------------------------------------------------------------
362 FHLMC, Series 77, Class H,
8.50%, 9/15/20(3) 387
- --------------------------------------------------------------------------------
3,500 GMAC Commercial Mortgage
Securities, Inc., Series 2005 C1,
Class A2 SEQ, 4.47%, 5/10/43(3) 3,437
- --------------------------------------------------------------------------------
5,380 Greenwich Capital Commercial
Funding Corp., Series 2005 GG5,
Class A5, 5.22%, 4/10/37(3) 5,363
- --------------------------------------------------------------------------------
1,000 LB-UBS Commercial Mortgage
Trust, Series 2004 C4, Class A2,
VRN, 4.57%, 11/13/06(3) 988
- --------------------------------------------------------------------------------
3,000 LB-UBS Commercial Mortgage
Trust, Series 2005 C3, Class A3
SEQ, 4.65%, 7/30/30(3) 2,937
- --------------------------------------------------------------------------------
3,510 LB-UBS Commercial Mortgage
Trust, Series 2005 C3, Class A5
SEQ, 4.74%, 7/15/30(3) 3,385
- --------------------------------------------------------------------------------
2,550 LB-UBS Commercial Mortgage
Trust, Series 2006 C1, Class A4
SEQ, 5.16%, 2/15/31(3) 2,528
- --------------------------------------------------------------------------------
772 Lehman Brothers Floating Rate
Commercial Mortgage Trust, Series
2005 LLFA, Class A1, VRN, 5.42%,
11/15/06, resets monthly off the
1-month LIBOR plus 0.10% with
no caps (Acquired 7/25/05,
Cost $772)(3)(7) 772
- --------------------------------------------------------------------------------
1,547 Lehman Brothers Floating Rate
Commercial Mortgage Trust, Series
2006 LLFA, Class A1, VRN, 5.40%,
11/15/06, resets monthly off the
1-month LIBOR plus 0.08% with
no caps (Acquired 8/7/06,
Cost $1,547)(3)(7) 1,548
- --------------------------------------------------------------------------------
159 MASTR Alternative Loans Trust,
Series 2003-8, Class 4A1, 7.00%,
12/25/33(3) 160
- --------------------------------------------------------------------------------
See Notes to Financial Statements. (continued)
- ------
14
Balanced - Schedule of Investments
OCTOBER 31, 2006
Principal Amount ($ IN THOUSANDS) Value
- --------------------------------------------------------------------------------
$ 970 Merrill Lynch Floating Trust, Series
2006-1, Class A1, VRN, 5.39%,
12/15/06, resets monthly off the
1-month LIBOR plus 0.07% with
no caps (Acquired 10/31/06,
Cost $970)(7)(8) $ 970
- --------------------------------------------------------------------------------
950 Morgan Stanley Capital I, Series
2006 XLF, Class A1, VRN, 5.41%,
11/15/06, resets monthly off the
1-month LIBOR plus 0.09% with
no caps (Acquired 7/28/06,
Cost $950)(3)(7) 950
- --------------------------------------------------------------------------------
1,107 Thornburg Mortgage Securities
Trust, Series 2006-5, Class A1,
VRN, 5.44%, 11/27/06, resets
monthly off the 1-month LIBOR
plus 0.12% with no caps 1,106
- --------------------------------------------------------------------------------
5,060 Wachovia Bank Commercial
Mortgage Trust, Series 2006 C23,
Class A4, 5.42%, 1/15/45(3) 5,101
- --------------------------------------------------------------------------------
267 Washington Mutual, Inc., Series
2005 AR11, Class A1C1, VRN,
5.52%, 11/25/06, resets monthly
off the 1-month LIBOR plus
0.20% with a cap of 10.50% 268
- --------------------------------------------------------------------------------
875 Washington Mutual, Inc., Series
2005 AR4, Class A3, 4.59%,
4/25/35(3) 859
- --------------------------------------------------------------------------------
TOTAL COLLATERALIZED MORTGAGE
OBLIGATIONS
(Cost $39,857) 39,817
- --------------------------------------------------------------------------------
U.S. TREASURY SECURITIES -- 5.2%
3,665 U.S. Treasury Bonds, 8.125%,
8/15/21(3)(4) 4,947
- --------------------------------------------------------------------------------
6,700 U.S. Treasury Bonds, 7.125%,
2/15/23(3)(4) 8,436
- --------------------------------------------------------------------------------
800 U.S. Treasury Bonds, 6.125%,
11/15/27(3)(4) 940
- --------------------------------------------------------------------------------
628 U.S. Treasury Bonds, 6.25%,
5/15/30(3)(4) 759
- --------------------------------------------------------------------------------
5,547 U.S. Treasury Inflation Indexed
Notes, 2.00%, 1/15/16(3)(4) 5,391
- --------------------------------------------------------------------------------
2,500 U.S. Treasury Notes, 4.875%,
4/30/11(3) 2,531
- --------------------------------------------------------------------------------
10,400 U.S. Treasury Notes, 5.125%,
6/30/11(3)(4) 10,637
- --------------------------------------------------------------------------------
565 U.S. Treasury Notes, 4.875%,
8/15/16(3)(4) 577
- --------------------------------------------------------------------------------
TOTAL U.S. TREASURY SECURITIES
(Cost $33,813) 34,218
- --------------------------------------------------------------------------------
ASSET-BACKED SECURITIES(5) -- 3.7%
6 ABSC Net Interest Margin, Series
2004 HE5, Class A1, 5.00%,
8/27/34 (Acquired 6/22/04,
Cost $6)(7) 6
- --------------------------------------------------------------------------------
Principal Amount ($ IN THOUSANDS) Value
- --------------------------------------------------------------------------------
$ 1,056 Accredited Mortgage Loan Trust,
Series 2006-1, Class A1, VRN,
5.38%, 11/25/06, resets monthly
off the 1-month LIBOR plus
0.06% with no caps(3) $ 1,057
- --------------------------------------------------------------------------------
1,403 Accredited Mortgage Loan Trust,
Series 2006-2, Class A1, VRN,
5.36%, 11/27/06, resets monthly
off the 1-month LIBOR plus
0.04% with no caps 1,404
- --------------------------------------------------------------------------------
1 AQ Finance Net Interest Margin,
Series 2004 RN5, Class A, 5.19%,
6/29/34 (Acquired 6/24/04,
Cost $1)(7) 1
- --------------------------------------------------------------------------------
519 Ameriquest Mortgage Securities
Inc., Series 2006 R1, Class A2A,
VRN, 5.40%, 11/27/06, resets
monthly off the 1-month LIBOR
plus 0.08% with no caps 519
- --------------------------------------------------------------------------------
1,053 Argent Securities Inc., Series
2006 M3, Class A2A, VRN, 5.37%,
11/27/06, resets monthly off the
1-month LIBOR plus 0.05% with
no caps(3) 1,054
- --------------------------------------------------------------------------------
2,000 Capital One Prime Auto
Receivables Trust, Series 2004-2,
Class A4, VRN, 5.38%, 11/15/06,
resets monthly off the 1-month
LIBOR plus 0.06% with no caps(3) 2,003
- --------------------------------------------------------------------------------
924 CNH Equipment Trust, Series
2004 A, Class A3A, VRN, 5.39%,
11/15/06, resets monthly off the
1-month LIBOR plus 0.07% with
no caps(3) 924
- --------------------------------------------------------------------------------
479 Countrywide Asset-Backed
Certificates, Series 2005-8,
Class 2A1, VRN, 5.45%, 11/25/06,
resets monthly off the 1-month
LIBOR plus 0.13% with no caps 480
- --------------------------------------------------------------------------------
1,376 Countrywide Asset-Backed
Certificates, Series 2006-6,
Class 2A1, VRN, 5.39%, 11/27/06,
resets monthly off the 1-month
LIBOR plus 0.07% with no caps 1,377
- --------------------------------------------------------------------------------
637 Countrywide Asset-Backed
Certificates, Series 2006 BC2,
Class 2A1, VRN, 5.36%, 11/27/06,
resets monthly off the 1-month
LIBOR plus 0.04% with no caps 638
- --------------------------------------------------------------------------------
1,633 First Franklin Mortgage Loan Asset
Backed Certificates, Series
2006 FF11, Class 2A1, VRN,
5.36%, 11/25/06, resets monthly
off the 1-month LIBOR plus
0.04% with no caps(3) 1,634
- --------------------------------------------------------------------------------
2,375 First Franklin Mortgage Loan Asset
Backed Certificates, Series
2006 FF12, Class A2, VRN,
5.36%, 11/27/06, resets monthly
off the 1-month LIBOR plus
0.04% with no caps(3) 2,376
- --------------------------------------------------------------------------------
See Notes to Financial Statements. (continued)
- ------
15
Balanced - Schedule of Investments
OCTOBER 31, 2006
Principal Amount ($ IN THOUSANDS) Value
- --------------------------------------------------------------------------------
$ 696 IndyMac Residential Asset Backed
Trust, Series 2006 B, Class 2A1,
VRN, 5.38%, 11/27/06, resets
monthly off the 1-month LIBOR
plus 0.06% with no caps $ 696
- --------------------------------------------------------------------------------
489 Long Beach Mortgage Loan Trust,
Series 2006-2, Class 2A1, VRN,
5.39%, 11/27/06, resets monthly
off the 1-month LIBOR plus
0.07% with no caps(3) 490
- --------------------------------------------------------------------------------
1,511 Long Beach Mortgage Loan Trust,
Series 2006-6, Class 2A1, VRN,
5.36%, 11/27/06, resets monthly
off the 1-month LIBOR plus
0.04% with no caps 1,512
- --------------------------------------------------------------------------------
2,495 NovaStar Home Equity Loan,
Series 2005-4, Class A2A, VRN,
5.41%, 11/27/06, resets monthly
off the 1-month LIBOR plus
0.09% with a cap of 11.00% 2,495
- --------------------------------------------------------------------------------
300 Residential Asset Securities Corp.,
Series 2004 KS2, Class MI1,
4.71%, 3/25/34(3) 293
- --------------------------------------------------------------------------------
1,125 SLC Student Loan Trust, Series
2006-2, Class A1, VRN, 5.36%,
12/15/06, resets quarterly off the
3-month LIBOR minus 0.02%
with no caps 1,125
- --------------------------------------------------------------------------------
170 SLM Student Loan Trust, Series
2006-2, Class A1, VRN, 5.35%,
1/25/07, resets quarterly off the
3-month LIBOR minus 0.03%
with no caps 170
- --------------------------------------------------------------------------------
790 SLM Student Loan Trust, Series
2006-5, Class A2, VRN, 5.37%,
1/25/07, resets quarterly off the
3-month LIBOR minus 0.01%
with no caps(3) 790
- --------------------------------------------------------------------------------
900 SLM Student Loan Trust, Series
2006-7, Class A1, VRN, 5.34%,
1/25/07, resets quarterly off the
3-month LIBOR minus 0.04%
with no caps(3) 900
- --------------------------------------------------------------------------------
2,444 Soundview Home Equity Loan
Trust, Series 2006-3, Class A1,
VRN, 5.36%, 11/27/06, resets
monthly off the 1-month LIBOR
plus 0.04% with no caps(3) 2,445
- --------------------------------------------------------------------------------
TOTAL ASSET-BACKED SECURITIES
(Cost $24,380) 24,389
- --------------------------------------------------------------------------------
Principal Amount ($ IN THOUSANDS) Value
- --------------------------------------------------------------------------------
MUNICIPAL SECURITIES -- 0.8%
$ 3,600 Commonwealth of Massachusetts
Rev., 5.50%, 1/1/34 (FGIC)(3) $ 4,371
- --------------------------------------------------------------------------------
800 Illinois GO, (Taxable Pension),
5.10%, 6/1/33(3) 774
- --------------------------------------------------------------------------------
TOTAL MUNICIPAL SECURITIES
(Cost $4,893) 5,145
- --------------------------------------------------------------------------------
SOVEREIGN GOVERNMENTS &
AGENCIES -- 0.3%
145 Hydro Quebec, 8.40%, 1/15/22(3) 190
- --------------------------------------------------------------------------------
810 Province of Quebec, 5.00%,
7/17/09(3) 811
- --------------------------------------------------------------------------------
910 Republic of Italy, 4.00%, 6/16/08(3) 895
- --------------------------------------------------------------------------------
TOTAL SOVEREIGN GOVERNMENTS &
AGENCIES
(Cost $1,905) 1,896
- --------------------------------------------------------------------------------
TEMPORARY CASH INVESTMENTS -- 2.4%
Repurchase Agreement, Deutsche Bank Securities,
Inc., (collateralized by various U.S. Treasury
obligations, 2.00%, 7/15/14, valued at $16,221,
in a joint trading account at 5.25%, dated
10/31/06, due 11/1/06 (Delivery value $15,902)(3)
(Cost $15,900) 15,900
- --------------------------------------------------------------------------------
COLLATERAL RECEIVED FOR
SECURITIES LENDING(9) -- 7.3%
Repurchase Agreement, BNP Paribas,
(collateralized by various U.S. Government Agency
obligations in a pooled account at the lending
agent), 5.30%, dated 10/31/06, due 11/1/06
(Delivery value $30,004) 30,000
- --------------------------------------------------------------------------------
Repurchase Agreement, UBS AG, (collateralized by
various U.S. Government Agency obligations in a
pooled account at the lending agent), 5.31%,
dated 10/31/06, due 11/1/06 (Delivery value
$17,822) 17,819
- --------------------------------------------------------------------------------
TOTAL COLLATERAL RECEIVED FOR
SECURITIES LENDING
(Cost $47,819) 47,819
- --------------------------------------------------------------------------------
TOTAL INVESTMENT SECURITIES -- 113.7%
(Cost $678,121) 743,646
- --------------------------------------------------------------------------------
OTHER ASSETS AND LIABILITIES -- (13.7)% (89,730)
- --------------------------------------------------------------------------------
TOTAL NET ASSETS -- 100.0% $653,916
================================================================================
See Notes to Financial Statements. (continued)
- ------
16
Balanced - Schedule of Investments
OCTOBER 31, 2006
FUTURES CONTRACTS
($ IN THOUSANDS)
Expiration Underlying Face Unrealized
Contracts Purchased Date Amount at Value Gain (Loss)
- ----------------------------------------------------------------------------------------------------
295 U.S. Treasury 2-Year Notes December 2006 $60,300 $ 60
- ----------------------------------------------------------------------------------------------------
368 U.S. Treasury 5-Year Notes December 2006 38,847 235
- ----------------------------------------------------------------------------------------------------
$99,147 $295
=============================
($ IN THOUSANDS)
Expiration Underlying Face Unrealized
Contracts Sold Date Amount at Value Gain (Loss)
- ----------------------------------------------------------------------------------------------------
38 U.S. Long Bond December 2006 $4,281 $ (99)
- ----------------------------------------------------------------------------------------------------
456 U.S. Treasury 10-Year Notes December 2006 49,348 (535)
- ----------------------------------------------------------------------------------------------------
$53,629 $(634)
=============================
SWAP AGREEMENTS ($ IN THOUSANDS)
Unrealized
Notional Amount Description of Agreement Expiration Date Gain (Loss)
- ----------------------------------------------------------------------------------------------------
CREDIT DEFAULT
- ----------------------------------------------------------------------------------------------------
$7,580 Pay quarterly a fixed rate equal to 0.45% multiplied December 2010 $ (49)
by the notional amount and receive from Deutsche
Bank AG upon each default event of one of the
issues of Dow Jones CDX N.A. Investment Grade 5,
par value of the proportional notional amount.
- ----------------------------------------------------------------------------------------------------
5,150 Pay quarterly a fixed rate equal to 0.85% multiplied December 2010 (48)
by the notional amount and receive from Barclays
Capital, Inc. upon each default event of one of the
issues of Dow Jones CDX N.A. Investment Grade High
Volume 5, par value of the proportional notional amount.
- ----------------------------------------------------------------------------------------------------
8,000 Pay quarterly a fixed rate equal to 0.40% multiplied June 2011 (30)
by the notional amount and receive from Barclays
Capital, Inc. upon each default event of one of the
issues of Dow Jones CDX N.A. Investment Grade 6,
par value of the proportional notional amount.
- ----------------------------------------------------------------------------------------------------
4,000 Pay quarterly a fixed rate equal to 0.75% multiplied June 2011 (10)
by the notional amount and receive from Deutsche
Bank AG upon each default event of one of the
issuesof Dow Jones CDX N.A. Investment Grade High
Volume 6, par value of the proportional notional amount.
- ----------------------------------------------------------------------------------------------------
$(137)
============
See Notes to Financial Statements. (continued)
- ------
17
Balanced - Schedule of Investments
OCTOBER 31, 2006
NOTES TO SCHEDULE OF INVESTMENTS
ABSC = Asset-Backed Securities Corp.
CDX = Credit Derivative Indexes
FGIC = Financial Guaranty Insurance Co.
FHLB = Federal Home Loan Bank
FHLMC = Federal Home Loan Mortgage Corporation
FNMA = Federal National Mortgage Association
GMAC = General Motors Acceptance Corporation
GNMA = Government National Mortgage Association
GO = General Obligation
LB-UBS = Lehman Brothers Inc. -- UBS AG
LIBOR = London Interbank Offered Rate
MASTR = Mortgage Asset Securitization Transactions, Inc.
resets = The frequency with which a security's coupon changes, based on current
market conditions or an underlying index. The more frequently a
security resets, the less risk the investor is taking that the coupon
will vary significantly from current market rates.
SEQ = Sequential Payer
STRIPS = Separate Trading of Registered Interest and Principal of Securities
VRN = Variable Rate Note. Interest reset date is indicated. Rate shown is
effective October 31, 2006.
(1) Industry is less than 0.05% of total net assets.
(2) Non-income producing.
(3) Security, or a portion thereof, has been segregated for forward commitments,
futures contracts, when-issued securities and/or swap agreements.
(4) Security, or a portion thereof, was on loan as of October 31, 2006.
(5) Final maturity indicated, unless otherwise noted.
(6) Forward commitment.
(7) Security was purchased under Rule 144A of the Securities Act of 1933 or is a
private placement and, unless registered under the Act or exempted from
registration, may only be sold to qualified institutional investors. The
aggregate value of restricted securities at October 31, 2006 was $10,667 (in
thousands), which represented 1.6% of total net assets.
(8) When-issued security.
(9) Investments represent purchases made by the lending agent with cash
collateral received through securities lending transactions. (See Note 5 in
Notes to Financial Statements.)
See Notes to Financial Statements.
- ------
18
Statement of Assets and Liabilities
OCTOBER 31, 2006
(AMOUNTS IN THOUSANDS EXCEPT AS NOTED)
- --------------------------------------------------------------------------------
ASSETS
- --------------------------------------------------------------------------------
Investment securities, at value (cost of $630,302) --
including $54,040 of securities on loan $695,827
- --------------------------------------------------------------
Investments made with cash collateral received
for securities on loan, at value (cost of $47,819) 47,819
- --------------------------------------------------------------------------------
Total investment securities, at value (cost of $678,121) 743,646
- --------------------------------------------------------------
Cash 56
- --------------------------------------------------------------
Receivable for investments sold 9,876
- --------------------------------------------------------------
Dividends and interest receivable 2,555
- --------------------------------------------------------------------------------
756,133
- --------------------------------------------------------------------------------
LIABILITIES
- --------------------------------------------------------------------------------
Payable for collateral received for securities on loan 47,819
- --------------------------------------------------------------
Payable for investments purchased 53,700
- --------------------------------------------------------------
Payable for variation margin on futures contracts 63
- --------------------------------------------------------------
Unrealized depreciation on swap agreements 137
- --------------------------------------------------------------
Accrued management fees 492
- --------------------------------------------------------------
Distribution fees payable 3
- --------------------------------------------------------------
Service fees payable 3
- --------------------------------------------------------------------------------
102,217
- --------------------------------------------------------------------------------
NET ASSETS $653,916
================================================================================
NET ASSETS CONSIST OF:
- --------------------------------------------------------------------------------
Capital (par value and paid-in surplus) $563,236
- --------------------------------------------------------------
Undistributed net investment income 1,625
- --------------------------------------------------------------
Undistributed net realized gain on investment transactions 24,006
- --------------------------------------------------------------
Net unrealized appreciation on investments 65,049
- --------------------------------------------------------------------------------
$653,916
================================================================================
INVESTOR CLASS, $0.01 PAR VALUE ($ AND SHARES IN FULL)
- --------------------------------------------------------------------------------
Net assets $636,799,341
- --------------------------------------------------------------
Shares outstanding 37,384,421
- --------------------------------------------------------------
Net asset value per share $17.03
- --------------------------------------------------------------------------------
INSTITUTIONAL CLASS, $0.01 PAR VALUE ($ AND SHARES IN FULL)
- --------------------------------------------------------------------------------
Net assets $1,227,718
- --------------------------------------------------------------
Shares outstanding 72,069
- --------------------------------------------------------------
Net asset value per share $17.04
- --------------------------------------------------------------------------------
ADVISOR CLASS, $0.01 PAR VALUE ($ AND SHARES IN FULL)
- --------------------------------------------------------------------------------
Net assets $15,888,974
- --------------------------------------------------------------
Shares outstanding 933,420
- --------------------------------------------------------------
Net asset value per share $17.02
- --------------------------------------------------------------------------------
See Notes to Financial Statements.
- ------
19
Statement of Operations
YEAR ENDED OCTOBER 31, 2006
(AMOUNTS IN THOUSANDS)
- --------------------------------------------------------------------------------
INVESTMENT INCOME (LOSS)
- --------------------------------------------------------------------------------
INCOME:
- --------------------------------------------------------------
Interest $13,102
- --------------------------------------------------------------
Dividends 6,428
- --------------------------------------------------------------
Securities lending 108
- --------------------------------------------------------------------------------
19,638
- --------------------------------------------------------------------------------
EXPENSES:
- --------------------------------------------------------------
Management fees 5,783
- --------------------------------------------------------------
Distribution fees -- Advisor Class 39
- --------------------------------------------------------------
Service fees -- Advisor Class 39
- --------------------------------------------------------------
Directors' fees and expenses 10
- --------------------------------------------------------------
Other expenses 3
- --------------------------------------------------------------------------------
5,874
- --------------------------------------------------------------------------------
NET INVESTMENT INCOME (LOSS) 13,764
- --------------------------------------------------------------------------------
REALIZED AND UNREALIZED GAIN (LOSS)
- --------------------------------------------------------------------------------
NET REALIZED GAIN (LOSS) ON:
- --------------------------------------------------------------
Investment transactions 26,261
- --------------------------------------------------------------
Futures and swaps transactions 147
- --------------------------------------------------------------------------------
26,408
- --------------------------------------------------------------------------------
CHANGE IN NET UNREALIZED APPRECIATION (DEPRECIATION) ON:
- --------------------------------------------------------------
Investments 27,728
- --------------------------------------------------------------
Futures and swaps (596)
- --------------------------------------------------------------------------------
27,132
- --------------------------------------------------------------------------------
NET REALIZED AND UNREALIZED GAIN (LOSS) 53,540
- --------------------------------------------------------------------------------
NET INCREASE (DECREASE) IN NET ASSETS
RESULTING FROM OPERATIONS $67,304
================================================================================
See Notes to Financial Statements.
- ------
20
Statement of Changes in Net Assets
YEARS ENDED OCTOBER 31, 2006 AND OCTOBER 31, 2005
(AMOUNTS IN THOUSANDS)
- --------------------------------------------------------------------------------
INCREASE (DECREASE) IN NET ASSETS 2006 2005
- --------------------------------------------------------------------------------
OPERATIONS
- --------------------------------------------------------------------------------
Net investment income (loss) $ 13,764 $ 12,056
- ---------------------------------------------------
Net realized gain (loss) 26,408 44,163
- ---------------------------------------------------
Change in net unrealized
appreciation (depreciation) 27,132 (14,041)
- --------------------------------------------------------------------------------
Net increase (decrease) in net assets
resulting from operations 67,304 42,178
- --------------------------------------------------------------------------------
DISTRIBUTIONS TO SHAREHOLDERS
- --------------------------------------------------------------------------------
From net investment income:
- ---------------------------------------------------
Investor Class (13,417) (11,086)
- ---------------------------------------------------
Institutional Class (28) (14)
- ---------------------------------------------------
Advisor Class (296) (254)
- ---------------------------------------------------
From net realized gains:
- ---------------------------------------------------
Investor Class (32,826) --
- ---------------------------------------------------
Institutional Class (66) --
- ---------------------------------------------------
Advisor Class (860) --
- --------------------------------------------------------------------------------
Decrease in net assets from distributions (47,493) (11,354)
- --------------------------------------------------------------------------------
CAPITAL SHARE TRANSACTIONS
- --------------------------------------------------------------------------------
Net increase (decrease) in net assets
from capital share transactions 2,121 (10,683)
- --------------------------------------------------------------------------------
NET INCREASE (DECREASE) IN NET ASSETS 21,932 20,141
NET ASSETS
- --------------------------------------------------------------------------------
Beginning of period 631,984 611,843
- --------------------------------------------------------------------------------
End of period $653,916 $631,984
================================================================================
Undistributed net investment income $1,625 $1,609
================================================================================
See Notes to Financial Statements.
- ------
21
Notes to Financial Statements
OCTOBER 31, 2006 (AMOUNTS IN THOUSANDS)
1. ORGANIZATION AND SUMMARY OF SIGNIFICANT ACCOUNTING POLICIES
ORGANIZATION -- American Century Mutual Funds, Inc. (the corporation) is
registered under the Investment Company Act of 1940 (the 1940 Act) as an
open-end management investment company. Balanced Fund (the fund) is one fund in
a series issued by the corporation. The fund is diversified under the 1940 Act.
The fund's investment objective is to seek long-term capital growth and current
income. The fund pursues its objective by investing approximately 60% of its
assets in equity securities and the remainder in bonds and other fixed-income
securities. The following is a summary of the fund's significant accounting
policies.
MULTIPLE CLASS -- The fund is authorized to issue the Investor Class, the
Institutional Class and the Advisor Class. The share classes differ principally
in their respective distribution and shareholder servicing expenses and
arrangements. All shares of the fund represent an equal pro rata interest in the
assets of the class to which such shares belong, and have identical voting,
dividend, liquidation and other rights and the same terms and conditions, except
for class specific expenses and exclusive rights to vote on matters affecting
only individual classes. Income, non-class specific expenses, and realized and
unrealized capital gains and losses of the fund are allocated to each class of
shares based on their relative net assets.
SECURITY VALUATIONS -- Securities traded primarily on a principal securities
exchange are valued at the last reported sales price, or at the mean of the
latest bid and asked prices where no last sales price is available. Depending on
local convention or regulation, securities traded over-the-counter are valued at
the mean of the latest bid and asked prices, the last sales price, or the
official close price. Debt securities not traded on a principal securities
exchange are valued through a commercial pricing service or at the mean of the
most recent bid and asked prices. Discount notes may be valued through a
commercial pricing service or at amortized cost, which approximates fair value.
Securities traded on foreign securities exchanges and over-the-counter markets
are normally completed before the close of business on days that the New York
Stock Exchange (the Exchange) is open and may also take place on days when the
Exchange is not open. If an event occurs after the value of a security was
established but before the net asset value per share was determined that was
likely to materially change the net asset value, that security would be valued
at fair value as determined in accordance with procedures adopted by the Board
of Directors. If the fund determines that the market price of a portfolio
security is not readily available, or that the valuation methods mentioned above
do not reflect the security's fair value, such security is valued at its fair
value as determined by, or in accordance with procedures adopted by, the Board
of Directors or its designee if such fair value determination would materially
impact a fund's net asset value. Certain other circumstances may cause the fund
to fair value a security such as: a security has been declared in default;
trading in a security has been halted during the trading day; or there is a
foreign market holiday and no trading will commence.
SECURITY TRANSACTIONS -- Security transactions are accounted for as of the trade
date. Net realized gains and losses are determined on the identified cost basis,
which is also used for federal income tax purposes.
INVESTMENT INCOME -- Dividend income less foreign taxes withheld, if any, is
recorded as of the ex-dividend date. Interest income is recorded on the accrual
basis and includes paydown gain (loss) and accretion of discounts and
amortization of premiums.
SECURITIES ON LOAN -- The fund may lend portfolio securities through its lending
agent to certain approved borrowers in order to earn additional income. The fund
continues to recognize any gain or loss in the market price of the securities
loaned and records any interest earned or dividends declared.
FUTURES CONTRACTS -- The fund may enter into futures contracts in order to
manage the fund's exposure to changes in market conditions. One of the risks of
entering into futures contracts is the possibility that the change in value of
the contract may not correlate with the changes in value of the underlying
securities. Upon entering into a futures contract, the fund is required to
deposit either cash or securities in an amount equal to a certain percentage of
the contract value (initial margin). Subsequent payments (variation margin) are
made or received daily, in cash, by the fund. The variation margin is equal to
the daily change in the contract value and is recorded as unrealized gains and
losses. The fund recognizes a realized gain or loss when the contract is closed
or expires. Net realized and unrealized gains or losses occurring during the
holding period of futures contracts are a component of realized gain (loss) on
futures and swaps transactions and unrealized appreciation (depreciation) on
futures and swaps, respectively.
(continued)
- ------
22
Notes to Financial Statements
OCTOBER 31, 2006 (AMOUNTS IN THOUSANDS)
1. ORGANIZATION AND SUMMARY OF SIGNIFICANT ACCOUNTING POLICIES (CONTINUED)
WHEN-ISSUED AND FORWARD COMMITMENTS -- The fund may engage in securities
transactions on a when-issued or forward commitment basis. Under these
arrangements, the securities' prices and yields are fixed on the date of the
commitment, but payment and delivery are scheduled for a future date. During
this period, securities are subject to market fluctuations. The fund will
segregate cash, cash equivalents or other appropriate liquid securities on its
records in amounts sufficient to meet the purchase price.
SWAP AGREEMENTS -- The fund may enter into a swap agreement in order to attempt
to obtain or preserve a particular return or spread at a lower cost than
obtaining a return or spread through purchases and/or sales of instruments in
other markets; protect against currency fluctuations; attempt to manage duration
to protect against any increase in the price of securities the fund anticipates
purchasing at a later date; or gain exposure to certain markets in the most
economical way possible. A basic swap agreement is a contract in which two
parties agree to exchange the returns earned or realized on predetermined
investments or instruments. Credit default swaps enable an investor to buy/sell
protection against a credit event of a specific issuer. The seller of credit
protection against a security or basket of securities receives an up-front or
periodic payment to compensate against potential default events. The fund may
enhance returns by selling protection or attempt to mitigate credit risk by
buying protection. The fund will segregate cash, cash equivalents or other
appropriate liquid securities on its records in amounts sufficient to meet
requirements. Unrealized gains are reported as an asset and unrealized losses
are reported as a liability on the Statement of Assets and Liabilities. Swap
agreements are valued daily and changes in value, including the periodic amounts
of interest to be paid or received on swaps, are recorded as unrealized
appreciation (depreciation) on futures and swaps. Realized gain or loss is
recorded upon receipt or payment of a periodic settlement or termination of swap
agreements. The risks of entering into swap agreements include the possible lack
of liquidity, failure of the counterparty to meet its obligations, and that
there may be unfavorable changes in the underlying investments and instruments.
REPURCHASE AGREEMENTS -- The fund may enter into repurchase agreements with
institutions that American Century Investment Management, Inc. (ACIM) (the
investment advisor) has determined are creditworthy pursuant to criteria adopted
by the Board of Directors. Each repurchase agreement is recorded at cost. The
fund requires that the collateral, represented by securities, received in a
repurchase transaction be transferred to the custodian in a manner sufficient to
enable the fund to obtain those securities in the event of a default under the
repurchase agreement. ACIM monitors, on a daily basis, the securities
transferred to ensure the value, including accrued interest, of the securities
under each repurchase agreement is equal to or greater than amounts owed to the
fund under each repurchase agreement.
JOINT TRADING ACCOUNT -- Pursuant to an Exemptive Order issued by the Securities
and Exchange Commission, the fund, along with other registered investment
companies having management agreements with ACIM or American Century Global
Investment Management, Inc. (ACGIM), may transfer uninvested cash balances into
a joint trading account. These balances are invested in one or more repurchase
agreements that are collateralized by U.S. Treasury or Agency obligations.
INCOME TAX STATUS -- It is the fund's policy to distribute substantially all net
investment income and net realized gains to shareholders and to otherwise
qualify as a regulated investment company under provisions of the Internal
Revenue Code. Accordingly, no provision has been made for federal or state
income taxes.
DISTRIBUTIONS TO SHAREHOLDERS -- Distributions to shareholders are recorded on
the ex-dividend date. Distributions from net investment income are declared and
paid quarterly. Distributions from net realized gains, if any, are generally
declared and paid annually.
INDEMNIFICATIONS -- Under the corporation's organizational documents, its
officers and directors are indemnified against certain liabilities arising out
of the performance of their duties to the fund. In addition, in the normal
course of business, the fund enters into contracts that provide general
indemnifications. The fund's maximum exposure under these arrangements is
unknown as this would involve future claims that may be made against the fund.
The risk of material loss from such claims is considered by management to be
remote.
USE OF ESTIMATES -- The financial statements are prepared in conformity with
accounting principles generally accepted in the United States of America, which
may require management to make certain estimates and assumptions at the date of
the financial statements. Actual results could differ from these estimates.
(continued)
- ------
23
Notes to Financial Statements
OCTOBER 31, 2006 (AMOUNTS IN THOUSANDS)
2. FEES AND TRANSACTIONS WITH RELATED PARTIES
MANAGEMENT FEES -- The corporation has entered into a Management Agreement with
ACIM, under which ACIM provides the fund with investment advisory and management
services in exchange for a single, unified management fee (the fee) per class.
The Agreement provides that all expenses of the fund, except brokerage
commissions, taxes, interest, fees and expenses of those directors who are not
considered "interested persons" as defined in the 1940 Act (including counsel
fees) and extraordinary expenses, will be paid by ACIM. The fee is computed and
accrued daily based on the daily net assets of the specific class of shares of
the fund and paid monthly in arrears. For funds with a stepped fee schedule, the
rate of the fee is determined by applying a fee rate calculation formula. This
formula takes into account all of the investment advisor's assets under
management in the fund's investment strategy (strategy assets) to calculate the
appropriate fee rate for the fund. The strategy assets include the fund's assets
and the assets of other clients of the investment advisor that are not in the
American Century family of funds, but that have the same investment team and
investment strategy.
The annual management fee schedule for each class of the fund is as follows:
INVESTOR INSTITUTIONAL ADVISOR
- --------------------------------------------------------------------------------
STRATEGY ASSETS
- --------------------------------------------------------------------------------
First $1 billion 0.90% 0.70% 0.65%
- --------------------------------------------------------------------------------
Over $1 billion 0.80% 0.60% 0.55%
- --------------------------------------------------------------------------------
The effective annual management fee for each class of the fund for the year
ended October 31, 2006 was 0.90%, 0.70% and 0.65%, for the Investor Class,
Institutional Class and Advisor Class, respectively.
DISTRIBUTION AND SERVICE FEES -- The Board of Directors has adopted a Master
Distribution and Shareholder Services Plan (the plan) for the Advisor Class,
pursuant to Rule 12b-1 of the 1940 Act. The plan provides that the Advisor Class
will pay American Century Investment Services, Inc. (ACIS) an annual
distribution fee equal to 0.25% and an annual service fee equal to 0.25%. The
fees are computed and accrued daily based on the Advisor Class's daily net
assets and paid monthly in arrears. The distribution fee provides compensation
for expenses incurred by financial intermediaries in connection with
distributing shares of the Advisor Class including, but not limited to, payments
to brokers, dealers, and financial institutions that have entered into sales
agreements with respect to shares of the fund. The service fee provides
compensation for shareholder and administrative services rendered by ACIS, its
affiliates or independent third party providers. Fees incurred under the plan
during the year ended October 31, 2006, are detailed in the Statement of
Operations.
RELATED PARTIES -- Certain officers and directors of the corporation are also
officers and/or directors, and, as a group, controlling stockholders of American
Century Companies, Inc. (ACC), the parent of the corporation's investment
advisor, ACIM, the distributor of the corporation, ACIS, and the corporation's
transfer agent, American Century Services, LLC.
The fund has a bank line of credit agreement and securities lending agreement
with JPMorgan Chase Bank (JPMCB). JPMCB is a custodian of the fund and a wholly
owned subsidiary of JPMorgan Chase & Co. (JPM). JPM is an equity investor in
ACC.
3. INVESTMENT TRANSACTIONS
Purchases of investment securities, excluding short-term investments, for the
year ended October 31, 2006, totaled $1,241,785, of which $744,450 represented
U.S. Treasury and Agency obligations. Sales of investment securities, excluding
short-term investments, for the year ended October 31, 2006, totaled $1,282,568,
of which $740,679 represented U.S. Treasury and Agency obligations.
(continued)
- ------
24
Notes to Financial Statements
OCTOBER 31, 2006 (AMOUNTS IN THOUSANDS)
4. CAPITAL SHARE TRANSACTIONS
Transactions in shares of the fund were as follows:
- --------------------------------------------------------------------------------
SHARES AMOUNT
- --------------------------------------------------------------------------------
INVESTOR CLASS
- --------------------------------------------------------------------------------
YEAR ENDED OCTOBER 31, 2006
SHARES AUTHORIZED 200,000
================================================================================
Sold 3,907 $ 64,285
- -------------------------------------------
Issued in reinvestment of distributions 2,763 44,897
- -------------------------------------------
Redeemed (6,476) (106,216)
- --------------------------------------------------------------------------------
Net increase (decrease) 194 $ 2,966
================================================================================
YEAR ENDED OCTOBER 31, 2005
SHARES AUTHORIZED 200,000
================================================================================
Sold 4,551 $ 75,084
- -------------------------------------------
Issued in reinvestment of distributions 647 10,748
- -------------------------------------------
Redeemed (5,845) (96,478)
- --------------------------------------------------------------------------------
Net increase (decrease) (647) $(10,646)
================================================================================
INSTITUTIONAL CLASS
- --------------------------------------------------------------------------------
YEAR ENDED OCTOBER 31, 2006
SHARES AUTHORIZED 15,000
================================================================================
Sold 14 $ 238
- -------------------------------------------
Issued in reinvestment of distributions 6 94
- -------------------------------------------
Redeemed (23) (381)
- --------------------------------------------------------------------------------
Net increase (decrease) (3) $ (49)
================================================================================
YEAR ENDED OCTOBER 31, 2005
SHARES AUTHORIZED 15,000
================================================================================
Sold 64 $1,052
- -------------------------------------------
Issued in reinvestment of distributions 1 14
- -------------------------------------------
Redeemed (4) (68)
- --------------------------------------------------------------------------------
Net increase (decrease) 61 $ 998
================================================================================
ADVISOR CLASS
- --------------------------------------------------------------------------------
YEAR ENDED OCTOBER 31, 2006
SHARES AUTHORIZED 50,000
================================================================================
Sold 303 $ 4,964
- -------------------------------------------
Issued in reinvestment of distributions 62 1,004
- -------------------------------------------
Redeemed (412) (6,764)
- --------------------------------------------------------------------------------
Net increase (decrease) (47) $ (796)
================================================================================
YEAR ENDED OCTOBER 31, 2005
SHARES AUTHORIZED 50,000
================================================================================
Sold 316 $ 5,224
- -------------------------------------------
Issued in reinvestment of distributions 13 224
- -------------------------------------------
Redeemed (395) (6,483)
- --------------------------------------------------------------------------------
Net increase (decrease) (66) $(1,035)
================================================================================
(continued)
- ------
25
Notes to Financial Statements
OCTOBER 31, 2006 (AMOUNTS IN THOUSANDS)
5. SECURITIES LENDING
As of October 31, 2006, securities in the fund valued at $54,040, were on loan
through the lending agent, JPMCB, to certain approved borrowers. JPMCB receives
and maintains collateral in the form of cash and/or acceptable securities as
approved by ACIM. Cash collateral is invested in authorized investments by the
lending agent in a pooled account. The value of cash collateral received at
period end is disclosed in the Statement of Assets and Liabilities and
investments made with the cash by the lending agent are listed in the Schedule
of Investments. Any deficiencies or excess of collateral must be delivered or
transferred by the member firms no later than the close of business on the next
business day. The total value of all collateral received, at this date, was
$55,084. The fund's risks in securities lending are that the borrower may not
provide additional collateral when required or return the securities when due.
If the borrower defaults, receipt of the collateral by the fund may be delayed
or limited.
6. BANK LINE OF CREDIT
The fund, along with certain other funds managed by ACIM or ACGIM, has a $500
million unsecured bank line of credit agreement with JPMCB. The fund may borrow
money for temporary or emergency purposes to fund shareholder redemptions.
Borrowings under the agreement bear interest at the Federal Funds rate plus
0.50%. The fund did not borrow from the line during the year ended October 31,
2006.
7. FEDERAL TAX INFORMATION
The tax character of distributions paid during the years ended October 31, 2006
and October 31, 2005 were as follows:
- --------------------------------------------------------------------------------
2006 2005
- --------------------------------------------------------------------------------
DISTRIBUTIONS PAID FROM
- --------------------------------------------------------------------------------
Ordinary income $16,917 $11,354
- --------------------------------------------------------------------------------
Long-term capital gains $30,576 --
- --------------------------------------------------------------------------------
The book-basis character of distributions made during the year from net
investment income or net realized gains may differ from their ultimate
characterization for federal income tax purposes. These differences reflect the
differing character of paydown losses, interest on swap agreements, certain
income items and net realized gains and losses for financial statement and tax
purposes, and may result in reclassification among certain capital accounts on
the financial statements.
As of October 31, 2006, the components of distributable earnings on a tax-basis
and the federal tax cost of investments were as follows:
- --------------------------------------------------------------------------------
Federal tax cost of investments $679,156
================================================================================
Gross tax appreciation of investments $68,108
- --------------------------------------------------------------
Gross tax depreciation of investments (3,618)
- --------------------------------------------------------------------------------
Net tax appreciation (depreciation) of investments $64,490
================================================================================
Net tax appreciation (depreciation) on derivatives and
translation of assets and liabilities in foreign currencies (688)
- --------------------------------------------------------------------------------
Net tax appreciation (depreciation) $63,802
================================================================================
Undistributed ordinary income $2,339
- --------------------------------------------------------------
Accumulated long-term gains $24,539
- --------------------------------------------------------------------------------
The difference between book-basis and tax-basis cost and unrealized appreciation
(depreciation) is attributable primarily to the tax deferral of losses on wash
sales and the realization for tax purposes of unrealized gains on certain
futures contracts.
(continued)
- ------
26
Notes to Financial Statements
OCTOBER 31, 2006 (AMOUNTS IN THOUSANDS)
8. RECENTLY ISSUED ACCOUNTING STANDARDS
In June 2006, the Financial Accounting Standards Board (FASB) issued
Interpretation No. 48, "Accounting for Uncertainty in Income Taxes -- an
Interpretation of FASB Statement No. 109" (FIN 48). FIN 48 establishes a minimum
threshold for financial statement recognition of the benefit of positions taken
in filing tax returns (including whether an entity is taxable in a particular
jurisdiction), and requires certain expanded tax disclosures. FIN 48 is
effective for fiscal years beginning after December 15, 2006, and is to be
applied to all open tax years as of the date of effectiveness. The FASB issued
Statement of Financial Accounting Standards No. 157, "Fair Value Measurements"
(FAS 157), in September 2006, which is effective for fiscal years beginning
after November 15, 2007. FAS 157 defines fair value, establishes a framework for
measuring fair value and expands the required financial statement disclosures
about fair value measurements. Management is currently evaluating the impact of
adopting FIN 48 and FAS 157.
9. OTHER TAX INFORMATION (UNAUDITED) ($ IN FULL)
The following information is provided pursuant to provisions of the Internal
Revenue Code.
The fund hereby designates $5,724,448 of qualified dividend income for the
fiscal year ended October 31, 2006.
The fund hereby designates $30,575,882 of long-term capital gains distributions
for the fiscal year ended October 31, 2006.
For corporate taxpayers, ordinary income distributions paid during the fiscal
year ended October 31, 2006, of $10,236,464 qualify for the corporate dividends
received deduction.
The fund designates $3,176,170 of distributions as qualified short-term capital
gains for purposes of Internal Revenue Code Section 871.
- ------
27
Balanced - Financial Highlights
FOR A SHARE OUTSTANDING THROUGHOUT THE YEARS ENDED OCTOBER 31
- --------------------------------------------------------------------------------
INVESTOR CLASS
- --------------------------------------------------------------------------------
2006 2005 2004 2003 2002
- --------------------------------------------------------------------------------
PER-SHARE DATA
- --------------------------------------------------------------------------------
Net Asset Value,
Beginning of Period $16.52 $15.73 $14.77 $12.98 $14.28
- --------------------------------------------------------------------------------
Income From
Investment Operations
- -------------------------
Net Investment
Income (Loss)(1) 0.35 0.31 0.26 0.27 0.35
- -------------------------
Net Realized and
Unrealized Gain (Loss) 1.40 0.77 0.98 1.77 (1.30)
- --------------------------------------------------------------------------------
Total From
Investment Operations 1.75 1.08 1.24 2.04 (0.95)
- --------------------------------------------------------------------------------
Distributions
- -------------------------
From Net
Investment Income (0.35) (0.29) (0.28) (0.25) (0.35)
- -------------------------
From Net
Realized Gains (0.89) -- -- -- --
- --------------------------------------------------------------------------------
Total Distributions (1.24) (0.29) (0.28) (0.25) (0.35)
- --------------------------------------------------------------------------------
Net Asset Value,
End of Period $17.03 $16.52 $15.73 $14.77 $12.98
================================================================================
TOTAL RETURN(2) 11.04% 6.89% 8.46% 15.92% (6.80)%
RATIOS/SUPPLEMENTAL DATA
- --------------------------------------------------------------------------------
Ratio of Operating
Expenses to Average
Net Assets 0.90% 0.90% 0.90% 0.90% 0.90%
- -------------------------
Ratio of Net Investment
Income (Loss) to
Average Net Assets 2.13% 1.89% 1.65% 1.96% 2.46%
- -------------------------
Portfolio Turnover Rate 197% 206% 204% 133% 108%
- -------------------------
Net Assets, End of Period
(in millions) $637 $615 $595 $583 $541
- --------------------------------------------------------------------------------
(1) Computed using average shares outstanding throughout the period.
(2) Total return assumes reinvestment of net investment income and capital gains
distributions, if any. The total return of the classes may not precisely
reflect the class expense differences because of the impact of calculating
the net asset values to two decimal places. If net asset values were
calculated to three decimal places, the total return differences would more
closely reflect the class expense differences. The calculation of net asset
values to two decimal places is made in accordance with SEC guidelines and
does not result in any gain or loss of value between one class and another.
See Notes to Financial Statements.
- ------
28
Balanced - Financial Highlights
FOR A SHARE OUTSTANDING THROUGHOUT THE YEARS ENDED OCTOBER 31
- --------------------------------------------------------------------------------
INSTITUTIONAL CLASS
- --------------------------------------------------------------------------------
2006 2005 2004 2003 2002
- --------------------------------------------------------------------------------
PER-SHARE DATA
- --------------------------------------------------------------------------------
Net Asset Value,
Beginning of Period $16.53 $15.73 $14.78 $12.99 $14.28
- --------------------------------------------------------------------------------
Income From
Investment Operations
- -------------------------
Net Investment
Income (Loss)(1) 0.38 0.33 0.28 0.41 0.37
- -------------------------
Net Realized and
Unrealized Gain (Loss) 1.40 0.80 0.98 1.66 (1.29)
- --------------------------------------------------------------------------------
Total From
Investment Operations 1.78 1.13 1.26 2.07 (0.92)
- --------------------------------------------------------------------------------
Distributions
- -------------------------
From Net
Investment Income (0.38) (0.33) (0.31) (0.28) (0.37)
- -------------------------
From Net
Realized Gains (0.89) -- -- -- --
- --------------------------------------------------------------------------------
Total Distributions (1.27) (0.33) (0.31) (0.28) (0.37)
- --------------------------------------------------------------------------------
Net Asset Value,
End of Period $17.04 $16.53 $15.73 $14.78 $12.99
================================================================================
TOTAL RETURN(2) 11.26% 7.17% 8.61% 16.13% (6.54)%
RATIOS/SUPPLEMENTAL DATA
- --------------------------------------------------------------------------------
Ratio of Operating
Expenses to Average
Net Assets 0.70% 0.70% 0.70% 0.70% 0.70%
- -------------------------
Ratio of Net Investment
Income (Loss) to
Average Net Assets 2.33% 2.09% 1.85% 2.16% 2.66%
- -------------------------
Portfolio Turnover Rate 197% 206% 204% 133% 108%
- -------------------------
Net Assets, End of Period
(in thousands) $1,228 $1,237 $225 $155 $16,245
- --------------------------------------------------------------------------------
(1) Computed using average shares outstanding throughout the period.
(2) Total return assumes reinvestment of net investment income and capital gains
distributions, if any. The total return of the classes may not precisely
reflect the class expense differences because of the impact of calculating
the net asset values to two decimal places. If net asset values were
calculated to three decimal places, the total return differences would more
closely reflect the class expense differences. The calculation of net asset
values to two decimal places is made in accordance with SEC guidelines and
does not result in any gain or loss of value between one class and another.
See Notes to Financial Statements.
- ------
29
Balanced - Financial Highlights
FOR A SHARE OUTSTANDING THROUGHOUT THE YEARS ENDED OCTOBER 31
- --------------------------------------------------------------------------------
ADVISOR CLASS
- --------------------------------------------------------------------------------
2006 2005 2004 2003 2002
- --------------------------------------------------------------------------------
PER-SHARE DATA
- --------------------------------------------------------------------------------
Net Asset Value,
Beginning of Period $16.52 $15.72 $14.77 $12.97 $14.27
- --------------------------------------------------------------------------------
Income From
Investment Operations
- -------------------------
Net Investment
Income (Loss)(1) 0.31 0.27 0.22 0.22 0.31
- -------------------------
Net Realized and
Unrealized Gain (Loss) 1.39 0.78 0.97 1.80 (1.30)
- --------------------------------------------------------------------------------
Total From
Investment Operations 1.70 1.05 1.19 2.02 (0.99)
- --------------------------------------------------------------------------------
Distributions
- -------------------------
From Net
Investment Income (0.31) (0.25) (0.24) (0.22) (0.31)
- -------------------------
From Net
Realized Gains (0.89) -- -- -- --
- --------------------------------------------------------------------------------
Total Distributions (1.20) (0.25) (0.24) (0.22) (0.31)
- --------------------------------------------------------------------------------
Net Asset Value,
End of Period $17.02 $16.52 $15.72 $14.77 $12.97
================================================================================
TOTAL RETURN(2) 10.71% 6.70% 8.11% 15.74% (7.04)%
RATIOS/SUPPLEMENTAL DATA
- --------------------------------------------------------------------------------
Ratio of Operating
Expenses to Average
Net Assets 1.15% 1.15% 1.15% 1.15% 1.15%
- -------------------------
Ratio of Net Investment
Income (Loss) to
Average Net Assets 1.88% 1.64% 1.40% 1.71% 2.21%
- -------------------------
Portfolio Turnover Rate 197% 206% 204% 133% 108%
- -------------------------
Net Assets, End of Period
(in thousands) $15,889 $16,189 $16,439 $17,482 $13,985
- --------------------------------------------------------------------------------
(1) Computed using average shares outstanding throughout the period.
(2) Total return assumes reinvestment of net investment income and capital gains
distributions, if any. The total return of the classes may not precisely
reflect the class expense differences because of the impact of calculating
the net asset values to two decimal places. If net asset values were
calculated to three decimal places, the total return differences would more
closely reflect the class expense differences. The calculation of net asset
values to two decimal places is made in accordance with SEC guidelines and
does not result in any gain or loss of value between one class and another.
See Notes to Financial Statements.
- ------
30
Report of Independent Registered Public Accounting Firm
The Board of Directors and Shareholders, American Century Mutual Funds, Inc.:
We have audited the accompanying statement of assets and liabilities, including
the schedule of investments, of Balanced Fund, (the "Fund"), one of the mutual
funds comprising American Century Mutual Funds, Inc., as of October 31, 2006,
and the related statement of operations for the year then ended, the statements
of changes in net assets for each of the two years in the period then ended, and
the financial highlights for each of the five years in the period then ended.
These financial statements and financial highlights are the responsibility of
the Fund's management. Our responsibility is to express an opinion on these
financial statements and financial highlights based on our audits.
We conducted our audits in accordance with the standards of the Public Company
Accounting Oversight Board (United States). Those standards require that we plan
and perform the audit to obtain reasonable assurance about whether the financial
statements and financial highlights are free of material misstatement. The Fund
is not required to have, nor were we engaged to perform, an audit of its
internal control over financial reporting. Our audits included consideration of
internal control over financial reporting as a basis for designing audit
procedures that are appropriate in the circumstances, but not for the purpose of
expressing an opinion on the effectiveness of the Fund's internal control over
financial reporting. Accordingly, we express no such opinion. An audit also
includes examining, on a test basis, evidence supporting the amounts and
disclosures in the financial statements, assessing the accounting principles
used and significant estimates made by management, as well as evaluating the
overall financial statement presentation. Our procedures included confirmation
of securities owned as of October 31, 2006, by correspondence with the custodian
and brokers; where replies were not received from brokers, we performed other
auditing procedures. We believe that our audits provide a reasonable basis for
our opinion.
In our opinion, the financial statements and financial highlights referred to
above present fairly, in all material respects, the financial position of
Balanced Fund as of October 31, 2006, the results of its operations for the year
then ended, the changes in its net assets for each of the two years in the
period then ended, and the financial highlights for each of the five years in
the period then ended, in conformity with accounting principles generally
accepted in the United States of America.
Deloitte & Touche LLP
Kansas City, Missouri
December 14, 2006
- ------
31
Management
The individuals listed below serve as directors or officers of the fund. Each
director serves until his or her successor is duly elected and qualified or
until he or she retires. Mandatory retirement age for independent directors is
72. Those listed as interested directors are "interested" primarily by virtue of
their engagement as officers of American Century Companies, Inc. (ACC) or its
wholly owned, direct or indirect, subsidiaries, including the fund's investment
advisor, American Century Investment Management, Inc. (ACIM); the fund's
principal underwriter, American Century Investment Services, Inc. (ACIS); and
the fund's transfer agent, American Century Services, LLC (ACS).
The other directors (more than three-fourths of the total number) are
independent; that is, they have never been employees or officers of, and have no
financial interest in, ACC or any of its wholly owned subsidiaries, including
ACIM, ACIS, and ACS. The directors serve in this capacity for seven registered
investment companies in the American Century family of funds.
All persons named as officers of the fund also serve in a similar capacity for
the other 14 investment companies advised by ACIM or American Century Global
Investment Management, Inc. (ACGIM), unless otherwise noted. Only officers with
policy-making functions are listed. No officer is compensated for his or her
service as an officer of the fund. The listed officers are interested persons of
the fund and are appointed or re-appointed on an annual basis.
INDEPENDENT DIRECTORS
- --------------------------------------------------------------------------------
THOMAS A. BROWN, 4500 Main Street, Kansas City, MO 64111
YEAR OF BIRTH: 1940
POSITION(S) HELD WITH FUND: Director
FIRST YEAR OF SERVICE: 1980
PRINCIPAL OCCUPATION(S) DURING PAST 5 YEARS: Retired, Formerly Chief Executive
Officer/Treasurer, Associated Bearings Company
NUMBER OF PORTFOLIOS IN FUND COMPLEX OVERSEEN BY DIRECTOR: 66
OTHER DIRECTORSHIPS HELD BY DIRECTOR: None
- --------------------------------------------------------------------------------
ANDREA C. HALL, Ph.D., 4500 Main Street, Kansas City, MO 64111
YEAR OF BIRTH: 1945
POSITION(S) HELD WITH FUND: Director
FIRST YEAR OF SERVICE: 1997
PRINCIPAL OCCUPATION(S) DURING PAST 5 YEARS: Senior Vice President, Midwest
Research Institute
NUMBER OF PORTFOLIOS IN FUND COMPLEX OVERSEEN BY DIRECTOR: 66
OTHER DIRECTORSHIPS HELD BY DIRECTOR: None
- --------------------------------------------------------------------------------
D.D. (DEL) HOCK, 4500 Main Street, Kansas City, MO 64111
YEAR OF BIRTH: 1935
POSITION(S) HELD WITH FUND: Director
FIRST YEAR OF SERVICE: 1996
PRINCIPAL OCCUPATION(S) DURING PAST 5 YEARS: Retired, formerly Chairman, Public
Service Company of Colorado
NUMBER OF PORTFOLIOS IN FUND COMPLEX OVERSEEN BY DIRECTOR: 66
OTHER DIRECTORSHIPS HELD BY DIRECTOR: Director, Allied Motion Technologies, Inc
- --------------------------------------------------------------------------------
JAMES A. OLSON, 4500 Main Street, Kansas City, MO 64111
YEAR OF BIRTH: 1942
POSITION(S) HELD WITH FUND: Advisory Board Member
FIRST YEAR OF SERVICE: 2006
PRINCIPAL OCCUPATION(S) DURING PAST 5 YEARS: Principal, Plaza Belmont LLC; Chief
Financial Officer, Plaza Belmont LLC (September 1999 to July 2006)
NUMBER OF PORTFOLIOS IN FUND COMPLEX OVERSEEN BY DIRECTOR: 66
OTHER DIRECTORSHIPS HELD BY DIRECTOR: Director, Saia, Inc. and Entertainment
Properties Trust
- --------------------------------------------------------------------------------
(continued)
- ------
32
Management
INDEPENDENT DIRECTORS (CONTINUED)
- --------------------------------------------------------------------------------
DONALD H. PRATT, 4500 Main Street, Kansas City, MO 64111
YEAR OF BIRTH: 1937
POSITION(S) HELD WITH FUND: Director, Chairman of the Board
FIRST YEAR OF SERVICE: 1995
PRINCIPAL OCCUPATION(S) DURING PAST 5 YEARS: Chairman, Western Investments,
Inc.; Retired Chairman of the Board, Butler Manufacturing Company
NUMBER OF PORTFOLIOS IN FUND COMPLEX OVERSEEN BY DIRECTOR: 66
OTHER DIRECTORSHIPS HELD BY DIRECTOR: None
- --------------------------------------------------------------------------------
GALE E. SAYERS, 4500 Main Street, Kansas City, MO 64111
YEAR OF BIRTH: 1943
POSITION(S) HELD WITH FUND: Director
FIRST YEAR OF SERVICE: 2000
PRINCIPAL OCCUPATION(S) DURING PAST 5 YEARS: President, Chief Executive Officer
and Founder, Sayers40, Inc., a technology products and service provider
NUMBER OF PORTFOLIOS IN FUND COMPLEX OVERSEEN BY DIRECTOR: 66
OTHER DIRECTORSHIPS HELD BY DIRECTOR: Director, Triad Hospitals, Inc.
- --------------------------------------------------------------------------------
M. JEANNINE STRANDJORD, 4500 Main Street, Kansas City, MO 64111
YEAR OF BIRTH: 1945
POSITION(S) HELD WITH FUND: Director
FIRST YEAR OF SERVICE: 1994
PRINCIPAL OCCUPATION(S) DURING PAST 5 YEARS: Retired, formerly Senior Vice
President, Sprint Corporation
NUMBER OF PORTFOLIOS IN FUND COMPLEX OVERSEEN BY DIRECTOR: 66
OTHER DIRECTORSHIPS HELD BY DIRECTOR: Director, DST Systems, Inc.; Director,
Euronet Worldwide, Inc.
- --------------------------------------------------------------------------------
TIMOTHY S. WEBSTER, 4500 Main Street, Kansas City, MO 64111
YEAR OF BIRTH: 1961
POSITION(S) HELD WITH FUND: Director
FIRST YEAR OF SERVICE: 2001
PRINCIPAL OCCUPATION(S) DURING PAST 5 YEARS: President and Chief Executive
Officer, American Italian Pasta Company (1992 to December 2005)
NUMBER OF PORTFOLIOS IN FUND COMPLEX OVERSEEN BY DIRECTOR: 66
OTHER DIRECTORSHIPS HELD BY DIRECTOR: None
- --------------------------------------------------------------------------------
INTERESTED DIRECTORS
- --------------------------------------------------------------------------------
JAMES E. STOWERS, JR.(1), 4500 Main Street, Kansas City, MO 64111
YEAR OF BIRTH: 1924
POSITION(S) HELD WITH FUND: Director, Co-Vice Chairman
FIRST YEAR OF SERVICE: 1958
PRINCIPAL OCCUPATION(S) DURING PAST 5 YEARS: Founder, Director and Controlling
Shareholder, ACC; Chairman, ACC (January 1995 to December 2004); Director, ACIM,
ACGIM, ACS, ACIS and other ACC subsidiaries
NUMBER OF PORTFOLIOS IN FUND COMPLEX OVERSEEN BY DIRECTOR: 66
OTHER DIRECTORSHIPS HELD BY DIRECTOR: None
- --------------------------------------------------------------------------------
JAMES E. STOWERS III(1), 4500 Main Street, Kansas City, MO 64111
YEAR OF BIRTH: 1959
POSITION(S) HELD WITH FUND: Director, Co-Vice Chairman
FIRST YEAR OF SERVICE: 1990
PRINCIPAL OCCUPATION(S) DURING PAST 5 YEARS: Chairman, ACC (January 2005 to
present); Co-Chairman, ACC (September 2000 to December 2004); Chairman, ACS and
other ACC subsidiaries (April 2005 to September 2006); Director, ACC, ACIM,
ACGIM, ACS, ACIS and other ACC subsidiaries
NUMBER OF PORTFOLIOS IN FUND COMPLEX OVERSEEN BY DIRECTOR: 66
OTHER DIRECTORSHIPS HELD BY DIRECTOR: None
- --------------------------------------------------------------------------------
(1) James E. Stowers, Jr. is the father of James E. Stowers III.
(continued)
- ------
33
Management
OFFICERS
- --------------------------------------------------------------------------------
WILLIAM M. LYONS, 4500 Main Street, Kansas City, MO 64111
YEAR OF BIRTH: 1955
POSITION(S) HELD WITH FUND: President
FIRST YEAR OF SERVICE: 2000
PRINCIPAL OCCUPATION(S) DURING PAST 5 YEARS: Chief Executive Officer, ACC
(September 2000 to present); President, ACC (June 1997 to present); Also serves
as: Chairman, ACIM, ACGIM, ACS, ACIS and other ACC subsidiaries; Chief Executive
Officer, ACIM, ACGIM, ACIS and other ACC subsidiaries (October 2000 to October
2006); President, ACIM, ACGIM and other ACC subsidiaries (September 2002 to
September 2006); Executive Vice President, ACS (January 2005 to September 2006);
Director, ACC, ACIM, ACGIM, ACS, ACIS and other ACC subsidiaries
- --------------------------------------------------------------------------------
JONATHAN THOMAS, 4500 Main Street, Kansas City, MO 64111
YEAR OF BIRTH: 1963
POSITION(S) HELD WITH FUND: Executive Vice President
FIRST YEAR OF SERVICE: 2005
PRINCIPAL OCCUPATION(S) DURING PAST 5 YEARS: Chief Administrative Officer, ACC
(February 2006 to present); Executive Vice President, ACC (November 2005 to
present); Also serves as: President and Chief Executive Officer, ACS; Chief
Financial Officer and Chief Accounting Officer, ACIM, ACGIM, ACS, ACIS and other
ACC subsidiaries; Managing Director, Morgan Stanley (March 2000 to November
2005)
- --------------------------------------------------------------------------------
MARYANNE ROEPKE, 4500 Main Street, Kansas City, MO 64111
YEAR OF BIRTH: 1956
POSITION(S) HELD WITH FUND: Chief Compliance Officer and Senior Vice President
FIRST YEAR OF SERVICE: 2000
PRINCIPAL OCCUPATION(S) DURING PAST 5 YEARS: Chief Compliance Officer, ACIM,
ACGIM and ACS (August 2006 to present); Assistant Treasurer, ACC (January 1995
to August 2006); Treasurer and Chief Financial Officer, various American Century
funds (July 2000 to August 2006); Also serves as: Senior Vice President, ACS
- --------------------------------------------------------------------------------
DAVID C. TUCKER, 4500 Main Street, Kansas City, MO 64111
YEAR OF BIRTH: 1958
POSITION(S) HELD WITH FUND: Senior Vice President and General Counsel
FIRST YEAR OF SERVICE: 2000
PRINCIPAL OCCUPATION(S) DURING PAST 5 YEARS: Vice President, ACC (February 2001
to present); General Counsel, ACC (June 1998 to present); Also serves as: Senior
Vice President and General Counsel, ACIM, ACGIM, ACS, ACIS and other ACC
subsidiaries
- --------------------------------------------------------------------------------
ROBERT LEACH, 4500 Main Street, Kansas City, MO 64111
YEAR OF BIRTH: 1966
POSITION(S) HELD WITH FUND: Vice President, Treasurer and Chief Financial
Officer
FIRST YEAR OF SERVICE: 1997
PRINCIPAL OCCUPATION(S) DURING PAST 5 YEARS: Vice President, ACS (February 2000
to present); Controller, various American Century funds (June 1997 to September
2006)
- --------------------------------------------------------------------------------
C. JEAN WADE, 4500 Main Street, Kansas City, MO 64111
YEAR OF BIRTH: 1964
POSITION(S) HELD WITH FUNDS: Controller
FIRST YEAR OF SERVICE: 2006
PRINCIPAL OCCUPATION(S) DURING PAST 5 YEARS: Vice President, ACS (February 2000
to present)
- --------------------------------------------------------------------------------
JON ZINDEL, 4500 Main Street, Kansas City, MO 64111
YEAR OF BIRTH: 1967
POSITION(S) HELD WITH FUND: Tax Officer
FIRST YEAR OF SERVICE: 1997
PRINCIPAL OCCUPATION(S) DURING PAST 5 YEARS: Senior Vice President, ACC (August
2006 to present); Vice President, ACC and certain ACC subsidiaries (October 2001
to August 2006); Vice President, Corporate Tax, ACS (April 1998 to August 2006);
Also serves as: Senior Vice President, ACIM, ACGIM, ACS, ACIS and other ACC
subsidiaries
- --------------------------------------------------------------------------------
The SAI has additional information about the fund's directors and is available
without charge, upon request, by calling 1-800-345-2021.
- ------
34
Approval of Management Agreement for Balanced
Under Section 15(c) of the Investment Company Act, contracts for investment
advisory services are required to be reviewed, evaluated and approved by a
majority of a fund's independent directors or trustees (the "Directors") each
year. At American Century, this process is referred to as the "15(c) Process."
As a part of this process, the board reviews fund performance, shareholder
services, audit and compliance information, and a variety of other reports from
the advisor concerning fund operations. In addition to this annual review, the
board of directors oversees and evaluates on a continuous basis at its quarterly
meetings the nature and quality of significant services performed by the
advisor, fund performance, audit and compliance information, and a variety of
other reports relating to fund operations. The board, or committees of the
board, also holds special meetings as needed.
Under a Securities and Exchange Commission rule, each fund is required to
disclose in its annual or semiannual report, as appropriate, the material
factors and conclusions that formed the basis for the board's approval or
renewal of any advisory agreements within the fund's most recently completed
fiscal half-year period.
ANNUAL CONTRACT REVIEW PROCESS
As part of the annual 15(c) Process undertaken during the most recent fiscal
half-year period, the Directors reviewed extensive data and information compiled
by the advisor and certain independent providers of evaluative data (the "15(c)
Providers") concerning Balanced (the "fund") and the services provided to the
fund under the management agreement. The information considered and the
discussions held at the meetings included, but were not limited to:
* the nature, extent and quality of investment management, shareholder services
and other services provided to the fund under the management agreement;
* reports on the advisor's activities relating to the wide range of programs and
services the advisor provides to the fund and its shareholders on a routine
and non-routine basis;
* data comparing the cost of owning the fund to the cost of owning a similar
fund;
* data comparing the fund's performance to appropriate benchmarks and/or a peer
group of other mutual funds with similar investment objectives and strategies;
* financial data showing the profitability of the fund to the advisor and the
overall profitability of the advisor; and
* data comparing services provided and charges to other investment management
clients of the advisor.
In keeping with its practice, the fund's board of directors held two regularly
scheduled meetings and one special meeting to review and discuss the information
provided by the advisor and to complete its negotiations with the advisor
regarding the renewal of the management agreement, including the setting of the
applicable advisory fee. The board also had the benefit of the advice of its
independent counsel throughout the period.
(continued)
- ------
35
Approval of Management Agreement for Balanced
FACTORS CONSIDERED
The Directors considered all of the information provided by the advisor, the
15(c) Providers, and the board's independent counsel, and evaluated such
information for each fund for which the board has responsibility. The Directors
did not identify any single factor as being all-important or controlling, and
each Director may have attributed different levels of importance to different
factors. In deciding to renew the agreement under the terms ultimately
determined by the board to be appropriate, the Directors' decision was based on
the following factors.
NATURE, EXTENT AND QUALITY OF SERVICES -- GENERALLY. Under the management
agreement, the advisor is responsible for providing or arranging for all
services necessary for the operation of the fund. The board noted that under the
management agreement, the advisor provides or arranges at its own expense a wide
variety of services including:
* fund construction and design
* portfolio security selection
* initial capitalization/funding
* securities trading
* custody of fund assets
* daily valuation of the fund's portfolio
* shareholder servicing and transfer agency, including shareholder
confirmations, recordkeeping and communications
* legal services
* regulatory and portfolio compliance
* financial reporting
* marketing and distribution
The Directors noted that many of these services have expanded over time both in
terms of quantity and complexity in response to shareholder demands, competition
in the industry and the changing regulatory environment. In performing their
evaluation, the Directors considered information received in connection with the
annual review, as well as information provided on an ongoing basis at their
regularly scheduled board and committee meetings.
INVESTMENT MANAGEMENT SERVICES. The nature of the investment management services
provided is quite complex and allows fund shareholders access to professional
money management, instant diversification of their investments within an asset
class, the opportunity to easily diversify among asset classes, and liquidity.
In evaluating investment performance, the board expects the advisor to manage
the fund in accordance with its investment objectives and approved strategies.
In providing these services, the advisor utilizes teams of investment
professionals (portfolio managers, analysts, research assistants, and securities
traders) who require extensive information technology, research, training,
compliance and other systems to conduct their business. At each quarterly
meeting the Directors review investment performance information for the fund,
together with comparative information for appropriate benchmarks and peer groups
of funds managed similarly to the fund. The Directors also review detailed
performance information during the 15(c) Process comparing the fund's
performance with that of similar funds not managed by the advisor. If
performance
(continued)
- ------
36
Approval of Management Agreement for Balanced
concerns are identified, the Directors discuss with the advisor the reasons for
such results (e.g., market conditions, security selection) and any efforts being
undertaken to improve performance. The fund's performance for both the one and
three year periods was above the median for its peer group.
SHAREHOLDER AND OTHER SERVICES. The advisor provides the fund with a
comprehensive package of transfer agency, shareholder, and other services. The
Directors review reports and evaluations of such services at their regular
quarterly meetings, including the annual meeting concerning contract review, and
reports to the board. These reports include, but are not limited to, information
regarding the operational efficiency and accuracy of the shareholder and
transfer agency services provided, staffing levels, shareholder satisfaction (as
measured by external as well as internal sources), technology support, new
products and services offered to fund shareholders, securities trading
activities, portfolio valuation services, auditing services, and legal and
operational compliance activities. Certain aspects of shareholder and transfer
agency service level efficiency and the quality of securities trading activities
are measured by independent third party providers and are presented in
comparison to other fund groups not managed by the advisor.
COSTS OF SERVICES PROVIDED AND PROFITABILITY TO THE ADVISOR. The advisor
provides detailed information concerning its cost of providing various services
to the fund, its profitability in managing the fund, its overall profitability,
and its financial condition. The Directors have reviewed with the advisor the
methodology used to prepare this financial information. This financial
information regarding the advisor is considered in order to evaluate the
advisor's financial condition, its ability to continue to provide services under
the management agreement, and the reasonableness of the current management fee.
ETHICS OF THE ADVISOR. The Directors generally consider the advisor's commitment
to providing quality services to shareholders and to conducting its business
ethically. They noted that the advisor's practices generally meet or exceed
industry best practices and that the advisor was not implicated in the industry
scandals of 2003 and 2004.
ECONOMIES OF SCALE. The Directors review reports provided by the advisor on
economies of scale for the complex as a whole and the year-over-year changes in
revenue, costs, and profitability. The Directors concluded that economies of
scale are difficult to measure and predict with precision, especially on a
fund-by-fund basis. This analysis is also complicated by the additional services
and content provided by the advisor and its reinvestment in its ability to
provide and expand those services. Accordingly, the Directors also seek to
evaluate economies of scale by reviewing other information, such as
year-over-year profitability of the advisor generally, the profitability of its
management of the fund specifically, the expenses incurred by the advisor in
providing various functions to the fund, and the breakpoint fees of competitive
funds not managed by the advisor. The Directors believe the advisor is
appropriately sharing economies of scale through its competitive fee structure,
fee break-
(continued)
- ------
37
Approval of Management Agreement for Balanced
points as the fund increases in size, and through reinvestment in its business
to provide shareholders additional content and services.
COMPARISON TO OTHER FUNDS' FEES. The fund pays the advisor a single,
all-inclusive (or unified) management fee for providing all services necessary
for the management and operation of the fund, other than brokerage expenses,
taxes, interest, extraordinary expenses, and the fees and expenses of the fund's
independent directors (including their independent legal counsel). Under the
unified fee structure, the advisor is responsible for providing all investment
advisory, custody, audit, administrative, compliance, recordkeeping, marketing
and shareholder services, or arranging and supervising third parties to provide
such services. By contrast, most other funds are charged a variety of fees,
including an investment advisory fee, a transfer agency fee, an administrative
fee, distribution charges and other expenses. Other than their investment
advisory fees and Rule 12b-1 distribution fees, all other components of the
total fees charged by these other funds may be increased without shareholder
approval. The board believes the unified fee structure is a benefit to fund
shareholders because it clearly discloses to shareholders the cost of owning
fund shares, and, since the unified fee cannot be increased without a vote of
fund shareholders, it shifts to the advisor the risk of increased costs of
operating the fund and provides a direct incentive to minimize administrative
inefficiencies. Part of the Directors' analysis of fee levels involves reviewing
certain evaluative data compiled by a 15(c) Provider comparing the fund's
unified fee to the total expense ratio of other funds in the fund's peer group.
The unified fee charged to shareholders of the fund was below the median of the
total expense ratios of its peer group.
COMPARISON TO FEES AND SERVICES PROVIDED TO OTHER CLIENTS OF THE ADVISOR. The
Directors also requested and received information from the advisor concerning
the nature of the services, fees, and profitability of its advisory services to
advisory clients other than the fund. They observed that these varying types of
client accounts require different services and involve different regulatory and
entrepreneurial risks than the management of the fund. The Directors analyzed
this information and concluded that the fees charged and services provided to
the fund were reasonable by comparison.
COLLATERAL BENEFITS DERIVED BY THE ADVISOR. The Directors reviewed information
from the advisor concerning collateral benefits it receives as a result of its
relationship with the fund. They concluded that the advisor's primary business
is managing mutual funds and it generally does not use the fund or shareholder
information to generate profits in other lines of business, and therefore does
not derive any significant collateral benefits from them. The Directors noted
that the advisor receives proprietary research from broker dealers that execute
fund portfolio transactions and concluded that this research is likely to
benefit fund shareholders. The Directors also determined that the advisor is
able to provide investment management services to certain clients other than the
fund, at least in part, due to its existing infrastructure built to
(continued)
- ------
38
Approval of Management Agreement for Balanced
serve the fund complex. The Directors concluded, however, that the assets of
those other clients are not material to the analysis and, in any event, are
included with the assets of the fund to determine breakpoints in the fund's fee
schedule, provided they are managed using the same investment team and strategy.
CONCLUSIONS OF THE DIRECTORS
As a result of this process, the independent directors, in the absence of
particular circumstances and assisted by the advice of legal counsel that is
independent of the advisor, taking into account all of the factors discussed
above and the information provided by the advisor concluded that the investment
management agreement between the fund and the advisor is fair and reasonable in
light of the services provided and should be renewed.
- ------
39
Share Class Information
Three classes of shares are authorized for sale by the fund: Investor Class,
Institutional Class, and Advisor Class. The total expense ratio of Institutional
Class shares is lower than that of Investor Class shares. The total expense
ratio of Advisor Class shares is higher than that of Investor Class shares.
INVESTOR CLASS shares are available for purchase in two ways: 1) directly from
American Century without any commissions or other fees; or 2) through certain
financial intermediaries (such as banks, broker-dealers, insurance companies and
investment advisors), which may require payment of a transaction fee to the
financial intermediary.
INSTITUTIONAL CLASS shares are available to large investors such as endowments,
foundations, and retirement plans, and to financial intermediaries serving these
investors. This class recognizes the relatively lower cost of serving
institutional customers and others who invest at least $5 million ($3 million
for endowments and foundations) in an American Century fund or at least $10
million in multiple funds. In recognition of the larger investments and account
balances and comparatively lower transaction costs, the unified management fee
of Institutional Class shares is 0.20% less than the unified management fee of
Investor Class shares.
ADVISOR CLASS shares are sold primarily through institutions such as investment
advisors, banks, broker-dealers, insurance companies, and financial advisors.
Advisor Class shares are subject to a 0.50% annual Rule 12b-1 distribution and
service fee. The total expense ratio of Advisor Class shares is 0.25% higher
than the total expense ratio of Investor Class shares.
All classes of shares represent a pro rata interest in the fund and generally
have the same rights and preferences.
- ------
40
Additional Information
RETIREMENT ACCOUNT INFORMATION
As required by law, any distributions you receive from an IRA or certain 403(b),
457 and qualified plans [those not eligible for rollover to an IRA or to another
qualified plan] are subject to federal income tax withholding, unless you elect
not to have withholding apply. Tax will be withheld on the total amount
withdrawn even though you may be receiving amounts that are not subject to
withholding, such as nondeductible contributions. In such case, excess amounts
of withholding could occur. You may adjust your withholding election so that a
greater or lesser amount will be withheld.
If you don't want us to withhold on this amount, you must notify us to not
withhold the federal income tax. Even if you plan to roll over the amount you
withdraw to another tax-deferred account, the withholding rate still applies to
the withdrawn amount unless we have received notice not to withhold federal
income tax prior to the withdrawal. You may notify us in writing or in certain
situations by telephone or through other electronic means. You have the right to
revoke your withholding election at any time and any election you make may
remain in effect until revoked by filing a new election.
Remember, even if you elect not to have income tax withheld, you are liable for
paying income tax on the taxable portion of your withdrawal. If you elect not to
have income tax withheld or you don't have enough income tax withheld, you may
be responsible for payment of estimated tax. You may incur penalties under the
estimated tax rules if your withholding and estimated tax payments are not
sufficient.
State tax will be withheld if, at the time of your distribution, your address is
within one of the mandatory withholding states and you have federal income tax
withheld. State taxes will be withheld from your distribution in accordance with
the respective state rules.
PROXY VOTING GUIDELINES
American Century Investment Management, Inc., the fund's investment advisor, is
responsible for exercising the voting rights associated with the securities
purchased and/or held by the fund. A description of the policies and procedures
the advisor uses in fulfilling this responsibility is available without charge,
upon request, by calling 1-800-345-2021. It is also available on American
Century's website at americancentury.com and on the Securities and Exchange
Commission's website at sec.gov. Information regarding how the investment
advisor voted proxies relating to portfolio securities during the most recent
12-month period ended June 30 is available on the "About Us" page at
americancentury.com. It is also available at sec.gov.
QUARTERLY PORTFOLIO DISCLOSURE
The fund files its complete schedule of portfolio holdings with the Securities
and Exchange Commission (SEC) for the first and third quarters of each fiscal
year on Form N-Q. The fund's Form N-Q is available on the SEC's website at
sec.gov, and may be reviewed and copied at the SEC's Public Reference Room in
Washington, DC. Information on the operation of the Public Reference Room may be
obtained by calling 1-800-SEC-0330. The fund also makes its complete schedule of
portfolio holdings for the most recent quarter of its fiscal year available on
its website at americancentury.com and, upon request, by calling 1-800-345-2021.
(continued)
- ------
41
Index Definitions
The following indices are used to illustrate investment market, sector, or style
performance or to serve as fund performance comparisons. They are not investment
products available for purchase.
The BLENDED INDEX is considered the benchmark for Balanced. It combines two
widely known indices in proportion to the asset mix of the fund. Accordingly,
60% of the index is represented by the S&P 500 Index, which reflects the
approximately 60% of the fund's assets invested in stocks. The old blended
index's remaining 40% was represented by the Lehman Brothers U.S. Aggregate
Index, which reflects the roughly 40% of the fund's assets invested in
fixed-income securities. However, the new blended index's remaining 40% is
represented by the Citigroup US Broad Investment-Grade Bond Index. The change in
the blended index better represents the fund's portfolio composition.
The CITIGROUP US BROAD INVESTMENT-GRADE (BIG) BOND INDEX is a
market-capitalization-weighted index that includes fixed-rate Treasury,
government-sponsored, mortgage, asset-backed, and investment-grade issues with a
maturity of one year or longer.
The DOW JONES INDUSTRIAL AVERAGE (DJIA) is a price-weighted average of 30
actively traded blue chip stocks, primarily industrials but including
service-oriented firms. Prepared and published by Dow Jones & Co., it is the
oldest and most widely quoted of all the market indicators.
The LEHMAN BROTHERS U.S. AGENCY INDEX is composed of those securities included
in the Lehman Brothers U.S. Aggregate Index that are public obligations of U.S.
government agencies, quasi-federal corporations, and corporate or foreign debt
guaranteed by the U.S. government.
The LEHMAN BROTHERS U.S. AGGREGATE INDEX represents securities that are taxable,
registered with the Securities and Exchange Commission, and U.S.
dollar-denominated. The index covers the U.S. investment-grade fixed-rate bond
market, with index components for government and corporate securities, mortgage
pass-through securities, and asset-backed securities.
The LEHMAN BROTHERS U.S. CORPORATE INDEX is composed of those securities
included in the Lehman Brothers U.S. Aggregate Index that are U.S.
dollar-denominated, investment-grade, fixed-rate, taxable securities sold by
industrial, utility and financial issuers.
The LEHMAN BROTHERS U.S. FIXED-RATE MORTGAGE-BACKED SECURITIES (MBS) INDEX is
the MBS Fixed-Rate component of the Lehman Brothers U.S. Aggregate Index. It
covers the mortgage-backed pass-through securities of the Government National
Mortgage Association (GNMA), the Federal National Mortgage Association (FNMA),
and the Federal Home Loan Mortgage Corporation (FHLMC).
The LEHMAN BROTHERS U.S. TREASURY INDEX is composed of those securities included
in the Lehman Brothers U.S. Aggregate Index that are public obligations of the
U.S. Treasury with a remaining maturity of one year or more.
The NASDAQ COMPOSITE INDEX is a market value-weighted index of all domestic and
international common stocks listed on the Nasdaq stock market.
(continued)
- ------
42
Index Definitions
The RUSSELL 2000(reg.tm) INDEX is a market-capitalization weighted index created
by Frank Russell Company to measure the performance of the 2,000 smallest of the
3,000 largest publicly traded U.S. companies, based on total market
capitalization.
The S&P 500 INDEX is a market value-weighted index of the stocks of 500 publicly
traded U.S. companies chosen for market size, liquidity, and industry group
representation that are considered to be leading firms in dominant industries.
Each stock's weight in the index is proportionate to its market value. Created
by Standard & Poor's, it is considered to be a broad measure of U.S. stock
market performance.
- ------
43
Notes
- ------
44
[back cover]
CONTACT US
AMERICANCENTURY.COM
AUTOMATED INFORMATION LINE:
1-800-345-8765
INVESTOR SERVICES REPRESENTATIVE:
1-800-345-2021 or 816-531-5575
BUSINESS, NOT-FOR-PROFIT,
EMPLOYER-SPONSORED RETIREMENT PLANS:
1-800-345-3533
BANKS AND TRUST COMPANIES, BROKER-DEALERS,
FINANCIAL PROFESSIONALS, INSURANCE COMPANIES:
1-800-345-6488
TELECOMMUNICATIONS DEVICE FOR THE DEAF:
1-800-634-4113 or 816-444-3485
AMERICAN CENTURY MUTUAL FUNDS, INC.
INVESTMENT ADVISOR:
American Century Investment Management, Inc.
Kansas City, Missouri
THIS REPORT AND THE STATEMENTS IT CONTAINS ARE SUBMITTED FOR THE GENERAL
INFORMATION OF OUR SHAREHOLDERS. THE REPORT IS NOT AUTHORIZED FOR DISTRIBUTION
TO PROSPECTIVE INVESTORS UNLESS PRECEDED OR ACCOMPANIED BY AN EFFECTIVE
PROSPECTUS.
American Century Investments PRSRT STD
P.O. Box 419200 U.S. POSTAGE PAID
Kansas City, MO 64141-6200 AMERICAN CENTURY
COMPANIES
The American Century Investments logo, American Century and American Century
Investments are service marks of American Century Proprietary Holdings, Inc.
American Century Investment Services, Inc., Distributor
0612 (c)2006 American Century Proprietary Holdings, Inc.
SH-ANN-52269S All rights reserved.
[front cover]
American Century Investments
Annual Report
October 31, 2006
[photo of winter scene]
Veedot(reg.tm) Fund
[american century investments logo and text logo]
Our Message to You
[photo of James E. Stowers III and James E. Stowers, Jr.]
/s/James E. Stowers, Jr.
James E. Stowers, Jr.
FOUNDER
AMERICAN CENTURY COMPANIES, INC.
/s/James E. Stowers III
James E. Stowers III
CHAIRMAN OF THE BOARD
AMERICAN CENTURY COMPANIES, INC.
We are pleased to provide you with the annual report for the American Century
Veedot fund for the 12 months ended October 31, 2006. We hope you find this
information helpful in monitoring your investment. Another useful resource we
offer is our website, americancentury.com, where we post quarterly portfolio
commentaries, the views of senior investment officers and analysts, and other
communications about investments, portfolio strategy, personal finance, and the
markets.
In its most recent rankings, Dalbar -- which issues customer satisfaction
ratings and rankings based on website functionality -- ranked
americancentury.com seventh out of the sites provided by the top 25 fund
companies that it believes lead the industry in web-based technology. Our
website earned an "Excellent" rating, Dalbar's highest designation.
For most of 2006, our website has linked visitors to information explaining our
strategic collaboration with Lance Armstrong and the Lance Armstrong Foundation
(LAF). This campaign, featuring Lance, is designed to encourage investors to
take a more active role in planning their financial futures and make every
investment decision count. To learn more about the collaboration and the LAF,
please visit americancentury.com or www.lanceface.com on the Web and click on
the links to related sites.
With the approach of year end and the 2006 tax season, you can also find out
more about December fund distributions and tax information via a link from our
website. We've posted December distribution estimates for over 50 funds, answers
to frequent distribution questions, and online descriptions of all of the tax
information we provide to investors.
If you haven't visited americancentury.com yet, we encourage you to do so...it's
there to serve you. And so are we. As always, we deeply appreciate your
commitment to American Century Investments.
Table of Contents
Market Perspective. . . . . . . . . . . . . . . . . . . . . . . . . . . . . 2
One-Year Total Returns . . . . . . . . . . . . . . . . . . . . . . . . . 2
VEEDOT
Performance . . . . . . . . . . . . . . . . . . . . . . . . . . . . . . . . 3
Portfolio Commentary. . . . . . . . . . . . . . . . . . . . . . . . . . . . 5
Top Ten Holdings . . . . . . . . . . . . . . . . . . . . . . . . . . . . 5
Top Five Industries . . . . . . . . . . . . . . . . . . . . . . . . . . 6
Types of Investments in Portfolio . . . . . . . . . . . . . . . . . . . 6
Shareholder Fee Example . . . . . . . . . . . . . . . . . . . . . . . . . . 7
Schedule of Investments . . . . . . . . . . . . . . . . . . . . . . . . . . 9
FINANCIAL STATEMENTS
Statement of Assets and Liabilities . . . . . . . . . . . . . . . . . . . .12
Statement of Operations . . . . . . . . . . . . . . . . . . . . . . . . . .13
Statement of Changes in Net Assets. . . . . . . . . . . . . . . . . . . . .14
Notes to Financial Statements . . . . . . . . . . . . . . . . . . . . . . .15
Financial Highlights. . . . . . . . . . . . . . . . . . . . . . . . . . . .20
Report of Independent Registered Public Accounting Firm . . . . . . . . . .22
OTHER INFORMATION
Management. . . . . . . . . . . . . . . . . . . . . . . . . . . . . . . . .23
Approval of Management Agreement for Veedot . . . . . . . . . . . . . . . .27
Share Class Information . . . . . . . . . . . . . . . . . . . . . . . . . .32
Additional Information. . . . . . . . . . . . . . . . . . . . . . . . . . .33
Index Definitions . . . . . . . . . . . . . . . . . . . . . . . . . . . . .34
The opinions expressed in the Market Perspective and the Portfolio Commentary
reflect those of the portfolio management team as of the date of the report, and
do not necessarily represent the opinions of American Century or any other
person in the American Century organization. Any such opinions are subject to
change at any time based upon market or other conditions and American Century
disclaims any responsibility to update such opinions. These opinions may not be
relied upon as investment advice and, because investment decisions made by
American Century funds are based on numerous factors, may not be relied upon as
an indication of trading intent on behalf of any American Century fund. Security
examples are used for representational purposes only and are not intended as
recommendations to purchase or sell securities. Performance information for
comparative indices and securities is provided to American Century by third
party vendors. To the best of American Century's knowledge, such information is
accurate at the time of printing.
Market Perspective
[photo of Chief Investment Officer]
BY MARK MALLON, CHIEF INVESTMENT OFFICER, AMERICAN CENTURY INVESTMENTS
ECONOMIC GROWTH SURGED, THEN MODERATED
Economic growth -- along with commodity prices, short-term interest rates, and
inflation -- surged early in the 12-month period ended October 31, 2006. But
growth and inflation moderated in the period's second half, which saw the
Federal Reserve end its two-year string of interest rate hikes.
After a hurricane-related slowdown in the fourth quarter of 2005, U.S. gross
domestic product grew in the first quarter of 2006 at a 5.6% annualized pace,
the highest level in more than two years. The Fed steadily raised short-term
interest rates through June to keep inflation in check, including pressures from
soaring commodity prices. The Fed finally snapped its string of rate hikes in
August 2006, leaving its target at 5.25%, a five-year high. By then, economic
growth had slowed, dragged down in part by a cooling housing market.
BEST FISCAL-YEAR STOCK RETURNS SINCE 2003
The Fed's pause and expectations for lower interest rates and mild inflation
going forward helped produce the best U.S. stock returns for a 12-month fiscal
period ended October 31 since 2003. Market rallies beginning and ending the
period offset a late-spring/early-summer selloff. Growth stocks flourished in
the latter rally, but value stocks outperformed growth for the full reporting
period. Likewise, though large-cap stocks gained ground late in the period,
small-caps posted higher returns for the entire 12-month stretch.
In the first half of the 12-month period, investors celebrated a dip in crude
oil prices and strong economic growth by pushing stock prices higher. The
small-cap Russell 2000 Index led the way, surging 18.91%. Sentiment changed in
early May, however, when the Fed made it clear that more interest rate hikes
might be necessary to control inflation. Between April 30 and July 15, the S&P
500 fell 5.28%, and the Russell 2000 more than doubled that loss as investors
desired larger, more stable companies.
The selloff ended in late July after Fed chairman Ben Bernanke predicted
inflation would moderate. The Fed's subsequent rate pause in August and plunging
energy prices allowed stocks to rebound nicely in the last three months of the
reporting period.
ONE-YEAR TOTAL RETURNS
AS OF OCTOBER 31, 2006
- --------------------------------------------------------------------------------
S&P 500 Index 16.34%
- --------------------------------------------------------------------------------
Dow Jones Industrial Average 18.47%
- --------------------------------------------------------------------------------
Nasdaq Composite Index 12.48%
- --------------------------------------------------------------------------------
- ------
2
Veedot - Performance
TOTAL RETURNS AS OF OCTOBER 31, 2006
----------------------
AVERAGE ANNUAL RETURNS
- --------------------------------------------------------------------------------
SINCE INCEPTION
1 YEAR 5 YEARS INCEPTION DATE
- --------------------------------------------------------------------------------
INVESTOR CLASS 11/30/99
Before redemption fee 10.77% 7.38% 3.08%
Net of redemption fee(1) 8.56% 7.38% 3.08%
- --------------------------------------------------------------------------------
RUSSELL 3000 INDEX(2) 16.37% 8.35% 2.57% --
- --------------------------------------------------------------------------------
Institutional Class 8/1/00
Before redemption fee 11.01% 7.61% 0.34%
Net of redemption fee(1) 8.79% 7.61% 0.34%
- --------------------------------------------------------------------------------
(1) Returns reflect the deduction of a 2.00% redemption fee, incurred if shares
were redeemed within the first five years after purchase.
(2) Data provided by Lipper Inc. -- A Reuters Company. (c) 2006 Reuters. All
rights reserved. Any copying, republication or redistribution of Lipper
content, including by caching, framing or similar means, is expressly
prohibited without the prior written consent of Lipper. Lipper shall not be
liable for any errors or delays in the content, or for any actions taken in
reliance thereon.
The data contained herein has been obtained from company reports, financial
reporting services, periodicals and other resources believed to be reliable.
Although carefully verified, data on compilations is not guaranteed by
Lipper and may be incomplete. No offer or solicitations to buy or sell any
of the securities herein is being made by Lipper.
Data presented reflect past performance. Past performance is no guarantee of
future results. Current performance may be higher or lower than the performance
shown. Investment return and principal value will fluctuate, and redemption
value may be more or less than original cost. To obtain performance data current
to the most recent month end, please call 1-800-345-2021 or visit
americancentury.com. The fund's investment process may involve high portfolio
turnover and high capital gains distributions. In addition, its investment
approach may involve higher volatility and risk.
Unless otherwise indicated, performance reflects Investor Class shares;
performance for other share classes will vary due to differences in fee
structure. For information about other share classes available, please consult
the prospectus. Data assumes reinvestment of dividends and capital gains, and
none of the charts reflect the deduction of taxes that a shareholder would pay
on fund distributions or the redemption of fund shares. Returns for the index
are provided for comparison. The fund's total returns include operating expenses
(such as transaction costs and management fees) that reduce returns, while the
total returns of the index do not.
(continued)
- ------
3
Veedot - Performance
GROWTH OF $10,000 OVER LIFE OF CLASS
$10,000 investment made November 30, 1999
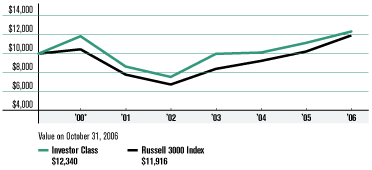
ONE-YEAR RETURNS OVER LIFE OF CLASS
Periods ended October 31
- --------------------------------------------------------------------------------
2000* 2001 2002 2003 2004 2005 2006
- --------------------------------------------------------------------------------
Investor Class
(before redemption fee) 18.40% -27.03% -12.73% 32.36% 1.40% 10.08% 10.77%
- --------------------------------------------------------------------------------
Russell 3000 Index 6.65% -25.17% -14.35% 23.69% 9.51% 10.60% 16.37%
- --------------------------------------------------------------------------------
*From 11/30/99, the Investor Class's inception date. Not annualized.
Data presented reflect past performance. Past performance is no guarantee of
future results. Current performance may be higher or lower than the performance
shown. Investment return and principal value will fluctuate, and redemption
value may be more or less than original cost. To obtain performance data current
to the most recent month end, please call 1-800-345-2021 or visit
americancentury.com. The fund's investment process may involve high portfolio
turnover and high capital gains distributions. In addition, its investment
approach may involve higher volatility and risk.
Unless otherwise indicated, performance reflects Investor Class shares;
performance for other share classes will vary due to differences in fee
structure. For information about other share classes available, please consult
the prospectus. Data assumes reinvestment of dividends and capital gains, and
none of the charts reflect the deduction of taxes that a shareholder would pay
on fund distributions or the redemption of fund shares. Returns for the index
are provided for comparison. The fund's total returns include operating expenses
(such as transaction costs and management fees) that reduce returns, while the
total returns of the index do not.
- ------
4
Veedot - Portfolio Commentary
PORTFOLIO MANAGER: JOHN SMALL JR.
PERFORMANCE SUMMARY
Veedot gained 10.77%* during the 12-month period ended October 31, 2006,
trailing the 16.37% return of its broad market benchmark, the Russell 3000
Index.
A pause in Federal Reserve interest rate hikes and expectations for lower
interest rates and mild inflation going forward helped produce U.S. stock index
returns in the 10-25% range for the 12-month period, despite a sizeable market
selloff from mid-May to mid-June 2006. After almost doubling the return of its
benchmark in the first half of the reporting period, the portfolio struggled on
both an absolute and relative basis after the selloff.
Our systematic investment process guides us to stocks that show acceleration in
earnings and revenue and does not reflect any consideration of external
benchmark sector, industry, or individual stock weights. In the first half of
the reporting period, our process led us to overweight positions in numerous
sectors -- especially industrials and materials -- that had enjoyed sound
financial growth. Strong returns in those sectors in the first half of the
period reflected that growth.
However, the market's selloff and an ensuing rebound late in the period
encompassed a broad shift away from the sectors that had worked well in early
2006. As a result, several of the stocks and sectors responsible for Veedot's
surge in the first half of the reporting period detracted from performance in
the second half of the period. In addition, investors generally did not favor
growth and momentum factors, such as accelerating stock prices or financial
results. Veedot relies heavily on such factors in its investment process.
The recent volatility is not unusual for Veedot; that's one of the expected
trade-offs for high potential long-term returns. Despite its struggles at the
end of the reporting period, Veedot's 3.08% average annual return since its
November 30, 1999, inception surpassed the 2.57% return of its benchmark for the
same period.
ENERGY PICKS SUFFERED
We gradually reduced our exposure to the energy sector as the period progressed
and energy prices declined. Nonetheless, an overweight position in the sector
hurt the portfolio's relative return, and three of our 10 worst relative
performers came from that sector, including overweights in several smaller oil
and gas producers. Veedot also suffered from an underweight stake in Exxon
Mobil, which surged 30% in the reporting period.
One of the smaller producers, Blue Dolphin Energy, highlighted the market's
bumpy transition in May 2006. The small-
TOP TEN HOLDINGS
AS OF OCTOBER 31, 2006
- --------------------------------------------------------------------------------
% OF % OF
NET ASSETS NET ASSETS
AS OF AS OF
10/31/06 4/30/06
- --------------------------------------------------------------------------------
Geo Group Inc. (The) 2.6% 1.4%
- --------------------------------------------------------------------------------
Tempur-Pedic International Inc. 1.6% --
- --------------------------------------------------------------------------------
AT&T Inc. 1.5% 1.0%
- --------------------------------------------------------------------------------
WellCare Health Plans Inc. 1.4% --
- --------------------------------------------------------------------------------
FactSet Research Systems Inc. 1.4% 1.0%
- --------------------------------------------------------------------------------
Capital Trust Inc. Cl A 1.4% --
- --------------------------------------------------------------------------------
Cisco Systems Inc. 1.3% 1.0%
- --------------------------------------------------------------------------------
Triad Guaranty Inc. 1.2% --
- --------------------------------------------------------------------------------
HEICO Corp. 1.2% 1.1%
- --------------------------------------------------------------------------------
Entertainment Properties Trust 1.1% --
- --------------------------------------------------------------------------------
*All fund returns referenced in this commentary are for Investor Class shares
and are not reduced by any redemption fees.
(continued)
- ------
5
Veedot - Portfolio Commentary
cap company's shares actually surged 79% for the full reporting period. But
after nearly quadrupling in early April, the company's shares lost half their
value between mid-April and mid-May. We purchased the stock on its upswing in
late April and sold our stake by the end of May, but not before enduring its
quick decline.
Within health care, Veedot's worst relative performer, NPS Pharmaceuticals, fell
38% in one trading session in early March. The share decline occurred after the
U.S. Food and Drug Administration requested additional clinical information
concerning an osteoporosis drug the company wants to market. Our technical
process flags such precipitous declines, and we quickly shed our position in the
company.
TOP HOLDING LED RETURNS
Geo Group, one of the portfolio's five heaviest average individual holdings and
one of our biggest overweight stakes, topped the list of leading relative and
absolute performers by a substantial margin. Shares in the Florida-based
operator of correctional facilities soared 161% in the period, primarily
resulting from strong earnings growth. Our position in Geo Group explained the
bulk of our relative outperformance in the industrials sector.
We also reaped relative and absolute gains from the information technology
sector, despite maintaining a detrimental overweight position in the sector.
Several picks in the electronic equipment and computer industries boosted
performance. But Anadigics, a New Jersey-based producer of integrated circuits
and radio frequency solutions for wireless handset and broadband applications,
provided the biggest individual contribution from the sector. Its shares rose
141% amid booming demand for the company's products.
PORTFOLIO OBJECTIVE & EXPECTATIONS
Veedot is best-suited for investors who can tolerate short-term share price
fluctuation as the fund seeks long-term capital growth. Using a systematic and
technically driven investment process, we focus on finding companies whose
fundamental characteristics meet strict requirements for accelerating earnings
and revenue growth. For inclusion into the portfolio, such companies also must
have historical stock price performance that suggests impending share price
appreciation.
We believe Veedot is poised for solid returns if the market rebound that began
late in the reporting period persists and predictions for Federal Reserve rate
cuts in 2007 prove correct.
TOP FIVE INDUSTRIES
AS OF OCTOBER 31, 2006
- --------------------------------------------------------------------------------
% OF % OF
NET ASSETS NET ASSETS
AS OF AS OF
10/31/06 4/30/06
- --------------------------------------------------------------------------------
Real Estate Investment Trusts 6.1% --
- --------------------------------------------------------------------------------
Software 5.6% 5.0%
- --------------------------------------------------------------------------------
Semiconductors &
Semiconductor Equipment 4.9% 3.5%
- --------------------------------------------------------------------------------
Communications Equipment 4.9% 5.3%
- --------------------------------------------------------------------------------
Machinery 4.3% 2.7%
- --------------------------------------------------------------------------------
TYPES OF INVESTMENTS IN PORTFOLIO
- --------------------------------------------------------------------------------
% OF % OF
NET ASSETS NET ASSETS
AS OF AS OF
10/31/06 4/30/06
- --------------------------------------------------------------------------------
Domestic Common Stocks 85.5% 85.4%
- --------------------------------------------------------------------------------
Foreign Common Stocks* 11.2% 3.6%
- --------------------------------------------------------------------------------
Foreign Preferred Stocks 0.8% --
- --------------------------------------------------------------------------------
TOTAL EQUITY EXPOSURE 97.5% 89.0%
- --------------------------------------------------------------------------------
Temporary Cash Investments 2.9% 0.9%
- --------------------------------------------------------------------------------
Other Assets and Liabilities (0.4%) 10.1%
- --------------------------------------------------------------------------------
*Includes depositary shares, dual listed securities and foreign ordinary shares.
- ------
6
Shareholder Fee Example (Unaudited)
Fund shareholders may incur two types of costs: (1) transaction costs, including
sales charges (loads) on purchase payments and redemption/exchange fees; and (2)
ongoing costs, including management fees; distribution and service (12b-1) fees;
and other fund expenses. This example is intended to help you understand your
ongoing costs (in dollars) of investing in your fund and to compare these costs
with the ongoing cost of investing in other mutual funds.
The example is based on an investment of $1,000 made at the beginning of the
period and held for the entire period from May 1, 2006 to October 31, 2006.
ACTUAL EXPENSES
The table provides information about actual account values and actual expenses
for each class. You may use the information, together with the amount you
invested, to estimate the expenses that you paid over the period. First,
identify the share class you own. Then simply divide your account value by
$1,000 (for example, an $8,600 account value divided by $1,000 = 8.6), then
multiply the result by the number under the heading "Expenses Paid During
Period" to estimate the expenses you paid on your account during this period.
If you hold Investor Class shares of any American Century fund, or Institutional
Class shares of the American Century Diversified Bond Fund, in an American
Century account (i.e., not a financial intermediary or retirement plan account),
American Century may charge you a $12.50 semiannual account maintenance fee if
the value of those shares is less than $10,000. We will redeem shares
automatically in one of your accounts to pay the $12.50 fee. In determining your
total eligible investment amount, we will include your investments in all
PERSONAL ACCOUNTS (including American Century Brokerage accounts) registered
under your Social Security number. PERSONAL ACCOUNTS include individual
accounts, joint accounts, UGMA/UTMA accounts, personal trusts, Coverdell
Education Savings Accounts and IRAs (including traditional, Roth, Rollover,
SEP-, SARSEP- and SIMPLE-IRAs), and certain other retirement accounts. If you
have only business, business retirement, employer-sponsored or American Century
Brokerage accounts, you are currently not subject to this fee. We will not
charge the fee as long as you choose to manage your accounts exclusively online.
If you are subject to the Account Maintenance Fee, your account value could be
reduced by the fee amount.
HYPOTHETICAL EXAMPLE FOR COMPARISON PURPOSES
The table also provides information about hypothetical account values and
hypothetical expenses based on the actual expense ratio of each class of your
fund and an assumed rate of return of 5% per year before expenses, which is not
the actual return of a fund's share class. The hypothetical account values and
expenses may not be used to estimate the actual ending account balance or
expenses you paid for the period. You may use this information to compare the
ongoing costs of investing in your fund and other funds. To do so, compare this
5% hypothetical
(continued)
- ------
7
Shareholder Fee Example (Unaudited)
example with the 5% hypothetical examples that appear in the shareholder reports
of the other funds.
Please note that the expenses shown in the table are meant to highlight your
ongoing costs only and do not reflect any transactional costs, such as sales
charges (loads) or redemption/exchange fees. Therefore, the table is useful in
comparing ongoing costs only, and will not help you determine the relative total
costs of owning different funds. In addition, if these transactional costs were
included, your costs would have been higher.
- --------------------------------------------------------------------------------
EXPENSES PAID
BEGINNING ENDING DURING PERIOD* ANNUALIZED
ACCOUNT VALUE ACCOUNT VALUE 5/1/06 - EXPENSE
5/1/06 10/31/06 10/31/06 RATIO*
- --------------------------------------------------------------------------------
VEEDOT SHAREHOLDER FEE EXAMPLE
- --------------------------------------------------------------------------------
ACTUAL
- --------------------------------------------------------------------------------
Investor Class $1,000 $955.10 $6.80 1.38%
- --------------------------------------------------------------------------------
Institutional
Class $1,000 $957.10 $5.82 1.18%
- --------------------------------------------------------------------------------
HYPOTHETICAL
- --------------------------------------------------------------------------------
Investor Class $1,000 $1,018.25 $7.02 1.38%
- --------------------------------------------------------------------------------
Institutional
Class $1,000 $1,019.26 $6.01 1.18%
- --------------------------------------------------------------------------------
*Expenses are equal to the class's annualized expense ratio listed in the table
above, multiplied by the average account value over the period, multiplied by
184, the number of days in the most recent fiscal half-year, divided by 365, to
reflect the one-half year period.
- ------
8
Veedot - Schedule of Investments
OCTOBER 31, 2006
Shares Value
- --------------------------------------------------------------------------------
COMMON STOCKS -- 96.7%
- --------------------------------------------------------------------------------
AEROSPACE & DEFENSE - 3.0%
- --------------------------------------------------------------------------------
53,500 HEICO Corp. $ 1,940,980
- --------------------------------------------------------------------------------
22,000 Precision Castparts Corp. 1,497,320
- --------------------------------------------------------------------------------
36,000 Teledyne Technologies Inc.(1) 1,501,920
- --------------------------------------------------------------------------------
4,940,220
- --------------------------------------------------------------------------------
BIOTECHNOLOGY - 1.7%
- --------------------------------------------------------------------------------
30,000 Digene Corp.(1) 1,392,900
- --------------------------------------------------------------------------------
42,000 MedImmune, Inc.(1) 1,345,680
- --------------------------------------------------------------------------------
2,738,580
- --------------------------------------------------------------------------------
BUILDING PRODUCTS - 0.9%
- --------------------------------------------------------------------------------
23,500 NCI Building Systems Inc.(1) 1,406,475
- --------------------------------------------------------------------------------
CAPITAL MARKETS - 1.8%
- --------------------------------------------------------------------------------
68,000 Janus Capital Group Inc. 1,365,440
- --------------------------------------------------------------------------------
20,500 Morgan Stanley 1,566,815
- --------------------------------------------------------------------------------
2,932,255
- --------------------------------------------------------------------------------
CHEMICALS - 0.9%
- --------------------------------------------------------------------------------
55,500 Lyondell Chemical Co. 1,424,685
- --------------------------------------------------------------------------------
COMMERCIAL BANKS - 0.9%
- --------------------------------------------------------------------------------
71,500 Sun Bancorp Inc.(1) 1,485,055
- --------------------------------------------------------------------------------
COMMERCIAL SERVICES & SUPPLIES - 3.4%
- --------------------------------------------------------------------------------
112,500 Geo Group Inc. (The)(1) 4,275,000
- --------------------------------------------------------------------------------
64,500 Korn/Ferry International(1) 1,426,095
- --------------------------------------------------------------------------------
5,701,095
- --------------------------------------------------------------------------------
COMMUNICATIONS EQUIPMENT - 4.9%
- --------------------------------------------------------------------------------
46,500 Avocent Corp.(1) 1,707,015
- --------------------------------------------------------------------------------
90,500 Cisco Systems Inc.(1) 2,183,765
- --------------------------------------------------------------------------------
41,000 CommScope Inc.(1) 1,308,310
- --------------------------------------------------------------------------------
56,000 Polycom Inc.(1) 1,534,400
- --------------------------------------------------------------------------------
12,000 Research In Motion Ltd.(1) 1,409,760
- --------------------------------------------------------------------------------
8,143,250
- --------------------------------------------------------------------------------
COMPUTERS & PERIPHERALS - 2.9%
- --------------------------------------------------------------------------------
211,500 Brocade
Communications System(1) 1,715,265
- --------------------------------------------------------------------------------
27,000 Lexmark
International, Inc. Cl A(1) 1,716,930
- --------------------------------------------------------------------------------
65,500 QLogic Corp.(1) 1,347,990
- --------------------------------------------------------------------------------
4,780,185
- --------------------------------------------------------------------------------
CONSUMER FINANCE - 1.0%
- --------------------------------------------------------------------------------
25,000 First Marblehead Corp. (The) 1,686,250
- --------------------------------------------------------------------------------
CONTAINERS & PACKAGING - 1.7%
- --------------------------------------------------------------------------------
137,000 Caraustar Industries Inc.(1) 1,483,710
- --------------------------------------------------------------------------------
32,500 Silgan Holdings Inc. 1,344,525
- --------------------------------------------------------------------------------
2,828,235
- --------------------------------------------------------------------------------
Shares Value
- --------------------------------------------------------------------------------
DIVERSIFIED FINANCIAL SERVICES - 2.1%
- --------------------------------------------------------------------------------
30,000 Bank of America Corp. $ 1,616,100
- --------------------------------------------------------------------------------
21,000 IntercontinentalExchange Inc.(1) 1,772,820
- --------------------------------------------------------------------------------
3,388,920
- --------------------------------------------------------------------------------
DIVERSIFIED
TELECOMMUNICATION SERVICES - 2.3%
- --------------------------------------------------------------------------------
71,000 AT&T Inc. 2,431,750
- --------------------------------------------------------------------------------
78,500 Eschelon Telecom Inc.(1) 1,391,020
- --------------------------------------------------------------------------------
3,822,770
- --------------------------------------------------------------------------------
ELECTRIC UTILITIES - 2.5%
- --------------------------------------------------------------------------------
32,500 American Electric Power 1,346,475
- --------------------------------------------------------------------------------
39,500 ITC Holdings Corp. 1,403,040
- --------------------------------------------------------------------------------
30,500 Pinnacle West Capital Corp. 1,458,205
- --------------------------------------------------------------------------------
4,207,720
- --------------------------------------------------------------------------------
ELECTRICAL EQUIPMENT - 0.8%
- --------------------------------------------------------------------------------
76,000 LSI Industries Inc. 1,364,200
- --------------------------------------------------------------------------------
ELECTRONIC EQUIPMENT
& INSTRUMENTS - 2.5%
- --------------------------------------------------------------------------------
24,000 Anixter International Inc.(1) 1,434,240
- --------------------------------------------------------------------------------
113,500 Flextronics International Ltd.(1) 1,316,600
- --------------------------------------------------------------------------------
44,000 ScanSource, Inc.(1) 1,381,160
- --------------------------------------------------------------------------------
4,132,000
- --------------------------------------------------------------------------------
ENERGY EQUIPMENT & SERVICES - 1.7%
- --------------------------------------------------------------------------------
43,000 Gulfmark Offshore Inc.(1) 1,484,790
- --------------------------------------------------------------------------------
38,000 Hercules Offshore Inc.(1) 1,353,560
- --------------------------------------------------------------------------------
2,838,350
- --------------------------------------------------------------------------------
FOOD & STAPLES RETAILING - 0.8%
- --------------------------------------------------------------------------------
40,500 SUPERVALU INC. 1,352,700
- --------------------------------------------------------------------------------
FOOD PRODUCTS - 1.1%
- --------------------------------------------------------------------------------
35,500 Ralcorp Holdings, Inc.(1) 1,755,475
- --------------------------------------------------------------------------------
HEALTH CARE EQUIPMENT & SUPPLIES - 4.2%
- --------------------------------------------------------------------------------
29,500 Baxter International, Inc. 1,356,115
- --------------------------------------------------------------------------------
24,500 Hillenbrand Industries, Inc. 1,437,660
- --------------------------------------------------------------------------------
95,000 I-Flow Corp.(1) 1,473,450
- --------------------------------------------------------------------------------
15,000 Idexx Laboratories, Inc.(1) 1,248,150
- --------------------------------------------------------------------------------
83,500 Natus Medical Inc.(1) 1,386,935
- --------------------------------------------------------------------------------
6,902,310
- --------------------------------------------------------------------------------
HEALTH CARE PROVIDERS & SERVICES - 3.0%
- --------------------------------------------------------------------------------
21,500 Humana Inc.(1) 1,290,000
- --------------------------------------------------------------------------------
39,500 WellCare Health Plans Inc.(1) 2,320,625
- --------------------------------------------------------------------------------
17,000 WellPoint Inc.(1) 1,297,440
- --------------------------------------------------------------------------------
4,908,065
- --------------------------------------------------------------------------------
HOTELS, RESTAURANTS & LEISURE - 2.6%
- --------------------------------------------------------------------------------
47,500 Ambassadors Group Inc. 1,301,025
- --------------------------------------------------------------------------------
38,000 Ambassadors International Inc. 1,482,000
- --------------------------------------------------------------------------------
38,000 McDonald's Corporation 1,592,960
- --------------------------------------------------------------------------------
4,375,985
- --------------------------------------------------------------------------------
See Notes to Financial Statements.
(continued)
- ------
9
Veedot - Schedule of Investments
OCTOBER 31, 2006
Shares Value
- --------------------------------------------------------------------------------
HOUSEHOLD DURABLES - 1.6%
- --------------------------------------------------------------------------------
136,000 Tempur-Pedic International Inc.(1) $ 2,684,640
- --------------------------------------------------------------------------------
HOUSEHOLD PRODUCTS - 1.0%
- --------------------------------------------------------------------------------
21,500 Energizer Holdings Inc.(1) 1,680,225
- --------------------------------------------------------------------------------
INSURANCE - 3.5%
- --------------------------------------------------------------------------------
41,000 HCC Insurance Holdings, Inc. 1,380,060
- --------------------------------------------------------------------------------
51,500 National Interstate Corp. 1,451,270
- --------------------------------------------------------------------------------
29,500 St. Paul Travelers
Companies, Inc. (The) 1,508,335
- --------------------------------------------------------------------------------
42,500 United Fire & Casualty Co. 1,503,650
- --------------------------------------------------------------------------------
5,843,315
- --------------------------------------------------------------------------------
INTERNET & CATALOG RETAIL - 1.0%
- --------------------------------------------------------------------------------
41,500 Priceline.com Inc.(1) 1,672,035
- --------------------------------------------------------------------------------
INTERNET SOFTWARE & SERVICES - 1.7%
- --------------------------------------------------------------------------------
77,500 Open Text Corp.(1) 1,401,200
- --------------------------------------------------------------------------------
83,500 Vocus Inc.(1) 1,354,370
- --------------------------------------------------------------------------------
2,755,570
- --------------------------------------------------------------------------------
IT SERVICES - 0.8%
- --------------------------------------------------------------------------------
27,500 Fiserv, Inc.(1) 1,358,500
- --------------------------------------------------------------------------------
LIFE SCIENCES TOOLS & SERVICES - 1.0%
- --------------------------------------------------------------------------------
38,000 Illumina, Inc.(1) 1,670,480
- --------------------------------------------------------------------------------
MACHINERY - 4.3%
- --------------------------------------------------------------------------------
46,000 CIRCOR International Inc. 1,516,620
- --------------------------------------------------------------------------------
37,000 Mueller Industries Inc. 1,356,790
- --------------------------------------------------------------------------------
27,000 Paccar Inc. 1,598,670
- --------------------------------------------------------------------------------
16,000 Parker-Hannifin Corp. 1,338,080
- --------------------------------------------------------------------------------
61,500 Sun Hydraulics Corp. 1,321,020
- --------------------------------------------------------------------------------
7,131,180
- --------------------------------------------------------------------------------
MARINE - 0.9%
- --------------------------------------------------------------------------------
95,000 Diana Shipping Inc. 1,420,250
- --------------------------------------------------------------------------------
MEDIA - 1.7%
- --------------------------------------------------------------------------------
45,500 Scholastic Corp.(1) 1,429,610
- --------------------------------------------------------------------------------
44,000 Walt Disney Co. (The) 1,384,240
- --------------------------------------------------------------------------------
2,813,850
- --------------------------------------------------------------------------------
METALS & MINING - 3.4%
- --------------------------------------------------------------------------------
17,500 Allegheny Technologies Inc. 1,377,775
- --------------------------------------------------------------------------------
14,500 Phelps Dodge Corp. 1,455,510
- --------------------------------------------------------------------------------
29,000 Southern Copper Corp. 1,490,020
- --------------------------------------------------------------------------------
45,000 Universal Stainless & Alloy(1) 1,367,550
- --------------------------------------------------------------------------------
5,690,855
- --------------------------------------------------------------------------------
OIL, GAS & CONSUMABLE FUELS - 3.3%
- --------------------------------------------------------------------------------
34,000 Arena Resources Inc.(1) 1,214,480
- --------------------------------------------------------------------------------
22,000 China Petroleum &
Chemical Corp. ADR 1,526,140
- --------------------------------------------------------------------------------
29,000 Swift Energy Co.(1) 1,354,880
- --------------------------------------------------------------------------------
29,500 Tsakos Energy Navigation Ltd. 1,308,030
- --------------------------------------------------------------------------------
5,403,530
- --------------------------------------------------------------------------------
Shares Value
- --------------------------------------------------------------------------------
PAPER & FOREST PRODUCTS - 0.9%
- --------------------------------------------------------------------------------
82,500 Votorantim Celulose e
Papel SA ADR $ 1,505,625
- --------------------------------------------------------------------------------
PHARMACEUTICALS - 4.3%
- --------------------------------------------------------------------------------
12,000 Allergan, Inc. 1,386,000
- --------------------------------------------------------------------------------
93,500 Bradley Pharmaceuticals Inc.(1) 1,626,900
- --------------------------------------------------------------------------------
84,000 Dr. Reddy's
Laboratories Ltd. ADR 1,411,200
- --------------------------------------------------------------------------------
38,500 Medicis
Pharmaceutical Corp. Cl A 1,349,040
- --------------------------------------------------------------------------------
50,000 Watson Pharmaceuticals, Inc.(1) 1,345,500
- --------------------------------------------------------------------------------
7,118,640
- --------------------------------------------------------------------------------
REAL ESTATE INVESTMENT TRUSTS - 6.1%
- --------------------------------------------------------------------------------
39,500 Brandywine Realty Trust 1,317,720
- --------------------------------------------------------------------------------
50,500 Capital Trust Inc. Cl A 2,247,755
- --------------------------------------------------------------------------------
34,000 Entertainment Properties Trust 1,870,000
- --------------------------------------------------------------------------------
59,500 Host Hotels & Resorts Inc. 1,372,070
- --------------------------------------------------------------------------------
171,000 Luminent Mortgage Capital, Inc. 1,814,310
- --------------------------------------------------------------------------------
89,500 Omega Healthcare Investors Inc. 1,510,760
- --------------------------------------------------------------------------------
10,132,615
- --------------------------------------------------------------------------------
SEMICONDUCTORS &
SEMICONDUCTOR EQUIPMENT - 4.9%
- --------------------------------------------------------------------------------
94,000 Advanced Energy
Industries, Inc.(1) 1,477,680
- --------------------------------------------------------------------------------
63,500 ASML Holding N.V.
New York Shares(1) 1,450,340
- --------------------------------------------------------------------------------
29,500 Diodes Inc.(1) 1,299,180
- --------------------------------------------------------------------------------
77,500 Rudolph Technologies Inc.(1) 1,368,650
- --------------------------------------------------------------------------------
275,000 TriQuint Semiconductor, Inc.(1) 1,237,500
- --------------------------------------------------------------------------------
102,000 Ultra Clean Holdings(1) 1,331,100
- --------------------------------------------------------------------------------
8,164,450
- --------------------------------------------------------------------------------
SOFTWARE - 5.6%
- --------------------------------------------------------------------------------
45,000 FactSet Research Systems Inc. 2,290,500
- --------------------------------------------------------------------------------
42,500 Hyperion Solutions Corp.(1) 1,589,500
- --------------------------------------------------------------------------------
67,500 Parametric Technology Corp.(1) 1,318,950
- --------------------------------------------------------------------------------
81,500 Shanda Interactive
Entertainment Ltd. ADR(1) 1,203,755
- --------------------------------------------------------------------------------
77,000 Smith Micro Software Inc.(1) 1,309,770
- --------------------------------------------------------------------------------
61,000 Sybase, Inc.(1) 1,485,350
- --------------------------------------------------------------------------------
9,197,825
- --------------------------------------------------------------------------------
TEXTILES, APPAREL
& LUXURY GOODS - 0.9%
- --------------------------------------------------------------------------------
43,000 Unifirst Corporation 1,550,150
- --------------------------------------------------------------------------------
THRIFTS & MORTGAGE FINANCE - 1.2%
- --------------------------------------------------------------------------------
39,500 Triad Guaranty Inc.(1) 2,034,645
- --------------------------------------------------------------------------------
See Notes to Financial Statements.
(continued)
- ------
10
Veedot - Schedule of Investments
OCTOBER 31, 2006
Shares Value
- --------------------------------------------------------------------------------
WIRELESS TELECOMMUNICATION SERVICES - 1.9%
- --------------------------------------------------------------------------------
31,500 Millicom International
Cellular SA(1) $ 1,571,220
- --------------------------------------------------------------------------------
33,000 Philippine Long Distance
Telephone ADR 1,571,130
- --------------------------------------------------------------------------------
3,142,350
- --------------------------------------------------------------------------------
TOTAL COMMON STOCKS
(Cost $145,375,794) 160,085,510
- --------------------------------------------------------------------------------
PREFERRED STOCKS - 0.8%
- --------------------------------------------------------------------------------
PAPER & FOREST PRODUCTS - 0.8%
- --------------------------------------------------------------------------------
25,000 Aracruz Celulose SA ADR
(Cost $1,330,803) 1,375,500
- --------------------------------------------------------------------------------
Value
- --------------------------------------------------------------------------------
TEMPORARY CASH INVESTMENTS - 2.9%
- --------------------------------------------------------------------------------
Repurchase Agreement, Goldman Sachs & Co.,
(collateralized by various U.S. Treasury
obligations, 3.125% -- 4.98%, 4/19/07 --
8/15/07, valued at $4,895,615), in a joint
trading account at 5.13%, dated 10/31/06,
due 11/1/06 (Delivery value $4,800,684)
(Cost $4,800,000) $ 4,800,000
- --------------------------------------------------------------------------------
TOTAL INVESTMENT SECURITIES - 100.4%
(Cost $151,506,597) 166,261,010
- --------------------------------------------------------------------------------
OTHER ASSETS AND LIABILITIES - (0.4)% (650,092)
- --------------------------------------------------------------------------------
TOTAL NET ASSETS - 100.0% $165,610,918
================================================================================
NOTES TO SCHEDULE OF INVESTMENTS
- --------------------------------------------------------------------------------
ADR = American Depositary Receipt
(1) Non-income producing.
See Notes to Financial Statements.
- ------
11
Statement of Assets and Liabilities
OCTOBER 31, 2006
- --------------------------------------------------------------------------------
ASSETS
- --------------------------------------------------------------------------------
Investment securities, at value (cost of $151,506,597) $166,261,010
- ----------------------------------------------------------
Receivable for investments sold 9,120,764
- ----------------------------------------------------------
Dividends and interest receivable 104,428
- --------------------------------------------------------------------------------
175,486,202
- --------------------------------------------------------------------------------
LIABILITIES
- --------------------------------------------------------------------------------
Disbursements in excess of demand deposit cash 146,476
- ----------------------------------------------------------
Payable for investments purchased 9,552,640
- ----------------------------------------------------------
Accrued management fees 176,168
- --------------------------------------------------------------------------------
9,875,284
- --------------------------------------------------------------------------------
NET ASSETS $165,610,918
================================================================================
NET ASSETS CONSIST OF:
- --------------------------------------------------------------------------------
Capital (par value and paid-in surplus) $220,717,956
- ----------------------------------------------------------
Accumulated net realized loss on investment and
foreign currency transactions (69,861,451)
- ----------------------------------------------------------
Net unrealized appreciation on investments 14,754,413
- --------------------------------------------------------------------------------
$165,610,918
================================================================================
INVESTOR CLASS, $0.01 PAR VALUE
- --------------------------------------------------------------------------------
Net assets $154,373,747
- ----------------------------------------------------------
Shares outstanding 25,002,675
- ----------------------------------------------------------
Net asset value per share $6.17
- --------------------------------------------------------------------------------
INSTITUTIONAL CLASS, $0.01 PAR VALUE
- --------------------------------------------------------------------------------
Net assets $11,237,171
- ----------------------------------------------------------
Shares outstanding 1,798,144
- ----------------------------------------------------------
Net asset value per share $6.25
- --------------------------------------------------------------------------------
See Notes to Financial Statements.
- ------
12
Statement of Operations
YEAR ENDED OCTOBER 31, 2006
- --------------------------------------------------------------------------------
INVESTMENT INCOME (LOSS)
- --------------------------------------------------------------------------------
INCOME:
- ----------------------------------------------------------
Dividends (net of foreign taxes withheld of $19,665) $1,780,892
- ----------------------------------------------------------
Interest 164,166
- --------------------------------------------------------------------------------
1,945,058
- --------------------------------------------------------------------------------
EXPENSES:
- ----------------------------------------------------------
Management fees 2,629,600
- ----------------------------------------------------------
Directors' fees and expenses 2,694
- ----------------------------------------------------------
Other expenses 4,671
- --------------------------------------------------------------------------------
2,636,965
- --------------------------------------------------------------------------------
NET INVESTMENT INCOME (LOSS) (691,907)
- --------------------------------------------------------------------------------
REALIZED AND UNREALIZED GAIN (LOSS)
- --------------------------------------------------------------------------------
Net realized gain (loss) on investment and
foreign currency transactions 23,038,039
- ----------------------------------------------------------
Change in net unrealized appreciation (depreciation)
on investments and translation of assets and
liabilities in foreign currencies (3,027,960)
- --------------------------------------------------------------------------------
NET REALIZED AND UNREALIZED GAIN (LOSS) 20,010,079
- --------------------------------------------------------------------------------
NET INCREASE (DECREASE) IN NET ASSETS
RESULTING FROM OPERATIONS $19,318,172
================================================================================
See Notes to Financial Statements.
- ------
13
Statement of Changes in Net Assets
YEARS ENDED OCTOBER 31, 2006 AND OCTOBER 31, 2005
- --------------------------------------------------------------------------------
INCREASE (DECREASE) IN NET ASSETS 2006 2005
- --------------------------------------------------------------------------------
OPERATIONS
- --------------------------------------------------------------------------------
Net investment income (loss) $ (691,907) $ (1,079,316)
- -----------------------------------------
Net realized gain (loss) 23,038,039 25,010,629
- -----------------------------------------
Change in net unrealized
appreciation (depreciation) (3,027,960) (2,501,295)
- --------------------------------------------------------------------------------
Net increase (decrease) in net assets
resulting from operations 19,318,172 21,430,018
- --------------------------------------------------------------------------------
CAPITAL SHARE TRANSACTIONS
- --------------------------------------------------------------------------------
Net increase (decrease) in net assets
from capital share transactions (43,224,906) (63,930,650)
- --------------------------------------------------------------------------------
NET INCREASE (DECREASE) IN NET ASSETS (23,906,734) (42,500,632)
- --------------------------------------------------------------------------------
NET ASSETS
- --------------------------------------------------------------------------------
Beginning of period 189,517,652 232,018,284
- --------------------------------------------------------------------------------
End of period $165,610,918 $189,517,652
================================================================================
See Notes to Financial Statements.
- ------
14
Notes to Financial Statements
OCTOBER 31, 2006
1. ORGANIZATION AND SUMMARY OF SIGNIFICANT ACCOUNTING POLICIES
ORGANIZATION -- American Century Mutual Funds, Inc. (the corporation) is
registered under the Investment Company Act of 1940 (the 1940 Act) as an
open-end management investment company. Veedot Fund (the fund) is one fund in a
series issued by the corporation. The fund is non-diversified under the 1940
Act. The fund's investment objective is to seek long-term capital growth. The
fund pursues its objective by investing primarily in common stocks that
management believes to have better than average prospects for appreciation. The
fund uses an approach to common stock investing developed by American Century.
This approach relies heavily on quantitative tools to identify attractive
investment opportunities, regardless of company size, industry type or
geographic location, on a disciplined, consistent basis. The following is a
summary of the fund's significant accounting policies.
MULTIPLE CLASS -- The fund is authorized to issue the Investor Class and the
Institutional Class. The share classes differ principally in their respective
distribution and shareholder servicing expenses and arrangements. All shares of
the fund represent an equal pro rata interest in the assets of the class to
which such shares belong, and have identical voting, dividend, liquidation and
other rights and the same terms and conditions, except for class specific
expenses and exclusive rights to vote on matters affecting only individual
classes. Income, non-class specific expenses, and realized and unrealized
capital gains and losses of the fund are allocated to each class of shares based
on their relative net assets.
SECURITY VALUATIONS -- Securities traded primarily on a principal securities
exchange are valued at the last reported sales price, or at the mean of the
latest bid and asked prices where no last sales price is available. Depending on
local convention or regulation, securities traded over-the-counter are valued at
the mean of the latest bid and asked prices, the last sales price, or the
official close price. Debt securities not traded on a principal securities
exchange are valued through a commercial pricing service or at the mean of the
most recent bid and asked prices. Discount notes may be valued through a
commercial pricing service or at amortized cost, which approximates fair value.
Securities traded on foreign securities exchanges and over-the-counter markets
are normally completed before the close of business on days that the New York
Stock Exchange (the Exchange) is open and may also take place on days when the
Exchange is not open. If an event occurs after the value of a security was
established but before the net asset value per share was determined that was
likely to materially change the net asset value, that security would be valued
at fair value as determined in accordance with procedures adopted by the Board
of Directors. If the fund determines that the market price of a portfolio
security is not readily available, or that the valuation methods mentioned above
do not reflect the security's fair value, such security is valued at its fair
value as determined by, or in accordance with procedures adopted by, the Board
of Directors or its designee if such fair value determination would materially
impact a fund's net asset value. Certain other circumstances may cause the fund
to fair value a security such as: a security has been declared in default;
trading in a security has been halted during the trading day; or there is a
foreign market holiday and no trading will commence.
SECURITY TRANSACTIONS -- Security transactions are accounted for as of the trade
date. Net realized gains and losses are determined on the identified cost basis,
which is also used for federal income tax purposes.
INVESTMENT INCOME -- Dividend income less foreign taxes withheld, if any, is
recorded as of the ex-dividend date. Distributions received on securities that
represent a return of capital or capital gain, are recorded as a reduction of
cost of investments and/or as a realized gain. The fund estimates the components
of distributions received that may be considered nontaxable distributions or
capital gain distributions for income tax purposes. Interest income is recorded
on the accrual basis and includes accretion of discounts and amortization of
premiums
FUTURES CONTRACTS -- The fund may enter into futures contracts in order to
manage the fund's exposure to changes in market conditions. One of the risks of
entering into futures contracts is the possibility that the change in value of
the contract may not correlate with the changes in value of the underlying
securities. Upon entering into a futures contract, the fund is required to
deposit either cash or securities in an amount equal to a certain percentage of
the contract value (initial margin). Subsequent payments (variation margin) are
made or received daily, in cash, by the fund. The variation margin is equal to
the daily change in the contract value and is recorded as unrealized gains and
losses. The fund recognizes a realized gain or loss when the contract is closed
or expires. Net realized and unrealized gains or losses occurring during the
holding period of futures contracts are a component of realized gain (loss) on
investment transactions and unrealized appreciation (depreciation) on
investments, respectively.
(continued)
- ------
15
Notes to Financial Statements
OCTOBER 31, 2006
1. ORGANIZATION AND SUMMARY OF SIGNIFICANT ACCOUNTING POLICIES (CONTINUED)
FOREIGN CURRENCY TRANSACTIONS -- All assets and liabilities initially expressed
in foreign currencies are translated into U.S. dollars at prevailing exchange
rates at period end. Purchases and sales of investment securities, dividend and
interest income, and certain expenses are translated at the rates of exchange
prevailing on the respective dates of such transactions. For assets and
liabilities, other than investments in securities, net realized and unrealized
gains and losses from foreign currency translations arise from changes in
currency exchange rates.
Net realized and unrealized foreign currency exchange gains or losses occurring
during the holding period of investment securities are a component of realized
gain (loss) on investment transactions and unrealized appreciation
(depreciation) on investments, respectively. Certain countries may impose taxes
on the contract amount of purchases and sales of foreign currency contracts in
their currency. The fund records the foreign tax expense, if any, as a reduction
to the net realized gain (loss) on foreign currency transactions.
FORWARD FOREIGN CURRENCY EXCHANGE CONTRACTS -- The fund may enter into forward
foreign currency exchange contracts to facilitate transactions of securities
denominated in a foreign currency or to hedge the fund's exposure to foreign
currency exchange rate fluctuations. The net U.S. dollar value of foreign
currency underlying all contractual commitments held by the fund and the
resulting unrealized appreciation or depreciation are determined daily using
prevailing exchange rates. The fund bears the risk of an unfavorable change in
the foreign currency exchange rate underlying the forward contract.
Additionally, losses may arise if the counterparties do not perform under the
contract terms.
REPURCHASE AGREEMENTS -- The fund may enter into repurchase agreements with
institutions that American Century Investment Management, Inc. (ACIM) (the
investment advisor) has determined are creditworthy pursuant to criteria adopted
by the Board of Directors. Each repurchase agreement is recorded at cost. The
fund requires that the collateral, represented by securities, received in a
repurchase transaction be transferred to the custodian in a manner sufficient to
enable the fund to obtain those securities in the event of a default under the
repurchase agreement. ACIM monitors, on a daily basis, the securities
transferred to ensure the value, including accrued interest, of the securities
under each repurchase agreement is equal to or greater than amounts owed to the
fund under each repurchase agreement.
JOINT TRADING ACCOUNT -- Pursuant to an Exemptive Order issued by the Securities
and Exchange Commission, the fund, along with other registered investment
companies having management agreements with ACIM or American Century Global
Investment Management, Inc. (ACGIM), may transfer uninvested cash balances into
a joint trading account. These balances are invested in one or more repurchase
agreements that are collateralized by U.S. Treasury or Agency obligations.
INCOME TAX STATUS -- It is the fund's policy to distribute substantially all net
investment income and net realized gains to shareholders and to otherwise
qualify as a regulated investment company under provisions of the Internal
Revenue Code. Accordingly, no provision has been made for federal or state
income taxes.
DISTRIBUTIONS TO SHAREHOLDERS -- Distributions to shareholders are recorded on
the ex-dividend date. Distributions from net in vestment income and net realized
gains, if any, are generally declared and paid annually.
REDEMPTION -- The fund may impose a 2% redemption fee on shares held less than
five years. The redemption fee is recorded as a reduction in the cost of shares
redeemed. The redemption fee is retained by the fund and helps cover transaction
costs that long-term investors may bear when a fund sells securities to meet
investor redemptions.
INDEMNIFICATIONS -- Under the corporation's organizational documents, its
officers and directors are indemnified against certain liabilities arising out
of the performance of their duties to the fund. In addition, in the normal
course of business, the fund enters into contracts that provide general
indemnifications. The fund's maximum exposure under these arrangements is
unknown as this would involve future claims that may be made against the fund.
The risk of material loss from such claims is considered by management to be
remote.
USE OF ESTIMATES -- The financial statements are prepared in conformity with
accounting principles generally accepted in the United States of America, which
may require management to make certain estimates and assumptions at the date of
the financial statements. Actual results could differ from these estimates.
(continued)
- ------
16
Notes to Financial Statements
OCTOBER 31, 2006
2. FEES AND TRANSACTIONS WITH RELATED PARTIES
MANAGEMENT FEES -- The corporation has entered into a Management Agreement with
ACIM, under which ACIM provides the fund with investment advisory and management
services in exchange for a single, unified management fee (the fee) per class.
The Agreement provides that all expenses of the fund, except brokerage
commissions, taxes, interest, fees and expenses of those directors who are not
considered "interested persons" as defined in the 1940 Act (including counsel
fees) and extraordinary expenses, will be paid by ACIM. The fee is computed and
accrued daily based on the daily net assets of the specific class of shares of
the fund and paid monthly in arrears. For funds with a stepped fee schedule, the
rate of the fee is determined by applying a fee rate calculation formula. This
formula takes into account all of the investment advisor's assets under
management in the fund's investment strategy (strategy assets) to calculate the
appropriate fee rate for the fund. The strategy assets include the fund's assets
and the assets of other clients of the investment advisor that are not in the
American Century family of funds, but that have the same investment team and
investment strategy.
Effective August 1, 2006, the fund modified its management fee schedule,
resulting in lower fee rates and higher breakpoints. There was a reduction of
the effective annual management fee for the year ended October 31, 2006
resulting from this change.
Effective August 1, 2006, the annual management fee schedule for each class of
the fund is as follows:
- --------------------------------------------------------------------------------
INVESTOR INSTITUTIONAL
CLASS CLASS
- --------------------------------------------------------------------------------
STRATEGY ASSETS
- --------------------------------------------------------------------------------
First $500 million 1.25% 1.05%
- --------------------------------------------------------------------------------
Next $500 million 1.10% 0.90%
- --------------------------------------------------------------------------------
Over $1 billion 1.00% 0.80%
- --------------------------------------------------------------------------------
The effective annual management fee for each class of the fund for the year
ended October 31, 2006 was 1.45% and 1.25% for the Investor Class and
Institutional Class, respectively.
RELATED PARTIES -- Certain officers and directors of the corporation are also
officers and/or directors, and, as a group, controlling stockholders of American
Century Companies, Inc. (ACC), the parent of the corporation's investment
advisor, ACIM, the distributor of the corporation, American Century Investment
Services, Inc., and the corporation's transfer agent, American Century Services,
LLC.
The fund has a bank line of credit agreement with JPMorgan Chase Bank (JPMCB).
JPMCB is a custodian of the fund and a wholly owned subsidiary of JPMorgan Chase
& Co. (JPM). JPM is an equity investor in ACC.
3. INVESTMENT TRANSACTIONS
Purchase and sales of investment securities, excluding short-term investments,
for the year ended October 31, 2006, were $594,271,181 and $640,897,817,
respectively.
(continued)
- ------
17
Notes to Financial Statements
OCTOBER 31, 2006
4. CAPITAL SHARE TRANSACTIONS
Transactions in shares of the fund were as follows:
- --------------------------------------------------------------------------------
SHARES AMOUNT
- --------------------------------------------------------------------------------
INVESTOR CLASS
- --------------------------------------------------------------------------------
YEAR ENDED OCTOBER 31, 2006
SHARES AUTHORIZED 200,000,000
================================================================================
Sold 1,125,207 $ 6,920,171
- -------------------------------------------------
Redeemed (8,068,501) (48,716,333)(1)
- --------------------------------------------------------------------------------
Net increase (decrease) (6,943,294) $(41,796,162)
================================================================================
YEAR ENDED OCTOBER 31, 2005
SHARES AUTHORIZED 200,000,000
================================================================================
Sold 846,849 $ 4,523,633
- -------------------------------------------------
Redeemed (12,307,748) (66,288,038)(2)
- --------------------------------------------------------------------------------
Net increase (decrease) (11,460,899) $(61,764,405)
================================================================================
INSTITUTIONAL CLASS
- --------------------------------------------------------------------------------
YEAR ENDED OCTOBER 31, 2006
SHARES AUTHORIZED 50,000,000
================================================================================
Sold 176,461 $ 1,106,406
- -------------------------------------------------
Redeemed (410,030) (2,535,150)(3)
- --------------------------------------------------------------------------------
Net increase (decrease) (233,569) $(1,428,744)
================================================================================
YEAR ENDED OCTOBER 31, 2005
SHARES AUTHORIZED 50,000,000
================================================================================
Sold 166,129 $ 917,669
- -------------------------------------------------
Redeemed (565,545) (3,083,914)
- --------------------------------------------------------------------------------
Net increase (decrease) (399,416) $(2,166,245)
================================================================================
(1) Net of redemption fees of $98,958.
(2) Net of redemption fees of $334,934.
(3) Net of redemption fees of $1,699.
5. BANK LINE OF CREDIT
The fund, along with certain other funds managed by ACIM or ACGIM, has a
$500,000,000 unsecured bank line of credit agreement with JPMCB. The fund may
borrow money for temporary or emergency purposes to fund shareholder
redemptions. Borrowings under the agreement bear interest at the Federal Funds
rate plus 0.50%. The fund did not borrow from the line during the year ended
October 31, 2006.
6. RISK FACTORS
The fund's investment process may involve high portfolio turnover and high
capital gains distributions. In addition, its investment approach may involve
higher volatility and risk.
(continued)
- ------
18
Notes to Financial Statements
OCTOBER 31, 2006
7. FEDERAL TAX INFORMATION
The book-basis character of distributions made during the year from net
investment income or net realized gains may differ from their ultimate
characterization for federal income tax purposes. These differences reflect the
differing character of certain income items and net realized gains and losses
for financial statement and tax purposes, and may result in reclassification
among certain capital accounts on the financial statements. There were no
distributions paid by the fund during the years ended October 31, 2006 and
October 31, 2005.
As of October 31, 2006, the components of distributable earnings on a tax-basis
and the federal tax cost of investments were as follows:
- --------------------------------------------------------------------------------
Federal tax cost of investments $151,573,843
================================================================================
Gross tax appreciation of investments $15,855,588
- --------------------------------------------------------------
Gross tax depreciation of investments (1,168,421)
- --------------------------------------------------------------------------------
Net tax appreciation (depreciation) of investments $14,687,167
================================================================================
Net tax appreciation (depreciation)
on derivatives and translation of assets and
liabilities in foreign currencies --
- --------------------------------------------------------------------------------
Net tax appreciation (depreciation) $14,687,167
================================================================================
Undistributed ordinary income --
- --------------------------------------------------------------
Accumulated capital losses $(69,794,205)
- --------------------------------------------------------------------------------
The difference between book-basis and tax-basis cost and unrealized appreciation
(depreciation) is attributable primarily to the tax deferral of losses on wash
sales.
The accumulated capital losses listed above represent net capital loss
carryovers that may be used to offset future realized capital gains for federal
income tax purposes. The capital loss carryovers expire as follows:
- --------------------------------------------------------------------------------
2009 2010
- --------------------------------------------------------------------------------
$(37,476,753) $(32,317,452)
- --------------------------------------------------------------------------------
8. RECENTLY ISSUED ACCOUNTING STANDARDS
In June 2006, the Financial Accounting Standards Board (FASB) issued
Interpretation No. 48, "Accounting for Uncertainty in Income Taxes -- an
Interpretation of FASB Statement No. 109" (FIN 48). FIN 48 establishes a minimum
threshold for financial statement recognition of the benefit of positions taken
in filing tax returns (including whether an entity is taxable in a particular
jurisdiction), and requires certain expanded tax disclosures. FIN 48 is
effective for fiscal years beginning after December 15, 2006, and is to be
applied to all open tax years as of the date of effectiveness. The FASB issued
Statement of Financial Accounting Standards No. 157, "Fair Value Measurements"
(FAS 157), in September 2006, which is effective for fiscal years beginning
after November 15, 2007. FAS 157 defines fair value, establishes a framework for
measuring fair value and expands the required financial statement disclosures
about fair value measurements. Management is currently evaluating the impact of
adopting FIN 48 and FAS 157.
- ------
19
Veedot - Financial Highlights
For a Share Outstanding Throughout the Years Ended October 31
- --------------------------------------------------------------------------------
INVESTOR CLASS
- --------------------------------------------------------------------------------
2006 2005 2004 2003 2002
- --------------------------------------------------------------------------------
PER-SHARE DATA
- --------------------------------------------------------------------------------
Net Asset Value,
Beginning of Period $5.57 $5.06 $4.99 $3.77 $4.32
- --------------------------------------------------------------------------------
Income From
Investment Operations
- -------------------------
Net Investment
Income (Loss)(1) (0.02) (0.03) (0.03) (0.03) (0.01)
- -------------------------
Net Realized and
Unrealized Gain (Loss) 0.62 0.53 0.09 1.24 (0.55)
- --------------------------------------------------------------------------------
Total From
Investment Operations 0.60 0.50 0.06 1.21 (0.56)
- --------------------------------------------------------------------------------
Redemption Fees(1) --(2) 0.01 0.01 0.01 0.01
- --------------------------------------------------------------------------------
Net Asset Value,
End of Period $6.17 $5.57 $5.06 $4.99 $3.77
================================================================================
TOTAL RETURN(3) 10.77% 10.08% 1.40% 32.36% (12.73)%
- --------------------------------------------------------------------------------
RATIOS/SUPPLEMENTAL DATA
- --------------------------------------------------------------------------------
Ratio of Operating
Expenses to
Average Net Assets 1.45% 1.50% 1.50% 1.50% 1.50%
- -------------------------
Ratio of Net
Investment Income (Loss)
to Average Net Assets (0.39)% (0.51)% (0.57)% (0.68)% (0.31)%
- -------------------------
Portfolio Turnover Rate 330% 399% 344% 415% 330%
- -------------------------
Net Assets,
End of Period
(in thousands) $154,374 $178,078 $219,618 $228,724 $187,451
- --------------------------------------------------------------------------------
(1) Computed using average shares outstanding throughout the period.
(2) Per-share amount was less than $0.005.
(3) Total return assumes reinvestment of net investment income and capital
gains distributions, if any, and does not reflect applicable redemption
fees. The total return of the classes may not precisely reflect the class
expense differences because of the impact of calculating the net asset
values to two decimal places. If net asset values were calculated to three
decimal places, the total return differences would more closely reflect the
class expense differences. The calculation of net asset values to two
decimal places is made in accordance with SEC guidelines and does not result
in any gain or loss of value between one class and another.
See Notes to Financial Statements.
- ------
20
Veedot - Financial Highlights
For a Share Outstanding Throughout the Years Ended October 31
- --------------------------------------------------------------------------------
INSTITUTIONAL CLASS
- --------------------------------------------------------------------------------
2006 2005 2004 2003 2002
- --------------------------------------------------------------------------------
PER-SHARE DATA
- --------------------------------------------------------------------------------
Net Asset Value,
Beginning of Period $5.63 $5.10 $5.02 $3.79 $4.33
- --------------------------------------------------------------------------------
Income From
Investment Operations
- -------------------------
Net Investment
Income (Loss)(1) (0.01) (0.02) (0.02) (0.02) --(2)
- -------------------------
Net Realized and
Unrealized Gain (Loss) 0.63 0.54 0.09 1.24 (0.55)
- --------------------------------------------------------------------------------
Total From
Investment Operations 0.62 0.52 0.07 1.22 (0.55)
- --------------------------------------------------------------------------------
Redemption Fees(1) --(2) 0.01 0.01 0.01 0.01
- --------------------------------------------------------------------------------
Net Asset Value,
End of Period $6.25 $5.63 $5.10 $5.02 $3.79
================================================================================
TOTAL RETURN(3) 11.01% 10.39% 1.59% 32.45% (12.47)%
- --------------------------------------------------------------------------------
RATIOS/SUPPLEMENTAL DATA
- --------------------------------------------------------------------------------
Ratio of Operating
Expenses to
Average Net Assets 1.25% 1.30% 1.30% 1.30% 1.30%
- -------------------------
Ratio of Net
Investment Income (Loss)
to Average Net Assets (0.19)% (0.31)% (0.37)% (0.48)% (0.11)%
- -------------------------
Portfolio Turnover Rate 330% 399% 344% 415% 330%
- -------------------------
Net Assets, End of
Period (in thousands) $11,237 $11,440 $12,400 $12,458 $8,709
- --------------------------------------------------------------------------------
(1) Computed using average shares outstanding throughout the period.
(2) Per-share amount was less than $0.005.
(3) Total return assumes reinvestment of net investment income and capital
gains distributions, if any, and does not reflect applicable redemption
fees. The total return of the classes may not precisely reflect the class
expense differences because of the impact of calculating the net asset
values to two decimal places. If net asset values were calculated to three
decimal places, the total return differences would more closely reflect the
class expense differences. The calculation of net asset values to two
decimal places is made in accordance with SEC guidelines and does not result
in any gain or loss of value between one class and another.
See Notes to Financial Statements.
- ------
21
Report of Independent Registered Public Accounting Firm
The Board of Directors and Shareholders,
American Century Mutual Funds, Inc.:
We have audited the accompanying statement of assets and liabilities, including
the schedule of investments, of Veedot Fund, (the "Fund"), one of the mutual
funds comprising American Century Mutual Funds, Inc., as of October 31, 2006,
and the related statement of operations for the year then ended, the statements
of changes in net assets for each of the two years in the period then ended, and
the financial highlights for each of the five years in the period then ended.
These financial statements and financial highlights are the responsibility of
the Fund's management. Our responsibility is to express an opinion on these
financial statements and financial highlights based on our audits.
We conducted our audits in accordance with the standards of the Public Company
Accounting Oversight Board (United States). Those standards require that we plan
and perform the audit to obtain reasonable assurance about whether the financial
statements and financial highlights are free of material misstatement. The Fund
is not required to have, nor were we engaged to perform, an audit of its
internal control over financial reporting. Our audits included consideration of
internal control over financial reporting as a basis for designing audit
procedures that are appropriate in the circumstances, but not for the purpose of
expressing an opinion on the effectiveness of the Fund's internal control over
financial reporting. Accordingly, we express no such opinion. An audit also
includes examining, on a test basis, evidence supporting the amounts and
disclosures in the financial statements, assessing the accounting principles
used and significant estimates made by management, as well as evaluating the
overall financial statement presentation. Our procedures included confirmation
of securities owned as of October 31, 2006, by correspondence with the custodian
and brokers; where replies were not received from brokers, we performed other
auditing procedures. We believe that our audits provide a reasonable basis for
our opinion.
In our opinion, the financial statements and financial highlights referred to
above present fairly, in all material respects, the financial position of Veedot
Fund as of October 31, 2006, the results of its operations for the year then
ended, the changes in its net assets for each of the two years in the period
then ended, and the financial highlights for each of the five years in the
period then ended, in conformity with accounting principles generally accepted
in the United States of America.
Deloitte & Touche LLP
Kansas City, Missouri
December 14, 2006
- ------
22
Management
The individuals listed below serve as directors or officers of the fund. Each
director serves until his or her successor is duly elected and qualified or
until he or she retires. Mandatory retirement age for independent directors is
72. Those listed as interested directors are "interested" primarily by virtue of
their engagement as officers of American Century Companies, Inc. (ACC) or its
wholly owned, direct or indirect, subsidiaries, including the fund's investment
advisor, American Century Investment Management, Inc. (ACIM); the fund's
principal underwriter, American Century Investment Services, Inc. (ACIS); and
the fund's transfer agent, American Century Services, LLC (ACS).
The other directors (more than three-fourths of the total number) are
independent; that is, they have never been employees or officers of, and have no
financial interest in, ACC or any of its wholly owned subsidiaries, including
ACIM, ACIS, and ACS. The directors serve in this capacity for seven registered
investment companies in the American Century family of funds.
All persons named as officers of the fund also serve in a similar capacity for
the other 14 investment companies advised by ACIM or American Century Global
Investment Management, Inc. (ACGIM), unless otherwise noted. Only officers with
policy-making functions are listed. No officer is compensated for his or her
service as an officer of the fund. The listed officers are interested persons of
the fund and are appointed or re-appointed on an annual basis.
INDEPENDENT DIRECTORS
- --------------------------------------------------------------------------------
THOMAS A. BROWN
4500 Main Street, Kansas City, MO 64111
YEAR OF BIRTH: 1940
POSITION(S) HELD WITH FUND: Director
FIRST YEAR OF SERVICE: 1980
PRINCIPAL OCCUPATION(S) DURING PAST 5 YEARS: Retired, Formerly Chief Executive
Officer/Treasurer, Associated Bearings Company
NUMBER OF PORTFOLIOS IN FUND COMPLEX OVERSEEN BY DIRECTOR: 66
OTHER DIRECTORSHIPS HELD BY DIRECTOR: None
- --------------------------------------------------------------------------------
ANDREA C. HALL, PH.D.
4500 Main Street, Kansas City, MO 64111
YEAR OF BIRTH: 1945
POSITION(S) HELD WITH FUND: Director
FIRST YEAR OF SERVICE: 1997
PRINCIPAL OCCUPATION(S) DURING PAST 5 YEARS: Senior Vice President, Midwest
Research Institute
NUMBER OF PORTFOLIOS IN FUND COMPLEX OVERSEEN BY DIRECTOR: 66
OTHER DIRECTORSHIPS HELD BY DIRECTOR: None
- --------------------------------------------------------------------------------
D.D. (DEL) HOCK
4500 Main Street, Kansas City, MO 64111
YEAR OF BIRTH: 1935
POSITION(S) HELD WITH FUND: Director
FIRST YEAR OF SERVICE: 1996
PRINCIPAL OCCUPATION(S) DURING PAST 5 YEARS: Retired, formerly Chairman, Public
Service Company of Colorado
NUMBER OF PORTFOLIOS IN FUND COMPLEX OVERSEEN BY DIRECTOR: 66
OTHER DIRECTORSHIPS HELD BY DIRECTOR: Director, Allied Motion Technologies, Inc.
- --------------------------------------------------------------------------------
(continued)
- ------
23
Management
INDEPENDENT DIRECTORS (CONTINUED)
- --------------------------------------------------------------------------------
JAMES A. OLSON
4500 Main Street, Kansas City, MO 64111
YEAR OF BIRTH: 1942
POSITION(S) HELD WITH FUND: Advisory Board Member
FIRST YEAR OF SERVICE: 2006
PRINCIPAL OCCUPATION(S) DURING PAST 5 YEARS: Principal, Plaza Belmont LLC; Chief
Financial Officer, Plaza Belmont LLC (September 1999 to July 2006)
NUMBER OF PORTFOLIOS IN FUND COMPLEX OVERSEEN BY DIRECTOR: 66
OTHER DIRECTORSHIPS HELD BY DIRECTOR: Director, Saia, Inc. and Entertainment
Properties Trust
- --------------------------------------------------------------------------------
DONALD H. PRATT
4500 Main Street, Kansas City, MO 64111
YEAR OF BIRTH: 1937
POSITION(S) HELD WITH FUND: Director, Chairman of the Board
FIRST YEAR OF SERVICE: 1995
PRINCIPAL OCCUPATION(S) DURING PAST 5 YEARS: Chairman, Western Investments,
Inc.; Retired Chairman of the Board, Butler Manufacturing Company
NUMBER OF PORTFOLIOS IN FUND COMPLEX OVERSEEN BY DIRECTOR: 66
OTHER DIRECTORSHIPS HELD BY DIRECTOR: None
- --------------------------------------------------------------------------------
GALE E. SAYERS
4500 Main Street, Kansas City, MO 64111
YEAR OF BIRTH: 1943
POSITION(S) HELD WITH FUND: Director
FIRST YEAR OF SERVICE: 2000
PRINCIPAL OCCUPATION(S) DURING PAST 5 YEARS: President, Chief Executive Officer
and Founder, Sayers40, Inc., a technology products and service provider
NUMBER OF PORTFOLIOS IN FUND COMPLEX OVERSEEN BY DIRECTOR: 66
OTHER DIRECTORSHIPS HELD BY DIRECTOR: Director, Triad Hospitals, Inc.
- --------------------------------------------------------------------------------
M. JEANNINE STRANDJORD
4500 Main Street, Kansas City, MO 64111
YEAR OF BIRTH: 1945
POSITION(S) HELD WITH FUND: Director
FIRST YEAR OF SERVICE: 1994
PRINCIPAL OCCUPATION(S) DURING PAST 5 YEARS: Retired, formerly Senior Vice
President, Sprint Corporation
NUMBER OF PORTFOLIOS IN FUND COMPLEX OVERSEEN BY DIRECTOR: 66
OTHER DIRECTORSHIPS HELD BY DIRECTOR: Director, DST Systems, Inc.; Director,
Euronet Worldwide, Inc.
- --------------------------------------------------------------------------------
TIMOTHY S. WEBSTER
4500 Main Street, Kansas City, MO 64111
YEAR OF BIRTH: 1961
POSITION(S) HELD WITH FUND: Director
FIRST YEAR OF SERVICE: 2001
PRINCIPAL OCCUPATION(S) DURING PAST 5 YEARS: President and Chief Executive
Officer, American Italian Pasta Company (1992 to December 2005)
NUMBER OF PORTFOLIOS IN FUND COMPLEX OVERSEEN BY DIRECTOR: 66
OTHER DIRECTORSHIPS HELD BY DIRECTOR: None
- --------------------------------------------------------------------------------
(continued)
- ------
24
Management
INTERESTED DIRECTORS
- --------------------------------------------------------------------------------
JAMES E. STOWERS, JR.(1)
4500 Main Street, Kansas City, MO 64111
YEAR OF BIRTH: 1924
POSITION(S) HELD WITH FUND: Director, Co-Vice Chairman
FIRST YEAR OF SERVICE: 1958
PRINCIPAL OCCUPATION(S) DURING PAST 5 YEARS: Founder, Director and Controlling
Shareholder, ACC; Chairman, ACC (January 1995 to December 2004); Director, ACIM,
ACGIM, ACS, ACIS and other ACC subsidiaries
NUMBER OF PORTFOLIOS IN FUND COMPLEX OVERSEEN BY DIRECTOR: 66
OTHER DIRECTORSHIPS HELD BY DIRECTOR: None
- --------------------------------------------------------------------------------
JAMES E. STOWERS III(1)
4500 Main Street, Kansas City, MO 64111
YEAR OF BIRTH: 1959
POSITION(S) HELD WITH FUND: Director, Co-Vice Chairman
FIRST YEAR OF SERVICE: 1990
PRINCIPAL OCCUPATION(S) DURING PAST 5 YEARS: Chairman, ACC (January 2005 to
present); Co-Chairman, ACC (September 2000 to December 2004); Chairman, ACS and
other ACC subsidiaries (April 2005 to September 2006); Director, ACC, ACIM,
ACGIM, ACS, ACIS and other ACC subsidiaries
NUMBER OF PORTFOLIOS IN FUND COMPLEX OVERSEEN BY DIRECTOR: 66
OTHER DIRECTORSHIPS HELD BY DIRECTOR: None
- --------------------------------------------------------------------------------
(1) James E. Stowers, Jr. is the father of James E. Stowers III.
OFFICERS
- --------------------------------------------------------------------------------
WILLIAM M. LYONS
4500 Main Street, Kansas City, MO 64111
YEAR OF BIRTH: 1955
POSITION(S) HELD WITH FUND: President
FIRST YEAR OF SERVICE: 2000
PRINCIPAL OCCUPATION(S) DURING PAST 5 YEARS: Chief Executive Officer, ACC
(September 2000 to present); President, ACC (June 1997 to present). Also serves
as: Chairman, ACIM, ACGIM, ACS, ACIS and other ACC subsidiaries; Chief Executive
Officer, ACIM, ACGIM, ACIS and other ACC subsidiaries (October 2000 to October
2006); President, ACIM, ACGIM and other ACC subsidiaries (September 2002 to
September 2006); Executive Vice President, ACS (January 2005 to September 2006);
Director, ACC, ACIM, ACGIM, ACS, ACIS and other ACC subsidiaries
- --------------------------------------------------------------------------------
JONATHAN THOMAS
4500 Main Street, Kansas City, MO 64111
YEAR OF BIRTH: 1963
POSITION(S) HELD WITH FUND: Executive Vice President
FIRST YEAR OF SERVICE: 2005
PRINCIPAL OCCUPATION(S) DURING PAST 5 YEARS: Chief Administrative Officer, ACC
(February 2006 to present); Executive Vice President, ACC (November 2005 to
present); Also serves as: President and Chief Executive Officer, ACS; Chief
Financial Officer and Chief Accounting Officer, ACIM, ACGIM, ACS, ACIS and other
ACC subsidiaries; Managing Director, Morgan Stanley (March 2000 to November
2005)
- --------------------------------------------------------------------------------
MARYANNE ROEPKE
4500 Main Street, Kansas City, MO 64111
YEAR OF BIRTH: 1956
POSITION(S) HELD WITH FUND: Chief Compliance Officer and Senior Vice President
FIRST YEAR OF SERVICE: 2000
PRINCIPAL OCCUPATION(S) DURING PAST 5 YEARS: Chief Compliance Officer, ACIM,
ACGIM and ACS (August 2006 to present); Assistant Treasurer, ACC (January 1995
to August 2006); Treasurer and Chief Financial Officer, various American Century
funds (July 2000 to August 2006); Also serves as: Senior Vice President, ACS
- --------------------------------------------------------------------------------
(continued)
- ------
25
Management
OFFICERS (CONTINUED)
- --------------------------------------------------------------------------------
DAVID C. TUCKER
4500 Main Street, Kansas City, MO 64111
YEAR OF BIRTH: 1958
POSITION(S) HELD WITH FUND: Senior Vice President and General Counsel
FIRST YEAR OF SERVICE: 2000
PRINCIPAL OCCUPATION(S) DURING PAST 5 YEARS: Vice President, ACC (February 2001
to present); General Counsel, ACC (June 1998 to present); Also serves as: Senior
Vice President and General Counsel, ACIM, ACGIM, ACS, ACIS and other ACC
subsidiaries
- --------------------------------------------------------------------------------
ROBERT LEACH
4500 Main Street, Kansas City, MO 64111
YEAR OF BIRTH: 1966
POSITION(S) HELD WITH FUND: Vice President, Treasurer and Chief Financial
Officer
FIRST YEAR OF SERVICE: 1997
PRINCIPAL OCCUPATION(S) DURING PAST 5 YEARS: Vice President, ACS (February 2000
to present); Controller, various American Century funds (June 1997 to September
2006)
- --------------------------------------------------------------------------------
C. JEAN WADE
4500 Main Street, Kansas City, MO 64111
YEAR OF BIRTH: 1964
POSITION(S) HELD WITH FUND: Controller
FIRST YEAR OF SERVICE: 2006
PRINCIPAL OCCUPATION(S) DURING PAST 5 YEARS: Vice President, ACS (February 2000
to present)
- --------------------------------------------------------------------------------
JON ZINDEL
4500 Main Street, Kansas City, MO 64111
YEAR OF BIRTH: 1967
POSITION(S) HELD WITH FUND: Tax Officer
FIRST YEAR OF SERVICE: 1997
PRINCIPAL OCCUPATION(S) DURING PAST 5 YEARS: Senior Vice President, ACC (August
2006 to present); Vice President, ACC and certain ACC subsidiaries (October
2001 to August 2006); Vice President, Corporate Tax, ACS (April 1998 to August
2006); Also serves as: Senior Vice President, ACIM, ACGIM, ACS, ACIS and other
ACC subsidiaries
- --------------------------------------------------------------------------------
The SAI has additional information about the fund's directors and is available
without charge, upon request, by calling 1-800-345-2021.
- ------
26
Approval of Management Agreement for Veedot
Under Section 15(c) of the Investment Company Act, contracts for investment
advisory services are required to be reviewed, evaluated and approved by a
majority of a fund's independent directors or trustees (the "Directors") each
year. At American Century, this process is referred to as the "15(c) Process."
As a part of this process, the board reviews fund performance, shareholder
services, audit and compliance information, and a variety of other reports from
the advisor concerning fund operations. In addition to this annual review, the
board of directors oversees and evaluates on a continuous basis at its quarterly
meetings the nature and quality of significant services performed by the
advisor, fund performance, audit and compliance information, and a variety of
other reports relating to fund operations. The board, or committees of the
board, also holds special meetings as needed.
Under a Securities and Exchange Commission rule, each fund is required to
disclose in its annual or semiannual report, as appropriate, the material
factors and conclusions that formed the basis for the board's approval or
renewal of any advisory agreements within the fund's most recently completed
fiscal half-year period.
ANNUAL CONTRACT REVIEW PROCESS
As part of the annual 15(c) Process undertaken during the most recent fiscal
half-year period, the Directors reviewed extensive data and information compiled
by the advisor and certain independent providers of evaluative data (the "15(c)
Providers") concerning Veedot (the "fund") and the services provided to the fund
under the management agreement. The information considered and the discussions
held at the meetings included, but were not limited to:
* the nature, extent and quality of investment management, shareholder services
and other services provided to the fund under the management agreement;
* reports on the advisor's activities relating to the wide range of programs
and services the advisor provides to the fund and its shareholders on a
routine and non-routine basis;
* data comparing the cost of owning the fund to the cost of owning a similar
fund;
* data comparing the fund's performance to appropriate benchmarks and/or a peer
group of other mutual funds with similar investment objectives and
strategies;
* financial data showing the profitability of the fund to the advisor and the
overall profitability of the advisor; and
* data comparing services provided and charges to other investment management
clients of the advisor.
In keeping with its practice, the fund's board of directors held two regularly
scheduled meetings and one special meeting to review and discuss the information
provided by the advisor and to complete its negotiations with the advisor
regarding the renewal of the management agreement, including the setting of the
applicable advisory fee. The board also had the benefit of
(continued)
- ------
27
Approval of Management Agreement for Veedot
the advice of its independent counsel throughout the period.
FACTORS CONSIDERED
The Directors considered all of the information provided by the advisor, the
15(c) Providers, and the board's independent counsel, and evaluated such
information for each fund for which the board has responsibility. The Directors
did not identify any single factor as being all-important or controlling, and
each Director may have attributed different levels of importance to different
factors. In deciding to renew the agreement under the terms ultimately
determined by the board to be appropriate, the Directors' decision was based on
the following factors.
NATURE, EXTENT AND QUALITY OF SERVICES -- GENERALLY. Under the management
agreement, the advisor is responsible for providing or arranging for all
services necessary for the operation of the fund. The board noted that under the
management agreement, the advisor provides or arranges at its own expense a wide
variety of services including:
* fund construction and design
* portfolio security selection
* initial capitalization/funding
* securities trading
* custody of fund assets
* daily valuation of the fund's portfolio
* shareholder servicing and transfer agency, including shareholder
confirmations, recordkeeping and communications
* legal services
* regulatory and portfolio compliance
* financial reporting
* marketing and distribution
The Directors noted that many of these services have expanded over time both in
terms of quantity and complexity in response to shareholder demands, competition
in the industry and the changing regulatory environment. In performing their
evaluation, the Directors considered information received in connection with the
annual review, as well as information provided on an ongoing basis at their
regularly scheduled board and committee meetings.
INVESTMENT MANAGEMENT SERVICES. The nature of the investment management services
provided is quite complex and allows fund shareholders access to professional
money management, instant diversification of their investments within an asset
class, the opportunity to easily diversify among asset classes, and liquidity.
In evaluating investment performance, the board expects the advisor to manage
the fund in accordance with its investment objectives and approved strategies.
In providing these services, the advisor utilizes teams of investment
professionals (portfolio managers, analysts, research assistants, and securities
traders) who require extensive information technology, research, training,
compliance and other systems to conduct their business. At each quarterly
meeting the Directors review investment performance information for the fund,
together with comparative information for appropriate bench-
(continued)
- ------
28
Approval of Management Agreement for Veedot
marks and peer groups of funds managed similarly to the fund. The Directors also
review detailed performance information during the 15(c) Process comparing the
fund's performance with that of similar funds not managed by the advisor. If
performance concerns are identified, the Directors discuss with the advisor the
reasons for such results (e.g., market conditions, security selection) and any
efforts being undertaken to improve performance. The fund's performance fell
below the median for both the one and three year periods during the past year.
The board discussed the fund's performance with the advisor and was satisfied
with the efforts being undertaken by the advisor.
SHAREHOLDER AND OTHER SERVICES. The advisor provides the fund with a
comprehensive package of transfer agency, shareholder, and other services. The
Directors review reports and evaluations of such services at their regular
quarterly meetings, including the annual meeting concerning contract review, and
reports to the board. These reports include, but are not limited to, information
regarding the operational efficiency and accuracy of the shareholder and
transfer agency services provided, staffing levels, shareholder satisfaction (as
measured by external as well as internal sources), technology support, new
products and services offered to fund shareholders, securities trading
activities, portfolio valuation services, auditing services, and legal and
operational compliance activities. Certain aspects of shareholder and transfer
agency service level efficiency and the quality of securities trading activities
are measured by independent third party providers and are presented in
comparison to other fund groups not managed by the advisor.
COSTS OF SERVICES PROVIDED AND PROFITABILITY TO THE ADVISOR. The advisor
provides detailed information concerning its cost of providing various services
to the fund, its profitability in managing the fund, its overall profitability,
and its financial condition. The Directors have reviewed with the advisor the
methodology used to prepare this financial information. This financial
information regarding the advisor is considered in order to evaluate the
advisor's financial condition, its ability to continue to provide services under
the management agreement, and the reasonableness of the current management fee.
ETHICS OF THE ADVISOR. The Directors generally consider the advisor's commitment
to providing quality services to shareholders and to conducting its business
ethically. They noted that the advisor's practices generally meet or exceed
industry best practices and that the advisor was not implicated in the industry
scandals of 2003 and 2004.
ECONOMIES OF SCALE. The Directors review reports provided by the advisor on
economies of scale for the complex as a whole and the year-over-year changes in
revenue, costs, and profitability. The Directors concluded that economies of
scale are difficult to measure and predict with precision, especially on a
fund-by-fund basis. This analysis is also complicated by the additional services
and content provided by the advisor and its reinvest-
(continued)
- ------
29
Approval of Management Agreement for Veedot
ment in its ability to provide and expand those services. Accordingly, the
Directors also seek to evaluate economies of scale by reviewing other
information, such as year-over-year profitability of the advisor generally, the
profitability of its management of the fund specifically, the expenses incurred
by the advisor in providing various functions to the fund, and the breakpoint
fees of competitive funds not managed by the advisor. The Directors believe the
advisor is appropriately sharing economies of scale through its competitive fee
structure, fee breakpoints as the fund increases in size, and through
reinvestment in its business to provide shareholders additional content and
services.
COMPARISON TO OTHER FUNDS' FEES. The fund pays the advisor a single,
all-inclusive (or unified) management fee for providing all services necessary
for the management and operation of the fund, other than brokerage expenses,
taxes, interest, extraordinary expenses, and the fees and expenses of the fund's
independent directors (including their independent legal counsel). Under the
unified fee structure, the advisor is responsible for providing all investment
advisory, custody, audit, administrative, compliance, recordkeeping, marketing
and shareholder services, or arranging and supervising third parties to provide
such services. By contrast, most other funds are charged a variety of fees,
including an investment advisory fee, a transfer agency fee, an administrative
fee, distribution charges and other expenses. Other than their investment
advisory fees and Rule 12b-1 distribution fees, all other components of the
total fees charged by these other funds may be increased without shareholder
approval. The board believes the unified fee structure is a benefit to fund
shareholders because it clearly discloses to shareholders the cost of owning
fund shares, and, since the unified fee cannot be increased without a vote of
fund shareholders, it shifts to the advisor the risk of increased costs of
operating the fund and provides a direct incentive to minimize administrative
inefficiencies. Part of the Directors' analysis of fee levels involves reviewing
certain evaluative data compiled by a 15(c) Provider comparing the fund's
unified fee to the total expense ratio of other funds in the fund's peer group.
The unified fee charged to shareholders of the fund was above the median of the
total expense ratios of its peer group.
COMPARISON TO FEES AND SERVICES PROVIDED TO OTHER CLIENTS OF THE ADVISOR. The
Directors also requested and received information from the advisor concerning
the nature of the services, fees, and profitability of its advisory services to
advisory clients other than the fund. They observed that these varying types of
client accounts require different services and involve different regulatory and
entrepreneurial risks than the management of the fund. The Directors analyzed
this information and concluded that the fees charged and services provided to
the fund were reasonable by comparison.
COLLATERAL BENEFITS DERIVED BY THE ADVISOR. The Directors reviewed information
from the advisor concerning collateral benefits it receives as a result of its
relationship with the fund. They
(continued)
- ------
30
Approval of Management Agreement for Veedot
concluded that the advisor's primary business is managing mutual funds and it
generally does not use the fund or shareholder information to generate profits
in other lines of business, and therefore does not derive any significant
collateral benefits from them. The Directors noted that the advisor receives
proprietary research from broker dealers that execute fund portfolio
transactions and concluded that this research is likely to benefit fund
shareholders. The Directors also determined that the advisor is able to provide
investment management services to certain clients other than the fund, at least
in part, due to its existing infrastructure built to serve the fund complex. The
Directors concluded, however, that the assets of those other clients are not
material to the analysis and, in any event, are included with the assets of the
fund to determine breakpoints in the fund's fee schedule, provided they are
managed using the same investment team and strategy.
CONCLUSIONS OF THE DIRECTORS
As a result of this process, the independent directors, assisted by the advice
of legal counsel independent of the advisor, taking into account all of the
factors discussed above and the information provided by the advisor, negotiated
changes to the breakpoint schedule used to calculate the fund's management fee.
These changes were proposed by the Directors based on their review of the
competitive changes in the mutual fund marketplace and their review of financial
information provided by the advisor. The new schedule, effective August 1, 2006,
contains lower management fees at certain asset levels than under the existing
structure. Following these negotiations with the advisor, the independent
directors concluded that the investment management agreement between the fund
and the advisor is fair and reasonable in light of the services provided and
should be renewed.
- ------
31
Share Class Information
Two classes of shares are authorized for sale by the fund: Investor Class and
Institutional Class. The total expense ratio for Institutional Class shares is
lower than that of Investor Class shares.
INVESTOR CLASS shares are available for purchase in two ways: 1) directly from
American Century without any commissions or other fees; or 2) through certain
financial intermediaries (such as banks, broker-dealers, insurance companies and
investment advisors), which may require payment of a transaction fee to the
financial intermediary.
INSTITUTIONAL CLASS shares are available to large investors such as endowments,
foundations, and retirement plans, and to financial intermediaries serving these
investors. This class recognizes the relatively lower cost of serving
institutional customers and others who invest at least $5 million ($3 million
for endowments and foundations) in an American Century fund or at least $10
million in multiple funds. In recognition of the larger investments and account
balances and comparatively lower transaction costs, the unified management fee
of Institutional Class shares is 0.20% less than the unified management fee of
Investor Class shares.
All classes of shares represent a pro rata interest in the fund and generally
have the same rights and preferences.
- ------
32
Additional Information
RETIREMENT ACCOUNT INFORMATION
As required by law, any distributions you receive from an IRA or certain 403(b),
457 and qualified plans [those not eligible for rollover to an IRA or to another
qualified plan] are subject to federal income tax withholding, unless you elect
not to have withholding apply. Tax will be withheld on the total amount
withdrawn even though you may be receiving amounts that are not subject to
withholding, such as nondeductible contributions. In such case, excess amounts
of withholding could occur. You may adjust your withholding election so that a
greater or lesser amount will be withheld.
If you don't want us to withhold on this amount, you must notify us to not
withhold the federal income tax. Even if you plan to roll over the amount you
withdraw to another tax-deferred account, the withholding rate still applies to
the withdrawn amount unless we have received notice not to withhold federal
income tax prior to the withdrawal. You may notify us in writing or in certain
situations by telephone or through other electronic means. You have the right to
revoke your withholding election at any time and any election you make may
remain in effect until revoked by filing a new election.
Remember, even if you elect not to have income tax withheld, you are liable for
paying income tax on the taxable portion of your withdrawal. If you elect not to
have income tax withheld or you don't have enough income tax withheld, you may
be responsible for payment of estimated tax. You may incur penalties under the
estimated tax rules if your withholding and estimated tax payments are not
sufficient.
State tax will be withheld if, at the time of your distribution, your address is
within one of the mandatory withholding states and you have federal income tax
withheld. State taxes will be withheld from your distribution in accordance with
the respective state rules.
PROXY VOTING GUIDELINES
American Century Investment Management, Inc., the fund's investment advisor, is
responsible for exercising the voting rights associated with the securities
purchased and/or held by the fund. A description of the policies and procedures
the advisor uses in fulfilling this responsibility is available without charge,
upon request, by calling 1-800-345-2021. It is also available on American
Century's website at americancentury.com and on the Securities and Exchange
Commission's website at sec.gov. Information regarding how the investment
advisor voted proxies relating to portfolio securities during the most recent
12-month period ended June 30 is available on the "About Us" page at
americancentury.com. It is also available at sec.gov.
QUARTERLY PORTFOLIO DISCLOSURE
The fund files its complete schedule of portfolio holdings with the Securities
and Exchange Commission (SEC) for the first and third quarters of each fiscal
year on Form N-Q. The fund's Form N-Q is available on the SEC's website at
sec.gov, and may be reviewed and copied at the SEC's Public Reference Room in
Washington, DC. Information on the operation of the Public Reference Room may be
obtained by calling 1-800-SEC-0330. The fund also makes its complete schedule of
portfolio holdings for the most recent quarter of its fiscal year available on
its website at americancentury.com and, upon request, by calling 1-800-345-2021.
- ------
33
Index Definitions
The following indices are used to illustrate investment market, sector, or style
performance or to serve as fund performance comparisons. They are not investment
products available for purchase.
The DOW JONES INDUSTRIAL AVERAGE (DJIA) is a price-weighted average of 30
actively traded blue chip stocks, primarily industrials but including
service-oriented firms. Prepared and published by Dow Jones & Co., it is the
oldest and most widely quoted of all the market indicators.
The NASDAQ COMPOSITE INDEX is a market value-weighted index of all domestic and
international common stocks listed on the Nasdaq stock market.
The RUSSELL 2000(reg.tm) INDEX is a market-capitalization weighted index created
by Frank Russell Company to measure the performance of the 2,000 smallest of the
3,000 largest publicly traded U.S. companies, based on total market
capitalization.
The RUSSELL 3000(reg.tm) INDEX measures the performance of the 3,000 largest
U.S. companies based on total market capitalization, which represents
approximately 98% of the investable U.S. equity market.
The S&P 500 INDEX is a market value-weighted index of the stocks of 500 publicly
traded U.S. companies chosen for market size, liquidity, and industry group
representation that are considered to be leading firms in dominant industries.
Each stock's weight in the index is proportionate to its market value. Created
by Standard & Poor's, it is considered to be a broad measure of U.S. stock
market performance.
- ------
34
Notes
- ------
35
Notes
- ------
36
CONTACT US
AMERICANCENTURY.COM
AUTOMATED INFORMATION LINE:
1-800-345-8765
INVESTOR SERVICES REPRESENTATIVE:
1-800-345-2021 or 816-531-5575
BUSINESS, NOT-FOR-PROFIT,
EMPLOYER-SPONSORED RETIREMENT PLANS:
1-800-345-3533
BANKS AND TRUST COMPANIES, BROKER-DEALERS,
FINANCIAL PROFESSIONALS, INSURANCE COMPANIES:
1-800-345-6488
TELECOMMUNICATIONS DEVICE FOR THE DEAF:
1-800-634-4113 or 816-444-3485
AMERICAN CENTURY MUTUAL FUNDS, INC.
INVESTMENT ADVISOR:
American Century Investment Management, Inc.
Kansas City, Missouri
THIS REPORT AND THE STATEMENTS IT CONTAINS ARE SUBMITTED FOR THE GENERAL
INFORMATION OF OUR SHAREHOLDERS. THE REPORT IS NOT AUTHORIZED FOR DISTRIBUTION
TO PROSPECTIVE INVESTORS UNLESS PRECEDED OR ACCOMPANIED BY AN EFFECTIVE
PROSPECTUS.
American Century Investments PRSRT STD
P.O. Box 419200 U.S. POSTAGE PAID
Kansas City, MO 64141-6200 AMERICAN CENTURY COMPANIES
The American Century Investments logo, American Century and American Century
Investments are service marks of American Century Proprietary Holdings, Inc.
American Century Investment Services, Inc., Distributor
(c)2006 American Century Proprietary Holdings, Inc. All rights reserved.
0612
SH-ANN-52277S
[front cover]
American Century Investments
Annual Report
October 31, 2006
[photo of winter scene]
Capital Value Fund
[american century investments logo and text logo]
Our Message to You
[photo of James E. Stowers III and James E. Stowers, Jr.]
/s/James E. Stowers, Jr.
James E. Stowers, Jr.
FOUNDER
AMERICAN CENTURY COMPANIES, INC.
/s/James E. Stowers III
James E. Stowers III
CHAIRMAN OF THE BOARD
AMERICAN CENTURY COMPANIES, INC.
We are pleased to provide you with the annual report for the American Century
Capital Value Fund for the 12 months ended October 31, 2006. We hope you find
this information helpful in monitoring your investment. Another useful resource
we offer is our website, americancentury.com, where we post quarterly portfolio
commentaries, the views of senior investment officers and analysts, and other
communications about investments, portfolio strategy, personal finance, and the
markets.
In its most recent rankings, Dalbar -- which issues customer satisfaction
ratings and rankings based on website functionality -- ranked
americancentury.com seventh out of the sites provided by the top 25 fund
companies that it believes lead the industry in web-based technology. Our
website earned an "Excellent" rating, Dalbar's highest designation.
For most of 2006, our website has linked visitors to information explaining our
strategic collaboration with Lance Armstrong and the Lance Armstrong Foundation
(LAF). This campaign, featuring Lance, is designed to encourage investors to
take a more active role in planning their financial futures and make every
investment decision count. To learn more about the collaboration and the LAF,
please visit americancentury.com or www.lanceface.com on the Web and click on
the links to related sites.
With the approach of year end and the 2006 tax season, you can also find out
more about December fund distributions and tax information via a link from our
website. We've posted December distribution estimates for over 50 funds, answers
to frequent distribution questions, and online descriptions of all of the tax
information we provide to investors.
If you haven't visited americancentury.com yet, we encourage you to do so...it's
there to serve you. And so are we. As always, we deeply appreciate your
commitment to American Century Investments.
Table of Contents
Market Perspective. . . . . . . . . . . . . . . . . . . . . . . . . . . . . 2
One-Year Total Returns . . . . . . . . . . . . . . . . . . . . . . . . . 2
CAPITAL VALUE
Performance . . . . . . . . . . . . . . . . . . . . . . . . . . . . . . . . 3
Portfolio Commentary. . . . . . . . . . . . . . . . . . . . . . . . . . . . 5
Top Ten Holdings . . . . . . . . . . . . . . . . . . . . . . . . . . . . 5
Top Five Industries . . . . . . . . . . . . . . . . . . . . . . . . . . 6
Types of Investments in Portfolio . . . . . . . . . . . . . . . . . . . 6
Shareholder Fee Example . . . . . . . . . . . . . . . . . . . . . . . . . . 7
Schedule of Investments . . . . . . . . . . . . . . . . . . . . . . . . . . 9
FINANCIAL STATEMENTS
Statement of Assets and Liabilities . . . . . . . . . . . . . . . . . . . .11
Statement of Operations . . . . . . . . . . . . . . . . . . . . . . . . . .12
Statement of Changes in Net Assets. . . . . . . . . . . . . . . . . . . . .13
Notes to Financial Statements . . . . . . . . . . . . . . . . . . . . . . .14
Financial Highlights. . . . . . . . . . . . . . . . . . . . . . . . . . . .20
Report of Independent Registered Public Accounting Firm . . . . . . . . . .23
OTHER INFORMATION
Management. . . . . . . . . . . . . . . . . . . . . . . . . . . . . . . . .24
Approval of Management Agreement for Capital Value. . . . . . . . . . . . .28
Share Class Information . . . . . . . . . . . . . . . . . . . . . . . . . .33
Additional Information. . . . . . . . . . . . . . . . . . . . . . . . . . .34
Index Definitions . . . . . . . . . . . . . . . . . . . . . . . . . . . . .35
The opinions expressed in the Market Perspective and the Portfolio Commentary
reflect those of the portfolio management team as of the date of the report, and
do not necessarily represent the opinions of American Century or any other
person in the American Century organization. Any such opinions are subject to
change at any time based upon market or other conditions and American Century
disclaims any responsibility to update such opinions. These opinions may not be
relied upon as investment advice and, because investment decisions made by
American Century funds are based on numerous factors, may not be relied upon as
an indication of trading intent on behalf of any American Century fund. Security
examples are used for representational purposes only and are not intended as
recommendations to purchase or sell securities. Performance information for
comparative indices and securities is provided to American Century by third
party vendors. To the best of American Century's knowledge, such information is
accurate at the time of printing.
Market Perspective
[photo of Chief Investment Officer]
BY MARK MALLON, CHIEF INVESTMENT OFFICER, AMERICAN CENTURY INVESTMENTS
ECONOMIC GROWTH SURGED, THEN MODERATED
Economic growth -- along with commodity prices, short-term interest rates, and
inflation -- surged early in the 12-month period ended October 31, 2006. But
growth and inflation moderated in the period's second half, which saw the
Federal Reserve end its two-year string of interest rate hikes.
After a hurricane-related slowdown in the fourth quarter of 2005, U.S. gross
domestic product grew in the first quarter of 2006 at a 5.6% annualized pace,
the highest level in more than two years. The Fed steadily raised short-term
interest rates through June to keep inflation in check, including pressures from
soaring commodity prices. The Fed finally snapped its string of rate hikes in
August 2006, leaving its target at 5.25%, a five-year high. By then, economic
growth had slowed, dragged down in part by a cooling housing market.
BEST FISCAL-YEAR STOCK RETURNS SINCE 2003
The Fed's pause and expectations for lower interest rates and mild inflation
going forward helped produce the best U.S. stock returns for a 12-month fiscal
period ended October 31 since 2003. Market rallies beginning and ending the
period offset a late-spring/early-summer selloff. Growth stocks flourished in
the latter rally, but value stocks outperformed growth for the full reporting
period. Likewise, though large-cap stocks gained ground late in the period,
small-caps posted higher returns for the entire 12-month stretch.
In the first half of the 12-month period, investors celebrated a dip in crude
oil prices and strong economic growth by pushing stock prices higher. The
small-cap Russell 2000 Index led the way, surging 18.91%. Sentiment changed in
early May, however, when the Fed made it clear that more interest rate hikes
might be necessary to control inflation. Between April 30 and July 15, the S&P
500 fell 5.28%, and the Russell 2000 more than doubled that loss as investors
desired larger, more stable companies.
The selloff ended in late July after Fed chairman Ben Bernanke predicted
inflation would moderate. The Fed's subsequent rate pause in August and plunging
energy prices allowed stocks to rebound nicely in the last three months of the
reporting period.
ONE-YEAR TOTAL RETURNS
AS OF OCTOBER 31, 2006
- --------------------------------------------------------------------------------
S&P 500 Index 16.34%
- --------------------------------------------------------------------------------
Dow Jones Industrial Average 18.47%
- --------------------------------------------------------------------------------
Nasdaq Composite Index 12.48%
- --------------------------------------------------------------------------------
- ------
2
Capital Value - Performance
TOTAL RETURNS AS OF OCTOBER 31, 2006
----------------------
AVERAGE ANNUAL RETURNS
- --------------------------------------------------------------------------------
SINCE INCEPTION
1 YEAR 5 YEARS INCEPTION DATE
- --------------------------------------------------------------------------------
INVESTOR CLASS 18.03% 10.35% 8.12% 3/31/99
Return After-Tax
on Distributions(1) 17.59% 10.00% 7.75%
Return After-Tax
on Distributions and
Sale of Shares(1) 12.20% 8.84% 6.91%
- --------------------------------------------------------------------------------
RUSSELL 1000 VALUE INDEX(2) 21.46% 11.64% 7.35% --
- --------------------------------------------------------------------------------
Institutional Class 18.24% -- 9.06% 3/1/02
Return After-Tax
on Distributions(1) 17.76% -- 8.75%
Return After-Tax
on Distributions and
Sale of Shares(1) 12.37% -- 7.73%
- --------------------------------------------------------------------------------
Advisor Class 17.62% -- 15.43% 5/14/03
Return After-Tax
on Distributions(1) 17.22% -- 15.24%
Return After-Tax
on Distributions and
Sale of Shares(1) 11.89% -- 13.39%
- --------------------------------------------------------------------------------
(1) After-tax returns are calculated using the historical highest individual
federal marginal income tax rates, and do not reflect the impact of state
and local taxes. Actual after-tax returns depend on an investor's tax
situation and may differ from those shown. After-tax returns shown are not
relevant to investors who hold their fund shares through tax-deferred
arrangements such as 401(k) plans or individual retirement accounts.
(2) Data provided by Lipper Inc. -- A Reuters Company. (c) 2006 Reuters. All
rights reserved. Any copying, republication or redistribution of Lipper
content, including by caching, framing or similar means, is expressly
prohibited without the prior written consent of Lipper. Lipper shall not be
liable for any errors or delays in the content, or for any actions taken in
reliance thereon.
The data contained herein has been obtained from company reports, financial
reporting services, periodicals and other resources believed to be reliable.
Although carefully verified, data on compilations is not guaranteed by
Lipper and may be incomplete. No offer or solicitations to buy or sell any
of the securities herein is being made by Lipper.
Data presented reflect past performance. Past performance is no guarantee of
future results. Current performance may be higher or lower than the performance
shown. Investment return and principal value will fluctuate, and redemption
value may be more or less than original cost. To obtain performance data current
to the most recent month end, please call 1-800-345-2021 or visit
americancentury.com.
Unless otherwise indicated, performance reflects Investor Class shares;
performance for other share classes will vary due to differences in fee
structure. For more information about other share classes available, please
consult the prospectus. Data assumes reinvestment of dividends and capital
gains. Returns for the index are provided for comparison. The fund's total
returns include operating expenses (such as transaction costs and management
fees) that reduce returns, while the total returns of the index do not.
(continued)
- ------
3
Capital Value - Performance
GROWTH OF $10,000 OVER LIFE OF CLASS
$10,000 investment made March 31, 1999
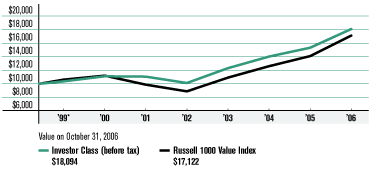
ONE-YEAR RETURNS OVER LIFE OF CLASS
Periods ended October 31
- ---------------------------------------------------------------------------------------
1999* 2000 2001 2002 2003 2004 2005 2006
- ---------------------------------------------------------------------------------------
Investor Class
(before tax) 3.60% 7.23% -0.47% -8.49% 21.67% 13.94% 9.29% 18.03%
- ---------------------------------------------------------------------------------------
Russell 1000
Value Index 6.15% 5.52% -11.86% -10.02% 22.87% 15.45% 11.86% 21.46%
- ---------------------------------------------------------------------------------------
*From 3/31/99, the Investor Class's inception date. Not annualized.
Data presented reflect past performance. Past performance is no guarantee of
future results. Current performance may be higher or lower than the performance
shown. Investment return and principal value will fluctuate, and redemption
value may be more or less than original cost. To obtain performance data current
to the most recent month end, please call 1-800-345-2021 or visit
americancentury.com.
Unless otherwise indicated, performance reflects Investor Class shares;
performance for other share classes will vary due to differences in fee
structure. For more information about other share classes available, please
consult the prospectus. Data assumes reinvestment of dividends and capital
gains, and none of the charts reflect the deduction of taxes that a shareholder
would pay on fund distributions or the redemption of fund shares. Returns for
the index are provided for comparison. The fund's total returns include
operating expenses (such as transaction costs and management fees) that reduce
returns, while the total returns of the index do not.
- ------
4
Capital Value - Portfolio Commentary
PORTFOLIO MANAGERS: CHUCK RITTER, BRENDAN HEALY, AND MARK MALLON
PERFORMANCE SUMMARY
For the 12 months ended October 31, 2006, Capital Value gained 18.03%,* its best
fiscal-year return since 2003. By comparison, its benchmark, the Russell 1000
Value Index, gained 21.46% and the broader market, as measured by the S&P 500,
returned 16.34%.**
As outlined in the Market Perspective on page 2, a pause in the Federal
Reserve's interest rate hikes and expectations for lower interest rates and mild
inflation going forward helped produce U.S. stock index returns in the 10% - 25%
range for the 12-month period. In relative terms, value stocks outperformed for
the period, helping us outpace the S&P 500. Amid mixed economic signals,
investors rediscovered the kinds of companies we find appealing, gravitating
toward investments in large, value-oriented firms with reliable earnings.
It's worth mentioning Capital Value's solid performance since its March 31,
1999, inception. Our consistent, patient approach has produced an average annual
return of 8.12%, compared with the 7.35% return of its benchmark and the 2.51%
return of the S&P 500 for the same period.
FINANCIALS: THE TOP CONTRIBUTOR
Capital Value's stake in the financials sector, its largest sector position,
made the biggest contribution to total return. Diversified financial services
firms were the strongest performers, and all of our holdings in the
industry--Bank of America, JPMorgan Chase, and Citigroup--finished among the
top-contributing stocks.
The energy sector was another source of strength on an absolute basis. We
focused on diversified multinational oil and gas companies and remained
selective, holding only a handful of names. Though it was a volatile period for
energy stocks as oil prices came off their highs, we sidestepped broader damage,
and most of our holdings--including Exxon Mobil, the top-contributing
stock--posted gains.
Holdings in the telecommunications services sector represented additional bright
spots, particularly among diversified telecom firms. AT&T was a noteworthy name
in that industry. The company announced strong second-quarter earnings, driven
by the success of its merger with SBC Communications and increased contributions
from Cingular Wireless. AT&T's share price jumped sharply on the earnings news
and climbed for the remainder of the period.
Finally, our stake in the health care sector performed well. Our patience was
TOP TEN HOLDINGS
AS OF OCTOBER 31, 2006
- --------------------------------------------------------------------------------
% OF % OF
NET ASSETS NET ASSETS
AS OF AS OF
10/31/06 4/30/06
- --------------------------------------------------------------------------------
Exxon Mobil Corp. 4.7% 4.7%
- --------------------------------------------------------------------------------
Citigroup Inc. 4.5% 4.9%
- --------------------------------------------------------------------------------
Bank of America Corp. 3.4% 3.6%
- --------------------------------------------------------------------------------
Freddie Mac 3.0% 2.9%
- --------------------------------------------------------------------------------
Chevron Corp. 2.9% 2.5%
- --------------------------------------------------------------------------------
Royal Dutch Shell plc ADR 2.7% 2.9%
- --------------------------------------------------------------------------------
JPMorgan Chase & Co. 2.5% 2.7%
- --------------------------------------------------------------------------------
Wells Fargo & Co. 2.1% 2.3%
- --------------------------------------------------------------------------------
AT&T Inc. 2.0% 1.6%
- --------------------------------------------------------------------------------
Pfizer Inc. 1.9% 1.8%
- --------------------------------------------------------------------------------
*All fund returns referenced in this commentary are for Investor Class shares.
**The S&P 500 Index returned 7.26% for the five-year period ended October 31,
2006.
(continued)
- ------
5
Capital Value - Portfolio Commentary
rewarded when long-time holdings in the pharmaceutical industry, some of which
have struggled in the past, became solid performers. Industry leader Pfizer
paced gains. Despite the challenges of generic competition and patent
expirations, the company's stock rebounded nicely from its July lows on robust
earnings reports driven by strength in key drugs such as Lipitor, the
largest-selling medicine in the world.
SOME DISAPPOINTMENTS
Unfortunately, we made some decisions that caused us to trail the benchmark for
the reporting period. Our position in the consumer discretionary sector
detracted the most from relative performance. The benchmark's collection of
holdings in the multi-line retail and media industries, many of which recorded
powerful gains, outperformed the portfolio's handful of investments. Security
selection worked against us in both industries and yielded the portfolio's
top-detracting stock. Discount retailer Dollar General struggled during the
period, and our portfolio overweight position compared with the benchmark proved
costly. Dollar General's profits were squeezed by an unfavorable sales mix,
lower-than-expected back-to-school sales, and high gasoline prices that raised
transportation costs and slowed spending by the chain's low-income customers.
Elsewhere, stock selection in the industrials sector worked against us,
particularly in the machinery industry. Exposure to Ingersoll Rand--present in
the portfolio but not in the benchmark--dampened relative performance. This
stock declined following an analyst's downgrade based on lowered expectations
for profit growth in the months ahead.
PORTFOLIO OBJECTIVE & EXPECTATIONS
Capital Value is designed to for investors seeking long-term capital growth who
can tolerate relatively moderate share price fluctuation compared with
volatility from more aggressive, growth-oriented investments. The fund can serve
as a solid core holding in a diversified portfolio, with the capability to
outperform growth-oriented investments when the value discipline is more in
favor, as it was for much of the reporting period. Investors should keep in
mind, though, that Capital Value could lag growth-oriented investments when the
growth discipline is in favor.
TOP FIVE INDUSTRIES
AS OF OCTOBER 31, 2006
- --------------------------------------------------------------------------------
% OF % OF
NET ASSETS NET ASSETS
AS OF AS OF
10/31/06 4/30/06
- --------------------------------------------------------------------------------
Oil, Gas & Consumable Fuels 12.8% 13.0%
- --------------------------------------------------------------------------------
Diversified Financial Services 10.4% 7.6%
- --------------------------------------------------------------------------------
Pharmaceuticals 7.0% 6.5%
- --------------------------------------------------------------------------------
Commercial Banks 6.4% 10.4%
- --------------------------------------------------------------------------------
Insurance 6.2% 6.3%
- --------------------------------------------------------------------------------
TYPES OF INVESTMENTS IN PORTFOLIO
- --------------------------------------------------------------------------------
% OF % OF
NET ASSETS NET ASSETS
AS OF AS OF
10/31/06 4/30/06
- --------------------------------------------------------------------------------
Common Stocks 95.1% 97.9%
- --------------------------------------------------------------------------------
Temporary Cash Investments 4.7% 1.9%
- --------------------------------------------------------------------------------
Other Assets and Liabilities 0.2% 0.2%
- --------------------------------------------------------------------------------
- ------
6
Shareholder Fee Example (Unaudited)
Fund shareholders may incur two types of costs: (1) transaction costs, including
sales charges (loads) on purchase payments and redemption/exchange fees; and (2)
ongoing costs, including management fees; distribution and service (12b-1) fees;
and other fund expenses. This example is intended to help you understand your
ongoing costs (in dollars) of investing in your fund and to compare these costs
with the ongoing cost of investing in other mutual funds.
The example is based on an investment of $1,000 made at the beginning of the
period and held for the entire period from May 1, 2006 to October 31, 2006.
ACTUAL EXPENSES
The table provides information about actual account values and actual expenses
for each class. You may use the information, together with the amount you
invested, to estimate the expenses that you paid over the period. First,
identify the share class you own. Then simply divide your account value by
$1,000 (for example, an $8,600 account value divided by $1,000 = 8.6), then
multiply the result by the number under the heading "Expenses Paid During
Period" to estimate the expenses you paid on your account during this period.
If you hold Investor Class shares of any American Century fund, or Institutional
Class shares of the American Century Diversified Bond Fund, in an American
Century account (i.e., not a financial intermediary or retirement plan account),
American Century may charge you a $12.50 semiannual account maintenance fee if
the value of those shares is less than $10,000. We will redeem shares
automatically in one of your accounts to pay the $12.50 fee. In determining your
total eligible investment amount, we will include your investments in all
PERSONAL ACCOUNTS (including American Century Brokerage accounts) registered
under your Social Security number. PERSONAL ACCOUNTS include individual
accounts, joint accounts, UGMA/UTMA accounts, personal trusts, Coverdell
Education Savings Accounts and IRAs (including traditional, Roth, Rollover,
SEP-, SARSEP- and SIMPLE-IRAs), and certain other retirement accounts. If you
have only business, business retirement, employer-sponsored or American Century
Brokerage accounts, you are currently not subject to this fee. We will not
charge the fee as long as you choose to manage your accounts exclusively online.
If you are subject to the Account Maintenance Fee, your account value could be
reduced by the fee amount.
HYPOTHETICAL EXAMPLE FOR COMPARISON PURPOSES
The table also provides information about hypothetical account values and
hypothetical expenses based on the actual expense ratio of each class of your
fund and an assumed rate of return of 5% per year before expenses, which is not
the actual return of a fund's share class. The hypothetical account values and
expenses may not be used to estimate the actual ending account balance or
expenses you paid for the period. You may use this information to compare the
ongoing costs of investing in your fund and other funds. To do so, compare this
5% hypothetical example with the 5% hypothetical examples that appear in the
shareholder reports of the other funds.
(continued)
- ------
7
Shareholder Fee Example (Unaudited)
Please note that the expenses shown in the table are meant to highlight your
ongoing costs only and do not reflect any transactional costs, such as sales
charges (loads) or redemption/exchange fees. Therefore, the table is useful in
comparing ongoing costs only, and will not help you determine the relative total
costs of owning different funds. In addition, if these transactional costs were
included, your costs would have been higher.
--------------------------------------------------------------------------------
EXPENSES PAID
BEGINNING ENDING DURING PERIOD* ANNUALIZED
ACCOUNT VALUE ACCOUNT VALUE 5/1/06 - EXPENSE
5/1/06 10/31/06 10/31/06 RATIO*
- --------------------------------------------------------------------------------
CAPITAL VALUE SHAREHOLDER FEE EXAMPLE
- --------------------------------------------------------------------------------
ACTUAL
- --------------------------------------------------------------------------------
Investor Class $1,000 $1,075.80 $5.76 1.10%
- --------------------------------------------------------------------------------
Institutional
Class $1,000 $1,077.10 $4.71 0.90%
- --------------------------------------------------------------------------------
Advisor Class $1,000 $1,074.60 $7.06 1.35%
- --------------------------------------------------------------------------------
HYPOTHETICAL
- --------------------------------------------------------------------------------
Investor Class $1,000 $1,019.66 $5.60 1.10%
- --------------------------------------------------------------------------------
Institutional
Class $1,000 $1,020.67 $4.58 0.90%
- --------------------------------------------------------------------------------
Advisor Class $1,000 $1,018.40 $6.87 1.35%
- --------------------------------------------------------------------------------
*Expenses are equal to the class's annualized expense ratio listed in the
table above, multiplied by the average account value over the period,
multiplied by 184, the number of days in the most recent fiscal half-year,
divided by 365, to reflect the one-half year period.
- ------
8
Capital Value - Schedule of Investments
OCTOBER 31, 2006
Shares Value
- --------------------------------------------------------------------------------
COMMON STOCKS -- 95.1%
- --------------------------------------------------------------------------------
AEROSPACE & DEFENSE - 0.8%
- --------------------------------------------------------------------------------
63,700 Northrop Grumman Corp. $ 4,229,043
- --------------------------------------------------------------------------------
AUTO COMPONENTS - 0.3%
- --------------------------------------------------------------------------------
43,800 Lear Corporation 1,323,198
- --------------------------------------------------------------------------------
BEVERAGES - 1.8%
- --------------------------------------------------------------------------------
113,700 Coca-Cola Company (The) 5,312,064
- --------------------------------------------------------------------------------
117,300 Pepsi Bottling Group Inc. 3,709,026
- --------------------------------------------------------------------------------
9,021,090
- --------------------------------------------------------------------------------
CAPITAL MARKETS - 4.1%
- --------------------------------------------------------------------------------
128,400 Bank of New York Co., Inc. (The) 4,413,108
- --------------------------------------------------------------------------------
96,700 Merrill Lynch & Co., Inc. 8,453,514
- --------------------------------------------------------------------------------
105,800 Morgan Stanley 8,086,294
- --------------------------------------------------------------------------------
20,952,916
- --------------------------------------------------------------------------------
CHEMICALS - 2.0%
- --------------------------------------------------------------------------------
102,900 du Pont (E.I.) de Nemours & Co. 4,712,820
- --------------------------------------------------------------------------------
84,900 PPG Industries, Inc. 5,807,160
- --------------------------------------------------------------------------------
10,519,980
- --------------------------------------------------------------------------------
COMMERCIAL BANKS - 6.4%
- --------------------------------------------------------------------------------
79,800 National City Corp. 2,972,550
- --------------------------------------------------------------------------------
48,700 PNC Financial Services Group 3,410,461
- --------------------------------------------------------------------------------
208,200 U.S. Bancorp 7,045,488
- --------------------------------------------------------------------------------
148,400 Wachovia Corp. 8,236,200
- --------------------------------------------------------------------------------
304,600 Wells Fargo & Co. 11,053,934
- --------------------------------------------------------------------------------
32,718,633
- --------------------------------------------------------------------------------
COMMERCIAL SERVICES
& SUPPLIES - 1.1%
- --------------------------------------------------------------------------------
87,000 R.R. Donnelley & Sons Company 2,945,820
- --------------------------------------------------------------------------------
77,600 Waste Management, Inc. 2,908,448
- --------------------------------------------------------------------------------
5,854,268
- --------------------------------------------------------------------------------
COMPUTERS & PERIPHERALS - 1.4%
- --------------------------------------------------------------------------------
188,800 Hewlett-Packard Co. 7,314,112
- --------------------------------------------------------------------------------
DIVERSIFIED - 1.3%
- --------------------------------------------------------------------------------
50,000 Standard and Poor's 500
Depositary Receipt 6,891,500
- --------------------------------------------------------------------------------
DIVERSIFIED CONSUMER SERVICES - 0.4%
- --------------------------------------------------------------------------------
103,838 H & R Block, Inc. 2,269,899
- --------------------------------------------------------------------------------
DIVERSIFIED FINANCIAL SERVICES - 10.4%
- --------------------------------------------------------------------------------
326,100 Bank of America Corp. 17,567,007
- --------------------------------------------------------------------------------
460,800 Citigroup Inc. 23,113,728
- --------------------------------------------------------------------------------
267,248 JPMorgan Chase & Co. 12,678,245
- --------------------------------------------------------------------------------
53,358,980
- --------------------------------------------------------------------------------
Shares Value
- --------------------------------------------------------------------------------
DIVERSIFIED TELECOMMUNICATION SERVICES - 4.6%
- --------------------------------------------------------------------------------
295,248 AT&T Inc. $ 10,112,244
- --------------------------------------------------------------------------------
151,900 BellSouth Corp. 6,850,690
- --------------------------------------------------------------------------------
187,600 Verizon Communications Inc. 6,941,200
- --------------------------------------------------------------------------------
23,904,134
- --------------------------------------------------------------------------------
ELECTRIC UTILITIES - 2.7%
- --------------------------------------------------------------------------------
121,700 Exelon Corporation 7,542,966
- --------------------------------------------------------------------------------
177,900 PPL Corporation 6,141,108
- --------------------------------------------------------------------------------
13,684,074
- --------------------------------------------------------------------------------
FOOD & STAPLES RETAILING - 1.9%
- --------------------------------------------------------------------------------
231,400 Kroger Co. (The) 5,204,186
- --------------------------------------------------------------------------------
97,000 Wal-Mart Stores, Inc. 4,780,160
- --------------------------------------------------------------------------------
9,984,346
- --------------------------------------------------------------------------------
FOOD PRODUCTS - 1.0%
- --------------------------------------------------------------------------------
217,300 Unilever N.V. New York Shares 5,258,660
- --------------------------------------------------------------------------------
HEALTH CARE PROVIDERS
& SERVICES - 0.3%
- --------------------------------------------------------------------------------
23,900 HCA Inc. 1,207,428
- --------------------------------------------------------------------------------
5,100 Quest Diagnostics Inc. 253,674
- --------------------------------------------------------------------------------
1,461,102
- --------------------------------------------------------------------------------
HOTELS, RESTAURANTS & LEISURE - 1.1%
- --------------------------------------------------------------------------------
141,158 McDonald's Corporation 5,917,343
- --------------------------------------------------------------------------------
HOUSEHOLD DURABLES - 0.7%
- --------------------------------------------------------------------------------
124,000 Newell Rubbermaid Inc. 3,568,720
- --------------------------------------------------------------------------------
INDUSTRIAL CONGLOMERATES - 2.5%
- --------------------------------------------------------------------------------
198,500 General Electric Co. 6,969,335
- --------------------------------------------------------------------------------
196,100 Tyco International Ltd. 5,771,223
- --------------------------------------------------------------------------------
12,740,558
- --------------------------------------------------------------------------------
INSURANCE - 6.2%
- --------------------------------------------------------------------------------
113,600 Allstate Corp. 6,970,496
- --------------------------------------------------------------------------------
123,700 American International
Group, Inc. 8,308,929
- --------------------------------------------------------------------------------
67,300 Hartford Financial Services
Group Inc. (The) 5,866,541
- --------------------------------------------------------------------------------
112,500 Loews Corp. 4,378,500
- --------------------------------------------------------------------------------
102,300 Marsh & McLennan
Companies, Inc. 3,011,712
- --------------------------------------------------------------------------------
56,400 Torchmark Corp. 3,478,752
- --------------------------------------------------------------------------------
32,014,930
- --------------------------------------------------------------------------------
IT SERVICES - 1.9%
- --------------------------------------------------------------------------------
59,500 Fiserv, Inc.(1) 2,939,300
- --------------------------------------------------------------------------------
72,300 International Business
Machines Corp. 6,675,459
- --------------------------------------------------------------------------------
9,614,759
- --------------------------------------------------------------------------------
See Notes to Financial Statements.
(continued)
- ------
9
Capital Value - Schedule of Investments
OCTOBER 31, 2006
Shares Value
- --------------------------------------------------------------------------------
MACHINERY - 2.8%
- --------------------------------------------------------------------------------
41,000 Deere & Co. $ 3,490,330
- --------------------------------------------------------------------------------
69,800 Dover Corp. 3,315,500
- --------------------------------------------------------------------------------
113,100 Ingersoll-Rand Company Cl A 4,151,901
- --------------------------------------------------------------------------------
42,100 Parker-Hannifin Corp. 3,520,823
- --------------------------------------------------------------------------------
14,478,554
- --------------------------------------------------------------------------------
MEDIA - 3.5%
- --------------------------------------------------------------------------------
95,300 Gannett Co., Inc. 5,636,042
- --------------------------------------------------------------------------------
471,700 Time Warner Inc. 9,438,717
- --------------------------------------------------------------------------------
76,241 Viacom Inc. Cl B 2,967,300
- --------------------------------------------------------------------------------
18,042,059
- --------------------------------------------------------------------------------
METALS & MINING - 0.5%
- --------------------------------------------------------------------------------
40,000 Nucor Corp. 2,336,400
- --------------------------------------------------------------------------------
MULTI-UTILITIES - 0.5%
- --------------------------------------------------------------------------------
116,800 NiSource Inc. 2,717,936
- --------------------------------------------------------------------------------
MULTILINE RETAIL - 0.5%
- --------------------------------------------------------------------------------
200,300 Dollar General Corp. 2,810,209
- --------------------------------------------------------------------------------
OFFICE ELECTRONICS - 0.7%
- --------------------------------------------------------------------------------
210,000 Xerox Corp.(1) 3,570,000
- --------------------------------------------------------------------------------
OIL, GAS & CONSUMABLE FUELS - 12.8%
- --------------------------------------------------------------------------------
40,700 Anadarko Petroleum Corp. 1,889,294
- --------------------------------------------------------------------------------
223,925 Chevron Corp. 15,047,760
- --------------------------------------------------------------------------------
155,500 ConocoPhillips 9,367,320
- --------------------------------------------------------------------------------
23,900 Devon Energy Corporation 1,597,476
- --------------------------------------------------------------------------------
335,700 Exxon Mobil Corp. 23,975,693
- --------------------------------------------------------------------------------
202,700 Royal Dutch Shell plc ADR 14,111,974
- --------------------------------------------------------------------------------
65,989,517
- --------------------------------------------------------------------------------
PAPER & FOREST PRODUCTS - 1.2%
- --------------------------------------------------------------------------------
93,984 Weyerhaeuser Co. 5,976,443
- --------------------------------------------------------------------------------
PHARMACEUTICALS - 7.0%
- --------------------------------------------------------------------------------
157,000 Abbott Laboratories 7,459,070
- --------------------------------------------------------------------------------
109,500 Johnson & Johnson 7,380,300
- --------------------------------------------------------------------------------
89,000 Merck & Co., Inc. 4,042,380
- --------------------------------------------------------------------------------
365,500 Pfizer Inc. 9,740,575
- --------------------------------------------------------------------------------
141,700 Wyeth 7,230,951
- --------------------------------------------------------------------------------
35,853,276
- --------------------------------------------------------------------------------
SEMICONDUCTORS
&
SEMICONDUCTOR EQUIPMENT - 0.7%
- --------------------------------------------------------------------------------
170,300 Intel Corp. 3,634,202
- --------------------------------------------------------------------------------
Shares Value
- --------------------------------------------------------------------------------
SOFTWARE - 2.4%
- --------------------------------------------------------------------------------
277,639 Microsoft Corporation $ 7,971,016
- -------------------------------------------------------------------------------
238,800 Oracle Corp.(1) 4,410,636
- -------------------------------------------------------------------------------
12,381,652
- -------------------------------------------------------------------------------
SPECIALTY RETAIL - 1.3%
- --------------------------------------------------------------------------------
152,200 Gap, Inc. (The) 3,199,244
- --------------------------------------------------------------------------------
99,800 Home Depot, Inc. (The) 3,725,534
- --------------------------------------------------------------------------------
6,924,778
- --------------------------------------------------------------------------------
TEXTILES, APPAREL & LUXURY GOODS - 1.4%
- --------------------------------------------------------------------------------
91,800 Liz Claiborne, Inc. 3,871,206
- --------------------------------------------------------------------------------
45,800 VF Corp. 3,481,258
- --------------------------------------------------------------------------------
7,352,464
- --------------------------------------------------------------------------------
THRIFTS & MORTGAGE FINANCE - 4.7%
- --------------------------------------------------------------------------------
224,600 Freddie Mac 15,495,154
- --------------------------------------------------------------------------------
43,500 MGIC Investment Corp. 2,556,060
- --------------------------------------------------------------------------------
145,400 Washington Mutual, Inc. 6,150,420
- --------------------------------------------------------------------------------
24,201,634
- --------------------------------------------------------------------------------
TOBACCO - 1.4%
- --------------------------------------------------------------------------------
85,800 Altria Group Inc. 6,978,114
- --------------------------------------------------------------------------------
WIRELESS TELECOMMUNICATION SERVICES - 0.8%
- --------------------------------------------------------------------------------
213,500 Sprint Nextel Corp. 3,990,315
- --------------------------------------------------------------------------------
TOTAL COMMON STOCKS
(Cost $375,987,438) $489,839,798
- --------------------------------------------------------------------------------
TEMPORARY CASH INVESTMENTS - 4.7%
- --------------------------------------------------------------------------------
Repurchase Agreement, Deutsche Bank
Securities, Inc., (collateralized by various
U.S. Treasury obligations, 2.00%, 7/15/14,
valued at $24,688,764), in a joint trading
account at 5.25%, dated 10/31/06,
due 11/1/06 (Delivery value $24,203,529)
(Cost $24,200,000) 24,200,000
- --------------------------------------------------------------------------------
TOTAL INVESTMENT SECURITIES - 99.8%
(Cost $400,187,438) 514,039,798
- --------------------------------------------------------------------------------
OTHER ASSETS AND LIABILITIES - 0.2% 877,597
- --------------------------------------------------------------------------------
TOTAL NET ASSETS - 100.0% $514,917,395
================================================================================
NOTES TO SCHEDULE OF INVESTMENTS
- --------------------------------------------------------------------------------
ADR = American Depositary Receipt
(1) Non-income producing.
See Notes to Financial Statements.
- ------
10
Statement of Assets and Liabilities
OCTOBER 31, 2006
- --------------------------------------------------------------------------------
ASSETS
- --------------------------------------------------------------------------------
Investment securities, at value (cost of $400,187,438) $514,039,798
- ------------------------------------------------------------
Cash 1,263,865
- ------------------------------------------------------------
Receivable for investments sold 413,301
- ------------------------------------------------------------
Dividends and interest receivable 561,311
- --------------------------------------------------------------------------------
516,278,275
- --------------------------------------------------------------------------------
LIABILITIES
- --------------------------------------------------------------------------------
Payable for investments purchased 892,895
- ------------------------------------------------------------
Accrued management fees 460,909
- ------------------------------------------------------------
Distribution fees payable 3,538
- ------------------------------------------------------------
Service fees payable 3,538
- --------------------------------------------------------------------------------
1,360,880
- --------------------------------------------------------------------------------
NET ASSETS $514,917,395
================================================================================
NET ASSETS CONSIST OF:
- --------------------------------------------------------------------------------
Capital (par value and paid-in surplus) $389,200,405
- ------------------------------------------------------------
Undistributed net investment income 5,367,334
- ------------------------------------------------------------
Undistributed net realized gain on investment transactions 6,497,296
- ---------------------------------------------------------------------
Net unrealized appreciation on investments 113,852,360
- --------------------------------------------------------------------------------
$514,917,395
================================================================================
INVESTOR CLASS, $0.01 PAR VALUE
- --------------------------------------------------------------------------------
Net assets $466,802,546
- ------------------------------------------------------------
Shares outstanding 56,705,692
- ------------------------------------------------------------
Net asset value per share $8.23
- --------------------------------------------------------------------------------
INSTITUTIONAL CLASS, $0.01 PAR VALUE
- --------------------------------------------------------------------------------
Net assets $31,141,486
- ------------------------------------------------------------
Shares outstanding 3,777,263
- ------------------------------------------------------------
Net asset value per share $8.24
- --------------------------------------------------------------------------------
ADVISOR CLASS, $0.01 PAR VALUE
- --------------------------------------------------------------------------------
Net assets $16,973,363
- ------------------------------------------------------------
Shares outstanding 2,066,555
- ------------------------------------------------------------
Net asset value per share $8.21
- --------------------------------------------------------------------------------
See Notes to Financial Statements.
- ------
11
Statement of Operations
YEAR ENDED OCTOBER 31, 2006
- --------------------------------------------------------------------------------
INVESTMENT INCOME (LOSS)
- --------------------------------------------------------------------------------
INCOME:
- ------------------------------------------------------------
Dividends (net of foreign taxes withheld $100,143) $12,403,290
- ------------------------------------------------------------
Interest 637,919
- --------------------------------------------------------------------------------
13,041,209
- --------------------------------------------------------------------------------
EXPENSES:
- ------------------------------------------------------------
Management fees 5,305,197
- ------------------------------------------------------------
Distribution fees - Advisor Class 38,997
- ------------------------------------------------------------
Service fees - Advisor Class 38,997
- ------------------------------------------------------------
Directors' fees and expenses 7,563
- ------------------------------------------------------------
Other expenses 1,654
- --------------------------------------------------------------------------------
5,392,408
- --------------------------------------------------------------------------------
NET INVESTMENT INCOME (LOSS) 7,648,801
- --------------------------------------------------------------------------------
REALIZED AND UNREALIZED GAIN (LOSS)
- ------------------------------------------------------------
Net realized gain (loss) on investment transactions 6,923,827
- ------------------------------------------------------------
Change in net unrealized appreciation (depreciation)
on investments 67,362,731
- --------------------------------------------------------------------------------
NET REALIZED AND UNREALIZED GAIN (LOSS) 74,286,558
- --------------------------------------------------------------------------------
NET INCREASE (DECREASE) IN NET ASSETS
RESULTING FROM OPERATIONS $81,935,359
================================================================================
See Notes to Financial Statements.
- ------
12
Statement of Changes in Net Assets
YEARS ENDED OCTOBER 31, 2006 AND OCTOBER 31, 2005
- --------------------------------------------------------------------------------
INCREASE (DECREASE) IN NET ASSETS 2006 2005
- --------------------------------------------------------------------------------
OPERATIONS
- --------------------------------------------------------------------------------
Net investment income (loss) $ 7,648,801 $ 6,319,371
- -----------------------------------------------
Net realized gain (loss) 6,923,827 7,227,289
- -----------------------------------------------
Change in net unrealized
appreciation (depreciation) 67,362,731 17,982,905
- --------------------------------------------------------------------------------
Net increase (decrease) in net assets
resulting from operations 81,935,359 31,529,565
- --------------------------------------------------------------------------------
DISTRIBUTIONS TO SHAREHOLDERS
- --------------------------------------------------------------------------------
From net investment income:
- -----------------------------------------------
Investor Class (6,466,570) (3,184,833)
- -----------------------------------------------
Institutional Class (610,968) (335,120)
- -----------------------------------------------
Advisor Class (174,997) (80,961)
- -----------------------------------------------
From net realized gains:
- -----------------------------------------------
Investor Class (5,171,999) --
- -----------------------------------------------
Institutional Class (428,777) --
- -----------------------------------------------
Advisor Class (170,420) --
- --------------------------------------------------------------------------------
Decrease in net assets from distributions (13,023,731) (3,600,914)
- --------------------------------------------------------------------------------
CAPITAL SHARE TRANSACTIONS
- --------------------------------------------------------------------------------
Net increase (decrease) in net assets
from capital share transactions (64,615,188) 195,715,769
- --------------------------------------------------------------------------------
NET INCREASE (DECREASE) IN NET ASSETS 4,296,440 223,644,420
- --------------------------------------------------------------------------------
NET ASSETS
- --------------------------------------------------------------------------------
Beginning of period 510,620,955 286,976,535
- --------------------------------------------------------------------------------
End of period $514,917,395 $510,620,955
================================================================================
Undistributed net investment income $5,367,334 $4,971,068
================================================================================
See Notes to Financial Statements.
- ------
13
Notes to Financial Statements
OCTOBER 31, 2006
1. ORGANIZATION AND SUMMARY OF SIGNIFICANT ACCOUNTING POLICIES
ORGANIZATION -- American Century Mutual Funds, Inc. (the corporation) is
registered under the Investment Company Act of 1940 (the 1940 Act) as an
open-end management investment company. Capital Value Fund (the fund) is one
fund in a series issued by the corporation. The fund is diversified under the
1940 Act. The fund's investment objective is to seek long-term capital growth.
The fund pursues its objective by investing primarily in common stocks that
management believes to be undervalued at the time of purchase. The fund also
seeks to minimize the impact of federal income taxes on shareholder returns by
attempting to minimize taxable distributions to shareholders. The following is a
summary of the fund's significant accounting policies.
MULTIPLE CLASS -- The fund is authorized to issue the Investor Class, the
Institutional Class and the Advisor Class. The share classes differ principally
in their respective distribution and shareholder servicing expenses and
arrangements. All shares of the fund represent an equal pro rata interest in the
assets of the class to which such shares belong, and have identical voting,
dividend, liquidation and other rights and the same terms and conditions, except
for class specific expenses and exclusive rights to vote on matters affecting
only individual classes. Income, non-class specific expenses, and realized and
unrealized capital gains and losses of the fund are allocated to each class of
shares based on their relative net assets.
SECURITY VALUATIONS -- Securities traded primarily on a principal securities
exchange are valued at the last reported sales price, or at the mean of the
latest bid and asked prices where no last sales price is available. Depending on
local convention or regulation, securities traded over-the-counter are valued at
the mean of the latest bid and asked prices, the last sales price, or the
official close price. Debt securities not traded on a principal securities
exchange are valued through a commercial pricing service or at the mean of the
most recent bid and asked prices. Discount notes may be valued through a
commercial pricing service or at amortized cost, which approximates fair value.
Securities traded on foreign securities exchanges and over-the-counter markets
are normally completed before the close of business on days that the New York
Stock Exchange (the Exchange) is open and may also take place on days when the
Exchange is not open. If an event occurs after the value of a security was
established but before the net asset value per share was determined that was
likely to materially change the net asset value, that security would be valued
at fair value as determined in accordance with procedures adopted by the Board
of Directors. If the fund determines that the market price of a portfolio
security is not readily available, or that the valuation methods mentioned above
do not reflect the security's fair value, such security is valued at its fair
value as determined by, or in accordance with procedures adopted by, the Board
of Directors or its designee if such fair value determination would materially
impact a fund's net asset value. Certain other circumstances may cause the fund
to fair value a security such as: a security has been declared in default;
trading in a security has been halted during the trading day; or there is a
foreign market holiday and no trading will commence.
SECURITY TRANSACTIONS -- Security transactions are accounted for as of the trade
date. Net realized gains and losses are determined on the identified cost basis,
which is also used for federal income tax purposes.
INVESTMENT INCOME -- Dividend income less foreign taxes withheld, if any, is
recorded as of the ex-dividend date. Interest income is recorded on the accrual
basis and includes accretion of discounts and amortization of premiums.
REPURCHASE AGREEMENTS -- The fund may enter into repurchase agreements with
institutions that American Century Investment Management, Inc. (ACIM) (the
investment advisor) has determined are creditworthy pursuant to criteria adopted
by the Board of Directors. Each repurchase agreement is recorded at cost. The
fund requires that the collateral, represented by securities, received in a
repurchase transaction be transferred to the custodian in a manner sufficient to
enable the fund to obtain those securities in the event of a default under the
repurchase agreement. ACIM monitors, on a daily basis, the securities
transferred to ensure the value, including accrued interest, of the securities
under each repurchase agreement is equal to or greater than amounts owed to the
fund under each repurchase agreement.
JOINT TRADING ACCOUNT -- Pursuant to an Exemptive Order issued by the Securities
and Exchange Commission, the fund, along with other registered investment
companies having management agreements with ACIM or American Century Global
Investment Management, Inc. (ACGIM), may transfer uninvested cash balances into
a joint trading account. These balances are invested in one or more repurchase
agreements that are collateralized by U.S. Treasury or Agency obligations.
INCOME TAX STATUS -- It is the fund's policy to distribute substantially all net
investment income and net realized gains to shareholders and to otherwise
qualify as a regulated investment company under provisions of the Internal
(continued)
- ------
14
Notes to Financial Statements
OCTOBER 31, 2006
1. ORGANIZATION AND SUMMARY OF SIGNIFICANT ACCOUNTING POLICIES (CONTINUED)
Revenue Code. Accordingly, no provision has been made for federal or state
income taxes.
DISTRIBUTIONS TO SHAREHOLDERS -- Distributions to shareholders are recorded on
the ex-dividend date. Distributions from net investment income and net realized
gains, if any, are generally declared and paid annually.
INDEMNIFICATIONS -- Under the corporation's organizational documents, its
officers and directors are indemnified against certain liabilities arising out
of the performance of their duties to the fund. In addition, in the normal
course of business, the fund enters into contracts that provide general
indemnifications. The fund's maximum exposure under these arrangements is
unknown as this would involve future claims that may be made against the fund.
The risk of material loss from such claims is considered by management to be
remote.
USE OF ESTIMATES -- The financial statements are prepared in conformity with
accounting principles generally accepted in the United States of America, which
may require management to make certain estimates and assumptions at the date of
the financial statements. Actual results could differ from these estimates.
2. FEES AND TRANSACTIONS WITH RELATED PARTIES
MANAGEMENT FEES -- The corporation has entered into a Management Agreement with
ACIM, under which ACIM provides the fund with investment advisory and management
services in exchange for a single, unified management fee (the fee) per class.
The Agreement provides that all expenses of the fund, except brokerage
commissions, taxes, interest, fees and expenses of those directors who are not
considered "interested persons" as defined in the 1940 Act (including counsel
fees) and extraordinary expenses, will be paid by ACIM. The fee is computed and
accrued daily based on the daily net assets of the specific class of shares of
the fund and paid monthly in arrears. For funds with a stepped fee schedule, the
rate of the fee is determined by applying a fee rate calculation formula. This
formula takes into account all of the investment advisor's assets under
management in the fund's investment strategy (strategy assets) to calculate the
appropriate fee rate for the fund. The strategy assets include the fund's assets
and the assets of other clients of the investment advisor that are not in the
American Century family of funds, but that have the same investment team and
investment strategy. The annual management fee schedule for each class of the
fund is as follows:
- --------------------------------------------------------------------------------
INVESTOR INSTITUTIONAL ADVISOR
CLASS CLASS CLASS
- --------------------------------------------------------------------------------
STRATEGY ASSETS
- --------------------------------------------------------------------------------
First $500 million 1.10% 0.90% 0.85%
- --------------------------------------------------------------------------------
Next $500 million 1.00% 0.80% 0.75%
- --------------------------------------------------------------------------------
Over $1 billion 0.90% 0.70% 0.65%
- --------------------------------------------------------------------------------
The effective annual management fee for each class of the fund for the year
ended October 31, 2006, was 1.10%, 0.90%, and 0.85%, for the Investor Class,
Institutional Class and Advisor Class, respectively.
DISTRIBUTION AND SERVICE FEES -- The Board of Directors has adopted a Master
Distribution and Shareholder Services Plan (the plan) for the Advisor Class,
pursuant to Rule 12b-1 of the 1940 Act. The plan provides that the Advisor Class
will pay American Century Investment Services, Inc. (ACIS) an annual
distribution fee equal to 0.25% and an annual service fee equal to 0.25%. The
fees are computed and accrued daily based on the Advisor Class's daily net
assets and paid monthly in arrears. The distribution fee provides compensation
for expenses incurred by financial intermediaries in connection with
distributing shares of the Advisor Class including, but not limited to, payments
to brokers, dealers, and financial institutions that have entered into sales
agreements with respect to shares of the fund. The service fee provides
compensation for shareholder and administrative services rendered by ACIS, its
affiliates or independent third party providers. Fees incurred under the plan
during the year ended October 31, 2006, are detailed in the Statement of
Operations.
(continued)
- ------
15
Notes to Financial Statements
OCTOBER 31, 2006
2. FEES AND TRANSACTIONS WITH RELATED PARTIES (CONTINUED)
RELATED PARTIES -- Certain officers and directors of the corporation are also
officers and/or directors, and, as a group, controlling stockholders of American
Century Companies, Inc. (ACC), the parent of the corporation's investment
advisor, ACIM, the distributor of the corporation, ACIS, and the corporation's
transfer agent, American Century Services, LLC.
The fund has a bank line of credit agreement with JPMorgan Chase Bank (JPMCB).
JPMCB is a custodian of the fund and a wholly owned subsidiary of JPMorgan Chase
& Co. (JPM). JPM is an equity investor in ACC.
3. INVESTMENT TRANSACTIONS
Purchases and sales of investment securities, excluding short-term investments,
for the year ended October 31, 2006, were $77,591,919 and $152,608,438,
respectively.
(continued)
- ------
16
Notes to Financial Statements
OCTOBER 31, 2006
4. CAPITAL SHARE TRANSACTIONS
Transactions in shares of the fund were as follows:
- --------------------------------------------------------------------------------
SHARES AMOUNT
- --------------------------------------------------------------------------------
INVESTOR CLASS
- --------------------------------------------------------------------------------
YEAR ENDED OCTOBER 31, 2006
SHARES AUTHORIZED 200,000,000
================================================================================
Sold 9,373,982 $71,303,459
- ---------------------------------------------
Issued in reinvestment of distributions 1,417,919 10,279,913
- ---------------------------------------------
Redeemed (18,164,887) (135,283,954)
- --------------------------------------------------------------------------------
Net increase (decrease) (7,372,986) $(53,700,582)
================================================================================
YEAR ENDED OCTOBER 31, 2005
SHARES AUTHORIZED 200,000,000
================================================================================
Sold 35,843,118 $251,786,243
- ---------------------------------------------
Issued in reinvestment of distributions 398,001 2,778,045
- ---------------------------------------------
Redeemed (10,808,116) (76,893,821)
- --------------------------------------------------------------------------------
Net increase (decrease) 25,433,003 $177,670,467
================================================================================
INSTITUTIONAL CLASS
- --------------------------------------------------------------------------------
YEAR ENDED OCTOBER 31, 2006
SHARES AUTHORIZED 15,000,000
================================================================================
Sold 394,236 $2,919,221
- ---------------------------------------------
Issued in reinvestment of distributions 126,734 918,822
- ---------------------------------------------
Redeemed (1,981,998) (14,766,520)
- --------------------------------------------------------------------------------
Net increase (decrease) (1,461,028) $(10,928,477
================================================================================
YEAR ENDED OCTOBER 31, 2005
SHARES AUTHORIZED 15,000,000
================================================================================
Sold 2,861,961 $20,546,551
- ---------------------------------------------
Issued in reinvestment of distributions 46,241 322,764
- ---------------------------------------------
Redeemed (1,211,707) (8,746,880)
- --------------------------------------------------------------------------------
Net increase (decrease) 1,696,495 $12,122,435
================================================================================
ADVISOR CLASS
- --------------------------------------------------------------------------------
YEAR ENDED OCTOBER 31, 2006
SHARES AUTHORIZED 50,000,000
================================================================================
Sold 387,581 $2,931,598
- ---------------------------------------------
Issued in reinvestment of distributions 47,294 342,881
- ---------------------------------------------
Redeemed (434,195) (3,260,608)
- --------------------------------------------------------------------------------
Net increase (decrease) 680 $13,871
================================================================================
YEAR ENDED OCTOBER 31, 2005
SHARES AUTHORIZED 50,000,000
================================================================================
Sold 1,049,941 $7,346,149
- ---------------------------------------------
Issued in reinvestment of distributions 11,581 80,831
- ---------------------------------------------
Redeemed (211,844) (1,504,113)
- --------------------------------------------------------------------------------
Net increase (decrease) 849,678 $5,922,867
================================================================================
(continued)
- ------
17
Notes to Financial Statements
OCTOBER 31, 2006
5. BANK LINE OF CREDIT
The fund, along with certain other funds managed by ACIM or ACGIM, has a
$500,000,000 unsecured bank line of credit agreement with JPMCB. The fund may
borrow money for temporary or emergency purposes to fund shareholder
redemptions. Borrowings under the agreement bear interest at the Federal Funds
rate plus 0.50%. The fund did not borrow from the line during the year ended
October 31, 2006.
6. FEDERAL TAX INFORMATION
The tax character of distributions paid during the years ended October 31, 2006
and October 31, 2005 were as follows:
- --------------------------------------------------------------------------------
2006 2005
- --------------------------------------------------------------------------------
DISTRIBUTIONS PAID FROM
- --------------------------------------------------------------------------------
Ordinary income $7,252,535 $3,600,914
- --------------------------------------------------------------------------------
Long-term capital gains $5,771,196 --
- --------------------------------------------------------------------------------
The book-basis character of distributions made during the year from net
investment income or net realized gains may differ from their ultimate
characterization for federal income tax purposes. These differences reflect the
differing character of certain income items and net realized gains and losses
for financial statement and tax purposes, and may result in reclassification
among certain capital accounts on the financial statements.
As of October 31, 2006, the components of distributable earnings on a tax-basis
and the federal tax cost of investments were as follows:
- --------------------------------------------------------------------------------
Federal tax cost of investments $400,501,212
================================================================================
Gross tax appreciation of investments $114,200,222
- ---------------------------------------------------------------
Gross tax depreciation of investments (661,636)
- --------------------------------------------------------------------------------
Net tax appreciation (depreciation) of investments $113,538,586
================================================================================
Undistributed ordinary income $5,370,151
- ---------------------------------------------------------------
Accumulated long-term gains $6,808,253
- --------------------------------------------------------------------------------
The difference between book-basis and tax-basis cost and unrealized appreciation
(depreciation) is attributable primarily to the tax deferral of losses on wash
sales.
(continued)
- ------
18
Notes to Financial Statements
OCTOBER 31, 2006
7. RECENTLY ISSUED ACCOUNTING STANDARDS
In June 2006, the Financial Accounting Standards Board (FASB) issued
Interpretation No. 48, "Accounting for Uncertainty in Income Taxes -- an
Interpretation of FASB Statement No. 109" (FIN 48). FIN 48 establishes a minimum
threshold for financial statement recognition of the benefit of positions taken
in filing tax returns (including whether an entity is taxable in a particular
jurisdiction), and requires certain expanded tax disclosures. FIN 48 is
effective for fiscal years beginning after December 15, 2006, and is to be
applied to all open tax years as of the date of effectiveness. The FASB issued
Statement of Financial Accounting Standards No. 157, "Fair Value Measurements"
(FAS 157), in September 2006, which is effective for fiscal years beginning
after November 15, 2007. FAS 157 defines fair value, establishes a framework for
measuring fair value and expands the required financial statement disclosures
about fair value measurements. Management is currently evaluating the impact of
adopting FIN 48 and FAS 157.
8. OTHER TAX INFORMATION (UNAUDITED)
The following information is provided pursuant to provisions of the Internal
Revenue Code.
The fund hereby designates $7,252,535 of qualified dividend income for the
fiscal year ended October 31, 2006.
The fund hereby designates $5,771,196 of capital gain distributions for the
fiscal year ended October 31, 2006.
For corporate taxpayers, ordinary income distributions paid during the fiscal
year ended October 31, 2006, of $7,252,535 qualify for the corporate dividends
received deduction.
- ------
19
Capital Value - Financial Highlights
For a Share Outstanding Throughout the Years Ended October 31
- --------------------------------------------------------------------------------
INVESTOR CLASS
- --------------------------------------------------------------------------------
2006 2005 2004 2003 2002
- --------------------------------------------------------------------------------
PER-SHARE DATA
- --------------------------------------------------------------------------------
Net Asset Value,
Beginning of Period $7.15 $6.61 $5.86 $4.88 $5.39
- --------------------------------------------------------------------------------
Income From
Investment Operations
- -----------------------
Net Investment
Income (Loss)(1) 0.12 0.10 0.09 0.08 0.07
- -----------------------
Net Realized and
Unrealized Gain (Loss) 1.14 0.51 0.72 0.97 (0.52)
- --------------------------------------------------------------------------------
Total From
Investment Operations 1.26 0.61 0.81 1.05 (0.45)
- --------------------------------------------------------------------------------
Distributions
- -----------------------
From Net
Investment Income (0.10) (0.07) (0.06) (0.07) (0.06)
- -----------------------
From Net
Realized Gains (0.08) -- -- -- --
- --------------------------------------------------------------------------------
Total Distributions (0.18) (0.07) (0.06) (0.07) (0.06)
- --------------------------------------------------------------------------------
Net Asset Value,
End of Period $8.23 $7.15 $6.61 $5.86 $4.88
================================================================================
TOTAL RETURN(2) 18.03% 9.29% 13.94% 21.67% (8.49)%
- --------------------------------------------------------------------------------
RATIOS/SUPPLEMENTAL DATA
- --------------------------------------------------------------------------------
Ratio of Operating
Expenses to Average
Net Assets 1.10% 1.10% 1.10% 1.10% 1.10%
- -----------------------
Ratio of Net
Investment Income (Loss)
to Average Net Assets 1.55% 1.42% 1.44% 1.54% 1.32%
- -----------------------
Portfolio Turnover Rate 16% 28% 15% 22% 42%
- -----------------------
Net Assets, End of
Period (in thousands) $466,803 $458,354 $255,504 $91,960 $50,425
- --------------------------------------------------------------------------------
(1) Computed using average shares outstanding throughout the period.
(2) Total return assumes reinvestment of net investment income and capital
gains distributions, if any. The total return of the classes may not
precisely reflect the class expense differences because of the impact of
calculating the net asset values to two decimal places. If net asset values
were calculated to three decimal places, the total return differences would
more closely reflect the class expense differences. The calculation of net
asset values to two decimal places is made in accordance with SEC guidelines
and does not result in any gain or loss of value between one class and
another.
See Notes to Financial Statements.
- ------
20
Capital Value - Financial Highlights
For a Share Outstanding Throughout the Years Ended October 31 (except as noted)
- --------------------------------------------------------------------------------
INSTITUTIONAL CLASS
- --------------------------------------------------------------------------------
2006 2005 2004 2003 2002(1)
- --------------------------------------------------------------------------------
PER-SHARE DATA
- --------------------------------------------------------------------------------
Net Asset Value,
Beginning of Period $7.16 $6.62 $5.87 $4.88 $5.87
- --------------------------------------------------------------------------------
Income From
Investment Operations
- -----------------------
Net Investment
Income (Loss)(2) 0.13 0.12 0.10 0.09 0.06
- -----------------------
Net Realized and
Unrealized Gain (Loss) 1.15 0.51 0.72 0.97 (1.05)
- --------------------------------------------------------------------------------
Total From
Investment Operations 1.28 0.63 0.82 1.06 (0.99)
- --------------------------------------------------------------------------------
Distributions
- -----------------------
From Net
Investment Income (0.12) (0.09) (0.07) (0.07) --
- -----------------------
From Net
Realized Gains (0.08) -- -- -- --
- --------------------------------------------------------------------------------
Total Distributions (0.20) (0.09) (0.07) (0.07) --
- --------------------------------------------------------------------------------
Net Asset Value,
End of Period $8.24 $7.16 $6.62 $5.87 $4.88
================================================================================
TOTAL RETURN(3) 18.24% 9.50% 14.15% 22.07% (16.87)%
- --------------------------------------------------------------------------------
RATIOS/SUPPLEMENTAL DATA
- --------------------------------------------------------------------------------
Ratio of Operating
Expenses to Average
Net Assets 0.90% 0.90% 0.90% 0.90% 0.90%(4)
- -----------------------
Ratio of Net Investment
Income (Loss)
to Average Net Assets 1.75% 1.62% 1.64% 1.74% 1.56%(4)
- -----------------------
Portfolio Turnover Rate 16% 28% 15% 22% 42%(5)
- -----------------------
Net Assets, End of
Period (in thousands) $31,141 $37,523 $23,449 $11,244 $3,779
- --------------------------------------------------------------------------------
(1) March 1, 2002 (commencement of sale) through October 31, 2002.
(2) Computed using average shares outstanding throughout the period.
(3) Total return assumes reinvestment of net investment income and capital
gains distributions, if any. Total returns for periods less than one year
are not annualized. The total return of the classes may not precisely
reflect the class expense differences because of the impact of calculating
the net asset values to two decimal places. If net asset values were
calculated to three decimal places, the total return differences would more
closely reflect the class expense differences. The calculation of net asset
values to two decimal places is made in accordance with SEC guidelines and
does not result in any gain or loss of value between one class and another.
(4) Annualized.
(5) Portfolio turnover is calculated at the fund level. Percentage indicated
was calculated for the year ended October 31, 2002.
See Notes to Financial Statements.
- ------
21
Capital Value - Financial Highlights
For a Share Outstanding Throughout the Years Ended October 31 (except as noted)
- --------------------------------------------------------------------------------
ADVISOR CLASS
- --------------------------------------------------------------------------------
2006 2005 2004 2003(1)
- --------------------------------------------------------------------------------
PER-SHARE DATA
- --------------------------------------------------------------------------------
Net Asset Value, Beginning of Period $7.14 $6.60 $5.86 $5.19
- --------------------------------------------------------------------------------
Income From Investment Operations
- -------------------------------------
Net Investment Income (Loss)(2) 0.10 0.08 0.08 0.03
- -------------------------------------
Net Realized and
Unrealized Gain (Loss) 1.13 0.52 0.71 0.64
- --------------------------------------------------------------------------------
Total From Investment Operations 1.23 0.60 0.79 0.67
- --------------------------------------------------------------------------------
Distributions
- -------------------------------------
From Net Investment Income (0.08) (0.06) (0.05) --
- -------------------------------------
From Net Realized Gains (0.08) -- -- --
- --------------------------------------------------------------------------------
Total Distributions (0.16) (0.06) (0.05) --
- --------------------------------------------------------------------------------
Net Asset Value, End of Period $8.21 $7.14 $6.60 $5.86
================================================================================
TOTAL RETURN(3) 17.62% 9.04% 13.60% 12.91%
- --------------------------------------------------------------------------------
RATIOS/SUPPLEMENTAL DATA
- --------------------------------------------------------------------------------
Ratio of Operating Expenses
to Average Net Assets 1.35% 1.35% 1.35% 1.35%(4)
- -------------------------------------
Ratio of Net Investment Income
(Loss) to Average Net Assets 1.30% 1.17% 1.19% 1.03%(4)
- -------------------------------------
Portfolio Turnover Rate 16% 28% 15% 22%(5)
- -------------------------------------
Net Assets, End of
Period (in thousands) $16,973 $14,744 $8,023 $201
- --------------------------------------------------------------------------------
(1) May 14, 2003 (commencement of sale) through October 31, 2003.
(2) Computed using average shares outstanding throughout the period.
(3) Total return assumes reinvestment of net investment income and capital
gains distributions, if any. Total returns for periods less than one year
are not annualized. The total return of the classes may not precisely
reflect the class expense differences because of the impact of calculating
the net asset values to two decimal places. If net asset values were
calculated to three decimal places, the total return differences would more
closely reflect the class expense differences. The calculation of net asset
values to two decimal places is made in accordance with SEC guidelines and
does not result in any gain or loss of value between one class and another.
(4) Annualized.
(5) Portfolio turnover is calculated at the fund level. Percentage indicated
was calculated for the year ended October 31, 2003.
See Notes to Financial Statements.
- ------
22
Report of Independent Registered Public Accounting Firm
The Board of Directors and Shareholders,
American Century Mutual Funds, Inc.:
We have audited the accompanying statement of assets and liabilities, including
the schedule of investments, of Capital Value Fund, (the "Fund"), one of the
mutual funds comprising American Century Mutual Funds, Inc., as of October 31,
2006, and the related statement of operations for the year then ended, the
statements of changes in net assets for each of the two years in the period then
ended, and the financial highlights for the periods presented. These financial
statements and financial highlights are the responsibility of the Fund's
management. Our responsibility is to express an opinion on these financial
statements and financial highlights based on our audits.
We conducted our audits in accordance with the standards of the Public Company
Accounting Oversight Board (United States). Those standards require that we plan
and perform the audit to obtain reasonable assurance about whether the financial
statements and financial highlights are free of material misstatement. The Fund
is not required to have, nor were we engaged to perform, an audit of its
internal control over financial reporting. Our audits included consideration of
internal control over financial reporting as a basis for designing audit
procedures that are appropriate in the circumstances, but not for the purpose of
expressing an opinion on the effectiveness of the Fund's internal control over
financial reporting. Accordingly, we express no such opinion. An audit also
includes examining, on a test basis, evidence supporting the amounts and
disclosures in the financial statements, assessing the accounting principles
used and significant estimates made by management, as well as evaluating the
overall financial statement presentation. Our procedures included confirmation
of securities owned as of October 31, 2006, by correspondence with the custodian
and brokers; where replies were not received from brokers, we performed other
auditing procedures. We believe that our audits provide a reasonable basis for
our opinion.
In our opinion, the financial statements and financial highlights referred to
above present fairly, in all material respects, the financial position of
Capital Value Fund as of October 31, 2006, the results of its operations for the
year then ended, the changes in its net assets for each of the two years in the
period then ended, and the financial highlights for the periods presented, in
conformity with accounting principles generally accepted in the United States of
America.
Deloitte & Touche LLP
Kansas City, Missouri
December 14, 2006
- ------
23
Management
The individuals listed below serve as directors or officers of the fund. Each
director serves until his or her successor is duly elected and qualified or
until he or she retires. Mandatory retirement age for independent directors is
72. Those listed as interested directors are "interested" primarily by virtue of
their engagement as officers of American Century Companies, Inc. (ACC) or its
wholly owned, direct or indirect, subsidiaries, including the fund's investment
advisor, American Century Investment Management, Inc. (ACIM); the fund's
principal underwriter, American Century Investment Services, Inc. (ACIS); and
the fund's transfer agent, American Century Services, LLC (ACS).
The other directors (more than three-fourths of the total number) are
independent; that is, they have never been employees or officers of, and have no
financial interest in, ACC or any of its wholly owned subsidiaries, including
ACIM, ACIS, and ACS. The directors serve in this capacity for seven registered
investment companies in the American Century family of funds.
All persons named as officers of the fund also serve in a similar capacity for
the other 14 investment companies advised by ACIM or American Century Global
Investment Management, Inc. (ACGIM), unless otherwise noted. Only officers with
policy-making functions are listed. No officer is compensated for his or her
service as an officer of the fund. The listed officers are interested persons of
the fund and are appointed or re-appointed on an annual basis.
INDEPENDENT DIRECTORS
- --------------------------------------------------------------------------------
THOMAS A. BROWN
4500 Main Street, Kansas City, MO 64111
YEAR OF BIRTH: 1940
POSITION(S) HELD WITH FUND: Director
FIRST YEAR OF SERVICE: 1980
PRINCIPAL OCCUPATION(S) DURING PAST 5 YEARS: Retired, Formerly Chief Executive
Officer/Treasurer, Associated Bearings Company
NUMBER OF PORTFOLIOS IN FUND COMPLEX OVERSEEN BY DIRECTOR: 66
OTHER DIRECTORSHIPS HELD BY DIRECTOR: None
- --------------------------------------------------------------------------------
ANDREA C. HALL, PH.D.
4500 Main Street, Kansas City, MO 64111
YEAR OF BIRTH: 1945
POSITION(S) HELD WITH FUND: Director
FIRST YEAR OF SERVICE: 1997
PRINCIPAL OCCUPATION(S) DURING PAST 5 YEARS: Senior Vice President, Midwest
Research Institute
NUMBER OF PORTFOLIOS IN FUND COMPLEX OVERSEEN BY DIRECTOR: 66
OTHER DIRECTORSHIPS HELD BY DIRECTOR: None
- --------------------------------------------------------------------------------
D.D. (DEL) HOCK
4500 Main Street, Kansas City, MO 64111
YEAR OF BIRTH: 1935
POSITION(S) HELD WITH FUND: Director
FIRST YEAR OF SERVICE: 1996
PRINCIPAL OCCUPATION(S) DURING PAST 5 YEARS: Retired, formerly Chairman, Public
Service Company of Colorado
NUMBER OF PORTFOLIOS IN FUND COMPLEX OVERSEEN BY DIRECTOR: 66
OTHER DIRECTORSHIPS HELD BY DIRECTOR: Director, Allied Motion Technologies, Inc.
- --------------------------------------------------------------------------------
(continued)
- ------
24
Management
INDEPENDENT DIRECTORS (CONTINUED)
- --------------------------------------------------------------------------------
JAMES A. OLSON
4500 Main Street, Kansas City, MO 64111
YEAR OF BIRTH: 1942
POSITION(S) HELD WITH FUND: Advisory Board Member
FIRST YEAR OF SERVICE: 2006
PRINCIPAL OCCUPATION(S) DURING PAST 5 YEARS: Principal, Plaza Belmont LLC; Chief
Financial Officer, Plaza Belmont LLC (September 1999 to July 2006)
NUMBER OF PORTFOLIOS IN FUND COMPLEX OVERSEEN BY DIRECTOR: 66
OTHER DIRECTORSHIPS HELD BY DIRECTOR: Director, Saia, Inc. and Entertainment
Properties Trust
- --------------------------------------------------------------------------------
DONALD H. PRATT
4500 Main Street, Kansas City, MO 64111
YEAR OF BIRTH: 1937
POSITION(S) HELD WITH FUND: Director, Chairman of the Board
FIRST YEAR OF SERVICE: 1995
PRINCIPAL OCCUPATION(S) DURING PAST 5 YEARS: Chairman, Western Investments,
Inc.; Retired Chairman of the Board, Butler Manufacturing Company
NUMBER OF PORTFOLIOS IN FUND COMPLEX OVERSEEN BY DIRECTOR: 66
OTHER DIRECTORSHIPS HELD BY DIRECTOR: None
- --------------------------------------------------------------------------------
GALE E. SAYERS
4500 Main Street, Kansas City, MO 64111
YEAR OF BIRTH: 1943
POSITION(S) HELD WITH FUND: Director
FIRST YEAR OF SERVICE: 2000
PRINCIPAL OCCUPATION(S) DURING PAST 5 YEARS: President, Chief Executive Officer
and Founder, Sayers40, Inc., a technology products and service provider
NUMBER OF PORTFOLIOS IN FUND COMPLEX OVERSEEN BY DIRECTOR: 66
OTHER DIRECTORSHIPS HELD BY DIRECTOR: Director, Triad Hospitals, Inc.
- --------------------------------------------------------------------------------
M. JEANNINE STRANDJORD
4500 Main Street, Kansas City, MO 64111
YEAR OF BIRTH: 1945
POSITION(S) HELD WITH FUND: Director
FIRST YEAR OF SERVICE: 1994
PRINCIPAL OCCUPATION(S) DURING PAST 5 YEARS: Retired, formerly Senior Vice
President, Sprint Corporation
NUMBER OF PORTFOLIOS IN FUND COMPLEX OVERSEEN BY DIRECTOR: 66
OTHER DIRECTORSHIPS HELD BY DIRECTOR: Director, DST Systems, Inc.; Director,
Euronet Worldwide, Inc.
- --------------------------------------------------------------------------------
TIMOTHY S. WEBSTER
4500 Main Street, Kansas City, MO 64111
YEAR OF BIRTH: 1961
POSITION(S) HELD WITH FUND: Director
FIRST YEAR OF SERVICE: 2001
PRINCIPAL OCCUPATION(S) DURING PAST 5 YEARS: President and Chief Executive
Officer, American Italian Pasta Company (1992 to December 2005)
NUMBER OF PORTFOLIOS IN FUND COMPLEX OVERSEEN BY DIRECTOR: 66
OTHER DIRECTORSHIPS HELD BY DIRECTOR: None
- --------------------------------------------------------------------------------
(continued)
- ------
25
Management
INTERESTED DIRECTORS
- --------------------------------------------------------------------------------
JAMES E. STOWERS, JR.(1)
4500 Main Street, Kansas City, MO 64111
YEAR OF BIRTH: 1924
POSITION(S) HELD WITH FUND: Director, Co-Vice Chairman
FIRST YEAR OF SERVICE: 1958
PRINCIPAL OCCUPATION(S) DURING PAST 5 YEARS: Founder, Director and Controlling
Shareholder, ACC; Chairman, ACC (January 1995 to December 2004); Director, ACIM,
ACGIM, ACS, ACIS and other ACC subsidiaries
NUMBER OF PORTFOLIOS IN FUND COMPLEX OVERSEEN BY DIRECTOR: 66
OTHER DIRECTORSHIPS HELD BY DIRECTOR: None
- --------------------------------------------------------------------------------
JAMES E. STOWERS III(1)
4500 Main Street, Kansas City, MO 64111
YEAR OF BIRTH: 1959
POSITION(S) HELD WITH FUND: Director, Co-Vice Chairman
FIRST YEAR OF SERVICE: 1990
PRINCIPAL OCCUPATION(S) DURING PAST 5 YEARS: Chairman, ACC (January 2005 to
present); Co-Chairman, ACC (September 2000 to December 2004); Chairman, ACS and
other ACC subsidiaries (April 2005 to September 2006); Director, ACC, ACIM,
ACGIM, ACS, ACIS and other ACC subsidiaries
NUMBER OF PORTFOLIOS IN FUND COMPLEX OVERSEEN BY DIRECTOR: 66
OTHER DIRECTORSHIPS HELD BY DIRECTOR: None
- --------------------------------------------------------------------------------
(1) James E. Stowers, Jr. is the father of James E. Stowers III.
OFFICERS
- --------------------------------------------------------------------------------
WILLIAM M. LYONS
4500 Main Street, Kansas City, MO 64111
YEAR OF BIRTH: 1955
POSITION(S) HELD WITH FUND: President
FIRST YEAR OF SERVICE: 2000
PRINCIPAL OCCUPATION(S) DURING PAST 5 YEARS: Chief Executive Officer, ACC
(September 2000 to present); President, ACC (June 1997 to present); Also serves
as: Chairman, ACIM, ACGIM, ACS, ACIS and other ACC subsidiaries, Chief Executive
Officer, ACIM, ACGIM, ACIS, and other ACC subsidiaries (October 2000 to October
2006); President, ACIM, ACGIM and other ACC subsidiaries (September 2002 to
September 2006); Executive Vice President, ACS (January 2005 to September 2006);
Director, ACC, ACIM, ACGIM, ACS, ACIS and other ACC subsidiaries
- --------------------------------------------------------------------------------
JONATHAN THOMAS
4500 Main Street, Kansas City, MO 64111
YEAR OF BIRTH: 1963
POSITION(S) HELD WITH FUND: Executive Vice President
FIRST YEAR OF SERVICE: 2005
PRINCIPAL OCCUPATION(S) DURING PAST 5 YEARS: Chief Administrative Officer, ACC
(February 2006 to present); Executive Vice President, ACC (November 2005 to
present); Also serves as: President and Chief Executive Officer, ACS; Chief
Financial Officer and Chief Accounting Officer, ACIM, ACGIM, ACS, ACIS and other
ACC subsidiaries; Managing Director, Morgan Stanley (March 2000 to November
2005)
- --------------------------------------------------------------------------------
MARYANNE ROEPKE
4500 Main Street, Kansas City, MO 64111
YEAR OF BIRTH: 1956
POSITION(S) HELD WITH FUND: Chief Compliance Officer and Senior Vice President
FIRST YEAR OF SERVICE: 2000
PRINCIPAL OCCUPATION(S) DURING PAST 5 YEARS: Chief Compliance Officer, ACIM,
ACGIM and ACS (August 2006 to present); Assistant Treasurer, ACC (January 1995
to August 2006); Treasurer and Chief Financial Officer, various American Century
funds (July 2000 to August 2006); Also serves as: Senior Vice President, ACS
- --------------------------------------------------------------------------------
(continued)
- ------
26
Management
OFFICERS (CONTINUED)
- --------------------------------------------------------------------------------
DAVID C. TUCKER
4500 Main Street, Kansas City, MO 64111
YEAR OF BIRTH: 1958
POSITION(S) HELD WITH FUND: Senior Vice President and General Counsel
FIRST YEAR OF SERVICE: 2000
PRINCIPAL OCCUPATION(S) DURING PAST 5 YEARS: Vice President, ACC (February 2001
to present); General Counsel, ACC (June 1998 to present); Also serves as: Senior
Vice President and General Counsel, ACIM, ACGIM, ACS, ACIS and other ACC
subsidiaries
- --------------------------------------------------------------------------------
ROBERT LEACH
4500 Main Street, Kansas City, MO 64111
YEAR OF BIRTH: 1966
POSITION(S) HELD WITH FUND: Vice President, Treasurer and Chief Financial
Officer
FIRST YEAR OF SERVICE: 1997
PRINCIPAL OCCUPATION(S) DURING PAST 5 YEARS: Vice President, ACS (February 2000
to present); Controller, various American Century funds (June 1997 to September
2006)
- --------------------------------------------------------------------------------
C. JEAN WADE
4500 Main Street, Kansas City, MO 64111
YEAR OF BIRTH: 1964
POSITION(S) HELD WITH FUND: Controller
FIRST YEAR OF SERVICE: 2006
PRINCIPAL OCCUPATION(S) DURING PAST 5 YEARS: Vice President, ACS (February 2000
to present)
- --------------------------------------------------------------------------------
JON ZINDEL
4500 Main Street, Kansas City, MO 64111
YEAR OF BIRTH: 1967
POSITION(S) HELD WITH FUND: Tax Officer
FIRST YEAR OF SERVICE: 1997
PRINCIPAL OCCUPATION(S) DURING PAST 5 YEARS: Senior Vice President, ACC (August
2006 to present); Vice President, ACC and certain ACC subsidiaries (October 2001
to August 2006); Vice President, Corporate Tax, ACS (April 1998 to August 2006);
Also serves as: Senior Vice President, ACIM, ACGIM, ACS, ACIS and other ACC
subsidiaries
- --------------------------------------------------------------------------------
The SAI has additional information about the fund's directors and is available
without charge, upon request, by calling 1-800-345-2021.
- ------
27
Approval of Management Agreement for Capital Value
Under Section 15(c) of the Investment Company Act, contracts for investment
advisory services are required to be reviewed, evaluated and approved by a
majority of a fund's independent directors or trustees (the "Directors") each
year. At American Century, this process is referred to as the "15(c) Process."
As a part of this process, the board reviews fund performance, shareholder
services, audit and compliance information, and a variety of other reports from
the advisor concerning fund operations. In addition to this annual review, the
board of directors oversees and evaluates on a continuous basis at its quarterly
meetings the nature and quality of significant services performed by the
advisor, fund performance, audit and compliance information, and a variety of
other reports relating to fund operations. The board, or committees of the
board, also holds special meetings as needed.
Under a Securities and Exchange Commission rule, each fund is required to
disclose in its annual or semiannual report, as appropriate, the material
factors and conclusions that formed the basis for the board's approval or
renewal of any advisory agreements within the fund's most recently completed
fiscal half-year period.
ANNUAL CONTRACT REVIEW PROCESS
As part of the annual 15(c) Process undertaken during the most recent fiscal
half-year period, the Directors reviewed extensive data and information compiled
by the advisor and certain independent providers of evaluative data (the "15(c)
Providers") concerning Capital Value (the "fund") and the services provided to
the fund under the management agreement. The information considered and the
discussions held at the meetings included, but were not limited to:
* the nature, extent and quality of investment management, shareholder
services and other services provided to the fund under the management
agreement;
* reports on the advisor's activities relating to the wide range of programs
and services the advisor provides to the fund and its shareholders on a
routine and non-routine basis;
* data comparing the cost of owning the fund to the cost of owning a similar
fund;
* data comparing the fund's performance to appropriate benchmarks and/or a
peer group of other mutual funds with similar investment objectives and
strategies;
* financial data showing the profitability of the fund to the advisor and the
overall profitability of the advisor; and
* data comparing services provided and charges to other investment management
clients of the advisor.
In keeping with its practice, the fund's board of directors held two regularly
scheduled meetings and one special meeting to review and discuss the information
provided by the advisor and to complete its negotiations with the advisor
regarding the renewal of the management agreement, including the setting of the
applicable advisory fee. The board also had the benefit of
(continued)
- ------
28
Approval of Management Agreement for Capital Value
the advice of its independent counsel throughout the period.
FACTORS CONSIDERED
The Directors considered all of the information provided by the advisor, the
15(c) Providers, and the board's independent counsel, and evaluated such
information for each fund for which the board has responsibility. The Directors
did not identify any single factor as being all-important or controlling, and
each Director may have attributed different levels of importance to different
factors. In deciding to renew the agreement under the terms ultimately
determined by the board to be appropriate, the Directors' decision was based on
the following factors.
NATURE, EXTENT AND QUALITY OF SERVICES - GENERALLY. Under the management
agreement, the advisor is responsible for providing or arranging for all
services necessary for the operation of the fund. The board noted that under the
management agreement, the advisor provides or arranges at its own expense a wide
variety of services including:
* fund construction and design
* portfolio security selection
* initial capitalization/funding
* securities trading
* custody of fund assets
* daily valuation of the fund's portfolio
* shareholder servicing and transfer agency, including shareholder
confirmations, recordkeeping and communications
* legal services
* regulatory and portfolio compliance
* financial reporting
* marketing and distribution
The Directors noted that many of these services have expanded over time both in
terms of quantity and complexity in response to shareholder demands, competition
in the industry and the changing regulatory environment. In performing their
evaluation, the Directors considered information received in connection with the
annual review, as well as information provided on an ongoing basis at their
regularly scheduled board and committee meetings.
INVESTMENT MANAGEMENT SERVICES.The nature of the investment management services
provided is quite complex and allows fund shareholders access to professional
money management, instant diversification of their investments within an asset
class, the opportunity to easily diversify among asset classes, and liquidity.
In evaluating investment performance, the board expects the advisor to manage
the fund in accordance with its investment objectives and approved strategies.
In providing these services, the advisor utilizes teams of investment
professionals (portfolio managers, analysts, research assistants, and securities
traders) who require extensive information technology, research, training,
compliance and other systems to conduct their business. At each quarterly
meeting the Directors review investment performance information for the fund,
together with comparative information for appropriate bench-
(continued)
- ------
29
Approval of Management Agreement for Capital Value
marks and peer groups of funds managed similarly to the fund. The Directors also
review detailed performance information during the 15(c) Process comparing the
fund's performance with that of similar funds not managed by the advisor. If
performance concerns are identified, the Directors discuss with the advisor the
reasons for such results (e.g., market conditions, security selection) and any
efforts being undertaken to improve performance. The fund's performance fell
below the median for both the one and three year periods during part of the past
year. The board discussed the fund's performance with the advisor and was
satisfied with the efforts being undertaken by the advisor.
SHAREHOLDER AND OTHER SERVICES. The advisor provides the fund with a
comprehensive package of transfer agency, shareholder, and other services. The
Directors review reports and evaluations of such services at their regular
quarterly meetings, including the annual meeting concerning contract review, and
reports to the board. These reports include, but are not limited to, information
regarding the operational efficiency and accuracy of the shareholder and
transfer agency services provided, staffing levels, shareholder satisfaction (as
measured by external as well as internal sources), technology support, new
products and services offered to fund shareholders, securities trading
activities, portfolio valuation services, auditing services, and legal and
operational compliance activities. Certain aspects of shareholder and transfer
agency service level efficiency and the quality of securities trading activities
are measured by independent third party providers and are presented in
comparison to other fund groups not managed by the advisor.
COSTS OF SERVICES PROVIDED AND PROFITABILITY TO THE ADVISOR. The advisor
provides detailed information concerning its cost of providing various services
to the fund, its profitability in managing the fund, its overall profitability,
and its financial condition. The Directors have reviewed with the advisor the
methodology used to prepare this financial information. This financial
information regarding the advisor is considered in order to evaluate the
advisor's financial condition, its ability to continue to provide services under
the management agreement, and the reasonableness of the current management fee.
ETHICS OF THE ADVISOR. The Directors generally consider the advisor's commitment
to providing quality services to shareholders and to conducting its business
ethically. They noted that the advisor's practices generally meet or exceed
industry best practices and that the advisor was not implicated in the industry
scandals of 2003 and 2004.
ECONOMIES OF SCALE. The Directors review reports provided by the advisor on
economies of scale for the complex as a whole and the year-over-year changes in
revenue, costs, and profitability. The Directors concluded that economies of
scale are difficult to measure and predict with precision, especially on a
fund-by-fund basis. This analysis is also complicated by the additional services
and content provided by the advisor and its reinves-
(continued)
- ------
30
Approval of Management Agreement for Capital Value
ment in its ability to provide and expand those services. Accordingly, the
Directors also seek to evaluate economies of scale by reviewing other
information, such as year-over-year profitability of the advisor generally, the
profitability of its management of the fund specifically, the expenses incurred
by the advisor in providing various functions to the fund, and the breakpoint
fees of competitive funds not managed by the advisor. The Directors believe the
advisor is appropriately sharing economies of scale through its competitive fee
structure, fee breakpoints as the fund increases in size, and through
reinvestment in its business to provide shareholders additional content and
services.
COMPARISON TO OTHER FUNDS' FEES. The fund pays the advisor a single,
all-inclusive (or unified) management fee for providing all services necessary
for the management and operation of the fund, other than brokerage expenses,
taxes, interest, extraordinary expenses, and the fees and expenses of the fund's
independent directors (including their independent legal counsel). Under the
unified fee structure, the advisor is responsible for providing all investment
advisory, custody, audit, administrative, compliance, recordkeeping, marketing
and shareholder services, or arranging and supervising third parties to provide
such services. By contrast, most other funds are charged a variety of fees,
including an investment advisory fee, a transfer agency fee, an administrative
fee, distribution charges and other expenses. Other than their investment
advisory fees and Rule 12b-1 distribution fees, all other components of the
total fees charged by these other funds may be increased without shareholder
approval. The board believes the unified fee structure is a benefit to fund
shareholders because it clearly discloses to shareholders the cost of owning
fund shares, and, since the unified fee cannot be increased without a vote of
fund shareholders, it shifts to the advisor the risk of increased costs of
operating the fund and provides a direct incentive to minimize administrative
inefficiencies. Part of the Directors' analysis of fee levels involves reviewing
certain evaluative data compiled by a 15(c) Provider comparing the fund's
unified fee to the total expense ratio of other funds in the fund's peer group.
The unified fee charged to shareholders of the fund was at the median of the
total expense ratios of its peer group.
COMPARISON TO FEES AND SERVICES PROVIDED TO OTHER CLIENTS OF THE ADVISOR. The
Directors also requested and received information from the advisor concerning
the nature of the services, fees, and profitability of its advisory services to
advisory clients other than the fund. They observed that these varying types of
client accounts require different services and involve different regulatory and
entrepreneurial risks than the management of the fund. The Directors analyzed
this information and concluded that the fees charged and services provided to
the fund were reasonable by comparison.
COLLATERAL BENEFITS DERIVED BY THE ADVISOR. The Directors reviewed information
from the advisor concerning collateral benefits it receives as a result of its
relationship with the fund. They
(continued)
- ------
31
Approval of Management Agreement for Capital Value
concluded that the advisor's primary business is managing mutual funds and it
generally does not use the fund or shareholder information to generate profits
in other lines of business, and therefore does not derive any significant
collateral benefits from them. The Directors noted that the advisor receives
proprietary research from broker dealers that execute fund portfolio
transactions and concluded that this research is likely to benefit fund
shareholders. The Directors also determined that the advisor is able to provide
investment management services to certain clients other than the fund, at least
in part, due to its existing infrastructure built to serve the fund complex. The
Directors concluded, however, that the assets of those other clients are not
material to the analysis and, in any event, are included with the assets of the
fund to determine breakpoints in the fund's fee schedule, provided they are
managed using the same investment team and strategy.
CONCLUSIONS OF THE DIRECTORS
As a result of this process, the independent directors, in the absence of
particular circumstances and assisted by the advice of legal counsel that is
independent of the advisor, taking into account all of the factors discussed
above and the information provided by the advisor concluded that the investment
management agreement between the fund and the advisor is fair and reasonable in
light of the services provided and should be renewed.
- ------
32
Share Class Information
Three classes of shares are authorized for sale by the fund: Investor Class,
Institutional Class, and Advisor Class. The total expense ratio of Institutional
Class shares is lower than that of Investor Class shares. The total expense
ratio of Advisor Class shares is higher than that of Investor Class shares.
INVESTOR CLASS shares are available for purchase in two ways: 1) directly from
American Century without any commissions or other fees; or 2) through certain
financial intermediaries (such as banks, broker-dealers, insurance companies and
investment advisors), which may require payment of a transaction fee to the
financial intermediary.
INSTITUTIONAL CLASS shares are available to large investors such as endowments,
foundations, and retirement plans, and to financial intermediaries serving these
investors. This class recognizes the relatively lower cost of serving
institutional customers and others who invest at least $5 million ($3 million
for endowments and foundations) in an American Century fund or at least $10
million in multiple funds. In recognition of the larger investments and account
balances and comparatively lower transaction costs, the unified management fee
of Institutional Class shares is 0.20% less than the unified management fee of
Investor Class shares.
ADVISOR CLASS shares are sold primarily through institutions such as investment
advisors, banks, broker-dealers, insurance companies, and financial advisors.
Advisor Class shares are subject to a 0.50% annual Rule 12b-1 distribution and
service fee. The total expense ratio of Advisor Class shares is 0.25% higher
than the total expense ratio of Investor Class shares.
All classes of shares represent a pro rata interest in the fund and generally
have the same rights and preferences.
- ------
33
Additional Information
RETIREMENT ACCOUNT INFORMATION
As required by law, any distributions you receive from an IRA or certain 403(b),
457 and qualified plans [those not eligible for rollover to an IRA or to another
qualified plan] are subject to federal income tax withholding, unless you elect
not to have withholding apply. Tax will be withheld on the total amount
withdrawn even though you may be receiving amounts that are not subject to
withholding, such as nondeductible contributions. In such case, excess amounts
of withholding could occur. You may adjust your withholding election so that a
greater or lesser amount will be withheld.
If you don't want us to withhold on this amount, you must notify us to not
withhold the federal income tax. Even if you plan to roll over the amount you
withdraw to another tax-deferred account, the withholding rate still applies to
the withdrawn amount unless we have received notice not to withhold federal
income tax prior to the withdrawal. You may notify us in writing or in certain
situations by telephone or through other electronic means. You have the right to
revoke your withholding election at any time and any election you make may
remain in effect until revoked by filing a new election.
Remember, even if you elect not to have income tax withheld, you are liable for
paying income tax on the taxable portion of your withdrawal. If you elect not to
have income tax withheld or you don't have enough income tax withheld, you may
be responsible for payment of estimated tax. You may incur penalties under the
estimated tax rules if your withholding and estimated tax payments are not
sufficient.
State tax will be withheld if, at the time of your distribution, your address is
within one of the mandatory withholding states and you have federal income tax
withheld. State taxes will be withheld from your distribution in accordance with
the respective state rules.
PROXY VOTING GUIDELINES
American Century Investment Management, Inc., the fund's investment advisor, is
responsible for exercising the voting rights associated with the securities
purchased and/or held by the fund. A description of the policies and procedures
the advisor uses in fulfilling this responsibility is available without charge,
upon request, by calling 1-800-345-2021. It is also available on American
Century's website at americancentury.com and on the Securities and Exchange
Commission's website at sec.gov. Information regarding how the investment
advisor voted proxies relating to portfolio securities during the most recent
12-month period ended June 30 is available on the "About Us" page at
americancentury.com. It is also available at sec.gov.
QUARTERLY PORTFOLIO DISCLOSURE
The fund files its complete schedule of portfolio holdings with the Securities
and Exchange Commission (SEC) for the first and third quarters of each fiscal
year on Form N-Q. The fund's Form N-Q is available on the SEC's website at
sec.gov, and may be reviewed and copied at the SEC's Public Reference Room in
Washington, DC. Information on the operation of the Public Reference Room may be
obtained by calling 1-800-SEC-0330. The fund also makes its complete schedule of
portfolio holdings for the most recent quarter of its fiscal year available on
its website at americancentury.com and, upon request, by calling 1-800-345-2021.
- ------
34
Index Definitions
The following indices are used to illustrate investment market, sector, or style
performance or to serve as fund performance comparisons. They are not investment
products available for purchase.
The DOW JONES INDUSTRIAL AVERAGE (DJIA) is a price-weighted average of 30
actively traded blue chip stocks, primarily industrials but including
service-oriented firms. Prepared and published by Dow Jones & Co., it is the
oldest and most widely quoted of all the market indicators.
The NASDAQ COMPOSITE INDEX is a market value-weighted index of all domestic and
international common stocks listed on the Nasdaq stock market.
The RUSSELL 1000(reg.tm) INDEX is a market-capitalization weighted, large-cap
index created by Frank Russell Company to measure the performance of the 1,000
largest companies in the Russell 3000 Index (the 3,000 largest publicly traded
U.S. companies, based on total market capitalization).
The RUSSELL 1000(reg.tm) VALUE INDEX measures the performance of those Russell
1000 companies (the 1,000 largest of the 3,000 largest publicly traded U.S.
companies, based on total market capitalization) with lower price-to-book ratios
and lower forecasted growth rates.
The RUSSELL 2000(reg.tm) INDEX is a market-capitalization weighted index created
by Frank Russell Company to measure the performance of the 2,000 smallest of the
3,000 largest publicly traded U.S. companies, based on total market
capitalization.
The S&P 500 INDEX is a market value-weighted index of the stocks of 500 publicly
traded U.S. companies chosen for market size, liquidity, and industry group
representation that are considered to be leading firms in dominant industries.
Each stock's weight in the index is proportionate to its market value. Created
by Standard & Poor's, it is considered to be a broad measure of U.S. stock
market performance.
- ------
35
Notes
- ------
36
CONTACT US
AMERICANCENTURY.COM
AUTOMATED INFORMATION LINE:
1-800-345-8765
INVESTOR SERVICES REPRESENTATIVE:
1-800-345-2021 or 816-531-5575
BUSINESS, NOT-FOR-PROFIT,
EMPLOYER-SPONSORED RETIREMENT PLANS:
1-800-345-3533
BANKS AND TRUST COMPANIES, BROKER-DEALERS,
FINANCIAL PROFESSIONALS, INSURANCE COMPANIES:
1-800-345-6488
TELECOMMUNICATIONS DEVICE FOR THE DEAF:
1-800-634-4113 or 816-444-3485
AMERICAN CENTURY MUTUAL FUNDS, INC.
INVESTMENT ADVISOR:
American Century Investment Management, Inc.
Kansas City, Missouri
THIS REPORT AND THE STATEMENTS IT CONTAINS ARE SUBMITTED FOR THE GENERAL
INFORMATION OF OUR SHAREHOLDERS. THE REPORT IS NOT AUTHORIZED FOR DISTRIBUTION
TO PROSPECTIVE INVESTORS UNLESS PRECEDED OR ACCOMPANIED BY AN EFFECTIVE
PROSPECTUS.
The American Century Investments logo, American Century and American Century
Investments are service marks of American Century Proprietary Holdings, Inc.
American Century Investment Services, Inc., Distributor
(c)2006 American Century Proprietary Holdings, Inc. All rights reserved.
0612
SH-ANN-52273N
AMERICAN CENTURY INVESTMENTS
Annual Report
October 31, 2006
[photo of winter scene]
American Century-Mason Street
Mid Cap Growth Fund
American Century-Mason Street
Small Cap Growth Fund
[american century investments logo and text logo]
Our Message to You
[photo of James E. Stowers III and James E. Stowers, Jr.]
/s/James E. Stowers, Jr.
James E. Stowers, Jr.
FOUNDER
AMERICAN CENTURY COMPANIES, INC.
/s/James E. Stowers III
James E. Stowers III
CHAIRMAN OF THE BOARD
AMERICAN CENTURY COMPANIES, INC.
We are pleased to provide you with the annual report for the American
Century-Mason Street Mid Cap Growth and Small Cap Growth funds for the seven
months ended October 31, 2006. We hope you find this information helpful in
monitoring your investment. Another useful resource we offer is our website,
americancentury.com, where we post quarterly portfolio commentaries, the views
of senior investment officers and analysts, and other communications about
investments, portfolio strategy, personal finance, and the markets.
In its most recent rankings, Dalbar -- which issues customer satisfaction
ratings and rankings based on website functionality -- ranked
americancentury.com seventh out of the sites provided by the top 25 fund
companies that it believes lead the industry in web-based technology. Our
website earned an "Excellent" rating, Dalbar's highest designation.
For most of 2006, our website has linked visitors to information explaining our
strategic collaboration with Lance Armstrong and the Lance Armstrong Foundation
(LAF). This campaign, featuring Lance, is designed to encourage investors to
take a more active role in planning their financial futures and make every
investment decision count. To learn more about the collaboration and the LAF,
please visit americancentury.com or www.lanceface.com on the Web and click on
the links to related sites.
With the approach of year end and the 2006 tax season, you can also find out
more about December fund distributions and tax information via a link from our
website. We've posted December distribution estimates for over 50 funds, answers
to frequent distribution questions, and online descriptions of all of the tax
information we provide to investors.
If you haven't visited americancentury.com yet, we encourage you to do so . . .
it's there to serve you. And so are we. As always, we deeply appreciate your
commitment to American Century Investments.
Table of Contents
Market Perspective . . . . . . . . . . . . . . . . . . . . . . . . . . . . 2
Seven-Month Total Returns . . . . . . . . . . . . . . . . . . . . . . . 2
MID CAP GROWTH
Performance . . . . . . . . . . . . . . . . . . . . . . . . . . . . . . . . 3
Portfolio Commentary . . . . . . . . . . . . . . . . . . . . . . . . . . . 5
Top Ten Holdings . . . . . . . . . . . . . . . . . . . . . . . . . . . . 5
Top Five Industries . . . . . . . . . . . . . . . . . . . . . . . . . . 6
Types of Investments in Portfolio . . . . . . . . . . . . . . . . . . . 6
Schedule of Investments . . . . . . . . . . . . . . . . . . . . . . . . . . 7
SMALL CAP GROWTH
Performance . . . . . . . . . . . . . . . . . . . . . . . . . . . . . . . 10
Portfolio Commentary . . . . . . . . . . . . . . . . . . . . . . . . . . . 12
Top Ten Holdings . . . . . . . . . . . . . . . . . . . . . . . . . . . 12
Top Five Industries . . . . . . . . . . . . . . . . . . . . . . . . . . 13
Types of Investments in Portfolio . . . . . . . . . . . . . . . . . . . 13
Schedule of Investments . . . . . . . . . . . . . . . . . . . . . . . . . 14
Shareholder Fee Examples . . . . . . . . . . . . . . . . . . . . . . . . . 16
FINANCIAL STATEMENTS
Statement of Assets and Liabilities . . . . . . . . . . . . . . . . . . . 19
Statement of Operations . . . . . . . . . . . . . . . . . . . . . . . . . 21
Statement of Changes in Net Assets . . . . . . . . . . . . . . . . . . . . 22
Notes to Financial Statements . . . . . . . . . . . . . . . . . . . . . . 24
Financial Highlights . . . . . . . . . . . . . . . . . . . . . . . . . . . 31
Report of Independent Registered Public Accounting Firm . . . . . . . . . 43
OTHER INFORMATION
Management . . . . . . . . . . . . . . . . . . . . . . . . . . . . . . . . 44
Share Class Information . . . . . . . . . . . . . . . . . . . . . . . . . 47
Additional Information . . . . . . . . . . . . . . . . . . . . . . . . . . 49
Index Definitions . . . . . . . . . . . . . . . . . . . . . . . . . . . . 50
The opinions expressed in the Market Perspective and each of the Portfolio
Commentaries reflect those of the portfolio management team as of the date of
the report, and do not necessarily represent the opinions of American Century or
any other person in the American Century organization. Any such opinions are
subject to change at any time based upon market or other conditions and American
Century disclaims any responsibility to update such opinions. These opinions may
not be relied upon as investment advice and, because investment decisions made
by American Century funds are based on numerous factors, may not be relied upon
as an indication of trading intent on behalf of any American Century fund.
Security examples are used for representational purposes only and are not
intended as recommendations to purchase or sell securities. Performance
information for comparative indices and securities is provided to American
Century by third party vendors. To the best of American Century's knowledge,
such information is accurate at the time of printing.
Market Perspective
MODEST RALLY FOR STOCKS
Cooling energy prices and a pause from the Federal Reserve enabled most U.S.
stocks to post positive results from the March 31, 2006, date that American
Century acquired the American Century-Mason Street funds' assets from Mason
Street, to October 31, 2006.
The stock market rallied after enduring a difficult spring--the broad S&P 500
Index fell by more than 4% during the last three weeks of May after unexpectedly
high inflation figures led to concerns about rising interest rates. Stocks
plodded along through the early summer, weighed down by uncertainties about
inflation and economic growth, until the Federal Reserve chose to leave
short-term interest rates unchanged at its policy meeting in mid-August.
After 17 consecutive rate hikes over a two-year period, the Fed decided to stand
pat amid evidence of moderating economic growth and declining energy and
commodity prices. In response, the major stock indexes staged a strong rally
that persisted through the end of the period.
SIZE AND QUALITY MATTERED
Thanks to the stock market's late-summer rally, most U.S. equity indexes
advanced during the seven-month period. However, the market's overall gains
masked some relatively narrow breadth. In an environment of slowing economic
growth, investors focused their attention on the stocks of larger,
higher-quality companies. Mid- and small-cap stocks lagged the performance of
large-caps but still posted modest gains. Extending a multi-year trend, value
shares performed better than growth stocks across the capitalization range.
Unfortunately, the shares of mid- and small-cap growth stocks such as those in
which the American Century-Mason Street Mid and Small Cap Growth funds invest
produced negative returns for the seven months (see the table below).
SECTOR PERFORMANCE SHIFTED
Sector performance reflected the defensive, risk-averse posture of the market
during the summer. Investors seeking companies with more predictable earnings
and dividend payouts shifted money into utilities and telecommunication services
providers, as well as companies that make everyday consumer products.
On the downside, the information technology and health care sectors posted some
of the largest declines during the period as investors moved away from the more
speculative and growth-oriented segments of the market. The slowing economy also
weighed on industrial and materials stocks, which are the most economically
sensitive sectors.
SEVEN-MONTH TOTAL RETURNS
AS OF OCTOBER 31, 2006*
- --------------------------------------------------------------------------------
RUSSELL 1000 INDEX (LARGE-CAP) 6.82%
- --------------------------------------------------------------------------------
Russell 1000 Growth 3.39%
- --------------------------------------------------------------------------------
Russell 1000 Value 10.35%
- --------------------------------------------------------------------------------
RUSSELL MIDCAP INDEX 3.40%
- --------------------------------------------------------------------------------
Russell Midcap Growth -0.16%
- --------------------------------------------------------------------------------
Russell Midcap Value 7.12%
- --------------------------------------------------------------------------------
RUSSELL 2000 INDEX (SMALL-CAP) 0.89%
- --------------------------------------------------------------------------------
Russell 2000 Growth -2.98%
- --------------------------------------------------------------------------------
Russell 2000 Value 4.86%
- --------------------------------------------------------------------------------
*Total returns for periods less than one year are not annualized.
- ------
2
Mid Cap Growth - Performance
TOTAL RETURNS AS OF OCTOBER 31, 2006
----------------------
AVERAGE ANNUAL RETURNS
- ------------------------------------------------------------------------------------------
SINCE INCEPTION
7 MONTHS(1) 1 YEAR 5 YEARS INCEPTION DATE
- ------------------------------------------------------------------------------------------
A CLASS 3/31/97
No sales charge* -7.35% 7.08% 5.64% 9.26%
With sales charge* -12.65% 0.90% 4.40% 8.59%
- ------------------------------------------------------------------------------------------
RUSSELL MIDCAP GROWTH INDEX(2) -0.16% 14.51% 10.62% 9.09% --
- ------------------------------------------------------------------------------------------
S&P MIDCAP 400 INDEX(2) -0.21% 13.43% 13.03% 13.96% --
- ------------------------------------------------------------------------------------------
Investor Class -- -- -- -6.90%(4) 4/3/06
- ------------------------------------------------------------------------------------------
Institutional Class -- -- -- -6.77%(4) 4/3/06
- ------------------------------------------------------------------------------------------
B Class(3) 3/31/97
No sales charge* -7.66% 6.35% 4.95% 8.55%
With sales charge* -12.66% 2.35% 4.79% 8.55%
- ------------------------------------------------------------------------------------------
C Class 4/3/06
No sales charge* -- -- -- -7.44%(4)
With sales charge* -- -- -- -8.37%(4)
- ------------------------------------------------------------------------------------------
R Class -- -- -- -7.17%(4) 4/3/06
- ------------------------------------------------------------------------------------------
*Sales charges include initial sales charges and contingent deferred sales
charges (CDSCs), as applicable. A Class shares have a maximum 5.75% initial
sales charge for equity funds and may be subject to a maximum CDSC of 1.00%. B
Class shares redeemed within six years of purchase are subject to a CDSC that
declines from 5.00% during the first year after purchase to 0.00% the sixth year
after purchase. C Class shares redeemed within 12 months of purchase are subject
to a maximum CDSC of 1.00%. Please see the Share Class Information pages for
more about the applicable sales charges for each share class. The SEC requires
that mutual funds provide performance information net of maximum sales charges
in all cases where charges could be applied.
Mid Cap Growth acquired all the net assets of the Mason Street Aggressive Growth
Fund on March 31, 2006, pursuant to a plan of reorganization approved by the
acquired fund's shareholders on March 15, 2006. Performance information prior to
April 1, 2006, is that of the Mason Street Aggressive Growth Fund.
(1) Total returns for periods less than one year are not annualized. The fund's
fiscal year was changed from March 31 to October 31, resulting in a
seven-month annual reporting period.
(2) Data provided by Lipper Inc. - A Reuters Company. (c) 2006 Reuters. All
rights reserved. Any copying, republication or redistribution of Lipper
content, including by caching, framing or similar means, is expressly
prohibited without the prior written consent of Lipper. Lipper shall not be
liable for any errors or delays in the content, or for any actions taken in
reliance thereon.
The data contained herein has been obtained from company reports, financial
reporting services, periodicals and other resources believed to be reliable.
Although carefully verified, data on compilations is not guaranteed by
Lipper and may be incomplete. No offer or solicitations to buy or sell any
of the securities herein is being made by Lipper.
(3) Class returns would have been lower if fees had not been waived.
(4) Total returns for periods less than one year are not annualized.
Data presented reflect past performance. Past performance is no guarantee of
future results. Current performance may be higher or lower than the performance
shown. Investment return and principal value will fluctuate, and redemption
value may be more or less than original cost. To obtain performance data current
to the most recent month end, please call 1-800-345-2021 or visit
americancentury.com.
Unless otherwise indicated, performance reflects A Class shares; performance for
other share classes will vary due to differences in fee structure. For
information about other share classes available, please consult the prospectus.
Data assumes reinvestment of dividends and capital gains, and none of the charts
reflect the deduction of taxes that a shareholder would pay on fund
distributions or the redemption of fund shares. Returns for the indices are
provided for comparison. The fund's total returns include operating expenses
(such as transaction costs and management fees) that reduce returns, while the
total returns of the indices do not.
(continued)
- ------
3
Mid Cap Growth - Performance
GROWTH OF $10,000 OVER LIFE OF CLASS
$10,000 investment made March 31, 1997
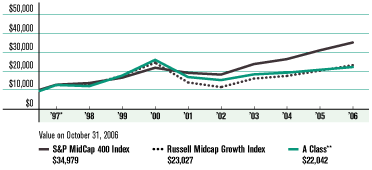
ONE-YEAR RETURNS OVER LIFE OF CLASS
Periods ended October 31
- --------------------------------------------------------------------------------------------------------------
1997* 1998 1999 2000 2001 2002 2003 2004 2005 2006
- --------------------------------------------------------------------------------------------------------------
A Class
(no sales charge)** 33.50% -4.94% 46.73% 47.26% -35.19% -9.55% 19.92% 4.92% 7.99% 7.08%
- --------------------------------------------------------------------------------------------------------------
Russell Midcap
Growth Index 24.22% 2.43% 37.66% 38.67% -42.78% -17.61% 39.30% 8.77% 15.91% 14.51%
- --------------------------------------------------------------------------------------------------------------
S&P MidCap
400 Index 27.35% 6.71% 21.07% 31.65% -12.45% -4.78% 30.73% 11.04% 17.65% 13.43%
- --------------------------------------------------------------------------------------------------------------
*From 3/31/97, the A Class's inception date. Not annualized. Mid Cap Growth A
Class's initial investment is $9,425 to reflect the maximum 5.75% initial
sales charge.
**Class returns would have been lower, along with ending value, if fees had not
been waived.
Data presented reflect past performance. Past performance is no guarantee of
future results. Current performance may be higher or lower than the performance
shown. Investment return and principal value will fluctuate, and redemption
value may be more or less than original cost. To obtain performance data current
to the most recent month end, please call 1-800-345-2021 or visit
americancentury.com.
Unless otherwise indicated, performance reflects A Class shares; performance for
other share classes will vary due to differences in fee structure. For
information about other share classes available, please consult the prospectus.
Data assumes reinvestment of dividends and capital gains, and none of the charts
reflect the deduction of taxes that a shareholder would pay on fund
distributions or the redemption of fund shares. Returns for the indices are
provided for comparison. The fund's total returns include operating expenses
(such as transaction costs and management fees) that reduce returns, while the
total returns of the indices do not.
- ------
4
Mid Cap Growth - Portfolio Commentary
PORTFOLIO MANAGER: BILL WALKER
PERFORMANCE SUMMARY
American Century-Mason Street Mid Cap Growth returned -7.35%* in the seven
months from the date American Century acquired the fund's assets from Mason
Street to the fund's fiscal year-end on October 31, 2006. By comparison, its
benchmark, the Russell MidCap Growth Index, returned -0.16%.
In a difficult environment for mid-cap growth stocks (see the Market Perspective
on page 2) that saw many segments of the fund and benchmark produce negative
returns, our positioning in the health care, industrials, energy, and consumer
discretionary sectors detracted from performance on an absolute basis and
relative to the benchmark.
HEALTH CARE, INDUSTRIALS HURT
Poor performance from our health care holdings was by far the largest detractor
from relative and absolute results for the period. The portfolio's return was
limited by our positioning and stock selection among medical device makers,
biotechnology firms, and health care providers. The leading detractor in the
health care space was biotech firm Neurocrine Biosciences. This portfolio
overweight received an unfavorable FDA decision on its new sleep drug, hurting
its share price. We eliminated this stock from the portfolio.
In industrial shares, our stock selection limited returns, particularly among
commercial services firms. Portfolio overweight positions such as Corporate
Executive Board and Monster Worldwide, home of the monster.com job board, were
key detractors during the period. After several years of solid performance,
these stocks sold off in recent months on worries about slower economic growth,
among other factors. Overall, the portfolio's industrial position returned -9%,
while these stocks in the index returned -2%.
ENERGY, CONSUMER DISCRETIONARY MIXED
In the energy sector, our stock selection was a positive influence, though this
sector detracted from relative performance because we were a little early taking
profits from energy's big run-up in recent years. Stocks in the oil, gas, and
consumable fuels industry were the sector's biggest detractors for the
TOP TEN HOLDINGS
AS OF OCTOBER 31, 2006
- --------------------------------------------------------------------------------
% OF % OF
NET ASSETS NET ASSETS
AS OF AS OF
10/31/06 4/30/06
- --------------------------------------------------------------------------------
Praxair, Inc. 2.5% 1.5%
- --------------------------------------------------------------------------------
DaVita Inc. 2.4% 1.9%
- --------------------------------------------------------------------------------
Amphenol Corp. Cl A 2.4% 1.4%
- --------------------------------------------------------------------------------
Alliance Data
Systems Corp. 2.3% 1.6%
- --------------------------------------------------------------------------------
Chicago Mercantile
Exchange Holdings Inc. 2.3% 1.4%
- --------------------------------------------------------------------------------
WebEx
Communications, Inc. 2.2% 1.0%
- --------------------------------------------------------------------------------
VCA Antech Inc. 2.1% 1.3%
- --------------------------------------------------------------------------------
Cognizant Technology
Solutions Corporation Cl A 1.8% 2.1%
- --------------------------------------------------------------------------------
VeriFone Holdings Inc. 1.7% 1.2%
- --------------------------------------------------------------------------------
Covance Inc. 1.7% 1.1%
- --------------------------------------------------------------------------------
*All fund returns referenced in this commentary are for A Class shares and are
not reduced by sales charges.
A Class shares are subject to a maximum sales charge of 5.75%.
Had the sales charge been applied, returns would be lower than those shown.
Total returns for periods less than one year are not annualized. (continued)
- ------
5
Mid Cap Growth - Portfolio Commentary
period, led by CONSOL Energy. CONSOL is a leading coal and gas provider, which
suffered from weaker energy prices and electricity demand. Nevertheless, one of
the portfolio's top contributors to both relative and absolute results resided
in the energy space--IntercontinentalExchange, an energy exchange benefiting
from the intense volatility and trading activity in energy in recent months.
Mixed returns were also the story among consumer discretionary shares, where
positive contributions from many industries couldn't overcome poor performance
by our hotel, restaurant, and leisure names. Some of the portfolio's biggest
detractors from relative returns were in this industry segment, including
Scientific Games, Station Casinos, and Choice Hotels International.
On a positive note, one source of outperformance relative to our index was an
underweight position in select consumer discretionary names where we saw
business fundamentals deteriorating. A prime example is shares of homebuilders
and home-related firms, as rising interest rates took a toll on many segments of
the housing market. We had zero exposure to stocks in the household durables
industry, which returned -15% for the period. In addition, this sector was home
to top-ten contributor AnnTaylor Stores. This specialty retailer of women's
apparel continued to benefit from management changes and a turnaround strategy
enacted last year.
PORTFOLIO OBJECTIVE & EXPECTATIONS
American Century-Mason Street Mid Cap Growth seeks long-term growth and is
committed to a strategy of identifying and investing in medium- and
smaller-sized companies with above-average growth potential. Our disciplined
investment process uses extensive research to identify companies that we believe
are well managed, have solid growth in revenue and earnings, and have strong
financial characteristics. We believe this investment approach can deliver solid
performance over time, and that American Century-Mason Street Mid Cap Growth can
be a good choice for the mid-cap growth portion of an investor's portfolio. In
addition, the mid-cap space has historically offered above-average earnings
growth, which should help drive relative performance.
TOP FIVE INDUSTRIES
AS OF OCTOBER 31, 2006
- --------------------------------------------------------------------------------
% OF % OF
NET ASSETS NET ASSETS
AS OF AS OF
10/31/06 4/30/06
- --------------------------------------------------------------------------------
Commercial Services
& Supplies 8.8% 8.4%
- --------------------------------------------------------------------------------
IT Services 8.2% 7.4%
- --------------------------------------------------------------------------------
Health Care Equipment
& Supplies 6.0% 6.0%
- --------------------------------------------------------------------------------
Health Care Providers
& Services 5.6% 6.6%
- --------------------------------------------------------------------------------
Internet Software
& Services 5.2% 1.6%
- --------------------------------------------------------------------------------
TYPES OF INVESTMENTS IN PORTFOLIO
- --------------------------------------------------------------------------------
% OF % OF
NET ASSETS NET ASSETS
AS OF AS OF
10/31/06 4/30/06
- --------------------------------------------------------------------------------
Common Stocks 88.5% 93.9%
- --------------------------------------------------------------------------------
Commercial Paper 10.8% 4.9%
- --------------------------------------------------------------------------------
Temporary Cash
Investments 0.3% 0.2%
- --------------------------------------------------------------------------------
Other Assets
and Liabilities 0.4% 1.0%
- --------------------------------------------------------------------------------
- ------
6
Mid Cap Growth - Schedule of Investments
OCTOBER 31, 2006
Shares Value
- --------------------------------------------------------------------------------
COMMON STOCKS -- 88.5%
AIR FREIGHT & LOGISTICS - 0.8%
- --------------------------------------------------------------------------------
31,760 Expeditors International
of Washington, Inc. $ 1,505,742
- --------------------------------------------------------------------------------
BIOTECHNOLOGY - 0.9%
- --------------------------------------------------------------------------------
29,620 Celgene Corp.(1) 1,582,893
- --------------------------------------------------------------------------------
CAPITAL MARKETS - 4.4%
- --------------------------------------------------------------------------------
39,630 Investment Technology
Group Inc.(1) 1,850,721
- --------------------------------------------------------------------------------
38,340 Investors Financial
Services Corporation 1,507,529
- --------------------------------------------------------------------------------
9,905 Legg Mason, Inc. 891,648
- --------------------------------------------------------------------------------
29,120 SEI Investments Co. 1,638,874
- --------------------------------------------------------------------------------
128,150 TD Ameritrade Holding Corp. 2,110,630
- --------------------------------------------------------------------------------
7,999,402
- --------------------------------------------------------------------------------
CHEMICALS - 2.5%
- --------------------------------------------------------------------------------
75,650 Praxair, Inc. 4,557,913
- --------------------------------------------------------------------------------
COMMERCIAL BANKS - 1.9%
- --------------------------------------------------------------------------------
81,200 Colonial BancGroup Inc. (The) 1,935,808
- --------------------------------------------------------------------------------
35,000 SVB Financial Group(1) 1,610,700
- --------------------------------------------------------------------------------
3,546,508
- --------------------------------------------------------------------------------
COMMERCIAL SERVICES & SUPPLIES - 8.8%
- --------------------------------------------------------------------------------
24,730 Corporate Executive
Board Co. (The) 2,221,249
- --------------------------------------------------------------------------------
64,650 Corrections Corp. of America(1) 2,953,858
- --------------------------------------------------------------------------------
49,740 Herman Miller Inc. 1,705,087
- --------------------------------------------------------------------------------
26,450 Monster Worldwide Inc.(1) 1,071,490
- --------------------------------------------------------------------------------
51,860 Ritchie Bros Auctioneers Inc. 2,827,926
- --------------------------------------------------------------------------------
71,150 Robert Half International Inc. 2,600,532
- --------------------------------------------------------------------------------
39,110 Stericycle Inc.(1) 2,765,467
- --------------------------------------------------------------------------------
16,145,609
- --------------------------------------------------------------------------------
COMMUNICATIONS EQUIPMENT - 1.7%
- --------------------------------------------------------------------------------
71,490 Harris Corp. 3,045,474
- --------------------------------------------------------------------------------
DIVERSIFIED CONSUMER SERVICES - 0.7%
- --------------------------------------------------------------------------------
11,630 Strayer Education, Inc. 1,315,586
- --------------------------------------------------------------------------------
DIVERSIFIED FINANCIAL SERVICES - 3.9%
- --------------------------------------------------------------------------------
8,250 Chicago Mercantile
Exchange Holdings Inc. 4,133,250
- --------------------------------------------------------------------------------
35,192 IntercontinentalExchange Inc.(1) 2,970,909
- --------------------------------------------------------------------------------
7,104,159
- --------------------------------------------------------------------------------
DIVERSIFIED TELECOMMUNICATION SERVICES - 0.9%
- --------------------------------------------------------------------------------
58,340 NeuStar, Inc. Cl A(1) 1,704,695
- --------------------------------------------------------------------------------
ELECTRONIC EQUIPMENT & INSTRUMENTS - 4.3%
- --------------------------------------------------------------------------------
64,460 Amphenol Corp. Cl A 4,376,834
- --------------------------------------------------------------------------------
27,400 Dolby Laboratories Inc. Cl A(1) 542,246
- --------------------------------------------------------------------------------
100,980 Jabil Circuit, Inc. 2,899,136
- --------------------------------------------------------------------------------
7,818,216
- --------------------------------------------------------------------------------
Shares Value
- --------------------------------------------------------------------------------
ENERGY EQUIPMENT & SERVICES - 4.4%
- --------------------------------------------------------------------------------
45,290 Cameron International Corp.(1) $ 2,269,029
- --------------------------------------------------------------------------------
47,060 ENSCO International Inc. 2,304,528
- --------------------------------------------------------------------------------
32,000 National Oilwell Varco, Inc.(1) 1,932,800
- --------------------------------------------------------------------------------
37,910 Smith International, Inc. 1,496,687
- --------------------------------------------------------------------------------
8,003,044
- --------------------------------------------------------------------------------
FOOD & STAPLES RETAILING - 0.9%
- --------------------------------------------------------------------------------
24,765 Whole Foods Market, Inc. 1,580,998
- --------------------------------------------------------------------------------
HEALTH CARE EQUIPMENT & SUPPLIES - 6.0%
- --------------------------------------------------------------------------------
31,050 Cytyc Corp.(1) 820,341
- --------------------------------------------------------------------------------
25,780 Gen-Probe Inc.(1) 1,234,089
- --------------------------------------------------------------------------------
16,100 Intuitive Surgical Inc.(1) 1,596,798
- --------------------------------------------------------------------------------
54,290 Kyphon Inc.(1) 2,144,454
- --------------------------------------------------------------------------------
26,690 Mentor Corp. 1,249,092
- --------------------------------------------------------------------------------
48,550 ResMed Inc.(1) 2,135,714
- --------------------------------------------------------------------------------
34,130 Varian Medical Systems, Inc.(1) 1,872,372
- --------------------------------------------------------------------------------
11,052,860
- --------------------------------------------------------------------------------
HEALTH CARE PROVIDERS & SERVICES - 5.6%
- --------------------------------------------------------------------------------
41,817 Caremark Rx Inc. 2,058,651
- --------------------------------------------------------------------------------
78,900 DaVita Inc.(1) 4,389,206
- --------------------------------------------------------------------------------
117,550 VCA Antech Inc.(1) 3,805,093
- --------------------------------------------------------------------------------
10,252,950
- --------------------------------------------------------------------------------
HOTELS, RESTAURANTS & LEISURE - 2.2%
- --------------------------------------------------------------------------------
13,270 Choice Hotels International Inc. 556,278
- --------------------------------------------------------------------------------
54,600 Scientific Games Corp. Cl A(1) 1,530,438
- --------------------------------------------------------------------------------
32,200 Station Casinos Inc. 1,941,660
- --------------------------------------------------------------------------------
4,028,376
- --------------------------------------------------------------------------------
INSURANCE - 2.5%
- --------------------------------------------------------------------------------
89,300 Assured Guaranty Ltd. 2,247,681
- --------------------------------------------------------------------------------
83,960 Brown & Brown Inc. 2,456,670
- --------------------------------------------------------------------------------
4,704,351
- --------------------------------------------------------------------------------
INTERNET & CATALOG RETAIL - 0.8%
- --------------------------------------------------------------------------------
24,870 NutriSystem, Inc.(1) 1,533,982
- --------------------------------------------------------------------------------
INTERNET SOFTWARE & SERVICES - 5.2%
- --------------------------------------------------------------------------------
42,300 Digital River Inc.(1) 2,447,055
- --------------------------------------------------------------------------------
167,820 ValueClick Inc.(1) 3,155,016
- --------------------------------------------------------------------------------
102,510 WebEx Communications, Inc.(1) 3,941,510
- --------------------------------------------------------------------------------
9,543,581
- --------------------------------------------------------------------------------
IT SERVICES - 8.2%
- --------------------------------------------------------------------------------
69,860 Alliance Data Systems Corp.(1) 4,241,899
- --------------------------------------------------------------------------------
44,380 Cognizant Technology
Solutions Corporation Cl A(1) 3,340,926
- --------------------------------------------------------------------------------
47,410 Euronet Worldwide Inc.(1) 1,409,025
- --------------------------------------------------------------------------------
86,840 SRA International, Inc. Cl A(1) 2,783,222
- --------------------------------------------------------------------------------
108,680 VeriFone Holdings Inc.(1) 3,174,543
- --------------------------------------------------------------------------------
14,949,615
- --------------------------------------------------------------------------------
See Notes to Financial Statements. (continued)
- ------
7
Mid Cap Growth - Schedule of Investments
OCTOBER 31, 2006
Shares Value
- --------------------------------------------------------------------------------
LEISURE EQUIPMENT & PRODUCTS - 0.9%
- --------------------------------------------------------------------------------
39,300 Pool Corp. $ 1,610,514
- --------------------------------------------------------------------------------
LIFE SCIENCES TOOLS & SERVICES - 2.7%
- --------------------------------------------------------------------------------
54,170 Covance Inc.(1) 3,168,945
- --------------------------------------------------------------------------------
17,590 Illumina, Inc.(1) 773,256
- --------------------------------------------------------------------------------
22,430 Ventana Medical Systems Inc.(1) 905,948
- --------------------------------------------------------------------------------
4,848,149
- --------------------------------------------------------------------------------
MACHINERY - 2.4%
- --------------------------------------------------------------------------------
56,220 Graco Inc. 2,291,527
- --------------------------------------------------------------------------------
51,960 Joy Global Inc. 2,032,156
- --------------------------------------------------------------------------------
4,323,683
- --------------------------------------------------------------------------------
MEDIA - 0.8%
- --------------------------------------------------------------------------------
25,170 Lamar Advertising Co. Cl A(1) 1,451,806
- --------------------------------------------------------------------------------
OIL, GAS & CONSUMABLE FUELS - 2.3%
- --------------------------------------------------------------------------------
56,130 Newfield Exploration Company(1) 2,289,542
- --------------------------------------------------------------------------------
72,210 Range Resources Corporation 1,960,502
- --------------------------------------------------------------------------------
4,250,044
- --------------------------------------------------------------------------------
REAL ESTATE INVESTMENT TRUSTS - 1.4%
- --------------------------------------------------------------------------------
65,030 Ventas, Inc. 2,534,869
- --------------------------------------------------------------------------------
ROAD & RAIL - 0.7%
- --------------------------------------------------------------------------------
60,710 J.B. Hunt Transport Services, Inc. 1,313,764
- --------------------------------------------------------------------------------
SEMICONDUCTORS &
SEMICONDUCTOR EQUIPMENT - 3.2%
- --------------------------------------------------------------------------------
45,720 Altera Corp.(1) 843,077
- --------------------------------------------------------------------------------
24,950 KLA-Tencor Corp. 1,226,792
- --------------------------------------------------------------------------------
35,790 MEMC Electronic Materials Inc.(1) 1,270,545
- --------------------------------------------------------------------------------
77,797 Microchip Technology Inc. 2,561,855
- --------------------------------------------------------------------------------
5,902,269
- --------------------------------------------------------------------------------
SOFTWARE - 3.1%
- --------------------------------------------------------------------------------
138,397 Activision, Inc.(1) 2,134,082
- --------------------------------------------------------------------------------
59,838 Citrix Systems, Inc.(1) 1,767,016
- --------------------------------------------------------------------------------
32,860 FactSet Research Systems Inc. 1,672,574
- --------------------------------------------------------------------------------
5,573,672
- --------------------------------------------------------------------------------
SPECIALTY RETAIL - 3.5%
- --------------------------------------------------------------------------------
35,570 Aeropostale Inc.(1) 1,042,557
- --------------------------------------------------------------------------------
39,700 AnnTaylor Stores Corporation(1) 1,747,594
- --------------------------------------------------------------------------------
24,670 GameStop Corp. Cl A(1) 1,259,650
- --------------------------------------------------------------------------------
58,970 O'Reilly Automotive Inc.(1) 1,904,141
- --------------------------------------------------------------------------------
22,650 Urban Outfitters Inc.(1) 396,375
- --------------------------------------------------------------------------------
6,350,317
- --------------------------------------------------------------------------------
Shares/Principal Amount Value
- --------------------------------------------------------------------------------
TRADING COMPANIES &
DISTRIBUTORS - 0.9%
- --------------------------------------------------------------------------------
40,650 Fastenal Co. 1,635,756
- --------------------------------------------------------------------------------
TOTAL COMMON STOCKS
(Cost $138,520,989) 161,770,797
- --------------------------------------------------------------------------------
COMMERCIAL PAPER(2) -- 10.8%
$2,000,000 Bank of America Corp.,
5.24%, 11/6/06 1,998,534
- --------------------------------------------------------------------------------
3,000,000 DaimlerChrysler Auto,
5.25%, 11/20/06(3) 2,991,639
- --------------------------------------------------------------------------------
3,000,000 New Century Asset Trust,
5.26%, 12/5/06(3) 2,984,997
- --------------------------------------------------------------------------------
2,000,000 Preferred Receivable Funding,
5.26%, 11/10/06 1,997,348
- --------------------------------------------------------------------------------
2,500,000 Ranger Funding Co. LLC,
5.26%, 11/22/06(3) 2,492,300
- --------------------------------------------------------------------------------
2,000,000 Sheffield Receivables,
5.26%, 11/15/06 1,995,884
- --------------------------------------------------------------------------------
2,000,000 Thunder Bay Funding LLC,
5.26%, 11/20/06
(Acquired 10/18/06,
Cost $1,990,357)(4) 1,994,396
- --------------------------------------------------------------------------------
1,300,000 UBS Finance LLC,
5.28%, 11/1/06 1,300,000
- --------------------------------------------------------------------------------
2,000,000 Windmill Funding Corp.,
5.25%, 11/13/06
(Acquired 10/18/06,
Cost $1,992,417)(4) 1,996,468
- --------------------------------------------------------------------------------
TOTAL COMMERCIAL PAPER
(Cost $19,751,884) 19,751,566
- --------------------------------------------------------------------------------
TEMPORARY CASH INVESTMENTS -- 0.3%
- --------------------------------------------------------------------------------
500,000 FHLMC Discount Notes,
5.14%, 12/27/06(2)
(Cost $496,001) 496,061
- --------------------------------------------------------------------------------
TOTAL INVESTMENT SECURITIES -- 99.6%
(Cost $158,768,874) 182,018,424
- --------------------------------------------------------------------------------
OTHER ASSETS
AND LIABILITIES -- 0.4% 703,078
- --------------------------------------------------------------------------------
TOTAL NET ASSETS -- 100.0% $182,721,502
================================================================================
See Notes to Financial Statements. (continued)
- ------
8
Mid Cap Growth - Schedule of Investments
OCTOBER 31, 2006
FUTURES CONTRACTS
Underlying Face Unrealized
Contracts Purchased Expiration Date Amount at Value Gain (Loss)
- --------------------------------------------------------------------------------
18 S&P MidCap 400 Index Futures December 2006 $7,114,500 $74,933
==============================
NOTES TO SCHEDULE OF INVESTMENTS
FHLMC = Federal Home Loan Mortgage Corporation
(1) Non-income producing.
(2) The rate indicated is the yield to maturity at purchase.
(3) Security, or a portion thereof, has been segregated for futures contracts.
(4) Security was purchased under Rule 144A or Section 4(2) of the Securities
Act of 1933 or is a private placement and, unless registered under the Act
or exempted from registration, may only be sold to qualified institutional
investors. The aggregate value of restricted securities at October 31, 2006
was $3,990,864, which represented 2.2% of total net assets.
See Notes to Financial Statements.
- ------
9
Small Cap Growth - Performance
TOTAL RETURNS AS OF OCTOBER 31, 2006
----------------------
AVERAGE ANNUAL RETURNS
- ------------------------------------------------------------------------------
SINCE INCEPTION
7 MONTHS(1) 1 YEAR 5 YEARS INCEPTION DATE
- ------------------------------------------------------------------------------
A CLASS(2) 7/12/99
No sales charge* -5.88% 6.63% 10.29% 11.98%
With sales charge* -11.30% 0.52% 8.99% 11.07%
- ------------------------------------------------------------------------------
RUSSELL 2000
GROWTH INDEX(3) -2.98% 17.07% 9.51% 2.56%(4) --
- ------------------------------------------------------------------------------
S&P SMALLCAP
600 INDEX(3) -0.71% 16.10% 14.97% 11.44%(4) --
- ------------------------------------------------------------------------------
Investor Class -- -- -- -4.92%(5) 4/3/06
- ------------------------------------------------------------------------------
Institutional Class -- -- -- -4.80%(5) 4/3/06
- ------------------------------------------------------------------------------
B Class(2) 7/12/99
No sales charge* -6.24% 5.87% 9.55% 11.27%
With sales charge* -11.24% 1.87% 9.41% 11.27%
- ------------------------------------------------------------------------------
C Class 4/3/06
No sales charge* -- -- -- -5.46%(5)
With sales charge* -- -- -- -6.40%(5)
- ------------------------------------------------------------------------------
R Class -- -- -- -5.22%(5) 4/3/06
- ------------------------------------------------------------------------------
*Sales charges include initial sales charges and contingent deferred sales
charges (CDSCs), as applicable. A Class shares have a maximum 5.75% initial
sales charge for equity funds and may be subject to a maximum CDSC of 1.00%. B
Class shares redeemed within six years of purchase are subject to a CDSC that
declines from 5.00% during the first year after purchase to 0.00% the sixth year
after purchase. C Class shares redeemed within 12 months of purchase are subject
to a maximum CDSC of 1.00%. Please see the Share Class Information pages for
more about the applicable sales charges for each share class. The SEC requires
that mutual funds provide performance information net of maximum sales charges
in all cases where charges could be applied.
Small Cap Growth acquired all the net assets of the Mason Street Small Cap
Growth Fund on March 31, 2006, pursuant to a plan of reorganization approved by
the acquired fund's shareholders on March 23, 2006. Performance information
prior to April 1, 2006, is that of the Mason Street Small Cap Growth Fund.
(1) Total returns for periods less than one year are not annualized. The fund's
fiscal year was changed from March 31 to October 31, resulting in a
seven-month annual reporting period.
(2) Class returns would have been lower if fees had not been waived.
(3) Data provided by Lipper Inc. - A Reuters Company. (c) 2006 Reuters. All
rights reserved. Any copying, republication or redistribution of Lipper
content, including by caching, framing or similar means, is expressly
prohibited without the prior written consent of Lipper. Lipper shall not be
liable for any errors or delays in the content, or for any actions taken in
reliance thereon.
The data contained herein has been obtained from company reports, financial
reporting services, periodicals and other resources believed to be reliable.
Although carefully verified, data on compilations is not guaranteed by
Lipper and may be incomplete. No offer or solicitations to buy or sell any
of the securities herein is being made by Lipper.
(4) Since 7/14/99, the date nearest the A Class's inception for which data are
available.
(5) Total returns for periods less than one year are not annualized.
Data presented reflect past performance. Past performance is no guarantee of
future results. Current performance may be higher or lower than the performance
shown. Investment return and principal value will fluctuate, and redemption
value may be more or less than original cost. To obtain performance data current
to the most recent month end, please call 1-800-345-2021 or visit
americancentury.com. Historically, small company stocks have been more volatile
than the stocks of larger, more established companies.
Unless otherwise indicated, performance reflects A Class shares; performance for
other share classes will vary due to differences in fee structure. For
information about other share classes available, please consult the prospectus.
Data assumes reinvestment of dividends and capital gains, and none of the charts
reflect the deduction of taxes that a shareholder would pay on fund
distributions or the redemption of fund shares. Returns for the indices are
provided for comparison. The fund's total returns include operating expenses
(such as transaction costs and management fees) that reduce returns, while the
total returns of the indices do not.
(continued)
- ------
10
Small Cap Growth - Performance
GROWTH OF $10,000 OVER LIFE OF CLASS
$10,000 investment made July 12, 1999

ONE-YEAR RETURNS OVER LIFE OF CLASS
Periods ended October 31
- -----------------------------------------------------------------------------------------------------
1999* 2000 2001 2002 2003 2004 2005 2006
- -----------------------------------------------------------------------------------------------------
A Class (no sales charge)** 13.00% 63.92% -24.37% -7.06% 28.49% 7.39% 19.34% 6.63%
- -----------------------------------------------------------------------------------------------------
Russell 2000 Growth Index -4.03% 16.16% -31.50% -21.57% 46.56% 5.53% 10.91% 17.07%
- -----------------------------------------------------------------------------------------------------
S&P SmallCap 600 Index -6.41% 25.27% -6.44% -3.78% 33.58% 16.78% 15.27% 16.10%
- -----------------------------------------------------------------------------------------------------
*From 7/12/99, the A Class's inception date. Index data from 7/14/99, the date
nearest the A Class's inception for which data are available. Not annualized.
Small Cap Growth A Class's initial investment is $9,425 to reflect the maximum
5.75% initial sales charge.
**Class returns would have been lower, along with ending value, if fees had not
been waived.
Data presented reflect past performance. Past performance is no guarantee of
future results. Current performance may be higher or lower than the performance
shown. Investment return and principal value will fluctuate, and redemption
value may be more or less than original cost. To obtain performance data current
to the most recent month end, please call 1-800-345-2021 or visit
americancentury.com. Historically, small company stocks have been more volatile
than the stocks of larger, more established companies.
Unless otherwise indicated, performance reflects A Class shares; performance for
other share classes will vary due to differences in fee structure. For
information about other share classes available, please consult the prospectus.
Data assumes reinvestment of dividends and capital gains, and none of the charts
reflect the deduction of taxes that a shareholder would pay on fund
distributions or the redemption of fund shares. Returns for the indices are
provided for comparison. The fund's total returns include operating expenses
(such as transaction costs and management fees) that reduce returns, while the
total returns of the indices do not.
- ------
11
Small Cap Growth - Portfolio Commentary
PORTFOLIO MANAGER: BILL WALKER
PERFORMANCE SUMMARY
American Century-Mason Street Small Cap Growth returned -5.88%* in the seven
months from the date American Century acquired the fund's assets from Mason
Street to the fund's fiscal year-end on October 31, 2006. By comparison, its
benchmark, the small-cap Russell 2000 Growth Index, returned -2.98%.
In a difficult environment for small-cap growth stocks (see the Market
Perspective on page 2) that saw many segments of the fund and benchmark produce
negative returns, our positioning in industrials and financials contributed
positively to performance on an absolute basis and relative to the benchmark.
That said, the portfolio's underperformance versus its index resulted in large
part from disappointing stock selection in the health care, consumer
discretionary, and energy sectors.
HEALTH CARE HURT
In the health care sector, we added value relative to the benchmark by
underweighting biotechnology and pharmaceuticals, two poor-performing industry
segments. In addition, this sector was home to one of the portfolio's biggest
relative and absolute contributors--medical device-maker FoxHollow Technologies,
which performed well on the strength of its solid product line and earnings
growth, as well as a deal with pharmaceutical giant Merck. But despite those
positives, many of the portfolio's leading relative and absolute detractors were
health care providers, including LCA-Vision, The Providence Service Corp.,
Symbion, and Horizon Health. Add it all up, and the health care stocks in the
portfolio returned -7%, compared with -4% for those in the index.
CONSUMER DISCRETIONARY, ENERGY DETRACTED
Mixed performance was also the story among consumer discretionary shares, where
good stock picks among hotel, restaurant, and leisure names and auto parts
providers couldn't overcome poor performance by our specialty retail stocks. One
of the portfolio's biggest detractors resided in this space--Golf Galaxy. This
golf retailer was hurt by bad weather and disappointing Father's Day sales,
resulting in poor earnings.
Another area where our stock selection worked against us was in energy, where
TOP TEN HOLDINGS
AS OF OCTOBER 31, 2006
- --------------------------------------------------------------------------------
% OF % OF
NET ASSETS NET ASSETS
AS OF AS OF
10/31/06 4/30/06
- --------------------------------------------------------------------------------
Kyphon Inc. 2.3% 1.4%
- --------------------------------------------------------------------------------
Huron Consulting
Group Inc. 2.2% 1.1%
- --------------------------------------------------------------------------------
United Natural Foods Inc. 2.2% 1.7%
- --------------------------------------------------------------------------------
Psychiatric Solutions, Inc. 2.1% 1.6%
- --------------------------------------------------------------------------------
Advisory Board Co. (The) 2.0% 2.0%
- --------------------------------------------------------------------------------
LKQ Corporation 1.9% 1.3%
- --------------------------------------------------------------------------------
Hibbett Sporting
Goods Inc. 1.9% 1.3%
- --------------------------------------------------------------------------------
Providence Service
Corp. (The) 1.9% 1.7%
- --------------------------------------------------------------------------------
Blackboard Inc. 1.9% 1.5%
- --------------------------------------------------------------------------------
Life Time Fitness Inc. 1.8% 1.2%
- --------------------------------------------------------------------------------
*All fund returns referenced in this commentary are for A Class shares and are
not reduced by sales charges.
A Class shares are subject to a maximum sales charge of 5.75%.
Had the sales charge been applied, returns would be lower than those shown.
Total returns for periods less than one year are not annualized.
Class returns would have been lower if fees had not been waived. (continued)
- ------
12
Small Cap Growth - Portfolio Commentary
equipment & services holdings hurt, as did oil, gas & consumable fuels firms.
For example, after a big run-up with energy prices in recent years, Hydril--an
equipment & services firm with exposure to the volatile North American natural
gas market--ended the seven-month reporting period as one of our biggest
detractors. It's a similar story for James River Coal, where strong performance
in 2005 turned negative in 2006. In part that's due to the fact that coal is
seen as a cheaper alternative to natural gas, so when natural gas prices weaken,
coal's pricing advantage decreases.
INDUSTRIAL-STRENGTH GAINS
The industrials sector was home to many of our leading contributors to
performance. A good example is Corrections Corp. of America, which runs
correctional facilities across the United States. This stock benefited from
expanding business and a favorable municipal budget environment, making it the
number-one contributor to both relative and absolute returns.
Other leading contributors were business support outsourcing firm ICT Group, and
the Huron Consulting Group. Huron is a financial consulting firm with expertise
in issues around stock option grants and executive compensation--this during a
period when several high-profile firms were hit with questions about the timing
of option grants.
We also added value relative to the index with an underweight position in
information technology shares, which had negative absolute returns and made up
the worst-performing segment of the index during the reporting period. The
financials sector was another positive contributor as a result of our effective
stock selection and allocation decisions in many industry segments.
PORTFOLIO OBJECTIVE & EXPECTATIONS
American Century-Mason Street Small Cap Growth seeks long-term growth by buying
high-quality, fast-growing, small-cap companies. We believe that relative to
small-cap value, growth currently offers greater opportunities through
attractive relative value and strong earnings per share growth.
Our disciplined investment process focuses on well-managed, growing,
attractively valued companies. We believe this investment approach can deliver
solid performance over time, and that American Century-Mason Street Small Cap
Growth can be a good choice for the small-cap growth portion of an investor's
portfolio.
TOP FIVE INDUSTRIES
AS OF OCTOBER 31, 2006
- --------------------------------------------------------------------------------
% OF % OF
NET ASSETS NET ASSETS
AS OF AS OF
10/31/06 4/30/06
- --------------------------------------------------------------------------------
Commercial Services
& Supplies 14.3% 9.9%
- --------------------------------------------------------------------------------
Health Care Providers
& Services 8.7% 12.0%
- --------------------------------------------------------------------------------
Semiconductors &
Semiconductor Equipment 6.2% 4.8%
- --------------------------------------------------------------------------------
Hotels, Restaurants
& Leisure 5.7% 6.7%
- --------------------------------------------------------------------------------
Health Care Equipment
& Supplies 5.7% 6.3%
- --------------------------------------------------------------------------------
TYPES OF INVESTMENTS IN PORTFOLIO
- --------------------------------------------------------------------------------
% OF % OF
NET ASSETS NET ASSETS
AS OF AS OF
10/31/06 4/30/06
- --------------------------------------------------------------------------------
Common Stocks 89.6% 93.7%
- --------------------------------------------------------------------------------
Commercial Paper 8.9% 6.3%
- --------------------------------------------------------------------------------
Temporary Cash
Investments 0.4% 0.6%
- --------------------------------------------------------------------------------
Other Assets
and Liabilities 1.1% (0.6)%
- --------------------------------------------------------------------------------
- ------
13
Small Cap Growth - Schedule of Investments
OCTOBER 31, 2006
Shares Value
- --------------------------------------------------------------------------------
COMMON STOCKS -- 89.6%
AEROSPACE & DEFENSE - 1.2%
- --------------------------------------------------------------------------------
31,400 Essex Corp.(1) $ 617,952
- --------------------------------------------------------------------------------
AIR FREIGHT & LOGISTICS - 1.2%
- --------------------------------------------------------------------------------
7,140 C.H. Robinson Worldwide Inc. 298,024
- --------------------------------------------------------------------------------
9,651 Forward Air Corp. 313,368
- --------------------------------------------------------------------------------
611,392
- --------------------------------------------------------------------------------
AUTO COMPONENTS - 1.9%
- --------------------------------------------------------------------------------
42,100 LKQ Corporation(1) 974,194
- --------------------------------------------------------------------------------
CAPITAL MARKETS - 3.2%
- --------------------------------------------------------------------------------
2,000 Evercore Partners Inc. Cl A(1) 73,360
- --------------------------------------------------------------------------------
11,575 Greenhill & Co. Inc. 786,406
- --------------------------------------------------------------------------------
24,489 OptionsXpress Holdings, Inc. 761,118
- --------------------------------------------------------------------------------
1,620,884
- --------------------------------------------------------------------------------
CHEMICALS - 1.2%
- --------------------------------------------------------------------------------
15,625 Airgas Inc. 590,781
- --------------------------------------------------------------------------------
COMMERCIAL BANKS - 2.0%
- --------------------------------------------------------------------------------
6,025 First Republic Bank 234,614
- --------------------------------------------------------------------------------
23,250 Greater Bay Bancorp 598,687
- --------------------------------------------------------------------------------
13,800 Nexity Financial Corp.(1) 182,298
- --------------------------------------------------------------------------------
1,015,599
- --------------------------------------------------------------------------------
COMMERCIAL SERVICES & SUPPLIES - 14.3%
- --------------------------------------------------------------------------------
17,700 ACCO Brands Corp.(1) 430,110
- --------------------------------------------------------------------------------
18,600 Advisory Board Co. (The)(1) 1,027,091
- --------------------------------------------------------------------------------
13,200 Brady Corp. Cl A 488,400
- --------------------------------------------------------------------------------
5,700 Corporate Executive
Board Co. (The) 511,974
- --------------------------------------------------------------------------------
15,540 Corrections Corp. of America(1) 710,023
- --------------------------------------------------------------------------------
34,900 Global Cash Access Inc.(1) 556,655
- --------------------------------------------------------------------------------
28,000 Huron Consulting Group Inc.(1) 1,118,879
- --------------------------------------------------------------------------------
24,100 ICT Group Inc.(1) 763,970
- --------------------------------------------------------------------------------
22,984 Kenexa Corp.(1) 738,476
- --------------------------------------------------------------------------------
25,232 Knoll Inc. 499,594
- --------------------------------------------------------------------------------
18,800 PeopleSupport Inc.(1) 368,292
- --------------------------------------------------------------------------------
7,213,464
- --------------------------------------------------------------------------------
CONTAINERS & PACKAGING - 0.7%
- --------------------------------------------------------------------------------
8,320 Silgan Holdings Inc. 344,198
- --------------------------------------------------------------------------------
DIVERSIFIED FINANCIAL SERVICES - 3.0%
- --------------------------------------------------------------------------------
11,400 International Securities
Exchange Inc. 585,390
- --------------------------------------------------------------------------------
26,230 Marlin Business
Services Corp.(1) 606,175
- --------------------------------------------------------------------------------
7,350 Portfolio Recovery
Associates Inc.(1) 342,657
- --------------------------------------------------------------------------------
1,534,222
- --------------------------------------------------------------------------------
ELECTRIC UTILITIES - 1.0%
- --------------------------------------------------------------------------------
13,675 ITC Holdings Corp. 485,736
- --------------------------------------------------------------------------------
Shares Value
- --------------------------------------------------------------------------------
ELECTRONIC EQUIPMENT & INSTRUMENTS - 1.2%
- --------------------------------------------------------------------------------
47,273 International
DisplayWorks, Inc.(1) $ 303,020
- --------------------------------------------------------------------------------
14,200 Plexus Corp.(1) 311,264
- --------------------------------------------------------------------------------
614,284
- --------------------------------------------------------------------------------
ENERGY EQUIPMENT & SERVICES - 2.9%
- --------------------------------------------------------------------------------
9,600 Dril-Quip Inc.(1) 378,048
- --------------------------------------------------------------------------------
10,645 Grant Prideco Inc.(1) 402,062
- --------------------------------------------------------------------------------
99,550 Grey Wolf Inc.(1) 696,850
- --------------------------------------------------------------------------------
1,476,960
- --------------------------------------------------------------------------------
FOOD & STAPLES RETAILING - 2.2%
- --------------------------------------------------------------------------------
31,575 United Natural Foods Inc.(1) 1,101,968
- --------------------------------------------------------------------------------
HEALTH CARE EQUIPMENT & SUPPLIES - 5.7%
- --------------------------------------------------------------------------------
14,000 FoxHollow Technologies Inc.(1) 490,140
- --------------------------------------------------------------------------------
29,150 Kyphon Inc.(1) 1,151,425
- --------------------------------------------------------------------------------
14,400 PolyMedica Corp. 598,320
- --------------------------------------------------------------------------------
14,440 ResMed Inc.(1) 635,216
- --------------------------------------------------------------------------------
2,875,101
- --------------------------------------------------------------------------------
HEALTH CARE PROVIDERS & SERVICES - 8.7%
- --------------------------------------------------------------------------------
13,600 Centene Corp.(1) 320,824
- --------------------------------------------------------------------------------
6,400 HealthExtras Inc.(1) 147,392
- --------------------------------------------------------------------------------
16,120 Pediatrix Medical Group, Inc.(1) 724,272
- --------------------------------------------------------------------------------
34,484 Providence Service Corp. (The)(1) 947,965
- --------------------------------------------------------------------------------
31,100 PSS World Medical Inc.(1) 625,732
- --------------------------------------------------------------------------------
32,300 Psychiatric Solutions, Inc.(1) 1,072,359
- --------------------------------------------------------------------------------
19,075 Radiation Therapy Services Inc.(1) 567,672
- --------------------------------------------------------------------------------
4,406,216
- --------------------------------------------------------------------------------
HEALTH CARE TECHNOLOGY - 1.4%
- --------------------------------------------------------------------------------
29,800 Allscripts Healthcare
Solutions Inc.(1) 702,982
- --------------------------------------------------------------------------------
HOTELS, RESTAURANTS & LEISURE - 5.7%
- --------------------------------------------------------------------------------
17,775 Life Time Fitness Inc.(1) 915,946
- --------------------------------------------------------------------------------
37,900 Morton's Restaurant Group Inc.(1) 613,601
- --------------------------------------------------------------------------------
18,438 Orient-Express Hotels Ltd. Cl A 727,379
- --------------------------------------------------------------------------------
21,300 Pinnacle Entertainment Inc.(1) 644,538
- --------------------------------------------------------------------------------
2,901,464
- --------------------------------------------------------------------------------
INTERNET & CATALOG RETAIL - 3.6%
- --------------------------------------------------------------------------------
11,200 Blue Nile Inc.(1) 427,952
- --------------------------------------------------------------------------------
24,200 Coldwater Creek Inc.(1) 737,858
- --------------------------------------------------------------------------------
20,300 VistaPrint Ltd.(1) 634,984
- --------------------------------------------------------------------------------
1,800,794
- --------------------------------------------------------------------------------
INTERNET SOFTWARE & SERVICES - 2.0%
- --------------------------------------------------------------------------------
14,950 Bankrate Inc.(1) 477,653
- --------------------------------------------------------------------------------
20,200 DealerTrack Holdings Inc.(1) 514,898
- --------------------------------------------------------------------------------
992,551
- --------------------------------------------------------------------------------
IT SERVICES - 3.2%
- --------------------------------------------------------------------------------
13,375 Euronet Worldwide Inc.(1) 397,505
- --------------------------------------------------------------------------------
19,700 Forrester Research Inc.(1) 619,171
- --------------------------------------------------------------------------------
See Notes to Financial Statements. (continued)
- ------
14
Small Cap Growth - Schedule of Investments
OCTOBER 31, 2006
Shares Value
- --------------------------------------------------------------------------------
23,300 Heartland Payment
Systems Inc. $ 622,576
- --------------------------------------------------------------------------------
1,639,252
- --------------------------------------------------------------------------------
LIFE SCIENCES TOOLS & SERVICES - 1.8%
- --------------------------------------------------------------------------------
19,400 ICON plc ADR(1) 696,072
- --------------------------------------------------------------------------------
5,618 Ventana Medical Systems Inc.(1) 226,911
- --------------------------------------------------------------------------------
922,983
- --------------------------------------------------------------------------------
MACHINERY - 1.6%
- --------------------------------------------------------------------------------
19,855 Bucyrus International, Inc. Cl A 831,925
- --------------------------------------------------------------------------------
OIL, GAS & CONSUMABLE FUELS - 0.9%
- --------------------------------------------------------------------------------
10,900 World Fuel Services Corp. 468,918
- --------------------------------------------------------------------------------
PHARMACEUTICALS - 2.2%
- --------------------------------------------------------------------------------
15,859 Adams Respiratory
Therapeutics Inc.(1) 683,523
- --------------------------------------------------------------------------------
18,600 Noven Pharmaceuticals Inc.(1) 413,106
- --------------------------------------------------------------------------------
1,096,629
- --------------------------------------------------------------------------------
ROAD & RAIL - 1.3%
- --------------------------------------------------------------------------------
20,065 Knight Transportation Inc. 365,585
- --------------------------------------------------------------------------------
17,421 Marten Transport Ltd.(1) 296,331
- --------------------------------------------------------------------------------
661,916
- --------------------------------------------------------------------------------
SEMICONDUCTORS &
SEMICONDUCTOR EQUIPMENT - 6.2%
- --------------------------------------------------------------------------------
9,300 Cymer, Inc.(1) 430,869
- --------------------------------------------------------------------------------
40,890 Entegris, Inc.(1) 458,377
- --------------------------------------------------------------------------------
21,700 MKS Instruments, Inc.(1) 469,804
- --------------------------------------------------------------------------------
18,700 Netlogic Microsystems Inc.(1) 370,821
- --------------------------------------------------------------------------------
45,700 RF Micro Devices, Inc.(1) 333,610
- --------------------------------------------------------------------------------
22,400 Silicon Image, Inc.(1) 264,992
- --------------------------------------------------------------------------------
23,050 Tessera Technologies Inc.(1) 804,675
- --------------------------------------------------------------------------------
3,133,148
- --------------------------------------------------------------------------------
SOFTWARE - 4.0%
- --------------------------------------------------------------------------------
34,050 Blackboard Inc.(1) 943,526
- --------------------------------------------------------------------------------
18,300 Sonic Solutions(1) 295,362
- --------------------------------------------------------------------------------
Shares/Principal Amount Value
- --------------------------------------------------------------------------------
26,204 THQ Inc.(1) $ 787,954
- --------------------------------------------------------------------------------
2,026,842
- --------------------------------------------------------------------------------
SPECIALTY RETAIL - 3.2%
- --------------------------------------------------------------------------------
40,750 Golf Galaxy Inc.(1) 632,440
- --------------------------------------------------------------------------------
32,600 Hibbett Sporting Goods Inc.(1) 953,224
- --------------------------------------------------------------------------------
1,585,664
- --------------------------------------------------------------------------------
TRADING COMPANIES & DISTRIBUTORS - 2.1%
- --------------------------------------------------------------------------------
31,575 Beacon Roofing Supply, Inc.(1) 625,185
- --------------------------------------------------------------------------------
18,400 Williams Scotsman
International, Inc.(1) 432,952
- --------------------------------------------------------------------------------
1,058,137
- --------------------------------------------------------------------------------
TOTAL COMMON STOCKS
(Cost $37,360,379) 45,306,156
- --------------------------------------------------------------------------------
COMMERCIAL PAPER(2) -- 8.9%
$3,000,000 Thunder Bay Funding LLC, 5.26%,
11/20/06 (Acquired 10/18/06,
Cost $2,985,535)(3)(4) 2,991,595
- --------------------------------------------------------------------------------
1,500,000 UBS Finance LLC,
5.28%, 11/1/06 1,500,000
- --------------------------------------------------------------------------------
TOTAL COMMERCIAL PAPER
(Cost $4,491,672) 4,491,595
- --------------------------------------------------------------------------------
TEMPORARY CASH INVESTMENTS -- 0.4%
- --------------------------------------------------------------------------------
200,000 FHLMC Discount Notes,
5.14%, 12/27/06(2)
(Cost $198,402) 198,424
- --------------------------------------------------------------------------------
TOTAL INVESTMENT SECURITIES -- 98.9%
(Cost $42,050,453) 49,996,175
- --------------------------------------------------------------------------------
OTHER ASSETS AND LIABILITIES -- 1.1% 580,345
- --------------------------------------------------------------------------------
TOTAL NET ASSETS -- 100.0% $50,576,520
================================================================================
FUTURES CONTRACTS
Underlying Face Unrealized
Contracts Purchased Expiration Date Amount at Value Gain (Loss)
- -----------------------------------------------------------------------------
5 Russell 2000 Index Futures December 2006 $1,925,625 $55,809
=============================
NOTES TO SCHEDULE OF INVESTMENTS
ADR = American Depositary Receipt
FHLMC = Federal Home Loan Mortgage Corporation
(1) Non-income producing.
(2) The rate indicated is the yield to maturity at purchase.
(3) Security, or a portion thereof, has been segregated for futures contracts.
(4) Security was purchased under Rule 144A or Section 4(2) of the Securities
Act of 1933 or is a private placement and, unless registered under the Act
or exempted from registration, may only be sold to qualified institutional
investors. The aggregate value of restricted securities at October 31, 2006
was $2,991,595, which represented 5.9% of total net assets.
See Notes to Financial Statements.
- ------
15
Shareholder Fee Examples
(Unaudited)
Fund shareholders may incur two types of costs: (1) transaction costs, including
sales charges (loads) on purchase payments and redemption/exchange fees; and (2)
ongoing costs, including management fees; distribution and service (12b-1) fees;
and other fund expenses. This example is intended to help you understand your
ongoing costs (in dollars) of investing in your fund and to compare these costs
with the ongoing cost of investing in other mutual funds.
The example is based on an investment of $1,000 made at the beginning of the
period and held for the entire period from May 1, 2006 to October 31, 2006.
ACTUAL EXPENSES
The table provides information about actual account values and actual expenses
for each class. You may use the information, together with the amount you
invested, to estimate the expenses that you paid over the period. First,
identify the share class you own. Then simply divide your account value by
$1,000 (for example, an $8,600 account value divided by $1,000 = 8.6), then
multiply the result by the number under the heading "Expenses Paid During
Period" to estimate the expenses you paid on your account during this period.
If you hold Investor Class shares of any American Century fund, or Institutional
Class shares of the American Century Diversified Bond Fund, in an American
Century account (i.e., not a financial intermediary or retirement plan account),
American Century may charge you a $12.50 semiannual account maintenance fee if
the value of those shares is less than $10,000. We will redeem shares
automatically in one of your accounts to pay the $12.50 fee. In determining your
total eligible investment amount, we will include your investments in all
PERSONAL ACCOUNTS (including American Century Brokerage accounts) registered
under your Social Security number. PERSONAL ACCOUNTS include individual
accounts, joint accounts, UGMA/UTMA accounts, personal trusts, Coverdell
Education Savings Accounts and IRAs (including traditional, Roth, Rollover,
SEP-, SARSEP- and SIMPLE-IRAs), and certain other retirement accounts. If you
have only business, business retirement, employer-sponsored or American Century
Brokerage accounts, you are currently not subject to this fee. We will not
charge the fee as long as you choose to manage your accounts exclusively online.
If you are subject to the Account Maintenance Fee, your account value could be
reduced by the fee amount.
HYPOTHETICAL EXAMPLE FOR COMPARISON PURPOSES
The table also provides information about hypothetical account values and
hypothetical expenses based on the actual expense ratio of each class of your
fund and an assumed rate of return of 5% per year before expenses, which is not
the actual return of a fund's share class. The hypothetical account values and
expenses may not be used to estimate the actual ending account balance or
expenses you paid for the period. You may use this information to compare the
ongoing costs of investing in your fund and other funds. To do so, compare this
5% hypothetical example with the 5% hypothetical examples that appear in the
shareholder reports of the other funds.
(continued)
- ------
16
Shareholder Fee Examples (Unaudited)
Please note that the expenses shown in the table are meant to highlight your
ongoing costs only and do not reflect any transactional costs, such as sales
charges (loads) or redemption/exchange fees. Therefore, the table is useful in
comparing ongoing costs only, and will not help you determine the relative total
costs of owning different funds. In addition, if these transactional costs were
included, your costs would have been higher.
- --------------------------------------------------------------------------------
EXPENSES PAID
BEGINNING ENDING DURING PERIOD(1) ANNUALIZED
ACCOUNT VALUE ACCOUNT VALUE 5/1/06 - EXPENSE
5/1/06 10/31/06 10/31/06 RATIO(1)
- --------------------------------------------------------------------------------
MID CAP GROWTH
SHAREHOLDER FEE EXAMPLE
- --------------------------------------------------------------------------------
ACTUAL
- --------------------------------------------------------------------------------
Investor Class $1,000 $927.20 $5.10 1.05%
- --------------------------------------------------------------------------------
Institutional
Class $1,000 $928.60 $4.13 0.85%
- --------------------------------------------------------------------------------
A Class $1,000 $925.90 $6.31 1.30%
- --------------------------------------------------------------------------------
B Class
(after waiver)(2) $1,000 $923.40 $9.45 1.95%
- --------------------------------------------------------------------------------
B Class
(before waiver) $1,000 $923.40(3) $9.94 2.05%
- --------------------------------------------------------------------------------
C Class $1,000 $922.50 $9.93 2.05%
- --------------------------------------------------------------------------------
R Class $1,000 $924.50 $7.52 1.55%
- --------------------------------------------------------------------------------
HYPOTHETICAL
- --------------------------------------------------------------------------------
Investor Class $1,000 $1,019.91 $5.35 1.05%
- --------------------------------------------------------------------------------
Institutional
Class $1,000 $1,020.92 $4.33 0.85%
- --------------------------------------------------------------------------------
A Class $1,000 $1,018.65 $6.61 1.30%
- --------------------------------------------------------------------------------
B Class
(after waiver)(2) $1,000 $1,015.38 $9.91 1.95%
- --------------------------------------------------------------------------------
B Class
(before waiver) $1,000 $1,014.87 $10.41 2.05%
- --------------------------------------------------------------------------------
C Class $1,000 $1,014.87 $10.41 2.05%
- --------------------------------------------------------------------------------
R Class $1,000 $1,017.39 $7.88 1.55%
- --------------------------------------------------------------------------------
(1) Expenses are equal to the class's annualized expense ratio listed in the
table above, multiplied by the average account value over the period,
multiplied by 184, the number of days in the most recent fiscal half-year,
divided by 365, to reflect the one-half year period.
(2) During the six months ended October 31, 2006, the class received a partial
waiver of its distribution and service fees.
(3) Ending account value assumes the return earned after waiver. The return
would have been lower had fees not been waived and may have resulted in a
lower ending account value.
(continued)
- ------
17
Shareholder Fee Examples (Unaudited)
- --------------------------------------------------------------------------------
EXPENSES PAID
BEGINNING ENDING DURING PERIOD(1) ANNUALIZED
ACCOUNT VALUE ACCOUNT VALUE 5/1/06 - EXPENSE
5/1/06 10/31/06 10/31/06 RATIO(1)
- --------------------------------------------------------------------------------
SMALL CAP GROWTH
SHAREHOLDER FEE EXAMPLE
- --------------------------------------------------------------------------------
ACTUAL
- --------------------------------------------------------------------------------
Investor Class $1,000 $929.80 $6.32 1.30%
- --------------------------------------------------------------------------------
Institutional
Class $1,000 $930.40 $5.35 1.10%
- --------------------------------------------------------------------------------
A Class
(after waiver)(2) $1,000 $929.20 $6.81 1.40%
- --------------------------------------------------------------------------------
A Class
(before waiver) $1,000 $929.20(3) $7.54 1.55%
- --------------------------------------------------------------------------------
B Class
(after waiver)(2) $1,000 $925.70 $9.95 2.05%
- --------------------------------------------------------------------------------
B Class
(before waiver) $1,000 $925.70(3) $11.16 2.30%
- --------------------------------------------------------------------------------
C Class $1,000 $925.10 $11.16 2.30%
- --------------------------------------------------------------------------------
R Class $1,000 $926.90 $8.74 1.80%
- --------------------------------------------------------------------------------
HYPOTHETICAL
- --------------------------------------------------------------------------------
Investor Class $1,000 $1,018.65 $6.61 1.30%
- --------------------------------------------------------------------------------
Institutional
Class $1,000 $1,019.66 $5.60 1.10%
- --------------------------------------------------------------------------------
A Class
(after waiver)(2) $1,000 $1,018.15 $7.12 1.40%
- --------------------------------------------------------------------------------
A Class
(before waiver) $1,000 $1,017.39 $7.88 1.55%
- --------------------------------------------------------------------------------
B Class
(after waiver)(2) $1,000 $1,014.87 $10.41 2.05%
- --------------------------------------------------------------------------------
B Class
(before waiver) $1,000 $1,013.61 $11.67 2.30%
- --------------------------------------------------------------------------------
C Class $1,000 $1,013.61 $11.67 2.30%
- --------------------------------------------------------------------------------
R Class $1,000 $1,016.13 $9.15 1.80%
- --------------------------------------------------------------------------------
(1) Expenses are equal to the class's annualized expense ratio listed in the
table above, multiplied by the average account value over the period,
multiplied by 184, the number of days in the most recent fiscal half-year,
divided by 365, to reflect the one-half year period.
(2) During the six months ended October 31, 2006, the class received a partial
waiver of its distribution and service fees.
(3) Ending account value assumes the return earned after waiver. The return
would have been lower had fees not been waived and may have resulted in a
lower ending account value.
- ------
18
Statement of Assets and Liabilities
OCTOBER 31, 2006
- --------------------------------------------------------------------------------
MID CAP SMALL CAP
GROWTH GROWTH
- --------------------------------------------------------------------------------
ASSETS
- --------------------------------------------------------------------------------
Investment securities, at value
(cost of $158,768,874 and
$42,050,453, respectively) $182,018,424 $49,996,175
- --------------------------------------
Cash 48,784 121,882
- --------------------------------------
Receivable for investments sold 2,816,228 644,283
- --------------------------------------
Receivable for capital shares sold 8,818 14,495
- --------------------------------------
Interest and dividend receivable 22,767 1,454
- --------------------------------------------------------------------------------
184,915,021 50,778,289
- --------------------------------------------------------------------------------
LIABILITIES
- --------------------------------------------------------------------------------
Payable for investments purchased 1,978,754 34,748
- --------------------------------------
Payable for capital shares redeemed 46,869 95,107
- --------------------------------------
Payable for variation
margin on futures contracts 15,548 8,375
- --------------------------------------
Accrued management fees 139,259 55,441
- --------------------------------------
Distribution fees payable 4,337 4,458
- --------------------------------------
Service fees (and distribution
fees - A Class and R Class) payable 8,752 3,640
- --------------------------------------------------------------------------------
2,193,519 201,769
- --------------------------------------------------------------------------------
NET ASSETS $182,721,502 $50,576,520
================================================================================
See Notes to Financial Statements.
(continued)
- ------
19
Statement of Assets and Liabilities
OCTOBER 31, 2006
- --------------------------------------------------------------------------------
MID CAP SMALL CAP
GROWTH GROWTH
- --------------------------------------------------------------------------------
NET ASSETS CONSIST OF:
- --------------------------------------------------------------------------------
Capital paid in $150,914,118 $41,023,980
- -------------------------------------------
Undistributed net realized gain
on investment transactions 8,482,901 1,551,009
- -------------------------------------------
Net unrealized appreciation on investments 23,324,483 8,001,531
- --------------------------------------------------------------------------------
$182,721,502 $50,576,520
================================================================================
INVESTOR CLASS, $0.01 PAR VALUE
- --------------------------------------------------------------------------------
Net assets $311,440 $587,179
- -------------------------------------------
Shares outstanding 22,633 36,626
- -------------------------------------------
Net asset value per share $13.76 $16.03
- --------------------------------------------------------------------------------
INSTITUTIONAL CLASS, $0.01 PAR VALUE
- --------------------------------------------------------------------------------
Net assets $138,985,975 $1,166,384
- -------------------------------------------
Shares outstanding 10,089,307 72,668
- -------------------------------------------
Net asset value per share $13.78 $16.05
- --------------------------------------------------------------------------------
A CLASS, $0.01 PAR VALUE
- --------------------------------------------------------------------------------
Net assets $36,674,503 $41,797,973
- -------------------------------------------
Shares outstanding 2,669,403 2,609,038
- -------------------------------------------
Net asset value per share $13.74 $16.02
- -------------------------------------------
Maximum offering price
(net asset value divided by 0.9425) $14.58 $17.00
- --------------------------------------------------------------------------------
B CLASS, $0.01 PAR VALUE
- --------------------------------------------------------------------------------
Net assets $6,626,207 $6,883,630
- -------------------------------------------
Shares outstanding 514,156 449,187
- -------------------------------------------
Net asset value per share $12.89 $15.32
- --------------------------------------------------------------------------------
C CLASS, $0.01 PAR VALUE
- --------------------------------------------------------------------------------
Net assets $100,171 $117,653
- -------------------------------------------
Shares outstanding 7,323 7,382
- -------------------------------------------
Net asset value per share $13.68 $15.94
- --------------------------------------------------------------------------------
R CLASS, $0.01 PAR VALUE
- --------------------------------------------------------------------------------
Net assets $23,206 $23,701
- -------------------------------------------
Shares outstanding 1,691 1,483
- -------------------------------------------
Net asset value per share $13.72 $15.98
- --------------------------------------------------------------------------------
See Notes to Financial Statements.
- ------
20
Statement of Operations
FOR THE SEVEN MONTHS ENDED OCTOBER 31, 2006 AND YEAR ENDED MARCH 31, 2006
- --------------------------------------------------------------------------------------------
MID CAP GROWTH SMALL CAP GROWTH
- --------------------------------------------------------------------------------------------
OCT. 31, MARCH 31, OCT. 31, MARCH 31,
2006(1) 2006 2006(1) 2006
- --------------------------------------------------------------------------------------------
INVESTMENT INCOME (LOSS)
- --------------------------------------------------------------------------------------------
INCOME:
- ------------------------------
Dividends $ 501,867 $ 1,846,186 $ 75,342 $ 149,013
- ------------------------------
Interest 435,041 378,804 82,502 164,040
- --------------------------------------------------------------------------------------------
936,908 2,224,990 157,844 313,053
- --------------------------------------------------------------------------------------------
EXPENSES:
- ------------------------------
Management fees 984,825 1,382,888 409,517 460,953
- ------------------------------
Distribution fees:
- ------------------------------
A Class -- 41,392 -- 45,290
- ------------------------------
B Class 33,256 69,276 32,298 56,761
- ------------------------------
C Class 157 6,393 315 9,886
- ------------------------------
Service fees:
- ------------------------------
B Class 11,086 -- 10,766 --
- ------------------------------
C Class 52 -- 105 --
- ------------------------------
Distribution and service fees:
- ------------------------------
A Class 61,395 -- 67,592 --
- ------------------------------
R Class 68 -- 68 --
- ------------------------------
Shareholder servicing fees
(A Class, B Class and C Class) -- 461,530 -- 136,465
- ------------------------------
Transfer agent fees -- 194,216 -- 167,210
- ------------------------------
Administrative fees -- 184,385 -- 54,230
- ------------------------------
Directors' fees and expenses 1,873 6,682 879 6,682
- ------------------------------
Other expenses -- 107,902 -- 128,498
- --------------------------------------------------------------------------------------------
1,092,712 2,454,664 521,540 1,065,975
- ------------------------------
Amount waived (4,434) (8,480) (51,321) (250,993)
- --------------------------------------------------------------------------------------------
1,088,278 2,446,184 470,219 814,982
- --------------------------------------------------------------------------------------------
NET INVESTMENT
INCOME (LOSS) (151,370) (221,194) (312,375) (501,929)
- --------------------------------------------------------------------------------------------
REALIZED AND
UNREALIZED GAIN (LOSS)
- --------------------------------------------------------------------------------------------
NET REALIZED GAIN (LOSS) ON:
- ------------------------------
Investment transactions (892,334) 21,927,598 (1,186,967) 6,054,394
- ------------------------------
Futures transactions (174,556) 289,550 (53,072) (41,807)
- --------------------------------------------------------------------------------------------
(1,066,890) 22,217,148 (1,240,039) 6,012,587
- --------------------------------------------------------------------------------------------
CHANGE IN NET
UNREALIZED APPRECIATION
(DEPRECIATION) ON:
- ------------------------------
Investments (13,145,019) 12,674,368 (2,205,785) 5,599,924
- ------------------------------
Futures (101,710) 196,654 55,809 --
- --------------------------------------------------------------------------------------------
(13,246,729) 12,871,022 (2,149,976) 5,599,924
- --------------------------------------------------------------------------------------------
NET REALIZED AND
UNREALIZED GAIN (LOSS) (14,313,619) 35,088,170 (3,390,015) 11,612,511
- --------------------------------------------------------------------------------------------
NET INCREASE (DECREASE)
IN NET ASSETS
RESULTING FROM OPERATIONS $(14,464,989) $34,866,976 $(3,702,390) $11,110,582
============================================================================================
(1) The funds' fiscal year end was changed from March 31 to October 31,
resulting in a seven-month annual reporting period (see Note 7).
See Notes to Financial Statements.
- ------
21
Statement of Changes in Net Assets
SEVEN MONTHS ENDED OCTOBER 31, 2006 AND YEARS ENDED
MARCH 31, 2006 AND MARCH 31, 2005, RESPECTIVELY
- -------------------------------------------------------------------------------------------
MID CAP GROWTH
- -------------------------------------------------------------------------------------------
INCREASE (DECREASE) IN NET ASSETS OCT. 31, 2006(1) MARCH 31, 2006 MARCH 31, 2005
- -------------------------------------------------------------------------------------------
OPERATIONS
- -------------------------------------------------------------------------------------------
Net investment income (loss) $ (151,370) $ (221,194) $ (1,396,429)
- ------------------------------------
Net realized gain (loss) (1,066,890) 22,217,148 13,428,989
- ------------------------------------
Change in net unrealized
appreciation (depreciation) (13,246,729) 12,871,022 (2,865,722)
- -------------------------------------------------------------------------------------------
Net increase (decrease)
in net assets resulting
from operations (14,464,989) 34,866,976 9,166,838
- -------------------------------------------------------------------------------------------
DISTRIBUTIONS TO SHAREHOLDERS
- -------------------------------------------------------------------------------------------
From net realized gains:
- ------------------------------------
A Class -- (15,783,919) --
- ------------------------------------
B Class -- (836,858) --
- ------------------------------------
C Class -- (88,602) --
- -------------------------------------------------------------------------------------------
Decrease in net
assets from distributions -- (16,709,379) --
- -------------------------------------------------------------------------------------------
CAPITAL SHARE TRANSACTIONS
- -------------------------------------------------------------------------------------------
Net increase (decrease)
in net assets from
capital share transactions (5,875,318) 11,335,375 4,266,819
- -------------------------------------------------------------------------------------------
NET INCREASE (DECREASE)
IN NET ASSETS (20,340,307) 29,492,972 13,433,657
- -------------------------------------------------------------------------------------------
NET ASSETS
- -------------------------------------------------------------------------------------------
Beginning of period 203,061,809 173,568,837 160,135,180
- -------------------------------------------------------------------------------------------
End of period $182,721,502 $203,061,809 $173,568,837
===========================================================================================
(1) The fund's fiscal year end was changed from March 31 to October 31,
resulting in a seven-month annual reporting period (see Note 7).
See Notes to Financial Statements.
(continued)
- ------
22
Statement of Changes in Net Assets
SEVEN MONTHS ENDED OCTOBER 31, 2006 AND YEARS ENDED
MARCH 31, 2006 AND MARCH 31, 2005, RESPECTIVELY
- -------------------------------------------------------------------------------------------
SMALL CAP GROWTH
- -------------------------------------------------------------------------------------------
INCREASE (DECREASE) IN NET ASSETS OCT. 31, 2006(1) MARCH 31, 2006 MARCH 31, 2005
- -------------------------------------------------------------------------------------------
OPERATIONS
- -------------------------------------------------------------------------------------------
Net investment income (loss) $ (312,375) $ (501,929) $ (420,997)
- ------------------------------------
Net realized gain (loss) (1,240,039) 6,012,587 3,721,650
- ------------------------------------
Change in net unrealized
appreciation (depreciation) (2,149,976) 5,599,924 594,057
- -------------------------------------------------------------------------------------------
Net increase (decrease)
in net assets resulting
from operations (3,702,390) 11,110,582 3,894,710
- -------------------------------------------------------------------------------------------
DISTRIBUTIONS TO SHAREHOLDERS
- -------------------------------------------------------------------------------------------
From net realized gains:
- ------------------------------------
A Class -- (4,765,611) (1,329,074)
- ------------------------------------
B Class -- (758,743) (320,858)
- ------------------------------------
C Class -- (150,496) (34,300)
- -------------------------------------------------------------------------------------------
Decrease in net assets
from distributions -- (5,674,850) (1,684,232)
- -------------------------------------------------------------------------------------------
CAPITAL SHARE TRANSACTIONS
- -------------------------------------------------------------------------------------------
Net increase (decrease)
in net assets from
capital share transactions (10,809,168) 17,960,189 8,175,057
- -------------------------------------------------------------------------------------------
NET INCREASE (DECREASE)
IN NET ASSETS (14,511,558) 23,395,921 10,385,535
- -------------------------------------------------------------------------------------------
NET ASSETS
- -------------------------------------------------------------------------------------------
Beginning of period 65,088,078 41,692,157 31,306,622
- -------------------------------------------------------------------------------------------
End of period $50,576,520 $65,088,078 $41,692,157
===========================================================================================
(1) The fund's fiscal year end was changed from March 31 to October 31,
resulting in a seven-month annual reporting period (see Note 7).
See Notes to Financial Statements.
- ------
23
Notes to Financial Statements
OCTOBER 31, 2006
1. ORGANIZATION AND SUMMARY OF SIGNIFICANT ACCOUNTING POLICIES
ORGANIZATION -- American Century Mutual Funds, Inc. (the corporation) is
registered under the Investment Company Act of 1940 (the 1940 Act) as an
open-end management investment company. American Century-Mason Street Mid Cap
Growth Fund (Mid Cap Growth) and American Century-Mason Street Small Cap Growth
Fund (Small Cap Growth) (the funds) are two funds in a series issued by the
corporation (see Note 7). The funds are diversified under the 1940 Act. The
funds' investment objective is to seek long-term capital growth. Mid Cap Growth
invests primarily in stocks of mid-sized companies. Small Cap Growth invests
primarily in stocks of smaller market capitalization companies. The following is
a summary of the funds' significant accounting policies.
MULTIPLE CLASS -- The funds are authorized to issue the Investor Class, the
Institutional Class, the A Class, the B Class, the C Class and the R Class. The
A Class may incur an initial sales charge. The A Class, B Class and C Class may
be subject to a contingent deferred sales charge. The share classes differ
principally in their respective sales charges and distribution and shareholder
servicing expenses and arrangements. All shares of each fund represent an equal
pro rata interest in the net assets of the class to which such shares belong,
and have identical voting, dividend, liquidation and other rights and the same
terms and conditions, except for class specific expenses and exclusive rights to
vote on matters affecting only individual classes. Income, non-class specific
expenses, and realized and unrealized capital gains and losses of the funds are
allocated to each class of shares based on their relative net assets. Sale of
the funds' Investor Class, Institutional Class, C Class and R Class commenced on
April 3, 2006.
SECURITY VALUATIONS -- Securities traded primarily on a principal securities
exchange are valued at the last reported sales price, or at the mean of the
latest bid and asked prices where no last sales price is available. Depending on
local convention or regulation, securities traded over-the-counter are valued at
the mean of the latest bid and asked prices, the last sales price, or the
official close price. Debt securities not traded on a principal securities
exchange are valued through a commercial pricing service or at the mean of the
most recent bid and asked prices. Debt securities maturing within 60 days may be
valued at cost, plus or minus any amortization discount or premium. Discount
notes may be valued through a commercial pricing service or at amortized cost,
which approximates fair value. Securities traded on foreign securities exchanges
and over-the-counter markets are normally completed before the close of business
on days that the New York Stock Exchange (the Exchange) is open and may also
take place on days when the Exchange is not open. If an event occurs after the
value of a security was established but before the net asset value per share was
determined that was likely to materially change the net asset value, that
security would be valued at fair value as determined in accordance with
procedures adopted by the Board of Directors. If the funds determine that the
market price of a portfolio security is not readily available, or that the
valuation methods mentioned above do not reflect the security's fair value, such
security is valued at its fair value as determined by, or in accordance with
procedures adopted by, the Board of Directors or its designee if such fair value
determination would materially impact a fund's net asset value. Certain other
circumstances may cause the funds to fair value a security such as: a security
has been declared in default; trading in a security has been halted during the
trading day; or there is a foreign market holiday and no trading will commence.
SECURITY TRANSACTIONS -- Security transactions are accounted for as of the trade
date. Net realized gains and losses are determined on the identified cost basis,
which is also used for federal income tax purposes.
INVESTMENT INCOME -- Dividend income less foreign taxes withheld, if any, is
recorded as of the ex-dividend date. Interest income is recorded on the accrual
basis and includes accretion of discounts and amortization of premiums.
FUTURES CONTRACTS -- The funds may enter into futures contracts in order to
manage the funds' exposure to changes in market conditions. One of the risks of
entering into futures contracts is the possibility that the change in value of
the contract may not correlate with the changes in value of the underlying
securities. Upon entering into a futures contract, the funds are required to
deposit either cash or securities in an amount equal to a certain percentage of
the contract value (initial margin). Subsequent payments (variation margin) are
made or received daily, in cash, by the funds. The variation margin is equal to
the daily change in the contract value and is recorded as unrealized gains and
losses. The funds recognize a realized gain or loss when the contract is closed
or expires. Net realized and unrealized gains or losses occurring during the
holding period of futures contracts are a component of realized gain (loss) on
futures transactions and unrealized appreciation (depreciation) on futures,
respectively.
REPURCHASE AGREEMENTS -- The fund may enter into repurchase agreements with
institutions that American Century Investment Management, Inc.
(continued)
- ------
24
Notes to Financial Statements
OCTOBER 31, 2006
1. ORGANIZATION AND SUMMARY OF SIGNIFICANT ACCOUNTING POLICIES (CONTINUED)
(ACIM) (the investment advisor) has determined are creditworthy pursuant to
criteria adopted by the Board of Directors. Each repurchase agreement is
recorded at cost. The fund requires that the collateral, represented by
securities, received in a repurchase transaction be transferred to the custodian
in a manner sufficient to enable the fund to obtain those securities in the
event of a default under the repurchase agreement. ACIM monitors, on a daily
basis, the securities transferred to ensure the value, including accrued
interest, of the securities under each repurchase agreement is equal to or
greater than amounts owed to the fund under each repurchase agreement.
JOINT TRADING ACCOUNT -- Pursuant to an Exemptive Order issued by the Securities
and Exchange Commission, the fund, along with other registered investment
companies having management agreements with ACIM or American Century Global
Investment Management, Inc. (ACGIM), may transfer uninvested cash balances into
a joint trading account. These balances are invested in one or more repurchase
agreements that are collateralized by U.S. Treasury or Agency obligations.
INCOME TAX STATUS -- It is each fund's policy to distribute substantially all
net investment income and net realized gains to shareholders and to otherwise
qualify as a regulated investment company under provisions of the Internal
Revenue Code. Accordingly, no provision has been made for federal or state
income taxes.
DISTRIBUTIONS TO SHAREHOLDERS -- Distributions to shareholders are recorded on
the ex-dividend date. Distributions from net investment income and net realized
gains, if any, are generally declared and paid annually.
INDEMNIFICATIONS -- Under the corporation's organizational documents, its
officers and directors are indemnified against certain liabilities arising out
of the performance of their duties to the funds. In addition, in the normal
course of business, the funds enter into contracts that provide general
indemnifications. The funds' maximum exposure under these arrangements is
unknown as this would involve future claims that may be made against the funds.
The risk of material loss from such claims is considered by management to be
remote.
USE OF ESTIMATES -- The financial statements are prepared in conformity with
accounting principles generally accepted in the United States of America, which
may require management to make certain estimates and assumptions at the date of
the financial statements. Actual results could differ from these estimates.
2. FEES AND TRANSACTIONS WITH RELATED PARTIES
MANAGEMENT FEES -- The corporation has entered into a Management Agreement with
ACIM, under which ACIM provides the funds with investment advisory and
management services in exchange for a single, unified management fee (the fee)
per class. The Agreement provides that all expenses of the funds, except
brokerage commissions, taxes, interest, fees and expenses of those directors who
are not considered "interested persons" as defined in the 1940 Act (including
counsel fees) and extraordinary expenses, will be paid by ACIM. The fee is
computed and accrued daily based on the daily net assets of each specific class
of shares of each fund and paid monthly in arrears. For funds with a stepped fee
schedule, the rate of the fee is determined by applying a fee rate calculation
formula. This formula takes into account all of the investment advisor's assets
under management in each fund's investment strategy (strategy assets) to
calculate the appropriate fee rate for each fund. The strategy assets include
each fund's assets and the assets of other clients of the investment advisor
that are not in the American Century family of funds, but that have the same
investment team and investment strategy.
The annual management fee schedule for each class of Mid Cap Growth is as
follows:
- --------------------------------------------------------------------
INVESTOR,
A, B, C & R INSTITUTIONAL
- --------------------------------------------------------------------
STRATEGY ASSETS
- --------------------------------------------------------------------
First $500 million 1.05% 0.85%
- --------------------------------------------------------------------
Over $500 million 1.00% 0.80%
- --------------------------------------------------------------------
(continued)
- ------
25
Notes to Financial Statements
OCTOBER 31, 2006
2. FEES AND TRANSACTIONS WITH RELATED PARTIES (CONTINUED)
The annual management fee schedule for each
class of Small Cap Growth is as follows:
- ------------------------------------------------------------------------
INVESTOR,
A, B, C & R INSTITUTIONAL
- ------------------------------------------------------------------------
STRATEGY ASSETS
- ------------------------------------------------------------------------
First $1 billion 1.30% 1.10%
- ------------------------------------------------------------------------
Over $1 billion 1.10% 0.90%
- ------------------------------------------------------------------------
For the seven months ended October 31, 2006, the effective
annual management fee for each class of each fund was as follows:
- ------------------------------------------------------------------------
INVESTOR,
A, B, C & R INSTITUTIONAL
- ------------------------------------------------------------------------
Mid Cap Growth 1.05% 0.85%
- ------------------------------------------------------------------------
Small Cap Growth 1.30% 1.10%
- ------------------------------------------------------------------------
ACIM has entered into a Subadvisory Agreement with Mason Street Advisors LLC
(Mason Street) on behalf of the funds. The subadvisor makes investment decisions
for the funds in accordance with the funds' investment objectives, policies, and
restrictions under the supervision of ACIM and the Board of Directors. ACIM pays
all costs associated with retaining Mason Street as the subadvisor of the funds.
DISTRIBUTION AND SERVICE FEES -- The Board of Directors has adopted a separate
Master Distribution and Individual Shareholder Services Plan for each of the A
Class, B Class, C Class and R Class (collectively the plans), pursuant to Rule
12b-1 of the 1940 Act. The plans provide that the B Class and C Class will pay
American Century Investment Services, Inc. (ACIS) an annual distribution fee and
service fee of 0.75% and 0.25%, respectively. The plans provide that the A Class
and the R Class will pay ACIS an annual distribution and service fee of 0.25%
for the A Class and 0.50% for the R Class. The fees are computed and accrued
daily based on each class's daily net assets and paid monthly in arrears. The
distribution fee provides compensation for expenses incurred in connection with
distributing shares of the classes including, but not limited to, payments to
brokers, dealers, and financial institutions that have entered into sales
agreements with respect to shares of the funds. The service fee provides
compensation for individual shareholder services rendered by broker/dealers or
other independent financial intermediaries for A Class, B Class, C Class and R
Class shares. ACIM has agreed to voluntarily waive a portion of its distribution
and service fees through March 31, 2008, by 0.10% for the B Class of Mid Cap
Growth and by 0.15% and 0.25% for the A Class and B Class of Small Cap Growth,
respectively. The total amount of the waivers for the seven months ended October
31, 2006, was as follows:
- -------------------------------------------------------------------------------
A B
- -------------------------------------------------------------------------------
Mid Cap Growth -- $4,434
- -------------------------------------------------------------------------------
Small Cap Growth $40,555 $10,766
- -------------------------------------------------------------------------------
Fees incurred under the plans during the seven months ended October 31, 2006,
are detailed in the Statement of Operations.
RELATED PARTIES -- Certain officers and directors of the corporation are also
officers and/or directors, and, as a group, controlling stockholders of American
Century Companies, Inc. (ACC), the parent of the corporation's investment
advisor, ACIM, the distributor of the corporation, ACIS, and the corporation's
transfer agent, American Century Services, LLC.
JPMorgan Chase Bank is a custodian of the funds and a wholly owned subsidiary of
JPMorgan Chase & Co. (JPM). JPM is an equity investor in ACC.
(continued)
- ------
26
Notes to Financial Statements
OCTOBER 31, 2006
3. INVESTMENT TRANSACTIONS
Investment transactions, excluding short-term investments, for the seven months
ended October 31, 2006, were as follows:
MID CAP GROWTH SMALL CAP
GROWTH
- --------------------------------------------------------------------------------
Purchases $88,378,866 $21,192,761
- --------------------------------------------------------------------------------
Proceeds from sales $97,450,885 $35,348,152
- --------------------------------------------------------------------------------
4. CAPITAL SHARE TRANSACTIONS
Transactions in shares of the funds were as follows (see Note 7):
- ------------------------------------------------------------------------------------------------
MID CAP GROWTH SMALL CAP GROWTH
- ------------------------------------------------------------------------------------------------
SHARES AMOUNT SHARES AMOUNT
- ------------------------------------------------------------------------------------------------
INVESTOR CLASS
- ------------------------------------------------------------------------------------------------
PERIOD ENDED
OCTOBER 31, 2006(1)
SHARES AUTHORIZED 55,000,000 55,000,000
================================================================================================
Sold 22,633 $312,114 36,767 $575,594
- ------------------------
Redeemed -- -- (141) (2,124)
- ------------------------------------------------------------------------------------------------
Net increase (decrease) 22,633 $312,114 36,626 $573,470
================================================================================================
INSTITUTIONAL CLASS
- ----------------------------------------------
PERIOD ENDED
OCTOBER 31, 2006(1)
SHARES AUTHORIZED 50,000,000 50,000,000
================================================================================================
Sold 10,089,307 $149,766,470 73,638 $1,177,466
- ------------------------
Redeemed -- -- (970) (15,697)
- ------------------------------------------------------------------------------------------------
Net increase (decrease) 10,089,307 $149,766,470 72,668 $1,161,769
================================================================================================
A CLASS
- ------------------------------------------------------------------------------------------------
PERIOD ENDED
OCTOBER 31, 2006(2)
SHARES AUTHORIZED 20,000,000 20,000,000
================================================================================================
Sold 321,113 $ 4,524,423 487,111 $ 7,946,087
- ------------------------
Redeemed (10,741,497) (158,865,810) (1,219,827) (19,780,091)
- ------------------------------------------------------------------------------------------------
Net increase (decrease) (10,420,384) $(154,341,387) (732,716) $(11,834,004)
================================================================================================
YEAR ENDED
MARCH 31, 2006
SHARES AUTHORIZED 149,148,534 149,635,857
================================================================================================
Sold 628,722 $ 8,754,617 1,409,502 $23,405,269
- ------------------------
Issued in reinvestment
of distributions 1,142,004 15,702,632 288,264 4,537,275
- ------------------------
Redeemed (835,676) (11,797,915) (674,623) (11,197,022)
- ------------------------------------------------------------------------------------------------
Net increase (decrease) 935,050 $12,659,334 1,023,143 $16,745,522
================================================================================================
YEAR ENDED
MARCH 31, 2005
SHARES AUTHORIZED 149,148,534 149,635,857
================================================================================================
Sold 970,357 $12,678,022 950,771 $14,037,646
- ------------------------
Issued in reinvestment
of distributions -- -- 80,483 1,259,556
- ------------------------
Redeemed (537,458) (7,066,240) (480,513) (7,192,504)
- ------------------------------------------------------------------------------------------------
Net increase (decrease) 432,899 $ 5,611,782 550,741 $ 8,104,698
================================================================================================
(1) April 3, 2006 (commencement of sale) through October 31, 2006.
(2) April 1, 2006 through October 31, 2006. The funds' fiscal year end was
changed from March 31 to October 31, resulting in a seven-month annual
reporting period (see Note 7).
(continued)
- ------
27
Notes to Financial Statements
OCTOBER 31, 2006
4. CAPITAL SHARE TRANSACTIONS (CONTINUED)
- ------------------------------------------------------------------------------------------------
MID CAP GROWTH SMALL CAP GROWTH
- ------------------------------------------------------------------------------------------------
SHARES AMOUNT SHARES AMOUNT
- ------------------------------------------------------------------------------------------------
B CLASS
- ------------------------------------------------------------------------------------------------
PERIOD ENDED
OCTOBER 31, 2006(1)
SHARES AUTHORIZED 10,000,000 10,000,000
================================================================================================
Sold 20,103 $ 266,124 13,209 $ 204,876
- -----------------------
Redeemed (152,890) (2,005,925) (70,902) (1,058,789)
- ------------------------------------------------------------------------------------------------
Net increase (decrease) (132,787) $(1,739,801) (57,693) $(853,913)
================================================================================================
YEAR ENDED
MARCH 31, 2006
SHARES AUTHORIZED 75,851,466 75,364,143
================================================================================================
Sold 82,194 $ 1,102,818 64,896 $1,034,592
- -----------------------
Issued in reinvestment
of distributions 64,131 831,774 48,853 739,630
- -----------------------
Redeemed (264,539) (3,535,355) (78,509) (1,249,817)
- ------------------------------------------------------------------------------------------------
Net increase (decrease) (118,214) $(1,600,763) 35,240 $ 524,405
================================================================================================
YEAR ENDED
MARCH 31, 2005
SHARES AUTHORIZED 75,851,466 75,364,143
================================================================================================
Sold 87,432 $1,093,104 71,250 $1,014,827
- -----------------------
Issued in reinvestment
of distributions -- -- 20,580 313,025
- -----------------------
Redeemed (148,836) (1,871,389) (51,611) (744,166)
- ------------------------------------------------------------------------------------------------
Net increase (decrease) (61,404) $ (778,285) 40,219 $ 583,686
================================================================================================
C CLASS
- ------------------------------------------------------------------------------------------------
PERIOD ENDED
OCTOBER 31, 2006(2)
SHARES AUTHORIZED 10,000,000 10,000,000
================================================================================================
Sold 7,323 $102,286 7,382 $118,510
================================================================================================
C CLASS -- ACQUIRED
FUND (SEE NOTE 7)
- ------------------------------------------------------------------------------------------------
YEAR ENDED
MARCH 31, 2006
SHARES AUTHORIZED 75,000,000 75,000,000
================================================================================================
Sold 25,969 $344,127 41,416 $664,850
- -----------------------
Issued in reinvestment
of distributions 6,748 87,593 9,618 145,522
- -----------------------
Redeemed (11,732) (154,916) (7,626) (120,110)
- ------------------------------------------------------------------------------------------------
Net increase (decrease) 20,985 $276,804 43,408 $690,262
================================================================================================
YEAR ENDED
MARCH 31, 2005
SHARES AUTHORIZED 75,000,000 75,000,000
================================================================================================
Sold 44,778 $ 561,515 45,157 $ 647,586
- -----------------------
Issued in reinvestment
of distributions -- -- 2,193 33,355
- -----------------------
Redeemed (86,859) (1,128,193) (79,839) (1,194,268)
- ------------------------------------------------------------------------------------------------
Net increase (decrease) (42,081) $(566,678) (32,489) $(513,327)
================================================================================================
R CLASS
- ------------------------------------------------------------------------------------------------
PERIOD ENDED
OCTOBER 31, 2006(2)
SHARES AUTHORIZED 10,000,000 10,000,000
================================================================================================
Sold 1,691 $25,000 1,483 $25,000
================================================================================================
(1) April 1, 2006 through October 31, 2006. The funds' fiscal year end was
changed from March 31 to October 31, resulting in a seven-month annual
reporting period (see Note 7).
(2) April 3, 2006 (commencement of sale) through October 31, 2006.
(continued)
- ------
28
Notes to Financial Statements
OCTOBER 31, 2006
5. RISK FACTORS
Small Cap Growth concentrates its investments in common stocks of small
companies. Because of this, Small Cap Growth may be subject to greater risk and
market fluctuations than a fund investing in larger, more established companies.
6. FEDERAL TAX INFORMATION
On December 12, 2006, Mid Cap Growth and Small Cap Growth declared and paid a
per-share distribution from net realized gains to shareholders of record on
December 11, 2006 of $0.7567 and $0.9492, respectively, for each class of the
funds.
The tax character of distributions paid during the seven months ended October
31, 2006 and the years end March 31, 2006 and March 31, 2005 were as follows:
- ------------------------------------------------------------------------------------------------------
MID CAP GROWTH SMALL CAP GROWTH
- ------------------------------------------------------------------------------------------------------
OCT. 31, MARCH 31, MARCH 31, OCT. 31, MARCH 31, MARCH 31,
2006(1) 2006 2005 2006(1) 2006 2005
- ------------------------------------------------------------------------------------------------------
DISTRIBUTIONS PAID FROM
- ------------------------------------------------------------------------------------------------------
Ordinary income -- -- -- -- $ 918,544 --
- ------------------------------------------------------------------------------------------------------
Long-term capital gains -- $16,709,379 -- -- $4,756,306 $1,684,232
- ------------------------------------------------------------------------------------------------------
(1) April 1, 2006 through October 31, 2006. The funds' fiscal year end was
changed from March 31 to October 31 resulting in a seven-month annual
reporting period.
The book-basis character of distributions made during the year from net
investment income or net realized gains may differ from their ultimate
characterization for federal income tax purposes. These differences reflect the
differing character of certain income items and net realized gains and losses
for financial statement and tax purposes, and may result in reclassification
among certain capital accounts on the financial statements.
As of October 31, 2006, the components of distributable earnings on a tax-basis
and the federal tax cost of investments were as follows:
- --------------------------------------------------------------------------------
MID CAP GROWTH SMALL CAP
GROWTH
- --------------------------------------------------------------------------------
Federal tax cost of investments $159,080,621 $42,239,108
================================================================================
Gross tax appreciation of investments $25,494,185 $8,268,769
- ----------------------------------------
Gross tax depreciation of investments (2,556,382) (511,702)
- --------------------------------------------------------------------------------
Net tax appreciation
(depreciation) of investments $22,937,803 $7,757,067
================================================================================
Net tax appreciation
(depreciation) on derivatives
and translation of assets and
liabilities in foreign currencies -- --
- --------------------------------------------------------------------------------
Net tax appreciation (depreciation) $22,937,803 $7,757,067
================================================================================
Undistributed ordinary income $2,253,852 --
- ----------------------------------------
Accumulated long-term gains $7,757,181 $2,958,172
- ----------------------------------------
Accumulated capital losses $(1,141,452) $(1,162,699)
- --------------------------------------------------------------------------------
The difference between book-basis and tax-basis cost and unrealized appreciation
(depreciation) is attributable primarily to the tax deferral of losses on wash
sales.
The accumulated capital losses listed above represent net capital loss
carryovers that may be used to offset future capital gains for federal income
tax purposes. The capital loss carryovers for the funds expire in 2014.
(continued)
- ------
29
Notes to Financial Statements
OCTOBER 31, 2006
7. REORGANIZATION PLAN
As of the close of business on March 31, 2006, Mid Cap Growth and Small Cap
Growth acquired all of the net assets of two funds issued by Mason Street Funds,
Inc., Mason Street Aggressive Growth Stock Fund (Aggressive Growth Stock) and
Mason Street Small Cap Growth Stock Fund (Small Cap Growth Stock), respectively,
pursuant to a plan of reorganization approved by the acquired funds'
shareholders on March 15, 2006 for Aggressive Growth Stock and March 23, 2006
for Small Cap Growth Stock. The surviving funds for the purposes of maintaining
the financial statements and performance history in the post-reorganization are
Aggressive Growth Stock and Small Cap Growth Stock. These funds were also
reorganized as funds issued by American Century Mutual Funds, Inc. The funds'
fiscal year end was changed from March 31 to October 31.
Prior to the reorganization, Aggressive Growth Stock and Small Cap Growth Stock
had A Class, B Class and C Class shares. At the close of business and as a
result of the reorganization, A Class shares and B Class shares of the acquired
funds were converted to A Class shares and B Class shares, respectively, of the
surviving funds. C Class shares of the acquired funds were converted to A Class
shares of the surviving funds.
A Class, B Class and C Class net assets of Aggressive Growth Stock before the
reorganization were $193,018,755, $9,032,496 and $1,010,558, respectively.
Immediately after the reorganization, A Class, B Class and C Class net assets of
Mid Cap Growth were $194,029,313, $9,032,496 and $-, respectively.
A Class, B Class and C Class net assets of Small Cap Growth Stock before the
reorganization were $55,084,794, $8,283,664 and $1,719,620, respectively.
Immediately after the reorganization, A Class, B Class and C Class net assets of
Small Cap Growth were $56,804,414, $8,283,664 and $-, respectively.
8. RECENTLY ISSUED ACCOUNTING STANDARDS
In June 2006, the Financial Accounting Standards Board (FASB) issued
Interpretation No. 48, "Accounting for Uncertainty in Income Taxes - an
Interpretation of FASB Statement No. 109" (FIN 48). FIN 48 establishes a minimum
threshold for financial statement recognition of the benefit of positions taken
in filing tax returns (including whether an entity is taxable in a particular
jurisdiction), and requires certain expanded tax disclosures. FIN 48 is
effective for fiscal years beginning after December 15, 2006, and is to be
applied to all open tax years as of the date of effectiveness. The FASB issued
Statement of Financial Accounting Standards No. 157, "Fair Value Measurements"
(FAS 157), in September 2006, which is effective for fiscal years beginning
after November 15, 2007. FAS 157 defines fair value, establishes a framework for
measuring fair value and expands the required financial statement disclosures
about fair value measurements. Management is currently evaluating the impact of
adopting FIN 48 and FAS 157.
- ------
30
Mid Cap Growth - Financial Highlights
For a Share Outstanding Throughout the Period Indicated
- --------------------------------------------------------------------------------
INVESTOR
CLASS
- --------------------------------------------------------------------------------
2006(1)
- --------------------------------------------------------------------------------
PER-SHARE DATA
- --------------------------------------------------------------------------------
Net Asset Value, Beginning of Period $14.78
- --------------------------------------------------------------------------------
Income From Investment Operations
- ------------------------------------------------------------
Net Investment Income (Loss)(2) (0.01)
- ------------------------------------------------------------
Net Realized and Unrealized Gain (Loss) (1.01)
- --------------------------------------------------------------------------------
Total From Investment Operations (1.02)
- --------------------------------------------------------------------------------
Net Asset Value, End of Period $13.76
================================================================================
TOTAL RETURN(3) (6.90)%
- --------------------------------------------------------------------------------
RATIOS/SUPPLEMENTAL DATA
- --------------------------------------------------------------------------------
Ratio of Operating Expenses to Average Net Assets 1.05%(4)
- ------------------------------------------------------------
Ratio of Net Investment Income (Loss) to Average Net Assets (0.19)%(4)
- ------------------------------------------------------------
Portfolio Turnover Rate 52%
- ------------------------------------------------------------
Net Assets, End of Period (in thousands) $311
- --------------------------------------------------------------------------------
(1) April 3, 2006 (commencement of sale) through October 31, 2006.
(2) Computed using average shares outstanding throughout the period.
(3) Total return assumes reinvestment of net investment income and capital
gains distributions, if any. Total returns for periods less than one year
are not annualized. The total return of the classes may not precisely
reflect the class expense differences because of the impact of calculating
the net asset values to two decimal places. If net asset values were
calculated to three decimal places, the total return differences would more
closely reflect the class expense differences. The calculation of net asset
values to two decimal places is made in accordance with SEC guidelines and
does not result in any gain or loss of value between one class and another.
(4) Annualized.
See Notes to Financial Statements.
- ------
31
Mid Cap Growth - Financial Highlights
For a Share Outstanding Throughout the Period Indicated
- --------------------------------------------------------------------------------
INSTITUTIONAL
CLASS
- --------------------------------------------------------------------------------
2006(1)
- --------------------------------------------------------------------------------
PER-SHARE DATA
- --------------------------------------------------------------------------------
Net Asset Value, Beginning of Period $14.78
- --------------------------------------------------------------------------------
Income From Investment Operations
- ------------------------------------------------------------
Net Investment Income (Loss)(2) --(3)
- ------------------------------------------------------------
Net Realized and Unrealized Gain (Loss) (1.00)
- --------------------------------------------------------------------------------
Total From Investment Operations (1.00)
- --------------------------------------------------------------------------------
Net Asset Value, End of Period $13.78
================================================================================
TOTAL RETURN(4) (6.77)%
- --------------------------------------------------------------------------------
RATIOS/SUPPLEMENTAL DATA
- --------------------------------------------------------------------------------
Ratio of Operating Expenses to Average Net Assets 0.85%(5)
- ------------------------------------------------------------
Ratio of Net Investment Income (Loss) to Average Net Assets 0.01%(5)
- ------------------------------------------------------------
Portfolio Turnover Rate 52%
- ------------------------------------------------------------
Net Assets, End of Period (in thousands) $138,986
- --------------------------------------------------------------------------------
(1) April 3, 2006 (commencement of sale) through October 31, 2006.
(2) Computed using average shares outstanding throughout the period.
(3) Per-share amount was less than $0.005.
(4) Total return assumes reinvestment of net investment income and capital
gains distributions, if any. Total returns for periods less than one year
are not annualized. The total return of the classes may not precisely
reflect the class expense differences because of the impact of calculating
the net asset values to two decimal places. If net asset values were
calculated to three decimal places, the total return differences would more
closely reflect the class expense differences. The calculation of net asset
values to two decimal places is made in accordance with SEC guidelines and
does not result in any gain or loss of value between one class and another.
(5) Annualized.
See Notes to Financial Statements.
- ------
32
Mid Cap Growth - Financial Highlights
For a Share Outstanding Throughout the Years Ended March 31 (except as noted)
- --------------------------------------------------------------------------------------------------------------
A CLASS
- --------------------------------------------------------------------------------------------------------------
2006(1) 2006 2005 2004 2003 2002
- --------------------------------------------------------------------------------------------------------------
PER-SHARE DATA
- --------------------------------------------------------------------------------------------------------------
Net Asset Value,
Beginning of Period $14.83 $13.50 $12.78 $9.83 $12.93 $13.70
- --------------------------------------------------------------------------------------------------------------
Income From
Investment Operations
- ----------------------
Net Investment
Income (Loss) (0.04)(2) (0.01)(2) (0.10)(2) (0.09)(2) (0.09)(2) (0.09)
- ----------------------
Net Realized
and Unrealized
Gain (Loss) (1.05) 2.65 0.82 3.04 (3.01) 0.43
- --------------------------------------------------------------------------------------------------------------
Total From
Investment Operations (1.09) 2.64 0.72 2.95 (3.10) 0.34
- --------------------------------------------------------------------------------------------------------------
Distributions
- ----------------------
From Net
Realized Gains -- (1.31) -- -- -- (1.11)
- --------------------------------------------------------------------------------------------------------------
Net Asset Value,
End of Period $13.74 $14.83 $13.50 $12.78 $9.83 $12.93
==============================================================================================================
TOTAL RETURN(3) (7.35)% 20.28% 5.63% 30.01% (23.98)% 2.54%
- --------------------------------------------------------------------------------------------------------------
RATIOS/
SUPPLEMENTAL DATA
- --------------------------------------------------------------------------------------------------------------
Ratio of Operating
Expenses to
Average Net Assets 1.30%(4) 1.29% 1.30%(5) 1.30%(5) 1.30%(5) 1.30%(5)
- ----------------------
Ratio of Operating
Expenses to Average
Net Assets (Before
Expense Waiver) 1.30%(4) 1.29% 1.36% 1.40% 1.55% 1.55%
- ----------------------
Ratio of Net
Investment Income
(Loss) to Average
Net Assets (0.44)%(4) (0.08)% (0.79)%(5) (0.74)%(5) (0.86)%(5) (0.61)%(5)
- ----------------------
Ratio of Net
Investment Income
(Loss) to Average
Net Assets (Before
Expense Waiver) (0.44)%(4) (0.08)% (0.85)% (0.84)% (1.11)% (0.86)%
- ----------------------
Portfolio
Turnover Rate 52% 89% 70% 72% 35% 68%
- ----------------------
Net Assets,
End of Period
(in thousands) $36,675 $193,019 $163,069 $148,862 $105,728 $66,062
- --------------------------------------------------------------------------------------------------------------
(1) April 1, 2006 through October 31, 2006. The fund's fiscal year was changed
from March 31 to October 31, resulting in a seven-month annual reporting
period.
(2) Computed using average shares outstanding throughout the period.
(3) Total return assumes reinvestment of net investment income and capital
gains distributions, if any, and does not reflect applicable sales charges.
Total returns for periods less than one year are not annualized. The total
return of the classes may not precisely reflect the class expense
differences because of the impact of calculating the net asset values to two
decimal places. If net asset values were calculated to three decimal places,
the total return differences would more closely reflect the class expense
differences. The calculation of net asset values to two decimal places is
made in accordance with SEC guidelines and does not result in any gain or
loss of value between one class and another.
(4) Annualized.
(5) The investment advisor voluntarily agreed to waive fees and absorb certain
operating expenses.
See Notes to Financial Statements.
- ------
33
Mid Cap Growth - Financial Highlights
For a Share Outstanding Throughout the Years Ended March 31 (except as noted)
- -------------------------------------------------------------------------------------------------------------
B CLASS
- -------------------------------------------------------------------------------------------------------------
2006(1) 2006 2005 2004 2003 2002
- -------------------------------------------------------------------------------------------------------------
PER-SHARE DATA
- -------------------------------------------------------------------------------------------------------------
Net Asset Value,
Beginning of Period $13.96 $12.86 $12.25 $9.49 $12.55 $13.43
- -------------------------------------------------------------------------------------------------------------
Income From
Investment Operations
- ---------------------
Net Investment
Income (Loss) (0.08)(2) (0.10)(2) (0.18)(2) (0.16)(2) (0.16)(2) (0.09)
- ---------------------
Net Realized
and Unrealized
Gain (Loss) (0.99) 2.51 0.79 2.92 (2.90) 0.32
- -------------------------------------------------------------------------------------------------------------
Total From
Investment
Operations (1.07) 2.41 0.61 2.76 (3.06) 0.23
- -------------------------------------------------------------------------------------------------------------
Distributions
- ---------------------
From Net
Realized Gains -- (1.31) -- -- -- (1.11)
- -------------------------------------------------------------------------------------------------------------
Net Asset Value,
End of Period $12.89 $13.96 $12.86 $12.25 $9.49 $12.55
=============================================================================================================
TOTAL RETURN(3) (7.66)% 19.48% 4.98% 29.08% (24.38)% 1.75%
- -------------------------------------------------------------------------------------------------------------
RATIOS/SUPPLEMENTAL
DATA
- -------------------------------------------------------------------------------------------------------------
Ratio of Operating
Expenses to
Average Net Assets 1.95%(4)(5) 1.95%(6) 1.95%(6) 1.95%(6) 1.95%(6) 1.95%(6)
- ---------------------
Ratio of Operating
Expenses to Average
Net Assets (Before
Expense Waiver) 2.05%(4) 2.02% 2.04% 2.05% 2.20% 2.20%
- ---------------------
Ratio of Net
Investment Income
(Loss) to Average
Net Assets (1.09)%(4)(5) (0.78)%(6) (1.44)%(6) (1.40)%(6) (1.52)%(6) (1.26)%(6)
- ---------------------
Ratio of Net
Investment Income
(Loss) to Average
Net Assets (Before
Expense Waiver) (1.19)%(4) (0.85)% (1.53)% (1.50)% (1.77)% (1.51)%
- ---------------------
Portfolio
Turnover Rate 52% 89% 70% 72% 35% 68%
- ---------------------
Net Assets,
End of Period
(in thousands) $6,626 $9,032 $9,839 $10,128 $7,978 $10,302
- -------------------------------------------------------------------------------------------------------------
(1) April 1, 2006 through October 31, 2006. The fund's fiscal year was changed
from March 31 to October 31, resulting in a seven-month annual reporting
period.
(2) Computed using average shares outstanding throughout the period.
(3) Total return assumes reinvestment of net investment income and capital
gains distributions, if any, and does not reflect applicable sales charges.
Total returns for periods less than one year are not annualized. The total
return of the classes may not precisely reflect the class expense
differences because of the impact of calculating the net asset values to two
decimal places. If net asset values were calculated to three decimal places,
the total return differences would more closely reflect the class expense
differences. The calculation of net asset values to two decimal places is
made in accordance with SEC guidelines and does not result in any gain or
loss of value between one class and another.
(4) Annualized.
(5) During the seven months ended October 31, 2006, the distributor voluntarily
waived a portion of its distribution and service fees.
(6) The investment advisor voluntarily agreed to waive fees and absorb certain
operating expenses.
See Notes to Financial Statements.
- ------
34
Mid Cap Growth - Financial Highlights
For a Share Outstanding Throughout the Period Indicated
- --------------------------------------------------------------------------------
C CLASS
- --------------------------------------------------------------------------------
2006(1)
- --------------------------------------------------------------------------------
PER-SHARE DATA
- --------------------------------------------------------------------------------
Net Asset Value, Beginning of Period $14.78
- --------------------------------------------------------------------------------
Income From Investment Operations
- ------------------------------------------------------------
Net Investment Income (Loss)(2) (0.10)
- ------------------------------------------------------------
Net Realized and Unrealized Gain (Loss) (1.00)
- --------------------------------------------------------------------------------
Total From Investment Operations (1.10)
- --------------------------------------------------------------------------------
Net Asset Value, End of Period $13.68
================================================================================
TOTAL RETURN(3) (7.44)%
- --------------------------------------------------------------------------------
RATIOS/SUPPLEMENTAL DATA
- --------------------------------------------------------------------------------
Ratio of Operating Expenses to Average Net Assets 2.05%(4)
- ------------------------------------------------------------
Ratio of Net Investment Income (Loss) to Average Net Assets (1.19)%(4)
- ------------------------------------------------------------
Portfolio Turnover Rate 52%
- ------------------------------------------------------------
Net Assets, End of Period (in thousands) $100
- --------------------------------------------------------------------------------
(1) April 3, 2006 (commencement of sale) through October 31, 2006.
(2) Computed using average shares outstanding throughout the period.
(3) Total return assumes reinvestment of net investment income and capital
gains distributions, if any, and does not reflect applicable sales charges.
Total returns for periods less than one year are not annualized. The total
return of the classes may not precisely reflect the class expense
differences because of the impact of calculating the net asset values to two
decimal places. If net asset values were calculated to three decimal places,
the total return differences would more closely reflect the class expense
differences. The calculation of net asset values to two decimal places is
made in accordance with SEC guidelines and does not result in any gain or
loss of value between one class and another.
(4) Annualized.
See Notes to Financial Statements.
- ------
35
Mid Cap Growth - Financial Highlights
For a Share Outstanding Throughout the Period Indicated
- --------------------------------------------------------------------------------
R CLASS
- --------------------------------------------------------------------------------
2006(1)
- --------------------------------------------------------------------------------
PER-SHARE DATA
- --------------------------------------------------------------------------------
Net Asset Value, Beginning of Period $14.78
- --------------------------------------------------------------------------------
Income From Investment Operations
- -----------------------------------------------------------------
Net Investment Income (Loss)(2) (0.06)
- -----------------------------------------------------------------
Net Realized and Unrealized Gain (Loss) (1.00)
- --------------------------------------------------------------------------------
Total From Investment Operations (1.06)
- --------------------------------------------------------------------------------
Net Asset Value, End of Period $13.72
================================================================================
TOTAL RETURN(3) (7.17)%
- --------------------------------------------------------------------------------
RATIOS/SUPPLEMENTAL DATA
- --------------------------------------------------------------------------------
Ratio of Operating Expenses to Average Net Assets 1.55%(4)
- -----------------------------------------------------------------
Ratio of Net Investment Income (Loss) to Average Net Assets (0.69)%(4)
- -----------------------------------------------------------------
Portfolio Turnover Rate 52%
- -----------------------------------------------------------------
Net Assets, End of Period (in thousands) $23
- --------------------------------------------------------------------------------
(1) April 3, 2006 (commencement of sale) through October 31, 2006.
(2) Computed using average shares outstanding throughout the period.
(3) Total return assumes reinvestment of net investment income and capital
gains distributions, if any. Total returns for periods less than one year
are not annualized. The total return of the classes may not precisely
reflect the class expense differences because of the impact of calculating
the net asset values to two decimal places. If net asset values were
calculated to three decimal places, the total return differences would more
closely reflect the class expense differences. The calculation of net asset
values to two decimal places is made in accordance with SEC guidelines and
does not result in any gain or loss of value between one class and another.
(4) Annualized.
See Notes to Financial Statements.
- ------
36
Small Cap Growth - Financial Highlights
For a Share Outstanding Throughout the Period Indicated
- --------------------------------------------------------------------------------
INVESTOR
CLASS
- --------------------------------------------------------------------------------
2006(1)
- --------------------------------------------------------------------------------
PER-SHARE DATA
- --------------------------------------------------------------------------------
Net Asset Value, Beginning of Period $16.86
- --------------------------------------------------------------------------------
Income From Investment Operations
- -----------------------------------------------------------------
Net Investment Income (Loss)(2) (0.06)
- -----------------------------------------------------------------
Net Realized and Unrealized Gain (Loss) (0.77)
- --------------------------------------------------------------------------------
Total From Investment Operations (0.83)
- --------------------------------------------------------------------------------
Net Asset Value, End of Period $16.03
================================================================================
TOTAL RETURN(3) (4.92)%
- --------------------------------------------------------------------------------
RATIOS/SUPPLEMENTAL DATA
- --------------------------------------------------------------------------------
Ratio of Operating Expenses to Average Net Assets 1.30%(4)
- -----------------------------------------------------------------
Ratio of Net Investment Income (Loss) to Average Net Assets (0.80)%(4)
- -----------------------------------------------------------------
Portfolio Turnover Rate 42%
- -----------------------------------------------------------------
Net Assets, End of Period (in thousands) $587
- --------------------------------------------------------------------------------
(1) April 3, 2006 (commencement of sale) through October 31, 2006.
(2) Computed using average shares outstanding throughout the period.
(3) Total return assumes reinvestment of net investment income and capital
gains distributions, if any. Total returns for periods less than one year
are not annualized. The total return of the classes may not precisely
reflect the class expense differences because of the impact of calculating
the net asset values to two decimal places. If net asset values were
calculated to three decimal places, the total return differences would more
closely reflect the class expense differences. The calculation of net asset
values to two decimal places is made in accordance with SEC guidelines and
does not result in any gain or loss of value between one class and another.
(4) Annualized.
See Notes to Financial Statements.
- ------
37
Small Cap Growth - Financial Highlights
For a Share Outstanding Throughout the Period Indicated
- --------------------------------------------------------------------------------
INSTITUTIONAL
CLASS
- --------------------------------------------------------------------------------
2006(1)
- --------------------------------------------------------------------------------
PER-SHARE DATA
- --------------------------------------------------------------------------------
Net Asset Value, Beginning of Period $16.86
- --------------------------------------------------------------------------------
Income From Investment Operations
- -----------------------------------------------------------------
Net Investment Income (Loss)(2) (0.05)
- -----------------------------------------------------------------
Net Realized and Unrealized Gain (Loss) (0.76)
- --------------------------------------------------------------------------------
Total From Investment Operations (0.81)
- --------------------------------------------------------------------------------
Net Asset Value, End of Period $16.05
================================================================================
TOTAL RETURN(3) (4.80)%
- --------------------------------------------------------------------------------
RATIOS/SUPPLEMENTAL DATA
- --------------------------------------------------------------------------------
Ratio of Operating Expenses to Average Net Assets 1.10%(4)
- -----------------------------------------------------------------
Ratio of Net Investment Income (Loss) to Average Net Assets (0.60)%(4)
- -----------------------------------------------------------------
Portfolio Turnover Rate 42%
- -----------------------------------------------------------------
Net Assets, End of Period (in thousands) $1,166
- --------------------------------------------------------------------------------
(1) April 3, 2006 (commencement of sale) through October 31, 2006.
(2) Computed using average shares outstanding throughout the period.
(3) Total return assumes reinvestment of net investment income and capital
gains distributions, if any. Total returns for periods less than one year
are not annualized. The total return of the classes may not precisely
reflect the class expense differences because of the impact of calculating
the net asset values to two decimal places. If net asset values were
calculated to three decimal places, the total return differences would more
closely reflect the class expense differences. The calculation of net asset
values to two decimal places is made in accordance with SEC guidelines and
does not result in any gain or loss of value between one class and another.
(4) Annualized.
See Notes to Financial Statements.
- ------
38
Small Cap Growth - Financial Highlights
For a Share Outstanding Throughout the Years Ended March 31 (except as noted)
- --------------------------------------------------------------------------------------------------------------
A CLASS
- --------------------------------------------------------------------------------------------------------------
2006(1) 2006 2005 2004 2003 2002
- --------------------------------------------------------------------------------------------------------------
PER-SHARE DATA
- --------------------------------------------------------------------------------------------------------------
Net Asset Value,
Beginning of Period $17.02 $15.27 $14.38 $10.11 $13.38 $11.61
- --------------------------------------------------------------------------------------------------------------
Income From
Investment
Operations
- ---------------------
Net Investment
Income (Loss) (0.08)(2) (0.14)(2) (0.15)(2) (0.15)(2) (0.12)(2) (0.11)
- ---------------------
Net Realized
and Unrealized
Gain (Loss) (0.92) 3.53 1.75 4.42 (3.15) 1.88
- --------------------------------------------------------------------------------------------------------------
Total From
Investment
Operations (1.00) 3.39 1.60 4.27 (3.27) 1.77
- --------------------------------------------------------------------------------------------------------------
Distributions
- ---------------------
From Net
Realized Gains -- (1.64) (0.71) -- -- --
- --------------------------------------------------------------------------------------------------------------
Net Asset Value,
End of Period $16.02 $17.02 $15.27 $14.38 $10.11 $13.38
==============================================================================================================
TOTAL RETURN(3) (5.88)% 23.08% 10.99% 42.24% (24.44)% 15.25%
- --------------------------------------------------------------------------------------------------------------
RATIOS/SUPPLEMENTAL
DATA
- --------------------------------------------------------------------------------------------------------------
Ratio of Operating
Expenses to
Average Net Assets 1.40%(4)(5) 1.40%(6) 1.40%(6) 1.40%(6) 1.40%(6) 1.40%(6)
- ---------------------
Ratio of Operating
Expenses to Average
Net Assets (Before
Expense Waiver) 1.55%(4) 1.86% 2.03% 2.21% 2.29% 2.46%
- ---------------------
Ratio of Net
Investment Income
(Loss) to Average
Net Assets (0.90)%(4)(5) (0.82)%(6) (1.05)%(6) (1.16)%(6) (1.10)%(6) (0.89)%(6)
- ---------------------
Ratio of Net
Investment Income
(Loss) to Average
Net Assets (Before
Expense Waiver) (1.05)%(4) (1.28)% (1.68)% (1.97)% (1.99)% (1.95)%
- ---------------------
Portfolio
Turnover Rate 42% 81% 86% 98% 49% 58%
- ---------------------
Net Assets,
End of Period
(in thousands) $41,798 $55,085 $33,791 $23,914 $14,623 $13,997
- --------------------------------------------------------------------------------------------------------------
(1) April 1, 2006 through October 31, 2006. The fund's fiscal year was changed
from March 31 to October 31, resulting in a seven-month annual reporting
period.
(2) Computed using average shares outstanding throughout the period.
(3) Total return assumes reinvestment of net investment income and capital
gains distributions, if any, and does not reflect applicable sales charges.
Total returns for periods less than one year are not annualized. The total
return of the classes may not precisely reflect the class expense
differences because of the impact of calculating the net asset values to two
decimal places. If net asset values were calculated to three decimal places,
the total return differences would more closely reflect the class expense
differences. The calculation of net asset values to two decimal places is
made in accordance with SEC guidelines and does not result in any gain or
loss of value between one class and another.
(4) Annualized.
(5) During the seven months ended October 31, 2006, the distributor voluntarily
waived a portion of its distribution and service fees.
(6) The investment advisor voluntarily agreed to waive fees and absorb certain
operating expenses.
See Notes to Financial Statements.
- ------
39
Small Cap Growth - Financial Highlights
For a Share Outstanding Throughout the Years Ended March 31 (except as noted)
- --------------------------------------------------------------------------------------------------------------
B CLASS
- --------------------------------------------------------------------------------------------------------------
2006(1) 2006 2005 2004 2003 2002
- --------------------------------------------------------------------------------------------------------------
PER-SHARE DATA
- --------------------------------------------------------------------------------------------------------------
Net Asset Value,
Beginning of Period $16.34 $14.81 $14.06 $9.95 $13.25 $11.58
- --------------------------------------------------------------------------------------------------------------
Income From
Investment
Operations
- -------------------
Net Investment
Income (Loss) (0.14)(2) (0.24)(2) (0.24)(2) (0.23)(2) (0.19)(2) (0.11)
- -------------------
Net Realized
and Unrealized
Gain (Loss) (0.88) 3.41 1.70 4.34 (3.11) 1.78
- --------------------------------------------------------------------------------------------------------------
Total From
Investment
Operations (1.02) 3.17 1.46 4.11 (3.30) 1.67
- --------------------------------------------------------------------------------------------------------------
Distributions
- -------------------
From Net
Realized Gains -- (1.64) (0.71) -- -- --
- --------------------------------------------------------------------------------------------------------------
Net Asset Value,
End of Period $15.32 $16.34 $14.81 $14.06 $9.95 $13.25
==============================================================================================================
TOTAL RETURN(3) (6.24)% 22.29% 10.23% 41.31% (24.91)% 14.42%
- --------------------------------------------------------------------------------------------------------------
RATIOS/SUPPLEMENTAL
DATA
- --------------------------------------------------------------------------------------------------------------
Ratio of Operating
Expenses to
Average Net Assets 2.05%(4)(5) 2.05%(6) 2.05%(6) 2.05%(6) 2.05%(6) 2.05%(6)
- -------------------
Ratio of Operating
Expenses to Average
Net Assets (Before
Expense Waiver) 2.30%(4) 2.51% 2.68% 2.86% 2.94% 3.11%
- -------------------
Ratio of Net
Investment Income
(Loss) to
Average Net Assets (1.55)%(4)(5) (1.48)%(6) (1.70)%(6) (1.81)%(6) (1.74)%(6) (1.54)%(6)
- -------------------
Ratio of Net
Investment Income
(Loss) to Average
Net Assets (Before
Expense Waiver) (1.80)%(4) (1.94)% (2.33)% (2.62)% (2.63)% (2.60)%
- -------------------
Portfolio
Turnover Rate 42% 81% 86% 98% 49% 58%
- -------------------
Net Assets,
End of Period
(in thousands) $6,884 $8,284 $6,986 $6,066 $3,674 $3,525
- --------------------------------------------------------------------------------------------------------------
(1) April 1, 2006 through October 31, 2006. The fund's fiscal year was changed
from March 31 to October 31, resulting in a seven-month annual reporting
period.
(2) Computed using average shares outstanding throughout the period.
(3) Total return assumes reinvestment of net investment income and capital
gains distributions, if any, and does not reflect applicable sales charges.
Total returns for periods less than one year are not annualized. The total
return of the classes may not precisely reflect the class expense
differences because of the impact of calculating the net asset values to two
decimal places. If net asset values were calculated to three decimal places,
the total return differences would more closely reflect the class expense
differences. The calculation of net asset values to two decimal places is
made in accordance with SEC guidelines and does not result in any gain or
loss of value between one class and another.
(4) Annualized.
(5) During the seven months ended October 31, 2006, the distributor voluntarily
waived a portion of its distribution and service fees.
(6) The investment advisor voluntarily agreed to waive fees and absorb certain
operating expenses.
See Notes to Financial Statements.
- ------
40
Small Cap Growth - Financial Highlights
For a Share Outstanding Throughout the Period Indicated
- --------------------------------------------------------------------------------
C CLASS
- --------------------------------------------------------------------------------
2006(1)
- --------------------------------------------------------------------------------
PER-SHARE DATA
- --------------------------------------------------------------------------------
Net Asset Value, Beginning of Period $16.86
- --------------------------------------------------------------------------------
Income From Investment Operations
- -----------------------------------------------------------------
Net Investment Income (Loss)(2) (0.16)
- -----------------------------------------------------------------
Net Realized and Unrealized Gain (Loss) (0.76)
- --------------------------------------------------------------------------------
Total From Investment Operations (0.92)
- --------------------------------------------------------------------------------
Net Asset Value, End of Period $15.94
================================================================================
TOTAL RETURN(3) (5.46)%
- --------------------------------------------------------------------------------
RATIOS/SUPPLEMENTAL DATA
- --------------------------------------------------------------------------------
Ratio of Operating Expenses to Average Net Assets 2.30%(4)
- -----------------------------------------------------------------
Ratio of Net Investment Income (Loss) to Average Net Assets (1.80)%(4)
- -----------------------------------------------------------------
Portfolio Turnover Rate 42%
- -----------------------------------------------------------------
Net Assets, End of Period (in thousands) $118
- --------------------------------------------------------------------------------
(1) April 3, 2006 (commencement of sale) through October 31, 2006.
(2) Computed using average shares outstanding throughout the period.
(3) Total return assumes reinvestment of net investment income and capital
gains distributions, if any, and does not reflect applicable sales charges.
Total returns for periods less than one year are not annualized. The total
return of the classes may not precisely reflect the class expense
differences because of the impact of calculating the net asset values to two
decimal places. If net asset values were calculated to three decimal places,
the total return differences would more closely reflect the class expense
differences. The calculation of net asset values to two decimal places is
made in accordance with SEC guidelines and does not result in any gain or
loss of value between one class and another.
(4) Annualized.
See Notes to Financial Statements.
- ------
41
Small Cap Growth - Financial Highlights
For a Share Outstanding Throughout the Period Indicated
- --------------------------------------------------------------------------------
R CLASS
- --------------------------------------------------------------------------------
2006(1)
- --------------------------------------------------------------------------------
PER-SHARE DATA
- --------------------------------------------------------------------------------
Net Asset Value, Beginning of Period $16.86
- --------------------------------------------------------------------------------
Income From Investment Operations
- -----------------------------------------------------------------
Net Investment Income (Loss)(2) (0.12)
- -----------------------------------------------------------------
Net Realized and Unrealized Gain (Loss) (0.76)
- --------------------------------------------------------------------------------
Total From Investment Operations (0.88)
- --------------------------------------------------------------------------------
Net Asset Value, End of Period $15.98
================================================================================
TOTAL RETURN(3) (5.22)%
- --------------------------------------------------------------------------------
RATIOS/SUPPLEMENTAL DATA
- --------------------------------------------------------------------------------
Ratio of Operating Expenses to Average Net Assets 1.80%(4)
- -----------------------------------------------------------------
Ratio of Net Investment Income (Loss) to Average Net Assets (1.30)%(4)
- -----------------------------------------------------------------
Portfolio Turnover Rate 42%
- -----------------------------------------------------------------
Net Assets, End of Period (in thousands) $24
- --------------------------------------------------------------------------------
(1) April 3, 2006 (commencement of sale) through October 31, 2006.
(2) Computed using average shares outstanding throughout the period.
(3) Total return assumes reinvestment of net investment income and capital
gains distributions, if any. Total returns for periods less than one year
are not annualized. The total return of the classes may not precisely
reflect the class expense differences because of the impact of calculating
the net asset values to two decimal places. If net asset values were
calculated to three decimal places, the total return differences would more
closely reflect the class expense differences. The calculation of net asset
values to two decimal places is made in accordance with SEC guidelines and
does not result in any gain or loss of value between one class and another.
(4) Annualized.
See Notes to Financial Statements.
- ------
42
Report of Independent Registered Public Accounting Firm
The Board of Directors and Shareholders,
American Century Mutual Funds, Inc.:
We have audited the accompanying statements of assets and liabilities, including
the schedules of investments, of American Century-Mason Street Mid Cap Growth
Fund and American Century-Mason Street Small Cap Growth Fund (collectively the
"Funds"), two of the mutual funds comprising American Century Mutual Funds,
Inc., as of October 31, 2006, and the related statements of operations and the
statements of changes in net assets for the seven month period then ended, and
the financial highlights for the periods ended October 31, 2006 (except as noted
below). These financial statements and financial highlights are the
responsibility of the Funds' management. Our responsibility is to express an
opinion on these financial statements and financial highlights based on our
audits. The financial statements and financial highlights for each of the
periods ended March 31, 2006 and prior were audited by other auditors whose
report, dated May 1, 2006, expressed an unqualified opinion on those financial
statements and financial highlights.
We conducted our audits in accordance with the standards of the Public Company
Accounting Oversight Board (United States). Those standards require that we plan
and perform the audit to obtain reasonable assurance about whether the financial
statements and financial highlights are free of material misstatement. The Funds
are not required to have, nor were we engaged to perform, an audit of their
internal control over financial reporting. Our audits included consideration of
internal control over financial reporting as a basis for designing audit
procedures that are appropriate in the circumstances, but not for the purpose of
expressing an opinion on the effectiveness of the Funds' internal control over
financial reporting. Accordingly, we express no such opinion. An audit also
includes examining, on a test basis, evidence supporting the amounts and
disclosures in the financial statements, assessing the accounting principles
used and significant estimates made by management, as well as evaluating the
overall financial statement presentation. Our procedures included confirmation
of securities owned as of October 31, 2006, by correspondence with the custodian
and brokers; where replies were not received from brokers, we performed other
auditing procedures. We believe that our audits provide a reasonable basis for
our opinion.
In our opinion, such fiscal October 31, 2006 financial statements and financial
highlights referred to above present fairly, in all material respects, the
financial position of each of the respective Funds as of October 31, 2006, the
results of their operations and the changes in their net assets for the seven
month period then ended, and the financial highlights for the periods ended
October 31, 2006, in conformity with accounting principles generally accepted in
the United States of America.
Deloitte & Touche LLP
Kansas City, Missouri
December 14, 2006
- ------
43
Management
The individuals listed below serve as directors or officers of the funds. Each
director serves until his or her successor is duly elected and qualified or
until he or she retires. Mandatory retirement age for independent directors is
72. Those listed as interested directors are "interested" primarily by virtue of
their engagement as officers of American Century Companies, Inc. (ACC) or its
wholly owned, direct or indirect, subsidiaries, including the funds' investment
advisor, American Century Investment Management, Inc. (ACIM); the funds'
principal underwriter, American Century Investment Services, Inc. (ACIS); and
the funds' transfer agent, American Century Services, LLC (ACS).
The other directors (more than three-fourths of the total number) are
independent; that is, they have never been employees or officers of, and have no
financial interest in, ACC or any of its wholly owned subsidiaries, including
ACIM, ACIS, and ACS. The directors serve in this capacity for seven registered
investment companies in the American Century family of funds.
All persons named as officers of the funds also serve in a similar capacity for
the other 14 investment companies advised by ACIM or American Century Global
Investment Management, Inc. (ACGIM), unless otherwise noted. Only officers with
policy-making functions are listed. No officer is compensated for his or her
service as an officer of the funds. The listed officers are interested persons
of the funds and are appointed or re-appointed on an annual basis.
- --------------------------------------------------------------------------------
INDEPENDENT DIRECTORS
- --------------------------------------------------------------------------------
THOMAS A. BROWN, 4500 Main Street, Kansas City, MO 64111
YEAR OF BIRTH: 1940
POSITION(S) HELD WITH FUND: Director
FIRST YEAR OF SERVICE: 1980
PRINCIPAL OCCUPATION(S) DURING PAST 5 YEARS: Retired, Formerly Chief Executive
Officer/Treasurer, Associated Bearings Company
NUMBER OF PORTFOLIOS IN FUND COMPLEX OVERSEEN BY DIRECTOR: 66
OTHER DIRECTORSHIPS HELD BY DIRECTOR: None
- --------------------------------------------------------------------------------
ANDREA C. HALL, Ph.D., 4500 Main Street, Kansas City, MO 64111
YEAR OF BIRTH: 1945
POSITION(S) HELD WITH FUND: Director
FIRST YEAR OF SERVICE: 1997
PRINCIPAL OCCUPATION(S) DURING PAST 5 YEARS: Senior Vice President, Midwest
Research Institute
NUMBER OF PORTFOLIOS IN FUND COMPLEX OVERSEEN BY DIRECTOR: 66
OTHER DIRECTORSHIPS HELD BY DIRECTOR: None
- --------------------------------------------------------------------------------
D.D. (DEL) HOCK, 4500 Main Street, Kansas City, MO 64111
YEAR OF BIRTH: 1935
POSITION(S) HELD WITH FUND: Director
FIRST YEAR OF SERVICE: 1996
PRINCIPAL OCCUPATION(S) DURING PAST 5 YEARS: Retired, formerly Chairman, Public
Service Company of Colorado
NUMBER OF PORTFOLIOS IN FUND COMPLEX OVERSEEN BY DIRECTOR: 66
OTHER DIRECTORSHIPS HELD BY DIRECTOR: Director, Allied Motion Technologies, Inc
- --------------------------------------------------------------------------------
JAMES A. OLSON, 4500 Main Street, Kansas City, MO 64111
YEAR OF BIRTH: 1942
POSITION(S) HELD WITH FUND: Advisory Board Member
FIRST YEAR OF SERVICE: 2006
PRINCIPAL OCCUPATION(S) DURING PAST 5 YEARS: Principal, Plaza Belmont LLC; Chief
Financial Officer, Plaza Belmont LLC (September 1999 to July 2006)
NUMBER OF PORTFOLIOS IN FUND COMPLEX OVERSEEN BY DIRECTOR: 66
OTHER DIRECTORSHIPS HELD BY DIRECTOR: Director, Saia, Inc. and Entertainment
Properties Trust
- --------------------------------------------------------------------------------
(continued)
- ------
44
Management
- --------------------------------------------------------------------------------
INDEPENDENT DIRECTORS (CONTINUED)
- --------------------------------------------------------------------------------
DONALD H. PRATT, 4500 Main Street, Kansas City, MO 64111
YEAR OF BIRTH: 1937
POSITION(S) HELD WITH FUND: Director, Chairman of the Board
FIRST YEAR OF SERVICE: 1995
PRINCIPAL OCCUPATION(S) DURING PAST 5 YEARS: Chairman, Western Investments,
Inc.; Retired Chairman of the Board, Butler Manufacturing Company
NUMBER OF PORTFOLIOS IN FUND COMPLEX OVERSEEN BY DIRECTOR: 66
OTHER DIRECTORSHIPS HELD BY DIRECTOR: None
- --------------------------------------------------------------------------------
GALE E. SAYERS, 4500 Main Street, Kansas City, MO 64111
YEAR OF BIRTH: 1943
POSITION(S) HELD WITH FUND: Director
FIRST YEAR OF SERVICE: 2000
PRINCIPAL OCCUPATION(S) DURING PAST 5 YEARS: President, Chief Executive Officer
and Founder, Sayers40, Inc., a technology products and service provider
NUMBER OF PORTFOLIOS IN FUND COMPLEX OVERSEEN BY DIRECTOR: 66
OTHER DIRECTORSHIPS HELD BY DIRECTOR: Director, Triad Hospitals, Inc.
- --------------------------------------------------------------------------------
M. JEANNINE STRANDJORD, 4500 Main Street, Kansas City, MO 64111
YEAR OF BIRTH: 1945
POSITION(S) HELD WITH FUND: Director
FIRST YEAR OF SERVICE: 1994
PRINCIPAL OCCUPATION(S) DURING PAST 5 YEARS: Retired, formerly Senior Vice
President, Sprint Corporation
NUMBER OF PORTFOLIOS IN FUND COMPLEX OVERSEEN BY DIRECTOR: 66
OTHER DIRECTORSHIPS HELD BY DIRECTOR: Director, DST Systems, Inc.; Director,
Euronet Worldwide, Inc.
- --------------------------------------------------------------------------------
TIMOTHY S. WEBSTER, 4500 Main Street, Kansas City, MO 64111
YEAR OF BIRTH: 1961
POSITION(S) HELD WITH FUND: Director
FIRST YEAR OF SERVICE: 2001
PRINCIPAL OCCUPATION(S) DURING PAST 5 YEARS: President and Chief Executive
Officer, American Italian Pasta Company (1992 to December 2005)
NUMBER OF PORTFOLIOS IN FUND COMPLEX OVERSEEN BY DIRECTOR: 66
OTHER DIRECTORSHIPS HELD BY DIRECTOR: None
- --------------------------------------------------------------------------------
INTERESTED DIRECTORS
- --------------------------------------------------------------------------------
JAMES E. STOWERS, JR.(1), 4500 Main Street, Kansas City, MO 64111
YEAR OF BIRTH: 1924
POSITION(S) HELD WITH FUND: Director, Co-Vice Chairman
FIRST YEAR OF SERVICE: 1958
PRINCIPAL OCCUPATION(S) DURING PAST 5 YEARS: Founder, Director and Controlling
Shareholder, ACC; Chairman, ACC (January 1995 to December 2004); Director, ACIM,
ACGIM, ACS, ACIS and other ACC subsidiaries
NUMBER OF PORTFOLIOS IN FUND COMPLEX OVERSEEN BY DIRECTOR: 66
OTHER DIRECTORSHIPS HELD BY DIRECTOR: None
- --------------------------------------------------------------------------------
JAMES E. STOWERS III(1), 4500 Main Street, Kansas City, MO 64111
YEAR OF BIRTH: 1959
POSITION(S) HELD WITH FUND: Director, Co-Vice Chairman
FIRST YEAR OF SERVICE: 1990
PRINCIPAL OCCUPATION(S) DURING PAST 5 YEARS: Chairman, ACC (January 2005 to
present); Co-Chairman, ACC (September 2000 to December 2004); Chairman, ACS and
other ACC subsidiaries (April 2005 to September 2006); Director, ACC, ACIM,
ACGIM, ACS, ACIS and other ACC subsidiaries
NUMBER OF PORTFOLIOS IN FUND COMPLEX OVERSEEN BY DIRECTOR: 66
OTHER DIRECTORSHIPS HELD BY DIRECTOR: None
- --------------------------------------------------------------------------------
(1) James E. Stowers, Jr. is the father of James E. Stowers III.
(continued)
- ------
45
Management
- --------------------------------------------------------------------------------
OFFICERS
- --------------------------------------------------------------------------------
WILLIAM M. LYONS, 4500 Main Street, Kansas City, MO 64111
YEAR OF BIRTH: 1955
POSITION(S) HELD WITH FUND: President
FIRST YEAR OF SERVICE: 2000
PRINCIPAL OCCUPATION(S) DURING PAST 5 YEARS: Chief Executive Officer, ACC
(September 2000 to present); President, ACC (June 1997 to present); Also serves
as: Chairman, ACIM, ACGIM, ACS, ACIS and other ACC subsidiaries; Chief Executive
Officer, ACIM, ACGIM, ACIS, and other ACC subsidiaries (October 2000 to October
2006); President, ACIM, ACGIM and other ACC subsidiaries (September 2002 to
September 2006); Executive Vice President, ACS (January 2005 to September 2006);
Director, ACC, ACIM, ACGIM, ACS, ACIS and other ACC subsidiaries
- --------------------------------------------------------------------------------
JONATHAN THOMAS, 4500 Main Street, Kansas City, MO 64111
YEAR OF BIRTH: 1963
POSITION(S) HELD WITH FUND: Executive Vice President
FIRST YEAR OF SERVICE: 2005
PRINCIPAL OCCUPATION(S) DURING PAST 5 YEARS: Chief Administrative Officer, ACC
(February 2006 to present); Executive Vice President, ACC (November 2005 to
present); Also serves as: President and Chief Executive Officer, ACS; Chief
Financial Officer and Chief Accounting Officer, ACIM, ACGIM, ACS, ACIS and other
ACC subsidiaries; Managing Director, Morgan Stanley (March 2000 to November
2005)
- --------------------------------------------------------------------------------
MARYANNE ROEPKE, 4500 Main Street, Kansas City, MO 64111
YEAR OF BIRTH: 1956
POSITION(S) HELD WITH FUND: Chief Compliance Officer and Senior Vice President
FIRST YEAR OF SERVICE: 2000
PRINCIPAL OCCUPATION(S) DURING PAST 5 YEARS: Chief Compliance Officer, ACIM,
ACGIM and ACS (August 2006 to present); Assistant Treasurer, ACC (January 1995
to August 2006); Treasurer and Chief Financial Officer, various American Century
funds (July 2000 to August 2006); Also serves as: Senior Vice President, ACS
- --------------------------------------------------------------------------------
DAVID C. TUCKER, 4500 Main Street, Kansas City, MO 64111
YEAR OF BIRTH: 1958
POSITION(S) HELD WITH FUND: Senior Vice President and General Counsel
FIRST YEAR OF SERVICE: 2000
PRINCIPAL OCCUPATION(S) DURING PAST 5 YEARS: Vice President, ACC (February 2001
to present); General Counsel, ACC (June 1998 to present); Also serves as: Senior
Vice President and General Counsel, ACIM, ACGIM, ACS, ACIS and other ACC
subsidiaries
- --------------------------------------------------------------------------------
ROBERT LEACH, 4500 Main Street, Kansas City, MO 64111
YEAR OF BIRTH: 1966
POSITION(S) HELD WITH FUND: Vice President, Treasurer and Chief Financial
Officer
FIRST YEAR OF SERVICE: 1997
PRINCIPAL OCCUPATION(S) DURING PAST 5 YEARS: Vice President, ACS (February 2000
to present); Controller, various American Century funds (June 1997 to September
2006)
- --------------------------------------------------------------------------------
C. JEAN WADE, 4500 Main Street, Kansas City, MO 64111
YEAR OF BIRTH: 1964
POSITION(S) HELD WITH FUNDS: Controller
FIRST YEAR OF SERVICE: 2006
PRINCIPAL OCCUPATION(S) DURING PAST 5 YEARS: Vice President, ACS (February 2000
to present)
- --------------------------------------------------------------------------------
JON ZINDEL, 4500 Main Street, Kansas City, MO 64111
YEAR OF BIRTH: 1967
POSITION(S) HELD WITH FUND: Tax Officer
FIRST YEAR OF SERVICE: 1997
PRINCIPAL OCCUPATION(S) DURING PAST 5 YEARS: Senior Vice President, ACC (August
2006 to present); Vice President, ACC and certain ACC subsidiaries (October 2001
to August 2006); Vice President, Corporate Tax, ACS (April 1998 to August 2006);
Also serves as: Senior Vice President, ACIM, ACGIM, ACS, ACIS and other ACC
subsidiaries
- --------------------------------------------------------------------------------
The SAI has additional information about the funds' directors and is available
without charge, upon request, by calling 1-800-345-2021.
- ------
46
Share Class Information
Six classes of shares are authorized for sale by the funds: Investor Class,
Institutional Class, A Class, B Class, C Class and R Class. The total expense
ratio of Institutional Class shares is lower than that of Investor Class shares.
The total expense ratios of A Class, B Class, C Class and R Class shares are
higher than that of Investor Class shares. The funds are available for purchase
only through financial intermediaries by investors who seek advice from them.
The funds are closed to other investors, but those with open accounts may make
additional investments and reinvest dividends and capital gains distributions as
long as such accounts remain open.
INVESTOR CLASS shares are available for purchase in two ways: 1) directly from
American Century without any commissions or other fees; or 2) through certain
financial intermediaries (such as banks, broker-dealers, insurance companies and
investment advisors), which may require payment of a transaction fee to the
financial intermediary.
INSTITUTIONAL CLASS shares are available to large investors such as endowments,
foundations, and retirement plans, and to financial intermediaries serving these
investors. This class recognizes the relatively lower cost of serving
institutional customers and others who invest at least $5 million ($3 million
for endowments and foundations) in an American Century fund or at least $10
million in multiple funds. In recognition of the larger investments and account
balances and comparatively lower transaction costs, the unified management fee
of Institutional Class shares is 0.20% less than the unified management fee of
Investor Class shares.
A CLASS shares are sold primarily through employer-sponsored retirement plans
and through institutions such as investment advisors, banks, broker-dealers, and
insurance companies. A Class shares are sold at their offering price, which is
net asset value plus an initial sales charge that ranges from 5.75% to 0.00% for
equity funds, depending on the amount invested. The initial sales charge is
deducted from the purchase amount before it is invested. A Class shares may be
subject to a contingent deferred sales charge (CDSC). There is no CDSC on shares
acquired through reinvestment of dividends or capital gains. The prospectus
contains information regarding reductions and waivers of sales charges for A
Class shares. The unified management fee for A Class shares is the same as for
Investor Class shares. A Class shares also are subject to a 0.25% annual Rule
12b-1 distribution and service fee.
B CLASS shares are sold primarily through employer-sponsored retirement plans
and through institutions such as investment advisors, banks, broker-dealers, and
insurance companies. B Class shares redeemed within six years of purchase are
subject to a CDSC that declines from 5.00% during the first year after purchase
to 0.00% after the sixth year. There is no CDSC on shares acquired through
reinvestment of dividends or capital gains. The unified management fee for B
Class shares is the same as for Investor Class shares. B Class shares also are
subject to a 1.00% annual Rule 12b-1 distribution and service fee. B Class
shares automatically convert to A Class shares (with lower expenses) eight years
after their purchase date.
(continued)
- ------
47
Share Class Information
C CLASS shares are sold primarily through employer-sponsored retirement plans
and through institutions such as investment advisors, banks, broker-dealers, and
insurance companies. C Class shares redeemed within 12 months of purchase are
subject to a CDSC of 1.00%. There is no CDSC on shares acquired through
reinvestment of dividends or capital gains. The unified management fee for C
Class shares is the same as for Investor Class shares. C Class shares also are
subject to a Rule 12b-1 distribution and service fee of 1.00%.
R CLASS shares are sold primarily through employer-sponsored retirement plans
and through institutions such as investment advisors, banks, broker-dealers, and
insurance companies. The unified management fee for R Class shares is the same
as for Investor Class shares. R Class shares are subject to a 0.50% annual Rule
12b-1 distribution and service fee.
All classes of shares represent a pro rata interest in the funds and generally
have the same rights and preferences.
- ------
48
Additional Information
RETIREMENT ACCOUNT INFORMATION
As required by law, any distributions you receive from an IRA or certain 403(b),
457 and qualified plans [those not eligible for rollover to an IRA or to another
qualified plan] are subject to federal income tax withholding, unless you elect
not to have withholding apply. Tax will be withheld on the total amount
withdrawn even though you may be receiving amounts that are not subject to
withholding, such as nondeductible contributions. In such case, excess amounts
of withholding could occur. You may adjust your withholding election so that a
greater or lesser amount will be withheld.
If you don't want us to withhold on this amount, you must notify us to not
withhold the federal income tax. Even if you plan to roll over the amount you
withdraw to another tax-deferred account, the withholding rate still applies to
the withdrawn amount unless we have received notice not to withhold federal
income tax prior to the withdrawal. You may notify us in writing or in certain
situations by telephone or through other electronic means. You have the right to
revoke your withholding election at any time and any election you make may
remain in effect until revoked by filing a new election.
Remember, even if you elect not to have income tax withheld, you are liable for
paying income tax on the taxable portion of your withdrawal. If you elect not to
have income tax withheld or you don't have enough income tax withheld, you may
be responsible for payment of estimated tax. You may incur penalties under the
estimated tax rules if your withholding and estimated tax payments are not
sufficient.
State tax will be withheld if, at the time of your distribution, your address is
within one of the mandatory withholding states and you have federal income tax
withheld. State taxes will be withheld from your distribution in accordance with
the respective state rules.
PROXY VOTING GUIDELINES
American Century Investment Management, Inc., the funds' investment advisor, is
responsible for exercising the voting rights associated with the securities
purchased and/or held by the funds. A description of the policies and procedures
the advisor uses in fulfilling this responsibility is available without charge,
upon request, by calling 1-800-345-2021. It is also available on American
Century's website at americancentury.com and on the Securities and Exchange
Commission's website at sec.gov. Information regarding how the investment
advisor voted proxies relating to portfolio securities during the most recent
12-month period ended June 30 is available on the "About Us" page at
americancentury.com. It is also available at sec.gov.
QUARTERLY PORTFOLIO DISCLOSURE
The funds file their complete schedule of portfolio holdings with the Securities
and Exchange Commission (SEC) for the first and third quarters of each fiscal
year on Form N-Q. The funds' Forms N-Q are available on the SEC's website at
sec.gov, and may be reviewed and copied at the SEC's Public Reference Room in
Washington, DC. Information on the operation of the Public Reference Room may be
obtained by calling 1-800-SEC-0330. The funds also make their complete schedule
of portfolio holdings for the most recent quarter of their fiscal year available
on their website at americancentury.com and, upon request, by calling
1-800-345-2021.
- ------
49
Index Definitions
The following indices are used to illustrate investment market, sector, or style
performance or to serve as fund performance comparisons. They are not investment
products available for purchase.
The RUSSELL 1000(reg.tm) INDEX is a market-capitalization weighted, large-cap
index created by Frank Russell Company to measure the performance of the 1,000
largest companies in the Russell 3000 Index (the 3,000 largest publicly traded
U.S. companies, based on total market capitalization).
The RUSSELL 1000(reg.tm) GROWTH INDEX measures the performance of those Russell
1000 Index companies (the 1,000 largest of the 3,000 largest publicly traded
U.S. companies, based on total market capitalization) with higher price-to-book
ratios and higher forecasted growth rates.
The RUSSELL 1000(reg.tm) VALUE INDEX measures the performance of those Russell
1000 Index companies (the 1,000 largest of the 3,000 largest publicly traded
U.S. companies, based on total market capitalization) with lower price-to-book
ratios and lower forecasted growth rates.
The RUSSELL 2000(reg.tm) INDEX is a market-capitalization weighted index created
by Frank Russell Company to measure the performance of the 2,000 smallest of the
3,000 largest publicly traded U.S. companies, based on total market
capitalization.
The RUSSELL 2000(reg.tm) GROWTH INDEX measures the performance of those Russell
2000 Index companies (the 2,000 smallest of the 3,000 largest publicly traded
U.S. companies, based on total market capitalization) with higher price-to-book
ratios and higher forecasted growth rates.
The RUSSELL 2000(reg.tm) VALUE INDEX measures the performance of those Russell
2000 Index companies (the 2,000 smallest of the 3,000 largest publicly traded
U.S. companies, based on total market capitalization) with lower price-to-book
ratios and lower forecasted growth rates.
The RUSSELL MIDCAP(reg.tm) INDEX measures the performance of the 800 smallest of
the 1,000 largest publicly traded U.S. companies, based on total market
capitalization.
The RUSSELL MIDCAP(reg.tm) GROWTH INDEX measures the performance of those
Russell Midcap Index companies (the 800 smallest of the 1,000 largest publicly
traded U.S. companies, based on total market capitalization) with higher
price-to-book ratios and higher forecasted growth values.
The RUSSELL MIDCAP(reg.tm) VALUE INDEX measures the performance of those Russell
Midcap companies with lower price-to-book ratios and lower forecasted growth
values.
The S&P 500 INDEX is a market value-weighted index of the stocks of 500 publicly
traded U.S. companies chosen for market size, liquidity, and industry group
representation that are considered to be leading firms in dominant industries.
Each stock's weight in the index is proportionate to its market value. Created
by Standard & Poor's, it is considered to be a broad measure of U.S. stock
market performance.
The S&P MIDCAP 400 INDEX, a capitalization-weighted index consisting of 400
domestic stocks, measures the performance of the mid-size company segment of the
U.S. market.
The S&P SMALLCAP 600 INDEX, a capitalization-weighted index consisting of 600
domestic stocks, measures the small company segment of the U.S. market.
- ------
50
Notes
- ------
51
Notes
- ------
52
CONTACT US
AMERICANCENTURY.COM
AUTOMATED INFORMATION LINE:
1-800-345-8765
INVESTOR SERVICES REPRESENTATIVE:
1-800-345-2021 or 816-531-5575
INVESTORS USING ADVISORS:
1-800-378-9878
BUSINESS, NOT-FOR-PROFIT,
EMPLOYER-SPONSORED RETIREMENT PLANS:
1-800-345-3533
BANKS AND TRUST COMPANIES, BROKER-DEALERS,
FINANCIAL PROFESSIONALS, INSURANCE COMPANIES:
1-800-345-6488
TELECOMMUNICATIONS DEVICE FOR THE DEAF:
1-800-634-4113 or 816-444-3485
AMERICAN CENTURY MUTUAL FUNDS, INC.
INVESTMENT ADVISOR:
American Century Investment Management, Inc.
Kansas City, Missouri
THIS REPORT AND THE STATEMENTS IT CONTAINS ARE SUBMITTED FOR THE GENERAL
INFORMATION OF OUR SHAREHOLDERS. THE REPORT IS NOT AUTHORIZED FOR DISTRIBUTION
TO PROSPECTIVE INVESTORS UNLESS PRECEDED OR ACCOMPANIED BY AN EFFECTIVE
PROSPECTUS.
The American Century Investments logo, American Century
and American Century Investments are service marks
of American Century Proprietary Holdings, Inc.
American Century Investment Services, Inc., Distributor
(c)2006 American Century Proprietary Holdings, Inc. All rights reserved.
0612
SH-ANN-52279N
[front cover]
American Century Investments
Annual Report
October 31, 2006
[photo of winter scene]
NT Growth Fund
NT Vista(reg.sm) Fund
[american century investments logo and text logo]
Our Message to You
[photo of James E. Stowers III and James E. Stowers, Jr.]
/s/James E. Stowers, Jr.
James E. Stowers, Jr.
FOUNDER
AMERICAN CENTURY COMPANIES, INC.
/s/James E. Stowers III
James E. Stowers III
CHAIRMAN OF THE BOARD
AMERICAN CENTURY COMPANIES, INC.
We are pleased to provide you with the annual report for the American Century NT
Growth and NT Vista funds from their inception, May 12, 2006, through October
31, 2006. We hope you find this information helpful in monitoring your
investment. Another useful resource we offer is our website,
americancentury.com, where we post quarterly portfolio commentaries, the views
of senior investment officers and analysts, and other communications about
investments, portfolio strategy, personal finance, and the markets.
In its most recent rankings, Dalbar -- which issues customer satisfaction
ratings and rankings based on website functionality -- ranked
americancentury.com seventh out of the sites provided by the top 25 fund
companies that it believes lead the industry in web-based technology. Our
website earned an "Excellent" rating, Dalbar's highest designation.
For most of 2006, our website has linked visitors to information explaining our
strategic collaboration with Lance Armstrong and the Lance Armstrong Foundation
(LAF). This campaign, featuring Lance, is designed to encourage investors to
take a more active role in planning their financial futures and make every
investment decision count. To learn more about the collaboration and the LAF,
please visit americancentury.com or www.lanceface.com on the Web and click on
the links to related sites.
With the approach of year end and the 2006 tax season, you can also find out
more about December fund distributions and tax information via a link from our
website. We've posted December distribution estimates for over 50 funds, answers
to frequent distribution questions, and online descriptions of all of the tax
information we provide to investors.
If you haven't visited americancentury.com yet, we encourage you to do so...it's
there to serve you. And so are we. As always, we deeply appreciate your
commitment to American Century Investments.
Table of Contents
Market Perspective. . . . . . . . . . . . . . . . . . . . . . . . . . . . . 2
Total Returns . . . . . . . . . . . . . . . . . . . . . . . . . . . . . 2
NT GROWTH
Performance . . . . . . . . . . . . . . . . . . . . . . . . . . . . . . . . 3
Portfolio Commentary. . . . . . . . . . . . . . . . . . . . . . . . . . . . 4
Top Ten Holdings . . . . . . . . . . . . . . . . . . . . . . . . . . . . 4
Top Five Industries . . . . . . . . . . . . . . . . . . . . . . . . . . 5
Types of Investments in Portfolio . . . . . . . . . . . . . . . . . . . 5
Schedule of Investments . . . . . . . . . . . . . . . . . . . . . . . . . . 6
NT VISTA
Performance . . . . . . . . . . . . . . . . . . . . . . . . . . . . . . . . 9
Portfolio Commentary. . . . . . . . . . . . . . . . . . . . . . . . . . . .10
Top Ten Holdings . . . . . . . . . . . . . . . . . . . . . . . . . . . .10
Top Five Industries . . . . . . . . . . . . . . . . . . . . . . . . . .11
Types of Investments in Portfolio . . . . . . . . . . . . . . . . . . .11
Schedule of Investments . . . . . . . . . . . . . . . . . . . . . . . . . .12
Shareholder Fee Examples. . . . . . . . . . . . . . . . . . . . . . . . . .15
FINANCIAL STATEMENTS
Statement of Assets and Liabilities . . . . . . . . . . . . . . . . . . . .17
Statement of Operations . . . . . . . . . . . . . . . . . . . . . . . . . .18
Statement of Changes in Net Assets. . . . . . . . . . . . . . . . . . . . .19
Notes to Financial Statements . . . . . . . . . . . . . . . . . . . . . . .20
Financial Highlights. . . . . . . . . . . . . . . . . . . . . . . . . . . .24
Report of Independent Registered Public Accounting Firm . . . . . . . . . .26
OTHER INFORMATION
Management. . . . . . . . . . . . . . . . . . . . . . . . . . . . . . . . .27
Additional Information. . . . . . . . . . . . . . . . . . . . . . . . . . .30
Index Definitions . . . . . . . . . . . . . . . . . . . . . . . . . . . . .31
The opinions expressed in the Market Perspective and each of the Portfolio
Commentaries reflect those of the portfolio management team as of the date of
the report, and do not necessarily represent the opinions of American Century or
any other person in the American Century organization. Any such opinions are
subject to change at any time based upon market or other conditions and American
Century disclaims any responsibility to update such opinions. These opinions may
not be relied upon as investment advice and, because investment decisions made
by American Century funds are based on numerous factors, may not be relied upon
as an indication of trading intent on behalf of any American Century fund.
Security examples are used for representational purposes only and are not
intended as recommendations to purchase or sell securities. Performance
information for comparative indices and securities is provided to American
Century by third party vendors. To the best of American Century's knowledge,
such information is accurate at the time of printing.
Market Perspective
[photo of Mark Mallon]
BY MARK MALLON, CHIEF INVESTMENT OFFICER, AMERICAN CENTURY INVESTMENTS
STOCKS RALLIED AS FED PAUSED
Cooling energy prices and a pause from the Federal Reserve enabled U.S. stocks
to post positive results in the period from May 12, 2006, through October 31,
2006.
The stock market rallied after enduring a difficult spring -- the S&P 500 Index
fell by more than 4% during the last three weeks of May after unexpectedly high
inflation figures led to concerns about rising interest rates. Stocks plodded
along through early summer, weighed down by uncertainties about inflation and
economic growth until the Federal Reserve chose to leave short-term interest
rates unchanged at its policy meeting in mid-August.
After 17 consecutive rate hikes over a two-year period, the Fed decided to stand
pat amid evidence of moderating economic growth and declining energy and
commodity prices. In response, the major stock indexes staged a rally that
persisted through the end of the period.
SIZE AND QUALITY MATTERED
Thanks to the stock market's late-summer rally, the broad equity indexes
advanced 5-7% during the period. However, the market's overall gains masked some
relatively narrow breadth. In an environment of slowing economic growth,
investors focused their attention on the stocks of larger, higher-quality
companies, such as those that make up the S&P 500. Mid- and small-cap stocks
lagged the performance of large-caps but still posted gains of 1-2%. Extending a
multi-year trend, value shares performed better than growth stocks across the
capitalization range.
SECTOR PERFORMANCE SHIFTED
Sector performance reflected the defensive, risk-averse posture of the market
during the summer. Investors seeking companies with more predictable earnings
and dividend payouts shifted money into utilities and telecommunication services
providers, as well as companies that make everyday consumer products. Meanwhile,
the market shifted away from the industrials and materials sectors,
economically-sensitive sectors that surged with the broader economy in early
2006 but suffered as economic growth slowed in the second and third quarters.
TOTAL RETURNS FROM MAY 12, 2006
(FUND INCEPTION) THROUGH OCTOBER 31, 2006(1)
- --------------------------------------------------------------------------------
S&P 500 Index 7.60%
- --------------------------------------------------------------------------------
Russell Midcap Index 3.84%
- --------------------------------------------------------------------------------
Russell 2000 Index 3.87%
- --------------------------------------------------------------------------------
(1) Total returns for periods less than one year are not annualized.
- ------
2
NT Growth - Performance
TOTAL RETURNS AS OF OCTOBER 31, 2006
- --------------------------------------------------------------------------------
SINCE INCEPTION
INCEPTION(1) DATE
- --------------------------------------------------------------------------------
INSTITUTIONAL CLASS 5.70% 5/12/06
- --------------------------------------------------------------------------------
RUSSELL 1000 GROWTH INDEX(2) 5.28% --
- --------------------------------------------------------------------------------
(1) Total returns for periods less than one year are not annualized.
(2) Data provided by Lipper Inc. -- A Reuters Company. (c) 2006 Reuters. All
rights reserved. Any copying, republication or redistribution of Lipper
content, including by caching, framing or similar means, is expressly
prohibited without the prior written consent of Lipper. Lipper shall not be
liable for any errors or delays in the content, or for any actions taken in
reliance thereon.
The data contained herein has been obtained from company reports, financial
reporting services, periodicals and other resources believed to be reliable.
Although carefully verified, data on compilations is not guaranteed by
Lipper and may be incomplete. No offer or solicitations to buy or sell any
of the securities herein is being made by Lipper.
Data presented reflect past performance. Past performance is no guarantee of
future results. Current performance may be higher or lower than the performance
shown. Investment return and principal value will fluctuate, and redemption
value may be more or less than original cost. To obtain performance data current
to the most recent month end, please call 1-800-345-2021 or visit
americancentury.com.
Data assumes reinvestment of dividends and capital gains, and none of the charts
reflect the deduction of taxes that a shareholder would pay on fund
distributions or the redemption of fund shares. Returns for the index are
provided for comparison. The fund's total returns include operating expenses
(such as transaction costs and management fees) that reduce returns, while the
total returns of the index do not.
- ------
3
NT Growth - Portfolio Commentary
PORTFOLIO MANAGERS: GREG WOODHAMS AND PRESCOTT LEGARD
PERFORMANCE SUMMARY
NT Growth returned 5.70%* from its May 12, 2006, inception to October 31, 2006,
outperforming the Russell 1000 Growth Index (see page 3).
This portfolio is one of nine new NT tracker funds available exclusively in
LIVESTRONG Portfolios from American Century Investments. NT is an acronym for
"No Tobacco." American Century Investments introduced LIVESTRONG Portfolios on
May 12, 2006, as part of a strategic collaboration with Lance Armstrong and the
Lance Armstrong Foundation (LAF).**
On an absolute basis, NT Growth received significant contributions to return
from the information technology, health care, consumer discretionary, and
financials sectors; energy, materials, and industrials were only slight
detractors. Relative to its benchmark, NT Growth's outperformance resulted
largely from effective stock selection across a wide range of sectors, led by
consumer discretionary, health care, and industrials, among others. The
portfolio's positioning detracted from performance in only two main
areas--consumer staples on the one hand, and utilities on the other, a tiny
segment (less than 1%) of the fund and index.
TOP CONTRIBUTORS
Stock selection added value in consumer discretionary shares, particularly among
specialty retail names such as Home Depot and Lowe's (underweights), as well as
Foot Locker, Payless Shoesource, and Gap (overweights). NT Growth's holdings in
this industry were up 10%, versus 2% for the index's specialty retail shares.
The portfolio's consumer discretionary holdings returned 11%, compared with 6%
for this segment of the index.
Some of the leading contributors in the consumer discretionary sector were Polo
Ralph Lauren and JC Penney. Polo announced better-than-expected earnings and
operating margin figures, as well as a share buyback plan. JC Penney continued
to benefit from a decision to close underperforming stores. The firm announced
better-than-expected same-store sales figures, as well as rapid growth in
Internet sales, and lifted its earnings guidance.
NT Growth benefited from good stock selection in health care, home to several of
the portfolio's leading contributors to relative results. Though NT Growth was
slightly underweight in this sector, the
TOP TEN HOLDINGS AS OF OCTOBER 31, 2006
- --------------------------------------------------------------------------------
% OF
NET ASSETS
AS OF
10/31/06
- --------------------------------------------------------------------------------
Bank of America Corp. 3.3%
- --------------------------------------------------------------------------------
Cisco Systems Inc. 3.0%
- --------------------------------------------------------------------------------
Intel Corp. 2.7%
- --------------------------------------------------------------------------------
PepsiCo, Inc. 2.7%
- --------------------------------------------------------------------------------
Oracle Corp. 2.6%
- --------------------------------------------------------------------------------
Google Inc. Cl A 2.6%
- --------------------------------------------------------------------------------
General Electric Co. 2.6%
- --------------------------------------------------------------------------------
Schering-Plough Corp. 2.5%
- --------------------------------------------------------------------------------
Emerson Electric Co. 2.5%
- --------------------------------------------------------------------------------
Wal-Mart Stores, Inc. 2.2%
- --------------------------------------------------------------------------------
*Total returns for periods less than one year are not annualized.
**American Century Investment Services, Inc., has entered into an
agreement with the LAF for rights to use the LIVESTRONG name.
LIVESTRONG is a trademark of the LAF. For more information about
the foundation, visit www.livestrong.org. (continued)
- ------
4
NT Growth - Portfolio Commentary
health care names in the portfolio were up 12% during the quarter, compared with
9% for those in the index. The leading contributor to both relative and absolute
performance in this space was Baxter International, which performed well thanks
to progress on an ongoing turnaround under new management.
Effective stock selection also helped NT Growth's relative return in
industrials, where we favored stocks of companies that typically perform better
late in economic cycles and that have less interest rate sensitivity, such as
capital goods and aerospace and defense firms. Continental Airlines was among
the portfolio's biggest contributors to both relative and absolute returns. The
company is experiencing good yield and traffic trends, and has a relatively
young, efficient fleet of planes.
Finally, our top contributor during the period was an overweight position in
Freescale Semiconductor, a spin-off from Motorola producing chips for a number
of wireless and industrial applications. Freescale performed well overall, and
received an additional boost near the end of the period after agreeing to be
acquired at a significant premium to its existing share price.
CONSUMER STAPLES DETRACTED
The portfolio's performance would have been even better relative to its
benchmark but for positioning among consumer staples shares. We were underweight
this sector, which was among the better-performing segments of the market during
the period. Disappointing stock selection also limited NT Growth's relative
return. In particular, positioning among food & staples retailing shares--the
leading consumer staples industry contributor to index returns--detracted from
relative performance.
PORTFOLIO OBJECTIVE & EXPECTATIONS
NT Growth seeks long-term capital appreciation. We pursue our objective by
continuing to remain fully invested in large companies that are exhibiting
sustainable improvement in their businesses. It is our belief that owning such
companies will generate outperformance over time versus the Russell 1000 Growth
Index.
TOP FIVE INDUSTRIES AS OF OCTOBER 31, 2006
- --------------------------------------------------------------------------------
% OF
NET ASSETS
AS OF
10/31/06
- --------------------------------------------------------------------------------
Pharmaceuticals 7.3%
- --------------------------------------------------------------------------------
Software 6.7%
- --------------------------------------------------------------------------------
Specialty Retail 5.3%
- --------------------------------------------------------------------------------
Diversified Financial Services 5.2%
- --------------------------------------------------------------------------------
Semiconductors &
Semiconductor Equipment 5.1%
- --------------------------------------------------------------------------------
TYPES OF INVESTMENTS IN PORTFOLIO
- --------------------------------------------------------------------------------
% OF
NET ASSETS
AS OF
10/31/06
- --------------------------------------------------------------------------------
Domestic Common Stocks 90.2%
- --------------------------------------------------------------------------------
Foreign Common Stocks* 9.2%
- --------------------------------------------------------------------------------
TOTAL COMMON STOCKS 99.4%
- --------------------------------------------------------------------------------
Temporary Cash Investments 1.4%
- --------------------------------------------------------------------------------
Other Assets and Liabilities (0.8)%
- --------------------------------------------------------------------------------
*Includes depositary shares, dual listed securities and foreign ordinary shares.
- ------
5
NT Growth - Schedule of Investments
OCTOBER 31, 2006
Shares Value
- --------------------------------------------------------------------------------
COMMON STOCKS -- 99.4%
AEROSPACE & DEFENSE -- 3.5%
- --------------------------------------------------------------------------------
12,200 Boeing Co. $ 974,292
- --------------------------------------------------------------------------------
17,000 United Technologies Corp. 1,117,240
- --------------------------------------------------------------------------------
2,091,532
- --------------------------------------------------------------------------------
AIRLINES -- 1.1%
- --------------------------------------------------------------------------------
17,500 Continental Airlines Inc.
Cl B(1) 645,400
- --------------------------------------------------------------------------------
BEVERAGES -- 3.1%
- --------------------------------------------------------------------------------
4,900 Anheuser-Busch
Companies, Inc. 232,358
- --------------------------------------------------------------------------------
24,700 PepsiCo, Inc. 1,566,968
- --------------------------------------------------------------------------------
1,799,326
- --------------------------------------------------------------------------------
BIOTECHNOLOGY -- 4.4%
- --------------------------------------------------------------------------------
16,100 Amgen Inc.(1) 1,222,151
- --------------------------------------------------------------------------------
6,600 Genentech, Inc.(1) 549,780
- --------------------------------------------------------------------------------
12,000 Gilead Sciences, Inc.(1) 826,800
- --------------------------------------------------------------------------------
2,598,731
- --------------------------------------------------------------------------------
CAPITAL MARKETS -- 2.4%
- --------------------------------------------------------------------------------
3,100 Bear Stearns
Companies Inc. (The) 469,185
- --------------------------------------------------------------------------------
5,100 Goldman Sachs
Group, Inc. (The) 967,929
- --------------------------------------------------------------------------------
1,437,114
- --------------------------------------------------------------------------------
CHEMICALS -- 0.3%
- --------------------------------------------------------------------------------
3,900 Monsanto Co. 172,458
- --------------------------------------------------------------------------------
COMMERCIAL BANKS -- 1.6%
- --------------------------------------------------------------------------------
4,700 SunTrust Banks, Inc. 371,253
- --------------------------------------------------------------------------------
15,300 Wells Fargo & Co. 555,237
- --------------------------------------------------------------------------------
926,490
- --------------------------------------------------------------------------------
COMMUNICATIONS EQUIPMENT -- 4.9%
- --------------------------------------------------------------------------------
73,100 Cisco Systems Inc.(1) 1,763,903
- --------------------------------------------------------------------------------
50,000 Motorola, Inc. 1,153,000
- --------------------------------------------------------------------------------
2,916,903
- --------------------------------------------------------------------------------
COMPUTERS & PERIPHERALS -- 3.8%
- --------------------------------------------------------------------------------
7,600 Apple Computer, Inc.(1) 616,208
- --------------------------------------------------------------------------------
29,400 Hewlett-Packard Co. 1,138,956
- --------------------------------------------------------------------------------
13,600 Network Appliance, Inc.(1) 496,400
- --------------------------------------------------------------------------------
2,251,564
- --------------------------------------------------------------------------------
DIVERSIFIED -- 0.5%
- --------------------------------------------------------------------------------
5,600 iShares Russell 1000 Growth
Index Fund 302,344
- --------------------------------------------------------------------------------
DIVERSIFIED FINANCIAL SERVICES -- 5.2%
- --------------------------------------------------------------------------------
35,700 Bank of America Corp. 1,923,159
- --------------------------------------------------------------------------------
24,300 JPMorgan Chase & Co. 1,152,792
- --------------------------------------------------------------------------------
3,075,951
- --------------------------------------------------------------------------------
Shares Value
- --------------------------------------------------------------------------------
DIVERSIFIED TELECOMMUNICATION SERVICES -- 1.5%
- --------------------------------------------------------------------------------
26,000 AT&T Inc. $ 890,500
- --------------------------------------------------------------------------------
ELECTRICAL EQUIPMENT -- 4.9%
- --------------------------------------------------------------------------------
10,400 Cooper Industries, Ltd. Cl A 930,280
- --------------------------------------------------------------------------------
17,200 Emerson Electric Co. 1,451,680
- --------------------------------------------------------------------------------
10,900 Roper Industries Inc. 521,565
- --------------------------------------------------------------------------------
2,903,525
- --------------------------------------------------------------------------------
ELECTRONIC EQUIPMENT &
INSTRUMENTS -- 0.4%
- --------------------------------------------------------------------------------
7,400 Tektronix, Inc. 224,738
- --------------------------------------------------------------------------------
ENERGY EQUIPMENT & SERVICES -- 2.0%
- --------------------------------------------------------------------------------
6,500 Cameron International Corp.(1) 325,650
- --------------------------------------------------------------------------------
13,500 Schlumberger Ltd. 851,580
- --------------------------------------------------------------------------------
1,177,230
- --------------------------------------------------------------------------------
FOOD & STAPLES RETAILING -- 2.2%
- --------------------------------------------------------------------------------
26,700 Wal-Mart Stores, Inc. 1,315,776
- --------------------------------------------------------------------------------
HEALTH CARE EQUIPMENT &
SUPPLIES -- 4.1%
- --------------------------------------------------------------------------------
2,300 Alcon Inc. 243,984
- --------------------------------------------------------------------------------
13,000 Baxter International, Inc. 597,610
- --------------------------------------------------------------------------------
16,500 Becton Dickinson & Co. 1,155,495
- --------------------------------------------------------------------------------
4,200 Cytyc Corp.(1) 110,964
- --------------------------------------------------------------------------------
3,700 DJO Inc.(1) 148,851
- --------------------------------------------------------------------------------
3,100 Edwards Lifesciences
Corporation(1) 133,083
- --------------------------------------------------------------------------------
200 Idexx Laboratories, Inc.(1) 16,642
- --------------------------------------------------------------------------------
2,406,629
- --------------------------------------------------------------------------------
HEALTH CARE PROVIDERS &
SERVICES -- 1.2%
- --------------------------------------------------------------------------------
5,400 Caremark Rx Inc. 265,842
- --------------------------------------------------------------------------------
5,300 Laboratory Corp.
of America Holdings(1) 362,997
- --------------------------------------------------------------------------------
2,700 VCA Antech Inc.(1) 87,399
- --------------------------------------------------------------------------------
716,238
- --------------------------------------------------------------------------------
HOTELS, RESTAURANTS & LEISURE -- 3.7%
- --------------------------------------------------------------------------------
11,100 Brinker International, Inc. 515,373
- --------------------------------------------------------------------------------
6,142 Chipotle Mexican Grill Inc.
Cl B(1) 358,693
- --------------------------------------------------------------------------------
5,700 Darden Restaurants, Inc. 238,830
- --------------------------------------------------------------------------------
13,400 Hilton Hotels Corporation 387,528
- --------------------------------------------------------------------------------
17,400 Starbucks Corporation(1) 656,850
- --------------------------------------------------------------------------------
2,157,274
- --------------------------------------------------------------------------------
HOUSEHOLD DURABLES -- 2.0%
- --------------------------------------------------------------------------------
6,000 Mohawk Industries Inc.(1) 436,200
- --------------------------------------------------------------------------------
26,300 Newell Rubbermaid Inc. 756,914
- --------------------------------------------------------------------------------
1,193,114
- --------------------------------------------------------------------------------
See Notes to Financial Statements. (continued)
- ------
6
NT Growth - Schedule of Investments
OCTOBER 31, 2006
Shares Value
- --------------------------------------------------------------------------------
INDEPENDENT POWER PRODUCERS &
ENERGY TRADERS -- 0.7%
- --------------------------------------------------------------------------------
6,200 TXU Corp. $ 391,406
- --------------------------------------------------------------------------------
INDUSTRIAL CONGLOMERATES -- 4.6%
- --------------------------------------------------------------------------------
43,100 General Electric Co. 1,513,241
- --------------------------------------------------------------------------------
13,500 Textron Inc. 1,227,555
- --------------------------------------------------------------------------------
2,740,796
- --------------------------------------------------------------------------------
INSURANCE -- 2.0%
- --------------------------------------------------------------------------------
2,700 Endurance Specialty Holdings Ltd. 96,255
- --------------------------------------------------------------------------------
2,800 PartnerRe Ltd. 195,776
- --------------------------------------------------------------------------------
17,200 St. Paul Travelers
Companies, Inc. (The) 879,436
- --------------------------------------------------------------------------------
1,171,467
- --------------------------------------------------------------------------------
INTERNET SOFTWARE & SERVICES -- 2.6%
- --------------------------------------------------------------------------------
3,200 Google Inc. Cl A(1) 1,524,448
- --------------------------------------------------------------------------------
IT SERVICES -- 4.5%
- --------------------------------------------------------------------------------
13,500 Accenture Ltd. Cl A 444,285
- --------------------------------------------------------------------------------
12,300 International Business
Machines Corp. 1,135,659
- --------------------------------------------------------------------------------
48,200 Western Union Co. (The)(1) 1,062,810
- --------------------------------------------------------------------------------
2,642,754
- --------------------------------------------------------------------------------
MACHINERY -- 0.4%
- --------------------------------------------------------------------------------
2,600 Deere & Co. 221,338
- --------------------------------------------------------------------------------
MEDIA -- 0.8%
- --------------------------------------------------------------------------------
8,200 Lamar Advertising Co. Cl A(1) 472,976
- --------------------------------------------------------------------------------
METALS & MINING -- 1.9%
- --------------------------------------------------------------------------------
10,800 Allegheny Technologies Inc. 850,284
- --------------------------------------------------------------------------------
2,500 Carpenter Technology 267,475
- --------------------------------------------------------------------------------
1,117,759
- --------------------------------------------------------------------------------
MULTILINE RETAIL -- 1.5%
- --------------------------------------------------------------------------------
6,200 J.C. Penney Co. Inc. 466,426
- --------------------------------------------------------------------------------
7,200 Target Corp. 426,096
- --------------------------------------------------------------------------------
892,522
- --------------------------------------------------------------------------------
OIL, GAS & CONSUMABLE FUELS -- 1.6%
- --------------------------------------------------------------------------------
1,500 Apache Corp. 97,980
- --------------------------------------------------------------------------------
17,600 Occidental Petroleum Corp. 826,144
- --------------------------------------------------------------------------------
924,124
- --------------------------------------------------------------------------------
PERSONAL PRODUCTS -- 0.2%
- --------------------------------------------------------------------------------
4,668 Bare Escentuals Inc.(1) 142,981
- --------------------------------------------------------------------------------
PHARMACEUTICALS -- 7.3%
- --------------------------------------------------------------------------------
2,500 Allergan, Inc. 288,750
- --------------------------------------------------------------------------------
14,300 Novartis AG ORD 868,409
- --------------------------------------------------------------------------------
5,700 Novo Nordisk AS Cl B ORD 430,539
- --------------------------------------------------------------------------------
4,900 Roche Holding AG ORD 858,017
- --------------------------------------------------------------------------------
67,400 Schering-Plough Corp. 1,492,236
- --------------------------------------------------------------------------------
11,900 Teva Pharmaceutical
Industries Ltd. ADR 392,343
- --------------------------------------------------------------------------------
4,330,294
- --------------------------------------------------------------------------------
Shares Value
- --------------------------------------------------------------------------------
SEMICONDUCTORS &
SEMICONDUCTOR EQUIPMENT -- 5.1%
- --------------------------------------------------------------------------------
10,400 Broadcom Corp. Cl A(1) $ 314,808
- --------------------------------------------------------------------------------
75,700 Intel Corp. 1,615,438
- --------------------------------------------------------------------------------
28,900 STMicroelectronics N.V.
New York Shares 501,704
- --------------------------------------------------------------------------------
18,600 Texas Instruments Inc. 561,348
- --------------------------------------------------------------------------------
2,993,298
- --------------------------------------------------------------------------------
SOFTWARE -- 6.7%
- --------------------------------------------------------------------------------
35,600 BEA Systems Inc.(1) 579,212
- --------------------------------------------------------------------------------
8,700 Business Objects SA ADR(1) 322,248
- --------------------------------------------------------------------------------
5,500 Cognos, Inc.(1) 200,640
- --------------------------------------------------------------------------------
7,200 Electronic Arts Inc.(1) 380,808
- --------------------------------------------------------------------------------
15,100 Microsoft Corporation 433,521
- --------------------------------------------------------------------------------
84,100 Oracle Corp.(1) 1,553,327
- --------------------------------------------------------------------------------
24,200 Symantec Corp.(1) 480,128
- --------------------------------------------------------------------------------
3,949,884
- --------------------------------------------------------------------------------
SPECIALTY RETAIL -- 5.3%
- --------------------------------------------------------------------------------
7,500 Abercrombie & Fitch Co. 574,875
- --------------------------------------------------------------------------------
22,700 Gap, Inc. (The) 477,154
- --------------------------------------------------------------------------------
19,200 Lowe's Companies, Inc. 578,688
- --------------------------------------------------------------------------------
20,400 Office Depot, Inc.(1) 856,596
- --------------------------------------------------------------------------------
22,700 TJX Companies, Inc. (The) 657,165
- --------------------------------------------------------------------------------
3,144,478
- --------------------------------------------------------------------------------
TEXTILES, APPAREL & LUXURY GOODS -- 0.9%
- --------------------------------------------------------------------------------
7,300 Polo Ralph Lauren Corp. 518,300
- --------------------------------------------------------------------------------
WIRELESS TELECOMMUNICATION
SERVICES -- 0.5%
- --------------------------------------------------------------------------------
7,800 American Tower Corp. Cl A(1) 280,956
- --------------------------------------------------------------------------------
TOTAL COMMON STOCKS
(Cost $54,355,191) 58,662,618
- --------------------------------------------------------------------------------
TEMPORARY CASH INVESTMENTS -- 1.4%
Repurchase Agreement, Morgan Stanley
Group, Inc., (collateralized by various
U.S. Treasury obligations, 6.375% - 8.125%,
11/15/16 - 8/15/27, valued at $819,941),
in a joint trading account at 5.23%,
dated 10/31/06, due 11/1/06
(Delivery value $800,116)
(Cost $800,000) 800,000
- --------------------------------------------------------------------------------
TOTAL INVESTMENT SECURITIES -- 100.8%
(Cost $55,155,191) 59,462,618
- --------------------------------------------------------------------------------
OTHER ASSETS AND LIABILITIES -- (0.8)% (479,940)
- --------------------------------------------------------------------------------
TOTAL NET ASSETS -- 100.0% $ 58,982,678
================================================================================
See Notes to Financial Statements. (continued)
- ------
7
NT Growth - Schedule of Investments
OCTOBER 31, 2006
FORWARD FOREIGN CURRENCY EXCHANGE CONTRACTS
Contracts to Sell Settlement Date Value Unrealized Gain (Loss)
- --------------------------------------------------------------------------------
1,282,245 CHF for USD 11/30/06 $1,034,427 $(4,920)
- --------------------------------------------------------------------------------
1,494,540 DKK for USD 11/30/06 256,367 (943)
- --------------------------------------------------------------------------------
$1,290,794 $(5,863)
=====================================
(Value on Settlement Date $1,284,931)
NOTES TO SCHEDULE OF INVESTMENTS
ADR = American Depositary Receipt
CHF = Swiss Franc
DKK = Danish Krone
ORD = Foreign Ordinary Share
USD = United States Dollar
(1) Non-income producing.
See Notes to Financial Statements.
- ------
8
NT Vista - Performance
TOTAL RETURNS AS OF OCTOBER 31, 2006
- --------------------------------------------------------------------------------
SINCE INCEPTION
INCEPTION(1) DATE
- --------------------------------------------------------------------------------
INSTITUTIONAL CLASS -10.00% 5/12/06
- --------------------------------------------------------------------------------
RUSSELL MIDCAP GROWTH INDEX(2) 0.79% --
- --------------------------------------------------------------------------------
(1) Total returns for periods less than one year are not annualized.
(2) Data provided by Lipper Inc. -- A Reuters Company. (c) 2006 Reuters. All
rights reserved. Any copying, republication or redistribution of Lipper
content, including by caching, framing or similar means, is expressly
prohibited without the prior written consent of Lipper. Lipper shall not be
liable for any errors or delays in the content, or for any actions taken in
reliance thereon.
The data contained herein has been obtained from company reports, financial
reporting services, periodicals and other resources believed to be reliable.
Although carefully verified, data on compilations is not guaranteed by
Lipper and may be incomplete. No offer or solicitations to buy or sell any
of the securities herein is being made by Lipper.
Data presented reflect past performance. Past performance is no guarantee of
future results. Current performance may be higher or lower than the performance
shown. Investment return and principal value will fluctuate, and redemption
value may be more or less than original cost. To obtain performance data current
to the most recent month end, please call 1-800-345-2021 or visit
americancentury.com.
Data assumes reinvestment of dividends and capital gains, and none of the charts
reflect the deduction of taxes that a shareholder would pay on fund
distributions or the redemption of fund shares. Returns for the index are
provided for comparison. The fund's total returns include operating expenses
(such as transaction costs and management fees) that reduce returns, while the
total returns of the index do not.
- ------
9
NT Vista - Portfolio Commentary
PORTFOLIO MANAGERS: GLENN FOGLE AND DAVID HOLLOND
PERFORMANCE SUMMARY
American Century NT Vista fell 10.00%* from its May 12, 2006, inception to
October 31, 2006. Its benchmark, the Russell Midcap Growth Index, returned 0.79%
in the same time period.
This portfolio is one of nine new NT tracker funds available exclusively in
LIVESTRONG Portfolios from American Century Investments. NT is an acronym for
"No Tobacco." American Century Investments introduced LIVESTRONG Portfolios on
May 12, 2006, as part of a strategic collaboration with Lance Armstrong and the
Lance Armstrong Foundation (LAF).**
NT Vista struggled on both an absolute and relative basis after the U.S. stock
market declined in May 2006. The broad market rebounded late in the reporting
period after the Federal Reserve paused its two-year, interest rate-hike
campaign in August. But the portfolio missed the rebound's gains. That's because
the market's favor swung toward consumer-oriented and technology stocks, and our
picks in those sectors did not perform well. Our underweight positions in
energy, health care and consumer discretionary further detracted from absolute
and relative performance.
SECURITY SELECTION REDUCED RETURNS
Several of the portfolio's leading detractors were stocks in the industrials and
materials sectors, which had performed well in early 2006. These stocks fit the
portfolio's focus on companies that appeared poised to benefit from a rebound in
capital spending.
Those companies included Titanium Metals, a maker of titanium materials used in
the aircraft industry. Its shares declined 27% in the reporting period after
surging 181% between Jan. 1, 2006, and the beginning of the reporting period.
Likewise, shares of TETRA Technologies, which caps old offshore wells and either
repairs or deconstructs broken offshore energy platforms, declined 8% in the
reporting period after rising 96% between the start of 2006 and the beginning of
the reporting period. It represented one of the portfolio's biggest overweight
positions.
Fitting its portfolio process of shedding investments that lose share-price
momentum, NT Vista reduced its stake in both companies, along with its overall
stakes in industrials and mate-
TOP TEN HOLDINGS AS OF OCTOBER 31, 2006
- --------------------------------------------------------------------------------
% OF
NET ASSETS
AS OF
10/31/06
- --------------------------------------------------------------------------------
NII Holdings, Inc. Cl B 6.0%
- --------------------------------------------------------------------------------
Thermo Electron Corp. 4.0%
- --------------------------------------------------------------------------------
America Movil SA de CV Series L ADR 3.4%
- --------------------------------------------------------------------------------
Alliance Data Systems Corp. 3.0%
- --------------------------------------------------------------------------------
Leap Wireless International, Inc. 2.9%
- --------------------------------------------------------------------------------
SBA Communications Corp. Cl A 2.8%
- --------------------------------------------------------------------------------
Precision Castparts Corp. 2.7%
- --------------------------------------------------------------------------------
BE Aerospace, Inc. 2.7%
- --------------------------------------------------------------------------------
American Tower Corp. Cl A 2.6%
- --------------------------------------------------------------------------------
Las Vegas Sands Corp. 2.6%
- --------------------------------------------------------------------------------
*Total returns for periods less than one year are not annualized.
**American Century Investment Services, Inc., has entered into
an agreement with the LAF for rights to use the LIVESTRONG name.
LIVESTRONG is a trademark of the LAF. For more information
about the foundation, visit www.livestrong.org. (continued)
- ------
10
NT Vista - Portfolio Commentary
rials. Similarly, NT Vista substantially reduced its stake in its worst
individual performer, MEMC Electronic Materials, which lost 20% of its value in
the reporting period after soaring 120% the previous six months.
Our health care sector return for the period also detracted from performance.
The portfolio's underperformance reflected an underweight stake in the
pharmaceutical industry, which recovered nicely after a sluggish start to 2006.
It also reflected an underweight stake in health care providers and services;
again, shares in that industry stabilized after a tough start to 2006.
TELECOM PROVIDED POSITIVE CONTRIBUTIONS
Telecommunications was the only sector that boosted NT Vista's relative
performance. The portfolio's entire stake in the sector centered on the wireless
industry, including positions in two cellular providers, NII Holdings and
America Movil SA de CV, focused on the Latin American market. Both stocks ranked
among the portfolio's top five positions in the period, and they also ranked
among its 10 leading individual contributors on both a relative- and
total-return basis.
Thermo Electron Corp. topped the portfolio's list of leading individual
contributors. Shares in this manufacturer of analytical instruments for medical
and other research applications, which announced plans to merge with Fisher
Scientific, rose steadily during the period. The portfolio steadily raised its
stake in the company as its value increased.
PORTFOLIO OBJECTIVE & EXPECTATIONS
NT Vista adheres to an investment process that identifies mid-sized and smaller
companies with accelerating earnings and revenue. Ultimately, we believe this
selection strategy will produce solid, long-term gains for investors. It's
difficult to gauge long-term performance based on short-term returns, such as
those from this reporting period, which can be extremely volatile.
We think the portfolio will perform well in a consistent, directional market,
and we're encouraged by the market's behavior since the Fed paused its
interest-rate hike campaign in August. Growth stocks traditionally have
performed well after the Fed stops raising rates, and we believe our process
works well in such an environment.
TOP FIVE INDUSTRIES AS OF OCTOBER 31, 2006
- --------------------------------------------------------------------------------
% OF
NET ASSETS
AS OF
10/31/06
- --------------------------------------------------------------------------------
Wireless Telecommunication Services 19.3%
- --------------------------------------------------------------------------------
Life Science Tools & Services 6.7%
- --------------------------------------------------------------------------------
Specialty Retail 6.2%
- --------------------------------------------------------------------------------
Software 5.5%
- --------------------------------------------------------------------------------
Aerospace & Defense 5.4%
- --------------------------------------------------------------------------------
TYPES OF INVESTMENTS IN PORTFOLIO
- --------------------------------------------------------------------------------
% OF
NET ASSETS
AS OF
10/31/06
- --------------------------------------------------------------------------------
Domestic Common Stocks 82.1%
- --------------------------------------------------------------------------------
Foreign Common Stocks* 13.5%
- --------------------------------------------------------------------------------
TOTAL COMMON STOCKS 95.6%
- --------------------------------------------------------------------------------
Temporary Cash Investments 4.3%
- --------------------------------------------------------------------------------
Other Assets and Liabilities 0.1%
- --------------------------------------------------------------------------------
*Includes depositary shares, dual listed securities and foreign ordinary shares.
- ------
11
NT Vista - Schedule of Investments
OCTOBER 31, 2006
Shares Value
- --------------------------------------------------------------------------------
COMMON STOCKS -- 95.6%
AEROSPACE & DEFENSE -- 5.4%
- --------------------------------------------------------------------------------
27,021 BE Aerospace, Inc.(1) $ 683,091
- --------------------------------------------------------------------------------
10,191 Precision Castparts Corp. 693,599
- --------------------------------------------------------------------------------
1,376,690
- --------------------------------------------------------------------------------
AUTOMOBILES -- 2.0%
- --------------------------------------------------------------------------------
7,600 Harley-Davidson, Inc. 521,588
- --------------------------------------------------------------------------------
BIOTECHNOLOGY -- 1.3%
- --------------------------------------------------------------------------------
6,011 Celgene Corp.(1) 321,228
- --------------------------------------------------------------------------------
CAPITAL MARKETS -- 2.9%
- --------------------------------------------------------------------------------
22,800 Amvescap plc ORD 260,742
- --------------------------------------------------------------------------------
8,700 SEI Investments Co. 489,636
- --------------------------------------------------------------------------------
750,378
- --------------------------------------------------------------------------------
CHEMICALS -- 2.7%
- --------------------------------------------------------------------------------
11,170 Monsanto Co. 493,937
- --------------------------------------------------------------------------------
3,400 OM Group, Inc.(1) 193,800
- --------------------------------------------------------------------------------
687,737
- --------------------------------------------------------------------------------
COMMERCIAL SERVICES & SUPPLIES -- 0.5%
- --------------------------------------------------------------------------------
3,050 Corrections Corp. of America(1) 139,355
- --------------------------------------------------------------------------------
COMMUNICATIONS EQUIPMENT -- 1.0%
- --------------------------------------------------------------------------------
3,800 CommScope Inc.(1) 121,258
- --------------------------------------------------------------------------------
1,200 Research In Motion Ltd.(1) 140,976
- --------------------------------------------------------------------------------
262,234
- --------------------------------------------------------------------------------
COMPUTERS & PERIPHERALS -- 0.8%
- --------------------------------------------------------------------------------
2,400 Apple Computer, Inc.(1) 194,592
- --------------------------------------------------------------------------------
CONSTRUCTION & ENGINEERING -- 2.2%
- --------------------------------------------------------------------------------
8,320 Foster Wheeler Ltd.(1) 373,984
- --------------------------------------------------------------------------------
10,045 Quanta Services, Inc.(1) 183,824
- --------------------------------------------------------------------------------
557,808
- --------------------------------------------------------------------------------
DIVERSIFIED FINANCIAL SERVICES -- 1.0%
- --------------------------------------------------------------------------------
1,600 IntercontinentalExchange Inc.(1) 135,072
- --------------------------------------------------------------------------------
2,400 International Securities
Exchange Inc. 123,240
- --------------------------------------------------------------------------------
258,312
- --------------------------------------------------------------------------------
ELECTRIC UTILITIES -- 1.0%
- --------------------------------------------------------------------------------
6,100 Allegheny Energy, Inc.(1) 262,483
- --------------------------------------------------------------------------------
ELECTRICAL EQUIPMENT -- 2.1%
- --------------------------------------------------------------------------------
9,933 ABB Ltd. ORD 147,807
- --------------------------------------------------------------------------------
2,943 Alstom RGPT ORD(1) 271,665
- --------------------------------------------------------------------------------
2,900 General Cable Corp.(1) 109,040
- --------------------------------------------------------------------------------
528,512
- --------------------------------------------------------------------------------
Shares Value
- --------------------------------------------------------------------------------
ELECTRONIC EQUIPMENT &
INSTRUMENTS -- 1.3%
- --------------------------------------------------------------------------------
2,800 Amphenol Corp. Cl A $ 190,120
- --------------------------------------------------------------------------------
2,300 Anixter International Inc.(1) 137,448
- --------------------------------------------------------------------------------
327,568
- --------------------------------------------------------------------------------
ENERGY EQUIPMENT & SERVICES -- 2.1%
- --------------------------------------------------------------------------------
6,900 Acergy SA ORD(1) 124,839
- --------------------------------------------------------------------------------
1,906 Core Laboratories N.V.(1) 138,928
- --------------------------------------------------------------------------------
10,434 TETRA Technologies, Inc.(1) 270,241
- --------------------------------------------------------------------------------
534,008
- --------------------------------------------------------------------------------
FOOD & STAPLES RETAILING -- 0.5%
- --------------------------------------------------------------------------------
4,400 Safeway Inc. 129,184
- --------------------------------------------------------------------------------
HEALTH CARE PROVIDERS & SERVICES -- 2.9%
- --------------------------------------------------------------------------------
4,900 Caremark Rx Inc. 241,227
- --------------------------------------------------------------------------------
4,100 Humana Inc.(1) 246,000
- --------------------------------------------------------------------------------
3,900 Laboratory Corp.
of America Holdings(1) 267,111
- --------------------------------------------------------------------------------
754,338
- --------------------------------------------------------------------------------
HOTELS, RESTAURANTS & LEISURE -- 4.5%
- --------------------------------------------------------------------------------
11,800 International Game Technology 501,618
- --------------------------------------------------------------------------------
8,612 Las Vegas Sands Corp.(1) 656,234
- --------------------------------------------------------------------------------
1,157,852
- --------------------------------------------------------------------------------
HOUSEHOLD DURABLES -- 1.2%
- --------------------------------------------------------------------------------
4,300 Newell Rubbermaid Inc. 123,754
- --------------------------------------------------------------------------------
9,900 Tempur-Pedic
International Inc.(1) 195,426
- --------------------------------------------------------------------------------
319,180
- --------------------------------------------------------------------------------
INDUSTRIAL CONGLOMERATES -- 2.0%
- --------------------------------------------------------------------------------
11,696 McDermott International, Inc.(1) 522,811
- --------------------------------------------------------------------------------
INSURANCE -- 2.3%
- --------------------------------------------------------------------------------
2,800 American Financial Group, Inc. 134,008
- --------------------------------------------------------------------------------
2,100 Arch Capital Group Ltd.(1) 135,009
- --------------------------------------------------------------------------------
3,600 Axis Capital Holdings Limited 118,260
- --------------------------------------------------------------------------------
3,858 RenaissanceRe Holdings Ltd. 209,875
- --------------------------------------------------------------------------------
597,152
- --------------------------------------------------------------------------------
INTERNET SOFTWARE & SERVICES -- 1.0%
- --------------------------------------------------------------------------------
5,358 Akamai Technologies, Inc.(1) 251,076
- --------------------------------------------------------------------------------
IT SERVICES -- 3.9%
- --------------------------------------------------------------------------------
12,588 Alliance Data Systems Corp.(1) 764,343
- --------------------------------------------------------------------------------
3,300 Cognizant Technology Solutions
Corporation Cl A(1) 248,424
- --------------------------------------------------------------------------------
1,012,767
- --------------------------------------------------------------------------------
See Notes to Financial Statements. (continued)
- ------
12
NT Vista - Schedule of Investments
OCTOBER 31, 2006
Shares Value
- --------------------------------------------------------------------------------
LIFE SCIENCES TOOLS & SERVICES -- 6.7%
- --------------------------------------------------------------------------------
4,100 Covance Inc.(1) $ 239,850
- --------------------------------------------------------------------------------
2,800 Illumina, Inc.(1) 123,088
- --------------------------------------------------------------------------------
10,883 Pharmaceutical Product
Development, Inc. 344,447
- --------------------------------------------------------------------------------
23,800 Thermo Electron Corp.(1) 1,020,306
- --------------------------------------------------------------------------------
1,727,691
- --------------------------------------------------------------------------------
MACHINERY -- 1.2%
- --------------------------------------------------------------------------------
2,400 Manitowoc Co., Inc. (The) 131,712
- --------------------------------------------------------------------------------
2,400 Terex Corp.(1) 124,224
- --------------------------------------------------------------------------------
1,700 Trinity Industries, Inc. 61,302
- --------------------------------------------------------------------------------
317,238
- --------------------------------------------------------------------------------
MARINE -- 0.9%
- --------------------------------------------------------------------------------
3,684 American Commercial
Lines Inc.(1) 236,329
- --------------------------------------------------------------------------------
MEDIA -- 0.3%
- --------------------------------------------------------------------------------
1,220 Focus Media
Holding Ltd. ADR(1) 64,526
- --------------------------------------------------------------------------------
METALS & MINING -- 2.1%
- --------------------------------------------------------------------------------
1,600 Allegheny Technologies Inc. 125,968
- --------------------------------------------------------------------------------
5,159 Oregon Steel Mills, Inc.(1) 280,650
- --------------------------------------------------------------------------------
4,300 Titanium Metals Corp.(1) 126,764
- --------------------------------------------------------------------------------
533,382
- --------------------------------------------------------------------------------
MULTILINE RETAIL -- 3.0%
- --------------------------------------------------------------------------------
6,100 Big Lots Inc.(1) 128,588
- --------------------------------------------------------------------------------
9,000 Kohl's Corp.(1) 635,400
- --------------------------------------------------------------------------------
763,988
- --------------------------------------------------------------------------------
REAL ESTATE INVESTMENT TRUSTS -- 2.5%
- --------------------------------------------------------------------------------
6,700 Archstone-Smith Trust 403,407
- --------------------------------------------------------------------------------
3,100 Camden Property Trust 250,232
- --------------------------------------------------------------------------------
653,639
- --------------------------------------------------------------------------------
REAL ESTATE MANAGEMENT &
DEVELOPMENT -- 1.0%
- --------------------------------------------------------------------------------
2,792 Jones Lang LaSalle Inc. 256,864
- --------------------------------------------------------------------------------
SEMICONDUCTORS &
SEMICONDUCTOR EQUIPMENT -- 1.5%
- --------------------------------------------------------------------------------
4,924 MEMC Electronic Materials Inc.(1) 174,802
- --------------------------------------------------------------------------------
5,900 NVIDIA Corp.(1) 205,733
- --------------------------------------------------------------------------------
380,535
- --------------------------------------------------------------------------------
SOFTWARE -- 5.5%
- --------------------------------------------------------------------------------
3,100 Amdocs Ltd.(1) 120,156
- --------------------------------------------------------------------------------
15,941 BEA Systems Inc.(1) 259,360
- --------------------------------------------------------------------------------
11,776 Mentor Graphics Corp.(1) 198,661
- --------------------------------------------------------------------------------
2,700 Nintendo Co., Ltd. ORD 552,378
- --------------------------------------------------------------------------------
6,100 Parametric Technology Corp.(1) 119,194
- --------------------------------------------------------------------------------
5,800 THQ Inc.(1) 174,406
- --------------------------------------------------------------------------------
1,424,155
- --------------------------------------------------------------------------------
Shares Value
- --------------------------------------------------------------------------------
SPECIALTY RETAIL -- 6.2%
- --------------------------------------------------------------------------------
10,800 American Eagle Outfitters, Inc. $ 494,640
- --------------------------------------------------------------------------------
3,000 AnnTaylor Stores Corporation(1) 132,060
- --------------------------------------------------------------------------------
8,400 GameStop Corp. Cl A(1) 428,904
- --------------------------------------------------------------------------------
3,000 Men's Wearhouse, Inc. (The) 119,550
- --------------------------------------------------------------------------------
3,402 Office Depot, Inc.(1) 142,850
- --------------------------------------------------------------------------------
9,200 Rent-A-Center Inc.(1) 264,592
- --------------------------------------------------------------------------------
1,582,596
- --------------------------------------------------------------------------------
TEXTILES, APPAREL & LUXURY GOODS -- 0.8%
- --------------------------------------------------------------------------------
4,800 Coach Inc.(1) 190,272
- --------------------------------------------------------------------------------
WIRELESS TELECOMMUNICATION
SERVICES -- 19.3%
- --------------------------------------------------------------------------------
20,168 America Movil SA de CV
Series L ADR 864,602
- --------------------------------------------------------------------------------
18,369 American Tower Corp. Cl A(1) 661,651
- --------------------------------------------------------------------------------
3,450 Crown Castle
International Corp.(1) 116,093
- --------------------------------------------------------------------------------
13,396 Leap Wireless
International, Inc.(1) 742,942
- --------------------------------------------------------------------------------
2,844 Millicom International
Cellular SA(1) 141,859
- --------------------------------------------------------------------------------
23,667 NII Holdings, Inc. Cl B(1) 1,539,065
- --------------------------------------------------------------------------------
2,900 Rogers Communications Inc.
Cl B ORD 173,695
- --------------------------------------------------------------------------------
26,902 SBA Communications Corp.
Cl A(1) 718,552
- --------------------------------------------------------------------------------
4,958,459
- --------------------------------------------------------------------------------
TOTAL COMMON STOCKS
(Cost $22,775,689) 24,556,527
- --------------------------------------------------------------------------------
TEMPORARY CASH INVESTMENTS -- 4.3%
Repurchase Agreement, Morgan Stanley
Group, Inc., (collateralized by various
U.S. Treasury obligations, 6.375% - 8.125%,
11/15/16 - 8/15/27, valued at $1,127,419),
in a joint trading account at 5.23%,
dated 10/31/06, due 11/1/06
(Delivery value $1,100,160)
(Cost $1,100,000) 1,100,000
- --------------------------------------------------------------------------------
TOTAL INVESTMENT SECURITIES -- 99.9%
(Cost $23,875,689) 25,656,527
- --------------------------------------------------------------------------------
OTHER ASSETS AND LIABILITIES -- 0.1% 21,709
- --------------------------------------------------------------------------------
TOTAL NET ASSETS -- 100.0% $ 25,678,236
================================================================================
See Notes to Financial Statements. (continued)
- ------
13
NT Vista - Schedule of Investments
OCTOBER 31, 2006
FORWARD FOREIGN CURRENCY EXCHANGE CONTRACTS
Contracts to Sell Settlement Date Value Unrealized Gain (Loss)
- --------------------------------------------------------------------------------
79,175 CAD for USD 11/30/06 $ 70,636 $ 193
- --------------------------------------------------------------------------------
91,631 CHF for USD 11/30/06 73,921 (352)
- --------------------------------------------------------------------------------
108,523 Euro for USD 11/30/06 138,780 (367)
- --------------------------------------------------------------------------------
68,115 GBP for USD 11/30/06 129,969 (687)
- --------------------------------------------------------------------------------
32,670,000 JPY for USD 11/30/06 280,569 (1,497)
- --------------------------------------------------------------------------------
403,650 NOK for USD 11/30/06 61,860 (9)
- --------------------------------------------------------------------------------
$ 755,735 $(2,719)
====================================
(Value on Settlement Date $753,016)
NOTES TO SCHEDULE OF INVESTMENTS
ADR = American Depositary Receipt
CAD = Canadian Dollar
CHF = Swiss Franc
GBP = British Pound
JPY = Japanese Yen
NOK = Norwegian Krona
ORD = Foreign Ordinary Share
USD = United States Dollar
(1) Non-income producing.
See Notes to Financial Statements.
- ------
14
Shareholder Fee Examples (Unaudited)
Fund shareholders may incur two types of costs: (1) transaction costs, including
sales charges (loads) on purchase payments and redemption/exchange fees; and (2)
ongoing costs, including management fees; distribution and service (12b-1) fees;
and other fund expenses. This example is intended to help you understand your
ongoing costs (in dollars) of investing in your fund and to compare these costs
with the ongoing cost of investing in other mutual funds.
The example is based on an investment of $1,000 made at the beginning of the
period and held for the entire period from May 1, 2006 to October 31, 2006
(except as noted).
ACTUAL EXPENSES
The table provides information about actual account values and actual expenses
for each class. You may use the information, together with the amount you
invested, to estimate the expenses that you paid over the period. First,
identify the share class you own. Then simply divide your account value by
$1,000 (for example, an $8,600 account value divided by $1,000 = 8.6), then
multiply the result by the number under the heading "Expenses Paid During
Period" to estimate the expenses you paid on your account during this period.
If you hold Investor Class shares of any American Century fund, or Institutional
Class shares of the American Century Diversified Bond Fund, in an American
Century account (i.e., not a financial intermediary or retirement plan account),
American Century may charge you a $12.50 semiannual account maintenance fee if
the value of those shares is less than $10,000. We will redeem shares
automatically in one of your accounts to pay the $12.50 fee. In determining your
total eligible investment amount, we will include your investments in all
PERSONAL ACCOUNTS (including American Century Brokerage accounts) registered
under your Social Security number. PERSONAL ACCOUNTS include individual
accounts, joint accounts, UGMA/UTMA accounts, personal trusts, Coverdell
Education Savings Accounts and IRAs (including traditional, Roth, Rollover,
SEP-, SARSEP- and SIMPLE-IRAs), and certain other retirement accounts. If you
have only business, business retirement, employer-sponsored or American Century
Brokerage accounts, you are currently not subject to this fee. We will not
charge the fee as long as you choose to manage your accounts exclusively online.
If you are subject to the Account Maintenance Fee, your account value could be
reduced by the fee amount.
HYPOTHETICAL EXAMPLE FOR COMPARISON PURPOSES
The table also provides information about hypothetical account values and
hypothetical expenses based on the actual expense ratio of each class of your
fund and an assumed rate of return of 5% per year before expenses, which is not
the actual return of a fund's share class. The hypothetical account values and
expenses may not be used to estimate the actual ending account balance or
expenses you paid for the period. You may use this information to compare the
ongoing costs of investing in your fund and other funds. To do so, compare this
5% hypothetical example with the 5% hypothetical examples that appear in the
shareholder reports of the other funds.
(continued)
- ------
15
Shareholder Fee Examples (Unaudited)
Please note that the expenses shown in the table are meant to highlight your
ongoing costs only and do not reflect any transactional costs, such as sales
charges (loads) or redemption/exchange fees. Therefore, the table is useful in
comparing ongoing costs only, and will not help you determine the relative total
costs of owning different funds. In addition, if these transactional costs were
included, your costs would have been higher.
- --------------------------------------------------------------------------------
EXPENSES PAID
BEGINNING ENDING DURING PERIOD(1) ANNUALIZED
ACCOUNT VALUE ACCOUNT VALUE 5/1/06 - EXPENSE
5/1/06 10/31/06 10/31/06 RATIO(1)
- --------------------------------------------------------------------------------
NT GROWTH -- INSTITUTIONAL CLASS SHAREHOLDER FEE EXAMPLE
- --------------------------------------------------------------------------------
Actual $1,000 $1,057.00(2) $3.88(3) 0.80%
- --------------------------------------------------------------------------------
Hypothetical $1,000 $1,021.17(4) $4.08(4) 0.80%
- --------------------------------------------------------------------------------
NT VISTA -- INSTITUTIONAL CLASS SHAREHOLDER FEE EXAMPLE
- --------------------------------------------------------------------------------
Actual $1,000 $900.00(2) $3.58(3) 0.80%
- --------------------------------------------------------------------------------
Hypothetical $1,000 $1,021.17(4) $4.08(4) 0.80%
- --------------------------------------------------------------------------------
(1) Expenses are equal to the class's annualized expense ratio listed in the
table above, multiplied by the average account value over the period,
multiplied by 184, the number of days in the most recent fiscal half-year,
divided by 365, to reflect the one-half year period.
(2) Ending account value based on actual return from May 12, 2006 (fund
inception) through October 31, 2006.
(3) Expenses are equal to the class's annualized expense ratio listed in the
table above, multiplied by the average account value over the period,
multiplied by 172, the number of days in the period from May 12, 2006 (fund
inception) through October 31, 2006, divided by 365, to reflect the period.
Had the class been available for the full period, the expenses paid during
the period would have been higher.
(4) Ending account value and expenses paid during period assumes the class had
been available throughout the entire period and are calculated using the
class's annualized expense ratio listed in the table above.
- ------
16
Statement of Assets and Liabilities
OCTOBER 31, 2006
- --------------------------------------------------------------------------------
NT GROWTH NT VISTA
- --------------------------------------------------------------------------------
ASSETS
- --------------------------------------------------------------------------------
Investment securities, at value
(cost of $55,155,191 and
$23,875,689, respectively) $59,462,618 $25,656,527
- -----------------------------------------------
Cash 161,991 108,026
- -----------------------------------------------
Receivable for investments sold 447,961 682,560
- -----------------------------------------------
Receivable for forward foreign
currency exchange contracts -- 193
- -----------------------------------------------
Dividends and interest receivable 20,828 1,656
- --------------------------------------------------------------------------------
60,093,398 26,448,962
- --------------------------------------------------------------------------------
LIABILITIES
- --------------------------------------------------------------------------------
Payable for investments purchased 1,066,467 751,064
- -----------------------------------------------
Payable for forward foreign
currency exchange contracts 5,863 2,912
- -----------------------------------------------
Accrued management fees 38,390 16,750
- --------------------------------------------------------------------------------
1,110,720 770,726
- --------------------------------------------------------------------------------
NET ASSETS $58,982,678 $25,678,236
================================================================================
CAPITAL SHARES, $0.01 PAR VALUE
- --------------------------------------------------------------------------------
Authorized 100,000,000 100,000,000
================================================================================
Outstanding 5,579,366 2,854,497
================================================================================
NET ASSET VALUE PER SHARE $10.57 $9.00
================================================================================
NET ASSETS CONSIST OF:
- --------------------------------------------------------------------------------
Capital (par value and paid-in surplus) $55,646,061 $27,312,618
- -----------------------------------------------
Undistributed net investment income 113,918 2,719
- -----------------------------------------------
Accumulated net realized loss on investment
and foreign currency transactions (1,078,884) (3,415,221)
- -----------------------------------------------
Net unrealized appreciation on investments
and translation of assets and liabilities
in foreign currencies 4,301,583 1,778,120
- --------------------------------------------------------------------------------
$58,982,678 $25,678,236
================================================================================
See Notes to Financial Statements.
- ------
17
Statement of Operations
PERIOD ENDED OCTOBER 31, 2006(1)
- --------------------------------------------------------------------------------
NT GROWTH NT VISTA
- --------------------------------------------------------------------------------
INVESTMENT INCOME (LOSS)
- --------------------------------------------------------------------------------
INCOME:
- ---------------------------------------------
Dividends (net of foreign taxes
withheld of $103 and $75) $ 237,163 $ 32,431
- ---------------------------------------------
Interest 25,406 20,373
- --------------------------------------------------------------------------------
262,569 52,804
- --------------------------------------------------------------------------------
EXPENSES:
- ---------------------------------------------
Management fees 179,563 80,530
- ---------------------------------------------
Directors' fees and expenses 434 120
- ---------------------------------------------
Other expenses 266 125
- --------------------------------------------------------------------------------
180,263 80,775
- --------------------------------------------------------------------------------
NET INVESTMENT INCOME (LOSS) 82,306 (27,971)
- --------------------------------------------------------------------------------
REALIZED AND UNREALIZED GAIN (LOSS)
- --------------------------------------------------------------------------------
Net realized gain (loss) on investment
and foreign currency transactions (1,047,272) (3,412,177)
- ---------------------------------------------
Change in net unrealized appreciation
(depreciation) on investments and
translation of assets and liabilities
in foreign currencies 4,301,583 1,778,120
- --------------------------------------------------------------------------------
NET REALIZED AND UNREALIZED GAIN (LOSS) 3,254,311 (1,634,057)
- --------------------------------------------------------------------------------
NET INCREASE (DECREASE) IN NET ASSETS
RESULTING FROM OPERATIONS $ 3,336,617 $(1,662,028)
================================================================================
(1) May 12, 2006 (fund inception) through October 31, 2006.
See Notes to Financial Statements.
- ------
18
Statement of Changes in Net Assets
PERIOD ENDED OCTOBER 31, 2006(1)
- --------------------------------------------------------------------------------
INCREASE (DECREASE) IN NET ASSETS NT GROWTH NT VISTA
- --------------------------------------------------------------------------------
OPERATIONS
- --------------------------------------------------------------------------------
Net investment income (loss) $ 82,306 $ (27,971)
- --------------------------------------------
Net realized gain (loss) (1,047,272) (3,412,177)
- --------------------------------------------
Change in net unrealized
appreciation (depreciation) 4,301,583 1,778,120
- --------------------------------------------------------------------------------
Net increase (decrease) in net assets
resulting from operations 3,336,617 (1,662,028)
- --------------------------------------------------------------------------------
CAPITAL SHARE TRANSACTIONS
- --------------------------------------------------------------------------------
Proceeds from shares sold 56,820,645 27,880,764
- --------------------------------------------
Payments for shares redeemed (1,174,584) (540,500)
- --------------------------------------------------------------------------------
Net increase (decrease) in net assets
from capital share transactions 55,646,061 27,340,264
- --------------------------------------------------------------------------------
NET INCREASE (DECREASE) IN NET ASSETS 58,982,678 25,678,236
NET ASSETS
- --------------------------------------------------------------------------------
End of period $58,982,678 $25,678,236
================================================================================
Undistributed net investment income $113,918 $2,719
================================================================================
TRANSACTIONS IN SHARES OF THE FUNDS
- --------------------------------------------------------------------------------
Sold 5,698,720 2,915,545
- --------------------------------------------
Redeemed (119,354) (61,048)
- --------------------------------------------------------------------------------
Net increase (decrease) in shares of the funds 5,579,366 2,854,497
================================================================================
(1) May 12, 2006 (fund inception) through October 31, 2006.
See Notes to Financial Statements.
- ------
19
Notes to Financial Statements
OCTOBER 31, 2006
1. ORGANIZATION AND SUMMARY OF SIGNIFICANT ACCOUNTING POLICIES
ORGANIZATION -- American Century Mutual Funds, Inc. (the corporation) is
registered under the Investment Company Act of 1940 (the 1940 Act) as an
open-end management investment company. NT Growth Fund (NT Growth) and NT Vista
Fund (NT Vista) (collectively, the funds) are two funds in a series issued by
the corporation. The funds are diversified under the 1940 Act. The funds'
investment objective is to seek long-term capital growth. The funds pursue this
objective by investing primarily in equity securities. NT Growth generally
invests in larger companies but may purchase companies of any size. NT Vista
generally invests in companies that are medium-sized and smaller at the time of
purchase. The funds are not permitted to invest in any securities issued by
companies assigned the Global Industry Classification Standard for the tobacco
industry. The funds incepted on May 12, 2006. The following is a summary of the
funds' significant accounting policies.
SECURITY VALUATIONS -- Securities traded primarily on a principal securities
exchange are valued at the last reported sales price, or at the mean of the
latest bid and asked prices where no last sales price is available. Depending on
local convention or regulation, securities traded over-the-counter are valued at
the mean of the latest bid and asked prices, the last sales price, or the
official close price. Debt securities not traded on a principal securities
exchange are valued through a commercial pricing service or at the mean of the
most recent bid and asked prices. Discount notes may be valued through a
commercial pricing service or at amortized cost, which approximates fair value.
Securities traded on foreign securities exchanges and over-the-counter markets
are normally completed before the close of business on days that the New York
Stock Exchange (the Exchange) is open and may also take place on days when the
Exchange is not open. If an event occurs after the value of a security was
established but before the net asset value per share was determined that was
likely to materially change the net asset value, that security would be valued
at fair value as determined in accordance with procedures adopted by the Board
of Directors. If the funds determine that the market price of a portfolio
security is not readily available, or that the valuation methods mentioned above
do not reflect the security's fair value, such security is valued at its fair
value as determined by, or in accordance with procedures adopted by, the Board
of Directors or its designee if such fair value determination would materially
impact a fund's net asset value. Certain other circumstances that may cause the
funds to fair value a security such as: a security has been declared in default;
trading in a security has been halted during the trading day; or there is a
foreign market holiday and no trading will commence.
SECURITY TRANSACTIONS -- Security transactions are accounted for as of the trade
date. Net realized gains and losses are determined on the identified cost basis,
which is also used for federal income tax purposes.
INVESTMENT INCOME -- Dividend income less foreign taxes withheld, if any, is
recorded as of the ex-dividend date. Distributions received on securities that
represent a return of capital or capital gain are recorded as a reduction of
cost of investments and/or as a realized gain. The funds estimate the components
of distributions received that may be considered nontaxable distributions or
capital gain distributions for income tax purposes. Interest income is recorded
on the accrual basis and includes accretion of discounts and amortization of
premiums.
FOREIGN CURRENCY TRANSACTIONS -- All assets and liabilities initially expressed
in foreign currencies are translated into U.S. dollars at prevailing exchange
rates at period end. Purchases and sales of investment securities, dividend and
interest income, and certain expenses are translated at the rates of exchange
prevailing on the respective dates of such transactions. For assets and
liabilities, other than investments in securities, net realized and unrealized
gains and losses from foreign currency translations arise from changes in
currency exchange rates.
Net realized and unrealized foreign currency exchange gains or losses occurring
during the holding period of investment securities are a component of realized
gain (loss) on investment transactions and unrealized appreciation
(depreciation) on investments, respectively. Certain countries may impose taxes
on the contract amount of purchases and sales of foreign currency contracts in
their currency. The funds record the foreign tax expense, if any, as a reduction
to the net realized gain (loss) on foreign currency transactions.
FORWARD FOREIGN CURRENCY EXCHANGE CONTRACTS -- The funds may enter into forward
foreign currency exchange contracts to facilitate transactions of securities
denominated in a foreign currency or to hedge the funds' exposure to foreign
currency exchange rate fluctuations. The net U.S. dollar value of foreign
currency underlying all contractual commitments held by the funds and the
resulting unrealized appreciation or depreciation are determined daily using
prevailing exchange rates. The funds bear the risk of an unfavorable change in
the foreign currency exchange rate underlying the forward contract.
Additionally, losses may arise if the counterparties do not perform under the
contract terms.
(continued)
- ------
20
Notes to Financial Statements
OCTOBER 31, 2006
1. ORGANIZATION AND SUMMARY OF SIGNIFICANT ACCOUNTING POLICIES (CONTINUED)
REPURCHASE AGREEMENTS -- The funds may enter into repurchase agreements with
institutions that American Century Investment Management, Inc. (ACIM) (the
investment advisor) has determined are creditworthy pursuant to criteria adopted
by the Board of Directors. Each repurchase agreement is recorded at cost. Each
fund requires that the collateral, represented by securities, received in a
repurchase transaction be transferred to the custodian in a manner sufficient to
enable each fund to obtain those securities in the event of a default under the
repurchase agreement. ACIM monitors, on a daily basis, the securities
transferred to ensure the value, including accrued interest, of the securities
under each repurchase agreement is equal to or greater than amounts owed to each
fund under each repurchase agreement.
JOINT TRADING ACCOUNT -- Pursuant to an Exemptive Order issued by the Securities
and Exchange Commission, each fund, along with other registered investment
companies having management agreements with ACIM or American Century Global
Investment Management, Inc. (ACGIM), may transfer uninvested cash balances into
a joint trading account. These balances are invested in one or more repurchase
agreements that are collateralized by U.S. Treasury or Agency obligations.
INCOME TAX STATUS -- It is each fund's policy to distribute substantially all
net investment income and net realized gains to shareholders and to otherwise
qualify as a regulated investment company under provisions of the Internal
Revenue Code. Accordingly, no provision has been made for federal or state
income taxes.
DISTRIBUTIONS TO SHAREHOLDERS -- Distributions to shareholders are recorded on
the ex-dividend date. Distributions from net investment income and net realized
gains, if any, are generally declared and paid annually.
INDEMNIFICATIONS -- Under the corporation's organizational documents, its
officers and directors are indemnified against certain liabilities arising out
of the performance of their duties to the funds. In addition, in the normal
course of business, the funds enter into contracts that provide general
indemnifications. The funds' maximum exposure under these arrangements is
unknown as this would involve future claims that may be made against the funds.
The risk of material loss from such claims is considered by management to be
remote.
USE OF ESTIMATES -- The financial statements are prepared in conformity with
accounting principles generally accepted in the United States of America, which
may require management to make certain estimates and assumptions at the date of
the financial statements. Actual results could differ from these estimates.
2. FEES AND TRANSACTIONS WITH RELATED PARTIES
MANAGEMENT FEES -- The corporation has entered into a Management Agreement with
ACIM, under which ACIM provides the funds with investment advisory and
management services in exchange for a single, unified management fee (the fee).
The Agreement provides that all expenses of the funds, except brokerage
commissions, taxes, interest, fees and expenses of those directors who are not
considered "interested persons" as defined in the 1940 Act (including counsel
fees) and extraordinary expenses, will be paid by ACIM. The fee is computed and
accrued daily based on the daily net assets of each fund and paid monthly in
arrears. For funds with a stepped fee schedule, the rate of the fee is
determined by applying a fee rate calculation formula. This formula takes into
account all of the investment advisor's assets under management in each fund's
investment strategy (strategy assets) to calculate the appropriate fee rate for
each fund. The strategy assets include each fund's assets and the assets of
other clients of the investment advisor that are not in the American Century
family of funds, but that have the same investment team and investment strategy.
The strategy assets of NT Growth include the assets of Growth Fund, one fund in
a series issued by the corporation. The annual management fee for NT Vista is
0.80%.
(continued)
- ------
21
Notes to Financial Statements
OCTOBER 31, 2006
2. FEES AND TRANSACTIONS WITH RELATED PARTIES (CONTINUED)
The annual management fee schedule for NT Growth is as follows:
- --------------------------------------------------------------------------------
INSTITUTIONAL
- --------------------------------------------------------------------------------
STRATEGY ASSETS
- --------------------------------------------------------------------------------
First $5 billion 0.800%
- --------------------------------------------------------------------------------
Next $5 billion 0.780%
- --------------------------------------------------------------------------------
Next $5 billion 0.770%
- --------------------------------------------------------------------------------
Next $5 billion 0.760%
- --------------------------------------------------------------------------------
Next $5 billion 0.750%
- --------------------------------------------------------------------------------
Next $5 billion 0.700%
- --------------------------------------------------------------------------------
Over $30 billion 0.600%
- --------------------------------------------------------------------------------
The effective annual management fee for NT Growth for the period May 12, 2006
(fund inception) through October 31, 2006 was 0.80%.
RELATED PARTIES -- Certain officers and directors of the corporation are also
officers and/or directors, and, as a group, controlling stockholders of American
Century Companies, Inc. (ACC), the parent of the corporation's investment
advisor, ACIM, the distributor of the corporation, American Century Investment
Services, Inc., and the corporation's transfer agent, American Century Services,
LLC. The funds are wholly owned by American Century Assets Allocation
Portfolios, Inc. (ACAAP). ACAAP does not invest in the funds for the purpose of
exercising management or control.
JPMorgan Chase Bank is a custodian of the funds and a wholly owned subsidiary of
JPMorgan Chase & Co. (JPM). JPM is an equity investor in ACC.
3. INVESTMENT TRANSACTIONS
Investment transactions, excluding short-term investments, for the period May
12, 2006 (fund inception) through October 31, 2006, were as follows:
- --------------------------------------------------------------------------------
NT GROWTH NT VISTA
- --------------------------------------------------------------------------------
Purchases $82,305,327 $48,554,334
- --------------------------------------------------------------------------------
Proceeds from sales $26,863,963 $22,357,782
- --------------------------------------------------------------------------------
For the period May 12, 2006 (fund inception) through October 31, 2006, NT Vista
incurred a purchase in kind of equity securities valued at $18,446,064. A
purchase in kind occurs when a fund receives securities into its portfolio in
lieu of cash as payment from a purchasing shareholder.
(continued)
- ------
22
Notes to Financial Statements
OCTOBER 31, 2006
4. FEDERAL TAX INFORMATION
The book-basis character of distributions made during the year from net
investment income or net realized gains may differ from their ultimate
characterization for federal income tax purposes. These differences reflect the
differing character of certain income items and net realized gains and losses
for financial statement and tax purposes, and may result in reclassification
among certain capital accounts on the financial statements. There were no
distributions paid by the funds during the period May 12, 2006 (fund inception)
through October 31, 2006.
As of October 31, 2006, the components of distributable earnings on a tax-basis
and the federal tax cost of investments were as follows:
- --------------------------------------------------------------------------------
NT GROWTH NT VISTA
- --------------------------------------------------------------------------------
Federal tax cost of investments $55,268,636 $24,148,673
================================================================================
Gross tax appreciation of investments $4,622,074 $1,827,745
- ---------------------------------------------------
Gross tax depreciation of investments (428,092) (319,891)
- --------------------------------------------------------------------------------
Net tax appreciation (depreciation) of investments $4,193,982 $1,507,854
================================================================================
Net tax appreciation (depreciation)
on derivatives and translation of assets
and liabilities in foreign currencies (1,063) --
- --------------------------------------------------------------------------------
Net tax appreciation (depreciation) $4,192,919 $1,507,854
================================================================================
Undistributed ordinary income $109,137 --
- ---------------------------------------------------
Accumulated capital losses $(965,439) $(3,142,236)
- --------------------------------------------------------------------------------
The difference between book-basis and tax-basis cost and unrealized appreciation
(depreciation) is attributable primarily to the tax deferral of losses on wash
sales and the realization for tax purposes of unrealized gains on certain
forward foreign currency exchange contracts.
The accumulated capital losses listed above represent net capital loss
carryovers that may be used to offset future realized capital gains for federal
income tax purposes. The capital loss carryovers for the funds expire in 2014.
5. RECENTLY ISSUED ACCOUNTING STANDARDS
In June 2006, the Financial Accounting Standards Board (FASB) issued
Interpretation No. 48, "Accounting for Uncertainty in Income Taxes - an
Interpretation of FASB Statement No. 109" (FIN 48). FIN 48 establishes a minimum
threshold for financial statement recognition of the benefit of positions taken
in filing tax returns (including whether an entity is taxable in a particular
jurisdiction), and requires certain expanded tax disclosures. FIN 48 is
effective for fiscal years beginning after December 15, 2006, and is to be
applied to all open tax years as of the date of effectiveness. The FASB issued
Statement of Financial Accounting Standards No. 157, "Fair Value Measurements"
(FAS 157), in September 2006, which is effective for fiscal years beginning
after November 15, 2007. FAS 157 defines fair value, establishes a framework for
measuring fair value and expands the required financial statement disclosures
about fair value measurements. Management is currently evaluating the impact of
adopting FIN 48 and FAS 157.
- ------
23
NT Growth - Financial Highlights
For a Share Outstanding Throughout the Period Indicated
- --------------------------------------------------------------------------------
INSTITUTIONAL
CLASS
- --------------------------------------------------------------------------------
2006(1)
- --------------------------------------------------------------------------------
PER-SHARE DATA
- --------------------------------------------------------------------------------
Net Asset Value, Beginning of Period $10.00
- --------------------------------------------------------------------------------
Income From Investment Operations
- --------------------------------------------------------------
Net Investment Income (Loss) 0.01
- --------------------------------------------------------------
Net Realized and Unrealized Gain (Loss) 0.56
- --------------------------------------------------------------------------------
Total From Investment Operations 0.57
- --------------------------------------------------------------------------------
Net Asset Value, End of Period $10.57
================================================================================
TOTAL RETURN(2) 5.70%
- --------------------------------------------------------------------------------
RATIOS/SUPPLEMENTAL DATA
- --------------------------------------------------------------------------------
Ratio of Operating Expenses to Average Net Assets 0.80%(3)
- --------------------------------------------------------------
Ratio of Net Investment Income (Loss) to Average Net Assets 0.36%(3)
- --------------------------------------------------------------
Portfolio Turnover Rate 57%
- --------------------------------------------------------------
Net Assets, End of Period (in thousands) $58,983
- --------------------------------------------------------------------------------
(1) May 12, 2006 (fund inception) through October 31, 2006.
(2) Total return assumes reinvestment of net investment income and capital
gains distributions, if any. Total returns for periods less than one year
are not annualized.
(3) Annualized.
See Notes to Financial Statements.
- ------
24
NT Vista - Financial Highlights
For a Share Outstanding Throughout the Period Indicated
- --------------------------------------------------------------------------------
INSTITUTIONAL
CLASS
- --------------------------------------------------------------------------------
2006(1)
- --------------------------------------------------------------------------------
PER-SHARE DATA
- --------------------------------------------------------------------------------
Net Asset Value, Beginning of Period $10.00
- --------------------------------------------------------------------------------
Income From Investment Operations
- --------------------------------------------------------------
Net Investment Income (Loss) (0.01)
- --------------------------------------------------------------
Net Realized and Unrealized Gain (Loss) (0.99)
- --------------------------------------------------------------------------------
Total From Investment Operations (1.00)
- --------------------------------------------------------------------------------
Net Asset Value, End of Period $9.00
================================================================================
TOTAL RETURN(2) (10.00)%
- --------------------------------------------------------------------------------
RATIOS/SUPPLEMENTAL DATA
- --------------------------------------------------------------------------------
Ratio of Operating Expenses to Average Net Assets 0.80%(3)
- --------------------------------------------------------------
Ratio of Net Investment Income (Loss) to Average Net Assets (0.27)%(3)
- --------------------------------------------------------------
Portfolio Turnover Rate 109%
- --------------------------------------------------------------
Net Assets, End of Period (in thousands) $25,678
- --------------------------------------------------------------------------------
(1) May 12, 2006 (fund inception) through October 31, 2006.
(2) Total return assumes reinvestment of net investment income and capital
gains distributions, if any. Total returns for periods less than one year
are not annualized.
(3) Annualized.
See Notes to Financial Statements.
- ------
25
Report of Independent Registered Public Accounting Firm
The Board of Directors and Shareholders,
American Century Mutual Funds, Inc.:
We have audited the accompanying statements of assets and liabilities, including
the schedules of investments, of NT Growth Fund and NT Vista Fund (collectively
the "Funds"), two of the mutual funds comprising American Century Mutual Funds,
Inc., as of October 31, 2006, and the related statements of operations, the
statements of changes in net assets, and the financial highlights for the period
May 12, 2006 (Funds' inception) to October 31, 2006. These financial statements
and financial highlights are the responsibility of the Funds' management. Our
responsibility is to express an opinion on these financial statements and
financial highlights based on our audits.
We conducted our audits in accordance with the standards of the Public Company
Accounting Oversight Board (United States). Those standards require that we plan
and perform the audit to obtain reasonable assurance about whether the financial
statements and financial highlights are free of material misstatement. The Funds
are not required to have, nor were we engaged to perform, an audit of their
internal control over financial reporting. Our audits included consideration of
internal control over financial reporting as a basis for designing audit
procedures that are appropriate in the circumstances, but not for the purpose of
expressing an opinion on the effectiveness of the Funds' internal control over
financial reporting. Accordingly, we express no such opinion. An audit also
includes examining, on a test basis, evidence supporting the amounts and
disclosures in the financial statements, assessing the accounting principles
used and significant estimates made by management, as well as evaluating the
overall financial statement presentation. Our procedures included confirmation
of securities owned as of October 31, 2006, by correspondence with the custodian
and brokers; where replies were not received from brokers, we performed other
auditing procedures. We believe that our audits provide a reasonable basis for
our opinion.
In our opinion, the financial statements and financial highlights referred to
above present fairly, in all material respects, the financial position of each
of the respective Funds, as of October 31, 2006, and the results of their
operations, the changes in their net assets, and the financial highlights for
the period May 12, 2006 (Funds' inception) to October 31, 2006, in conformity
with accounting principles generally accepted in the United States of America.
Deloitte & Touche LLP
Kansas City, Missouri
December 14, 2006
- ------
26
Management
The individuals listed below serve as directors or officers of the funds. Each
director serves until his or her successor is duly elected and qualified or
until he or she retires. Mandatory retirement age for independent directors is
72. Those listed as interested directors are "interested" primarily by virtue of
their engagement as officers of American Century Companies, Inc. (ACC) or its
wholly owned, direct or indirect, subsidiaries, including the funds' investment
advisor, American Century Investment Management, Inc. (ACIM); the funds'
principal underwriter, American Century Investment Services, Inc. (ACIS); and
the funds' transfer agent, American Century Services, LLC (ACS).
The other directors (more than three-fourths of the total number) are
independent; that is, they have never been employees or officers of, and have no
financial interest in, ACC or any of its wholly owned subsidiaries, including
ACIM, ACIS, and ACS. The directors serve in this capacity for seven registered
investment companies in the American Century family of funds.
All persons named as officers of the funds also serve in a similar capacity for
the other 14 investment companies advised by ACIM or American Century Global
Investment Management, Inc. (ACGIM), unless otherwise noted. Only officers with
policy-making functions are listed. No officer is compensated for his or her
service as an officer of the funds. The listed officers are interested persons
of the funds and are appointed or re-appointed on an annual basis.
INDEPENDENT DIRECTORS
- --------------------------------------------------------------------------------
THOMAS A. BROWN, 4500 Main Street, Kansas City, MO 64111
YEAR OF BIRTH: 1940
POSITION(S) HELD WITH FUND: Director
FIRST YEAR OF SERVICE: 1980
PRINCIPAL OCCUPATION(S) DURING PAST 5 YEARS: Retired, Formerly Chief Executive
Officer/Treasurer, Associated Bearings Company
NUMBER OF PORTFOLIOS IN FUND COMPLEX OVERSEEN BY DIRECTOR: 66
OTHER DIRECTORSHIPS HELD BY DIRECTOR: None
- --------------------------------------------------------------------------------
ANDREA C. HALL, PH.D., 4500 Main Street, Kansas City, MO 64111
YEAR OF BIRTH: 1945
POSITION(S) HELD WITH FUND: Director
FIRST YEAR OF SERVICE: 1997
PRINCIPAL OCCUPATION(S) DURING PAST 5 YEARS: Senior Vice President, Midwest
Research Institute
NUMBER OF PORTFOLIOS IN FUND COMPLEX OVERSEEN BY DIRECTOR: 66
OTHER DIRECTORSHIPS HELD BY DIRECTOR: None
- --------------------------------------------------------------------------------
D.D. (DEL) HOCK, 4500 Main Street, Kansas City, MO 64111
YEAR OF BIRTH: 1935
POSITION(S) HELD WITH FUND: Director
FIRST YEAR OF SERVICE: 1996
PRINCIPAL OCCUPATION(S) DURING PAST 5 YEARS: Retired, formerly Chairman, Public
Service Company of Colorado
NUMBER OF PORTFOLIOS IN FUND COMPLEX OVERSEEN BY DIRECTOR: 66
OTHER DIRECTORSHIPS HELD BY DIRECTOR: Director, Allied Motion Technologies, Inc.
- --------------------------------------------------------------------------------
(continued)
- ------
27
Management
INDEPENDENT DIRECTORS (CONTINUED)
- --------------------------------------------------------------------------------
JAMES A. OLSON, 4500 Main Street, Kansas City, MO 64111
YEAR OF BIRTH: 1942
POSITION(S) HELD WITH FUND: Advisory Board Member
FIRST YEAR OF SERVICE: 2006
PRINCIPAL OCCUPATION(S) DURING PAST 5 YEARS: Principal, Plaza Belmont LLC; Chief
Financial Officer, Plaza Belmont LLC (September 1999 to July 2006)
NUMBER OF PORTFOLIOS IN FUND COMPLEX OVERSEEN BY DIRECTOR: 66
OTHER DIRECTORSHIPS HELD BY DIRECTOR: Director, Saia, Inc. and Entertainment
Properties Trust
- --------------------------------------------------------------------------------
DONALD H. PRATT, 4500 Main Street, Kansas City, MO 64111
YEAR OF BIRTH: 1937
POSITION(S) HELD WITH FUND: Director, Chairman of the Board
FIRST YEAR OF SERVICE: 1995
PRINCIPAL OCCUPATION(S) DURING PAST 5 YEARS: Chairman, Western Investments,
Inc.; Retired Chairman of the Board, Butler Manufacturing Company
NUMBER OF PORTFOLIOS IN FUND COMPLEX OVERSEEN BY DIRECTOR: 66
OTHER DIRECTORSHIPS HELD BY DIRECTOR: None
- --------------------------------------------------------------------------------
GALE E. SAYERS, 4500 Main Street, Kansas City, MO 64111
YEAR OF BIRTH: 1943
POSITION(S) HELD WITH FUND: Director
FIRST YEAR OF SERVICE: 2000
PRINCIPAL OCCUPATION(S) DURING PAST 5 YEARS: President, Chief Executive Officer
and Founder, Sayers40, Inc., a technology products and service provider
NUMBER OF PORTFOLIOS IN FUND COMPLEX OVERSEEN BY DIRECTOR: 66
OTHER DIRECTORSHIPS HELD BY DIRECTOR: Director, Triad Hospitals, Inc.
- --------------------------------------------------------------------------------
M. JEANNINE STRANDJORD, 4500 Main Street, Kansas City, MO 64111
YEAR OF BIRTH: 1945
POSITION(S) HELD WITH FUND: Director
FIRST YEAR OF SERVICE: 1994
PRINCIPAL OCCUPATION(S) DURING PAST 5 YEARS: Retired, formerly Senior Vice
President, Sprint Corporation
NUMBER OF PORTFOLIOS IN FUND COMPLEX OVERSEEN BY DIRECTOR: 66
OTHER DIRECTORSHIPS HELD BY DIRECTOR: Director, DST Systems, Inc.; Director,
Euronet Worldwide, Inc.
- --------------------------------------------------------------------------------
TIMOTHY S. WEBSTER, 4500 Main Street, Kansas City, MO 64111
YEAR OF BIRTH: 1961
POSITION(S) HELD WITH FUND: Director
FIRST YEAR OF SERVICE: 2001
PRINCIPAL OCCUPATION(S) DURING PAST 5 YEARS: President and Chief Executive
Officer, American Italian Pasta Company (1992 to December 2005)
NUMBER OF PORTFOLIOS IN FUND COMPLEX OVERSEEN BY DIRECTOR: 66
OTHER DIRECTORSHIPS HELD BY DIRECTOR: None
- --------------------------------------------------------------------------------
INTERESTED DIRECTORS
- --------------------------------------------------------------------------------
JAMES E. STOWERS, JR.(1), 4500 Main Street, Kansas City, MO 64111
YEAR OF BIRTH: 1924
POSITION(S) HELD WITH FUND: Director, Co-Vice Chairman
FIRST YEAR OF SERVICE: 1958
PRINCIPAL OCCUPATION(S) DURING PAST 5 YEARS: Founder, Director and Controlling
Shareholder, ACC; Chairman, ACC (January 1995 to December 2004); Director, ACIM,
ACGIM, ACS, ACIS and other ACC subsidiaries
NUMBER OF PORTFOLIOS IN FUND COMPLEX OVERSEEN BY DIRECTOR: 66
OTHER DIRECTORSHIPS HELD BY DIRECTOR: None
- --------------------------------------------------------------------------------
JAMES E. STOWERS III(1), 4500 Main Street, Kansas City, MO 64111
YEAR OF BIRTH: 1959
POSITION(S) HELD WITH FUND: Director, Co-Vice Chairman
FIRST YEAR OF SERVICE: 1990
PRINCIPAL OCCUPATION(S) DURING PAST 5 YEARS: Chairman, ACC (January 2005 to
present); Co-Chairman, ACC (September 2000 to December 2004); Chairman, ACS and
other ACC subsidiaries (April 2005 to September 2006); Director, ACC, ACIM,
ACGIM, ACS, ACIS and other ACC subsidiaries
Number of Portfolios in Fund Complex Overseen by Director: 66
OTHER DIRECTORSHIPS HELD BY DIRECTOR: None
- --------------------------------------------------------------------------------
(1) James E. Stowers, Jr. is the father of James E. Stowers III. (continued)
- ------
28
Management
OFFICERS
- --------------------------------------------------------------------------------
WILLIAM M. LYONS, 4500 Main Street, Kansas City, MO 64111
YEAR OF BIRTH: 1955
POSITION(S) HELD WITH FUND: President
FIRST YEAR OF SERVICE: 2000
PRINCIPAL OCCUPATION(S) DURING PAST 5 YEARS: Chief Executive Officer, ACC
(September 2000 to present); President, ACC (June 1997 to present); Also serves
as: Chairman, ACIM, ACGIM, ACS, ACIS and other ACC subsidiaries; Chief Executive
Officer, ACIM, ACGIM, ACIS and other ACC subsidiaries (October 2000 to October
2006); President, ACIM, ACGIM and other ACC subsidiaries (September 2002 to
September 2006); Executive Vice President, ACS (January 2005 to September 2006);
Director, ACC, ACIM, ACGIM, ACS, ACIS and other ACC subsidiaries
- --------------------------------------------------------------------------------
JONATHAN THOMAS, 4500 Main Street, Kansas City, MO 64111
YEAR OF BIRTH: 1963
POSITION(S) HELD WITH FUND: Executive Vice President
FIRST YEAR OF SERVICE: 2005
PRINCIPAL OCCUPATION(S) DURING PAST 5 YEARS: Chief Administrative Officer, ACC
(February 2006 to present); Executive Vice President, ACC (November 2005 to
present); Also serves as: President and Chief Executive Officer, ACS; Chief
Financial Officer and Chief Accounting Officer, ACIM, ACGIM, ACS, ACIS and other
ACC subsidiaries; Managing Director, Morgan Stanley (March 2000 to November
2005)
- --------------------------------------------------------------------------------
MARYANNE ROEPKE, 4500 Main Street, Kansas City, MO 64111
YEAR OF BIRTH: 1956
POSITION(S) HELD WITH FUND: Chief Compliance Officer and Senior Vice President
FIRST YEAR OF SERVICE: 2000
PRINCIPAL OCCUPATION(S) DURING PAST 5 YEARS: Chief Compliance Officer, ACIM,
ACGIM and ACS (August 2006 to present); Assistant Treasurer, ACC (January 1995
to August 2006); Treasurer and Chief Financial Officer, various American Century
funds (July 2000 to August 2006); Also serves as: Senior Vice President, ACS
- --------------------------------------------------------------------------------
DAVID C. TUCKER, 4500 Main Street, Kansas City, MO 64111
YEAR OF BIRTH: 1958
POSITION(S) HELD WITH FUND: Senior Vice President and General Counsel
FIRST YEAR OF SERVICE: 2000
PRINCIPAL OCCUPATION(S) DURING PAST 5 YEARS: Vice President, ACC (February 2001
to present); General Counsel, ACC (June 1998 to present); Also serves as: Senior
Vice President and General Counsel, ACIM, ACGIM, ACS, ACIS and other ACC
subsidiaries
- --------------------------------------------------------------------------------
ROBERT LEACH, 4500 Main Street, Kansas City, MO 64111
YEAR OF BIRTH: 1966
POSITION(S) HELD WITH FUND: Vice President, Treasurer and Chief Financial
Officer
FIRST YEAR OF SERVICE: 1997
PRINCIPAL OCCUPATION(S) DURING PAST 5 YEARS: Vice President, ACS (February 2000
to present); Controller, various American Century funds (June 1997 to September
2006)
- --------------------------------------------------------------------------------
C. JEAN WADE, 4500 Main Street, Kansas City, MO 64111
YEAR OF BIRTH: 1964
POSITION(S) HELD WITH FUND: Controller
FIRST YEAR OF SERVICE: 2006
PRINCIPAL OCCUPATION(S) DURING PAST 5 YEARS: Vice President, ACS (February 2000
to present)
- --------------------------------------------------------------------------------
JON ZINDEL, 4500 Main Street, Kansas City, MO 64111
YEAR OF BIRTH: 1967
POSITION(S) HELD WITH FUND: Tax Officer
FIRST YEAR OF SERVICE: 1997
PRINCIPAL OCCUPATION(S) DURING PAST 5 YEARS: Senior Vice President, ACC (August
2006 to present); Vice President, ACC and certain ACC subsidiaries (October 2001
to August 2006); Vice President, Corporate Tax, ACS (April 1998 to August 2006);
Also serves as: Senior Vice President, ACIM, ACGIM, ACS, ACIS and other ACC
subsidiaries
- --------------------------------------------------------------------------------
The SAI has additional information about the funds' directors and is available
without charge, upon request, by calling 1-800-345-2021.
- ------
29
Additional Information
RETIREMENT ACCOUNT INFORMATION
As required by law, any distributions you receive from an IRA or certain 403(b),
457 and qualified plans [those not eligible for rollover to an IRA or to another
qualified plan] are subject to federal income tax withholding, unless you elect
not to have withholding apply. Tax will be withheld on the total amount
withdrawn even though you may be receiving amounts that are not subject to
withholding, such as nondeductible contributions. In such case, excess amounts
of withholding could occur. You may adjust your withholding election so that a
greater or lesser amount will be withheld.
If you don't want us to withhold on this amount, you must notify us to not
withhold the federal income tax. Even if you plan to roll over the amount you
withdraw to another tax-deferred account, the withholding rate still applies to
the withdrawn amount unless we have received notice not to withhold federal
income tax prior to the withdrawal. You may notify us in writing or in certain
situations by telephone or through other electronic means. You have the right to
revoke your withholding election at any time and any election you make may
remain in effect until revoked by filing a new election.
Remember, even if you elect not to have income tax withheld, you are liable for
paying income tax on the taxable portion of your withdrawal. If you elect not to
have income tax withheld or you don't have enough income tax withheld, you may
be responsible for payment of estimated tax. You may incur penalties under the
estimated tax rules if your withholding and estimated tax payments are not
sufficient.
State tax will be withheld if, at the time of your distribution, your address is
within one of the mandatory withholding states and you have federal income tax
withheld. State taxes will be withheld from your distribution in accordance with
the respective state rules.
PROXY VOTING GUIDELINES
American Century Investment Management, Inc., the funds' investment advisor, is
responsible for exercising the voting rights associated with the securities
purchased and/or held by the funds. A description of the policies and procedures
the advisor uses in fulfilling this responsibility is available without charge,
upon request, by calling 1-800-345-2021. It is also available on American
Century's website at americancentury.com and on the Securities and Exchange
Commission's website at sec.gov. Information regarding how the investment
advisor voted proxies relating to portfolio securities during the most recent
12-month period ended June 30 is available on the "About Us" page at
americancentury.com. It is also available at sec.gov.
QUARTERLY PORTFOLIO DISCLOSURE
The funds file their complete schedule of portfolio holdings with the Securities
and Exchange Commission (SEC) for the first and third quarters of each fiscal
year on Form N-Q. The funds' Forms N-Q are available on the SEC's website at
sec.gov, and may be reviewed and copied at the SEC's Public Reference Room in
Washington, DC. Information on the operation of the Public Reference Room may be
obtained by calling 1-800-SEC-0330. The funds also make their complete schedule
of portfolio holdings for the most recent quarter of their fiscal year available
on their website at americancentury.com and, upon request, by calling
1-800-345-2021.
- ------
30
Index Definitions
The following indices are used to illustrate investment market, sector, or style
performance or to serve as fund performance comparisons. They are not investment
products available for purchase.
The RUSSELL 1000(reg.sm) INDEX is a market-capitalization weighted, large-cap
index created by Frank Russell Company to measure the performance of the 1,000
largest companies in the Russell 3000 Index (the 3,000 largest publicly traded
U.S. companies, based on total market capitalization).
The RUSSELL 1000(reg.sm) GROWTH INDEX measures the performance of those Russell
1000 Index companies (the 1,000 largest of the 3,000 largest publicly traded
U.S. companies, based on total market capitalization) with higher price-to-book
ratios and higher forecasted growth rates.
The RUSSELL 2000(reg.sm) INDEX is a market-capitalization weighted index created
by Frank Russell Company to measure the performance of the 2,000 smallest of the
3,000 largest publicly traded U.S. companies, based on total market
capitalization.
The RUSSELL MIDCAP(reg.sm) INDEX measures the performance of the 800 smallest of
the 1,000 largest publicly traded U.S. companies, based on total market
capitalization.
The RUSSELL MIDCAP(reg.sm) GROWTH INDEX measures the performance of those
Russell Midcap Index companies (the 800 smallest of the 1,000 largest publicly
traded U.S. companies, based on total market capitalization) with higher
price-to-book ratios and higher forecasted growth values.
The S&P 500 INDEX is a market value-weighted index of the stocks of 500 publicly
traded U.S. companies chosen for market size, liquidity, and industry group
representation that are considered to be leading firms in dominant industries.
Each stock's weight in the index is proportionate to its market value. Created
by Standard & Poor's, it is considered to be a broad measure of U.S. stock
market performance.
- ------
31
Notes
- ------
32
CONTACT US
AMERICANCENTURY.COM
AUTOMATED INFORMATION LINE:
1-800-345-8765
INVESTOR SERVICES REPRESENTATIVE:
1-800-345-2021 or 816-531-5575
BUSINESS, NOT-FOR-PROFIT,
EMPLOYER-SPONSORED RETIREMENT PLANS:
1-800-345-3533
BANKS AND TRUST COMPANIES, BROKER-DEALERS,
FINANCIAL PROFESSIONALS, INSURANCE COMPANIES:
1-800-345-6488
TELECOMMUNICATIONS DEVICE FOR THE DEAF:
1-800-634-4113 or 816-444-3485
AMERICAN CENTURY MUTUAL FUNDS, INC.
INVESTMENT ADVISOR:
American Century Investment Management, Inc.
Kansas City, Missouri
THIS REPORT AND THE STATEMENTS IT CONTAINS ARE SUBMITTED FOR THE GENERAL
INFORMATION OF OUR SHAREHOLDERS. THE REPORT IS NOT AUTHORIZED FOR DISTRIBUTION
TO PROSPECTIVE INVESTORS UNLESS PRECEDED OR ACCOMPANIED BY AN EFFECTIVE
PROSPECTUS.
The American Century Investments logo, American Century
and American Century Investments are service marks
of American Century Proprietary Holdings, Inc.
0612
SH-ANN-52280N
American Century Investment Services, Inc., Distributor
(c)2006 American Century Proprietary Holdings, Inc. All rights reserved.
ITEM 2. CODE OF ETHICS.
a. The registrant has adopted a Code of Ethics for Senior Financial
Officers that applies to the registrant's principal executive officer,
principal financial officer, principal accounting officer, and persons
performing similar functions.
b. No response required.
c. None.
d. None.
e. Not applicable.
f. The registrant's Code of Ethics for Senior Financial Officers was
filed as Exhibit 12 (a)(1) to American Century Asset Allocation
Portfolios, Inc.'s Annual Certified Shareholder Report on Form N-CSR,
File No. 811-21591, on September 29, 2005, and is incorporated herein
by reference.
ITEM 3. AUDIT COMMITTEE FINANCIAL EXPERT.
(a)(1) The registrant's board has determined that the registrant has at least
one audit committee financial expert serving on its audit committee.
(a)(2) D.D. (Del) Hock, Donald H. Pratt and Thomas A. Brown are the
registrant's designated audit committee financial experts. They are
"independent" as defined in Item 3 of Form N-CSR.
(a)(3) Not applicable.
(b) No response required.
(c) No response required.
(d) No response required.
ITEM 4. PRINCIPAL ACCOUNTANT FEES AND SERVICES.
(a) Audit Fees.
The aggregate fees billed for each of the last two fiscal years for professional
services rendered by the principal accountant for the audit of the registrant's
annual financial statements or services that are normally provided by the
accountant in connection with statutory and regulatory filings or engagements
for those fiscal years were as follows:
FY 2005: $218,979
FY 2006: $270,281
(b) Audit-Related Fees.
The aggregate fees billed in each of the last two fiscal years for assurance and
related services by the principal accountant that are reasonably related to the
performance of the audit of the registrant's financial statements and are not
reported under paragraph (a) of this Item were as follows:
For services rendered to the registrant:
FY 2005: $0
FY 2006: $0
Fees required to be approved pursuant to paragraph (c)(7)(ii) of Rule
2-01 of Regulation S-X (relating to certain engagements for non-audit
services with the registrant's investment adviser and its affiliates):
FY 2005: $0
FY 2006: $0
(c) Tax Fees.
The aggregate fees billed in each of the last two fiscal years for professional
services rendered by the principal accountant for tax compliance, tax advice,
and tax planning were as follows:
For services rendered to the registrant:
FY 2005: $21,496
FY 2006: $33,106
These services included review of federal and state income tax forms
and federal excise tax forms.
Fees required to be approved pursuant to paragraph (c)(7)(ii) of Rule
2-01 of Regulation S-X (relating to certain engagements for non-audit
services with the registrant's investment adviser and its affiliates):
FY 2005: $0
FY 2006: $0
(d) All Other Fees.
The aggregate fees billed in each of the last two fiscal years for products and
services provided by the principal accountant, other than the services reported
in paragraphs (a) through (c) of this Item were as follows:
For services rendered to the registrant:
FY 2005: $0
FY 2006: $0
Fees required to be approved pursuant to paragraph (c)(7)(ii) of Rule
2-01 of Regulation S-X (relating to certain engagements for non-audit
services with the registrant's investment adviser and its affiliates):
FY 2005: $0
FY 2006: $0
(e)(1) In accordance with paragraph (c)(7)(i)(A) of Rule 2-01 of Regulation
S-X, before the accountant is engaged by the registrant to render
audit or non-audit services, the engagement is approved by the
registrant's audit committee. Pursuant to paragraph (c)(7)(ii) of Rule
2-01 of Regulation S-X, the registrant's audit committee also
pre-approves its accountant's engagements for non-audit services with
the registrant's investment adviser, its parent company, and any
entity controlled by, or under common control with the investment
adviser that provides ongoing services to the registrant, if the
engagement relates directly to the operations and financial reporting
of the registrant.
(e)(2) All services described in each of paragraphs (b) through (d) of this
Item were pre-approved before the engagement by the registrant's audit
committee pursuant to paragraph (c)(7)(i)(A) of Rule 2-01 of
Regulation S-X. Consequently, none of such services were required to
be approved by the audit committee pursuant to paragraph (c)(7)(i)(C).
(f) The percentage of hours expended on the principal accountant's
engagement to audit the registrant's financial statements for the most
recent fiscal year that were attributed to work performed by persons
other than the principal accountant's full-time, permanent employees
was less than 50%.
(g) The aggregate non-audit fees billed by the registrant's accountant for
services rendered to the registrant, and rendered to the registrant's
investment adviser (not including any sub-adviser whose role is
primarily portfolio management and is subcontracted with or overseen
by another investment adviser), and any entity controlling, controlled
by, or under common control with the adviser that provides ongoing
services to the registrant for each of the last two fiscal years of
the registrant were as follows:
FY 2005: $183,792
FY 2006: $207,647
(h) The registrant's investment adviser and accountant have notified the
registrant's audit committee of all non-audit services that were
rendered by the registrant's accountant to the registrant's investment
adviser, its parent company, and any entity controlled by, or under
common control with the investment adviser that provides services to
the registrant, which services were not required to be pre-approved
pursuant to paragraph (c)(7)(ii) of Rule 2-01 of Regulation S-X. The
notification provided to the registrant's audit committee included
sufficient details regarding such services to allow the registrant's
audit committee to consider the continuing independence of its
principal accountant.
ITEM 5. AUDIT COMMITTEE OF LISTED REGISTRANTS.
Not applicable.
ITEM 6. SCHEDULE OF INVESTMENTS.
The schedule of investments is included as part of the report to stockholders
filed under Item 1 of this Form.
ITEM 7. DISCLOSURE OF PROXY VOTING POLICIES AND PROCEDURES FOR CLOSED-END
MANAGEMENT INVESTMENT COMPANIES.
Not applicable.
ITEM 8. PORTFOLIO MANAGERS OF CLOSED-END MANAGEMENT INVESTMENT COMPANIES.
Not applicable.
ITEM 9. PURCHASES OF EQUITY SECURITIES BY CLOSED-END MANAGEMENT INVESTMENT
COMPANY AND AFFILIATED PURCHASERS.
Not applicable.
ITEM 10. SUBMISSION OF MATTERS TO A VOTE OF SECURITY HOLDERS.
During the reporting period, there were no material changes to the procedures by
which shareholders may recommend nominees to the registrant's board.
ITEM 11. CONTROLS AND PROCEDURES.
(a) The registrant's principal executive officer and principal financial
officer have concluded that the registrant's disclosure controls and
procedures (as defined in Rule 30a-3(c) under the Investment Company Act of
1940) are effective based on their evaluation of these controls and
procedures as of a date within 90 days of the filing date of this report.
(b) There were no changes in the registrant's internal control over financial
reporting (as defined in Rule 30a-3(d) under the Investment Company Act of
1940) that occurred during the registrant's second fiscal quarter of the
period covered by this report that have materially affected, or are
reasonably likely to materially affect, the registrant's internal control
over financial reporting.
ITEM 12. EXHIBITS.
(a)(1) Registrant's Code of Ethics for Senior Financial Officers, which is the
subject of the disclosure required by Item 2 of Form N-CSR, was filed
as Exhibit 12(a)(1) to American Century Asset Allocation Portfolios,
Inc.'s Certified Shareholder Report on Form N-CSR, File No. 811-21591,
on September 29, 2005.
(a)(2) Separate certifications by the registrant's principal executive officer
and principal financial officer, pursuant to Section 302 of the
Sarbanes-Oxley Act of 2002 and Rule 30a-2(a) under the Investment
Company Act of 1940, are filed and attached hereto as Exhibit
99.302CERT.
(a)(3) Not applicable.
(b) A certification by the registrant's chief executive officer and chief
financial officer, pursuant to Section 906 of the Sarbanes-Oxley Act of
2002, is furnished and attached hereto as Exhibit 99.906CERT.
SIGNATURES
Pursuant to the requirements of the Securities Exchange Act of 1934 and the
Investment Company Act of 1940, the registrant has duly caused this report to be
signed on its behalf by the undersigned, thereunto duly authorized.
Registrant: AMERICAN CENTURY MUTUAL FUNDS, INC.
By: /s/ William M. Lyons
-----------------------------------------------
Name: William M. Lyons
Title: President
Date: December 26, 2006
Pursuant to the requirements of the Securities Exchange Act of 1934 and the
Investment Company Act of 1940, this report has been signed below by the
following persons on behalf of the registrant and in the capacities and on the
dates indicated.
By: /s/ William M. Lyons
-----------------------------------------------
Name: William M. Lyons
Title: President
(principal executive officer)
Date: December 26, 2006
By: /s/ Robert J. Leach
-----------------------------------------------
Name: Robert J. Leach
Title: Vice President, Treasurer, and
Chief Financial Officer
(principal financial officer)
Date: December 26, 2006