| | |
| UNITED STATES |
| SECURITIES AND EXCHANGE COMMISSION |
| Washington, D.C. 20549 |
| |
| FORM N-CSR |
|
| CERTIFIED SHAREHOLDER REPORT OF REGISTERED |
| MANAGEMENT INVESTMENT COMPANIES |
| | |
| Investment Company Act file number | 811-00816 |
| |
| AMERICAN CENTURY MUTUAL FUNDS, INC. |
| (Exact name of registrant as specified in charter) |
| |
| 4500 MAIN STREET, KANSAS CITY, MISSOURI | 64111 |
| (Address of principal executive offices) | | (Zip Code) |
| |
| CHARLES A. ETHERINGTON |
| 4500 MAIN STREET, KANSAS CITY, MISSOURI 64111 |
| (Name and address of agent for service) |
| |
| Registrant’s telephone number, including area code: | 816-531-5575 |
| |
| Date of fiscal year end: | 10-31 |
| |
| Date of reporting period: | 10-31-2009 |
ITEM 1. REPORTS TO STOCKHOLDERS. |
|
| Annual Report |
| October 31, 2009 |

|
| American Century Investments |
Ultra® Fund
| |
| President’s Letter | 2 |
| Independent Chairman’s Letter | 3 |
| Market Perspective | 4 |
| U.S. Stock Index Returns | 4 |
| |
| Ultra | |
| |
| Performance | 5 |
| Portfolio Commentary | 7 |
| Top Ten Holdings | 9 |
| Top Five Industries | 9 |
| Types of Investments in Portfolio | 9 |
| |
| Shareholder Fee Example | 10 |
| |
| Financial Statements | |
| |
| Schedule of Investments | 12 |
| Statement of Assets and Liabilities | 15 |
| Statement of Operations | 17 |
| Statement of Changes in Net Assets | 18 |
| Notes to Financial Statements | 19 |
| Financial Highlights | 26 |
| Report of Independent Registered Public Accounting Firm | 32 |
| |
| Other Information | |
| |
| Management | 33 |
| Approval of Management Agreement | 36 |
| Additional Information | 41 |
| Index Definitions | 42 |
The opinions expressed in the Market Perspective and the Portfolio Commentary reflect those of the portfolio management team as of the date of the report, and do not necessarily represent the opinions of American Century Investments or any other person in the American Century Investments organization. Any such opinions are subject to change at any time based upon market or other conditions and American Century Investments disclaims any responsibility to update such opinions. These opinions may not be relied upon as investment advice and, because investment decisions made by American Century Investments funds are based on numerous factors, may not be relied upon as an indication of trading intent on behalf of any American Century Investments fund. Security examples are used for representational purposes only and are not intended as recommendations to purchase or sell securities. Performance information for comparative i ndices and securities is provided to American Century Investments by third party vendors. To the best of American Century Investments’ knowledge, such information is accurate at the time of printing.

Dear Investor:
Thank you for taking time to review the following pages, which provide the performance of your investment along with the perspectives of our experienced portfolio management team for the financial reporting period ended October 31, 2009. We appreciate your trust in American Century Investments® at this volatile, transitional time in the economy and investment markets.
As the upheavals associated with the “Great Recession” gradually subside, our senior management team has put considerable thought into how the investment environment has changed and what new challenges and opportunities await us. Critical factors that we are anticipating in the coming year include marked shifts in investment and spending behavior, along with consolidation in our industry.
Most importantly, we think the economic recovery will be slow and extended. The economy and capital markets have come a long way since Lehman Brothers collapsed in the third quarter of 2008, but 2010 will likely bring continuing challenges. The stock market’s rebound since last March and the third-quarter economic surge in 2009 were fueled largely by corporate cost-cutting and unprecedented monetary and fiscal stimulus, including some key programs that have since expired or been scaled back.
Meanwhile, the resilient but struggling consumer sector still faces double-digit unemployment, heavy debt burdens, tight credit conditions, and a housing market that is starting to stabilize, but remains vulnerable. Much of our investment positioning in 2009 cautiously reflected these still unstable economic fundamentals, leading to underperformance, in some cases, versus market benchmarks buoyed by the rally of riskier assets. We still support our fundamentally based positioning because we believe strongly that some markets—driven more by technical factors than fundamentals—have advanced further than underlying economic conditions warrant, and remain susceptible to the possibility of more volatility ahead.
Thank you for your continued confidence in us.
Sincerely,

Jonathan Thomas
President and Chief Executive Officer
American Century Investments
2
|
| Independent Chairman’s Letter |

In my first letter to shareholders of the American Century Investments funds, I invited you to contact me with your questions. I have been gratified with your response. Most shareholder inquiries to date have related to specific fund performance issues. As I noted in my individual responses, your board through the Fund Performance Committee continues to stress improved performance in our quarterly meetings with chief investment officers and fund managers.
An important part of our fund performance review process is a face-to-face meeting with portfolio managers. The board traveled during the second quarter to the American Century Investments office in Mountain View, California to meet with the fund of funds and asset allocation portfolio management teams. These meetings validated the importance of thorough reviews of investment opportunities by the credit management personnel resident in that office. As a result of their efforts, American Century Investments funds were able to avoid the “toxic assets” that plagued many other fund families in 2008.
From April through June 2009, the board conducted its annual review of the advisory contracts between American Century Investments and each fund. Our efforts involved a review of fund information, including assets under management; total expense ratio compared to peers; economies of scale; fee breakpoints that reduce shareholder costs as assets increase; performance compared to peers and benchmarks; and the quality of services provided to fund shareholders. A detailed discussion of board considerations in connection with advisory contract renewal is included annually in each fund’s shareholder reports. During this review, the board focuses on a detailed comparison of the competitive position of each fund and has negotiated more than 60 breakpoints or fee reductions in the past five years.
The board looks forward to another year of work on your behalf and your comments are appreciated. You are invited to email me at dhpratt@fundboardchair.com.
Don Pratt
3

By Greg Woodhams, Chief Investment Officer, U.S. Growth Equity—Large Cap
Signs of Economic Recovery Boosted Stocks
The year ended October 31, 2009, was a period of extremes for the U.S. stock market. The market began the period in the midst of a historically steep decline, then finished the period with one of its strongest rallies since the 1930s. The market’s dramatic swings resulted from rapidly shifting expectations regarding the economic and financial environment.
Stocks fell sharply in late 2008 and early 2009 as investors grew increasingly concerned about a deep economic downturn and a lack of liquidity in the credit markets. In response, the federal government took unprecedented actions to shore up the credit sector, support the housing market, and revive the stalled economy.
These efforts began to bear fruit in the spring of 2009 as signs of economic stabilization emerged. Although the unemployment rate continued to climb, reaching a 26-year high of 10.2% by October, the broader economy showed evidence of improvement, producing real growth in the third quarter of 2009—the first positive quarterly growth in more than a year. In addition, cost-management efforts at many companies helped generate better-than-expected earnings in the second and third quarters.
As a result, the equity market reached a multi-year low on March 9 and then reversed course, rising steadily throughout the last seven months of the period. The rally helped erase the market’s earlier losses, enabling the major stock indexes to produce gains of approximately 10% overall. Growth stocks outperformed value shares by a wide margin (see the table below) across all market capitalizations, though they lagged modestly over the last six months.
Economic Challenges Remain
Although recent economic trends have been encouraging, the recovery will likely be gradual until there is sustained improvement in the delinquency levels of consumer debt and the unemployment rate. Thus far, the U.S. consumer has been conspicuously absent from the recovery, and given the weakness in the U.S. dollar and improving economic conditions elsewhere in the world, we may see an export-led recovery until the consumer gets back on firmer footing.
| | | | |
| U.S. Stock Index Returns | | | | |
| For the 12 months ended October 31, 2009 | | | |
| Russell 1000 Index (Large-Cap) | 11.20% | | Russell 2000 Index (Small-Cap) | 6.46% |
| Russell 1000 Growth Index | 17.51% | | Russell 2000 Growth Index | 11.34% |
| Russell 1000 Value Index | 4.78% | | Russell 2000 Value Index | 1.96% |
| Russell Midcap Index | 18.75% | | | |
| Russell Midcap Growth Index | 22.48% | | | |
| Russell Midcap Value Index | 14.52% | | | |
4
| | | | | | |
| Ultra | | | | | |
| |
| Total Returns as of October 31, 2009 | | | | |
| | | | Average Annual Returns | |
| | | | | | Since | Inception |
| | | 1 year | 5 years | 10 years | Inception | Date |
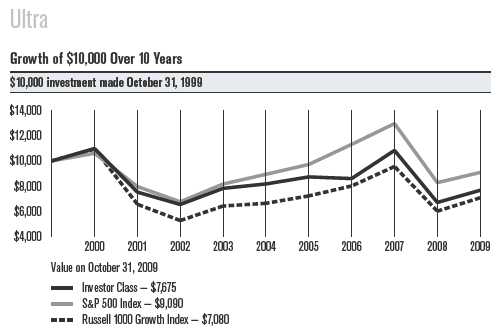
| Investor Class | 14.35% | -1.26% | -2.61% | 10.69% | 11/2/81 |
| Russell 1000 Growth Index(1) | 17.51% | 1.27% | -3.39% | 9.65%(2) | — |
| S&P 500 Index(1) | 9.80% | 0.33% | -0.95% | 10.92%(2) | — |
| Institutional Class | 14.58% | -1.06% | -2.42% | 3.01% | 11/14/96 |
| A Class(3) | | | | | 10/2/96 |
| No sales charge* | 14.14% | -1.49% | -2.84% | 2.86% | |
| With sales charge* | 7.58% | -2.66% | -3.42% | 2.39% | |
| B Class | | | | | 9/28/07 |
| No sales charge* | 13.23% | — | — | -13.69% | |
| With sales charge* | 9.23% | — | — | -15.39% | |
| C Class | 13.20% | -2.24% | — | -0.97% | 10/29/01 |
| R Class | 13.84% | -1.74% | — | -0.08% | 8/29/03 |
| *Sales charges include initial sales charges and contingent deferred sales charges (CDSCs), as applicable. A Class shares have a 5.75% |
| maximum initial sales charge for equity funds and may be subject to a maximum CDSC of 1.00%. B Class shares redeemed within six |
| years of purchase are subject to a CDSC that declines from 5.00% during the first year after purchase to 0.00% the sixth year after |
| purchase. C Class shares redeemed within 12 months of purchase are subject to a maximum CDSC of 1.00%. The SEC requires that |
| mutual funds provide performance information net of maximum sales charges in all cases where charges could be applied. |
| |
| (1) | Data provided by Lipper Inc. — A Reuters Company. © 2009 Reuters. All rights reserved. Any copying, republication or redistribution of Lipper |
| | content, including by caching, framing or similar means, is expressly prohibited without the prior written consent of Lipper. Lipper shall not be |
| | liable for any errors or delays in the content, or for any actions taken in reliance thereon. | | | |
| | The data contained herein has been obtained from company reports, financial reporting services, periodicals and other resources believed to be |
| | reliable. Although carefully verified, data on compilations is not guaranteed by Lipper and may be incomplete. No offer or solicitations to buy or |
| | sell any of the securities herein is being made by Lipper. | | | | |
| (2) | Since 10/31/81, the date nearest the Investor Class’s inception for which data are available. | | |
| (3) | Prior to September 4, 2007, the A Class was referred to as the Advisor Class. Performance, with sales charge, prior to that date has been |
| | adjusted to reflect the A Class’s current sales charge. | | | | |
Data presented reflect past performance. Past performance is no guarantee of future results. Current performance may be higher or lower than the performance shown. Investment return and principal value will fluctuate, and redemption value may be more or less than original cost. To obtain performance data current to the most recent month end, please call 1-800-345-2021 or visit americancentury.com. International investing involves special risks, such as political instability and currency fluctuations.
Unless otherwise indicated, performance reflects Investor Class shares; performance for other share classes will vary due to differences in fee structure. For information about other share classes available, please consult the prospectus. Data assumes reinvestment of dividends and capital gains, and none of the charts reflect the deduction of taxes that a shareholder would pay on fund distributions or the redemption of fund shares. Returns for the indices are provided for comparison. The fund’s total returns include operating expenses (such as transaction costs and management fees) that reduce returns, while the total returns of the indices do not.
5
| | | | | | | | | | |
| One-Year Returns Over 10 Years | | | | | | | |
| Periods ended October 31 | | | | | | | | | |
| | 2000 | 2001 | 2002 | 2003 | 2004 | 2005 | 2006 | 2007 | 2008 | 2009 |
| Investor Class | 9.81% | -31.44% | -12.99% | 19.50% | 4.46% | 6.81% | -1.51% | 25.89% | -38.02% | 14.35% |
| Russell 1000 | | | | | | | | | | |
| Growth Index | 9.33% | -39.95% | -19.62% | 21.81% | 3.38% | 8.81% | 10.84% | 19.23% | -36.95% | 17.51% |
| S&P 500 Index | 6.09% | -24.90% | -15.11% | 20.80% | 9.42% | 8.72% | 16.34% | 14.56% | -36.10% | 9.80% |
| | | | | | | | | | | |
| Total Annual Fund Operating Expenses | | | | | | |
| | Institutional | | | | | | | | |
| Investor Class | Class | A Class | B Class | C Class | R Class |
| 0.99% | 0.79% | 1.24% | 1.99% | 1.99% | 1.49% |
The total annual fund operating expenses shown is as stated in the fund’s prospectus current as of the date of this report. The prospectus may vary from the expense ratio shown elsewhere in this report because it is based on a different time period, includes acquired fund fees and expenses, and, if applicable, does not include fee waivers or expense reimbursements.
Data presented reflect past performance. Past performance is no guarantee of future results. Current performance may be higher or lower than the performance shown. Investment return and principal value will fluctuate, and redemption value may be more or less than original cost. To obtain performance data current to the most recent month end, please call 1-800-345-2021 or visit americancentury.com. International investing involves special risks, such as political instability and currency fluctu ations.
Unless otherwise indicated, performance reflects Investor Class shares; performance for other share classes will vary due to differences in fee structure. For information about other share classes available, please consult the prospectus. Data assumes reinvestment of dividends and capital gains, and none of the charts reflect the deduction of taxes that a shareholder would pay on fund distributions or the redemption of fund shares. Returns for the indices are provided for comparison. The fund’s total returns include operating expenses (such as transaction costs and management fees) that reduce returns, while the total returns of the indices do not.
6
Ultra
Portfolio Managers: Keith Lee and Michael Li
Performance Summary
Ultra returned 14.35%* for the fiscal year ended October 31, 2009, trailing the 17.51% return of the fund’s benchmark, the Russell 1000 Growth Index, but outpacing the 9.80% return of the broad S&P 500 Index.
The 12-month period was one of the most volatile in the history of the U.S. stock market, featuring a plunge of approximately 30%, followed by a sharp rally of more than 55%. The volatility reflected an extraordinary swing in market sentiment resulting from a sudden change in perception about the direction of the U.S. economy. The initial market decline was driven by rampant pessimism in the face of a recession, a financial sector on the verge of collapse, and a deep freeze in the credit markets. But when signs of economic stabilization began to appear, along with improving financial and credit conditions, confidence and optimism returned to the equity market, producing a dramatic rebound in stock prices.
Given that backdrop, Ultra posted a double-digit gain for the 12-month period and outperformed the broad stock market indices. However, the fund underperformed its growth-oriented benchmark index as price momentum and accelerating growth—key factors in Ultra’s investment process—were out of favor for much of the period, creating significant performance headwinds. In addition, the rally during the last seven months of the period was led by lower-quality stocks, whereas we emphasize higher-quality companies in the Ultra portfolio.
Despite these challenges, we remained committed to our long-term investment philosophy, and the positive impact of our stock selection process helped mitigate the overall underperformance versus the benchmark.
Health Care Lagged
The fund’s health care holdings had the biggest negative impact on performance versus the Russell 1000 Growth Index. Stock selection among biotechnology firms and an underweight position in pharmaceutical companies contributed the lion’s share of the underperformance in this sector.
The portfolio’s biggest individual detractor was biotech company Genzyme, which makes “orphan” medications that treat rare genetic diseases. The company has a strong product lineup and favorable market position, but the stock was hurt by poor execution—Genzyme faced FDA approval delays on one of its new products and was forced to temporarily shutter a production facility because of viral contamination. These issues weighed on the company’s earnings and cast doubts on its quality-control practices.
*All fund returns referenced in this commentary are for Investor Class shares.
7
Ultra
Other notable detractors in the health care sector included cancer treatment developer Celgene, which reported disappointing sales of its core drug Revlimid in early 2009, and health services provider UnitedHealth Group, whose stock has been negatively impacted by uncertainty related to health care reform.
Materials and Consumer Staples Detracted
The portfolio’s materials and consumer staples holdings also underper-formed their counterparts in the benchmark index. Virtually all of the underperformance in the materials sector resulted from stock selection and an overweight position in chemicals companies. The most significant detractor was agricultural products maker Monsanto, which slumped as increased price competition from a generic version of its Roundup herbicide in China weighed on earnings. Beyond this short-term issue, however, we believe Monsanto’s patent seed business will drive robust long-term growth for the company in a global environment of diminishing resources and arable land.
In the consumer staples sector, a heavy weighting in discount retailer Wal-Mart—the fund’s largest holding on average during the 12-month period—detracted the most. Wal-Mart held up well during the market decline in late 2008 and early 2009 but has underperformed during the recent rally as investors flocked to more cyclical stocks.
Technology and Consumer Discretionary Outperformed
On the positive side, the fund’s information technology and consumer discretionary holdings were the best absolute performers and also added value versus the Russell 1000 Growth Index. The outperformance in the technology sector was driven largely by strong results among Internet companies. Online search and advertising firm Baidu—one of the best-positioned Chinese companies—posted healthy revenue growth and gained market share in China, where e-commerce penetration is relatively low. Chinese Internet portal Tencent Holdings also fared well, benefiting from strength in online gaming. These two stocks were among several foreign holdings that contributed meaningfully to both absolute and relative performance.
Internet retailer Amazon.com was the big winner in the consumer discretionary sector and the portfolio’s top contributor. Amazon delivered consistently strong revenue growth and reinforced its competitive position by adding more products and categories. Other top performers included department store chain Kohl’s, which benefited from rising sales of private-label brands, and comic book publisher Marvel Entertainment, which was acquired by Disney.
A Look Ahead
The U.S. economy appears to be on the road to recovery as we move into 2010, but the pace of this recovery remains uncertain. Our emphasis will remain on executing our disciplined investment process, which seeks high-quality stocks exhibiting price momentum, accelerating growth, positive relative strength, and attractive valuations.
8
| | | |
| Ultra | | |
| |
| Top Ten Holdings as of October 31, 2009 | | |
| | | % of net assets | % of net assets |
| | | as of 10/31/09 | as of 4/30/09 |
| Google, Inc., Class A | 4.1% | 3.2% |
| Apple, Inc. | 3.9% | 3.0% |
| Microsoft Corp. | 2.8% | 2.8% |
| Wal-Mart Stores, Inc. | 2.8% | 3.0% |
| Cisco Systems, Inc. | 2.7% | 2.8% |
| Hewlett-Packard Co. | 2.6% | 2.3% |
| Express Scripts, Inc. | 2.5% | 2.3% |
| Amazon.com, Inc. | 2.5% | 1.0% |
| Coca-Cola Co. (The) | 2.5% | 1.7% |
| QUALCOMM, Inc. | 2.2% | 2.4% |
| |
| Top Five Industries as of October 31, 2009 | | |
| | | % of net assets | % of net assets |
| | | as of 10/31/09 | as of 4/30/09 |
| Computers & Peripherals | 7.8% | 6.3% |
| Software | 7.5% | 7.0% |
| Internet Software & Services | 5.6% | 4.3% |
| Communications Equipment | 4.9% | 5.2% |
| Food & Staples Retailing | 4.2% | 4.1% |
| |
| Types of Investments in Portfolio | | |
| | | % of net assets | % of net assets |
| | | as of 10/31/09 | as of 4/30/09 |
| Domestic Common Stocks | 91.9% | 94.2% |
| Foreign Common Stocks(1) | 7.7% | 5.4% |
| Total Common Stocks | 99.6% | 99.6% |
| Temporary Cash Investments | 0.4% | 0.8% |
| Other Assets and Liabilities | —(2) | (0.4)% |
| (1) | Includes depositary shares, dual listed securities and foreign ordinary shares. | | |
| (2) | Category is less than 0.05% of total net assets. | | |
9
|
| Shareholder Fee Example (Unaudited) |
Fund shareholders may incur two types of costs: (1) transaction costs, including sales charges (loads) on purchase payments and redemption/ exchange fees; and (2) ongoing costs, including management fees; distribution and service (12b-1) fees; and other fund expenses. This example is intended to help you understand your ongoing costs (in dollars) of investing in your fund and to compare these costs with the ongoing cost of investing in other mutual funds.
The example is based on an investment of $1,000 made at the beginning of the period and held for the entire period from May 1, 2009 to October 31, 2009.
Actual Expenses
The table provides information about actual account values and actual expenses for each class. You may use the information, together with the amount you invested, to estimate the expenses that you paid over the period. First, identify the share class you own. Then simply divide your account value by $1,000 (for example, an $8,600 account value divided by $1,000 = 8.6), then multiply the result by the number under the heading “Expenses Paid During Period” to estimate the expenses you paid on your account during this period.
If you hold Investor Class shares of any American Century Investments fund, or Institutional Class shares of the American Century Diversified Bond Fund, in an American Century Investments account (i.e., not a financial intermediary or retirement plan account), American Century Investments may charge you a $12.50 semiannual account maintenance fee if the value of those shares is less than $10,000. We will redeem shares automatically in one of your accounts to pay the $12.50 fee. In determining your total eligible investment amount, we will include your investments in all personal accounts (including American Century Investments Brokerage accounts) registered under your Social Security number. Personal accounts include individual accounts, joint accounts, UGMA/UTMA accounts, personal trusts, Coverdell Education Savings Accounts and IRAs (including traditional, Roth, Rollover, SEP-, SARSEP- and SIMPLE-IRAs), and certain other retirement accounts. If you have only business, business retirement, employer-sponsored or American Century Investments Brokerage accounts, you are currently not subject to this fee. We will not charge the fee as long as you choose to manage your accounts exclusively online. If you are subject to the Account Maintenance Fee, your account value could be reduced by the fee amount.
Hypothetical Example for Comparison Purposes
The table also provides information about hypothetical account values and hypothetical expenses based on the actual expense ratio of each class of your fund and an assumed rate of return of 5% per year before expenses, which is not the actual return of a fund’s share class. The hypothetical account values and expenses may not be used to estimate the actual ending account balance or expenses you paid for the period. You may use this information to compare the ongoing costs of investing in your fund and other funds. To do so, compare this 5% hypothetical example with the 5% hypothetical examples that appear in the shareholder reports of the other funds.
10
Please note that the expenses shown in the table are meant to highlight your ongoing costs only and do not reflect any transactional costs, such as sales charges (loads) or redemption/exchange fees. Therefore, the table is useful in comparing ongoing costs only, and will not help you determine the relative total costs of owning different funds. In addition, if these transactional costs were included, your costs would have been higher.
| | | | |
| | Beginning | Ending | Expenses Paid | |
| | Account Value | Account Value | During Period* | Annualized |
| | 5/1/09 | 10/31/09 | 5/1/09 – 10/31/09 | Expense Ratio* |
| Actual | | | | |
| Investor Class | $1,000 | $1,183.30 | $5.50 | 1.00% |
| Institutional Class | $1,000 | $1,184.70 | $4.41 | 0.80% |
| A Class | $1,000 | $1,182.10 | $6.88 | 1.25% |
| B Class | $1,000 | $1,177.20 | $10.98 | 2.00% |
| C Class | $1,000 | $1,177.20 | $10.98 | 2.00% |
| R Class | $1,000 | $1,180.60 | $8.24 | 1.50% |
| Hypothetical | | | | |
| Investor Class | $1,000 | $1,020.16 | $5.09 | 1.00% |
| Institutional Class | $1,000 | $1,021.17 | $4.08 | 0.80% |
| A Class | $1,000 | $1,018.90 | $6.36 | 1.25% |
| B Class | $1,000 | $1,015.12 | $10.16 | 2.00% |
| C Class | $1,000 | $1,015.12 | $10.16 | 2.00% |
| R Class | $1,000 | $1,017.64 | $7.63 | 1.50% |
| *Expenses are equal to the class’s annualized expense ratio listed in the table above, multiplied by the average account value over the period, |
| multiplied by 184, the number of days in the most recent fiscal half-year, divided by 365, to reflect the one-half year period. |
11
|
| Schedule of Investments |
| Ultra |
| | | | | | |
| OCTOBER 31, 2009 | | | | | | |
| |
| | Shares | Value | | | Shares | Value |
| Common Stocks — 99.6% | | | ELECTRICAL EQUIPMENT — 3.7% | |
| | | | | ABB Ltd.(1) | 1,285,000 | $ 23,938,378 |
| AEROSPACE & DEFENSE — 1.7% | | | | | |
| General Dynamics Corp. | 1,530,000 | $ 95,931,000 | | ABB Ltd. ADR(1) | 2,130,000 | 39,468,900 |
| BEVERAGES — 2.9% | | | | Cooper Industries plc, | | |
| | | | | Class A | 1,461,000 | 56,526,090 |
| Coca-Cola Co. (The) | 2,577,000 | 137,379,870 | | | | |
| | | | | Emerson Electric Co. | 2,353,000 | 88,825,750 |
| PepsiCo, Inc. | 437,000 | 26,460,350 | | | | |
| | | | | | | 208,759,118 |
| | | 163,840,220 | | | | |
| | | | | ENERGY EQUIPMENT & SERVICES — 1.8% | |
| BIOTECHNOLOGY — 4.1% | | | | | | |
| | | | | Oceaneering | | |
| Alexion | | | | International, Inc.(1) | 297,000 | 15,176,700 |
| Pharmaceuticals, Inc.(1) | 795,000 | 35,305,950 | | | | |
| | | | | Schlumberger Ltd. | 1,342,000 | 83,472,400 |
| Celgene Corp.(1) | 1,270,000 | 64,833,500 | | | | |
| | | | | | | 98,649,100 |
| Genzyme Corp.(1) | 390,000 | 19,734,000 | | | | |
| | | | | FOOD & STAPLES RETAILING — 4.2% | |
| Gilead Sciences, Inc.(1) | 2,565,000 | 109,140,750 | | | | |
| | | | | Costco Wholesale Corp. | 1,347,000 | 76,576,950 |
| | | 229,014,200 | | Wal-Mart Stores, Inc. | 3,154,000 | 156,690,720 |
| CAPITAL MARKETS — 3.4% | | | | | | 233,267,670 |
| BlackRock, Inc. | 223,000 | 48,277,270 | | FOOD PRODUCTS — 2.4% | | |
| Charles Schwab Corp. (The) | 4,051,000 | 70,244,340 | | General Mills, Inc. | 1,094,000 | 72,116,480 |
| Goldman Sachs | | | | Nestle SA | 1,353,000 | 62,894,221 |
| Group, Inc. (The) | 410,000 | 69,769,700 | | | | |
| | | 188,291,310 | | | | 135,010,701 |
| CHEMICALS — 3.1% | | | | HEALTH CARE EQUIPMENT & SUPPLIES — 3.0% |
| Monsanto Co. | 1,338,000 | 89,886,840 | | Baxter International, Inc. | 1,356,000 | 73,305,360 |
| | | | | Gen-Probe, Inc.(1) | 443,000 | 18,481,960 |
| Mosaic Co. (The) | 1,062,000 | 49,627,260 | | | | |
| | | | | Intuitive Surgical, Inc.(1) | 98,000 | 24,142,300 |
| Nalco Holding Co. | 1,489,000 | 31,492,350 | | | | |
| | | 171,006,450 | | NuVasive, Inc.(1) | 501,000 | 18,181,290 |
| COMMUNICATIONS EQUIPMENT — 4.9% | | | Varian Medical | | |
| | | | | Systems, Inc.(1) | 780,000 | 31,964,400 |
| Cisco Systems, Inc.(1) | 6,656,000 | 152,089,600 | | | | |
| | | | | | | 166,075,310 |
| QUALCOMM, Inc. | 2,899,000 | 120,047,590 | | HEALTH CARE PROVIDERS & SERVICES — 4.1% |
| | | 272,137,190 | | Express Scripts, Inc.(1) | 1,759,000 | 140,579,280 |
| COMPUTERS & PERIPHERALS — 7.8% | | | | | |
| | | | | Medco Health | | |
| Apple, Inc.(1) | 1,167,000 | 219,979,500 | | Solutions, Inc.(1) | 206,000 | 11,560,720 |
| EMC Corp.(1) | 4,315,000 | 71,068,050 | | UnitedHealth Group, Inc. | 2,902,000 | 75,306,900 |
| Hewlett-Packard Co. | 3,105,000 | 147,363,300 | | | | 227,446,900 |
| | | 438,410,850 | | HOTELS, RESTAURANTS & LEISURE — 2.6% | |
| CONSTRUCTION & ENGINEERING — 0.2% | | | Intercontinental Hotels | | |
| Fluor Corp. | 306,000 | 13,592,520 | | Group plc | 1,749,462 | 22,403,307 |
| CONSUMER FINANCE — 0.6% | | | | McDonald’s Corp. | 1,696,000 | 99,402,560 |
| American Express Co. | 1,025,000 | 35,711,000 | | Yum! Brands, Inc. | 641,000 | 21,120,950 |
| DIVERSIFIED FINANCIAL SERVICES — 2.6% | | | | | 142,926,817 |
| CME Group, Inc. | 269,000 | 81,402,090 | | HOUSEHOLD PRODUCTS — 1.8% | |
| JPMorgan Chase & Co. | 1,561,000 | 65,202,970 | | Colgate-Palmolive Co. | 1,263,000 | 99,309,690 |
| | | 146,605,060 | | INSURANCE — 1.4% | | |
| | | | | MetLife, Inc. | 2,256,000 | 76,771,680 |
12
| | | | | | |
| Ultra | | | | | | |
| |
| | Shares | Value | | | Shares | Value |
| INTERNET & CATALOG RETAIL — 2.5% | | | ASML Holding NV | 1,748,000 | $ 47,059,443 |
| Amazon.com, Inc.(1) | 1,175,000 | $ 139,601,750 | | Linear Technology Corp. | 1,722,000 | 44,565,360 |
| INTERNET SOFTWARE & SERVICES — 5.6% | | | Microchip Technology, Inc. | 1,695,000 | 40,612,200 |
| Baidu, Inc. ADR(1) | 124,000 | 46,862,080 | | | | 231,325,483 |
| Google, Inc., Class A(1) | 428,000 | 229,459,360 | | SOFTWARE — 7.5% | | |
| Tencent Holdings Ltd. | 2,090,000 | 36,475,104 | | Adobe Systems, Inc.(1) | 3,216,000 | 105,935,040 |
| | | 312,796,544 | | Electronic Arts, Inc.(1) | 1,977,000 | 36,060,480 |
| IT SERVICES — 3.5% | | | | Microsoft Corp. | 5,663,000 | 157,034,990 |
| International Business | | | | Oracle Corp. | 4,194,000 | 88,493,400 |
| Machines Corp. | 186,000 | 22,433,460 | | VMware, Inc., Class A(1) | 854,000 | 32,819,220 |
| MasterCard, Inc., Class A | 471,000 | 103,158,420 | | | | 420,343,130 |
| Visa, Inc., Class A | 941,000 | 71,290,160 | | SPECIALTY RETAIL — 3.2% | | |
| | | 196,882,040 | | Lowe’s Cos., Inc. | 3,214,000 | 62,897,980 |
| LEISURE EQUIPMENT & PRODUCTS — 0.7% | | Staples, Inc. | 2,541,000 | 55,139,700 |
| Hasbro, Inc. | 1,436,000 | 39,159,720 | | TJX Cos., Inc. (The) | 1,633,000 | 60,992,550 |
| LIFE SCIENCES TOOLS & SERVICES — 0.3% | | | | | 179,030,230 |
| Thermo Fisher | | | | TEXTILES, APPAREL & LUXURY GOODS — 1.1% |
| Scientific, Inc.(1) | 342,609 | 15,417,405 | | | | |
| | | | | NIKE, Inc., Class B | 1,010,000 | 62,801,800 |
| MACHINERY — 2.7% | | | | TOBACCO — 2.1% | | |
| Cummins, Inc. | 769,000 | 33,113,140 | | Philip Morris | | |
| Joy Global, Inc. | 1,000,000 | 50,410,000 | | International, Inc. | 2,503,000 | 118,542,080 |
| Parker-Hannifin Corp. | 1,259,000 | 66,676,640 | | TRADING COMPANIES & DISTRIBUTORS — 0.4% |
| | | 150,199,780 | | W.W. Grainger, Inc. | 225,000 | 21,089,250 |
| METALS & MINING — 1.8% | | | | TOTAL COMMON STOCKS | | |
| BHP Billiton Ltd. ADR | 1,039,000 | 68,137,620 | | (Cost $4,591,536,135) | | 5,567,606,198 |
| Nucor Corp. | 831,000 | 33,115,350 | | Temporary Cash Investments — 0.4% |
| | | 101,252,970 | | JPMorgan U.S. Treasury | | |
| MULTILINE RETAIL — 1.3% | | | | Plus Money Market Fund | | |
| Kohl’s Corp.(1) | 1,258,000 | 71,982,760 | | Agency Shares | 70,843 | 70,843 |
| OIL, GAS & CONSUMABLE FUELS — 2.7% | | | Repurchase Agreement, Deutsche Bank | |
| EOG Resources, Inc. | 703,000 | 57,406,980 | | Securities, Inc., (collateralized by various | |
| | | | | U.S. Treasury obligations, 1.25%, 5/12/12, | |
| Occidental Petroleum Corp. | 800,000 | 60,704,000 | | valued at $21,222,692), in a joint trading | |
| Southwestern Energy Co.(1) | 813,000 | 35,430,540 | | account at 0.04%, dated 10/30/09, due | |
| | | 153,541,520 | | 11/2/09 (Delivery value $20,800,069) | 20,800,000 |
| PHARMACEUTICALS — 3.8% | | | | TOTAL TEMPORARY | | |
| | | | | CASH INVESTMENTS | | |
| Abbott Laboratories | 2,183,000 | 110,394,310 | | (Cost $20,870,843) | | 20,870,843 |
| Bristol-Myers Squibb Co. | 724,000 | 15,783,200 | | TOTAL INVESTMENT | | |
| Teva Pharmaceutical | | | | SECURITIES — 100.0% | | |
| Industries Ltd. ADR | 1,678,000 | 84,705,440 | | (Cost $4,612,406,978) | | 5,588,477,041 |
| | | 210,882,950 | | OTHER ASSETS | | |
| SEMICONDUCTORS & | | | | AND LIABILITIES(2) | | 2,017,998 |
| SEMICONDUCTOR EQUIPMENT — 4.1% | | | TOTAL NET ASSETS — 100.0% | | $5,590,495,039 |
| Altera Corp. | 2,612,000 | 51,691,480 | | | | |
| Applied Materials, Inc. | 3,885,000 | 47,397,000 | | | | |
13
| | | | | |
| Ultra | | | | |
| |
| Forward Foreign Currency Exchange Contracts | | |
| Contracts to Sell | Settlement Date | Value | Unrealized Gain (Loss) |
| | 44,054,135 | CHF for USD | 11/30/09 | $42,949,475 | $169,500 |
| | 16,107,820 | EUR for USD | 11/30/09 | 23,703,624 | 116,442 |
| | 6,971,606 | GBP for USD | 11/30/09 | 11,440,266 | (17,152) |
| | | | | $78,093,365 | $268,790 |
| (Value on Settlement Date $78,362,155) | | | |
| |
| Notes to Schedule of Investments | | |
| ADR = American Depositary Receipt | | | |
| CHF = Swiss Franc | | | | |
| EUR = Euro | | | | |
| GBP = British Pound | | | | |
| USD = United States Dollar | | | |
| (1) | Non-income producing. | | | |
| (2) | Category is less than 0.05% of total net assets. | | | |
Industry classifications are unaudited.
See Notes to Financial Statements.
14
|
| Statement of Assets and Liabilities |
| |
| OCTOBER 31, 2009 | |
| Assets | |
| Investment securities, at value (cost of $4,612,406,978) | $5,588,477,041 |
| Cash | 78,050 |
| Foreign currency holdings, at value (cost of $652,936) | 658,135 |
| Receivable for investments sold | 20,495,757 |
| Receivable for capital shares sold | 1,501,101 |
| Receivable for forward foreign currency exchange contracts | 285,942 |
| Dividends and interest receivable | 5,524,716 |
| | 5,617,020,742 |
| |
| Liabilities | |
| Payable for investments purchased | 18,149,493 |
| Payable for capital shares redeemed | 3,499,211 |
| Payable for forward foreign currency exchange contracts | 17,152 |
| Accrued management fees | 4,840,648 |
| Service fees (and distribution fees — A Class and R Class) payable | 18,565 |
| Distribution fees payable | 634 |
| | 26,525,703 |
| |
| Net Assets | $5,590,495,039 |
| |
| |
| See Notes to Financial Statements. | |
15
| |
| OCTOBER 31, 2009 | |
| Net Assets Consist of: | |
| Capital (par value and paid-in surplus) | $ 5,620,528,613 |
| Undistributed net investment income | 27,142,625 |
| Accumulated net realized loss on investment and foreign currency transactions | (1,033,541,646) |
| Net unrealized appreciation on investments and translation of assets and liabilities in foreign currencies | 976,365,447 |
| | $ 5,590,495,039 |
| | |
| Investor Class, $0.01 Par Value | |
| Net assets | $5,435,051,104 |
| Shares outstanding | 304,932,851 |
| Net asset value per share | $17.82 |
| | |
| Institutional Class, $0.01 Par Value | |
| Net assets | $73,932,659 |
| Shares outstanding | 4,057,385 |
| Net asset value per share | $18.22 |
| | |
| A Class, $0.01 Par Value | |
| Net assets | $77,484,381 |
| Shares outstanding | 4,472,236 |
| Net asset value per share | $17.33 |
| Maximum offering price (net asset value divided by 0.9425) | $18.39 |
| | |
| B Class, $0.01 Par Value | |
| Net assets | $87,110 |
| Shares outstanding | 4,965 |
| Net asset value per share | $17.54 |
| | |
| C Class, $0.01 Par Value | |
| Net assets | $883,795 |
| Shares outstanding | 54,502 |
| Net asset value per share | $16.22 |
| | |
| R Class, $0.01 Par Value | |
| Net assets | $3,055,990 |
| Shares outstanding | 177,054 |
| Net asset value per share | $17.26 |
| |
| |
| See Notes to Financial Statements. | |
16
| |
| YEAR ENDED OCTOBER 31, 2009 | |
| Investment Income (Loss) | |
| Income: | |
| Dividends (net of foreign taxes withheld of $241,388) | $ 85,368,409 |
| Interest | 46,391 |
| | 85,414,800 |
| | |
| Expenses: | |
| Management fees | 50,306,192 |
| Distribution fees: | |
| B Class | 425 |
| C Class | 5,959 |
| Service fees: | |
| B Class | 142 |
| C Class | 1,986 |
| Distribution and service fees: | |
| A Class | 182,901 |
| R Class | 15,625 |
| Directors’ fees and expenses | 201,297 |
| Other expenses | 7,447 |
| | 50,721,974 |
| | |
| Net investment income (loss) | 34,692,826 |
| | |
| Realized and Unrealized Gain (Loss) | |
| Net realized gain (loss) on: | |
| Investment transactions | (658,029,675) |
| Foreign currency transactions | (6,934,078) |
| | (664,963,753) |
| | |
| Change in net unrealized appreciation (depreciation) on: | |
| Investments | 1,318,769,128 |
| Translation of assets and liabilities in foreign currencies | (101,392) |
| | 1,318,667,736 |
| | |
| Net realized and unrealized gain (loss) | 653,703,983 |
| | |
| Net Increase (Decrease) in Net Assets Resulting from Operations | $ 688,396,809 |
| |
| |
| See Notes to Financial Statements. | |
17
|
| Statement of Changes in Net Assets |
| | |
| YEARS ENDED OCTOBER 31, 2009 AND OCTOBER 31, 2008 | | |
| Increase (Decrease) in Net Assets | 2009 | 2008 |
| Operations | | |
| Net investment income (loss) | $ 34,692,826 | $ 29,064,990 |
| Net realized gain (loss) | (664,963,753) | (368,571,720) |
| Change in net unrealized appreciation (depreciation) | 1,318,667,736 | (3,217,056,037) |
| Net increase (decrease) in net assets resulting from operations | 688,396,809 | (3,556,562,767) |
| | | |
| Distributions to Shareholders | | |
| From net investment income: | | |
| Investor Class | (25,630,818) | — |
| Institutional Class | (491,887) | — |
| A Class | (226,924) | — |
| R Class | (1,496) | — |
| From net realized gains: | | |
| Investor Class | — | (2,312,270,157) |
| Institutional Class | — | (65,091,994) |
| A Class | — | (50,919,711) |
| B Class | — | (11,669) |
| C Class | — | (533,319) |
| R Class | — | (1,501,522) |
| Decrease in net assets from distributions | (26,351,125) | (2,430,328,372) |
| | | |
| Capital Share Transactions | | |
| Net increase (decrease) in net assets from capital share transactions | (513,655,552) | 794,859,566 |
| | | |
| Net increase (decrease) in net assets | 148,390,132 | (5,192,031,573) |
| | | |
| Net Assets | | |
| Beginning of period | 5,442,104,907 | 10,634,136,480 |
| End of period | $5,590,495,039 | $ 5,442,104,907 |
| | | |
| Undistributed net investment income | $27,142,625 | $25,735,002 |
| |
| |
| See Notes to Financial Statements. | | |
18
|
| Notes to Financial Statements |
OCTOBER 31, 2009
1. Organization and Summary of Significant Accounting Policies
Organization — American Century Mutual Funds, Inc. (the corporation) is registered under the Investment Company Act of 1940 (the 1940 Act) as an open-end management investment company. Ultra Fund (the fund) is one fund in a series issued by the corporation. The fund is diversified under the 1940 Act. The fund’s investment objective is to seek long-term capital growth. The fund pursues this objective by investing primarily in equity securities of large companies, but may invest in companies of any size. The following is a summary of the fund’s significant accounting policies.
Multiple Class — The fund is authorized to issue the Investor Class, the Institutional Class, the A Class, the B Class, the C Class and the R Class. The A Class may incur an initial sales charge. The A Class, the B Class, and the C Class may be subject to a contingent deferred sales charge. The share classes differ principally in their respective sales charges and distribution and shareholder servicing expenses and arrangements. All shares of the fund represent an equal pro rata interest in the net assets of the class to which such shares belong, and have identical voting, dividend, liquidation and other rights and the same terms and conditions, except for class specific expenses and exclusive rights to vote on matters affecting only individual classes. Income, non-class specific expenses, and realized and unrealized capital gains and loss es of the fund are allocated to each class of shares based on their relative net assets.
Security Valuations — Securities traded primarily on a principal securities exchange are valued at the last reported sales price, or at the mean of the latest bid and asked prices where no last sales price is available. Depending on local convention or regulation, securities traded over-the-counter are valued at the mean of the latest bid and asked prices, the last sales price, or the official close price. Investments in open-end management investment companies are valued at the reported net asset value. Debt securities not traded on a principal securities exchange are valued through a commercial pricing service or at the mean of the most recent bid and asked prices. Discount notes may be valued through a commercial pricing service or at amortized cost, which approximates fair value. Securities traded on foreign securities exchanges and ov er-the-counter markets are normally completed before the close of business on days that the New York Stock Exchange (the Exchange) is open and may also take place on days when the Exchange is not open. If an event occurs after the value of a security was established but before the net asset value per share was determined that was likely to materially change the net asset value, that security would be valued as determined in accordance with procedures adopted by the Board of Directors. If the fund determines that the market price of a portfolio security is not readily available, or that the valuation methods mentioned above do not reflect the security’s fair value, such security is valued as determined by the Board of Directors or its designee, in accordance with procedures adopted by the Board of Directors, if such determination would materially impact a fund’s net asset value. Certain other circumstances may cause the fund to use alternative procedures to value a security such as: a security has b een declared in default; trading in a security has been halted during the trading day; or there is a foreign market holiday and no trading will commence.
Security Transactions — For financial reporting purposes, security transactions are accounted for as of the trade date. Net realized gains and losses are determined on the identified cost basis, which is also used for federal income tax purposes.
Investment Income — Dividend income less foreign taxes withheld, if any, is recorded as of the ex-dividend date. Interest income is recorded on the accrual basis and includes accretion of discounts and amortization of premiums.
Foreign Currency Translations — All assets and liabilities initially expressed in foreign currencies are translated into U.S. dollars at prevailing exchange rates at period end. The fund may enter into spot foreign currency exchange contracts to facilitate transactions denominated in a foreign currency. Purchases and sales of investment securities, dividend and interest income, spot foreign currency exchange contracts, and certain expenses are translated at the rates of exchange prevailing on the respective dates of such transactions.
19
For assets and liabilities, other than investments in securities, net realized and unrealized gains and losses from foreign currency translations arise from changes in currency exchange rates.
Net realized and unrealized foreign currency exchange gains or losses occurring during the holding period of investment securities are a component of net realized gain (loss) on investment transactions and net unrealized appreciation (depreciation) on investments, respectively. Certain countries may impose taxes on the contract amount of purchases and sales of foreign currency contracts in their currency. The fund records the foreign tax expense, if any, as a reduction to the net realized gain (loss) on foreign currency transactions.
Repurchase Agreements — The fund may enter into repurchase agreements with institutions that American Century Investment Management, Inc. (ACIM) (the investment advisor) has determined are creditworthy pursuant to criteria adopted by the Board of Directors. Each repurchase agreement is recorded at cost. The fund requires that the collateral, represented by securities, received in a repurchase transaction be transferred to the custodian in a manner sufficient to enable the fund to obtain those securities in the event of a default under the repurchase agreement. ACIM monitors, on a daily basis, the securities transferred to ensure the value, including accrued interest, of the securities under each repurchase agreement is equal to or greater than amounts owed to the fund under each repurchase agreement.
Joint Trading Account — Pursuant to an Exemptive Order issued by the Securities and Exchange Commission, the fund, along with certain other funds in the American Century Investments family of funds, may transfer uninvested cash balances into a joint trading account. These balances are invested in one or more repurchase agreements that are collateralized by U.S. Treasury or Agency obligations.
Income Tax Status — It is the fund’s policy to distribute substantially all net investment income and net realized gains to shareholders and to otherwise qualify as a regulated investment company under provisions of the Internal Revenue Code. The fund is no longer subject to examination by tax authorities for years prior to 2006. At this time, management believes there are no uncertain tax positions which, based on their technical merit, would not be sustained upon examination and for which it is reasonably possible that the total amounts of unrecognized tax benefits will significantly change in the next twelve months. Accordingly, no provision has been made for federal or state income taxes. Interest and penalties associated with any federal or state income tax obligations, if any, are recorded as interest expense.
Distributions to Shareholders — Distributions to shareholders are recorded on the ex-dividend date. Distributions from net investment income and net realized gains, if any, are generally declared and paid annually.
Indemnifications — Under the corporation‘s organizational documents, its officers and directors are indemnified against certain liabilities arising out of the performance of their duties to the fund. In addition, in the normal course of business, the fund enters into contracts that provide general indemnifications. The maximum exposure under these arrangements is unknown as this would involve future claims that may be made against a fund. The risk of material loss from such claims is considered by management to be remote.
Use of Estimates — The financial statements are prepared in conformity with accounting principles generally accepted in the United States of America, which may require management to make certain estimates and assumptions at the date of the financial statements. Actual results could differ from these estimates.
Subsequent Events — Management has evaluated events or transactions that may have occurred since October 31, 2009, that would merit recognition or disclosure in the financial statements. This evaluation was completed through December 28, 2009, the date the financial statements were issued.
20
2. Fees and Transactions with Related Parties
Management Fees — The corporation has entered into a Management Agreement with ACIM, under which ACIM provides the fund with investment advisory and management services in exchange for a single, unified management fee (the fee) per class. The Agreement provides that all expenses of the fund, except brokerage commissions, taxes, interest, fees and expenses of those directors who are not considered “interested persons” as defined in the 1940 Act (including counsel fees) and extraordinary expenses, will be paid by ACIM. The fee is computed and accrued daily based on the daily net assets of each specific class of shares of the fund and paid monthly in arrears. For funds with a stepped fee schedule, the rate of the fee is determined by applying a fee rate calculation formula. This formula takes into account each fund’s asset s as well as certain assets, if any, of other clients of the investment advisor outside the American Century Investments family of funds (such as subadvised funds and separate accounts) that have very similar investment teams and investment strategies (strategy assets). The annual management fee schedule ranges from 0.800% to 1.000% for the Investor Class, A Class, B Class, C Class and R Class. The Institutional Class is 0.200% less at each point within the range. The effective annual management fee for each class of the fund for the year ended October 31, 2009 was 1.00% for the Investor Class, A Class, B Class, C Class and R Class, and 0.80% for the Institutional Class.
Distribution and Service Fees — The Board of Directors has adopted a separate Master Distribution and Individual Shareholder Services Plan for each of the A Class, B Class, C Class and R Class (collectively the plans), pursuant to Rule 12b-1 of the 1940 Act. The plans provide that the A Class will pay American Century Investment Services, Inc. (ACIS) an annual distribution and service fee of 0.25%. The plans provide that the B Class and the C Class will each pay ACIS an annual distribution fee of 0.75% and service fee of 0.25%. The plans provide that the R Class will pay ACIS an annual distribution and service fee of 0.50%. The fees are computed and accrued daily based on each class’s daily net assets and paid monthly in arrears. The fees are used to pay financial intermediaries for distribution and individual shareholder service s. Fees incurred under the plans during the year ended October 31, 2009, are detailed in the Statement of Operations.
Related Parties — Certain officers and directors of the corporation are also officers and/or directors, and, as a group, controlling stockholders of American Century Companies, Inc. (ACC), the parent of the corporation’s investment advisor, ACIM, the distributor of the corporation, ACIS, and the corporation’s transfer agent, American Century Services, LLC.
The fund is eligible to invest in a money market fund for temporary purposes, which is managed by J.P. Morgan Investment Management, Inc. (JPMIM). The fund has a Mutual Funds Services Agreement with J.P. Morgan Investor Services Co. (JPMIS) and a securities lending agreement with JPMorgan Chase Bank (JPMCB). JPMCB is a custodian of the fund. JPMIM, JPMIS and JPMCB are wholly owned subsidiaries of JPMorgan Chase & Co. (JPM). JPM is an equity investor in ACC.
3. Investment Transactions
Purchases and sales of investment securities, excluding short-term investments, for the year ended October 31, 2009, were $2,680,376,654 and $3,078,532,540, respectively.
21
| | | | |
| 4. Capital Share Transactions | | | | |
| |
| Transactions in shares of the fund were as follows: | | |
| |
| | Year ended October 31, 2009 | Year ended October 31, 2008 |
| | Shares | Amount | Shares | Amount |
| Investor Class/Shares Authorized | 3,500,000,000 | | 3,500,000,000 | |
| Sold | 10,713,688 | $ 162,466,559 | 15,047,819 | $ 349,727,360 |
| Issued in reinvestment of distributions | 1,792,590 | 24,916,998 | 91,021,431 | 2,229,114,850 |
| Redeemed | (44,276,980) | (673,015,336) | (70,022,806) | (1,625,259,696) |
| | (31,770,702) | (485,631,779) | 36,046,444 | 953,582,514 |
| Institutional Class/Shares Authorized | 200,000,000 | | 200,000,000 | |
| Sold | 616,942 | 9,517,688 | 1,768,195 | 41,370,627 |
| Issued in reinvestment of distributions | 33,797 | 479,581 | 2,567,071 | 64,151,093 |
| Redeemed | (1,359,616) | (20,634,403) | (9,133,416) | (232,001,615) |
| | (708,877) | (10,637,134) | (4,798,150) | (126,479,895) |
| A Class/Shares Authorized | 100,000,000 | | 100,000,000 | |
| Sold | 761,220 | 11,227,185 | 1,495,972 | 34,046,242 |
| Issued in reinvestment of distributions | 16,176 | 219,026 | 2,076,111 | 49,536,018 |
| Redeemed | (1,933,030) | (28,089,270) | (5,107,987) | (116,870,252) |
| | (1,155,634) | (16,643,059) | (1,535,904) | (33,287,992) |
| B Class/Shares Authorized | 50,000,000 | | 50,000,000 | |
| Sold | 2,779 | 44,188 | 1,429 | 39,247 |
| Issued in reinvestment of distributions | — | — | 478 | 11,669 |
| Redeemed | (429) | (7,449) | (82) | (1,808) |
| | 2,350 | 36,739 | 1,825 | 49,108 |
| C Class/Shares Authorized | 50,000,000 | | 50,000,000 | |
| Sold | 11,640 | 167,046 | 18,798 | 403,824 |
| Issued in reinvestment of distributions | — | — | 22,734 | 513,343 |
| Redeemed | (19,376) | (267,383) | (46,798) | (965,829) |
| | (7,736) | (100,337) | (5,266) | (48,662) |
| R Class/Shares Authorized | 50,000,000 | | 50,000,000 | |
| Sold | 73,819 | 1,103,287 | 104,389 | 2,462,123 |
| Issued in reinvestment of distributions | 95 | 1,278 | 56,879 | 1,354,849 |
| Redeemed | (112,765) | (1,784,547) | (127,380) | (2,772,479) |
| | (38,851) | (679,982) | 33,888 | 1,044,493 |
| Net increase (decrease) | (33,679,450) | $(513,655,552) | 29,742,837 | $ 794,859,566 |
22
5. Fair Value Measurements
The fund’s securities valuation process is based on several considerations and may use multiple inputs to determine the fair value of the positions held by the fund. In conformity with accounting principles generally accepted in the United States of America, the inputs used to determine a valuation are classified into three broad levels as follows:
• Level 1 valuation inputs consist of actual quoted prices in an active market for identical securities;
• Level 2 valuation inputs consist of significant direct or indirect observable market data (including quoted prices for similar securities, evaluations of subsequent market events, interest rates, prepayment speeds, credit risk, etc.); or
• Level 3 valuation inputs consist of significant unobservable inputs (including a fund’s own assumptions.)
The level classification is based on the lowest level input that is significant to the fair valuation measurement. The valuation inputs are not an indication of the risks associated with investing in these securities or other financial instruments.
The following is a summary of the valuation inputs used to determine the fair value of the fund’s securities and other financial instruments as of October 31, 2009:
| | | |
| | Level 1 | Level 2 | Level 3 |
| Investment Securities | | | |
| Domestic Common Stocks | $5,135,661,705 | — | — |
| Foreign Common Stocks | 239,174,040 | $192,770,453 | — |
| Temporary Cash Investments | 70,843 | 20,800,000 | — |
| Total Value of Investment Securities | $5,374,906,588 | $213,570,453 | — |
| | | | |
| Other Financial Instruments | | | |
| Total Unrealized Gain (Loss) on Forward Foreign | | | |
| Currency Exchange Contracts | — | $268,790 | — |
6. Derivative Instruments
Foreign Currency Risk — The fund is subject to foreign currency exchange rate risk in the normal course of pursuing its investment objectives. The value of foreign investments held by a fund may be significantly affected by changes in foreign currency exchange rates. The dollar value of a foreign security generally decreases when the value of the dollar rises against the foreign currency in which the security is denominated and tends to increase when the value of the dollar declines against such foreign currency. A fund may enter into forward foreign currency exchange contracts to reduce a fund’s exposure to foreign currency exchange rate fluctuations. The net U.S. dollar value of foreign currency underlying all contractual commitments held by a fund and the resulting unrealized appreciation or depreciation are determined daily using prevailing exchange rates. Realized gain or loss is recorded upon the termination of the contract. Net realized and unrealized gains or losses occurring during the holding period of forward foreign currency exchange contracts are a component of net realized gain (loss) on foreign currency transactions and change in net unrealized appreciation (depreciation) on translation of assets and liabilities in foreign currencies, respectively. A fund bears the risk of an unfavorable change in the foreign currency exchange rate underlying the forward contract. Additionally, losses, up to the fair value, may arise if the counterparties do not perform under the contract terms. The risk of loss from non-performance by the counterparty may be reduced by the use of master netting agreements. During the year ended October 31, 2009, the fund participated in forward foreign currency exchange contracts.
23
The value of foreign currency risk derivatives as of October 31, 2009, is disclosed on the Statement of Assets and Liabilities as an asset of $285,942 in receivable for forward foreign currency exchange contracts and a liability of $17,152 in payable for forward foreign currency exchange contracts. For the year ended October 31, 2009, the effect of foreign currency risk derivatives on the Statement of Operations was $(6,906,793) in net realized gain (loss) on foreign currency transactions and $(301,472) in change in net unrealized appreciation (depreciation) on translation of assets and liabilities in foreign currencies.
The derivative instruments at period end as disclosed on the Schedule of Investments are indicative of the fund’s typical volume.
7. Risk Factors
There are certain risks involved in investing in foreign securities. These risks include those resulting from future adverse political, social, and economic developments, fluctuations in currency exchange rates, the possible imposition of exchange controls, and other foreign laws or restrictions.
8. Bank Line of Credit
The fund, along with certain other funds in the American Century Investments family of funds, had a $500,000,000 unsecured bank line of credit agreement with Bank of America, N.A. The line expired December 10, 2008, and was not renewed. The agreement allowed the fund to borrow money for temporary or emergency purposes to fund shareholder redemptions. Borrowings under the agreement were subject to interest at the Federal Funds rate plus 0.40%. The fund did not borrow from the line during the year ended October 31, 2009.
9. Interfund Lending
The fund, along with certain other funds in the American Century Investments family of funds, may participate in an interfund lending program, pursuant to an Exemptive Order issued by the Securities and Exchange Commission (SEC). This program provides an alternative credit facility allowing the fund to borrow from or lend to other funds in the American Century Investments family of funds that permit such transactions. Interfund lending transactions are subject to each fund’s investment policies and borrowing and lending limits. The interfund loan rate earned/paid on interfund lending transactions is determined daily based on the average of certain current market rates. Interfund lending transactions normally extend only overnight, but can have a maximum duration of seven days. The program is subject to annual approval by the Board of Directors. During the year ended October 31, 2009, the fund did not utilize the program.
10. Federal Tax Information
The tax character of distributions paid during the years ended October 31, 2009 and October 31, 2008 were as follows:
| | |
| | 2009 | 2008 |
| Distributions Paid From | | |
| Ordinary income | $26,351,125 | — |
| Long-term capital gains | — | $2,430,328,372 |
The book-basis character of distributions made during the year from net investment income or net realized gains may differ from their ultimate characterization for federal income tax purposes. These differences reflect the differing character of certain income items and net realized gains and losses for financial statement and tax purposes, and may result in reclassification among certain capital accounts on the financial statements.
24
As of October 31, 2009, the federal tax cost of investments and the components of distributable earnings on a tax-basis were as follows:
| |
| Federal tax cost of investments | $4,698,205,177 |
| Gross tax appreciation of investments | $1,055,224,421 |
| Gross tax depreciation of investments | (164,952,557) |
| Net tax appreciation (depreciation) of investments | $ 890,271,864 |
| Net tax appreciation (depreciation) of derivatives and translation of assets | |
| and liabilities in foreign currencies | $ 26,594 |
| Net tax appreciation (depreciation) | $890,298,458 |
| Undistributed ordinary income | $27,411,415 |
| Accumulated capital losses | $(947,743,447) |
The difference between book-basis and tax-basis cost and unrealized appreciation (depreciation) is attributable primarily to the tax deferral of losses on wash sales and the realization for tax purposes of unrealized gains on certain forward foreign currency exchange contracts.
The accumulated capital losses listed above represent net capital loss carryovers that may be used to offset future realized capital gains for federal income tax purposes. Future capital loss carryover utilization in any given year may be subject to Internal Revenue Code limitations. The capital loss carryovers of $(201,210,564) and $(746,532,883) expire in 2016 and 2017, respectively.
11. Recently Issued Accounting Standards
The Financial Accounting Standards Board (FASB) issued Accounting Standards Codification (ASC) Section 820-10 (formerly Statement of Financial Accounting Standards No. 157, “Fair Value Measurements”), in September 2006, which is effective for fiscal years beginning after November 15, 2007. ASC Section 820-10 defines fair value, establishes a framework for measuring fair value and expands the required financial statement disclosures about fair value measurements. The adoption of ASC Section 820-10 did not materially impact the determination of fair value.
In March 2008, the FASB issued ASC Section 815-10 (formerly Statement of Financial Accounting Standards No. 161, “Disclosures about Derivative Instruments and Hedging Activities — an amendment of FASB Statement No. 133”). ASC Section 815-10 is effective for interim periods beginning after November 15, 2008 and has been adopted by the fund. ASC Section 815-10 amends and expands disclosures about derivative instruments and hedging activities. ASC Section 815-10 requires qualitative disclosures about the objectives and strategies of derivative instruments, quantitative disclosures about the fair value amounts of and gains and losses on derivative instruments, and disclosures of credit-risk-related contingent features in hedging activities.
12. Other Tax Information (Unaudited)
The following information is provided pursuant to provisions of the Internal Revenue Code.
The fund hereby designates up to the maximum amount allowable as qualified dividend income for the fiscal year ended October 31, 2009.
For corporate taxpayers, the fund hereby designates $26,351,125, or up to the maximum amount allowable, of ordinary income distributions paid during the fiscal year ended October 31, 2009 as qualified for the corporate dividends received deduction.
25
| | | | | | |
| Ultra | | | | | |
| |
| Investor Class | | | | | |
| For a Share Outstanding Throughout the Years Ended October 31 | | | |
| | | 2009 | 2008 | 2007 | 2006 | 2005 |
| Per-Share Data | | | | | |
| Net Asset Value, Beginning of Period | $15.67 | $33.48 | $28.55 | $29.02 | $27.17 |
| Income From Investment Operations | | | | | |
| Net Investment Income (Loss)(1) | 0.11 | 0.08 | (0.01) | (0.06) | 0.02 |
| Net Realized and Unrealized Gain (Loss) | 2.12 | (9.95) | 6.95 | (0.37) | 1.83 |
| Total From Investment Operations | 2.23 | (9.87) | 6.94 | (0.43) | 1.85 |
| Distributions | | | | | |
| From Net Investment Income | (0.08) | — | — | (0.04) | — |
| From Net Realized Gains | — | (7.94) | (2.01) | — | — |
| Total Distributions | (0.08) | (7.94) | (2.01) | (0.04) | — |
| Net Asset Value, End of Period | $17.82 | $15.67 | $33.48 | $28.55 | $29.02 |
| |
| Total Return(2) | 14.35% | (38.02)% | 25.89% | (1.51)% | 6.81% |
| |
| Ratios/Supplemental Data | | | | | |
| Ratio of Operating Expenses | | | | | |
| to Average Net Assets | 1.00% | 0.99% | 0.99% | 0.99% | 0.99% |
| Ratio of Net Investment Income (Loss) | | | | | |
| to Average Net Assets | 0.69% | 0.36% | (0.04)% | (0.15)% | 0.09% |
| Portfolio Turnover Rate | 53% | 152% | 93% | 62% | 33% |
| Net Assets, End of Period (in millions) | $5,435 | $5,276 | $10,066 | $13,482 | $18,904 |
| (1) | Computed using average shares outstanding throughout the period. | | | | |
| (2) | Total return assumes reinvestment of net investment income and capital gains distributions, if any. The total return of the classes may not |
| | precisely reflect the class expense differences because of the impact of calculating the net asset value to two decimal places. If net asset values |
| | were calculated to three decimal places, the total return differences would more closely reflect the class expense differences. The calculation of |
| | net asset values to two decimal places is made in accordance with SEC guidelines and does not result in any gain or loss of value between one |
| | class and another. | | | | | |
| |
| |
| See Notes to Financial Statements. | | | | | |
26
| | | | | | |
| Ultra | | | | | |
| |
| Institutional Class | | | | | |
| For a Share Outstanding Throughout the Years Ended October 31 | | | |
| | | 2009 | 2008 | 2007 | 2006 | 2005 |
| Per-Share Data | | | | | |
| Net Asset Value, Beginning of Period | $16.02 | $33.98 | $28.90 | $29.38 | $27.44 |
| Income From Investment Operations | | | | | |
| Net Investment Income (Loss)(1) | 0.14 | 0.15 | 0.05 | —(2) | 0.07 |
| Net Realized and Unrealized Gain (Loss) | 2.17 | (10.17) | 7.04 | (0.38) | 1.87 |
| Total From Investment Operations | 2.31 | (10.02) | 7.09 | (0.38) | 1.94 |
| Distributions | | | | | |
| From Net Investment Income | (0.11) | — | — | (0.10) | — |
| From Net Realized Gains | — | (7.94) | (2.01) | — | — |
| Total Distributions | (0.11) | (7.94) | (2.01) | (0.10) | — |
| Net Asset Value, End of Period | $18.22 | $16.02 | $33.98 | $28.90 | $29.38 |
| |
| Total Return(3) | 14.58% | (37.89)% | 26.14% | (1.33)% | 7.07% |
| |
| Ratios/Supplemental Data | | | | | |
| Ratio of Operating Expenses | | | | | |
| to Average Net Assets | 0.80% | 0.79% | 0.79% | 0.79% | 0.79% |
| Ratio of Net Investment Income (Loss) | | | | | |
| to Average Net Assets | 0.89% | 0.56% | 0.16% | 0.05% | 0.29% |
| Portfolio Turnover Rate | 53% | 152% | 93% | 62% | 33% |
| Net Assets, End of Period (in thousands) | $73,933 | $76,339 | $325,035 | $1,073,767 | $1,460,343 |
| (1) | Computed using average shares outstanding throughout the period. | | | | |
| (2) | Per-share amount was less than $0.005. | | | | | |
| (3) | Total return assumes reinvestment of net investment income and capital gains distributions, if any. The total return of the classes may not |
| | precisely reflect the class expense differences because of the impact of calculating the net asset value to two decimal places. If net asset values |
| | were calculated to three decimal places, the total return differences would more closely reflect the class expense differences. The calculation of |
| | net asset values to two decimal places is made in accordance with SEC guidelines and does not result in any gain or loss of value between one |
| | class and another. | | | | | |
| |
| |
| See Notes to Financial Statements. | | | | | |
27
| | | | | | |
| Ultra | | | | | |
| |
| A Class(1) | | | | | |
| For a Share Outstanding Throughout the Years Ended October 31 | | | |
| | | 2009 | 2008 | 2007 | 2006 | 2005 |
| Per-Share Data | | | | | |
| Net Asset Value, Beginning of Period | $15.23 | $32.83 | $28.11 | $28.61 | $26.85 |
| Income From Investment Operations | | | | | |
| Net Investment Income (Loss)(2) | 0.07 | 0.03 | (0.08) | (0.13) | (0.05) |
| Net Realized and Unrealized Gain (Loss) | 2.07 | (9.69) | 6.81 | (0.37) | 1.81 |
| Total From Investment Operations | 2.14 | (9.66) | 6.73 | (0.50) | 1.76 |
| Distributions | | | | | |
| From Net Investment Income | (0.04) | — | — | — | — |
| From Net Realized Gains | — | (7.94) | (2.01) | — | — |
| Total Distributions | (0.04) | (7.94) | (2.01) | — | — |
| Net Asset Value, End of Period | $17.33 | $15.23 | $32.83 | $28.11 | $28.61 |
| |
| Total Return(3) | 14.14% | (38.19)% | 25.56% | (1.75)% | 6.55% |
| |
| Ratios/Supplemental Data | | | | | |
| Ratio of Operating Expenses | | | | | |
| to Average Net Assets | 1.25% | 1.24% | 1.24% | 1.24% | 1.24% |
| Ratio of Net Investment Income (Loss) | | | | | |
| to Average Net Assets | 0.44% | 0.11% | (0.29)% | (0.40)% | (0.16)% |
| Portfolio Turnover Rate | 53% | 152% | 93% | 62% | 33% |
| Net Assets, End of Period (in thousands) | $77,484 | $85,723 | $235,217 | $405,173 | $639,792 |
| (1) | Prior to September 4, 2007, the A Class was referred to as the Advisor Class. | | | |
| (2) | Computed using average shares outstanding throughout the period. | | | | |
| (3) | Total return assumes reinvestment of net investment income and capital gains distributions, if any, and does not reflect applicable sales charges. |
| | The total return of the classes may not precisely reflect the class expense differences because of the impact of calculating the net asset value to |
| | two decimal places. If net asset values were calculated to three decimal places, the total return differences would more closely reflect the class |
| | expense differences. The calculation of net asset values to two decimal places is made in accordance with SEC guidelines and does not result in |
| | any gain or loss of value between one class and another. | | | | |
| |
| |
| See Notes to Financial Statements. | | | | | |
28
| | | | |
| Ultra | | | |
| |
| B Class | | | |
| For a Share Outstanding Throughout the Years Ended October 31 (except as noted) | | |
| | | 2009 | 2008 | 2007(1) |
| Per-Share Data | | | |
| Net Asset Value, Beginning of Period | $15.49 | $33.45 | $31.63 |
| Income From Investment Operations | | | |
| Net Investment Income (Loss)(2) | (0.06) | (0.16) | (0.04) |
| Net Realized and Unrealized Gain (Loss) | 2.11 | (9.86) | 1.86 |
| Total From Investment Operations | 2.05 | (10.02) | 1.82 |
| Distributions | | | |
| From Net Realized Gains | — | (7.94) | — |
| Net Asset Value, End of Period | $17.54 | $15.49 | $33.45 |
| |
| Total Return(3) | 13.23% | (38.64)% | 5.75% |
| |
| Ratios/Supplemental Data | | | |
| Ratio of Operating Expenses to Average Net Assets | 2.00% | 1.99% | 1.99%(4) |
| Ratio of Net Investment Income (Loss) to Average Net Assets | (0.31)% | (0.64)% | (1.53)%(4) |
| Portfolio Turnover Rate | 53% | 152% | 93%(5) |
| Net Assets, End of Period (in thousands) | $87 | $41 | $26 |
| (1) | September 28, 2007 (commencement of sale) through October 31, 2007. | | | |
| (2) | Computed using average shares outstanding throughout the period. | | | |
| (3) | Total return assumes reinvestment of net investment income and capital gains distributions, if any, and does not reflect applicable sales charges. |
| | Total returns for periods less than one year are not annualized. The total return of the classes may not precisely reflect the class expense |
| | differences because of the impact of calculating the net asset value to two decimal places. If net asset values were calculated to three decimal |
| | places, the total return differences would more closely reflect the class expense differences. The calculation of net asset values to two decimal |
| | places is made in accordance with SEC guidelines and does not result in any gain or loss of value between one class and another. | |
| (4) | Annualized. | | | |
| (5) | Portfolio turnover is calculated at the fund level. Percentage indicated was calculated for the year ended October 31, 2007. | |
| |
| |
| See Notes to Financial Statements. | | | |
29
| | | | | | |
| Ultra | | | | | |
| |
| C Class | | | | | |
| For a Share Outstanding Throughout the Years Ended October 31 | | | |
| | | 2009 | 2008 | 2007 | 2006 | 2005 |
| Per-Share Data | | | | | |
| Net Asset Value, Beginning of Period | $14.32 | $31.54 | $27.26 | $27.96 | $26.44 |
| Income From Investment Operations | | | | | |
| Net Investment Income (Loss)(1) | (0.04) | (0.13) | (0.29) | (0.34) | (0.26) |
| Net Realized and Unrealized Gain (Loss) | 1.94 | (9.15) | 6.58 | (0.36) | 1.78 |
| Total From Investment Operations | 1.90 | (9.28) | 6.29 | (0.70) | 1.52 |
| Distributions | | | | | |
| From Net Realized Gains | — | (7.94) | (2.01) | — | — |
| Net Asset Value, End of Period | $16.22 | $14.32 | $31.54 | $27.26 | $27.96 |
| |
| Total Return(2) | 13.20% | (38.63)% | 24.64% | (2.50)% | 5.75% |
| |
| Ratios/Supplemental Data | | | | | |
| Ratio of Operating Expenses | | | | | |
| to Average Net Assets | 2.00% | 1.99% | 1.99% | 1.99% | 1.99% |
| Ratio of Net Investment Income (Loss) | | | | | |
| to Average Net Assets | (0.31)% | (0.64)% | (1.04)% | (1.15)% | (0.91)% |
| Portfolio Turnover Rate | 53% | 152% | 93% | 62% | 33% |
| Net Assets, End of Period (in thousands) | $884 | $891 | $2,129 | $3,342 | $5,601 |
| (1) | Computed using average shares outstanding throughout the period. | | | | |
| (2) | Total return assumes reinvestment of net investment income and capital gains distributions, if any, and does not reflect applicable sales charges. |
| | Total returns are calculated based on the net asset value of the last business day. The total return of the classes may not precisely reflect the |
| | class expense differences because of the impact of calculating the net asset value to two decimal places. If net asset values were calculated to |
| | three decimal places, the total return differences would more closely reflect the class expense differences. The calculation of net asset values to |
| | two decimal places is made in accordance with SEC guidelines and does not result in any gain or loss of value between one class and another. |
| |
| |
| See Notes to Financial Statements. | | | | | |
30
| | | | | | |
| Ultra | | | | | |
| |
| R Class | | | | | |
| For a Share Outstanding Throughout the Years Ended October 31 | | | |
| | | 2009 | 2008 | 2007 | 2006 | 2005 |
| Per-Share Data | | | | | |
| Net Asset Value, Beginning of Period | $15.17 | $32.80 | $28.15 | $28.72 | $27.01 |
| Income From Investment Operations | | | | | |
| Net Investment Income (Loss)(1) | 0.03 | (0.03) | (0.15) | (0.21) | (0.12) |
| Net Realized and Unrealized Gain (Loss) | 2.07 | (9.66) | 6.81 | (0.36) | 1.83 |
| Total From Investment Operations | 2.10 | (9.69) | 6.66 | (0.57) | 1.71 |
| Distributions | | | | | |
| From Net Investment Income | (0.01) | — | — | — | — |
| From Net Realized Gains | — | (7.94) | (2.01) | — | — |
| Total Distributions | (0.01) | (7.94) | (2.01) | — | — |
| Net Asset Value, End of Period | $17.26 | $15.17 | $32.80 | $28.15 | $28.72 |
| |
| Total Return(2) | 13.84% | (38.35)% | 25.26% | (1.98)% | 6.33% |
| |
| Ratios/Supplemental Data | | | | | |
| Ratio of Operating Expenses | | | | | |
| to Average Net Assets | 1.50% | 1.49% | 1.49% | 1.49% | 1.44%(3) |
| Ratio of Net Investment Income (Loss) | | | | | |
| to Average Net Assets | 0.19% | (0.14)% | (0.54)% | (0.65)% | (0.36)%(3) |
| Portfolio Turnover Rate | 53% | 152% | 93% | 62% | 33% |
| Net Assets, End of Period (in thousands) | $3,056 | $3,276 | $5,971 | $8,922 | $8,367 |
| (1) | Computed using average shares outstanding throughout the period. | | | | |
| (2) | Total return assumes reinvestment of net investment income and capital gains distributions, if any. The total return of the classes may not |
| | precisely reflect the class expense differences because of the impact of calculating the net asset value to two decimal places. If net asset values |
| | were calculated to three decimal places, the total return differences would more closely reflect the class expense differences. The calculation of |
| | net asset values to two decimal places is made in accordance with SEC guidelines and does not result in any gain or loss of value between one |
| | class and another. | | | | | |
| (3) | During the year ended October 31, 2005, the class received a partial reimbursement of its distribution and service fee. Had fees not been |
| | reimbursed the ratio of operating expenses to average net assets and ratio of net investment income (loss) to average net assets would have |
| | been 1.49% and (0.41)%, respectively. | | | | | |
| |
| |
| See Notes to Financial Statements. | | | | | |
31
|
| Report of Independent Registered Public Accounting Firm |
The Board of Directors and Shareholders,
American Century Mutual Funds, Inc.:
We have audited the accompanying statement of assets and liabilities, including the schedule of investments, of Ultra Fund, one of the funds constituting American Century Mutual Funds, Inc. (the “Corporation”), as of October 31, 2009, and the related statement of operations for the year then ended, the statements of changes in net assets for each of the two years in the period then ended, and the financial highlights for each of the five years in the period then ended. These financial statements and financial highlights are the responsibility of the Corporation’s management. Our responsibility is to express an opinion on these financial statements and financial highlights based on our audits.
We conducted our audits in accordance with the standards of the Public Company Accounting Oversight Board (United States). Those standards require that we plan and perform the audit to obtain reasonable assurance about whether the financial statements and financial highlights are free of material misstatement. The Corporation is not required to have, nor were we engaged to perform, an audit of its internal control over financial reporting. Our audits included consideration of internal control over finan cial reporting as a basis for designing audit procedures that are appropriate in the circumstances, but not for the purpose of expressing an opinion on the effectiveness of the Corporation’s internal control over financial reporting. Accordingly, we express no such opinion. An audit also includes examining, on a test basis, evidence supporting the amounts and disclosures in the financial statements, assessing the accounting principles used and significant estimates made by management, as well as evaluating the overall financial statement presentation. Our procedures included confirma tion of securities owned as of October 31, 2009, by correspondence with custodian and brokers; where replies were not received from brokers, we performed other auditing procedures. We believe that our audits provide reasonable basis for our opinion.
In our opinion, the financial statements and financial highlights referred above present fairly, in all material respects, the financial position of Ultra Fund of American Century Mutual Funds, Inc., as of October 31, 2009, the results of its operations for the year then ended, the changes in its net assets for each of the two years in the period then ended, and the financial highlights for each of the five years in the period then ended, in conformity accounting principles generally accepted in the United States of America.
Deloitte & Touche LLP
Kansas City, Missouri
December 28, 2009
32
The individuals listed below serve as directors or officers of the fund. Each director serves until his or her successor is duly elected and qualified or until he or she retires. Mandatory retirement age for independent directors is 72. Those listed as interested directors are “interested” primarily by virtue of their engagement as directors and/or officers of, or ownership interest in, American Century Companies, Inc. (ACC) or its wholly owned, direct or indirect, subsidiaries, including the fund’s investment advisor, American Century Investment Management, Inc. (ACIM); the fund’s principal underwriter, American Century Investment Services, Inc. (ACIS); and the fund’s transfer agent, American Century Services, LLC (ACS).
The other directors (more than three-fourths of the total number) are independent; that is, they have never been employees, directors or officers of, and have no financial interest in, ACC or any of its wholly owned, direct or indirect, subsidiaries, including ACIM, ACIS and ACS. The directors serve in this capacity for seven registered investment companies in the American Century Investments family of funds.
All persons named as officers of the fund also serve in similar capacities for the other 14 registered investment companies in the American Century Investments family of funds advised by ACIM or American Century Global Investment Management, Inc. (ACGIM), a wholly owned subsidiary of ACIM, unless otherwise noted. Only officers with policy-making functions are listed. No officer is compensated for his or her service as an officer of the fund. The listed officers are interested persons of the fund and are appointed or re-appointed on an annual basis.
Interested Director
Jonathan S. Thomas, 4500 Main Street, Kansas City, MO 64111
Year of Birth: 1963
Position(s) Held with Fund: Director (since 2007) and President (since 2007)
Principal Occupation(s) During Past 5 Years: President and Chief Executive Officer, ACC
(March 2007 to present); Chief Administrative Officer, ACC (February 2006 to
February 2007); Executive Vice President, ACC (November 2005 to February 2007).
Also serves as: President, Chief Executive Officer and Director, ACS; Executive
Vice President, ACIM and ACGIM; Director, ACIM, ACGIM, ACIS and other ACC
subsidiaries. Managing Director, Morgan Stanley (March 2000 to November 2005)
Number of Portfolios in Fund Complex Overseen by Director: 103
Other Directorships Held by Director: None
Independent Directors
Thomas A. Brown, 4500 Main Street, Kansas City, MO 64111
Year of Birth: 1940
Position(s) Held with Fund: Director (since 1980)
Principal Occupation(s) During Past 5 Years: Managing Member, Associated Investments, LLC
(real estate investment company); Managing Member, Brown Cascade Properties,
LLC (real estate investment company); Retired, Area Vice President, Applied
Industrial Technologies (bearings and power transmission company)
Number of Portfolios in Fund Complex Overseen by Director: 63
Other Directorships Held by Director: None
33
Andrea C. Hall, Ph.D., 4500 Main Street, Kansas City, MO 64111
Year of Birth: 1945
Position(s) Held with Fund: Director (since 1997)
Principal Occupation(s) During Past 5 Years: Retired, Advisor to the President, Midwest
Research Institute (not-for-profit, contract research organization)
Number of Portfolios in Fund Complex Overseen by Director: 63
Other Directorships Held by Director: None
James A. Olson, 4500 Main Street, Kansas City, MO 64111
Year of Birth: 1942
Position(s) Held with Fund: Director (since 2007)
Principal Occupation(s) During Past 5 Years: Member, Plaza Belmont LLC (private equity
fund manager); Chief Financial Officer, Plaza Belmont LLC (September 1999 to
September 2006)
Number of Portfolios in Fund Complex Overseen by Director: 63
Other Directorships Held by Director: Saia, Inc. and Entertainment Properties Trust
Donald H. Pratt, 4500 Main Street, Kansas City, MO 64111
Year of Birth: 1937
Position(s) Held with Fund: Director (since 1995) and Chairman of the Board (since 2005)
Principal Occupation(s) During Past 5 Years: Chairman and Chief Executive Officer, Western
Investments, Inc. (real estate company); Retired Chairman of the Board, Butler
Manufacturing Company (metal buildings producer)
Number of Portfolios in Fund Complex Overseen by Director: 63
Other Directorships Held by Director: None
Gale E. Sayers, 4500 Main Street, Kansas City, MO 64111
Year of Birth: 1943
Position(s) Held with Fund: Director (since 2000)
Principal Occupation(s) During Past 5 Years: President, Chief Executive Officer and Founder,
Sayers40, Inc. (technology products and services provider)
Number of Portfolios in Fund Complex Overseen by Director: 63
Other Directorships Held by Director: None
M. Jeannine Strandjord, 4500 Main Street, Kansas City, MO 64111
Year of Birth: 1945
Position(s) Held with Fund: Director (since 1994)
Principal Occupation(s) During Past 5 Years: Retired, formerly Senior Vice President, Sprint
Corporation (telecommunications company)
Number of Portfolios in Fund Complex Overseen by Director: 63
Other Directorships Held by Director: DST Systems, Inc.; Euronet Worldwide, Inc. and
Charming Shoppes, Inc.
John R. Whitten, 4500 Main Street, Kansas City, MO 64111
Year of Birth: 1946
Position(s) Held with Fund: Director (since 2008)
Principal Occupation(s) During Past 5 Years: Project Consultant, Celanese Corp. (industrial
chemical company) (September 2004 to January 2005)
Number of Portfolios in Fund Complex Overseen by Director: 63
Other Directorships Held by Director: Rudolph Technologies, Inc.
34
Officers
Barry Fink, 4500 Main Street, Kansas City, MO 64111
Year of Birth: 1955
Position(s) Held with Fund: Executive Vice President (since 2007)
Principal Occupation(s) During Past 5 Years: Chief Operating Officer and Executive Vice
President, ACC (September 2007 to present); President, ACS (October 2007 to
present); Managing Director, Morgan Stanley (2000 to 2007); Global General
Counsel, Morgan Stanley (2000 to 2006). Also serves as: Director, ACC, ACS, ACIS
and other ACC subsidiaries
Maryanne Roepke, 4500 Main Street, Kansas City, MO 64111
Year of Birth: 1956
Position(s) Held with Fund: Chief Compliance Officer (since 2006) and Senior Vice
President (since 2000)
Principal Occupation(s) During Past 5 Years: Chief Compliance Officer, ACIM, ACGIM and ACS
(August 2006 to present); Assistant Treasurer, ACC (January 1995 to August 2006); and
Treasurer and Chief Financial Officer, various American Century Investments funds
(July 2000 to August 2006). Also serves as: Senior Vice President, ACS
Charles A. Etherington, 4500 Main Street, Kansas City, MO 64111
Year of Birth: 1957
Position(s) Held with Fund: General Counsel (since 2007) and Senior Vice President
(since 2006)
Principal Occupation(s) During Past 5 Years: Attorney, ACC (February 1994 to present); Vice
President, ACC (November 2005 to present); General Counsel, ACC (March 2007
to present). Also serves as: General Counsel, ACIM, ACGIM, ACS, ACIS and other
ACC subsidiaries; and Senior Vice President, ACIM, ACGIM and ACS
Robert Leach, 4500 Main Street, Kansas City, MO 64111
Year of Birth: 1966
Position(s) Held with Fund: Vice President, Treasurer and Chief Financial Officer
(all since 2006)
Principal Occupation(s) During Past 5 Years: Vice President, ACS (February 2000 to present); and
Controller, various American Century Investments funds (1997 to September 2006)
David H. Reinmiller, 4500 Main Street, Kansas City, MO 64111
Year of Birth: 1963
Position(s) Held with Fund: Vice President (since September 2000)
Principal Occupation(s) During Past 5 Years: Attorney, ACC (January 1994 to present);
Associate General Counsel, ACC (January 2001 to present); Chief Compliance
Officer, American Century Investments funds, ACIM and ACGIM (January 2001 to
February 2005). Also serves as: Associate General Counsel, ACIM, ACGIM, ACS,
ACIS and other ACC subsidiaries; and Vice President, ACIM, ACGIM and ACS
Ward Stauffer, 4500 Main Street, Kansas City, MO 64111
Year of Birth: 1960
Position(s) Held with Fund: Secretary (since February 2005)
Principal Occupation(s) During Past 5 Years: Attorney, ACC (June 2003 to present)
The SAI has additional information about the fund’s directors and is available without charge, upon request, by calling 1-800-345-2021.
35
|
| Approval of Management Agreement |
Under Section 15(c) of the Investment Company Act, contracts for investment advisory services are required to be reviewed, evaluated and approved by a majority of a fund’s independent directors (the “Directors”) each year. At American Century Investments, this process is referred to as the “15(c) Process.” As a part of this process, the board reviews fund performance, shareholder services, audit and compliance information, and a variety of other reports from the advisor concerning fund operations. In addition to this annual review, the board of directors oversees and evaluates on a continuous basis at its quarterly meetings the nature and quality of significant services performed by the advisor, fund performance, audit and compliance information, and a variety of other reports relating to fund operations. The board, or committees of the board, also holds special meetings as needed.
Under a Securities and Exchange Commission rule, each fund is required to disclose in its annual or semiannual report, as appropriate, the material factors and conclusions that formed the basis for the board’s approval or renewal of any advisory agreements within the fund’s most recently completed fiscal half-year period.
Annual Contract Review Process
As part of the annual 15(c) Process undertaken during the most recent fiscal half-year period, the Directors reviewed extensive data and information compiled by the advisor and certain independent providers of evaluative data (the “15(c) Providers”) concerning Ultra (the “Fund”) and the services provided to the Fund under the management agreement. The information considered and the discussions held at the meetings included, but were not limited to:
• the nature, extent and quality of investment management, shareholder services and other services provided to the Fund;
• the wide range of programs and services the advisor provides to the Fund and their shareholders on a routine and non-routine basis;
• the compliance policies, procedures, and regulatory experience of the advisor;
• data comparing the cost of owning the Fund to the cost of owning a similar fund;
• data comparing the Fund’s performance to appropriate benchmarks and/or a peer group of other mutual funds with similar investment objectives and strategies;
• financial data showing the profitability of the Fund to the advisor and the overall profitability of the advisor;
• data comparing services provided and charges to other investment management clients of the advisor; and
• consideration of collateral benefits derived by the advisor from the management of the Fund and any potential economies of scale relating thereto.
36
In keeping with its practice, the Fund’s board of directors held two in-person meetings and one telephonic meeting to review and discuss the information provided. The board also had the benefit of the advice of its independent counsel throughout the period.
Factors Considered
The Directors considered all of the information provided by the advisor, the 15(c) Providers, and the board’s independent counsel, and evaluated such information for each fund for which the board has responsibility. In connection with their review of the Fund, the Directors did not identify any single factor as being all-important or controlling, and each Director may have attributed different levels of importance to different factors. In deciding to renew the management and subadvisory agreements under the terms ultimately determined by the board to be appropriate, the Directors’ decision was based on the following factors.
Nature, Extent and Quality of Services - Generally. Under the management agreement, the advisor is responsible for providing or arranging for all services necessary for the operation of the Fund. The board noted that under the management agreement, the advisor provides or arranges at its own expense a wide variety of services including:
• Fund construction and design
• portfolio security selection
• initial capitalization/funding
• securities trading
• Fund administration
• custody of Fund assets
• daily valuation of the Fund’s portfolio
• shareholder servicing and transfer agency, including shareholder confirmations, recordkeeping and communications
• legal services
• regulatory and portfolio compliance
• financial reporting
• marketing and distribution
The Directors noted that many of the services provided by the advisor have expanded over time both in terms of quantity and complexity in response to shareholder demands, competition in the industry and the changing regulatory environment. They discussed with the advisor the challenges presented by these changes and the impact on the Fund. In performing
37
their evaluation, the Directors considered information received in connection with the annual review, as well as information provided on an ongoing basis at their regularly scheduled board and committee meetings.
Investment Management Services. The nature of the investment management services provided to the Fund is quite complex and allows Fund shareholders access to professional money management, instant diversification of their investments, and liquidity. In evaluating investment performance, the board expects the advisor to manage the Fund in accordance with its investment objectives and approved strategies. Further, the Directors recognize that the advisor has an obligation to monitor trading activities, and in particular to seek the best execution of fund trades, and to evaluate the use of and payment for research. In providing these services, the advisor utilizes teams of investment professionals (portfolio managers, analysts, research assistants, and securities traders) who require extensive information technology, research, training, compl iance and other systems to conduct their business. At each quarterly meeting the Directors review investment performance information for the Fund, together with comparative information for appropriate benchmarks and/or peer groups of funds managed similarly to the Fund. The Directors also review detailed performance information during the 15(c) Process comparing the Fund’s performance with that of similar funds not managed by the advisor. If performance concerns are identified, the Directors discuss with the advisor the reasons for such results (e.g., market conditions, security selection) and any efforts being undertaken to improve performance. The fund’s quarter end performance fell below the median for its peer group for both the one- and three-year period during the past year. The board discussed the fund’s performance with the advisor and was satisfied with the efforts being undertaken by the advisor. The board will continue to monitor these efforts and the performance of the Fund. More d etailed information about the Fund’s performance can be found in the Performance and Portfolio Commentary sections of this report.
Shareholder and Other Services. The advisor provides the Fund with a comprehensive package of transfer agency, shareholder, and other services. The Directors review reports and evaluations of such services at their regular quarterly meetings, including the annual meeting concerning contract review, and reports to the board. These reports include, but are not limited to, information regarding the operational efficiency and accuracy of the shareholder and transfer agency services provided, staffing levels, shareholder satisfaction (as measured by external as well as internal sources), technology support, new products and services offered to Fund shareholders, securities trading activities, portfolio valuation services, auditing services, and legal and operational compliance activities. Certain aspects of shareholder and transfer agency servi ce level efficiency and the quality of securities trading activities are measured by independent third party providers and are presented in comparison to other fund groups not managed by the advisor.
38
Costs of Services Provided and Profitability. The advisor provides detailed information concerning its cost of providing various services to the Fund, its profitability in managing the Fund, its overall profitability, and its financial condition. The Directors have reviewed with the advisor the methodology used to prepare this financial information. This financial information regarding the advisor is considered in order to evaluate the advisor’s financial condition, its ability to continue to provide services under the management agreement, and the reasonableness of the current management fee. The board concluded that the advisor’s profits were reasonable in light of the services provided to the Fund.
Ethics. The Directors generally consider the advisor’s commitment to providing quality services to shareholders and to conducting its business ethically. They noted that the advisor’s practices generally meet or exceed industry best practices.
Economies of Scale. The Directors review information provided by the advisor regarding the possible existence of economies of scale in connection with the management of the Fund. The Directors concluded that economies of scale are difficult to measure and predict with precision, especially on a fund-by-fund basis. The analysis of economies of scale is further complicated by the additional services and content provided by the advisor and its reinvestment in its ability to provide and expand those services. Accordingly, the Directors seek to evaluate economies of scale by reviewing other information, such as year-over-year profitability of the advisor generally, the profitability of its management of the Fund specifically, the expenses incurred by the advisor in providing various functions to the Fund, and the fees of competitive funds not m anaged by the advisor. The Directors believe the advisor is appropriately sharing economies of scale through its competitive fee structure, fee breakpoints as the Fund increases in size, and through reinvestment in its business to provide shareholders additional content and services.
Comparison to Other Funds’ Fees. The Fund pays the advisor a single, all-inclusive (or unified) management fee for providing all services necessary for the management and operation of the Fund, other than brokerage expenses, taxes, interest, extraordinary expenses, and the fees and expenses of the Fund’s independent directors (including their independent legal counsel). Under the unified fee structure, the advisor is responsible for providing all investment advisory, custody, audit, administrative, compliance, record-keeping, marketing and shareholder services, or arranging and supervising third parties to provide such services. By contrast, most other funds are charged a variety of fees, including an investment advisory fee, a transfer agency fee, an administrative fee, distribution charges and other expenses. Other than their i nvestment advisory fees and Rule 12b-1 distribution fees, all other components of the total fees charged by these other funds may be increased without shareholder approval. The board believes the unified fee structure is a benefit to Fund shareholders because it clearly discloses to shareholders the cost of owning Fund shares, and, since the unified fee cannot be increased without a vote of Fund shareholders, it shifts to the advisor the risk of increased costs of operating the Fund and provides a direct incentive to minimize administrative inefficiencies. Part of the
39
Directors’ analysis of fee levels involves reviewing certain evaluative data compiled by a 15(c) Provider comparing the Fund’s unified fee to the total expense ratio of other funds in the Fund’s peer group and performing a regression analysis to evaluate the effect of fee breakpoints as assets under management increase. The unified fee charged to shareholders of the Fund was below the median of the total expense ratios of its peer group. In addition, the Directors also reviewed updated fee level data provided by the advisor, but recognized that comparative data was particularly difficult to evaluate given the significant market developments during the past year. The board concluded that the management fee paid by the Fund to the advisor was reasonable in light of the services provided to the Fund.
Comparison to Fees and Services Provided to Other Clients of the Advisor. The Directors also requested and received information from the advisor concerning the nature of the services, fees, and profitability of its advisory services to advisory clients other than the Fund. They observed that these varying types of client accounts require different services and involve different regulatory and entrepreneurial risks than the management of the Fund. The Directors analyzed this information and concluded that the fees charged and services provided to the Fund were reasonable by comparison.
Collateral Benefits Derived by the Advisor. The Directors considered the existence of collateral benefits the advisor may receive as a result of its relationship with the Fund. They concluded that the advisor’s primary business is managing mutual funds and it generally does not use fund or shareholder information to generate profits in other lines of business, and therefore does not derive any significant collateral benefits from them. The Directors noted that the advisor receives proprietary research from broker-dealers that execute fund portfolio transactions and concluded that this research is likely to benefit fund shareholders. The Directors also determined that the advisor is able to provide investment management services to certain clients other than the Fund, at least in part, due to its existing infrastructure built to serve the fund complex. The Directors concluded, however, that the assets of those other clients are not material to the analysis and, in any event, are included with the assets of the Fund to determine breakpoints in the Fund’s fee schedule, provided they are managed using the same investment team and strategy.
Conclusions of the Directors
As a result of this process, the board, including all of the independent directors, in the absence of particular circumstances and assisted by the advice of legal counsel that is independent of the advisor, taking into account all of the factors discussed above and the information provided by the advisor concluded that the investment management agreement between the Fund and the advisor is fair and reasonable in light of the services provided and should be renewed.
40
Retirement Account Information
As required by law, distributions you receive from certain IRAs, or 403(b), 457 and qualified plans are subject to federal income tax withholding, unless you elect not to have withholding apply. Tax will be withheld on the total amount withdrawn even though you may be receiving amounts that are not subject to withholding, such as nondeductible contributions. In such case, excess amounts of withholding could occur. You may adjust your withholding election so that a greater or lesser amount will be withheld.
If you don’t want us to withhold on this amount, you must notify us to not withhold the federal income tax. You may notify us in writing or in certain situations by telephone or through other electronic means. You have the right to revoke your withholding election at any time and any election you make may remain in effect until revoked by filing a new election.
Remember, even if you elect not to have income tax withheld, you are liable for paying income tax on the taxable portion of your withdrawal. If you elect not to have income tax withheld or you don’t have enough income tax withheld, you may be responsible for payment of estimated tax. You may incur penalties under the estimated tax rules if your withholding and estimated tax payments are not sufficient. You can reduce or defer the income tax on a distribution by directly or indirectly rolling such distribution over to another IRA or eligible plan. You should consult your tax advisor for additional information.
State tax will be withheld if, at the time of your distribution, your address is within one of the mandatory withholding states and you have federal income tax withheld. State taxes will be withheld from your distribution in accordance with the respective state rules.
Proxy Voting Guidelines
American Century Investment Management, Inc., the fund’s investment advisor, is responsible for exercising the voting rights associated with the securities purchased and/or held by the fund. A description of the policies and procedures the advisor uses in fulfilling this responsibility is available without charge, upon request, by calling 1-800-345-2021. It is also available on American Century Investments’ website at americancentury.com and on the Securities and Exchange Commission’s website at sec.gov. Information regarding how the investment advisor voted proxies relating to portfolio securities during the most recent 12-month period ended June 30 is available on the “About Us” page at americancentury.com. It is also available at sec.gov.
Quarterly Portfolio Disclosure
The fund files its complete schedule of portfolio holdings with the Securities and Exchange Commission (SEC) for the first and third quarters of each fiscal year on Form N-Q. The fund’s Form N-Q is available on the SEC’s website at sec.gov, and may be reviewed and copied at the SEC’s Public Reference Room in Washington, DC. Information on the operation of the Public Reference Room may be obtained by calling 1-800-SEC-0330. The fund also makes its complete schedule of portfolio holdings for the most recent quarter of its fiscal year available on its website at americancentury.com and, upon request, by calling 1-800-345-2021.
41
The following indices are used to illustrate investment market, sector, or style performance or to serve as fund performance comparisons. They are not investment products available for purchase.
The Russell 1000® Index is a market-capitalization weighted, large-cap index created by Frank Russell Company to measure the performance of the 1,000 largest publicly traded U.S. companies, based on total market capitalization.
The Russell 1000® Growth Index measures the performance of those Russell 1000 Index companies (the 1,000 largest publicly traded U.S. companies, based on total market capitalization) with higher price-to-book ratios and higher forecasted growth values.
The Russell 1000® Value Index measures the performance of those Russell 1000 Index companies (the 1,000 largest publicly traded U.S. companies, based on total market capitalization) with lower price-to-book ratios and lower forecasted growth values.
The Russell 2000® Index is a market-capitalization weighted index created by Frank Russell Company to measure the performance of the 2,000 smallest of the 3,000 largest publicly traded U.S. companies, based on total market capitalization.
The Russell 2000® Growth Index measures the performance of those Russell 2000 Index companies (the 2,000 smallest of the 3,000 largest publicly traded U.S. companies, based on total market capitalization) with higher price-to-book ratios and higher forecasted growth values.
The Russell 2000® Value Index measures the performance of those Russell 2000 Index companies (the 2,000 smallest of the 3,000 largest publicly traded U.S. companies, based on total market capitalization) with lower price-to-book ratios and lower forecasted growth values.
The Russell Midcap® Index measures the performance of the 800 smallest of the 1,000 largest publicly traded U.S. companies, based on total market capitalization.
The Russell Midcap® Growth Index measures the performance of those Russell Midcap Index companies (the 800 smallest of the 1,000 largest publicly traded U.S. companies, based on total market capitalization) with higher price-to-book ratios and higher forecasted growth values.
The Russell Midcap® Value Index measures the performance of those Russell Midcap Index companies (the 800 smallest of the 1,000 largest publicly traded U.S. companies, based on total market capitalization) with lower price-to-book ratios and lower forecasted growth values.
The S&P 500 Index is a market value-weighted index of the stocks of 500 publicly traded U.S. companies chosen for market size, liquidity, and industry group representation that are considered to be leading firms in dominant industries. Each stock’s weight in the index is proportionate to its market value. Created by Standard & Poor’s, it is considered to be a broad measure of U.S. stock market performance.
42
43
44

| |
| |
| Contact Us | |
| americancentury.com | |
| Automated Information Line | 1-800-345-8765 |
| Investor Services Representative | 1-800-345-2021 or |
| | 816-531-5575 |
| Investors Using Advisors | 1-800-378-9878 |
| Business, Not-For-Profit, Employer-Sponsored | |
| Retirement Plans | 1-800-345-3533 |
| Banks and Trust Companies, Broker-Dealers, | |
| Financial Professionals, Insurance Companies | 1-800-345-6488 |
| Telecommunications Device for the Deaf | 1-800-634-4113 |
| American Century Mutual Funds, Inc. | |
| Investment Advisor: | |
| American Century Investment Management, Inc. | |
| Kansas City, Missouri | |
This report and the statements it contains are submitted for the general
information of our shareholders. The report is not authorized for distribution to
prospective investors unless preceded or accompanied by an effective prospectus.
American Century Investment Services, Inc., Distributor
©2009 American Century Proprietary Holdings, Inc. All rights reserved.
0912
CL-ANN-67034N
|
| Annual Report |
| October 31, 2009 |

|
| American Century Investments |
Growth Fund
VistaSM Fund
| |
| President’s Letter | 2 |
| Independent Chairman’s Letter | 3 |
| Market Perspective | 4 |
| U.S. Stock Index Returns | 4 |
| |
| Growth | |
| |
| Performance | 5 |
| Portfolio Commentary | 7 |
| Top Ten Holdings | 9 |
| Top Five Industries | 9 |
| Types of Investments in Portfolio | 9 |
| |
| Vista | |
| |
| Performance | 10 |
| Portfolio Commentary | 12 |
| Top Ten Holdings | 14 |
| Top Five Industries | 14 |
| Types of Investments in Portfolio | 14 |
| |
| Shareholder Fee Examples | 15 |
| |
| Financial Statements | |
| |
| Schedule of Investments | 17 |
| Statement of Assets and Liabilities | 23 |
| Statement of Operations | 25 |
| Statement of Changes in Net Assets | 26 |
| Notes to Financial Statements | 27 |
| Financial Highlights | 37 |
| Report of Independent Registered Public Accounting Firm | 45 |
| |
| Other Information | |
| |
| Management | 46 |
| Approval of Management Agreements | 49 |
| Additional Information | 54 |
| Index Definitions | 55 |
The opinions expressed in the Market Perspective and each of the Portfolio Commentaries reflect those of the portfolio management team as of the date of the report, and do not necessarily represent the opinions of American Century Investments or any other person in the American Century Investments organization. Any such opinions are subject to change at any time based upon market or other conditions and American Century Investments disclaims any responsibility to update such opinions. These opinions may not be relied upon as investment advice and, because investment decisions made by American Century Investments funds are based on numerous factors, may not be relied upon as an indication of trading intent on behalf of any American Century Investments fund. Security examples are used for representational purposes only and are not intended as recommendations to purchase or sell securities. Performance information for com parative indices and securities is provided to American Century Investments by third party vendors. To the best of American Century Investments’ knowledge, such information is accurate at the time of printing.

Dear Investor:
Thank you for taking time to review the following pages, which provide the performance of your investment along with the perspectives of our experienced portfolio management team for the financial reporting period ended October 31, 2009. We appreciate your trust in American Century Investments® at this volatile, transitional time in the economy and investment markets.
As the upheavals associated with the “Great Recession” gradually subside, our senior management team has put considerable thought into how the investment environment has changed and what new challenges and opportunities await us. Critical factors that we are anticipating in the coming year include marked shifts in investment and spending behavior, along with consolidation in our industry.
Most importantly, we think the economic recovery will be slow and extended. The economy and capital markets have come a long way since Lehman Brothers collapsed in the third quarter of 2008, but 2010 will likely bring continuing challenges. The stock market’s rebound since last March and the third-quarter economic surge in 2009 were fueled largely by corporate cost-cutting and unprecedented monetary and fiscal stimulus, including some key programs that have since expired or been scaled back.
Meanwhile, the resilient but struggling consumer sector still faces double-digit unemployment, heavy debt burdens, tight credit conditions, and a housing market that is starting to stabilize, but remains vulnerable. Much of our investment positioning in 2009 cautiously reflected these still unstable economic fundamentals, leading to underperformance, in some cases, versus market benchmarks buoyed by the rally of riskier assets. We still support our fundamentally based positioning because we believe strongly that some markets—driven more by technical factors than fundamentals—have advanced further than underlying economic conditions warrant, and remain susceptible to the possibility of more volatility ahead.
Thank you for your continued confidence in us.
Sincerely,

Jonathan Thomas
President and Chief Executive Officer
American Century Investments
2
|
| Independent Chairman’s Letter |

In my first letter to shareholders of the American Century Investments funds, I invited you to contact me with your questions. I have been gratified with your response. Most shareholder inquiries to date have related to specific fund performance issues. As I noted in my individual responses, your board through the Fund Performance Committee continues to stress improved performance in our quarterly meetings with chief investment officers and fund managers.
An important part of our fund performance review process is a face-to-face meeting with portfolio managers. The board traveled during the second quarter to the American Century Investments office in Mountain View, California to meet with the fund of funds and asset allocation portfolio management teams. These meetings validated the importance of thorough reviews of investment opportunities by the credit management personnel resident in that office. As a result of their efforts, American Century Investments funds were able to avoid the “toxic assets” that plagued many other fund families in 2008.
From April through June 2009, the board conducted its annual review of the advisory contracts between American Century Investments and each fund. Our efforts involved a review of fund information, including assets under management; total expense ratio compared to peers; economies of scale; fee breakpoints that reduce shareholder costs as assets increase; performance compared to peers and benchmarks; and the quality of services provided to fund shareholders. A detailed discussion of board considerations in connection with advisory contract renewal is included annually in each fund’s shareholder reports. During this review, the board focuses on a detailed comparison of the competitive position of each fund and has negotiated more than 60 breakpoints or fee reductions in the past five years.
The board looks forward to another year of work on your behalf and your comments are appreciated. You are invited to email me at dhpratt@fundboardchair.com.
3

By Enrique Chang — Chief Investment Officer, American Century Investments (far left) and Greg Woodhams — Chief Investment Officer, U.S. Growth Equity - Large Cap
Signs of Economic Recovery Boosted Stocks
The year ended October 31, 2009, was a period of extremes for the U.S. stock market. The market began the period in the midst of a historically steep decline, then finished the period with one of its strongest rallies since the 1930s. The market’s dramatic swings resulted from rapidly shifting expectations regarding the economic and financial environment.
Stocks fell sharply in late 2008 and early 2009 as investors grew increasingly concerned about a deep economic downturn and a lack of liquidity in the credit markets. In response, the federal government took unprecedented actions to shore up the credit sector, support the housing market, and revive the stalled economy.
These efforts began to bear fruit in the spring of 2009 as signs of economic stabilization emerged. Although the unemployment rate continued to climb, reaching a 26-year high of 10.2% by October, the broader economy showed evidence of improvement, producing real growth in the third quarter of 2009—the first positive quarterly growth in more than a year. In addition, cost-management efforts at many companies helped generate better-than-expected earnings in the second and third quarters.
As a result, the equity market reached a multi-year low on March 9 and then reversed course, rising steadily throughout the last seven months of the period. The rally helped erase the market’s earlier losses, enabling the major stock indexes to produce gains of approximately 10% overall. Growth stocks outperformed value shares by a wide margin (see the table below) across all market capitalizations, though they lagged modestly over the last six months.
Economic Challenges Remain
Although recent economic trends have been encouraging, the recovery will likely be gradual until there is sustained improvement in the delinquency levels of consumer debt and the unemployment rate. Thus far, the U.S. consumer has been conspicuously absent from the recovery, and given the weakness in the U.S. dollar and improving economic conditions elsewhere in the world, we may see an export-led recovery until the consumer gets back on firmer footing.
| | | | |
| U.S. Stock Index Returns | | | | |
| For the 12 months ended October 31, 2009 | | | |
| Russell 1000 Index (Large-Cap) | 11.20% | | Russell 2000 Index (Small-Cap) | 6.46% |
| Russell 1000 Growth Index | 17.51% | | Russell 2000 Growth Index | 11.34% |
| Russell 1000 Value Index | 4.78% | | Russell 2000 Value Index | 1.96% |
| Russell Midcap Index | 18.75% | | | |
| Russell Midcap Growth Index | 22.48% | | | |
| Russell Midcap Value Index | 14.52% | | | |
4
| | | | | | |
| Growth | | | | | |
| |
| Total Returns as of October 31, 2009 | | | | |
| | | | Average Annual Returns | |
| | | | | | Since | Inception |
| | | 1 year | 5 years | 10 years | Inception | Date |
| Investor Class | 15.25% | 2.17% | -1.68% | 13.27% | 6/30/71(1) |
| Russell 1000 Growth Index(2) | 17.51% | 1.27% | -3.39% | N/A(3) | — |
| Institutional Class | 15.45% | 2.38% | -1.47% | 3.41% | 6/16/97 |
| Advisor Class | 14.99% | 1.92% | -1.94% | 3.38% | 6/4/97 |
| R Class | 14.67% | 1.66% | — | 3.01% | 8/29/03 |
| (1) | Although the fund’s actual inception date was 10/31/58, this inception date corresponds with the investment advisor’s implementation of its |
| | current investment philosophy and practices. | | | | | |
| (2) | Data provided by Lipper Inc. – A Reuters Company. © 2009 Reuters. All rights reserved. Any copying, republication or redistribution of Lipper |
| | content, including by caching, framing or similar means, is expressly prohibited without the prior written consent of Lipper. Lipper shall not be |
| | liable for any errors or delays in the content, or for any actions taken in reliance thereon. | | | |
| | The data contained herein has been obtained from company reports, financial reporting services, periodicals and other resources believed to be |
| | reliable. Although carefully verified, data on compilations is not guaranteed by Lipper and may be incomplete. No offer or solicitations to buy or |
| | sell any of the securities herein is being made by Lipper. | | | | |
| (3) | Benchmark began 12/29/78. | | | | | |
Data presented reflect past performance. Past performance is no guarantee of future results. Current performance may be higher or lower than the performance shown. Investment return and principal value will fluctuate, and redemption value may be more or less than original cost. To obtain performance data current to the most recent month end, please call 1-800-345-2021 or visit americancentury.com.
Unless otherwise indicated, performance reflects Investor Class shares; performance for other share classes will vary due to differences in fee structure. For information about other share classes available, please consult the prospectus. Data assumes reinvestment of dividends and capital gains, and none of the charts reflect the deduction of taxes that a shareholder would pay on fund distributions or the redemption of fund shares. Returns for the index are provided for comparison. The fund’s total returns include operating expenses (such as transaction costs and management fees) that reduce returns, while the total returns of the index do not.
5
Growth
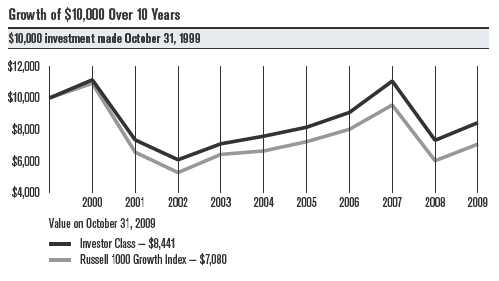
| | | | | | | | | | | |
| One-Year Returns Over 10 Years | | | | | | | |
| Periods ended October 31 | | | | | | | | | |
| | | 2000 | 2001 | 2002 | 2003 | 2004 | 2005 | 2006 | 2007 | 2008 | 2009 |
| Investor Class | 11.49% | -34.14% | -17.09% | 16.62% | 6.78% | 7.47% | 11.51% | 21.86% | -33.86% | 15.25% |
| Russell 1000 | | | | | | | | | | |
| Growth Index | 9.33% | -39.95% | -19.62% | 21.81% | 3.38% | 8.81% | 10.84% | 19.23% | -36.95% | 17.51% |
| | | | | | | | | | | |
| Total Annual Fund Operating Expenses | | | | | | |
| | Investor Class | Institutional Class | Advisor Class | | R Class | |
| | 1.00% | | 0.80% | | | 1.25% | | | 1.50% | |
The total annual fund operating expenses shown is as stated in the fund’s prospectus current as of the date of this report. The prospectus may vary from the expense ratio shown elsewhere in this report because it is based on a different time period, includes acquired fund fees and expenses, and, if applicable, does not include fee waivers or expense reimbursements.
Data presented reflect past performance. Past performance is no guarantee of future results. Current performance may be higher or lower than the performance shown. Investment return and principal value will fluctuate, and redemption value may be more or less than original cost. To obtain performance data current to the most recent month end, please call 1-800-345-2021 or visit americancentury.com.
Unless otherwise indicated, performance reflects Investor Class shares; performance for other share classes will vary due to differences in fee structure. For information about other share classes available, please consult the prospectus. Data assumes reinvestment of dividends and capital gains, and none of the charts reflect the deduction of taxes that a shareholder would pay on fund distributions or the redemption of fund shares. Returns for the index are provided for comparison. The fund’s total returns include operating expenses (such as transaction costs and management fees) that reduce returns, while the total returns of the index do not.
6
Growth
Portfolio Managers: Greg Woodhams and Prescott LeGard
Performance Summary
Growth gained 15.25%* in the 12 months ended October 31, 2009. By comparison, the Russell 1000 Growth Index (the fund’s benchmark) returned 17.51%. However, the portfolio continues to outperform its benchmark over longer time periods (see pages 5 and 6).
The portfolio enjoyed double-digit returns during a remarkable period that included the depths of the credit crisis and subsequent rebound by financial markets (see the Market Perspective on page 4). In terms of absolute returns, holdings in the information technology sector contributed most; no sector detracted from absolute performance. Relative to its benchmark, positioning in the energy sector hurt most, while consumer discretionary shares were the leading contributors for the 12 months.
Energy Shares Detracted Most
Energy shares were the leading detractors from relative performance, as it hurt to be underweight oil services stocks during the first half of the fiscal year. Oil services companies outperformed the exploration and production companies we favored during that time. The largest single detractor from relative results was Devon Energy, which was hurt by declining prices for natural gas. We eliminated the position. In addition, it hurt to be under-represented in shares of Exxon Mobil early in the fiscal year. In the energy equipment and services industry segment, the leading detractor was oil rig operator Transocean, which underperformed because of slack demand for its deep-ocean rigs.
Other Detractors
In information technology, positioning among IT services companies detracted most from performance. The leading detractor was Global Payments, whose earnings were hurt by difficult macroeconomic conditions and negative currency effects. Exposure to consumer credit firm Visa and game maker Activision Blizzard also detracted from relative results. In addition, it hurt to be underrepresented in shares of IBM, Cognizant Technology Solutions, and Adobe Systems.
Stock selection and an underweight position meant materials shares also detracted. Chemical firm Mosaic was the leading detractor in the sector. Positioning in the health care sector also hurt relative performance, led by holdings in the pharmaceutical and health care equipment industries. In general, performance in the sector reflected a trend evident across the market—the higher-beta, higher-volatility shares that underperformed in 2008 and early 2009 generally did best in the rally since March. Higher-quality, lower-beta securities—including many in the health care sector—did not participate fully in the rebound. The leading individual detractors in this space were pharmaceutical companies Schering-Plough—which was acquired at a premium and in which the portfolio was underrepresented—and Abbott Laboratories.
*All fund returns referenced in this commentary are for Investor Class shares.
7
Growth
Key Contributors
The largest contribution to relative return by far came from stock choices among consumer discretionary shares. Specialty retailer J. Crew Group was the number-one contributor to relative results for the year, thanks to good sales trends and margin control. Mid-price retailer Kohl’s was another key contributor after demonstrating stronger same-store sales and margins in recent quarters. Auto component manufacturer BorgWarner also helped relative results. The Growth management team added to this position late in 2008 when the stock underperformed. That helped performance in 2009, as the shares benefited from a return of investor focus to the growing demand for more fuel-efficient, cleaner-burning engines. Among other notable contributors in the sector were CarMax, Advance Auto Parts, and O’Reilly Automotive.
The portfolio also benefited from a number of holdings in the industrial sector. Valmont Industries was the key contributor in this space, driven by strong demand for its products relating to cellular towers, power poles, and mechanized irrigation systems. Commercial truck manufacturer Navistar International was another source of strength, as these economically sensitive shares benefited from signs of economic stability in 2009.
Other stocks making significant contributions to relative return were multinational semiconductor firm Marvell Technology Group and chemicals and materials firm Celanese. Marvell benefited from better pricing for its computer chips. Celanese enjoyed cost advantages over its competitors and provided a more favorable outlook than expected.
Outlook
Despite the volatile investment climate of recent years, the portfolio managers continue to work to consistently execute their disciplined process. They recognize that each environment presents its own unique challenges; nevertheless, their emphasis on stock selection as the principal generator of alpha (excess return above a market benchmark) and focus on risk management remain constant.
As a result, the portfolio’s sector and industry selection as well as capitalization range allocations are primarily a result of identifying what the managers believe to be superior individual securities. As of October 31, 2009, they found opportunity in the consumer discretionary, health care, and financials sectors, the portfolio’s largest overweight positions. The most notable sector underweights were in industrial and material shares.
8
| | |
| Growth | | |
| |
| Top Ten Holdings as of October 31, 2009 | | |
| | % of net assets | % of net assets |
| | as of 10/31/09 | as of 4/30/09 |
| Microsoft Corp. | 4.7% | 3.7% |
| Google, Inc., Class A | 3.8% | 2.8% |
| Apple, Inc. | 3.5% | 2.7% |
| Abbott Laboratories | 2.9% | 2.1% |
| Coca-Cola Co. (The) | 2.7% | 2.5% |
| PepsiCo, Inc. | 2.6% | 1.6% |
| Cisco Systems, Inc. | 2.6% | 2.0% |
| Procter & Gamble Co. (The) | 2.3% | 1.3% |
| Express Scripts, Inc. | 2.0% | 1.4% |
| Hewlett-Packard Co. | 1.9% | 1.5% |
| |
| Top Five Industries as of October 31, 2009 | | |
| | % of net assets | % of net assets |
| | as of 10/31/09 | as of 4/30/09 |
| Computers & Peripherals | 9.7% | 5.9% |
| Software | 7.5% | 6.9% |
| Communications Equipment | 6.0% | 5.7% |
| Pharmaceuticals | 5.3% | 2.6% |
| Beverages | 5.3% | 4.1% |
| |
| Types of Investments in Portfolio | | |
| | % of net assets | % of net assets |
| | as of 10/31/09 | as of 4/30/09 |
| Common Stocks | 97.9% | 99.8% |
| Temporary Cash Investments | 1.2% | 0.1% |
| Other Assets and Liabilities | 0.9% | 0.1% |
9
| | | | | | |
| Vista | | | | | |
| |
| Total Returns as of October 31, 2009 | | | | |
| | | | Average Annual Returns | |
| | | | | | Since | Inception |
| | | 1 year | 5 years | 10 years | Inception | Date |
| Investor Class | -2.41% | 0.46% | 2.78% | 8.39% | 11/25/83 |
| Russell Midcap Growth Index(1) | 22.48% | 2.22% | 1.01% | N/A(2) | — |
| Institutional Class | -2.12% | 0.67% | 2.98% | 3.32% | 11/14/96 |
| Advisor Class | -2.65% | 0.20% | 2.52% | 2.29% | 10/2/96 |
| R Class | -2.86% | — | — | -3.48% | 7/29/05 |
| (1) | Data provided by Lipper Inc. – A Reuters Company. © 2009 Reuters. All rights reserved. Any copying, republication or redistribution of Lipper |
| | content, including by caching, framing or similar means, is expressly prohibited without the prior written consent of Lipper. Lipper shall not be |
| | liable for any errors or delays in the content, or for any actions taken in reliance thereon. | | | |
| | The data contained herein has been obtained from company reports, financial reporting services, periodicals and other resources believed to be |
| | reliable. Although carefully verified, data on compilations is not guaranteed by Lipper and may be incomplete. No offer or solicitations to buy or |
| | sell any of the securities herein is being made by Lipper. | | | | |
| (2) | Benchmark began 12/31/85. | | | | | |
Data presented reflect past performance. Past performance is no guarantee of future results. Current performance may be higher or lower than the performance shown. Investment return and principal value will fluctuate, and redemption value may be more or less than original cost. To obtain performance data current to the most recent month end, please call 1-800-345-2021 or visit americancentury.com. International investing involves special risks, such as political instability and currency fluctuations.
Unless otherwise indicated, performance reflects Investor Class shares; performance for other share classes will vary due to differences in fee structure. For information about other share classes available, please consult the prospectus. Data assumes reinvestment of dividends and capital gains, and none of the charts reflect the deduction of taxes that a shareholder would pay on fund distributions or the redemption of fund shares. Returns for the index are provided for comparison. The fund’s total returns include operating expenses (such as transaction costs and management fees) that reduce returns, while the total returns of the index do not.
10
Vista
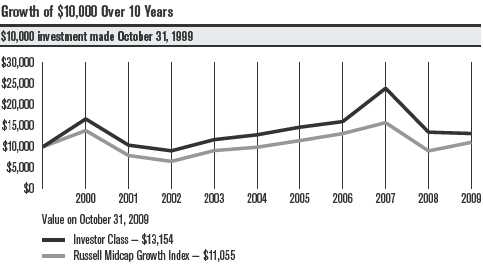
| | | | | | | | | | |
| One-Year Returns Over 10 Years | | | | | | | |
| Periods ended October 31 | | | | | | | | | |
| | 2000 | 2001 | 2002 | 2003 | 2004 | 2005 | 2006 | 2007 | 2008 | 2009 |
| Investor Class | 66.16% | -37.48% | -12.90% | 29.41% | 9.77% | 14.08% | 9.07% | 49.39% | -43.58% | -2.41% |
| Russell Midcap | | | | | | | | | | |
| Growth Index | 38.67% | -42.78% | -17.61% | 39.30% | 8.77% | 15.91% | 14.51% | 19.72% | -42.65% | 22.48% |
| | | | | | | | | | | |
| Total Annual Fund Operating Expenses | | | | | | |
| Investor Class | Institutional Class | Advisor Class | | R Class | |
| 1.00% | | 0.80% | | | 1.25% | | | 1.50% | |
The total annual fund operating expenses shown is as stated in the fund’s prospectus current as of the date of this report. The prospectus may vary from the expense ratio shown elsewhere in this report because it is based on a different time period, includes acquired fund fees and expenses, and, if applicable, does not include fee waivers or expense reimbursements.
Data presented reflect past performance. Past performance is no guarantee of future results. Current performance may be higher or lower than the performance shown. Investment return and principal value will fluctuate, and redemption value may be more or less than original cost. To obtain performance data current to the most recent month end, please call 1-800-345-2021 or visit americancentury.com. International investing involves special risks, such as political instability and currency fluctuations.
Unless otherwise indicated, performance reflects Investor Class shares; performance for other share classes will vary due to differences in fee structure. For information about other share classes available, please consult the prospectus. Data assumes reinvestment of dividends and capital gains, and none of the charts reflect the deduction of taxes that a shareholder would pay on fund distributions or the redemption of fund shares. Returns for the index are provided for comparison. The fund’s total returns include operating expenses (such as transaction costs and management fees) that reduce returns, while the total returns of the index do not.
11
Vista
Portfolio Manager: Brad Eixmann
In September 2009, portfolio manager Glenn Fogle took a personal leave of absence from American Century Investments. Brad Eixmann continues as manager for Vista.
Performance Summary
Vista declined 2.41%* for the 12 months ended October 31, 2009, under–performing the 22.48% return of its benchmark, the Russell Midcap Growth Index.
As discussed in the Market Perspective on page 4, equity markets continued to struggle during the first half of the reporting period amid extreme volatility and recession. After dipping to multi-year lows on March 9, 2009, markets responded positively to generally improving economic data and rallied soundly, erasing losses sustained early in the reporting period. Stocks that exhibit accelerating growth and improving price momentum, the two main factors that the Vista team looks for in portfolio holdings, suffered historic losses during this rally. On the other hand, lower-quality stocks that were the laggards in previous reporting periods led market strength.
Within the portfolio, security selection in the consumer discretionary and industrials sectors accounted for the majority of underperformance relative to the benchmark. Holdings in the information technology, financials, and health care sectors further detracted from relative returns.
Consumer Discretionary Detracted, but Some Holdings Contributed
Stock selection in the consumer discretionary sector detracted from absolute and relative performance. Within the sector, Vista held a number of detrimental positions within the specialty retail and discount retail industry groups. Discount chain Family Dollar Stores, Inc. had benefited from the weak economy causing consumers to trade down in their buying habits, and investors had viewed that stock and similar ones as safe havens during the downturn. As investors’ appetite for risk increased, however, these types of securities were abandoned in favor of more aggressive stocks despite generally positive continued fundamentals.
Also in the consumer discretionary sector, an overweight position in private education company ITT Educational Services added positively to both absolute and relative performance. The company benefited from expanding student enrollments as a result of corporate layoffs and fewer job opportunities. ITT was Vista’s largest contributor to relative returns for the reporting period.
Industrials, Information Technology Hindered, but Some Holdings Helped
The industrials sector was a key source of underperformance relative to Vista’s benchmark. An overweight allocation to the construction and engineering industry reflected a focus on AECOM Technology Corp. Although
*All fund returns referenced in this commentary are for Investor Class shares.
12
Vista
the company is a likely beneficiary of infrastructure buildout initiatives under the Obama administration, its stock price has been hindered by uncertainty about the timing and magnitude of demand for its services.
Holdings in the electrical equipment industry also trimmed returns. In this group, the portfolio held companies involved with alternative energy, including China-based Suntech Power, that have been some of the largest beneficiaries of increasing demand in the past. During the reporting period, though, these holdings collectively declined amid lower energy prices, slower demand, and falling product prices.
Elsewhere in the industrials sector, Vista benefited from solid stock selection in the machinery industry through its exposure to mining equipment company Bucyrus International. As the economies of China and other emerging markets have rebounded this year and commodity prices have risen, this company has seen an improvement in orders for machinery used to mine coal, copper, oil sands, and iron ore.
The information technology sector also weighed on relative performance, although Vista derived absolute gains from the sector. Within the sector, an overweight allocation and poor stock selection in the semiconductor group detracted meaningfully from relative returns.
Financials, Health Care Hurt
In the financials sector, overweight holding Fidelity National detracted significantly from absolute and relative returns. The title insurance company, which benefited from increased mortgage refinance activity as a result of lower mortgage rates, posted gains for the entire reporting period but declined while it was held in the portfolio.
The health care sector was also home to underperforming holdings. Within the sector, stakes in pharmaceutical companies and health care providers weighed on absolute and relative returns. In particular, a position in UnitedHealth Group, which is not a constituent of the benchmark, hurt returns as its share price declined in the portfolio.
Outlook
Our investment process focuses on medium-sized and smaller companies with accelerating earnings growth rates and share-price momentum. We believe that active investing in such companies will generate outperformance over time compared with the Russell Midcap Growth Index.
Despite the challenging market environment, the Vista team has identified three areas of opportunity moving forward: industry groups that we believe will benefit from a rebound in economic activity; companies that are experiencing diminished competition as a result of the economic environment; and companies with unique products or services. As always, we will rely on our process of identifying companies with accelerating growth and price momentum and currently see a significant number of companies demonstrating such characteristics.
13
| | |
| Vista | | |
| |
| Top Ten Holdings as of October 31, 2009 | | |
| | % of net assets | % of net assets |
| | as of 10/31/09 | as of 4/30/09 |
| SBA Communications Corp., Class A | 2.9% | 3.2% |
| Jefferies Group, Inc. | 2.4% | 0.5% |
| Life Technologies Corp. | 2.2% | — |
| Lazard Ltd., Class A | 2.2% | 0.6% |
| Express Scripts, Inc. | 2.2% | 1.6% |
| Legg Mason, Inc. | 2.1% | — |
| Petrohawk Energy Corp. | 1.9% | 2.3% |
| ASML Holding NV New York Shares | 1.9% | 0.5% |
| Walter Energy, Inc. | 1.8% | — |
| Bucyrus International, Inc. | 1.8% | — |
| |
| Top Five Industries as of October 31, 2009 | | |
| | % of net assets | % of net assets |
| | as of 10/31/09 | as of 4/30/09 |
| Semiconductors & Semiconductor Equipment | 10.8% | 7.6% |
| Capital Markets | 9.3% | 3.5% |
| Hotels, Restaurants & Leisure | 5.7% | 3.9% |
| Specialty Retail | 5.3% | 7.5% |
| Health Care Providers & Services | 5.3% | 5.3% |
| |
| Types of Investments in Portfolio | | |
| | % of net assets | % of net assets |
| | as of 10/31/09 | as of 4/30/09 |
| Domestic Common Stocks | 83.8% | 87.5% |
| Foreign Common Stocks(1) | 13.7% | 10.4% |
| Total Common Stocks | 97.5% | 97.9% |
| Temporary Cash Investments | 2.8% | 1.0% |
| Other Assets and Liabilities | (0.3)% | 1.1% |
| (1) Includes depositary shares, dual listed securities and foreign ordinary shares. | | |
14
|
| Shareholder Fee Examples (Unaudited) |
Fund shareholders may incur two types of costs: (1) transaction costs, including sales charges (loads) on purchase payments and redemption/ exchange fees; and (2) ongoing costs, including management fees; distribution and service (12b-1) fees; and other fund expenses. This example is intended to help you understand your ongoing costs (in dollars) of investing in your fund and to compare these costs with the ongoing cost of investing in other mutual funds.
The example is based on an investment of $1,000 made at the beginning of the period and held for the entire period from May 1, 2009 to October 31, 2009.
Actual Expenses
The table provides information about actual account values and actual expenses for each class. You may use the information, together with the amount you invested, to estimate the expenses that you paid over the period. First, identify the share class you own. Then simply divide your account value by $1,000 (for example, an $8,600 account value divided by $1,000 = 8.6), then multiply the result by the number under the heading “Expenses Paid During Period” to estimate the expenses you paid on your account during this period.
If you hold Investor Class shares of any American Century Investments fund, or Institutional Class shares of the American Century Diversified Bond Fund, in an American Century Investments account (i.e., not a financial intermediary or retirement plan account), American Century Investments may charge you a $12.50 semiannual account maintenance fee if the value of those shares is less than $10,000. We will redeem shares automatically in one of your accounts to pay the $12.50 fee. In determining your total eligible investment amount, we will include your investments in all personal accounts (including American Century Investments Brokerage accounts) registered under your Social Security number. Personal accounts include individual accounts, joint accounts, UGMA/UTMA accounts, personal trusts, Coverdell Education Savings Accounts and IRAs (including traditional, Roth, Rollover, SEP-, SARSEP- and SIMPLE-IRAs), and certain other retirement accounts. If you have only business, business retirement, employer-sponsored or American Century Investments Brokerage accounts, you are currently not subject to this fee. We will not charge the fee as long as you choose to manage your accounts exclusively online. If you are subject to the Account Maintenance Fee, your account value could be reduced by the fee amount.
Hypothetical Example for Comparison Purposes
The table also provides information about hypothetical account values and hypothetical expenses based on the actual expense ratio of each class of your fund and an assumed rate of return of 5% per year before expenses, which is not the actual return of a fund’s share class. The hypothetical account values and expenses may not be used to estimate the actual ending account balance or expenses you paid for the period. You may use this information to compare the ongoing costs of investing in your fund and other funds. To do so, compare this 5% hypothetical example with the 5% hypothetical examples that appear in the shareholder reports of the other funds.
15
Please note that the expenses shown in the table are meant to highlight your ongoing costs only and do not reflect any transactional costs, such as sales charges (loads) or redemption/exchange fees. Therefore, the table is useful in comparing ongoing costs only, and will not help you determine the relative total costs of owning different funds. In addition, if these transactional costs were included, your costs would have been higher.
| | | | |
| | Beginning | Ending | Expenses Paid | |
| | Account Value | Account Value | During Period* | Annualized |
| | 5/1/09 | 10/31/09 | 5/1/09 - 10/31/09 | Expense Ratio* |
| Growth | | | | |
| Actual | | | | |
| Investor Class | $1,000 | $1,179.10 | $5.49 | 1.00% |
| Institutional Class | $1,000 | $1,180.50 | $4.40 | 0.80% |
| Advisor Class | $1,000 | $1,177.80 | $6.86 | 1.25% |
| R Class | $1,000 | $1,176.20 | $8.23 | 1.50% |
| Hypothetical | | | | |
| Investor Class | $1,000 | $1,020.16 | $5.09 | 1.00% |
| Institutional Class | $1,000 | $1,021.17 | $4.08 | 0.80% |
| Advisor Class | $1,000 | $1,018.90 | $6.36 | 1.25% |
| R Class | $1,000 | $1,017.64 | $7.63 | 1.50% |
| Vista | | | | |
| Actual | | | | |
| Investor Class | $1,000 | $1,080.10 | $5.24 | 1.00% |
| Institutional Class | $1,000 | $1,081.70 | $4.20 | 0.80% |
| Advisor Class | $1,000 | $1,078.80 | $6.55 | 1.25% |
| R Class | $1,000 | $1,078.10 | $7.86 | 1.50% |
| Hypothetical | | | | |
| Investor Class | $1,000 | $1,020.16 | $5.09 | 1.00% |
| Institutional Class | $1,000 | $1,021.17 | $4.08 | 0.80% |
| Advisor Class | $1,000 | $1,018.90 | $6.36 | 1.25% |
| R Class | $1,000 | $1,017.64 | $7.63 | 1.50% |
| *Expenses are equal to the class’s annualized expense ratio listed in the table above, multiplied by the average account value over the period, |
| multiplied by 184, the number of days in the most recent fiscal half-year, divided by 365, to reflect the one-half year period. |
16
| | | | | | |
| Growth | | | | | | |
| |
| OCTOBER 31, 2009 | | | | | | |
| | Shares | Value | | | Shares | Value |
| Common Stocks — 97.9% | | | COMPUTERS & PERIPHERALS — 9.7% | |
| | | | | Apple, Inc.(1) | 765,700 | $ 144,334,450 |
| AEROSPACE & DEFENSE — 1.9% | | | | | |
| Honeywell International, Inc. | 813,500 | $ 29,196,515 | | Dell, Inc.(1) | 4,038,000 | 58,510,620 |
| Rockwell Collins, Inc. | 957,300 | 48,228,774 | | EMC Corp.(1) | 2,463,700 | 40,577,139 |
| | | 77,425,289 | | Hewlett-Packard Co. | 1,650,600 | 78,337,476 |
| AIR FREIGHT & LOGISTICS — 1.0% | | | Lexmark International, Inc., | | |
| | | | | Class A(1) | 578,400 | 14,749,200 |
| United Parcel Service, Inc., | | | | | | |
| Class B | 800,200 | 42,954,736 | | NetApp, Inc.(1) | 1,311,000 | 35,462,550 |
| AUTO COMPONENTS — 1.1% | | | | QLogic Corp.(1) | 1,716,000 | 30,098,640 |
| BorgWarner, Inc. | 1,555,200 | 47,153,664 | | | | 402,070,075 |
| BEVERAGES — 5.3% | | | | CONSUMER FINANCE — 1.4% | | |
| Coca-Cola Co. (The) | 2,130,700 | 113,587,617 | | American Express Co. | 1,687,600 | 58,795,984 |
| PepsiCo, Inc. | 1,760,400 | 106,592,220 | | ELECTRICAL EQUIPMENT — 0.5% | |
| | | 220,179,837 | | Rockwell Automation, Inc. | 540,200 | 22,121,190 |
| BIOTECHNOLOGY — 3.9% | | | | ELECTRONIC EQUIPMENT, INSTRUMENTS | |
| Alexion | | | | & COMPONENTS — 1.0% | | |
| Pharmaceuticals, Inc.(1) | 511,000 | 22,693,510 | | Jabil Circuit, Inc. | 2,944,000 | 39,390,720 |
| Amgen, Inc.(1) | 1,453,100 | 78,075,063 | | ENERGY EQUIPMENT & SERVICES — 1.4% | |
| Gilead Sciences, Inc.(1) | 958,400 | 40,779,920 | | Schlumberger Ltd. | 731,600 | 45,505,520 |
| Talecris Biotherapeutics | | | | Transocean Ltd.(1) | 124,000 | 10,404,840 |
| Holdings Corp.(1) | 542,500 | 10,882,550 | | | | 55,910,360 |
| Vertex | | | | FOOD & STAPLES RETAILING — 3.1% | |
| Pharmaceuticals, Inc.(1) | 329,600 | 11,061,376 | | Walgreen Co. | 1,853,700 | 70,125,471 |
| | | 163,492,419 | | Wal-Mart Stores, Inc. | 1,190,600 | 59,149,008 |
| CAPITAL MARKETS — 2.1% | | | | | | 129,274,479 |
| Charles Schwab Corp. (The) | 2,010,000 | 34,853,400 | | FOOD PRODUCTS — 3.7% | | |
| Goldman Sachs | | | | Archer-Daniels-Midland Co. | 1,144,900 | 34,484,388 |
| Group, Inc. (The) | 304,600 | 51,833,782 | | General Mills, Inc. | 928,800 | 61,226,496 |
| | | 86,687,182 | | Kellogg Co. | 1,148,400 | 59,188,536 |
| CHEMICALS — 1.5% | | | | | | 154,899,420 |
| Airgas, Inc. | 429,700 | 19,061,492 | | HEALTH CARE EQUIPMENT & SUPPLIES — 4.5% |
| Celanese Corp., Series A | 1,532,000 | 42,053,400 | | Alcon, Inc. | 191,000 | 27,272,890 |
| | | 61,114,892 | | Baxter International, Inc. | 1,264,400 | 68,353,464 |
| COMMERCIAL BANKS — 1.3% | | | | Becton, Dickinson & Co. | 174,100 | 11,901,476 |
| Wells Fargo & Co. | 1,931,300 | 53,149,376 | | Covidien plc | 734,200 | 30,924,504 |
| COMMUNICATIONS EQUIPMENT — 6.0% | | | Edwards | | |
| Arris Group, Inc.(1) | 1,429,000 | 14,661,540 | | Lifesciences Corp.(1) | 455,500 | 35,046,170 |
| Cisco Systems, Inc.(1) | 4,663,900 | 106,570,115 | | Gen-Probe, Inc.(1) | 306,100 | 12,770,492 |
| F5 Networks, Inc.(1) | 793,400 | 35,615,726 | | | | 186,268,996 |
| Palm, Inc.(1) | 1,150,800 | 13,360,788 | | HEALTH CARE PROVIDERS & SERVICES — 2.0% |
| QUALCOMM, Inc. | 1,853,400 | 76,749,294 | | Express Scripts, Inc.(1) | 1,020,800 | 81,582,336 |
| | | 246,957,463 | | | | |
17
| | | | | | |
| Growth | | | | | | |
| | Shares | Value | | | Shares | Value |
| HOTELS, RESTAURANTS & LEISURE — 1.1% | | | OIL, GAS & CONSUMABLE FUELS — 2.9% |
| Chipotle Mexican Grill, Inc., | | | | Apache Corp. | 274,700 | $ 25,854,764 |
| Class A(1) | 158,300 | $ 12,899,867 | | Exxon Mobil Corp. | 512,400 | 36,723,708 |
| Starwood Hotels & Resorts | | | | Occidental Petroleum Corp. | 590,700 | 44,822,316 |
| Worldwide, Inc. | 1,081,500 | 31,428,390 | | Quicksilver | | |
| | | 44,328,257 | | Resources, Inc.(1) | 1,114,400 | 13,595,680 |
| HOUSEHOLD DURABLES — 1.1% | | | | | 120,996,468 |
| Whirlpool Corp. | 633,600 | 45,359,424 | | PERSONAL PRODUCTS — 0.4% | |
| HOUSEHOLD PRODUCTS — 3.1% | | | Mead Johnson Nutrition | | |
| Colgate-Palmolive Co. | 404,900 | 31,837,287 | | Co., Class A | 365,400 | 15,361,416 |
| Procter & Gamble Co. (The) | 1,663,800 | 96,500,400 | | PHARMACEUTICALS — 5.3% | | |
| | | 128,337,687 | | Abbott Laboratories | 2,395,200 | 121,125,264 |
| INDUSTRIAL CONGLOMERATES — 1.5% | | | Johnson & Johnson | 1,246,800 | 73,623,540 |
| 3M Co. | 839,000 | 61,725,230 | | Novo Nordisk A/S B Shares | 429,200 | 26,691,663 |
| INSURANCE — 1.2% | | | | | | 221,440,467 |
| Aflac, Inc. | 1,171,800 | 48,617,982 | | ROAD & RAIL — 0.8% | | |
| INTERNET & CATALOG RETAIL — 0.7% | | | Union Pacific Corp. | 588,300 | 32,438,862 |
| Amazon.com, Inc.(1) | 255,100 | 30,308,431 | | SEMICONDUCTORS & SEMICONDUCTOR |
| INTERNET SOFTWARE & SERVICES — 3.8% | | | EQUIPMENT — 2.6% | | |
| Google, Inc., Class A(1) | 292,100 | 156,600,652 | | Broadcom Corp., Class A(1) | 778,600 | 20,718,546 |
| IT SERVICES — 1.2% | | | | Cree, Inc.(1) | 529,900 | 22,308,790 |
| International Business | | | | Linear Technology Corp. | 2,068,700 | 53,537,956 |
| Machines Corp. | 406,500 | 49,027,965 | | Skyworks Solutions, Inc.(1) | 905,000 | 9,439,150 |
| LIFE SCIENCES TOOLS & SERVICES — 0.7% | | | | | 106,004,442 |
| Thermo Fisher | | | | SOFTWARE — 7.5% | | |
| Scientific, Inc.(1) | 633,400 | 28,503,000 | | | | |
| | | | | Adobe Systems, Inc.(1) | 1,024,900 | 33,760,206 |
| MACHINERY — 2.5% | | | | Microsoft Corp. | 6,950,600 | 192,740,138 |
| Caterpillar, Inc. | 263,300 | 14,497,298 | | Oracle Corp. | 3,346,100 | 70,602,710 |
| Eaton Corp. | 547,800 | 33,114,510 | | salesforce.com, inc.(1) | 275,700 | 15,645,975 |
| Illinois Tool Works, Inc. | 1,250,400 | 57,418,368 | | | | 312,749,029 |
| | | 105,030,176 | | SPECIALTY RETAIL — 3.3% | | |
| MEDIA — 0.7% | | | | Abercrombie & Fitch Co., | | |
| Scripps Networks | | | | Class A | 829,600 | 27,227,472 |
| Interactive, Inc., Class A | 811,500 | 30,642,240 | | Chico’s FAS, Inc.(1) | 1,527,200 | 18,250,040 |
| METALS & MINING — 1.4% | | | | Home Depot, Inc. (The) | 1,310,800 | 32,887,972 |
| Freeport-McMoRan Copper | | | | | | |
| & Gold, Inc.(1) | 277,400 | 20,350,064 | | J. Crew Group, Inc.(1) | 812,800 | 33,145,984 |
| Newmont Mining Corp. | 901,400 | 39,174,844 | | Lowe’s Cos., Inc. | 1,327,900 | 25,987,003 |
| | | 59,524,908 | | | | 137,498,471 |
| MULTILINE RETAIL — 2.9% | | | | TEXTILES, APPAREL & LUXURY GOODS — 0.5% |
| Kohl’s Corp.(1) | 914,700 | 52,339,134 | | Polo Ralph Lauren Corp. | 271,600 | 20,212,472 |
| Target Corp. | 1,423,000 | 68,915,890 | | WIRELESS TELECOMMUNICATION SERVICES — 1.3% |
| | | 121,255,024 | | American Tower Corp., | | |
| | | | | Class A(1) | 1,409,400 | 51,894,108 |
| | | | | TOTAL COMMON STOCKS | | |
| | | | | (Cost $3,681,971,347) | | 4,057,285,129 |
18
| | | |
| Growth | | | |
| | Shares | | Value |
| Temporary Cash Investments — 1.2% |
| JPMorgan U.S. Treasury | | | |
| Plus Money Market Fund | | | |
| Agency Shares | 50,689 | $ 50,689 |
| Repurchase Agreement, Bank of America | | |
| Securities, LLC, (collateralized by various | | |
| U.S. Treasury obligations, 1.875%-3.625%, | | |
| 7/15/13-4/15/28, valued at $51,428,479), | | |
| in a joint trading account at 0.05%, | | |
| dated 10/30/09, due 11/2/09 | | | |
| (Delivery value $50,000,208) | | | 50,000,000 |
| TOTAL TEMPORARY | | | |
| CASH INVESTMENTS | | | |
| (Cost $50,050,689) | | | 50,050,689 |
| TOTAL INVESTMENT | | | |
| SECURITIES — 99.1% | | | |
| (Cost $3,732,022,036) | | | 4,107,335,818 |
| OTHER ASSETS | | | |
| AND LIABILITIES — 0.9% | | | 36,462,242 |
| TOTAL NET ASSETS — 100.0% | | $4,143,798,060 |
| | | |
| Forward Foreign Currency Exchange Contracts | | |
| Contracts to Sell | Settlement Date | Value | Unrealized Gain (Loss) |
| 87,041,760 DKK for USD | 11/30/09 | $17,202,099 | $89,616 |
| (Value on Settlement Date $17,291,715) | | | |
| |
| Notes to Schedule of Investments | | |
| DKK = Danish Krone | | | |
| USD = United States Dollar | | | |
| (1) Non-income producing. | | | |
| |
| Industry classifications are unaudited. | | | |
| |
| |
| See Notes to Financial Statements. | | | |
19
| | | | | | |
| Vista | | | | | | |
| |
| OCTOBER 31, 2009 | | | | | | |
| | Shares | Value | | | Shares | Value |
| Common Stocks — 97.5% | | | CONSUMER FINANCE — 0.8% | | |
| AEROSPACE & DEFENSE — 1.2% | | | Discover Financial Services | 1,201,000 | $ 16,982,140 |
| BE Aerospace, Inc.(1) | 877,000 | $ 15,549,210 | | CONTAINERS & PACKAGING — 1.4% | |
| | | | | Crown Holdings, Inc.(1) | 1,121,000 | 29,874,650 |
| Precision Castparts Corp. | 112,000 | 10,699,360 | | | | |
| | | 26,248,570 | | DIVERSIFIED FINANCIAL SERVICES — 0.6% | |
| AIR FREIGHT & LOGISTICS — 0.8% | | | IntercontinentalExchange, | | |
| | | | | Inc.(1) | 129,000 | 12,924,510 |
| FedEx Corp. | 226,000 | 16,427,940 | | ELECTRONIC EQUIPMENT, INSTRUMENTS | |
| AUTO COMPONENTS — 0.8% | | | | & COMPONENTS — 0.8% | | |
| Autoliv, Inc. | 531,000 | 17,830,980 | | Molex, Inc. | 896,000 | 16,728,320 |
| BIOTECHNOLOGY — 1.1% | | | | ENERGY EQUIPMENT & SERVICES — 3.4% | |
| Alexion | | | | Atwood Oceanics, Inc.(1) | 845,000 | 29,989,050 |
| Pharmaceuticals, Inc.(1) | 542,000 | 24,070,220 | | | | |
| | | | | Cameron | | |
| CAPITAL MARKETS — 9.3% | | | | International Corp.(1) | 757,000 | 27,986,290 |
| Janus Capital Group, Inc. | 2,712,000 | 35,581,440 | | Oceaneering | | |
| Jefferies Group, Inc.(1) | 2,028,000 | 52,930,800 | | International, Inc.(1) | 327,000 | 16,709,700 |
| Lazard Ltd., Class A | 1,259,000 | 47,527,250 | | | | 74,685,040 |
| Legg Mason, Inc. | 1,543,000 | 44,916,730 | | FOOD PRODUCTS — 0.5% | | |
| Morgan Stanley | 326,000 | 10,471,120 | | Green Mountain Coffee | | |
| Waddell & Reed Financial, | | | | Roasters, Inc.(1) | 161,000 | 10,714,550 |
| Inc., Class A | 435,000 | 12,206,100 | | HEALTH CARE PROVIDERS & SERVICES — 5.3% |
| | | 203,633,440 | | Express Scripts, Inc.(1) | 593,000 | 47,392,560 |
| CHEMICALS — 2.1% | | | | Health Management | | |
| Celanese Corp., Series A | 841,000 | 23,085,450 | | Associates, Inc., Class A(1) | 2,546,000 | 15,530,600 |
| CF Industries Holdings, Inc. | 133,000 | 11,072,250 | | Medco Health Solutions, Inc.(1) | 651,000 | 36,534,120 |
| Scotts Miracle-Gro Co. | | | | Tenet Healthcare Corp.(1) | 3,157,000 | 16,163,840 |
| (The), Class A | 289,000 | 11,739,180 | | | | 115,621,120 |
| | | 45,896,880 | | HEALTH CARE TECHNOLOGY — 0.8% | |
| COMMERCIAL BANKS — 0.5% | | | | Allscripts-Misys Healthcare | | |
| Fifth Third Bancorp. | 1,214,000 | 10,853,160 | | Solutions, Inc.(1) | 845,000 | 16,477,500 |
| COMMERCIAL SERVICES & SUPPLIES — 0.5% | | HOTELS, RESTAURANTS & LEISURE — 5.7% | |
| Tetra Tech, Inc.(1) | 467,000 | 12,015,910 | | Bally Technologies, Inc.(1) | 428,000 | 16,858,920 |
| COMMUNICATIONS EQUIPMENT — 1.7% | | | Boyd Gaming Corp.(1) | 634,000 | 4,666,240 |
| Alcatel-Lucent ADR(1) | 2,697,000 | 9,951,930 | | Ctrip.com International | | |
| | | | | Ltd. ADR(1) | 389,000 | 20,827,060 |
| CommScope, Inc.(1) | 661,000 | 17,860,220 | | | | |
| Tellabs, Inc.(1) | 1,623,000 | 9,770,460 | | International Game | | |
| | | | | Technology | 1,152,000 | 20,551,680 |
| | | 37,582,610 | | Las Vegas Sands Corp.(1) | 1,220,000 | 18,409,800 |
| COMPUTERS & PERIPHERALS — 2.1% | | | Starwood Hotels & Resorts | | |
| Seagate Technology | 1,196,000 | 16,684,200 | | Worldwide, Inc. | 531,000 | 15,430,860 |
| Western Digital Corp.(1) | 840,000 | 28,291,200 | | WMS Industries, Inc.(1) | 405,000 | 16,191,900 |
| | | 44,975,400 | | Wynn Resorts Ltd.(1) | 190,000 | 10,301,800 |
| CONSTRUCTION & ENGINEERING — 3.1% | | | | | 123,238,260 |
| AECOM Technology Corp.(1) | 1,156,000 | 29,177,440 | | HOUSEHOLD DURABLES — 2.4% | |
| Chicago Bridge & Iron Co. | | | | KB Home | 1,285,000 | 18,221,300 |
| New York Shares | 866,000 | 16,289,460 | | NVR, Inc.(1) | 35,000 | 23,179,450 |
| Quanta Services, Inc.(1) | 1,023,000 | 21,687,600 | | | | |
| | | | | Tupperware Brands Corp. | 264,000 | 11,885,280 |
| | | 67,154,500 | | | | 53,286,030 |
20
| | | | | | |
| Vista | | | | | | |
| | Shares | Value | | | Shares | Value |
| INDUSTRIAL CONGLOMERATES — 1.4% | | | SEMICONDUCTORS & SEMICONDUCTOR | |
| McDermott | | | | EQUIPMENT — 10.8% | | |
| International, Inc.(1) | 1,406,000 | $ 31,255,380 | | Altera Corp. | 849,000 | $ 16,801,710 |
| INTERNET SOFTWARE & SERVICES — 1.5% | | | Analog Devices, Inc. | 863,000 | 22,118,690 |
| Equinix, Inc.(1) | 391,000 | 33,360,120 | | ASML Holding NV | | |
| LIFE SCIENCES TOOLS & SERVICES — 2.2% | | | New York Shares | 1,568,000 | 42,241,920 |
| Life Technologies Corp.(1) | 1,040,000 | 49,056,800 | | Atheros | | |
| | | | | Communications, Inc.(1) | 699,000 | 17,209,380 |
| MACHINERY — 4.3% | | | | KLA-Tencor Corp. | 669,000 | 21,749,190 |
| Bucyrus International, Inc. | 896,000 | 39,800,320 | | Marvell Technology | | |
| Flowserve Corp. | 156,000 | 15,320,760 | | Group Ltd.(1) | 1,847,000 | 25,340,840 |
| Ingersoll-Rand plc | 794,000 | 25,082,460 | | NVIDIA Corp.(1) | 1,627,000 | 19,458,920 |
| Joy Global, Inc. | 258,000 | 13,005,780 | | PMC - Sierra, Inc.(1) | 2,893,000 | 24,648,360 |
| | | 93,209,320 | | Silicon Laboratories, Inc.(1) | 412,000 | 17,262,800 |
| METALS & MINING — 5.1% | | | | Teradyne, Inc.(1) | 3,543,000 | 29,654,910 |
| AK Steel Holding Corp. | 1,052,000 | 16,695,240 | | | | 236,486,720 |
| Cia Siderurgica Nacional | | | | | | |
| SA ADR | 816,000 | 27,058,560 | | SOFTWARE — 4.0% | | |
| Freeport-McMoRan | | | | Cerner Corp.(1) | 280,000 | 21,291,200 |
| Copper & Gold, Inc.(1) | 374,000 | 27,436,640 | | Perfect World Co. Ltd., | | |
| Walter Energy, Inc. | 686,000 | 40,131,000 | | Class B ADR(1) | 464,000 | 20,420,640 |
| | | 111,321,440 | | Rovi Corp.(1) | 1,211,000 | 33,363,050 |
| MULTILINE RETAIL — 2.9% | | | | Shanda Games Ltd. ADR(1) | 1,143,000 | 11,384,280 |
| Dollar Tree, Inc.(1) | 504,000 | 22,745,520 | | | | 86,459,170 |
| Family Dollar Stores, Inc. | 627,000 | 17,744,100 | | SPECIALTY RETAIL — 5.3% | | |
| Macy’s, Inc. | 647,000 | 11,367,790 | | Aeropostale, Inc.(1) | 564,000 | 21,166,920 |
| Nordstrom, Inc. | 353,000 | 11,218,340 | | Bed Bath & Beyond, Inc.(1) | 304,000 | 10,703,840 |
| | | 63,075,750 | | Chico’s FAS, Inc.(1) | 2,162,000 | 25,835,900 |
| OIL, GAS & CONSUMABLE FUELS — 4.7% | | | J. Crew Group, Inc.(1) | 143,000 | 5,831,540 |
| Brigham Exploration Co.(1) | 543,000 | 5,158,500 | | Ross Stores, Inc. | 534,000 | 23,501,340 |
| Continental | | | | TJX Cos., Inc. (The) | 482,000 | 18,002,700 |
| Resources, Inc.(1) | 576,000 | 21,432,960 | | Williams-Sonoma, Inc. | 576,000 | 10,817,280 |
| Petrohawk Energy Corp.(1) | 1,803,000 | 42,406,560 | | | | 115,859,520 |
| Southwestern Energy Co.(1) | 238,000 | 10,372,040 | | TEXTILES, APPAREL & LUXURY GOODS — 3.2% |
| Whiting Petroleum Corp.(1) | 408,000 | 23,011,200 | | Coach, Inc. | 580,000 | 19,122,600 |
| | | 102,381,260 | | Fuqi International, Inc.(1) | 390,000 | 7,991,100 |
| PAPER & FOREST PRODUCTS — 0.8% | | | Jones Apparel Group, Inc. | 1,120,000 | 20,036,800 |
| MeadWestvaco Corp. | 796,000 | 18,172,680 | | Phillips-Van Heusen Corp. | 558,000 | 22,403,700 |
| PERSONAL PRODUCTS — 1.0% | | | | | 69,554,200 |
| Avon Products, Inc. | 702,000 | 22,499,100 | | WIRELESS TELECOMMUNICATION SERVICES — 3.8% |
| REAL ESTATE MANAGEMENT | | | | American Tower Corp., | | |
| & DEVELOPMENT — 0.5% | | | | Class A(1) | 572,000 | 21,061,040 |
| E-House China | | | | SBA Communications Corp., | | |
| Holdings Ltd. ADR(1) | 602,000 | 10,300,220 | | Class A(1) | 2,223,000 | 62,710,830 |
| ROAD & RAIL — 1.1% | | | | | | 83,771,870 |
| Avis Budget Group, Inc.(1) | 916,000 | 7,694,400 | | TOTAL COMMON STOCKS | | |
| Kansas City Southern(1) | 633,000 | 15,337,590 | | (Cost $1,814,050,170) | | 2,127,017,270 |
| | | 23,031,990 | | | | |
21
| | | | | |
| Vista | | | | | |
| | Shares | Value | | Geographic Diversification | |
| Temporary Cash Investments — 2.8% | | (as a % of net assets) | |
| | | | | United States | 83.8% |
| JPMorgan U.S. Treasury | | | | | |
| Plus Money Market Fund | | | | Bermuda | 3.3% |
| Agency Shares | 94,497 | $ 94,497 | | People’s Republic of China | 3.3% |
| Repurchase Agreement, Deutsche | | | | Netherlands | 2.7% |
| Bank Securities, Inc., (collateralized | | | Brazil | 1.2% |
| by various U.S. Treasury obligations, | | | Ireland | 1.2% |
| 1.25%, 5/12/12, valued at $61,627,431), | | | | |
| in a joint trading account at 0.04%, | | | Sweden | 0.8% |
| dated 10/30/09, due 11/2/09 | | | | Cayman Islands | 0.8% |
| (Delivery value $60,400,201) | | 60,400,000 | | France | 0.4% |
| TOTAL TEMPORARY | | | | Cash and Equivalents* | 2.5% |
| CASH INVESTMENTS | | | | | |
| (Cost $60,494,497) | | 60,494,497 | | *Includes temporary cash investments and other assets and liabilities. |
| |
| TOTAL INVESTMENT | | | | Notes to Schedule of Investments | |
| SECURITIES — 100.3% | | | | | |
| (Cost $1,874,544,667) | | 2,187,511,767 | | ADR = American Depositary Receipt | |
| OTHER ASSETS | | | | (1) Non-income producing. | |
| AND LIABILITIES — (0.3)% | | (7,541,546) | | | |
| TOTAL NET ASSETS — 100.0% | | $2,179,970,221 | | Industry classifications and geographic diversification are unaudited. |
| |
| |
| |
| | | | | See Notes to Financial Statements. | |
22
|
| Statement of Assets and Liabilities |
| | |
| OCTOBER 31, 2009 | | |
| | Growth | Vista |
| Assets | | |
| Investment securities, at value (cost of $3,732,022,036 | | |
| and $1,874,544,667, respectively) | $4,107,335,818 | $2,187,511,767 |
| Receivable for investments sold | 53,041,170 | 45,317,605 |
| Receivable for capital shares sold | 12,676,304 | 1,984,090 |
| Receivable for forward foreign currency exchange contracts | 89,616 | — |
| Dividends and interest receivable | 3,974,478 | 424,666 |
| | 4,177,117,386 | 2,235,238,128 |
| |
| Liabilities | | |
| Payable for investments purchased | 28,052,867 | 50,061,725 |
| Payable for capital shares redeemed | 1,756,425 | 3,186,320 |
| Accrued management fees | 3,461,588 | 1,951,049 |
| Distribution and service fees payable | 48,446 | 68,813 |
| | 33,319,326 | 55,267,907 |
| |
| Net Assets | $4,143,798,060 | $2,179,970,221 |
| |
| |
| See Notes to Financial Statements. | | |
23
| | |
| OCTOBER 31, 2009 | | |
| | Growth | Vista |
| Net Assets Consist of: | | |
| Capital (par value and paid-in surplus) | $4,471,375,376 | $2,744,993,597 |
| Undistributed net investment income | 12,280,812 | — |
| Accumulated net realized loss on investment and | | |
| foreign currency transactions | (715,328,181) | (878,010,565) |
| Net unrealized appreciation on investments and translation | | |
| of assets and liabilities in foreign currencies | 375,470,053 | 312,987,189 |
| | $4,143,798,060 | $2,179,970,221 |
| | | |
| Investor Class, $0.01 Par Value | | |
| Net assets | $3,372,274,435 | $1,690,575,746 |
| Shares outstanding | 166,259,782 | 139,353,231 |
| Net asset value per share | $20.28 | $12.13 |
| | | |
| Institutional Class, $0.01 Par Value | | |
| Net assets | $549,496,019 | $211,357,385 |
| Shares outstanding | 26,840,501 | 16,979,316 |
| Net asset value per share | $20.47 | $12.45 |
| | | |
| Advisor Class, $0.01 Par Value | | |
| Net assets | $214,371,280 | $255,418,812 |
| Shares outstanding | 10,749,029 | 21,697,452 |
| Net asset value per share | $19.94 | $11.77 |
| | | |
| R Class, $0.01 Par Value | | |
| Net assets | $7,656,326 | $22,618,278 |
| Shares outstanding | 384,821 | 1,905,947 |
| Net asset value per share | $19.90 | $11.87 |
| |
| |
| See Notes to Financial Statements. | | |
24
| | |
| YEAR ENDED OCTOBER 31, 2009 | | |
| | Growth | Vista |
| Investment Income (Loss) | | |
| Income: | | |
| Dividends (net of foreign taxes withheld of $371,109 and $61,203, respectively) | $ 49,459,521 | $ 11,002,146 |
| Interest | 45,722 | 89,565 |
| | 49,505,243 | 11,091,711 |
| | | |
| Expenses: | | |
| Management fees | 32,113,041 | 20,689,057 |
| Distribution and service fees: | | |
| Advisor Class | 406,728 | 608,303 |
| R Class | 24,733 | 82,739 |
| Directors’ fees and expenses | 134,492 | 93,220 |
| Other expenses | 3,241 | 3,151 |
| | 32,682,235 | 21,476,470 |
| | | |
| Net investment income (loss) | 16,823,008 | (10,384,759) |
| | | |
| Realized and Unrealized Gain (Loss) | | |
| Net realized gain (loss) on: | | |
| Investment transactions | (356,375,248) | (571,900,085) |
| Foreign currency transactions | (3,531,585) | (1,141,917) |
| Futures contract transactions | 635,109 | — |
| | (359,271,724) | (573,042,002) |
| | | |
| Change in net unrealized appreciation (depreciation) on: | | |
| Investments | 873,786,368 | 530,891,129 |
| Translation of assets and liabilities in foreign currencies | (1,172,592) | (470,996) |
| | 872,613,776 | 530,420,133 |
| | | |
| Net realized and unrealized gain (loss) | 513,342,052 | (42,621,869) |
| | | |
| Net Increase (Decrease) in Net Assets Resulting from Operations | $530,165,060 | $(53,006,628) |
| |
| |
| See Notes to Financial Statements. | | |
25
|
| Statement of Changes in Net Assets |
| | | | |
| YEARS ENDED OCTOBER 31, 2009 AND OCTOBER 31, 2008 | | | |
| | Growth | Vista |
| Increase (Decrease) in Net Assets | 2009 | 2008 | 2009 | 2008 |
| Operations | | | | |
| Net investment income (loss) | $ 16,823,008 | $ 6,649,546 | $ (10,384,759) | $ (18,382,516) |
| Net realized gain (loss) | (359,271,724) | (154,385,227) | (573,042,002) | (295,184,270) |
| Change in net unrealized | | | | |
| appreciation (depreciation) | 872,613,776 | (1,415,699,398) | 530,420,133 | (1,398,403,493) |
| Net increase (decrease) in net assets | | | | |
| resulting from operations | 530,165,060 | (1,563,435,079) | (53,006,628) | (1,711,970,279) |
| | | | | |
| Distributions to Shareholders | | | | |
| From net investment income: | | | | |
| Investor Class | (12,789,814) | (5,142,411) | — | — |
| Institutional Class | (2,136,538) | (895,366) | — | — |
| Advisor Class | (370,766) | — | — | — |
| R Class | (790) | — | — | — |
| From net realized gains: | | | | |
| Investor Class | — | — | — | (254,880,472) |
| Institutional Class | — | — | — | (21,928,910) |
| Advisor Class | — | — | — | (35,302,295) |
| R Class | — | — | — | (388,974) |
| Decrease in net assets from distributions | (15,297,908) | (6,037,777) | — | (312,500,651) |
| | | | | |
| Capital Share Transactions | | | | |
| Net increase (decrease) in net assets | | | | |
| from capital share transactions | 580,646,064 | (10,334,134) | (75,018,272) | 766,730,513 |
| | | | | |
| | | | | |
| Net increase (decrease) in net assets | 1,095,513,216 | (1,579,806,990) | (128,024,900) | (1,257,740,417) |
| | | | | |
| Net Assets | | | | |
| Beginning of period | 3,048,284,844 | 4,628,091,834 | 2,307,995,121 | 3,565,735,538 |
| End of period | $4,143,798,060 | $3,048,284,844 | $2,179,970,221 | $2,307,995,121 |
| | | | | |
| Accumulated undistributed | | | | |
| net investment income (loss) | $12,280,812 | $14,384,583 | — | $(510,485) |
| |
| |
| See Notes to Financial Statements. | | | | |
26
|
| Notes to Financial Statements |
OCTOBER 31, 2009
1. Organization and Summary of Significant Accounting Policies
Organization — American Century Mutual Funds, Inc. (the corporation) is registered under the Investment Company Act of 1940 (the 1940 Act) as an open-end management investment company. Growth Fund (Growth) and Vista Fund (Vista) (collectively, the funds) are two funds in a series issued by the corporation. The funds are diversified under the 1940 Act. The funds’ investment objective is to seek long-term capital growth. The funds pursue this objective by investing primarily in equity securities. Growth generally invests in larger-sized companies that management believes will increase in value but may purchase companies of any size. Vista generally invests in companies that are medium-sized and smaller at the time of purchase that management believes will increase in value. The following is a summary of the funds’ significant accou nting policies.
Multiple Class — The funds are authorized to issue the Investor Class, the Institutional Class, the Advisor Class and the R Class. Prior to December 3, 2007, the funds were authorized to issue the C Class (see Note 11). The share classes differ principally in their respective distribution and shareholder servicing expenses and arrangements. All shares of each fund represent an equal pro rata interest in the net assets of the class to which such shares belong, and have identical voting, dividend, liquidation and other rights and the same terms and conditions, except for class specific expenses and exclusive rights to vote on matters affecting only individual classes. Income, non-class specific expenses, and realized and unrealized capital gains and losses of the funds are allocated to each class of shares based on their relative net assets.
Security Valuations — Securities traded primarily on a principal securities exchange are valued at the last reported sales price, or at the mean of the latest bid and asked prices where no last sales price is available. Depending on local convention or regulation, securities traded over-the-counter are valued at the mean of the latest bid and asked prices, the last sales price, or the official close price. Investments in open-end management investment companies are valued at the reported net asset value. Debt securities not traded on a principal securities exchange are valued through a commercial pricing service or at the mean of the most recent bid and asked prices. Discount notes may be valued through a commercial pricing service or at amortized cost, which approximates fair value. Securities traded on foreign securities exchanges and ov er-the-counter markets are normally completed before the close of business on days that the New York Stock Exchange (the Exchange) is open and may also take place on days when the Exchange is not open. If an event occurs after the value of a security was established but before the net asset value per share was determined that was likely to materially change the net asset value, that security would be valued as determined in accordance with procedures adopted by the Board of Directors. If the funds determine that the market price of a portfolio security is not readily available, or that the valuation methods mentioned above do not reflect the security’s fair value, such security is valued as determined by the Board of Directors or its designee, in accordance with procedures adopted by the Board of Directors, if such determination would materially impact a fund’s net asset value. Certain other circumstances may cause the funds to use alternative procedures to value a security such as: a security has been declared in default; trading in a security has been halted during the trading day; or there is a foreign market holiday and no trading will commence.
Security Transactions — For financial reporting purposes, security transactions are accounted for as of the trade date. Net realized gains and losses are determined on the identified cost basis, which is also used for federal income tax purposes.
Investment Income — Dividend income less foreign taxes withheld, if any, is recorded as of the ex-dividend date. Interest income is recorded on the accrual basis and includes accretion of discounts and amortization of premiums.
Foreign Currency Translations — All assets and liabilities initially expressed in foreign currencies are translated into U.S. dollars at prevailing exchange rates at period end. The funds may enter into spot foreign currency exchange contracts to facilitate transactions denominated in a foreign currency. Purchases and sales of investment securities, dividend
27
and interest income, spot foreign currency exchange contracts, and certain expenses are translated at the rates of exchange prevailing on the respective dates of such transactions. For assets and liabilities, other than investments in securities, net realized and unrealized gains and losses from foreign currency translations arise from changes in currency exchange rates.
Net realized and unrealized foreign currency exchange gains or losses occurring during the holding period of investment securities are a component of net realized gain (loss) on investment transactions and net unrealized appreciation (depreciation) on investments, respectively. Certain countries may impose taxes on the contract amount of purchases and sales of foreign currency contracts in their currency. The funds record the foreign tax expense, if any, as a reduction to the net realized gain (loss) on foreign currency transactions.
Repurchase Agreements — The funds may enter into repurchase agreements with institutions that American Century Investment Management, Inc. (ACIM) (the investment advisor) has determined are creditworthy pursuant to criteria adopted by the Board of Directors. Each repurchase agreement is recorded at cost. Each fund requires that the collateral, represented by securities, received in a repurchase transaction be transferred to the custodian in a manner sufficient to enable each fund to obtain those securities in the event of a default under the repurchase agreement. ACIM monitors, on a daily basis, the securities transferred to ensure the value, including accrued interest, of the securities under each repurchase agreement is equal to or greater than amounts owed to each fund under each repurchase agreement.
Joint Trading Account — Pursuant to an Exemptive Order issued by the Securities and Exchange Commission, each fund, along with certain other funds in the American Century Investments family of funds, may transfer uninvested cash balances into a joint trading account. These balances are invested in one or more repurchase agreements that are collateralized by U.S. Treasury or Agency obligations.
Exchange Traded Funds — The funds may invest in exchange traded funds (ETFs). ETFs are a type of index fund bought and sold on a securities exchange. An ETF trades like common stock and represents a fixed portfolio of securities designed to track the performance and dividend yield of a particular domestic or foreign market index. A fund may purchase an ETF to temporarily gain exposure to a portion of the U.S. or a foreign market while awaiting purchase of underlying securities. The risks of owning an ETF generally reflect the risks of owning the underlying securities they are designed to track, although the lack of liquidity on an ETF could result in it being more volatile. Additionally, ETFs have fees and expenses that reduce their value.
Income Tax Status — It is each fund’s policy to distribute substantially all net investment income and net realized gains to shareholders and to otherwise qualify as a regulated investment company under provisions of the Internal Revenue Code. The funds are no longer subject to examination by tax authorities for years prior to 2006. At this time, management believes there are no uncertain tax positions which, based on their technical merit, would not be sustained upon examination and for which it is reasonably possible that the total amounts of unrecognized tax benefits will significantly change in the next twelve months. Accordingly, no provision has been made for federal or state income taxes. Interest and penalties associated with any federal or state income tax obligations, if any, are recorded as interest expense.
Distributions to Shareholders — Distributions to shareholders are recorded on the ex-dividend date. Distributions from net investment income and net realized gains, if any, are generally declared and paid annually.
Indemnifications — Under the corporation’s organizational documents, its officers and directors are indemnified against certain liabilities arising out of the performance of their duties to the funds. In addition, in the normal course of business, the funds enter into contracts that provide general indemnifications. The maximum exposure under these arrangements is unknown as this would involve future claims that may be made against a fund. The risk of material loss from such claims is considered by management to be remote.
28
Use of Estimates — The financial statements are prepared in conformity with accounting principles generally accepted in the United States of America, which may require management to make certain estimates and assumptions at the date of the financial statements. Actual results could differ from these estimates.
Subsequent Events — Management has evaluated events or transactions that may have occurred since October 31, 2009, that would merit recognition or disclosure in the financial statements. This evaluation was completed through December 28, 2009, the date the financial statements were issued.
2. Fees and Transactions with Related Parties
Management Fees — The corporation has entered into a Management Agreement with ACIM, under which ACIM provides the funds with investment advisory and management services in exchange for a single, unified management fee (the fee) per class. The Agreement provides that all expenses of the funds, except brokerage commissions, taxes, interest, fees and expenses of those directors who are not considered “interested persons” as defined in the 1940 Act (including counsel fees) and extraordinary expenses, will be paid by ACIM. The fee is computed and accrued daily based on the daily net assets of each specific class of shares of each fund and paid monthly in arrears. For funds with a stepped fee schedule, the rate of the fee is determined by applying a fee rate calculation formula. This formula takes into account each fund’s assets as well as certain assets, if any, of other clients of the investment advisor outside the American Century Investments family of funds (such as subadvised funds and separate accounts) that have very similar investment teams and investment strategies (strategy assets). The annual management fee schedule for Growth ranges from 0.800% to 1.000% for the Investor Class, Advisor Class and R Class. The annual management fee schedule for Vista is 1.000% for the Investor Class, Advisor Class and R Class. The Institutional Class is 0.20% less at each point within the range for the funds. The effective annual management fee for each class of each fund for the year ended October 31, 2009, was as follows:
| | |
| | Growth | Vista |
| Investor, Advisor and R | 1.00% | 1.00% |
| Institutional | 0.80% | 0.80% |
Distribution and Service Fees — The Board of Directors has adopted a separate Master Distribution and Individual Shareholder Services Plan for each of the Advisor Class and R Class (collectively the plans), pursuant to Rule 12b-1 of the 1940 Act. The plans provide that the Advisor Class will pay American Century Investment Services, Inc. (ACIS) an annual distribution and service fee of 0.25%. The plans provide that the R Class will pay ACIS an annual distribution and service fee of 0.50%. The fees are computed and accrued daily based on each class’s daily net assets and paid monthly in arrears. The fees are used to pay financial intermediaries for distribution and individual shareholder services. Fees incurred under the plans during the year ended October 31, 2009, are detailed in the Statement of Operations.
Related Parties — Certain officers and directors of the corporation are also officers and/or directors, and, as a group, controlling stockholders of American Century Companies, Inc. (ACC), the parent of the corporation’s investment advisor, ACIM, the distributor of the corporation, ACIS, and the corporation’s transfer agent, American Century Services, LLC.
The funds are eligible to invest in a money market fund for temporary purposes, which is managed by J.P. Morgan Investment Management, Inc. (JPMIM). The funds have a Mutual Funds Services Agreement with J.P. Morgan Investor Services Co. (JPMIS). JPMorgan Chase Bank (JPMCB) is a custodian of the funds. Growth has a securities lending agreement with JPMCB. JPMIM, JPMIS and JPMCB are wholly owned subsidiaries of JPMorgan Chase & Co. (JPM). JPM is an equity investor in ACC.
29
3. Investment Transactions
Investment transactions, excluding short-term investments, for the year ended October 31, 2009, were as follows:
| | | | |
| | Growth | Vista |
| Purchases | $4,171,349,413 | $3,823,464,706 |
| Sales | $3,757,576,518 | $3,914,375,146 |
| |
| 4. Capital Share Transactions | | | | |
| |
| Transactions in shares of the funds were as follows: | | |
| | Year ended October 31, 2009 | Year ended October 31, 2008 |
| | Shares | Amount | Shares | Amount |
| Growth | | | | |
| Investor Class/Shares Authorized | 800,000,000 | | 800,000,000 | |
| Sold | 32,861,265 | $566,193,264 | 12,836,527 | $300,950,250 |
| Issued in connection with reorganization | | | | |
| (Note 12) | 6,689,833 | 119,748,011 | — | — |
| Issued in reinvestment of distributions | 719,542 | 11,275,229 | 177,027 | 4,567,294 |
| Redeemed | (21,943,388) | (378,453,255) | (19,382,053) | (453,420,723) |
| | 18,327,252 | 318,763,249 | (6,368,499) | (147,903,179) |
| Institutional Class/Shares Authorized | 150,000,000 | | 150,000,000 | |
| Sold | 18,025,182 | 335,314,338 | 9,611,676 | 230,187,708 |
| Issued in connection with reorganization | | | | |
| (Note 12) | 199,166 | 3,596,938 | — | — |
| Issued in reinvestment of distributions | 135,395 | 2,136,538 | 34,450 | 895,366 |
| Redeemed | (7,550,113) | (128,368,426) | (4,148,451) | (99,365,649) |
| | 10,809,630 | 212,679,388 | 5,497,675 | 131,717,425 |
| Advisor Class/Shares Authorized | 310,000,000 | | 310,000,000 | |
| Sold | 5,736,574 | 98,983,093 | 2,322,369 | 51,515,155 |
| Issued in connection with reclassification | | | | |
| (Note 11) | — | — | 61,986 | 1,519,904 |
| Issued in reinvestment of distributions | 22,056 | 340,539 | — | — |
| Redeemed | (3,140,611) | (53,536,555) | (2,098,624) | (47,812,210) |
| | 2,618,019 | 45,787,077 | 285,731 | 5,222,849 |
| C Class/Shares Authorized | N/A | | N/A | |
| Sold | | | 117 | 2,858 |
| Issued in connection with reclassification | | | | |
| (Note 11) | | | (61,986) | (1,519,904) |
| Redeemed | | | (1,377) | (32,865) |
| | | | (63,246) | (1,549,911) |
| R Class/Shares Authorized | 50,000,000 | | 50,000,000 | |
| Sold | 279,510 | 4,897,686 | 138,140 | 3,100,669 |
| Issued in reinvestment of distributions | 39 | 604 | — | — |
| Redeemed | (83,745) | (1,481,940) | (39,513) | (921,987) |
| | 195,804 | 3,416,350 | 98,627 | 2,178,682 |
| Net increase (decrease) | 31,950,705 | $580,646,064 | (549,712) | $ (10,334,134) |
30
| | | | |
| | Year ended October 31, 2009 | Year ended October 31, 2008 |
| | Shares | Amount | Shares | Amount |
| Vista | | | | |
| Investor Class/Shares Authorized | 800,000,000 | | 800,000,000 | |
| Sold | 22,067,745 | $246,859,389 | 45,528,430 | $848,307,407 |
| Issued in reinvestment of distributions | — | — | 10,942,528 | 228,589,393 |
| Redeemed | (27,625,843) | (311,354,023) | (32,057,988) | (575,840,072) |
| | (5,558,098) | (64,494,634) | 24,412,970 | 501,056,728 |
| Institutional Class/Shares Authorized | 80,000,000 | | 80,000,000 | |
| Sold | 8,008,528 | 91,570,629 | 13,601,031 | 248,188,626 |
| Issued in reinvestment of distributions | — | — | 1,026,634 | 21,928,910 |
| Redeemed | (9,788,881) | (116,857,411) | (6,162,698) | (116,233,467) |
| | (1,780,353) | (25,286,782) | 8,464,967 | 153,884,069 |
| Advisor Class/Shares Authorized | 310,000,000 | | 310,000,000 | |
| Sold | 7,660,713 | 83,311,592 | 11,477,175 | 206,951,884 |
| Issued in connection with reclassification | | | | |
| (Note 11) | — | — | 298,623 | 6,537,776 |
| Issued in reinvestment of distributions | — | — | 1,717,908 | 34,993,776 |
| Redeemed | (7,227,808) | (79,354,013) | (8,290,080) | (144,859,203) |
| | 432,905 | 3,957,579 | 5,203,626 | 103,624,233 |
| C Class/Shares Authorized | N/A | | N/A | |
| Sold | | | 6,353 | 139,449 |
| Issued in connection with reclassification | | | | |
| (Note 11) | | | (298,623) | (6,537,776) |
| Redeemed | | | (30,349) | (630,821) |
| | | | (322,619) | (7,029,148) |
| R Class/Shares Authorized | 10,000,000 | | 10,000,000 | |
| Sold | 1,297,310 | 14,468,375 | 1,019,466 | 18,305,579 |
| Issued in reinvestment of distributions | — | — | 18,855 | 388,974 |
| Redeemed | (326,357) | (3,662,810) | (203,365) | (3,499,922) |
| | 970,953 | 10,805,565 | 834,956 | 15,194,631 |
| Net increase (decrease) | (5,934,593) | $ (75,018,272) | 38,593,900 | $766,730,513 |
5. Fair Value Measurements
The funds’ securities valuation process is based on several considerations and may use multiple inputs to determine the fair value of the positions held by the funds. In conformity with accounting principles generally accepted in the United States of America, the inputs used to determine a valuation are classified into three broad levels as follows:
• Level 1 valuation inputs consist of actual quoted prices in an active market for identical securities;
• Level 2 valuation inputs consist of significant direct or indirect observable market data (including quoted prices for similar securities, evaluations of subsequent market events, interest rates, prepayment speeds, credit risk, etc.); or
• Level 3 valuation inputs consist of significant unobservable inputs (including a fund’s own assumptions).
The level classification is based on the lowest level input that is significant to the fair valuation measurement. The valuation inputs are not an indication of the risks associated with investing in these securities or other financial instruments.
31
The following is a summary of the valuation inputs used to determine the fair value of the funds’ securities and other financial instruments as of October 31, 2009:
| | | |
| | Level 1 | Level 2 | Level 3 |
| Growth | | | |
| Investment Securities | | | |
| Common Stocks | $4,030,593,466 | $26,691,663 | — |
| Temporary Cash Investments | 50,689 | 50,000,000 | — |
| Total Value of Investment Securities | $4,030,644,155 | $76,691,663 | — |
| |
| Other Financial Instruments | | | |
| Total Unrealized Gain (Loss) on Forward | | | |
| Foreign Currency Exchange Contracts | — | $89,616 | — |
| |
| Vista | | | |
| Investment Securities | | | |
| Domestic Common Stocks | $1,828,086,370 | — | — |
| Foreign Common Stocks | 298,930,900 | — | — |
| Temporary Cash Investments | 94,497 | $60,400,000 | — |
| Total Value of Investment Securities | $ 2,127,111,767 | $60,400,000 | — |
6. Derivative Instruments
Equity Price Risk — Growth is subject to equity price risk in the normal course of pursuing its investment objectives. A fund may enter into futures contracts based on an equity index in order to manage its exposure to changes in market conditions. A fund may purchase futures contracts to gain exposure to increases in market value or sell futures contracts to protect against a decline in market value. Upon entering into a futures contract, a fund is required to deposit either cash or securities in an amount equal to a certain percentage of the contract value (initial margin). Subsequent payments (variation margin) are made or received daily, in cash, by a fund. The variation margin is equal to the daily change in the contract value and is recorded as unrealized gains and losses. A fund recognizes realized gain or loss when the contract is closed or expires. Net realized and unrealized gains or losses occurring during the holding period of futures contracts are a component of net realized gain (loss) on futures contract transactions and change in net unrealized appreciation (depreciation) on futures contracts, respectively. One of the risks of entering into futures contracts is the possibility that the change in value of the contract may not correlate with the changes in value of the underlying securities. During the year ended October 31, 2009, Growth purchased futures contracts.
Foreign Currency Risk — Growth and Vista are subject to foreign currency exchange rate risk in the normal course of pursuing their investment objectives. The value of foreign investments held by a fund may be significantly affected by changes in foreign currency exchange rates. The dollar value of a foreign security generally decreases when the value of the dollar rises against the foreign currency in which the security is denominated and tends to increase when the value of the dollar declines against such foreign currency.
A fund may enter into forward foreign currency exchange contracts to reduce a fund’s exposure to foreign currency exchange rate fluctuations. The net U.S. dollar value of foreign currency underlying all contractual commitments held by a fund and the resulting unrealized appreciation or depreciation are determined daily using prevailing exchange rates. Realized gain or loss is recorded upon the termination of the contract. Net realized and unrealized gains or losses occurring during the holding period of forward foreign currency exchange contracts are a component of net realized gain (loss) on foreign currency transactions and change in net unrealized appreciation (depreciation) on translation of assets and liabilities in foreign currencies, respectively. A fund bears the risk of an unfavorable change in the foreign currency exchange rate underlying the forward contract.
32
Additionally, losses, up to the fair value, may arise if the counterparties do not perform under the contract terms. The risk of loss from non-performance by the counterparty may be reduced by the use of master netting agreements. During the year ended October 31, 2009, the funds participated in forward foreign currency exchange contracts.
Value of Derivative Instruments as of October 31, 2009
| | | | | |
| | Asset Derivatives | | Liability Derivatives | | |
| Fund/Type of | Location on Statement | | Location on Statement | | |
| Derivative | of Assets and Liabilities | Value | of Assets and Liabilities | Value | |
| |
| Growth | | | | | |
| Foreign | Receivable for forward foreign | | Payable for forward foreign | | |
| Currency Risk | currency exchange contracts | $89,616 | currency exchange contracts | | — |
At October 31, 2009, Vista did not have any derivative instruments disclosed on the Statement of Assets and Liabilities.
Effect of Derivative Instruments on the Statement of Operations for the Year Ended October 31, 2009
| | | | |
| | | | Change in Net Unrealized |
| | Net Realized Gain (Loss) | Appreciation (Depreciation) |
| Fund/Type of | Location on | | Location on | |
| Derivative | Statement of Operations | | Statement of Operations | |
| |
| Growth | | | | |
| Foreign | Net realized gain (loss) | | Change in net unrealized | |
| Currency Risk | on foreign currency | | appreciation (depreciation) | |
| | transactions | $(3,753,262) | on translation of assets and | |
| | | | liabilities in foreign currencies | $(1,228,701) |
| Equity Price Risk | Net realized gain (loss) | | Change in net unrealized | |
| | on futures contract | | appreciation (depreciation) | |
| | transactions | 635,109 | on futures contracts | — |
| | | $(3,118,153) | | $(1,228,701) |
| | | | | |
| Vista | | | | |
| Foreign | Net realized gain (loss) | | Change in net unrealized | |
| Currency Risk | on foreign currency | | appreciation (depreciation) | |
| | transactions | | on translation of assets and | |
| | | $(1,321,878) | liabilities in foreign currencies | $(510,485) |
For Growth, the infrequent use of equity price risk derivatives and the foreign currency risk derivatives at period end as disclosed on the Schedule of Investments are indicative of the fund’s typical volume.
For Vista, there were no derivative instruments at period end, though the fund occasionally held derivative instruments during the period.
33
7. Bank Line of Credit
The funds, along with certain other funds in the American Century Investments family of funds, had a $500,000,000 unsecured bank line of credit agreement with Bank of America, N.A. The line expired December 10, 2008, and was not renewed. The agreement allowed the funds to borrow money for temporary or emergency purposes to fund shareholder redemptions. Borrowings under the agreement were subject to interest at the Federal Funds rate plus 0.40%. The funds did not borrow from the line during the year ended October 31, 2009.
8. Interfund Lending
The funds, along with certain other funds in the American Century Investments family of funds, may participate in an interfund lending program, pursuant to an Exemptive Order issued by the Securities and Exchange Commission (SEC). This program provides an alternative credit facility allowing the funds to borrow from or lend to other funds in the American Century Investments family of funds that permit such transactions. Interfund lending transactions are subject to each fund’s investment policies and borrowing and lending limits. The interfund loan rate earned/paid on interfund lending transactions is determined daily based on the average of certain current market rates. Interfund lending transactions normally extend only overnight, but can have a maximum duration of seven days. The program is subject to annual approval by the Board of Directors. During the year ended October 31, 2009, the funds did not utilize the program .
9. Risk Factors
There are certain risks involved in investing in foreign securities. These risks include those resulting from future adverse political, social, and economic developments, fluctuations in currency exchange rates, the possible imposition of exchange controls, and other foreign laws or restrictions.
10. Federal Tax Information
The tax character of distributions paid during the years ended October 31, 2009 and October 31, 2008 were as follows:
| | | | | | |
| | | Growth | | | Vista | |
| | 2009 | | 2008 | 2009 | | 2008 |
| Distributions Paid From | | | | | | |
| Ordinary income | $15,297,908 | | $6,037,777 | — | | $91,105,580 |
| Long-term capital gains | — | | — | — | | $221,395,071 |
The book-basis character of distributions made during the year from net investment income or net realized gains may differ from their ultimate characterization for federal income tax purposes. These differences reflect the differing character of certain income items and net realized gains and losses for financial statement and tax purposes, and may result in reclassification among certain capital accounts on the financial statements.
34
As of October 31, 2009, the federal tax cost of investments and the components of distributable earnings on a tax-basis were as follows:
| | |
| | Growth | Vista |
| Federal tax cost of investments | $3,759,238,397 | $1,881,896,942 |
| Gross tax appreciation of investments | $447,852,382 | $346,157,226 |
| Gross tax depreciation of investments | (99,754,961) | (40,542,401) |
| Net tax appreciation (depreciation) of investments | $348,097,421 | $305,614,825 |
| Net tax appreciation (depreciation) on derivatives and | | |
| translation of assets and liabilities in foreign currencies | $156,271 | $20,089 |
| Net tax appreciation (depreciation) | $348,253,692 | $305,634,914 |
| Undistributed ordinary income | $12,280,812 | — |
| Accumulated capital losses | $(688,111,820) | $(870,658,290) |
The difference between book-basis and tax-basis cost and unrealized appreciation (depreciation) is attributable primarily to the tax deferral of losses on wash sales.
The accumulated capital losses listed above represent net capital loss carryovers that may be used to offset future realized capital gains for federal income tax purposes. Future capital loss carryover utilization in any given year may be subject to Internal Revenue Code limitations. The capital loss carryovers expire as follows:
| | | | |
| | 2010 | 2015 | 2016 | 2017 |
| Growth | $(168,744,439) | $(17,354,465) | $(131,790,282) | $(370,222,634) |
| Vista | — | — | $(250,166,415) | $(620,491,875) |
11. Corporate Event
On July 27, 2007, the C Class shareholders of each fund approved a reclassification of C Class shares into Advisor Class shares of that fund. The change was approved by the Board of Directors on November 29, 2006 and March 7, 2007. The reclassification was effective December 3, 2007.
12. Reorganization Plan
On December 3, 2008, the Board of Directors of Life Sciences Fund (Life Sciences) and Technology Fund (Technology), two funds in a series issued by American Century World Mutual Funds, Inc., approved a plan of reorganization (the reorganization), pursuant to which Growth acquired all of the assets of Life Sciences and Technology in exchange for shares of equal value of Growth and assumption by Growth of certain ordinary course liabilities of Life Sciences’ and Technology. The financial statements and performance history of Growth were carried over in the post-reorganization. The reorganization was approved by shareholders of Life Sciences and Technology on May 5, 2009. The reorganization was effective at the close of business on May 29, 2009.
35
The reorganization was accomplished by a tax-free exchange of shares. On May 29, 2009, Life Sciences and Technology exchanged its shares for shares of Growth as follows:
| | | | |
| Original Fund/Class | Shares Exchanged | | New Fund/Class | Shares Received |
| Life Sciences – Investor Class | 14,188,887 | | Growth – Investor Class | 3,543,258 |
| Life Sciences – Institutional Class | 292,636 | | Growth – Institutional Class | 73,726 |
| | | | | |
| Technology – Investor Class | 3,955,315 | | Growth – Investor Class | 3,146,575 |
| Technology – Institutional Class | 156,129 | | Growth – Institutional Class | 125,440 |
The net assets of Life Sciences, Technology and Growth immediately before the reorganization were $64,755,810, $58,589,139 and $3,253,531,971, respectively. Life Sciences’ unrealized depreciation of $(4,447,437) and Technology’s unrealized appreciation of $1,243,638 were combined with that of Growth. Immediately after the reorganization, the combined net assets were $3,376,876,920. Growth acquired capital loss carryovers of $(11,422,597) and $(91,949,746) from Life Sciences and Technology, respectively.
13. Recently Issued Accounting Standards
The Financial Accounting Standards Board (FASB) issued Accounting Standards Codification (ASC) Section 820-10 (formerly Statement of Financial Accounting Standards No. 157, “Fair Value Measurements”), in September 2006, which is effective for fiscal years beginning after November 15, 2007. ASC Section 820-10 defines fair value, establishes a framework for measuring fair value and expands the required financial statement disclosures about fair value measurements. The adoption of ASC Section 820-10 did not materially impact the determination of fair value.
In March 2008, the FASB issued ASC Section 815-10 (formerly Statement of Financial Accounting Standards No. 161, “Disclosures about Derivative Instruments and Hedging Activities — an amendment of FASB Statement No. 133”). ASC Section 815-10 is effective for interim periods beginning after November 15, 2008 and has been adopted by the funds. ASC Section 815-10 amends and expands disclosures about derivative instruments and hedging activities. ASC Section 815-10 requires qualitative disclosures about the objectives and strategies of derivative instruments, quantitative disclosures about the fair value amounts of and gains and losses on derivative instruments, and disclosures of credit-risk-related contingent features in hedging activities.
14. Other Tax Information (Unaudited)
The following information is provided pursuant to provisions of the Internal Revenue Code.
Growth hereby designates up to the maximum amount allowable as qualified dividend income for the fiscal year ended October 31, 2009.
For corporate taxpayers, Growth hereby designates $15,297,908, or up to the maximum amount allowable, of ordinary income distributions paid during the fiscal year ended October 31, 2009 as qualified for the corporate dividends received deduction.
36
| | | | | | |
| Growth | | | | | |
| |
| Investor Class | | | | | |
| For a Share Outstanding Throughout the Years Ended October 31 | | | |
| | | 2009 | 2008 | 2007 | 2006 | 2005 |
| Per-Share Data | | | | | |
| Net Asset Value, Beginning of Period | $17.69 | $26.78 | $21.99 | $19.80 | $18.43 |
| Income From Investment Operations | | | | | |
| Net Investment Income (Loss)(1) | 0.09 | 0.04 | 0.04 | 0.02 | 0.08 |
| Net Realized and Unrealized Gain (Loss) | 2.58 | (9.10) | 4.76 | 2.26 | 1.30 |
| Total From Investment Operations | 2.67 | (9.06) | 4.80 | 2.28 | 1.38 |
| Distributions | | | | | |
| From Net Investment Income | (0.08) | (0.03) | (0.01) | (0.09) | (0.01) |
| Net Asset Value, End of Period | $20.28 | $17.69 | $26.78 | $21.99 | $19.80 |
| |
| Total Return(2) | 15.25% | (33.86)% | 21.86% | 11.51% | 7.47% |
| | | | | | |
| Ratios/Supplemental Data | | | | | |
| Ratio of Operating Expenses | | | | | |
| to Average Net Assets | 1.00% | 1.00% | 1.00% | 1.00% | 1.00% |
| Ratio of Net Investment Income (Loss) | | | | | |
| to Average Net Assets | 0.50% | 0.16% | 0.15% | 0.09% | 0.38% |
| Portfolio Turnover Rate | 114% | 129% | 112% | 127% | 77% |
| Net Assets, End of Period (in millions) | $3,372 | $2,617 | $4,133 | $3,946 | $4,008 |
| (1) | Computed using average shares outstanding throughout the period. | | | | |
| (2) | Total return assumes reinvestment of net investment income and capital gains distributions, if any. The total return of the classes may not |
| | precisely reflect the class expense differences because of the impact of calculating the net asset value to two decimal places. If net asset values |
| | were calculated to three decimal places, the total return differences would more closely reflect the class expense differences. The calculation of |
| | net asset values to two decimal places is made in accordance with SEC guidelines and does not result in any gain or loss of value between one |
| | class and another. | | | | | |
| |
| |
| See Notes to Financial Statements. | | | | | |
37
| | | | | | |
| Growth | | | | | |
| |
| Institutional Class | | | | | |
| For a Share Outstanding Throughout the Years Ended October 31 | | | |
| | | 2009 | 2008 | 2007 | 2006 | 2005 |
| Per-Share Data | | | | | |
| Net Asset Value, Beginning of Period | $17.86 | $27.03 | $22.19 | $19.98 | $18.59 |
| Income From Investment Operations | | | | | |
| Net Investment Income (Loss)(1) | 0.12 | 0.08 | 0.09 | 0.06 | 0.11 |
| Net Realized and Unrealized Gain (Loss) | 2.61 | (9.17) | 4.81 | 2.27 | 1.33 |
| Total From Investment Operations | 2.73 | (9.09) | 4.90 | 2.33 | 1.44 |
| Distributions | | | | | |
| From Net Investment Income | (0.12) | (0.08) | (0.06) | (0.12) | (0.05) |
| Net Asset Value, End of Period | $20.47 | $17.86 | $27.03 | $22.19 | $19.98 |
| |
| Total Return(2) | 15.45% | (33.71)% | 22.13% | 11.70% | 7.72% |
| | | | | | |
| Ratios/Supplemental Data | | | | | |
| Ratio of Operating Expenses | | | | | |
| to Average Net Assets | 0.80% | 0.80% | 0.80% | 0.80% | 0.80% |
| Ratio of Net Investment Income (Loss) | | | | | |
| to Average Net Assets | 0.70% | 0.36% | 0.35% | 0.29% | 0.58% |
| Portfolio Turnover Rate | 114% | 129% | 112% | 127% | 77% |
| Net Assets, End of Period (in thousands) | $549,496 | $286,262 | $284,695 | $759,816 | $689,983 |
| (1) | Computed using average shares outstanding throughout the period. | | | | |
| (2) | Total return assumes reinvestment of net investment income and capital gains distributions, if any. The total return of the classes may not |
| | precisely reflect the class expense differences because of the impact of calculating the net asset value to two decimal places. If net asset values |
| | were calculated to three decimal places, the total return differences would more closely reflect the class expense differences. The calculation of |
| | net asset values to two decimal places is made in accordance with SEC guidelines and does not result in any gain or loss of value between one |
| | class and another. | | | | | |
| |
| |
| See Notes to Financial Statements. | | | | | |
38
| | | | | | |
| Growth | | | | | |
| |
| Advisor Class | | | | | |
| For a Share Outstanding Throughout the Years Ended October 31 | | | |
| | | 2009 | 2008 | 2007 | 2006 | 2005 |
| Per-Share Data | | | | | |
| Net Asset Value, Beginning of Period | $17.40 | $26.36 | $21.68 | $19.53 | $18.22 |
| Income From Investment Operations | | | | | |
| Net Investment Income (Loss)(1) | 0.04 | (0.02) | (0.04) | (0.03) | 0.02 |
| Net Realized and Unrealized Gain (Loss) | 2.54 | (8.94) | 4.72 | 2.22 | 1.29 |
| Total From Investment Operations | 2.58 | (8.96) | 4.68 | 2.19 | 1.31 |
| Distributions | | | | | |
| From Net Investment Income | (0.04) | — | — | (0.04) | — |
| Net Asset Value, End of Period | $19.94 | $17.40 | $26.36 | $21.68 | $19.53 |
| |
| Total Return(2) | 14.99% | (34.03)% | 21.59% | 11.23% | 7.19% |
| | | | | | |
| Ratios/Supplemental Data | | | | | |
| Ratio of Operating Expenses | | | | | |
| to Average Net Assets | 1.25% | 1.25% | 1.25% | 1.25% | 1.25% |
| Ratio of Net Investment Income (Loss) | | | | | |
| to Average Net Assets | 0.25% | (0.09)% | (0.10)% | (0.16)% | 0.13% |
| Portfolio Turnover Rate | 114% | 129% | 112% | 127% | 77% |
| Net Assets, End of Period (in thousands) | $214,371 | $141,441 | $206,837 | $85,953 | $86,303 |
| (1) | Computed using average shares outstanding throughout the period. | | | | |
| (2) | Total return assumes reinvestment of net investment income and capital gains distributions, if any. The total return of the classes may not |
| | precisely reflect the class expense differences because of the impact of calculating the net asset value to two decimal places. If net asset values |
| | were calculated to three decimal places, the total return differences would more closely reflect the class expense differences. The calculation of |
| | net asset values to two decimal places is made in accordance with SEC guidelines and does not result in any gain or loss of value between one |
| | class and another. | | | | | |
| |
| |
| See Notes to Financial Statements. | | | | | |
39
| | | | | | |
| Growth | | | | | |
| |
| R Class | | | | | |
| For a Share Outstanding Throughout the Years Ended October 31 | | | |
| | | 2009 | 2008 | 2007 | 2006 | 2005 |
| Per-Share Data | | | | | |
| Net Asset Value, Beginning of Period | $17.35 | $26.37 | $21.74 | $19.59 | $18.32 |
| Income From Investment Operations | | | | | |
| Net Investment Income (Loss)(1) | (0.01) | (0.08) | (0.10) | (0.11) | (0.07) |
| Net Realized and Unrealized Gain (Loss) | 2.56 | (8.94) | 4.73 | 2.26 | 1.34 |
| Total From Investment Operations | 2.55 | (9.02) | 4.63 | 2.15 | 1.27 |
| Distributions | | | | | |
| From Net Investment Income | —(2) | — | — | — | — |
| Net Asset Value, End of Period | $19.90 | $17.35 | $26.37 | $21.74 | $19.59 |
| |
| Total Return(3) | 14.67% | (34.21)% | 21.30% | 10.97% | 6.93% |
| | | | | | |
| Ratios/Supplemental Data | | | | | |
| Ratio of Operating Expenses | | | | | |
| to Average Net Assets | 1.50% | 1.50% | 1.50% | 1.50% | 1.50% |
| Ratio of Net Investment Income (Loss) | | | | | |
| to Average Net Assets | 0.00%(4) | (0.34)% | (0.35)% | (0.41)% | (0.12)% |
| Portfolio Turnover Rate | 114% | 129% | 112% | 127% | 77% |
| Net Assets, End of Period (in thousands) | $7,656 | $3,280 | $2,383 | $298 | $49 |
| (1) | Computed using average shares outstanding throughout the period. | | | | |
| (2) | Per-share amount was less than $0.005. | | | | | |
| (3) | Total return assumes reinvestment of net investment income and capital gains distributions, if any. The total return of the classes may not |
| | precisely reflect the class expense differences because of the impact of calculating the net asset value to two decimal places. If net asset values |
| | were calculated to three decimal places, the total return differences would more closely reflect the class expense differences. The calculation of |
| | net asset values to two decimal places is made in accordance with SEC guidelines and does not result in any gain or loss of value between one |
| | class and another. | | | | | |
| (4) | Ratio is less than 0.005%. | | | | | |
| |
| |
| See Notes to Financial Statements. | | | | | |
40
| | | | | | |
| Vista | | | | | |
| |
| Investor Class | | | | | |
| For a Share Outstanding Throughout the Years Ended October 31 | | | |
| | | 2009 | 2008 | 2007 | 2006 | 2005 |
| Per-Share Data | | | | | |
| Net Asset Value, Beginning of Period | $12.43 | $24.24 | $16.35 | $14.99 | $13.14 |
| Income From Investment Operations | | | | | |
| Net Investment Income (Loss)(1) | (0.05) | (0.11) | (0.12) | (0.04) | (0.04) |
| Net Realized and Unrealized Gain (Loss) | (0.25) | (9.61) | 8.14 | 1.40 | 1.89 |
| Total From Investment Operations | (0.30) | (9.72) | 8.02 | 1.36 | 1.85 |
| Distributions | | | | | |
| From Net Realized Gains | — | (2.09) | (0.13) | — | — |
| Net Asset Value, End of Period | $12.13 | $12.43 | $24.24 | $16.35 | $14.99 |
| |
| Total Return(2) | (2.41)% | (43.58)% | 49.39% | 9.07% | 14.08% |
| | | | | | |
| Ratios/Supplemental Data | | | | | |
| Ratio of Operating Expenses | | | | | |
| to Average Net Assets | 1.00% | 1.00% | 1.00% | 1.00% | 1.00% |
| Ratio of Net Investment Income (Loss) | | | | | |
| to Average Net Assets | (0.48)% | (0.56)% | (0.60)% | (0.23)% | (0.26)% |
| Portfolio Turnover Rate | 183% | 167% | 121% | 234% | 284% |
| Net Assets, End of Period (in millions) | $1,691 | $1,801 | $2,921 | $1,965 | $1,902 |
| (1) | Computed using average shares outstanding throughout the period. | | | | |
| (2) | Total return assumes reinvestment of net investment income and capital gains distributions, if any. The total return of the classes may not |
| | precisely reflect the class expense differences because of the impact of calculating the net asset value to two decimal places. If net asset values |
| | were calculated to three decimal places, the total return differences would more closely reflect the class expense differences. The calculation of |
| | net asset values to two decimal places is made in accordance with SEC guidelines and does not result in any gain or loss of value between one |
| | class and another. | | | | | |
| |
| |
| See Notes to Financial Statements. | | | | | |
41
| | | | | | |
| Vista | | | | | |
| |
| Institutional Class | | | | | |
| For a Share Outstanding Throughout the Years Ended October 31 | | | |
| | | 2009 | 2008 | 2007 | 2006 | 2005 |
| Per-Share Data | | | | | |
| Net Asset Value, Beginning of Period | $12.73 | $24.72 | $16.64 | $15.22 | $13.32 |
| Income From Investment Operations | | | | | |
| Net Investment Income (Loss)(1) | (0.03) | (0.07) | (0.08) | (0.01) | (0.01) |
| Net Realized and Unrealized Gain (Loss) | (0.25) | (9.83) | 8.29 | 1.43 | 1.91 |
| Total From Investment Operations | (0.28) | (9.90) | 8.21 | 1.42 | 1.90 |
| Distributions | | | | | |
| From Net Realized Gains | — | (2.09) | (0.13) | — | — |
| Net Asset Value, End of Period | $12.45 | $12.73 | $24.72 | $16.64 | $15.22 |
| |
| Total Return(2) | (2.12)% | (43.50)% | 49.68% | 9.33% | 14.26% |
| | | | | | |
| Ratios/Supplemental Data | | | | | |
| Ratio of Operating Expenses | | | | | |
| to Average Net Assets | 0.80% | 0.80% | 0.80% | 0.80% | 0.80% |
| Ratio of Net Investment Income (Loss) | | | | | |
| to Average Net Assets | (0.28)% | (0.36)% | (0.40)% | (0.03)% | (0.06)% |
| Portfolio Turnover Rate | 183% | 167% | 121% | 234% | 284% |
| Net Assets, End of Period (in thousands) | $211,357 | $238,727 | $254,528 | $132,325 | $98,439 |
| (1) | Computed using average shares outstanding throughout the period. | | | | |
| (2) | Total return assumes reinvestment of net investment income and capital gains distributions, if any. Total returns are calculated based on the net |
| | asset value of the last business day. The total return of the classes may not precisely reflect the class expense differences because of the impact |
| | of calculating the net asset value to two decimal places. If net asset values were calculated to three decimal places, the total return differences |
| | would more closely reflect the class expense differences. The calculation of net asset values to two decimal places is made in accordance with |
| | SEC guidelines and does not result in any gain or loss of value between one class and another. | | |
| |
| |
| See Notes to Financial Statements. | | | | | |
42
| | | | | | |
| Vista | | | | | |
| |
| Advisor Class | | | | | |
| For a Share Outstanding Throughout the Years Ended October 31 | | | |
| | | 2009 | 2008 | 2007 | 2006 | 2005 |
| Per-Share Data | | | | | |
| Net Asset Value, Beginning of Period | $12.09 | $23.69 | $16.03 | $14.73 | $12.95 |
| Income From Investment Operations | | | | | |
| Net Investment Income (Loss)(1) | (0.08) | (0.15) | (0.16) | (0.08) | (0.08) |
| Net Realized and Unrealized Gain (Loss) | (0.24) | (9.36) | 7.95 | 1.38 | 1.86 |
| Total From Investment Operations | (0.32) | (9.51) | 7.79 | 1.30 | 1.78 |
| Distributions | | | | | |
| From Net Realized Gains | — | (2.09) | (0.13) | — | — |
| Net Asset Value, End of Period | $11.77 | $12.09 | $23.69 | $16.03 | $14.73 |
| |
| Total Return(2) | (2.65)% | (43.72)% | 48.94% | 8.83% | 13.75% |
| | | | | | |
| Ratios/Supplemental Data | | | | | |
| Ratio of Operating Expenses | | | | | |
| to Average Net Assets | 1.25% | 1.25% | 1.25% | 1.25% | 1.25% |
| Ratio of Net Investment Income (Loss) | | | | | |
| to Average Net Assets | (0.73)% | (0.81)% | (0.85)% | (0.48)% | (0.51)% |
| Portfolio Turnover Rate | 183% | 167% | 121% | 234% | 284% |
| Net Assets, End of Period (in thousands) | $255,419 | $257,057 | $380,555 | $210,576 | $190,635 |
| (1) | Computed using average shares outstanding throughout the period. | | | | |
| (2) | Total return assumes reinvestment of net investment income and capital gains distributions, if any. The total return of the classes may not |
| | precisely reflect the class expense differences because of the impact of calculating the net asset value to two decimal places. If net asset values |
| | were calculated to three decimal places, the total return differences would more closely reflect the class expense differences. The calculation of |
| | net asset values to two decimal places is made in accordance with SEC guidelines and does not result in any gain or loss of value between one |
| | class and another. | | | | | |
| |
| |
| See Notes to Financial Statements. | | | | | |
43
| | | | | | |
| Vista | | | | | |
| |
| R Class | | | | | |
| For a Share Outstanding Throughout the Years Ended October 31 (except as noted) | | |
| | | 2009 | 2008 | 2007 | 2006 | 2005(1) |
| Per-Share Data | | | | | |
| Net Asset Value, Beginning of Period | $12.22 | $23.98 | $16.25 | $14.97 | $15.32 |
| Income From Investment Operations | | | | | |
| Net Investment Income (Loss)(2) | (0.12) | (0.18) | (0.21) | (0.16) | (0.04) |
| Net Realized and Unrealized Gain (Loss) | (0.23) | (9.49) | 8.07 | 1.44 | (0.31) |
| Total From Investment Operations | (0.35) | (9.67) | 7.86 | 1.28 | (0.35) |
| Distributions | | | | | |
| From Net Realized Gains | — | (2.09) | (0.13) | — | — |
| Net Asset Value, End of Period | $11.87 | $12.22 | $23.98 | $16.25 | $14.97 |
| |
| Total Return(3) | (2.86)% | (43.87)% | 48.71% | 8.55% | (2.28)% |
| | | | | | |
| Ratios/Supplemental Data | | | | | |
| Ratio of Operating Expenses | | | | | |
| to Average Net Assets | 1.50% | 1.50% | 1.50% | 1.50% | 1.99%(4) |
| Ratio of Net Investment Income (Loss) | | | | | |
| to Average Net Assets | (0.98)% | (1.06)% | (1.10)% | (0.73)% | (0.92)%(4) |
| Portfolio Turnover Rate | 183% | 167% | 121% | 234% | 284%(5) |
| Net Assets, End of Period (in thousands) | $22,618 | $11,423 | $2,398 | $337 | $24 |
| (1) | July 29, 2005 (commencement of sale) through October 31, 2007. | | | | |
| (2) | Computed using average shares outstanding throughout the period. | | | | |
| (3) | Total return assumes reinvestment of net investment income and capital gains distributions, if any. Total returns for periods less than one year are |
| | not annualized. The total return of the classes may not precisely reflect the class expense differences because of the impact of calculating the |
| | net asset value to two decimal places. If net asset values were calculated to three decimal places, the total return differences would more closely |
| | reflect the class expense differences. The calculation of net asset values to two decimal places is made in accordance with SEC guidelines and |
| | does not result in any gain or loss of value between one class and another. | | | |
| (4) | Annualized. | | | | | |
| (5) | Portfolio turnover is calculated at the fund level. Percentage indicated was calculated for the year ended October 31, 2005. | |
| |
| |
| See Notes to Financial Statements. | | | | | |
44
|
| Report of Independent Registered Public Accounting Firm |
The Board of Directors and Shareholders, American Century Mutual Funds, Inc.:
We have audited the accompanying statements of assets and liabilities, including the schedules of investments, of Growth Fund and Vista Fund, two of the funds constituting American Century Mutual Funds, Inc. (the “Corporation”), as of October 31, 2009, and the related statements of operations for the year then ended, the statements of changes in net assets for each of the two years in the period then ended, and the financial highlights for each of the five years in the period then ended. These financial statements and financial highlights are the responsibility of the Corporation’s management. Our responsibility is to express an opinion on these financial statements and financial highlights based on our audits.
We conducted our audits in accordance with the standards of the Public Company Accounting Oversight Board (United States). Those standards require that we plan and perform the audit to obtain reasonable assurance about whether the financial statements and financial highlights are free of material misstatement. The Corporation is not required to have, nor were we engaged to perform, an audit of its internal control over financial reporting. Our audits included consideration of internal control over financial reporting as a basis for designing audit procedures that are appropriate in the circumstances, but not for the purpose of expressing an opinion on the effectiveness of the Corporation’s internal control over financial reporting. Accordingly, we express no such opinion. An audit also includes examining, on a test basis, evidence supporting the amounts and disclosures in the financial statements, assessing the accounting principles used and significant estimates made by management, as well as evaluating the overall financial statement presentation. Our procedures included confirmation of securities owned as of October 31, 2009, by correspondence with the custodian and brokers; where replies were not received from brokers, we performed other auditing procedures. We believe that our audits provide a reasonable basis for our opinion.
In our opinion, the financial statements and financial highlights referred to above present fairly, in all material respects, the respective financial positions of Growth Fund and Vista Fund of American Century Mutual Funds, Inc., as of October 31, 2009, the results of their operations for the year then ended, the changes in their net assets for each of the two years in the period then ended, and the financial highlights for each of the five years in the period then ended, in conformity with accounting principles generally accepted in the United States of America.
Deloitte & Touche LLP
Kansas City, Missouri
December 28, 2009
45
The individuals listed below serve as directors or officers of the funds. Each director serves until his or her successor is duly elected and qualified or until he or she retires. Mandatory retirement age for independent directors is 72. Those listed as interested directors are “interested” primarily by virtue of their engagement as directors and/or officers of, or ownership interest in, American Century Companies, Inc. (ACC) or its wholly owned, direct or indirect, subsidiaries, including the funds’ investment advisor, American Century Investment Management, Inc. (ACIM); the funds’ principal underwriter, American Century Investment Services, Inc. (ACIS); and the funds’ transfer agent, American Century Services, LLC (ACS).
The other directors (more than three-fourths of the total number) are independent; that is, they have never been employees, directors or officers of, and have no financial interest in, ACC or any of its wholly owned, direct or indirect, subsidiaries, including ACIM, ACIS and ACS. The directors serve in this capacity for seven registered investment companies in the American Century Investments family of funds.
All persons named as officers of the funds also serve in similar capacities for the other 14 registered investment companies in the American Century Investments family of funds advised by ACIM or American Century Global Investment Management, Inc. (ACGIM), a wholly owned subsidiary of ACIM, unless otherwise noted. Only officers with policy-making functions are listed. No officer is compensated for his or her service as an officer of the funds. The listed officers are interested persons of the funds and are appointed or re-appointed on an annual basis.
Interested Director
Jonathan S. Thomas, 4500 Main Street, Kansas City, MO 64111
Year of Birth: 1963
Position(s) Held with Funds: Director (since 2007) and President (since 2007)
Principal Occupation(s) During Past 5 Years: President and Chief Executive Officer, ACC
(March 2007 to present); Chief Administrative Officer, ACC (February 2006 to
February 2007); Executive Vice President, ACC (November 2005 to February 2007).
Also serves as: President, Chief Executive Officer and Director, ACS; Executive
Vice President, ACIM and ACGIM; Director, ACIM, ACGIM, ACIS and other ACC
subsidiaries. Managing Director, Morgan Stanley (March 2000 to November 2005)
Number of Portfolios in Fund Complex Overseen by Director: 103
Other Directorships Held by Director: None
Independent Directors
Thomas A. Brown, 4500 Main Street, Kansas City, MO 64111
Year of Birth: 1940
Position(s) Held with Funds: Director (since 1980)
Principal Occupation(s) During Past 5 Years: Managing Member, Associated Investments, LLC
(real estate investment company); Managing Member, Brown Cascade Properties,
LLC (real estate investment company); Retired, Area Vice President, Applied
Industrial Technologies (bearings and power transmission company)
Number of Portfolios in Fund Complex Overseen by Director: 63
Other Directorships Held by Director: None
46
Andrea C. Hall, Ph.D., 4500 Main Street, Kansas City, MO 64111
Year of Birth: 1945
Position(s) Held with Funds: Director (since 1997)
Principal Occupation(s) During Past 5 Years: Retired, Advisor to the President, Midwest
Research Institute (not-for-profit, contract research organization)
Number of Portfolios in Fund Complex Overseen by Director: 63
Other Directorships Held by Director: None
James A. Olson, 4500 Main Street, Kansas City, MO 64111
Year of Birth: 1942
Position(s) Held with Funds: Director (since 2007)
Principal Occupation(s) During Past 5 Years: Member, Plaza Belmont LLC (private equity
fund manager); Chief Financial Officer, Plaza Belmont LLC (September 1999 to
September 2006)
Number of Portfolios in Fund Complex Overseen by Director: 63
Other Directorships Held by Director: Saia, Inc. and Entertainment Properties Trust
Donald H. Pratt, 4500 Main Street, Kansas City, MO 64111
Year of Birth: 1937
Position(s) Held with Funds: Director (since 1995) and Chairman of the Board (since 2005)
Principal Occupation(s) During Past 5 Years: Chairman and Chief Executive Officer, Western
Investments, Inc. (real estate company); Retired Chairman of the Board, Butler
Manufacturing Company (metal buildings producer)
Number of Portfolios in Fund Complex Overseen by Director: 63
Other Directorships Held by Director: None
Gale E. Sayers, 4500 Main Street, Kansas City, MO 64111
Year of Birth: 1943
Position(s) Held with Funds: Director (since 2000)
Principal Occupation(s) During Past 5 Years: President, Chief Executive Officer and Founder,
Sayers40, Inc. (technology products and services provider)
Number of Portfolios in Fund Complex Overseen by Director: 63
Other Directorships Held by Director: None
M. Jeannine Strandjord, 4500 Main Street, Kansas City, MO 64111
Year of Birth: 1945
Position(s) Held with Funds: Director (since 1994)
Principal Occupation(s) During Past 5 Years: Retired, formerly Senior Vice President, Sprint
Corporation (telecommunications company)
Number of Portfolios in Fund Complex Overseen by Director: 63
Other Directorships Held by Director: DST Systems, Inc.; Euronet Worldwide, Inc. and
Charming Shoppes, Inc.
John R. Whitten, 4500 Main Street, Kansas City, MO 64111
Year of Birth: 1946
Position(s) Held with Funds: Director (since 2008)
Principal Occupation(s) During Past 5 Years: Project Consultant, Celanese Corp. (industrial
chemical company) (September 2004 to January 2005)
Number of Portfolios in Fund Complex Overseen by Director: 63
Other Directorships Held by Director: Rudolph Technologies, Inc.
47
Officers
Barry Fink, 4500 Main Street, Kansas City, MO 64111
Year of Birth: 1955
Position(s) Held with Funds: Executive Vice President (since 2007)
Principal Occupation(s) During Past 5 Years: Chief Operating Officer and Executive Vice
President, ACC (September 2007 to present); President, ACS (October 2007 to
present); Managing Director, Morgan Stanley (2000 to 2007); Global General
Counsel, Morgan Stanley (2000 to 2006). Also serves as: Director, ACC, ACS, ACIS
and other ACC subsidiaries
Maryanne Roepke, 4500 Main Street, Kansas City, MO 64111
Year of Birth: 1956
Position(s) Held with Funds: Chief Compliance Officer (since 2006) and Senior Vice
President (since 2000)
Principal Occupation(s) During Past 5 Years: Chief Compliance Officer, ACIM, ACGIM and ACS
(August 2006 to present); Assistant Treasurer, ACC (January 1995 to August 2006); and
Treasurer and Chief Financial Officer, various American Century Investments funds
(July 2000 to August 2006). Also serves as: Senior Vice President, ACS
Charles A. Etherington, 4500 Main Street, Kansas City, MO 64111
Year of Birth: 1957
Position(s) Held with Funds: General Counsel (since 2007) and Senior Vice President
(since 2006)
Principal Occupation(s) During Past 5 Years: Attorney, ACC (February 1994 to present); Vice
President, ACC (November 2005 to present); General Counsel, ACC (March 2007
to present). Also serves as: General Counsel, ACIM, ACGIM, ACS, ACIS and other
ACC subsidiaries; and Senior Vice President, ACIM, ACGIM and ACS
Robert Leach, 4500 Main Street, Kansas City, MO 64111
Year of Birth: 1966
Position(s) Held with Funds: Vice President, Treasurer and Chief Financial Officer (all
since 2006)
Principal Occupation(s) During Past 5 Years: Vice President, ACS (February 2000 to present); and
Controller, various American Century Investments funds (1997 to September 2006)
David H. Reinmiller, 4500 Main Street, Kansas City, MO 64111
Year of Birth: 1963
Position(s) Held with Funds: Vice President (since September 2000)
Principal Occupation(s) During Past 5 Years: Attorney, ACC (January 1994 to present);
Associate General Counsel, ACC (January 2001 to present); Chief Compliance
Officer, American Century Investments funds, ACIM and ACGIM (January 2001 to
February 2005). Also serves as: Associate General Counsel, ACIM, ACGIM, ACS,
ACIS and other ACC subsidiaries; and Vice President, ACIM, ACGIM and ACS
Ward Stauffer, 4500 Main Street, Kansas City, MO 64111
Year of Birth: 1960
Position(s) Held with Funds: Secretary (since February 2005)
Principal Occupation(s) During Past 5 Years: Attorney, ACC (June 2003 to present)
The SAI has additional information about the funds’ directors and is available without charge, upon request, by calling 1-800-345-2021.
48
|
| Approval of Management Agreements |
Under Section 15(c) of the Investment Company Act, contracts for investment advisory services are required to be reviewed, evaluated and approved by a majority of a fund’s independent directors (the “Directors”) each year. At American Century Investments, this process is referred to as the “15(c) Process.” As a part of this process, the board reviews fund performance, shareholder services, audit and compliance information, and a variety of other reports from the advisor concerning fund operations. In addition to this annual review, the board of directors oversees and evaluates on a continuous basis at its quarterly meetings the nature and quality of significant services performed by the advisor, fund performance, audit and compliance information, and a variety of other reports relating to fund operations. The board, or committees of the board, also holds special meetings as needed.
Under a Securities and Exchange Commission rule, each fund is required to disclose in its annual or semiannual report, as appropriate, the material factors and conclusions that formed the basis for the board’s approval or renewal of any advisory agreements within the fund’s most recently completed fiscal half-year period.
Annual Contract Review Process
As part of the annual 15(c) Process undertaken during the most recent fiscal half-year period, the Directors reviewed extensive data and information compiled by the advisor and certain independent providers of evaluative data (the “15(c) Providers”) concerning Growth and Vista (the “Funds”) and the services provided to the Funds under the management agreement. The information considered and the discussions held at the meetings included, but were not limited to:
• the nature, extent and quality of investment management, shareholder services and other services provided to the Funds;
• the wide range of programs and services the advisor provides to the
Funds and their shareholders on a routine and non-routine basis;
• the compliance policies, procedures, and regulatory experience of the advisor;
• data comparing the cost of owning the Funds to the cost of owning a similar fund;
• data comparing the Funds’ performance to appropriate benchmarks and/or a peer group of other mutual funds with similar investment objectives and strategies;
• financial data showing the profitability of the Funds to the advisor and the overall profitability of the advisor;
• data comparing services provided and charges to other investment management clients of the advisor; and
• consideration of collateral benefits derived by the advisor from the management of the Funds and any potential economies of scale relating thereto.
49
In keeping with its practice, the Funds’ board of directors held two in-person meetings and one telephonic meeting to review and discuss the information provided. The board also had the benefit of the advice of its independent counsel throughout the period.
Factors Considered
The Directors considered all of the information provided by the advisor, the 15(c) Providers, and the board’s independent counsel, and evaluated such information for each fund for which the board has responsibility. In connection with their review of the Funds, the Directors did not identify any single factor as being all-important or controlling, and each Director may have attributed different levels of importance to different factors. In deciding to renew the management and subadvisory agreements under the terms ultimately determined by the board to be appropriate, the Directors’ decision was based on the following factors.
Nature, Extent and Quality of Services – Generally. Under the management agreement, the advisor is responsible for providing or arranging for all services necessary for the operation of the Funds. The board noted that under the management agreement, the advisor provides or arranges at its own expense a wide variety of services including:
• Fund construction and design
• portfolio security selection
• initial capitalization/funding
• securities trading
• Fund administration
• custody of Fund assets
• daily valuation of each Fund’s portfolio
• shareholder servicing and transfer agency, including shareholder confirmations, recordkeeping and communications
• legal services
• regulatory and portfolio compliance
• financial reporting
• marketing and distribution
The Directors noted that many of the services provided by the advisor have expanded over time both in terms of quantity and complexity in response to shareholder demands, competition in the industry and the changing regulatory environment. They discussed with the advisor the challenges
50
presented by these changes and the impact on the Funds. In performing their evaluation, the Directors considered information received in connection with the annual review, as well as information provided on an ongoing basis at their regularly scheduled board and committee meetings.
Investment Management Services. The nature of the investment management services provided to the Funds is quite complex and allows Fund shareholders access to professional money management, instant diversification of their investments, and liquidity. In evaluating investment performance, the board expects the advisor to manage the Funds in accordance with its investment objectives and approved strategies. Further, the Directors recognize that the advisor has an obligation to monitor trading activities, and in particular to seek the best execution of fund trades, and to evaluate the use of and payment for research. In providing these services, the advisor utilizes teams of investment professionals (portfolio managers, analysts, research assistants, and securities traders) who require extensive information technology, research, training, com pliance and other systems to conduct their business. At each quarterly meeting the Directors review investment performance information for the Funds, together with comparative information for appropriate benchmarks and/or peer groups of funds managed similarly to the Funds. The Directors also review detailed performance information during the 15(c) Process comparing each Fund’s performance with that of similar funds not managed by the advisor. If performance concerns are identified, the Directors discuss with the advisor the reasons for such results (e.g., market conditions, security selection) and any efforts being undertaken to improve performance. Growth’s performance for both the one- and three-year periods was above the median for its peer group. Vista’s performance was above the median for its peer group for the three-year period and below the median for the one-year period. The board discussed the fund’s performance with the advisor and was satisfied with the efforts being undertak en by the advisor. The board will continue to monitor these efforts and the performance of the Fund. More detailed information about the Fund’s performance can be found in the Performance and Portfolio Commentary sections of this report.
Shareholder and Other Services. The advisor provides the Funds with a comprehensive package of transfer agency, shareholder, and other services. The Directors review reports and evaluations of such services at their regular quarterly meetings, including the annual meeting concerning contract review, and reports to the board. These reports include, but are not limited to, information regarding the operational efficiency and accuracy of the shareholder and transfer agency services provided, staffing levels, shareholder satisfaction (as measured by external as well as internal sources), technology support, new products and services offered to Fund shareholders, securities trading activities, portfolio valuation services, auditing services, and legal and operational compliance activities. Certain aspects of shareholder and transfer agency serv ice level efficiency and the quality of securities trading activities are measured by independent third party providers and are presented in comparison to other fund groups not managed by the advisor.
51
Costs of Services Provided and Profitability. The advisor provides detailed information concerning its cost of providing various services to the Funds, its profitability in managing the Funds, its overall profitability, and its financial condition. The Directors have reviewed with the advisor the methodology used to prepare this financial information. This financial information regarding the advisor is considered in order to evaluate the advisor’s financial condition, its ability to continue to provide services under the management agreement, and the reasonableness of the current management fee. The board concluded that the advisor’s profits were reasonable in light of the services provided to the Funds.
Ethics. The Directors generally consider the advisor’s commitment to providing quality services to shareholders and to conducting its business ethically. They noted that the advisor’s practices generally meet or exceed industry best practices.
Economies of Scale. The Directors review information provided by the advisor regarding the possible existence of economies of scale in connection with the management of the Funds. The Directors concluded that economies of scale are difficult to measure and predict with precision, especially on a fund-by-fund basis. The analysis of economies of scale is further complicated by the additional services and content provided by the advisor and its reinvestment in its ability to provide and expand those services. Accordingly, the Directors seek to evaluate economies of scale by reviewing other information, such as year-over-year profitability of the advisor generally, the profitability of its management of the Funds specifically, the expenses incurred by the advisor in providing various functions to the Funds, and the fees of competitive funds no t managed by the advisor. The Directors believe the advisor is appropriately sharing economies of scale through its competitive fee structure, fee breakpoints as each Fund increases in size, and through reinvestment in its business to provide shareholders additional content and services.
Comparison to Other Funds’ Fees. The Funds pay the advisor a single, all-inclusive (or unified) management fee for providing all services necessary for the management and operation of the Funds, other than brokerage expenses, taxes, interest, extraordinary expenses, and the fees and expenses of each Fund’s independent directors (including their independent legal counsel). Under the unified fee structure, the advisor is responsible for providing all investment advisory, custody, audit, administrative, compliance, record-keeping, marketing and shareholder services, or arranging and supervising third parties to provide such services. By contrast, most other funds are charged a variety of fees, including an investment advisory fee, a transfer agency fee, an administrative fee, distribution charges and other expenses. Other than their investment advisory fees and Rule 12b-1 distribution fees, all other components of the total fees charged by these other funds may be increased without shareholder approval. The board believes the unified fee structure is a benefit to Fund shareholders because it clearly discloses to shareholders the cost of owning Fund shares, and, since the unified fee cannot be increased without a vote of Fund shareholders, it shifts to the advisor the risk of increased costs of operating the Funds and provides
52
a direct incentive to minimize administrative inefficiencies. Part of the Directors’ analysis of fee levels involves reviewing certain evaluative data compiled by a 15(c) Provider comparing each Funds’ unified fee to the total expense ratio of other funds in the Fund’s peer group and performing a regression analysis to evaluate the effect of fee breakpoints as assets under management increase. The unified fee charged to shareholders of each of the Funds was below the median of the total expense ratios of its respective peer group. In addition, the Directors also reviewed updated fee level data provided by the advisor, but recognized that comparative data was particularly difficult to evaluate given the significant market developments during the past year. The board concluded that the management fee paid by each Fund to the advisor was reasonable in light of the services provided to the Funds.
Comparison to Fees and Services Provided to Other Clients of the Advisor. The Directors also requested and received information from the advisor concerning the nature of the services, fees, and profitability of its advisory services to advisory clients other than the Funds. They observed that these varying types of client accounts require different services and involve different regulatory and entrepreneurial risks than the management of the Funds. The Directors analyzed this information and concluded that the fees charged and services provided to the Funds were reasonable by comparison.
Collateral Benefits Derived by the Advisor. The Directors considered the existence of collateral benefits the advisor may receive as a result of its relationship with the Funds. They concluded that the advisor’s primary business is managing mutual funds and it generally does not use fund or shareholder information to generate profits in other lines of business, and therefore does not derive any significant collateral benefits from them. The Directors noted that the advisor receives proprietary research from broker-dealers that execute fund portfolio transactions and concluded that this research is likely to benefit fund shareholders. The Directors also determined that the advisor is able to provide investment management services to certain clients other than the Funds, at least in part, due to its existing infrastructure built to serv e the fund complex. The Directors concluded, however, that the assets of those other clients are not material to the analysis and, in any event, are included with the assets of the Funds to determine breakpoints in each Fund’s fee schedule, provided they are managed using the same investment team and strategy.
Conclusions of the Directors
As a result of this process, the board, including all of the independent directors, in the absence of particular circumstances and assisted by the advice of legal counsel that is independent of the advisor, taking into account all of the factors discussed above and the information provided by the advisor concluded that the investment management agreement between each Fund and the advisor is fair and reasonable in light of the services provided and should be renewed.
53
Retirement Account Information
As required by law, distributions you receive from certain IRAs, or 403(b), 457 and qualified plans are subject to federal income tax withholding, unless you elect not to have withholding apply. Tax will be withheld on the total amount withdrawn even though you may be receiving amounts that are not subject to withholding, such as nondeductible contributions. In such case, excess amounts of withholding could occur. You may adjust your withholding election so that a greater or lesser amount will be withheld.
If you don’t want us to withhold on this amount, you must notify us to not withhold the federal income tax. You may notify us in writing or in certain situations by telephone or through other electronic means. You have the right to revoke your withholding election at any time and any election you make may remain in effect until revoked by filing a new election.
Remember, even if you elect not to have income tax withheld, you are liable for paying income tax on the taxable portion of your withdrawal. If you elect not to have income tax withheld or you don’t have enough income tax withheld, you may be responsible for payment of estimated tax. You may incur penalties under the estimated tax rules if your withholding and estimated tax payments are not sufficient. You can reduce or defer the income tax on a distribution by directly or indirectly rolling such distribution over to another IRA or eligible plan. You should consult your tax advisor for additional information.
State tax will be withheld if, at the time of your distribution, your address is within one of the mandatory withholding states and you have federal income tax withheld. State taxes will be withheld from your distribution in accordance with the respective state rules.
Proxy Voting Guidelines
American Century Investment Management, Inc., the funds’ investment advisor, is responsible for exercising the voting rights associated with the securities purchased and/or held by the funds. A description of the policies and procedures the advisor uses in fulfilling this responsibility is available without charge, upon request, by calling 1-800-345-2021. It is also available on American Century Investments’ website at americancentury.com and on the Securities and Exchange Commission’s website at sec.gov. Information regarding how the investment advisor voted proxies relating to portfolio securities during the most recent 12-month period ended June 30 is available on the “About Us” page at americancentury.com. It is also available at sec.gov.
Quarterly Portfolio Disclosure
The funds file their complete schedule of portfolio holdings with the Securities and Exchange Commission (SEC) for the first and third quarters of each fiscal year on Form N-Q. The funds’ Forms N-Q are available on the SEC’s website at sec.gov, and may be reviewed and copied at the SEC’s Public Reference Room in Washington, DC. Information on the operation of the Public Reference Room may be obtained by calling 1-800-SEC-0330. The funds also make their complete schedule of portfolio holdings for the most recent quarter of their fiscal year available on their website at americancentury.com and, upon request, by calling 1-800-345-2021.
54
The following indices are used to illustrate investment market, sector, or style performance or to serve as fund performance comparisons. They are not investment products available for purchase.
The Russell 1000® Index is a market-capitalization weighted, large-cap index created by Frank Russell Company to measure the performance of the 1,000 largest publicly traded U.S. companies, based on total market capitalization.
The Russell 1000® Growth Index measures the performance of those Russell 1000 Index companies (the 1,000 largest publicly traded U.S. companies, based on total market capitalization) with higher price-to-book ratios and higher forecasted growth values.
The Russell 1000® Value Index measures the performance of those Russell 1000 Index companies (the 1,000 largest publicly traded U.S. companies, based on total market capitalization) with lower price-to-book ratios and lower forecasted growth values.
The Russell 2000® Index is a market-capitalization weighted index created by Frank Russell Company to measure the performance of the 2,000 smallest of the 3,000 largest publicly traded U.S. companies, based on total market capitalization.
The Russell 2000® Growth Index measures the performance of those Russell 2000 Index companies (the 2,000 smallest of the 3,000 largest publicly traded U.S. companies, based on total market capitalization) with higher price-to-book ratios and higher forecasted growth values.
The Russell 2000® Value Index measures the performance of those Russell 2000 Index companies (the 2,000 smallest of the 3,000 largest publicly traded U.S. companies, based on total market capitalization) with lower price-to-book ratios and lower forecasted growth values.
The Russell Midcap® Index measures the performance of the 800 smallest of the 1,000 largest publicly traded U.S. companies, based on total market capitalization.
The Russell Midcap® Growth Index measures the performance of those Russell Midcap Index companies (the 800 smallest of the 1,000 largest publicly traded U.S. companies, based on total market capitalization) with higher price-to-book ratios and higher forecasted growth values.
The Russell Midcap® Value Index measures the performance of those Russell Midcap Index companies (the 800 smallest of the 1,000 largest publicly traded U.S. companies, based on total market capitalization) with lower price-to-book ratios and lower forecasted growth values.
55
56

| |
| |
| Contact Us | |
| americancentury.com | |
| Automated Information Line | 1-800-345-8765 |
| Investor Services Representative | 1-800-345-2021 or |
| | 816-531-5575 |
| Business, Not-For-Profit, Employer-Sponsored | |
| Retirement Plans | 1-800-345-3533 |
| Banks and Trust Companies, Broker-Dealers, | |
| Financial Professionals, Insurance Companies | 1-800-345-6488 |
| Telecommunications Device for the Deaf | 1-800-634-4113 |
| American Century Mutual Funds, Inc. | |
| Investment Advisor: | |
| American Century Investment Management, Inc. | |
| Kansas City, Missouri | |
This report and the statements it contains are submitted for the general
information of our shareholders. The report is not authorized for distribution to
prospective investors unless preceded or accompanied by an effective prospectus.
American Century Investment Services, Inc., Distributor
©2009 American Century Proprietary Holdings, Inc. All rights reserved.
0912 CL-ANN-67036N
|
| Annual Report |
| October 31, 2009 |

|
| American Century Investments |
Giftrust® Fund
| |
| President’s Letter | 2 |
| Independent Chairman’s Letter | 3 |
| Market Perspective | 4 |
| U.S. Stock Index Returns | 4 |
| |
| Giftrust | |
| |
| Performance | 5 |
| Portfolio Commentary | 7 |
| Top Ten Holdings | 9 |
| Top Five Industries | 9 |
| Types of Investments in Portfolio | 9 |
| |
| Shareholder Fee Example | 10 |
| |
| Financial Statements | |
| |
| Schedule of Investments | 12 |
| Statement of Assets and Liabilities | 15 |
| Statement of Operations | 16 |
| Statement of Changes in Net Assets | 17 |
| Notes to Financial Statements | 18 |
| Financial Highlights | 24 |
| Report of Independent Registered Public Accounting Firm | 25 |
| |
| Other Information | |
| |
| Management | 26 |
| Approval of Management Agreement | 29 |
| Additional Information | 34 |
| Index Definitions | 35 |
The opinions expressed in the Market Perspective and the Portfolio Commentary reflect those of the portfolio management team as of the date of the report, and do not necessarily represent the opinions of American Century Investments or any other person in the American Century Investments organization. Any such opinions are subject to change at any time based upon market or other conditions and American Century Investments disclaims any responsibility to update such opinions. These opinions may not be relied upon as investment advice and, because investment decisions made by American Century Investments funds are based on numerous factors, may not be relied upon as an indication of trading intent on behalf of any American Century Investments fund. Security examples are used for representational purposes only and are not intended as recommendations to purchase or sell securities. Performance information for comparative i ndices and securities is provided to American Century Investments by third party vendors. To the best of American Century Investments’ knowledge, such information is accurate at the time of printing.

Dear Investor:
Thank you for taking time to review the following pages, which provide the perfor mance of your investment along with the perspectives of our experienced portfolio management team for the financial reporting period ended October 31, 2009. We appreciate your trust in American Century Investments® at this volatile, transitional time in the economy and investment markets.
As the upheavals associated with the “Great Recession” gradually subside, our senior management team has put considerable thought into how the investment environment has changed and what new challenges and opportunities await us. Critical factors that we are anticipating in the coming year include marked shifts in investment and spending behavior, along with consolidation in our industry.
Most importantly, we think the economic recovery will be slow and extended. The economy and capital markets have come a long way since Lehman Brothers collapsed in the third quarter of 2008, but 2010 will likely bring continuing challenges. The stock market’s rebound since last March and the third-quarter economic surge in 2009 were fueled largely by corporate cost-cutting and unprecedented monetary and fiscal stimulus, including some key programs that have since expired or been scaled back.
Meanwhile, the resilient but struggling consumer sector still faces double-digit unemployment, heavy debt burdens, tight credit conditions, and a housing market that is starting to stabilize, but remains vulnerable. Much of our investment positioning in 2009 cautiously reflected these still unstable economic fundamentals, leading to underperformance, in some cases, versus market benchmarks buoyed by the rally of riskier assets. We still support our fundamentally based positioning because we believe strongly that some markets—driven more by technical factors than fundamentals—have advanced further than underlying economic conditions warrant, and remain susceptible to the possibility of more volatility ahead.
Thank you for your continued confidence in us.
Sincerely,

Jonathan Thomas
President and Chief Executive Officer
American Century Investments
2
|
| Independent Chairman’s Letter |

In my first letter to shareholders of the American Century Investments funds, I invited you to contact me with your questions. I have been gratified with your response. Most shareholder inquiries to date have related to specific fund performance issues. As I noted in my individual responses, your board through the Fund Performance Committee continues to stress improved performance in our quarterly meetings with chief investment officers and fund managers.
An important part of our fund performance review process is a face-to-face meeting with portfolio managers. The board traveled during the second quarter to the American Century Investments office in Mountain View, California to meet with the fund of funds and asset allocation portfolio management teams. These meetings validated the importance of thorough reviews of investment opportunities by the credit management personnel resident in that office. As a result of their efforts, American Century Investments funds were able to avoid the “toxic assets” that plagued many other fund families in 2008.
From April through June 2009, the board conducted its annual review of the advisory contracts between American Century Investments and each fund. Our efforts involved a review of fund information, including assets under management; total expense ratio compared to peers; economies of scale; fee breakpoints that reduce shareholder costs as assets increase; performance compared to peers and benchmarks; and the quality of services provided to fund shareholders. A detailed discussion of board considerations in connection with advisory contract renewal is included annually in each fund’s shareholder reports. During this review, the board focuses on a detailed comparison of the competitive position of each fund and has negotiated more than 60 breakpoints or fee reductions in the past five years.
The board looks forward to another year of work on your behalf and your comments are appreciated. You are invited to email me at dhpratt@fundboardchair.com.

3

By Enrique Chang, Chief Investment Officer, American Century Investments
Signs of Economic Recovery Boosted Stocks
The year ended October 31, 2009, was a period of extremes for the U.S. stock market. The market began the period in the midst of a historically steep decline, then finished the period with one of its strongest rallies since the 1930s. The market’s dramatic swings resulted from rapidly shifting expectations regarding the economic and financial environment.
Stocks fell sharply in late 2008 and early 2009 as investors grew increasingly concerned about a deep economic downturn and a lack of liquidity in the credit markets. In response, the federal government took unprecedented actions to shore up the credit sector, support the housing market, and revive the stalled economy.
These efforts began to bear fruit in the spring of 2009 as signs of economic stabilization emerged. Although the unemployment rate continued to climb, reaching a 26-year high of 10.2% by October, the broader economy showed evidence of improvement, producing real growth in the third quarter of 2009—the first positive quarterly growth in more than a year. In addition, cost-management efforts at many companies helped generate better-than-expected earnings in the second and third quarters.
As a result, the equity market reached a multi-year low on March 9 and then reversed course, rising steadily throughout the last seven months of the period. The rally helped erase the market’s earlier losses, enabling the major stock indexes to produce gains of approximately 10% overall. Growth stocks outperformed value shares by a wide margin (see the table below) across all market capitalizations, though they lagged modestly over the last six months.
Economic Challenges Remain
Although recent economic trends have been encouraging, the recovery will likely be gradual until there is sustained improvement in the delinquency levels of consumer debt and the unemployment rate. Thus far, the U.S. consumer has been conspicuously absent from the recovery, and given the weakness in the U.S. dollar and improving economic conditions elsewhere in the world, we may see an export-led recovery until the consumer gets back on firmer footing.
| | | | |
| U.S. Stock Index Returns | | | | |
| For the 12 months ended October 31, 2009 | | | |
| Russell 1000 Index (Large-Cap) | 11.20% | | Russell 2000 Index (Small-Cap) | 6.46% |
| Russell 1000 Growth Index | 17.51% | | Russell 2000 Growth Index | 11.34% |
| Russell 1000 Value Index | 4.78% | | Russell 2000 Value Index | 1.96% |
| Russell Midcap Index | 18.75% | | | |
| Russell Midcap Growth Index | 22.48% | | | |
| Russell Midcap Value Index | 14.52% | | | |
4
| | | | | | |
| Giftrust | | | | | |
| |
| Total Returns as of October 31, 2009 | | | | |
| | | | Average Annual Returns | |
| | | | | | Since | Inception |
| | | 1 year | 5 years | 10 years | Inception | Date |
| Giftrust | 9.72% | 8.67% | 0.60%(1) | 10.78% | 11/25/83 |
| Russell 3000 Growth Index(2)(3) | 17.04% | 1.26% | -3.14% | 8.62%(4) | — |
| Russell Midcap Growth Index(3) | 22.48% | 2.22% | 1.01% | —(5) | — |
| (1) | Returns would have been lower if management fees had not been waived from 2/1/04 to 7/31/04. | | |
| (2) | Effective March 1, 2009, the fund’s benchmark changed from the Russell Midcap Growth Index to the Russell 3000 Growth Index. The |
| | investment strategy was changed to include stocks of companies of all sizes, resulting in an expanded investment universe. | |
| (3) | Data provided by Lipper Inc. – A Reuters Company. © 2009 Reuters. All rights reserved. Any copying, republication or redistribution of Lipper |
| | content, including by caching, framing or similar means, is expressly prohibited without the prior written consent of Lipper. Lipper shall not be |
| | liable for any errors or delays in the content, or for any actions taken in reliance thereon. | | | |
| | The data contained herein has been obtained from company reports, financial reporting services, periodicals and other resources believed to be |
| | reliable. Although carefully verified, data on compilations is not guaranteed by Lipper and may be incomplete. No offer or solicitations to buy or |
| | sell any of the securities herein is being made by Lipper. | | | | |
| (4) | Since 11/30/83, the date nearest the fund’s inception. | | | | |
| (5) | Benchmark began 12/31/85. | | | | | |
Data presented reflect past performance. Past performance is no guarantee of future results. Current performance may be higher or lower than the performance shown. Investment return and principal value will fluctuate, and redemption value may be more or less than original cost. To obtain performance data current to the most recent month end, please call 1-800-345-2021 or visit americancentury.com. The fund’s investment process may result in high portfolio turnover, high commission costs and high capital gains distributions. In addition, its investment approach may involve higher volatility and risk. International investing involves special risks, such as political instability and currency fluctuations. Investing in emerging markets may accentuate those risks.
Data assumes reinvestment of dividends and capital gains, and none of the charts reflect the deduction of taxes that a shareholder would pay on fund distributions or the redemption of fund shares. Returns for the indices are provided for comparison. The fund’s total returns include operating expenses (such as transaction costs and management fees) that reduce returns, while the total returns of the indices do not.
5
Giftrust
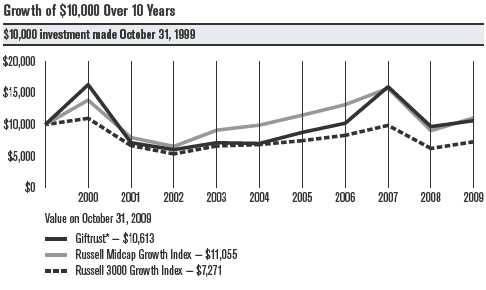
| | | | | | | | | | | |
| One-Year Returns Over 10 Years | | | | | | | |
| Periods ended October 31 | | | | | | | | | |
| | | 2000 | 2001 | 2002 | 2003 | 2004 | 2005 | 2006 | 2007 | 2008 | 2009 |
| Giftrust | | 63.10% | -56.36% | -15.38% | 18.18% | -1.64%* | 25.13% | 16.49% | 56.63% | -39.49% | 9.72% |
| Russell 3000 | | | | | | | | | | |
| Growth Index | 9.81% | -39.34% | -19.72% | 23.36% | 3.54% | 8.99% | 11.39% | 19.00% | -37.04% | 17.04% |
| Russell Midcap | | | | | | | | | | |
| Growth Index | 38.67% | -42.78% | -17.61% | 39.30% | 8.77% | 15.91% | 14.51% | 19.72% | -42.65% | 22.48% |
| *Returns would have been lower, along with the ending value, if management fees had not been waived from 2/1/04 to 7/31/04. | |
| | | | | | | | | | | |
| |
| Total Annual Fund Operating Expenses | | | | | | |
| Giftrust | 1.00% | | | | | | | | | |
The total annual fund operating expenses shown is as stated in the fund’s prospectus current as of the date of this report. The prospectus may vary from the expense ratio shown elsewhere in this report because it is based on a different time period, includes acquired fund fees and expenses, and, if applicable, does not include fee waivers or expense reimbursements.
Data presented reflect past performance. Past performance is no guarantee of future results. Current performance may be higher or lower than the performance shown. Investment return and principal value will fluctuate, and redemption value may be more or less than original cost. To obtain performance data current to the most recent month end, please call 1-800-345-2021 or visit americanc entury.com. The fund’s investment process may result in high portfolio turnover, high commission costs and high capital gains distributions. In addition, its investment approach may involve higher volatility and risk. International investing involves special risks, such as political instability and currency fluctuations. Investing in emerging markets may accentuate those risks.
Data assumes reinvestment of dividends and capital gains, and none of the charts reflect the deduction of taxes that a shareholder would pay on fund distributions or the redemption of fund shares. Returns for the indices are provided for comparison. The fund’s total returns include operating expenses (such as transaction costs and management fees) that reduce returns, while the total returns of the indices do not.
6
Giftrust
Portfolio Managers: David Hollond and Michael Orndorff
Performance Summary
Giftrust returned 9.72% for the 12 months ended October 31, 2009, lagging the 17.04% return of the portfolio’s benchmark, the Russell 3000 Growth Index.
As discussed in the Market Perspective on page 4, equity markets continued to struggle during the first half of the reporting period amid extreme volatility and recession. After dipping to multi-year lows on March 9, 2009, markets responded positively to generally improving economic data and rallied soundly, erasing losses sustained early in the reporting period. However, earnings and revenue acceleration and relative price strength, key factors that the Giftrust team looks for in candidates for the portfolio, were not rewarded during this rally. Instead, as investors increased their appetite for risk, lower-quality stocks that were laggards in previous reporting periods led the market.
The portfolio’s relative performance was hindered most by holdings in the health care sector, as well as by overweight allocation and stock selection in industrial stocks. Stock selection among energy companies, combined with an underweight position in the sector, also weighed on relative performance, as did a larger-than-the-benchmark stake in the financials sector. Partially offsetting those losses, investments in the telecommunications services sector, as well as stock selection among information technology businesses, contributed to relative returns.
Health Care, Industrials Detracted
The health care sector was the largest source of underperformance against the benchmark, the result of overweight positions in biotechnology companies, including Celgene Corp. and Gilead Sciences Inc. Concerns about the potential for generic competition in the biotechnology industry to disrupt growth prospects weighed on biotech stocks in general. Elsewhere, in pharmaceuticals, Giftrust did not own Schering-Plough, which benefited from being a takeover target of Merck.
Within the industrials sector, Giftrust maintained overweight positions in railroad companies, including Norfolk Southern Corp. This industry had experienced improving fundamentals as higher fuel prices created an advantage for the more fuel-efficient railroads versus trucking companies, and as coal shipments continued to increase. However, the abrupt decline in business activity during the period caused rail car shipments to decline and these positions ended up underperforming the benchmark. Elsewhere in the sector, the portfolio’s investments in companies involved in construction and engineering also lagged in relative terms.
7
Giftrust
Energy, Financials Lagged
Although Giftrust held overweight stakes in several companies in the oil, gas, and consumable fuels group that enjoyed strong gains during the entire reporting period, their returns were weaker for the shorter time that they were held in the portfolio.
Investments in financials also trimmed portfolio returns. An overweight position in insurance dampened performance as investors migrated from this defensive group toward riskier areas of the market. Partially offsetting this underperformance was an overweight position in the capital markets industry. Morgan Stanley and Goldman Sachs, which benefited from increased financial activity and reduced competition, significantly outperformed the benchmark.
Telecommunications, Information Technology Services Helped
Giftrust’s overweight position in the telecommunications services sector reflected an ongoing focus on wireless telecommunications companies. The group has contributed to the portfolio’s past performance and continued to benefit returns, led by SBA Communications.
Within information technology, Giftrust was rewarded for overweight positions in the semiconductor group, including chip-maker Broadcom Corp. and integrated circuit manufacturer Marvell Technology Group. Both companies quickly reduced inventory into the economic downturn and benefited when demand for consumer technology products came back faster and stronger than the market anticipated. Marvell’s share price nearly doubled during the period as it announced cost cuts, delivered earnings in excess of analysts’ estimates, and raised forward earnings guidance well above analyst expectations. In computers and peripherals, Apple Inc. benefited portfolio returns as the company continued to introduce consumer-related products that were well received. The iPhone, in particular, has been a significant contributor to Apple’s growth. While Apple only recently entered the cell phone business, they have quickly gained marke t share within the rapidly expanding smartphone segment of the market.
Outlook
Giftrust’s investment mandate has been changed to include stocks of companies of all sizes, resulting in an expanded investment universe. In line with this, in March 2009, the fund’s benchmark changed from the Russell Midcap Growth Index to the Russell 3000 Growth Index. The portfolio’s investment approach has not changed. Giftrust will continue its investment focus on companies with accelerating revenue and earnings growth rates that are also exhibiting share-price strength. We believe that active investing in such companies will generate attractive absolute and relative investment performance over time. Despite the present difficult environment for this discipline, we remain focused on implementing our time-tested process.
8
| | |
| Giftrust | | |
| |
| Top Ten Holdings as of October 31, 2009 | | |
| | % of net assets | % of net assets |
| | as of 10/31/09 | as of 4/30/09 |
| Apple, Inc. | 5.5% | 4.2% |
| Google, Inc., Class A | 3.9% | 3.1% |
| Microsoft Corp. | 3.8% | 3.0% |
| Hewlett-Packard Co. | 2.7% | 1.8% |
| Costco Wholesale Corp. | 2.5% | — |
| Abbott Laboratories | 2.4% | 2.0% |
| Cisco Systems, Inc. | 2.4% | 2.7% |
| Philip Morris International, Inc. | 2.3% | 1.5% |
| Medco Health Solutions, Inc. | 1.9% | 1.7% |
| Goldman Sachs Group, Inc. (The) | 1.9% | 0.5% |
| |
| Top Five Industries as of October 31, 2009 | | |
| | % of net assets | % of net assets |
| | as of 10/31/09 | as of 4/30/09 |
| Computers & Peripherals | 10.6% | 6.6% |
| Food & Staples Retailing | 6.4% | 4.7% |
| Software | 6.3% | 5.3% |
| Internet Software & Services | 5.7% | 3.8% |
| Communications Equipment | 5.3% | 6.5% |
| |
| Types of Investments in Portfolio | | |
| | % of net assets | % of net assets |
| | as of 10/31/09 | as of 4/30/09 |
| Domestic Common Stocks | 92.0% | 94.1% |
| Foreign Common Stocks* | 8.0% | 5.7% |
| Total Common Stocks | 100.0% | 99.8% |
| Temporary Cash Investments | 0.3% | 0.1% |
| Other Assets and Liabilities | (0.3)% | 0.1% |
| *Includes depositary shares, dual listed securities and foreign ordinary shares. | | |
9
|
| Shareholder Fee Example (Unaudited) |
Fund shareholders may incur two types of costs: (1) transaction costs, including sales charges (loads) on purchase payments and redemption/ exchange fees; and (2) ongoing costs, including management fees; distribution and service (12b-1) fees; and other fund expenses. This example is intended to help you understand your ongoing costs (in dollars) of investing in your fund and to compare these costs with the ongoing cost of investing in other mutual funds.
The example is based on an investment of $1,000 made at the beginning of the period and held for the entire period from May 1, 2009 to October 31, 2009.
Actual Expenses
The table provides information about actual account values and actual expenses for each class. You may use the information, together with the amount you invested, to estimate the expenses that you paid over the period. First, identify the share class you own. Then simply divide your account value by $1,000 (for example, an $8,600 account value divided by $1,000 = 8.6), then multiply the result by the number under the heading “Expenses Paid During Period” to estimate the expenses you paid on your account during this period.
If you hold Investor Class shares of any American Century Investments fund, or Institutional Class shares of the American Century Diversified Bond Fund, in an American Century Investments account (i.e., not a financial intermediary or retirement plan account), American Century Investments may charge you a $12.50 semiannual account maintenance fee if the value of those shares is less than $10,000. We will redeem shares automatically in one of your accounts to pay the $12.50 fee. In determining your total eligible investment amount, we will include your investments in all personal accounts (including American Century Investments Brokerage accounts) registered under your Social Security number. Personal accounts include individual accounts, joint accounts, UGMA/UTMA accounts, personal trusts, Coverdell Education Savings Accounts and IRAs (including traditional, Roth, Rollover, SEP-, SARSEP- and SIMPLE-IRAs), and certain other retirement accounts. If you have only business, business retirement, employer-sponsored or American Century Investments Brokerage accounts, you are currently not subject to this fee. We will not charge the fee as long as you choose to manage your accounts exclusively online. If you are subject to the Account Maintenance Fee, your account value could be reduced by the fee amount.
10
Hypothetical Example for Comparison Purposes
The table also provides information about hypothetical account values and hypothetical expenses based on the actual expense ratio of each class of your fund and an assumed rate of return of 5% per year before expenses, which is not the actual return of a fund’s share class. The hypothetical account values and expenses may not be used to estimate the actual ending account balance or expenses you paid for the period. You may use this information to compare the ongoing costs of investing in your fund and other funds. To do so, compare this 5% hypothetical example with the 5% hypothetical examples that appear in the shareholder reports of the other funds.
Please note that the expenses shown in the table are meant to highlight your ongoing costs only and do not reflect any transactional costs, such as sales charges (loads) or redemption/exchange fees. Therefore, the table is useful in comparing ongoing costs only, and will not help you determine the relative total costs of owning different funds. In addition, if these transactional costs were included, your costs would have been higher.
| | | | |
| | Beginning | Ending | Expenses Paid | |
| | Account Value | Account Value | During Period* | Annualized |
| | 5/1/09 | 10/31/09 | 5/1/09 - 10/31/09 | Expense Ratio* |
| Actual | $1,000 | $1,172.60 | $5.48 | 1.00% |
| Hypothetical | $1,000 | $1,020.16 | $5.09 | 1.00% |
| *Expenses are equal to the fund’s annualized expense ratio listed in the table above, multiplied by the average account value over the period, |
| multiplied by 184, the number of days in the most recent fiscal half-year, divided by 365, to reflect the one-half year period. |
11
| | | | | | |
| Giftrust | | | | | | |
| |
| OCTOBER 31, 2009 | | | | | | |
| | Shares | Value | | | Shares | Value |
| Common Stocks — 100.0% | | | CONSUMER FINANCE — 0.7% | | |
| AEROSPACE & DEFENSE — 1.7% | | | Discover Financial Services | 408,210 | $ 5,772,089 |
| Honeywell International, Inc. | 117,371 | $ 4,212,445 | | CONTAINERS & PACKAGING — 0.5% | |
| | | | | Crown Holdings, Inc.(1) | 165,670 | 4,415,106 |
| United Technologies Corp. | 163,677 | 10,057,952 | | | | |
| | | 14,270,397 | | DIVERSIFIED CONSUMER SERVICES — 0.3% | |
| AUTOMOBILES — 0.6% | | | | Career Education Corp.(1) | 109,297 | 2,277,749 |
| Dongfeng Motor Group Co. | | | | DIVERSIFIED FINANCIAL SERVICES — 1.3% | |
| Ltd. H Shares | 4,004,000 | 4,747,848 | | Bank of America Corp. | 428,097 | 6,241,654 |
| BIOTECHNOLOGY — 4.0% | | | | JPMorgan Chase & Co. | 115,878 | 4,840,224 |
| Alexion | | | | | | 11,081,878 |
| Pharmaceuticals, Inc.(1) | 84,579 | 3,756,153 | | ELECTRICAL EQUIPMENT — 0.8% | |
| Amgen, Inc.(1) | 58,158 | 3,124,829 | | Cooper Industries plc, | | |
| Celgene Corp.(1) | 270,139 | 13,790,596 | | Class A | 171,718 | 6,643,769 |
| Gilead Sciences, Inc.(1) | 198,135 | 8,430,644 | | ELECTRONIC EQUIPMENT, INSTRUMENTS | |
| Talecris Biotherapeutics | | | | & COMPONENTS — 0.6% | | |
| Holdings Corp.(1) | 214,909 | 4,311,075 | | Agilent Technologies, Inc.(1) | 205,359 | 5,080,582 |
| | | 33,413,297 | | ENERGY EQUIPMENT & SERVICES — 0.3% | |
| CAPITAL MARKETS — 3.3% | | | | Schlumberger Ltd. | 42,724 | 2,657,433 |
| Affiliated Managers | | | | FOOD & STAPLES RETAILING — 6.4% | |
| Group, Inc.(1) | 62,569 | 3,972,506 | | Costco Wholesale Corp. | 368,058 | 20,924,097 |
| Goldman Sachs | | | | CVS Caremark Corp. | 141,013 | 4,977,759 |
| Group, Inc. (The) | 91,078 | 15,498,743 | | Walgreen Co. | 391,372 | 14,805,603 |
| Morgan Stanley | 241,073 | 7,743,265 | | Whole Foods Market, Inc.(1) | 408,594 | 13,099,524 |
| | | 27,214,514 | | | | 53,806,983 |
| CHEMICALS — 1.2% | | | | FOOD PRODUCTS — 0.5% | | |
| Ecolab, Inc. | 149,842 | 6,587,054 | | General Mills, Inc. | 68,193 | 4,495,283 |
| Monsanto Co. | 50,591 | 3,398,704 | | HEALTH CARE EQUIPMENT & SUPPLIES — 2.9% |
| | | 9,985,758 | | Baxter International, Inc. | 184,933 | 9,997,478 |
| COMMERCIAL BANKS — 0.7% | | | | Beckman Coulter, Inc. | 61,032 | 3,926,189 |
| Wells Fargo & Co. | 221,257 | 6,088,993 | | Covidien plc | 146,934 | 6,188,860 |
| COMMUNICATIONS EQUIPMENT — 5.3% | | | ev3, Inc.(1) | 353,766 | 4,167,363 |
| ADTRAN, Inc. | 175,601 | 4,045,847 | | | | 24,279,890 |
| Cisco Systems, Inc.(1) | 885,107 | 20,224,695 | | HEALTH CARE PROVIDERS & SERVICES — 4.9% |
| F5 Networks, Inc.(1) | 147,981 | 6,642,867 | | Express Scripts, Inc.(1) | 162,036 | 12,949,917 |
| Juniper Networks, Inc.(1) | 146,204 | 3,729,664 | | Health Management | | |
| QUALCOMM, Inc. | 232,867 | 9,643,023 | | Associates, Inc., Class A(1) | 693,952 | 4,233,107 |
| | | 44,286,096 | | Medco Health | | |
| COMPUTERS & PERIPHERALS — 10.6% | | | Solutions, Inc.(1) | 279,899 | 15,707,932 |
| Apple, Inc.(1) | 243,187 | 45,840,750 | | Tenet Healthcare Corp.(1) | 1,668,873 | 8,544,630 |
| EMC Corp.(1) | 575,039 | 9,470,892 | | | | 41,435,586 |
| Hewlett-Packard Co. | 472,371 | 22,418,728 | | HEALTH CARE TECHNOLOGY — 0.5% | |
| Seagate Technology | 571,912 | 7,978,172 | | athenahealth, Inc.(1) | 112,267 | 4,222,362 |
| STEC, Inc.(1) | 145,003 | 3,091,464 | | | | |
| | | 88,800,006 | | | | |
12
| | | | | | |
| Giftrust | | | | | | |
| | Shares | Value | | | Shares | Value |
| HOTELS, RESTAURANTS & LEISURE — 2.7% | | | MULTILINE RETAIL — 3.0% | | |
| Ctrip.com International | | | | J.C. Penney Co., Inc. | 301,563 | $ 9,990,782 |
| Ltd. ADR(1) | 85,317 | $ 4,567,872 | | Kohl’s Corp.(1) | 260,042 | 14,879,603 |
| Las Vegas Sands Corp.(1) | 539,713 | 8,144,269 | | | | 24,870,385 |
| Starbucks Corp.(1) | 303,472 | 5,759,899 | | OIL, GAS & CONSUMABLE FUELS — 3.5% | |
| Starwood Hotels & Resorts | | | | Petrohawk Energy Corp.(1) | 656,974 | 15,452,028 |
| Worldwide, Inc. | 147,459 | 4,285,158 | | Petroleo Brasileiro SA- | | |
| | | 22,757,198 | | Petrobras ADR | 227,144 | 10,498,596 |
| HOUSEHOLD PRODUCTS — 1.0% | | | Quicksilver Resources, Inc.(1) | 273,488 | 3,336,554 |
| Colgate-Palmolive Co. | 102,750 | 8,079,232 | | | | 29,287,178 |
| INSURANCE — 0.8% | | | | PERSONAL PRODUCTS — 0.6% | |
| Aflac, Inc. | 75,592 | 3,136,312 | | Mead Johnson Nutrition Co., | | |
| Genworth Financial, Inc., | | | | Class A | 119,775 | 5,035,341 |
| Class A(1) | 359,802 | 3,821,097 | | PHARMACEUTICALS — 2.5% | | |
| | | 6,957,409 | | Abbott Laboratories | 405,721 | 20,517,311 |
| INTERNET & CATALOG RETAIL — 0.7% | | | PROFESSIONAL SERVICES — 0.5% | |
| priceline.com, Inc.(1) | 38,195 | 6,026,789 | | Manpower, Inc. | 83,460 | 3,956,839 |
| INTERNET SOFTWARE & SERVICES — 5.7% | | | ROAD & RAIL — 2.3% | | |
| Equinix, Inc.(1) | 53,554 | 4,569,227 | | J.B. Hunt Transport | | |
| Google, Inc., Class A(1) | 61,554 | 33,000,330 | | Services, Inc. | 141,704 | 4,259,622 |
| MercadoLibre, Inc.(1) | 98,520 | 3,526,031 | | Kansas City Southern(1) | 255,685 | 6,195,248 |
| Tencent Holdings Ltd. | 395,300 | 6,898,856 | | Railamerica, Inc.(1) | 188,458 | 2,218,151 |
| | | 47,994,444 | | Union Pacific Corp. | 121,168 | 6,681,203 |
| IT SERVICES — 3.5% | | | | | | 19,354,224 |
| Cognizant Technology | | | | SEMICONDUCTORS & SEMICONDUCTOR | |
| Solutions Corp., Class A(1) | 143,387 | 5,541,908 | | EQUIPMENT — 3.9% | | |
| Global Payments, Inc. | 104,423 | 5,140,744 | | Analog Devices, Inc. | 170,803 | 4,377,681 |
| MasterCard, Inc., Class A | 26,291 | 5,758,255 | | Atheros | | |
| Visa, Inc., Class A | 171,495 | 12,992,461 | | Communications, Inc.(1) | 155,250 | 3,822,255 |
| | | 29,433,368 | | Broadcom Corp., Class A(1) | 221,658 | 5,898,319 |
| LIFE SCIENCES TOOLS & SERVICES — 1.1% | | | NVIDIA Corp.(1) | 339,231 | 4,057,203 |
| Life Technologies Corp.(1) | 192,010 | 9,057,112 | | Teradyne, Inc.(1) | 489,793 | 4,099,567 |
| MACHINERY — 2.8% | | | | Texas Instruments, Inc. | 287,411 | 6,739,788 |
| Bucyrus International, Inc. | 57,039 | 2,533,672 | | Varian Semiconductor | | |
| | | | | Equipment Associates, Inc.(1) | 127,794 | 3,628,072 |
| Cummins, Inc. | 95,819 | 4,125,966 | | | | |
| Flowserve Corp. | 40,115 | 3,939,694 | | | | 32,622,885 |
| Hitachi Construction | | | | SOFTWARE — 6.3% | | |
| Machinery Co. Ltd. | 194,100 | 4,503,230 | | Adobe Systems, Inc.(1) | 134,162 | 4,419,296 |
| Ingersoll-Rand plc | 270,625 | 8,549,044 | | Citrix Systems, Inc.(1) | 162,878 | 5,987,396 |
| | | 23,651,606 | | Microsoft Corp. | 1,153,633 | 31,990,243 |
| METALS & MINING — 2.9% | | | | Oracle Corp. | 509,571 | 10,751,948 |
| AK Steel Holding Corp. | 259,403 | 4,116,726 | | | | 53,148,883 |
| Cliffs Natural Resources, Inc. | 359,098 | 12,773,116 | | | | |
| Vale SA ADR | 131,274 | 3,346,174 | | | | |
| Walter Energy, Inc. | 68,123 | 3,985,195 | | | | |
| | | 24,221,211 | | | | |
13
| | | | | | |
| Giftrust | | | | | | |
| | Shares | Value | | | Shares | Value |
| SPECIALTY RETAIL — 3.2% | | | | Temporary Cash Investments — 0.3% |
| Chico’s FAS, Inc.(1) | 698,536 | $ 8,347,505 | | | | |
| | | | | JPMorgan U.S. Treasury | | |
| Dick’s Sporting Goods, Inc.(1) | 210,048 | 4,765,989 | | Plus Money Market Fund | | |
| Gymboree Corp.(1) | 93,980 | 4,000,729 | | Agency Shares | 43,039 | $ 43,039 |
| J. Crew Group, Inc.(1) | 82,996 | 3,384,577 | | Repurchase Agreement, Bank of | | |
| O’Reilly Automotive, Inc.(1) | 171,117 | 6,379,242 | | America Securities, LLC, (collateralized | |
| | | | | by various U.S. Treasury obligations, | |
| | | 26,878,042 | | 1.875%-3.625%, 7/15/13-4/15/28, | |
| TEXTILES, APPAREL & LUXURY GOODS — 1.2% | | valued at $2,057,139), in a joint | | |
| Fuqi International, Inc.(1) | 158,542 | 3,248,526 | | trading account at 0.05%, | | |
| | | | | dated 10/30/09, due 11/2/09 | | |
| Warnaco Group, Inc. (The)(1) | 168,121 | 6,813,944 | | (Delivery value $2,000,008) | | 2,000,000 |
| | | 10,062,470 | | TOTAL TEMPORARY | | |
| TOBACCO — 2.8% | | | | CASH INVESTMENTS | | |
| Altria Group, Inc. | 246,406 | 4,462,413 | | (Cost $2,043,039) | | 2,043,039 |
| Philip Morris | | | | TOTAL INVESTMENT | | |
| International, Inc. | 404,384 | 19,151,626 | | SECURITIES — 100.3% | | |
| | | 23,614,039 | | (Cost $665,652,534) | | 840,212,504 |
| | | | | OTHER ASSETS | | |
| TRADING COMPANIES & DISTRIBUTORS — 0.5% | | AND LIABILITIES — (0.3)% | | (2,373,083) |
| Fastenal Co. | 126,799 | 4,374,565 | | TOTAL NET ASSETS — 100.0% | | $837,839,421 |
| WIRELESS TELECOMMUNICATION SERVICES — 1.4% | | | | |
| Millicom International | | | | | | |
| Cellular SA(1) | 57,194 | 3,583,776 | | | | |
| SBA Communications Corp., | | | | | | |
| Class A(1) | 273,291 | 7,709,539 | | | | |
| | | 11,293,315 | | | | |
| TOTAL COMMON STOCKS | | | | | | |
| (Cost $663,609,495) | | 838,169,465 | | | | |
| | | |
| Forward Foreign Currency Exchange Contracts | | |
| Contracts to Sell | Settlement Date | Value | Unrealized Gain (Loss) |
| 222,244,500 JPY for USD | 11/30/09 | $2,469,313 | $(29,425) |
| (Value on Settlement Date $2,439,888) | | | |
| |
| Notes to Schedule of Investments | | |
| ADR = American Depositary Receipt | | | |
| JPY = Japanese Yen | | | |
| USD = United States Dollar | | | |
| (1) Non-income producing. | | | |
| |
| Industry classifications are unaudited. | | | |
| |
| |
| See Notes to Financial Statements. | | | |
14
|
| Statement of Assets and Liabilities |
| |
| OCTOBER 31, 2009 | |
| Assets | |
| Investment securities, at value (cost of $665,652,534) | $840,212,504 |
| Cash | 6,618 |
| Receivable for investments sold | 13,431,254 |
| Receivable for capital shares sold | 25,307 |
| Dividends and interest receivable | 612,495 |
| | 854,288,178 |
| | |
| Liabilities | |
| Payable for investments purchased | 15,571,762 |
| Payable for capital shares redeemed | 104,022 |
| Payable for forward foreign currency exchange contracts | 29,425 |
| Accrued management fees | 743,548 |
| | 16,448,757 |
| | |
| Net Assets | $837,839,421 |
| | |
| Capital Shares, $0.01 Par Value | |
| Authorized | 200,000,000 |
| Outstanding | 40,168,872 |
| | |
| Net Asset Value Per Share | $20.86 |
| | |
| Net Assets Consist of: | |
| Capital (par value and paid-in surplus) | $858,413,764 |
| Undistributed net investment income | 29,425 |
| Accumulated net realized loss on investment and | |
| foreign currency transactions | (195,134,936) |
| Net unrealized appreciation on investments and translation | |
| of assets and liabilities in foreign currencies | 174,531,168 |
| | $837,839,421 |
| |
| |
| See Notes to Financial Statements. | |
15
| |
| YEAR ENDED OCTOBER 31, 2009 | |
| Investment Income (Loss) | |
| Income: | |
| Dividends (net of foreign taxes withheld of $12,020) | $ 8,914,326 |
| Interest | 3,556 |
| | 8,917,882 |
| | |
| Expenses: | |
| Management fees | 7,483,126 |
| Directors’ fees and expenses | 29,315 |
| Other expenses | 1,134 |
| | 7,513,575 |
| | |
| Net investment income (loss) | 1,404,307 |
| | |
| Realized and Unrealized Gain (Loss) | |
| Net realized gain (loss) on: | |
| Investment transactions | (166,421,591) |
| Foreign currency transactions | (1,537,289) |
| | (167,958,880) |
| | |
| Change in net unrealized appreciation (depreciation) on: | |
| Investments | 240,300,977 |
| Translation of assets and liabilities in foreign currencies | (540,477) |
| | 239,760,500 |
| | |
| Net realized and unrealized gain (loss) | 71,801,620 |
| | |
| Net Increase (Decrease) in Net Assets Resulting from Operations | $73,205,927 |
| |
| |
| See Notes to Financial Statements. | |
16
|
| Statement of Changes in Net Assets |
| | |
| YEARS ENDED OCTOBER 31, 2009 AND OCTOBER 31, 2008 | | |
| Increase (Decrease) in Net Assets | 2009 | 2008 |
| Operations | | |
| Net investment income (loss) | $ 1,404,307 | $ (5,838,494) |
| Net realized gain (loss) | (167,958,880) | (13,344,342) |
| Change in net unrealized appreciation (depreciation) | 239,760,500 | (515,303,606) |
| Net increase (decrease) in net assets resulting from operations | 73,205,927 | (534,486,442) |
| | | |
| Distributions to Shareholders | | |
| From net investment income | (2,424,540) | — |
| | | |
| Capital Share Transactions | | |
| Proceeds from shares sold | 6,747,149 | 10,453,508 |
| Proceeds from reinvestment of distributions | 2,404,219 | — |
| Payments for shares redeemed | (45,864,082) | (93,410,238) |
| Net increase (decrease) in net assets from capital share transactions | (36,712,714) | (82,956,730) |
| | | |
| Net increase (decrease) in net assets | 34,068,673 | (617,443,172) |
| | | |
| Net Assets | | |
| Beginning of period | 803,770,748 | 1,421,213,920 |
| End of period | $837,839,421 | $ 803,770,748 |
| | | |
| Undistributed net investment income | $29,425 | $585,494 |
| | | |
| Transactions in Shares of the Fund | | |
| Sold | 382,429 | 377,995 |
| Issued in reinvestment of distributions | 148,502 | — |
| Redeemed | (2,490,790) | (3,326,738) |
| Net increase (decrease) in shares of the fund | (1,959,859) | (2,948,743) |
| |
| |
| See Notes to Financial Statements. | | |
17
|
| Notes to Financial Statements |
OCTOBER 31, 2009
1. Organization and Summary of Significant Accounting Policies
Organization — American Century Mutual Funds, Inc. (the corporation) is registered under the Investment Company Act of 1940 (the 1940 Act) as an open-end management investment company. Giftrust Fund (the fund) is one fund in a series issued by the corporation. The fund is diversified under the 1940 Act. The fund’s investment objective is to seek long-term capital growth. The fund pursues its objective by investing in equity securities of companies of any size that management believes will increase in value over time. Prior to March 1, 2009, the fund invested primarily in equity securities of medium-sized and smaller companies. The following is a summary of the fund’s significant accounting policies.
Security Valuations — Securities traded primarily on a principal securities exchange are valued at the last reported sales price, or at the mean of the latest bid and asked prices where no last sales price is available. Depending on local convention or regulation, securities traded over-the-counter are valued at the mean of the latest bid and asked prices, the last sales price, or the official close price. Investments in open-end management investment companies are valued at the reported net asset value. Debt securities not traded on a principal securities exchange are valued through a commercial pricing service or at the mean of the most recent bid and asked prices. Securities traded on foreign securities exchanges and over-the-counter markets are normally completed before the close of business on days that the New York Stock Exchange (th e Exchange) is open and may also take place on days when the Exchange is not open. If an event occurs after the value of a security was established but before the net asset value per share was determined that was likely to materially change the net asset value, that security would be valued as determined in accordance with procedures adopted by the Board of Directors. If the fund determines that the market price of a portfolio security is not readily available, or that the valuation methods mentioned above do not reflect the security’s fair value, such security is valued as determined by the Board of Directors or its designee, in accordance with procedures adopted by the Board of Directors, if such determination would materially impact a fund’s net asset value. Certain other circumstances may cause the fund to use alternative procedures to value a security such as: a security has been declared in default; trading in a security has been halted during the trading day; or there is a foreign market hol iday and no trading will commence.
Security Transactions — For financial reporting purposes, security transactions are accounted for as of the trade date. Net realized gains and losses are determined on the identified cost basis, which is also used for federal income tax purposes.
Investment Income — Dividend income less foreign taxes withheld, if any, is recorded as of the ex-dividend date. Interest income is recorded on the accrual basis and includes accretion of discounts and amortization of premiums.
Foreign Currency Translations — All assets and liabilities initially expressed in foreign currencies are translated into U.S. dollars at prevailing exchange rates at period end. The fund may enter into spot foreign currency exchange contracts to facilitate transactions denominated in a foreign currency. Purchases and sales of investment securities, dividend and interest income, spot foreign currency exchange contracts, and certain expenses are translated at the rates of exchange prevailing on the respective dates of such transactions. For assets and liabilities, other than investments in securities, net realized and unrealized gains and losses from foreign currency translations arise from changes in currency exchange rates.
Net realized and unrealized foreign currency exchange gains or losses occurring during the holding period of investment securities are a component of net realized gain (loss) on investment transactions and net unrealized appreciation (depreciation) on investments, respectively. Certain countries may impose taxes on the contract amount of purchases and sales of foreign currency contracts in their currency. The fund records the foreign tax expense, if any, as a reduction to the net realized gain (loss) on foreign currency transactions.
18
Repurchase Agreements — The fund may enter into repurchase agreements with institutions that American Century Investment Management, Inc. (ACIM) (the investment advisor) has determined are creditworthy pursuant to criteria adopted by the Board of Directors. Each repurchase agreement is recorded at cost. The fund requires that the collateral, represented by securities, received in a repurchase transaction be transferred to the custodian in a manner sufficient to enable the fund to obtain those securities in the event of a default under the repurchase agreement. ACIM monitors, on a daily basis, the securities transferred to ensure the value, including accrued interest, of the securities under each repurchase agreement is equal to or greater than amounts owed to the fund under each repurchase agreement.
Joint Trading Account — Pursuant to an Exemptive Order issued by the Securities and Exchange Commission, the fund, along with certain other funds in the American Century Investments family of funds, may transfer uninvested cash balances into a joint trading account. These balances are invested in one or more repurchase agreements that are collateralized by U.S. Treasury or Agency obligations.
Exchange Traded Funds — The fund may invest in exchange traded funds (ETFs). ETFs are a type of index fund bought and sold on a securities exchange. An ETF trades like common stock and represents a fixed portfolio of securities designed to track the performance and dividend yield of a particular domestic or foreign market index. A fund may purchase an ETF to temporarily gain exposure to a portion of the U.S. or a foreign market while awaiting purchase of underlying securities. The risks of owning an ETF generally reflect the risks of owning the underlying securities they are designed to track, although the lack of liquidity on an ETF could result in it being more volatile. Additionally, ETFs have fees and expenses that reduce their value.
Income Tax Status — It is the fund’s policy to distribute substantially all net investment income and net realized gains to shareholders and to otherwise qualify as a regulated investment company under provisions of the Internal Revenue Code. The fund is no longer subject to examination by tax authorities for years prior to 2006. Additionally, non-U.S. tax returns filed by the fund due to investments in certain foreign securities remain subject to examination by the relevant taxing authority for 7 years from the date of filing. At this time, management believes there are no uncertain tax positions which, based on their technical merit, would not be sustained upon examination and for which it is reasonably possible that the total amounts of unrecognized tax benefits will significantly change in the next twelve months. Accordingly, no provision has been made for federal or state income taxes. Interest and penalties associated with any federal or state income tax obligations, if any, are recorded as interest expense.
Distributions to Shareholders — Distributions to shareholders are recorded on the ex-dividend date. Distributions from net investment income and net realized gains, if any, are generally declared and paid annually.
Indemnifications — Under the corporation‘s organizational documents, its officers and directors are indemnified against certain liabilities arising out of the performance of their duties to the fund. In addition, in the normal course of business, the fund enters into contracts that provide general indemnifications. The maximum exposure under these arrangements is unknown as this would involve future claims that may be made against a fund. The risk of material loss from such claims is considered by management to be remote.
Use of Estimates — The financial statements are prepared in conformity with accounting principles generally accepted in the United States of America, which may require management to make certain estimates and assumptions at the date of the financial statements. Actual results could differ from these estimates.
Subsequent Events — Management has evaluated events or transactions that may have occurred since October 31, 2009, that would merit recognition or disclosure in the financial statements. This evaluation was completed through December 28, 2009, the date the financial statements were issued.
19
2. Fees and Transactions with Related Parties
Management Fees — The corporation has entered into a Management Agreement with ACIM, under which ACIM provides the fund with investment advisory and management services in exchange for a single, unified management fee (the fee). The Agreement provides that all expenses of the fund, except brokerage commissions, taxes, interest, fees and expenses of those directors who are not considered “interested persons” as defined in the 1940 Act (including counsel fees) and extraordinary expenses, will be paid by ACIM. The fee is computed and accrued daily based on the daily net assets of the fund and paid monthly in arrears. The annual management fee for the fund is 1.00%.
Related Parties — Certain officers and directors of the corporation are also officers and/or directors, and, as a group, controlling stockholders of American Century Companies, Inc. (ACC), the parent of the corporation’s investment advisor, ACIM, the distributor of the corporation, American Century Investment Services, Inc. and the corporation’s transfer agent, American Century Services, LLC.
The fund is eligible to invest in a money market fund for temporary purposes, which is managed by J.P. Morgan Investment Management, Inc. (JPMIM). The fund has a Mutual Funds Services Agreement with J.P. Morgan Investor Services Co. (JPMIS). JPMorgan Chase Bank (JPMCB) is a custodian of the fund. JPMIM, JPMIS and JPMCB are wholly owned subsidiaries of JPMorgan Chase & Co. (JPM). JPM is an equity investor in ACC.
3. Investment Transactions
Purchases and sales of investment securities, excluding short-term investments, for the year ended October 31, 2009, were $1,256,239,997 and $1,277,427,841, respectively.
4. Fair Value Measurements
The fund’s securities valuation process is based on several considerations and may use multiple inputs to determine the fair value of the positions held by the fund. In conformity with accounting principles generally accepted in the United States of America, the inputs used to determine a valuation are classified into three broad levels as follows:
• Level 1 valuation inputs consist of actual quoted prices in an active market for identical securities;
• Level 2 valuation inputs consist of significant direct or indirect observable market data (including quoted prices for similar securities, evaluations of subsequent market events, interest rates, prepayment speeds, credit risk, etc.); or
• Level 3 valuation inputs consist of significant unobservable inputs (including a fund’s own assumptions).
The level classification is based on the lowest level input that is significant to the fair valuation measurement. The valuation inputs are not an indication of the risks associated with investing in these securities or other financial instruments.
20
The following is a summary of the valuation inputs used to determine the fair value of the fund’s securities and other financial instruments as of October 31, 2009:
| | | |
| | Level 1 | Level 2 | Level 3 |
| Investment Securities | | | |
| Domestic Common Stocks | $770,532,480 | — | — |
| Foreign Common Stocks | 51,487,051 | $16,149,934 | — |
| Temporary Cash Investments | 43,039 | 2,000,000 | — |
| Total Value of Investment Securities | $822,062,570 | $18,149,934 | — |
| | | | |
| Other Financial Instruments | | | |
| Total Unrealized Gain (Loss) on Forward | | | |
| Foreign Currency Exchange Contracts | — | $ (29,425) | — |
5. Derivative Instruments
Foreign Currency Risk — The fund is subject to foreign currency exchange rate risk in the normal course of pursuing its investment objectives. The value of foreign investments held by a fund may be significantly affected by changes in foreign currency exchange rates. The dollar value of a foreign security generally decreases when the value of the dollar rises against the foreign currency in which the security is denominated and tends to increase when the value of the dollar declines against such foreign currency. A fund may enter into forward foreign currency exchange contracts to reduce a fund’s exposure to foreign currency exchange rate fluctuations. The net U.S. dollar value of foreign currency underlying all contractual commitments held by a fund and the resulting unrealized appreciation or depreciation are determined daily using prevailing exchange rates. Realized gain or loss is recorded upon the termination of the contract. Net realized and unrealized gains or losses occurring during the holding period of forward foreign currency exchange contracts are a component of net realized gain (loss) on foreign currency transactions and change in net unrealized appreciation (depreciation) on translation of assets and liabilities in foreign currencies, respectively. A fund bears the risk of an unfavorable change in the foreign currency exchange rate underlying the forward contract. Additionally, losses, up to the fair value, may arise if the counterparties do not perform under the contract terms. The risk of loss from non-performance by the counterparty may be reduced by the use of master netting agreements. During the year ended October 31, 2009, the fund participated in forward foreign currency exchange contracts.
The value of foreign currency risk derivatives as of October 31, 2009, is disclosed on the Statement of Assets and Liabilities as a liability of $29,425 in payable for forward foreign currency exchange contracts. For the year ended October 31, 2009, the effect of foreign currency risk derivatives on the Statement of Operations was $(1,634,548) in net realized gain (loss) on foreign currency transactions and $(522,510) in change in net unrealized appreciation (depreciation) on translation of assets and liabilities in foreign currencies.
The derivative instruments at period end as disclosed on the Schedule of Investments are indicative of the fund’s typical volume.
6. Risk Factors
The fund’s investment process may result in high portfolio turnover, high commission costs and high capital gains distributions. In addition, its investment approach may involve higher volatility and risk. There are also certain risks involved in investing in foreign securities. These risks include those resulting from future adverse political, social, and economic developments, fluctuations in currency exchange rates, the possible imposition of exchange controls, and other foreign laws or restrictions. Investing in emerging markets may accentuate these risks.
21
7. Bank Line of Credit
The fund, along with certain other funds in the American Century Investments family of funds, had a $500,000,000 unsecured bank line of credit agreement with Bank of America, N.A. The line expired December 10, 2008, and was not renewed. The agreement allowed the fund to borrow money for temporary or emergency purposes to fund shareholder redemptions. Borrowings under the agreement were subject to interest at the Federal Funds rate plus 0.40%. The fund did not borrow from the line during the year ended October 31, 2009.
8. Interfund Lending
The fund, along with certain other funds in the American Century Investments family of funds, may participate in an interfund lending program, pursuant to an Exemptive Order issued by the Securities and Exchange Commission (SEC). This program provides an alternative credit facility allowing the fund to borrow from or lend to other funds in the American Century Investments family of funds that permit such transactions. Interfund lending transactions are subject to each fund’s investment policies and borrowing and lending limits. The interfund loan rate earned/paid on interfund lending transactions is determined daily based on the average of certain current market rates. Interfund lending transactions normally extend only overnight, but can have a maximum duration of seven days. The program is subject to annual approval by the Board of Directors. During the year ended October 31, 2009, the fund did not utilize the program.
9. Federal Tax Information
The tax character of distributions paid during the years ended October 31, 2009 and October 31, 2008 were as follows:
| | |
| | 2009 | 2008 |
| Distributions Paid From | | |
| Ordinary income | $(2,424,540) | — |
| Long-term capital gains | — | — |
The book-basis character of distributions made during the year from net investment income or net realized gains may differ from their ultimate characterization for federal income tax purposes. These differences reflect the differing character of certain income items and net realized gains and losses for financial statement and tax purposes, and may result in reclassification among certain capital accounts on the financial statements.
As of October 31, 2009, the federal tax cost of investments and the components of distributable earnings on a tax-basis were as follows:
| | |
| Federal tax cost of investments | $670,640,814 |
| Gross tax appreciation of investments | $179,948,517 |
| Gross tax depreciation of investments | (10,376,827) |
| Net tax appreciation (depreciation) of investments | $169,571,690 |
| Net tax appreciation (depreciation) on derivatives and translation | |
| of assets and liabilities in foreign currencies | $623 |
| Net tax appreciation (depreciation) | $169,572,313 |
| Undistributed ordinary income | — |
| Accumulated capital losses | $(190,146,656) |
22
The difference between book-basis and tax-basis cost and unrealized appreciation (depreciation) is attributable primarily to the tax deferral of losses on wash sales and the realization for tax purposes of unrealized gains on certain forward foreign currency exchange contracts.
The accumulated capital losses on the previous page represent net capital loss carryovers that may be used to offset future realized capital gains for federal income tax purposes. Future capital loss carryover utilization in any given year may be subject to Internal Revenue Code limitations. Capital loss carryovers of $(2,183,412), $(7,528,594) and $(180,434,650) expire in 2011, 2016 and 2017, respectively.
10. Recently Issued Accounting Standards
The Financial Accounting Standards Board (FASB) issued Accounting Standards Codification (ASC) Section 820-10 (formerly Statement of Financial Accounting Standards No. 157, “Fair Value Measurements”), in September 2006, which is effective for fiscal years beginning after November 15, 2007. ASC Section 820-10 defines fair value, establishes a framework for measuring fair value and expands the required financial statement disclosures about fair value measurements. The adoption of ASC Section 820-10 did not materially impact the determination of fair value.
In March 2008, the FASB issued ASC Section 815-10 (formerly Statement of Financial Accounting Standards No. 161, “Disclosures about Derivative Instruments and Hedging Activities—an amendment of FASB Statement No. 133”). ASC Section 815-10 is effective for interim periods beginning after November 15, 2008 and has been adopted by the fund. ASC Section 815-10 amends and expands disclosures about derivative instruments and hedging activities. ASC Section 815-10 requires qualitative disclosures about the objectives and strategies of derivative instruments, quantitative disclosures about the fair value amounts of and gains and losses on derivative instruments, and disclosures of credit-risk-related contingent features in hedging activities.
11. Other Tax Information (Unaudited)
The following information is provided pursuant to provisions of the Internal Revenue Code.
The fund hereby designates up to the maximum amount allowable as qualified dividend income for the fiscal year ended October 31, 2009.
For corporate taxpayers, the fund hereby designates ordinary income distributions of $2,424,540, or up to the maximum amount allowable, of ordinary income distributions paid during the fiscal year ended October 31, 2009 as qualified for the corporate dividends received deduction.
23
| | | | | | |
| Giftrust | | | | | |
| |
| Investor Class | | | | | |
| For a Share Outstanding Throughout the Years Ended October 31 | | | |
| | | 2009 | 2008 | 2007 | 2006 | 2005 |
| Per-Share Data | | | | | |
| Net Asset Value, Beginning of Period | $19.08 | $31.53 | $20.13 | $17.28 | $13.81 |
| Income From Investment Operations | | | | | |
| Net Investment Income (Loss)(1) | 0.03 | (0.13) | (0.14) | (0.05) | (0.08) |
| Net Realized and Unrealized Gain (Loss) | 1.81 | (12.32) | 11.54 | 2.90 | 3.55 |
| Total From Investment Operations | 1.84 | (12.45) | 11.40 | 2.85 | 3.47 |
| Distributions | | | | | |
| From Net Investment Income | (0.06) | — | — | — | — |
| Net Asset Value, End of Period | $20.86 | $19.08 | $31.53 | $20.13 | $17.28 |
| |
| Total Return(2) | 9.72% | (39.49)% | 56.63% | 16.49% | 25.13% |
| | | | | | |
| Ratios/Supplemental Data | | | | | |
| Ratio of Operating Expenses | | | | | |
| to Average Net Assets | 1.00% | 1.00% | 1.00% | 1.00% | 1.00% |
| Ratio of Net Investment Income (Loss) | | | | | |
| to Average Net Assets | 0.19% | (0.48)% | (0.57)% | (0.22)% | (0.46)% |
| Portfolio Turnover Rate | 167% | 171% | 147% | 229% | 223% |
| Net Assets, End of Period (in millions) | $838 | $804 | $1,421 | $985 | $927 |
| (1) | Computed using average shares outstanding throughout the period | | | | |
| (2) | Total return assumes reinvestment of net investment income and capital gains distributions, if any. | | |
| |
| |
| See Notes to Financial Statements. | | | | | |
24
|
| Report of Independent Registered Public Accounting Firm |
The Board of Directors and Shareholders, American Century Mutual Funds, Inc.:
We have audited the accompanying statement of assets and liabilities, including the schedule of investments, of Giftrust Fund, one of the funds constituting American Century Mutual Funds, Inc. (the “Corporation”), as of October 31, 2009, and the related statement of operations for the year then ended, the statements of changes in net assets for each of the two years in the period then ended, and the financial highlights for each of the five years in the period then ended. These financial statements and financial highlights are the responsibility of the Corporation’s management. Our responsibility is to express an opinion on these financial statements and financial highlights based on our audits.
We conducted our audits in accordance with the standards of the Public Company Accounting Oversight Board (United States). Those standards require that we plan and perform the audit to obtain reasonable assurance about whether the financial statements and financial highlights are free of material misstatement. The Corporation is not required to have, nor were we engaged to perform, an audit of its internal control over financial reporting. Our audits included consideration of internal control over financial reporting as a basis for designing audit procedures that are appropriate in the circumstances, but not for the purpose of expressing an opinion on the effectiveness of the Corporation’s internal control over financial reporting. Accordingly, we express no such opinion. An audit also includes examining, on a test basis, evidence supporting the amounts and disclosures in the financial statements, assessing the accounting principles used and significant estimates made by management, as well as evaluating the overall financial statement presentation. Our procedures included confirmation of securities owned as of October 31, 2009, by correspondence with the custodian and brokers; where replies were not received from brokers, we performed other auditing procedures. We believe that our audits provide a reasonable basis for our opinion.
In our opinion, the financial statements and financial highlights referred to above present fairly, in all material respects, the financial position of Giftrust Fund of American Century Mutual Funds, Inc., as of October 31, 2009, the results of its operations for the year then ended, the changes in its net assets for each of the two years in the period then ended, and the financial highlights for each of the five years in the period then ended, in conformity with accounting principles generally accepted in the United States of America.
Deloitte & Touche LLP
Kansas City, Missouri
December 28, 2009
25
The individuals listed below serve as directors or officers of the fund. Each director serves until his or her successor is duly elected and qualified or until he or she retires. Mandatory retirement age for independent directors is 72. Those listed as interested directors are “interested” primarily by virtue of their engagement as directors and/or officers of, or ownership interest in, American Century Companies, Inc. (ACC) or its wholly owned, direct or indirect, subsidiaries, including the fund’s investment advisor, American Century Investment Management, Inc. (ACIM); the fund’s principal underwriter, American Century Investment Services, Inc. (ACIS); and the fund’s transfer agent, American Century Services, LLC (ACS).
The other directors (more than three-fourths of the total number) are independent; that is, they have never been employees, directors or officers of, and have no financial interest in, ACC or any of its wholly owned, direct or indirect, subsidiaries, including ACIM, ACIS and ACS. The directors serve in this capacity for seven registered investment companies in the American Century Investments family of funds.
All persons named as officers of the fund also serve in similar capacities for the other 14 registered investment companies in the American Century Investments family of funds advised by ACIM or American Century Global Investment Management, Inc. (ACGIM), a wholly owned subsidiary of ACIM, unless otherwise noted. Only officers with policy-making functions are listed. No officer is compensated for his or her service as an officer of the fund. The listed officers are interested persons of the fund and are appointed or re-appointed on an annual basis.
Interested Director
Jonathan S. Thomas, 4500 Main Street, Kansas City, MO 64111
Year of Birth: 1963
Position(s) Held with Fund: Director (since 2007) and President (since 2007)
Principal Occupation(s) During Past 5 Years: President and Chief Executive Officer, ACC
(March 2007 to present); Chief Administrative Officer, ACC (February 2006 to
February 2007); Executive Vice President, ACC (November 2005 to February 2007).
Also serves as: President, Chief Executive Officer and Director, ACS; Executive
Vice President, ACIM and ACGIM; Director, ACIM, ACGIM, ACIS and other ACC
subsidiaries. Managing Director, Morgan Stanley (March 2000 to November 2005)
Number of Portfolios in Fund Complex Overseen by Director: 103
Other Directorships Held by Director: None
Independent Directors
Thomas A. Brown, 4500 Main Street, Kansas City, MO 64111
Year of Birth: 1940
Position(s) Held with Fund: Director (since 1980)
Principal Occupation(s) During Past 5 Years: Managing Member, Associated Investments, LLC
(real estate investment company); Managing Member, Brown Cascade Properties,
LLC (real estate investment company); Retired, Area Vice President, Applied
Industrial Technologies (bearings and power transmission company)
Number of Portfolios in Fund Complex Overseen by Director: 63
Other Directorships Held by Director: None
26
Andrea C. Hall, Ph.D., 4500 Main Street, Kansas City, MO 64111
Year of Birth: 1945
Position(s) Held with Fund: Director (since 1997)
Principal Occupation(s) During Past 5 Years: Retired, Advisor to the President, Midwest
Research Institute (not-for-profit, contract research organization)
Number of Portfolios in Fund Complex Overseen by Director: 63
Other Directorships Held by Director: None
James A. Olson, 4500 Main Street, Kansas City, MO 64111
Year of Birth: 1942
Position(s) Held with Fund: Director (since 2007)
Principal Occupation(s) During Past 5 Years: Member, Plaza Belmont LLC (private equity
fund manager); Chief Financial Officer, Plaza Belmont LLC (September 1999 to
September 2006)
Number of Portfolios in Fund Complex Overseen by Director: 63
Other Directorships Held by Director: Saia, Inc. and Entertainment Properties Trust
Donald H. Pratt, 4500 Main Street, Kansas City, MO 64111
Year of Birth: 1937
Position(s) Held with Fund: Director (since 1995) and Chairman of the Board (since 2005)
Principal Occupation(s) During Past 5 Years: Chairman and Chief Executive Officer, Western
Investments, Inc. (real estate company); Retired Chairman of the Board, Butler
Manufacturing Company (metal buildings producer)
Number of Portfolios in Fund Complex Overseen by Director: 63
Other Directorships Held by Director: None
Gale E. Sayers, 4500 Main Street, Kansas City, MO 64111
Year of Birth: 1943
Position(s) Held with Fund: Director (since 2000)
Principal Occupation(s) During Past 5 Years: President, Chief Executive Officer and Founder,
Sayers40, Inc. (technology products and services provider)
Number of Portfolios in Fund Complex Overseen by Director: 63
Other Directorships Held by Director: None
M. Jeannine Strandjord, 4500 Main Street, Kansas City, MO 64111
Year of Birth: 1945
Position(s) Held with Fund: Director (since 1994)
Principal Occupation(s) During Past 5 Years: Retired, formerly Senior Vice President, Sprint
Corporation (telecommunications company)
Number of Portfolios in Fund Complex Overseen by Director: 63
Other Directorships Held by Director: DST Systems, Inc.; Euronet Worldwide, Inc. and
Charming Shoppes, Inc.
John R. Whitten, 4500 Main Street, Kansas City, MO 64111
Year of Birth: 1946
Position(s) Held with Fund: Director (since 2008)
Principal Occupation(s) During Past 5 Years: Project Consultant, Celanese Corp. (industrial
chemical company) (September 2004 to January 2005)
Number of Portfolios in Fund Complex Overseen by Director: 63
Other Directorships Held by Director: Rudolph Technologies, Inc.
27
Officers
Barry Fink, 4500 Main Street, Kansas City, MO 64111
Year of Birth: 1955
Position(s) Held with Fund: Executive Vice President (since 2007)
Principal Occupation(s) During Past 5 Years: Chief Operating Officer and Executive Vice
President, ACC (September 2007 to present); President, ACS (October 2007 to
present); Managing Director, Morgan Stanley (2000 to 2007); Global General
Counsel, Morgan Stanley (2000 to 2006). Also serves as: Director, ACC, ACS, ACIS
and other ACC subsidiaries
Maryanne Roepke, 4500 Main Street, Kansas City, MO 64111
Year of Birth: 1956
Position(s) Held with Fund: Chief Compliance Officer (since 2006) and Senior Vice
President (since 2000)
Principal Occupation(s) During Past 5 Years: Chief Compliance Officer, ACIM, ACGIM and ACS
(August 2006 to present); Assistant Treasurer, ACC (January 1995 to August 2006); and
Treasurer and Chief Financial Officer, various American Century Investments funds
(July 2000 to August 2006). Also serves as: Senior Vice President, ACS
Charles A. Etherington, 4500 Main Street, Kansas City, MO 64111
Year of Birth: 1957
Position(s) Held with Fund: General Counsel (since 2007) and Senior Vice President
(since 2006)
Principal Occupation(s) During Past 5 Years: Attorney, ACC (February 1994 to present); Vice
President, ACC (November 2005 to present); General Counsel, ACC (March 2007
to present). Also serves as: General Counsel, ACIM, ACGIM, ACS, ACIS and other
ACC subsidiaries; and Senior Vice President, ACIM, ACGIM and ACS
Robert Leach, 4500 Main Street, Kansas City, MO 64111
Year of Birth: 1966
Position(s) Held with Fund: Vice President, Treasurer and Chief Financial Officer (all
since 2006)
Principal Occupation(s) During Past 5 Years: Vice President, ACS (February 2000 to present); and
Controller, various American Century Investments funds (1997 to September 2006)
David H. Reinmiller, 4500 Main Street, Kansas City, MO 64111
Year of Birth: 1963
Position(s) Held with Fund: Vice President (since September 2000)
Principal Occupation(s) During Past 5 Years: Attorney, ACC (January 1994 to present);
Associate General Counsel, ACC (January 2001 to present); Chief Compliance
Officer, American Century Investments funds, ACIM and ACGIM (January 2001 to
February 2005). Also serves as: Associate General Counsel, ACIM, ACGIM, ACS,
ACIS and other ACC subsidiaries; and Vice President, ACIM, ACGIM and ACS
Ward Stauffer, 4500 Main Street, Kansas City, MO 64111
Year of Birth: 1960
Position(s) Held with Fund: Secretary (since February 2005)
Principal Occupation(s) During Past 5 Years: Attorney, ACC (June 2003 to present)
The SAI has additional information about the fund’s directors and is available without charge, upon request, by calling 1-800-345-2021.
28
|
| Approval of Management Agreement |
Under Section 15(c) of the Investment Company Act, contracts for investment advisory services are required to be reviewed, evaluated and approved by a majority of a fund’s independent directors (the “Directors”) each year. At American Century Investments, this process is referred to as the “15(c) Process.” As a part of this process, the board reviews fund performance, shareholder services, audit and compliance information, and a variety of other reports from the advisor concerning fund operations. In addition to this annual review, the board of directors oversees and evaluates on a continuous basis at its quarterly meetings the nature and quality of significant services performed by the advisor, fund performance, audit and compliance information, and a variety of other reports relating to fund operations. The board, or committees of the board, also holds special meetings as needed.
Under a Securities and Exchange Commission rule, each fund is required to disclose in its annual or semiannual report, as appropriate, the material factors and conclusions that formed the basis for the board’s approval or renewal of any advisory agreements within the fund’s most recently completed fiscal half-year period.
Annual Contract Review Process
As part of the annual 15(c) Process undertaken during the most recent fiscal half-year period, the Directors reviewed extensive data and information compiled by the advisor and certain independent providers of evaluative data (the “15(c) Providers”) concerning Giftrust (the “Fund”) and the services provided to the Fund under the management agreement. The information considered and the discussions held at the meetings included, but were not limited to:
• the nature, extent and quality of investment management, shareholder services and other services provided to the Fund;
• the wide range of programs and services the advisor provides to the Fund and its shareholders on a routine and non-routine basis;
• the compliance policies, procedures, and regulatory experience of the advisor;
• data comparing the cost of owning the Fund to the cost of owning a similar fund;
• data comparing the Fund’s performance to appropriate benchmarks and/or a peer group of other mutual funds with similar investment objectives and strategies;
• financial data showing the profitability of the Fund to the advisor and the overall profitability of the advisor;
• data comparing services provided and charges to other investment management clients of the advisor; and
• consideration of collateral benefits derived by the advisor from the management of the Fund and any potential economies of scale relating thereto.
29
In keeping with its practice, the Fund’s board of directors held two in-person meetings and one telephonic meeting to review and discuss the information provided. The board also had the benefit of the advice of its independent counsel throughout the period.
Factors Considered
The Directors considered all of the information provided by the advisor, the 15(c) Providers, and the board’s independent counsel, and evaluated such information for each fund for which the board has responsibility. In connection with their review of the Fund, the Directors did not identify any single factor as being all-important or controlling, and each Director may have attributed different levels of importance to different factors. In deciding to renew the management and subadvisory agreements under the terms ultimately determined by the board to be appropriate, the Directors’ decision was based on the following factors.
Nature, Extent and Quality of Services – Generally. Under the management agreement, the advisor is responsible for providing or arranging for all services necessary for the operation of the Fund. The board noted that under the management agreement, the advisor provides or arranges at its own expense a wide variety of services including:
• Fund construction and design
• portfolio security selection
• initial capitalization/funding
• securities trading
• Fund administration
• custody of Fund assets
• daily valuation of the Fund’s portfolio
• shareholder servicing and transfer agency, including shareholder confirmations, recordkeeping and communications
• legal services
• regulatory and portfolio compliance
• financial reporting
• marketing and distribution
The Directors noted that many of the services provided by the advisor have expanded over time both in terms of quantity and complexity in response to shareholder demands, competition in the industry and the changing regulatory environment. They discussed with the advisor the challenges
30
presented by these changes and the impact on the Fund. In performing their evaluation, the Directors considered information received in connection with the annual review, as well as information provided on an ongoing basis at their regularly scheduled board and committee meetings.
Investment Management Services. The nature of the investment management services provided to the Fund is quite complex and allows Fund shareholders access to professional money management, instant diversification of their investments, and liquidity. In evaluating investment performance, the board expects the advisor to manage the Fund in accordance with its investment objectives and approved strategies. Further, the Directors recognize that the advisor has an obligation to monitor trading activities, and in particular to seek the best execution of fund trades, and to evaluate the use of and payment for research. In providing these services, the advisor utilizes teams of investment professionals (portfolio managers, analysts, research assistants, and securities traders) who require extensive information technology, research, training, compl iance and other systems to conduct their business. At each quarterly meeting the Directors review investment performance information for the Fund, together with comparative information for appropriate benchmarks and/or peer groups of funds managed similarly to the Fund. The Directors also review detailed performance information during the 15(c) Process comparing the Fund’s performance with that of similar funds not managed by the advisor. If performance concerns are identified, the Directors discuss with the advisor the reasons for such results (e.g., market conditions, security selection) and any efforts being undertaken to improve performance. The Fund’s performance was in the top decile of its peer group for the three-year period and below the median for the one-year period.
Shareholder and Other Services. The advisor provides the Fund with a comprehensive package of transfer agency, shareholder, and other services. The Directors review reports and evaluations of such services at their regular quarterly meetings, including the annual meeting concerning contract review, and reports to the board. These reports include, but are not limited to, information regarding the operational efficiency and accuracy of the shareholder and transfer agency services provided, staffing levels, shareholder satisfaction (as measured by external as well as internal sources), technology support, new products and services offered to Fund shareholders, securities trading activities, portfolio valuation services, auditing services, and legal and operational compliance activities. Certain aspects of shareholder and transfer agency servi ce level efficiency and the quality of securities trading activities are measured by independent third party providers and are presented in comparison to other fund groups not managed by the advisor.
Costs of Services Provided and Profitability. The advisor provides detailed information concerning its cost of providing various services to the Fund, its profitability in managing the Fund, its overall profitability, and its financial condition. The Directors have reviewed with the advisor the methodology used to prepare this financial information. This financial information regarding the advisor is considered in order to evaluate the advisor’s
31
financial condition, its ability to continue to provide services under the management agreement, and the reasonableness of the current management fee. The board concluded that the advisor’s profits were reasonable in light of the services provided to the Fund.
Ethics. The Directors generally consider the advisor’s commitment to providing quality services to shareholders and to conducting its business ethically. They noted that the advisor’s practices generally meet or exceed industry best practices.
Economies of Scale. The Directors review information provided by the advisor regarding the possible existence of economies of scale in connection with the management of the Fund. The Directors concluded that economies of scale are difficult to measure and predict with precision, especially on a fund-by-fund basis. The analysis of economies of scale is further complicated by the additional services and content provided by the advisor and its reinvestment in its ability to provide and expand those services. Accordingly, the Directors seek to evaluate economies of scale by reviewing other information, such as year-over-year profitability of the advisor generally, the profitability of its management of the Fund specifically, the expenses incurred by the advisor in providing various functions to the Fund, and the fees of competitive funds not m anaged by the advisor. The Directors believe the advisor is appropriately sharing economies of scale through its competitive fee structure, fee breakpoints as the Fund increases in size, and through reinvestment in its business to provide shareholders additional content and services.
Comparison to Other Funds’ Fees. The Fund pays the advisor a single, all-inclusive (or unified) management fee for providing all services necessary for the management and operation of the Fund, other than brokerage expenses, taxes, interest, extraordinary expenses, and the fees and expenses of the Fund’s independent directors (including their independent legal counsel). Under the unified fee structure, the advisor is responsible for providing all investment advisory, custody, audit, administrative, compliance, record-keeping, marketing and shareholder services, or arranging and supervising third parties to provide such services. By contrast, most other funds are charged a variety of fees, including an investment advisory fee, a transfer agency fee, an administrative fee, distribution charges and other expenses. Other than their i nvestment advisory fees and Rule 12b-1 distribution fees, all other components of the total fees charged by these other funds may be increased without shareholder approval. The board believes the unified fee structure is a benefit to Fund shareholders because it clearly discloses to shareholders the cost of owning Fund shares, and, since the unified fee cannot be increased without a vote of Fund shareholders, it shifts to the advisor the risk of increased costs of operating the Fund and provides a direct incentive to minimize administrative inefficiencies. Part of the Directors’ analysis of fee levels involves reviewing certain evaluative data compiled by a 15(c) Provider comparing the Fund’s unified fee to the total expense ratio of other funds in the Fund’s peer group and performing a regression analysis to evaluate the effect of fee breakpoints as assets under management increase. The unified fee charged to shareholders of the Fund was in the lowest quartile of the total expense ratios of i ts peer group.
32
In addition, the Directors also reviewed updated fee level data provided by the advisor, but recognized that comparative data was particularly difficult to evaluate given the significant market developments during the past year. The board concluded that the management fee paid by the Fund to the advisor was reasonable in light of the services provided to the Fund.
Comparison to Fees and Services Provided to Other Clients of the Advisor. The Directors also requested and received information from the advisor concerning the nature of the services, fees, and profitability of its advisory services to advisory clients other than the Fund. They observed that these varying types of client accounts require different services and involve different regulatory and entrepreneurial risks than the management of the Fund. The Directors analyzed this information and concluded that the fees charged and services provided to the Fund were reasonable by comparison.
Collateral Benefits Derived by the Advisor. The Directors considered the existence of collateral benefits the advisor may receive as a result of its relationship with the Fund. They concluded that the advisor’s primary business is managing mutual funds and it generally does not use fund or shareholder information to generate profits in other lines of business, and therefore does not derive any significant collateral benefits from them. The Directors noted that the advisor receives proprietary research from broker-dealers that execute fund portfolio transactions and concluded that this research is likely to benefit fund shareholders. The Directors also determined that the advisor is able to provide investment management services to certain clients other than the Fund, at least in part, due to its existing infrastructure built to serve the fund complex. The Directors concluded, however, that the assets of those other clients are not material to the analysis and, in any event, are included with the assets of the Fund to determine breakpoints in the Fund’s fee schedule, provided they are managed using the same investment team and strategy.
Conclusions of the Directors
As a result of this process, the board, including all of the independent directors, in the absence of particular circumstances and assisted by the advice of legal counsel that is independent of the advisor, taking into account all of the factors discussed above and the information provided by the advisor concluded that the investment management agreement between the Fund and the advisor is fair and reasonable in light of the services provided and should be renewed.
33
Proxy Voting Guidelines
American Century Investment Management, Inc., the fund’s investment advisor, is responsible for exercising the voting rights associated with the securities purchased and/or held by the fund. A description of the policies and procedures the advisor uses in fulfilling this responsibility is available without charge, upon request, by calling 1-800-345-2021. It is also available on American Century Investments’ website at americancentury.com and on the Securities and Exchange Commission’s website at sec.gov. Information regarding how the investment advisor voted proxies relating to portfolio securities during the most recent 12-month period ended June 30 is available on the “About Us” page at americancentury.com. It is also available at sec.gov.
Quarterly Portfolio Disclosure
The fund files its complete schedule of portfolio holdings with the Securities and Exchange Commission (SEC) for the first and third quarters of each fiscal year on Form N-Q. The fund’s Form N-Q is available on the SEC’s website at sec.gov, and may be reviewed and copied at the SEC’s Public Reference Room in Washington, DC. Information on the operation of the Public Reference Room may be obtained by calling 1-800-SEC-0330. The fund also makes its complete schedule of portfolio holdings for the most recent quarter of its fiscal year available on its website at americancentury.com and, upon request, by calling 1-800-345-2021.
34
The following indices are used to illustrate investment market, sector, or style performance or to serve as fund performance comparisons. They are not investment products available for purchase.
The Russell 1000® Index is a market-capitalization weighted, large-cap index created by Frank Russell Company to measure the performance of the 1,000 largest publicly traded U.S. companies, based on total market capitalization.
The Russell 1000® Growth Index measures the performance of those Russell 1000 Index companies (the 1,000 largest publicly traded U.S. companies, based on total market capitalization) with higher price-to-book ratios and higher forecasted growth values.
The Russell 1000® Value Index measures the performance of those Russell 1000 Index companies (the 1,000 largest publicly traded U.S. companies, based on total market capitalization) with lower price-to-book ratios and lower forecasted growth values.
The Russell 2000® Index is a market-capitalization weighted index created by Frank Russell Company to measure the performance of the 2,000 smallest of the 3,000 largest publicly traded U.S. companies, based on total market capitalization.
The Russell 2000® Growth Index measures the performance of those Russell 2000 Index companies (the 2,000 smallest of the 3,000 largest publicly traded U.S. companies, based on total market capitalization) with higher price-to-book ratios and higher forecasted growth values.
The Russell 2000® Value Index measures the performance of those Russell 2000 Index companies (the 2,000 smallest of the 3,000 largest publicly traded U.S. companies, based on total market capitalization) with lower price-to-book ratios and lower forecasted growth values.
The Russell 3000® Index measures the performance of the 3,000 largest U.S. companies based on total market capitalization, which represents approximately 98% of the investable U.S. equity market.
The Russell 3000® Growth Index measures the performance of those Russell 3000 Index companies (the 3,000 largest U.S. companies based on total market capitalization) with higher price-to-book ratios and higher forecasted growth values.
The Russell Midcap® Index measures the performance of the 800 smallest of the 1,000 largest publicly traded U.S. companies, based on total market capitalization.
The Russell Midcap® Growth Index measures the performance of those Russell Midcap Index companies (the 800 smallest of the 1,000 largest publicly traded U.S. companies, based on total market capitalization) with higher price-to-book ratios and higher forecasted growth values.
The Russell Midcap® Value Index measures the performance of those Russell Midcap Index companies (the 800 smallest of the 1,000 largest publicly traded U.S. companies, based on total market capitalization) with lower price-to-book ratios and lower forecasted growth values.
35
36

| |
| |
| Contact Us | |
| americancentury.com | |
| Automated Information Line | 1-800-345-8765 |
| Investor Services Representative | 1-800-345-2021 or |
| | 816-531-5575 |
| Business, Not-For-Profit, Employer-Sponsored | |
| Retirement Plans | 1-800-345-3533 |
| Banks and Trust Companies, Broker-Dealers, | |
| Financial Professionals, Insurance Companies | 1-800-345-6488 |
| Telecommunications Device for the Deaf | 1-800-634-4113 |
| American Century Mutual Funds, Inc. | |
| Investment Advisor: | |
| American Century Investment Management, Inc. | |
| Kansas City, Missouri | |
This report and the statements it contains are submitted for the general
information of our shareholders. The report is not authorized for distribution to
prospective investors unless preceded or accompanied by an effective prospectus.
American Century Investment Services, Inc., Distributor
©2009 American Century Proprietary Holdings, Inc. All rights reserved.
0912
CL-ANN-67032S
|
| Annual Report |
| October 31, 2009 |

|
| American Century Investments |
Select Fund
Capital Growth Fund
Focused Growth Fund
Fundamental Equity Fund
| |
| President’s Letter | 2 |
| Independent Chairman’s Letter | 3 |
| Market Perspective | 4 |
| U.S. Stock Index Returns | 4 |
| |
| Select | |
| Performance | 5 |
| Portfolio Commentary | 7 |
| Top Ten Holdings, Top Five Industries and | |
| Types of Investments in Portfolio | 9 |
| |
| Capital Growth | |
| Performance | 10 |
| Portfolio Commentary | 12 |
| Top Ten Holdings, Top Five Industries and | |
| Types of Investments in Portfolio | 14 |
| |
| Focused Growth | |
| Performance | 15 |
| Portfolio Commentary | 17 |
| Top Ten Holdings, Top Five Industries and | |
| Types of Investments in Portfolio | 19 |
| |
| Fundamental Equity | |
| Performance | 20 |
| Portfolio Commentary | 22 |
| Top Ten Holdings, Top Five Industries and | |
| Types of Investments in Portfolio | 24 |
| |
| Shareholder Fee Examples | 25 |
| |
| Financial Statements | |
| Schedule of Investments | 28 |
| Statement of Assets and Liabilities | 40 |
| Statement of Operations | 42 |
| Statement of Changes in Net Assets | 43 |
| Notes to Financial Statements | 45 |
| Financial Highlights | 58 |
| Report of Independent Registered Public Accounting Firm | 82 |
| |
| Other Information | |
| Management | 83 |
| Approval of Management Agreements | 86 |
| Additional Information | 91 |
| Index Definitions | 92 |
The opinions expressed in the Market Perspective and each of the Portfolio Commentaries reflect those of the portfolio management team as of the date of the report, and do not necessarily represent the opinions of American Century Investments or any other person in the American Century Investments organization. Any such opinions are subject to change at any time based upon market or other conditions and American Century Investments disclaims any responsibility to update such opinions. These opinions may not be relied upon as investment advice and, because investment decisions made by American Century Investments funds are based on numerous factors, may not be relied upon as an indication of trading intent on behalf of any American Century Investments fund. Security examples are used for representational purposes only and are not intended as recommendations to purchase or sell securities. Performance information for com parative indices and securities is provided to American Century Investments by third party vendors. To the best of American Century Investments’ knowledge, such information is accurate at the time of printing.

Dear Investor:
Thank you for taking time to review the following pages, which provide the performance of your investment along with the perspectives of our experienced portfolio management team for the financial reporting period ended October 31, 2009. We appreciate your trust in American Century Investments® at this volatile, transitional time in the economy and investment markets.
As the upheavals associated with the “Great Recession” gradually subside, our senior management team has put considerable thought into how the investment environment has changed and what new challenges and opportunities await us. Critical factors that we are anticipating in the coming year include marked shifts in investment and spending behavior, along with consolidation in our industry.
Most importantly, we think the economic recovery will be slow and extended. The economy and capital markets have come a long way since Lehman Brothers collapsed in the third quarter of 2008, but 2010 will likely bring continuing challenges. The stock market’s rebound since last March and the third-quarter economic surge in 2009 were fueled largely by corporate cost-cutting and unprecedented monetary and fiscal stimulus, including some key programs that have since expired or been scaled back.
Meanwhile, the resilient but struggling consumer sector still faces double-digit unemployment, heavy debt burdens, tight credit conditions, and a housing market that is starting to stabilize, but remains vulnerable. Much of our investment positioning in 2009 cautiously reflected these still unstable economic fundamentals, leading to underperformance, in some cases, versus market benchmarks buoyed by the rally of riskier assets. We still support our fundamentally based positioning because we believe strongly that some markets—driven more by technical factors than fundamentals—have advanced further than underlying economic conditions warrant, and remain susceptible to the possibility of more volatility ahead.
Thank you for your continued confidence in us.
Sincerely,

Jonathan Thomas
President and Chief Executive Officer
American Century Investments
2
|
| Independent Chairman’s Letter |

In my first letter to shareholders of the American Century Investments funds, I invited you to contact me with your questions. I have been gratified with your response. Most shareholder inquiries to date have related to specific fund performance issues. As I noted in my individual responses, your board through the Fund Performance Committee continues to stress improved performance in our quarterly meetings with chief investment officers and fund managers.
An important part of our fund performance review process is a face-to-face meeting with portfolio managers. The board traveled during the second quarter to the American Century Investments office in Mountain View, California to meet with the fund of funds and asset allocation portfolio management teams. These meetings validated the importance of thorough reviews of investment opportunities by the credit management personnel resident in that office. As a result of their efforts, American Century Investments funds were able to avoid the “toxic assets” that plagued many other fund families in 2008.
From April through June 2009, the board conducted its annual review of the advisory contracts between American Century Investments and each fund. Our efforts involved a review of fund information, including assets under management; total expense ratio compared to peers; economies of scale; fee breakpoints that reduce shareholder costs as assets increase; performance compared to peers and benchmarks; and the quality of services provided to fund shareholders. A detailed discussion of board considerations in connection with advisory contract renewal is included annually in each fund’s shareholder reports. During this review, the board focuses on a detailed comparison of the competitive position of each fund and has negotiated more than 60 breakpoints or fee reductions in the past five years.
The board looks forward to another year of work on your behalf and your comments are appreciated. You are invited to email me at dhpratt@fundboardchair.com.

3

By Greg Woodhams, Chief Investment Officer, U.S. Growth Equity—Large Cap
Signs of Economic Recovery Boosted Stocks
The year ended October 31, 2009, was a period of extremes for the U.S. stock market. The market began the period in the midst of a historically steep decline, then finished the period with one of its strongest rallies since the 1930s. The market’s dramatic swings resulted from rapidly shifting expectations regarding the economic and financial environment.
Stocks fell sharply in late 2008 and early 2009 as investors grew increasingly concerned about a deep economic downturn and a lack of liquidity in the credit markets. In response, the federal government took unprecedented actions to shore up the credit sector, support the housing market, and revive the stalled economy.
These efforts began to bear fruit in the spring of 2009 as signs of economic stabilization emerged. Although the unemployment rate continued to climb, reaching a 26-year high of 10.2% by October, the broader economy showed evidence of improvement, producing real growth in the third quarter of 2009—the first positive quarterly growth in more than a year. In addition, cost-management efforts at many companies helped generate better-than-expected earnings in the second and third quarters.
As a result, the equity market reached a multi-year low on March 9 and then reversed course, rising steadily throughout the last seven months of the period. The rally helped erase the market’s earlier losses, enabling the major stock indexes to produce gains of approximately 10% overall. Growth stocks outperformed value shares by a wide margin (see the table below) across all market capitalizations, though they lagged modestly over the last six months.
Economic Challenges Remain
Although recent economic trends have been encouraging, the recovery will likely be gradual until there is sustained improvement in the delinquency levels of consumer debt and the unemployment rate. Thus far, the U.S. consumer has been conspicuously absent from the recovery, and given the weakness in the U.S. dollar and improving economic conditions elsewhere in the world, we may see an export-led recovery until the consumer gets back on firmer footing.
| | | | |
| U.S. Stock Index Returns | | | | |
| For the 12 months ended October 31, 2009 | | | |
| Russell 1000 Index (Large-Cap) | 11.20% | | Russell 2000 Index (Small-Cap) | 6.46% |
| Russell 1000 Growth Index | 17.51% | | Russell 2000 Growth Index | 11.34% |
| Russell 1000 Value Index | 4.78% | | Russell 2000 Value Index | 1.96% |
| Russell Midcap Index | 18.75% | | | |
| Russell Midcap Growth Index | 22.48% | | | |
| Russell Midcap Value Index | 14.52% | | | |
4
| | | | | | |
| Select | | | | | |
| |
| Total Returns as of October 31, 2009 | | | | |
| | | | Average Annual Returns | |
| | | | | | Since | Inception |
| | | 1 year | 5 years | 10 years | Inception | Date |
| Investor Class | 17.77% | -0.22% | -2.75% | 11.96% | 6/30/71(1) |
| Russell 1000 Growth Index(2) | 17.51% | 1.27% | -3.39% | N/A(3) | — |
| Institutional Class | 18.00% | -0.03% | -2.55% | 3.19% | 3/13/97 |
| A Class(4) | | | | | 8/8/97 |
| No sales charge* | 17.47% | -0.47% | -2.99% | 1.18% | |
| With sales charge* | 10.71% | -1.65% | -3.56% | 0.69% | |
| B Class | | | | | 1/31/03 |
| No sales charge* | 16.60% | -1.23% | — | 2.21% | |
| With sales charge* | 12.60% | -1.44% | — | 2.21% | |
| C Class | 16.58% | -1.23% | — | 2.22% | 1/31/03 |
| R Class | 17.17% | — | — | -3.04% | 7/29/05 |
| * Sales charges include initial sales charges and contingent deferred sales charges (CDSCs), as applicable. A Class shares have a 5.75% |
| maximum initial sales charge for equity funds and may be subject to a maximum CDSC of 1.00%. B Class shares redeemed within six |
| years of purchase are subject to a CDSC that declines from 5.00% during the first year after purchase to 0.00% the sixth year after |
| purchase. C Class shares redeemed within 12 months of purchase are subject to a maximum CDSC of 1.00%. The SEC requires that |
| mutual funds provide performance information net of maximum sales charges in all cases where charges could be applied. |
| |
| (1) | Although the fund’s actual inception date was 10/31/58, this inception date corresponds with the investment advisor’s implementation of its |
| | current investment philosophy and practices. | | | | | |
| (2) | Data provided by Lipper Inc. — A Reuters Company. © 2009 Reuters. All rights reserved. Any copying, republication or redistribution of Lipper |
| | content, including by caching, framing or similar means, is expressly prohibited without the prior written consent of Lipper. Lipper shall not be |
| | liable for any errors or delays in the content, or for any actions taken in reliance thereon. | | | |
| | The data contained herein has been obtained from company reports, financial reporting services, periodicals and other resources believed to be |
| | reliable. Although carefully verified, data on compilations is not guaranteed by Lipper and may be incomplete. No offer or solicitations to buy or |
| | sell any of the securities herein is being made by Lipper. | | | | |
| (3) | Benchmark began 12/29/78. | | | | | |
| (4) | Prior to September 4, 2007, the A Class was referred to as the Advisor Class. Performance, with sales charge, prior to that date has been |
| | adjusted to reflect the A Class’s current sales charge. | | | | |
Data presented reflect past performance. Past performance is no guarantee of future results. Current performance may be higher or lower than the performance shown. Investment return and principal value will fluctuate, and redemption value may be more or less than original cost. To obtain performance data current to the most recent month end, please call 1-800-345-2021 or visit americancentury.com. International investing involves special risks, such as political instability and currency fluctuations.
Unless otherwise indicated, performance reflects Investor Class shares; performance for other share classes will vary due to differences in fee structure. For information about other share classes available, please consult the prospectus. Data assumes reinvestment of dividends and capital gains, and none of the charts reflect the deduction of taxes that a shareholder would pay on fund distributions or the redemption of fund shares. Returns for the index are provided for comparison. The fund’s total returns include operating expenses (such as transaction costs and management fees) that reduce returns, while the total returns of the index do not.
5
Select

| | | | | | | | | | |
| One-Year Returns Over 10 Years | | | | | | | |
| Periods ended October 31 | | | | | | | | | |
| | 2000 | 2001 | 2002 | 2003 | 2004 | 2005 | 2006 | 2007 | 2008 | 2009 |
| Investor Class | 7.64% | -28.93% | -17.11% | 17.11% | 3.05% | 6.67% | -1.55% | 28.37% | -37.71% | 17.77% |
| Russell 1000 | | | | | | | | | | |
| Growth Index | 9.33% | -39.95% | -19.62% | 21.81% | 3.38% | 8.81% | 10.84% | 19.23% | -36.95% | 17.51% |
| | | | | | | | | | | |
| Total Annual Fund Operating Expenses | | | | | | |
| | Institutional | | | | | | | | |
| Investor Class | Class | A Class | B Class | C Class | R Class |
| 1.00% | 0.80% | 1.25% | 2.00% | 2.00% | 1.50% |
The total annual fund operating expenses shown is as stated in the fund’s prospectus current as of the date of this report. The prospectus may vary from the expense ratio shown elsewhere in this report because it is based on a different time period, includes acquired fund fees and expenses, and, if applicable, does not include fee waivers or expense reimbursements.
Data presented reflect past performance. Past performance is no guarantee of future results. Current performance may be higher or lower than the performance shown. Investment return and principal value will fluctuate, and redemption value may be more or less than original cost. To obtain performance data current to the most recent month end, please call 1-800-345-2021 or visit americancentury.com. International investing involves special risks, such as political instability and currency fluctuations.
Unless otherwise indicated, performance reflects Investor Class shares; performance for other share classes will vary due to differences in fee structure. For information about other share classes available, please consult the prospectus. Data assumes reinvestment of dividends and capital gains, and none of the charts reflect the deduction of taxes that a shareholder would pay on fund distributions or the redemption of fund shares. Returns for the index are provided for comparison. The fund’s total returns include operating expenses (such as transaction costs and management fees) that reduce returns, while the total returns of the index do not.
6
Select
Portfolio Managers: Keith Lee and Michael Li
Performance Summary
Select returned 17.77%* for the 12 months ended October 31, 2009, compared with the 17.51% return of its benchmark, the Russell 1000 Growth Index, and the 9.80%** return of the S&P 500 Index, a broader stock market measure.
As discussed in the Market Perspective on page 4, equity markets continued to struggle during the first half of the reporting period amid extreme volatility and recession. After dipping to multi-year lows on March 9, 2009, markets responded positively to generally improving economic data and rallied soundly, erasing earlier losses. In this market environment, Select outperformed both the broader market (as measured by the S&P 500 Index) and its primary benchmark, the Russell 1000 Index.
Within the portfolio, effective security selection in the industrials sector accounted for the bulk of Select’s outperformance relative to the benchmark. Stock selection in the energy and information technology sectors also helped relative returns. Poor stock decisions in the consumer discretionary and materials sectors offset part of this relative performance.
Industrials Contributed
Stock choices in the industrials sector were a key source of outperformance for Select. Avoiding railroad stocks, in particular, contributed meaningfully to the portfolio’s returns compared with the benchmark. Rail traffic slowed during the reporting period as reduced production in the manufacturing sector led to lower shipping volumes, hurting the share prices of railroad companies in the benchmark.
Elsewhere in the industrials sector, stock selection in the aerospace and defense industry helped relative performance. Here, Select sidestepped a handful of benchmark laggards, while holding an overweight stake in Rockwell Collins Inc., whose share price climbed. The manufacturer of communications and aviation electronics for military and commercial customers effectively managed costs in its commercial aerospace business and continued to win a number of new military contracts in its defense division.
Select also benefited from companies that are well positioned to benefit from the expected rise in demand for alternative energy and investment in the global utility grid. Swiss power systems producer ABB, in particular, is a key participant in the upgrade and build-out of the global power infrastructure. Not a benchmark constituent, ABB contributed meaningfully to absolute and relative returns.
|
| * All fund returns referenced in this commentary are for Investor Class shares. |
| **The S&P 500 Index returns were 0.33% and -0.95% for the five- and 10-year periods ended October 31, 2009, respectively, and 9.72% since the |
| fund’s inception. |
7
Select
Energy, Information Technology Helped
The energy sector was another source of outperformance relative to Select’s benchmark. Within the oil, gas, and consumable fuels industry group, Select focused on Occidental Petroleum. The oil and gas exploration and production company has a low risk profile compared with its peers, with an emphasis on developing existing oil wells rather than on new exploration. The portfolio also benefited from avoiding diversified oil company Exxon Mobil, whose share price underperformed the index during the period.
Within the information technology sector, an overweight allocation to computers and peripherals generated favorable results. Consumer electronics company Apple, which continued to experience success with its iPhone, was a key contributor to absolute returns. Elsewhere in the technology sector, the portfolio held a large stake in Baidu, China’s dominant Internet search engine. Not a member of the benchmark, Baidu contributed significantly to absolute and relative gains.
Consumer Discretionary, Materials Detracted, but Some Holdings Contributed
Stock selection in the consumer discretionary sector weighed on Select’s relative returns. The portfolio completely avoided the Internet and catalog retail industry, a decision that proved detrimental. The industry group by far outperformed all other industries in the sector as investors’ appetite for risk increased in the reporting period. Poor stock selection among media stocks also trimmed returns. Here, the portfolio held an overweight stake in entertainment company Walt Disney Co., which suffered from underperfor-mance in its studio production business.
Within the materials sector, Select maintained an overweight stake in chemicals company Monsanto. Although it had benefited portfolio returns in past reporting periods, Monsanto’s share price declined during the recent period as lower prices and diminished demand for its Roundup herbicide resulted in a weaker near-term earnings outlook. Elsewhere in the materials sector, effective stock selection in the metals and mining industry group helped absolute and relative performance. Within the group, the portfolio focused on one position—Freeport-McMoRan Copper & Gold—whose share price soared 152%.
Starting Point for Next Reporting Period
The reporting period was a very difficult environment for growth and momentum oriented investment styles. Select’s investment process, which emphasizes these characteristics, experienced a significant headwind as a result. Going forward, we remain confident in our investment beliefs that stocks which exhibit high quality, accelerating fundamentals, positive relative strength and attractive valuations will outperform in the long term.
8
| | |
| Select | | |
| |
| Top Ten Holdings as of October 31, 2009 | | |
| | % of net assets | % of net assets |
| | as of 10/31/09 | as of 4/30/09 |
| Apple, Inc. | 4.1% | 3.1% |
| Google, Inc., Class A | 3.9% | 3.0% |
| Microsoft Corp. | 2.9% | 2.5% |
| Coca-Cola Co. (The) | 2.8% | 2.7% |
| Hewlett-Packard Co. | 2.8% | 2.6% |
| Wal-Mart Stores, Inc. | 2.7% | 2.5% |
| Franklin Resources, Inc. | 2.5% | 1.3% |
| MasterCard, Inc., Class A | 2.4% | 2.2% |
| Medco Health Solutions, Inc. | 2.4% | 2.1% |
| EMC Corp. | 2.3% | 2.1% |
| |
| Top Five Industries as of October 31, 2009 | | |
| | % of net assets | % of net assets |
| | as of 10/31/09 | as of 4/30/09 |
| Computers & Peripherals | 10.7% | 8.7% |
| Software | 7.4% | 8.6% |
| Internet Software & Services | 5.4% | 4.0% |
| Food & Staples Retailing | 5.0% | 4.8% |
| Pharmaceuticals | 4.7% | 2.8% |
| |
| Types of Investments in Portfolio | | |
| | % of net assets | % of net assets |
| | as of 10/31/09 | as of 4/30/09 |
| Domestic Common Stocks | 91.1% | 87.9% |
| Foreign Common Stocks(1) | 8.7% | 11.6% |
| Total Common Stocks | 99.8% | 99.5% |
| Temporary Cash Investments | 0.1% | 0.6% |
| Other Assets and Liabilities | 0.1% | (0.1)% |
| (1) Includes depositary shares, dual listed securities and foreign ordinary shares. | | |
9
| | | | |
| Capital Growth | | | | |
| |
| Total Returns as of October 31, 2009 | | | |
| | | Average Annual Returns | |
| | 1 year | 5 years | Since Inception | Inception Date |
| A Class | | | | 2/27/04 |
| No sales charge* | 15.32% | 1.97% | 1.54% | |
| With sales charge* | 8.64% | 0.78% | 0.48% | |
| Russell 1000 Growth Index(1) | 17.51% | 1.27% | 0.45% | — |
| Investor Class | 15.58% | — | 0.49% | 7/29/05 |
| Institutional Class | 15.70% | — | 0.66% | 7/29/05 |
| B Class | | | | 2/27/04 |
| No sales charge* | 14.46% | 1.21% | 0.78% | |
| With sales charge* | 10.46% | 1.02% | 0.61% | |
| C Class | 14.46% | 1.21% | 0.78% | 2/27/04 |
| R Class | 14.97% | — | -0.02% | 7/29/05 |
| * Sales charges include initial sales charges and contingent deferred sales charges (CDSCs), as applicable. A Class shares have a 5.75% |
| maximum initial sales charge for equity funds and may be subject to a maximum CDSC of 1.00%. B Class shares redeemed within six |
| years of purchase are subject to a CDSC that declines from 5.00% during the first year after purchase to 0.00% the sixth year after |
| purchase. C Class shares redeemed within 12 months of purchase are subject to a maximum CDSC of 1.00%. The SEC requires that |
| mutual funds provide performance information net of maximum sales charges in all cases where charges could be applied. |
|
| (1) Data provided by Lipper Inc. — A Reuters Company. © 2009 Reuters. All rights reserved. Any copying, republication or redistribution of Lipper |
| content, including by caching, framing or similar means, is expressly prohibited without the prior written consent of Lipper. Lipper shall not be |
| liable for any errors or delays in the content, or for any actions taken in reliance thereon. | | |
| The data contained herein has been obtained from company reports, financial reporting services, periodicals and other resources believed to be |
| reliable. Although carefully verified, data on compilations is not guaranteed by Lipper and may be incomplete. No offer or solicitations to buy or |
| sell any of the securities herein is being made by Lipper. | | | |
Data presented reflect past performance. Past performance is no guarantee of future results. Current performance may be higher or lower than the performance shown. Investment return and principal value will fluctuate, and redemption value may be more or less than original cost. To obtain performance data current to the most recent month end, please call 1-800-345-2021 or visit americancentury.com.
Unless otherwise indicated, performance reflects A Class shares; performance for other share classes will vary due to differences in fee structure. For information about other share classes available, please consult the prospectus. Data assumes reinvestment of dividends and capital gains, and none of the charts reflect the deduction of taxes that a shareholder would pay on fund distributions or the redemption of fund shares. Returns for the index are provided for comparison. The fund’s total returns include operating expenses (such as transaction costs and management fees) that reduce returns, while the total returns of the index do not.
10
Capital Growth
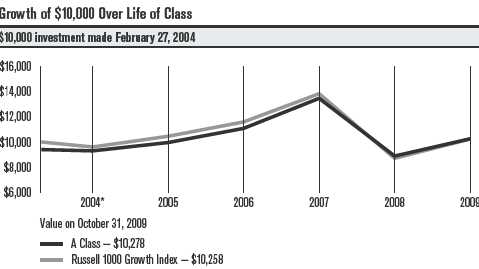
| | | | | | | |
| One-Year Returns Over Life of Class | | | | | |
| Periods ended October 31 | | | | | | |
| | | 2004* | 2005 | 2006 | 2007 | 2008 | 2009 |
| A Class (no sales charge) | | -1.10% | 7.08% | 11.24% | 21.40% | -33.88% | 15.32% |
| Russell 1000 Growth Index | | -3.70% | 8.81% | 10.84% | 19.23% | -36.95% | 17.51% |
| * From 2/27/04, the A Class’s inception date. Not annualized. Capital Growth A Class’s initial investment is $9,425 to reflect the maximum 5.75% |
| initial sales charge. | | | | | | | |
| |
| Total Annual Fund Operating Expenses | | | | | |
| Institutional | | | | | | |
| Investor Class | Class | A Class | B Class | C Class | R Class |
| 1.01% | 0.81% | 1.26% | 2.01% | 2.01% | 1.51% |
The total annual fund operating expenses shown is as stated in the fund’s prospectus current as of the date of this report. The prospectus may vary from the expense ratio shown elsewhere in this report because it is based on a different time period, includes acquired fund fees and expenses, and, if applicable, does not include fee waivers or expense reimbursements.
Data presented reflect past performance. Past performance is no guarantee of future results. Current performance may be higher or lower than the performance shown. Investment return and principal value will fluctuate, and redemption value may be more or less than original cost. To obtain performance data current t o the most recent month end, please call 1-800-345-2021 or visit americancentury.com.
Unless otherwise indicated, performance reflects A Class shares; performance for other share classes will vary due to differences in fee structure. For information about other share classes available, please consult the prospectus. Data assumes reinvestment of dividends and capital gains, and none of the charts reflect the deduction of taxes that a shareholder would pay on fund distributions or the redemption of fund shares. Returns for the index are provided for comparison. The fund’s total returns include operating expenses (such as transaction costs and management fees) that reduce returns, while the total returns of the index do not.
11
Capital Growth
Portfolio Managers: Greg Woodhams and Prescott LeGard
Performance Summary
Capital Growth gained 15.32%* in the 12 months ended October 31, 2009. By comparison, the Russell 1000 Growth Index (the fund’s benchmark) returned 17.51%. However, the portfolio continues to outperform its benchmark for the five years ended in October and for the period since its February 27, 2004, inception (see page 10).
The portfolio enjoyed double-digit returns during a remarkable period that included the depths of the credit crisis and subsequent rebound by financial markets (see the Market Perspective on page 4). In terms of absolute returns, holdings in the information technology sector contributed most; no sector detracted from absolute performance. Relative to its benchmark, positioning in the energy sector hurt most, while consumer discretionary shares were the leading contributors for the 12 months.
Energy Shares Detracted Most
Energy shares were the leading detractors from relative performance, as it hurt to be underweight oil services stocks during the first half of the fiscal year. Oil services companies outperformed the exploration and production companies we favored during that time. The largest single detractor from relative results was Devon Energy, which was hurt by declining prices for natural gas. We eliminated the position. In addition, it hurt to be under-represented in shares of Exxon Mobil early in the fiscal year. In the energy equipment and services industry segment, the leading detractor was oil rig operator Transocean, which underperformed because of slack demand for its deep-ocean rigs.
Other Detractors
In information technology, positioning among IT services companies detracted most from performance. The leading detractor was Global Payments, whose earnings were hurt by difficult macroeconomic conditions and negative currency effects. Exposure to consumer credit firm Visa and game maker Activision Blizzard also detracted from relative results. In addition, it hurt to be underrepresented in shares of IBM, Cognizant Technology Solutions, and Adobe Systems.
Stock selection and an underweight position meant materials shares also detracted. Chemical firm Mosaic was the leading detractor in the sector. Positioning in the health care sector also hurt relative performance, led by holdings in the pharmaceutical and health care equipment industries. In general, performance in the sector reflected a trend evident across the market—the higher-beta, higher-volatility shares that underper-formed in 2008 and early 2009 generally did best in the rally since March. Higher-quality, lower-beta securities—including many in the health care sector—did not participate fully in the rebound. The leading individual
|
| * All fund returns referenced in this commentary are for A Class shares and are not reduced by sales charges. A Class shares are subject to a |
| maximum sales charge of 5.75%. Had the sales charge been applied, returns would be lower than those shown. |
12
Capital Growth
detractors in this space were pharmaceutical companies Schering-Plough—which was acquired at a premium and to which the portfolio had no exposure—and Abbott Laboratories.
Key Contributors
The largest contribution to relative return by far came from stock choices among consumer discretionary shares. Specialty retailer J. Crew Group was the number-one contributor to relative results for the year, thanks to good sales trends and margin control. Mid-price retailer Kohl’s was another key contributor after demonstrating stronger same-store sales and margins in recent quarters. Auto component manufacturer BorgWarner also helped relative results. The Capital Growth management team added to this position late in 2008 when the stock underperformed. That helped performance in 2009, as the shares benefited from a return of investor focus to the growing demand for more fuel-efficient, cleaner-burning engines. Among other notable contributors in the sector were CarMax, Advance Auto Parts, and O’Reilly Automotive.
The portfolio also benefited from a number of holdings in the industrial sector. Valmont Industries was the key contributor in this space, driven by strong demand for its products relating to cellular towers, power poles, and mechanized irrigation systems. Commercial truck manufacturer Navistar International was another source of strength, as these economically sensitive shares benefited from signs of economic stability in 2009.
Other stocks making significant contributions to relative return were multinational semiconductor firm Marvell Technology Group and chemicals and materials firm Celanese. Marvell benefited from better pricing for its computer chips. Celanese enjoyed cost advantages over its competitors and provided a more favorable outlook than expected.
Outlook
Despite the volatile investment climate of recent years, the portfolio managers continue to work to consistently execute their disciplined process. They recognize that each environment presents its own unique challenges; nevertheless, their emphasis on stock selection as the principal generator of alpha (excess return above a market benchmark) and focus on risk management remain constant.
As a result, the portfolio’s sector and industry selection as well as capitalization range allocations are primarily a result of identifying what the managers believe to be superior individual securities. As of October 31, 2009, they found opportunity in the consumer discretionary, health care, and financials sectors, the portfolio’s largest overweight positions. The most notable sector underweights were in industrials and materials shares.
13
| | |
| Capital Growth | | |
| |
| Top Ten Holdings as of October 31, 2009 | | |
| | % of net assets | % of net assets |
| | as of 10/31/09 | as of 4/30/09 |
| Microsoft Corp. | 4.7% | 3.6% |
| Google, Inc., Class A | 3.8% | 2.7% |
| Apple, Inc. | 3.5% | 2.7% |
| Abbott Laboratories | 2.9% | 2.1% |
| Coca-Cola Co. (The) | 2.7% | 2.4% |
| PepsiCo, Inc. | 2.6% | 1.6% |
| Cisco Systems, Inc. | 2.6% | 2.0% |
| Procter & Gamble Co. (The) | 2.3% | 1.3% |
| Express Scripts, Inc. | 2.0% | 1.4% |
| Hewlett-Packard Co. | 1.9% | 1.5% |
| |
| Top Five Industries as of October 31, 2009 | | |
| | % of net assets | % of net assets |
| | as of 10/31/09 | as of 4/30/09 |
| Computers & Peripherals | 9.7% | 5.8% |
| Software | 7.5% | 6.7% |
| Communications Equipment | 5.9% | 5.6% |
| Pharmaceuticals | 5.4% | 2.6% |
| Beverages | 5.3% | 4.0% |
| |
| Types of Investments in Portfolio | | |
| | % of net assets | % of net assets |
| | as of 10/31/09 | as of 4/30/09 |
| Common Stocks | 98.2% | 98.3% |
| Temporary Cash Investments | 1.2% | 1.7% |
| Other Assets and Liabilities | 0.6% | —(1) |
| (1) Category is less than 0.05% of total net assets. | | |
14
| | | |
| Focused Growth | | | |
| |
| Total Returns as of October 31, 2009 | | | |
| | | Average Annual | |
| | | Returns | |
| | 1 year | Since Inception | Inception Date |
| Investor Class | 13.77% | 0.56% | 2/28/05 |
| Russell 1000 Growth Index(1) | 17.51% | 0.31% | — |
| Institutional Class | 14.00% | -10.38% | 9/28/07 |
| A Class | | | 9/28/07 |
| No sales charge* | 13.48% | -10.78% | |
| With sales charge* | 6.97% | -13.28% | |
| B Class | | | 9/28/07 |
| No sales charge* | 12.68% | -11.43% | |
| With sales charge* | 8.68% | -13.09% | |
| C Class | 12.68% | -11.43% | 9/28/07 |
| R Class | 13.19% | -11.01% | 9/28/07 |
| * Sales charges include initial sales charges and contingent deferred sales charges (CDSCs), as applicable. A Class shares have a 5.75% |
| maximum initial sales charge for equity funds and may be subject to a maximum CDSC of 1.00%. B Class shares redeemed within six |
| years of purchase are subject to a CDSC that declines from 5.00% during the first year after purchase to 0.00% the sixth year after |
| purchase. C Class shares redeemed within 12 months of purchase are subject to a maximum CDSC of 1.00%. The SEC requires that |
| mutual funds provide performance information net of maximum sales charges in all cases where charges could be applied. |
| |
| (1) Data provided by Lipper Inc. — A Reuters Company. © 2009 Reuters. All rights reserved. Any copying, republication or redistribution of Lipper |
| content, including by caching, framing or similar means, is expressly prohibited without the prior written consent of Lipper. Lipper shall not be |
| liable for any errors or delays in the content, or for any actions taken in reliance thereon. | | |
| The data contained herein has been obtained from company reports, financial reporting services, periodicals and other resources believed to be |
| reliable. Although carefully verified, data on compilations is not guaranteed by Lipper and may be incomplete. No offer or solicitations to buy or |
| sell any of the securities herein is being made by Lipper. | | | |
Data presented reflect past performance. Past performance is no guarantee of future results. Current performance may be higher or lower than the performance shown. Investment return and principal value will fluctuate, and redemption value may be more or less than original cost. To obtain performance data current to the most recent month end, please call 1-800-345-2021 or visit americancentury.com. The fund’s investment approach may also result in high portfolio turnover, which could mean high transaction costs, affecting both performance and capital gains tax liabilities to investors. International investing involves special risks, such as political instability and currency fluctuations.
Unless otherwise indicated, performance reflects Investor Class shares; performance for other share classes will vary due to differences in fee structure. For information about other share classes available, please consult the prospectus. Data assumes reinvestment of dividends and capital gains, and none of the charts reflect the deduction of taxes that a shareholder would pay on fund distributions or the redemption of fund shares. Returns for the index are provided for comparison. The fund’s total returns include operating expenses (such as transaction costs and management fees) that reduce returns, while the total returns of the index do not.
15
Focused Growth
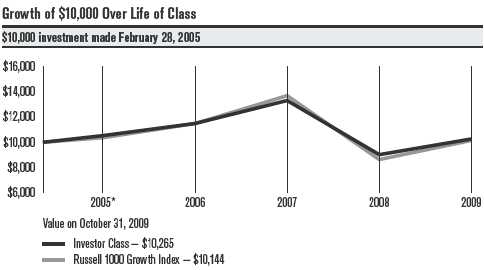
| | | | | | |
| One-Year Returns Over Life of Class | | | | |
| Periods ended October 31 | | | | | |
| | | 2005* | 2006 | 2007 | 2008 | 2009 |
| Investor Class | | 5.30% | 9.13% | 15.78% | -32.19% | 13.77% |
| Russell 1000 Growth Index | 3.62% | 10.84% | 19.23% | -36.95% | 17.51% |
| *From 2/28/05, the Investor Class’s inception date. Not annualized. | | | | |
| | | | | | |
| Total Annual Fund Operating Expenses | | | | |
| | Institutional | | | | | |
| Investor Class | Class | A Class | B Class | C Class | R Class |
| 1.00% | 0.80% | 1.25% | 2.00% | 2.00% | 1.50% |
The total annual fund operating expenses shown is as stated in the fund’s prospectus current as of the date of this report. The prospectus may vary from the expense ratio shown elsewhere in this report because it is based on a different time period, includes acquired fund fees and expenses, and, if applicable, does not include fee waivers or expense reimbursements.
Data presented reflect past performance. Past performance is no guarantee of future results. Current performance may be higher or lower than the performance shown. Investment return and principal value will fluctuate, and redemption value may be more or less than original cost. To obtain performance data current to the most recent month end, please call 1-800-345-2021 or visit americancentury.com. The fund’s investment approach may also result in high portfolio turnover, which could mean high transaction costs, affecting both performance and capital gains tax liabilities to investors. International investing involves special risks, such as political instability and currency fluctuations.
Unless otherwise indicated, performance reflects Investor Class shares; performance for other share classes will vary due to differences in fee structure. For information about other share classes available, please consult the prospectus. Data assumes reinvestment of dividends and capital gains, and none of the charts reflect the deduction of taxes that a shareholder would pay on fund distributions or the redemption of fund shares. Returns for the index are provided for comparison. The fund’s total returns include operating expenses (such as transaction costs and management fees) that reduce returns, while the total returns of the index do not.
16
Focused Growth
Portfolio Managers: Greg Woodhams and Joe Reiland
Performance Summary
Focused Growth returned 13.77%* during the 12 months ended October 31, 2009. By comparison, the Russell 1000 Growth Index (the fund’s benchmark) rose 17.51%. The portfolio’s performance since its February 2005 inception exceeded that of its benchmark (additional performance comparisons can be seen on page 15).
The portfolio enjoyed double-digit returns during a remarkable period that included the depths of the credit crisis and subsequent rebound by financial markets (see the Market Perspective on page 4). In terms of absolute returns, the leading contributors and detractors were information technology and energy shares, respectively. Relative to the benchmark, positioning in the energy and financials sectors hurt most, while consumer staples and information technology shares were the leading contributors to relative results for the 12 months.
Energy, Financial Shares Detracted Most
Stock choices made energy shares the leading detractors from relative performance. In particular, it hurt to be underweight oil services stocks in favor of exploration and production companies during the first half of the fiscal year. The largest single detractor from relative results was Devon Energy, which was hurt by declining prices for natural gas. We eliminated the position. In addition, it hurt to be underrepresented in shares of Alpha Natural Resources and Occidental Petroleum.
Financial shares were another source of weakness. Insurers Chubb Corporation and Hartford Financial Services—which held up relatively well at the height of the credit crisis—lagged in the market recovery since March. In addition, both suffered from the poor pricing environment for property and casualty insurers. The management team reduced their exposure to these stocks over the course of the fiscal year, but not before the positions hurt relative results.
Other Detractors
Holdings in the health care sector also detracted from relative return. Performance in this sector is illustrative of a theme evident across the market, as riskier, higher-volatility shares that underperformed in 2008 and early 2009 rebounded sharply, while relatively “safe,” higher-quality securities—including many in the health care sector—lagged more aggressive investments since about March 2009. A good example was the portfolio’s long-held stake in health care equipment firm Becton Dickinson, which lagged because it tends to be less economically sensitive. In addition, late in the fiscal year, Becton said foreign currency effects would hurt future earnings, which further weighed on the stock. In the biotechnology space, it hurt to have exposure to Amgen and Myriad Genetics, which pre-announced poor earnings. Other notable detractors were scientific tools
*All fund returns referenced in this commentary are for Investor Class shares.
17
Focused Growth
provider Thermo Fisher Scientific, which underperformed, and pharmaceutical company Schering-Plough, which was acquired at a premium and to which the portfolio had no exposure.
Two of the top-three individual detractors were in the industrials sector. The leading detractor in this space was Union Pacific, which saw shipping volumes and revenues decline in the difficult economic climate. Defense contractor Raytheon was another notable detractor.
Key Contributors
Stock selection and an underweight position in the lagging consumer staples sector made these shares the leading contributors to relative return. Among staples shares, it helped to avoid the defensive-oriented food and staples retailing, tobacco, and beverages segments. In particular, the portfolio was underrepresented in the poor-performing shares of Wal-Mart, PepsiCo, Altria Group, Philip Morris International, and Costco Wholesale, among others.
Information technology shares also made an important contribution to relative results, driven by positioning in the computers and peripherals and semiconductor industries. The sector was home to the leading individual contributor to relative results in foreign-based chip maker Marvell Technology Group, which benefited from better pricing in its disk drive business. Other notable contributors for the 12 months were Apple, Western Digital, EMC, and NetApp.
Another key contribution to relative return came from stock choices among consumer discretionary shares. Mid-price retailer Kohl’s was a top-10 contributor after demonstrating stronger same-store sales and margins in recent quarters. Auto component manufacturer BorgWarner helped relative results, as did specialty retailer Advance Auto Parts.
Outlook
Despite the volatile investment climate of recent years, the portfolio managers continue to work to consistently execute their disciplined process. They recognize that each environment presents its own unique challenges; nevertheless, their emphasis on stock selection as the principal generator of alpha (excess return above a market benchmark) and focus on risk management remain constant.
As a result, the portfolio’s sector and industry selection as well as capitalization range allocations are primarily a result of identifying what the managers believe to be superior individual securities. As of October 31, 2009, they found opportunity in the consumer discretionary and information technology sectors, the portfolio’s largest overweight positions. The most notable sector underweights were in consumer staples and materials shares.
18
| | |
| Focused Growth | | |
| |
| Top Ten Holdings as of October 31, 2009 | | |
| | % of net assets | % of net assets |
| | as of 10/31/09 | as of 4/30/09 |
| Coca-Cola Co. (The) | 4.7% | 3.8% |
| Apple, Inc. | 4.6% | 3.6% |
| Abbott Laboratories | 4.3% | 0.8% |
| QUALCOMM, Inc. | 3.6% | 3.9% |
| International Business Machines Corp. | 3.5% | — |
| Google, Inc., Class A | 3.5% | 1.9% |
| Microsoft Corp. | 3.5% | 0.5% |
| Express Scripts, Inc. | 3.3% | 2.8% |
| Amgen, Inc. | 3.1% | 1.0% |
| Illinois Tool Works, Inc. | 3.0% | — |
| |
| Top Five Industries as of October 31, 2009 | | |
| | % of net assets | % of net assets |
| | as of 10/31/09 | as of 4/30/09 |
| Computers & Peripherals | 11.0% | 6.8% |
| Software | 7.1% | 3.9% |
| Pharmaceuticals | 6.9% | 3.1% |
| Food Products | 6.6% | 3.7% |
| Multiline Retail | 4.9% | 3.7% |
| |
| Types of Investments in Portfolio | | |
| | % of net assets | % of net assets |
| | as of 10/31/09 | as of 4/30/09 |
| Domestic Common Stocks | 95.1% | 91.2% |
| Foreign Common Stocks(1) | 3.2% | 6.5% |
| Total Common Stocks | 98.3% | 97.7% |
| Temporary Cash Investments | — | 2.6% |
| Other Assets and Liabilities | 1.7% | (0.3)% |
| (1) Includes depositary shares, dual listed securities and foreign ordinary shares. | | |
19
| | | |
| Fundamental Equity | | | |
| |
| Total Returns as of October 31, 2009 | | | |
| | | Average Annual | |
| | | Returns | |
| | 1 year | Since Inception | Inception Date |
| A Class | | | 11/30/04 |
| No sales charge* | 8.00% | 3.01% | |
| With sales charge* | 1.83% | 1.78% | |
| S&P 500 Index(1) | 9.80% | -0.47% | — |
| Investor Class | 8.16% | 1.68% | 7/29/05 |
| Institutional Class | 8.47% | 1.89% | 7/29/05 |
| B Class | | | 11/30/04 |
| No sales charge* | 7.17% | 2.22% | |
| With sales charge* | 3.17% | 1.84% | |
| C Class | 7.06% | 2.22% | 11/30/04 |
| R Class | 7.64% | 1.16% | 7/29/05 |
| * Sales charges include initial sales charges and contingent deferred sales charges (CDSCs), as applicable. A Class shares have a 5.75% |
| maximum initial sales charge for equity funds and may be subject to a maximum CDSC of 1.00%. B Class shares redeemed within six |
| years of purchase are subject to a CDSC that declines from 5.00% during the first year after purchase to 0.00% the sixth year after |
| purchase. C Class shares redeemed within 12 months of purchase are subject to a maximum CDSC of 1.00%. The SEC requires that |
| mutual funds provide performance information net of maximum sales charges in all cases where charges could be applied. |
| |
| (1) Data provided by Lipper Inc. — A Reuters Company. © 2009 Reuters. All rights reserved. Any copying, republication or redistribution of Lipper |
| content, including by caching, framing or similar means, is expressly prohibited without the prior written consent of Lipper. Lipper shall not be |
| liable for any errors or delays in the content, or for any actions taken in reliance thereon. | | |
| The data contained herein has been obtained from company reports, financial reporting services, periodicals and other resources believed to be |
| reliable. Although carefully verified, data on compilations is not guaranteed by Lipper and may be incomplete. No offer or solicitations to buy or |
| sell any of the securities herein is being made by Lipper. | | | |
Data presented reflect past performance. Past performance is no guarantee of future results. Current performance may be higher or lower than the performance shown. Investment return and principal value will fluctuate, and redemption value may be more or less than original cost. To obtain performance data current to the most recent month end, please call 1-800-345-2021 or visit americancentury.com. International investing involves special risks, such as political instability and currency fluctuations.
Unless otherwise indicated, performance reflects A Class shares; performance for other share classes will vary due to differences in fee structure. For information about other share classes available, please consult the prospectus. Data assumes reinvestment of dividends and capital gains, and none of the charts reflect the deduction of taxes that a shareholder would pay on fund distributions or the redemption of fund shares. Returns for the index are provided for comparison. The fund’s total returns include operating expenses (such as transaction costs and management fees) that reduce returns, while the total returns of the index do not.
20
Fundamental Equity
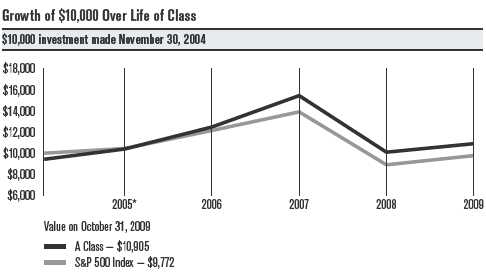
| | | | | | |
| One-Year Returns Over Life of Class | | | | |
| Periods ended October 31 | | | | | |
| | | 2005* | 2006 | 2007 | 2008 | 2009 |
| A Class (no sales charge) | 10.30% | 20.12% | 23.88% | -34.73% | 8.00% |
| S&P 500 Index | | 4.49% | 16.34% | 14.56% | -36.10% | 9.80% |
| * From 11/30/04, the A Class’s inception date. Not annualized. Fundamental Equity A Class’s initial investment is $9,425 to reflect the maximum |
| 5.75% initial sales charge. | | | | | | |
| |
| Total Annual Fund Operating Expenses | | | | |
| | Institutional | | | | | |
| Investor Class | Class | A Class | B Class | C Class | R Class |
| 1.02% | 0.82% | 1.27% | 2.02% | 2.02% | 1.52% |
The total annual fund operating expenses shown is as stated in the fund’s prospectus current as of the date of this report. The prospectus may vary from the expense ratio shown elsewhere in this report because it is based on a different time period, includes acquired fund fees and expenses, and, if applicable, does not include fee waivers or expense reimbursements.
Data presented reflect past performance. Past performance is no guarantee of future results. Current performance may be higher or lower than the performance shown. Investment return and principal value will fluctuate, and redemption value may be more or less than original cost. To obtain performance data current to the most recent month end, please call 1-800-345-2021 or visit americancentury.com. International investing involves special risks, such as political instability and currency fluctuations.
Unless otherwise indicated, performance reflects A Class shares; performance for other share classes will vary due to differences in fee structure. For information about other share classes available, please consult the prospectus. Data assumes reinvestment of dividends and capital gains, and none of the charts reflect the deduction of taxes that a shareholder would pay on fund distributions or the redemption of fund shares. Returns for the index are provided for comparison. The fund’s total returns include operating expenses (such as transaction costs and management fees) that reduce returns, while the total returns of the index do not.
21
Fundamental Equity
Portfolio Managers: Greg Woodhams, Prescott LeGard, Justin Brown, and Joe Reiland
Performance Summary
Fundamental Equity returned 8.00%* for the 12 months ended October 31, 2009. Its benchmark, the S&P 500 Index, returned 9.80% over the same time frame. The portfolio’s performance since its inception in November 2004, however, continued to outpace that of its benchmark (additional performance comparisons are listed on page 20).
As discussed in the Market Perspective on page 4, equity markets continued to struggle during the first half of the reporting period amid extreme volatility and recession. After dipping to multi-year lows on March 9, 2009, markets responded positively to generally improving economic data and rallied soundly, erasing earlier losses.
Within the portfolio, poor security selection in the health care, utilities, and consumer staples sectors accounted for the bulk of underperformance relative to the benchmark. Holdings in the materials, financials, and industrials sectors partially offset those losses.
Health Care Detracted
The health care sector was the largest source of Fundamental Equity’s under-performance relative to its benchmark. The portfolio maintained detrimental overweight positions in several underperforming pharmaceutical companies, including Abbott Laboratories. At the same time, the portfolio had an underweight position and poor timing in holding Schering-Plough, whose share price gained 93% in the reporting period as it became a takeover target of Merck. Poor stock choices also included an overweight position in Amgen. The biotechnology company’s share price slumped amid investor concerns that its potential blockbuster drug Prolia would take longer than originally anticipated to reach its sales potential in the market.
Utilities, Consumer Staples Lagged
In the utilities sector, an overweight stake in electric utility FirstEnergy weighed on performance. The company’s earnings fell as a weak economy, combined with unusually mild summer weather, curbed demand for electricity. Electric utility Pepco Holdings further trimmed results. Multi-utility CenterPoint Energy also hurt portfolio returns as it revised down earnings guidance in the face of a slow economy.
In the consumer staples sector, the portfolio’s overweight stake in Archer Daniels Midland benefited absolute returns, but poor timing resulted in underperformance compared with its returns in the benchmark.
|
| * All fund returns referenced in this commentary are for A Class shares and are not reduced by sales charges. A Class shares are subject to a |
| maximum sales charge of 5.75%. Had the sales charge been applied, returns would be lower than those shown. |
22
Fundamental Equity
Materials, Financials, and Industrials Contributed
Stock selection in the materials sector helped absolute and relative returns. In the containers and packaging group, non-benchmark holding Crown Holdings was a meaningful contributor to relative performance. An overweight position in paper and products company International Paper also added to returns.
Within the financials sector, the portfolio was rewarded for an underweight allocation to the underperforming diversified financial services and commercial bank sectors while many companies in these groups struggled with credit losses, as well as good timing in owning some companies that rebounded. The portfolio’s low exposure to Citigroup compared with the benchmark made a key contribution to relative performance. Fundamental Equity also enjoyed good timing in holding JPMorgan Chase, whose share price gained 65% during the time it was held in the portfolio but returned a modest 3% for the entire reporting period in the benchmark. Similarly, the portfolio held U.S. Bancorp while the company’s share price climbed 61%, although for the entire reporting period, its share price fell 20%.
Within the insurance group, Aflac, Inc. and Unum Group were among several overweight holdings that benefited performance.
General Electric, which is categorized as an industrial conglomerate, under-performed during the reporting period due to credit losses in its finance arm. Fundamental Equity’s underweight allocation to GE represented its largest individual contribution to relative performance during the period.
Outlook
Fundamental Equity generally invests in larger-sized companies, although it may invest in companies of any size. The managers use a quantitative model that combines fundamental measures of a stock’s value and growth potential. The fund seeks to provide better returns than, and a dividend yield comparable to, its benchmark, the S&P 500 Index, without taking on significant additional risk. Regardless of the current market volatility and difficult environment, we will remain focused on our methodology of identifying attractively valued companies.
23
| | |
| Fundamental Equity | | |
| |
| Top Ten Holdings as of October 31, 2009 | | |
| | % of net assets | % of net assets |
| | as of 10/31/09 | as of 4/30/09 |
| Exxon Mobil Corp. | 4.1% | 4.5% |
| JPMorgan Chase & Co. | 3.1% | 1.7% |
| International Business Machines Corp. | 2.8% | 2.2% |
| Cisco Systems, Inc. | 2.7% | 2.8% |
| Pfizer, Inc. | 2.6% | 2.4% |
| Procter & Gamble Co. (The) | 2.4% | 2.6% |
| Apple, Inc. | 2.2% | 1.6% |
| Amgen, Inc. | 2.0% | 2.2% |
| Johnson & Johnson | 1.9% | 2.0% |
| Honeywell International, Inc. | 1.8% | 1.9% |
| |
| Top Five Industries as of October 31, 2009 | | |
| | % of net assets | % of net assets |
| | as of 10/31/09 | as of 4/30/09 |
| Oil, Gas & Consumable Fuels | 10.3% | 10.9% |
| Pharmaceuticals | 8.4% | 9.0% |
| IT Services | 4.3% | 5.0% |
| Diversified Financial Services | 4.3% | 2.7% |
| Computers & Peripherals | 4.1% | 3.7% |
| |
| Types of Investments in Portfolio | | |
| | % of net assets | % of net assets |
| | as of 10/31/09 | as of 4/30/09 |
| Common Stocks & Futures | 98.5% | 98.6% |
| Temporary Cash Investments | 1.8% | 1.5% |
| Other Assets and Liabilities | (0.3)% | (0.1)% |
24
|
| Shareholder Fee Examples (Unaudited) |
Fund shareholders may incur two types of costs: (1) transaction costs, including sales charges (loads) on purchase payments and redemption/ exchange fees; and (2) ongoing costs, including management fees; distribution and service (12b-1) fees; and other fund expenses. This example is intended to help you understand your ongoing costs (in dollars) of investing in your fund and to compare these costs with the ongoing cost of investing in other mutual funds.
The example is based on an investment of $1,000 made at the beginning of the period and held for the entire period from May 1, 2009 to October 31, 2009.
Actual Expenses
The table provides information about actual account values and actual expenses for each class. You may use the information, together with the amount you invested, to estimate the expenses that you paid over the period. First, identify the share class you own. Then simply divide your account value by $1,000 (for example, an $8,600 account value divided by $1,000 = 8.6), then multiply the result by the number under the heading “Expenses Paid During Period” to estimate the expenses you paid on your account during this period.
If you hold Investor Class shares of any American Century Investments fund, or Institutional Class shares of the American Century Diversified Bond Fund, in an American Century Investments account (i.e., not a financial intermediary or retirement plan account), American Century Investments may charge you a $12.50 semiannual account maintenance fee if the value of those shares is less than $10,000. We will redeem shares automatically in one of your accounts to pay the $12.50 fee. In determining your total eligible investment amount, we will include your investments in all personal accounts (including American Century Investments Brokerage accounts) registered under your Social Security number. Personal accounts include individual accounts, joint accounts, UGMA/UTMA accounts, personal trusts, Coverdell Education Savings Accounts and IRAs (including traditional, Roth, Rollover, SEP-, SARSEP- and SIMPLE-IRAs), and certain other retirement accounts. If you have only business, business retirement, employer-sponsored or American Century Investments Brokerage accounts, you are currently not subject to this fee. We will not charge the fee as long as you choose to manage your accounts exclusively online. If you are subject to the Account Maintenance Fee, your account value could be reduced by the fee amount.
Hypothetical Example for Comparison Purposes
The table also provides information about hypothetical account values and hypothetical expenses based on the actual expense ratio of each class of your fund and an assumed rate of return of 5% per year before expenses, which is not the actual return of a fund’s share class. The hypothetical account values and expenses may not be used to estimate the actual ending account balance or expenses you paid for the period. You may use this information to compare the ongoing costs of investing in your fund and other funds.
To do so, compare this 5% hypothetical example with the 5% hypothetical examples that appear in the shareholder reports of the other funds.
25
Please note that the expenses shown in the table are meant to highlight your ongoing costs only and do not reflect any transactional costs, such as sales charges (loads) or redemption/exchange fees. Therefore, the table is useful in comparing ongoing costs only, and will not help you determine the relative total costs of owning different funds. In addition, if these transactional costs were included, your costs would have been higher.
| | | | |
| | Beginning | Ending | Expenses Paid | |
| | Account Value | Account Value | During Period* | Annualized |
| | 5/1/09 | 10/31/09 | 5/1/09 – 10/31/09 | Expense Ratio* |
| Select | | | | |
| Actual | | | | |
| Investor Class | $1,000 | $1,195.90 | $5.53 | 1.00% |
| Institutional Class | $1,000 | $1,197.00 | $4.43 | 0.80% |
| A Class | $1,000 | $1,194.40 | $6.91 | 1.25% |
| B Class | $1,000 | $1,189.80 | $11.04 | 2.00% |
| C Class | $1,000 | $1,189.60 | $11.04 | 2.00% |
| R Class | $1,000 | $1,192.90 | $8.29 | 1.50% |
| Hypothetical | | | | |
| Investor Class | $1,000 | $1,020.16 | $5.09 | 1.00% |
| Institutional Class | $1,000 | $1,021.17 | $4.08 | 0.80% |
| A Class | $1,000 | $1,018.90 | $6.36 | 1.25% |
| B Class | $1,000 | $1,015.12 | $10.16 | 2.00% |
| C Class | $1,000 | $1,015.12 | $10.16 | 2.00% |
| R Class | $1,000 | $1,017.64 | $7.63 | 1.50% |
| Capital Growth | | | | |
| Actual | | | | |
| Investor Class | $1,000 | $1,179.00 | $5.55 | 1.01% |
| Institutional Class | $1,000 | $1,179.20 | $4.45 | 0.81% |
| A Class | $1,000 | $1,178.10 | $6.92 | 1.26% |
| B Class | $1,000 | $1,172.80 | $11.01 | 2.01% |
| C Class | $1,000 | $1,174.30 | $11.02 | 2.01% |
| R Class | $1,000 | $1,175.80 | $8.28 | 1.51% |
| Hypothetical | | | | |
| Investor Class | $1,000 | $1,020.11 | $5.14 | 1.01% |
| Institutional Class | $1,000 | $1,021.12 | $4.13 | 0.81% |
| A Class | $1,000 | $1,018.85 | $6.41 | 1.26% |
| B Class | $1,000 | $1,015.07 | $10.21 | 2.01% |
| C Class | $1,000 | $1,015.07 | $10.21 | 2.01% |
| R Class | $1,000 | $1,017.59 | $7.68 | 1.51% |
| * Expenses are equal to the class’s annualized expense ratio listed in the table above, multiplied by the average account value over the period, |
26
| | | | |
| | Beginning | Ending | Expenses Paid | |
| | Account Value | Account Value | During Period* | Annualized |
| | 5/1/09 | 10/31/09 | 5/1/09 – 10/31/09 | Expense Ratio* |
| Focused Growth | | | | |
| Actual | | | | |
| Investor Class | $1,000 | $1,167.10 | $5.46 | 1.00% |
| Institutional Class | $1,000 | $1,168.70 | $4.37 | 0.80% |
| A Class | $1,000 | $1,165.60 | $6.82 | 1.25% |
| B Class | $1,000 | $1,162.90 | $10.90 | 2.00% |
| C Class | $1,000 | $1,162.90 | $10.90 | 2.00% |
| R Class | $1,000 | $1,165.60 | $8.19 | 1.50% |
| Hypothetical | | | | |
| Investor Class | $1,000 | $1,020.16 | $5.09 | 1.00% |
| Institutional Class | $1,000 | $1,021.17 | $4.08 | 0.80% |
| A Class | $1,000 | $1,018.90 | $6.36 | 1.25% |
| B Class | $1,000 | $1,015.12 | $10.16 | 2.00% |
| C Class | $1,000 | $1,015.12 | $10.16 | 2.00% |
| R Class | $1,000 | $1,017.64 | $7.63 | 1.50% |
| Fundamental Equity | | | | |
| Actual | | | | |
| Investor Class | $1,000 | $1,187.60 | $5.57 | 1.01% |
| Institutional Class | $1,000 | $1,188.60 | $4.47 | 0.81% |
| A Class | $1,000 | $1,186.50 | $6.94 | 1.26% |
| B Class | $1,000 | $1,181.40 | $11.05 | 2.01% |
| C Class | $1,000 | $1,181.40 | $11.05 | 2.01% |
| R Class | $1,000 | $1,184.70 | $8.32 | 1.51% |
| Hypothetical | | | | |
| Investor Class | $1,000 | $1,020.11 | $5.14 | 1.01% |
| Institutional Class | $1,000 | $1,021.12 | $4.13 | 0.81% |
| A Class | $1,000 | $1,018.85 | $6.41 | 1.26% |
| B Class | $1,000 | $1,015.07 | $10.21 | 2.01% |
| C Class | $1,000 | $1,015.07 | $10.21 | 2.01% |
| R Class | $1,000 | $1,017.59 | $7.68 | 1.51% |
| * | Expenses are equal to the class’s annualized expense ratio listed in the table above, multiplied by the average account value over the period, multiplied by 184, the number of days in the most recent fiscal half-year, divided by 365, to reflect the one-half year period. |
27
| | | | | | |
| Select | | | | | | |
| |
| OCTOBER 31, 2009 | | | | | | |
| | Shares | Value | | | Shares | Value |
| Common Stocks — 99.8% | | | ELECTRICAL EQUIPMENT — 3.6% | |
| | | | | ABB Ltd. ADR(1) | 1,438,092 | $ 26,647,845 |
| AEROSPACE & DEFENSE — 3.3% | | | | | |
| General Dynamics Corp. | 493,548 | $ 30,945,460 | | Emerson Electric Co. | 827,421 | 31,235,142 |
| Rockwell Collins, Inc. | 431,104 | 21,719,019 | | | | 57,882,987 |
| | | 52,664,479 | | ENERGY EQUIPMENT & SERVICES — 2.6% | |
| BEVERAGES — 4.4% | | | | Schlumberger Ltd. | 412,367 | 25,649,227 |
| Coca-Cola Co. (The) | 861,270 | 45,914,304 | | Transocean Ltd.(1) | 204,221 | 17,136,184 |
| Diageo plc | 1,556,791 | 25,373,021 | | | | 42,785,411 |
| | | 71,287,325 | | FOOD & STAPLES RETAILING — 5.0% | |
| BIOTECHNOLOGY — 2.3% | | | | Costco Wholesale Corp. | 307,548 | 17,484,104 |
| Genzyme Corp.(1) | 161,000 | 8,146,600 | | CVS Caremark Corp. | 516,944 | 18,248,123 |
| Gilead Sciences, Inc.(1) | 697,800 | 29,691,390 | | Wal-Mart Stores, Inc. | 892,536 | 44,341,188 |
| | | 37,837,990 | | | | 80,073,415 |
| CAPITAL MARKETS — 4.4% | | | | HEALTH CARE EQUIPMENT & SUPPLIES — 2.4% |
| Bank of New York | | | | Baxter International, Inc. | 368,700 | 19,931,922 |
| Mellon Corp. (The) | 1,157,176 | 30,850,312 | | Medtronic, Inc. | 537,300 | 19,181,610 |
| Franklin Resources, Inc. | 378,919 | 39,646,295 | | | | 39,113,532 |
| | | 70,496,607 | | HEALTH CARE PROVIDERS & SERVICES — 4.2% |
| CHEMICALS — 2.9% | | | | Medco Health | | |
| | | | | Solutions, Inc.(1) | 700,115 | 39,290,454 |
| Monsanto Co. | 435,100 | 29,230,018 | | | | |
| Potash Corp. of | | | | UnitedHealth Group, Inc. | 1,124,374 | 29,177,505 |
| Saskatchewan, Inc. | 194,053 | 18,004,237 | | | | 68,467,959 |
| | | 47,234,255 | | HOTELS, RESTAURANTS & LEISURE — 3.9% | |
| COMMERCIAL SERVICES & SUPPLIES — 0.4% | | International Game | | |
| Stericycle, Inc.(1) | 114,300 | 5,985,891 | | Technology | 1,124,800 | 20,066,432 |
| COMMUNICATIONS EQUIPMENT — 4.2% | | | McDonald’s Corp. | 475,655 | 27,878,140 |
| | | | | Yum! Brands, Inc. | 438,359 | 14,443,929 |
| Cisco Systems, Inc.(1) | 1,627,456 | 37,187,369 | | | | |
| | | | | | | 62,388,501 |
| QUALCOMM, Inc. | 742,490 | 30,746,511 | | HOUSEHOLD DURABLES — 0.4% | |
| | | 67,933,880 | | Harman International | | |
| COMPUTERS & PERIPHERALS — 10.7% | | | Industries, Inc. | 176,200 | 6,626,882 |
| Apple, Inc.(1) | 352,000 | 66,352,000 | | HOUSEHOLD PRODUCTS — 2.2% | |
| EMC Corp.(1) | 2,285,226 | 37,637,672 | | Colgate-Palmolive Co. | 456,017 | 35,856,617 |
| Hewlett-Packard Co. | 940,625 | 44,642,063 | | INSURANCE — 1.1% | | |
| Teradata Corp.(1) | 890,123 | 24,816,629 | | Travelers Cos., Inc. (The) | 371,200 | 18,482,048 |
| | | 173,448,364 | | INTERNET SOFTWARE & SERVICES — 5.4% | |
| CONSTRUCTION & ENGINEERING — 0.3% | | | Baidu, Inc. ADR(1) | 61,673 | 23,307,460 |
| Fluor Corp. | 106,100 | 4,712,962 | | Google, Inc., Class A(1) | 118,338 | 63,443,369 |
| DIVERSIFIED CONSUMER SERVICES — 0.9% | | | | 86,750,829 |
| ITT Educational | | | | IT SERVICES — 2.4% | | |
| Services, Inc.(1) | 164,200 | 14,835,470 | | | | |
| | | | | MasterCard, Inc., Class A | 180,579 | 39,550,413 |
| DIVERSIFIED FINANCIAL SERVICES — 2.8% | | | LEISURE EQUIPMENT & PRODUCTS — 1.1% | |
| CME Group, Inc. | 57,988 | 17,547,748 | | Hasbro, Inc. | 654,453 | 17,846,933 |
| Hong Kong Exchanges | | | | | | |
| and Clearing Ltd. | 537,000 | 9,440,325 | | MACHINERY — 1.1% | | |
| JPMorgan Chase & Co. | 447,679 | 18,699,552 | | Parker-Hannifin Corp. | 337,637 | 17,881,256 |
| | | 45,687,625 | | | | |
28
| | | | | | |
| Select | | | | | | |
| | Shares | Value | | | Shares | Value |
| METALS & MINING — 1.1% | | | | SPECIALTY RETAIL — 3.8% | | |
| Freeport-McMoRan | | | | Lowe’s Cos., Inc. | 1,631,700 | $ 31,932,369 |
| Copper & Gold, Inc.(1) | 253,300 | $ 18,582,088 | | TJX Cos., Inc. (The) | 789,421 | 29,484,874 |
| MULTILINE RETAIL — 0.9% | | | | | | 61,417,243 |
| Kohl’s Corp.(1) | 256,800 | 14,694,096 | | TEXTILES, APPAREL & LUXURY GOODS — 0.9% |
| OIL, GAS & CONSUMABLE FUELS — 2.4% | | | Coach, Inc. | 424,300 | 13,989,171 |
| EOG Resources, Inc. | 111,900 | 9,137,754 | | TOBACCO — 1.8% | | |
| Occidental Petroleum Corp. | 397,008 | 30,124,967 | | Philip Morris | | |
| | | 39,262,721 | | International, Inc. | 617,174 | 29,229,361 |
| PERSONAL PRODUCTS — 0.8% | | | TRANSPORTATION INFRASTRUCTURE — 0.3% |
| Mead Johnson | | | | China Merchants Holdings | | |
| Nutrition Co., Class A | 311,388 | 13,090,752 | | International Co. Ltd. | 1,539,973 | 4,917,663 |
| PHARMACEUTICALS — 4.7% | | | | TOTAL COMMON STOCKS | | |
| Abbott Laboratories | 507,197 | 25,648,952 | | (Cost $1,527,007,147) | | 1,614,891,991 |
| Allergan, Inc. | 472,390 | 26,571,938 | | Temporary Cash Investments — 0.1% |
| Johnson & Johnson | 389,680 | 23,010,604 | | JPMorgan U.S. Treasury | | |
| | | 75,231,494 | | Plus Money Market Fund | | |
| PROFESSIONAL SERVICES — 1.1% | | | Agency Shares | 89,080 | 89,080 |
| Robert Half | | | | Repurchase Agreement, Bank of America | |
| International, Inc. | 660,959 | 15,334,249 | | Securities, LLC, (collateralized by various | |
| | | | | U.S. Treasury obligations, 1.875%-3.625%, | |
| Verisk Analytics, Inc., | | | | 7/15/13-4/15/28, valued at $1,234,284), | |
| Class A(1) | 72,486 | 1,988,291 | | in a joint trading account at 0.05%, | |
| | | 17,322,540 | | dated 10/30/09, due 11/2/09 | | |
| SEMICONDUCTORS & SEMICONDUCTOR | | | (Delivery value $1,200,005) | | 1,200,000 |
| EQUIPMENT — 2.6% | | | | TOTAL TEMPORARY | | |
| Applied Materials, Inc. | 1,145,399 | 13,973,868 | | CASH INVESTMENTS | | |
| Linear Technology Corp. | 1,084,100 | 28,056,508 | | (Cost $1,289,080) | | 1,289,080 |
| | | 42,030,376 | | TOTAL INVESTMENT | | |
| | | | | SECURITIES — 99.9% | | |
| SOFTWARE — 7.4% | | | | (Cost $1,528,296,227) | | 1,616,181,071 |
| Adobe Systems, Inc.(1) | 1,010,500 | 33,285,870 | | OTHER ASSETS | | |
| Microsoft Corp. | 1,699,930 | 47,139,059 | | AND LIABILITIES — 0.1% | | 1,614,850 |
| Nintendo Co. Ltd. | 65,400 | 16,677,056 | | TOTAL NET ASSETS — 100.0% | | $1,617,795,921 |
| Oracle Corp. | 1,051,700 | 22,190,870 | | | | |
| | | 119,292,855 | | | | |
29
| | | | |
| Select | | | | |
| |
| Forward Foreign Currency Exchange Contracts | | |
| Contracts to Sell | Settlement Date | Value | Unrealized Gain (Loss) |
| 11,512,469 | GBP for USD | 11/30/09 | $18,891,732 | $ (23,322) |
| 800,496,000 | JPY for USD | 11/30/09 | 8,894,145 | (105,985) |
| | | | $27,785,877 | $(129,307) |
| (Value on Settlement Date $27,656,570) | | | |
| |
| Notes to Schedule of Investments | | |
| ADR = American Depositary Receipt | | | |
| GBP = British Pound | | | |
| JPY = Japanese Yen | | | |
| USD = United States Dollar | | | |
| (1) Non-income producing. | | | |
| |
| Industry classifications are unaudited. | | | |
| |
| |
| See Notes to Financial Statements. | | | |
30
| | | | | | |
| Capital Growth | | | | | | |
| |
| OCTOBER 31, 2009 | | | | | | |
| Shares | Value | | | Shares | Value |
| Common Stocks — 98.2% | | | | COMPUTERS & PERIPHERALS — 9.7% | |
| | | | | Apple, Inc.(1) | 7,000 | $ 1,319,500 |
| AEROSPACE & DEFENSE — 1.9% | | | | | | |
| Honeywell International, Inc. | 7,400 | $ 265,586 | | Dell, Inc.(1) | 36,600 | 530,334 |
| Rockwell Collins, Inc. | 8,637 | 435,132 | | EMC Corp.(1) | 22,500 | 370,575 |
| | | 700,718 | | Hewlett-Packard Co. | 14,941 | 709,100 |
| AIR FREIGHT & LOGISTICS — 1.0% | | | Lexmark International, Inc., | | |
| | | | | Class A(1) | 5,300 | 135,150 |
| United Parcel Service, Inc., | | | | | | |
| Class B | 7,200 | 386,496 | | NetApp, Inc.(1) | 12,025 | 325,276 |
| AUTO COMPONENTS — 1.1% | | | | QLogic Corp.(1) | 15,500 | 271,870 |
| BorgWarner, Inc. | 14,100 | 427,512 | | | | 3,661,805 |
| BEVERAGES — 5.3% | | | | CONSUMER FINANCE — 1.4% | | |
| Coca-Cola Co. (The) | 19,300 | 1,028,883 | | American Express Co. | 15,200 | 529,568 |
| PepsiCo, Inc. | 15,900 | 962,745 | | DIVERSIFIED — 0.7% | | |
| | | 1,991,628 | | iShares Russell 1000 | | |
| BIOTECHNOLOGY — 3.9% | | | | Growth Index Fund | 5,700 | 260,604 |
| Alexion | | | | ELECTRICAL EQUIPMENT — 0.5% | |
| Pharmaceuticals, Inc.(1) | 4,566 | 202,776 | | Rockwell Automation, Inc. | 4,922 | 201,556 |
| Amgen, Inc.(1) | 13,133 | 705,636 | | ELECTRONIC EQUIPMENT, | | |
| Gilead Sciences, Inc.(1) | 8,700 | 370,185 | | INSTRUMENTS & COMPONENTS — 0.9% | |
| Talecris Biotherapeutics | | | | Jabil Circuit, Inc. | 26,700 | 357,246 |
| Holdings Corp.(1) | 4,926 | 98,816 | | ENERGY EQUIPMENT & SERVICES — 1.3% | |
| Vertex | | | | Schlumberger Ltd. | 6,600 | 410,520 |
| Pharmaceuticals, Inc.(1) | 2,800 | 93,968 | | Transocean Ltd.(1) | 1,000 | 83,910 |
| | | 1,471,381 | | | | 494,430 |
| CAPITAL MARKETS — 2.1% | | | | FOOD & STAPLES RETAILING — 3.1% | |
| Charles Schwab Corp. (The) | 18,100 | 313,854 | | Walgreen Co. | 16,800 | 635,544 |
| Goldman Sachs | | | | Wal-Mart Stores, Inc. | 10,800 | 536,544 |
| Group, Inc. (The) | 2,800 | 476,476 | | | | 1,172,088 |
| | | 790,330 | | FOOD PRODUCTS — 3.7% | | |
| CHEMICALS — 1.4% | | | | Archer-Daniels-Midland Co. | 10,300 | 310,236 |
| Airgas, Inc. | 3,700 | 164,132 | | General Mills, Inc. | 8,400 | 553,728 |
| Celanese Corp., Series A | 13,810 | 379,085 | | Kellogg Co. | 10,395 | 535,758 |
| | | 543,217 | | | | 1,399,722 |
| COMMERCIAL BANKS — 1.3% | | | | HEALTH CARE EQUIPMENT & SUPPLIES — 4.4% |
| Wells Fargo & Co. | 17,496 | 481,490 | | Alcon, Inc. | 1,700 | 242,743 |
| COMMUNICATIONS EQUIPMENT — 5.9% | | | Baxter International, Inc. | 11,448 | 618,879 |
| Arris Group, Inc.(1) | 13,100 | 134,406 | | Becton, Dickinson & Co. | 1,400 | 95,704 |
| Cisco Systems, Inc.(1) | 42,100 | 961,985 | | Covidien plc | 6,600 | 277,992 |
| F5 Networks, Inc.(1) | 7,200 | 323,208 | | Edwards | | |
| Palm, Inc.(1) | 10,407 | 120,825 | | Lifesciences Corp.(1) | 4,168 | 320,686 |
| QUALCOMM, Inc. | 16,900 | 699,829 | | Gen-Probe, Inc.(1) | 2,719 | 113,436 |
| | | 2,240,253 | | | | 1,669,440 |
31
| | | | | | |
| Capital Growth | | | | | | |
| Shares | Value | | | Shares | Value |
| HEALTH CARE PROVIDERS & SERVICES — 2.0% | | OIL, GAS & CONSUMABLE FUELS — 2.9% | |
| Express Scripts, Inc.(1) | 9,300 | $ 743,256 | | Apache Corp. | 2,445 | $ 230,123 |
| HOTELS, RESTAURANTS & LEISURE — 1.1% | | | Exxon Mobil Corp. | 4,514 | 323,518 |
| Chipotle Mexican | | | | Occidental Petroleum Corp. | 5,337 | 404,972 |
| Grill, Inc., Class A(1) | 1,400 | 114,086 | | Quicksilver Resources, Inc.(1) | 9,429 | 115,034 |
| Starwood Hotels & | | | | | | 1,073,647 |
| Resorts Worldwide, Inc. | 9,801 | 284,817 | | PERSONAL PRODUCTS — 0.4% | |
| | | 398,903 | | Mead Johnson Nutrition Co., | | |
| HOUSEHOLD DURABLES — 1.1% | | | | Class A | 3,301 | 138,774 |
| Whirlpool Corp. | 5,700 | 408,063 | | PHARMACEUTICALS — 5.4% | | |
| HOUSEHOLD PRODUCTS — 3.1% | | | | Abbott Laboratories | 21,900 | 1,107,483 |
| Colgate-Palmolive Co. | 3,700 | 290,931 | | Johnson & Johnson | 11,400 | 673,170 |
| Procter & Gamble Co. (The) | 15,092 | 875,336 | | Novo Nordisk A/S B Shares | 3,900 | 242,538 |
| | | 1,166,267 | | | | 2,023,191 |
| INDUSTRIAL CONGLOMERATES — 1.5% | | | ROAD & RAIL — 0.8% | | |
| 3M Co. | 7,600 | 559,132 | | Union Pacific Corp. | 5,394 | 297,425 |
| INSURANCE — 1.2% | | | | SEMICONDUCTORS & SEMICONDUCTOR | |
| Aflac, Inc. | 10,700 | 443,943 | | EQUIPMENT — 2.6% | | |
| INTERNET & CATALOG RETAIL — 0.7% | | | Broadcom Corp., Class A(1) | 7,100 | 188,931 |
| Amazon.com, Inc.(1) | 2,300 | 273,263 | | Cree, Inc.(1) | 4,800 | 202,080 |
| INTERNET SOFTWARE & SERVICES — 3.8% | | | Linear Technology Corp. | 18,719 | 484,448 |
| Google, Inc., Class A(1) | 2,700 | 1,447,524 | | Skyworks Solutions, Inc.(1) | 8,300 | 86,569 |
| IT SERVICES — 1.2% | | | | | | 962,028 |
| International Business | | | | SOFTWARE — 7.5% | | |
| Machines Corp. | 3,700 | 446,257 | | Adobe Systems, Inc.(1) | 9,254 | 304,827 |
| LIFE SCIENCES TOOLS & SERVICES — 0.7% | | | Microsoft Corp. | 63,500 | 1,760,855 |
| Thermo Fisher | | | | Oracle Corp. | 30,200 | 637,220 |
| Scientific, Inc.(1) | 5,800 | 261,000 | | | | |
| | | | | salesforce.com, inc.(1) | 2,500 | 141,875 |
| MACHINERY — 2.5% | | | | | | |
| Caterpillar, Inc. | 2,400 | 132,144 | | | | 2,844,777 |
| Eaton Corp. | 5,000 | 302,250 | | SPECIALTY RETAIL — 3.3% | | |
| | | | | Abercrombie & Fitch Co., | | |
| Illinois Tool Works, Inc. | 11,248 | 516,508 | | Class A | 7,500 | 246,150 |
| | | 950,902 | | Chico’s FAS, Inc.(1) | 14,000 | 167,300 |
| MEDIA — 0.7% | | | | Home Depot, Inc. (The) | 12,000 | 301,080 |
| Scripps Networks | | | | | | |
| Interactive, Inc., Class A | 7,373 | 278,405 | | J. Crew Group, Inc.(1) | 7,327 | 298,795 |
| METALS & MINING — 1.4% | | | | Lowe’s Cos., Inc. | 12,027 | 235,368 |
| Freeport-McMoRan | | | | | | 1,248,693 |
| Copper & Gold, Inc.(1) | 2,500 | 183,400 | | TEXTILES, APPAREL & LUXURY GOODS — 0.5% |
| Newmont Mining Corp. | 8,162 | 354,721 | | Polo Ralph Lauren Corp. | 2,312 | 172,059 |
| | | 538,121 | | WIRELESS TELECOMMUNICATION SERVICES — 1.3% |
| MULTILINE RETAIL — 2.9% | | | | American Tower Corp., | | |
| | | | | Class A(1) | 12,800 | 471,296 |
| Kohl’s Corp.(1) | 8,300 | 474,926 | | | | |
| Target Corp. | 12,900 | 624,747 | | TOTAL COMMON STOCKS | | |
| | | | | (Cost $32,199,763) | | 37,026,083 |
| | | 1,099,673 | | | | |
32
| | | | | |
| Capital Growth | | | | | |
| Shares | | Value | | |
| Temporary Cash Investments — 1.2% | | |
| JPMorgan U.S. Treasury | | | | | |
| Plus Money Market Fund | | | | | |
| Agency Shares | 42,117 | $ 42,117 | | |
| Repurchase Agreement, Bank of America | | | | |
| Securities, LLC, (collateralized by various | | | | |
| U.S. Treasury obligations, 1.875%-3.625%, | | | | |
| 7/15/13-4/15/28, valued at $411,428), | | | | | |
| in a joint trading account at 0.05%, | | | | | |
| dated 10/30/09, due 11/2/09 | | | | | |
| (Delivery value $400,002) | | | 400,000 | | |
| TOTAL TEMPORARY | | | | | |
| CASH INVESTMENTS | | | | | |
| (Cost $442,117) | | | 442,117 | | |
| TOTAL INVESTMENT | | | | | |
| SECURITIES — 99.4% | | | | | |
| (Cost $32,641,880) | | | 37,468,200 | | |
| OTHER ASSETS | | | | | |
| AND LIABILITIES — 0.6% | | | 216,796 | | |
| TOTAL NET ASSETS — 100.0% | | $37,684,996 | | |
| |
| Forward Foreign Currency Exchange Contracts | | |
| Contracts to Sell | Settlement Date | Value | Unrealized Gain (Loss) |
| 790,920 DKK for USD | | 11/30/09 | $156,310 | $814 |
| (Value on Settlement Date $157,124) | | | | | |
| |
| Notes to Schedule of Investments | | | |
| DKK = Danish Krone | | | | | |
| USD = United States Dollar | | | | | |
| (1) Non-income producing. | | | | | |
| |
| Industry classifications are unaudited. | | | | | |
| |
| |
| See Notes to Financial Statements. | | | | | |
33
| | | | | | |
| Focused Growth | | | | | | |
| |
| OCTOBER 31, 2009 | | | | | | |
| Shares | Value | | Shares | Value |
| Common Stocks — 98.3% | | | | FOOD & STAPLES RETAILING — 0.5% | |
| AEROSPACE & DEFENSE — 0.8% | | | | Walgreen Co. | 1,728 | $ 65,370 |
| Honeywell International, Inc. | 2,755 | $ 98,877 | | FOOD PRODUCTS — 6.6% | | |
| AIR FREIGHT & LOGISTICS — 0.7% | | | Archer-Daniels-Midland Co. | 4,058 | 122,227 |
| United Parcel Service, Inc., | | | | General Mills, Inc. | 5,795 | 382,007 |
| Class B | 1,797 | 96,463 | | Kellogg Co. | 7,004 | 360,986 |
| AUTO COMPONENTS — 1.2% | | | | | | 865,220 |
| BorgWarner, Inc. | 4,992 | 151,357 | | HEALTH CARE EQUIPMENT & SUPPLIES — 1.1% |
| BEVERAGES — 4.7% | | | | Alcon, Inc. | 178 | 25,417 |
| Coca-Cola Co. (The) | 11,433 | 609,493 | | Baxter International, Inc. | 1,697 | 91,740 |
| BIOTECHNOLOGY — 3.2% | | | | Gen-Probe, Inc.(1) | 549 | 22,904 |
| Alexion | | | | | | 140,061 |
| Pharmaceuticals, Inc.(1) | 353 | 15,677 | | HEALTH CARE PROVIDERS & SERVICES — 3.3% |
| Amgen, Inc.(1) | 7,589 | 407,757 | | Express Scripts, Inc.(1) | 5,386 | 430,449 |
| | | 423,434 | | HOTELS, RESTAURANTS & LEISURE — 0.7% | |
| CAPITAL MARKETS — 2.3% | | | | Starwood Hotels & | | |
| Goldman Sachs | | | | Resorts Worldwide, Inc. | 2,957 | 85,930 |
| Group, Inc. (The) | 1,783 | 303,413 | | HOUSEHOLD DURABLES — 1.0% | | |
| CHEMICALS — 1.7% | | | | Whirlpool Corp. | 1,767 | 126,500 |
| Celanese Corp., Series A | 8,205 | 225,227 | | HOUSEHOLD PRODUCTS — 1.1% | | |
| COMMERCIAL BANKS — 1.3% | | | | Procter & Gamble Co. (The) | 2,464 | 142,912 |
| Wells Fargo & Co. | 6,331 | 174,229 | | INDUSTRIAL CONGLOMERATES — 1.3% | |
| COMMUNICATIONS EQUIPMENT — 4.2% | | | 3M Co. | 2,289 | 168,402 |
| Arris Group, Inc.(1) | 4,100 | 42,066 | | INSURANCE — 1.2% | | |
| F5 Networks, Inc.(1) | 939 | 42,152 | | Aflac, Inc. | 3,786 | 157,081 |
| QUALCOMM, Inc. | 11,262 | 466,359 | | INTERNET SOFTWARE & SERVICES — 3.5% | |
| | | 550,577 | | Google, Inc., Class A(1) | 853 | 457,310 |
| COMPUTERS & PERIPHERALS — 11.0% | | | IT SERVICES — 3.5% | | |
| Apple, Inc.(1) | 3,187 | 600,749 | | International Business | | |
| Dell, Inc.(1) | 6,502 | 94,214 | | Machines Corp. | 3,830 | 461,936 |
| EMC Corp.(1) | 22,477 | 370,196 | | MACHINERY — 3.0% | | |
| Hewlett-Packard Co. | 4,358 | 206,831 | | Illinois Tool Works, Inc. | 8,669 | 398,080 |
| NetApp, Inc.(1) | 5,980 | 161,759 | | MEDIA — 1.9% | | |
| | | | | Scripps Networks | | |
| | | 1,433,749 | | Interactive, Inc., Class A | 6,549 | 247,290 |
| CONSUMER FINANCE — 1.9% | | | | MULTILINE RETAIL — 4.9% | | |
| American Express Co. | 7,158 | 249,385 | | Kohl’s Corp.(1) | 6,717 | 384,347 |
| DIVERSIFIED — 2.3% | | | | Target Corp. | 5,446 | 263,750 |
| iShares Russell 1000 | | | | | | |
| Growth Index Fund | 6,544 | 299,192 | | | | 648,097 |
| ELECTRONIC EQUIPMENT, | | | | OIL, GAS & CONSUMABLE FUELS — 2.9% | |
| INSTRUMENTS & COMPONENTS — 1.6% | | | Apache Corp. | 2,525 | 237,653 |
| Jabil Circuit, Inc. | 15,908 | 212,849 | | Occidental Petroleum Corp. | 1,599 | 121,332 |
| ENERGY EQUIPMENT & SERVICES — 0.7% | | | Quicksilver Resources, Inc.(1) | 1,422 | 17,349 |
| Schlumberger Ltd. | 597 | 37,133 | | | | 376,334 |
| Transocean Ltd.(1) | 728 | 61,087 | | | | |
| | | 98,220 | | | | |
34
| | | | | | |
| Focused Growth | | | | | |
| | Shares | Value | | | Shares | Value |
| PHARMACEUTICALS — 6.9% | | | | SPECIALTY RETAIL — 3.3% | | |
| Abbott Laboratories | 11,200 | $ 566,384 | | Chico’s FAS, Inc.(1) | 12,305 | $ 147,045 |
| Novo Nordisk A/S B Shares | 5,347 | 332,526 | | J. Crew Group, Inc.(1) | 1,278 | 52,117 |
| | | 898,910 | | Lowe’s Cos., Inc. | 12,146 | 237,697 |
| ROAD & RAIL — 2.6% | | | | | | 436,859 |
| Union Pacific Corp. | 6,164 | 339,883 | | WIRELESS TELECOMMUNICATION SERVICES — 2.2% |
| SEMICONDUCTORS & | | | | American Tower Corp., | | |
| SEMICONDUCTOR EQUIPMENT — 2.1% | | | Class A(1) | 7,758 | 285,650 |
| Broadcom Corp., Class A(1) | 2,282 | 60,724 | | TOTAL INVESTMENT | | |
| Linear Technology Corp. | 3,527 | 91,279 | | SECURITIES — 98.3% | | |
| Skyworks Solutions, Inc.(1) | 11,480 | 119,736 | | (Cost $11,621,204) | | 12,864,678 |
| | | | | OTHER ASSETS | | |
| | | 271,739 | | AND LIABILITIES — 1.7% | | 227,149 |
| SOFTWARE — 7.1% | | | | TOTAL NET ASSETS — 100.0% | | $13,091,827 |
| Microsoft Corp. | 16,437 | 455,798 | | | | |
| Oracle Corp. | 16,912 | 356,843 | | | | |
| salesforce.com, inc.(1) | 2,142 | 121,559 | | | | |
| | | 934,200 | | | | |
| | | |
| Forward Foreign Currency Exchange Contracts | | |
| Contracts to Sell | Settlement Date | Value | Unrealized Gain (Loss) |
| 1,084,372 DKK for USD | 11/30/09 | $214,305 | $1,116 |
| (Value on Settlement Date $215,421) | | | |
| | |
| Notes to Schedule of Investments | | |
| DKK = Danish Krone | | | |
| USD = United States Dollar | | | |
| (1) Non-income producing. | | | |
| |
| Industry classifications are unaudited. | | | |
| |
| |
| See Notes to Financial Statements. | | | |
35
| | | | | | |
| Fundamental Equity | | | | | |
| |
| OCTOBER 31, 2009 | | | | | | |
| | Shares | Value | | | Shares | Value |
| Common Stocks — 95.8% | | | COMMERCIAL SERVICES & SUPPLIES — 0.1% |
| AEROSPACE & DEFENSE — 3.4% | | | Knoll, Inc. | 32,800 | $ 321,440 |
| General Dynamics Corp. | 35,800 | $ 2,244,660 | | COMMUNICATIONS EQUIPMENT — 3.1% | |
| | | | | Cisco Systems, Inc.(1)(2) | 255,900 | 5,847,315 |
| Honeywell International, Inc. | 112,200 | 4,026,858 | | | | |
| United Technologies Corp. | 19,800 | 1,216,710 | | QUALCOMM, Inc. | 21,000 | 869,610 |
| | | 7,488,228 | | | | 6,716,925 |
| AIR FREIGHT & LOGISTICS — 0.1% | | | COMPUTERS & PERIPHERALS — 4.1% | |
| United Parcel Service, Inc., | | | | Apple, Inc.(1) | 25,400 | 4,787,900 |
| Class B | 2,600 | 139,568 | | EMC Corp.(1) | 192,900 | 3,177,063 |
| AIRLINES — 0.3% | | | | Hewlett-Packard Co. | 20,700 | 982,422 |
| AirTran Holdings, Inc.(1) | 66,300 | 280,449 | | | | 8,947,385 |
| Allegiant Travel Co.(1) | 7,300 | 275,283 | | CONSTRUCTION & ENGINEERING — 0.6% | |
| | | 555,732 | | EMCOR Group, Inc.(1) | 13,900 | 328,318 |
| AUTOMOBILES — 0.2% | | | | Fluor Corp. | 22,900 | 1,017,218 |
| Ford Motor Co.(1) | 77,800 | 544,600 | | Foster Wheeler AG(1) | 2,800 | 78,372 |
| BEVERAGES — 0.4% | | | | | | 1,423,908 |
| Coca-Cola Enterprises, Inc. | 50,800 | 968,756 | | CONTAINERS & PACKAGING — 0.5% | |
| BIOTECHNOLOGY — 2.2% | | | | Pactiv Corp.(1) | 33,900 | 782,751 |
| Amgen, Inc.(1) | 83,600 | 4,491,828 | | Sealed Air Corp. | 18,200 | 349,986 |
| Gilead Sciences, Inc.(1) | 6,000 | 255,300 | | | | 1,132,737 |
| | | 4,747,128 | | DIVERSIFIED FINANCIAL SERVICES — 4.3% | |
| CAPITAL MARKETS — 3.6% | | | | Bank of America Corp. | 156,800 | 2,286,144 |
| BlackRock, Inc. | 6,500 | 1,407,185 | | Citigroup, Inc. | 80,800 | 330,472 |
| Charles Schwab Corp. (The) | 31,400 | 544,476 | | JPMorgan Chase & Co. | 161,200 | 6,733,324 |
| Goldman Sachs | | | | NYSE Euronext | 4,300 | 111,155 |
| Group, Inc. (The) | 19,100 | 3,250,247 | | | | 9,461,095 |
| Knight Capital | | | | DIVERSIFIED TELECOMMUNICATION | |
| Group, Inc., Class A(1) | 27,200 | 458,320 | | SERVICES — 2.0% | | |
| TD Ameritrade | | | | AT&T, Inc. | 67,600 | 1,735,292 |
| Holding Corp.(1) | 117,700 | 2,271,610 | | Qwest Communications | | |
| | | 7,931,838 | | International, Inc. | 297,100 | 1,066,589 |
| CHEMICALS — 0.7% | | | | Verizon | | |
| Eastman Chemical Co. | 1,700 | 89,267 | | Communications, Inc. | 57,600 | 1,704,384 |
| International Flavors & | | | | | | 4,506,265 |
| Fragrances, Inc. | 31,700 | 1,207,453 | | ELECTRIC UTILITIES — 1.1% | | |
| Terra Industries, Inc. | 10,500 | 333,585 | | FirstEnergy Corp. | 53,800 | 2,328,464 |
| | | 1,630,305 | | ELECTRICAL EQUIPMENT — 1.2% | |
| COMMERCIAL BANKS — 2.6% | | | | Belden, Inc. | 17,000 | 390,150 |
| Bank of Hawaii Corp. | 18,300 | 812,520 | | Emerson Electric Co. | 54,600 | 2,061,150 |
| BB&T Corp. | 41,300 | 987,483 | | GrafTech International Ltd.(1) | 15,800 | 213,300 |
| U.S. Bancorp. | 72,300 | 1,678,806 | | | | 2,664,600 |
| Wells Fargo & Co. | 84,800 | 2,333,696 | | ELECTRONIC EQUIPMENT, | | |
| | | 5,812,505 | | INSTRUMENTS & COMPONENTS — 0.2% | |
| | | | | Avnet, Inc.(1) | 21,300 | 527,814 |
36
| | | | | | |
| Fundamental Equity | | | | | |
| Shares | Value | | | Shares | Value |
| ENERGY EQUIPMENT & SERVICES — 2.4% | | | INSURANCE — 2.5% | | |
| ENSCO International, Inc. | 7,400 | $ 338,846 | | ACE Ltd.(1) | 17,600 | $ 903,936 |
| Nabors Industries Ltd.(1) | 61,100 | 1,272,713 | | Aflac, Inc. | 29,800 | 1,236,402 |
| National Oilwell Varco, Inc.(1) | 4,600 | 188,554 | | American Financial | | |
| Noble Corp. | 48,600 | 1,979,964 | | Group, Inc. | 9,000 | 221,400 |
| Patterson-UTI Energy, Inc. | 61,500 | 958,170 | | Assurant, Inc. | 17,700 | 529,761 |
| Rowan Cos., Inc. | 22,800 | 530,100 | | Chubb Corp. (The) | 10,500 | 509,460 |
| | | 5,268,347 | | Unum Group | 103,200 | 2,058,840 |
| FOOD & STAPLES RETAILING — 1.7% | | | | | 5,459,799 |
| Safeway, Inc. | 18,500 | 413,105 | | INTERNET & CATALOG RETAIL — 0.7% | |
| SUPERVALU, INC. | 17,600 | 279,312 | | Amazon.com, Inc.(1) | 12,500 | 1,485,125 |
| SYSCO Corp. | 13,700 | 362,365 | | INTERNET SOFTWARE & SERVICES — 0.7% | |
| Wal-Mart Stores, Inc. | 54,600 | 2,712,528 | | eBay, Inc.(1) | 10,900 | 242,743 |
| | | 3,767,310 | | Google, Inc., Class A(1) | 2,300 | 1,233,076 |
| FOOD PRODUCTS — 3.8% | | | | | | 1,475,819 |
| Archer-Daniels-Midland Co. | 108,700 | 3,274,044 | | IT SERVICES — 4.3% | | |
| H.J. Heinz Co. | 90,400 | 3,637,696 | | Accenture plc, Class A | 30,200 | 1,119,816 |
| Kraft Foods, Inc., Class A | 55,200 | 1,519,104 | | International Business | | |
| | | 8,430,844 | | Machines Corp. | 50,800 | 6,126,988 |
| HEALTH CARE EQUIPMENT & SUPPLIES — 1.2% | | Western Union Co. (The) | 122,400 | 2,224,008 |
| Baxter International, Inc.(2) | 20,600 | 1,113,636 | | | | 9,470,812 |
| STERIS Corp. | 49,900 | 1,460,074 | | LEISURE EQUIPMENT & PRODUCTS — 0.3% | |
| | | 2,573,710 | | Hasbro, Inc. | 23,300 | 635,391 |
| HEALTH CARE PROVIDERS & SERVICES — 1.5% | | LIFE SCIENCES TOOLS & SERVICES — 0.1% | |
| Aetna, Inc.(2) | 33,800 | 879,814 | | Thermo Fisher | | |
| | | | | Scientific, Inc.(1) | 4,600 | 207,000 |
| Medco Health | | | | MACHINERY — 2.0% | | |
| Solutions, Inc.(1) | 16,400 | 920,368 | | | | |
| UnitedHealth Group, Inc. | 61,100 | 1,585,545 | | Dover Corp. | 85,700 | 3,229,176 |
| | | 3,385,727 | | Oshkosh Corp. | 20,600 | 643,956 |
| HOTELS, RESTAURANTS & LEISURE — 0.8% | | | Wabtec Corp. | 12,700 | 466,852 |
| Bally Technologies, Inc.(1) | 6,500 | 256,035 | | | | 4,339,984 |
| | | | | MEDIA — 2.8% | | |
| Cheesecake | | | | | | |
| Factory, Inc. (The)(1) | 4,800 | 87,264 | | Comcast Corp., Class A | 156,000 | 2,262,000 |
| WMS Industries, Inc.(1) | 33,000 | 1,319,340 | | Omnicom Group, Inc. | 15,500 | 531,340 |
| Yum! Brands, Inc. | 5,900 | 194,405 | | Time Warner Cable, Inc. | 21,000 | 828,240 |
| | | 1,857,044 | | Time Warner, Inc.(2) | 83,700 | 2,521,044 |
| HOUSEHOLD DURABLES — 0.2% | | | | | | 6,142,624 |
| D.R. Horton, Inc. | 33,900 | 371,544 | | METALS & MINING — 0.6% | | |
| HOUSEHOLD PRODUCTS — 2.7% | | | | Cliffs Natural Resources, Inc. | 30,800 | 1,095,556 |
| Kimberly-Clark Corp. | 10,900 | 666,644 | | Reliance Steel | | |
| | | | | & Aluminum Co. | 6,900 | 251,712 |
| Procter & Gamble Co. (The) | 89,200 | 5,173,600 | | | | |
| | | | | | | 1,347,268 |
| | | 5,840,244 | | | | |
| | | | | MULTILINE RETAIL — 1.0% | | |
| INDUSTRIAL CONGLOMERATES — 1.4% | | | | | |
| | | | | Big Lots, Inc.(1)(2) | 49,400 | 1,237,470 |
| General Electric Co. | 219,600 | 3,131,496 | | | | |
| | | | | Kohl’s Corp.(1) | 16,700 | 955,574 |
| | | | | | | 2,193,044 |
37
| | | | | | |
| Fundamental Equity | | | | | |
| | Shares | Value | | | Shares | Value |
| MULTI-UTILITIES — 2.1% | | | | SEMICONDUCTORS & | | |
| CenterPoint Energy, Inc.(2) | 97,200 | $ 1,224,720 | | SEMICONDUCTOR EQUIPMENT — 2.8% | |
| NSTAR | 50,500 | 1,562,975 | | Altera Corp. | 53,400 | $ 1,056,786 |
| Public Service Enterprise | | | | Atmel Corp.(1) | 99,500 | 370,140 |
| Group, Inc. | 3,700 | 110,260 | | Intel Corp. | 31,700 | 605,787 |
| Xcel Energy, Inc. | 90,900 | 1,714,374 | | Marvell Technology | | |
| | | 4,612,329 | | Group Ltd.(1) | 155,300 | 2,130,716 |
| OIL, GAS & CONSUMABLE FUELS — 10.3% | | | National | | |
| Alpha Natural | | | | Semiconductor Corp. | 73,200 | 947,208 |
| Resources, Inc.(1) | 25,300 | 859,441 | | Xilinx, Inc. | 49,300 | 1,072,275 |
| Anadarko Petroleum Corp. | 10,500 | 639,765 | | | | 6,182,912 |
| Chevron Corp. | 50,600 | 3,872,924 | | SOFTWARE — 2.7% | | |
| ConocoPhillips | 51,200 | 2,569,216 | | Microsoft Corp. | 62,300 | 1,727,579 |
| Exxon Mobil Corp. | 125,600 | 9,001,752 | | Oracle Corp. | 126,300 | 2,664,930 |
| Murphy Oil Corp. | 14,600 | 892,644 | | Red Hat, Inc.(1) | 19,400 | 500,714 |
| Occidental Petroleum Corp. | 33,900 | 2,572,332 | | Symantec Corp.(1) | 64,600 | 1,135,668 |
| Peabody Energy Corp. | 17,200 | 680,948 | | | | 6,028,891 |
| Sunoco, Inc. | 6,500 | 200,200 | | SPECIALTY RETAIL — 2.5% | | |
| Tesoro Corp. | 17,500 | 247,450 | | Gap, Inc. (The) | 121,200 | 2,586,408 |
| Valero Energy Corp. | 24,200 | 438,020 | | Genesco, Inc.(1) | 12,700 | 331,089 |
| W&T Offshore, Inc. | 30,800 | 358,820 | | Home Depot, Inc. (The) | 33,800 | 848,042 |
| Williams Cos., Inc. (The) | 12,500 | 235,625 | | Lowe’s Cos., Inc. | 93,300 | 1,825,881 |
| | | 22,569,137 | | | | 5,591,420 |
| PAPER & FOREST PRODUCTS — 0.8% | | | TEXTILES, APPAREL & LUXURY GOODS — 0.2% |
| International Paper Co. | 77,400 | 1,726,794 | | Coach, Inc. | 13,100 | 431,907 |
| PHARMACEUTICALS — 8.4% | | | | THRIFTS & MORTGAGE FINANCE — 0.3% | |
| Abbott Laboratories | 73,800 | 3,732,066 | | Hudson City Bancorp., Inc. | 51,500 | 676,710 |
| Bristol-Myers Squibb Co. | 74,600 | 1,626,280 | | TOBACCO — 0.9% | | |
| Eli Lilly & Co. | 49,100 | 1,669,891 | | Altria Group, Inc.(2) | 79,600 | 1,441,556 |
| Johnson & Johnson | 70,400 | 4,157,120 | | Philip Morris | | |
| Pfizer, Inc. | 333,600 | 5,681,208 | | International, Inc. | 9,100 | 430,976 |
| Schering-Plough Corp. | 61,000 | 1,720,200 | | | | 1,872,532 |
| | | 18,586,765 | | TRADING COMPANIES & DISTRIBUTORS — 0.4% |
| REAL ESTATE INVESTMENT TRUSTS (REITs) — 0.6% | | United Rentals, Inc.(1) | 86,200 | 818,038 |
| Annaly Capital | | | | WIRELESS TELECOMMUNICATION SERVICES — 1.0% |
| Management, Inc. | 36,200 | 612,142 | | American Tower | | |
| Public Storage | 10,300 | 758,080 | | Corp., Class A(1) | 59,600 | 2,194,472 |
| | | 1,370,222 | | TOTAL COMMON STOCKS | | |
| ROAD & RAIL — 1.4% | | | | (Cost $199,851,681) | | 210,901,564 |
| Avis Budget Group, Inc.(1) | 43,000 | 361,200 | | | | |
| Con-way, Inc. | 4,600 | 151,754 | | | | |
| Norfolk Southern Corp. | 10,400 | 484,848 | | | | |
| Ryder System, Inc. | 28,200 | 1,143,510 | | | | |
| Union Pacific Corp. | 15,700 | 865,698 | | | | |
| | | 3,007,010 | | | | |
38
| | | | | |
| Fundamental Equity | | | |
| | Shares | Value | | |
| Temporary Cash Investments — | | | |
| Segregated For Futures Contracts — 2.7% | | |
| Repurchase Agreement, Bank of America | | | |
| Securities, LLC, (collateralized by various | | | |
| U.S. Treasury obligations, 1.875%-3.625%, | | | |
| 7/15/13-4/15/28, valued at $6,163,189), | | | |
| in a joint trading account at 0.05%, | | | | |
| dated 10/30/09, due 11/2/09 | | | | |
| (Delivery value $5,992,025) | | | | |
| (Cost $5,992,000) | | $ 5,992,000 | | |
| Temporary Cash Investments — 1.8% | | |
| JPMorgan U.S. Treasury | | | | |
| Plus Money Market Fund | | | | |
| Agency Shares(2) | 96,000 | 96,000 | | |
| Repurchase Agreement, Bank of America | | | |
| Securities, LLC, (collateralized by various | | | |
| U.S. Treasury obligations, 1.875%-3.625%, | | | |
| 7/15/13-4/15/28, valued at $3,916,793), | | | |
| in a joint trading account at 0.05%, | | | | |
| dated 10/30/09, due 11/2/09 | | | | |
| (Delivery value $3,808,016)(2) | | 3,808,000 | | |
| TOTAL TEMPORARY | | | | |
| CASH INVESTMENTS | | | | |
| (Cost $3,904,000) | | 3,904,000 | | |
| TOTAL INVESTMENT | | | | |
| SECURITIES — 100.3% | | | | |
| (Cost $209,747,681) | | 220,797,564 | | |
| OTHER ASSETS | | | | |
| AND LIABILITIES — (0.3)% | | (641,471) | | |
| TOTAL NET ASSETS — 100.0% | | $220,156,093 | | |
| |
| Futures Contracts | | | | |
| | | | | Underlying Face | |
| | Contracts Purchased | Expiration Date | Amount at Value | Unrealized Gain (Loss) |
| | 116 S&P 500 E-Mini Futures | December 2009 | $5,991,400 | $(70,544) |
| |
| Notes to Schedule of Investments | | |
| (1) | Non-income producing. | | | | |
| (2) | Security, or a portion thereof, has been segregated for futures contracts. At the period end, the aggregate value of securities pledged |
| | was $5,992,000. | | | | |
| |
| |
| Industry classifications are unaudited. | | | | |
| |
| |
| |
| See Notes to Financial Statements. | | | | |
39
|
| Statement of Assets and Liabilities |
| | | | |
| OCTOBER 31, 2009 | | | | |
| | | | Focused | Fundamental |
| | Select | Capital Growth | Growth | Equity |
| Assets | | | | |
| Investment securities, at value (cost of | | | | |
| $1,528,296,227, $32,641,880, $11,621,204 | | | | |
| and $209,747,681, respectively) | $1,616,181,071 | $37,468,200 | $12,864,678 | $220,797,564 |
| Cash | 22,384 | 104 | — | 7,915 |
| Receivable for investments sold | 13,256,860 | 635,629 | 955,060 | — |
| Receivable for capital shares sold | 194,253 | 72,346 | 2,068 | 137,984 |
| Receivable for forward foreign currency | | | | |
| exchange contracts | — | 814 | 1,116 | — |
| Dividends and interest receivable | 1,675,832 | 32,045 | 13,832 | 263,284 |
| | 1,631,330,400 | 38,209,138 | 13,836,754 | 221,206,747 |
| | | | |
| Liabilities | | | | |
| Disbursements in excess | | | | |
| of demand deposit cash | — | — | 17,939 | — |
| Payable for investments purchased | 11,565,488 | 278,735 | 668,217 | — |
| Payable for capital shares redeemed | 418,632 | 204,700 | 46,949 | 632,212 |
| Payable for variation margin | | | | |
| on futures contracts | — | — | — | 168,332 |
| Payable for forward foreign | | | | |
| currency exchange contracts | 129,307 | — | — | — |
| Accrued management fees | 1,414,636 | 32,305 | 11,611 | 196,017 |
| Service fees (and distribution fees — | | | | |
| A Class and R Class) payable | 4,879 | 5,956 | 115 | 41,149 |
| Distribution fees payable | 1,537 | 2,446 | 96 | 12,944 |
| | 13,534,479 | 524,142 | 744,927 | 1,050,654 |
| | | | | |
| Net Assets | $1,617,795,921 | $37,684,996 | $13,091,827 | $220,156,093 |
| |
| |
| See Notes to Financial Statements. | | | | |
40
| | | | |
| OCTOBER 31, 2009 | | | | |
| | | | Focused | Fundamental |
| | Select | Capital Growth | Growth | Equity |
| Net Assets Consist of: | | | | |
| Capital (par value and paid-in surplus) | $1,716,158,877 | $36,322,723 | $14,388,781 | $338,676,174 |
| Undistributed net investment income | 8,429,153 | — | — | 1,675,640 |
| Accumulated net realized loss | | | | |
| on investment and foreign | | | | |
| currency transactions | (194,565,302) | (3,464,989) | (2,541,628) | (131,175,060) |
| Net unrealized appreciation on | | | | |
| investments and translation of assets | | | | |
| and liabilities in foreign currencies | 87,773,193 | 4,827,262 | 1,244,674 | 10,979,339 |
| | $1,617,795,921 | $37,684,996 | $13,091,827 | $220,156,093 |
| | | | |
| Investor Class, $0.01 Par Value | | | | |
| Net assets | $1,591,620,953 | $10,971,643 | $12,541,358 | $37,918,262 |
| Shares outstanding | 52,047,418 | 1,096,405 | 1,436,311 | 3,586,131 |
| Net asset value per share | $30.58 | $10.01 | $8.73 | $10.57 |
| | | | |
| Institutional Class, $0.01 Par Value | | | | |
| Net assets | $3,949,539 | $74,136 | $19,880 | $273,831 |
| Shares outstanding | 127,671 | 7,360 | 2,277 | 25,857 |
| Net asset value per share | $30.94 | $10.07 | $8.73 | $10.59 |
| | | | | |
| A Class, $0.01 Par Value | | | | |
| Net assets | $19,823,822 | $21,272,504 | $373,164 | $159,959,019 |
| Shares outstanding | 658,320 | 2,145,194 | 42,720 | 15,152,090 |
| Net asset value per share | $30.11 | $9.92 | $8.74 | $10.56 |
| Maximum offering price | | | | |
| (net asset value divided by 0.9425) | $31.95 | $10.53 | $9.27 | $11.20 |
| | | | | |
| B Class, $0.01 Par Value | | | | |
| Net assets | $2,044,871 | $828,979 | $47,452 | $4,043,414 |
| Shares outstanding | 70,139 | 87,291 | 5,449 | 388,102 |
| Net asset value per share | $29.15 | $9.50 | $8.71 | $10.42 |
| | | | | |
| C Class, $0.01 Par Value | | | | |
| Net assets | $313,910 | $3,236,305 | $90,382 | $15,311,315 |
| Shares outstanding | 10,755 | 340,789 | 10,378 | 1,469,120 |
| Net asset value per share | $29.19 | $9.50 | $8.71 | $10.42 |
| | | | | |
| R Class, $0.01 Par Value | | | | |
| Net assets | $42,826 | $1,301,429 | $19,591 | $2,650,252 |
| Shares outstanding | 1,416 | 132,361 | 2,243 | 251,874 |
| Net asset value per share | $30.24 | $9.83 | $8.73 | $10.52 |
| |
| |
| See Notes to Financial Statements. | | | | |
41
| | | | |
| YEAR ENDED OCTOBER 31, 2009 | | | | |
| | | | Focused | Fundamental |
| | Select | Capital Growth | Growth | Equity |
| Investment Income (Loss) | | | | |
| Income: | | | | |
| Dividends (net of foreign taxes | | | | |
| withheld of $198,075, $2,031, | | | | |
| $1,294 and $–, respectively) | $ 25,998,710 | $ 300,165 | $ 151,834 | $ 5,450,630 |
| Interest | 15,148 | 622 | 279 | 13,813 |
| | 26,013,858 | 300,787 | 152,113 | 5,464,443 |
| | | | | |
| Expenses: | | | | |
| Management fees | 14,766,888 | 208,780 | 101,335 | 2,294,905 |
| Distribution fees: | | | | |
| B Class | 15,725 | 5,135 | 269 | 28,200 |
| C Class | 2,436 | 10,499 | 578 | 121,557 |
| Service fees: | | | | |
| B Class | 5,242 | 1,712 | 90 | 9,400 |
| C Class | 812 | 3,499 | 192 | 40,519 |
| Distribution and service fees: | | | | |
| A Class | 44,815 | 32,917 | 508 | 426,708 |
| R Class | 158 | 1,130 | 86 | 8,133 |
| Directors’ fees and expenses | 58,997 | 1,458 | 410 | 17,362 |
| Other expenses | 2,502 | 40 | 12 | 398 |
| | 14,897,575 | 265,170 | 103,480 | 2,947,182 |
| | | | | |
| Net investment income (loss) | 11,116,283 | 35,617 | 48,633 | 2,517,261 |
| | | | | |
| Realized and Unrealized Gain (Loss) | | | | |
| Net realized gain (loss) on: | | | | |
| Investment transactions | (172,070,180) | (2,275,537) | (1,822,071) | (75,720,319) |
| Foreign currency transactions | (2,582,857) | (25,701) | (36,387) | — |
| Futures contract transactions | — | — | — | 251,294 |
| | (174,653,037) | (2,301,238) | (1,858,458) | (75,469,025) |
| | | | | |
| Change in net unrealized | | | | |
| appreciation (depreciation) on: | | | | |
| Investments | 413,029,118 | 6,914,476 | 3,323,214 | 84,926,073 |
| Translation of assets and liabilities | | | | |
| in foreign currencies | (578,386) | (3,893) | (3,079) | — |
| Futures contracts | — | — | — | 714,587 |
| | 412,450,732 | 6,910,583 | 3,320,135 | 85,640,660 |
| | | | | |
| Net realized and unrealized gain (loss) | 237,797,695 | 4,609,345 | 1,461,677 | 10,171,635 |
| | | | | |
| Net Increase (Decrease) in Net Assets | | | | |
| Resulting from Operations | $ 248,913,978 | $ 4,644,962 | $ 1,510,310 | $ 12,688,896 |
See Notes to Financial Statements.
42
|
| Statement of Changes in Net Assets |
| | | | |
| YEARS ENDED OCTOBER 31, 2009 AND OCTOBER 31, 2008 | | | |
| | Select | Capital Growth |
| Increase (Decrease) in Net Assets | 2009 | 2008 | 2009 | 2008 |
| Operations | | | | |
| Net investment income (loss) | $ 11,116,283 | $ 4,511,836 | $ 35,617 | $ (16,251) |
| Net realized gain (loss) | (174,653,037) | (6,149,877) | (2,301,238) | (1,136,485) |
| Change in net unrealized | | | | |
| appreciation (depreciation) | 412,450,732 | (980,353,950) | 6,910,583 | (3,059,242) |
| Net increase (decrease) in net assets | | | | |
| resulting from operations | 248,913,978 | (981,991,991) | 4,644,962 | (4,211,978) |
| | | | | |
| Distributions to Shareholders | | | | |
| From net investment income: | | | | |
| Investor Class | (14,095,648) | — | (9,938) | — |
| Institutional Class | (1,087,962) | — | (758) | — |
| A Class | (144,697) | — | (15,944) | — |
| B Class | (1,824) | — | — | — |
| C Class | (287) | — | — | — |
| R Class | (175) | — | — | — |
| From net realized gains: | | | | |
| Investor Class | — | (182,640,492) | — | (106,995) |
| Institutional Class | — | (12,086,566) | — | (2,469) |
| A Class | — | (3,075,006) | — | (239,050) |
| B Class | — | (404,171) | — | (71,895) |
| C Class | — | (75,080) | — | (55,027) |
| R Class | — | (2,305) | — | (2,746) |
| Decrease in net assets from distributions | (15,330,593) | (198,283,620) | (26,640) | (478,182) |
| | | | | |
| Capital Share Transactions | | | | |
| Net increase (decrease) in net assets | | | | |
| from capital share transactions | (181,643,233) | (21,933,432) | 21,332,418 | 10,484,948 |
| | | | | |
| Net increase (decrease) in net assets | 51,940,152 | (1,202,209,043) | 25,950,740 | 5,794,788 |
| | | | | |
| Net Assets | | | | |
| Beginning of period | 1,565,855,769 | 2,768,064,812 | 11,734,256 | 5,939,468 |
| End of period | $1,617,795,921 | $ 1,565,855,769 | $37,684,996 | $11,734,256 |
| | | | | |
| Undistributed net investment income | $8,429,153 | $14,926,494 | — | $11,900 |
| |
| |
| See Notes to Financial Statements. | | | | |
43
| | | | |
| YEARS ENDED OCTOBER 31, 2009 AND OCTOBER 31, 2008 | | | |
| | Focused Growth | Fundamental Equity |
| Increase (Decrease) in Net Assets | 2009 | 2008 | 2009 | 2008 |
| Operations | | | | |
| Net investment income (loss) | $ 48,633 | $ 24,599 | $ 2,517,261 | $ 3,374,617 |
| Net realized gain (loss) | (1,858,458) | (695,655) | (75,469,025) | (55,619,015) |
| Change in net unrealized | | | | |
| appreciation (depreciation) | 3,320,135 | (3,672,388) | 85,640,660 | (99,921,840) |
| Net increase (decrease) in net assets | | | | |
| resulting from operations | 1,510,310 | (4,343,444) | 12,688,896 | (152,166,238) |
| | | | | |
| Distributions to Shareholders | | | | |
| From net investment income: | | | | |
| Investor Class | (57,432) | (7,155) | (570,427) | (460,415) |
| Institutional Class | (145) | (63) | (8,437) | (2,800) |
| A Class | (1,030) | — | (2,467,422) | (1,508,022) |
| B Class | — | — | (21,956) | — |
| C Class | — | — | (100,095) | — |
| R Class | (34) | — | (4,280) | (1,563) |
| From net realized gains: | | | | |
| Investor Class | — | (1,516,407) | — | (1,329,674) |
| Institutional Class | — | (2,904) | — | (6,528) |
| A Class | — | (2,856) | — | (6,205,227) |
| B Class | — | (2,673) | — | (119,040) |
| C Class | — | (7,928) | — | (598,169) |
| R Class | — | (2,795) | �� | (11,182) |
| Decrease in net assets from distributions | (58,641) | (1,542,781) | (3,172,617) | (10,242,620) |
| | | | | |
| Capital Share Transactions | | | | |
| Net increase (decrease) in net assets | | | | |
| from capital share transactions | 2,447,525 | 1,519,415 | (69,431,177) | 112,091,766 |
| | | | | |
| Net increase (decrease) in net assets | 3,899,194 | (4,366,810) | (59,914,898) | (50,317,092) |
| | | | | |
| Net Assets | | | | |
| Beginning of period | 9,192,633 | 13,559,443 | 280,070,991 | 330,388,083 |
| End of period | $13,091,827 | $ 9,192,633 | $220,156,093 | $280,070,991 |
| | | | | |
| Undistributed net investment income | — | $43,333 | $1,675,640 | $2,338,066 |
| |
| |
| See Notes to Financial Statements. | | | | |
44
|
| Notes to Financial Statements |
OCTOBER 31, 2009
1. Organization and Summary of Significant Accounting Policies
Organization — American Century Mutual Funds, Inc. (the corporation) is registered under the Investment Company Act of 1940 (the 1940 Act) as an open-end management investment company. Select Fund (Select), Capital Growth Fund (Capital Growth), Focused Growth Fund (Focused Growth) and Fundamental Equity Fund (Fundamental Equity) (collectively, the funds) are four funds in a series issued by the corporation. The funds are diversified under the 1940 Act. The funds’ investment objective is to seek long-term capital growth. Income is a secondary objective of Fundamental Equity. Select, Capital Growth and Focused Growth pursue this objective by purchasing stocks of larger-sized companies that management believes will increase in value over time. Fundamental Equity generally invests in larger-sized companies using a quantitative model that combines fundamental measures of a stock’s value and growth potential. The following is a summary of the funds’ significant accounting policies.
Multiple Class — The funds are authorized to issue the Investor Class, the Institutional Class, the A Class, the B Class, the C Class and the R Class. The A Class may incur an initial sales charge. The A Class, B Class and C Class may be subject to a contingent deferred sales charge. The share classes differ principally in their respective sales charges and distribution and shareholder servicing expenses and arrangements. All shares of each fund represent an equal pro rata interest in the net assets of the class to which such shares belong, and have identical voting, dividend, liquidation and other rights and the same terms and conditions, except for class specific expenses and exclusive rights to vote on matters affecting only individual classes. Income, non-class specific expenses, and realized and unrealized capital gains and losse s of the funds are allocated to each class of shares based on their relative net assets.
Security Valuations — Securities traded primarily on a principal securities exchange are valued at the last reported sales price, or at the mean of the latest bid and asked prices where no last sales price is available. Depending on local convention or regulation, securities traded over-the-counter are valued at the mean of the latest bid and asked prices, the last sales price, or the official close price. Investments in open-end management investment companies are valued at the reported net asset value. Debt securities not traded on a principal securities exchange are valued through a commercial pricing service or at the mean of the most recent bid and asked prices. Discount notes may be valued through a commercial pricing service or at amortized cost, which approximates fair value. Securities traded on foreign securities exchanges a nd over-the-counter markets are normally completed before the close of business on days that the New York Stock Exchange (the Exchange) is open and may also take place on days when the Exchange is not open. If an event occurs after the value of a security was established but before the net asset value per share was determined that was likely to materially change the net asset value, that security would be valued as determined in accordance with procedures adopted by the Board of Directors. If the funds determine that the market price of a portfolio security is not readily available, or that the valuation methods mentioned above do not reflect the security’s fair value, such security is valued as determined by the Board of Directors or its designee, in accordance with procedures adopted by the Board of Directors, if such determination would materially impact a fund’s net asset value. Certain other circumstances may cause the funds to use alternative procedures to value a security such as: a security has been declared in default; trading in a security has been halted during the trading day; or there is a foreign market holiday and no trading will commence.
Security Transactions — For financial reporting purposes, security transactions are accounted for as of the trade date. Net realized gains and losses are determined on the identified cost basis, which is also used for federal income tax purposes.
Investment Income — Dividend income less foreign taxes withheld, if any, is recorded as of the ex-dividend date. Interest income is recorded on the accrual basis and includes accretion of discounts and amortization of premiums.
Exchange Traded Funds — The funds may invest in exchange traded funds (ETFs). ETFs are a type of index fund bought and sold on a securities exchange. An ETF trades like common stock and represents a fixed portfolio of securities designed to track the performance and
45
dividend yield of a particular domestic or foreign market index. A fund may purchase an ETF to temporarily gain exposure to a portion of the U.S. or a foreign market while awaiting purchase of underlying securities. The risks of owning an ETF generally reflect the risks of owning the underlying securities they are designed to track, although the lack of liquidity on an ETF could result in it being more volatile. Additionally, ETFs have fees and expenses that reduce their value.
Foreign Currency Translations — All assets and liabilities initially expressed in foreign currencies are translated into U.S. dollars at prevailing exchange rates at period end. The funds may enter into spot foreign currency exchange contracts to facilitate transactions denominated in a foreign currency. Purchases and sales of investment securities, dividend and interest income, spot foreign currency exchange contracts, and certain expenses are translated at the rates of exchange prevailing on the respective dates of such transactions. For assets and liabilities, other than investments in securities, net realized and unrealized gains and losses from foreign currency translations arise from changes in currency exchange rates.
Net realized and unrealized foreign currency exchange gains or losses occurring during the holding period of investment securities are a component of net realized gain (loss) on investment transactions and net unrealized appreciation (depreciation) on investments, respectively. Certain countries may impose taxes on the contract amount of purchases and sales of foreign currency contracts in their currency. The fund records the foreign tax expense, if any, as a reduction to the net realized gain (loss) on foreign currency transactions. Repurchase Agreements — The funds may enter into repurchase agreements with institutions that American Century Investment Management, Inc. (ACIM) (the investment advisor) has determined are creditworthy pursuant to criteria adopted by the Board of Directors. Each repurchase agreement is recorded at cost. Each fund requires that the collateral, represented by securities, received in a repurchase transaction be transferred to the custodian in a manner sufficient to enable each fund to obtain those securities in the event of a default under the repurchase agreement. ACIM monitors, on a daily basis, the securities transferred to ensure the value, including accrued interest, of the securities under each repurchase agreement is equal to or greater than amounts owed to each fund under each repurchase agreement.
Joint Trading Account — Pursuant to an Exemptive Order issued by the Securities and Exchange Commission, each fund, along with certain other funds in the American Century Investments family of funds, may transfer uninvested cash balances into a joint trading account. These balances are invested in one or more repurchase agreements that are collateralized by U.S. Treasury or Agency obligations.
Income Tax Status — It is each fund’s policy to distribute substantially all net investment income and net realized gains to shareholders and to otherwise qualify as a regulated investment company under provisions of the Internal Revenue Code. The funds are no longer subject to examination by tax authorities for years prior to 2006. Additionally, non-U.S. tax returns filed by the fund due to investments in certain foreign securities remain subject to examination by the relevant taxing authority for seven years from the date of filing. At this time, management believes there are no uncertain tax positions which, based on their technical merit, would not be sustained upon examination and for which it is reasonably possible that the total amounts of unrecognized tax benefits will significantly change in the next twelve months. Accor dingly, no provision has been made for federal or state income taxes. Interest and penalties associated with any federal or state income tax obligations, if any, are recorded as interest expense.
Distributions to Shareholders — Distributions to shareholders are recorded on the ex-dividend date. Distributions from net investment income and net realized gains, if any, are generally declared and paid annually.
Indemnifications — Under the corporation’s organizational documents, its officers and directors are indemnified against certain liabilities arising out of the performance of their duties to the funds. In addition, in the normal course of business, the funds enter into contracts that provide general indemnifications. The maximum exposure under these arrangements is unknown as this would involve future claims that may be made against a fund. The risk of material loss from such claims is considered by management to be remote.
46
Use of Estimates — The financial statements are prepared in conformity with accounting principles generally accepted in the United States of America, which may require management to make certain estimates and assumptions at the date of the financial statements. Actual results could differ from these estimates.
Subsequent Events — Management has evaluated events or transactions that may have occurred since October 31, 2009, that would merit recognition or disclosure in the financial statements. This evaluation was completed through December 28, 2009, the date the financial statements were issued.
2. Fees and Transactions with Related Parties
Management Fees — The corporation has entered into a Management Agreement with ACIM, under which ACIM provides the funds with investment advisory and management services in exchange for a single, unified management fee (the fee) per class. The Agreement provides that all expenses of the funds, except brokerage commissions, taxes, interest, fees and expenses of those directors who are not considered “interested persons” as defined in the 1940 Act (including counsel fees) and extraordinary expenses, will be paid by ACIM. The fee is computed and accrued daily based on the daily net assets of each specific class of shares of each fund and paid monthly in arrears. For funds with a stepped fee schedule, the rate of the fee is determined by applying a fee rate calculation formula. This formula takes into account each fund’s as sets as well as certain assets, if any, of other clients of the investment advisor outside the American Century Investments family of funds (such as subadvised funds and separate accounts) that have very similar investment teams and investment strategies (strategy assets). The annual management fee schedule for the funds ranges from 0.800% to 1.000% for the Investor Class, A Class, B Class, C Class and R Class. The Institutional Class is 0.200% less at each point within the range. The effective annual management fee for each class of the funds for the year ended October 31, 2009, was 1.00% for the Investor Class, A Class, B Class, C Class and R Class and 0.80% for the Institutional Class.
Distribution and Service Fees — The Board of Directors has adopted a separate Master Distribution and Individual Shareholder Services Plan for each of the A Class, B Class, C Class and R Class (collectively the plans), pursuant to Rule 12b-1 of the 1940 Act. The plans provide that the A Class will pay American Century Investment Services, Inc. (ACIS) an annual distribution and service fee of 0.25%. The plans provide that the B Class and C Class will each pay ACIS an annual distribution fee of 0.75% and service fee of 0.25%. The plans provide that the R Class will pay ACIS an annual distribution and service fee of 0.50%. The fees are computed and accrued daily based on each class’s daily net assets and paid monthly in arrears. The fees are used to pay financial intermediaries for distribution and individual shareholder services. F ees incurred under the plans during the year ended October 31, 2009, are detailed in the Statement of Operations.
Related Parties — Certain officers and directors of the corporation are also officers and/or directors, and, as a group, controlling stockholders of American Century Companies, Inc. (ACC), the parent of the corporation’s investment advisor, ACIM, the distributor of the corporation, ACIS, and the corporation’s transfer agent, American Century Services, LLC.
The funds are eligible to invest in a money market fund for temporary purposes, which is managed by J.P. Morgan Investment Management, Inc. (JPMIM). The funds have a Mutual Funds Services Agreement with J.P. Morgan Investor Services Co. (JPMIS) and a securities lending agreement with JPMorgan Chase Bank (JPMCB). JPMCB is a custodian of the funds. JPMIM, JPMIS and JPMCB are wholly owned subsidiaries of JPMorgan Chase & Co. (JPM). JPM is an equity investor in ACC.
47
3. Investment Transactions
Investment transactions, excluding short-term investments, for the year ended October 31, 2009, were as follows:
| | | | |
| | Select | Capital Growth | Focused Growth | Fundamental Equity |
| Purchases | $452,356,432 | $48,087,326 | $14,878,748 | $140,869,279 |
| Sales | $602,809,920 | $27,281,866 | $12,474,322 | $197,906,513 |
4. Capital Share Transactions
Transactions in shares of the funds were as follows:
| | | | |
| | Year ended October 31, 2009 | Year ended October 31, 2008 |
| | Shares | Amount | Shares | Amount |
| Select | | | | |
| Investor Class/Shares Authorized | 300,000,000 | | 300,000,000 | |
| Sold | 1,400,628 | $ 36,567,221 | 1,304,514 | $ 48,509,921 |
| Issued in reinvestment of distributions | 571,178 | 13,496,935 | 4,320,701 | 174,988,391 |
| Redeemed | (5,114,851) | (131,631,069) | (6,380,454) | (233,776,220) |
| | (3,143,045) | (81,566,913) | (755,239) | (10,277,908) |
| Institutional Class/Shares Authorized | 40,000,000 | | 40,000,000 | |
| Sold | 24,800 | 656,737 | 34,755 | 1,327,615 |
| Issued in reinvestment of distributions | 45,572 | 1,087,343 | 295,584 | 12,086,426 |
| Redeemed | (3,498,181) | (98,618,933) | (437,958) | (17,300,838) |
| | (3,427,809) | (96,874,853) | (107,619) | (3,886,797) |
| A Class/Shares Authorized | 75,000,000 | | 75,000,000 | |
| Sold | 108,639 | 2,795,413 | 118,060 | 4,363,693 |
| Issued in reinvestment of distributions | 6,049 | 140,997 | 75,309 | 3,009,333 |
| Redeemed | (208,719) | (5,214,096) | (390,494) | (14,148,255) |
| | (94,031) | (2,277,686) | (197,125) | (6,775,229) |
| B Class/Shares Authorized | 25,000,000 | | 25,000,000 | |
| Sold | 3,185 | 78,585 | 4,313 | 147,174 |
| Issued in reinvestment of distributions | 76 | 1,743 | 9,553 | 372,090 |
| Redeemed | (37,234) | (895,666) | (36,169) | (1,284,825) |
| | (33,973) | (815,338) | (22,303) | (765,561) |
| C Class/Shares Authorized | 25,000,000 | | 25,000,000 | |
| Sold | 2,023 | 54,994 | 1,687 | 60,784 |
| Issued in reinvestment of distributions | 9 | 204 | 1,459 | 56,859 |
| Redeemed | (7,003) | (170,151) | (10,144) | (359,726) |
| | (4,971) | (114,953) | (6,998) | (242,083) |
| R Class/Shares Authorized | 50,000,000 | | 50,000,000 | |
| Sold | 434 | 12,430 | 497 | 11,841 |
| Issued in reinvestment of distributions | 7 | 175 | 57 | 2,305 |
| Redeemed | (276) | (6,095) | — | — |
| | 165 | 6,510 | 554 | 14,146 |
| Net increase (decrease) | (6,703,664) | $(181,643,233) | (1,088,730) | $ (21,933,432) |
48
| | | | |
| | Year ended October 31, 2009 | Year ended October 31, 2008 |
| | Shares | Amount | Shares | Amount |
| Capital Growth | | | | |
| Investor Class/Shares Authorized | 300,000,000 | | 300,000,000 | |
| Sold | 1,117,499 | $ 9,975,284 | 215,390 | $ 2,431,606 |
| Issued in reinvestment of distributions | 1,270 | 9,794 | 8,465 | 106,995 |
| Redeemed | (281,276) | (2,531,353) | (45,062) | (489,244) |
| | 837,493 | 7,453,725 | 178,793 | 2,049,357 |
| Institutional Class/Shares Authorized | 50,000,000 | | 50,000,000 | |
| Sold | 5,333 | 48,461 | 12,176 | 111,615 |
| Issued in reinvestment of distributions | 98 | 758 | 195 | 2,469 |
| Redeemed | (12,698) | (93,153) | (86) | (751) |
| | (7,267) | (43,934) | 12,285 | 113,333 |
| A Class/Shares Authorized | 100,000,000 | | 100,000,000 | |
| Sold | 1,856,708 | 15,703,091 | 752,534 | 8,201,510 |
| Issued in reinvestment of distributions | 1,956 | 14,980 | 16,251 | 204,109 |
| Redeemed | (604,116) | (5,102,611) | (102,560) | (1,077,664) |
| | 1,254,548 | 10,615,460 | 666,225 | 7,327,955 |
| B Class/Shares Authorized | 100,000,000 | | 100,000,000 | |
| Sold | 27,631 | 227,843 | 38,464 | 429,211 |
| Issued in reinvestment of distributions | — | — | 5,124 | 62,361 |
| Redeemed | (31,949) | (249,202) | (14,941) | (159,518) |
| | (4,318) | (21,359) | 28,647 | 332,054 |
| C Class/Shares Authorized | 100,000,000 | | 100,000,000 | |
| Sold | 340,491 | 2,957,794 | 90,501 | 1,042,449 |
| Issued in reinvestment of distributions | — | — | 2,288 | 27,845 |
| Redeemed | (99,820) | (800,238) | (43,280) | (488,213) |
| | 240,671 | 2,157,556 | 49,509 | 582,081 |
| R Class/Shares Authorized | 60,000,000 | | 60,000,000 | |
| Sold | 133,558 | 1,262,814 | 7,340 | 80,595 |
| Issued in reinvestment of distributions | — | — | 220 | 2,746 |
| Redeemed | (11,015) | (91,844) | (278) | (3,173) |
| | 122,543 | 1,170,970 | 7,282 | 80,168 |
| Net increase (decrease) | 2,443,670 | $21,332,418 | 942,741 | $10,484,948 |
49
| | | | |
| | Year ended October 31, 2009 | Year ended October 31, 2008 |
| | Shares | Amount | Shares | Amount |
| Focused Growth | | | | |
| Investor Class/Shares Authorized | 50,000,000 | | 50,000,000 | |
| Sold | 654,311 | $ 5,116,668 | 336,040 | $ 3,456,085 |
| Issued in reinvestment of distributions | 8,124 | 55,893 | 136,093 | 1,498,366 |
| Redeemed | (366,700) | (2,889,415) | (366,840) | (3,763,936) |
| | 295,735 | 2,283,146 | 105,293 | 1,190,515 |
| Institutional Class/Shares Authorized | 10,000,000 | | 10,000,000 | |
| Issued in reinvestment of distributions | 21 | 145 | 270 | 2,967 |
| A Class/Shares Authorized | 10,000,000 | | 10,000,000 | |
| Sold | 44,859 | 360,028 | 31,644 | 286,449 |
| Issued in reinvestment of distributions | 149 | 1,030 | 259 | 2,856 |
| Redeemed | (33,521) | (216,714) | (2,656) | (26,633) |
| | 11,487 | 144,344 | 29,247 | 262,672 |
| B Class/Shares Authorized | 10,000,000 | | 10,000,000 | |
| Sold | 2,202 | 17,425 | 1,681 | 17,306 |
| Issued in reinvestment of distributions | — | — | 240 | 2,673 |
| Redeemed | (660) | (4,449) | — | — |
| | 1,542 | 12,976 | 1,921 | 19,979 |
| C Class/Shares Authorized | 10,000,000 | | 10,000,000 | |
| Sold | 3,456 | 29,290 | 4,409 | 45,159 |
| Issued in reinvestment of distributions | — | — | 714 | 7,928 |
| Redeemed | (2,490) | (22,410) | (1,603) | (12,600) |
| | 966 | 6,880 | 3,520 | 40,487 |
| R Class/Shares Authorized | 10,000,000 | | 10,000,000 | |
| Issued in reinvestment of distributions | 5 | 34 | 252 | 2,795 |
| Net increase (decrease) | 309,756 | $ 2,447,525 | 140,503 | $ 1,519,415 |
50
| | | | |
| | Year ended October 31, 2009 | Year ended October 31, 2008 |
| | Shares | Amount | Shares | Amount |
| Fundamental Equity | | | | |
| Investor Class/Shares Authorized | 200,000,000 | | 200,000,000 | |
| Sold | 2,936,657 | $ 25,135,556 | 3,296,777 | $ 44,594,062 |
| Issued in reinvestment of distributions | 57,636 | 509,506 | 110,977 | 1,604,732 |
| Redeemed | (3,188,093) | (28,688,549) | (3,065,757) | (38,176,168) |
| | (193,800) | (3,043,487) | 341,997 | 8,022,626 |
| Institutional Class/Shares Authorized | 25,000,000 | | 25,000,000 | |
| Sold | 6,979 | 64,975 | 142,328 | 1,942,574 |
| Issued in reinvestment of distributions | 843 | 7,449 | 86 | 1,242 |
| Redeemed | (41,167) | (356,339) | (101,427) | (1,214,364) |
| | (33,345) | (283,915) | 40,987 | 729,452 |
| A Class/Shares Authorized | 150,000,000 | | 150,000,000 | |
| Sold | 3,799,682 | 34,559,184 | 16,392,959 | 222,736,346 |
| Issued in reinvestment of distributions | 270,411 | 2,390,433 | 519,284 | 7,514,042 |
| Redeemed | (10,954,111) | (100,378,119) | (10,612,121) | (134,187,154) |
| | (6,884,018) | (63,428,502) | 6,300,122 | 96,063,234 |
| B Class/Shares Authorized | 25,000,000 | | 25,000,000 | |
| Sold | 32,197 | 295,530 | 198,253 | 2,653,019 |
| Issued in reinvestment of distributions | 2,063 | 18,109 | 6,509 | 93,530 |
| Redeemed | (74,926) | (674,371) | (92,429) | (1,143,924) |
| | (40,666) | (360,732) | 112,333 | 1,602,625 |
| C Class/Shares Authorized | 50,000,000 | | 50,000,000 | |
| Sold | 368,218 | 3,301,855 | 1,217,499 | 16,547,716 |
| Issued in reinvestment of distributions | 6,919 | 60,819 | 21,262 | 305,742 |
| Redeemed | (839,097) | (7,652,952) | (893,725) | (11,302,775) |
| | (463,960) | (4,290,278) | 345,036 | 5,550,683 |
| R Class/Shares Authorized | 10,000,000 | | 10,000,000 | |
| Sold | 241,830 | 2,219,424 | 16,662 | 211,942 |
| Issued in reinvestment of distributions | 485 | 4,280 | 882 | 12,745 |
| Redeemed | (27,315) | (247,967) | (8,751) | (101,541) |
| | 215,000 | 1,975,737 | 8,793 | 123,146 |
| Net increase (decrease) | (7,400,789) | $ (69,431,177) | 7,149,268 | $ 112,091,766 |
51
5. Fair Value Measurements
The funds’ securities valuation process is based on several considerations and may use multiple inputs to determine the fair value of the positions held by the funds. In conformity with accounting principles generally accepted in the United States of America, the inputs used to determine a valuation are classified into three broad levels as follows:
• Level 1 valuation inputs consist of actual quoted prices in an active market for identical securities;
• Level 2 valuation inputs consist of significant direct or indirect observable market data (including quoted prices for similar securities, evaluations of subsequent market events, interest rates, prepayment speeds, credit risk, etc.); or
• Level 3 valuation inputs consist of significant unobservable inputs (including a fund’s own assumptions).
The level classification is based on the lowest level input that is significant to the fair valuation measurement. The valuation inputs are not an indication of the risks associated with investing in these securities or other financial instruments.
The following is a summary of the valuation inputs used to determine the fair value of the funds’ securities and other financial instruments as of October 31, 2009:
| | | | |
| | Level 1 | Level 2 | Level 3 | |
| Select | | | | |
| Investment Securities | | | | |
| Domestic Common Stocks | $1,473,388,200 | — | | — |
| Foreign Common Stocks | 85,095,726 | $56,408,065 | | — |
| Temporary Cash Investments | 89,080 | 1,200,000 | | — |
| Total Value of Investment Securities | $1,558,573,006 | $57,608,065 | | — |
| |
| Other Financial Instruments | | | | |
| Total Unrealized Gain (Loss) on Forward | | | | |
| Foreign Currency Exchange Contracts | — | $(129,307) | | — |
| |
| Capital Growth | | | | |
| Investment Securities | | | | |
| Common Stocks | $36,783,545 | $242,538 | | — |
| Temporary Cash Investments | 42,117 | 400,000 | | — |
| Total Value of Investment Securities | $36,825,662 | $642,538 | | — |
| |
| Other Financial Instruments | | | | |
| Total Unrealized Gain (Loss) on Forward | | | | |
| Foreign Currency Exchange Contracts | — | $814 | | — |
| |
| Focused Growth | | | | |
| Investment Securities | | | | |
| Total Value of Common Stocks | $12,532,152 | $332,526 | | — |
| |
| Other Financial Instruments | | | | |
| Total Unrealized Gain (Loss) on Forward | | | | |
| Foreign Currency Exchange Contracts | — | $1,116 | | — |
52
| | | | |
| | Level 1 | Level 2 | Level 3 | |
| Fundamental Equity | | | | |
| Investment Securities | | | | |
| Common Stocks | $210,901,564 | — | — | |
| Temporary Cash Investments | 96,000 | $9,800,000 | — | |
| Total Value of Investment Securities | $210,997,564 | $9,800,000 | — | |
| |
| Other Financial Instruments | | | | |
| Total Unrealized Gain (Loss) on Futures Contracts | $(70,544) | — | — | |
6. Derivative Instruments
Equity Price Risk — Fundamental Equity is subject to equity price risk in the normal course of pursuing its investment objectives. A fund may enter into futures contracts based on an equity index in order to manage its exposure to changes in market conditions. A fund may purchase futures contracts to gain exposure to increases in market value or sell futures contracts to protect against a decline in market value. Upon entering into a futures contract, a fund is required to deposit either cash or securities in an amount equal to a certain percentage of the contract value (initial margin). Subsequent payments (variation margin) are made or received daily, in cash, by a fund. The variation margin is equal to the daily change in the contract value and is recorded as unrealized gains and losses. A fund recognizes a realized gain or loss when th e contract is closed or expires. Net realized and unrealized gains or losses occurring during the holding period of futures contracts are a component of net realized gain (loss) on futures contract transactions and change in net unrealized appreciation (depreciation) on futures contracts, respectively. One of the risks of entering into futures contracts is the possibility that the change in value of the contract may not correlate with the changes in value of the underlying securities. During the year ended October 31, 2009, Fundamental Equity purchased futures contracts.
Foreign Currency Risk — Select, Capital Growth and Focused Growth are subject to foreign currency exchange rate risk in the normal course of pursuing their investment objectives. The value of foreign investments held by a fund may be significantly affected by changes in foreign currency exchange rates. The dollar value of a foreign security generally decreases when the value of the dollar rises against the foreign currency in which the security is denominated and tends to increase when the value of the dollar declines against such foreign currency. A fund may enter into forward foreign currency exchange contracts to reduce a fund’s exposure to foreign currency exchange rate fluctuations. The net U.S. dollar value of foreign currency underlying all contractual commitments held by a fund and the resulting unrealized appreciation or depr eciation are determined daily using prevailing exchange rates. Realized gain or loss is recorded upon the termination of the contract. Net realized and unrealized gains or losses occurring during the holding period of forward foreign currency exchange contracts are a component of net realized gain (loss) on foreign currency transactions and change in net unrealized appreciation (depreciation) on translation of assets and liabilities in foreign currencies, respectively. A fund bears the risk of an unfavorable change in the foreign currency exchange rate underlying the forward contract. Additionally, losses, up to the fair value, may arise if the counterparties do not perform under the contract terms. The risk of loss from non-performance by the counterparty may be reduced by the use of master netting agreements. During the year ended October 31, 2009, Select, Capital Growth and Focused Growth participated in forward foreign currency exchange contracts.
53
| | | | |
| Value of Derivative Instruments as of October 31, 2009 | | |
| | Asset Derivatives | | Liability Derivatives | |
| Fund/Type | Location on Statement | | Location on Statement | |
| of Derivative | of Assets and Liabilities | Value | of Assets and Liabilities | Value |
| Select | | | | |
| Foreign Currency Risk | Receivable for forward foreign | | Payable for forward foreign | |
| | currency exchange contracts | — | currency exchange contracts | $129,307 |
| | | | | |
| Capital Growth | | | | |
| Foreign Currency Risk | Receivable for forward foreign | | Payable for forward foreign | |
| | currency exchange contracts | $814 | currency exchange contracts | — |
| | | | | |
| Focused Growth | | | | |
| Foreign Currency Risk | Receivable for forward foreign | | Payable for forward foreign | |
| | currency exchange contracts | $1,116 | currency exchange contracts | — |
| | | | | |
| Fundamental Equity | | | |
| Equity Price Risk | Receivable for variation margin | | Payable for variation margin | |
| | on futures contracts | — | on futures contracts | $168,332 |
Effect of Derivative Instruments on the Statement of Operations for the Year Ended October 31, 2009
| | | | |
| | | Change in Net Unrealized |
| | Net Realized Gain (Loss) | Appreciation (Depreciation) |
| Fund/Type | Location on Statement | Location on Statement | |
| of Derivative | of Operations | of Operations | |
| Select | | | |
| Foreign Currency Risk | Net realized gain (loss) on | Change in net unrealized | |
| | foreign currency transactions | appreciation (depreciation) | |
| | | on translation of assets and | |
| | | $(2,708,037) | liabilities in foreign currencies | $(544,909) |
| | | | | |
| Capital Growth | | | | |
| Foreign Currency Risk | Net realized gain (loss) on | | Change in net unrealized | |
| | foreign currency transactions | | appreciation (depreciation) | |
| | | | on translation of assets and | |
| | | $(26,154) | liabilities in foreign currencies | $(4,052) |
| | | | | |
| Focused Growth | | | | |
| Foreign Currency Risk | Net realized gain (loss) on | | Change in net unrealized | |
| | foreign currency transactions | | appreciation (depreciation) | |
| | | | on translation of assets and | |
| | | $(36,396) | liabilities in foreign currencies | $(3,163) |
| | | | | |
| Fundamental Equity | | | | |
| Equity Price Risk | Net realized gain (loss) on | | Change in net unrealized | |
| | futures contract transactions | | appreciation (depreciation) | |
| | | $251,294 | on futures contracts | $714,587 |
The derivative instruments at period end as disclosed in each funds’ Schedule of Investments are indicative of each fund’s typical volume.
54
7. Bank Line of Credit
The funds, along with certain other funds in the American Century Investments family of funds, had a $500,000,000 unsecured bank line of credit agreement with Bank of America, N.A. The line expired December 10, 2008, and was not renewed. The agreement allowed the funds to borrow money for temporary or emergency purposes to fund shareholder redemptions. Borrowings under the agreement were subject to interest at the Federal Funds rate plus 0.40%. The funds did not borrow from the line during the year ended October 31, 2009.
8. Interfund Lending
The funds, along with certain other funds in the American Century Investments family of funds, may participate in an interfund lending program, pursuant to an Exemptive Order issued by the Securities and Exchange Commission (SEC). This program provides an alternative credit facility allowing the funds to borrow from or lend to other funds in the American Century Investments family of funds that permit such transactions. Interfund lending transactions are subject to each fund’s investment policies and borrowing and lending limits. The interfund loan rate earned/paid on interfund lending transactions is determined daily based on the average of certain current market rates. Interfund lending transactions normally extend only overnight, but can have a maximum duration of seven days. The program is subject to annual approval by the Board of Directors. During the year ended October 31, 2009, the funds did not utilize the program .
9. Risk Factors
There are certain risks involved in investing in foreign securities. These risks include those resulting from future adverse political, social, and economic developments, fluctuations in currency exchange rates, the possible imposition of exchange controls, and other foreign laws or restrictions.
Focused Growth’s investment process may result in high portfolio turnover, high commission costs and high capital gains distributions. In addition, its investment approach may involve higher volatility and risk.
10. Federal Tax Information
The tax character of distributions paid during the years ended October 31, 2009 and October 31, 2008 were as follows:
| | | | |
| | | Select | Capital Growth |
| | 2009 | 2008 | 2009 | 2008 |
| Distributions Paid From | | | | |
| Ordinary income | $15,330,593 | $79,550,077 | $26,640 | $165,021 |
| Long-term capital gains | — | $118,733,543 | — | $313,161 |
| |
| | Focused Growth | Fundamental Equity |
| | 2009 | 2008 | 2009 | 2008 |
| Distributions Paid From | | | | |
| Ordinary income | $58,641 | $1,178,297 | $3,172,617 | $9,581,019 |
| Long-term capital gains | — | $364,484 | — | $661,601 |
55
The book-basis character of distributions made during the year from net investment income or net realized gains may differ from their ultimate characterization for federal income tax purposes. These differences reflect the differing character of certain income items and net realized gains and losses for financial statement and tax purposes, and may result in reclassification among certain capital accounts on the financial statements.
As of October 31, 2009, the federal tax cost of investments and the components of distributable earnings on a tax-basis were as follows:
| | | | |
| | Select | Capital Growth | Focused Growth | Fundamental Equity |
| Federal tax cost of investments | $1,532,236,236 | $33,659,465 | $11,743,429 | $213,523,836 |
| Gross tax appreciation | | | | |
| of investments | $ 186,405,376 | $4,120,440 | $1,387,265 | $ 25,661,513 |
| Gross tax depreciation | | | | |
| of investments | (102,460,541) | (311,705) | (266,016) | (18,387,785) |
| Net tax appreciation | | | | |
| (depreciation) of investments | $ 83,944,835 | $3,808,735 | $1,121,249 | $ 7,273,728 |
| Net tax appreciation (depreciation) | | | | |
| on derivatives and translation | | | | |
| of assets and liabilities in | | | | |
| foreign currencies | $ 17,656 | $ 942 | $ 1,200 | — |
| Net tax appreciation (depreciation) | $83,962,491 | $3,809,677 | $1,122,449 | $7,273,728 |
| Undistributed ordinary income | $8,299,846 | — | — | $1,675,640 |
| Accumulated capital losses | $(190,625,293) | $(2,447,404) | $(2,419,403) | $(127,469,449) |
The difference between book-basis and tax-basis cost and unrealized appreciation (depreciation) is attributable primarily to the tax deferral of losses on wash sales and the realization for tax purposes of unrealized gains on certain forward foreign currency exchange contracts and unrealized gains for certain futures contracts.
The accumulated capital losses listed above represent net capital loss carryovers that may be used to offset future realized capital gains for federal income tax purposes. Future capital loss carryover utilization in any given year may be subject to Internal Revenue Code limitations. The capital loss carryovers expire as follows:
| | |
| | 2016 | 2017 |
| Select | $(14,707,162) | $(175,918,131) |
| Capital Growth | $(769,263) | $(1,678,141) |
| Focused Growth | $(677,282) | $(1,742,121) |
| Fundamental Equity | $(53,837,215) | $(73,632,234) |
56
11. Recently Issued Accounting Standards
The Financial Accounting Standards Board (FASB) issued Accounting Standards Codification (ASC) Section 820-10 (formerly Statement of Financial Accounting Standards No. 157, “Fair Value Measurements”), in September 2006, which is effective for fiscal years beginning after November 15, 2007. ASC Section 820-10 defines fair value, establishes a framework for measuring fair value and expands the required financial statement disclosures about fair value measurements. The adoption of ASC Section 820-10 did not materially impact the determination of fair value.
In March 2008, the FASB issued ASC Section 815-10 (formerly Statement of Financial Accounting Standards No. 161, “Disclosures about Derivative Instruments and Hedging Activities — an amendment of FASB Statement No. 133”). ASC Section 815-10 is effective for interim periods beginning after November 15, 2008 and has been adopted by the funds. ASC Section 815-10 amends and expands disclosures about derivative instruments and hedging activities. ASC Section 815-10 requires qualitative disclosures about the objectives and strategies of derivative instruments, quantitative disclosures about the fair value amounts of and gains and losses on derivative instruments, and disclosures of credit-risk-related contingent features in hedging activities.
12. Other Tax Information (Unaudited)
The following information is provided pursuant to provisions of the Internal Revenue Code.
The funds hereby designate up to the maximum amount allowable as qualified dividend income for the fiscal year ended October 31, 2009.
For corporate taxpayers, the funds hereby designate the following ordinary income distributions, or up to the maximum amount allowable, as qualified for the corporate dividends received deduction for the fiscal year ended October 31, 2009.
| | | |
| Select | Capital Growth | Focused Growth | Fundamental Equity |
| $15,330,593 | $26,640 | $58,641 | $3,172,617 |
57
| | | | | | |
| Select | | | | | |
| |
| Investor Class | | | | | |
| For a Share Outstanding Throughout the Years Ended October 31 | | | |
| | | 2009 | 2008 | 2007 | 2006 | 2005 |
| Per-Share Data | | | | | |
| Net Asset Value, Beginning of Period | $26.25 | $45.58 | $36.22 | $37.04 | $34.80 |
| Income From Investment Operations | | | | | |
| Net Investment Income (Loss)(1) | 0.19 | 0.07 | 0.04 | 0.21 | 0.15 |
| Net Realized and Unrealized Gain (Loss) | 4.40 | (16.10) | 10.06 | (0.77) | 2.17 |
| Total From Investment Operations | 4.59 | (16.03) | 10.10 | (0.56) | 2.32 |
| Distributions | | | | | |
| From Net Investment Income | (0.26) | — | (0.16) | (0.26) | (0.08) |
| From Net Realized Gains | — | (3.30) | (0.58) | — | — |
| Total Distributions | (0.26) | (3.30) | (0.74) | (0.26) | (0.08) |
| Net Asset Value, End of Period | $30.58 | $26.25 | $45.58 | $36.22 | $37.04 |
| |
| Total Return(2) | 17.77% | (37.71)% | 28.37% | (1.55)% | 6.67% |
| | | | | | |
| Ratios/Supplemental Data | | | | | |
| Ratio of Operating Expenses | | | | | |
| to Average Net Assets | 1.00% | 1.00% | 1.00% | 1.00% | 1.00% |
| Ratio of Net Investment Income (Loss) | | | | | |
| to Average Net Assets | 0.75% | 0.19% | 0.11% | 0.57% | 0.42% |
| Portfolio Turnover Rate | 31% | 64% | 79% | 206% | 55% |
| Net Assets, End of Period (in millions) | $1,592 | $1,449 | $2,550 | $2,576 | $3,329 |
| (1) | Computed using average shares outstanding throughout the period. | | | | |
| (2) | Total return assumes reinvestment of net investment income and capital gains distributions, if any. The total return of the classes may not |
| | precisely reflect the class expense differences because of the impact of calculating the net asset values to two decimal places. If net asset |
| | values were calculated to three decimal places, the total return differences would more closely reflect the class expense differences. The |
| | calculation of net asset values to two decimal places is made in accordance with SEC guidelines and does not result in any gain or loss of value |
| | between one class and another. | | | | | |
| |
| |
| See Notes to Financial Statements. | | | | | |
58
| | | | | | |
| Select | | | | | |
| |
| Institutional Class | | | | | |
| For a Share Outstanding Throughout the Years Ended October 31 | | | |
| | | 2009 | 2008 | 2007 | 2006 | 2005 |
| Per-Share Data | | | | | |
| Net Asset Value, Beginning of Period | $26.56 | $45.98 | $36.53 | $37.35 | $35.09 |
| Income From Investment Operations | | | | | |
| Net Investment Income (Loss)(1) | 0.28 | 0.15 | 0.12 | 0.30 | 0.24 |
| Net Realized and Unrealized Gain (Loss) | 4.41 | (16.27) | 10.15 | (0.78) | 2.18 |
| Total From Investment Operations | 4.69 | (16.12) | 10.27 | (0.48) | 2.42 |
| Distributions | | | | | |
| From Net Investment Income | (0.31) | — | (0.24) | (0.34) | (0.16) |
| From Net Realized Gains | — | (3.30) | (0.58) | — | — |
| Total Distributions | (0.31) | (3.30) | (0.82) | (0.34) | (0.16) |
| Net Asset Value, End of Period | $30.94 | $26.56 | $45.98 | $36.53 | $37.35 |
| |
| Total Return(2) | 18.00% | (37.60)% | 28.63% | (1.35)% | 6.87% |
| | | | | | |
| Ratios/Supplemental Data | | | | | |
| Ratio of Operating Expenses | | | | | |
| to Average Net Assets | 0.80% | 0.80% | 0.80% | 0.80% | 0.80% |
| Ratio of Net Investment Income (Loss) | | | | | |
| to Average Net Assets | 0.95% | 0.39% | 0.31% | 0.77% | 0.62% |
| Portfolio Turnover Rate | 31% | 64% | 79% | 206% | 55% |
| Net Assets, End of Period (in thousands) | $3,950 | $94,419 | $168,441 | $148,717 | $198,212 |
| (1) | Computed using average shares outstanding throughout the period. | | | | |
| (2) | Total return assumes reinvestment of net investment income and capital gains distributions, if any. Total returns are calculated based on the net |
| | asset value of the last business day. The total return of the classes may not precisely reflect the class expense differences because of the impact |
| | of calculating the net asset values to two decimal places. If net asset values were calculated to three decimal places, the total return differences |
| | would more closely reflect the class expense differences. The calculation of net asset values to two decimal places is made in accordance with |
| | SEC guidelines and does not result in any gain or loss of value between one class and another. | | |
| |
| |
| See Notes to Financial Statements. | | | | | |
59
| | | | | | |
| Select | | | | | |
| |
| A Class(1) | | | | | |
| For a Share Outstanding Throughout the Years Ended October 31 | | | |
| | | 2009 | 2008 | 2007 | 2006 | 2005 |
| Per-Share Data | | | | | |
| Net Asset Value, Beginning of Period | $25.85 | $45.05 | $35.80 | $36.63 | $34.43 |
| Income From Investment Operations | | | | | |
| Net Investment Income (Loss)(2) | 0.13 | (0.02) | (0.09) | 0.12 | 0.04 |
| Net Realized and Unrealized Gain (Loss) | 4.33 | (15.88) | 9.99 | (0.76) | 2.16 |
| Total From Investment Operations | 4.46 | (15.90) | 9.90 | (0.64) | 2.20 |
| Distributions | | | | | |
| From Net Investment Income | (0.20) | — | (0.07) | (0.19) | — |
| From Net Realized Gains | — | (3.30) | (0.58) | — | — |
| Total Distributions | (0.20) | (3.30) | (0.65) | (0.19) | — |
| Net Asset Value, End of Period | $30.11 | $25.85 | $45.05 | $35.80 | $36.63 |
| |
| Total Return(3) | 17.47% | (37.88)% | 28.07% | (1.79)% | 6.39% |
| | | | | | |
| Ratios/Supplemental Data | | | | | |
| Ratio of Operating Expenses | | | | | |
| to Average Net Assets | 1.25% | 1.25% | 1.25% | 1.25% | 1.25% |
| Ratio of Net Investment Income (Loss) | | | | | |
| to Average Net Assets | 0.50% | (0.06)% | (0.14)% | 0.32% | 0.17% |
| Portfolio Turnover Rate | 31% | 64% | 79% | 206% | 55% |
| Net Assets, End of Period (in thousands) | $19,824 | $19,450 | $42,770 | $21,455 | $27,741 |
| (1) | Prior to September 4, 2007, the A Class was referred to as the Advisor Class. | | | |
| (2) | Computed using average shares outstanding throughout the period. | | | | |
| (3) | Total return assumes reinvestment of net investment income and capital gains distributions, if any, and does not reflect applicable sales charges. |
| | The total return of the classes may not precisely reflect the class expense differences because of the impact of calculating the net asset values |
| | to two decimal places. If net asset values were calculated to three decimal places, the total return differences would more closely reflect the |
| | class expense differences. The calculation of net asset values to two decimal places is made in accordance with SEC guidelines and does not |
| | result in any gain or loss of value between one class and another. | | | | |
| |
| |
| See Notes to Financial Statements. | | | | | |
60
| | | | | | |
| Select | | | | | |
| |
| B Class | | | | | |
| For a Share Outstanding Throughout the Years Ended October 31 | | | |
| | | 2009 | 2008 | 2007 | 2006 | 2005 |
| Per-Share Data | | | | | |
| Net Asset Value, Beginning of Period | $25.03 | $44.03 | $35.21 | $36.12 | $34.21 |
| Income From Investment Operations | | | | | |
| Net Investment Income (Loss)(1) | (0.06) | (0.29) | (0.34) | (0.12) | (0.22) |
| Net Realized and Unrealized Gain (Loss) | 4.20 | (15.41) | 9.74 | (0.79) | 2.13 |
| Total From Investment Operations | 4.14 | (15.70) | 9.40 | (0.91) | 1.91 |
| Distributions | | | | | |
| From Net Investment Income | (0.02) | — | — | — | — |
| From Net Realized Gains | — | (3.30) | (0.58) | — | — |
| Total Distributions | (0.02) | (3.30) | (0.58) | — | — |
| Net Asset Value, End of Period | $29.15 | $25.03 | $44.03 | $35.21 | $36.12 |
| |
| Total Return(2) | 16.60% | (38.36)% | 27.07% | (2.52)% | 5.58% |
| | | | | | |
| Ratios/Supplemental Data | | | | | |
| Ratio of Operating Expenses | | | | | |
| to Average Net Assets | 2.00% | 2.00% | 2.00% | 2.00% | 2.00% |
| Ratio of Net Investment Income (Loss) | | | | | |
| to Average Net Assets | (0.25)% | (0.81)% | (0.89)% | (0.43)% | (0.58)% |
| Portfolio Turnover Rate | 31% | 64% | 79% | 206% | 55% |
| Net Assets, End of Period (in thousands) | $2,045 | $2,605 | $5,567 | $5,880 | $2,501 |
| (1) | Computed using average shares outstanding throughout the period. | | | | |
| (2) | Total return assumes reinvestment of net investment income and capital gains distributions, if any, and does not reflect applicable sales charges. |
| | The total return of the classes may not precisely reflect the class expense differences because of the impact of calculating the net asset values |
| | to two decimal places. If net asset values were calculated to three decimal places, the total return differences would more closely reflect the |
| | class expense differences. The calculation of net asset values to two decimal places is made in accordance with SEC guidelines and does not |
| | result in any gain or loss of value between one class and another. | | | | |
| |
| |
| See Notes to Financial Statements. | | | | | |
61
| | | | | | |
| Select | | | | | |
| |
| C Class | | | | | |
| For a Share Outstanding Throughout the Years Ended October 31 | | | |
| | | 2009 | 2008 | 2007 | 2006 | 2005 |
| Per-Share Data | | | | | |
| Net Asset Value, Beginning of Period | $25.05 | $44.07 | $35.24 | $36.15 | $34.23 |
| Income From Investment Operations | | | | | |
| Net Investment Income (Loss)(1) | (0.06) | (0.29) | (0.34) | (0.16) | (0.22) |
| Net Realized and Unrealized Gain (Loss) | 4.22 | (15.43) | 9.75 | (0.75) | 2.14 |
| Total From Investment Operations | 4.16 | (15.72) | 9.41 | (0.91) | 1.92 |
| Distributions | | | | | |
| From Net Investment Income | (0.02) | — | — | — | — |
| From Net Realized Gains | — | (3.30) | (0.58) | — | — |
| Total Distributions | (0.02) | (3.30) | (0.58) | — | — |
| Net Asset Value, End of Period | $29.19 | $25.05 | $44.07 | $35.24 | $36.15 |
| |
| Total Return(2) | 16.58% | (38.34)% | 27.07% | (2.52)% | 5.58% |
| | | | | | |
| Ratios/Supplemental Data | | | | | |
| Ratio of Operating Expenses | | | | | |
| to Average Net Assets | 2.00% | 2.00% | 2.00% | 2.00% | 2.00% |
| Ratio of Net Investment Income (Loss) | | | | | |
| to Average Net Assets | (0.25)% | (0.81)% | (0.89)% | (0.43)% | (0.58)% |
| Portfolio Turnover Rate | 31% | 64% | 79% | 206% | 55% |
| Net Assets, End of Period (in thousands) | $314 | $394 | $1,001 | $1,540 | $3,511 |
| (1) | Computed using average shares outstanding throughout the period. | | | | |
| (2) | Total return assumes reinvestment of net investment income and capital gains distributions, if any, and does not reflect applicable sales charges. |
| | Total returns are calculated based on the net asset value of the last business day. The total return of the classes may not precisely reflect the |
| | class expense differences because of the impact of calculating the net asset values to two decimal places. If net asset values were calculated to |
| | three decimal places, the total return differences would more closely reflect the class expense differences. The calculation of net asset values to |
| | two decimal places is made in accordance with SEC guidelines and does not result in any gain or loss of value between one class and another. |
| |
| |
| See Notes to Financial Statements. | | | | | |
62
| | | | | | |
| Select | | | | | |
| |
| R Class | | | | | |
| For a Share Outstanding Throughout the Years Ended October 31 (except as noted) | | |
| | | 2009 | 2008 | 2007 | 2006 | 2005(1) |
| Per-Share Data | | | | | |
| Net Asset Value, Beginning of Period | $25.96 | $45.33 | $36.05 | $37.00 | $38.34 |
| Income From Investment Operations | | | | | |
| Net Investment Income (Loss)(2) | 0.06 | (0.11) | (0.15) | 0.03 | (0.05) |
| Net Realized and Unrealized Gain (Loss) | 4.36 | (15.96) | 10.01 | (0.77) | (1.29) |
| Total From Investment Operations | 4.42 | (16.07) | 9.86 | (0.74) | (1.34) |
| Distributions | | | | | |
| From Net Investment Income | (0.14) | — | — | (0.21) | — |
| From Net Realized Gains | — | (3.30) | (0.58) | — | — |
| Total Distributions | (0.14) | (3.30) | (0.58) | (0.21) | — |
| Net Asset Value, End of Period | $30.24 | $25.96 | $45.33 | $36.05 | $37.00 |
| |
| Total Return(3) | 17.17% | (38.03)% | 27.72% | (2.04)% | (3.50)% |
| | | | | | |
| Ratios/Supplemental Data | | | | | |
| Ratio of Operating Expenses | | | | | |
| to Average Net Assets | 1.50% | 1.50% | 1.50% | 1.50% | 1.50%(4) |
| Ratio of Net Investment Income (Loss) | | | | | |
| to Average Net Assets | 0.25% | (0.31)% | (0.39)% | 0.07% | (0.50)%(4) |
| Portfolio Turnover Rate | 31% | 64% | 79% | 206% | 55%(5) |
| Net Assets, End of Period (in thousands) | $43 | $32 | $32 | $24 | $24 |
| (1) | July 29, 2005 (commencement of sale) through October 31, 2005. | | | | |
| (2) | Computed using average shares outstanding throughout the period. | | | | |
| (3) | Total return assumes reinvestment of net investment income and capital gains distributions, if any. Total returns for periods less than one year |
| | are not annualized. The total return of the classes may not precisely reflect the class expense differences because of the impact of calculating |
| | the net asset values to two decimal places. If net asset values were calculated to three decimal places, the total return differences would |
| | more closely reflect the class expense differences. The calculation of net asset values to two decimal places is made in accordance with SEC |
| | guidelines and does not result in any gain or loss of value between one class and another. | | | |
| (4) | Annualized. | | | | | |
| (5) | Portfolio turnover is calculated at the fund level. Percentage indicated was calculated for the year ended October 31, 2005. | |
| |
| |
| See Notes to Financial Statements. | | | | | |
63
| | | | | | |
| Capital Growth | | | | | |
| |
| Investor Class | | | | | |
| For a Share Outstanding Throughout the Years Ended October 31 (except as noted) | | |
| | | 2009 | 2008 | 2007 | 2006 | 2005(1) |
| Per-Share Data | | | | | |
| Net Asset Value, Beginning of Period | $8.70 | $14.21 | $11.81 | $10.60 | $10.80 |
| Income From Investment Operations | | | | | |
| Net Investment Income (Loss)(2) | 0.04 | 0.02 | —(3) | —(3) | —(3) |
| Net Realized and Unrealized Gain (Loss) | 1.31 | (4.48) | 2.54 | 1.21 | (0.20) |
| Total From Investment Operations | 1.35 | (4.46) | 2.54 | 1.21 | (0.20) |
| Distributions | | | | | |
| From Net Investment Income | (0.04) | — | — | — | — |
| From Net Realized Gains | — | (1.05) | (0.14) | — | — |
| Total Distributions | (0.04) | (1.05) | (0.14) | — | — |
| Net Asset Value, End of Period | $10.01 | $8.70 | $14.21 | $11.81 | $10.60 |
| |
| Total Return(4) | 15.58% | (33.67)% | 21.77% | 11.42% | (1.85)% |
| | | | | | |
| Ratios/Supplemental Data | | | | | |
| Ratio of Operating Expenses | | | | | |
| to Average Net Assets | 1.01% | 1.01% | 1.01% | 1.00% | 1.00%(5) |
| Ratio of Net Investment Income (Loss) | | | | | |
| to Average Net Assets | 0.43% | 0.15% | 0.15% | 0.05% | (0.12)%(5) |
| Portfolio Turnover Rate | 131% | 129% | 160% | 140% | 110%(6) |
| Net Assets, End of Period (in thousands) | $10,972 | $2,252 | $1,139 | $86 | $25 |
| (1) | July 29, 2005 (commencement of sale) through October 31, 2005. | | | | |
| (2) | Computed using average shares outstanding throughout the period. | | | | |
| (3) | Per-share amount was less than $0.005. | | | | | |
| (4) | Total return assumes reinvestment of net investment income and capital gains distributions, if any. Total returns for periods less than one year |
| | are not annualized. The total return of the classes may not precisely reflect the class expense differences because of the impact of calculating |
| | the net asset values to two decimal places. If net asset values were calculated to three decimal places, the total return differences would |
| | more closely reflect the class expense differences. The calculation of net asset values to two decimal places is made in accordance with SEC |
| | guidelines and does not result in any gain or loss of value between one class and another. | | | |
| (5) | Annualized. | | | | | |
| (6) | Portfolio turnover is calculated at the fund level. Percentage indicated was calculated for the year ended October 31, 2005. | |
| |
| |
| See Notes to Financial Statements. | | | | | |
64
| | | | | | |
| Capital Growth | | | | | |
| |
| Institutional Class | | | | | |
| For a Share Outstanding Throughout the Years Ended October 31 (except as noted) | | |
| | | 2009 | 2008 | 2007 | 2006 | 2005(1) |
| Per-Share Data | | | | | |
| Net Asset Value, Beginning of Period | $8.76 | $14.28 | $11.84 | $10.61 | $10.80 |
| Income From Investment Operations | | | | | |
| Net Investment Income (Loss)(2) | 0.07 | 0.04 | 0.04 | 0.03 | —(3) |
| Net Realized and Unrealized Gain (Loss) | 1.29 | (4.51) | 2.54 | 1.20 | (0.19) |
| Total From Investment Operations | 1.36 | (4.47) | 2.58 | 1.23 | (0.19) |
| Distributions | | | | | |
| From Net Investment Income | (0.05) | — | — | — | — |
| From Net Realized Gains | — | (1.05) | (0.14) | — | — |
| Total Distributions | (0.05) | (1.05) | (0.14) | — | — |
| Net Asset Value, End of Period | $10.07 | $8.76 | $14.28 | $11.84 | $10.61 |
| |
| Total Return(4) | 15.70% | (33.57)% | 22.06% | 11.59% | (1.76)% |
| | | | | | |
| Ratios/Supplemental Data | | | | | |
| Ratio of Operating Expenses | | | | | |
| to Average Net Assets | 0.81% | 0.81% | 0.81% | 0.80% | 0.80%(5) |
| Ratio of Net Investment Income (Loss) | | | | | |
| to Average Net Assets | 0.63% | 0.35% | 0.35% | 0.25% | 0.08%(5) |
| Portfolio Turnover Rate | 131% | 129% | 160% | 140% | 110%(6) |
| Net Assets, End of Period (in thousands) | $74 | $128 | $33 | $27 | $25 |
| (1) | July 29, 2005 (commencement of sale) through October 31, 2005. | | | | |
| (2) | Computed using average shares outstanding throughout the period. | | | | |
| (3) | Per-share amount was less than $0.005. | | | | | |
| (4) | Total return assumes reinvestment of net investment income and capital gains distributions, if any. Total returns for periods less than one year |
| | are not annualized. The total return of the classes may not precisely reflect the class expense differences because of the impact of calculating |
| | the net asset values to two decimal places. If net asset values were calculated to three decimal places, the total return differences would |
| | more closely reflect the class expense differences. The calculation of net asset values to two decimal places is made in accordance with SEC |
| | guidelines and does not result in any gain or loss of value between one class and another. | | | |
| (5) | Annualized. | | | | | |
| (6) | Portfolio turnover is calculated at the fund level. Percentage indicated was calculated for the year ended October 31, 2005. | |
| |
| |
| See Notes to Financial Statements. | | | | | |
65
| | | | | | |
| Capital Growth | | | | | |
| |
| A Class | | | | | |
| For a Share Outstanding Throughout the Years Ended October 31 | | | |
| | | 2009 | 2008 | 2007 | 2006 | 2005 |
| Per-Share Data | | | | | |
| Net Asset Value, Beginning of Period | $8.62 | $14.13 | $11.78 | $10.59 | $9.89 |
| Income From Investment Operations | | | | | |
| Net Investment Income (Loss)(1) | 0.02 | (0.01) | (0.01) | (0.02) | —(2) |
| Net Realized and Unrealized Gain (Loss) | 1.30 | (4.45) | 2.50 | 1.21 | 0.70 |
| Total From Investment Operations | 1.32 | (4.46) | 2.49 | 1.19 | 0.70 |
| Distributions | | | | | |
| From Net Investment Income | (0.02) | — | — | — | — |
| From Net Realized Gains | — | (1.05) | (0.14) | — | — |
| Total Distributions | (0.02) | (1.05) | (0.14) | — | — |
| Net Asset Value, End of Period | $9.92 | $8.62 | $14.13 | $11.78 | $10.59 |
| |
| Total Return(3) | 15.32% | (33.88)% | 21.40% | 11.24% | 7.08% |
| | | | | | |
| Ratios/Supplemental Data | | | | | |
| Ratio of Operating Expenses | | | | | |
| to Average Net Assets | 1.26% | 1.26% | 1.26% | 1.25% | 1.27% |
| Ratio of Net Investment Income (Loss) | | | | | |
| to Average Net Assets | 0.18% | (0.10)% | (0.10)% | (0.20)% | (0.03)% |
| Portfolio Turnover Rate | 131% | 129% | 160% | 140% | 110% |
| Net Assets, End of Period (in thousands) | $21,273 | $7,679 | $3,171 | $2,155 | $1,216 |
| (1) | Computed using average shares outstanding throughout the period. | | | | |
| (2) | Per-share amount was less than $0.005. | | | | | |
| (3) | Total return assumes reinvestment of net investment income and capital gains distributions, if any, and does not reflect applicable sales charges. |
| | The total return of the classes may not precisely reflect the class expense differences because of the impact of calculating the net asset values |
| | to two decimal places. If net asset values were calculated to three decimal places, the total return differences would more closely reflect the |
| | class expense differences. The calculation of net asset values to two decimal places is made in accordance with SEC guidelines and does not |
| | result in any gain or loss of value between one class and another. | | | | |
| |
| |
| See Notes to Financial Statements. | | | | | |
66
| | | | | | |
| Capital Growth | | | | | |
| |
| B Class | | | | | |
| For a Share Outstanding Throughout the Years Ended October 31 | | | |
| | | 2009 | 2008 | 2007 | 2006 | 2005 |
| Per-Share Data | | | | | |
| Net Asset Value, Beginning of Period | $8.30 | $13.74 | $11.54 | $10.46 | $9.84 |
| Income From Investment Operations | | | | | |
| Net Investment Income (Loss)(1) | (0.04) | (0.09) | (0.10) | (0.10) | (0.08) |
| Net Realized and Unrealized Gain (Loss) | 1.24 | (4.30) | 2.44 | 1.18 | 0.70 |
| Total From Investment Operations | 1.20 | (4.39) | 2.34 | 1.08 | 0.62 |
| Distributions | | | | | |
| From Net Realized Gains | — | (1.05) | (0.14) | — | — |
| Net Asset Value, End of Period | $9.50 | $8.30 | $13.74 | $11.54 | $10.46 |
| |
| Total Return(2) | 14.46% | (34.36)% | 20.54% | 10.33% | 6.30% |
| | | | | | |
| Ratios/Supplemental Data | | | | | |
| Ratio of Operating Expenses | | | | | |
| to Average Net Assets | 2.01% | 2.01% | 2.01% | 2.00% | 2.02% |
| Ratio of Net Investment Income (Loss) | | | | | |
| to Average Net Assets | (0.57)% | (0.85)% | (0.85)% | (0.95)% | (0.78)% |
| Portfolio Turnover Rate | 131% | 129% | 160% | 140% | 110% |
| Net Assets, End of Period (in thousands) | $829 | $760 | $865 | $960 | $772 |
| (1) | Computed using average shares outstanding throughout the period. | | | | |
| (2) | Total return assumes reinvestment of net investment income and capital gains distributions, if any, and does not reflect applicable sales charges. |
| | The total return of the classes may not precisely reflect the class expense differences because of the impact of calculating the net asset values |
| | to two decimal places. If net asset values were calculated to three decimal places, the total return differences would more closely reflect the |
| | class expense differences. The calculation of net asset values to two decimal places is made in accordance with SEC guidelines and does not |
| | result in any gain or loss of value between one class and another. | | | | |
| |
| |
| See Notes to Financial Statements. | | | | | |
67
| | | | | | |
| Capital Growth | | | | | |
| |
| C Class | | | | | |
| For a Share Outstanding Throughout the Years Ended October 31 | | | |
| | | 2009 | 2008 | 2007 | 2006 | 2005 |
| Per-Share Data | | | | | |
| Net Asset Value, Beginning of Period | $8.30 | $13.74 | $11.54 | $10.46 | $9.84 |
| Income From Investment Operations | | | | | |
| Net Investment Income (Loss)(1) | (0.05) | (0.09) | (0.10) | (0.10) | (0.08) |
| Net Realized and Unrealized Gain (Loss) | 1.25 | (4.30) | 2.44 | 1.18 | 0.70 |
| Total From Investment Operations | 1.20 | (4.39) | 2.34 | 1.08 | 0.62 |
| Distributions | | | | | |
| From Net Realized Gains | — | (1.05) | (0.14) | — | — |
| Net Asset Value, End of Period | $9.50 | $8.30 | $13.74 | $11.54 | $10.46 |
| |
| Total Return(2) | 14.46% | (34.36)% | 20.54% | 10.33% | 6.30% |
| | | | | | |
| Ratios/Supplemental Data | | | | | |
| Ratio of Operating Expenses | | | | | |
| to Average Net Assets | 2.01% | 2.01% | 2.01% | 2.00% | 2.02% |
| Ratio of Net Investment Income (Loss) | | | | | |
| to Average Net Assets | (0.57)% | (0.85)% | (0.85)% | (0.95)% | (0.78)% |
| Portfolio Turnover Rate | 131% | 129% | 160% | 140% | 110% |
| Net Assets, End of Period (in thousands) | $3,236 | $831 | $695 | $832 | $609 |
| (1) | Computed using average shares outstanding throughout the period. | | | | |
| (2) | Total return assumes reinvestment of net investment income and capital gains distributions, if any, and does not reflect applicable sales charges. |
| | The total return of the classes may not precisely reflect the class expense differences because of the impact of calculating the net asset values |
| | to two decimal places. If net asset values were calculated to three decimal places, the total return differences would more closely reflect the |
| | class expense differences. The calculation of net asset values to two decimal places is made in accordance with SEC guidelines and does not |
| | result in any gain or loss of value between one class and another. | | | | |
| |
| |
| See Notes to Financial Statements. | | | | | |
68
| | | | | | |
| Capital Growth | | | | | |
| |
| R Class | | | | | |
| For a Share Outstanding Throughout the Years Ended October 31 (except as noted) | | |
| | | 2009 | 2008 | 2007 | 2006 | 2005(1) |
| Per-Share Data | | | | | |
| Net Asset Value, Beginning of Period | $8.55 | $14.05 | $11.74 | $10.59 | $10.80 |
| Income From Investment Operations | | | | | |
| Net Investment Income (Loss)(2) | (0.03) | (0.04) | (0.04) | (0.05) | (0.02) |
| Net Realized and Unrealized Gain (Loss) | 1.31 | (4.41) | 2.49 | 1.20 | (0.19) |
| Total From Investment Operations | 1.28 | (4.45) | 2.45 | 1.15 | (0.21) |
| Distributions | | | | | |
| From Net Realized Gains | — | (1.05) | (0.14) | — | — |
| Net Asset Value, End of Period | $9.83 | $8.55 | $14.05 | $11.74 | $10.59 |
| |
| Total Return(3) | 14.97% | (34.01)% | 21.13% | 10.86% | (1.94)% |
| | | | | | |
| Ratios/Supplemental Data | | | | | |
| Ratio of Operating Expenses | | | | | |
| to Average Net Assets | 1.51% | 1.51% | 1.51% | 1.50% | 1.50%(4) |
| Ratio of Net Investment Income (Loss) | | | | | |
| to Average Net Assets | (0.07)% | (0.35)% | (0.35)% | (0.45)% | (0.62)%(4) |
| Portfolio Turnover Rate | 131% | 129% | 160% | 140% | 110%(5) |
| Net Assets, End of Period (in thousands) | $1,301 | $84 | $36 | $27 | $25 |
| (1) | July 29, 2005 (commencement of sale) through October 31, 2005. | | | | |
| (2) | Computed using average shares outstanding throughout the period. | | | | |
| (3) | Total return assumes reinvestment of net investment income and capital gains distributions, if any. Total returns for periods less than one year |
| | are not annualized. The total return of the classes may not precisely reflect the class expense differences because of the impact of calculating |
| | the net asset values to two decimal places. If net asset values were calculated to three decimal places, the total return differences would |
| | more closely reflect the class expense differences. The calculation of net asset values to two decimal places is made in accordance with SEC |
| | guidelines and does not result in any gain or loss of value between one class and another. | | | |
| (4) | Annualized. | | | | | |
| (5) | Portfolio turnover is calculated at the fund level. Percentage indicated was calculated for the year ended October 31, 2005. | |
| |
| |
| See Notes to Financial Statements. | | | | | |
69
| | | | | | |
| Focused Growth | | | | | |
| |
| Investor Class | | | | | |
| For a Share Outstanding Throughout the Years Ended October 31 (except as noted) | | |
| | | 2009 | 2008 | 2007 | 2006 | 2005(1) |
| Per-Share Data | | | | | |
| Net Asset Value, Beginning of Period | $7.73 | $12.92 | $11.42 | $10.53 | $10.00 |
| Income From Investment Operations | | | | | |
| Net Investment Income (Loss)(2) | 0.04 | 0.02 | 0.04 | 0.01 | —(3) |
| Net Realized and Unrealized Gain (Loss) | 1.01 | (3.74) | 1.73 | 0.95 | 0.53 |
| Total From Investment Operations | 1.05 | (3.72) | 1.77 | 0.96 | 0.53 |
| Distributions | | | | | |
| From Net Investment Income | (0.05) | (0.01) | (0.04) | —(3) | — |
| From Net Realized Gains | — | (1.46) | (0.23) | (0.07) | — |
| Total Distributions | (0.05) | (1.47) | (0.27) | (0.07) | — |
| Net Asset Value, End of Period | $8.73 | $7.73 | $12.92 | $11.42 | $10.53 |
| |
| Total Return(4) | 13.77% | (32.19)% | 15.78% | 9.13% | 5.30% |
| | | | | | |
| Ratios/Supplemental Data | | | | | |
| Ratio of Operating Expenses | | | | | |
| to Average Net Assets | 1.00% | 1.00% | 1.00% | 1.00% | 1.00%(5) |
| Ratio of Net Investment Income (Loss) | | | | | |
| to Average Net Assets | 0.50% | 0.22% | 0.33% | 0.07% | 0.00%(5) |
| Portfolio Turnover Rate | 125% | 130% | 275% | 313% | 95% |
| Net Assets, End of Period (in thousands) | $12,541 | $8,814 | $13,381 | $15,837 | $12,175 |
| (1) | February 28, 2005 (fund inception) through October 31, 2005. | | | | |
| (2) | Computed using average shares outstanding throughout the period. | | | | |
| (3) | Per-share amount was less than $0.005. | | | | | |
| (4) | Total return assumes reinvestment of net investment income and capital gains distributions, if any. Total returns for periods less than one year |
| | are not annualized. The total return of the classes may not precisely reflect the class expense differences because of the impact of calculating |
| | the net asset values to two decimal places. If net asset values were calculated to three decimal places, the total return differences would |
| | more closely reflect the class expense differences. The calculation of net asset values to two decimal places is made in accordance with SEC |
| | guidelines and does not result in any gain or loss of value between one class and another. | | | |
| (5) | Annualized. | | | | | |
| |
| |
| See Notes to Financial Statements. | | | | | |
70
| | | | |
| Focused Growth | | | |
| |
| Institutional Class | | | |
| For a Share Outstanding Throughout the Years Ended October 31 (except as noted) | | |
| | | 2009 | 2008 | 2007(1) |
| Per-Share Data | | | |
| Net Asset Value, Beginning of Period | $7.73 | $12.93 | $12.59 |
| Income From Investment Operations | | | |
| Net Investment Income (Loss)(2) | 0.05 | 0.04 | —(3) |
| Net Realized and Unrealized Gain (Loss) | 1.01 | (3.75) | 0.34 |
| Total From Investment Operations | 1.06 | (3.71) | 0.34 |
| Distributions | | | |
| From Net Investment Income | (0.06) | (0.03) | — |
| From Net Realized Gains | — | (1.46) | — |
| Total Distributions | (0.06) | (1.49) | — |
| Net Asset Value, End of Period | $8.73 | $7.73 | $12.93 |
| |
| Total Return(4) | 14.00% | (32.09)% | 2.70% |
| | | | |
| Ratios/Supplemental Data | | | |
| Ratio of Operating Expenses to Average Net Assets | 0.80% | 0.80% | 0.80%(5) |
| Ratio of Net Investment Income (Loss) to Average Net Assets | 0.70% | 0.42% | (0.40)%(5) |
| Portfolio Turnover Rate | 125% | 130% | 275%(6) |
| Net Assets, End of Period (in thousands) | $20 | $17 | $26 |
| (1) | September 28, 2007 (commencement of sale) through October 31, 2007. | | | |
| (2) | Computed using average shares outstanding throughout the period. | | | |
| (3) | Per-share amount was less than $0.005. | | | |
| (4) | Total return assumes reinvestment of net investment income and capital gains distributions, if any. Total returns for periods less than one year |
| | are not annualized. The total return of the classes may not precisely reflect the class expense differences because of the impact of calculating |
| | the net asset values to two decimal places. If net asset values were calculated to three decimal places, the total return differences would |
| | more closely reflect the class expense differences. The calculation of net asset values to two decimal places is made in accordance with SEC |
| | guidelines and does not result in any gain or loss of value between one class and another. | | | |
| (5) | Annualized. | | | |
| (6) | Portfolio turnover is calculated at the fund level. Percentage indicated was calculated for the year ended October 31, 2007. | |
| |
| |
| See Notes to Financial Statements. | | | |
71
| | | | |
| Focused Growth | | | |
| |
| A Class | | | |
| For a Share Outstanding Throughout the Years Ended October 31 (except as noted) | | |
| | | 2009 | 2008 | 2007(1) |
| Per-Share Data | | | |
| Net Asset Value, Beginning of Period | $7.73 | $12.92 | $12.59 |
| Income From Investment Operations | | | |
| Net Investment Income (Loss)(2) | 0.02 | —(3) | (0.01) |
| Net Realized and Unrealized Gain (Loss) | 1.02 | (3.75) | 0.34 |
| Total From Investment Operations | 1.04 | (3.75) | 0.33 |
| Distributions | | | |
| From Net Investment Income | (0.03) | — | — |
| From Net Realized Gains | — | (1.44) | — |
| Total Distributions | (0.03) | (1.44) | — |
| Net Asset Value, End of Period | $8.74 | $7.73 | $12.92 |
| |
| Total Return(4) | 13.48% | (32.37)% | 2.62% |
| | | | |
| Ratios/Supplemental Data | | | |
| Ratio of Operating Expenses to Average Net Assets | 1.25% | 1.25% | 1.25%(5) |
| Ratio of Net Investment Income (Loss) to Average Net Assets | 0.25% | (0.03)% | (0.85)%(5) |
| Portfolio Turnover Rate | 125% | 130% | 275%(6) |
| Net Assets, End of Period (in thousands) | $373 | $241 | $26 |
| (1) | September 28, 2007 (commencement of sale) through October 31, 2007. | | | |
| (2) | Computed using average shares outstanding throughout the period. | | | |
| (3) | Per-share amount was less than $0.005. | | | |
| (4) | Total return assumes reinvestment of net investment income and capital gains distributions, if any, and does not reflect applicable sales charges. |
| | Total returns are calculated based on the net asset value of the last business day. Total returns for periods less than one year are not annualized. |
| | The total return of the classes may not precisely reflect the class expense differences because of the impact of calculating the net asset values |
| | to two decimal places. If net asset values were calculated to three decimal places, the total return differences would more closely reflect the |
| | class expense differences. The calculation of net asset values to two decimal places is made in accordance with SEC guidelines and does not |
| | result in any gain or loss of value between one class and another. | | | |
| (5) | Annualized. | | | |
| (6) | Portfolio turnover is calculated at the fund level. Percentage indicated was calculated for the year ended October 31, 2007. | |
| |
| |
| See Notes to Financial Statements. | | | |
72
| | | | |
| Focused Growth | | | |
| |
| B Class | | | |
| For a Share Outstanding Throughout the Years Ended October 31 (except as noted) | | |
| | | 2009 | 2008 | 2007(1) |
| Per-Share Data | | | |
| Net Asset Value, Beginning of Period | $7.73 | $12.91 | $12.59 |
| Income From Investment Operations | | | |
| Net Investment Income (Loss)(2) | (0.04) | (0.08) | (0.02) |
| Net Realized and Unrealized Gain (Loss) | 1.02 | (3.75) | 0.34 |
| Total From Investment Operations | 0.98 | (3.83) | 0.32 |
| Distributions | | | |
| From Net Realized Gains | — | (1.35) | — |
| Net Asset Value, End of Period | $8.71 | $7.73 | $12.91 |
| |
| Total Return(3) | 12.68% | (32.87)% | 2.54% |
| | | | |
| Ratios/Supplemental Data | | | |
| Ratio of Operating Expenses to Average Net Assets | 2.00% | 2.00% | 2.00%(4) |
| Ratio of Net Investment Income (Loss) to Average Net Assets | (0.50)% | (0.78)% | (1.60)%(4) |
| Portfolio Turnover Rate | 125% | 130% | 275%(5) |
| Net Assets, End of Period (in thousands) | $47 | $30 | $26 |
| (1) | September 28, 2007 (commencement of sale) through October 31, 2007. | | | |
| (2) | Computed using average shares outstanding throughout the period. | | | |
| (3) | Total return assumes reinvestment of net investment income and capital gains distributions, if any, and does not reflect applicable sales charges. |
| | Total returns for periods less than one year are not annualized. The total return of the classes may not precisely reflect the class expense |
| | differences because of the impact of calculating the net asset values to two decimal places. If net asset values were calculated to three decimal |
| | places, the total return differences would more closely reflect the class expense differences. The calculation of net asset values to two decimal |
| | places is made in accordance with SEC guidelines and does not result in any gain or loss of value between one class and another. | |
| (4) | Annualized. | | | |
| (5) | Portfolio turnover is calculated at the fund level. Percentage indicated was calculated for the year ended October 31, 2007. | |
| |
| |
| See Notes to Financial Statements. | | | |
73
| | | | |
| Focused Growth | | | |
| |
| C Class | | | |
| For a Share Outstanding Throughout the Years Ended October 31 (except as noted) | | |
| | | 2009 | 2008 | 2007(1) |
| Per-Share Data | | | |
| Net Asset Value, Beginning of Period | $7.73 | $12.91 | $12.59 |
| Income From Investment Operations | | | |
| Net Investment Income (Loss)(2) | (0.04) | (0.08) | (0.02) |
| Net Realized and Unrealized Gain (Loss) | 1.02 | (3.75) | 0.34 |
| Total From Investment Operations | 0.98 | (3.83) | 0.32 |
| Distributions | | | |
| From Net Realized Gains | — | (1.35) | — |
| Net Asset Value, End of Period | $8.71 | $7.73 | $12.91 |
| |
| Total Return(3) | 12.68% | (32.87)% | 2.54% |
| | | | |
| Ratios/Supplemental Data | | | |
| Ratio of Operating Expenses to Average Net Assets | 2.00% | 2.00% | 2.00%(4) |
| Ratio of Net Investment Income (Loss) to Average Net Assets | (0.50)% | (0.78)% | (1.52)%(4) |
| Portfolio Turnover Rate | 125% | 130% | 275%(5) |
| Net Assets, End of Period (in thousands) | $90 | $73 | $76 |
| (1) | September 28, 2007 (commencement of sale) through October 31, 2007. | | | |
| (2) | Computed using average shares outstanding throughout the period. | | | |
| (3) | Total return assumes reinvestment of net investment income and capital gains distributions, if any, and does not reflect applicable sales charges |
| | Total returns for periods less than one year are not annualized. The total return of the classes may not precisely reflect the class expense |
| | differences because of the impact of calculating the net asset values to two decimal places. If net asset values were calculated to three decimal |
| | places, the total return differences would more closely reflect the class expense differences. The calculation of net asset values to two decimal |
| | places is made in accordance with SEC guidelines and does not result in any gain or loss of value between one class and another. | |
| (4) | Annualized. | | | |
| (5) | Portfolio turnover is calculated at the fund level. Percentage indicated was calculated for the year ended October 31, 2007. | |
| |
| |
| See Notes to Financial Statements. | | | |
74
| | | | |
| Focused Growth | | | |
| |
| R Class | | | |
| For a Share Outstanding Throughout the Years Ended October 31 (except as noted) | | |
| | | 2009 | 2008 | 2007(1) |
| Per-Share Data | | | |
| Net Asset Value, Beginning of Period | $7.73 | $12.92 | $12.59 |
| Income From Investment Operations | | | |
| Net Investment Income (Loss)(2) | —(3) | (0.02) | (0.01) |
| Net Realized and Unrealized Gain (Loss) | 1.02 | (3.76) | 0.34 |
| Total From Investment Operations | 1.02 | (3.78) | 0.33 |
| Distributions | | | |
| From Net Investment Income | (0.02) | — | — |
| From Net Realized Gains | — | (1.41) | — |
| Total Distributions | (0.02) | (1.41) | — |
| Net Asset Value, End of Period | $8.73 | $7.73 | $12.92 |
| |
| Total Return(4) | 13.19% | (32.56)% | 2.62% |
| | | | |
| Ratios/Supplemental Data | | | |
| Ratio of Operating Expenses to Average Net Assets | 1.50% | 1.50% | 1.50%(5) |
| Ratio of Net Investment Income (Loss) to Average Net Assets | 0.00%(6) | (0.28)% | (1.10)%(5) |
| Portfolio Turnover Rate | 125% | 130% | 275%(7) |
| Net Assets, End of Period (in thousands) | $20 | $17 | $26 |
| (1) | September 28, 2007 (commencement of sale) through October 31, 2007. | | | |
| (2) | Computed using average shares outstanding throughout the period. | | | |
| (3) | Per-share amount was less than $0.005. | | | |
| (4) | Total return assumes reinvestment of net investment income and capital gains distributions, if any. Total returns for periods less than one year |
| | are not annualized. The total return of the classes may not precisely reflect the class expense differences because of the impact of calculating |
| | the net asset values to two decimal places. If net asset values were calculated to three decimal places, the total return differences would |
| | more closely reflect the class expense differences. The calculation of net asset values to two decimal places is made in accordance with SEC |
| | guidelines and does not result in any gain or loss of value between one class and another. | | | |
| (5) | Annualized. | | | |
| (6) | Ratio is less than 0.005%. | | | |
| (7) | Portfolio turnover is calculated at the fund level. Percentage indicated was calculated for the year ended October 31, 2007. | |
| |
| |
| See Notes to Financial Statements. | | | |
75
| | | | | | |
| Fundamental Equity | | | | | |
| |
| Investor Class | | | | | |
| For a Share Outstanding Throughout the Years Ended October 31 (except as noted) | | |
| | | 2009 | 2008 | 2007 | 2006 | 2005(1) |
| Per-Share Data | | | | | |
| Net Asset Value, Beginning of Period | $9.93 | $15.68 | $12.88 | $11.04 | $10.88 |
| Income From Investment Operations | | | | | |
| Net Investment Income (Loss)(2) | 0.12 | 0.15 | 0.14 | 0.08 | 0.02 |
| Net Realized and Unrealized Gain (Loss) | 0.66 | (5.42) | 2.93 | 2.12 | 0.14 |
| Total From Investment Operations | 0.78 | (5.27) | 3.07 | 2.20 | 0.16 |
| Distributions | | | | | |
| From Net Investment Income | (0.14) | (0.12) | (0.08) | — | — |
| From Net Realized Gains | — | (0.36) | (0.19) | (0.36) | — |
| Total Distributions | (0.14) | (0.48) | (0.27) | (0.36) | — |
| Net Asset Value, End of Period | $10.57 | $9.93 | $15.68 | $12.88 | $11.04 |
| |
| Total Return(3) | 8.16% | (34.56)% | 24.18% | 20.37% | 1.47% |
| | | | | | |
| Ratios/Supplemental Data | | | | | |
| Ratio of Operating Expenses | | | | | |
| to Average Net Assets | 1.01% | 1.01% | 1.00% | 1.00% | 1.00%(4) |
| Ratio of Net Investment Income (Loss) | | | | | |
| to Average Net Assets | 1.37% | 1.15% | 0.99% | 0.74% | 0.59%(4) |
| Portfolio Turnover Rate | 64% | 97% | 82% | 174% | 101%(5) |
| Net Assets, End of Period (in thousands) | $37,918 | $37,535 | $53,908 | $3,836 | $25 |
| (1) | July 29, 2005 (commencement of sale) through October 31, 2005. | | | | |
| (2) | Computed using average shares outstanding throughout the period. | | | | |
| (3) | Total return assumes reinvestment of net investment income and capital gains distributions, if any. Total returns for periods less than one year |
| | are not annualized. The total return of the classes may not precisely reflect the class expense differences because of the impact of calculating |
| | the net asset values to two decimal places. If net asset values were calculated to three decimal places, the total return differences would |
| | more closely reflect the class expense differences. The calculation of net asset values to two decimal places is made in accordance with SEC |
| | guidelines and does not result in any gain or loss of value between one class and another. | | | |
| (4) | Annualized. | | | | | |
| (5) | Portfolio turnover is calculated at the fund level. Percentage indicated was calculated for the period November 30, 2004 (fund inception) through |
| | October 31, 2005. | | | | | |
| |
| |
| See Notes to Financial Statements. | | | | | |
76
| | | | | | |
| Fundamental Equity | | | | | |
| |
| Institutional Class | | | | | |
| For a Share Outstanding Throughout the Years Ended October 31 (except as noted) | | |
| | | 2009 | 2008 | 2007 | 2006 | 2005(1) |
| Per-Share Data | | | | | |
| Net Asset Value, Beginning of Period | $9.94 | $15.70 | $12.90 | $11.05 | $10.88 |
| Income From Investment Operations | | | | | |
| Net Investment Income (Loss)(2) | 0.16 | 0.19 | 0.19 | 0.12 | 0.02 |
| Net Realized and Unrealized Gain (Loss) | 0.65 | (5.44) | 2.91 | 2.10 | 0.15 |
| Total From Investment Operations | 0.81 | (5.25) | 3.10 | 2.22 | 0.17 |
| Distributions | | | | | |
| From Net Investment Income | (0.16) | (0.15) | (0.11) | — | — |
| From Net Realized Gains | — | (0.36) | (0.19) | (0.37) | — |
| Total Distributions | (0.16) | (0.51) | (0.30) | (0.37) | — |
| Net Asset Value, End of Period | $10.59 | $9.94 | $15.70 | $12.90 | $11.05 |
| |
| Total Return(3) | 8.47% | (34.45)% | 24.43% | 20.51% | 1.56% |
| | | | | | |
| Ratios/Supplemental Data | | | | | |
| Ratio of Operating Expenses | | | | | |
| to Average Net Assets | 0.81% | 0.81% | 0.80% | 0.80% | 0.80%(4) |
| Ratio of Net Investment Income (Loss) | | | | | |
| to Average Net Assets | 1.57% | 1.35% | 1.19% | 0.94% | 0.79%(4) |
| Portfolio Turnover Rate | 64% | 97% | 82% | 174% | 101%(5) |
| Net Assets, End of Period (in thousands) | $274 | $589 | $286 | $31 | $25 |
| (1) | July 29, 2005 (commencement of sale) through October 31, 2005. | | | | |
| (2) | Computed using average shares outstanding throughout the period. | | | | |
| (3) | Total return assumes reinvestment of net investment income and capital gains distributions, if any. Total returns for periods less than one year |
| | are not annualized. The total return of the classes may not precisely reflect the class expense differences because of the impact of calculating |
| | the net asset values to two decimal places. If net asset values were calculated to three decimal places, the total return differences would |
| | more closely reflect the class expense differences. The calculation of net asset values to two decimal places is made in accordance with SEC |
| | guidelines and does not result in any gain or loss of value between one class and another. | | | |
| (4) | Annualized. | | | | | |
| (5) | Portfolio turnover is calculated at the fund level. Percentage indicated was calculated for the period November 30, 2004 (fund inception) through |
| | October 31, 2005. | | | | | |
| |
| |
| See Notes to Financial Statements. | | | | | |
77
| | | | | | |
| Fundamental Equity | | | | | |
| |
| A Class | | | | | |
| For a Share Outstanding Throughout the Years Ended October 31 (except as noted) | | |
| | | 2009 | 2008 | 2007 | 2006 | 2005(1) |
| Per-Share Data | | | | | |
| Net Asset Value, Beginning of Period | $9.91 | $15.65 | $12.85 | $11.03 | $10.00 |
| Income From Investment Operations | | | | | |
| Net Investment Income (Loss)(2) | 0.11 | 0.12 | 0.11 | 0.06 | 0.02 |
| Net Realized and Unrealized Gain (Loss) | 0.66 | (5.41) | 2.92 | 2.11 | 1.01 |
| Total From Investment Operations | 0.77 | (5.29) | 3.03 | 2.17 | 1.03 |
| Distributions | | | | | |
| From Net Investment Income | (0.12) | (0.09) | (0.04) | — | — |
| From Net Realized Gains | — | (0.36) | (0.19) | (0.35) | — |
| Total Distributions | (0.12) | (0.45) | (0.23) | (0.35) | — |
| Net Asset Value, End of Period | $10.56 | $9.91 | $15.65 | $12.85 | $11.03 |
| |
| Total Return(3) | 8.00% | (34.73)% | 23.88% | 20.12% | 10.30% |
| | | | | | |
| Ratios/Supplemental Data | | | | | |
| Ratio of Operating Expenses | | | | | |
| to Average Net Assets | 1.26% | 1.26% | 1.25% | 1.25% | 1.28%(4) |
| Ratio of Net Investment Income (Loss) | | | | | |
| to Average Net Assets | 1.12% | 0.90% | 0.74% | 0.49% | 0.17%(4) |
| Portfolio Turnover Rate | 64% | 97% | 82% | 174% | 101% |
| Net Assets, End of Period (in thousands) | $159,959 | $218,469 | $246,322 | $37,314 | $1,636 |
| (1) | November 30, 2004 (fund inception) through October 31, 2005. | | | | |
| (2) | Computed using average shares outstanding throughout the period. | | | | |
| (3) | Total return assumes reinvestment of net investment income and capital gains distributions, if any, and does not reflect applicable sales charges |
| | Total returns for periods less than one year are not annualized. The total return of the classes may not precisely reflect the class expense |
| | differences because of the impact of calculating the net asset values to two decimal places. If net asset values were calculated to three decimal |
| | places, the total return differences would more closely reflect the class expense differences. The calculation of net asset values to two decimal |
| | places is made in accordance with SEC guidelines and does not result in any gain or loss of value between one class and another. | |
| (4) | Annualized. | | | | | |
| |
| |
| See Notes to Financial Statements. | | | | | |
78
| | | | | | |
| Fundamental Equity | | | | | |
| |
| B Class | | | | | |
| For a Share Outstanding Throughout the Years Ended October 31 (except as noted) | | |
| | | 2009 | 2008 | 2007 | 2006 | 2005(1) |
| Per-Share Data | | | | | |
| Net Asset Value, Beginning of Period | $9.78 | $15.45 | $12.74 | $10.96 | $10.00 |
| Income From Investment Operations | | | | | |
| Net Investment Income (Loss)(2) | 0.03 | 0.02 | 0.01 | (0.02) | (0.06) |
| Net Realized and Unrealized Gain (Loss) | 0.66 | (5.36) | 2.89 | 2.07 | 1.02 |
| Total From Investment Operations | 0.69 | (5.34) | 2.90 | 2.05 | 0.96 |
| Distributions | | | | | |
| From Net Investment Income | (0.05) | — | — | — | — |
| From Net Realized Gains | — | (0.33) | (0.19) | (0.27) | — |
| Total Distributions | (0.05) | (0.33) | (0.19) | (0.27) | — |
| Net Asset Value, End of Period | $10.42 | $9.78 | $15.45 | $12.74 | $10.96 |
| |
| Total Return(3) | 7.17% | (35.23)% | 23.01% | 19.04% | 9.60% |
| | | | | | |
| Ratios/Supplemental Data | | | | | |
| Ratio of Operating Expenses | | | | | |
| to Average Net Assets | 2.01% | 2.01% | 2.00% | 2.00% | 2.03%(4) |
| Ratio of Net Investment Income (Loss) | | | | | |
| to Average Net Assets | 0.37% | 0.15% | (0.01)% | (0.26)% | (0.58)%(4) |
| Portfolio Turnover Rate | 64% | 97% | 82% | 174% | 101% |
| Net Assets, End of Period (in thousands) | $4,043 | $4,195 | $4,889 | $1,498 | $469 |
| (1) | November 30, 2004 (fund inception) through October 31, 2005. | | | | |
| (2) | Computed using average shares outstanding throughout the period. | | | | |
| (3) | Total return assumes reinvestment of net investment income and capital gains distributions, if any, and does not reflect applicable sales charges. |
| | Total returns for periods less than one year are not annualized. The total return of the classes may not precisely reflect the class expense |
| | differences because of the impact of calculating the net asset values to two decimal places. If net asset values were calculated to three decimal |
| | places, the total return differences would more closely reflect the class expense differences. The calculation of net asset values to two decimal |
| | places is made in accordance with SEC guidelines and does not result in any gain or loss of value between one class and another. | |
| (4) | Annualized. | | | | | |
| |
| |
| See Notes to Financial Statements. | | | | | |
79
| | | | | | |
| Fundamental Equity | | | | | |
| |
| C Class | | | | | |
| For a Share Outstanding Throughout the Years Ended October 31 (except as noted) | | |
| | | 2009 | 2008 | 2007 | 2006 | 2005(1) |
| Per-Share Data | | | | | |
| Net Asset Value, Beginning of Period | $9.79 | $15.46 | $12.75 | $10.96 | $10.00 |
| Income From Investment Operations | | | | | |
| Net Investment Income (Loss)(2) | 0.03 | 0.02 | —(3) | (0.03) | (0.06) |
| Net Realized and Unrealized Gain (Loss) | 0.65 | (5.36) | 2.90 | 2.09 | 1.02 |
| Total From Investment Operations | 0.68 | (5.34) | 2.90 | 2.06 | 0.96 |
| Distributions | | | | | |
| From Net Investment Income | (0.05) | — | — | — | — |
| From Net Realized Gains | — | (0.33) | (0.19) | (0.27) | — |
| Total Distributions | (0.05) | (0.33) | (0.19) | (0.27) | — |
| Net Asset Value, End of Period | $10.42 | $9.79 | $15.46 | $12.75 | $10.96 |
| |
| Total Return(4) | 7.06% | (35.20)% | 22.99% | 19.13% | 9.60% |
| | | | | | |
| Ratios/Supplemental Data | | | | | |
| Ratio of Operating Expenses | | | | | |
| to Average Net Assets | 2.01% | 2.01% | 2.00% | 2.00% | 2.03%(5) |
| Ratio of Net Investment Income (Loss) | | | | | |
| to Average Net Assets | 0.37% | 0.15% | (0.01)% | (0.26)% | (0.58)%(5) |
| Portfolio Turnover Rate | 64% | 97% | 82% | 174% | 101% |
| Net Assets, End of Period (in thousands) | $15,311 | $18,919 | $24,544 | $4,530 | $693 |
| (1) | November 30, 2004 (fund inception) through October 31, 2005. | | | | |
| (2) | Computed using average shares outstanding throughout the period. | | | | |
| (3) | Per-share amount was less than $0.005. | | | | | |
| (4) | Total return assumes reinvestment of net investment income and capital gains distributions, if any, and does not reflect applicable sales charges. |
| | Total returns for periods less than one year are not annualized. The total return of the classes may not precisely reflect the class expense |
| | differences because of the impact of calculating the net asset values to two decimal places. If net asset values were calculated to three decimal |
| | places, the total return differences would more closely reflect the class expense differences. The calculation of net asset values to two decimal |
| | places is made in accordance with SEC guidelines and does not result in any gain or loss of value between one class and another. | |
| (5) | Annualized. | | | | | |
| |
| |
| See Notes to Financial Statements. | | | | | |
80
| | | | | | |
| Fundamental Equity | | | | | |
| |
| R Class | | | | | |
| For a Share Outstanding Throughout the Years Ended October 31 (except as noted) | | |
| | | 2009 | 2008 | 2007 | 2006 | 2005(1) |
| Per-Share Data | | | | | |
| Net Asset Value, Beginning of Period | $9.88 | $15.61 | $12.81 | $11.03 | $10.88 |
| Income From Investment Operations | | | | | |
| Net Investment Income (Loss)(2) | 0.06 | 0.09 | 0.09 | 0.04 | —(3) |
| Net Realized and Unrealized Gain (Loss) | 0.68 | (5.41) | 2.90 | 2.08 | 0.15 |
| Total From Investment Operations | 0.74 | (5.32) | 2.99 | 2.12 | 0.15 |
| Distributions | | | | | |
| From Net Investment Income | (0.10) | (0.05) | —(3) | — | — |
| From Net Realized Gains | — | (0.36) | (0.19) | (0.34) | — |
| Total Distributions | (0.10) | (0.41) | (0.19) | (0.34) | — |
| Net Asset Value, End of Period | $10.52 | $9.88 | $15.61 | $12.81 | $11.03 |
| |
| Total Return(4) | 7.64% | (34.92)% | 23.60% | 19.67% | 1.38% |
| | | | | | |
| Ratios/Supplemental Data | | | | | |
| Ratio of Operating Expenses | | | | | |
| to Average Net Assets | 1.51% | 1.51% | 1.50% | 1.50% | 1.50%(5) |
| Ratio of Net Investment Income (Loss) | | | | | |
| to Average Net Assets | 0.87% | 0.65% | 0.49% | 0.24% | 0.09%(5) |
| Portfolio Turnover Rate | 64% | 97% | 82% | 174% | 101%(6) |
| Net Assets, End of Period (in thousands) | $2,650 | $364 | $438 | $30 | $25 |
| (1) | July 29, 2005 (commencement of sale) through October 31, 2005. | | | | |
| (2) | Computed using average shares outstanding throughout the period. | | | | |
| (3) | Per-share amount was less than $0.005. | | | | | |
| (4) | Total return assumes reinvestment of net investment income and capital gains distributions, if any. Total returns for periods less than one year |
| | are not annualized. The total return of the classes may not precisely reflect the class expense differences because of the impact of calculating |
| | the net asset values to two decimal places. If net asset values were calculated to three decimal places, the total return differences would |
| | more closely reflect the class expense differences. The calculation of net asset values to two decimal places is made in accordance with SEC |
| | guidelines and does not result in any gain or loss of value between one class and another. | | | |
| (5) | Annualized. | | | | | |
| (6) | Portfolio turnover is calculated at the fund level. Percentage indicated was calculated for the period November 30, 2004 (fund inception) through |
| | October 31, 2005. | | | | | |
| |
| |
| See Notes to Financial Statements. | | | | | |
81
|
| Report of Independent Registered Public Accounting Firm |
The Board of Directors and Shareholders, American Century Mutual Funds, Inc.:
We have audited the accompanying statements of assets and liabilities, including the schedules of investments, of Select Fund, Capital Growth Fund, Focused Growth Fund and Fundamental Equity Fund, four of the funds constituting American Century Mutual Funds, Inc. (the “Corporation”), as of October 31, 2009, and the related statements of operations for the year then ended, the statements of changes in net assets for each of the two years in the period then ended, and the financial highlights for each of the periods presented. These financial statements and financial highlights are the responsibility of the Corporation’s management. Our responsibility is to express an opinion on these financial statements and financial highlights based on our audits.
We conducted our audits in accordance with the standards of the Public Company Accounting Oversight Board (United States). Those standards require that we plan and perform the audit to obtain reasonable assurance about whether the financial statements and financial highlights are free of material misstatement. The Corporation is not required to have, nor were we engaged to perform, an audit of its internal control over financial reporting. Our audits included consideration of internal control over financial reporting as a basis for designing audit procedures that are appropriate in the circumstances, but not for the purpose of expressing an opinion on the effectiveness of the Corporation’s internal control over financial reporting. Accordingly, we express no such opinion. An audit also includes examining, on a test basis, evidence supporting the amounts and disclosures in the financial statements, assessing the accounting principles used and significant estimates made by management, as well as evaluating the overall financial statement presentation. Our procedures included confirmation of securities owned as of October 31, 2009, by correspondence with the custodian and brokers; where replies were not received from brokers, we performed other auditing procedures. We believe that our audits provide a reasonable basis for our opinion.
In our opinion, the financial statements and financial highlights referred to above present fairly, in all material respects, the respective financial positions of Select Fund, Capital Growth Fund, Focused Growth Fund and Fundamental Equity Fund of American Century Mutual Funds, Inc., as of October 31, 2009, the results of their operations for the year then ended, the changes in their net assets for each of the two years in the period then ended, and the financial highlights for each of the periods presented, in conformity with accounting principles generally accepted in the United States of America.
Deloitte & Touche LLP
Kansas City, Missouri
December 28, 2009
82
The individuals listed below serve as directors or officers of the funds. Each director serves until his or her successor is duly elected and qualified or until he or she retires. Mandatory retirement age for independent directors is 72. Those listed as interested directors are “interested” primarily by virtue of their engagement as directors and/or officers of, or ownership interest in, American Century Companies, Inc. (ACC) or its wholly owned, direct or indirect, subsidiaries, including the funds’ investment advisor, American Century Investment Management, Inc. (ACIM); the funds’ principal underwriter, American Century Investment Services, Inc. (ACIS); and the funds’ transfer agent, American Century Services, LLC (ACS).
The other directors (more than three-fourths of the total number) are independent; that is, they have never been employees, directors or officers of, and have no financial interest in, ACC or any of its wholly owned, direct or indirect, subsidiaries, including ACIM, ACIS and ACS. The directors serve in this capacity for seven registered investment companies in the American Century Investments family of funds.
All persons named as officers of the funds also serve in similar capacities for the other 14 registered investment companies in the American Century Investments family of funds advised by ACIM or American Century Global Investment Management, Inc. (ACGIM), a wholly owned subsidiary of ACIM, unless otherwise noted. Only officers with policy-making functions are listed. No officer is compensated for his or her service as an officer of the funds. The listed officers are interested persons of the funds and are appointed or re-appointed on an annual basis.
Interested Director
Jonathan S. Thomas, 4500 Main Street, Kansas City, MO 64111
Year of Birth: 1963
Position(s) Held with Funds: Director (since 2007) and President (since 2007)
Principal Occupation(s) During Past 5 Years: President and Chief Executive Officer, ACC
(March 2007 to present); Chief Administrative Officer, ACC (February 2006 to
February 2007); Executive Vice President, ACC (November 2005 to February 2007).
Also serves as: President, Chief Executive Officer and Director, ACS; Executive
Vice President, ACIM and ACGIM; Director, ACIM, ACGIM, ACIS and other ACC
subsidiaries. Managing Director, Morgan Stanley (March 2000 to November 2005)
Number of Portfolios in Fund Complex Overseen by Director: 103
Other Directorships Held by Director: None
83
Independent Directors
Thomas A. Brown, 4500 Main Street, Kansas City, MO 64111
Year of Birth: 1940
Position(s) Held with Funds: Director (since 1980)
Principal Occupation(s) During Past 5 Years: Managing Member, Associated Investments, LLC
(real estate investment company); Managing Member, Brown Cascade Properties,
LLC (real estate investment company); Retired, Area Vice President, Applied
Industrial Technologies (bearings and power transmission company)
Number of Portfolios in Fund Complex Overseen by Director: 63
Other Directorships Held by Director: None
Andrea C. Hall, Ph.D., 4500 Main Street, Kansas City, MO 64111
Year of Birth: 1945
Position(s) Held with Funds: Director (since 1997)
Principal Occupation(s) During Past 5 Years: Retired, Advisor to the President, Midwest
Research Institute (not-for-profit, contract research organization)
Number of Portfolios in Fund Complex Overseen by Director: 63
Other Directorships Held by Director: None
James A. Olson, 4500 Main Street, Kansas City, MO 64111
Year of Birth: 1942
Position(s) Held with Funds: Director (since 2007)
Principal Occupation(s) During Past 5 Years: Member, Plaza Belmont LLC (private equity
fund manager); Chief Financial Officer, Plaza Belmont LLC (September 1999 to
September 2006)
Number of Portfolios in Fund Complex Overseen by Director: 63
Other Directorships Held by Director: Saia, Inc. and Entertainment Properties Trust
Donald H. Pratt, 4500 Main Street, Kansas City, MO 64111
Year of Birth: 1937
Position(s) Held with Funds: Director (since 1995) and Chairman of the Board (since 2005)
Principal Occupation(s) During Past 5 Years: Chairman and Chief Executive Officer, Western
Investments, Inc. (real estate company); Retired Chairman of the Board, Butler
Manufacturing Company (metal buildings producer)
Number of Portfolios in Fund Complex Overseen by Director: 63
Other Directorships Held by Director: None
Gale E. Sayers, 4500 Main Street, Kansas City, MO 64111
Year of Birth: 1943
Position(s) Held with Funds: Director (since 2000)
Principal Occupation(s) During Past 5 Years: President, Chief Executive Officer and Founder,
Sayers40, Inc. (technology products and services provider)
Number of Portfolios in Fund Complex Overseen by Director: 63
Other Directorships Held by Director: None
M. Jeannine Strandjord, 4500 Main Street, Kansas City, MO 64111
Year of Birth: 1945
Position(s) Held with Funds: Director (since 1994)
Principal Occupation(s) During Past 5 Years: Retired, formerly Senior Vice President, Sprint
Corporation (telecommunications company)
Number of Portfolios in Fund Complex Overseen by Director: 63
Other Directorships Held by Director: DST Systems, Inc.; Euronet Worldwide, Inc. and
Charming Shoppes, Inc.
84
John R. Whitten, 4500 Main Street, Kansas City, MO 64111
Year of Birth: 1946
Position(s) Held with Funds: Director (since 2008)
Principal Occupation(s) During Past 5 Years: Project Consultant, Celanese Corp. (industrial
chemical company) (September 2004 to January 2005)
Number of Portfolios in Fund Complex Overseen by Director: 63
Other Directorships Held by Director: Rudolph Technologies, Inc.
Officers
Barry Fink, 4500 Main Street, Kansas City, MO 64111
Year of Birth: 1955
Position(s) Held with Funds: Executive Vice President (since 2007)
Principal Occupation(s) During Past 5 Years: Chief Operating Officer and Executive Vice
President, ACC (September 2007 to present); President, ACS (October 2007 to
present); Managing Director, Morgan Stanley (2000 to 2007); Global General
Counsel, Morgan Stanley (2000 to 2006). Also serves as: Director, ACC, ACS, ACIS
and other ACC subsidiaries
Maryanne Roepke, 4500 Main Street, Kansas City, MO 64111
Year of Birth: 1956
Position(s) Held with Funds: Chief Compliance Officer (since 2006) and Senior Vice
President (since 2000)
Principal Occupation(s) During Past 5 Years: Chief Compliance Officer, ACIM, ACGIM and ACS
(August 2006 to present); Assistant Treasurer, ACC (January 1995 to August 2006); and
Treasurer and Chief Financial Officer, various American Century Investments funds
(July 2000 to August 2006). Also serves as: Senior Vice President, ACS
Charles A. Etherington, 4500 Main Street, Kansas City, MO 64111
Year of Birth: 1957
Position(s) Held with Funds: General Counsel (since 2007) and Senior Vice President
(since 2006)
Principal Occupation(s) During Past 5 Years: Attorney, ACC (February 1994 to present); Vice
President, ACC (November 2005 to present); General Counsel, ACC (March 2007
to present). Also serves as: General Counsel, ACIM, ACGIM, ACS, ACIS and other
ACC subsidiaries; and Senior Vice President, ACIM, ACGIM and ACS
Robert Leach, 4500 Main Street, Kansas City, MO 64111
Year of Birth: 1966
Position(s) Held with Funds: Vice President, Treasurer and Chief Financial Officer
(all since 2006)
Principal Occupation(s) During Past 5 Years: Vice President, ACS (February 2000 to present); and
Controller, various American Century Investments funds (1997 to September 2006)
David H. Reinmiller, 4500 Main Street, Kansas City, MO 64111
Year of Birth: 1963
Position(s) Held with Funds: Vice President (since September 2000)
Principal Occupation(s) During Past 5 Years: Attorney, ACC (January 1994 to present);
Associate General Counsel, ACC (January 2001 to present); Chief Compliance
Officer, American Century Investments funds, ACIM and ACGIM (January 2001 to
February 2005). Also serves as: Associate General Counsel, ACIM, ACGIM, ACS,
ACIS and other ACC subsidiaries; and Vice President, ACIM, ACGIM and ACS
Ward Stauffer, 4500 Main Street, Kansas City, MO 64111
Year of Birth: 1960
Position(s) Held with Funds: Secretary (since February 2005)
Principal Occupation(s) During Past 5 Years: Attorney, ACC (June 2003 to present)
The SAI has additional information about the funds’ directors and is available without charge, upon request, by calling 1-800-345-2021.
85
|
| Approval of Management Agreements |
Under Section 15(c) of the Investment Company Act, contracts for investment advisory services are required to be reviewed, evaluated and approved by a majority of a fund’s independent directors (the “Directors”) each year. At American Century Investments, this process is referred to as the “15(c) Process.” As a part of this process, the board reviews fund performance, shareholder services, audit and compliance information, and a variety of other reports from the advisor concerning fund operations. In addition to this annual review, the board of directors oversees and evaluates on a continuous basis at its quarterly meetings the nature and quality of significant services performed by the advisor, fund performance, audit and compliance information, and a variety of other reports relating to fund operations. The board, or committees of the board, also holds special meetings as needed.
Under a Securities and Exchange Commission rule, each fund is required to disclose in its annual or semiannual report, as appropriate, the material factors and conclusions that formed the basis for the board’s approval or renewal of any advisory agreements within the fund’s most recently completed fiscal half-year period.
Annual Contract Review Process
As part of the annual 15(c) Process undertaken during the most recent fiscal half-year period, the Directors reviewed extensive data and information compiled by the advisor and certain independent providers of evaluative data (the “15(c) Providers”) concerning Select, Capital Growth, Focused Growth and Fundamental Equity (the “Funds”) and the services provided to the Funds under the management agreement. The information considered and the discussions held at the meetings included, but were not limited to:
• the nature, extent and quality of investment management, shareholder services and other services provided to the Funds;
• the wide range of programs and services the advisor provides to the Funds and their shareholders on a routine and non-routine basis;
• the compliance policies, procedures, and regulatory experience of the advisor;
• data comparing the cost of owning the Funds to the cost of owning a similar fund;
• data comparing the Funds’ performance to appropriate benchmarks and/or a peer group of other mutual funds with similar investment objectives and strategies;
• financial data showing the profitability of the Funds to the advisor and the overall profitability of the advisor;
• data comparing services provided and charges to other investment management clients of the advisor; and
86
• consideration of collateral benefits derived by the advisor from the management of the Funds and any potential economies of scale relating thereto.
In keeping with its practice, the Funds’ board of directors held two in-person meetings and one telephonic meeting to review and discuss the information provided. The board also had the benefit of the advice of its independent counsel throughout the period.
Factors Considered
The Directors considered all of the information provided by the advisor, the 15(c) Providers, and the board’s independent counsel, and evaluated such information for each fund for which the board has responsibility. In connection with their review of the Funds, the Directors did not identify any single factor as being all-important or controlling, and each Director may have attributed different levels of importance to different factors. In deciding to renew the management and subadvisory agreements under the terms ultimately determined by the board to be appropriate, the Directors’ decision was based on the following factors.
Nature, Extent and Quality of Services — Generally. Under the management agreement, the advisor is responsible for providing or arranging for all services necessary for the operation of the Funds. The board noted that under the management agreement, the advisor provides or arranges at its own expense a wide variety of services including:
• Fund construction and design
• portfolio security selection
• initial capitalization/funding
• securities trading
• Fund administration
• custody of Fund assets
• daily valuation of each Fund’s portfolio
• shareholder servicing and transfer agency, including shareholder
confirmations, recordkeeping and communications
• legal services
• regulatory and portfolio compliance
• financial reporting
• marketing and distribution
87
The Directors noted that many of the services provided by the advisor have expanded over time both in terms of quantity and complexity in response to shareholder demands, competition in the industry and the changing regulatory environment. They discussed with the advisor the challenges presented by these changes and the impact on the Funds. In performing their evaluation, the Directors considered information received in connection with the annual review, as well as information provided on an ongoing basis at their regularly scheduled board and committee meetings.
Investment Management Services. The nature of the investment management services provided to the Funds is quite complex and allows Fund shareholders access to professional money management, instant diversification of their investments, and liquidity. In evaluating investment performance, the board expects the advisor to manage the Funds in accordance with its investment objectives and approved strategies. Further, the Directors recognize that the advisor has an obligation to monitor trading activities, and in particular to seek the best execution of fund trades, and to evaluate the use of and payment for research. In providing these services, the advisor utilizes teams of investment professionals (portfolio managers, analysts, research assistants, and securities traders) who require extensive information technology, research, training, com pliance and other systems to conduct their business. At each quarterly meeting the Directors review investment performance information for the Funds, together with comparative information for appropriate benchmarks and/or peer groups of funds managed similarly to the Funds. The Directors also review detailed performance information during the 15(c) Process comparing each Fund’s performance with that of similar funds not managed by the advisor. If performance concerns are identified, the Directors discuss with the advisor the reasons for such results (e.g., market conditions, security selection) and any efforts being undertaken to improve performance. The performance of Capital Growth, Focused Growth and Fundamental Equity for both the one- and three-year periods was above the median for its respective peer group. Select’s performance was above the median for its peer group for the one-year period and below the median for the three-year period.
Shareholder and Other Services. The advisor provides the Funds with a comprehensive package of transfer agency, shareholder, and other services. The Directors review reports and evaluations of such services at their regular quarterly meetings, including the annual meeting concerning contract review, and reports to the board. These reports include, but are not limited to, information regarding the operational efficiency and accuracy of the shareholder and transfer agency services provided, staffing levels, shareholder satisfaction (as measured by external as well as internal sources), technology support, new products and services offered to Fund shareholders, securities trading activities, portfolio valuation services, auditing services, and legal and operational compliance activities. Certain aspects of shareholder and transfer agency serv ice level efficiency and the quality of securities trading activities are measured by independent third party providers and are presented in comparison to other fund groups not managed by the advisor.
88
Costs of Services Provided and Profitability. The advisor provides detailed information concerning its cost of providing various services to the Funds, its profitability in managing the Funds, its overall profitability, and its financial condition. The Directors have reviewed with the advisor the methodology used to prepare this financial information. This financial information regarding the advisor is considered in order to evaluate the advisor’s financial condition, its ability to continue to provide services under the management agreement, and the reasonableness of the current management fee. The board concluded that the advisor’s profits were reasonable in light of the services provided to the Funds.
Ethics. The Directors generally consider the advisor’s commitment to providing quality services to shareholders and to conducting its business ethically. They noted that the advisor’s practices generally meet or exceed industry best practices.
Economies of Scale. The Directors review information provided by the advisor regarding the possible existence of economies of scale in connection with the management of the Funds. The Directors concluded that economies of scale are difficult to measure and predict with precision, especially on a fund-by-fund basis. The analysis of economies of scale is further complicated by the additional services and content provided by the advisor and its reinvestment in its ability to provide and expand those services. Accordingly, the Directors seek to evaluate economies of scale by reviewing other information, such as year-over-year profitability of the advisor generally, the profitability of its management of the Funds specifically, the expenses incurred by the advisor in providing various functions to the Funds, and the fees of competitive funds no t managed by the advisor. The Directors believe the advisor is appropriately sharing economies of scale through its competitive fee structure, fee breakpoints as each Fund increases in size, and through reinvestment in its business to provide shareholders additional content and services.
Comparison to Other Funds’ Fees. The Funds pay the advisor a single, all-inclusive (or unified) management fee for providing all services necessary for the management and operation of the Funds, other than brokerage expenses, taxes, interest, extraordinary expenses, and the fees and expenses of each Fund’s independent directors (including their independent legal counsel). Under the unified fee structure, the advisor is responsible for providing all investment advisory, custody, audit, administrative, compliance, record-keeping, marketing and shareholder services, or arranging and supervising third parties to provide such services. By contrast, most other funds are charged a variety of fees, including an investment advisory fee, a transfer agency fee, an administrative fee, distribution charges and other expenses. Other than their investment advisory fees and Rule 12b-1 distribution fees, all other components of the total fees charged by these other funds may be increased without shareholder approval. The board believes the unified fee structure is a benefit to Fund shareholders because it clearly discloses to shareholders the cost of owning Fund shares, and, since the unified fee cannot be increased without a vote of Fund shareholders, it shifts to the advisor the risk of increased costs of operating the Fund and provides a direct incentive to minimize administrative inefficiencies. Part of the Directors’ analysis of fee levels involves reviewing certain evaluative data
89
compiled by a 15(c) Provider comparing each Fund’s unified fee to the total expense ratio of other funds in the Fund’s peer group and performing a regression analysis to evaluate the effect of fee breakpoints as assets under management increase. The unified fee charged to shareholders of each of Capital Growth and Focused Growth was below the median of the total expense ratios of its respective peer group. The unified fee charged to shareholders of each of Select and Fundamental Equity were at or near the median of the total expense ratios of its respective peer group. In addition, the Directors also reviewed updated fee level data provided by the advisor, but recognized that comparative data was particularly difficult to evaluate given the significant market developments during the past year. The board concluded that the management fee paid by each Fund to the advisor was reasonable in light of the services provid ed to the Fund.
Comparison to Fees and Services Provided to Other Clients of the Advisor. The Directors also requested and received information from the advisor concerning the nature of the services, fees, and profitability of its advisory services to advisory clients other than the Funds. They observed that these varying types of client accounts require different services and involve different regulatory and entrepreneurial risks than the management of the Funds. The Directors analyzed this information and concluded that the fees charged and services provided to the Funds were reasonable by comparison.
Collateral Benefits Derived by the Advisor. The Directors considered the existence of collateral benefits the advisor may receive as a result of its relationship with the Funds. They concluded that the advisor’s primary business is managing mutual funds and it generally does not use fund or shareholder information to generate profits in other lines of business, and therefore does not derive any significant collateral benefits from them. The Directors noted that the advisor receives proprietary research from broker-dealers that execute fund portfolio transactions and concluded that this research is likely to benefit fund shareholders. The Directors also determined that the advisor is able to provide investment management services to certain clients other than the Funds, at least in part, due to its existing infrastructure built to serv e the fund complex. The Directors concluded, however, that the assets of those other clients are not material to the analysis and, in any event, are included with the assets of the Funds to determine breakpoints in each Fund’s fee schedule, provided they are managed using the same investment team and strategy.
Conclusions of the Directors
As a result of this process, the board, including all of the independent directors, in the absence of particular circumstances and assisted by the advice of legal counsel that is independent of the advisor, taking into account all of the factors discussed above and the information provided by the advisor concluded that the investment management agreement between each Fund and the advisor is fair and reasonable in light of the services provided and should be renewed.
90
Retirement Account Information
As required by law, distributions you receive from certain IRAs, or 403(b), 457 and qualified plans are subject to federal income tax withholding, unless you elect not to have withholding apply. Tax will be withheld on the total amount withdrawn even though you may be receiving amounts that are not subject to withholding, such as nondeductible contributions. In such case, excess amounts of withholding could occur. You may adjust your withholding election so that a greater or lesser amount will be withheld.
If you don’t want us to withhold on this amount, you must notify us to not withhold the federal income tax. You may notify us in writing or in certain situations by telephone or through other electronic means. You have the right to revoke your withholding election at any time and any election you make may remain in effect until revoked by filing a new election.
Remember, even if you elect not to have income tax withheld, you are liable for paying income tax on the taxable portion of your withdrawal. If you elect not to have income tax withheld or you don’t have enough income tax withheld, you may be responsible for payment of estimated tax. You may incur penalties under the estimated tax rules if your withholding and estimated tax payments are not sufficient. You can reduce or defer the income tax on a distribution by directly or indirectly rolling such distribution over to another IRA or eligible plan. You should consult your tax advisor for additional information.
State tax will be withheld if, at the time of your distribution, your address is within one of the mandatory withholding states and you have federal income tax withheld. State taxes will be withheld from your distribution in accordance with the respective state rules.
Proxy Voting Guidelines
American Century Investment Management, Inc., the funds’ investment advisor, is responsible for exercising the voting rights associated with the securities purchased and/or held by the funds. A description of the policies and procedures the advisor uses in fulfilling this responsibility is available without charge, upon request, by calling 1-800-345-2021. It is also available on American Century Investments’ website at americancentury.com and on the Securities and Exchange Commission’s website at sec.gov. Information regarding how the investment advisor voted proxies relating to portfolio securities during the most recent 12-month period ended June 30 is available on the “About Us” page at americancentury.com. It is also available at sec.gov.
Quarterly Portfolio Disclosure
The funds file their complete schedule of portfolio holdings with the Securities and Exchange Commission (SEC) for the first and third quarters of each fiscal year on Form N-Q. The funds’ Forms N-Q are available on the SEC’s website at sec.gov, and may be reviewed and copied at the SEC’s Public Reference Room in Washington, DC. Information on the operation of the Public Reference Room may be obtained by calling 1-800-SEC-0330. The funds also make their complete schedule of portfolio holdings for the most recent quarter of their fiscal year available on their website at americancentury.com and, upon request, by calling 1-800-345-2021.
91
The following indices are used to illustrate investment market, sector, or style performance or to serve as fund performance comparisons. They are not investment products available for purchase.
The Russell 1000® Index is a market-capitalization weighted, large-cap index created by Frank Russell Company to measure the performance of the 1,000 largest publicly traded U.S. companies, based on total market capitalization.
The Russell 1000® Growth Index measures the performance of those Russell 1000 Index companies (the 1,000 largest publicly traded U.S. companies, based on total market capitalization) with higher price-to-book ratios and higher forecasted growth values.
The Russell 1000® Value Index measures the performance of those Russell 1000 Index companies (the 1,000 largest publicly traded U.S. companies, based on total market capitalization) with lower price-to-book ratios and lower forecasted growth values.
The Russell 2000® Index is a market-capitalization weighted index created by Frank Russell Company to measure the performance of the 2,000 smallest of the 3,000 largest publicly traded U.S. companies, based on total market capitalization.
The Russell 2000® Growth Index measures the performance of those Russell 2000 Index companies (the 2,000 smallest of the 3,000 largest publicly traded U.S. companies, based on total market capitalization) with higher price-to-book ratios and higher forecasted growth values.
The Russell 2000® Value Index measures the performance of those Russell 2000 Index companies (the 2,000 smallest of the 3,000 largest publicly traded U.S. companies, based on total market capitalization) with lower price-to-book ratios and lower forecasted growth values.
The Russell Midcap® Index measures the performance of the 800 smallest of the 1,000 largest publicly traded U.S. companies, based on total market capitalization.
The Russell Midcap® Growth Index measures the performance of those Russell Midcap Index companies (the 800 smallest of the 1,000 largest publicly traded U.S. companies, based on total market capitalization) with higher price-to-book ratios and higher forecasted growth values.
92
The Russell Midcap® Value Index measures the performance of those Russell Midcap Index companies (the 800 smallest of the 1,000 largest publicly traded U.S. companies, based on total market capitalization) with lower price-to-book ratios and lower forecasted growth values.
The S&P 500 Index is a market value-weighted index of the stocks of 500 publicly traded U.S. companies chosen for market size, liquidity, and industry group representation that are considered to be leading firms in dominant industries. Each stock’s weight in the index is proportionate to its market value. Created by Standard & Poor’s, it is considered to be a broad measure of U.S. stock market performance.
93
94
95
96

| |
| |
| Contact Us | |
| americancentury.com | |
| Automated Information Line | 1-800-345-8765 |
| Investor Services Representative | 1-800-345-2021 or |
| | 816-531-5575 |
| Investors Using Advisors | 1-800-378-9878 |
| Business, Not-For-Profit, Employer-Sponsored | |
| Retirement Plans | 1-800-345-3533 |
| Banks and Trust Companies, Broker-Dealers, | |
| Financial Professionals, Insurance Companies | 1-800-345-6488 |
| Telecommunications Device for the Deaf | 1-800-634-4113 |
| American Century Mutual Funds, Inc. | |
| Investment Advisor: | |
| American Century Investment Management, Inc. | |
| Kansas City, Missouri | |
This report and the statements it contains are submitted for the general
information of our shareholders. The report is not authorized for distribution to
prospective investors unless preceded or accompanied by an effective prospectus.
American Century Investment Services, Inc., Distributor
©2009 American Century Proprietary Holdings, Inc. All rights reserved.
0912
CL-ANN-67030N
|
| Annual Report |
| October 31, 2009 |

|
|
| American Century Investments |
Heritage Fund
New Opportunities II Fund
(effective December 1, 2009, renamed Small Cap Growth Fund)
| |
| President’s Letter | 2 |
| Independent Chairman’s Letter | 3 |
| Market Perspective | 4 |
| U.S. Stock Index Returns | 4 |
| |
| Heritage | |
| |
| Performance | 5 |
| Portfolio Commentary | 7 |
| Top Ten Holdings | 9 |
| Top Five Industries | 9 |
| Types of Investments in Portfolio | 9 |
| |
| New Opportunities II | |
| |
| Performance | 10 |
| Portfolio Commentary | 12 |
| Top Ten Holdings | 14 |
| Top Five Industries | 14 |
| Types of Investments in Portfolio | 14 |
| |
| Shareholder Fee Examples | 15 |
| |
| Financial Statements | |
| |
| Schedule of Investments | 17 |
| Statement of Assets and Liabilities | 25 |
| Statement of Operations | 27 |
| Statement of Changes in Net Assets | 28 |
| Notes to Financial Statements | 30 |
| Financial Highlights | 40 |
| Report of Independent Registered Public Accounting Firm | 52 |
| |
| Other Information | |
| |
| Management | 53 |
| Approval of Management Agreements | 56 |
| Additional Information | 61 |
| Index Definitions | 62 |
The opinions expressed in the Market Perspective and each of the Portfolio Commentaries reflect those of the portfolio management team as of the date of the report, and do not necessarily represent the opinions of American Century Investments or any other person in the American Century Investments organization. Any such opinions are subject to change at any time based upon market or other conditions and American Century Investments disclaims any responsibility to update such opinions. These opinions may not be relied upon as investment advice and, because investment decisions made by American Century Investments funds are based on numerous factors, may not be relied upon as an indication of trading intent on behalf of any American Century Investments fund. Security examples are used for representational purposes only and are not intended as recommendations to purchase or sell securities. Performance information for com parative indices and securities is provided to American Century Investments by third party vendors. To the best of American Century Investments’ knowledge, such information is accurate at the time of printing.

Dear Investor:
Thank you for taking time to review the following pages, which provide the performance of your investment along with the perspectives of our experienced portfolio management team for the financial reporting period ended October 31, 2009. We appreciate your trust in American Century Investments® at this volatile, transitional time in the economy and investment markets.
As the upheavals associated with the “Great Recession” gradually subside, our senior management team has put considerable thought into how the investment environment has changed and what new challenges and opportunities await us Critical factors that we are anticipating in the coming year include marked shifts in investment and spending behavior, along with consolidation in our industry.
Most importantly, we think the economic recovery will be slow and extended. The economy and capital markets have come a long way since Lehman Brothers collapsed in the third quarter of 2008, but 2010 will likely bring continuing challenges. The stock market’s rebound since last March and the third-quarter economic surge in 2009 were fueled largely by corporate cost-cutting and unprecedented monetary and fiscal stimulus, including some key programs that have since expired or been scaled back.
Meanwhile, the resilient but struggling consumer sector still faces double-digit unemployment, heavy debt burdens, tight credit conditions, and a housing market that is starting to stabilize, but remains vulnerable. Much of our investment positioning in 2009 cautiously reflected these still unstable economic fundamentals, leading to underperformance, in some cases, versus market benchmarks buoyed by the rally of riskier assets. We still support our fundamentally based positioning because we believe strongly that some markets—driven more by technical factors than fundamentals—have advanced further than underlying economic conditions warrant, and remain susceptible to the possibility of more volatility ahead.
Thank you for your continued confidence in us.
Sincerely,

Jonathan Thomas
President and Chief Executive Officer
American Century Investments
2
|
| Independent Chairman’s Letter |

In my first letter to shareholders of the American Century Investments funds, I invited you to contact me with your questions. I have been gratified with your response. Most shareholder inquiries to date have related to specific fund performance issues. As I noted in my individual responses, your board through the Fund Performance Committee continues to stress improved performance in our quarterly meetings with chief investment officers and fund managers.
An important part of our fund performance review process is a face-to-face meeting with portfolio managers. The board traveled during the second quarter to the American Century Investments office in Mountain View, California to meet with the fund of funds and asset allocation portfolio management teams. These meetings validated the importance of thorough reviews of investment opportunities by the credit management personnel resident in that office. As a result of their efforts, American Century Investments funds were able to avoid the “toxic assets” that plagued many other fund families in 2008.
From April through June 2009, the board conducted its annual review of the advisory contracts between American Century Investments and each fund. Our efforts involved a review of fund information, including assets under management; total expense ratio compared to peers; economies of scale; fee breakpoints that reduce shareholder costs as assets increase; performance compared to peers and benchmarks; and the quality of services provided to fund shareholders. A detailed discussion of board considerations in connection with advisory contract renewal is included annually in each fund’s shareholder reports. During this review, the board focuses on a detailed comparison of the competitive position of each fund and has negotiated more than 60 breakpoints or fee reductions in the past five years.
The board looks forward to another year of work on your behalf and your comments are appreciated. You are invited to email me at dhpratt@fundboardchair.com.

3

By Enrique Chang, Chief Investment Officer, American Century Investments
Signs of Economic Recovery Boosted Stocks
The year ended October 31, 2009, was a period of extremes for the U.S. stock market. The market began the period in the midst of a historically steep decline, then finished the period with one of its strongest rallies since the 1930s. The market’s dramatic swings resulted from rapidly shifting expectations regarding the economic and financial environment.
Stocks fell sharply in late 2008 and early 2009 as investors grew increasingly concerned about a deep economic downturn and a lack of liquidity in the credit markets. In response, the federal government took unprecedented actions to shore up the credit sector, support the housing market, and revive the stalled economy.
These efforts began to bear fruit in the spring of 2009 as signs of economic stabilization emerged. Although the unemployment rate continued to climb, reaching a 26-year high of 10.2% by October, the broader economy showed evidence of improvement, producing real growth in the third quarter of 2009—the first positive quarterly growth in more than a year. In addition, cost-management efforts at many companies helped generate better-than-expected earnings in the second and third quarters.
As a result, the equity market reached a multi-year low on March 9 and then reversed course, rising steadily throughout the last seven months of the period. The rally helped erase the market’s earlier losses, enabling the major stock indexes to produce gains of approximately 10% overall. Growth stocks outperformed value shares by a wide margin (see the table below) across all market capitalizations, though they lagged modestly over the last six months.
Economic Challenges Remain
Although recent economic trends have been encouraging, the recovery will likely be gradual until there is sustained improvement in the delinquency levels of consumer debt and the unemployment rate. Thus far, the U.S. consumer has been conspicuously absent from the recovery, and given the weakness in the U.S. dollar and improving economic conditions elsewhere in the world, we may see an export-led recovery until the consumer gets back on firmer footing.
| | | | |
| U.S. Stock Index Returns | | | | |
| For the 12 months ended October 31, 2009 | | | |
| Russell 1000 Index (Large-Cap) | 11.20% | | Russell 2000 Index (Small-Cap) | 6.46% |
| Russell 1000 Growth Index | 17.51% | | Russell 2000 Growth Index | 11.34% |
| Russell 1000 Value Index | 4.78% | | Russell 2000 Value Index | 1.96% |
| Russell Midcap Index | 18.75% | | | |
| Russell Midcap Growth Index | 22.48% | | | |
| Russell Midcap Value Index | 14.52% | | | |
4
| | | | | |
| Performance | | | | | |
| |
| Heritage | | | | | |
| |
| Total Returns as of October 31, 2009 | | | | |
| | | Average Annual Returns | |
| | | | | Since | Inception |
| | 1 year | 5 years | 10 years | Inception | Date |
| Investor Class | 10.16% | 8.67% | 5.77% | 10.59% | 11/10/87 |
| Russell Midcap Growth Index(1) | 22.48% | 2.22% | 1.01% | 9.63%(2) | — |
| Russell Midcap Index(1) | 18.75% | 2.40% | 5.09% | 11.02%(2) | — |
| Institutional Class | 10.33% | 8.89% | 6.00% | 6.43% | 6/16/97 |
| A Class(3) | | | | | 7/11/97 |
| No sales charge* | 9.89% | 8.41% | 5.50% | 5.58% | |
| With sales charge* | 3.59% | 7.13% | 4.88% | 5.08% | |
| B Class | | | | | 9/28/07 |
| No sales charge* | 8.99% | — | — | -16.15% | |
| With sales charge* | 4.99% | — | — | -17.91% | |
| C Class | 9.07% | 7.61% | — | 2.29% | 6/26/01 |
| R Class | 9.58% | — | — | -15.72% | 9/28/07 |
|
| *Sales charges include initial sales charges and contingent deferred sales charges (CDSCs), as applicable. A Class shares have a 5.75% |
| maximum initial sales charge for equity funds and may be subject to a maximum CDSC of 1.00%. B Class shares redeemed within six |
| years of purchase are subject to a CDSC that declines from 5.00% during the first year after purchase to 0.00% the sixth year after |
| purchase. C Class shares redeemed within 12 months of purchase are subject to a maximum CDSC of 1.00%. The SEC requires that |
| mutual funds provide performance information net of maximum sales charges in all cases where charges could be applied. |
(1) | Data provided by Lipper Inc. – A Reuters Company. © 2009 Reuters. All rights reserved. Any copying, republication or redistribution of Lipper content, including by caching, framing or similar means, is expressly prohibited without the prior written consent of Lipper. Lipper shall not be liable for any errors or delays in the content, or for any actions taken in reliance thereon. |
| The data contained herein has been obtained from company reports, financial reporting services, periodicals and other resources believed to be reliable. Although carefully verified, data on compilations is not guaranteed by Lipper and may be incomplete. No offer or solicitations to buy or sell any of the securities herein is being made by Lipper. |
| (2) | Since 10/31/87, the date nearest the Investor Class’s inception for which data are available. |
| (3) | Prior to September 4, 2007, the A Class was referred to as the Advisor Class. Performance, with sales charge, prior to that date has been adjusted to reflect the A Class’s current sales charge. |
Data presented reflect past performance. Past performance is no guarantee of future results. Current performance may be higher or lower than the performance shown. Investment return and principal value will fluctuate, and redemption value may be more or less than original cost. To obtain performance data current to the most recent month end, please call 1-800-345-2021 or visit americancentury.com. International investing involves special risks, such as political instability and currency fluctuations. Investing in emerging markets may accentuate these risks.
Unless otherwise indicated, performance reflects Investor Class shares; performance for other share classes will vary due to differences in fee structure. For information about other share classes available, please consult the prospectus. Data assumes reinvestment of dividends and capital gains, and none of the charts reflect the deduction of taxes that a shareholder would pay on fund distributions or the redemption of fund shares. Returns for the indices are provided for comparison. The fund’s total returns include operating expenses (such as transaction costs and management fees) that reduce returns, while the total returns of the indices do not.
5
Heritage
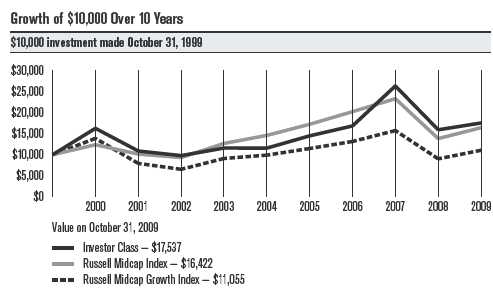
| | | | | | | | | | |
| One-Year Returns Over 10 Years | | | | | | | |
| Periods ended October 31 | | | | | | | | | |
| | 2000 | 2001 | 2002 | 2003 | 2004 | 2005 | 2006 | 2007 | 2008 | 2009 |
| Investor Class | 62.61% | -33.08% | -10.07% | 18.33% | -0.09% | 25.16% | 16.26% | 56.41% | -39.54% | 10.16% |
| Russell Midcap | | | | | | | | | | |
| Growth Index | 38.67% | -42.78% | -17.61% | 39.30% | 8.77% | 15.91% | 14.51% | 19.72% | -42.65% | 22.48% |
| Russell | | | | | | | | | | |
| Midcap Index | 23.73% | -18.02% | -8.02% | 35.88% | 15.09% | 18.09% | 17.41% | 15.24% | -40.67% | 18.75% |
| | | | | | | | | | |
| | | | | |
| Total Annual Fund Operating Expenses | | | |
| Institutional | | | | |
| Investor Class | Class | A Class | B Class | C Class | R Class |
| 1.01% | 0.81% | 1.26% | 2.01% | 2.01% | 1.51% |
The total annual fund operating expenses shown is as stated in the fund’s prospectus current as of the date of this report. The prospectus may vary from the expense ratio shown elsewhere in this report because it is based on a different time period, includes acquired fund fees and expenses, and, if applicable, does not include fee waivers or expense reimbursements.
Data presented reflect past performance. Past performance is no guarantee of future results. Current performance may be higher or lower than the performance shown. Investment return and principal value will fluctuate, and redemption value may be more or less than original cost. To obtain performance data current to the most recent month end, please call 1-800-345-202 1 or visit americancentury.com. International investing involves special risks, such as political instability and currency fluctuations. Investing in emerging markets may accentuate these risks.
Unless otherwise indicated, performance reflects Investor Class shares; performance for other share classes will vary due to differences in fee structure. For information about other share classes available, please consult the prospectus. Data assumes reinvestment of dividends and capital gains, and none of the charts reflect the deduction of taxes that a shareholder would pay on fund distributions or the redemption of fund shares. Returns for the indices are provided for comparison. The fund’s total returns include operating expenses (such as transaction costs and management fees) that reduce returns, while the total returns of the indices do not.
6
Heritage
Portfolio Managers: Greg Walsh and David Hollond
Performance Summary
Heritage returned 10.16%* for the 12 months ended October 31, 2009, lagging the 22.48% return of the portfolio’s benchmark, the Russell Midcap Growth Index.
As discussed in the Market Perspective on page 4, equity markets continued to struggle during the first half of the reporting period amid extreme volatility and recession. After dipping to multi-year lows on March 9, 2009, markets responded positively to generally improving economic data and rallied soundly, erasing losses sustained early in the reporting period. However, earnings and revenue acceleration and relative price strength, key factors that the Heritage team looks for in candidates for the portfolio, were not rewarded during this rally. Instead, as investors increased their appetite for risk, lower-quality stocks that were laggards in previous reporting periods led the market.
The portfolio’s relative performance was hurt most by holdings in the consumer discretionary, industrials, and health care sectors. Stock selection in the financials and materials sectors also trimmed returns. These losses were partially offset by effective stock selection in the information technology sector and an underweight allocation to utilities.
Consumer Discretionary Detracted, but Some Holdings Helped
Although Heritage derived positive absolute gains from consumer discretionary holdings, the portfolio’s positions collectively underperformed benchmark returns for the sector. In particular, Heritage held a number of detrimental positions within the specialty retail group, including clothing chain Children’s Place Retail Stores, Inc. (which is not a constituent of the benchmark). Because the company sells staple goods that are in demand regardless of economic conditions, it had fared better in the weak economic environment than did retailers of discretionary items, and investors viewed it as a defensive position going into 2009. After the market turn in early March, however, these types of securities were largely sidelined in favor of more aggressive stocks.
Elsewhere in the sector, an overweight position in private education company Career Education Corp. weighed on both absolute and relative performance. The company delivered gains in the midst of the economic recession, benefiting from expanding student enrollments as a result of corporate layoffs and fewer job opportunities. However, investors appetite for riskier securities after the March bottom, and worries about stricter regulation on for-profit colleges, caused the stock to underperform.
Elsewhere in the consumer discretionary sector, online travel company priceline.com helped performance. As travel demand overall rebounded, more travelers booked their vacation trips online. priceline.com took a greater share of these bookings compared with their peers during the course of the reporting period.
*All fund returns referenced in this commentary are for Investor Class shares.
7
Heritage
Industrials, Health Care Hindered
Within the industrials sector, Heritage maintained overweight positions in railroad companies, including Norfolk Southern Corp. This industry had experienced improving fundamentals as higher fuel prices created an advantage for the more fuel-efficient railroads versus trucking companies, and as coal shipments continued to increase. However, the abrupt decline in business activity during the period caused rail car shipments to decline and these positions ended up underperforming the benchmark. Elsewhere in the sector, the portfolio’s investments in companies involved in construction and engineering also lagged in relative terms.
The health care sector was the largest source of underperformance against the benchmark, the result of overweight positions in biotechnology companies, including Celgene Corp. and Gilead Sciences Inc. Concerns about President Obama’s health care reform plan and its effect on industry profits, as well as worries about generic competition hurt performance.
Financials, Materials Lagged
Investments in the financials sector trimmed Heritage’s returns. An overweight position within the insurance industry dampened returns as investors migrated from this defensive group toward riskier areas of the market. Similarly, an overweight stake in commercial banks detracted from relative returns.
Within the materials sector, Heritage maintained a significant position in chemical company Monsanto, which is not represented in the benchmark. Although Monsanto benefited portfolio returns in the past, the company’s share price declined during the period due to oversupply of its RoundUp herbicide, brought on by the availability of a generic version of the product from China.
Information Technology, Utilities Helped
In information technology, advantageous weightings in the semiconductor group included Marvell Technology Group. The integrated circuit manufacturer’s share price nearly doubled during the period as it announced cost cuts and cut inventory, which helped it deliver earnings in excess of analysts’ estimates when demand for consumer technology products came back quicker than the market had anticipated.
In computers and peripherals, Apple Inc. benefited portfolio returns as the company continued to introduce consumer-related products that were well received. The iPhone, in particular, has been a significant contributor to Apple’s growth and outperformance.
An underweight allotment to utilities also proved advantageous in relative terms. In fact, Heritage avoided utilities altogether, one of the weakest-performing sectors in the benchmark.
Outlook
Heritage’s investment process focuses on medium-sized and smaller companies with accelerating revenue and earnings growth rates, which are also exhibiting share-price strength. We believe that active investing in such companies will generate attractive investment performance over time. Despite the current difficult investment environment for this discipline, we remain focused on implementing our time-tested investment approach.
8
| | |
| Heritage | | |
| |
| Top Ten Holdings as of October 31, 2009 | | |
| | % of net assets | % of net assets |
| | as of 10/31/09 | as of 4/30/09 |
| Petrohawk Energy Corp. | 2.5% | 1.3% |
| SBA Communications Corp., Class A | 2.1% | 1.5% |
| Apple, Inc. | 2.1% | 1.7% |
| Cliffs Natural Resources, Inc. | 2.1% | — |
| Seagate Technology | 1.9% | 0.7% |
| O’Reilly Automotive, Inc. | 1.8% | 1.5% |
| Lorillard, Inc. | 1.7% | 1.7% |
| Crown Holdings, Inc. | 1.7% | 1.3% |
| Whole Foods Market, Inc. | 1.7% | 0.4% |
| Tenet Healthcare Corp. | 1.5% | — |
| |
| Top Five Industries as of October 31, 2009 | | |
| | % of net assets | % of net assets |
| | as of 10/31/09 | as of 4/30/09 |
| Specialty Retail | 7.0% | 5.2% |
| Semiconductors & Semiconductor Equipment | 5.0% | 7.7% |
| Health Care Providers & Services | 5.0% | 5.1% |
| Oil, Gas & Consumable Fuels | 4.8% | 8.1% |
| Computers & Peripherals | 4.7% | 2.5% |
| | | |
| Types of Investments in Portfolio | | |
| | % of net assets | % of net assets |
| | as of 10/31/09 | as of 4/30/09 |
| Domestic Common Stocks | 90.3% | 88.7% |
| Foreign Common Stocks* | 9.5% | 10.6% |
| Total Common Stocks | 99.8% | 99.3% |
| Temporary Cash Investments | 0.6% | 1.1% |
| Other Assets and Liabilities | (0.4)% | (0.4)% |
| *Includes depositary shares, dual listed securities and foreign ordinary shares. | | |
9
| | | | |
| Performance | | | | |
| |
| New Opportunities II | | | | |
| |
| Total Returns as of October 31, 2009 | | | |
| | | Average Annual Returns | |
| | | | Since | Inception |
| | 1 year | 5 years | Inception | Date |
| Investor Class | -1.80% | 0.33% | 2.97% | 6/1/01 |
| Russell 2000 Growth Index(1) | 11.34% | 0.95% | 0.22% | — |
| Institutional Class | -1.79% | — | -15.05% | 5/18/07 |
| A Class | | | | 1/31/03 |
| No sales charge* | -2.17% | 0.08% | 6.34% | |
| With sales charge* | -7.84% | -1.09% | 5.42% | |
| B Class | | | | 1/31/03 |
| No sales charge* | -2.77% | -0.67% | 5.55% | |
| With sales charge* | -6.77% | -0.88% | 5.55% | |
| C Class | -2.94% | -0.67% | 5.60%(2) | 1/31/03 |
| R Class | -2.35% | — | -21.33% | 9/28/07 |
|
| *Sales charges include initial sales charges and contingent deferred sales charges (CDSCs), as applicable. A Class shares have a 5.75% |
| maximum initial sales charge for equity funds and may be subject to a maximum CDSC of 1.00%. B Class shares redeemed within six |
| years of purchase are subject to a CDSC that declines from 5.00% during the first year after purchase to 0.00% the sixth year after |
| purchase. C Class shares redeemed within 12 months of purchase are subject to a maximum CDSC of 1.00%. The SEC requires that |
| mutual funds provide performance information net of maximum sales charges in all cases where charges could be applied. |
| (1) | Data provided by Lipper Inc. – A Reuters Company. © 2009 Reuters. All rights reserved. Any copying, republication or redistribution of Lipper content, including by caching, framing or similar means, is expressly prohibited without the prior written consent of Lipper. Lipper shall not be liable for any errors or delays in the content, or for any actions taken in reliance thereon. |
| | The data contained herein has been obtained from company reports, financial reporting services, periodicals and other resources believed to be reliable. Although carefully verified, data on compilations is not guaranteed by Lipper and may be incomplete. No offer or solicitations to buy or sell any of the securities herein is being made by Lipper. |
| (2) | Class returns would have been lower if distribution and service fees had not been waived from 2/1/03 to 6/30/03. |
Data presented reflect past performance. Past performance is no guarantee of future results. Current performance may be higher or lower than the performance shown. Investment return and principal value will fluctuate, and redemption value may be more or less than original cost. To obtain performance data current to the most recent month end, please call 1-800-345-2021 or visit americancentury.com. Historically, small company stocks have been more volatile than the stocks of larger, more established companies. The fund’s investment process may result in high portfolio turnover, high commission costs and high capital gains distributions. In addition, its investment approach may involve higher volatility and risk. International investing involves special risks, such as political instability and currency fluctuations. Investing in emerging markets may accentuate these risks.
Unless otherwise indicated, performance reflects Investor Class shares; performance for other share classes will vary due to differences in fee structure. For information about other share classes available, please consult the prospectus. Data assumes reinvestment of dividends and capital gains, and none of the charts reflect the deduction of taxes that a shareholder would pay on fund distributions or the redemption of fund shares. Returns for the index are provided for comparison. The fund’s total returns include operating expenses (such as transaction costs and management fees) that reduce returns, while the total returns of the index do not.
10
New Opportunities II
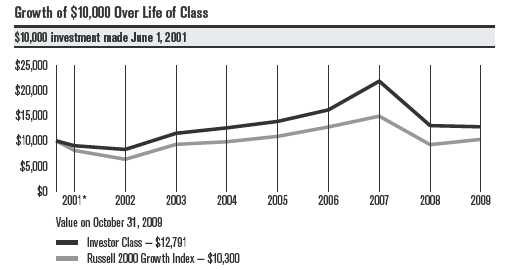
| | | | | | | | | |
| | | | | | | | | |
| One-Year Returns Over Life of Class | | | | | | |
| Periods ended October 31 | | | | | | | | |
| | 2001* | 2002 | 2003 | 2004 | 2005 | 2006 | 2007 | 2008 | 2009 |
| Investor Class | -9.60% | -8.19% | 38.55% | 9.39% | 10.14% | 16.52% | 35.22% | -40.34% | -1.80% |
| Russell 2000 | | | | | | | | | |
| Growth Index | -19.01% | -21.57% | 46.56% | 5.53% | 10.91% | 17.07% | 16.73% | -37.87% | 11.34% |
| *From 6/1/01, the Investor Class’s inception date. Index data from 5/31/01, the date nearest the Investor Class’s inception for which data are available. |
| Not annualized. | | | | | | | | | |
| | | | | |
| | | | | |
| Total Annual Fund Operating Expenses | | | |
| | Institutional | | | | |
| Investor Class | Class | A Class | B Class | C Class | R Class |
| 1.37% | 1.17% | 1.62% | 2.37% | 2.37% | 1.87% |
The total annual fund operating expenses shown is as stated in the fund’s prospectus current as of the date of this report. The prospectus may vary from the expense ratio shown elsewhere in this report because it is based on a different time period, includes acquired fund fees and expenses, and, if applicable, does not include fee waivers or expense reimbursements.
Data presented reflect past performance. Past performance is no guarantee of future results. Current performance may be higher or lower than the performance shown. Investment return and principal value will fluctuate, and redemption value may be more or less than original cost. To obtain performance data current to the most recent month end, please call 1-800-345-2021 or visit americancentury.com. Historically, small company stocks have been more volatile than the stocks of larger, more established companies. The fund’s investment process may result in high portfolio turnover, high commission costs and high capital gains distributions. In addition, its investment approach may involve higher volatility and risk. International investing involves special risks, such as political instability and currency fluctuations. Investing in emerging markets may accentuate these risks.
Unless otherwise indicated, performance reflects Investor Class shares; performance for other share classes will vary due to differences in fee structure. For information about other share classes available, please consult the prospectus. Data assumes reinvestment of dividends and capital gains, and none of the charts reflect the deduction of taxes that a shareholder would pay on fund distributions or the redemption of fund shares. Returns for the index are provided for comparison. The fund’s total returns include operating expenses (such as transaction costs and management fees) that reduce returns, while the total returns of the index do not.
11
New Opportunities II
Portfolio Managers: Stafford Southwick and Matthew Ferretti
Performance Summary
New Opportunities II returned –1.80%* for the fiscal year ended October 31, 2009, trailing the 11.34% return of its benchmark, the Russell 2000 Growth Index.
While the fund’s benchmark posted a double-digit gain for the 12-month period, the fund produced a modestly negative return. Virtually all of the portfolio’s underperformance occurred in the spring of 2009, during the stock market’s abrupt transition from steep decline to sharp rally. The portfolio was defensively positioned during the market downturn in late 2008 and early 2009, but as the market rapidly reversed course in anticipation of an economic recovery, our defensive holdings were left behind in the ensuing rally. Furthermore, the rebound in small-cap stocks was driven by companies that lacked the integral characteristics we look for as part of our investment process—improving business fundamentals and price momentum.
The portfolio outperformed during the last few months of the period as we repositioned the portfolio with a focus on companies that fare well in an economic recovery. In addition, the market began to recognize and reward stocks with the characteristics we seek in our investment process. Nonetheless, it was not enough to offset the severe underperformance in the middle of the period.
Technology and Financials Underperformed
The portfolio’s information technology and financials holdings had the biggest negative impact on performance versus the Russell 2000 Growth Index. The lion’s share of the underperformance in the information technology sector came from the semiconductor and Internet services industries. The most significant detractor was semiconductor manufacturer Microsemi, which faced a substantial decline in demand and a controversy about the credentials of its chief investment officer. Another notable detractor was Bankrate, which produces a website showing current interest rates on various financial instruments. Bankrate was hurt by reduced advertising demand on its website.
In the financials sector, overweight positions in commercial banks and insurance firms were largely responsible for the underperformance. The biggest detractor in this sector was real estate investment trust U-Store-It, which owns and operates self-storage units. Concerns about the company’s ability to service and refinance its debt caused the stock to drop sharply in the first half of the period. Regional bank Oriental Financial Group also slumped early in the period after reporting significant losses on its securities portfolio.
Industrials Hurt by Weak Airline Industry
The portfolio’s industrials holdings underperformed their counterparts in the benchmark index, and the main culprit was our overweight position in the airline industry during the first half of the period. Our thesis for the airline industry was based on the sharp decline in fuel prices during the last half of 2008, which we expected to translate into higher profit margins for airline companies.
*All fund returns referenced in this commentary are for Investor Class shares.
12
New Opportunities II
Unfortunately, this thesis did not play out as we anticipated. The economic downturn severely curtailed air traffic in early 2009, leading to a substantial drop in airfares that weighed on the industry’s profitability. Furthermore, most of the major airlines locked in fuel prices in advance to hedge against higher fuel costs, so they did not fully benefit from the decline in energy prices.
The portfolio’s largest detractors for the 12-month period were US Airways Group and UAL, the parent company of United Airlines. We eliminated our overweight position in early 2009, but we maintained some exposure to the airline industry as the economic environment improved.
Utilities and Materials Outperformed
Only two sectors of the portfolio added value relative to the Russell 2000 Growth Index—utilities and materials. Industry allocation was the key behind the outperformance in the utilities sector, particularly underweight positions in electric and gas utilities and an overweight position in water utilities.
In the materials sector, outperformance resulted primarily from an overweight position in paper and forest products companies and stock selection among chemicals producers. One of the top contributors was Schweitzer-Mauduit, which makes specialty paper products. The company developed low-ignition-propensity cigarette paper, which self-extinguishes when not being smoked to help prevent inadvertent fires. This product gives the company a significant competitive advantage at a time when more and more states are requiring usage of fire-safe cigarette paper.
The portfolio’s exposure to foreign companies had a meaningful impact on absolute performance, led by the fund’s top performance contributor—AsiaInfo Holdings, which provides billing software and services to the telecommunications industry in China. A restructuring and technological upgrade in the Chinese telecom industry led to stronger demand for AsiaInfo’s products and services, boosting revenue and profit growth.
Fund Name Change
Effective December 1, 2009, the name of the fund changed from New Opportunities II Fund to Small Cap Growth Fund, which more accurately depicts the segment of the market in which we invest. The fund’s investment mandate has not changed, however; we will continue to invest in small-cap stocks exhibiting price momentum and accelerating revenue and earnings growth.
A Look Ahead
As we move into 2010, the fund is positioned to benefit from further progress in the economic recovery, as well as a follow-through in current market leadership. While we are disappointed in the fund’s performance over the past year, we remain confident that our investment strategy will produce favorable results over time.
13
| | |
| New Opportunities II | | |
| |
| Top Ten Holdings as of October 31, 2009 | | |
| | % of net assets | % of net assets |
| | as of 10/31/09 | as of 4/30/09 |
| American Greetings Corp., Class A | 1.8% | — |
| Tempur-Pedic International, Inc. | 1.7% | 0.5% |
| Bare Escentuals, Inc. | 1.5% | — |
| Dollar Thrifty Automotive Group, Inc. | 1.5% | — |
| priceline.com, Inc. | 1.2% | 1.5% |
| Maxwell Technologies, Inc. | 1.1% | 0.8% |
| LodgeNet Interactive Corp. | 1.1% | 0.9% |
| Solutia, Inc. | 1.1% | — |
| TNS, Inc. | 1.1% | — |
| Lennar Corp., Class A | 1.1% | — |
| |
| Top Five Industries as of October 31, 2009 | | |
| | % of net assets | % of net assets |
| | as of 10/31/09 | as of 4/30/09 |
| Semiconductors & Semiconductor Equipment | 7.6% | 2.9% |
| Household Durables | 6.4% | 2.2% |
| Oil, Gas & Consumable Fuels | 5.1% | 4.5% |
| Capital Markets | 4.5% | 1.6% |
| Software | 4.3% | 6.3% |
| |
| Types of Investments in Portfolio | | |
| | % of net assets | % of net assets |
| | as of 10/31/09 | as of 4/30/09 |
| Domestic Common Stocks | 91.7% | 94.9% |
| Foreign Common Stocks* | 8.3% | 4.4% |
| Total Common Stocks | 100.0% | 99.3% |
| Temporary Cash Investments | 0.7% | 1.4% |
| Other Assets and Liabilities | (0.7)% | (0.7)% |
| *Includes depositary shares, dual listed securities and foreign ordinary shares. | | |
14
|
| Shareholder Fee Examples (Unaudited) |
Fund shareholders may incur two types of costs: (1) transaction costs, including sales charges (loads) on purchase payments and redemption/ exchange fees; and (2) ongoing costs, including management fees; distribution and service (12b-1) fees; and other fund expenses. This example is intended to help you understand your ongoing costs (in dollars) of investing in your fund and to compare these costs with the ongoing cost of investing in other mutual funds.
The example is based on an investment of $1,000 made at the beginning of the period and held for the entire period from May 1, 2009 to October 31, 2009.
Actual Expenses
The table provides information about actual account values and actual expenses for each class. You may use the information, together with the amount you invested, to estimate the expenses that you paid over the period. First, identify the share class you own. Then simply divide your account value by $1,000 (for example, an $8,600 account value divided by $1,000 = 8.6), then multiply the result by the number under the heading “Expenses Paid During Period” to estimate the expenses you paid on your account during this period.
If you hold Investor Class shares of any American Century Investments fund, or Institutional Class shares of the American Century Diversified Bond Fund, in an American Century Investments account (i.e., not a financial intermediary or retirement plan account), American Century Investments may charge you a $12.50 semiannual account maintenance fee if the value of those shares is less than $10,000. We will redeem shares automatically in one of your accounts to pay the $12.50 fee. In determining your total eligible investment amount, we will include your investments in all personal accounts (including American Century Investments Brokerage accounts) registered under your Social Security number. Personal accounts include individual accounts, joint accounts, UGMA/UTMA accounts, personal trusts, Coverdell Education Savings Accounts and IRAs (including traditional, Roth, Rollover, SEP-, SARSEP- and SIMPLE-IRAs), and certain other retirement accounts. If you have only business, business retirement, employer-sponsored or American Century Investments Brokerage accounts, you are currently not subject to this fee. We will not charge the fee as long as you choose to manage your accounts exclusively online. If you are subject to the Account Maintenance Fee, your account value could be reduced by the fee amount.
Hypothetical Example for Comparison Purposes
The table also provides information about hypothetical account values and hypothetical expenses based on the actual expense ratio of each class of your fund and an assumed rate of return of 5% per year before expenses, which is not the actual return of a fund’s share class. The hypothetical account values and expenses may not be used to estimate the actual ending account balance or expenses you paid for the period. You may use this information to compare the ongoing costs of investing in your fund and other funds. To do so, compare this 5% hypothetical example with the 5% hypothetical examples that appear in the shareholder reports of the other funds.
15
Please note that the expenses shown in the table are meant to highlight your ongoing costs only and do not reflect any transactional costs, such as sales charges (loads) or redemption/exchange fees. Therefore, the table is useful in comparing ongoing costs only, and will not help you determine the relative total costs of owning different funds. In addition, if these transactional costs were included, your costs would have been higher.
| | | | |
| | Beginning | Ending | Expenses Paid | |
| | Account Value | Account Value | During Period* | Annualized |
| | 5/1/09 | 10/31/09 | 5/1/09 - 10/31/09 | Expense Ratio* |
| Heritage | | | | |
| Actual | | | | |
| Investor Class | $1,000 | $1,130.20 | $5.37 | 1.00% |
| Institutional Class | $1,000 | $1,130.90 | $4.30 | 0.80% |
| A Class | $1,000 | $1,128.30 | $6.71 | 1.25% |
| B Class | $1,000 | $1,123.80 | $10.71 | 2.00% |
| C Class | $1,000 | $1,124.30 | $10.71 | 2.00% |
| R Class | $1,000 | $1,126.60 | $8.04 | 1.50% |
| Hypothetical | | | | |
| Investor Class | $1,000 | $1,020.16 | $5.09 | 1.00% |
| Institutional Class | $1,000 | $1,021.17 | $4.08 | 0.80% |
| A Class | $1,000 | $1,018.90 | $6.36 | 1.25% |
| B Class | $1,000 | $1,015.12 | $10.16 | 2.00% |
| C Class | $1,000 | $1,015.12 | $10.16 | 2.00% |
| R Class | $1,000 | $1,017.64 | $7.63 | 1.50% |
| New Opportunities II | | | | |
| Actual | | | | |
| Investor Class | $1,000 | $1,100.60 | $7.47 | 1.41% |
| Institutional Class | $1,000 | $1,100.20 | $6.41 | 1.21% |
| A Class | $1,000 | $1,099.60 | $8.78 | 1.66% |
| B Class | $1,000 | $1,093.60 | $12.72 | 2.41% |
| C Class | $1,000 | $1,093.20 | $12.72 | 2.41% |
| R Class | $1,000 | $1,097.40 | $10.10 | 1.91% |
| Hypothetical | | | | |
| Investor Class | $1,000 | $1,018.10 | $7.17 | 1.41% |
| Institutional Class | $1,000 | $1,019.11 | $6.16 | 1.21% |
| A Class | $1,000 | $1,016.84 | $8.44 | 1.66% |
| B Class | $1,000 | $1,013.06 | $12.23 | 2.41% |
| C Class | $1,000 | $1,013.06 | $12.23 | 2.41% |
| R Class | $1,000 | $1,015.58 | $9.70 | 1.91% |
*Expenses are equal to the class’s annualized expense ratio listed in the table above, multiplied by the average account value over the period, multiplied by 184, the number of days in the most recent fiscal half-year, divided by 365, to reflect the one-half year period.
16
|
| Schedule of Investments |
| Heritage |
| | | | | | |
| OCTOBER 31, 2009 | | | | | | |
| |
| | Shares | Value | | | Shares | Value |
| Common Stocks — 99.8% | | | CONSUMER FINANCE — 2.1% | | |
| | | | | AmeriCredit Corp.(1) | 1,017,200 | $ 17,953,580 |
| AIRLINES — 0.7% | | | | | | |
| Delta Air Lines, Inc.(1) | 1,939,400 | $ 13,847,316 | | Discover Financial Services | 1,654,104 | 23,389,031 |
| BEVERAGES — 0.6% | | | | | | 41,342,611 |
| Dr. Pepper Snapple | | | | CONTAINERS & PACKAGING — 1.7% | |
| Group, Inc.(1) | 415,600 | 11,329,256 | | Crown Holdings, Inc.(1) | 1,312,700 | 34,983,455 |
| BIOTECHNOLOGY — 3.8% | | | | DIVERSIFIED CONSUMER SERVICES — 1.5% |
| Alexion | | | | Career Education Corp.(1) | 864,651 | 18,019,327 |
| Pharmaceuticals, Inc.(1) | 415,800 | 18,465,678 | | Strayer Education, Inc. | 64,600 | 13,111,862 |
| Celgene Corp.(1) | 288,200 | 14,712,610 | | | | 31,131,189 |
| Grifols SA | 1,267,000 | 20,476,659 | | ELECTRICAL EQUIPMENT — 1.0% | |
| Talecris Biotherapeutics | | | | Cooper Industries plc, | | |
| Holdings Corp.(1) | 530,853 | 10,648,911 | | Class A | 529,000 | 20,467,010 |
| United Therapeutics Corp.(1) | 308,200 | 13,110,828 | | ELECTRONIC EQUIPMENT, INSTRUMENTS | |
| | | 77,414,686 | | & COMPONENTS — 2.4% | | |
| CAPITAL MARKETS — 3.8% | | | | Agilent Technologies, Inc.(1) | 831,500 | 20,571,310 |
| Affiliated Managers | | | | Amphenol Corp., Class A | 697,600 | 27,987,712 |
| Group, Inc.(1) | 281,300 | 17,859,737 | | | | 48,559,022 |
| Jefferies Group, Inc.(1) | 996,200 | 26,000,820 | | ENERGY EQUIPMENT & SERVICES — 1.5% | |
| Lazard Ltd., Class A | 566,370 | 21,380,467 | | Cameron | | |
| Morgan Stanley | 355,364 | 11,414,292 | | International Corp.(1) | 329,700 | 12,189,009 |
| | | 76,655,316 | | Smith International, Inc. | 617,000 | 17,109,410 |
| CHEMICALS — 2.3% | | | | | | 29,298,419 |
| Ecolab, Inc. | 569,900 | 25,052,804 | | FOOD & STAPLES RETAILING — 3.0% | |
| Scotts Miracle-Gro Co. | | | | Costco Wholesale Corp. | 453,800 | 25,798,530 |
| (The), Class A | 228,345 | 9,275,374 | | Whole Foods Market, Inc.(1) | 1,048,000 | 33,598,880 |
| Valspar Corp. | 486,100 | 12,332,357 | | | | 59,397,410 |
| | | 46,660,535 | | FOOD PRODUCTS — 0.6% | | |
| COMMERCIAL BANKS — 0.7% | | | | Green Mountain Coffee | | |
| Fifth Third Bancorp. | 1,486,900 | 13,292,886 | | Roasters, Inc.(1) | 191,280 | 12,729,684 |
| COMMUNICATIONS EQUIPMENT — 1.8% | | | HEALTH CARE EQUIPMENT & SUPPLIES — 2.2% |
| ADTRAN, Inc. | 658,600 | 15,174,144 | | Beckman Coulter, Inc. | 218,400 | 14,049,672 |
| F5 Networks, Inc.(1) | 456,700 | 20,501,263 | | C.R. Bard, Inc. | 276,000 | 20,719,320 |
| | | 35,675,407 | | ev3, Inc.(1) | 864,700 | 10,186,166 |
| COMPUTERS & PERIPHERALS — 4.7% | | | | | 44,955,158 |
| Apple, Inc.(1) | 223,727 | 42,172,540 | | HEALTH CARE PROVIDERS & SERVICES — 5.0% |
| Lexmark International, Inc., | | | | Express Scripts, Inc.(1) | 359,400 | 28,723,248 |
| Class A(1) | 204,500 | 5,214,750 | | Health Management | | |
| Seagate Technology | 2,703,500 | 37,713,825 | | Associates, Inc., Class A(1) | 2,568,200 | 15,666,020 |
| STEC, Inc.(1) | 487,948 | 10,403,051 | | Medco Health | | |
| | | | | Solutions, Inc.(1) | 458,500 | 25,731,020 |
| | | 95,504,166 | | | | |
| | | | | Tenet Healthcare Corp.(1) | 5,903,300 | 30,224,896 |
| | | | | | | 100,345,184 |
17
| | | | | | |
| Heritage | | | | | | |
| |
| | Shares | Value | | | Shares | Value |
| HEALTH CARE TECHNOLOGY — 1.1% | | | METALS & MINING — 4.1% | | |
| athenahealth, Inc.(1) | 274,300 | $ 10,316,423 | | AK Steel Holding Corp. | 939,000 | $ 14,901,930 |
| SXC Health | | | | Cliffs Natural Resources, Inc. | 1,178,400 | 41,915,688 |
| Solutions Corp.(1) | 263,485 | 12,035,995 | | Steel Dynamics, Inc. | 763,006 | 10,216,650 |
| | | 22,352,418 | | Walter Energy, Inc. | 248,800 | 14,554,800 |
| HOTELS, RESTAURANTS & LEISURE — 4.0% | | | | 81,589,068 |
| Ctrip.com International | | | | MULTI-INDUSTRY — 1.3% | | |
| Ltd. ADR(1) | 354,700 | 18,990,638 | | | | |
| | | | | Financial Select Sector | | |
| Las Vegas Sands Corp.(1) | 1,468,100 | 22,153,629 | | SPDR Fund | 1,857,500 | 26,042,150 |
| Royal Caribbean | | | | MULTILINE RETAIL — 2.9% | | |
| Cruises Ltd.(1) | 512,600 | 10,369,898 | | | | |
| | | | | J.C. Penney Co., Inc. | 647,600 | 21,454,988 |
| Starwood Hotels & Resorts | | | | Kohl’s Corp.(1) | 356,300 | 20,387,486 |
| Worldwide, Inc. | 461,100 | 13,399,566 | | | | |
| WMS Industries, Inc.(1) | 379,900 | 15,188,402 | | Nordstrom, Inc. | 539,400 | 17,142,132 |
| | | 80,102,133 | | | | 58,984,606 |
| INDUSTRIAL CONGLOMERATES — 0.5% | | | OIL, GAS & CONSUMABLE FUELS — 4.8% | |
| | | | | Continental | | |
| McDermott | | | | Resources, Inc.(1) | 274,400 | 10,210,424 |
| International, Inc.(1) | 418,500 | 9,303,255 | | | | |
| | | | | Petrohawk Energy Corp.(1) | 2,106,236 | 49,538,671 |
| INSURANCE — 0.5% | | | | | | |
| | | | | Quicksilver Resources, Inc.(1) | 1,453,997 | 17,738,763 |
| Genworth Financial, Inc., | | | | | | |
| Class A(1) | 906,276 | 9,624,651 | | Range Resources Corp. | 393,600 | 19,699,680 |
| INTERNET & CATALOG RETAIL — 1.9% | | | | | 97,187,538 |
| Netflix, Inc.(1) | 142,100 | 7,595,245 | | PROFESSIONAL SERVICES — 0.5% | |
| priceline.com, Inc.(1) | 190,641 | 30,081,243 | | Manpower, Inc. | 205,900 | 9,761,719 |
| | | 37,676,488 | | REAL ESTATE MANAGEMENT | | |
| INTERNET SOFTWARE & SERVICES — 2.7% | | | & DEVELOPMENT — 1.1% | | |
| | | | | CB Richard Ellis Group, Inc., | | |
| Equinix, Inc.(1) | 289,100 | 24,666,012 | | Class A(1) | 2,199,300 | 22,762,755 |
| MercadoLibre, Inc.(1) | 291,100 | 10,418,469 | | ROAD & RAIL — 2.2% | | |
| Tencent Holdings Ltd. | 1,152,000 | 20,104,937 | | J.B. Hunt Transport | | |
| | | 55,189,418 | | Services, Inc. | 638,700 | 19,199,322 |
| IT SERVICES — 3.5% | | | | Kansas City Southern(1) | 738,500 | 17,893,855 |
| Cognizant Technology | | | | Railamerica, Inc.(1) | 540,289 | 6,359,202 |
| Solutions Corp., Class A(1) | 740,300 | 28,612,595 | | | | |
| | | | | | | 43,452,379 |
| Global Payments, Inc. | 510,400 | 25,126,992 | | SEMICONDUCTORS & SEMICONDUCTOR | |
| MasterCard, Inc., Class A | 79,600 | 17,433,992 | | EQUIPMENT — 5.0% | | |
| | | 71,173,579 | | Analog Devices, Inc. | 851,600 | 21,826,508 |
| LIFE SCIENCES TOOLS & SERVICES — 1.5% | | | Atheros | | |
| Life Technologies Corp.(1) | 622,100 | 29,344,457 | | Communications, Inc.(1) | 580,500 | 14,291,910 |
| MACHINERY — 4.2% | | | | Cypress | | |
| | | | | Semiconductor Corp.(1) | 1,258,000 | 10,604,940 |
| Bucyrus International, Inc. | 334,100 | 14,840,722 | | | | |
| | | | | NVIDIA Corp.(1) | 1,477,200 | 17,667,312 |
| Cummins, Inc. | 350,700 | 15,101,142 | | | | |
| Flowserve Corp. | 178,087 | 17,489,924 | | Silicon Laboratories, Inc.(1) | 208,500 | 8,736,150 |
| Hitachi Construction | | | | Teradyne, Inc.(1) | 1,533,100 | 12,832,047 |
| Machinery Co. Ltd. | 539,500 | 12,516,706 | | Varian Semiconductor | | |
| Ingersoll-Rand plc | 637,000 | 20,122,830 | | Equipment Associates, Inc.(1) | 513,900 | 14,589,621 |
| Navistar | | | | | | 100,548,488 |
| International Corp.(1) | 143,703 | 4,762,317 | | | | |
| | | 84,833,641 | | | | |
18
| | | | | | |
| Heritage | | | | | | |
| |
| |
| | Shares | Value | | | Shares | Value |
| SOFTWARE — 3.2% | | | | TRADING COMPANIES & DISTRIBUTORS — 2.0% |
| Citrix Systems, Inc.(1) | 604,200 | $ 22,210,392 | | Fastenal Co. | 743,800 | $ 25,661,100 |
| McAfee, Inc.(1) | 420,422 | 17,607,274 | | MSC Industrial Direct Co., | | |
| Perfect World Co. Ltd., | | | | Class A | 339,964 | 14,635,450 |
| Class B ADR(1) | 279,031 | 12,280,154 | | | | 40,296,550 |
| Rovi Corp.(1) | 425,700 | 11,728,035 | | WIRELESS TELECOMMUNICATION SERVICES — 2.6% |
| | | 63,825,855 | | Millicom International | | |
| | | | | Cellular SA(1) | 144,700 | 9,066,902 |
| SPECIALTY RETAIL — 7.0% | | | | | | |
| Advance Auto Parts, Inc. | 316,300 | 11,785,338 | | SBA Communications Corp., | | |
| | | | | Class A(1) | 1,532,932 | 43,244,012 |
| Aeropostale, Inc.(1) | 336,100 | 12,613,833 | | | | |
| | | | | | | 52,310,914 |
| Chico’s FAS, Inc.(1) | 2,218,300 | 26,508,685 | | TOTAL COMMON STOCKS | | |
| Dick’s Sporting Goods, Inc.(1) | 469,000 | 10,641,610 | | (Cost $1,735,848,768) | | 2,008,812,599 |
| Gymboree Corp.(1) | 385,800 | 16,423,506 | | | | |
| | | | | Temporary Cash Investments — 0.6% |
| J. Crew Group, Inc.(1) | 200,565 | 8,179,040 | | | | |
| | | | | JPMorgan U.S. Treasury | | |
| O’Reilly Automotive, Inc.(1) | 959,600 | 35,773,888 | | Plus Money Market Fund | | |
| Ross Stores, Inc. | 39,977 | 1,759,388 | | Agency Shares | 79,182 | 79,182 |
| Williams-Sonoma, Inc. | 937,400 | 17,604,372 | | Repurchase Agreement, Bank of America | |
| | | 141,289,660 | | Securities, LLC, (collateralized by various | |
| | | | | U.S. Treasury obligations, 1.875%-3.625%, | |
| TEXTILES, APPAREL & LUXURY GOODS — 2.1% | | 7/15/13-4/15/28, valued at $12,137,121), | |
| Carter’s, Inc.(1) | 791,000 | 18,667,600 | | in a joint trading account at 0.05%, | | |
| Fuqi International, Inc.(1) | 382,800 | 7,843,572 | | dated 10/30/09, due 11/2/09 | | |
| | | | | (Delivery value $11,800,049) | | 11,800,000 |
| Warnaco Group, Inc. (The)(1) | 391,930 | 15,884,923 | | | | |
| | | | | TOTAL TEMPORARY | | |
| | | 42,396,095 | | CASH INVESTMENTS | | |
| TOBACCO — 1.7% | | | | (Cost $11,879,182) | | 11,879,182 |
| Lorillard, Inc. | 452,600 | 35,176,072 | | TOTAL INVESTMENT | | |
| | | | | SECURITIES — 100.4% | | |
| | | | | (Cost $1,747,727,950) | | 2,020,691,781 |
| | | | | OTHER ASSETS | | |
| | | | | AND LIABILITIES — (0.4)% | | (7,217,150) |
| | | | | TOTAL NET ASSETS — 100.0% | | $2,013,474,631 |
19
| | | | |
| Heritage | | | |
| |
| Forward Foreign Currency Exchange Contracts | | |
| Contracts to Sell | Settlement Date | Value | Unrealized Gain (Loss) |
| 8,533,245 | EUR for USD | 11/30/09 | $12,557,182 | $ 58,453 |
| 617,727,500 | JPY for USD | 11/30/09 | 6,863,442 | (81,786) |
| | | | $19,420,624 | $(23,333) |
| (Value on Settlement Date $19,397,291) | | | |
| |
| |
| Notes to Schedule of Investments | | |
| ADR = American Depositary Receipt | | | |
| EUR = Euro | | | | |
| JPY = Japanese Yen | | | |
| SPDR = Standard & Poor’s Depositary Receipts | | | |
| USD = United States Dollar | | | |
| (1) Non-income producing. | | | |
| |
| Industry classifications are unaudited. | | | |
| |
| |
| See Notes to Financial Statements. | | | |
20
| | | | | | |
| New Opportunities II | | | | | |
| |
| OCTOBER 31, 2009 | | | | | | |
| |
| | Shares | Value | | | Shares | Value |
| Common Stocks — 100.0% | | | Savient | | |
| | | | | Pharmaceuticals, Inc.(1) | 69,776 | $ 879,178 |
| AEROSPACE & DEFENSE — 0.8% | | | Seattle Genetics, Inc.(1) | 95,283 | 865,170 |
| AerCap Holdings NV(1) | 401,475 | $ 3,364,360 | | | | |
| | | | | Theravance, Inc.(1) | 60,183 | 840,756 |
| AIRLINES — 1.7% | | | | | | 17,496,686 |
| Gol Linhas Aereas | | | | | | |
| Inteligentes SA ADR(1) | 207,710 | 2,133,182 | | BUILDING PRODUCTS — 1.1% | | |
| Hawaiian Holdings, Inc.(1) | 445,094 | 3,155,716 | | Gibraltar Industries, Inc. | 202,181 | 2,187,598 |
| | | | | Trex Co., Inc.(1) | 156,084 | 2,483,297 |
| UAL Corp.(1) | 280,850 | 1,828,334 | | | | |
| | | 7,117,232 | | | | 4,670,895 |
| AUTO COMPONENTS — 4.0% | | | CAPITAL MARKETS — 4.5% | | |
| | | | | Artio Global Investors, Inc.(1) | 47,651 | 1,120,275 |
| American Axle & | | | | | | |
| Manufacturing Holdings, Inc. | 252,886 | 1,514,787 | | Cohen & Steers, Inc. | 198,932 | 3,845,356 |
| ArvinMeritor, Inc. | 115,955 | 905,608 | | Evercore Partners, Inc., | | |
| Cooper Tire & Rubber Co. | 233,356 | 3,561,013 | | Class A | 108,585 | 3,544,215 |
| | | | | HFF, Inc., Class A(1) | 208,892 | 1,201,129 |
| Dana Holding Corp.(1) | 189,583 | 1,073,040 | | | | |
| Modine Manufacturing Co. | 267,438 | 2,754,611 | | KBW, Inc.(1) | 88,669 | 2,482,732 |
| Tenneco, Inc.(1) | 195,550 | 2,663,391 | | Piper Jaffray Cos.(1) | 81,680 | 3,789,135 |
| TRW Automotive | | | | Stifel Financial Corp.(1) | 38,372 | 1,993,809 |
| Holdings Corp.(1) | 248,792 | 3,893,595 | | US Global Investors, Inc., | | |
| | | 16,366,045 | | Class A | 31,962 | 319,300 |
| AUTOMOBILES — 0.4% | | | | 18,295,951 |
| Winnebago Industries, Inc.(1) | 139,010 | 1,598,615 | | CHEMICALS — 2.1% | | |
| BEVERAGES — 1.1% | | | | A. Schulman, Inc. | 109,467 | 1,901,442 |
| Central European | | | | Ferro Corp. | 312,339 | 1,914,638 |
| Distribution Corp.(1) | 82,651 | 2,571,273 | | Solutia, Inc.(1) | 420,383 | 4,624,213 |
| Cott Corp.(1) | 252,257 | 1,992,830 | | | | 8,440,293 |
| | | 4,564,103 | | COMMERCIAL BANKS — 0.4% | | |
| BIOTECHNOLOGY — 4.3% | | | | East West Bancorp, Inc. | 198,538 | 1,792,798 |
| Acorda Therapeutics, Inc.(1) | 41,769 | 907,640 | | COMMERCIAL SERVICES & SUPPLIES — 0.5% |
| Alkermes, Inc.(1) | 106,428 | 848,231 | | Ennis, Inc. | 85,667 | 1,297,855 |
| Alnylam | | | | SYKES Enterprises, Inc.(1) | 36,090 | 856,777 |
| Pharmaceuticals, Inc.(1) | 40,649 | 692,659 | | | | 2,154,632 |
| AMAG | | | | COMMUNICATIONS EQUIPMENT — 1.2% | |
| Pharmaceuticals, Inc.(1) | 20,013 | 756,091 | | | | |
| | | | | Aruba Networks, Inc.(1) | 208,564 | 1,630,970 |
| Cepheid, Inc.(1) | 63,654 | 844,688 | | | | |
| | | | | Blue Coat Systems, Inc.(1) | 148,389 | 3,306,107 |
| Cubist | | | | | | 4,937,077 |
| Pharmaceuticals, Inc.(1) | 63,230 | 1,071,116 | | | | |
| Human Genome | | | | COMPUTERS & PERIPHERALS — 2.0% | |
| Sciences, Inc.(1) | 171,959 | 3,213,914 | | Intevac, Inc.(1) | 155,233 | 1,583,377 |
| InterMune, Inc.(1) | 45,407 | 548,517 | | Novatel Wireless, Inc.(1) | 226,607 | 2,021,334 |
| Isis Pharmaceuticals, Inc.(1) | 102,320 | 1,296,394 | | Silicon Graphics | | |
| | | | | International Corp.(1) | 158,162 | 942,646 |
| Medivation, Inc.(1) | 32,802 | 837,107 | | | | |
| | | | | STEC, Inc.(1) | 92,196 | 1,965,619 |
| Onyx Pharmaceuticals, Inc.(1) | 64,871 | 1,725,569 | | | | |
| | | | | Xyratex Ltd.(1) | 140,101 | 1,464,055 |
| PDL BioPharma, Inc. | 127,694 | 1,073,906 | | | | |
| Regeneron | | | | | | 7,977,031 |
| Pharmaceuticals, Inc.(1) | 69,793 | 1,095,750 | | | | |
21
| | | | | | |
| New Opportunities II | | | | | |
| |
| | Shares | Value | | | Shares | Value |
| CONSTRUCTION & ENGINEERING — 0.3% | | | Immucor, Inc.(1) | 75,938 | $ 1,357,771 |
| Great Lakes Dredge | | | | Masimo Corp.(1) | 52,943 | 1,406,696 |
| & Dock Corp. | 200,575 | $ 1,229,525 | | Meridian Bioscience, Inc. | 44,255 | 982,018 |
| CONSUMER FINANCE — 1.0% | | | | NuVasive, Inc.(1) | 38,925 | 1,412,588 |
| Cardtronics, Inc.(1) | 144,680 | 1,439,566 | | | | |
| | | | | STERIS Corp. | 63,001 | 1,843,409 |
| Dollar Financial Corp.(1) | 148,453 | 2,786,463 | | | | |
| | | | | Syneron Medical Ltd.(1) | 113,664 | 1,250,304 |
| | | 4,226,029 | | Thoratec Corp.(1) | 59,876 | 1,572,344 |
| CONTAINERS & PACKAGING — 0.7% | | | Volcano Corp.(1) | 43,296 | 621,298 |
| Temple-Inland, Inc. | 172,758 | 2,669,111 | | West Pharmaceutical | | |
| DIVERSIFIED CONSUMER SERVICES — 1.0% | | | Services, Inc. | 35,468 | 1,399,922 |
| Sotheby’s | 252,359 | 4,002,414 | | | | 17,022,208 |
| DIVERSIFIED FINANCIAL SERVICES — 0.6% | | | HEALTH CARE PROVIDERS & SERVICES — 3.0% |
| Portfolio Recovery | | | | Amedisys, Inc.(1) | 28,698 | 1,141,893 |
| Associates, Inc.(1) | 52,942 | 2,442,744 | | | | |
| | | | | AMERIGROUP Corp.(1) | 57,929 | 1,277,335 |
| DIVERSIFIED TELECOMMUNICATION | | | | | |
| SERVICES — 0.8% | | | | Catalyst Health | | |
| | | | | Solutions, Inc.(1) | 40,244 | 1,262,454 |
| Cogent Communications | | | | | | |
| Group, Inc.(1) | 324,028 | 3,282,404 | | Chemed Corp. | 25,077 | 1,136,490 |
| ELECTRICAL EQUIPMENT — 2.5% | | | Genoptix, Inc.(1) | 19,351 | 673,221 |
| American | | | | HealthSouth Corp.(1) | 103,415 | 1,510,893 |
| Superconductor Corp.(1) | 98,493 | 3,301,485 | | HMS Holdings Corp.(1) | 28,323 | 1,215,906 |
| AZZ, Inc.(1) | 77,398 | 2,651,656 | | Owens & Minor, Inc. | 35,701 | 1,459,814 |
| Trina Solar Ltd. ADR(1) | 124,811 | 4,053,861 | | PharMerica Corp.(1) | 35,806 | 552,487 |
| | | 10,007,002 | | PSS World Medical, Inc.(1) | 64,754 | 1,309,326 |
| ELECTRONIC EQUIPMENT, INSTRUMENTS & | | | Psychiatric Solutions, Inc.(1) | 42,012 | 867,128 |
| COMPONENTS — 4.2% | | | | | | 12,406,947 |
| Brightpoint, Inc.(1) | 559,178 | 4,121,142 | | | | |
| | | | | HEALTH CARE TECHNOLOGY — 1.4% | |
| Echelon Corp.(1) | 115,169 | 1,572,057 | | | | |
| | | | | athenahealth, Inc.(1) | 36,404 | 1,369,154 |
| Littelfuse, Inc.(1) | 111,984 | 3,086,279 | | | | |
| | | | | Eclipsys Corp.(1) | 61,612 | 1,155,225 |
| Maxwell Technologies, Inc.(1) | 259,940 | 4,660,724 | | | | |
| | | | | MedAssets, Inc.(1) | 43,684 | 958,427 |
| Sanmina-SCI Corp.(1) | 276,676 | 1,776,260 | | | | |
| | | | | Phase Forward, Inc.(1) | 50,103 | 656,850 |
| Smart Modular Technologies | | | | Quality Systems, Inc. | 23,338 | 1,424,085 |
| WWH, Inc.(1) | 508,344 | 2,063,876 | | | | |
| | | 17,280,338 | | | | 5,563,741 |
| ENERGY EQUIPMENT & SERVICES — 0.8% | | | HOTELS, RESTAURANTS & LEISURE — 2.4% | |
| | | | | Bally Technologies, Inc.(1) | 80,971 | 3,189,448 |
| Dril-Quip, Inc.(1) | 41,461 | 2,014,590 | | | | |
| | | | | Caribou Coffee Co., Inc.(1) | 60,297 | 493,833 |
| Lufkin Industries, Inc. | 21,717 | 1,238,955 | | | | |
| | | 3,253,545 | | Carrols Restaurant | | |
| | | | | Group, Inc.(1) | 231,135 | 1,500,066 |
| FOOD PRODUCTS — 0.3% | | | | Home Inns & Hotels | | |
| Darling International, Inc.(1) | 160,477 | 1,115,315 | | Management, Inc. ADR(1) | 100,428 | 2,669,376 |
| HEALTH CARE EQUIPMENT & SUPPLIES — 4.2% | | Life Time Fitness, Inc.(1) | 89,731 | 1,933,703 |
| Abaxis, Inc.(1) | 24,283 | 554,138 | | | | 9,786,426 |
| Align Technology, Inc.(1) | 65,299 | 1,026,500 | | HOUSEHOLD DURABLES — 6.4% | |
| American Medical Systems | | | | American Greetings Corp., | | |
| Holdings, Inc.(1) | 78,451 | 1,209,714 | | Class A | 351,208 | 7,143,571 |
| Cynosure, Inc., Class A(1) | 95,442 | 956,329 | | La-Z-Boy, Inc. | 453,295 | 3,218,395 |
| Haemonetics Corp.(1) | 27,751 | 1,429,177 | | Lennar Corp., Class A | 352,137 | 4,436,926 |
22
| | | | | | |
| New Opportunities II | | | | | |
| |
| | Shares | Value | | | Shares | Value |
| Sealy Corp.(1) | 1,152,597 | $ 3,342,531 | | OIL, GAS & CONSUMABLE FUELS — 5.1% | |
| Tempur-Pedic | | | | Arena Resources, Inc.(1) | 57,757 | $ 2,152,026 |
| International, Inc.(1) | 362,266 | 7,017,092 | | ATP Oil & Gas Corp.(1) | 206,956 | 3,582,408 |
| Tupperware Brands Corp. | 20,396 | 918,228 | | Carrizo Oil & Gas, Inc.(1) | 114,563 | 2,655,570 |
| | | 26,076,743 | | Clean Energy Fuels Corp.(1) | 223,122 | 2,588,215 |
| INSURANCE — 0.8% | | | | DCP Midstream Partners LP | 38,847 | 1,001,864 |
| National Financial | | | | EXCO Resources, Inc. | 73,814 | 1,152,975 |
| Partners Corp.(1) | 94,812 | 772,718 | | | | |
| | | | | Gran Tierra Energy, Inc.(1) | 515,218 | 2,452,438 |
| Protective Life Corp. | 118,368 | 2,278,584 | | | | |
| | | 3,051,302 | | Kodiak Oil & Gas Corp.(1) | 1,365,018 | 3,289,693 |
| INTERNET & CATALOG RETAIL — 1.6% | | | Northern Oil And Gas, Inc.(1) | 189,597 | 1,729,125 |
| Blue Nile, Inc.(1) | 29,617 | 1,778,501 | | | | 20,604,314 |
| priceline.com, Inc.(1) | 29,785 | 4,699,775 | | PAPER & FOREST PRODUCTS — 2.8% | |
| | | 6,478,276 | | Aracruz Celulose SA ADR(1) | 135,923 | 2,530,886 |
| INTERNET SOFTWARE & SERVICES — 2.3% | | | KapStone Paper and | | |
| | | | | Packaging Corp.(1) | 434,419 | 3,014,868 |
| Internet Capital Group, Inc.(1) | 426,846 | 3,103,171 | | | | |
| | | | | Louisiana-Pacific Corp.(1) | 222,132 | 1,166,193 |
| NIC, Inc. | 135,338 | 1,185,561 | | | | |
| | | | | Mercer International, Inc.(1) | 435,775 | 932,558 |
| Openwave Systems, Inc.(1) | 1,287,805 | 2,923,317 | | | | |
| | | | | Schweitzer-Mauduit | | |
| United Online, Inc. | 282,968 | 2,263,744 | | International, Inc. | 75,852 | 3,917,756 |
| | | 9,475,793 | | | | 11,562,261 |
| IT SERVICES — 1.8% | | | | PERSONAL PRODUCTS — 2.4% | | |
| China Information Security | | | | Bare Escentuals, Inc.(1) | 494,970 | 6,251,471 |
| Technology, Inc.(1) | 410,552 | 2,627,533 | | | | |
| | | | | China-Biotics, Inc.(1) | 66,088 | 766,621 |
| TNS, Inc.(1) | 161,183 | 4,555,031 | | | | |
| | | | | Medifast, Inc.(1) | 123,509 | 2,719,668 |
| | | 7,182,564 | | | | |
| LEISURE EQUIPMENT & PRODUCTS — 1.0% | | | | | 9,737,760 |
| Leapfrog Enterprises, Inc.(1) | 304,314 | 1,004,236 | | PHARMACEUTICALS — 1.0% | | |
| RC2 Corp.(1) | 247,692 | 3,234,858 | | Auxilium | | |
| | | | | Pharmaceuticals, Inc.(1) | 46,212 | 1,453,830 |
| | | 4,239,094 | | Nektar Therapeutics(1) | 105,862 | 859,599 |
| LIFE SCIENCES TOOLS & SERVICES — 0.7% | | | Salix Pharmaceuticals Ltd.(1) | 52,846 | 971,838 |
| Dionex Corp.(1) | 19,276 | 1,308,455 | | | | |
| | | | | VIVUS, Inc.(1) | 85,269 | 673,625 |
| Luminex Corp.(1) | 47,152 | 694,077 | | | | |
| | | | | | | 3,958,892 |
| PAREXEL | | | | PROFESSIONAL SERVICES — 0.9% | |
| International Corp.(1) | 65,249 | 816,918 | | | | |
| | | | | Heidrick & Struggles | | |
| | | 2,819,450 | | International, Inc. | 134,105 | 3,669,113 |
| MACHINERY — 1.2% | | | | REAL ESTATE INVESTMENT TRUSTS (REITs) — 2.5% |
| Chart Industries, Inc.(1) | 57,191 | 1,130,666 | | Agree Realty Corp. | 103,136 | 2,406,163 |
| FreightCar America, Inc. | 100,879 | 2,378,727 | | Ashford Hospitality | | |
| Trimas Corp.(1) | 267,534 | 1,203,903 | | Trust, Inc.(1) | 541,877 | 2,080,808 |
| | | 4,713,296 | | Sunstone Hotel | | |
| MEDIA — 1.9% | | | | Investors, Inc.(1) | 224,382 | 1,694,084 |
| Belo Corp., Class A | 617,333 | 2,901,465 | | U-Store-It Trust | 722,380 | 4,117,566 |
| LodgeNet Interactive Corp.(1) | 955,978 | 4,636,493 | | | | 10,298,621 |
| | | 7,537,958 | | ROAD & RAIL — 1.5% | | |
| METALS & MINING — 0.3% | | | | Dollar Thrifty Automotive | | |
| | | | | Group, Inc.(1) | 332,164 | 6,148,356 |
| Brush Engineered | | | | | | |
| Materials, Inc.(1) | 71,212 | 1,313,861 | | | | |
23
| | | | | | |
| New Opportunities II | | | | | |
| |
| | Shares | Value | | | Shares | Value |
| SEMICONDUCTORS & SEMICONDUCTOR | | | TEXTILES, APPAREL & LUXURY GOODS — 2.5% |
| EQUIPMENT — 7.6% | | | | Crocs, Inc.(1) | 325,215 | $ 1,977,307 |
| Advanced Energy | | | | Deckers Outdoor Corp.(1) | 21,897 | 1,963,504 |
| Industries, Inc.(1) | 277,457 | $ 3,387,750 | | | | |
| | | | | G-III Apparel Group Ltd.(1) | 164,385 | 2,631,804 |
| Amkor Technology, Inc.(1) | 743,090 | 4,094,426 | | | | |
| | | | | Steven Madden Ltd.(1) | 86,653 | 3,509,446 |
| Atheros | | | | | | |
| Communications, Inc.(1) | 154,475 | 3,803,174 | | | | 10,082,061 |
| Cymer, Inc.(1) | 103,607 | 3,547,504 | | TRADING COMPANIES & DISTRIBUTORS — 0.9% |
| Entegris, Inc.(1) | 1,088,977 | 4,094,553 | | Aircastle Ltd. | 469,130 | 3,715,510 |
| Entropic | | | | TRANSPORTATION INFRASTRUCTURE — 0.9% |
| Communications, Inc.(1) | 437,912 | 1,151,709 | | Aegean Marine Petroleum | | |
| LTX-Credence Corp.(1) | 1,033,337 | 1,384,672 | | Network, Inc. | 159,426 | 3,746,511 |
| OmniVision | | | | TOTAL COMMON STOCKS | | |
| Technologies, Inc.(1) | 170,052 | 2,084,837 | | (Cost $357,561,190) | | 407,500,094 |
| Pericom | | | | Temporary Cash Investments — 0.7% |
| Semiconductor Corp.(1) | 77,688 | 731,044 | | | | |
| | | | | JPMorgan U.S. Treasury | | |
| Semtech Corp.(1) | 143,383 | 2,218,135 | | Plus Money Market Fund | | |
| Skyworks Solutions, Inc.(1) | 169,502 | 1,767,906 | | Agency Shares | 74,754 | 74,754 |
| Techwell, Inc.(1) | 167,755 | 1,741,297 | | Repurchase Agreement, Bank of America | |
| Tessera Technologies, Inc.(1) | 49,048 | 1,084,451 | | Securities, LLC, (collateralized by various | |
| | | | | U.S. Treasury obligations, 1.875%-3.625%, | |
| | | 31,091,458 | | 7/15/13-4/15/28, valued at $3,085,709), | |
| SOFTWARE — 4.3% | | | | in a joint trading account at 0.05%, | | |
| Actuate Corp.(1) | 523,291 | 2,621,688 | | dated 10/30/09, due 11/2/09 | | |
| | | | | (Delivery value $3,000,012) | | 3,000,000 |
| CommVault Systems, Inc.(1) | 161,811 | 3,187,677 | | | | |
| | | | | TOTAL TEMPORARY | | |
| Deltek, Inc.(1) | 154,690 | 1,106,033 | | CASH INVESTMENTS | | |
| Interactive | | | | (Cost $3,074,754) | | 3,074,754 |
| Intelligence, Inc.(1) | 69,430 | 1,164,341 | | TOTAL INVESTMENT | | |
| JDA Software Group, Inc.(1) | 158,158 | 3,137,855 | | SECURITIES — 100.7% | | |
| Net 1 UEPS | | | | (Cost $360,635,944) | | 410,574,848 |
| Technologies, Inc.(1) | 96,665 | 1,690,671 | | OTHER ASSETS | | |
| Pegasystems, Inc. | 25,388 | 727,874 | | AND LIABILITIES — (0.7)% | | (3,033,341) |
| Smith Micro Software, Inc.(1) | 229,206 | 2,081,190 | | TOTAL NET ASSETS — 100.0% | | $407,541,507 |
| Taleo Corp., Class A(1) | 87,135 | 1,894,315 | | Notes to Schedule of Investments |
| | | 17,611,644 | | ADR = American Depositary Receipt | | |
| SPECIALTY RETAIL — 2.3% | | | | (1) Non-income producing. | | |
| Aeropostale, Inc.(1) | 102,479 | 3,846,037 | | | | |
| Casual Male Retail | | | | Industry classifications are unaudited. | | |
| Group, Inc.(1) | 545,984 | 1,370,420 | | | | |
| Kirkland’s, Inc.(1) | 182,308 | 2,293,435 | | | | |
| Pacific Sunwear | | | | | | |
| Of California(1) | 299,983 | 1,811,897 | | See Notes to Financial Statements. | | |
| | | 9,321,789 | | | | |
24
|
| Statement of Assets and Liabilities |
| | | |
| OCTOBER 31, 2009 | | |
| | | New |
| | Heritage | Opportunities II |
| Assets | | |
| Investment securities, at value (cost of $1,747,727,950 | | |
| and $360,635,944, respectively) | $2,020,691,781 | $410,574,848 |
| Cash | 1,199 | 4,161 |
| Foreign currency holdings, at value (cost of $197,910 and $–, respectively) | 198,145 | — |
| Receivable for investments sold | 44,440,721 | 7,972,398 |
| Receivable for capital shares sold | 3,095,727 | 301,472 |
| Receivable for forward foreign currency exchange contracts | 58,453 | — |
| Dividends and interest receivable | 505,941 | 49,761 |
| | 2,068,991,967 | 418,902,640 |
| |
| Liabilities | | |
| Payable for investments purchased | 50,963,743 | 10,216,756 |
| Payable for capital shares redeemed | 2,496,455 | 591,920 |
| Payable for forward foreign currency exchange contracts | 81,786 | — |
| Accrued management fees | 1,806,719 | 511,526 |
| Service fees (and distribution fees – A Class and R Class) payable | 131,731 | 30,626 |
| Distribution fees payable | 36,902 | 10,305 |
| | 55,517,336 | 11,361,133 |
| |
| Net Assets | $2,013,474,631 | $407,541,507 |
| |
| |
| See Notes to Financial Statements. | | |
25
| | |
| OCTOBER 31, 2009 | | |
| | | New |
| | Heritage | Opportunities II |
| Net Assets Consist of: | | |
| Capital (par value and paid-in surplus) | $2,226,811,890 | $778,946,495 |
| Accumulated undistributed net investment income (loss) | 23,333 | (599,780) |
| Accumulated net realized loss on investment and foreign currency transactions | (486,302,395) | (420,744,112) |
| Net unrealized appreciation on investments and translation | | |
| of assets and liabilities in foreign currencies | 272,941,803 | 49,938,904 |
| | $2,013,474,631 | $407,541,507 |
| |
| Investor Class, $0.01 Par Value | | |
| Net assets | $1,342,418,085 | $170,125,452 |
| Shares outstanding | 93,761,917 | 31,123,396 |
| Net asset value per share | $14.32 | $5.47 |
| |
| Institutional Class, $0.01 Par Value | | |
| Net assets | $92,343,181 | $108,261,459 |
| Shares outstanding | 6,324,608 | 19,703,815 |
| Net asset value per share | $14.60 | $5.49 |
| |
| A Class, $0.01 Par Value | | |
| Net assets | $518,768,264 | $114,026,339 |
| Shares outstanding | 37,116,977 | 21,074,498 |
| Net asset value per share | $13.98 | $5.41 |
| Maximum offering price (net asset value divided by 0.9425) | $14.83 | $5.74 |
| |
| B Class, $0.01 Par Value | | |
| Net assets | $3,425,468 | $2,975,541 |
| Shares outstanding | 241,829 | 565,524 |
| Net asset value per share | $14.16 | $5.26 |
| |
| C Class, $0.01 Par Value | | |
| Net assets | $51,744,602 | $11,607,845 |
| Shares outstanding | 3,916,830 | 2,197,483 |
| Net asset value per share | $13.21 | $5.28 |
| |
| R Class, $0.01 Par Value | | |
| Net assets | $4,775,031 | $544,871 |
| Shares outstanding | 335,292 | 100,738 |
| Net asset value per share | $14.24 | $5.41 |
| |
| |
| See Notes to Financial Statements. | | |
26
| | |
| YEAR ENDED OCTOBER 31, 2009 | | |
| | | New |
| | Heritage | Opportunities II |
| Investment Income (Loss) | | |
| Income: | | |
| Dividends (net of foreign taxes withheld of $101,963 and $42,539, respectively) | $ 13,992,524 | $ 4,060,757 |
| Interest | 35,360 | 6,105 |
| | 14,027,884 | 4,066,862 |
| |
| Expenses: | | |
| Management fees | 16,951,512 | 5,471,917 |
| Distribution fees: | | |
| B Class | 17,448 | 21,546 |
| C Class | 283,804 | 88,059 |
| Service fees: | | |
| B Class | 5,816 | 7,182 |
| C Class | 94,602 | 29,353 |
| Distribution and service fees: | | |
| A Class | 1,013,128 | 285,143 |
| R Class | 10,743 | 1,468 |
| Directors’ fees and expenses | 85,527 | 21,500 |
| Other expenses | 3,630 | 781 |
| | 18,466,210 | 5,926,949 |
| |
| Net investment income (loss) | (4,438,326) | (1,860,087) |
| |
| Realized and Unrealized Gain (Loss) | | |
| Net realized gain (loss) on: | | |
| Investment transactions | (262,737,518) | (103,779,168) |
| Foreign currency transactions | (7,074,849) | (17,717) |
| | (269,812,367) | (103,796,885) |
| |
| Change in net unrealized appreciation (depreciation) on: | | |
| Investments | 447,801,313 | 87,733,891 |
| Translation of assets and liabilities in foreign currencies | (1,272,835) | 16,022 |
| | 446,528,478 | 87,749,913 |
| |
| Net realized and unrealized gain (loss) | 176,716,111 | (16,046,972) |
| |
| Net Increase (Decrease) in Net Assets Resulting from Operations | $172,277,785 | $(17,907,059) |
| |
| |
| See Notes to Financial Statements. | | |
27
|
| Statement of Changes in Net Assets |
| | | | |
| YEARS ENDED OCTOBER 31, 2009 AND OCTOBER 31, 2008 | | | |
| | Heritage | New Opportunities II |
| Increase (Decrease) in Net Assets | 2009 | 2008 | 2009 | 2008 |
| Operations | | | | |
| Net investment income (loss) | $ (4,438,326) | $ (13,893,402) | $ (1,860,087) | $ (3,164,112) |
| Net realized gain (loss) | (269,812,367) | (187,029,551) | (103,796,885) | (137,399,405) |
| Change in net unrealized | | | | |
| appreciation (depreciation) | 446,528,478 | (1,057,065,104) | 87,749,913 | (137,916,205) |
| Net increase (decrease) in net assets | | | | |
| resulting from operations | 172,277,785 | (1,257,988,057) | (17,907,059) | (278,479,722) |
| |
| Distributions to Shareholders | | | | |
| From net investment income: | | | | |
| Investor Class | (11,939,054) | — | — | — |
| Institutional Class | (936,743) | — | — | — |
| A Class | (2,902,861) | — | — | — |
| B Class | (2,133) | — | — | — |
| C Class | (43,759) | — | — | — |
| R Class | (4,033) | — | — | — |
| From net realized gains: | | | | |
| Investor Class | — | (116,021,756) | — | (2,300,951) |
| Institutional Class | — | (7,340,538) | — | (540,870) |
| A Class | — | (16,474,408) | — | (1,726,801) |
| B Class | — | (12,405) | — | (39,168) |
| C Class | — | (1,359,296) | — | (150,324) |
| R Class | — | (1,228) | — | (229) |
| Decrease in net assets from distributions | (15,828,583) | (141,209,631) | — | (4,758,343) |
See Notes to Financial Statements.
28
| | | | |
| YEARS ENDED OCTOBER 31, 2009 AND OCTOBER 31, 2008 | | | |
| | Heritage | New Opportunities II |
| Increase (Decrease) in Net Assets | 2009 | 2008 | 2009 | 2008 |
| Capital Share Transactions | | | | |
| Net increase (decrease) in net assets | | | | |
| from capital share transactions | $ 121,367,022 | $ 187,043,641 | $(34,342,691) | $197,705,326(1) |
| | | | | |
| Redemption Fees | | | | |
| Increase in net assets | | | | |
| from redemption fees | — | — | 255,189 | —(1) |
| | | | | |
| Net increase (decrease) | | | | |
| in net assets | 277,816,224 | (1,212,154,047) | (51,994,561) | (85,532,739) |
| | | | | |
| Net Assets | | | | |
| Beginning of period | 1,735,658,407 | 2,947,812,454 | 459,536,068 | 545,068,807 |
| End of period | $2,013,474,631 | $1,735,658,407 | $407,541,507 | $459,536,068 |
| | | | | |
| Accumulated undistributed | | | | |
| net investment income (loss) | $23,333 | $12,271,498 | $(599,780) | — |
| (1) Capital share transactions for the year ended October 31, 2008 were net of redemption fees (Note 4). | |
| |
| |
| See Notes to Financial Statements. | | | | |
29
|
| Notes to Financial Statements |
OCTOBER 31, 2009
1. Organization and Summary of Significant Accounting Policies
Organization — American Century Mutual Funds, Inc. (the corporation) is registered under the Investment Company Act of 1940 (the 1940 Act) as an open-end management investment company. Heritage Fund (Heritage) and New Opportunities II Fund (New Opportunities II) (collectively, the funds) are two funds in a series issued by the corporation. Effective December 1, 2009, New Opportunities II Fund was renamed Small Cap Growth Fund. The funds are diversified under the 1940 Act. The funds’ investment objective is to seek long-term capital growth. Heritage pursues its objective by investing in companies that are medium-sized and smaller at the time of purchase that management believes will increase in value over time. New Opportunities II pursues its objective by investing in small cap companies that management believes will increase in value over time. The following is a summary of the funds’ significant accounting policies.
Multiple Class — The funds are authorized to issue the Investor Class, the Institutional Class, the A Class, the B Class, the C Class and the R Class. The A Class may incur an initial sales charge. The A Class, B Class and C Class may be subject to a contingent deferred sales charge. The share classes differ principally in their respective sales charges and distribution and shareholder servicing expenses and arrangements. All shares of each fund represent an equal pro rata interest in the net assets of the class to which such shares belong, and have identical voting, dividend, liquidation and other rights and the same terms and conditions, except for class specific expenses and exclusive rights to vote on matters affecting only individual classes. Income, non-class specific expenses, and realized and unrealized capital gains and losses of the funds are allocated to each class of shares based on their relative net assets.
Security Valuations — Securities traded primarily on a principal securities exchange are valued at the last reported sales price, or at the mean of the latest bid and asked prices where no last sales price is available. Depending on local convention or regulation, securities traded over-the-counter are valued at the mean of the latest bid and asked prices, the last sales price, or the official close price. Investments in open-end management investment companies are valued at the reported net asset value. Debt securities not traded on a principal securities exchange are valued through a commercial pricing service or at the mean of the most recent bid and asked prices. Securities traded on foreign securities exchanges and over-the-counter markets are normally completed before the close of business on days that the New York Stock Exchange (th e Exchange) is open and may also take place on days when the Exchange is not open. If an event occurs after the value of a security was established but before the net asset value per share was determined that was likely to materially change the net asset value, that security would be valued as determined in accordance with procedures adopted by the Board of Directors. If the funds determine that the market price of a portfolio security is not readily available, or that the valuation methods mentioned above do not reflect the security’s fair value, such security is valued as determined by the Board of Directors or its designee, in accordance with procedures adopted by the Board of Directors, if such determination would materially impact a fund’s net asset value. Certain other circumstances may cause the funds to use alternative procedures to value a security such as: a security has been declared in default; trading in a security has been halted during the trading day; or there is a foreign market ho liday and no trading will commence.
30
Security Transactions — For financial reporting purposes, security transactions are accounted for as of the trade date. Net realized gains and losses are determined on the identified cost basis, which is also used for federal income tax purposes. Certain countries impose taxes on realized gains on the sale of securities registered in their country. The funds record the foreign tax expense, if any, on an accrual basis. The realized and unrealized tax provision reduces the net realized gain (loss) on investment transactions and net unrealized appreciation (depreciation) on investments, respectively.
Investment Income — Dividend income less foreign taxes withheld, if any, is recorded as of the ex-dividend date. Distributions received on securities that represent a return of capital or capital gain are recorded as a reduction of cost of investments and/or as a realized gain. The funds estimate the components of distributions received that may be considered nontaxable distributions or capital gain distributions for income tax purposes. Interest income is recorded on the accrual basis and includes accretion of discounts and amortization of premiums.
Foreign Currency Translations — All assets and liabilities initially expressed in foreign currencies are translated into U.S. dollars at prevailing exchange rates at period end. The funds may enter into spot foreign currency exchange contracts to facilitate transactions denominated in a foreign currency. Purchases and sales of investment securities, dividend and interest income, spot foreign currency exchange contracts, and certain expenses are translated at the rates of exchange prevailing on the respective dates of such transactions. For assets and liabilities, other than investments in securities, net realized and unrealized gains and losses from foreign currency translations arise from changes in currency exchange rates.
Net realized and unrealized foreign currency exchange gains or losses occurring during the holding period of investment securities are a component of net realized gain (loss) on investment transactions and net unrealized appreciation (depreciation) on investments, respectively. Certain countries may impose taxes on the contract amount of purchases and sales of foreign currency contracts in their currency. The funds record the foreign tax expense, if any, as a reduction to the net realized gain (loss) on foreign currency transactions.
Repurchase Agreements — The funds may enter into repurchase agreements with institutions that American Century Investment Management, Inc. (ACIM) (the investment advisor) has determined are creditworthy pursuant to criteria adopted by the Board of Directors. Each repurchase agreement is recorded at cost. Each fund requires that the collateral, represented by securities, received in a repurchase transaction be transferred to the custodian in a manner sufficient to enable each fund to obtain those securities in the event of a default under the repurchase agreement. ACIM monitors, on a daily basis, the securities transferred to ensure the value, including accrued interest, of the securities under each repurchase agreement is equal to or greater than amounts owed to each fund under each repurchase agreement.
Joint Trading Account — Pursuant to an Exemptive Order issued by the Securities and Exchange Commission, each fund, along with certain other funds in the American Century Investments family of funds, may transfer uninvested cash balances into a joint trading account. These balances are invested in one or more repurchase agreements that are collateralized by U.S. Treasury or Agency obligations.
Exchange Traded Funds — The funds may invest in exchange traded funds (ETFs). ETFs are a type of index fund bought and sold on a securities exchange. An ETF trades like common stock and represents a fixed portfolio of securities designed to track the performance and dividend yield of a particular domestic or foreign market index. A fund may purchase an ETF to temporarily gain exposure to a portion of the U.S. or a foreign market while awaiting purchase of underlying securities. The risks of owning an ETF generally reflect the risks of owning the underlying securities they are designed to track, although the lack of liquidity on an ETF could result in it being more volatile. Additionally, ETFs have fees and expenses that reduce their value.
31
Income Tax Status — It is each fund’s policy to distribute substantially all net investment income and net realized gains to shareholders and to otherwise qualify as a regulated investment company under provisions of the Internal Revenue Code. The funds are no longer subject to examination by tax authorities for years prior to 2006. Additionally, non-U.S. tax returns filed by the funds due to investments in certain foreign securities remain subject to examination by the relevant taxing authority for 7 years from the date of filing. At this time, management believes there are no uncertain tax positions which, based on their technical merit, would not be sustained upon examination and for which it is reasonably possible that the total amounts of unrecognized tax benefits will significantly change in the next twelve months. Accordin gly, no provision has been made for federal or state income taxes. Interest and penalties associated with any federal or state income tax obligations, if any, are recorded as interest expense.
Distributions to Shareholders — Distributions to shareholders are recorded on the ex-dividend date. Distributions from net investment income and net realized gains, if any, are generally declared and paid annually.
Redemption — New Opportunities II may impose a 2.00% redemption fee on shares held less than 180 days. The fee may not be applicable to all classes. The redemption fee is retained by the fund and helps cover transaction costs that long-term investors may bear when a fund sells securities to meet investor redemptions.
Indemnifications — Under the corporation’s organizational documents, its officers and directors are indemnified against certain liabilities arising out of the performance of their duties to the funds. In addition, in the normal course of business, the funds enter into contracts that provide general indemnifications. The maximum exposure under these arrangements is unknown as this would involve future claims that may be made against a fund. The risk of material loss from such claims is considered by management to be remote.
Use of Estimates — The financial statements are prepared in conformity with accounting principles generally accepted in the United States of America, which may require management to make certain estimates and assumptions at the date of the financial statements. Actual results could differ from these estimates.
Subsequent Events — Management has evaluated events or transactions that may have occurred since October 31, 2009, that would merit recognition or disclosure in the financial statements. This evaluation was completed through December 28, 2009, the date the financial statements were issued.
2. Fees and Transactions with Related Parties
Management Fees — The corporation has entered into a Management Agreement with ACIM, under which ACIM provides the funds with investment advisory and management services in exchange for a single, unified management fee (the fee) per class. The Agreement provides that all expenses of the funds, except brokerage commissions, taxes, interest, fees and expenses of those directors who are not considered “interested persons” as defined in the 1940 Act (including counsel fees) and extraordinary expenses, will be paid by ACIM. The fee is computed and accrued daily based on the daily net assets of each specific class of shares of each fund and paid monthly in arrears. For funds with a stepped fee schedule, the rate of the fee is determined by applying a fee rate calculation formula. This formula takes into account each fund’s as sets as well as certain assets, if any, of other clients of the investment advisor outside the American Century Investments family of funds (such as subadvised funds and separate accounts) that have very similar
32
investment teams and investment strategies (strategy assets). The annual management fee schedule for each class of Heritage is 1.000% for the Investor Class, A Class, B Class, C Class and R Class and 0.800% for the Institutional Class. The annual management fee schedule for New Opportunities II ranges from 1.10% to 1.50% for the Investor Class, A Class, B Class, C Class and R Class. The Institutional Class of New Opportunities II is 0.20% less at each point within the range.
The effective annual management fee for each class of each fund for the year ended October 31, 2009, was as follows:
| | |
| | Investor, A, B, C & R | Institutional |
| Heritage | 1.00% | 0.80% |
| New Opportunities II | 1.40% | 1.20% |
Distribution and Service Fees — The Board of Directors has adopted a separate Master Distribution and Individual Shareholder Services Plan for each of the A Class, B Class, C Class and R Class (collectively the plans), pursuant to Rule 12b-1 of the 1940 Act. The plans provide that the A Class will pay American Century Investment Services, Inc. (ACIS) an annual distribution and service fee of 0.25%. The plans provide that the B Class and the C Class will each pay ACIS an annual distribution fee of 0.75% and service fee of 0.25%. The plans provide that the R Class will pay ACIS an annual distribution and service fee of 0.50%. The fees are computed and accrued daily based on each class’s daily net assets and paid monthly in arrears. The fees are used to pay financial intermediaries for distribution and individual shareholder services. Fe es incurred under the plans during the year ended October 31, 2009, are detailed in the Statement of Operations.
Related Parties — Certain officers and directors of the corporation are also officers and/or directors, and, as a group, controlling stockholders of American Century Companies, Inc. (ACC), the parent of the corporation’s investment advisor, ACIM, the distributor of the corporation, ACIS, and the corporation’s transfer agent, American Century Services, LLC.
The funds are eligible to invest in a money market fund for temporary purposes, which is managed by J.P. Morgan Investment Management, Inc. (JPMIM). The funds have a Mutual Funds Services Agreement with J.P. Morgan Investor Services Co. (JPMIS). JPMorgan Chase Bank (JPMCB) is a custodian of the funds. JPMIM, JPMIS and JPMCB are wholly owned subsidiaries of JPMorgan Chase & Co. (JPM). JPM is an equity investor in ACC.
3. Investment Transactions
Investment transactions, excluding short-term investments, for the year ended October 31, 2009, were as follows:
| | |
| | Heritage | New Opportunities II |
| Purchases | $2,760,757,065 | $820,721,497 |
| Sales | $2,641,665,558 | $855,620,591 |
33
| | | | |
| 4. Capital Share Transactions | | | | |
| |
| Transactions in shares of the funds were as follows: | | |
| |
| | Year ended October 31, 2009 | Year ended October 31, 2008 |
| | Shares | Amount | Shares | Amount |
| Heritage | | | | |
| Investor Class/Shares Authorized | 400,000,000 | | 400,000,000 | |
| Sold | 21,287,744 | $269,895,757 | 31,233,074 | $618,004,142 |
| Issued in reinvestment of distributions | 1,038,518 | 11,506,781 | 5,127,807 | 109,324,836 |
| Redeemed | (24,501,467) | (300,017,434) | (48,965,070) | (876,451,757) |
| | (2,175,205) | (18,614,896) | (12,604,189) | (149,122,779) |
| Institutional Class/Shares Authorized | 40,000,000 | | 40,000,000 | |
| Sold | 1,465,590 | 18,547,939 | 4,661,236 | 93,305,544 |
| Issued in reinvestment of distributions | 83,029 | 936,563 | 335,375 | 7,277,632 |
| Redeemed | (1,699,463) | (20,369,382) | (5,236,470) | (85,632,543) |
| | (150,844) | (884,880) | (239,859) | 14,950,633 |
| A Class/Shares Authorized | 200,000,000 | | 100,000,000 | |
| Sold | 20,552,782 | 250,958,298 | 22,743,450 | 430,416,225 |
| Issued in reinvestment of distributions | 257,512 | 2,791,428 | 779,682 | 16,263,842 |
| Redeemed | (11,102,089) | (132,976,948) | (9,151,482) | (160,662,157) |
| | 9,708,205 | 120,772,778 | 14,371,650 | 286,017,910 |
| B Class/Shares Authorized | 35,000,000 | | 35,000,000 | |
| Sold | 139,787 | 1,746,511 | 143,185 | 2,761,872 |
| Issued in reinvestment of distributions | 178 | 1,969 | 537 | 11,416 |
| Redeemed | (34,173) | (415,624) | (11,336) | (184,696) |
| | 105,792 | 1,332,856 | 132,386 | 2,588,592 |
| C Class/Shares Authorized | 35,000,000 | | 35,000,000 | |
| Sold | 2,011,575 | 24,044,708 | 2,301,879 | 42,068,427 |
| Issued in reinvestment of distributions | 3,445 | 35,514 | 60,851 | 1,207,291 |
| Redeemed | (802,497) | (9,141,997) | (674,227) | (11,344,437) |
| | 1,212,523 | 14,938,225 | 1,688,503 | 31,931,281 |
| R Class/Shares Authorized | 30,000,000 | | 30,000,000 | |
| Sold | 385,148 | 5,060,155 | 47,915 | 887,242 |
| Issued in reinvestment of distributions | 364 | 4,030 | 58 | 1,228 |
| Redeemed | (88,131) | (1,241,246) | (11,224) | (210,466) |
| | 297,381 | 3,822,939 | 36,749 | 678,004 |
| Net increase (decrease) | 8,997,852 | $121,367,022 | 3,385,240 | $187,043,641 |
34
| | | | |
| | Year ended October 31, 2009 | Year ended October 31, 2008 |
| | Shares | Amount | Shares | Amount |
| |
| New Opportunities II | | | | |
| Investor Class/Shares Authorized | 165,000,000 | | 165,000,000 | |
| Sold | 16,295,442 | $ 85,307,455 | 14,516,866 | $107,524,672 |
| Issued in reinvestment of distributions | — | — | 192,298 | 1,651,841 |
| Redeemed | (25,021,496) | (122,029,987) | (7,044,679) | (51,234,905)(1) |
| | (8,726,054) | (36,722,532) | 7,664,485 | 57,941,608 |
| Institutional Class/Shares Authorized | 150,000,000 | | 50,000,000 | |
| Sold | 11,827,728 | 58,268,863 | 17,709,479 | 141,204,228 |
| Issued in reinvestment of distributions | — | — | 7,845 | 67,466 |
| Redeemed | (8,547,304) | (43,412,649) | (3,243,291) | (23,252,011)(2) |
| | 3,280,424 | 14,856,214 | 14,474,033 | 118,019,683 |
| A Class/Shares Authorized | 110,000,000 | | 100,000,000 | |
| Sold | 5,152,254 | 25,297,336 | 7,874,721 | 61,062,282 |
| Issued in reinvestment of distributions | — | — | 193,819 | 1,655,219 |
| Redeemed | (7,556,245) | (37,383,702) | (6,200,038) | (46,433,452)(3) |
| | (2,403,991) | (12,086,366) | 1,868,502 | 16,284,049 |
| B Class/Shares Authorized | 20,000,000 | | 20,000,000 | |
| Sold | 161,020 | 741,803 | 120,388 | 909,810 |
| Issued in reinvestment of distributions | — | — | 4,508 | 37,960 |
| Redeemed | (121,098) | (582,619) | (91,032) | (657,189)(4) |
| | 39,922 | 159,184 | 33,864 | 290,581 |
| C Class/Shares Authorized | 20,000,000 | | 20,000,000 | |
| Sold | 607,886 | 2,915,777 | 1,109,692 | 8,592,777 |
| Issued in reinvestment of distributions | — | — | 13,136 | 111,133 |
| Redeemed | (797,746) | (3,877,579) | (501,516) | (3,655,747)(5) |
| | (189,860) | (961,802) | 621,312 | 5,048,163 |
| R Class/Shares Authorized | 20,000,000 | | 20,000,000 | |
| Sold | 97,427 | 497,692 | 20,089 | 138,869 |
| Issued in reinvestment of distributions | — | — | 27 | 229 |
| Redeemed | (16,219) | (85,081) | (3,358) | (17,856) |
| | 81,208 | 412,611 | 16,758 | 121,242 |
| Net increase (decrease) | (7,918,351) | $(34,342,691) | 24,678,954 | $197,705,326 |
| (1) | Net of redemption fees of $174,782. |
| (2) | Net of redemption fees of $14,858. |
| (3) | Net of redemption fees of $17,033. |
| (4) | Net of redemption fees of $249. |
| (5) | Net of redemption fees of $923. |
35
5. Fair Value Measurements
The funds’ securities valuation process is based on several considerations and may
use multiple inputs to determine the fair value of the positions held by the funds. In
conformity with accounting principles generally accepted in the United States of America,
the inputs used to determine a valuation are classified into three broad levels as follows:
• Level 1 valuation inputs consist of actual quoted prices in an active market for
identical securities;
• Level 2 valuation inputs consist of significant direct or indirect observable market data
(including quoted prices for similar securities, evaluations of subsequent market events,
interest rates, prepayment speeds, credit risk, etc.); or
• Level 3 valuation inputs consist of significant unobservable inputs (including a fund’s
own assumptions).
The level classification is based on the lowest level input that is significant to the fair
valuation measurement. The valuation inputs are not an indication of the risks associated
with investing in these securities or other financial instruments.
The following is a summary of the valuation inputs used to determine the fair value of the
funds’ securities and other financial instruments as of October 31, 2009:
| | | |
| | Level 1 | Level 2 | Level 3 |
| Heritage | | | |
| Investment Securities | | | |
| Domestic Common Stocks | $1,817,897,440 | — | — |
| Foreign Common Stocks | 137,816,857 | $53,098,302 | — |
| Temporary Cash Investments | 79,182 | 11,800,000 | — |
| Total Value of Investment Securities | $1,955,793,479 | $64,898,302 | — |
| | | | |
| Other Financial Instruments | | | |
| Total Unrealized Gain (Loss) on Forward | | | |
| Foreign Currency Exchange Contracts | — | $(23,333) | — |
| | | | |
| New Opportunities II | | | |
| Investment Securities | | | |
| Domestic Common Stocks | $373,761,030 | — | — |
| Foreign Common Stocks | 33,739,064 | — | — |
| Temporary Cash Investments | 74,754 | $3,000,000 | — |
| Total Value of Investment Securities | $407,574,848 | $3,000,000 | — |
36
6. Derivative Instruments
Foreign Currency Risk — Heritage is subject to foreign currency exchange rate risk in the normal course of pursuing its investment objectives. The value of foreign investments held by a fund may be significantly affected by changes in foreign currency exchange rates. The dollar value of a foreign security generally decreases when the value of the dollar rises against the foreign currency in which the security is denominated and tends to increase when the value of the dollar declines against such foreign currency. A fund may enter into forward foreign currency exchange contracts to reduce a fund’s exposure to foreign currency exchange rate fluctuations. The net U.S. dollar value of foreign currency underlying all contractual commitments held by a fund and the resulting unrealized appreciation or depreciation are determined daily u sing prevailing exchange rates. Realized gain or loss is recorded upon the termination of the contract. Net realized and unrealized gains or losses occurring during the holding period of forward foreign currency exchange contracts are a component of net realized gain (loss) on foreign currency transactions and change in net unrealized appreciation (depreciation) on translation of assets and liabilities in foreign currencies, respectively. A fund bears the risk of an unfavorable change in the foreign currency exchange rate underlying the forward contract. Additionally, losses, up to the fair value, may arise if the counterparties do not perform under the contract terms. The risk of loss from non-performance by the counterparty may be reduced by the use of master netting agreements. During the year ended October 31, 2009, Heritage participated in forward foreign currency exchange contracts.
For Heritage, the value of foreign currency risk derivatives as of October 31, 2009, is disclosed on the Statement of Assets and Liabilities as an asset of $58,453 in receivable for forward foreign currency exchange contracts and a liability of $81,786 in payable for forward foreign currency exchange contracts. For Heritage, for the year ended October 31, 2009, the effect of foreign currency risk derivatives on the Statement of Operations was $(7,230,916) in net realized gain (loss) on foreign currency transactions and $(1,220,770) in change in net unrealized appreciation (depreciation) on translation of assets and liabilities in foreign currencies.
For Heritage, the derivative instruments at period end as disclosed on the Schedule of Investments are indicative of the fund’s typical volume.
7. Bank Line of Credit
The funds, along with certain other funds in the American Century Investments family of funds, had a $500,000,000 unsecured bank line of credit agreement with Bank of America, N.A. The line expired December 10, 2008, and was not renewed. The agreement allowed the funds to borrow money for temporary or emergency purposes to fund shareholder redemptions. Borrowings under the agreement were subject to interest at the Federal Funds rate plus 0.40%. The funds did not borrow from the line during the year ended October 31, 2009.
8. Interfund Lending
The funds, along with certain other funds in the American Century Investments family of funds, may participate in an interfund lending program, pursuant to an Exemptive Order issued by the Securities and Exchange Commission (SEC). This program provides an alternative credit facility allowing the funds to borrow from or lend to other funds in the American Century Investments family of funds that permit such transactions. Interfund lending transactions are subject to each fund’s investment policies and borrowing and lending limits. The interfund loan rate earned/paid on interfund lending transactions is determined daily based on the average of certain current market rates. Interfund lending transactions normally extend only overnight, but can have a maximum duration of seven days. The program is subject to annual approval by the Board of Directors. During the year ended October 31, 2009, the funds did not utilize the prog ram.
37
9. Risk Factors
There are certain risks involved in investing in foreign securities. These risks include those resulting from future adverse political, social, and economic developments, fluctuations in currency exchange rates, the possible imposition of exchange controls, and other foreign laws or restrictions. Investing in emerging markets may accentuate these risks.
New Opportunities II concentrates its investments in common stocks of small companies. Because of this, New Opportunities II may be subject to greater risk and market fluctuations than a fund investing in larger, more established companies.
New Opportunities II’s investment process may result in high portfolio turnover, high commission costs and high capital gains distributions. In addition, its investment approach may involve higher volatility and risk.
10. Federal Tax Information
The tax character of distributions paid during the years ended October 31, 2009 and October 31, 2008 were as follows:
| | | | |
| | Heritage | New Opportunities II |
| | 2009 | 2008 | 2009 | 2008 |
| Distributions Paid From | | | | |
| Ordinary income | $15,828,583 | $8,441,706 | — | — |
| Long-term capital gains | — | $132,767,925 | — | $4,758,343 |
The book-basis character of distributions made during the year from net investment income or net realized gains may differ from their ultimate characterization for federal income tax purposes. These differences reflect the differing character of certain income items and net realized gains and losses for financial statement and tax purposes, and may result in reclassification among certain capital accounts on the financial statements.
As of October 31, 2009, the federal tax cost of investments and the components of distributable earnings on a tax-basis were as follows:
| | |
| | Heritage | New Opportunities II |
| Federal tax cost of investments | $1,760,182,174 | $365,564,407 |
| Gross tax appreciation of investments | $324,670,968 | $61,679,350 |
| Gross tax depreciation of investments | (64,161,361) | (16,668,909) |
| Net tax appreciation (depreciation) of investments | $260,509,607 | $45,010,441 |
| Net tax appreciation (depreciation) on derivatives and translation of assets and | | |
| liabilities in foreign currencies | $1,305 | — |
| Net tax appreciation (depreciation) | $260,510,912 | $45,010,441 |
| Undistributed ordinary income | — | — |
| Accumulated capital losses | $(473,848,171) | $(416,415,429) |
The difference between book-basis and tax-basis cost and unrealized appreciation (depreciation) is attributable primarily to the tax deferral of losses on wash sales and on investments in passive foreign investment companies and the realization for tax purposes of unrealized gains or certain forward foreign currency exchange contracts.
38
The accumulated capital losses on the previous page represent net capital loss carryovers that may be used to offset future realized capital gains for federal income tax purposes. Future capital loss carryover utilization in any given year may be subject to Internal Revenue Code limitations. The capital loss carryovers expire as follows:
| | | | | | | |
| | 2011 | 2012 | 2013 | 2014 | 2015 | 2016 | 2017 |
| Heritage | — | — | — | — | — | $(184,471,004) | $(289,377,167) |
| New Opportunities II | $(13,145,846) | $(19,655,453) | $(42,248,002) | $(103,823,579) | — | $(125,173,360) | $(112,369,189) |
11. Recently Issued Accounting Standards
The Financial Accounting Standards Board (FASB) issued Accounting Standards Codification (ASC) Section 820-10 (formerly Statement of Financial Accounting Standards No. 157, “Fair Value Measurements”), in September 2006, which is effective for fiscal years beginning after November 15, 2007. ASC Section 820-10 defines fair value, establishes a framework for measuring fair value and expands the required financial statement disclosures about fair value measurements. The adoption of ASC Section 820-10 did not materially impact the determination of fair value.
In March 2008, the FASB issued ASC Section 815-10 (formerly Statement of Financial Accounting Standards No. 161, “Disclosures about Derivative Instruments and Hedging Activities—an amendment of FASB Statement No. 133”). ASC Section 815-10 is effective for interim periods beginning after November 15, 2008 and has been adopted by the funds. ASC Section 815-10 amends and expands disclosures about derivative instruments and hedging activities. ASC Section 815-10 requires qualitative disclosures about the objectives and strategies of derivative instruments, quantitative disclosures about the fair value amounts of and gains and losses on derivative instruments, and disclosures of credit-risk-related contingent features in hedging activities.
12. Other Tax Information (Unaudited)
The following information is provided pursuant to provisions of the Internal Revenue Code.
Heritage designates up to the maximum amount allowable as qualified dividend income for the fiscal year ended October 31, 2009.
For corporate taxpayers, Heritage hereby designates $9,020,243, or up to the maximum amount allowable, of ordinary income distributions paid during the fiscal year ended October 31, 2009 as qualified for the corporate dividends received deduction.
39
| | | | | |
| Heritage | | | | | |
| |
| Investor Class | | | | | |
| For a Share Outstanding Throughout the Years Ended October 31 | | | |
| | 2009 | 2008 | 2007 | 2006 | 2005 |
| Per-Share Data | | | | | |
| Net Asset Value, Beginning of Period | $13.15 | $22.83 | $15.58 | $13.48 | $10.76 |
| Income From Investment Operations | | | | | |
| Net Investment Income (Loss)(1) | (0.02) | (0.09) | (0.10) | (0.03) | (0.06) |
| Net Realized and Unrealized Gain (Loss) | 1.32 | (8.53) | 8.42 | 2.22 | 2.78 |
| Total From Investment Operations | 1.30 | (8.62) | 8.32 | 2.19 | 2.72 |
| Distributions | | | | | |
| From Net Investment Income | (0.13) | — | — | — | — |
| From Net Realized Gains | — | (1.06) | (1.07) | (0.09) | — |
| Total Distributions | (0.13) | (1.06) | (1.07) | (0.09) | — |
| Net Asset Value, End of Period | $14.32 | $13.15 | $22.83 | $15.58 | $13.48 |
| |
| Total Return(2) | 10.16% | (39.54)% | 56.41% | 16.26% | 25.16% |
| |
| Ratios/Supplemental Data | | | | | |
| Ratio of Operating Expenses | | | | | |
| to Average Net Assets | 1.01% | 1.00% | 1.00% | 1.00% | 1.00% |
| Ratio of Net Investment Income (Loss) | | | | | |
| to Average Net Assets | (0.19)% | (0.47)% | (0.56)% | (0.22)% | (0.46)% |
| Portfolio Turnover Rate | 155% | 172% | 128% | 230% | 236% |
| Net Assets, End of Period (in millions) | $1,342 | $1,262 | $2,478 | $1,037 | $801 |
| (1) | Computed using average shares outstanding throughout the period. |
| (2) | Total return assumes reinvestment of net investment income and capital gains distributions, if any. The total return of the classes may not precisely reflect the class expense differences because of the impact of calculating the net asset values to two decimal places. If net asset values were calculated to three decimal places, the total return differences would more closely reflect the class expense differences. The calculation of net asset values to two decimal places is made in accordance with SEC guidelines and does not result in any gain or loss of value between one class and another. |
See Notes to Financial Statements.
40
| | | | | |
| Heritage | | | | | |
| |
| Institutional Class | | | | | |
| For a Share Outstanding Throughout the Years Ended October 31 | | | |
| | 2009 | 2008 | 2007 | 2006 | 2005 |
| Per-Share Data | | | | | |
| Net Asset Value, Beginning of Period | $13.41 | $23.21 | $15.80 | $13.63 | $10.87 |
| Income From Investment Operations | | | | | |
| Net Investment Income (Loss)(1) | —(2) | (0.05) | (0.07) | —(2) | (0.03) |
| Net Realized and Unrealized Gain (Loss) | 1.34 | (8.69) | 8.55 | 2.26 | 2.79 |
| Total From Investment Operations | 1.34 | (8.74) | 8.48 | 2.26 | 2.76 |
| Distributions | | | | | |
| From Net Investment Income | (0.15) | — | — | — | — |
| From Net Realized Gains | — | (1.06) | (1.07) | (0.09) | — |
| Total Distributions | (0.15) | (1.06) | (1.07) | (0.09) | — |
| Net Asset Value, End of Period | $14.60 | $13.41 | $23.21 | $15.80 | $13.63 |
| |
| Total Return(3) | 10.33% | (39.41)% | 56.66% | 16.59% | 25.39% |
| |
| Ratios/Supplemental Data | | | | | |
| Ratio of Operating Expenses | | | | | |
| to Average Net Assets | 0.81% | 0.80% | 0.80% | 0.80% | 0.80% |
| Ratio of Net Investment Income (Loss) | | | | | |
| to Average Net Assets | 0.01% | (0.27)% | (0.36)% | (0.02)% | (0.26)% |
| Portfolio Turnover Rate | 155% | 172% | 128% | 230% | 236% |
| Net Assets, End of Period (in thousands) | $92,343 | $86,835 | $155,885 | $57,039 | $43,192 |
| (1) | Computed using average shares outstanding throughout the period. |
| (2) | Per-share amount was less than $0.005. |
| (3) | Total return assumes reinvestment of net investment income and capital gains distributions, if any. The total return of the classes may not precisely reflect the class expense differences because of the impact of calculating the net asset values to two decimal places. If net asset values were calculated to three decimal places, the total return differences would more closely reflect the class expense differences. The calculation of net asset values to two decimal places is made in accordance with SEC guidelines and does not result in any gain or loss of value between one class and another. |
See Notes to Financial Statements.
41
| | | | | |
| Heritage | | | | | |
| |
| A Class(1) | | | | | |
| For a Share Outstanding Throughout the Years Ended October 31 | | | |
| | 2009 | 2008 | 2007 | 2006 | 2005 |
| Per-Share Data | | | | | |
| Net Asset Value, Beginning of Period | $12.84 | $22.37 | $15.32 | $13.29 | $10.64 |
| Income From Investment Operations | | | | | |
| Net Investment Income (Loss)(2) | (0.06) | (0.13) | (0.15) | (0.08) | (0.09) |
| Net Realized and Unrealized Gain (Loss) | 1.30 | (8.34) | 8.27 | 2.20 | 2.74 |
| Total From Investment Operations | 1.24 | (8.47) | 8.12 | 2.12 | 2.65 |
| Distributions | | | | | |
| From Net Investment Income | (0.10) | — | — | — | — |
| From Net Realized Gains | — | (1.06) | (1.07) | (0.09) | — |
| Total Distributions | (0.10) | (1.06) | (1.07) | (0.09) | — |
| Net Asset Value, End of Period | $13.98 | $12.84 | $22.37 | $15.32 | $13.29 |
| |
| Total Return(3) | 9.89% | (39.69)% | 56.05% | 15.96% | 24.91% |
| |
| Ratios/Supplemental Data | | | | | |
| Ratio of Operating Expenses | | | | | |
| to Average Net Assets | 1.26% | 1.25% | 1.25% | 1.25% | 1.25% |
| Ratio of Net Investment Income (Loss) | | | | | |
| to Average Net Assets | (0.44)% | (0.72)% | (0.81)% | (0.47)% | (0.71)% |
| Portfolio Turnover Rate | 155% | 172% | 128% | 230% | 236% |
| Net Assets, End of Period (in thousands) | $518,768 | $351,962 | $291,674 | $57,995 | $19,953 |
| (1) | Prior to September 4, 2007, the A Class was referred to as the Advisor Class. |
| (2) | Computed using average shares outstanding throughout the period. |
| (3) | Total return assumes reinvestment of net investment income and capital gains distributions, if any, and does not reflect applicable sales charges. The total return of the classes may not precisely reflect the class expense differences because of the impact of calculating the net asset values to two decimal places. If net asset values were calculated to three decimal places, the total return differences would more closely reflect the class expense differences. The calculation of net asset values to two decimal places is made in accordance with SEC guidelines and does not result in any gain or loss of value between one class and another. |
See Notes to Financial Statements.
42
| | | |
| Heritage | | | |
| |
| B Class | | | |
| For a Share Outstanding Throughout the Years Ended October 31 (except as noted) | | |
| | 2009 | 2008 | 2007(1) |
| Per-Share Data | | | |
| Net Asset Value, Beginning of Period | $13.01 | $22.82 | $21.52 |
| Income From Investment Operations | | | |
| Net Investment Income (Loss)(2) | (0.16) | (0.26) | (0.03) |
| Net Realized and Unrealized Gain (Loss) | 1.33 | (8.49) | 1.33 |
| Total From Investment Operations | 1.17 | (8.75) | 1.30 |
| Distributions | | | |
| From Net Investment Income | (0.02) | — | — |
| From Net Realized Gains | — | (1.06) | — |
| Total Distributions | (0.02) | (1.06) | — |
| Net Asset Value, End of Period | $14.16 | $13.01 | $22.82 |
| |
| Total Return(3) | 8.99% | (40.16)% | 6.04% |
| |
| Ratios/Supplemental Data | | | |
| Ratio of Operating Expenses to Average Net Assets | 2.01% | 2.00% | 2.00%(4) |
| Ratio of Net Investment Income (Loss) to Average Net Assets | (1.19)% | (1.47)% | (1.81)%(4) |
| Portfolio Turnover Rate | 155% | 172% | 128%(5) |
| Net Assets, End of Period (in thousands) | $3,425 | $1,770 | $83 |
| (1) | September 28, 2007 (commencement of sale) through October 31, 2007. |
| (2) | Computed using average shares outstanding throughout the period. |
| (3) | Total return assumes reinvestment of net investment income and capital gains distributions, if any, and does not reflect applicable sales charges. Total returns for periods less than one year are not annualized. The total return of the classes may not precisely reflect the class expense differences because of the impact of calculating the net asset values to two decimal places. If net asset values were calculated to three decimal places, the total return differences would more closely reflect the class expense differences. The calculation of net asset values to two decimal places is made in accordance with SEC guidelines and does not result in any gain or loss of value between one class and another. |
| (4) | Annualized. |
| (5) | Portfolio turnover is calculated at the fund level. Percentage indicated was calculated for the year ended October 31, 2007. |
See Notes to Financial Statements.
43
| | | | | |
| Heritage | | | | | |
| |
| C Class | | | | | |
| For a Share Outstanding Throughout the Years Ended October 31 | | | |
| | 2009 | 2008 | 2007 | 2006 | 2005 |
| Per-Share Data | | | | | |
| Net Asset Value, Beginning of Period | $12.13 | $21.35 | $14.77 | $12.91 | $10.41 |
| Income From Investment Operations | | | | | |
| Net Investment Income (Loss)(1) | (0.14) | (0.26) | (0.29) | (0.18) | (0.17) |
| Net Realized and Unrealized Gain (Loss) | 1.24 | (7.90) | 7.94 | 2.13 | 2.67 |
| Total From Investment Operations | 1.10 | (8.16) | 7.65 | 1.95 | 2.50 |
| Distributions | | | | | |
| From Net Investment Income | (0.02) | — | — | — | — |
| From Net Realized Gains | — | (1.06) | (1.07) | (0.09) | — |
| Total Distributions | (0.02) | (1.06) | (1.07) | (0.09) | — |
| Net Asset Value, End of Period | $13.21 | $12.13 | $21.35 | $14.77 | $12.91 |
| |
| Total Return(2) | 9.07% | (40.16)% | 54.88% | 15.11% | 24.02% |
| |
| Ratios/Supplemental Data | | | | | |
| Ratio of Operating Expenses | | | | | |
| to Average Net Assets | 2.01% | 2.00% | 2.00% | 2.00% | 2.00% |
| Ratio of Net Investment Income (Loss) | | | | | |
| to Average Net Assets | (1.19)% | (1.47)% | (1.56)% | (1.22)% | (1.46)% |
| Portfolio Turnover Rate | 155% | 172% | 128% | 230% | 236% |
| Net Assets, End of Period (in thousands) | $51,745 | $32,812 | $21,692 | $2,334 | $898 |
| (1) | Computed using average shares outstanding throughout the period. |
| (2) | Total return assumes reinvestment of net investment income and capital gains distributions, if any, and does not reflect applicable sales charges. The total return of the classes may not precisely reflect the class expense differences because of the impact of calculating the net asset values to two decimal places. If net asset values were calculated to three decimal places, the total return differences would more closely reflect the class expense differences. The calculation of net asset values to two decimal places is made in accordance with SEC guidelines and does not result in any gain or loss of value between one class and another. |
See Notes to Financial Statements.
44
| | | |
| Heritage | | | |
| |
| R Class | | | |
| For a Share Outstanding Throughout the Years Ended October 31 (except as noted) | | |
| | 2009 | 2008 | 2007(1) |
| Per-Share Data | | | |
| Net Asset Value, Beginning of Period | $13.08 | $22.83 | $21.52 |
| Income From Investment Operations | | | |
| Net Investment Income (Loss)(2) | (0.11) | (0.17) | (0.02) |
| Net Realized and Unrealized Gain (Loss) | 1.34 | (8.52) | 1.33 |
| Total From Investment Operations | 1.23 | (8.69) | 1.31 |
| Distributions | | | |
| From Net Investment Income | (0.07) | — | — |
| From Net Realized Gains | — | (1.06) | — |
| Total Distributions | (0.07) | (1.06) | — |
| Net Asset Value, End of Period | $14.24 | $13.08 | $22.83 |
| |
| Total Return(3) | 9.58% | (39.86)% | 6.09% |
| |
| Ratios/Supplemental Data | | | |
| Ratio of Operating Expenses to Average Net Assets | 1.51% | 1.50% | 1.50%(4) |
| Ratio of Net Investment Income (Loss) to Average Net Assets | (0.69)% | (0.97)% | (1.22)%(4) |
| Portfolio Turnover Rate | 155% | 172% | 128%(5) |
| Net Assets, End of Period (in thousands) | $4,775 | $496 | $27 |
| (1) | September 28, 2007 (commencement of sale) through October 31, 2007. |
| (2) | Computed using average shares outstanding throughout the period. |
| (3) | Total return assumes reinvestment of net investment income and capital gains distributions, if any. Total returns for periods less than one year are not annualized. The total return of the classes may not precisely reflect the class expense differences because of the impact of calculating the net asset values to two decimal places. If net asset values were calculated to three decimal places, the total return differences would more closely reflect the class expense differences. The calculation of net asset values to two decimal places is made in accordance with SEC guidelines and does not result in any gain or loss of value between one class and another. |
| (4) | Annualized. |
| (5) | Portfolio turnover is calculated at the fund level. Percentage indicated was calculated for the year ended October 31, 2007. |
See Notes to Financial Statements.
45
| | | | | |
| New Opportunities II | | | | | |
| |
| Investor Class | | | | | |
| For a Share Outstanding Throughout the Years Ended October 31 | | | |
| | 2009 | 2008 | 2007 | 2006 | 2005 |
| Per-Share Data | | | | | |
| Net Asset Value, Beginning of Period | $5.57 | $9.42 | $7.63 | $6.75 | $6.29 |
| Income From Investment Operations | | | | | |
| Net Investment Income (Loss)(1) | (0.02) | (0.04) | (0.05) | (0.06) | (0.06) |
| Net Realized and Unrealized Gain (Loss) | (0.08) | (3.73) | 2.52 | 1.16 | 0.69 |
| Total From Investment Operations | (0.10) | (3.77) | 2.47 | 1.10 | 0.63 |
| Distributions | | | | | |
| From Net Realized Gains | — | (0.08) | (0.68) | (0.22) | (0.17) |
| Net Asset Value, End of Period | $5.47 | $5.57 | $9.42 | $7.63 | $6.75 |
| |
| Total Return(2) | (1.80)% | (40.34)% | 35.22% | 16.52% | 10.14% |
| |
| Ratios/Supplemental Data | | | | | |
| Ratio of Operating Expenses | | | | | |
| to Average Net Assets | 1.41% | 1.36% | 1.41% | 1.50% | 1.50% |
| Ratio of Net Investment Income (Loss) | | | | | |
| to Average Net Assets | (0.40)% | (0.49)% | (0.70)% | (0.80)% | (0.93)% |
| Portfolio Turnover Rate | 204% | 148% | 204% | 299% | 269% |
| Net Assets, End of Period (in thousands) | $170,125 | $222,017 | $303,189 | $51,336 | $43,157 |
| (1) | Computed using average shares outstanding throughout the period. |
| (2) | Total return assumes reinvestment of net investment income and capital gains distributions, if any. The total return of the classes may not precisely reflect the class expense differences because of the impact of calculating the net asset values to two decimal places. If net asset values were calculated to three decimal places, the total return differences would more closely reflect the class expense differences. The calculation of net asset values to two decimal places is made in accordance with SEC guidelines and does not result in any gain or loss of value between one class and another. |
See Notes to Financial Statements.
46
| | | |
| New Opportunities II | | | |
| |
| Institutional Class | | | |
| For a Share Outstanding Throughout the Years Ended October 31 (except as noted) | | |
| | 2009 | 2008 | 2007(1) |
| Per-Share Data | | | |
| Net Asset Value, Beginning of Period | $5.59 | $9.43 | $8.27 |
| Income From Investment Operations | | | |
| Net Investment Income (Loss)(2) | (0.01) | (0.02) | (0.03) |
| Net Realized and Unrealized Gain (Loss) | (0.09) | (3.74) | 1.19 |
| Total From Investment Operations | (0.10) | (3.76) | 1.16 |
| Distributions | | | |
| Return of capital | — | (0.08) | — |
| Net Asset Value, End of Period | $5.49 | $5.59 | $9.43 |
| |
| Total Return(3) | (1.79)% | (40.19)% | 14.03% |
| |
| Ratios/Supplemental Data | | | |
| Ratio of Operating Expenses to Average Net Assets | 1.21% | 1.16% | 1.21%(4) |
| Ratio of Net Investment Income (Loss) to Average Net Assets | (0.20)% | (0.29)% | (0.65)%(4) |
| Portfolio Turnover Rate | 204% | 148% | 204%(5) |
| Net Assets, End of Period (in thousands) | $108,261 | $91,791 | $18,384 |
| (1) | May 18, 2007 (commencement of sale) through October 31, 2007. |
| (2) | Computed using average shares outstanding throughout the period. |
| (3) | Total return assumes reinvestment of net investment income and capital gains distributions, if any. Total returns for periods less than one year are not annualized. The total return of the classes may not precisely reflect the class expense differences because of the impact of calculating the net asset values to two decimal places. If net asset values were calculated to three decimal places, the total return differences would more closely reflect the class expense differences. The calculation of net asset values to two decimal places is made in accordance with SEC guidelines and does not result in any gain or loss of value between one class and another. |
| (4) | Annualized. |
| (5) | Portfolio turnover is calculated at the fund level. Percentage indicated was calculated for the year ended October 31, 2007 |
See Notes to Financial Statements.
47
| | | | | |
| New Opportunities II | | | | | |
| |
| A Class | | | | | |
| For a Share Outstanding Throughout the Years Ended October 31 | | | |
| | 2009 | 2008 | 2007 | 2006 | 2005 |
| Per-Share Data | | | | | |
| Net Asset Value, Beginning of Period | $5.53 | $9.37 | $7.59 | $6.72 | $6.26 |
| Income From Investment Operations | | | | | |
| Net Investment Income (Loss)(1) | (0.03) | (0.06) | (0.07) | (0.08) | (0.08) |
| Net Realized and Unrealized Gain (Loss) | (0.09) | (3.70) | 2.51 | 1.16 | 0.70 |
| Total From Investment Operations | (0.12) | (3.76) | 2.44 | 1.08 | 0.62 |
| Distributions | | | | | |
| From Net Realized Gains | — | (0.08) | (0.66) | (0.21) | (0.16) |
| Net Asset Value, End of Period | $5.41 | $5.53 | $9.37 | $7.59 | $6.72 |
| |
| Total Return(2) | (2.17)% | (40.45)% | 34.91% | 16.22% | 9.91% |
| |
| Ratios/Supplemental Data | | | | | |
| Ratio of Operating Expenses | | | | | |
| to Average Net Assets | 1.66% | 1.61% | 1.66% | 1.75% | 1.75% |
| Ratio of Net Investment Income (Loss) | | | | | |
| to Average Net Assets | (0.65)% | (0.74)% | (0.95)% | (1.05)% | (1.18)% |
| Portfolio Turnover Rate | 204% | 148% | 204% | 299% | 269% |
| Net Assets, End of Period (in thousands) | $114,026 | $129,791 | $202,515 | $73,383 | $47,937 |
| (1) | Computed using average shares outstanding throughout the period. |
| (2) | Total return assumes reinvestment of net investment income and capital gains distributions, if any, and does not reflect applicable sales charges. The total return of the classes may not precisely reflect the class expense differences because of the impact of calculating the net asset values to two decimal places. If net asset values were calculated to three decimal places, the total return differences would more closely reflect the class expense differences. The calculation of net asset values to two decimal places is made in accordance with SEC guidelines and does not result in any gain or loss of value between one class and another. |
See Notes to Financial Statements.
48
| | | | | |
| New Opportunities II | | | | | |
| |
| B Class | | | | | |
| For a Share Outstanding Throughout the Years Ended October 31 | | | |
| | 2009 | 2008 | 2007 | 2006 | 2005 |
| Per-Share Data | | | | | |
| Net Asset Value, Beginning of Period | $5.41 | $9.25 | $7.49 | $6.63 | $6.18 |
| Income From Investment Operations | | | | | |
| Net Investment Income (Loss)(1) | (0.07) | (0.11) | (0.13) | (0.14) | (0.13) |
| Net Realized and Unrealized Gain (Loss) | (0.08) | (3.65) | 2.49 | 1.15 | 0.69 |
| Total From Investment Operations | (0.15) | (3.76) | 2.36 | 1.01 | 0.56 |
| Distributions | | | | | |
| From Net Realized Gains | — | (0.08) | (0.60) | (0.15) | (0.11) |
| Net Asset Value, End of Period | $5.26 | $5.41 | $9.25 | $7.49 | $6.63 |
| |
| Total Return(2) | (2.77)% | (40.97)% | 33.84% | 15.46% | 9.03% |
| |
| Ratios/Supplemental Data | | | | | |
| Ratio of Operating Expenses | | | | | |
| to Average Net Assets | 2.41% | 2.36% | 2.41% | 2.50% | 2.50% |
| Ratio of Net Investment Income (Loss) | | | | | |
| to Average Net Assets | (1.40)% | (1.49)% | (1.70)% | (1.80)% | (1.93)% |
| Portfolio Turnover Rate | 204% | 148% | 204% | 299% | 269% |
| Net Assets, End of Period (in thousands) | $2,976 | $2,846 | $4,549 | $3,383 | $2,367 |
| (1) | Computed using average shares outstanding throughout the period. |
| (2) | Total return assumes reinvestment of net investment income and capital gains distributions, if any, and does not reflect applicable sales charges. The total return of the classes may not precisely reflect the class expense differences because of the impact of calculating the net asset values to two decimal places. If net asset values were calculated to three decimal places, the total return differences would more closely reflect the class expense differences. The calculation of net asset values to two decimal places is made in accordance with SEC guidelines and does not result in any gain or loss of value between one class and another. |
See Notes to Financial Statements.
49
| | | | | |
| New Opportunities II | | | | | |
| |
| C Class | | | | | |
| For a Share Outstanding Throughout the Years Ended October 31 | | | |
| | 2009 | 2008 | 2007 | 2006 | 2005 |
| Per-Share Data | | | | | |
| Net Asset Value, Beginning of Period | $5.44 | $9.29 | $7.52 | $6.66 | $6.20 |
| Income From Investment Operations | | | | | |
| Net Investment Income (Loss)(1) | (0.07) | (0.11) | (0.13) | (0.14) | (0.13) |
| Net Realized and Unrealized Gain (Loss) | (0.09) | (3.66) | 2.50 | 1.15 | 0.70 |
| Total From Investment Operations | (0.16) | (3.77) | 2.37 | 1.01 | 0.57 |
| Distributions | | | | | |
| From Net Realized Gains | — | (0.08) | (0.60) | (0.15) | (0.11) |
| Net Asset Value, End of Period | $5.28 | $5.44 | $9.29 | $7.52 | $6.66 |
| |
| Total Return(2) | (2.94)% | (40.91)% | 34.02% | 15.24% | 9.16% |
| |
| Ratios/Supplemental Data | | | | | |
| Ratio of Operating Expenses | | | | | |
| to Average Net Assets | 2.41% | 2.36% | 2.41% | 2.50% | 2.50% |
| Ratio of Net Investment Income (Loss) | | | | | |
| to Average Net Assets | (1.40)% | (1.49)% | (1.70)% | (1.80)% | (1.93)% |
| Portfolio Turnover Rate | 204% | 148% | 204% | 299% | 269% |
| Net Assets, End of Period (in thousands) | $11,608 | $12,983 | $16,406 | $4,424 | $3,414 |
| (1) | Computed using average shares outstanding throughout the period. |
| (2) | Total return assumes reinvestment of net investment income and capital gains distributions, if any, and does not reflect applicable sales charges. The total return of the classes may not precisely reflect the class expense differences because of the impact of calculating the net asset values to two decimal places. If net asset values were calculated to three decimal places, the total return differences would more closely reflect the class expense differences. The calculation of net asset values to two decimal places is made in accordance with SEC guidelines and does not result in any gain or loss of value between one class and another. |
See Notes to Financial Statements.
50
| | | |
| New Opportunities II | | | |
| |
| R Class | | | |
| For a Share Outstanding Throughout the Years Ended October 31 (except as noted) | | |
| | 2009 | 2008 | 2007(1) |
| Per-Share Data | | | |
| Net Asset Value, Beginning of Period | $5.54 | $9.42 | $9.02 |
| Income From Investment Operations | | | |
| Net Investment Income (Loss)(2) | (0.06) | (0.06) | (0.01) |
| Net Realized and Unrealized Gain (Loss) | (0.07) | (3.74) | 0.41 |
| Total From Investment Operations | (0.13) | (3.80) | 0.40 |
| Distributions | | | |
| From Net Realized Gains | – | (0.08) | – |
| Net Asset Value, End of Period | $5.41 | $5.54 | $9.42 |
| |
| Total Return(3) | (2.35)% | (40.66)% | 4.43% |
| |
| Ratios/Supplemental Data | | | |
| Ratio of Operating Expenses to Average Net Assets | 1.91% | 1.86% | 1.91%(4) |
| Ratio of Net Investment Income (Loss) to Average Net Assets | (0.90)% | (0.99)% | (1.61)%(4) |
| Portfolio Turnover Rate | 204% | 148% | 204%(5) |
| Net Assets, End of Period (in thousands) | $545 | $108 | $26 |
| (1) | September 28, 2007 (commencement of sale) through October 31, 2007. |
| (2) | Computed using average shares outstanding throughout the period. |
| (3) | Total return assumes reinvestment of net investment income and capital gains distributions, if any. Total returns for periods less than one year are not annualized. The total return of the classes may not precisely reflect the class expense differences because of the impact of calculating the net asset values to two decimal places. If net asset values were calculated to three decimal places, the total return differences would more closely reflect the class expense differences. The calculation of net asset values to two decimal places is made in accordance with SEC guidelines and does not result in any gain or loss of value between one class and another. |
| (4) | Annualized. |
| (5) | Portfolio turnover is calculated at the fund level. Percentage indicated was calculated for the year ended October 31, 2007. |
See Notes to Financial Statements.
51
|
| Report of Independent Registered Public Accounting Firm |
The Board of Directors and Shareholders,
American Century Mutual Funds, Inc.:
We have audited the accompanying statements of assets and liabilities, including the schedules of investments, of Heritage Fund and New Oppor tunities II Fund, two of the funds constituting American Century Mutual Funds, Inc. (the “Corporation”), as of October 31, 2009, and the related statements of operations for the year then ended, the statements of changes in net assets for each of the two years in the period then ended, and the financial highlights for each of the five years in the period then ended. These financial statements and financial highlights are the responsibility of the Corporation’s management. Our responsibility is to express an opinion on these financial statements and financial highlights based on our audits.
We conducted our audits in accordance with the standards of the Public Company Accounting Oversight Board (United States). Those standards require that we plan and perform the audit to obtain reasonable assurance about whether the financial statements and financial highlights are free of material misstatement. The Corporation is not required to have, nor were we engaged to perform, an audit of its internal control over financial reporting. Our audits included consideration of internal control over finan cial reporting as a basis for designing audit procedures that are appropriate in the circumstances, but not for the purpose of expressing an opinion on the effectiveness of the Corporation’s internal control over financial reporting. Accordingly, we express no such opinion. An audit also includes examining, on a test basis, evidence supporting the amounts and disclosures in the financial statements, assessing the accounting principles used and significant estimates made by management, as well as evaluating the overall financial statement presentation. Our procedures included confirma tion of securities owned as of October 31, 2009, by correspondence with the custodian and brokers; where replies were not received from brokers, we performed other auditing procedures. We believe that our audits provide reasonable basis for our opinion.
In our opinion, the financial statements and financial highlights referred to above present fairly, in all material respects, the respective financial positions of Heritage Fund and New Opportunities II Fund of American Century Mutual Funds, Inc., as of October 31, 2009, the results of their oper ations for the year then ended, the changes in their net assets for each of two years in the period then ended, and the financial highlights for each of the five years in the period then ended, in conformity with accounting principles generally accepted in the United States of America.
Deloitte & Touche LLP
Kansas City, Missouri
December 28, 2009
52
The individuals listed below serve as directors or officers of the funds. Each director serves until his or her successor is duly elected and qualified or until he or she retires. Mandatory retirement age for independent directors is 72. Those listed as interested directors are “interested” primarily by virtue of their engagement as directors and/or officers of, or ownership interest in, American Century Companies, Inc. (ACC) or its wholly owned, direct or indirect, subsidiaries, including the funds’ investment advisor, American Century Investment Management, Inc. (ACIM); the funds’ principal underwriter, American Century Investment Services, Inc. (ACIS); and the funds’ transfer agent, American Century Services, LLC (ACS).
The other directors (more than three-fourths of the total number) are independent; that is, they have never been employees, directors or officers of, and have no financial interest in, ACC or any of its wholly owned, direct or indirect, subsidiaries, including ACIM, ACIS and ACS. The directors serve in this capacity for seven registered investment companies in the American Century Investments family of funds.
All persons named as officers of the funds also serve in similar capacities for the other 14 registered investment companies in the American Century Investments family of funds advised by ACIM or American Century Global Investment Management, Inc. (ACGIM), a wholly owned subsidiary of ACIM, unless otherwise noted. Only officers with policy-making functions are listed. No officer is compensated for his or her service as an officer of the funds. The listed officers are interested persons of the funds and are appointed or re-appointed on an annual basis.
Interested Director
Jonathan S. Thomas, 4500 Main Street, Kansas City, MO 64111
Year of Birth: 1963
Position(s) Held with Funds: Director (since 2007) and President (since 2007)
Principal Occupation(s) During Past 5 Years: President and Chief Executive Officer, ACC
(March 2007 to present); Chief Administrative Officer, ACC (February 2006 to
February 2007); Executive Vice President, ACC (November 2005 to February 2007).
Also serves as: President, Chief Executive Officer and Director, ACS; Executive
Vice President, ACIM and ACGIM; Director, ACIM, ACGIM, ACIS and other ACC
subsidiaries. Managing Director, Morgan Stanley (March 2000 to November 2005)
Number of Portfolios in Fund Complex Overseen by Director: 103
Other Directorships Held by Director: None
Independent Directors
Thomas A. Brown, 4500 Main Street, Kansas City, MO 64111
Year of Birth: 1940
Position(s) Held with Funds: Director (since 1980)
Principal Occupation(s) During Past 5 Years: Managing Member, Associated Investments, LLC
(real estate investment company); Managing Member, Brown Cascade Properties,
LLC (real estate investment company); Retired, Area Vice President, Applied
Industrial Technologies (bearings and power transmission company)
Number of Portfolios in Fund Complex Overseen by Director: 63
Other Directorships Held by Director: None
53
Andrea C. Hall, Ph.D., 4500 Main Street, Kansas City, MO 64111
Year of Birth: 1945
Position(s) Held with Funds: Director (since 1997)
Principal Occupation(s) During Past 5 Years: Retired, Advisor to the President, Midwest
Research Institute (not-for-profit, contract research organization)
Number of Portfolios in Fund Complex Overseen by Director: 63
Other Directorships Held by Director: None
James A. Olson, 4500 Main Street, Kansas City, MO 64111
Year of Birth: 1942
Position(s) Held with Funds: Director (since 2007)
Principal Occupation(s) During Past 5 Years: Member, Plaza Belmont LLC (private equity
fund manager); Chief Financial Officer, Plaza Belmont LLC (September 1999 to
September 2006)
Number of Portfolios in Fund Complex Overseen by Director: 63
Other Directorships Held by Director: Saia, Inc. and Entertainment Properties Trust
Donald H. Pratt, 4500 Main Street, Kansas City, MO 64111
Year of Birth: 1937
Position(s) Held with Funds: Director (since 1995) and Chairman of the Board (since 2005)
Principal Occupation(s) During Past 5 Years: Chairman and Chief Executive Officer, Western
Investments, Inc. (real estate company); Retired Chairman of the Board, Butler
Manufacturing Company (metal buildings producer)
Number of Portfolios in Fund Complex Overseen by Director: 63
Other Directorships Held by Director: None
Gale E. Sayers, 4500 Main Street, Kansas City, MO 64111
Year of Birth: 1943
Position(s) Held with Funds: Director (since 2000)
Principal Occupation(s) During Past 5 Years: President, Chief Executive Officer and Founder,
Sayers40, Inc. (technology products and services provider)
Number of Portfolios in Fund Complex Overseen by Director: 63
Other Directorships Held by Director: None
M. Jeannine Strandjord, 4500 Main Street, Kansas City, MO 64111
Year of Birth: 1945
Position(s) Held with Funds: Director (since 1994)
Principal Occupation(s) During Past 5 Years: Retired, formerly Senior Vice President, Sprint
Corporation (telecommunications company)
Number of Portfolios in Fund Complex Overseen by Director: 63
Other Directorships Held by Director: DST Systems, Inc.; Euronet Worldwide, Inc. and
Charming Shoppes, Inc.
John R. Whitten, 4500 Main Street, Kansas City, MO 64111
Year of Birth: 1946
Position(s) Held with Funds: Director (since 2008)
Principal Occupation(s) During Past 5 Years: Project Consultant, Celanese Corp. (industrial
chemical company) (September 2004 to January 2005)
Number of Portfolios in Fund Complex Overseen by Director: 63
Other Directorships Held by Director: Rudolph Technologies, Inc.
54
Officers
Barry Fink, 4500 Main Street, Kansas City, MO 64111
Year of Birth: 1955
Position(s) Held with Funds: Executive Vice President (since 2007)
Principal Occupation(s) During Past 5 Years: Chief Operating Officer and Executive Vice
President, ACC (September 2007 to present); President, ACS (October 2007 to
present); Managing Director, Morgan Stanley (2000 to 2007); Global General
Counsel, Morgan Stanley (2000 to 2006). Also serves as: Director, ACC, ACS, ACIS
and other ACC subsidiaries
Maryanne Roepke, 4500 Main Street, Kansas City, MO 64111
Year of Birth: 1956
Position(s) Held with Funds: Chief Compliance Officer (since 2006) and Senior Vice
President (since 2000)
Principal Occupation(s) During Past 5 Years: Chief Compliance Officer, ACIM, ACGIM and ACS
(August 2006 to present); Assistant Treasurer, ACC (January 1995 to August 2006); and
Treasurer and Chief Financial Officer, various American Century Investments funds
(July 2000 to August 2006). Also serves as: Senior Vice President, ACS
Charles A. Etherington, 4500 Main Street, Kansas City, MO 64111
Year of Birth: 1957
Position(s) Held with Funds: General Counsel (since 2007) and Senior Vice President
(since 2006)
Principal Occupation(s) During Past 5 Years: Attorney, ACC (February 1994 to present); Vice
President, ACC (November 2005 to present); General Counsel, ACC (March 2007
to present). Also serves as: General Counsel, ACIM, ACGIM, ACS, ACIS and other
ACC subsidiaries; and Senior Vice President, ACIM, ACGIM and ACS
Robert Leach, 4500 Main Street, Kansas City, MO 64111
Year of Birth: 1966
Position(s) Held with Funds: Vice President, Treasurer and Chief Financial Officer (all
since 2006)
Principal Occupation(s) During Past 5 Years: Vice President, ACS (February 2000 to present); and
Controller, various American Century Investments funds (1997 to September 2006)
David H. Reinmiller, 4500 Main Street, Kansas City, MO 64111
Year of Birth: 1963
Position(s) Held with Funds: Vice President (since September 2000)
Principal Occupation(s) During Past 5 Years: Attorney, ACC (January 1994 to present);
Associate General Counsel, ACC (January 2001 to present); Chief Compliance
Officer, American Century Investments funds, ACIM and ACGIM (January 2001 to
February 2005). Also serves as: Associate General Counsel, ACIM, ACGIM, ACS,
ACIS and other ACC subsidiaries; and Vice President, ACIM, ACGIM and ACS
Ward Stauffer, 4500 Main Street, Kansas City, MO 64111
Year of Birth: 1960
Position(s) Held with Funds: Secretary (since February 2005)
Principal Occupation(s) During Past 5 Years: Attorney, ACC (June 2003 to present)
The SAI has additional information about the funds’ directors and is available without charge, upon request, by calling 1-800-345-2021.
55
|
| Approval of Management Agreements |
Under Section 15(c) of the Investment Company Act, contracts for investment advisory services are required to be reviewed, evaluated and approved by a majority of a fund’s independent directors (the “Directors”) each year. At American Century Investments, this process is referred to as the “15(c) Process.” As a part of this process, the board reviews fund performance, shareholder services, audit and compliance information, and a variety of other reports from the advisor concerning fund operations. In addition to this annual review, the board of directors oversees and evaluates on a continuous basis at its quarterly meetings the nature and quality of significant services performed by the advisor, fund performance, audit and compliance information, and a variety of other reports relating to fund operations. The board, or committees of the board, also holds special meetings as needed.
Under a Securities and Exchange Commission rule, each fund is required to disclose in its annual or semiannual report, as appropriate, the material factors and conclusions that formed the basis for the board’s approval or renewal of any advisory agreements within the fund’s most recently completed fiscal half-year period.
Annual Contract Review Process
As part of the annual 15(c) Process undertaken during the most recent fiscal half-year period, the Directors reviewed extensive data and information compiled by the advisor and certain independent providers of evaluative data (the “15(c) Providers”) concerning Heritage and New Opportunities II (the “Funds”) and the services provided to the Funds under the management agreement. The information considered and the discussions held at the meetings included, but were not limited to:
• the nature, extent and quality of investment management, shareholder services and other services provided to the Funds;
• the wide range of programs and services the advisor provides to the Funds and their shareholders on a routine and non-routine basis;
• the compliance policies, procedures, and regulatory experience of the advisor;
• data comparing the cost of owning the Funds to the cost of owning a similar fund;
• data comparing the Funds’ performance to appropriate benchmarks and/or a peer group of other mutual funds with similar investment objectives and strategies;
• financial data showing the profitability of the Funds to the advisor and the overall profitability of the advisor;
• data comparing services provided and charges to other investment management clients of the advisor; and
• consideration of collateral benefits derived by the advisor from the management of the Funds and any potential economies of scale relating thereto.
56
In keeping with its practice, the Funds’ board of directors held two in-person meetings and one telephonic meeting to review and discuss the information provided. The board also had the benefit of the advice of its independent counsel throughout the period.
Factors Considered
The Directors considered all of the information provided by the advisor, the 15(c) Providers, and the board’s independent counsel, and evaluated such information for each fund for which the board has responsibility. In connection with their review of the Funds, the Directors did not identify any single factor as being all-important or controlling, and each Director may have attributed different levels of importance to different factors. In deciding to renew the management and subadvisory agreements under the terms ultimately determined by the board to be appropriate, the Directors’ decision was based on the following factors.
Nature, Extent and Quality of Services — Generally. Under the management agreement, the advisor is responsible for providing or arranging for all services necessary for the operation of the Funds. The board noted that under the management agreement, the advisor provides or arranges at its own expense a wide variety of services including:
• Fund construction and design
• portfolio security selection
• initial capitalization/funding
• securities trading
• Fund administration
• custody of Fund assets
• daily valuation of each Fund’s portfolio
• shareholder servicing and transfer agency, including shareholder confirmations, recordkeeping and communications
• legal services
• regulatory and portfolio compliance
• financial reporting
• marketing and distribution
The Directors noted that many of the services provided by the advisor have expanded over time both in terms of quantity and complexity in response to shareholder demands, competition in the industry and the changing regulatory environment. They discussed with the advisor the challenges
57
presented by these changes and the impact on the Funds. In performing their evaluation, the Directors considered information received in connection with the annual review, as well as information provided on an ongoing basis at their regularly scheduled board and committee meetings.
Investment Management Services. The nature of the investment management services provided to the Funds is quite complex and allows Fund shareholders access to professional money management, instant diversification of their investments, and liquidity. In evaluating investment performance, the board expects the advisor to manage the Funds in accordance with its investment objectives and approved strategies. Further, the Directors recognize that the advisor has an obligation to monitor trading activities, and in particular to seek the best execution of fund trades, and to evaluate the use of and payment for research. In providing these services, the advisor utilizes teams of investment professionals (portfolio managers, analysts, research assistants, and securities traders) who require extensive information technology, research, training, com pliance and other systems to conduct their business. At each quarterly meeting the Directors review investment performance information for the Funds, together with comparative information for appropriate benchmarks and/or peer groups of funds managed similarly to the Funds. The Directors also review detailed performance information during the 15(c) Process comparing each Fund’s performance with that of similar funds not managed by the advisor. If performance concerns are identified, the Directors discuss with the advisor the reasons for such results (e.g., market conditions, security selection) and any efforts being undertaken to improve performance. Each Fund’s performance was above the median for its respective peer group for the three-year period and below the median for the one-year period.
Shareholder and Other Services. The advisor provides the Funds with a comprehensive package of transfer agency, shareholder, and other services. The Directors review reports and evaluations of such services at their regular quarterly meetings, including the annual meeting concerning contract review, and reports to the board. These reports include, but are not limited to, information regarding the operational efficiency and accuracy of the shareholder and transfer agency services provided, staffing levels, shareholder satisfaction (as measured by external as well as internal sources), technology support, new products and services offered to Fund shareholders, securities trading activities, portfolio valuation services, auditing services, and legal and operational compliance activities. Certain aspects of shareholder and transfer agency serv ice level efficiency and the quality of securities trading activities are measured by independent third party providers and are presented in comparison to other fund groups not managed by the advisor.
Costs of Services Provided and Profitability. The advisor provides detailed information concerning its cost of providing various services to the Funds, its profitability in managing the Funds, its overall profitability, and its financial condition. The Directors have reviewed with the advisor the methodology used to prepare this financial information. This financial information regarding the advisor is considered in order to evaluate the advisor’s
58
financial condition, its ability to continue to provide services under the management agreement, and the reasonableness of the current management fee. The board concluded that the advisor’s profits were reasonable in light of the services provided to the Funds.
Ethics. The Directors generally consider the advisor’s commitment to providing quality services to shareholders and to conducting its business ethically. They noted that the advisor’s practices generally meet or exceed industry best practices.
Economies of Scale. The Directors review information provided by the advisor regarding the possible existence of economies of scale in connection with the management of the Funds. The Directors concluded that economies of scale are difficult to measure and predict with precision, especially on a fund-by-fund basis. The analysis of economies of scale is further complicated by the additional services and content provided by the advisor and its reinvestment in its ability to provide and expand those services. Accordingly, the Directors seek to evaluate economies of scale by reviewing other information, such as year-over-year profitability of the advisor generally, the profitability of its management of the Funds specifically, the expenses incurred by the advisor in providing various functions to the Funds, and the fees of competitive funds no t managed by the advisor. The Directors believe the advisor is appropriately sharing economies of scale through its competitive fee structure, fee breakpoints as each Fund increases in size, and through reinvestment in its business to provide shareholders additional content and services.
Comparison to Other Funds’ Fees. The Funds pay the advisor a single, all-inclusive (or unified) management fee for providing all services necessary for the management and operation of the Funds, other than brokerage expenses, taxes, interest, extraordinary expenses, and the fees and expenses of each Fund’s independent directors (including their independent legal counsel). Under the unified fee structure, the advisor is responsible for providing all investment advisory, custody, audit, administrative, compliance, record-keeping, marketing and shareholder services, or arranging and supervising third parties to provide such services. By contrast, most other funds are charged a variety of fees, including an investment advisory fee, a transfer agency fee, an administrative fee, distribution charges and other expenses. Other than their investment advisory fees and Rule 12b-1 distribution fees, all other components of the total fees charged by these other funds may be increased without shareholder approval. The board believes the unified fee structure is a benefit to Fund shareholders because it clearly discloses to shareholders the cost of owning Fund shares, and, since the unified fee cannot be increased without a vote of Fund shareholders, it shifts to the advisor the risk of increased costs of operating the Funds and provides a direct incentive to minimize administrative inefficiencies. Part of the Directors’ analysis of fee levels involves reviewing certain evaluative data compiled by a 15(c) Provider comparing each Fund’s unified fee to the total expense ratio of other funds in the Funds’ peer group and performing a regression analysis to evaluate the effect of fee breakpoints as assets under management increase. The unified fee charged to shareholders of Heritage
59
was below the median of the total expense ratios of its peer group. The unified fee charged to shareholders of New Opportunities II was slightly above the median of the total expense ratios of its peer group. In addition, the Directors also reviewed updated fee level data provided by the advisor, but recognized that comparative data was particularly difficult to evaluate given the significant market developments during the past year. The board concluded that the management fee paid by each Fund to the advisor was reasonable in light of the services provided to the Funds.
Comparison to Fees and Services Provided to Other Clients of the Advisor. The Directors also requested and received information from the advisor concerning the nature of the services, fees, and profitability of its advisory services to advisory clients other than the Funds. They observed that these varying types of client accounts require different services and involve different regulatory and entrepreneurial risks than the management of the Funds. The Directors analyzed this information and concluded that the fees charged and services provided to the Funds were reasonable by comparison.
Collateral Benefits Derived by the Advisor. The Directors considered the existence of collateral benefits the advisor may receive as a result of its relationship with the Funds. They concluded that the advisor’s primary business is managing mutual funds and it generally does not use fund or shareholder information to generate profits in other lines of business, and therefore does not derive any significant collateral benefits from them. The Directors noted that the advisor receives proprietary research from broker-dealers that execute fund portfolio transactions and concluded that this research is likely to benefit fund shareholders. The Directors also determined that the advisor is able to provide investment management services to certain clients other than the Funds, at least in part, due to its existing infrastructure built to serv e the fund complex. The Directors concluded, however, that the assets of those other clients are not material to the analysis and, in any event, are included with the assets of the Funds to determine breakpoints in each Fund’s fee schedule, provided they are managed using the same investment team and strategy.
Conclusions of the Directors
As a result of this process, the board, including all of the independent directors, in the absence of particular circumstances and assisted by the advice of legal counsel that is independent of the advisor, taking into account all of the factors discussed above and the information provided by the advisor concluded that the investment management agreement between each Fund and the advisor is fair and reasonable in light of the services provided and should be renewed.
60
Retirement Account Information
As required by law, distributions you receive from certain IRAs, or 403(b), 457 and qualified plans are subject to federal income tax withholding, unless you elect not to have withholding apply. Tax will be withheld on the total amount withdrawn even though you may be receiving amounts that are not subject to withholding, such as nondeductible contributions. In such case, excess amounts of withholding could occur. You may adjust your withholding election so that a greater or lesser amount will be withheld.
If you don’t want us to withhold on this amount, you must notify us to not withhold the federal income tax. You may notify us in writing or in certain situations by telephone or through other electronic means. You have the right to revoke your withholding election at any time and any election you make may remain in effect until revoked by filing a new election.
Remember, even if you elect not to have income tax withheld, you are liable for paying income tax on the taxable portion of your withdrawal. If you elect not to have income tax withheld or you don’t have enough income tax withheld, you may be responsible for payment of estimated tax. You may incur penalties under the estimated tax rules if your withholding and estimated tax payments are not sufficient. You can reduce or defer the income tax on a distribution by directly or indirectly rolling such distribution over to another IRA or eligible plan. You should consult your tax advisor for additional information.
State tax will be withheld if, at the time of your distribution, your address is within one of the mandatory withholding states and you have federal income tax withheld. State taxes will be withheld from your distribution in accordance with the respective state rules.
Proxy Voting Guidelines
American Century Investment Management, Inc., the funds’ investment advisor, is responsible for exercising the voting rights associated with the securities purchased and/or held by the funds. A description of the policies and procedures the advisor uses in fulfilling this responsibility is available without charge, upon request, by calling 1-800-345-2021. It is also available on American Century Investments’ website at americancentury.com and on the Securities and Exchange Commission’s website at sec.gov. Information regarding how the investment advisor voted proxies relating to portfolio securities during the most recent 12-month period ended June 30 is available on the “About Us” page at americancentury.com. It is also available at sec.gov.
Quarterly Portfolio Disclosure
The funds file their complete schedule of portfolio holdings with the Securities and Exchange Commission (SEC) for the first and third quarters of each fiscal year on Form N-Q. The funds’ Forms N-Q are available on the SEC’s website at sec.gov, and may be reviewed and copied at the SEC’s Public Reference Room in Washington, DC. Information on the operation of the Public Reference Room may be obtained by calling 1-800-SEC-0330. The funds also make their complete schedule of portfolio holdings for the most recent quarter of their fiscal year available on their website at americancentury.com and, upon request, by calling 1-800-345-2021.
61
The following indices are used to illustrate investment market, sector, or style performance or to serve as fund performance comparisons. They are not investment products available for purchase.
The Russell 1000® Index is a market-capitalization weighted, large-cap index created by Frank Russell Company to measure the performance of the 1,000 largest publicly traded U.S. companies, based on total market capitalization.
The Russell 1000® Growth Index measures the performance of those Russell 1000 Index companies (the 1,000 largest publicly traded U.S. companies, based on total market capitalization) with higher price-to-book ratios and higher forecasted growth values.
The Russell 1000® Value Index measures the performance of those Russell 1000 Index companies (the 1,000 largest publicly traded U.S. companies, based on total market capitalization) with lower price-to-book ratios and lower forecasted growth values.
The Russell 2000® Index is a market-capitalization weighted index created by Frank Russell Company to measure the performance of the 2,000 smallest of the 3,000 largest publicly traded U.S. companies, based on total market capitalization.
The Russell 2000® Growth Index measures the performance of those Russell 2000 Index companies (the 2,000 smallest of the 3,000 largest publicly traded U.S. companies, based on total market capitalization) with higher price-to-book ratios and higher forecasted growth values.
The Russell 2000® Value Index measures the performance of those Russell 2000 Index companies (the 2,000 smallest of the 3,000 largest publicly traded U.S. companies, based on total market capitalization) with lower price-to-book ratios and lower forecasted growth values.
The Russell Midcap® Index measures the performance of the 800 smallest of the 1,000 largest publicly traded U.S. companies, based on total market capitalization.
The Russell Midcap® Growth Index measures the performance of those Russell Midcap Index companies (the 800 smallest of the 1,000 largest publicly traded U.S. companies, based on total market capitalization) with higher price-to-book ratios and higher forecasted growth values.
The Russell Midcap® Value Index measures the performance of those Russell Midcap Index companies (the 800 smallest of the 1,000 largest publicly traded U.S. companies, based on total market capitalization) with lower price-to-book ratios and lower forecasted growth values.
62
63
64

| |
| |
| Contact Us | |
| americancentury.com | |
| Automated Information Line | 1-800-345-8765 |
| Investor Services Representative | 1-800-345-2021 or |
| | 816-531-5575 |
| Investors Using Advisors | 1-800-378-9878 |
| Business, Not-For-Profit, Employer-Sponsored | |
| Retirement Plans | 1-800-345-3533 |
| Banks and Trust Companies, Broker-Dealers, | |
| Financial Professionals, Insurance Companies | 1-800-345-6488 |
| Telecommunications Device for the Deaf | 1-800-634-4113 |
| American Century Mutual Funds, Inc. | |
| Investment Advisor: | |
| American Century Investment Management, Inc. | |
| Kansas City, Missouri | |
| This report and the statements it contains are submitted for the general |
| information of our shareholders. The report is not authorized for distribution to |
| prospective investors unless preceded or accompanied by an effective prospectus. |
American Century Investment Services, Inc., Distributor
©2009 American Century Proprietary Holdings, Inc. All rights reserved.
0912
CL-ANN-67038N
|
| Annual Report |
| October 31, 2009 |

|
| American Century Investments |
New Opportunities Fund
| |
| President’s Letter | 2 |
| Independent Chairman’s Letter | 3 |
| Market Perspective | 4 |
| U.S. Stock Index Returns | 4 |
| |
| New Opportunities | |
| |
| Performance | 5 |
| Portfolio Commentary | 7 |
| Top Ten Holdings | 9 |
| Top Five Industries | 9 |
| Types of Investments in Portfolio | 9 |
| |
| Shareholder Fee Example | 10 |
| |
| Financial Statements | |
| |
| Schedule of Investments | 12 |
| Statement of Assets and Liabilities | 16 |
| Statement of Operations | 17 |
| Statement of Changes in Net Assets | 18 |
| Notes to Financial Statements | 19 |
| Financial Highlights | 24 |
| Report of Independent Registered Public Accounting Firm | 25 |
| |
| Other Information | |
| |
| Management | 26 |
| Approval of Management Agreement | 29 |
| Additional Information | 34 |
| Index Definitions | 35 |
The opinions expressed in the Market Perspective and the Portfolio Commentary reflect those of the portfolio management team as of the date of the report, and do not necessarily represent the opinions of American Century Investments or any other person in the American Century Investments organization. Any such opinions are subject to change at any time based upon market or other conditions and American Century Investments disclaims any responsibility to update such opinions. These opinions may not be relied upon as investment advice and, because investment decisions made by American Century Investments funds are based on numerous factors, may not be relied upon as an indication of trading intent on behalf of any American Century Investments fund. Security examples are used for representational purposes only and are not intended as recommendations to purchase or sell securities. Performance information for comparative i ndices and securities is provided to American Century Investments by third party vendors. To the best of American Century Investments’ knowledge, such information is accurate at the time of printing.

Dear Investor:
Thank you for taking time to review the following pages, which provide the performance of your investment along with the perspectives of our experienced portfolio management team for the financial reporting period ended October 31, 2009. We appreciate your trust in American Century Investments® at this volatile, transitional time in the economy and investment markets.
As the upheavals associated with the “Great Recession” gradually subside, our senior management team has put considerable thought into how the investment environment has changed and what new challenges and opportunities await us. Critical factors that we are anticipating in the coming year include marked shifts in investment and spending behavior, along with consolidation in our industry.
Most importantly, we think the economic recovery will be slow and extended. The economy and capital markets have come a long way since Lehman Brothers collapsed in the third quarter of 2008, but 2010 will likely bring continuing challenges. The stock market’s rebound since last March and the third-quarter economic surge in 2009 were fueled largely by corporate cost-cutting and unprecedented monetary and fiscal stimulus, including some key programs that have since expired or been scaled back.
Meanwhile, the resilient but struggling consumer sector still faces double-digit unemployment, heavy debt burdens, tight credit conditions, and a housing market that is starting to stabilize, but remains vulnerable. Much of our investment positioning in 2009 cautiously reflected these still unstable economic fundamentals, leading to underperformance, in some cases, versus market benchmarks buoyed by the rally of riskier assets. We still support our fundamentally based positioning because we believe strongly that some markets—driven more by technical factors than fundamentals—have advanced further than underlying economic conditions warrant, and remain susceptible to the possibility of more volatility ahead.
Thank you for your continued confidence in us.
Sincerely,

Jonathan Thomas
President and Chief Executive Officer
American Century Investments
2
|
| Independent Chairman’s Letter |

In my first letter to shareholders of the American Century Investments funds, I invited you to contact me with your questions. I have been gratified with your response. Most shareholder inquiries to date have related to specific fund performance issues. As I noted in my individual responses, your board through the Fund Performance Committee continues to stress improved performance in our quarterly meetings with chief investment officers and fund managers.
An important part of our fund performance review process is a face-to-face meeting with portfolio managers. The board traveled during the second quarter to the American Century Investments office in Mountain View, California to meet with the fund of funds and asset allocation portfolio management teams. These meetings validated the importance of thorough reviews of investment opportunities by the credit management personnel resident in that office. As a result of their efforts, American Century Investments funds were able to avoid the “toxic assets” that plagued many other fund families in 2008.
From April through June 2009, the board conducted its annual review of the advisory contracts between American Century Investments and each fund. Our efforts involved a review of fund information, including assets under management; total expense ratio compared to peers; economies of scale; fee breakpoints that reduce shareholder costs as assets increase; performance compared to peers and benchmarks; and the quality of services provided to fund shareholders. A detailed discussion of board considerations in connection with advisory contract renewal is included annually in each fund’s shareholder reports. During this review, the board focuses on a detailed comparison of the competitive position of each fund and has negotiated more than 60 breakpoints or fee reductions in the past five years.
The board looks forward to another year of work on your behalf and your comments are appreciated. You are invited to email me at dhpratt@fundboardchair.com.

3

By Enrique Chang, Chief Investment Officer, American Century Investments
Signs of Economic Recovery Boosted Stocks
The year ended October 31, 2009, was a period of extremes for the U.S. stock market. The market began the period in the midst of a historically steep decline, then finished the period with one of its strongest rallies since the 1930s. The market’s dramatic swings resulted from rapidly shifting expectations regarding the economic and financial environment.
Stocks fell sharply in late 2008 and early 2009 as investors grew increasingly concerned about a deep economic downturn and a lack of liquidity in the credit markets. In response, the federal government took unprecedented actions to shore up the credit sector, support the housing market, and revive the stalled economy.
These efforts began to bear fruit in the spring of 2009 as signs of economic stabilization emerged. Although the unemployment rate continued to climb, reaching a 26-year high of 10.2% by October, the broader economy showed evidence of improvement, producing real growth in the third quarter of 2009—the first positive quarterly growth in more than a year. In addition, cost-management efforts at many companies helped generate better-than-expected earnings in the second and third quarters.
As a result, the equity market reached a multi-year low on March 9 and then reversed course, rising steadily throughout the last seven months of the period. The rally helped erase the market’s earlier losses, enabling the major stock indexes to produce gains of approximately 10% overall. Growth stocks outperformed value shares by a wide margin (see the table below) across all market capitalizations, though they lagged modestly over the last six months.
Economic Challenges Remain
Although recent economic trends have been encouraging, the recovery will likely be gradual until there is sustained improvement in the delinquency levels of consumer debt and the unemployment rate. Thus far, the U.S. consumer has been conspicuously absent from the recovery, and given the weakness in the U.S. dollar and improving economic conditions elsewhere in the world, we may see an export-led recovery until the consumer gets back on firmer footing.
| | | | |
| U.S. Stock Index Returns | | | | |
| For the 12 months ended October 31, 2009 | | | |
| Russell 1000 Index (Large-Cap) | 11.20% | | Russell 2000 Index (Small-Cap) | 6.46% |
| Russell 1000 Growth Index | 17.51% | | Russell 2000 Growth Index | 11.34% |
| Russell 1000 Value Index | 4.78% | | Russell 2000 Value Index | 1.96% |
| Russell Midcap Index | 18.75% | | | |
| Russell Midcap Growth Index | 22.48% | | | |
| Russell Midcap Value Index | 14.52% | | | |
4
| | | | | |
| Performance | | | | | |
| New Opportunities | | | | | |
| |
| Total Returns as of October 31, 2009 | | | | |
| | | Average Annual Returns | |
| | | | | Since | Inception |
| | 1 year | 5 years | 10 years | Inception | Date |
| New Opportunities | -1.17% | 0.00% | -1.13% | 3.90% | 12/26/96 |
| Russell 2000 Growth Index(1) | 11.34% | 0.95% | 0.12% | 1.90%(2) | — |
| (1) | Data provided by Lipper Inc. — A Reuters Company. © 2009 Reuters. All rights reserved. Any copying, republication or redistribution of Lipper content, including by caching, framing or similar means, is expressly prohibited without the prior written consent of Lipper. Lipper shall not be liable for any errors or delays in the content, or for any actions taken in reliance thereon. |
| | The data contained herein has been obtained from company reports, financial reporting services, periodicals and other resources believed to be reliable. Although carefully verified, data on compilations is not guaranteed by Lipper and may be incomplete. No offer or solicitations to buy or sell any of the securities herein is being made by Lipper. |
| (2) | Since 12/31/96, the date nearest the fund’s inception for which data are available. |
Data presented reflect past performance. Past performance is no guarantee of future results. Current performance may be higher or lower than the performance shown. Investment return and principal value will fluctuate, and redemption value may be more or less than original cost. To obtain performance data current to the most recent month end, please call 1-800-345-2021 or visit americancentury.com. Historically, small company stocks have been more volatile than the stocks of larger, more established companies. The fund’s investment process may result in high portfolio turnover, high commission costs and high capital gains distributions. In addition, its investment approach may involve higher volatility and risk. International investing involves special risks, such as political instability and currency fluctuations.
Data assumes reinvestment of dividends and capital gains, and none of the charts reflect the deduction of taxes that a shareholder would pay on fund distributions or the redemption of fund shares. Returns for the index are provided for comparison. The fund’s total returns include operating expenses (such as transaction costs and management fees) that reduce returns, while the total returns of the index do not.
5
New Opportunities
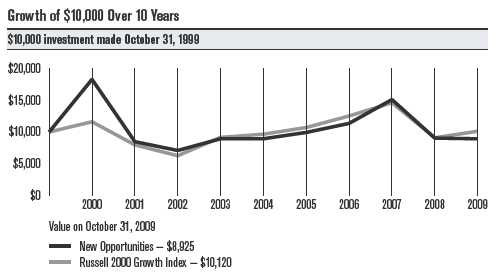
| | | | | | | | | | |
| | | | | | | | | | |
| One-Year Returns Over 10 Years | | | | | | | |
| Periods ended October 31 | | | | | | | | | |
| | 2000 | 2001 | 2002 | 2003 | 2004 | 2005 | 2006 | 2007 | 2008 | 2009 |
| New Opportunities | 83.28% | -53.81% | -16.46% | 26.18% | 0.00% | 11.26% | 14.39% | 33.23% | -40.33% | -1.17% |
| Russell 2000 | | | | | | | | | | |
| Growth Index | 16.16% | -31.50% | -21.57% | 46.56% | 5.53% | 10.91% | 17.07% | 16.73% | -37.87% | 11.34% |
| |
| Total Annual Fund Operating Expenses |
| New Opportunities | 1.51% |
The total annual fund operating expenses shown is as stated in the fund’s prospectus current as of the date of this report. The prospectus may vary from the expense ratio shown elsewhere in this report because it is based on a different time period, includes acquired fund fees and expenses, and, if applicable, does not include fee waivers or expense reimbursements.
Data presented reflect past performance. Past performance is no guarantee of future results. Current performance may be higher or lower than the performance shown. Investment return and principal value will fluctuate, and redemption value may be more or less than original cost. To obtain performance data current to the most recent month end, please call 1-800-345-2021 or visit americancentury.com. Historically, small company stocks have been more volatile than the stocks of larger, more established companies. The fund’s investment process may result in high portfolio turnover, high commission costs and high capital gains distributions. In addition, its investment approach may involve higher volatility and risk. International investing involves special risks, such as political instability and currency fluctuations.
Data assumes reinvestment of dividends and capital gains, and none of the charts reflect the deduction of taxes that a shareholder would pay on fund distributions or the redemption of fund shares. Returns for the index are provided for comparison. The fund’s total returns include operating expenses (such as transaction costs and management fees) that reduce returns, while the total returns of the index do not.
6
New Opportunities
Portfolio Managers: Stafford Southwick and Matthew Ferretti
Performance Summary
New Opportunities returned –1.17% for the fiscal year ended October 31, 2009, trailing the 11.34% return of its benchmark, the Russell 2000 Growth Index.
While the fund’s benchmark posted a double-digit gain for the 12-month period, the fund produced a modestly negative return. Virtually all of the portfolio’s underperformance occurred in the spring of 2009, during the stock market’s abrupt transition from steep decline to sharp rally. The portfolio was defensively positioned during the market downturn in late 2008 and early 2009, but as the market rapidly reversed course in anticipation of an economic recovery, our defensive holdings were left behind in the ensuing rally. Furthermore, the rebound in small-cap stocks was driven by companies that lacked the integral characteristics we look for as part of our investment process—improving business fundamentals and price momentum.
The portfolio outperformed during the last few months of the period as we repositioned the portfolio with a focus on companies that fare well in an economic recovery. In addition, the market began to recognize and reward stocks with the characteristics we seek in our investment process. Nonetheless, it was not enough to offset the severe underperformance in the middle of the period.
Technology and Financials Underperformed
The portfolio’s information technology and financials holdings had the biggest negative impact on performance versus the Russell 2000 Growth Index. The lion’s share of the underperformance in the information technology sector came from the semiconductor and Internet services industries. The most significant detractor was semiconductor manufacturer Microsemi, which faced a substantial decline in demand and a controversy about the credentials of its chief executive officer. Another notable detractor was Bankrate, which produces a website showing current interest rates on various financial instruments. Bankrate was hurt by reduced advertising demand on its website.
In the financials sector, overweight positions in commercial banks and insurance firms were largely responsible for the underperformance. The biggest detractor in this sector was real estate investment trust U-Store-It, which owns and operates self-storage units. Concerns about the company’s ability to service and refinance its debt caused the stock to drop sharply in the first half of the period. Regional bank Oriental Financial Group also slumped early in the period after reporting significant losses on its securities portfolio.
Industrials Hurt by Weak Airline Industry
The portfolio’s industrials holdings underperformed their counterparts in the benchmark index, and the main culprit was our overweight position in the airline industry during the first half of the period. Our thesis for the airline industry was based on the sharp decline in fuel prices during the last half of 2008, which we expected to translate into higher profit margins for airline companies.
7
New Opportunities
Unfortunately, this thesis did not play out as we anticipated. The economic downturn severely curtailed air traffic in early 2009, leading to a substantial drop in airfares that weighed on the industry’s profitability. Furthermore, most of the major airlines locked in fuel prices in advance to hedge against higher fuel costs, so they did not fully benefit from the decline in energy prices.
The portfolio’s largest detractors for the 12-month period were US Airways Group and UAL, the parent company of United Airlines. We eliminated our overweight position in early 2009, but we maintained some exposure to the airline industry as the economic environment improved.
Utilities and Materials Outperformed
Only two sectors of the portfolio added value relative to the Russell 2000 Growth Index—utilities and materials. Industry allocation was the key behind the outperformance in the utilities sector, particularly underweight positions in electric and gas utilities and an overweight position in water utilities.
In the materials sector, outperformance resulted primarily from an overweight position in paper and forest products companies and stock selection among chemicals producers. One of the top contributors was Schweitzer-Mauduit, which makes specialty paper products. The company developed low-ignition-propensity cigarette paper, which self-extinguishes when not being smoked to help prevent inadvertent fires. This product gives the company a significant competitive advantage at a time when more and more states are requiring usage of fire-safe cigarette paper.
The portfolio’s exposure to foreign companies had a meaningful impact on absolute performance, led by the fund’s top performance contributor—AsiaInfo Holdings, which provides billing software and services to the telecommunications industry in China. A restructuring and technological upgrade in the Chinese telecom industry led to stronger demand for AsiaInfo’s products and services, boosting revenue and profit growth.
Change in the Fund’s Investment Universe
Effective December 1, 2009, New Opportunities expanded its investment universe to include both small- and mid-cap stocks. As a result, the fund’s benchmark changed to the Russell 2500 Growth Index, which consists of small- and mid-sized growth stocks. The fund’s investment mandate has not changed, however; we will continue to invest in stocks exhibiting price momentum and accelerating revenue and earnings growth.
A Look Ahead
As we move into 2010, the fund is positioned to benefit from further progress in the economic recovery, as well as a follow-through in current market leadership. While we are disappointed in the fund’s performance over the past year, we remain confident that our investment strategy will produce favorable results over time.
8
| | |
| New Opportunities | | |
| |
| Top Ten Holdings as of October 31, 2009 | | |
| | % of net assets | % of net assets |
| | as of 10/31/09 | as of 4/30/09 |
| American Greetings Corp., Class A | 1.7% | — |
| Tempur-Pedic International, Inc. | 1.7% | 0.5% |
| priceline.com, Inc. | 1.6% | 1.5% |
| Bare Escentuals, Inc. | 1.5% | — |
| Dollar Thrifty Automotive Group, Inc. | 1.5% | — |
| Maxwell Technologies, Inc. | 1.1% | 0.8% |
| Solutia, Inc. | 1.1% | — |
| TNS, Inc. | 1.1% | — |
| Lennar Corp., Class A | 1.1% | — |
| Aeropostale, Inc. | 1.1% | 1.5% |
| |
| Top Five Industries as of October 31, 2009 | | |
| | % of net assets | % of net assets |
| | as of 10/31/09 | as of 4/30/09 |
| Semiconductors & Semiconductor Equipment | 7.6% | 2.9% |
| Household Durables | 6.3% | 2.2% |
| Software | 5.1% | 6.3% |
| Capital Markets | 4.8% | 1.6% |
| Oil, Gas & Consumable Fuels | 4.8% | 4.5% |
| |
| Types of Investments in Portfolio | | |
| | % of net assets | % of net assets |
| | as of 10/31/09 | as of 4/30/09 |
| Domestic Common Stocks | 93.3% | 94.9% |
| Foreign Common Stocks(1) | 6.4% | 4.3% |
| Total Common Stocks | 99.7% | 99.2% |
| Temporary Cash Investments | 0.3% | 1.1% |
| Other Assets and Liabilities | —(2) | (0.3)% |
| (1) | Includes depositary shares, dual listed securities and foreign ordinary shares. |
| (2) | Category is less than 0.05% of total net assets. |
9
|
| Shareholder Fee Example (Unaudited) |
Fund shareholders may incur two types of costs: (1) transaction costs, including sales charges (loads) on purchase payments and redemption/ exchange fees; and (2) ongoing costs, including management fees; distribution and service (12b-1) fees; and other fund expenses. This example is intended to help you understand your ongoing costs (in dollars) of investing in your fund and to compare these costs with the ongoing cost of investing in other mutual funds.
The example is based on an investment of $1,000 made at the beginning of the period and held for the entire period from May 1, 2009 to October 31, 2009.
Actual Expenses
The table provides information about actual account values and actual expenses for each class. You may use the information, together with the amount you invested, to estimate the expenses that you paid over the period. First, identify the share class you own. Then simply divide your account value by $1,000 (for example, an $8,600 account value divided by $1,000 = 8.6), then multiply the result by the number under the heading “Expenses Paid During Period” to estimate the expenses you paid on your account during this period.
If you hold Investor Class shares of any American Century Investments fund, or Institutional Class shares of the American Century Diversified Bond Fund, in an American Century Investments account (i.e., not a financial intermediary or retirement plan account), American Century Investments may charge you a $12.50 semiannual account maintenance fee if the value of those shares is less than $10,000. We will redeem shares automatically in one of your accounts to pay the $12.50 fee. In determining your total eligible investment amount, we will include your investments in all personal accounts (including American Century Investments Brokerage accounts) registered under your Social Security number. Personal accounts include individual accounts, joint accounts, UGMA/UTMA accounts, personal trusts, Coverdell Education Savings Accounts and IRAs (including traditional, Roth, Rollover, SEP-, SARSEP- and SIMPLE-IRAs), and certain other retirement accounts. If you have only business, business retirement, employer-sponsored or American Century Investments Brokerage accounts, you are currently not subject to this fee. We will not charge the fee as long as you choose to manage your accounts exclusively online. If you are subject to the Account Maintenance Fee, your account value could be reduced by the fee amount.
Hypothetical Example for Comparison Purposes
The table also provides information about hypothetical account values and hypothetical expenses based on the actual expense ratio of each class of your fund and an assumed rate of return of 5% per year before expenses, which is not the actual return of a fund’s share class. The hypothetical account values and expenses may not be used to estimate the actual ending account balance or expenses you paid for the period. You may use this information to compare the ongoing costs of investing in your fund and other funds.
To do so, compare this 5% hypothetical example with the 5% hypothetical examples that appear in the shareholder reports of the other funds.
10
Please note that the expenses shown in the table are meant to highlight your ongoing costs only and do not reflect any transactional costs, such as sales charges (loads) or redemption/exchange fees. Therefore, the table is useful in comparing ongoing costs only, and will not help you determine the relative total costs of owning different funds. In addition, if these transactional costs were included, your costs would have been higher.
| | | | |
| | Beginning | Ending | Expenses Paid | |
| | Account Value | Account Value | During Period* | Annualized |
| | 5/1/09 | 10/31/09 | 5/1/09 – 10/31/09 | Expense Ratio* |
| Actual | $1,000 | $1,114.50 | $7.99 | 1.50% |
| Hypothetical | $1,000 | $1,017.64 | $7.63 | 1.50% |
| * | Expenses are equal to the fund’s annualized expense ratio listed in the table above, multiplied by the average account value over the period, multiplied by 184, the number of days in the most recent fiscal half-year, divided by 365, to reflect the one-half year period. |
11
|
| Schedule of Investments |
| New Opportunities |
| | | | | | |
| OCTOBER 31, 2009 | | | | | | |
| |
| | Shares | Value | | | Shares | Value |
| Common Stocks — 99.7% | | | Savient Pharmaceuticals, Inc.(1) | 20,779 | $ 261,815 |
| AEROSPACE & DEFENSE — 0.8% | | | Seattle Genetics, Inc.(1) | 27,786 | 252,297 |
| AerCap Holdings NV(1) | 117,060 | $ 980,963 | | Theravance, Inc.(1) | 17,816 | 248,889 |
| AIRLINES — 1.7% | | | | | | 5,506,747 |
| Gol Linhas Aereas | | | | BUILDING PRODUCTS — 0.5% | | |
| Inteligentes SA ADR(1) | 60,563 | 621,982 | | Gibraltar Industries, Inc. | 58,951 | 637,850 |
| Hawaiian Holdings, Inc.(1) | 129,877 | 920,828 | | CAPITAL MARKETS — 4.8% | | |
| UAL Corp.(1) | 80,964 | 527,076 | | Artio Global Investors, Inc.(1) | 13,894 | 326,648 |
| | | 2,069,886 | | Cohen & Steers, Inc. | 58,131 | 1,123,672 |
| AUTO COMPONENTS — 4.7% | | | | Eaton Vance Corp. | 17,027 | 483,397 |
| American Axle & | | | | Evercore Partners, Inc., Class A | 31,621 | 1,032,109 |
| Manufacturing Holdings, Inc. | 73,735 | 441,673 | | KBW, Inc.(1) | 25,348 | 709,744 |
| ArvinMeritor, Inc. | 33,283 | 259,940 | | Lazard Ltd., Class A | 10,997 | 415,137 |
| BorgWarner, Inc. | 15,763 | 477,934 | | Piper Jaffray Cos.(1) | 23,868 | 1,107,237 |
| Cooper Tire & Rubber Co. | 67,431 | 1,028,997 | | Stifel Financial Corp.(1) | 11,067 | 575,041 |
| Dana Holding Corp.(1) | 54,377 | 307,774 | | | | 5,772,985 |
| Goodyear Tire & | | | | CHEMICALS — 2.5% | | |
| Rubber Co. (The)(1) | 33,444 | 430,759 | | | | |
| | | | | A. Schulman, Inc. | 31,271 | 543,177 |
| Modine Manufacturing Co. | 77,978 | 803,173 | | Ferro Corp. | 91,272 | 559,497 |
| Tenneco, Inc.(1) | 55,950 | 762,039 | | | | |
| | | | | Lubrizol Corp. | 8,333 | 554,645 |
| TRW Automotive | | | | Solutia, Inc.(1) | 120,696 | 1,327,656 |
| Holdings Corp.(1) | 70,995 | 1,111,072 | | | | |
| | | 5,623,361 | | | | 2,984,975 |
| AUTOMOBILES — 0.4% | | | | COMMERCIAL BANKS — 0.4% | | |
| Winnebago Industries, Inc.(1) | 40,358 | 464,117 | | East West Bancorp, Inc. | 58,082 | 524,480 |
| BEVERAGES — 1.2% | | | | COMMERCIAL SERVICES & SUPPLIES — 0.5% |
| Central European | | | | Ennis, Inc. | 24,682 | 373,932 |
| Distribution Corp.(1) | 24,800 | 771,528 | | SYKES Enterprises, Inc.(1) | 10,538 | 250,172 |
| Cott Corp.(1) | 75,319 | 595,020 | | | | 624,104 |
| | | 1,366,548 | | COMMUNICATIONS EQUIPMENT — 1.6% | |
| BIOTECHNOLOGY — 4.6% | | | | Aruba Networks, Inc.(1) | 61,015 | 477,138 |
| Acorda Therapeutics, Inc.(1) | 12,162 | 264,280 | | Blue Coat Systems, Inc.(1) | 43,411 | 967,197 |
| Alexion Pharmaceuticals, Inc.(1) | 12,398 | 550,595 | | F5 Networks, Inc.(1) | 11,052 | 496,124 |
| Alkermes, Inc.(1) | 30,980 | 246,911 | | | | 1,940,459 |
| Alnylam Pharmaceuticals, Inc.(1) | 11,820 | 201,413 | | COMPUTERS & PERIPHERALS — 1.0% | |
| AMAG Pharmaceuticals, Inc.(1) | 5,804 | 219,275 | | Novatel Wireless, Inc.(1) | 66,073 | 589,371 |
| Cepheid, Inc.(1) | 18,461 | 244,977 | | STEC, Inc.(1) | 26,942 | 574,404 |
| Cubist Pharmaceuticals, Inc.(1) | 18,686 | 316,541 | | | | 1,163,775 |
| Human Genome Sciences, Inc.(1) | 50,264 | 939,434 | | CONSTRUCTION & ENGINEERING — 0.3% | |
| Isis Pharmaceuticals, Inc.(1) | 29,827 | 377,908 | | Great Lakes Dredge | | |
| | | | | & Dock Corp. | 58,611 | 359,285 |
| Medivation, Inc.(1) | 9,513 | 242,772 | | CONSUMER FINANCE — 1.0% | | |
| Onyx Pharmaceuticals, Inc.(1) | 18,956 | 504,230 | | Cardtronics, Inc.(1) | 42,278 | 420,666 |
| PDL BioPharma, Inc. | 37,034 | 311,456 | | Dollar Financial Corp.(1) | 43,285 | 812,460 |
| Regeneron | | | | | | 1,233,126 |
| Pharmaceuticals, Inc.(1) | 20,634 | 323,954 | | | | |
12
| | | | | | |
| New Opportunities | | | | | |
| |
| | Shares | Value | | | Shares | Value |
| CONTAINERS & PACKAGING — 1.2% | | | Masimo Corp.(1) | 15,471 | $ 411,064 |
| Crown Holdings, Inc.(1) | 22,654 | $ 603,729 | | Meridian Bioscience, Inc. | 12,835 | 284,809 |
| Temple-Inland, Inc. | 49,706 | 767,958 | | NuVasive, Inc.(1) | 11,363 | 412,363 |
| | | 1,371,687 | | STERIS Corp. | 18,431 | 539,291 |
| DIVERSIFIED CONSUMER SERVICES — 1.8% | | | Thoratec Corp.(1) | 17,517 | 459,996 |
| DeVry, Inc. | 8,714 | 481,797 | | Volcano Corp.(1) | 12,605 | 180,882 |
| ITT Educational Services, Inc.(1) | 5,367 | 484,908 | | West Pharmaceutical | | |
| Sotheby’s | 73,267 | 1,162,015 | | Services, Inc. | 10,332 | 407,804 |
| | | 2,128,720 | | | | 4,921,961 |
| DIVERSIFIED FINANCIAL SERVICES — 0.6% | | | HEALTH CARE PROVIDERS & SERVICES — 2.9% |
| Portfolio Recovery | | | | Amedisys, Inc.(1) | 8,631 | 343,428 |
| Associates, Inc.(1) | 15,471 | 713,832 | | AMERIGROUP Corp.(1) | 16,944 | 373,615 |
| DIVERSIFIED TELECOMMUNICATION | | | Catalyst Health Solutions, Inc.(1) | 11,709 | 367,311 |
| SERVICES — 0.8% | | | | | | |
| | | | | Chemed Corp. | 7,254 | 328,751 |
| Cogent Communications | | | | | | |
| Group, Inc.(1) | 94,478 | 957,062 | | Genoptix, Inc.(1) | 5,633 | 195,972 |
| ELECTRICAL EQUIPMENT — 2.9% | | | HealthSouth Corp.(1) | 30,254 | 442,011 |
| American | | | | HMS Holdings Corp.(1) | 8,252 | 354,258 |
| Superconductor Corp.(1) | 28,565 | 957,499 | | Owens & Minor, Inc. | 10,407 | 425,542 |
| AZZ, Inc.(1) | 22,617 | 774,858 | | PSS World Medical, Inc.(1) | 18,734 | 378,802 |
| Roper Industries, Inc. | 11,080 | 560,094 | | Psychiatric Solutions, Inc.(1) | 12,297 | 253,810 |
| Trina Solar Ltd. ADR(1) | 37,296 | 1,211,374 | | | | 3,463,500 |
| | | 3,503,825 | | HEALTH CARE TECHNOLOGY — 1.4% | |
| ELECTRONIC EQUIPMENT, | | | | athenahealth, Inc.(1) | 10,535 | 396,221 |
| INSTRUMENTS & COMPONENTS — 4.2% | | | Eclipsys Corp.(1) | 17,952 | 336,600 |
| Brightpoint, Inc.(1) | 163,042 | 1,201,620 | | | | |
| | | | | MedAssets, Inc.(1) | 12,705 | 278,748 |
| Echelon Corp.(1) | 33,693 | 459,909 | | | | |
| | | | | Phase Forward, Inc.(1) | 14,658 | 192,166 |
| FLIR Systems, Inc.(1) | 20,933 | 582,147 | | | | |
| | | | | Quality Systems, Inc. | 6,724 | 410,299 |
| Littelfuse, Inc.(1) | 32,723 | 901,846 | | | | |
| | | | | | | 1,614,034 |
| Maxwell Technologies, Inc.(1) | 75,960 | 1,361,963 | | HOTELS, RESTAURANTS & LEISURE — 2.6% | |
| Sanmina-SCI Corp.(1) | 80,941 | 519,641 | | Bally Technologies, Inc.(1) | 23,508 | 925,980 |
| | | 5,027,126 | | Carrols Restaurant Group, Inc.(1) | 67,541 | 438,341 |
| ENERGY EQUIPMENT & SERVICES — 1.1% | | | Chipotle Mexican Grill, Inc., | | |
| Dril-Quip, Inc.(1) | 12,089 | 587,404 | | Class A(1) | 4,934 | 402,072 |
| Lufkin Industries, Inc. | 6,332 | 361,241 | | Home Inns & Hotels | | |
| Oceaneering International, Inc.(1) | 7,856 | 401,442 | | Management, Inc. ADR(1) | 29,347 | 780,043 |
| | | 1,350,087 | | Life Time Fitness, Inc.(1) | 26,221 | 565,063 |
| FOOD PRODUCTS — 0.3% | | | | | | 3,111,499 |
| Darling International, Inc.(1) | 46,542 | 323,467 | | HOUSEHOLD DURABLES — 6.3% | |
| HEALTH CARE EQUIPMENT & SUPPLIES — 4.1% | | American Greetings Corp., | | |
| Abaxis, Inc.(1) | 7,096 | 161,931 | | Class A | 99,982 | 2,033,634 |
| | | | | La-Z-Boy, Inc. | 130,376 | 925,670 |
| Align Technology, Inc.(1) | 19,103 | 300,299 | | | | |
| | | | | Lennar Corp., Class A | 100,697 | 1,268,782 |
| American Medical | | | | | | |
| Systems Holdings, Inc.(1) | 22,951 | 353,904 | | Sealy Corp.(1) | 336,807 | 976,740 |
| Beckman Coulter, Inc. | 9,359 | 602,065 | | Tempur-Pedic | | |
| | | | | International, Inc.(1) | 104,894 | 2,031,797 |
| Haemonetics Corp.(1) | 8,095 | 416,893 | | | | |
| | | | | Tupperware Brands Corp. | 5,947 | 267,734 |
| Immucor, Inc.(1) | 21,849 | 390,660 | | | | |
| | | | | | | 7,504,357 |
13
| | | | | | |
| New Opportunities | | | | | |
| |
| |
| | Shares | Value | | | Shares | Value |
| INSURANCE — 0.8% | | | | PAPER & FOREST PRODUCTS — 1.9% | |
| National Financial | | | | Aracruz Celulose SA ADR(1) | 40,787 | $ 759,454 |
| Partners Corp.(1) | 27,737 | $ 226,057 | | | | |
| | | | | Louisiana-Pacific Corp.(1) | 64,164 | 336,861 |
| Protective Life Corp. | 34,629 | 666,608 | | Schweitzer-Mauduit | | |
| | | 892,665 | | International, Inc. | 22,616 | 1,168,116 |
| INTERNET & CATALOG RETAIL — 2.1% | | | | | 2,264,431 |
| Blue Nile, Inc.(1) | 8,654 | 519,673 | | PERSONAL PRODUCTS — 2.2% | | |
| priceline.com, Inc.(1) | 12,221 | 1,928,351 | | Bare Escentuals, Inc.(1) | 144,320 | 1,822,761 |
| | | 2,448,024 | | Medifast, Inc.(1) | 36,092 | 794,746 |
| INTERNET SOFTWARE & SERVICES — 1.7% | | | | | 2,617,507 |
| Akamai Technologies, Inc.(1) | 24,875 | 547,250 | | PHARMACEUTICALS — 1.0% | | |
| Equinix, Inc.(1) | 5,365 | 457,742 | | Auxilium Pharmaceuticals, Inc.(1) | 13,475 | 423,924 |
| NIC, Inc. | 39,548 | 346,440 | | Nektar Therapeutics(1) | 31,102 | 252,548 |
| United Online, Inc. | 82,506 | 660,048 | | Salix Pharmaceuticals Ltd.(1) | 15,460 | 284,309 |
| | | 2,011,480 | | VIVUS, Inc.(1) | 25,253 | 199,499 |
| IT SERVICES — 1.9% | | | | | | 1,160,280 |
| Alliance Data Systems Corp.(1) | 7,646 | 420,377 | | PROFESSIONAL SERVICES — 1.3% | |
| Global Payments, Inc. | 11,028 | 542,909 | | Heidrick & Struggles | | |
| TNS, Inc.(1) | 46,254 | 1,307,138 | | International, Inc. | 39,102 | 1,069,831 |
| | | 2,270,424 | | Robert Half International, Inc. | 21,533 | 499,565 |
| LIFE SCIENCES TOOLS & SERVICES — 0.7% | | | | | 1,569,396 |
| Dionex Corp.(1) | 5,656 | 383,929 | | REAL ESTATE INVESTMENT TRUSTS (REITs) — 2.3% |
| Luminex Corp.(1) | 13,738 | 202,223 | | Ashford Hospitality Trust, Inc.(1) | 158,345 | 608,045 |
| PAREXEL International Corp.(1) | 18,961 | 237,392 | | Digital Realty Trust, Inc. | 10,784 | 486,682 |
| | | 823,544 | | Sunstone Hotel Investors, Inc.(1) | 64,689 | 488,402 |
| MACHINERY — 0.7% | | | | U-Store-It Trust | 211,332 | 1,204,592 |
| Chart Industries, Inc.(1) | 16,676 | 329,685 | | | | 2,787,721 |
| Pall Corp. | 16,826 | 534,057 | | ROAD & RAIL — 1.5% | | |
| | | 863,742 | | Dollar Thrifty | | |
| | | | | Automotive Group, Inc.(1) | 96,992 | 1,795,322 |
| MEDIA — 0.7% | | | | | | |
| | | | | SEMICONDUCTORS & | | |
| Belo Corp., Class A | 179,998 | 845,991 | | SEMICONDUCTOR EQUIPMENT — 7.6% | |
| METALS & MINING — 0.3% | | | | Advanced Energy | | |
| Brush Engineered | | | | Industries, Inc.(1) | 81,170 | 991,086 |
| Materials, Inc.(1) | 20,810 | 383,944 | | | | |
| | | | | Amkor Technology, Inc.(1) | 217,390 | 1,197,819 |
| OIL, GAS & CONSUMABLE FUELS — 4.8% | | | Atheros Communications, Inc.(1) | 44,667 | 1,099,702 |
| Alpha Natural Resources, Inc.(1) | 16,908 | 574,365 | | | | |
| | | | | Cree, Inc.(1) | 14,690 | 618,449 |
| Arena Resources, Inc.(1) | 16,840 | 627,458 | | | | |
| | | | | Cymer, Inc.(1) | 30,310 | 1,037,814 |
| ATP Oil & Gas Corp.(1) | 60,351 | 1,044,676 | | | | |
| | | | | Entegris, Inc.(1) | 312,500 | 1,175,000 |
| Carrizo Oil & Gas, Inc.(1) | 33,404 | 774,305 | | | | |
| | | | | Entropic Communications, Inc.(1) | 128,621 | 338,273 |
| Clean Energy Fuels Corp.(1) | 65,200 | 756,320 | | | | |
| | | | | OmniVision Technologies, Inc.(1) | 49,028 | 601,083 |
| DCP Midstream Partners LP | 10,939 | 282,117 | | | | |
| | | | | ON Semiconductor Corp.(1) | 70,716 | 473,090 |
| EXCO Resources, Inc. | 24,814 | 387,595 | | | | |
| | | | | Semtech Corp.(1) | 41,947 | 648,920 |
| Gran Tierra Energy, Inc.(1) | 149,623 | 712,205 | | | | |
| | | | | Skyworks Solutions, Inc.(1) | 49,588 | 517,203 |
| Northern Oil And Gas, Inc.(1) | 55,282 | 504,172 | | | | |
| | | | | Tessera Technologies, Inc.(1) | 14,301 | 316,195 |
| | | 5,663,213 | | | | |
| | | | | | | 9,014,634 |
14
| | | | | | | |
| New Opportunities | | | | | | |
| |
| | Shares | Value | | | | Shares | Value |
| SOFTWARE — 5.1% | | | | Temporary Cash Investments — 0.3% |
| ANSYS, Inc.(1) | 12,788 | $ 518,937 | | | | | |
| | | | | JPMorgan U.S. Treasury | | |
| CommVault Systems, Inc.(1) | 46,557 | 917,173 | | Plus Money Market Fund | | |
| Deltek, Inc.(1) | 45,254 | 323,566 | | Agency Shares | 61,213 | $ 61,213 |
| Interactive Intelligence, Inc.(1) | 20,288 | 340,230 | | Repurchase Agreement, Bank of America | |
| | | | | Securities, LLC, (collateralized by various | |
| JDA Software Group, Inc.(1) | 46,269 | 917,977 | | U.S. Treasury obligations, 1.875%-3.625%, | |
| Net 1 UEPS Technologies, Inc.(1) | 28,279 | 494,600 | | 7/15/13-4/15/28, valued at $308,571), | |
| Pegasystems, Inc. | 7,419 | 212,703 | | in a joint trading account at 0.05%, | |
| | | | | dated 10/30/09, due 11/2/09 | | |
| Red Hat, Inc.(1) | 26,430 | 682,158 | | (Delivery value $300,001) | | 300,000 |
| Smith Micro Software, Inc.(1) | 66,475 | 603,593 | | TOTAL TEMPORARY | | |
| Sybase, Inc.(1) | 11,948 | 472,663 | | CASH INVESTMENTS | | |
| Taleo Corp., Class A(1) | 25,463 | 553,565 | | (Cost $361,213) | | 361,213 |
| | | 6,037,165 | | TOTAL INVESTMENT | | |
| | | | | SECURITIES — 100.0% | | |
| SPECIALTY RETAIL — 3.3% | | | | (Cost $108,706,425) | | 119,340,760 |
| Aeropostale, Inc.(1) | 33,654 | 1,263,034 | | OTHER ASSETS AND LIABILITIES(2) | (53,899) |
| CarMax, Inc.(1) | 22,369 | 439,998 | | TOTAL NET ASSETS — 100.0% | | $119,286,861 |
| Kirkland’s, Inc.(1) | 43,300 | 544,714 | | | | | |
| Pacific Sunwear Of California(1) | 87,467 | 528,301 | | Notes to Schedule of Investments |
| Tiffany & Co. | 15,747 | 618,700 | | ADR = American Depositary Receipt | | |
| Urban Outfitters, Inc.(1) | 17,511 | 549,495 | | (1) | Non-income producing. | | |
| | | 3,944,242 | | (2) | Category is less than 0.05% of total net assets. | |
| TEXTILES, APPAREL & LUXURY GOODS — 1.8% | | | | | |
| Crocs, Inc.(1) | 94,419 | 574,068 | | Industry classifications are unaudited. | | |
| Deckers Outdoor Corp.(1) | 6,399 | 573,798 | | | | | |
| Steven Madden Ltd.(1) | 25,056 | 1,014,768 | | | | | |
| | | 2,162,634 | | See Notes to Financial Statements. | | |
| TRADING COMPANIES & DISTRIBUTORS — 0.9% | | | | | |
| Aircastle Ltd. | 137,244 | 1,086,972 | | | | | |
| TRANSPORTATION INFRASTRUCTURE — 0.9% | | | | | |
| Aegean Marine Petroleum | | | | | | | |
| Network, Inc. | 46,485 | 1,092,398 | | | | | |
| TOTAL COMMON STOCKS | | | | | | | |
| (Cost $108,345,212) | | 118,979,547 | | | | | |
15
|
| Statement of Assets and Liabilities |
| |
| OCTOBER 31, 2009 | |
| Assets | |
| Investment securities, at value (cost of $108,706,425) | $119,340,760 |
| Cash | 1,130 |
| Receivable for investments sold | 2,522,843 |
| Receivable for capital shares sold | 5,992 |
| Dividends and interest receivable | 16,987 |
| | 121,887,712 |
| |
| Liabilities | |
| Payable for investments purchased | 2,434,302 |
| Payable for capital shares redeemed | 166 |
| Accrued management fees | 166,383 |
| | 2,600,851 |
| |
| Net Assets | $119,286,861 |
| |
| Capital Shares, $0.01 Par Value | |
| Authorized | 300,000,000 |
| Shares outstanding | 23,580,696 |
| |
| Net Asset Value Per Share | $5.06 |
| |
| Net Assets Consist of: | |
| Capital (par value and paid-in surplus) | $ 213,456,462 |
| Accumulated net investment loss | (131,144) |
| Accumulated net realized loss on investment and foreign currency transactions | (104,672,792) |
| Net unrealized appreciation on investments and translation of assets and liabilities in foreign currencies | 10,634,335 |
| | $ 119,286,861 |
| |
| |
| See Notes to Financial Statements. | |
16
| |
| YEAR ENDED OCTOBER 31, 2009 | |
| Investment Income (Loss) | |
| Income: | |
| Dividends (net of foreign taxes withheld of $11,901) | $ 1,165,637 |
| Interest | 949 |
| | 1,166,586 |
| |
| Expenses: | |
| Management fees | 1,753,866 |
| Directors’ fees and expenses | 4,629 |
| Other expenses | 332 |
| | 1,758,827 |
| |
| Net investment income (loss) | (592,241) |
| |
| Realized and Unrealized Gain (Loss) | |
| Net realized gain (loss) on investment and foreign currency transactions | (32,090,793) |
| Change in unrealized appreciation (depreciation) on investments and translation | |
| of assets and liabilities in foreign currencies | 28,631,261 |
| |
| Net realized and unrealized gain (loss) | (3,459,532) |
| |
| Net Increase (Decrease) in Net Assets Resulting from Operations | $ (4,051,773) |
| |
| |
| See Notes to Financial Statements. | |
17
|
| Statement of Changes in Net Assets |
| | |
| YEARS ENDED OCTOBER 31, 2009 AND OCTOBER 31, 2008 | | |
| Increase (Decrease) in Net Assets | 2009 | 2008 |
| Operations | | |
| Net investment income (loss) | $ (592,241) | $ (1,450,960) |
| Net realized gain (loss) | (32,090,793) | (34,752,582) |
| Change in net unrealized appreciation (depreciation) | 28,631,261 | (68,501,298) |
| Net increase (decrease) in net assets resulting from operations | (4,051,773) | (104,704,840) |
| | | |
| Capital Share Transactions | | |
| Proceeds from shares sold | 4,381,201 | 11,746,882 |
| Payments for shares redeemed | (27,981,602) | (30,538,826)(1) |
| Net increase (decrease) in net assets from capital share transactions | (23,600,401) | (18,791,944) |
| | | |
| Redemption Fees | | |
| Increase in net assets from redemption fees | 7,327 | — |
| | | |
| Net increase (decrease) in net assets | (27,644,847) | (123,496,784) |
| | | |
| Net Assets | | |
| Beginning of period | 146,931,708 | 270,428,492 |
| End of period | $119,286,861 | $ 146,931,708 |
| | | |
| Accumulated net investment loss | $(131,144) | — |
| | | |
| Transactions in Shares of the Fund | | |
| Sold | 972,792 | 1,641,508 |
| Redeemed | (6,114,009) | (4,448,068) |
| Net increase (decrease) in shares of the fund | (5,141,217) | (2,806,560) |
| | |
| (1) Net of redemption fees of $26,903. | | |
| |
| |
| See Notes to Financial Statements. | | |
18
|
| Notes to Financial Statements |
OCTOBER 31, 2009
1. Organization and Summary of Significant Accounting Policies
Organization — American Century Mutual Funds, Inc. (the corporation) is registered under the Investment Company Act of 1940 (the 1940 Act) as an open-end management investment company. New Opportunities Fund (the fund) is one fund in a series issued by the corporation. The fund is diversified under the 1940 Act. The fund’s investment objective is to seek long-term capital growth. The fund pursues its objective by investing primarily in common stocks of smaller-sized companies that management believes will increase in value over time. Effective December 1, 2009, the fund may invest in common stocks of small and mid-sized companies that management believes will increase in value over time. The following is a summary of the fund’s significant accounting policies.
Security Valuations — Securities traded primarily on a principal securities exchange are valued at the last reported sales price, or at the mean of the latest bid and asked prices where no last sales price is available. Depending on local convention or regulation, securities traded over-the-counter are valued at the mean of the latest bid and asked prices, the last sales price, or the official close price. Investments in open-end management investment companies are valued at the reported net asset value. Debt securities not traded on a principal securities exchange are valued through a commercial pricing service or at the mean of the most recent bid and asked prices. Discount notes may be valued through a commercial pricing service or at amortized cost, which approximates fair value. Securities traded on foreign securities exchanges and ov er-the-counter markets are normally completed before the close of business on days that the New York Stock Exchange (the Exchange) is open and may also take place on days when the Exchange is not open. If an event occurs after the value of a security was established but before the net asset value per share was determined that was likely to materially change the net asset value, that security would be valued as determined in accordance with procedures adopted by the Board of Directors. If the fund determines that the market price of a portfolio security is not readily available, or that the valuation methods mentioned above do not reflect the security’s fair value, such security is valued as determined by the Board of Directors or its designee, in accordance with procedures adopted by the Board of Directors, if such determination would materially impact a fund’s net asset value. Certain other circumstances may cause the fund to use alternative procedures to value a security such as: a security has b een declared in default; trading in a security has been halted during the trading day; or there is a foreign market holiday and no trading will commence.
Security Transactions — For financial reporting purposes, security transactions are accounted for as of the trade date. Net realized gains and losses are determined on the identified cost basis, which is also used for federal income tax purposes.
Investment Income — Dividend income less foreign taxes withheld, if any, is recorded as of the ex-dividend date. Distributions received on securities that represent a return of capital or capital gain are recorded as a reduction of cost of investments and/or as a realized gain. The fund estimates the components of distributions received that may be considered nontaxable distributions or capital gain distributions for income tax purposes. Interest income is recorded on the accrual basis and includes accretion of discounts and amortization of premiums.
Foreign Currency Translations — All assets and liabilities initially expressed in foreign currencies are translated into U.S. dollars at prevailing exchange rates at period end. The fund may enter into spot foreign currency exchange contracts to facilitate transactions denominated in a foreign currency. Purchases and sales of investment securities, dividend and interest income, spot foreign currency exchange contracts, and certain expenses are translated at the rates of exchange prevailing on the respective dates of such transactions. For assets and liabilities, other than investments in securities, net realized and unrealized gains and losses from foreign currency translations arise from changes in currency exchange rates.
19
Net realized and unrealized foreign currency exchange gains or losses occurring during the holding period of investment securities are a component of net realized gain (loss) on investment transactions and net unrealized appreciation (depreciation) on investments, respectively. Certain countries may impose taxes on the contract amount of purchases and sales of foreign currency contracts in their currency. The fund records the foreign tax expense, if any, as a reduction to the net realized gain (loss) on foreign currency transactions.
Repurchase Agreements — The fund may enter into repurchase agreements with institutions that American Century Investment Management, Inc. (ACIM) (the investment advisor) has determined are creditworthy pursuant to criteria adopted by the Board of Directors. Each repurchase agreement is recorded at cost. The fund requires that the collateral, represented by securities, received in a repurchase transaction be transferred to the custodian in a manner sufficient to enable the fund to obtain those securities in the event of a default under the repurchase agreement. ACIM monitors, on a daily basis, the securities transferred to ensure the value, including accrued interest, of the securities under each repurchase agreement is equal to or greater than amounts owed to the fund under each repurchase agreement.
Joint Trading Account — Pursuant to an Exemptive Order issued by the Securities and Exchange Commission, the fund, along with certain other funds in the American Century Investments family of funds, may transfer uninvested cash balances into a joint trading account. These balances are invested in one or more repurchase agreements that are collateralized by U.S. Treasury or Agency obligations.
Exchange Traded Funds — The fund may invest in exchange traded funds (ETFs). ETFs are a type of index fund bought and sold on a securities exchange. An ETF trades like common stock and represents a fixed portfolio of securities designed to track the performance and dividend yield of a particular domestic or foreign market index. A fund may purchase an ETF to temporarily gain exposure to a portion of the U.S. or a foreign market while awaiting purchase of underlying securities. The risks of owning an ETF generally reflect the risks of owning the underlying securities they are designed to track, although the lack of liquidity on an ETF could result in it being more volatile. Additionally, ETFs have fees and expenses that reduce their value.
Income Tax Status — It is the fund’s policy to distribute substantially all net investment income and net realized gains to shareholders and to otherwise qualify as a regulated investment company under provisions of the Internal Revenue Code. The fund is no longer subject to examination by tax authorities for years prior to 2006. At this time, management believes there are no uncertain tax positions which, based on their technical merit, would not be sustained upon examination and for which it is reasonably possible that the total amounts of unrecognized tax benefits will significantly change in the next twelve months. Accordingly, no provision has been made for federal or state income taxes. Interest and penalties associated with any federal or state income tax obligations, if any, are recorded as interest expense.
Distributions to Shareholders — Distributions to shareholders are recorded on the ex-dividend date. Distributions from net investment income and net realized gains, if any, are generally declared and paid annually.
Redemption — The fund may impose a 2.00% redemption fee on shares held less than 180 days. The redemption fee is retained by the fund and helps cover transaction costs that long-term investors may bear when a fund sells securities to meet investor redemptions.
Indemnifications — Under the corporation‘s organizational documents, its officers and directors are indemnified against certain liabilities arising out of the performance of their duties to the fund. In addition, in the normal course of business, the fund enters into contracts that provide general indemnifications. The maximum exposure under these arrangements is unknown as this would involve future claims that may be made against a fund. The risk of material loss from such claims is considered by management to be remote.
20
Use of Estimates — The financial statements are prepared in conformity with accounting principles generally accepted in the United States of America, which may require management to make certain estimates and assumptions at the date of the financial statements. Actual results could differ from these estimates.
Subsequent Events — Management has evaluated events or transactions that may have occurred since October 31, 2009, that would merit recognition or disclosure in the financial statements. This evaluation was completed through December 28, 2009, the date the financial statements were issued.
2. Fees and Transactions with Related Parties
Management Fees — The corporation has entered into a Management Agreement with ACIM, under which ACIM provides the fund with investment advisory and management services in exchange for a single, unified management fee (the fee). The Agreement provides that all expenses of the fund, except brokerage commissions, taxes, interest, fees and expenses of those directors who are not considered “interested persons” as defined in the 1940 Act (including counsel fees) and extraordinary expenses, will be paid by ACIM. The fee is computed and accrued daily based on the daily net assets of the fund and paid monthly in arrears. For funds with a stepped fee schedule, the rate of the fee is determined by applying a fee rate calculation formula. This formula takes into account the fund’s assets as well as certain assets, if any, of other cli ents of the investment advisor outside the American Century Investments family of funds (such as subadvised funds and separate accounts) that have very similar investment teams and investment strategies (strategy assets). The annual management fee schedule for the fund ranges from 1.10% to 1.50%. The effective annual management fee for the fund for the year ended October 31, 2009 was 1.50%.
Related Parties — Certain officers and directors of the corporation are also officers and/or directors, and, as a group, controlling stockholders of American Century Companies, Inc. (ACC), the parent of the corporation’s investment advisor, ACIM, the distributor of the corporation, American Century Investment Services, Inc., and the corporation’s transfer agent, American Century Services, LLC.
The fund is eligible to invest in a money market fund for temporary purposes, which is managed by J.P. Morgan Investment Management, Inc. (JPMIM). The fund has a Mutual Funds Services Agreement with J.P. Morgan Investor Services Co. (JPMIS). JPMorgan Chase Bank (JPMCB) is a custodian of the fund. JPMIM, JPMIS and JPMCB are wholly owned subsidiaries of JPMorgan Chase & Co. (JPM). JPM is an equity investor in ACC.
3. Investment Transactions
Purchases and sales of investment securities, excluding short-term investments, for the year ended October 31, 2009, were $244,308,554 and $268,044,018, respectively.
4. Fair Value Measurements
The fund’s securities valuation process is based on several considerations and may use multiple inputs to determine the fair value of the positions held by the fund. In conformity with accounting principles generally accepted in the United States of America, the inputs used to determine a valuation are classified into three broad levels as follows:
• Level 1 valuation inputs consist of actual quoted prices in an active market for identical securities;
• Level 2 valuation inputs consist of significant direct or indirect observable market data (including quoted prices for similar securities, evaluations of subsequent market events, interest rates, prepayment speeds, credit risk, etc.); or
• Level 3 valuation inputs consist of significant unobservable inputs (including a fund’s own assumptions).
21
The level classification is based on the lowest level input that is significant to the fair valuation measurement. The valuation inputs are not an indication of the risks associated with investing in these securities or other financial instruments.
The following is a summary of the valuation inputs used to determine the fair value of the fund’s securities as of October 31, 2009:
| | | |
| | Level 1 | Level 2 | Level 3 |
| Investment Securities | | | |
| Domestic Common Stocks | $111,316,371 | — | — |
| Foreign Common Stocks | 7,663,176 | — | — |
| Temporary Cash Investments | 61,213 | $300,000 | — |
| Total Value of Investment Securities | $119,040,760 | $300,000 | — |
5. Risk Factors
The fund concentrates its investments in common stocks of smaller-sized companies. Because of this, the fund may be subject to greater risk and market fluctuations than a fund investing in larger, more established companies. The fund’s investment process may result in high portfolio turnover, high commission costs and high capital gains distributions. In addition, its investment approach may involve higher volatility and risk.
6. Bank Line of Credit
The fund, along with certain other funds in the American Century Investments family of funds, had a $500,000,000 unsecured bank line of credit agreement with Bank of America, N.A. The line expired December 10, 2008, and was not renewed. The agreement allowed the fund to borrow money for temporary or emergency purposes to fund shareholder redemptions. Borrowings under the agreement were subject to interest at the Federal Funds rate plus 0.40%. The fund did not borrow from the line during the year ended October 31, 2009.
7. Interfund Lending
The fund, along with certain other funds in the American Century Investments family of funds, may participate in an interfund lending program, pursuant to an Exemptive Order issued by the Securities and Exchange Commission (SEC). This program provides an alternative credit facility allowing the fund to borrow from or lend to other funds in the American Century Investments family of funds that permit such transactions. Interfund lending transactions are subject to each fund’s investment policies and borrowing and lending limits. The interfund loan rate earned/paid on interfund lending transactions is determined daily based on the average of certain current market rates. Interfund lending transactions normally extend only overnight, but can have a maximum duration of seven days. The program is subject to annual approval by the Board of Directors. During the year ended October 31, 2009, the fund did not utilize the program.
8. Federal Tax Information
The book-basis character of distributions made during the year from net investment income or net realized gains may differ from their ultimate characterization for federal income tax purposes. These differences reflect the differing character of certain income items and net realized gains and losses for financial statement and tax purposes, and may result in reclassification among certain capital accounts on the financial statements. There were no distributions paid by the fund during the years ended October 31, 2009 and October 31, 2008.
22
As of October 31, 2009, the federal tax cost of investments and the components of distributable earnings on a tax-basis were as follows:
| |
| Federal tax cost of investments | $109,184,913 |
| Gross tax appreciation of investments | $15,638,605 |
| Gross tax depreciation of investments | (5,482,758) |
| Net tax appreciation (depreciation) of investments | $10,155,847 |
| Undistributed ordinary income | — |
| Accumulated capital losses | $(104,325,448) |
The difference between book-basis and tax-basis cost and unrealized appreciation (depreciation) is attributable primarily to the tax deferral of losses on wash sales and on investments in passive foreign investment companies.
The accumulated capital losses listed above represent net capital loss carryovers that may be used to offset future realized capital gains for federal income tax purposes. Future capital loss carryover utilization in any given year may be subject to Internal Revenue Code limitations. The capital loss carryovers expire as follows:
| | | | | | | |
| 2010 | 2011 | 2012 | 2013 | 2014 | 2015 | 2016 | 2017 |
| $(37,698,539) | — | — | — | — | — | $(33,198,598) | $(33,428,311) |
9. Recently Issued Accounting Standards
The Financial Accounting Standards Board (FASB) issued Accounting Standards Codification (ASC) Section 820-10 (formerly Statement of Financial Accounting Standards No. 157, “Fair Value Measurements”), in September 2006, which is effective for fiscal years beginning after November 15, 2007. ASC Section 820-10 defines fair value, establishes a framework for measuring fair value and expands the required financial statement disclosures about fair value measurements. The adoption of ASC Section 820-10 did not materially impact the determination of fair value.
In March 2008, the FASB issued ASC Section 815-10 (formerly Statement of Financial Accounting Standards No. 161, “Disclosures about Derivative Instruments and Hedging Activities — an amendment of FASB Statement No. 133”). ASC Section 815-10 is effective for interim periods beginning after November 15, 2008 and has been adopted by the fund. ASC Section 815-10 amends and expands disclosures about derivative instruments and hedging activities. ASC Section 815-10 requires qualitative disclosures about the objectives and strategies of derivative instruments, quantitative disclosures about the fair value amounts of and gains and losses on derivative instruments, and disclosures of credit-risk-related contingent features in hedging activities.
23
| | | | | |
| Financial Highlights | | | | | |
| |
| New Opportunities | | | | | |
| |
| For a Share Outstanding Throughout the Years Ended October 31 | | | |
| | 2009 | 2008 | 2007 | 2006 | 2005 |
| Per-Share Data | | | | | |
| Net Asset Value, Beginning of Period | $5.12 | $8.58 | $6.44 | $5.63 | $5.06 |
| Income From Investment Operations | | | | | |
| Net Investment Income (Loss) | (0.02)(1) | (0.05)(1) | (0.07) | (0.06) | (0.06) |
| Net Realized and Unrealized Gain (Loss) | (0.04) | (3.41) | 2.21 | 0.87 | 0.63 |
| Total From Investment Operations | (0.06) | (3.46) | 2.14 | 0.81 | 0.57 |
| Net Asset Value, End of Period | $5.06 | $5.12 | $8.58 | $6.44 | $5.63 |
| |
| Total Return(2) | (1.17)% | (40.33)% | 33.23% | 14.39% | 11.26% |
| |
| Ratios/Supplemental Data | | | | | |
| Ratio of Operating Expenses | | | | | |
| to Average Net Assets | 1.50% | 1.50% | 1.50% | 1.50% | 1.50% |
| Ratio of Net Investment Income (Loss) | | | | | |
| to Average Net Assets | (0.51)% | (0.66)% | (0.83)% | (0.84)% | (0.98)% |
| Portfolio Turnover Rate | 206% | 159% | 201% | 298% | 260% |
| Net Assets, End of Period (in thousands) | $119,287 | $146,932 | $270,428 | $247,876 | $240,464 |
| (1) | Computed using average shares outstanding throughout the period. |
| (2) | Total return assumes reinvestment of net investment income and capital gains distributions, if any. |
See Notes to Financial Statements.
24
|
| Report of Independent Registered Public Accounting Firm |
The Board of Directors and Shareholders,
American Century Mutual Funds, Inc.:
We have audited the accompanying statement of assets and liabilities, including the schedule of investments, of New Opportunities Fund, one of the funds constituting American Century Mutual Funds, Inc. (the “Corporation”), as of October 31, 2009, and the related statement of operations for the year then ended, the statements of changes in net assets for each of the two years in the period then ended, and the financial highlights for each of the five years in the period then ended. These financial statements and financial highlights are the responsibility of the Corporation’s management. Our responsibility is to express an opinion on these financial statements and financial highlights based on our audits.
We conducted our audits in accordance with the standards of the Public Company Accounting Oversight Board (United States). Those standards require that we plan and perform the audit to obtain reasonable assurance about whether the financial statements and financial highlights are free of material misstatement. The Corporation is not required to have, nor were we engaged to perform, an audit of its internal control over financial reporting. Our audits included consideration of internal control over financial reporting as a basis for designing audit procedures that are appropriate in the circumstances, but not for the purpose of expressing an opinion on the effectiveness of the Corporation’s internal control over financial reporting. Accordingly, we express no such opinion. An audit also includes examining, on a test basis, evidence supporting the amounts and disclosures in the financial statements, assessing the accounting principles used and significant estimates made by management, as well as evaluating the overall financial statement presentation. Our procedures included confirmation of securities owned as of October 31, 2009, by correspondence with the custodian and brokers; where replies were not received from brokers, we performed other auditing procedures. We believe that our audits provide a reasonable basis for our opinion.
In our opinion, the financial statements and financial highlights referred to above present fairly, in all material respects, the financial position of New Opportunities Fund of American Century Mutual Funds, Inc., as of October 31, 2009, the results of its operations for the year then ended, the changes in its net assets for each of the two years in the period then ended, and the financial highlights for each of the five years in the period then ended, in conformity with accounting principles generally accepted in the United States of America.
Deloitte & Touche LLP
Kansas City, Missouri
December 28, 2009
25
The individuals listed below serve as directors or officers of the fund. Each director serves until his or her successor is duly elected and qualified or until he or she retires. Mandatory retirement age for independent directors is 72. Those listed as interested directors are “interested” primarily by virtue of their engagement as directors and/or officers of, or ownership interest in, American Century Companies, Inc. (ACC) or its wholly owned, direct or indirect, subsidiaries, including the fund’s investment advisor, American Century Investment Management, Inc. (ACIM); the fund’s principal underwriter, American Century Investment Services, Inc. (ACIS); and the fund’s transfer agent, American Century Services, LLC (ACS).
The other directors (more than three-fourths of the total number) are independent; that is, they have never been employees, directors or officers of, and have no financial interest in, ACC or any of its wholly owned, direct or indirect, subsidiaries, including ACIM, ACIS and ACS. The directors serve in this capacity for seven registered investment companies in the American Century Investments family of funds.
All persons named as officers of the fund also serve in similar capacities for the other 14 registered investment companies in the American Century Investments family of funds advised by ACIM or American Century Global Investment Management, Inc. (ACGIM), a wholly owned subsidiary of ACIM, unless otherwise noted. Only officers with policy-making functions are listed. No officer is compensated for his or her service as an officer of the fund. The listed officers are interested persons of the fund and are appointed or re-appointed on an annual basis.
Interested Director
Jonathan S. Thomas, 4500 Main Street, Kansas City, MO 64111
Year of Birth: 1963
Position(s) Held with Fund: Director (since 2007) and President (since 2007)
Principal Occupation(s) During Past 5 Years: President and Chief Executive Officer, ACC
(March 2007 to present); Chief Administrative Officer, ACC (February 2006 to
February 2007); Executive Vice President, ACC (November 2005 to February 2007).
Also serves as: President, Chief Executive Officer and Director, ACS; Executive
Vice President, ACIM and ACGIM; Director, ACIM, ACGIM, ACIS and other ACC
subsidiaries. Managing Director, Morgan Stanley (March 2000 to November 2005)
Number of Portfolios in Fund Complex Overseen by Director: 103
Other Directorships Held by Director: None
26
Independent Directors
Thomas A. Brown, 4500 Main Street, Kansas City, MO 64111
Year of Birth: 1940
Position(s) Held with Fund: Director (since 1980)
Principal Occupation(s) During Past 5 Years: Managing Member, Associated Investments, LLC
(real estate investment company); Managing Member, Brown Cascade Properties,
LLC (real estate investment company); Retired, Area Vice President, Applied
Industrial Technologies (bearings and power transmission company)
Number of Portfolios in Fund Complex Overseen by Director: 63
Other Directorships Held by Director: None
Andrea C. Hall, Ph.D., 4500 Main Street, Kansas City, MO 64111
Year of Birth: 1945
Position(s) Held with Fund: Director (since 1997)
Principal Occupation(s) During Past 5 Years: Retired, Advisor to the President, Midwest
Research Institute (not-for-profit, contract research organization)
Number of Portfolios in Fund Complex Overseen by Director: 63
Other Directorships Held by Director: None
James A. Olson, 4500 Main Street, Kansas City, MO 64111
Year of Birth: 1942
Position(s) Held with Fund: Director (since 2007)
Principal Occupation(s) During Past 5 Years: Member, Plaza Belmont LLC (private equity
fund manager); Chief Financial Officer, Plaza Belmont LLC (September 1999 to
September 2006)
Number of Portfolios in Fund Complex Overseen by Director: 63
Other Directorships Held by Director: Saia, Inc. and Entertainment Properties Trust
Donald H. Pratt, 4500 Main Street, Kansas City, MO 64111
Year of Birth: 1937
Position(s) Held with Fund: Director (since 1995) and Chairman of the Board (since 2005)
Principal Occupation(s) During Past 5 Years: Chairman and Chief Executive Officer, Western
Investments, Inc. (real estate company); Retired Chairman of the Board, Butler
Manufacturing Company (metal buildings producer)
Number of Portfolios in Fund Complex Overseen by Director: 63
Other Directorships Held by Director: None
Gale E. Sayers, 4500 Main Street, Kansas City, MO 64111
Year of Birth: 1943
Position(s) Held with Fund: Director (since 2000)
Principal Occupation(s) During Past 5 Years: President, Chief Executive Officer and Founder,
Sayers40, Inc. (technology products and services provider)
Number of Portfolios in Fund Complex Overseen by Director: 63
Other Directorships Held by Director: None
M. Jeannine Strandjord, 4500 Main Street, Kansas City, MO 64111
Year of Birth: 1945
Position(s) Held with Fund: Director (since 1994)
Principal Occupation(s) During Past 5 Years: Retired, formerly Senior Vice President, Sprint
Corporation (telecommunications company)
Number of Portfolios in Fund Complex Overseen by Director: 63
Other Directorships Held by Director: DST Systems, Inc.; Euronet Worldwide, Inc. and
Charming Shoppes, Inc.
27
John R. Whitten, 4500 Main Street, Kansas City, MO 64111
Year of Birth: 1946
Position(s) Held with Fund: Director (since 2008)
Principal Occupation(s) During Past 5 Years: Project Consultant, Celanese Corp. (industrial
chemical company) (September 2004 to January 2005)
Number of Portfolios in Fund Complex Overseen by Director: 63
Other Directorships Held by Director: Rudolph Technologies, Inc.
Officers
Barry Fink, 4500 Main Street, Kansas City, MO 64111
Year of Birth: 1955
Position(s) Held with Fund: Executive Vice President (since 2007)
Principal Occupation(s) During Past 5 Years: Chief Operating Officer and Executive Vice
President, ACC (September 2007 to present); President, ACS (October 2007 to
present); Managing Director, Morgan Stanley (2000 to 2007); Global General
Counsel, Morgan Stanley (2000 to 2006). Also serves as: Director, ACC, ACS, ACIS
and other ACC subsidiaries
Maryanne Roepke, 4500 Main Street, Kansas City, MO 64111
Year of Birth: 1956
Position(s) Held with Fund: Chief Compliance Officer (since 2006) and Senior Vice
President (since 2000)
Principal Occupation(s) During Past 5 Years: Chief Compliance Officer, ACIM, ACGIM and ACS
(August 2006 to present); Assistant Treasurer, ACC (January 1995 to August 2006); and
Treasurer and Chief Financial Officer, various American Century Investments funds
(July 2000 to August 2006). Also serves as: Senior Vice President, ACS
Charles A. Etherington, 4500 Main Street, Kansas City, MO 64111
Year of Birth: 1957
Position(s) Held with Fund: General Counsel (since 2007) and Senior Vice President
(since 2006)
Principal Occupation(s) During Past 5 Years: Attorney, ACC (February 1994 to present); Vice
President, ACC (November 2005 to present); General Counsel, ACC (March 2007
to present). Also serves as: General Counsel, ACIM, ACGIM, ACS, ACIS and other
ACC subsidiaries; and Senior Vice President, ACIM, ACGIM and ACS
Robert Leach, 4500 Main Street, Kansas City, MO 64111
Year of Birth: 1966
Position(s) Held with Fund: Vice President, Treasurer and Chief Financial Officer
(all since 2006)
Principal Occupation(s) During Past 5 Years: Vice President, ACS (February 2000 to present); and
Controller, various American Century Investments funds (1997 to September 2006)
David H. Reinmiller, 4500 Main Street, Kansas City, MO 64111
Year of Birth: 1963
Position(s) Held with Fund: Vice President (since September 2000)
Principal Occupation(s) During Past 5 Years: Attorney, ACC (January 1994 to present);
Associate General Counsel, ACC (January 2001 to present); Chief Compliance
Officer, American Century Investments funds, ACIM and ACGIM (January 2001 to
February 2005). Also serves as: Associate General Counsel, ACIM, ACGIM, ACS,
ACIS and other ACC subsidiaries; and Vice President, ACIM, ACGIM and ACS
Ward Stauffer, 4500 Main Street, Kansas City, MO 64111
Year of Birth: 1960
Position(s) Held with Fund: Secretary (since February 2005)
Principal Occupation(s) During Past 5 Years: Attorney, ACC (June 2003 to present)
The SAI has additional information about the fund’s directors and is available without charge, upon request, by calling 1-800-345-2021.
28
|
| Approval of Management Agreement |
Under Section 15(c) of the Investment Company Act, contracts for investment advisory services are required to be reviewed, evaluated and approved by a majority of a fund’s independent directors (the “Directors”) each year. At American Century Investments, this process is referred to as the “15(c) Process.” As a part of this process, the board reviews fund performance, shareholder services, audit and compliance information, and a variety of other reports from the advisor concerning fund operations. In addition to this annual review, the board of directors oversees and evaluates on a continuous basis at its quarterly meetings the nature and quality of significant services performed by the advisor, fund performance, audit and compliance information, and a variety of other reports relating to fund operations. The board, or committees of the board, also holds special meetings as needed.
Under a Securities and Exchange Commission rule, each fund is required to disclose in its annual or semiannual report, as appropriate, the material factors and conclusions that formed the basis for the board’s approval or renewal of any advisory agreements within the fund’s most recently completed fiscal half-year period.
Annual Contract Review Process
As part of the annual 15(c) Process undertaken during the most recent fiscal half-year period, the Directors reviewed extensive data and information compiled by the advisor and certain independent providers of evaluative data (the “15(c) Providers”) concerning New Opportunities (the “Fund”) and the services provided to the Fund under the management agreement. The information considered and the discussions held at the meetings included, but were not limited to:
• the nature, extent and quality of investment management, shareholder services and other services provided to the Fund;
• the wide range of programs and services the advisor provides to the Fund and its shareholders on a routine and non-routine basis;
• the compliance policies, procedures, and regulatory experience of the advisor;
• data comparing the cost of owning the Fund to the cost of owning a similar fund;
• data comparing the Fund’s performance to appropriate benchmarks and/or a peer group of other mutual funds with similar investment objectives and strategies;
• financial data showing the profitability of the Fund to the advisor and the overall profitability of the advisor;
• data comparing services provided and charges to other investment management clients of the advisor; and
29
• consideration of collateral benefits derived by the advisor from the management of the Fund and any potential economies of scale relating thereto.
In keeping with its practice, the Fund’s board of directors held two in-person meetings and one telephonic meeting to review and discuss the information provided. The board also had the benefit of the advice of its independent counsel throughout the period.
Factors Considered
The Directors considered all of the information provided by the advisor, the 15(c) Providers, and the board’s independent counsel, and evaluated such information for each fund for which the board has responsibility. In connection with their review of the Fund, the Directors did not identify any single factor as being all-important or controlling, and each Director may have attributed different levels of importance to different factors. In deciding to renew the management and subadvisory agreements under the terms ultimately determined by the board to be appropriate, the Directors’ decision was based on the following factors.
Nature, Extent and Quality of Services — Generally. Under the management agreement, the advisor is responsible for providing or arranging for all services necessary for the operation of the Fund. The board noted that under the management agreement, the advisor provides or arranges at its own expense a wide variety of services including:
• Fund construction and design
• portfolio security selection
• initial capitalization/funding
• securities trading
• Fund administration
• custody of Fund assets
• daily valuation of the Fund’s portfolio
• shareholder servicing and transfer agency, including shareholder confirmations, recordkeeping and communications
• legal services
• regulatory and portfolio compliance
• financial reporting
• marketing and distribution
30
The Directors noted that many of the services provided by the advisor have expanded over time both in terms of quantity and complexity in response to shareholder demands, competition in the industry and the changing regulatory environment. They discussed with the advisor the challenges presented by these changes and the impact on the Fund. In performing their evaluation, the Directors considered information received in connection with the annual review, as well as information provided on an ongoing basis at their regularly scheduled board and committee meetings.
Investment Management Services. The nature of the investment management services provided to the Fund is quite complex and allows Fund shareholders access to professional money management, instant diversification of their investments, and liquidity. In evaluating investment performance, the board expects the advisor to manage the Fund in accordance with its investment objectives and approved strategies. Further, the Directors recognize that the advisor has an obligation to monitor trading activities, and in particular to seek the best execution of fund trades, and to evaluate the use of and payment for research. In providing these services, the advisor utilizes teams of investment professionals (portfolio managers, analysts, research assistants, and securities traders) who require extensive information technology, research, training, compl iance and other systems to conduct their business. At each quarterly meeting the Directors review investment performance information for the Fund, together with comparative information for appropriate benchmarks and/or peer groups of funds managed similarly to the Fund. The Directors also review detailed performance information during the 15(c) Process comparing the Fund’s performance with that of similar funds not managed by the advisor. If performance concerns are identified, the Directors discuss with the advisor the reasons for such results (e.g., market conditions, security selection) and any efforts being undertaken to improve performance. The Fund’s performance was above the median for its peer group for the three-year period and slightly below the median for the one-year period.
Shareholder and Other Services. The advisor provides the Fund with a comprehensive package of transfer agency, shareholder, and other services. The Directors review reports and evaluations of such services at their regular quarterly meetings, including the annual meeting concerning contract review, and reports to the board. These reports include, but are not limited to, information regarding the operational efficiency and accuracy of the shareholder and transfer agency services provided, staffing levels, shareholder satisfaction (as measured by external as well as internal sources), technology support, new products and services offered to Fund shareholders, securities trading activities, portfolio valuation services, auditing services, and legal and operational compliance activities. Certain aspects of shareholder and transfer agency servi ce level efficiency and the quality of securities trading activities are measured by independent third party providers and are presented in comparison to other fund groups not managed by the advisor.
31
Costs of Services Provided and Profitability. The advisor provides detailed information concerning its cost of providing various services to the Fund, its profitability in managing the Fund, its overall profitability, and its financial condition. The Directors have reviewed with the advisor the methodology used to prepare this financial information. This financial information regarding the advisor is considered in order to evaluate the advisor’s financial condition, its ability to continue to provide services under the management agreement, and the reasonableness of the current management fee. The board concluded that the advisor’s profits were reasonable in light of the services provided to the Fund.
Ethics. The Directors generally consider the advisor’s commitment to providing quality services to shareholders and to conducting its business ethically. They noted that the advisor’s practices generally meet or exceed industry best practices.
Economies of Scale. The Directors review information provided by the advisor regarding the possible existence of economies of scale in connection with the management of the Fund. The Directors concluded that economies of scale are difficult to measure and predict with precision, especially on a fund-by-fund basis. The analysis of economies of scale is further complicated by the additional services and content provided by the advisor and its reinvestment in its ability to provide and expand those services. Accordingly, the Directors seek to evaluate economies of scale by reviewing other information, such as year-over-year profitability of the advisor generally, the profitability of its management of the Fund specifically, the expenses incurred by the advisor in providing various functions to the Fund, and the fees of competitive funds not m anaged by the advisor. The Directors believe the advisor is appropriately sharing economies of scale through its competitive fee structure, fee breakpoints as the Fund increases in size, and through reinvestment in its business to provide shareholders additional content and services.
Comparison to Other Funds’ Fees. The Fund pays the advisor a single, all-inclusive (or unified) management fee for providing all services necessary for the management and operation of the Fund, other than brokerage expenses, taxes, interest, extraordinary expenses, and the fees and expenses of the Fund’s independent directors (including their independent legal counsel). Under the unified fee structure, the advisor is responsible for providing all investment advisory, custody, audit, administrative, compliance, record-keeping, marketing and shareholder services, or arranging and supervising third parties to provide such services. By contrast, most other funds are charged a variety of fees, including an investment advisory fee, a transfer agency fee, an administrative fee, distribution charges and other expenses. Other than their i nvestment advisory fees and Rule 12b-1 distribution fees, all other components of the total fees charged by these other funds may be increased without shareholder approval. The board believes the unified fee structure is a benefit to Fund shareholders because it clearly discloses to shareholders the cost of owning Fund shares, and, since the unified fee cannot be increased without a vote of Fund shareholders, it shifts to the advisor the risk of increased costs of operating the Fund and provides a direct incentive to minimize administrative inefficiencies. Part of the Directors’ analysis of fee levels involves reviewing certain evaluative data
32
compiled by a 15(c) Provider comparing the Fund’s unified fee to the total expense ratio of other funds in the Fund’s peer group and performing a regression analysis to evaluate the effect of fee breakpoints as assets under management increase. The unified fee charged to shareholders of the Fund was above the median of the total expense ratios of its peer group. In addition, the Directors also reviewed updated fee level data provided by the advisor, but recognized that comparative data was particularly difficult to evaluate given the significant market developments during the past year. The board concluded that the management fee paid by the Fund to the advisor was reasonable in light of the services provided to the Fund.
Comparison to Fees and Services Provided to Other Clients of the Advisor. The Directors also requested and received information from the advisor concerning the nature of the services, fees, and profitability of its advisory services to advisory clients other than the Fund. They observed that these varying types of client accounts require different services and involve different regulatory and entrepreneurial risks than the management of the Fund. The Directors analyzed this information and concluded that the fees charged and services provided to the Fund were reasonable by comparison.
Collateral Benefits Derived by the Advisor. The Directors considered the existence of collateral benefits the advisor may receive as a result of its relationship with the Fund. They concluded that the advisor’s primary business is managing mutual funds and it generally does not use fund or shareholder information to generate profits in other lines of business, and therefore does not derive any significant collateral benefits from them. The Directors noted that the advisor receives proprietary research from broker-dealers that execute fund portfolio transactions and concluded that this research is likely to benefit fund shareholders. The Directors also determined that the advisor is able to provide investment management services to certain clients other than the Fund, at least in part, due to its existing infrastructure built to serve the fund complex. The Directors concluded, however, that the assets of those other clients are not material to the analysis and, in any event, are included with the assets of the Fund to determine breakpoints in the Fund’s fee schedule, provided they are managed using the same investment team and strategy.
Conclusions of the Directors
As a result of this process, the board, including all of the independent directors, in the absence of particular circumstances and assisted by the advice of legal counsel that is independent of the advisor, taking into account all of the factors discussed above and the information provided by the advisor concluded that the investment management agreement between the Fund and the advisor is fair and reasonable in light of the services provided and should be renewed.
33
Retirement Account Information
As required by law, distributions you receive from certain IRAs, or 403(b), 457 and qualified plans are subject to federal income tax withholding, unless you elect not to have withholding apply. Tax will be withheld on the total amount withdrawn even though you may be receiving amounts that are not subject to withholding, such as nondeductible contributions. In such case, excess amounts of withholding could occur. You may adjust your withholding election so that a greater or lesser amount will be withheld.
If you don’t want us to withhold on this amount, you must notify us to not withhold the federal income tax. You may notify us in writing or in certain situations by telephone or through other electronic means. You have the right to revoke your withholding election at any time and any election you make may remain in effect until revoked by filing a new election.
Remember, even if you elect not to have income tax withheld, you are liable for paying income tax on the taxable portion of your withdrawal. If you elect not to have income tax withheld or you don’t have enough income tax withheld, you may be responsible for payment of estimated tax. You may incur penalties under the estimated tax rules if your withholding and estimated tax payments are not sufficient. You can reduce or defer the income tax on a distribution by directly or indirectly rolling such distribution over to another IRA or eligible plan. You should consult your tax advisor for additional information.
State tax will be withheld if, at the time of your distribution, your address is within one of the mandatory withholding states and you have federal income tax withheld. State taxes will be withheld from your distribution in accordance with the respective state rules.
Proxy Voting Guidelines
American Century Investment Management, Inc., the fund’s investment advisor, is responsible for exercising the voting rights associated with the securities purchased and/or held by the fund. A description of the policies and procedures the advisor uses in fulfilling this responsibility is available without charge, upon request, by calling 1-800-345-2021. It is also available on American Century Investments’ website at americancentury.com and on the Securities and Exchange Commission’s website at sec.gov. Information regarding how the investment advisor voted proxies relating to portfolio securities during the most recent 12-month period ended June 30 is available on the “About Us” page at americancentury.com. It is also available at sec.gov.
Quarterly Portfolio Disclosure
The fund files its complete schedule of portfolio holdings with the Securities and Exchange Commission (SEC) for the first and third quarters of each fiscal year on Form N-Q. The fund’s Form N-Q is available on the SEC’s website at sec.gov, and may be reviewed and copied at the SEC’s Public Reference Room in Washington, DC. Information on the operation of the Public Reference Room may be obtained by calling 1-800-SEC-0330. The fund also makes its complete schedule of portfolio holdings for the most recent quarter of its fiscal year available on its website at americancentury.com and, upon request, by calling 1-800-345-2021.
34
The following indices are used to illustrate investment market, sector, or style performance or to serve as fund performance comparisons. They are not investment products available for purchase.
The Russell 1000® Index is a market-capitalization weighted, large-cap index created by Frank Russell Company to measure the performance of the 1,000 largest publicly traded U.S. companies, based on total market capitalization.
The Russell 1000® Growth Index measures the performance of those Russell 1000 Index companies (the 1,000 largest publicly traded U.S. companies, based on total market capitalization) with higher price-to-book ratios and higher forecasted growth values.
The Russell 1000® Value Index measures the performance of those Russell 1000 Index companies (the 1,000 largest publicly traded U.S. companies, based on total market capitalization) with lower price-to-book ratios and lower forecasted growth values.
The Russell 2000® Index is a market-capitalization weighted index created by Frank Russell Company to measure the performance of the 2,000 smallest of the 3,000 largest publicly traded U.S. companies, based on total market capitalization.
The Russell 2000® Growth Index measures the performance of those Russell 2000 Index companies (the 2,000 smallest of the 3,000 largest publicly traded U.S. companies, based on total market capitalization) with higher price-to-book ratios and higher forecasted growth values.
The Russell 2000® Value Index measures the performance of those Russell 2000 Index companies (the 2,000 smallest of the 3,000 largest publicly traded U.S. companies, based on total market capitalization) with lower price-to-book ratios and lower forecasted growth values.
The Russell 2500® Index is a market-capitalization weighted index created by Frank Russell Company to measure the performance of the 2,500 smallest of the 3,000 largest publicly traded U.S. companies, based on total market capitalization.
The Russell 2500® Growth Index measures the performance of those Russell 2500 Index companies (the 2,500 smallest of the 3,000 largest publicly traded U.S. companies, based on total market capitalization) with higher price-to-book ratios and higher forecasted growth values.
The Russell Midcap® Index measures the performance of the 800 smallest of the 1,000 largest publicly traded U.S. companies, based on total market capitalization.
35
The Russell Midcap® Growth Index measures the performance of those Russell Midcap Index companies (the 800 smallest of the 1,000 largest publicly traded U.S. companies, based on total market capitalization) with higher price-to-book ratios and higher forecasted growth values.
The Russell Midcap® Value Index measures the performance of those Russell Midcap Index companies (the 800 smallest of the 1,000 largest publicly traded U.S. companies, based on total market capitalization) with lower price-to-book ratios and lower forecasted growth values.
36

| |
| |
| Contact Us | |
| americancentury.com | |
| Automated Information Line | 1-800-345-8765 |
| Investor Services Representative | 1-800-345-2021 or |
| | 816-531-5575 |
| Business, Not-For-Profit, Employer-Sponsored | |
| Retirement Plans | 1-800-345-3533 |
| Banks and Trust Companies, Broker-Dealers, | |
| Financial Professionals, Insurance Companies | 1-800-345-6488 |
| Telecommunications Device for the Deaf | 1-800-634-4113 |
| American Century Mutual Funds, Inc. | |
| Investment Advisor: | |
| American Century Investment Management, Inc. | |
| Kansas City, Missouri | |
This report and the statements it contains are submitted for the general
information of our shareholders. The report is not authorized for distribution to
prospective investors unless preceded or accompanied by an effective prospectus.
American Century Investment Services, Inc., Distributor
©2009 American Century Proprietary Holdings, Inc. All rights reserved.
0912
CL-ANN-67033S
|
| Annual Report |
| October 31, 2009 |

|
| American Century Investments |
Balanced Fund
| |
| President’s Letter | 2 |
| Independent Chairman’s Letter | 3 |
| Market Perspective | 4 |
| U.S. Market Returns | 4 |
| |
| Balanced | |
| |
| Performance | 5 |
| Portfolio Commentary | 7 |
| Top Ten Stock Holdings | 9 |
| Top Five Stock Industries | 9 |
| Key Fixed-Income Portfolio Statistics | 9 |
| Types of Investments in Portfolio | 9 |
| |
| Shareholder Fee Example | 10 |
| |
| Financial Statements | |
| |
| Schedule of Investments | 12 |
| Statement of Assets and Liabilities | 25 |
| Statement of Operations | 26 |
| Statement of Changes in Net Assets | 27 |
| Notes to Financial Statements | 28 |
| Financial Highlights | 36 |
| Report of Independent Registered Public Accounting Firm | 38 |
| |
| Other Information | |
| |
| Management | 39 |
| Approval of Management Agreement | 42 |
| Additional Information | 47 |
| Index Definitions | 48 |
The opinions expressed in the Market Perspective and the Portfolio Commentary reflect those of the portfolio management team as of the date of the report, and do not necessarily represent the opinions of American Century Investments or any other person in the American Century Investments organization. Any such opinions are subject to change at any time based upon market or other conditions and American Century Investments disclaims any responsibility to update such opinions. These opinions may not be relied upon as investment advice and, because investment decisions made by American Century Investments funds are based on numerous factors, may not be relied upon as an indication of trading intent on behalf of any American Century Investments fund. Security examples are used for representational purposes only and are not intended as recommendations to purchase or sell securities. Performance information for comparative i ndices and securities is provided to American Century Investments by third party vendors. To the best of American Century Investments’ knowledge, such information is accurate at the time of printing.

Dear Investor:
Thank you for taking time to review the following pages, which provide the performance of your investment along with the perspectives of our experienced portfolio management team for the financial reporting period ended October 31, 2009. We appreciate your trust in American Century Investments® at this volatile, transitional time in the economy and investment markets.
As the upheavals associated with the “Great Recession” gradually subside, our senior management team has put considerable thought into how the investment environment has changed and what new challenges and opportunities await us. Critical factors that we are anticipating in the coming year include marked shifts in investment and spending behavior, along with consolidation in our industry.
Most importantly, we think the economic recovery will be slow and extended. The economy and capital markets have come a long way since Lehman Brothers collapsed in the third quarter of 2008, but 2010 will likely bring continuing challenges. The stock market’s rebound since last March and the third-quarter economic surge in 2009 were fueled largely by corporate cost-cutting and unprecedented monetary and fiscal stimulus, including some key programs that have since expired or been scaled back.
Meanwhile, the resilient but struggling consumer sector still faces double-digit unemployment, heavy debt burdens, tight credit conditions, and a housing market that is starting to stabilize, but remains vulnerable. Much of our investment positioning in 2009 cautiously reflected these still unstable economic fundamentals, leading to underperformance, in some cases, versus market benchmarks buoyed by the rally of riskier assets. We still support our fundamentally based positioning because we believe strongly that some markets—driven more by technical factors than fundamentals—have advanced further than underlying economic conditions warrant, and remain susceptible to the possibility of more volatility ahead.
Thank you for your continued confidence in us.
Sincerely,

Jonathan Thomas
President and Chief Executive Officer
American Century Investments
2
|
| Independent Chairman’s Letter |

In my first letter to shareholders of the American Century Investments funds, I invited you to contact me with your questions. I have been gratified with your response. Most shareholder inquiries to date have related to specific fund performance issues. As I noted in my individual responses, your board through the Fund Performance Committee continues to stress improved performance in our quarterly meetings with chief investment officers and fund managers.
An important part of our fund performance review process is a face-to-face meeting with portfolio managers. The board traveled during the second quarter to the American Century Investments office in Mountain View, California to meet with the fund of funds and asset allocation portfolio management teams. These meetings validated the importance of thorough reviews of investment opportunities by the credit management personnel resident in that office. As a result of their efforts, American Century Investments funds were able to avoid the “toxic assets” that plagued many other fund families in 2008.
From April through June 2009, the board conducted its annual review of the advisory contracts between American Century Investments and each fund. Our efforts involved a review of fund information, including assets under management; total expense ratio compared to peers; economies of scale; fee breakpoints that reduce shareholder costs as assets increase; performance compared to peers and benchmarks; and the quality of services provided to fund shareholders. A detailed discussion of board considerations in connection with advisory contract renewal is included annually in each fund’s shareholder reports. During this review, the board focuses on a detailed comparison of the competitive position of each fund and has negotiated more than 60 breakpoints or fee reductions in the past five years.
The board looks forward to another year of work on your behalf and your comments are appreciated. You are invited to email me at dhpratt@fundboardchair.com.

Don Pratt
3

By Enrique Chang, Chief Investment Officer, American Century Investments
A Wild Ride for Stocks
The U.S. stock market posted positive returns for the 12 months ended October 31, 2009, overcoming one of the most volatile periods in its history. The market’s advance was driven by a dramatic shift in market sentiment as extreme pessimism regarding the economy and financial sector gave way to renewed optimism.
In late 2008 and early 2009, stocks fell sharply as investors grew increasingly concerned about a deep economic downturn and a potential collapse in the global financial system. Thanks to an unprecedented series of actions by the federal government, however, signs of stabilization in the economy began to emerge in the spring of 2009, erasing the market’s pessimistic sentiment and boosting confidence about a possible recovery. Although the unemployment rate continued to climb through the end of the period, reaching a 26-year high of 10.2%, other segments of the economy improved markedly, most notably housing and manufacturing.
Signs of economic recovery, along with better-than-expected corporate profits, led to a significant reversal in the stock market. The market advanced steadily from mid-March, when it reached a multi-year low, through the end of the period. The rally was broad based, but mid-cap stocks generated the best results overall for the period (see the table below), while growth shares outpaced value across all market capitalizations.
Double-Digit Gains for Bonds
The U.S. bond market also gained ground during the period, outperforming the broad equity indices. The bond market’s double-digit gains resulted primarily from outsized returns for corporate bonds, which benefited substantially from the improving economic environment. Mortgage-backed securities also delivered robust gains as the Federal Reserve purchased mortgage-backed securities to support the housing market.
Treasury and government agency securities also generated positive returns but lagged the rest of the bond market. Treasury bonds were in high demand early in the period amid the economic and financial turmoil, but as the economic environment improved, investors shifted to other higher-yielding segments of the bond market. In addition, an increase in supply—as the government issued more securities to fund its economic stimulus package—weighed on the Treasury market.
| | | | |
| U.S. Market Returns | | | | |
| For the 12 months ended October 31, 2009 | | | |
| Stock Indices | | | Citigroup U.S. Bond Market Indices | |
| Russell 1000 Index (large-cap) | 11.20% | | Broad Investment-Grade (multi-sector) | 14.07% |
| Russell Midcap Index | 18.75% | | Credit (investment-grade corporate) | 28.72% |
| Russell 2000 Index (small-cap) | 6.46% | | Mortgage (mortgage-backed) | 12.27% |
| | | | Agency | 9.97% |
| | | | Treasury | 6.28% |
4
| | | | | | |
| Balanced | | | | | |
| |
| Total Returns as of October 31, 2009 | | | | |
| | | | Average Annual Returns | |
| | | | | | Since | Inception |
| | | 1 year | 5 years | 10 years | Inception | Date |
| Investor Class | 9.81% | 2.44% | 2.29% | 7.47% | 10/20/88 |
| Blended index(1) | 12.22% | 2.63% | 2.31% | 8.55%(2) | — |
| S&P 500 Index(3) | 9.80% | 0.33% | -0.95% | 8.84%(2) | — |
| Citigroup US Broad | | | | | |
| Investment-Grade Bond Index | 14.07% | 5.33% | 6.46% | 7.41%(2) | — |
| Institutional Class | 10.11% | 2.66% | — | 1.92% | 5/1/00 |
| (1) | See Index Definitions page. | | | | | |
| (2) | Since 10/31/88, the date nearest the Investor Class’s inception for which data are available. | | |
| (3) | Data provided by Lipper Inc. – A Reuters Company. © 2009 Reuters. All rights reserved. Any copying, republication or redistribution of Lipper |
| | content, including by caching, framing or similar means, is expressly prohibited without the prior written consent of Lipper. Lipper shall not be |
| | liable for any errors or delays in the content, or for any actions taken in reliance thereon. | | | |
| | The data contained herein has been obtained from company reports, financial reporting services, periodicals and other resources believed to be |
| | reliable. Although carefully verified, data on compilations is not guaranteed by Lipper and may be incomplete. No offer or solicitations to buy or |
| | sell any of the securities herein is being made by Lipper. | | | | |
Data presented reflect past performance. Past performance is no guarantee of future results. Current performance may be higher or lower than the performance shown. Investment return and principal value will fluctuate, and redemption value may be more or less than original cost. To obtain performance data current to the most recent month end, please call 1-800-345-2021 or visit americancentury.com. As interest rates rise, bond values will decline.
Unless otherwise indicated, performance reflects Investor Class shares; performance for other share classes will vary due to differences in fee structure. For information about other share classes available, please consult the prospectus. Data assumes reinvestment of dividends and capital gains, and none of the charts reflect the deduction of taxes that a shareholder would pay on fund distributions or the redemption of fund shares. Returns for the indices are provided for comparison. The fund’s total returns include operating expenses (such as transaction costs and management fees) that reduce returns, while the total returns of the indices do not.
5
Balanced
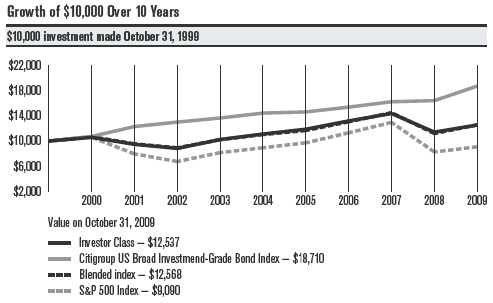
| | | | | | | | | | |
| One-Year Returns Over 10 Years | | | | | | | |
| Periods ended October 31 | | | | | | | | | |
| | 2000 | 2001 | 2002 | 2003 | 2004 | 2005 | 2006 | 2007 | 2008 | 2009 |
| Investor Class | 5.90% | -10.46% | -6.80% | 15.92% | 8.46% | 6.89% | 11.04% | 8.92% | -20.52% | 9.81% |
| Blended index | 6.84% | -10.54% | -6.64% | 14.57% | 7.99% | 5.78% | 11.83% | 10.95% | -22.70% | 12.22% |
| S&P 500 Index | 6.09% | -24.90% | -15.11% | 20.80% | 9.42% | 8.72% | 16.34% | 14.56% | -36.10% | 9.80% |
| Citigroup US Broad | | | | | | | | | | |
| Investment-Grade | | | | | | | | | | |
| Bond Index | 7.28% | 14.61% | 5.75% | 4.99% | 5.70% | 1.24% | 5.24% | 5.50% | 1.12% | 14.07% |
| |
| Total Annual Fund Operating Expenses | | | | | | |
| | Investor Class | | | | | Institutional Class | | |
| | 0.90% | | | | | 0.70% | | |
| | | | | | | | | | | |
The total annual fund operating expenses shown is as stated in the fund’s prospectus current as of the date of this report. The prospectus may vary from the expense ratio shown elsewhere in this report because it is based on a different time period, includes acquired fund fees and expenses, and, if applicable, doe s not include fee waivers or expense reimbursements.
Data presented reflect past performance. Past performance is no guarantee of future results. Current performance may be higher or lower than the performance shown. Investment return and principal value will fluctuate, and redemption value may be more or less than original cost. To obtain performance data current to the most recent month end, please call 1-800-345-2021 or visit americancentury.com. As interest rates rise, bond values will decline.
Unless otherwise indicated, performance reflects Investor Class shares; performance for other share classes will vary due to differences in fee structure. For information about other share classes available, please consult the prospectus. Data assumes reinvestment of dividends and capital gains, and none of the charts reflect the deduction of taxes that a shareholder would pay on fund distributions or the redemption of fund shares. Returns for the indices are provided for comparison. The fund’s total returns include operating expenses (such as transaction costs and management fees) that reduce returns, while the total returns of the indices do not.
6
Balanced
Equity Portfolio Managers: Bill Martin, Tom Vaiana
Fixed-Income Portfolio Managers: Dave MacEwen, Bob Gahagan, Brian Howell
Performance Summary
Balanced returned 9.81%* for the fiscal year ended October 31, 2009, compared with the 12.22% return of its benchmark (a blended index consisting of 60% S&P 500 Index and 40% Citigroup US Broad Investment-Grade [BIG] Bond Index).
The positive returns for the fund and its benchmark reflected the broad gains in both the stock and bond markets during the 12-month period. Bonds generated the best results, rising steadily throughout the period, while stocks fell sharply early in the period and then staged a strong rebound over the last seven months.
The fund’s underperformance of its benchmark resulted entirely from the equity portion of the portfolio, which trailed the S&P 500 Index for the period. In contrast, the fixed-income portion of the portfolio essentially matched the performance of the Citigroup BIG Index. (It’s worth noting that the fund’s results reflected operating expenses, while the benchmark’s return did not.)
Security Selection Weighed on the Stock Component
The stock portion of the Balanced fund underperformed the S&P 500 for the 12-month period. Performance in the stock component is driven largely by our stock selection process, and the extreme volatility during the period led to conflicts among several of the factors used in our stock selection model. In particular, value and price momentum were both out of favor at different points during the period, which created significant performance headwinds for the portfolio.
From a sector perspective, stock selection detracted the most in the consumer staples and health care sectors. Security selection among food retailers and an overweight position in food products makers hurt relative results in the consumer staples sector. Agricultural producer Archer-Daniels-Midland was the most significant detractor in this sector, declining amid weaker demand for ethanol and other agricultural commodities. Supermarket chains Safeway and SUPERVALU and food products maker General Mills were also noteworthy detractors.
In the health care sector, stock choices among pharmaceutical firms and health equipment makers were responsible for the bulk of the underper-formance. Medical instruments maker CR Bard, health care provider Humana, and drug maker King Pharmaceuticals were among the biggest individual detractors in the health care sector.
On the positive side, stock selection in the financials and industrials sectors contributed favorably to relative results. Stock selection among commercial banks generated virtually all of the outperformance in the financials sector,
*All fund returns referenced in this commentary are for Investor Class shares.
7
Balanced
led by two Canadian banks—Toronto-Dominion Bank and Bank of Montreal. In the industrials sector, outperformance resulted largely from stock selection among construction and engineering firms and an underweight in industrial conglomerates. The top contributors included aerospace components supplier Goodrich and engineering firm Shaw Group. The portfolio’s two best contributors came from the materials sector—fertilizer producers Terra Industries and CF Industries Holdings. CF rallied after a larger rival launched a takeover bid for the company while it was pursuing its own acquisition of Terra, which also rose on the takeover news.
Fixed-Income Portion In Line with Overall Bond Market
The bond portion of the portfolio kept pace with the Citigroup BIG Index for the 12-month period. Sector allocation added value overall during the period, particularly an underweight position in Treasury bonds and overweight positions in high-quality municipal bonds and Treasury inflation-protected securities (TIPS). As municipal bonds and TIPS outperformed, we gradually took profits and reduced our holdings in these segments.
The portfolio’s position in corporate bonds also contributed positively to performance. We moved from an underweight position in corporate securities early in the period, when corporate bonds were underperforming, to an overweight position as corporate bonds rallied during the latter half of the period. We were selective as we increased our corporate exposure, favoring companies in stable, non-cyclical industries that were capable of improving profitability through innovation or cost reductions. However, this approach led us to limit our exposure to the finance sector and lower-quality securities, both of which rebounded sharply during the corporate bond rally.
We maintained a neutral position for the portfolio’s duration (a measure of interest rate sensitivity) and yield curve exposure relative to the Citigroup BIG Index. With an uncertain economic and financial environment clouding the interest rate outlook, we had greater confidence in our sector allocation and security selection decisions.
Toward the end of the period, we re-established a position in TIPS and initiated a position in German government bonds. This shift into TIPS and non-dollar-denominated bonds reflects our view that the federal government’s massive monetary and fiscal stimulus will eventually result in higher inflation and lower purchasing power for the dollar.
A Look Ahead
While we believe the worst of the financial and economic problems are behind us, the economy remains relatively weak. As corporations continue to cut costs and individuals work toward reducing their debt levels, a recovery in 2010 is likely to be muted. At the same time, we also remain concerned about the long-term potential for higher inflation thanks to the extraordinary monetary and fiscal efforts put forth by the government to ease the credit crisis and recession. Given this environment, both the equity and fixed-income components of the portfolio will remain focused on prudent security selection and risk management.
8
| | |
| Balanced | | |
| |
| Top Ten Stock Holdings as of October 31, 2009 | | |
| | % of equity holdings | % of S&P 500 Index |
| Exxon Mobil Corp. | 4.0% | 3.8% |
| International Business Machines Corp. | 2.4% | 1.7% |
| Johnson & Johnson | 2.4% | 1.8% |
| Microsoft Corp. | 2.3% | 2.4% |
| Apple, Inc. | 2.1% | 1.9% |
| JPMorgan Chase & Co. | 2.1% | 1.8% |
| AT&T, Inc. | 1.8% | 1.7% |
| Procter & Gamble Co. (The) | 1.8% | 1.9% |
| Google, Inc., Class A | 1.7% | 1.4% |
| Cisco Systems, Inc. | 1.6% | 1.4% |
| |
| Top Five Stock Industries as of October 31, 2009 | | |
| | % of equity holdings | % of S&P 500 Index |
| Oil, Gas & Consumable Fuels | 9.6% | 10.5% |
| Pharmaceuticals | 6.2% | 6.6% |
| Software | 4.5% | 4.3% |
| Computers & Peripherals | 4.3% | 4.1% |
| Diversified Financial Services | 4.1% | 4.4% |
| |
| Key Fixed-Income Portfolio Statistics | | |
| | As of 10/31/09 | As of 4/30/09 |
| Weighted Average Life | 6.3 years | 5.6 years |
| Average Duration (Effective) | 4.4 years | 3.8 years |
| |
| Types of Investments in Portfolio | | |
| | % of fund investments | % of fund investments |
| | as of 10/31/09 | as of 4/30/09 |
| Common Stocks | 60.1% | 62.0% |
| Mortgage- & Asset-Backed Securities | 14.9% | 16.9% |
| Corporate Bonds | 10.0% | 8.3% |
| U.S. Treasury Securities | 10.0% | 5.7% |
| U.S. Government Agency Securities and Equivalents | 3.7% | 1.8% |
| Municipal Securities | 0.6% | 3.2% |
| Sovereign Governments & Agencies | 0.2% | —(1) |
| Temporary Cash Investments | 0.5% | 2.1% |
| (1) Category is less than 0.05% of total net assets. | | |
9
|
| Shareholder Fee Example (Unaudited) |
Fund shareholders may incur two types of costs: (1) transaction costs, including sales charges (loads) on purchase payments and redemption/ exchange fees; and (2) ongoing costs, including management fees; distribution and service (12b-1) fees; and other fund expenses. This example is intended to help you understand your ongoing costs (in dollars) of investing in your fund and to compare these costs with the ongoing cost of investing in other mutual funds.
The example is based on an investment of $1,000 made at the beginning of the period and held for the entire period from May 1, 2009 to October 31, 2009.
Actual Expenses
The table provides information about actual account values and actual expenses for each class. You may use the information, together with the amount you invested, to estimate the expenses that you paid over the period. First, identify the share class you own. Then simply divide your account value by $1,000 (for example, an $8,600 account value divided by $1,000 = 8.6), then multiply the result by the number under the heading “Expenses Paid During Period” to estimate the expenses you paid on your account during this period.
If you hold Investor Class shares of any American Century Investments fund, or Institutional Class shares of the American Century Diversified Bond Fund, in an American Century Investments account (i.e., not a financial intermediary or retirement plan account), American Century Investments may charge you a $12.50 semiannual account maintenance fee if the value of those shares is less than $10,000. We will redeem shares automatically in one of your accounts to pay the $12.50 fee. In determining your total eligible investment amount, we will include your investments in all personal accounts (including American Century Investments Brokerage accounts) registered under your Social Security number. Personal accounts include individual accounts, joint accounts, UGMA/UTMA accounts, personal trusts, Coverdell Education Savings Accounts and IRAs (including traditional, Roth, Rollover, SEP-, SARSEP- and SIMPLE-IRAs), and certain other retirement accounts. If you have only business, business retirement, employer-sponsored or American Century Investments Brokerage accounts, you are currently not subject to this fee. We will not charge the fee as long as you choose to manage your accounts exclusively online. If you are subject to the Account Maintenance Fee, your account value could be reduced by the fee amount.
Hypothetical Example for Comparison Purposes
The table also provides information about hypothetical account values and hypothetical expenses based on the actual expense ratio of each class of your fund and an assumed rate of return of 5% per year before expenses, which is not the actual return of a fund’s share class. The hypothetical account values and expenses may not be used to estimate the actual ending account balance or expenses you paid for the period. You may use this information to compare the ongoing costs of investing in your fund and other funds. To do so, compare this 5% hypothetical example with the 5% hypothetical examples that appear in the shareholder reports of the other funds.
10
Please note that the expenses shown in the table are meant to highlight your ongoing costs only and do not reflect any transactional costs, such as sales charges (loads) or redemption/exchange fees. Therefore, the table is useful in comparing ongoing costs only, and will not help you determine the relative total costs of owning different funds. In addition, if these transactional costs were included, your costs would have been higher.
| | | | |
| | Beginning | Ending | Expenses Paid | |
| | Account Value | Account Value | During Period* | Annualized |
| | 5/1/09 | 10/31/09 | 5/1/09 – 10/31/09 | Expense Ratio* |
| Actual | | | | |
| Investor Class | $1,000 | $1,136.90 | $4.85 | 0.90% |
| Institutional Class | $1,000 | $1,138.90 | $3.77 | 0.70% |
| Hypothetical | | | | |
| Investor Class | $1,000 | $1,020.67 | $4.58 | 0.90% |
| Institutional Class | $1,000 | $1,021.68 | $3.57 | 0.70% |
| *Expenses are equal to the class’s annualized expense ratio listed in the table above, multiplied by the average account value over the period, |
| multiplied by 184, the number of days in the most recent fiscal half-year, divided by 365, to reflect the one-half year period. |
11
| | | | | | |
| Balanced | | | | | | |
| |
| OCTOBER 31, 2009 | | | | | | |
| |
| | Shares/ | | | | Shares/ | |
| | Principal | | | | Principal | |
| | Amount | Value | | | Amount | Value |
| Common Stocks — 59.9% | | | Fortress Investment | | |
| | | | | Group LLC, Class A(1) | 127,663 | $ 534,908 |
| AEROSPACE & DEFENSE — 1.1% | | | Goldman Sachs | | |
| General Dynamics Corp. | 19,808 | $ 1,241,962 | | Group, Inc. (The) | 21,696 | 3,692,008 |
| Goodrich Corp. | 14,510 | 788,618 | | Morgan Stanley | 54,580 | 1,753,110 |
| L-3 Communications | | | | TD Ameritrade | | |
| Holdings, Inc. | 8,527 | 616,417 | | Holding Corp.(1) | 28,220 | 544,646 |
| Northrop Grumman Corp. | 11,391 | 571,031 | | | | 10,357,956 |
| Raytheon Co. | 43,496 | 1,969,499 | | CHEMICALS — 0.8% | | |
| | | 5,187,527 | | CF Industries Holdings, Inc. | 13,250 | 1,103,062 |
| AIR FREIGHT & LOGISTICS — 0.6% | | | Huntsman Corp. | 107,862 | 857,503 |
| C.H. Robinson Worldwide, Inc. | 5,982 | 329,668 | | OM Group, Inc.(1) | 10,087 | 272,551 |
| FedEx Corp. | 9,664 | 702,476 | | Terra Industries, Inc. | 30,157 | 958,088 |
| United Parcel Service, Inc., | | | | Valspar Corp. | 16,671 | 422,943 |
| Class B | 31,292 | 1,679,755 | | | | 3,614,147 |
| | | 2,711,899 | | COMMERCIAL BANKS — 1.5% | |
| AIRLINES — 0.1% | | | | Bank of Montreal | 5,854 | 271,450 |
| Copa Holdings SA, Class A | 1,645 | 69,468 | | Canadian Imperial Bank | | |
| Southwest Airlines Co. | 24,782 | 208,169 | | of Commerce | 523 | 29,879 |
| | | 277,637 | | Toronto-Dominion Bank (The) | 35,335 | 2,022,575 |
| AUTO COMPONENTS — 0.6% | | | | U.S. Bancorp. | 16,504 | 383,223 |
| Gentex Corp. | 49,440 | 791,534 | | Valley National Bancorp. | 2,922 | 38,804 |
| TRW Automotive | | | | Wells Fargo & Co. | 149,947 | 4,126,542 |
| Holdings Corp.(1) | 60,725 | 950,346 | | | | |
| | | | | | | 6,872,473 |
| WABCO Holdings, Inc. | 39,527 | 937,581 | | COMMERCIAL SERVICES & SUPPLIES(2) | |
| | | 2,679,461 | | | | |
| | | | | Waste Management, Inc. | 2,370 | 70,816 |
| BEVERAGES — 1.1% | | | | | | |
| | | | | COMMUNICATIONS EQUIPMENT — 2.0% | |
| Coca-Cola Co. (The) | 58,689 | 3,128,711 | | | | |
| | | | | Ciena Corp.(1) | 24,606 | 288,628 |
| Coca-Cola Enterprises, Inc. | 73,576 | 1,403,094 | | | | |
| | | | | Cisco Systems, Inc.(1) | 199,104 | 4,549,526 |
| PepsiCo, Inc. | 9,409 | 569,715 | | | | |
| | | | | CommScope, Inc.(1) | 10,729 | 289,898 |
| | | 5,101,520 | | | | |
| BIOTECHNOLOGY — 1.3% | | | | Palm, Inc.(1) | 16,032 | 186,132 |
| Amgen, Inc.(1) | 68,930 | 3,703,609 | | Plantronics, Inc. | 12,341 | 297,541 |
| | | | | Polycom, Inc.(1) | 15,066 | 323,467 |
| Biogen Idec, Inc.(1) | 6,484 | 273,171 | | | | |
| Celgene Corp.(1) | 12,942 | 660,689 | | QUALCOMM, Inc. | 68,904 | 2,853,315 |
| | | | | Research In Motion Ltd.(1) | 7,211 | 423,502 |
| Gilead Sciences, Inc.(1) | 36,095 | 1,535,842 | | | | |
| | | | | Tellabs, Inc.(1) | 34,467 | 207,491 |
| | | 6,173,311 | | | | |
| BUILDING PRODUCTS — 0.1% | | | | | 9,419,500 |
| Masco Corp. | 39,661 | 466,017 | | COMPUTERS & PERIPHERALS — 2.6% | |
| CAPITAL MARKETS — 2.2% | | | | Apple, Inc.(1) | 31,479 | 5,933,792 |
| Bank of New York Mellon | | | | EMC Corp.(1) | 33,869 | 557,822 |
| Corp. (The) | 51,623 | 1,376,269 | | Hewlett-Packard Co. | 60,713 | 2,881,439 |
| BlackRock, Inc. | 4,721 | 1,022,049 | | NCR Corp.(1) | 37,222 | 377,803 |
| Blackstone Group LP (The) | 62,009 | 832,161 | | SanDisk Corp.(1) | 20,162 | 412,918 |
| Federated Investors, Inc., | | | | | | |
| Class B | 22,964 | 602,805 | | | | |
12
| | | | | | |
| Balanced | | | | | | |
| |
| | Shares/ | | | | Shares/ | |
| | Principal | | | | Principal | |
| | Amount | Value | | | Amount | Value |
| Seagate Technology | 75,945 | $ 1,059,433 | | ENERGY EQUIPMENT & SERVICES — 2.2% | |
| Western Digital Corp.(1) | 26,350 | 887,468 | | Baker Hughes, Inc. | 13,301 | $ 559,573 |
| | | 12,110,675 | | BJ Services Co. | 50,865 | 976,608 |
| CONSTRUCTION & ENGINEERING — 0.4% | | | Diamond Offshore | | |
| EMCOR Group, Inc.(1) | 20,185 | 476,770 | | Drilling, Inc. | 10,266 | 977,837 |
| Fluor Corp. | 23,359 | 1,037,607 | | ENSCO International, Inc. | 23,702 | 1,085,315 |
| Shaw Group, Inc. (The)(1) | 7,148 | 183,417 | | Halliburton Co. | 51,274 | 1,497,714 |
| URS Corp.(1) | 5,828 | 226,476 | | Helix Energy Solutions | | |
| | | | | Group, Inc.(1) | 2,882 | 39,570 |
| | | 1,924,270 | | National Oilwell Varco, Inc.(1) | 35,896 | 1,471,377 |
| CONSUMER FINANCE(2) | | | | | | |
| | | | | Noble Corp. | 1,260 | 51,332 |
| Discover Financial Services | 7,574 | 107,096 | | Oil States | | |
| CONTAINERS & PACKAGING — 0.6% | | | International, Inc.(1) | 15,689 | 540,329 |
| Pactiv Corp.(1) | 89,429 | 2,064,916 | | Schlumberger Ltd. | 36,436 | 2,266,319 |
| Rock-Tenn Co., Class A | 13,409 | 587,314 | | Transocean Ltd.(1) | 10,475 | 878,957 |
| Sonoco Products Co. | 5,654 | 151,244 | | | | 10,344,931 |
| | | 2,803,474 | | FOOD & STAPLES RETAILING — 1.4% | |
| DIVERSIFIED FINANCIAL SERVICES — 2.5% | | | Kroger Co. (The) | 11,518 | 266,411 |
| Bank of America Corp. | 268,031 | 3,907,892 | | SUPERVALU, INC. | 26,776 | 424,935 |
| Citigroup, Inc. | 210,367 | 860,401 | | SYSCO Corp. | 82,892 | 2,192,493 |
| CME Group, Inc. | 2,795 | 845,795 | | Wal-Mart Stores, Inc. | 76,692 | 3,810,059 |
| JPMorgan Chase & Co. | 139,555 | 5,829,212 | | | | 6,693,898 |
| | | 11,443,300 | | FOOD PRODUCTS — 1.0% | | |
| DIVERSIFIED TELECOMMUNICATION | | | Archer-Daniels-Midland Co. | 42,583 | 1,282,600 |
| SERVICES — 1.5% | | | | ConAgra Foods, Inc. | 64,473 | 1,353,933 |
| AT&T, Inc. | 196,640 | 5,047,749 | | Dean Foods Co.(1) | 12,206 | 222,515 |
| CenturyTel, Inc. | 2,380 | 77,255 | | Fresh Del Monte | | |
| Verizon Communications, Inc. | 63,382 | 1,875,473 | | Produce, Inc.(1) | 2,569 | 55,773 |
| Windstream Corp. | 4,246 | 40,931 | | General Mills, Inc. | 549 | 36,190 |
| | | 7,041,408 | | Hershey Co. (The) | 2,188 | 82,685 |
| ELECTRIC UTILITIES — 0.6% | | | | J.M. Smucker Co. (The) | 12,066 | 636,240 |
| Entergy Corp. | 17,677 | 1,356,179 | | Kraft Foods, Inc., Class A | 26,626 | 732,748 |
| Exelon Corp. | 8,237 | 386,810 | | Lancaster Colony Corp. | 4,264 | 207,145 |
| FPL Group, Inc. | 25,596 | 1,256,764 | | | | 4,609,829 |
| | | 2,999,753 | | GAS UTILITIES — 0.1% | | |
| ELECTRICAL EQUIPMENT — 0.2% | | | New Jersey Resources Corp. | 5,528 | 194,586 |
| Cooper Industries plc, | | | | UGI Corp. | 7,238 | 172,843 |
| Class A | 8,692 | 336,293 | | | | 367,429 |
| GrafTech International Ltd.(1) | 46,504 | 627,804 | | | | |
| | | | | HEALTH CARE EQUIPMENT & SUPPLIES — 1.4% |
| | | 964,097 | | Becton, Dickinson & Co. | 5,395 | 368,802 |
| ELECTRONIC EQUIPMENT, | | | | Boston Scientific Corp.(1) | 115,937 | 941,408 |
| INSTRUMENTS & COMPONENTS — 0.5% | | | | | |
| Arrow Electronics, Inc.(1) | 25,855 | 655,166 | | C.R. Bard, Inc. | 26,163 | 1,964,056 |
| | | | | Gen-Probe, Inc.(1) | 187 | 7,802 |
| Celestica, Inc.(1) | 140,913 | 1,169,578 | | | | |
| | | | | Hospira, Inc.(1) | 2,930 | 130,795 |
| Molex, Inc. | 9,878 | 184,422 | | | | |
| | | | | Intuitive Surgical, Inc.(1) | 5,625 | 1,385,719 |
| Tech Data Corp.(1) | 2,330 | 89,542 | | | | |
| | | 2,098,708 | | Medtronic, Inc. | 17,081 | 609,792 |
13
| | | | | | |
| Balanced | | | | | | |
| |
| | Shares/ | | | | Shares/ | |
| | Principal | | | | Principal | |
| | Amount | Value | | | Amount | Value |
| St. Jude Medical, Inc.(1) | 10,657 | $ 363,191 | | Aspen Insurance | | |
| STERIS Corp. | 20,949 | 612,968 | | Holdings Ltd. | 11,911 | $ 307,304 |
| | | 6,384,533 | | Berkshire Hathaway, Inc., | | |
| | | | | Class A(1) | 13 | 1,287,000 |
| HEALTH CARE PROVIDERS & SERVICES — 1.1% | | | | |
| | | | | Chubb Corp. (The) | 17,860 | 866,567 |
| Cardinal Health, Inc. | 52,700 | 1,493,518 | | | | |
| | | | | CNA Financial Corp.(1) | 26,920 | 586,048 |
| Coventry Health Care, Inc.(1) | 8,269 | 163,974 | | | | |
| | | | | Endurance Specialty | | |
| Humana, Inc.(1) | 34,498 | 1,296,435 | | Holdings Ltd. | 21,074 | 758,453 |
| Magellan Health | | | | MetLife, Inc. | 18,516 | 630,100 |
| Services, Inc.(1) | 9,824 | 315,645 | | | | |
| | | | | Prudential Financial, Inc. | 43,458 | 1,965,605 |
| Medco Health | | | | | | |
| Solutions, Inc.(1) | 22,121 | 1,241,430 | | | | 8,457,600 |
| WellCare Health Plans, Inc.(1) | 19,298 | 504,257 | | INTERNET & CATALOG RETAIL — 0.4% | |
| | | | | Amazon.com, Inc.(1) | 8,045 | 955,826 |
| | | 5,015,259 | | | | |
| HOTELS, RESTAURANTS & LEISURE — 0.5% | | | Netflix, Inc.(1) | 14,437 | 771,658 |
| McDonald’s Corp. | 8,254 | 483,767 | | | | 1,727,484 |
| Panera Bread Co., Class A(1) | 16,194 | 971,316 | | INTERNET SOFTWARE & SERVICES — 1.1% | |
| | | | | Google, Inc., Class A(1) | 8,653 | 4,639,046 |
| WMS Industries, Inc.(1) | 17,177 | 686,737 | | | | |
| | | 2,141,820 | | Sohu.com, Inc.(1) | 4,514 | 250,979 |
| HOUSEHOLD DURABLES — 0.6% | | | VeriSign, Inc.(1) | 10,074 | 229,788 |
| Harman International | | | | | | 5,119,813 |
| Industries, Inc. | 27,148 | 1,021,037 | | IT SERVICES — 2.4% | | |
| NVR, Inc.(1) | 2,775 | 1,837,799 | | Affiliated Computer | | |
| | | 2,858,836 | | Services, Inc., Class A(1) | 7,958 | 414,532 |
| HOUSEHOLD PRODUCTS — 1.5% | | | Convergys Corp.(1) | 28,783 | 312,295 |
| Clorox Co. | 6,425 | 380,553 | | Global Payments, Inc. | 13,069 | 643,387 |
| Colgate-Palmolive Co. | 7,439 | 584,928 | | International Business | | |
| Kimberly-Clark Corp. | 18,537 | 1,133,723 | | Machines Corp. | 56,113 | 6,767,789 |
| | | | | SAIC, Inc.(1) | 28,702 | 508,312 |
| Procter & Gamble Co. (The) | 85,248 | 4,944,384 | | | | |
| | | 7,043,588 | | Visa, Inc., Class A | 11,614 | 879,877 |
| INDEPENDENT POWER PRODUCERS & | | | Western Union Co. (The) | 86,386 | 1,569,634 |
| ENERGY TRADERS — 0.8% | | | | | | 11,095,826 |
| Constellation Energy | | | | LEISURE EQUIPMENT & PRODUCTS — 0.1% | |
| Group, Inc. | 26,831 | 829,615 | | Polaris Industries, Inc. | 14,953 | 629,073 |
| Mirant Corp.(1) | 82,700 | 1,156,146 | | LIFE SCIENCES TOOLS & SERVICES — 0.4% | |
| NRG Energy, Inc.(1) | 84,069 | 1,932,746 | | Bruker Corp.(1) | 70,174 | 760,686 |
| | | 3,918,507 | | Millipore Corp.(1) | 17,953 | 1,203,031 |
| INDUSTRIAL CONGLOMERATES — 0.9% | | | | | 1,963,717 |
| 3M Co. | 22,751 | 1,673,791 | | MACHINERY — 1.0% | | |
| Carlisle Cos., Inc. | 9,729 | 301,988 | | AGCO Corp.(1) | 17,559 | 493,584 |
| General Electric Co. | 158,187 | 2,255,747 | | Cummins, Inc. | 17,274 | 743,818 |
| | | 4,231,526 | | Dover Corp. | 4,288 | 161,572 |
| INSURANCE — 1.8% | | | | Graco, Inc. | 25,312 | 697,092 |
| ACE Ltd.(1) | 9,588 | 492,440 | | Joy Global, Inc. | 13,517 | 681,392 |
| Allied World Assurance Co. | | | | Kennametal, Inc. | 16,043 | 377,973 |
| Holdings Ltd. | 12,147 | 543,700 | | Lincoln Electric Holdings, Inc. | 11,779 | 558,796 |
| American Financial | | | | | | |
| Group, Inc. | 41,479 | 1,020,383 | | | | |
14
| | | | | | |
| Balanced | | | | | | |
| |
| | Shares/ | | | | Shares/ | |
| | Principal | | | | Principal | |
| | Amount | Value | | | Amount | Value |
| Navistar International Corp.(1) | 8,858 | $ 293,554 | | Frontier Oil Corp. | 22,458 | $ 311,268 |
| Timken Co. | 23,898 | 526,473 | | McMoRan Exploration Co.(1) | 43,597 | 335,261 |
| | | 4,534,254 | | Murphy Oil Corp. | 20,040 | 1,225,245 |
| MEDIA — 1.4% | | | | Occidental Petroleum Corp. | 31,024 | 2,354,101 |
| CBS Corp., Class B | 3,051 | 35,910 | | Peabody Energy Corp. | 21,922 | 867,892 |
| Comcast Corp., Class A | 161,705 | 2,344,723 | | Tesoro Corp. | 9,606 | 135,829 |
| Interpublic Group of | | | | Valero Energy Corp. | 244 | 4,416 |
| Cos., Inc. (The)(1) | 19,291 | 116,132 | | World Fuel Services Corp. | 12,967 | 659,372 |
| Marvel Entertainment, Inc.(1) | 12,969 | 648,061 | | | | 26,756,193 |
| Scripps Networks | | | | PERSONAL PRODUCTS — 0.2% | |
| Interactive, Inc., Class A | 13,996 | 528,489 | | Mead Johnson Nutrition Co., | | |
| Time Warner, Inc. | 101,244 | 3,049,469 | | Class A | 18,227 | 766,263 |
| | | 6,722,784 | | PHARMACEUTICALS — 3.7% | | |
| METALS & MINING — 0.6% | | | | Abbott Laboratories | 42,450 | 2,146,697 |
| Allegheny Technologies, Inc. | 15,347 | 473,608 | | Eli Lilly & Co. | 86,690 | 2,948,327 |
| Cliffs Natural Resources, Inc. | 12,996 | 462,268 | | Endo Pharmaceuticals | | |
| Freeport-McMoRan | | | | Holdings, Inc.(1) | 20,075 | 449,680 |
| Copper & Gold, Inc.(1) | 8,230 | 603,753 | | Forest Laboratories, Inc.(1) | 32,254 | 892,468 |
| Reliance Steel & | | | | Johnson & Johnson | 112,701 | 6,654,994 |
| Aluminum Co. | 10,714 | 390,847 | | King Pharmaceuticals, Inc.(1) | 45,192 | 457,795 |
| Schnitzer Steel Industries, | | | | | | |
| Inc., Class A | 10,820 | 467,857 | | Pfizer, Inc. | 164,858 | 2,807,532 |
| Worthington Industries, Inc. | 27,523 | 304,129 | | Schering-Plough Corp. | 8,667 | 244,409 |
| | | 2,702,462 | | Valeant Pharmaceuticals | | |
| | | | | International(1) | 21,126 | 621,104 |
| MULTI-INDUSTRY — 0.7% | | | | | | |
| | | | | | | 17,223,006 |
| Financial Select Sector | | | | | | |
| SPDR Fund | 225,419 | 3,160,374 | | PROFESSIONAL SERVICES — 0.1% | |
| MULTILINE RETAIL — 0.2% | | | | Manpower, Inc. | 8,988 | 426,121 |
| Dollar Tree, Inc.(1) | 10,634 | 479,912 | | Watson Wyatt Worldwide, | | |
| | | | | Inc., Class A | 5,427 | 236,509 |
| Family Dollar Stores, Inc. | 16,142 | 456,819 | | | | 662,630 |
| Sears Holdings Corp.(1) | 1,365 | 92,629 | | | | |
| | | | | REAL ESTATE INVESTMENT TRUSTS (REITs) — 0.6% |
| | | 1,029,360 | | Host Hotels & Resorts, Inc. | 17,078 | 172,658 |
| MULTI-UTILITIES — 0.6% | | | | Public Storage | 1,636 | 120,410 |
| DTE Energy Co. | 1,444 | 53,399 | | Simon Property Group, Inc. | 4,383 | 297,562 |
| Integrys Energy Group, Inc. | 10,342 | 357,833 | | SPDR Dow Jones REIT Fund | 48,165 | 2,096,622 |
| Public Service Enterprise | | | | | | 2,687,252 |
| Group, Inc. | 74,333 | 2,215,124 | | | | |
| | | 2,626,356 | | ROAD & RAIL — 0.6% | | |
| | | | | Burlington Northern | | |
| OIL, GAS & CONSUMABLE FUELS — 5.7% | | | Santa Fe Corp. | 8,258 | 621,992 |
| Alpha Natural | | | | CSX Corp. | 12,805 | 540,115 |
| Resources, Inc.(1) | 19,109 | 649,133 | | | | |
| Anadarko Petroleum Corp. | 17,777 | 1,083,153 | | Norfolk Southern Corp. | 11,322 | 527,832 |
| Apache Corp. | 15,368 | 1,446,436 | | Union Pacific Corp. | 18,569 | 1,023,895 |
| Chevron Corp. | 48,821 | 3,736,759 | | | | 2,713,834 |
| | | | | SEMICONDUCTORS & SEMICONDUCTOR | |
| ConocoPhillips | 47,450 | 2,381,041 | | EQUIPMENT — 1.7% | | |
| Devon Energy Corp. | 7,944 | 514,056 | | Applied Materials, Inc. | 57,743 | 704,465 |
| Exxon Mobil Corp. | 154,210 | 11,052,231 | | Broadcom Corp., Class A(1) | 22,230 | 591,540 |
15
| | | | | | |
| Balanced | | | | | | |
| |
| | Shares/ | | | | Shares/ | |
| | Principal | | | | Principal | |
| | Amount | Value | | | Amount | Value |
| Cypress Semiconductor | | | | U.S. Government Agency | |
| Corp.(1) | 30,943 | $ 260,849 | | | | |
| | | | | Mortgage-Backed Securities(3) — 13.1% |
| Intel Corp. | 131,981 | 2,522,157 | | | | |
| Lam Research Corp.(1) | 3,607 | 121,628 | | FHLMC, 7.00%, 10/1/12(4) | $ 52,295 | $ 55,174 |
| LSI Corp.(1) | 83,031 | 425,119 | | FHLMC, 4.50%, 1/1/19(4) | 1,583,792 | 1,679,075 |
| Marvell Technology | | | | FHLMC, 6.50%, 1/1/28(4) | 99,771 | 108,176 |
| Group Ltd.(1) | 10,588 | 145,267 | | FHLMC, 5.50%, 12/1/33(4) | 864,842 | 915,666 |
| ON Semiconductor Corp.(1) | 37,373 | 250,025 | | FHLMC, 5.50%, 1/1/38(4) | 2,505,269 | 2,644,666 |
| Skyworks Solutions, Inc.(1) | 98,420 | 1,026,521 | | FHLMC, 6.00%, 8/1/38 | 870,922 | 926,713 |
| Tessera Technologies, Inc.(1) | 9,532 | 210,753 | | FHLMC, 6.50%, 7/1/47(4) | 163,941 | 175,086 |
| Texas Instruments, Inc. | 65,720 | 1,541,134 | | FNMA, 6.50%, 5/1/11(4) | 6,543 | 6,874 |
| Xilinx, Inc. | 11,598 | 252,256 | | FNMA, 7.50%, 11/1/11(4) | 61,705 | 64,451 |
| | | 8,051,714 | | FNMA, 6.50%, 5/1/13(4) | 2,969 | 3,194 |
| SOFTWARE — 2.7% | | | | FNMA, 6.50%, 5/1/13(4) | 6,545 | 7,039 |
| Adobe Systems, Inc.(1) | 14,874 | 489,950 | | FNMA, 6.50%, 6/1/13(4) | 1,125 | 1,210 |
| Autodesk, Inc.(1) | 31,658 | 789,234 | | FNMA, 6.50%, 6/1/13(4) | 9,354 | 10,061 |
| Microsoft Corp. | 232,475 | 6,446,532 | | FNMA, 6.50%, 6/1/13(4) | 15,376 | 16,538 |
| Oracle Corp. | 111,603 | 2,354,823 | | FNMA, 6.50%, 6/1/13(4) | 17,817 | 19,163 |
| Quest Software, Inc.(1) | 10,576 | 177,359 | | | | |
| | | | | FNMA, 6.00%, 1/1/14(4) | 59,354 | 63,981 |
| Sybase, Inc.(1) | 34,674 | 1,371,703 | | | | |
| | | | | FNMA, 6.00%, 4/1/14(4) | 214,389 | 231,102 |
| Symantec Corp.(1) | 22,379 | 393,423 | | | | |
| | | | | FNMA, 4.50%, 5/1/19(4) | 578,623 | 611,083 |
| Synopsys, Inc.(1) | 23,684 | 521,048 | | | | |
| | | | | FNMA, 4.50%, 5/1/19(4) | 1,250,341 | 1,320,484 |
| | | 12,544,072 | | FNMA, 5.00%, 9/1/20(4) | 2,600,120 | 2,763,818 |
| SPECIALTY RETAIL — 1.0% | | | | FNMA, 6.50%, 1/1/28(4) | 26,732 | 28,971 |
| AutoZone, Inc.(1) | 1,078 | 145,864 | | | | |
| | | | | FNMA, 7.00%, 1/1/28(4) | 121,988 | 135,159 |
| Gap, Inc. (The) | 70,540 | 1,505,324 | | | | |
| | | | | FNMA, 6.50%, 1/1/29(4) | 113,800 | 123,617 |
| RadioShack Corp. | 11,142 | 188,188 | | | | |
| | | | | FNMA, 7.50%, 7/1/29(4) | 165,159 | 187,042 |
| Ross Stores, Inc. | 44,426 | 1,955,188 | | | | |
| | | | | FNMA, 7.50%, 9/1/30(4) | 59,765 | 67,675 |
| Sherwin-Williams Co. (The) | 8,932 | 509,481 | | | | |
| | | | | FNMA, 6.50%, 9/1/31(4) | 100,138 | 108,588 |
| Tractor Supply Co.(1) | 2,494 | 111,482 | | | | |
| | | 4,415,527 | | FNMA, 7.00%, 9/1/31(4) | 38,308 | 42,416 |
| TEXTILES, APPAREL & LUXURY GOODS — 0.3% | | FNMA, 6.50%, 1/1/32(4) | 175,460 | 190,157 |
| Jones Apparel Group, Inc. | 6,878 | 123,047 | | FNMA, 7.00%, 6/1/32(4) | 413,413 | 455,940 |
| Liz Claiborne, Inc. | 49,102 | 281,846 | | FNMA, 6.50%, 8/1/32(4) | 175,989 | 190,731 |
| Polo Ralph Lauren Corp. | 12,178 | 906,287 | | FNMA, 5.50%, 6/1/33(4) | 1,136,729 | 1,202,465 |
| | | 1,311,180 | | FNMA, 5.50%, 7/1/33(4) | 1,458,992 | 1,543,364 |
| TOBACCO — 0.8% | | | | FNMA, 5.50%, 8/1/33(4) | 1,316,894 | 1,393,049 |
| Altria Group, Inc. | 15,146 | 274,294 | | FNMA, 5.50%, 9/1/33(4) | 802,827 | 849,254 |
| Philip Morris | | | | FNMA, 5.00%, 11/1/33(4) | 4,104,341 | 4,270,991 |
| International, Inc. | 70,946 | 3,360,003 | | FNMA, 5.50%, 1/1/34(4) | 6,052,184 | 6,412,903 |
| | | 3,634,297 | | | | |
| | | | | FNMA, 4.50%, 9/1/35(4) | 3,922,460 | 3,989,328 |
| TOTAL COMMON STOCKS | | | | | | |
| (Cost $242,935,118) | | 278,570,272 | | FNMA, 5.00%, 2/1/36(4) | 4,472,498 | 4,647,807 |
| | | | | FNMA, 5.50%, 4/1/36(4) | 1,894,416 | 2,000,711 |
| | | | | FNMA, 5.50%, 5/1/36(4) | 3,774,829 | 3,986,634 |
16
| | | | | | |
| Balanced | | | | | | |
| |
| |
| | Shares/ | | | | Shares/ | |
| | Principal | | | | Principal | |
| | Amount | Value | | | Amount | Value |
| FNMA, 5.50%, 2/1/37(4) | $ 1,363,690 | $ 1,437,863 | | Dr Pepper Snapple Group, | | |
| FNMA, 6.00%, 7/1/37 | 7,723,468 | 8,219,876 | | Inc., 6.82%, 5/1/18(4) | $ 230,000 | $ 263,038 |
| FNMA, 6.50%, 8/1/37(4) | 2,999,263 | 3,215,352 | | SABMiller plc, 6.20%, | | |
| | | | | 7/1/11(4)(5) | 230,000 | 244,989 |
| FNMA, 6.50%, 6/1/47(4) | 121,663 | 130,010 | | | | |
| | | | | | | 1,089,614 |
| FNMA, 6.50%, 8/1/47(4) | 717,897 | 767,152 | | | | |
| | | | | CAPITAL MARKETS — 0.8% | | |
| FNMA, 6.50%, 9/1/47(4) | 48,719 | 52,062 | | Bank of New York Mellon | | |
| FNMA, 6.50%, 9/1/47(4) | 797,406 | 852,116 | | Corp. (The), 4.30%, 5/15/14 | 240,000 | 253,198 |
| FNMA, 6.50%, 9/1/47(4) | 1,037,726 | 1,108,924 | | Credit Suisse (New York), | | |
| | | | | 5.00%, 5/15/13(4) | 340,000 | 363,112 |
| GNMA, 7.00%, 4/20/26(4) | 159,289 | 174,333 | | | | |
| GNMA, 7.50%, 8/15/26(4) | 86,581 | 98,106 | | Credit Suisse (New York), | | |
| | | | | 5.50%, 5/1/14(4) | 200,000 | 217,096 |
| GNMA, 7.00%, 2/15/28(4) | 33,091 | 36,578 | | | | |
| | | | | Credit Suisse (New York), | | |
| GNMA, 7.50%, 2/15/28(4) | 71,737 | 81,433 | | 5.30%, 8/13/19(4) | 230,000 | 238,145 |
| GNMA, 7.00%, 12/15/28(4) | 54,678 | 60,440 | | Deutsche Bank AG | | |
| GNMA, 7.00%, 5/15/31(4) | 188,413 | 208,420 | | (London), 4.875%, | | |
| | | | | 5/20/13(4) | 330,000 | 352,666 |
| GNMA, 5.50%, 11/15/32(4) | 1,175,844 | 1,250,417 | | | | |
| | | | | Goldman Sachs Group, Inc. | | |
| TOTAL U.S. GOVERNMENT AGENCY | | | (The), 6.00%, 5/1/14(4) | 150,000 | 165,068 |
| MORTGAGE-BACKED SECURITIES | | | | | |
| (Cost $57,603,700) | | 61,143,438 | | Goldman Sachs Group, Inc. | | |
| | | | | (The), 7.50%, 2/15/19(4) | 850,000 | 995,017 |
| Corporate Bonds — 10.0% | | | Jefferies Group, Inc., | | |
| AEROSPACE & DEFENSE — 0.5% | | | 8.50%, 7/15/19(4) | 130,000 | 141,318 |
| BAE Systems Holdings, Inc., | | | | Morgan Stanley, 6.625%, | | |
| 6.375%, 6/1/19(4)(5) | 140,000 | 153,661 | | 4/1/18(4) | 320,000 | 343,321 |
| Honeywell International, Inc., | | | | Morgan Stanley, 7.30%, | | |
| 5.30%, 3/15/17(4) | 262,000 | 281,960 | | 5/13/19(4) | 390,000 | 437,413 |
| Honeywell International, Inc., | | | | Morgan Stanley, 5.625%, | | |
| 5.30%, 3/1/18(4) | 230,000 | 247,355 | | 9/23/19(4) | 250,000 | 251,854 |
| L-3 Communications Corp., | | | | UBS AG (Stamford Branch), | | |
| 5.875%, 1/15/15(4) | 160,000 | 156,400 | | 5.75%, 4/25/18(4) | 130,000 | 132,712 |
| L-3 Communications Corp., | | | | | | 3,890,920 |
| 5.20%, 10/15/19(4)(5) | 130,000 | 131,476 | | CHEMICALS — 0.1% | | |
| Lockheed Martin Corp., | | | | Dow Chemical Co. (The), | | |
| 6.15%, 9/1/36(4) | 378,000 | 418,180 | | 8.55%, 5/15/19(4) | 130,000 | 148,560 |
| United Technologies Corp., | | | | Rohm & Haas Co., 5.60%, | | |
| 6.05%, 6/1/36(4) | 454,000 | 501,185 | | 3/15/13(4) | 240,000 | 251,123 |
| United Technologies Corp., | | | | | | 399,683 |
| 6.125%, 7/15/38(4) | 200,000 | 223,060 | | COMMERCIAL BANKS — 0.3% | |
| | | 2,113,277 | | Barclays Bank plc, 5.00%, | | |
| AUTOMOBILES — 0.1% | | | | 9/22/16(4) | 100,000 | 102,345 |
| Daimler Finance N.A. LLC, | | | | BB&T Corp., 5.70%, | | |
| 5.875%, 3/15/11(4) | 260,000 | 271,321 | | 4/30/14(4) | 150,000 | 162,468 |
| BEVERAGES — 0.2% | | | | PNC Bank N.A., 6.00%, | | |
| Anheuser-Busch InBev | | | | 12/7/17(4) | 290,000 | 296,218 |
| Worldwide, Inc., 3.00%, | | | | SunTrust Bank, 7.25%, | | |
| 10/15/12(4)(5) | 300,000 | 302,809 | | 3/15/18(4) | 110,000 | 115,804 |
| Anheuser-Busch InBev | | | | Wachovia Bank N.A., 4.80%, | | |
| Worldwide, Inc., 6.875%, | | | | 11/1/14(4) | 373,000 | 378,484 |
| 11/15/19(5) | 250,000 | 278,778 | | Wachovia Bank N.A., | | |
| | | | | 4.875%, 2/1/15(4) | 123,000 | 126,299 |
17
| | | | | | |
| Balanced | | | | | | |
| |
| |
| | Shares/ | | | | Shares/ | |
| | Principal | | | | Principal | |
| | Amount | Value | | | Amount | Value |
| Wells Fargo & Co., 5.625%, | | | | DIVERSIFIED TELECOMMUNICATION | |
| 12/11/17(4) | $ 50,000 $ | 52,056 | | SERVICES — 0.8% | | |
| Wells Fargo Bank N.A., | | | | Alltel Corp., 7.875%, | | |
| 6.45%, 2/1/11(4) | 140,000 | 147,684 | | 7/1/32(4) | $ 100,000 | $ 121,431 |
| | | 1,381,358 | | AT&T, Inc., 6.80%, | | |
| COMMERCIAL SERVICES & SUPPLIES — 0.2% | | 5/15/36(4) | 350,000 | 385,244 |
| Allied Waste North America, | | | | AT&T, Inc., 6.55%, | | |
| Inc., 6.375%, 4/15/11(4) | 180,000 | 190,109 | | 2/15/39(4) | 470,000 | 509,930 |
| Corrections Corp. of | | | | Cellco Partnership/Verizon | | |
| America, 6.25%, 3/15/13(4) | 250,000 | 250,000 | | Wireless Capital LLC, 8.50%, | | |
| | | | | 11/15/18(4)(5) | 500,000 | 623,725 |
| Republic Services, Inc., | | | | | | |
| 5.50%, 9/15/19(4)(5) | 140,000 | 144,585 | | CenturyTel, Inc., 7.60%, | | |
| | | | | 9/15/39(4) | 120,000 | 117,709 |
| Waste Management, Inc., | | | | | | |
| 7.375%, 3/11/19(4) | 190,000 | 221,741 | | Embarq Corp., 7.08%, | | |
| | | | | 6/1/16(4) | 219,000 | 239,489 |
| | | 806,435 | | | | |
| | | | | Koninklijke KPN NV, 8.375%, | | |
| CONSUMER FINANCE — 0.4% | | | 10/1/30(4) | 80,000 | 101,737 |
| American Express Centurion | | | | Qwest Corp., 7.875%, | | |
| Bank, 5.55%, 10/17/12(4) | 150,000 | 160,234 | | | | |
| | | | | 9/1/11(4) | 120,000 | 124,500 |
| American Express Centurion | | | | Qwest Corp., 7.50%, | | |
| Bank, 6.00%, 9/13/17 | 250,000 | 263,158 | | 10/1/14(4) | 200,000 | 203,000 |
| American Express Co., | | | | Sprint Capital Corp., 7.625%, | | |
| 7.25%, 5/20/14(4) | 100,000 | 113,879 | | | | |
| | | | | 1/30/11(4) | 180,000 | 182,925 |
| Capital One Bank USA N.A., | | | | Telecom Italia Capital SA, | | |
| 8.80%, 7/15/19(4) | 250,000 | 296,406 | | | | |
| | | | | 6.18%, 6/18/14(4) | 340,000 | 369,115 |
| General Electric Capital | | | | Telefonica Emisiones SAU, | | |
| Corp., 4.375%, 9/21/15(4) | 200,000 | 203,671 | | | | |
| | | | | 5.88%, 7/15/19(4) | 220,000 | 238,128 |
| General Electric Capital | | | | Telefonica Emisiones SAU, | | |
| Corp., 5.625%, 9/15/17(4) | 450,000 | 465,392 | | | | |
| | | | | 7.05%, 6/20/36(4) | 280,000 | 330,645 |
| General Electric Capital | | | | Verizon Communications, | | |
| Corp., 6.00%, 8/7/19(4) | 150,000 | 157,839 | | | | |
| | | | | Inc., 6.40%, 2/15/38(4) | 70,000 | 74,839 |
| | | 1,660,579 | | | | 3,622,417 |
| DIVERSIFIED FINANCIAL SERVICES — 0.6% | | | ELECTRIC UTILITIES — 0.3% | | |
| Bank of America Corp., | | | | Carolina Power & Light Co., | | |
| 6.50%, 8/1/16(4) | 220,000 | 235,694 | | | | |
| | | | | 5.15%, 4/1/15(4) | 100,000 | 107,960 |
| Bank of America Corp., | | | | Cleveland Electric | | |
| 7.625%, 6/1/19(4) | 150,000 | 173,268 | | | | |
| | | | | Illuminating Co. (The), | | |
| Bank of America N.A., | | | | 5.70%, 4/1/17(4) | 81,000 | 84,608 |
| 5.30%, 3/15/17(4) | 420,000 | 410,796 | | | | |
| | | | | Duke Energy Corp., 3.95%, | | |
| Citigroup, Inc., 5.50%, | | | | 9/15/14(4) | 130,000 | 132,475 |
| 4/11/13(4) | 470,000 | 490,053 | | | | |
| | | | | Exelon Generation Co. LLC, | | |
| Citigroup, Inc., 5.50%, | | | | 5.20%, 10/1/19(4) | 150,000 | 153,220 |
| 10/15/14(4) | 80,000 | 82,133 | | | | |
| | | | | FirstEnergy Solutions Corp., | | |
| Citigroup, Inc., 6.125%, | | | | 6.05%, 8/15/21(4)(5) | 300,000 | 309,591 |
| 5/15/18(4) | 320,000 | 324,176 | | | | |
| | | | | Florida Power Corp., 6.35%, | | |
| Citigroup, Inc., 8.50%, | | | | 9/15/37(4) | 230,000 | 262,586 |
| 5/22/19(4) | 100,000 | 117,009 | | | | |
| | | | | Southern California Edison | | |
| JPMorgan Chase & Co., | | | | Co., 5.625%, 2/1/36(4) | 60,000 | 63,499 |
| 4.65%, 6/1/14(4) | 330,000 | 348,465 | | | | |
| | | | | Toledo Edison Co. (The), | | |
| JPMorgan Chase & Co., | | | | 6.15%, 5/15/37(4) | 190,000 | 193,451 |
| 6.00%, 1/15/18(4) | 670,000 | 718,040 | | | | |
| | | | | | | 1,307,390 |
| | | 2,899,634 | | | | |
18
| | | | | | |
| Balanced | | | | | | |
| |
| | Shares/ | | | | Shares/ | |
| | Principal | | | | Principal | |
| | Amount | Value | | | Amount | Value |
| ELECTRICAL EQUIPMENT(2) | | | | HEALTH CARE PROVIDERS & SERVICES — 0.1% |
| Roper Industries, Inc., | | | | Express Scripts, Inc., 5.25%, | | |
| 6.25%, 9/1/19(4) | $ 90,000 | $ 94,540 | | 6/15/12(4) | $ 230,000 | $ 245,162 |
| ELECTRONIC EQUIPMENT, | | | | Medco Health Solutions, | | |
| INSTRUMENTS & COMPONENTS — 0.1% | | | Inc., 7.25%, 8/15/13(4) | 270,000 | 303,038 |
| Aphenol Corp., 4.75%, | | | | | | 548,200 |
| 11/15/14(6) | 120,000 | 120,798 | | HOTELS, RESTAURANTS & LEISURE — 0.2% | |
| Corning, Inc., 6.625%, | | | | McDonald’s Corp., 5.35%, | | |
| 5/15/19(4) | 270,000 | 298,087 | | 3/1/18(4) | 170,000 | 185,790 |
| | | 418,885 | | McDonald’s Corp., 6.30%, | | |
| ENERGY EQUIPMENT & SERVICES — 0.1% | | | 10/15/37(4) | 230,000 | 259,858 |
| Pride International, Inc., | | | | Yum! Brands, Inc., 5.30%, | | |
| 8.50%, 6/15/19(4) | 100,000 | 112,250 | | 9/15/19(4) | 310,000 | 314,122 |
| Weatherford International | | | | Yum! Brands, Inc., 6.875%, | | |
| Ltd., 9.625%, 3/1/19(4) | 240,000 | 297,419 | | 11/15/37(4) | 230,000 | 251,652 |
| | | 409,669 | | | | 1,011,422 |
| FOOD & STAPLES RETAILING — 0.4% | | | HOUSEHOLD DURABLES(2) | | |
| CVS Caremark Corp., 6.60%, | | | | Toll Brothers Finance Corp., | | |
| 3/15/19(4) | 350,000 | 390,747 | | 6.75%, 11/1/19(4) | 100,000 | 98,375 |
| SYSCO Corp., 4.20%, | | | | Whirlpool Corp., 8.60%, | | |
| 2/12/13(4) | 100,000 | 105,264 | | 5/1/14(4) | 60,000 | 68,542 |
| Wal-Mart Stores, Inc., | | | | | | 166,917 |
| 3.00%, 2/3/14(4) | 370,000 | 377,327 | | HOUSEHOLD PRODUCTS — 0.1% | |
| Wal-Mart Stores, Inc., | | | | Kimberly-Clark Corp., | | |
| 5.875%, 4/5/27(4) | 468,000 | 500,269 | | 6.125%, 8/1/17(4) | 230,000 | 261,282 |
| Wal-Mart Stores, Inc., | | | | INDUSTRIAL CONGLOMERATES — 0.2% | |
| 6.50%, 8/15/37(4) | 330,000 | 383,209 | | | | |
| | | | | General Electric Co., 5.00%, | | |
| Wal-Mart Stores, Inc., | | | | 2/1/13(4) | 308,000 | 328,173 |
| 6.20%, 4/15/38(4) | 220,000 | 248,386 | | | | |
| | | | | General Electric Co., 5.25%, | | |
| | | 2,005,202 | | 12/6/17(4) | 230,000 | 239,515 |
| FOOD PRODUCTS — 0.2% | | | | Hutchison Whampoa | | |
| General Mills, Inc., 5.65%, | | | | International 09/16 Ltd., | | |
| 9/10/12(4) | 120,000 | 131,111 | | 4.625%, 9/11/15(4)(5) | 230,000 | 231,865 |
| Kellogg Co., 4.45%, | | | | | | 799,553 |
| 5/30/16(4) | 200,000 | 209,017 | | INSURANCE — 0.2% | | |
| Kraft Foods, Inc., 6.00%, | | | | Allstate Corp. (The), 7.45%, | | |
| 2/11/13(4) | 70,000 | 75,462 | | 5/16/19 | 150,000 | 176,950 |
| Kraft Foods, Inc., 6.125%, | | | | MetLife Global Funding I, | | |
| 2/1/18(4) | 180,000 | 190,967 | | 5.125%, 4/10/13(4)(5) | 200,000 | 211,891 |
| Ralcorp Holdings, Inc., | | | | MetLife, Inc., 6.75%, | | |
| 6.625%, 8/15/39(4)(5) | 130,000 | 133,943 | | 6/1/16(4) | 190,000 | 212,752 |
| | | 740,500 | | New York Life Global | | |
| HEALTH CARE EQUIPMENT & SUPPLIES — 0.1% | | Funding, 4.65%, 5/9/13(4)(5) | 150,000 | 158,646 |
| Baxter International, Inc., | | | | Prudential Financial, Inc., | | |
| 5.90%, 9/1/16(4) | 130,000 | 146,240 | | 5.40%, 6/13/35(4) | 270,000 | 228,877 |
| Baxter International, Inc., | | | | Travelers Cos., Inc. (The), | | |
| 5.375%, 6/1/18(4) | 220,000 | 237,541 | | 5.90%, 6/2/19(4) | 100,000 | 110,621 |
| Baxter International, Inc., | | | | | | 1,099,737 |
| 6.25%, 12/1/37(4) | 230,000 | 261,171 | | | | |
| | | 644,952 | | | | |
19
| | | | | | |
| Balanced | | | | | | |
| |
| | Shares/ | | | | Shares/ | |
| | Principal | | | | Principal | |
| | Amount | Value | | | Amount | Value |
| MACHINERY — 0.1% | | | | Newmont Mining Corp., | | |
| Caterpillar Financial | | | | 5.125%, 10/1/19(4) | $ 250,000 | $ 249,994 |
| Services Corp., 4.85%, | | | | Rio Tinto Finance USA Ltd., | | |
| 12/7/12(4) | $ 230,000 | $ 245,298 | | 5.875%, 7/15/13(4) | 290,000 | 312,735 |
| Deere & Co., 5.375%, | | | | Vale Overseas Ltd., 5.625%, | | |
| 10/16/29(4) | 200,000 | 205,942 | | 9/15/19(4) | 90,000 | 90,221 |
| | | 451,240 | | Xstrata Finance Canada Ltd., | | |
| MEDIA — 0.7% | | | | 5.80%, 11/15/16(4)(5) | 197,000 | 195,618 |
| British Sky Broadcasting | | | | | | 1,753,052 |
| Group plc, 9.50%, | | | | MULTILINE RETAIL(2) | | |
| 11/15/18(4)(5) | 250,000 | 318,918 | | Macy’s Retail Holdings, Inc., | | |
| Comcast Corp., 5.90%, | | | | 5.35%, 3/15/12(4) | 175,000 | 172,594 |
| 3/15/16(4) | 189,000 | 202,917 | | MULTI-UTILITIES — 0.6% | | |
| Comcast Corp., 6.40%, | | | | CenterPoint Energy | | |
| 5/15/38(4) | 220,000 | 225,132 | | Resources Corp., 6.125%, | | |
| DirecTV Holdings LLC/ | | | | 11/1/17(4) | 230,000 | 240,358 |
| DirecTV Financing Co., Inc., | | | | CenterPoint Energy | | |
| 4.75%, 10/1/14(4)(5) | 250,000 | 255,602 | | Resources Corp., 6.25%, | | |
| DirecTV Holdings LLC/ | | | | 2/1/37(4) | 330,000 | 316,889 |
| DirecTV Financing Co., Inc., | | | | Dominion Resources, Inc., | | |
| 6.375%, 6/15/15(4) | 210,000 | 217,875 | | 4.75%, 12/15/10(4) | 258,000 | 266,723 |
| News America, Inc., 6.90%, | | | | Dominion Resources, Inc., | | |
| 8/15/39(4)(5) | 190,000 | 202,100 | | 6.40%, 6/15/18(4) | 230,000 | 257,024 |
| Omnicom Group, Inc., | | | | NSTAR Electric Co., 5.625%, | | |
| 6.25%, 7/15/19(4) | 250,000 | 270,260 | | 11/15/17(4) | 170,000 | 185,483 |
| Rogers Cable, Inc., 6.25%, | | | | Pacific Gas & Electric Co.,, | | |
| 6/15/13(4) | 180,000 | 196,531 | | 4.20%, 3/1/11(4) | 420,000 | 434,972 |
| Time Warner Cable, Inc., | | | | Pacific Gas & Electric Co.,, | | |
| 5.40%, 7/2/12(4) | 350,000 | 374,048 | | 5.80%, 3/1/37(4) | 163,000 | 173,116 |
| Time Warner Cable, Inc., | | | | Pacific Gas & Electric Co.,, | | |
| 6.75%, 7/1/18(4) | 240,000 | 264,540 | | 6.35%, 2/15/38(4) | 220,000 | 251,366 |
| Time Warner, Inc., 5.50%, | | | | PG&E Corp., 5.75%, | | |
| 11/15/11(4) | 195,000 | 208,586 | | 4/1/14(4) | 180,000 | 196,636 |
| Time Warner, Inc., 7.625%, | | | | Sempra Energy, 8.90%, | | |
| 4/15/31(4) | 70,000 | 78,479 | | 11/15/13(4) | 170,000 | 201,626 |
| Time Warner, Inc., 7.70%, | | | | Sempra Energy, 6.50%, | | |
| 5/1/32(4) | 150,000 | 169,885 | | 6/1/16(4) | 100,000 | 109,939 |
| Viacom, Inc., 5.625%, | | | | Sempra Energy, 6.00%, | | |
| 9/15/19(4) | 450,000 | 466,938 | | 10/15/39(4) | 80,000 | 80,396 |
| | | 3,451,811 | | | | 2,714,528 |
| METALS & MINING — 0.4% | | | | OIL, GAS & CONSUMABLE FUELS — 1.0% | |
| ArcelorMittal, 6.125%, | | | | Anadarko Petroleum Corp., | | |
| 6/1/18(4) | 350,000 | 346,127 | | 6.45%, 9/15/36(4) | 250,000 | 260,956 |
| Barrick Gold Corp., 6.95%, | | | | Cenovus Energy, Inc., | | |
| 4/1/19 | 170,000 | 194,313 | | 4.50%, 9/15/14(4)(5) | 140,000 | 143,870 |
| BHP Billiton Finance USA | | | | ConocoPhillips, 6.50%, | | |
| Ltd., 6.50%, 4/1/19(4) | 120,000 | 137,981 | | 2/1/39(4) | 370,000 | 415,571 |
| Freeport-McMoRan | | | | El Paso Corp., 7.875%, | | |
| Copper & Gold, Inc., 8.375%, | | | | 6/15/12(4) | 110,000 | 113,387 |
| 4/1/17(4) | 210,000 | 226,063 | | | | |
| | | | | Enbridge Energy Partners | | |
| | | | | LP, 6.50%, 4/15/18(4) | 95,000 | 102,190 |
20
| | | | | | |
| Balanced | | | | | | |
| |
| |
| | Shares/ | | | | Shares/ | |
| | Principal | | | | Principal | |
| | Amount | Value | | | Amount | Value |
| Enterprise Products | | | | AstraZeneca plc, 5.90%, | | |
| Operating LLC, 6.30%, | | | | 9/15/17(4) | $ 360,000 | $ 404,115 |
| 9/15/17(4) | $ 390,000 | $ 428,533 | | GlaxoSmithKline Capital, | | |
| EOG Resources, Inc., | | | | Inc., 4.85%, 5/15/13(4) | 180,000 | 194,216 |
| 5.625%, 6/1/19(4) | 150,000 | 163,944 | | GlaxoSmithKline Capital, | | |
| Kerr-McGee Corp., 6.95%, | | | | Inc., 6.375%, 5/15/38(4) | 70,000 | 79,706 |
| 7/1/24(4) | 170,000 | 180,203 | | Pfizer, Inc., 7.20%, | | |
| Kinder Morgan Energy | | | | 3/15/39(4) | 170,000 | 214,351 |
| Partners LP, 6.85%, | | | | Watson Pharmaceuticals, | | |
| 2/15/20(4) | 200,000 | 221,712 | | Inc., 5.00%, 8/15/14(4) | 410,000 | 421,104 |
| Kinder Morgan Energy | | | | Wyeth, 5.95%, 4/1/37(4) | 272,000 | 294,282 |
| Partners LP, 6.50%, | | | | | | |
| 9/1/39(4) | 130,000 | 132,851 | | | | 2,275,738 |
| Magellan Midstream | | | | REAL ESTATE INVESTMENT TRUSTS (REITs) — 0.2% |
| Partners LP, 6.55%, | | | | ProLogis, 7.625%, 8/15/14(4) | 90,000 | 95,560 |
| 7/15/19(4) | 150,000 | 165,551 | | ProLogis, 5.625%, 11/15/16(4) | 490,000 | 451,519 |
| Nexen, Inc., 5.65%, | | | | ProLogis, 7.375%, 10/30/19(4) | 120,000 | 120,503 |
| 5/15/17(4) | 150,000 | 152,543 | | | | |
| | | | | Simon Property Group LP, | | |
| Nexen, Inc., 6.40%, | | | | 6.75%, 5/15/14(4) | 220,000 | 236,954 |
| 5/15/37(4) | 440,000 | 436,387 | | | | |
| Petrobras International | | | | | | 904,536 |
| Finance Co.,, 5.75%, | | | | ROAD & RAIL — 0.1% | | |
| 1/20/20(4) | 120,000 | 120,240 | | CSX Corp., 7.375%, 2/1/19(4) | 150,000 | 175,184 |
| Plains All American Pipeline | | | | Union Pacific Corp., 5.75%, | | |
| LP/PAA Finance Corp., | | | | 11/15/17(4) | 340,000 | 364,141 |
| 8.75%, 5/1/19(4) | 190,000 | 230,860 | | | | 539,325 |
| Shell International Finance | | | | SOFTWARE — 0.1% | | |
| BV, 4.30%, 9/22/19(4) | 250,000 | 251,331 | | | | |
| | | | | Intuit, Inc., 5.75%, | | |
| Shell International Finance | | | | 3/15/17(4) | 254,000 | 267,187 |
| BV, 6.375%, 12/15/38(4) | 200,000 | 232,897 | | | | |
| | | | | Oracle Corp., 6.125%, | | |
| Talisman Energy, Inc., | | | | 7/8/39(4) | 210,000 | 231,876 |
| 7.75%, 6/1/19(4) | 200,000 | 238,022 | | | | |
| | | | | | | 499,063 |
| XTO Energy, Inc., 5.30%, | | | | | | |
| 6/30/15(4) | 342,000 | 365,220 | | SPECIALTY RETAIL — 0.1% | | |
| XTO Energy, Inc., 6.50%, | | | | Home Depot, Inc. (The), | | |
| | | | | 5.875%, 12/16/36(4) | 75,000 | 73,403 |
| 12/15/18(4) | 150,000 | 167,171 | | | | |
| XTO Energy, Inc., 6.10%, | | | | Staples, Inc., 9.75%, | | |
| | | | | 1/15/14(4) | 240,000 | 291,102 |
| 4/1/36(4) | 272,000 | 276,834 | | | | |
| | | 4,800,273 | | | | 364,505 |
| PAPER & FOREST PRODUCTS — 0.1% | | | TOBACCO(2) | | |
| International Paper Co., | | | | Altria Group, Inc., 9.25%, | | |
| 9.375%, 5/15/19(4) | 250,000 | 302,947 | | 8/6/19(4) | 150,000 | 182,044 |
| PERSONAL PRODUCTS(2) | | | | WIRELESS TELECOMMUNICATION SERVICES — 0.1% |
| Mead Johnson Nutrition Co., | | | | America Movil SAB de CV, | | |
| | | | | 5.00%, 10/16/19(4)(5) | 200,000 | 195,809 |
| 3.50%, 11/1/14(5)(6) | 120,000 | 120,628 | | | | |
| PHARMACEUTICALS — 0.5% | | | | Rogers Communications, | | |
| | | | | Inc., 6.80%, 8/15/18(4) | 120,000 | 135,433 |
| Abbott Laboratories, 5.875%, | | | | | | |
| 5/15/16(4) | 100,000 | 112,157 | | Vodafone Group plc, 5.45%, | | |
| | | | | 6/10/19(4) | 140,000 | 147,004 |
| Abbott Laboratories, 5.60%, | | | | | | |
| 11/30/17(4) | 210,000 | 230,472 | | | | 478,246 |
| AstraZeneca plc, 5.40%, | | | | TOTAL CORPORATE BONDS | | |
| 9/15/12(4) | 295,000 | 325,335 | | (Cost $43,929,073) | | 46,654,017 |
21
| | | | | | |
| Balanced | | | | | | |
| |
| | Shares/ | | | | Shares/ | |
| | Principal | | | | Principal | |
| | Amount | Value | | | Amount | Value |
| U.S. Treasury Securities — 9.9% | | | Countrywide Home Loan | | |
| | | | | Mortgage Pass-Through | | |
| U.S. Treasury Bonds, | | | | Trust, Series 2005-17, Class | | |
| 5.25%, 2/15/29(4) | $ 2,000,000 | $ 2,274,064 | | 1A11, 5.50%, 9/25/35(4) | $ 591,532 | $ 547,377 |
| U.S. Treasury Bonds, | | | | Countrywide Home Loan | | |
| 6.25%, 5/15/30(4) | 310,000 | 397,285 | | Mortgage Pass-Through | | |
| U.S. Treasury Bonds, | | | | Trust, Series 2007-16, | | |
| 4.75%, 2/15/37(4) | 929,000 | 1,007,385 | | Class A1, 6.50%, 10/25/37(4) | 435,083 | 358,554 |
| U.S. Treasury Notes, | | | | Credit Suisse First Boston | | |
| 0.875%, 4/30/11(4) | 10,500,000 | 10,547,586 | | Mortgage Securities Corp., | | |
| U.S. Treasury Notes, | | | | Series 2003 AR28, Class 2A1, | | |
| 1.875%, 6/15/12(4) | 7,200,000 | 7,320,938 | | VRN, 3.62%, 11/2/09(4) | 754,574 | 698,218 |
| U.S. Treasury Notes, | | | | MASTR Alternative Loans | | |
| 1.50%, 7/15/12(4) | 4,200,000 | 4,228,547 | | Trust, Series 2003-8, | | |
| | | | | Class 4A1, 7.00%, 12/25/33(4) | 65,991 | 62,207 |
| U.S. Treasury Notes, | | | | | | |
| 2.375%, 8/31/14(4) | 13,500,000 | 13,570,673 | | | | 2,309,721 |
| U.S. Treasury Notes, | | | | U.S. GOVERNMENT AGENCY COLLATERALIZED |
| 3.125%, 5/15/19(4) | 7,000,000 | 6,849,612 | | MORTGAGE OBLIGATIONS — 0.3% | |
| TOTAL U.S. TREASURY SECURITIES | | | FHLMC, Series 77, | | |
| (Cost $45,394,914) | | 46,196,090 | | Class H, 8.50%, 9/15/20(4) | 183,842 | 199,697 |
| | | | | FHLMC, Series 2541, | | |
| U.S. Government Agency Securities | | Class EA SEQ, 5.00%, | | |
| and Equivalents — 3.7% | | | 3/15/16(4) | 9,218 | 9,218 |
| FIXED-RATE U.S. GOVERNMENT | | | FHLMC, Series 2926, | | |
| AGENCY SECURITIES — 2.7% | | | Class EW SEQ, 5.00%, | | |
| | | | | 1/15/25(4) | 1,200,000 | 1,256,264 |
| FHLB, 1.625%, 11/21/12(4) | 3,000,000 | 2,999,967 | | | | |
| | | | | | | 1,465,179 |
| FNMA, 1.00%, 11/23/11 | 3,000,000 | 3,000,984 | | | | |
| | | | | TOTAL COLLATERALIZED | | |
| FNMA, 2.75%, 3/13/14(4) | 4,000,000 | 4,061,808 | | MORTGAGE OBLIGATIONS | | |
| FNMA, 5.00%, 2/13/17(4) | 2,200,000 | 2,435,268 | | (Cost $3,888,017) | | 3,774,900 |
| |
| | | 12,498,027 | | Commercial Mortgage-Backed | |
| GOVERNMENT-BACKED | | | | Securities(3) — 0.8% | | |
| CORPORATE BONDS(7) — 1.0% | | | | | |
| Citigroup Funding, Inc., | | | | Commercial Mortgage | | |
| 1.875%, 11/15/12(4) | 1,800,000 | 1,809,574 | | Pass-Through Certificates, | | |
| | | | | Series 2005 F10A, Class A1, | | |
| GMAC, Inc., 1.75%, | | | | VRN, 0.35%, 11/15/09, | | |
| 10/30/12(4) | 2,000,000 | 2,004,918 | | resets monthly off the | | |
| State Street Bank and | | | | 1-month LIBOR plus 0.10% | | |
| Trust Co., 1.85%, 3/15/11(4) | 1,000,000 | 1,015,007 | | with no caps(4)(5) | 67,951 | 67,451 |
| | | 4,829,499 | | Credit Suisse Mortgage | | |
| TOTAL U.S. GOVERNMENT AGENCY | | | Capital Certificates, Series | | |
| SECURITIES AND EQUIVALENTS | | | 2007 TF2A, Class A1, VRN, | | |
| (Cost $17,013,010) | | 17,327,526 | | 0.43%, 11/15/09, resets | | |
| | | | | monthly off the 1-month | | |
| Collateralized Mortgage | | | LIBOR plus 0.18% with | | |
| Obligations(3) — 0.8% | | | | no caps(4)(5) | 1,192,564 | 1,010,083 |
| PRIVATE SPONSOR COLLATERALIZED | | | Greenwich Capital | | |
| MORTGAGE OBLIGATIONS — 0.5% | | | Commercial Funding Corp., | | |
| | | | | Series 2006 FL4A, Class A1, | | |
| Banc of America Alternative | | | | VRN, 0.34%, 11/5/09, resets | | |
| Loan Trust, Series 2007-2, | | | | monthly off the 1-month | | |
| Class 2A4, 5.75%, 6/25/37(4) | 781,752 | 643,365 | | LIBOR plus 0.09% with | | |
| | | | | no caps(4)(5) | 142,352 | 119,657 |
22
| | | | | | |
| Balanced | | | | | | |
| |
| | Shares/ | | | | Shares/ | |
| | Principal | | | | Principal | |
| | Amount | Value | | | Amount | Value |
| LB-UBS Commercial | | | | Sovereign Governments & | |
| Mortgage Trust, Series | | | | | | |
| 2005 C2, Class A2 SEQ, | | | | Agencies — 0.2% | | |
| 4.82%, 4/15/30(4) | $ 1,224,552 | $ 1,228,530 | | BRAZIL(2) | | |
| Merrill Lynch Floating Trust, | | | | Brazilian Government | | |
| Series 2006-1, Class A1, | | | | International Bond, 5.875%, | | |
| VRN, 0.32%, 11/15/09, | | | | 1/15/19(4) | $ 160,000 | $ 170,000 |
| resets monthly off the | | | | | | |
| 1-month LIBOR plus 0.07% | | | | CANADA — 0.1% | | |
| with no caps(4)(5) | 537,407 | 483,430 | | Hydro Quebec, 8.40%, | | |
| | | | | 1/15/22(4) | 145,000 | 193,187 |
| Morgan Stanley Capital I, | | | | | | |
| Series 2003-T11, Class A3 | | | | MEXICO — 0.1% | | |
| SEQ, 4.85%, 6/13/41(4) | 664,000 | 677,878 | | United Mexican States, | | |
| TOTAL COMMERCIAL | | | | 5.95%, 3/19/19(4) | 420,000 | 441,000 |
| MORTGAGE-BACKED SECURITIES | | | TOTAL SOVEREIGN | | |
| (Cost $3,830,342) | | 3,587,029 | | GOVERNMENTS & AGENCIES | | |
| |
| Municipal Securities — 0.6% | | | (Cost $762,395) | | 804,187 |
| California GO, (Building | | | | Asset-Backed Securities(3) — 0.1% |
| Bonds), 7.30%, 10/1/39(4) | 400,000 | 405,692 | | CNH Equipment Trust, | | |
| Illinois GO, (Taxable | | | | Series 2007 C, Class A3A | | |
| Pension), 5.10%, 6/1/33(4) | 800,000 | 724,384 | | SEQ, 5.21%, 12/15/11(4) | 366,264 | 369,094 |
| Los Angeles Unified School | | | | SLM Student Loan Trust, | | |
| District GO, (Building | | | | Series 2006-5, Class A2, | | |
| Bonds), 5.76%, 7/1/29(4) | 200,000 | 197,778 | | VRN, 0.27%, 1/25/10, resets | | |
| Missouri Highways & | | | | quarterly off the 3-month | | |
| Transportation Commission | | | | LIBOR minus 0.01% with | | |
| | | | | no caps(4) | 52,351 | 52,287 |
| Rev., (Building Bonds), | | | | | | |
| 5.45%, 5/1/33(4) | 130,000 | 132,165 | | TOTAL ASSET-BACKED SECURITIES | |
| New Jersey State Turnpike | | | | (Cost $418,611) | | 421,381 |
| Auth. Rev., Series 2009 F, | | | | Temporary Cash Investments — 0.5% |
| (Building Bonds), 7.41%, | | | | | | |
| 1/1/40(4) | 180,000 | 215,845 | | JPMorgan U.S. Treasury | | |
| | | | | Plus Money Market Fund | | |
| New York State Dormitory | | | | Agency Shares(4) | | |
| Auth. Rev., (Building Bonds), | | | | (Cost $2,260,431) | 2,260,431 | 2,260,431 |
| 5.63%, 3/15/39(4) | 180,000 | 182,824 | | | | |
| | | | | TOTAL INVESTMENT | | |
| Texas GO, (Building Bonds), | | | | SECURITIES — 99.6% | | |
| 5.52%, 4/1/39(4) | 340,000 | 356,660 | | (Cost $420,899,986) | | 463,586,114 |
| University of California Rev., | | | | OTHER ASSETS AND | | |
| (Building Bonds), 5.77%, | | | | LIABILITIES — 0.4% | | 1,846,172 |
| 5/15/43(4) | 230,000 | 240,217 | | | | |
| | | | | TOTAL NET ASSETS — 100.0% | | $465,432,286 |
| Utah GO, Series 2009 D, | | | | | | |
| (Building Bonds), 4.55%, | | | | | | |
| 7/1/24(4) | 380,000 | 391,278 | | | | |
| TOTAL MUNICIPAL SECURITIES | | | | | |
| (Cost $2,864,375) | | 2,846,843 | | | | |
23
| | | |
| Balanced | | |
| |
| Swap Agreements | | |
| Notional Amount Description of Agreement | Premiums Paid (Received) | Value |
| CREDIT DEFAULT – BUY PROTECTION | | |
| | $2,650,000 Pay quarterly a fixed rate equal to 0.12% multiplied | — | $79,463 |
| | by the notional amount and receive from Barclays | | |
| | Bank plc upon each default event of Pfizer, Inc., | | |
| | par value of the proportional notional amount of | | |
| | Pfizer, Inc., 4.65%, 3/1/18. Expires March 2017. | | |
| |
| |
| Notes to Schedule of Investments | | |
| Equivalent = Security whose principal payments are backed by the full faith and credit of the United States | |
| FHLB = Federal Home Loan Bank | | |
| FHLMC = Federal Home Loan Mortgage Corporation | | |
| FNMA = Federal National Mortgage Association | | |
| GMAC = General Motors Acceptance Corporation | | |
| GNMA = Government National Mortgage Association | | |
| GO = General Obligation | | |
| LB-UBS = Lehman Brothers, Inc. — UBS AG | | |
| LIBOR = London Interbank Offered Rate | | |
| MASTR = Mortgage Asset Securitization Transactions, Inc. | | |
| resets = The frequency with which a security’s coupon changes, based on current market conditions or an underlying index. The more frequently a |
| security resets, the less risk the investor is taking that the coupon will vary significantly from current market rates. | |
| SEQ = Sequential Payer | | |
| SPDR = Standard & Poor’s Depositary Receipts | | |
| VRN = Variable Rate Note. Interest reset date is indicated. Rate shown is effective at the period end. | |
| (1) | Non-income producing. | | |
| (2) | Category is less than 0.05% of total net assets. | | |
| (3) | Final maturity indicated, unless otherwise noted. | | |
| (4) | Security, or a portion thereof, has been segregated for when-issued securities and/or swap agreements. At the period end, the aggregate value |
| | of securities pledged was $321,000. | | |
| (5) | Security was purchased under Rule 144A of the Securities Act of 1933 or is a private placement and, unless registered under the Act or |
| | exempted from registration, may only be sold to qualified institutional investors. The aggregate value of these securities at the period end was |
| | $6,039,125, which represented 1.3% of total net assets. | | |
| (6) | When-issued security. | | |
| (7) | The debt is guaranteed under the Federal Deposit Insurance Corporation’s (FDIC) Temporary Liquidity Guarantee Program and is backed by |
| | the full faith and credit of the United States. The expiration date of the FDIC’s guarantee is the earlier of the maturity date of the debt or |
| | June 30, 2012. | | |
| |
| Industry classifications are unaudited. | | |
| |
| |
| See Notes to Financial Statements. | | |
24
|
| Statement of Assets and Liabilities |
| |
| OCTOBER 31, 2009 | |
| Assets | |
| Investment securities, at value (cost of $420,899,986) | $463,586,114 |
| Cash | 62,202 |
| Receivable for investments sold | 1,348,227 |
| Receivable for capital shares sold | 143,124 |
| Swap agreements, at value | 79,463 |
| Dividends and interest receivable | 1,674,831 |
| | 466,893,961 |
| | |
| Liabilities | |
| Payable for investments purchased | 992,504 |
| Payable for capital shares redeemed | 107,025 |
| Accrued management fees | 362,146 |
| | 1,461,675 |
| | |
| Net Assets | $465,432,286 |
| | |
| Net Assets Consist of: | |
| Capital (par value and paid-in surplus) | $502,404,038 |
| Undistributed net investment income | 940,113 |
| Accumulated net realized loss on investment transactions | (80,677,456) |
| Net unrealized appreciation on investments | 42,765,591 |
| | $465,432,286 |
| | |
| Investor Class, $0.01 Par Value | |
| Net assets | $459,183,047 |
| Shares outstanding | 33,803,513 |
| Net asset value per share | $13.58 |
| | |
| Institutional Class, $0.01 Par Value | |
| Net assets | $6,249,239 |
| Shares outstanding | 459,958 |
| Net asset value per share | $13.59 |
| |
| |
| |
| See Notes to Financial Statements. | |
25
| |
| YEAR ENDED OCTOBER 31, 2009 | |
| Investment Income (Loss) | |
| Income: | |
| Dividends (net of foreign taxes withheld of $11,755) | $ 5,778,277 |
| Interest | 7,675,620 |
| | 13,453,897 |
| | |
| Expenses: | |
| Management fees | 3,874,118 |
| Directors’ fees and expenses | 16,868 |
| Other expenses | 625 |
| | 3,891,611 |
| | |
| Net investment income (loss) | 9,562,286 |
| | |
| Realized and Unrealized Gain (Loss) | |
| Net realized gain (loss) on: | |
| Investment transactions | (66,184,644) |
| Futures contract transactions | (262,002) |
| Swap agreement transactions | (57,459) |
| | (66,504,105) |
| | |
| Change in net unrealized appreciation (depreciation) on: | |
| Investments | 97,881,326 |
| Futures contracts | (24,223) |
| Swap agreements | (10,289) |
| | 97,846,814 |
| | |
| Net realized and unrealized gain (loss) | 31,342,709 |
| | |
| Net Increase (Decrease) in Net Assets Resulting from Operations | $ 40,904,995 |
| |
| |
| |
| See Notes to Financial Statements. | |
26
|
| Statement of Changes in Net Assets |
| | |
| YEARS ENDED OCTOBER 31, 2009 AND OCTOBER 31, 2008 | | |
| Increase (Decrease) in Net Assets | 2009 | 2008 |
| Operations | | |
| Net investment income (loss) | $ 9,562,286 | $ 13,692,226 |
| Net realized gain (loss) | (66,504,105) | (13,490,807) |
| Change in net unrealized appreciation (depreciation) | 97,846,814 | (121,399,814) |
| Net increase (decrease) in net assets resulting from operations | 40,904,995 | (121,198,395) |
| | | |
| Distributions to Shareholders | | |
| From net investment income: | | |
| Investor Class | (9,841,987) | (13,588,608) |
| Institutional Class | (144,934) | (152,831) |
| From net realized gains: | | |
| Investor Class | — | (40,498,231) |
| Institutional Class | — | (82,676) |
| Decrease in net assets from distributions | (9,986,921) | (54,322,346) |
| | | |
| Capital Share Transactions | | |
| Net increase (decrease) in net assets from capital share transactions | (11,382,316) | (29,341,788) |
| | | |
| Net increase (decrease) in net assets | 19,535,758 | (204,862,529) |
| | | |
| Net Assets | | |
| Beginning of period | 445,896,528 | 650,759,057 |
| End of period | $465,432,286 | $ 445,896,528 |
| | | |
| Undistributed net investment income | $940,113 | $1,340,022 |
| |
| |
| See Notes to Financial Statements. | | |
27
|
| Notes to Financial Statements |
OCTOBER 31, 2009
1. Organization and Summary of Significant Accounting Policies
Organization — American Century Mutual Funds, Inc. (the corporation) is registered under the Investment Company Act of 1940 (the 1940 Act) as an open-end management investment company. Balanced Fund (the fund) is one fund in a series issued by the corporation. The fund is diversified under the 1940 Act. The fund’s investment objective is to seek long-term capital growth and current income. The fund pursues its objective by investing approximately 60% of its assets in equity securities and the remainder in bonds and other fixed-income securities. The following is a summary of the fund’s significant accounting policies.
Multiple Class — The fund is authorized to issue the Investor Class and the Institutional Class. Prior to December 3, 2007, the fund was authorized to issue the Advisor Class (see Note 10). The share classes differ principally in their respective distribution and shareholder servicing expenses and arrangements. All shares of the fund represent an equal pro rata interest in the net assets of the class to which such shares belong, and have identical voting, dividend, liquidation and other rights and the same terms and conditions, except for class specific expenses and exclusive rights to vote on matters affecting only individual classes. Income, non-class specific expenses, and realized and unrealized capital gains and losses of the fund are allocated to each class of shares based on their relative net assets.
Security Valuations — Securities traded primarily on a principal securities exchange are valued at the last reported sales price, or at the mean of the latest bid and asked prices where no last sales price is available. Depending on local convention or regulation, securities traded over-the-counter are valued at the mean of the latest bid and asked prices, the last sales price, or the official close price. Investments in open-end management investment companies are valued at the reported net asset value. Debt securities not traded on a principal securities exchange are valued through a commercial pricing service or at the mean of the most recent bid and asked prices. Discount notes may be valued through a commercial pricing service or at amortized cost, which approximates fair value. Securities traded on foreign securities exchanges and ov er-the-counter markets are normally completed before the close of business on days that the New York Stock Exchange (the Exchange) is open and may also take place on days when the Exchange is not open. If an event occurs after the value of a security was established but before the net asset value per share was determined that was likely to materially change the net asset value, that security would be valued as determined in accordance with procedures adopted by the Board of Directors. If the fund determines that the market price of a portfolio security is not readily available, or that the valuation methods mentioned above do not reflect the security’s fair value, such security is valued as determined by the Board of Directors or its designee, in accordance with procedures adopted by the Board of Directors, if such determination would materially impact a fund’s net asset value. Certain other circumstances may cause the fund to use alternative procedures to value a security such as: a security has b een declared in default; trading in a security has been halted during the trading day; or there is a foreign market holiday and no trading will commence.
Security Transactions — For financial reporting purposes, security transactions are accounted for as of the trade date. Net realized gains and losses are determined on the identified cost basis, which is also used for federal income tax purposes.
Investment Income — Dividend income less foreign taxes withheld, if any, is recorded as of the ex-dividend date. Interest income is recorded on the accrual basis and includes paydown gain (loss) and accretion of discounts and amortization of premiums.
When-Issued and Forward Commitments — The fund may engage in securities transactions on a when-issued or forward commitment basis. In these transactions, the securities’ prices and yields are fixed on the date of the commitment. In a when-issued transaction, the payment and delivery are scheduled for a future date and during this period, securities are subject to market fluctuations. In a forward commitment transaction, the fund may sell a security and at the same time make a commitment to purchase the same security at a future date at
28
a specified price. Conversely, the fund may purchase a security and at the same time make a commitment to sell the same security at a future date at a specified price. These types of transactions are executed simultaneously in what are known as “roll” transactions. The fund will segregate cash, cash equivalents or other appropriate liquid securities on its records in amounts sufficient to meet the purchase price. The fund accounts for “roll” transactions as purchases and sales; as such these transactions may increase portfolio turnover.
Repurchase Agreements — The fund may enter into repurchase agreements with institutions that American Century Investment Management, Inc. (ACIM) (the investment advisor) has determined are creditworthy pursuant to criteria adopted by the Board of Directors. Each repurchase agreement is recorded at cost. The fund requires that the collateral, represented by securities, received in a repurchase transaction be transferred to the custodian in a manner sufficient to enable the fund to obtain those securities in the event of a default under the repurchase agreement. ACIM monitors, on a daily basis, the securities transferred to ensure the value, including accrued interest, of the securities under each repurchase agreement is equal to or greater than amounts owed to the fund under each repurchase agreement.
Joint Trading Account — Pursuant to an Exemptive Order issued by the Securities and Exchange Commission, the fund, along with certain other funds in the American Century Investments family of funds, may transfer uninvested cash balances into a joint trading account. These balances are invested in one or more repurchase agreements that are collateralized by U.S. Treasury or Agency obligations.
Income Tax Status — It is the fund’s policy to distribute substantially all net investment income and net realized gains to shareholders and to otherwise qualify as a regulated investment company under provisions of the Internal Revenue Code. The fund is no longer subject to examination by tax authorities for years prior to 2006. At this time, management believes there are no uncertain tax positions which, based on their technical merit, would not be sustained upon examination and for which it is reasonably possible that the total amounts of unrecognized tax benefits will significantly change in the next twelve months. Accordingly, no provision has been made for federal or state income taxes. Interest and penalties associated with any federal or state income tax obligations, if any, are recorded as interest expense.
Distributions to Shareholders — Distributions to shareholders are recorded on the ex-dividend date. Distributions from net investment income are declared and paid quarterly. Distributions from net realized gains, if any, are generally declared and paid annually.
Indemnifications — Under the corporation‘s organizational documents, its officers and directors are indemnified against certain liabilities arising out of the performance of their duties to the fund. In addition, in the normal course of business, the fund enters into contracts that provide general indemnifications. The maximum exposure under these arrangements is unknown as this would involve future claims that may be made against a fund. The risk of material loss from such claims is considered by management to be remote.
Use of Estimates — The financial statements are prepared in conformity with accounting principles generally accepted in the United States of America, which may require management to make certain estimates and assumptions at the date of the financial statements. Actual results could differ from these estimates.
Subsequent Events — Management has evaluated events or transactions that may have occurred since October 31, 2009, that would merit recognition or disclosure in the financial statements. This evaluation was completed through December 28, 2009, the date the financial statements were issued.
29
2. Fees and Transactions with Related Parties
Management Fees — The corporation has entered into a Management Agreement with ACIM, under which ACIM provides the fund with investment advisory and management services in exchange for a single, unified management fee (the fee) per class. The Agreement provides that all expenses of the fund, except brokerage commissions, taxes, interest, fees and expenses of those directors who are not considered “interested persons” as defined in the 1940 Act (including counsel fees) and extraordinary expenses, will be paid by ACIM. The fee is computed and accrued daily based on the daily net assets of the specific class of shares of the fund and paid monthly in arrears. For funds with a stepped fee schedule, the rate of the fee is determined by applying a fee rate calculation formula. This formula takes into account each fund’s assets as well as certain assets, if any, of other clients of the investment advisor outside the American Century Investments family of funds (such as subadvised funds and separate accounts) that have very similar investment teams and investment strategies (strategy assets). The annual management fee schedule for the fund ranges from 0.80% to 0.90% for the Investor Class. The Institutional Class is 0.20% less at each point within the range. The effective annual management fee for the year ended October 31, 2009 was 0.90% and 0.70% for the Investor Class and Institutional Class, respectively.
Related Parties — Certain officers and directors of the corporation are also officers and/or directors, and, as a group, controlling stockholders of American Century Companies, Inc. (ACC), the parent of the corporation’s investment advisor, ACIM, the distributor of the corporation, American Century Investment Services, Inc., and the corporation’s transfer agent, American Century Services, LLC.
The fund is eligible to invest in a money market fund for temporary purposes, which is managed by J.P. Morgan Investment Management, Inc. (JPMIM). The fund has a Mutual Funds Services Agreement with J.P. Morgan Investor Services Co. (JPMIS) and a securities lending agreement with JPMorgan Chase Bank (JPMCB). JPMCB is a custodian of the fund. JPMIM, JPMIS and JPMCB are wholly owned subsidiaries of JPMorgan Chase & Co. (JPM). JPM is an equity investor in ACC.
3. Investment Transactions
Purchases of investment securities, excluding short-term investments, for the year ended October 31, 2009, totaled $459,360,715, of which $200,435,616 represented U.S. Treasury and Agency obligations. Sales of investment securities, excluding short-term investments, for the year ended October 31, 2009, totaled $478,594,745, of which $182,379,459 represented U.S. Treasury and Agency obligations.
30
| | | | |
| 4. Capital Share Transactions | | | | |
| |
| Transactions in shares of the fund were as follows: | | |
| |
| | Year ended October 31, 2009 | Year ended October 31, 2008 |
| | Shares | Amount | Shares | Amount |
| Investor Class/Shares Authorized | 250,000,000 | | 250,000,000 | |
| Sold | 2,879,604 | $ 35,959,986 | 2,498,883 | $ 37,970,203 |
| Issued in connection with | | | | |
| reclassification (Note 10) | — | — | 732,507 | 12,525,159 |
| Issued in reinvestment of distributions | 781,150 | 9,583,804 | 3,360,729 | 52,807,274 |
| Redeemed | (4,611,319) | (56,808,243) | (8,259,045) | (125,882,923) |
| | (950,565) | (11,264,453) | (1,666,926) | (22,580,287) |
| Institutional Class/Shares Authorized | 15,000,000 | | 15,000,000 | |
| Sold | 85,033 | 1,029,943 | 511,350 | 7,883,323 |
| Issued in reinvestment of distributions | 11,787 | 144,934 | 15,330 | 235,507 |
| Redeemed | (104,985) | (1,292,740) | (135,139) | (2,010,038) |
| | (8,165) | (117,863) | 391,541 | 6,108,792 |
| Advisor Class/Shares Authorized | N/A | | N/A | |
| Sold | — | — | 5,330 | 90,447 |
| Issued in connection with | | | | |
| reclassification (Note 10) | — | — | (732,507) | (12,525,159) |
| Redeemed | — | — | (25,768) | (435,581) |
| | — | — | (752,945) | (12,870,293) |
| Net increase (decrease) | (958,730) | $(11,382,316) | (2,028,330) | $ (29,341,788) |
5. Fair Value Measurements
The fund’s securities valuation process is based on several considerations and may use multiple inputs to determine the fair value of the positions held by the fund. In conformity with accounting principles generally accepted in the United States of America, the inputs used to determine a valuation are classified into three broad levels as follows:
• Level 1 valuation inputs consist of actual quoted prices in an active market for identical securities;
• Level 2 valuation inputs consist of significant direct or indirect observable market data (including quoted prices for similar securities, evaluations of subsequent market events, interest rates, prepayment speeds, credit risk, etc.); or
• Level 3 valuation inputs consist of significant unobservable inputs (including a fund’s own assumptions).
The level classification is based on the lowest level input that is significant to the fair valuation measurement. The valuation inputs are not an indication of the risks associated with investing in these securities or other financial instruments.
31
The following is a summary of the valuation inputs used to determine the fair value of the fund’s securities and other financial instruments as of October 31, 2009:
| | | |
| | Level 1 | Level 2 | Level 3 |
| Investment Securities | | | |
| Common Stocks | $278,570,272 | — | — |
| U.S. Government Agency Mortgage-Backed Securities | — | $ 61,143,438 | — |
| Corporate Bonds | — | 46,654,017 | — |
| U.S. Treasury Securities | — | 46,196,090 | — |
| U.S. Government Agency Securities and Equivalents | — | 17,327,526 | — |
| Collateralized Mortgage Obligations | — | 3,774,900 | — |
| Commercial Mortgage-Backed Securities | — | 3,587,029 | — |
| Municipal Securities | — | 2,846,843 | — |
| Sovereign Governments & Agencies | — | 804,187 | — |
| Asset-Backed Securities | — | 421,381 | — |
| Temporary Cash Investments | 2,260,431 | — | — |
| Total Value of Investment Securities | $280,830,703 | $182,755,411 | — |
| |
| Other Financial Instruments | | | |
| Total Unrealized Gain (Loss) on Swap Agreements | — | $79,463 | — |
6. Derivative Instruments
Credit Risk — The fund is subject to credit risk in the normal course of pursuing its investment objectives. The value of a bond generally declines as the credit quality of its issuer declines. Credit default swaps enable a fund to buy/sell protection against a credit event of a specific issuer or index. A fund may attempt to enhance returns by selling protection or attempt to mitigate credit risk by buying protection. The buyer/seller of credit protection against a security or basket of securities may pay/receive an up-front or periodic payment to compensate for/against potential default events. A fund will segregate cash, cash equivalents or other appropriate liquid securities on its records in amounts sufficient to meet requirements. Swap agreements are valued daily at current market value as provided by a commercial pricing service and /or independent brokers. Changes in value, including the periodic amounts of interest to be paid or received on swaps, are recorded as unrealized appreciation (depreciation) on swaps. Realized gain or loss is recorded upon receipt or payment of a periodic settlement or termination of swap agreements. Net realized and unrealized gains or losses occurring during the holding period of swap agreements are a component of net realized gain (loss) on swap agreement transactions and change in net unrealized appreciation (depreciation) on swap agreements, respectively. The risks of entering into swap agreements include the possible lack of liquidity, failure of the counterparty to meet its obligations, and that there may be unfavorable changes in the underlying investments or instruments. During the year ended October 31, 2009, the fund participated in credit default swap agreements to buy protection.
Equity Price Risk — The fund is subject to equity price risk in the normal course of pursuing its investment objectives. A fund may enter into futures contracts based on an equity index in order to manage its exposure to changes in market conditions. A fund may purchase futures contracts to gain exposure to increases in market value or sell futures contracts to protect against a decline in market value. Upon entering into a futures contract, a fund is required to deposit either cash or securities in an amount equal to a certain percentage of the contract value (initial margin). Subsequent payments (variation margin) are made or received daily, in cash, by a fund. The variation margin is equal to the daily change in the contract value and is recorded as unrealized gains and losses. A fund recognizes a realized gain or loss when the contract is closed or expires. Net realized and unrealized gains or losses occurring during the holding period of futures contracts are a component
32
of net realized gain (loss) on futures contract transactions and change in net unrealized appreciation (depreciation) on futures contracts, respectively. One of the risks of entering into futures contracts is the possibility that the change in value of the contract may not correlate with the changes in value of the underlying securities. During the year ended October 31, 2009, the fund purchased futures contracts.
Interest Rate Risk — The fund is subject to interest rate risk in the normal course of pursuing its investment objectives. The value of bonds generally declines as interest rates rise. A fund may enter into futures contracts based on a bond index or a specific underlying security. A fund may purchase futures contracts to gain exposure to increases in market value or sell futures contracts to protect against a decline in market value. Upon entering into a futures contract, a fund will segregate cash, cash equivalents or other appropriate liquid securities on its records in amounts sufficient to meet requirements. Subsequent payments (variation margin) are made or received daily, in cash, by a fund. The variation margin is equal to the daily change in the contract value and is recorded as unrealized gains and losses. A fund recognizes a real ized gain or loss when the futures contract is closed or expires. Net realized and unrealized gains or losses occurring during the holding period of futures contracts are a component of net realized gain (loss) on futures contract transactions and change in net unrealized appreciation (depreciation) on futures contracts, respectively. One of the risks of entering into futures contracts is the possibility that the change in value of the contract may not correlate with the changes in value of the underlying securities. During the year ended October 31, 2009, the fund purchased and sold futures contracts. Value of Derivative Instruments as of October 31, 2009
| | | | |
| | Asset Derivatives | Liability Derivatives |
| | Location on Statement | | Location on Statement | |
| Type of Derivative | of Assets and Liabilities | Value | of Assets and Liabilities | Value |
| Credit Risk | Swap agreements | $79,463 | Swap agreements | — |
| |
| Effect of Derivative Instruments on the Statement of Operations for the Year Ended |
| October 31, 2009 | | | | |
| |
| | | | Change in Net Unrealized |
| | Net Realized Gain (Loss) | Appreciation (Depreciation) |
| | Location on | | Location on | |
| Type of Derivative | Statement of Operations | | Statement of Operations | |
| Credit Risk | Net realized gain (loss) on | $ (57,459) | Change in net unrealized | $(10,289) |
| | swap agreement transactions | | appreciation (depreciation) | |
| | | | on swap agreements | |
| Equity Price Risk | Net realized gain (loss) on | (147,100) | Change in net unrealized | — |
| | futures contract transactions | | appreciation (depreciation) | |
| | | | on futures contracts | |
| Interest Rate Risk | Net realized gain (loss) on | (114,902) | Change in net unrealized | (24,223) |
| | futures contract transactions | | appreciation (depreciation) | |
| | | | on futures contracts | |
| | | $(319,461) | | $(34,512) |
The credit risk derivative instruments at period end as disclosed on the Schedule of Investments are indicative of the fund’s typical volume. At the beginning of the year ended October 31, 2009, the fund held two interest rate risk futures contracts purchased and one interest rate risk futures contracts sold. The interest rate risk derivatives were closed in November 2008. During the year ended October 31, 2009, the fund purchased two equity price risk futures contracts.
33
7. Bank Line of Credit
The fund, along with certain other funds in the American Century Investments family of funds, had a $500,000,000 unsecured bank line of credit agreement with Bank of America, N.A. The line expired December 10, 2008, and was not renewed. The agreement allowed the fund to borrow money for temporary or emergency purposes to fund shareholder redemptions. Borrowings under the agreement were subject to interest at the Federal Funds rate plus 0.40%. The fund did not borrow from the line during the year ended October 31, 2009.
8. Interfund Lending
The fund, along with certain other funds in the American Century Investments family of funds, may participate in an interfund lending program, pursuant to an Exemptive Order issued by the Securities and Exchange Commission (SEC). This program provides an alternative credit facility allowing the fund to borrow from or lend to other funds in the American Century Investments family of funds that permit such transactions. Interfund lending transactions are subject to each fund’s investment policies and borrowing and lending limits. The interfund loan rate earned/paid on interfund lending transactions is determined daily based on the average of certain current market rates. Interfund lending transactions normally extend only overnight, but can have a maximum duration of seven days. The program is subject to annual approval by the Board of Directors. During the year ended October 31, 2009, the fund did not utilize the program.
9. Federal Tax Information
The tax character of distributions paid during the years ended October 31, 2009 and October 31, 2008 were as follows:
| | |
| | 2009 | 2008 |
| Distributions Paid From | | |
| Ordinary income | $9,986,921 | $21,351,722 |
| Long-term capital gains | — | $32,970,624 |
The book-basis character of distributions made during the year from net investment income or net realized gains may differ from their ultimate characterization for federal income tax purposes. These differences reflect the differing character of certain income items and net realized gains and losses for financial statement and tax purposes, and may result in reclassification among certain capital accounts on the financial statements.
As of October 31, 2009, the federal tax cost of investments and the components of distributable earnings on a tax-basis were as follows:
| |
| Federal tax cost of investments | $432,965,484 |
| Gross tax appreciation of investments | $ 42,043,453 |
| Gross tax depreciation of investments | (11,422,823) |
| Net tax appreciation (depreciation) of investments | $ 30,620,630 |
| Net tax appreciation (depreciation) on derivatives | $ 79,092 |
| Net tax appreciation (depreciation) | $30,699,722 |
| Undistributed ordinary income | $940,484 |
| Accumulated capital losses | $(68,611,958) |
The difference between book-basis and tax-basis cost and unrealized appreciation (depreciation) is attributable primarily to the tax deferral of losses on wash sales.
34
The accumulated capital losses listed on the previous page represent net capital loss carryovers that may be used to offset future realized capital gains for federal income tax purposes. Future capital loss carryover utilization in any given year may be subject to Internal Revenue Code limitations. Capital loss carryovers of $(7,757,812) and $(60,854,146) expire in 2016 and 2017, respectively.
10. Corporate Event
On July 27, 2007, the Advisor Class shareholders of the fund approved a reclassification of Advisor Class shares into Investor Class shares. The change was approved by the Board of Directors on November 29, 2006 and March 7, 2007. The reclassification was effective on December 3, 2007.
11. Recently Issued Accounting Standards
The Financial Accounting Standards Board (FASB) issued Accounting Standards Codification (ASC) Section 820-10 (formerly Statement of Financial Accounting Standards No. 157, “Fair Value Measurements”), in September 2006, which is effective for fiscal years beginning after November 15, 2007. ASC Section 820-10 defines fair value, establishes a framework for measuring fair value and expands the required financial statement disclosures about fair value measurements. The adoption of ASC Section 820-10 did not materially impact the determination of fair value.
In March 2008, the FASB issued ASC Section 815-10 (formerly Statement of Financial Accounting Standards No. 161, “Disclosures about Derivative Instruments and Hedging Activities — an amendment of FASB Statement No. 133”). ASC Section 815-10 is effective for interim periods beginning after November 15, 2008 and has been adopted by the fund. ASC Section 815-10 amends and expands disclosures about derivative instruments and hedging activities. ASC Section 815-10 requires qualitative disclosures about the objectives and strategies of derivative instruments, quantitative disclosures about the fair value amounts of and gains and losses on derivative instruments, and disclosures of credit-risk-related contingent features in hedging activities.
12. Other Tax Information (Unaudited)
The following information is provided pursuant to provisions of the Internal Revenue Code.
The fund hereby designates up to the maximum amount allowable as qualified dividend income for the fiscal year ended October 31, 2009.
For corporate taxpayers, the fund hereby designates ordinary income distributions of $5,418,030, or up to the maximum amount allowable, of ordinary income distributions paid during the fiscal year ended October 31, 2009 as qualified for the corporate dividends received deduction.
35
| | | | | | |
| Balanced | | | | | |
| |
| Investor Class | | | | | |
| For a Share Outstanding Throughout the Years Ended October 31 | | | |
| | | 2009 | 2008 | 2007 | 2006 | 2005 |
| Per-Share Data | | | | | |
| Net Asset Value, Beginning of Period | $12.66 | $17.47 | $17.03 | $16.52 | $15.73 |
| Income From Investment Operations | | | | | |
| Net Investment Income (Loss)(1) | 0.28 | 0.37 | 0.35 | 0.35 | 0.31 |
| Net Realized and Unrealized Gain (Loss) | 0.93 | (3.69) | 1.11 | 1.40 | 0.77 |
| Total From Investment Operations | 1.21 | (3.32) | 1.46 | 1.75 | 1.08 |
| Distributions | | | | | |
| From Net Investment Income | (0.29) | (0.37) | (0.36) | (0.35) | (0.29) |
| From Net Realized Gains | — | (1.12) | (0.66) | (0.89) | — |
| Total Distributions | (0.29) | (1.49) | (1.02) | (1.24) | (0.29) |
| Net Asset Value, End of Period | $13.58 | $12.66 | $17.47 | $17.03 | $16.52 |
| |
| Total Return(2) | 9.81% | (20.52)% | 8.92% | 11.04% | 6.89% |
| |
| Ratios/Supplemental Data | | | | | |
| Ratio of Operating Expenses | | | | | |
| to Average Net Assets | 0.90% | 0.90% | 0.90% | 0.90% | 0.90% |
| Ratio of Net Investment Income (Loss) | | | | | |
| to Average Net Assets | 2.21% | 2.42% | 2.08% | 2.13% | 1.89% |
| Portfolio Turnover Rate | 110% | 153% | 161% | 197% | 206% |
| Net Assets, End of Period (in millions) | $459 | $440 | $636 | $637 | $615 |
| (1) | Computed using average shares outstanding throughout the period. | | | | |
| (2) | Total return assumes reinvestment of net investment income and capital gains distributions, if any. The total return of the classes may not |
| | precisely reflect the class expense differences because of the impact of calculating the net asset values to two decimal places. If net asset |
| | values were calculated to three decimal places, the total return differences would more closely reflect the class expense differences. The |
| | calculation of net asset value to two decimal places is made in accordance with SEC guidelines and does not result in any gain or loss of value |
| | between one class and another. | | | | | |
| |
| |
| See Notes to Financial Statements. | | | | | |
36
| | | | | | |
| Balanced | | | | | |
| |
| Institutional Class | | | | | |
| For a Share Outstanding Throughout the Years Ended October 31 | | | |
| | | 2009 | 2008 | 2007 | 2006 | 2005 |
| Per-Share Data | | | | | |
| Net Asset Value, Beginning of Period | $12.66 | $17.47 | $17.04 | $16.53 | $15.73 |
| Income From Investment Operations | | | | | |
| Net Investment Income (Loss)(1) | 0.30 | 0.39 | 0.39 | 0.38 | 0.33 |
| Net Realized and Unrealized Gain (Loss) | 0.94 | (3.68) | 1.09 | 1.40 | 0.80 |
| Total From Investment Operations | 1.24 | (3.29) | 1.48 | 1.78 | 1.13 |
| Distributions | | | | | |
| From Net Investment Income | (0.31) | (0.40) | (0.39) | (0.38) | (0.33) |
| From Net Realized Gains | — | (1.12) | (0.66) | (0.89) | — |
| Total Distributions | (0.31) | (1.52) | (1.05) | (1.27) | (0.33) |
| Net Asset Value, End of Period | $13.59 | $12.66 | $17.47 | $17.04 | $16.53 |
| |
| Total Return(2) | 10.11% | (20.37)% | 9.07% | 11.26% | 7.17% |
| |
| Ratios/Supplemental Data | | | | | |
| Ratio of Operating Expenses | | | | | |
| to Average Net Assets | 0.70% | 0.70% | 0.70% | 0.70% | 0.70% |
| Ratio of Net Investment Income (Loss) | | | | | |
| to Average Net Assets | 2.41% | 2.62% | 2.28% | 2.33% | 2.09% |
| Portfolio Turnover Rate | 110% | 153% | 161% | 197% | 206% |
| Net Assets, End of Period (in thousands) | $6,249 | $5,927 | $1,338 | $1,228 | $1,237 |
| (1) | Computed using average shares outstanding throughout the period. | | | | |
| (2) | Total return assumes reinvestment of net investment income and capital gains distributions, if any. The total return of the classes may not |
| | precisely reflect the class expense differences because of the impact of calculating the net asset values to two decimal places. If net asset |
| | values were calculated to three decimal places, the total return differences would more closely reflect the class expense differences. The |
| | calculation of net asset value to two decimal places is made in accordance with SEC guidelines and does not result in any gain or loss of value |
| | between one class and another. | | | | | |
| |
| |
| See Notes to Financial Statements. | | | | | |
37
|
| Report of Independent Registered Public Accounting Firm |
The Board of Directors and Shareholders,
American Century Mutual Funds, Inc.:
We have audited the accompanying statement of assets and liabilities, including the schedule of investments, of Balanced Fund, one of the funds constituting American Century Mutual Funds, Inc. (the “Corporation”), as of October 31, 2009, and the related statement of operations for the year then ended, the statements of changes in net assets for each of the two years in the period then ended, and the financial highlights for each of the five years in the period then ended. These financial statements and financial highlights are the responsibility of the Corporation’s management. Our responsibility is to express an opinion on these financial statements and financial highlights based on our audits.
We conducted our audits in accordance with the standards of the Public Company Accounting Oversight Board (United States). Those standards require that we plan and perform the audit to obtain reasonable assurance about whether the financial statements and financial highlights are free of material misstatement. The Corporation is not required to have, nor were we engaged to perform, an audit of its internal control over financial reporting. Our audits included consideration of internal control over financial reporting as a basis for designing audit procedures that are appropriate in the circumstances, but not for the purpose of expressing an opinion on the effectiveness of the Corporation’s internal control over financial reporting. Accordingly, we express no such opinion. An audit also includes examining, on a test basis, evidence supporting the amounts and disclosures in the financial statements, assessing the accounting principles used and significant estimates made by management, as well as evaluating the overall financial statement presentation. Our procedures included confirmation of securities owned as of October 31, 2009, by correspondence with the custodian and brokers; where replies were not received from brokers, we performed other auditing procedures. We believe that our audits provide a reasonable basis for our opinion.
In our opinion, the financial statements and financial highlights referred to above present fairly, in all material respects, the financial position of Balanced Fund of American Century Mutual Funds, Inc., as of October 31, 2009, the results of its operations for the year then ended, the changes in its net assets for each of the two years in the period then ended, and the financial highlights for each of the five years in the period then ended, in conformity with accounting principles generally accepted in the United States of America.
Deloitte & Touche LLP
Kansas City, Missouri
December 28, 2009
38
The individuals listed below serve as directors or officers of the fund. Each director serves until his or her successor is duly elected and qualified or until he or she retires. Mandatory retirement age for independent directors is 72. Those listed as interested directors are “interested” primarily by virtue of their engagement as directors and/or officers of, or ownership interest in, American Century Companies, Inc. (ACC) or its wholly owned, direct or indirect, subsidiaries, including the fund’s investment advisor, American Century Investment Management, Inc. (ACIM); the fund’s principal underwriter, American Century Investment Services, Inc. (ACIS); and the fund’s transfer agent, American Century Services, LLC (ACS).
The other directors (more than three-fourths of the total number) are independent; that is, they have never been employees, directors or officers of, and have no financial interest in, ACC or any of its wholly owned, direct or indirect, subsidiaries, including ACIM, ACIS and ACS. The directors serve in this capacity for seven registered investment companies in the American Century Investments family of funds.
All persons named as officers of the fund also serve in similar capacities for the other 14 registered investment companies in the American Century Investments family of funds advised by ACIM or American Century Global Investment Management, Inc. (ACGIM), a wholly owned subsidiary of ACIM, unless otherwise noted. Only officers with policy-making functions are listed. No officer is compensated for his or her service as an officer of the fund. The listed officers are interested persons of the fund and are appointed or re-appointed on an annual basis.
Interested Director
Jonathan S. Thomas, 4500 Main Street, Kansas City, MO 64111
Year of Birth: 1963
Position(s) Held with Fund: Director (since 2007) and President (since 2007)
Principal Occupation(s) During Past 5 Years: President and Chief Executive Officer, ACC
(March 2007 to present); Chief Administrative Officer, ACC (February 2006 to
February 2007); Executive Vice President, ACC (November 2005 to February 2007).
Also serves as: President, Chief Executive Officer and Director, ACS; Executive
Vice President, ACIM and ACGIM; Director, ACIM, ACGIM, ACIS and other ACC
subsidiaries. Managing Director, Morgan Stanley (March 2000 to November 2005)
Number of Portfolios in Fund Complex Overseen by Director: 103
Other Directorships Held by Director: None
Independent Directors
Thomas A. Brown, 4500 Main Street, Kansas City, MO 64111
Year of Birth: 1940
Position(s) Held with Fund: Director (since 1980)
Principal Occupation(s) During Past 5 Years: Managing Member, Associated Investments, LLC
(real estate investment company); Managing Member, Brown Cascade Properties,
LLC (real estate investment company); Retired, Area Vice President, Applied
Industrial Technologies (bearings and power transmission company)
Number of Portfolios in Fund Complex Overseen by Director: 63
Other Directorships Held by Director: None
39
Andrea C. Hall, Ph.D., 4500 Main Street, Kansas City, MO 64111
Year of Birth: 1945
Position(s) Held with Fund: Director (since 1997)
Principal Occupation(s) During Past 5 Years: Retired, Advisor to the President, Midwest
Research Institute (not-for-profit, contract research organization)
Number of Portfolios in Fund Complex Overseen by Director: 63
Other Directorships Held by Director: None
James A. Olson, 4500 Main Street, Kansas City, MO 64111
Year of Birth: 1942
Position(s) Held with Fund: Director (since 2007)
Principal Occupation(s) During Past 5 Years: Member, Plaza Belmont LLC (private equity
fund manager); Chief Financial Officer, Plaza Belmont LLC (September 1999 to
September 2006)
Number of Portfolios in Fund Complex Overseen by Director: 63
Other Directorships Held by Director: Saia, Inc. and Entertainment Properties Trust
Donald H. Pratt, 4500 Main Street, Kansas City, MO 64111
Year of Birth: 1937
Position(s) Held with Fund: Director (since 1995) and Chairman of the Board (since 2005)
Principal Occupation(s) During Past 5 Years: Chairman and Chief Executive Officer, Western
Investments, Inc. (real estate company); Retired Chairman of the Board, Butler
Manufacturing Company (metal buildings producer)
Number of Portfolios in Fund Complex Overseen by Director: 63
Other Directorships Held by Director: None
Gale E. Sayers, 4500 Main Street, Kansas City, MO 64111
Year of Birth: 1943
Position(s) Held with Fund: Director (since 2000)
Principal Occupation(s) During Past 5 Years: President, Chief Executive Officer and Founder,
Sayers40, Inc. (technology products and services provider)
Number of Portfolios in Fund Complex Overseen by Director: 63
Other Directorships Held by Director: None
M. Jeannine Strandjord, 4500 Main Street, Kansas City, MO 64111
Year of Birth: 1945
Position(s) Held with Fund: Director (since 1994)
Principal Occupation(s) During Past 5 Years: Retired, formerly Senior Vice President, Sprint
Corporation (telecommunications company)
Number of Portfolios in Fund Complex Overseen by Director: 63
Other Directorships Held by Director: DST Systems, Inc.; Euronet Worldwide, Inc. and
Charming Shoppes, Inc.
John R. Whitten, 4500 Main Street, Kansas City, MO 64111
Year of Birth: 1946
Position(s) Held with Fund: Director (since 2008)
Principal Occupation(s) During Past 5 Years: Project Consultant, Celanese Corp. (industrial
chemical company) (September 2004 to January 2005)
Number of Portfolios in Fund Complex Overseen by Director: 63
Other Directorships Held by Director: Rudolph Technologies, Inc.
40
Officers
Barry Fink, 4500 Main Street, Kansas City, MO 64111
Year of Birth: 1955
Position(s) Held with Fund: Executive Vice President (since 2007)
Principal Occupation(s) During Past 5 Years: Chief Operating Officer and Executive Vice
President, ACC (September 2007 to present); President, ACS (October 2007 to
present); Managing Director, Morgan Stanley (2000 to 2007); Global General
Counsel, Morgan Stanley (2000 to 2006). Also serves as: Director, ACC, ACS, ACIS
and other ACC subsidiaries
Maryanne Roepke, 4500 Main Street, Kansas City, MO 64111
Year of Birth: 1956
Position(s) Held with Fund: Chief Compliance Officer (since 2006) and Senior Vice
President (since 2000)
Principal Occupation(s) During Past 5 Years: Chief Compliance Officer, ACIM, ACGIM and ACS
(August 2006 to present); Assistant Treasurer, ACC (January 1995 to August 2006);
and Treasurer and Chief Financial Officer, various American Century Investments
funds (July 2000 to August 2006). Also serves as: Senior Vice President, ACS
Charles A. Etherington, 4500 Main Street, Kansas City, MO 64111
Year of Birth: 1957
Position(s) Held with Fund: General Counsel (since 2007) and Senior Vice President
(since 2006)
Principal Occupation(s) During Past 5 Years: Attorney, ACC (February 1994 to present); Vice
President, ACC (November 2005 to present); General Counsel, ACC (March 2007
to present). Also serves as: General Counsel, ACIM, ACGIM, ACS, ACIS and other
ACC subsidiaries; and Senior Vice President, ACIM, ACGIM and ACS
Robert Leach, 4500 Main Street, Kansas City, MO 64111
Year of Birth: 1966
Position(s) Held with Fund: Vice President, Treasurer and Chief Financial Officer
(all since 2006)
Principal Occupation(s) During Past 5 Years: Vice President, ACS (February 2000 to present);
and Controller, various American Century Investments funds (1997 to
September 2006)
David H. Reinmiller, 4500 Main Street, Kansas City, MO 64111
Year of Birth: 1963
Position(s) Held with Fund: Vice President (since September 2000)
Principal Occupation(s) During Past 5 Years: Attorney, ACC (January 1994 to present);
Associate General Counsel, ACC (January 2001 to present); Chief Compliance
Officer, American Century Investments funds, ACIM and ACGIM (January 2001 to
February 2005). Also serves as: Associate General Counsel, ACIM, ACGIM, ACS,
ACIS and other ACC subsidiaries; and Vice President, ACIM, ACGIM and ACS
Ward Stauffer, 4500 Main Street, Kansas City, MO 64111
Year of Birth: 1960
Position(s) Held with Fund: Secretary (since February 2005)
Principal Occupation(s) During Past 5 Years: Attorney, ACC (June 2003 to present)
The SAI has additional information about the fund’s directors and is available without charge, upon request, by calling 1-800-345-2021.
41
|
| Approval of Management Agreement |
Under Section 15(c) of the Investment Company Act, contracts for investment advisory services are required to be reviewed, evaluated and approved by a majority of a fund’s independent directors (the “Directors”) each year. At American Century Investments, this process is referred to as the “15(c) Process.” As a part of this process, the board reviews fund performance, shareholder services, audit and compliance information, and a variety of other reports from the advisor concerning fund operations. In addition to this annual review, the board of directors oversees and evaluates on a continuous basis at its quarterly meetings the nature and quality of significant services performed by the advisor, fund performance, audit and compliance information, and a variety of other reports relating to fund operations. The board, or committees of the board, also holds special meetings as needed.
Under a Securities and Exchange Commission rule, each fund is required to disclose in its annual or semiannual report, as appropriate, the material factors and conclusions that formed the basis for the board’s approval or renewal of any advisory agreements within the fund’s most recently completed fiscal half-year period.
Annual Contract Review Process
As part of the annual 15(c) Process undertaken during the most recent fiscal half-year period, the Directors reviewed extensive data and information compiled by the advisor and certain independent providers of evaluative data (the “15(c) Providers”) concerning Balanced (the “Fund”) and the services provided to the Fund under the management agreement. The information considered and the discussions held at the meetings included, but were not limited to:
• the nature, extent and quality of investment management, shareholder services and other services provided to the Fund;
• the wide range of programs and services the advisor provides to the Fund and its shareholders on a routine and non-routine basis;
• the compliance policies, procedures, and regulatory experience of the advisor;
• data comparing the cost of owning the Fund to the cost of owning a similar fund;
• data comparing the Fund’s performance to appropriate benchmarks and/ or a peer group of other mutual funds with similar investment objectives and strategies;
• financial data showing the profitability of the Fund to the advisor and the overall profitability of the advisor;
• data comparing services provided and charges to other investment management clients of the advisor; and
42
• consideration of collateral benefits derived by the advisor from the management of the Fund and any potential economies of scale relating thereto.
In keeping with its practice, the Fund’s board of directors held two in-person meetings and one telephonic meeting to review and discuss the information provided. The board also had the benefit of the advice of its independent counsel throughout the period.
Factors Considered
The Directors considered all of the information provided by the advisor, the 15(c) Providers, and the board’s independent counsel, and evaluated such information for each fund for which the board has responsibility. In connection with their review of the Fund, the Directors did not identify any single factor as being all-important or controlling, and each Director may have attributed different levels of importance to different factors. In deciding to renew the management and subadvisory agreements under the terms ultimately determined by the board to be appropriate, the Directors’ decision was based on the following factors.
Nature, Extent and Quality of Services — Generally. Under the management agreement, the advisor is responsible for providing or arranging for all services necessary for the operation of the Fund. The board noted that under the management agreement, the advisor provides or arranges at its own expense a wide variety of services including:
• Fund construction and design
• portfolio security selection
• initial capitalization/funding
• securities trading
• Fund administration
• custody of Fund assets
• daily valuation of the Fund’s portfolio
• shareholder servicing and transfer agency, including shareholder confirmations, recordkeeping and communications
• legal services
• regulatory and portfolio compliance
• financial reporting
• marketing and distribution
43
The Directors noted that many of the services provided by the advisor have expanded over time both in terms of quantity and complexity in response to shareholder demands, competition in the industry and the changing regulatory environment. They discussed with the advisor the challenges presented by these changes and the impact on the Fund. In performing their evaluation, the Directors considered information received in connection with the annual review, as well as information provided on an ongoing basis at their regularly scheduled board and committee meetings.
Investment Management Services. The nature of the investment management services provided to the Fund is quite complex and allows Fund shareholders access to professional money management, instant diversification of their investments, and liquidity. In evaluating investment performance, the board expects the advisor to manage the Fund in accordance with its investment objectives and approved strategies. Further, the Directors recognize that the advisor has an obligation to monitor trading activities, and in particular to seek the best execution of fund trades, and to evaluate the use of and payment for research. In providing these services, the advisor utilizes teams of investment professionals (portfolio managers, analysts, research assistants, and securities traders) who require extensive information technology, research, training, compl iance and other systems to conduct their business. At each quarterly meeting the Directors review investment performance information for the Fund, together with comparative information for appropriate benchmarks and/or peer groups of funds managed similarly to the Fund. The Directors also review detailed performance information during the 15(c) Process comparing the Fund’s performance with that of similar funds not managed by the advisor. If performance concerns are identified, the Directors discuss with the advisor the reasons for such results (e.g., market conditions, security selection) and any efforts being undertaken to improve performance. The Fund’s performance was above its benchmark for the one-year period and slightly below its benchmark for the three-year period.
Shareholder and Other Services. The advisor provides the Fund with a comprehensive package of transfer agency, shareholder, and other services. The Directors review reports and evaluations of such services at their regular quarterly meetings, including the annual meeting concerning contract review, and reports to the board. These reports include, but are not limited to, information regarding the operational efficiency and accuracy of the shareholder and transfer agency services provided, staffing levels, shareholder satisfaction (as measured by external as well as internal sources), technology support, new products and services offered to Fund shareholders, securities trading activities, portfolio valuation services, auditing services, and legal and operational compliance activities. Certain aspects of shareholder and transfer agency servi ce level efficiency and the quality of securities trading activities are measured by independent third party providers and are presented in comparison to other fund groups not managed by the advisor.
44
Costs of Services Provided and Profitability. The advisor provides detailed information concerning its cost of providing various services to the Fund, its profitability in managing the Fund, its overall profitability, and its financial condition. The Directors have reviewed with the advisor the methodology used to prepare this financial information. This financial information regarding the advisor is considered in order to evaluate the advisor’s financial condition, its ability to continue to provide services under the management agreement, and the reasonableness of the current management fee. The board concluded that the advisor’s profits were reasonable in light of the services provided to the Fund.
Ethics. The Directors generally consider the advisor’s commitment to providing quality services to shareholders and to conducting its business ethically. They noted that the advisor’s practices generally meet or exceed industry best practices.
Economies of Scale. The Directors review information provided by the advisor regarding the possible existence of economies of scale in connection with the management of the Fund. The Directors concluded that economies of scale are difficult to measure and predict with precision, especially on a fund-by-fund basis. The analysis of economies of scale is further complicated by the additional services and content provided by the advisor and its reinvestment in its ability to provide and expand those services. Accordingly, the Directors seek to evaluate economies of scale by reviewing other information, such as year-over-year profitability of the advisor generally, the profitability of its management of the Fund specifically, the expenses incurred by the advisor in providing various functions to the Fund, and the fees of competitive funds not m anaged by the advisor. The Directors believe the advisor is appropriately sharing economies of scale through its competitive fee structure, fee breakpoints as the Fund increases in size, and through reinvestment in its business to provide shareholders additional content and services.
Comparison to Other Funds’ Fees. The Fund pays the advisor a single, all-inclusive (or unified) management fee for providing all services necessary for the management and operation of the Fund, other than brokerage expenses, taxes, interest, extraordinary expenses, and the fees and expenses of the Fund’s independent directors (including their independent legal counsel). Under the unified fee structure, the advisor is responsible for providing all investment advisory, custody, audit, administrative, compliance, record-keeping, marketing and shareholder services, or arranging and supervising third parties to provide such services. By contrast, most other funds are charged a variety of fees, including an investment advisory fee, a transfer agency fee, an administrative fee, distribution charges and other expenses. Other than their i nvestment advisory fees and Rule 12b-1 distribution fees, all other components of the total fees charged by these other funds may be increased without shareholder approval. The board believes the unified fee structure is a benefit to Fund shareholders because it clearly discloses to shareholders the cost of owning Fund shares, and, since the unified fee cannot be increased without a vote of Fund shareholders, it shifts to the advisor the risk of increased costs of operating the Fund and provides a
45
direct incentive to minimize administrative inefficiencies. Part of the Directors’ analysis of fee levels involves reviewing certain evaluative data compiled by a 15(c) Provider comparing the Fund’s unified fee to the total expense ratio of other funds in the Fund’s peer group and performing a regression analysis to evaluate the effect of fee breakpoints as assets under management increase. The unified fee charged to shareholders of the Fund was below the median of the total expense ratios of its peer group. In addition, the Directors also reviewed updated fee level data provided by the advisor, but recognized that comparative data was particularly difficult to evaluate given the significant market developments during the past year. The board concluded that the management fee paid by the Fund to the advisor was reasonable in light of the services provided to the Fund.
Comparison to Fees and Services Provided to Other Clients of the Advisor. The Directors also requested and received information from the advisor concerning the nature of the services, fees, and profitability of its advisory services to advisory clients other than the Fund. They observed that these varying types of client accounts require different services and involve different regulatory and entrepreneurial risks than the management of the Fund. The Directors analyzed this information and concluded that the fees charged and services provided to the Fund were reasonable by comparison.
Collateral Benefits Derived by the Advisor. The Directors considered the existence of collateral benefits the advisor may receive as a result of its relationship with the Fund. They concluded that the advisor’s primary business is managing mutual funds and it generally does not use fund or shareholder information to generate profits in other lines of business, and therefore does not derive any significant collateral benefits from them. The Directors noted that the advisor receives proprietary research from broker-dealers that execute fund portfolio transactions and concluded that this research is likely to benefit fund shareholders. The Directors also determined that the advisor is able to provide investment management services to certain clients other than the Fund, at least in part, due to its existing infrastructure built to serve the fund complex. The Directors concluded, however, that the assets of those other clients are not material to the analysis and, in any event, are included with the assets of the Fund to determine breakpoints in the Fund’s fee schedule, provided they are managed using the same investment team and strategy.
Conclusions of the Directors
As a result of this process, the board, including all of the independent directors, in the absence of particular circumstances and assisted by the advice of legal counsel that is independent of the advisor, taking into account all of the factors discussed above and the information provided by the advisor concluded that the investment management agreement between the Fund and the advisor is fair and reasonable in light of the services provided and should be renewed.
46
Retirement Account Information
As required by law, distributions you receive from certain IRAs, or 403(b), 457 and qualified plans are subject to federal income tax withholding, unless you elect not to have withholding apply. Tax will be withheld on the total amount withdrawn even though you may be receiving amounts that are not subject to withholding, such as nondeductible contributions. In such case, excess amounts of withholding could occur. You may adjust your withholding election so that a greater or lesser amount will be withheld.
If you don’t want us to withhold on this amount, you must notify us to not withhold the federal income tax. You may notify us in writing or in certain situations by telephone or through other electronic means. You have the right to revoke your withholding election at any time and any election you make may remain in effect until revoked by filing a new election.
Remember, even if you elect not to have income tax withheld, you are liable for paying income tax on the taxable portion of your withdrawal. If you elect not to have income tax withheld or you don’t have enough income tax withheld, you may be responsible for payment of estimated tax. You may incur penalties under the estimated tax rules if your withholding and estimated tax payments are not sufficient. You can reduce or defer the income tax on a distribution by directly or indirectly rolling such distribution over to another IRA or eligible plan. You should consult your tax advisor for additional information.
State tax will be withheld if, at the time of your distribution, your address is within one of the mandatory withholding states and you have federal income tax withheld. State taxes will be withheld from your distribution in accordance with the respective state rules.
Proxy Voting Guidelines
American Century Investment Management, Inc., the fund’s investment advisor, is responsible for exercising the voting rights associated with the securities purchased and/or held by the fund. A description of the policies and procedures the advisor uses in fulfilling this responsibility is available without charge, upon request, by calling 1-800-345-2021. It is also available on American Century Investments’ website at americancentury.com and on the Securities and Exchange Commission’s website at sec.gov. Information regarding how the investment advisor voted proxies relating to portfolio securities during the most recent 12-month period ended June 30 is available on the “About Us” page at americancentury.com. It is also available at sec.gov.
Quarterly Portfolio Disclosure
The fund files its complete schedule of portfolio holdings with the Securities and Exchange Commission (SEC) for the first and third quarters of each fiscal year on Form N-Q. The fund’s Form N-Q is available on the SEC’s website at sec.gov, and may be reviewed and copied at the SEC’s Public Reference Room in Washington, DC. Information on the operation of the Public Reference Room may be obtained by calling 1-800-SEC-0330. The fund also makes its complete schedule of portfolio holdings for the most recent quarter of its fiscal year available on its website at americancentury.com and, upon request, by calling 1-800-345-2021.
47
The following indices are used to illustrate investment market, sector, or style performance or to serve as fund performance comparisons. They are not investment products available for purchase.
The blended index is considered the benchmark for Balanced. It combines two widely known indices in proportion to the asset mix of the fund. Accordingly, 60% of the index is represented by the S&P 500 Index, which reflects the approximately 60% of the fund’s assets invested in stocks. The blended index’s remaining 40% is represented by the Citigroup US Broad Investment-Grade Bond Index, which reflects the roughly 40% of the fund’s assets invested in fixed-income securities.
The Citigroup Agency Index is a market-capitalization-weighted index that includes US government sponsored agencies with a remaining maturity of at least one year.
The Citigroup Credit Index includes US and non-US corporate securities and non-US sovereign and provincial securities.
The Citigroup Mortgage Index measures the mortgage component of the US BIG Bond Index, comprising 15- and 30-year GNMA, FNMA, and FHLMC pass-throughs and FNMA and FHLMC balloon mortgages.
The Citigroup Treasury Index is comprised of US Treasury securities with an amount outstanding of at least $5 billion and a remaining maturity of at least one year.
The Citigroup US Broad Investment-Grade (BIG) Bond Index is a market-capitalization-weighted index that includes fixed-rate Treasury, government-sponsored, mortgage, asset-backed, and investment-grade issues with a maturity of one year or longer.
The Russell 1000® Index is a market-capitalization weighted, large-cap index created by Frank Russell Company to measure the performance of the 1,000 largest publicly traded U.S. companies, based on total market capitalization.
The Russell 2000® Index is a market-capitalization weighted index created by Frank Russell Company to measure the performance of the 2,000 smallest of the 3,000 largest publicly traded U.S. companies, based on total market capitalization.
The Russell Midcap® Index measures the performance of the 800 smallest of the 1,000 largest publicly traded U.S. companies, based on total market capitalization.
The S&P 500 Index is a market value-weighted index of the stocks of 500 publicly traded U.S. companies chosen for market size, liquidity, and industry group representation that are considered to be leading firms in dominant industries. Each stock’s weight in the index is proportionate to its market value. Created by Standard & Poor’s, it is considered to be a broad measure of U.S. stock market performance.
48

| |
| |
| Contact Us | |
| americancentury.com | |
| Automated Information Line | 1-800-345-8765 |
| Investor Services Representative | 1-800-345-2021 or |
| | 816-531-5575 |
| Business, Not-For-Profit, Employer-Sponsored | |
| Retirement Plans | 1-800-345-3533 |
| Banks and Trust Companies, Broker-Dealers, | |
| Financial Professionals, Insurance Companies | 1-800-345-6488 |
| Telecommunications Device for the Deaf | 1-800-634-4113 |
| American Century Mutual Funds, Inc. | |
| Investment Advisor: | |
| American Century Investment Management, Inc. | |
| Kansas City, Missouri | |
This report and the statements it contains are submitted for the general
information of our shareholders. The report is not authorized for distribution to
prospective investors unless preceded or accompanied by an effective prospectus.
American Century Investment Services, Inc., Distributor
©2009 American Century Proprietary Holdings, Inc. All rights reserved.
0912
CL-ANN-67029N
|
| Annual Report |
| October 31, 2009 |

|
| American Century Investments |
Capital Value Fund
| |
| President’s Letter | 2 |
| Independent Chairman’s Letter | 3 |
| Market Perspective | 4 |
| U.S. Stock Index Returns | 4 |
| |
| Capital Value | |
| |
| Performance | 5 |
| Portfolio Commentary | 7 |
| Top Ten Holdings | 9 |
| Top Five Industries | 9 |
| Types of Investments in Portfolio | 9 |
| |
| Shareholder Fee Example | 10 |
| |
| Financial Statements | |
| |
| Schedule of Investments | 12 |
| Statement of Assets and Liabilities | 15 |
| Statement of Operations | 16 |
| Statement of Changes in Net Assets | 17 |
| Notes to Financial Statements | 18 |
| Financial Highlights | 24 |
| Report of Independent Registered Public Accounting Firm | 27 |
| |
| Other Information | |
| |
| Management | 28 |
| Approval of Management Agreement | 31 |
| Additional Information | 36 |
| Index Definitions | 37 |
The opinions expressed in the Market Perspective and the Portfolio Commentary reflect those of the portfolio management team as of the date of the report, and do not necessarily represent the opinions of American Century Investments or any other person in the American Century Investments organization. Any such opinions are subject to change at any time based upon market or other conditions and American Century Investments disclaims any responsibility to update such opinions. These opinions may not be relied upon as investment advice and, because investment decisions made by American Century Investments funds are based on numerous factors, may not be relied upon as an indication of trading intent on behalf of any American Century Investments fund. Security examples are used for representational purposes only and are not intended as recommendations to purchase or sell securities. Performance information for comparative i ndices and securities is provided to American Century Investments by third party vendors. To the best of American Century Investments’ knowledge, such information is accurate at the time of printing.

Dear Investor:
Thank you for taking time to review the following pages, which provide the performance of your investment along with the perspectives of our experienced portfolio management team for the financial reporting period ended October 31, 2009. We appreciate your trust in American Century Investments® at this volatile, transitional time in the economy and investment markets.
As the upheavals associated with the “Great Recession” gradually subside, our senior management team has put considerable thought into how the investment environment has changed and what new challenges and opportunities await us. Critical factors that we are anticipating in the coming year include marked shifts in investment and spending behavior, along with consolidation in our industry.
Most importantly, we think the economic recovery will be slow and extended. The economy and capital markets have come a long way since Lehman Brothers collapsed in the third quarter of 2008, but 2010 will likely bring continuing challenges. The stock market’s rebound since last March and the third-quarter economic surge in 2009 were fueled largely by corporate cost-cutting and unprecedented monetary and fiscal stimulus, including some key programs that have since expired or been scaled back.
Meanwhile, the resilient but struggling consumer sector still faces double-digit unemployment, heavy debt burdens, tight credit conditions, and a housing market that is starting to stabilize, but remains vulnerable. Much of our investment positioning in 2009 cautiously reflected these still unstable economic fundamentals, leading to underperformance, in some cases, versus market benchmarks buoyed by the rally of riskier assets. We still support our fundamentally based positioning because we believe strongly that some markets—driven more by technical factors than fundamentals—have advanced further than underlying economic conditions warrant, and remain susceptible to the possibility of more volatility ahead.
Thank you for your continued confidence in us.
Sincerely,

Jonathan Thomas
President and Chief Executive Officer
American Century Investments
2
|
| Independent Chairman’s Letter |

In my first letter to shareholders of the American Century Investments funds, I invited you to contact me with your questions. I have been gratified with your response. Most shareholder inquiries to date have related to specific fund performance issues. As I noted in my individual responses, your board through the Fund Performance Committee continues to stress improved performance in our quarterly meetings with chief investment officers and fund managers.
An important part of our fund performance review process is a face-to-face meeting with portfolio managers. The board traveled during the second quarter to the American Century Investments office in Mountain View, California to meet with the fund of funds and asset allocation portfolio management teams. These meetings validated the importance of thorough reviews of investment opportunities by the credit management personnel resident in that office. As a result of their efforts, American Century Investments funds were able to avoid the “toxic assets” that plagued many other fund families in 2008.
From April through June 2009, the board conducted its annual review of the advisory contracts between American Century Investments and each fund. Our efforts involved a review of fund information, including assets under management; total expense ratio compared to peers; economies of scale; fee breakpoints that reduce shareholder costs as assets increase; performance compared to peers and benchmarks; and the quality of services provided to fund shareholders. A detailed discussion of board considerations in connection with advisory contract renewal is included annually in each fund’s shareholder reports. During this review, the board focuses on a detailed comparison of the competitive position of each fund and has negotiated more than 60 breakpoints or fee reductions in the past five years.
The board looks forward to another year of work on your behalf and your comments are appreciated. You are invited to email me at dhpratt@fundboardchair.com.

3

By Phil Davidson, Chief Investment Officer, U.S. Value Equity
A tale of two markets
Despite a dismal start, the 12 months ended October 31, 2009, proved to be a strong period for stock investors. The U.S. stock market struggled during the first half of the period, as consumer confidence and spending plunged, unemployment soared, the housing market continued to tumble, and corporate earnings faltered. At the same time, widespread credit and liquidity problems, combined with unprecedented failures, takeovers, and bailouts in the financial services industry, plagued the financial markets.
Market sentiment changed drastically in the second half of the period, as the extreme pessimism regarding the economy and financial sector gave way to a measure of optimism. Investors responded favorably to thawing credit markets, signs of improvement in the housing and manufacturing sectors and to better-than-expected corporate profits. These factors sparked a sharp stock market rally in lower-quality stocks that continued through October, even as the unemployment rate climbed above 10%, consumer confidence remained uninspiring, and the federal budget deficit reached an all-time high.
Growth Outpaced Value
The market’s rebound pushed all major stock benchmarks back into positive territory, with mid-cap stocks leading the charge. As investors moved into riskier assets, value stocks generally underperformed their growth counterparts. In addition, value managers contended with relatively poor performance among financial, utility, and telecommunication stocks, which represent a large slice of their investment universe. Dividend cuts also affected results. In the first half of the period, investors experienced the largest reduction in dividend payouts by U.S. companies in more than 50 years.
Despite signs of economic improvement, particularly in housing and manufacturing, we still expect a slow, gradual recovery. Consumer spending, which accounts for 70% of the economy, is likely to remain weak as consumers continue to reduce debt and increase savings. In this environment, we believe that stronger companies with self-funding business models, particularly those that emphasize higher returns on capital, will outperform over time. These companies will be in the best position to gain market share from weaker competitors and generate cash flows regardless of the pace of economic recovery.
| | | | |
| U.S. Stock Index Returns | | | | |
| For the 12 months ended October 31, 2009 | | | |
| Russell 1000 Index (Large-Cap) | 11.20% | | Russell 2000 Index (Small-Cap) | 6.46% |
| Russell 1000 Value Index | 4.78% | | Russell 2000 Value Index | 1.96% |
| Russell 1000 Growth Index | 17.51% | | Russell 2000 Growth Index | 11.34% |
| Russell Midcap Index | 18.75% | | | |
| Russell Midcap Value Index | 14.52% | | | |
| Russell Midcap Growth Index | 22.48% | | | |
4
| | | | | |
| Capital Value | | | | | |
| |
| Total Returns as of October 31, 2009 | | | | |
| | | Average Annual Returns | |
| | | | | Since | Inception |
| | 1 year | 5 years | 10 years | Inception | Date |
| Investor Class | 6.85% | -1.14% | 2.49% | 2.69% | 3/31/99 |
| Return After-Tax on Distributions(1) | 6.26% | -1.60% | 2.03% | 2.26% | |
| Return After-Tax on Distributions | | | | | |
| and Sale of Shares(1) | 5.06% | -0.88% | 2.06% | 2.23% | |
| Russell 1000 Value Index(2) | 4.78% | -0.05% | 1.70% | 2.18% | — |
| Institutional Class | 7.07% | -0.97% | — | 1.29% | 3/1/02 |
| Return After-Tax on Distributions(1) | 6.44% | -1.46% | — | 0.86% | |
| Return After-Tax on Distributions | | | | | |
| and Sale of Shares(1) | 5.23% | -0.73% | — | 1.11% | |
| Advisor Class | 6.59% | -1.43% | — | 2.77% | 5/14/03 |
| Return After-Tax on Distributions(1) | 6.04% | -1.86% | — | 2.41% | |
| Return After-Tax on Distributions | | | | | |
| and Sale of Shares(1) | 4.85% | -1.12% | — | 2.45% | |
| |
| (1) | After-tax returns are calculated using the historical highest individual federal marginal income tax rates, and do not reflect the impact of state |
| | and local taxes. Actual after-tax returns depend on an investor’s tax situation and may differ from those shown. After-tax returns shown are not |
| | relevant to investors who hold their fund shares through tax-deferred arrangements such as 401(k) plans or individual retirement accounts. |
| (2) | Data provided by Lipper Inc. — A Reuters Company. © 2009 Reuters. All rights reserved. Any copying, republication or redistribution of Lipper |
| | content, including by caching, framing or similar means, is expressly prohibited without the prior written consent of Lipper. Lipper shall not be |
| | liable for any errors or delays in the content, or for any actions taken in reliance thereon. |
| | The data contained herein has been obtained from company reports, financial reporting services, periodicals and other resources believed to be |
| | reliable. Although carefully verified, data on compilations is not guaranteed by Lipper and may be incomplete. No offer or solicitations to buy or |
| | sell any of the securities herein is being made by Lipper. |
Data presented reflect past performance. Past performance is no guarantee of future results. Current performance may be higher or lower than the performance shown. Investment return and principal value will fluctuate, and redemption value may be more or less than original cost. To obtain performance data current to the most recent month end, please call 1-800-345-2021 or visit americancentury.com.
Unless otherwise indicated, performance reflects Investor Class shares; performance for other share classes will vary due to differences in fee structure. For information about other share classes available, please consult the prospectus. Data assumes reinvestment of dividends and capital gains. Returns for the index are provided for comparison. The fund’s total returns include operating expenses (such as transaction costs and management fees) that reduce returns, while the total returns of the index do not.
5
Capital Value
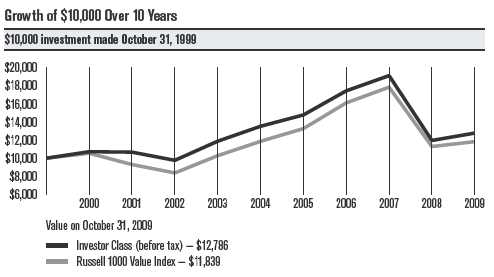
| | | | | | | | | | | |
| One-Year Returns Over 10 Years | | | | | | | |
| Periods ended October 31 | | | | | | | | | |
| | | 2000 | 2001 | 2002 | 2003 | 2004 | 2005 | 2006 | 2007 | 2008 | 2009 |
| Investor Class | | | | | | | | | | |
| (before tax) | 7.23% | -0.47% | -8.49% | 21.67% | 13.94% | 9.29% | 18.03% | 9.66% | -37.52% | 6.85% |
| Russell 1000 | | | | | | | | | | |
| Value Index | 5.52% | -11.86% | -10.02% | 22.87% | 15.45% | 11.86% | 21.46% | 10.83% | -36.80% | 4.78% |
| |
| Total Annual Fund Operating Expenses | | | | | | |
| | Investor Class | | | Institutional Class | | | Advisor Class | |
| | 1.10% | | | 0.90% | | | 1.35% | |
The total annual fund operating expenses shown is as stated in the fund’s prospectus current as of the date of this report. The prospectus may vary from the expense ratio shown elsewhere in this report because it is based on a different time period, includes acquired fund fees and expenses, and, if applicable, does not include fee waivers or expense reimbursements.
Data presented reflect past performance. Past performance is no guarantee of future results. Current performance may be higher or lower than the performance shown. Investment return and principal value will fluctuate, and redemption value may be more or less than original cost. To obtain performance data current to the most recent month end, please call 1-800-345-2021 or visit americancentury.com.
Unless otherwise indicated, performance reflects Investor Class shares; performance for other share classes will vary due to differences in fee structure. For information about other share classes available, please consult the prospectus. Data assumes reinvestment of dividends and capital gains, and none of the charts reflect the deduction of taxes that a shareholder would pay on fund distributions or the redemption of fund shares. Returns for the index are provided for comparison. The fund’s total returns include operating expenses (such as transaction costs and management fees) that reduce returns, while the total returns of the index do not.
6
Capital Value
Portfolio Managers: Chuck Ritter and Brendan Healy
Performance Summary
Capital Value returned 6.85%(1) for the 12 months ended October 31, 2009. By comparison, its benchmark, the Russell 1000 Value Index, returned 4.78%, while the broader market, as measured by the S&P 500 Index, returned 9.80%.(2) The portfolio’s return reflects operating expenses, while the indices’ returns do not. The average return for Morningstar’s Large Cap Value category (whose performance, like Capital Value’s, reflects operating expenses) was 9.52%.(3)
The one-year reporting period, described in the Market Perspective on page 4, was notable for its ups and downs. During the first few months, the stock market suffered steep declines as the U.S. government struggled to contain the financial crisis and the economic recession deepened. In the second half of the period, the economy showed signs of stabilization and improving conditions in the capital markets reduced concern about the balance sheets of the more highly leveraged companies. These factors led many investors to shift into riskier assets. As a result, most equity indices ended the period in positive territory with growth stocks beating value stocks across the capitalization spectrum. Nevertheless, Capital Value outpaced its benchmark index, largely because of effective security selection in the consumer staples, financials, consumer discretionary, and industrials sectors. The portfolio’s position in the health care sector hampered results.
Since Capital Value’s inception on March 31, 1999, the portfolio has produced an average annualized return of 2.69%, topping the returns for Morningstar’s Large Cap Value category average,the Russell 1000 Value Index, and the S&P 500 Index for that period (see performance information on pages 5 and 6 or in footnotes below).
Consumer Staples Contributed
Security selection within the consumer staples sector added the most to relative results. The portfolio did not own household products maker Procter & Gamble, which announced a slowdown in sales growth as consumers reined in spending, weakening the perception of it as a defensive investment in recessionary times.
The portfolio also benefited from its position in the beverages industry. A key contributor was Pepsi Bottling Group, the world’s largest bottler of Pepsi beverages. Its share price surged on news PepsiCo, which already owned one third of the bottling company, had launched a takeover bid. The deal is expected to close in late 2009 or early 2010.
| |
| (1) | All fund returns referenced in this commentary are for Investor Class shares. |
| (2) | The S&P 500 Index returned 0.33%, -0.95% and -0.29% on an average annualized basis for the five-year, 10-year and since inception periods |
| | ended October 31, 2009, respectively. |
| (3) | The average returns for Morningstar’s Large Cap Value category were 0.18%, 1.95% and 2.21% on an average annualized basis for the five-year, |
| | 10-year and since inception periods ended October 31, 2009, respectively. © 2009 Morningstar, Inc. All Rights Reserved. The information |
| | contained herein: (1) is proprietary to Morningstar and/or its content providers; (2) may not be copied or distributed; and (3) is not warranted to |
| | be accurate, complete or timely. Neither Morningstar nor its content providers are responsible for any damages or losses arising from any use of |
| | this information. |
7
Capital Value
Financials Added Value
An underweight in financials, the weakest sector in the benchmark, boosted relative performance. The portfolio benefited from its smaller-than-the-benchmark positions in commercial banks, thrifts, and mortgage finance companies.
However, the financials sector provided top detractor Citigroup. Shares of the financial giant, which dropped sharply early in the period, climbed as optimism about the economy sparked a rally in financials stocks. The portfolio’s underweight acted as a restraint when the stock price experienced a partial rebound.
Consumer Discretionary, Industrials Enhanced Results
Many consumer discretionary companies suffered in the economic downturn, but Capital Value’s mix of stocks added to relative progress. A notable holding was Best Buy Co., which is not represented in the benchmark. The electronics retailer executed well in the difficult environment and benefited from the bankruptcy of competitor Circuit City.
Alternatively, the portfolio did not own shares of Ford Motor, which rose nearly 220% during the period. The car maker has been able to restructure its business without the help of the U.S. government, unlike competitors General Motors and Chrysler, and has steadily gained market share.
Effective security selection among industrials companies also contributed to Capital Value’s outperformance. The machinery industry supplied top contributor Ingersoll Rand, a manufacturer of industrial and commercial products. The company reported better-than-expected results in the second quarter driven by significant cost savings from its restructuring program.
Health Care Detracted
The portfolio’s overweight in health care slowed relative results. Health care stocks benefited from the rally that began in March, but their performance was constrained as investors priced in worst-case scenarios for health care reform.
An underweighted position in health insurer WellPoint also hampered performance. We believe WellPoint had benefited during the market decline from a perception that its business was relatively stable and less sensitive than other businesses to economic weakness.
Outlook
We continue to be bottom-up investment managers, evaluating each company individually and building our portfolio one stock at a time. Capital Value is broadly diversified, with ongoing overweight positions in the health care, information technology, and consumer staples sectors. Our valuation work is also directing us toward smaller relative weightings in financials and utilities stocks. In addition, we are still finding value opportunities among mega-cap stocks and have maintained our bias toward them.
8
| | | |
| Capital Value | | |
| |
| Top Ten Holdings as of October 31, 2009 | | |
| | | % of net assets | % of net assets |
| | | as of 10/31/09 | as of 4/30/09 |
| Exxon Mobil Corp. | 5.0% | 5.7% |
| Pfizer, Inc. | 4.4% | 3.5% |
| Chevron Corp. | 3.7% | 3.7% |
| JPMorgan Chase & Co. | 3.7% | 3.5% |
| AT&T, Inc. | 3.7% | 3.9% |
| General Electric Co. | 3.3% | 4.0% |
| ConocoPhillips | 3.1% | 2.9% |
| Bank of America Corp. | 2.9% | 1.5% |
| Royal Dutch Shell plc ADR | 2.8% | 2.5% |
| Verizon Communications, Inc. | 2.1% | 2.2% |
| |
| Top Five Industries as of October 31, 2009 | | |
| | | % of net assets | % of net assets |
| | | as of 10/31/09 | as of 4/30/09 |
| Oil, Gas & Consumable Fuels | 17.7% | 16.3% |
| Pharmaceuticals | 9.8% | 12.7% |
| Diversified Financial Services | 6.9% | 5.0% |
| Diversified Telecommunication Services | 6.0% | 6.4% |
| Capital Markets | 4.4% | 3.7% |
| |
| Types of Investments in Portfolio | | |
| | | % of net assets | % of net assets |
| | | as of 10/31/09 | as of 4/30/09 |
| Domestic Common Stocks | 93.1% | 92.5% |
| Foreign Common Stocks(1) | 5.5% | 4.9% |
| Convertible Preferred Stocks | — | 0.1% |
| Total Equity Exposure | 98.6% | 97.5% |
| Temporary Cash Investments | 1.4% | 2.7% |
| Other Assets and Liabilities | —(2) | (0.2)% |
| (1) | Includes depositary shares, dual listed securities and foreign ordinary shares. | | |
| (2) | Category is less than 0.05% of total net assets. | | |
9
|
| Shareholder Fee Example (Unaudited) |
Fund shareholders may incur two types of costs: (1) transaction costs, including sales charges (loads) on purchase payments and redemption/ exchange fees; and (2) ongoing costs, including management fees; distribution and service (12b-1) fees; and other fund expenses. This example is intended to help you understand your ongoing costs (in dollars) of investing in your fund and to compare these costs with the ongoing cost of investing in other mutual funds.
The example is based on an investment of $1,000 made at the beginning of the period and held for the entire period from May 1, 2009 to October 31, 2009.
Actual Expenses
The table provides information about actual account values and actual expenses for each class. You may use the information, together with the amount you invested, to estimate the expenses that you paid over the period. First, identify the share class you own. Then simply divide your account value by $1,000 (for example, an $8,600 account value divided by $1,000 = 8.6), then multiply the result by the number under the heading “Expenses Paid During Period” to estimate the expenses you paid on your account during this period.
If you hold Investor Class shares of any American Century Investments fund, or Institutional Class shares of the American Century Diversified Bond Fund, in an American Century Investments account (i.e., not a financial intermediary or retirement plan account), American Century Investments may charge you a $12.50 semiannual account maintenance fee if the value of those shares is less than $10,000. We will redeem shares automatically in one of your accounts to pay the $12.50 fee. In determining your total eligible investment amount, we will include your investments in all personal accounts (including American Century Investments Brokerage accounts) registered under your Social Security number. Personal accounts include individual accounts, joint accounts, UGMA/UTMA accounts, personal trusts, Coverdell Education Savings Accounts and IRAs (including traditional, Roth, Rollover, SEP-, SARSEP- and SIMPLE-IRAs), and certain other retirement accounts. If you have only business, business retirement, employer-sponsored or American Century Investments Brokerage accounts, you are currently not subject to this fee. We will not charge the fee as long as you choose to manage your accounts exclusively online. If you are subject to the Account Maintenance Fee, your account value could be reduced by the fee amount.
Hypothetical Example for Comparison Purposes
The table also provides information about hypothetical account values and hypothetical expenses based on the actual expense ratio of each class of your fund and an assumed rate of return of 5% per year before expenses, which is not the actual return of a fund’s share class. The hypothetical account values and expenses may not be used to estimate the actual ending account balance or expenses you paid for the period. You may use this information to compare the ongoing costs of investing in your fund and other funds. To do so, compare this 5% hypothetical example with the 5% hypothetical examples that appear in the shareholder reports of the other funds.
10
Please note that the expenses shown in the table are meant to highlight your ongoing costs only and do not reflect any transactional costs, such as sales charges (loads) or redemption/exchange fees. Therefore, the table is useful in comparing ongoing costs only, and will not help you determine the relative total costs of owning different funds. In addition, if these transactional costs were included, your costs would have been higher.
| | | | |
| | Beginning | Ending | Expenses Paid | |
| | Account Value | Account Value | During Period* | Annualized |
| | 5/1/09 | 10/31/09 | 5/1/09 – 10/31/09 | Expense Ratio* |
| Actual | | | | |
| Investor Class | $1,000 | $1,209.10 | $6.12 | 1.10% |
| Institutional Class | $1,000 | $1,209.10 | $5.01 | 0.90% |
| Advisor Class | $1,000 | $1,204.50 | $7.50 | 1.35% |
| Hypothetical | | | | |
| Investor Class | $1,000 | $1,019.66 | $5.60 | 1.10% |
| Institutional Class | $1,000 | $1,020.67 | $4.58 | 0.90% |
| Advisor Class | $1,000 | $1,018.40 | $6.87 | 1.35% |
*Expenses are equal to the class’s annualized expense ratio listed in the table above, multiplied by the average account value over the period, multiplied by 184, the number of days in the most recent fiscal
half-year, divided by 365, to reflect the one-half year period.
11
| | | | | | |
| Capital Value | | | | | | |
| |
| OCTOBER 31, 2009 | | | | | | |
| | Shares | Value | | | Shares | Value |
| Common Stocks — 98.6% | | | DIVERSIFIED TELECOMMUNICATION | |
| | | | | SERVICES — 6.0% | | |
| AEROSPACE & DEFENSE — 2.2% | | | AT&T, Inc. | 245,200 | $ 6,294,284 |
| Honeywell International, Inc. | 35,400 | $ 1,270,506 | | CenturyTel, Inc. | 16,200 | 525,852 |
| Lockheed Martin Corp. | 6,000 | 412,740 | | Verizon | | |
| Northrop Grumman Corp. | 43,100 | 2,160,603 | | Communications, Inc. | 118,700 | 3,512,333 |
| | | 3,843,849 | | | | 10,332,469 |
| BEVERAGES — 1.5% | | | | ELECTRIC UTILITIES — 2.5% | | |
| Coca-Cola Co. (The) | 47,700 | 2,542,887 | | Exelon Corp. | 51,300 | 2,409,048 |
| BIOTECHNOLOGY — 0.5% | | | | PPL Corp. | 65,200 | 1,919,488 |
| Amgen, Inc.(1) | 15,600 | 838,188 | | | | 4,328,536 |
| CAPITAL MARKETS — 4.4% | | | | ENERGY EQUIPMENT & SERVICES — 1.6% | |
| Ameriprise Financial, Inc. | 46,700 | 1,619,089 | | Baker Hughes, Inc. | 13,700 | 576,359 |
| Bank of New York | | | | Diamond Offshore | | |
| Mellon Corp. (The) | 61,500 | 1,639,590 | | Drilling, Inc. | 5,200 | 495,300 |
| Goldman Sachs | | | | National Oilwell Varco, Inc.(1) | 36,200 | 1,483,838 |
| Group, Inc. (The) | 16,600 | 2,824,822 | | Smith International, Inc. | 8,700 | 241,251 |
| Morgan Stanley | 46,100 | 1,480,732 | | | | 2,796,748 |
| | | 7,564,233 | | FOOD & STAPLES RETAILING — 3.6% | |
| CHEMICALS — 2.3% | | | | Kroger Co. (The) | 59,800 | 1,383,174 |
| E.I. du Pont de Nemours | | | | SYSCO Corp. | 39,100 | 1,034,195 |
| & Co. | 65,800 | 2,093,756 | | | | |
| PPG Industries, Inc. | 31,900 | 1,800,117 | | Walgreen Co. | 57,000 | 2,156,310 |
| | | 3,893,873 | | Wal-Mart Stores, Inc. | 31,100 | 1,545,048 |
| COMMERCIAL BANKS — 3.9% | | | | | | 6,118,727 |
| PNC Financial | | | | FOOD PRODUCTS — 1.1% | | |
| Services Group, Inc. | 24,028 | 1,175,930 | | Unilever NV | | |
| U.S. Bancorp. | 101,800 | 2,363,796 | | New York Shares | 59,200 | 1,828,688 |
| Wells Fargo & Co. | 113,400 | 3,120,768 | | HEALTH CARE EQUIPMENT & SUPPLIES — 0.4% |
| | | 6,660,494 | | Medtronic, Inc. | 18,100 | 646,170 |
| COMMERCIAL SERVICES & SUPPLIES — 1.9% | | HEALTH CARE PROVIDERS & SERVICES — 1.2% |
| Avery Dennison Corp. | 21,700 | 773,605 | | Aetna, Inc. | 25,400 | 661,162 |
| Pitney Bowes, Inc. | 30,100 | 737,450 | | Quest Diagnostics, Inc. | 10,100 | 564,893 |
| | | | | WellPoint, Inc.(1) | 16,600 | 776,216 |
| R.R. Donnelley & Sons Co. | 39,900 | 801,192 | | | | |
| Waste Management, Inc. | 33,200 | 992,016 | | | | 2,002,271 |
| | | 3,304,263 | | HOTELS, RESTAURANTS & LEISURE — 0.6% | |
| COMMUNICATIONS EQUIPMENT — 0.8% | | | Darden Restaurants, Inc. | 14,300 | 433,433 |
| | | | | Starbucks Corp.(1) | 27,400 | 520,052 |
| Cisco Systems, Inc.(1) | 57,500 | 1,313,875 | | | | |
| COMPUTERS & PERIPHERALS — 1.2% | | | | | 953,485 |
| Hewlett-Packard Co. | 44,000 | 2,088,240 | | HOUSEHOLD DURABLES — 0.7% | |
| DIVERSIFIED CONSUMER SERVICES — 0.5% | | | Newell Rubbermaid, Inc. | 82,200 | 1,192,722 |
| H&R Block, Inc. | 47,300 | 867,482 | | HOUSEHOLD PRODUCTS — 0.3% | |
| DIVERSIFIED FINANCIAL SERVICES — 6.9% | | | Clorox Co. | 7,800 | 461,994 |
| Bank of America Corp. | 344,300 | 5,019,894 | | INDEPENDENT POWER PRODUCERS | |
| | | | | & ENERGY TRADERS — 0.3% | | |
| Citigroup, Inc. | 118,000 | 482,620 | | NRG Energy, Inc.(1) | 21,600 | 496,584 |
| JPMorgan Chase & Co. | 153,100 | 6,394,987 | | | | |
| | | 11,897,501 | | | | |
12
| | | | | | |
| Capital Value | | | | | | |
| |
| | Shares | Value | | | Shares | Value |
| INDUSTRIAL CONGLOMERATES — 3.9% | | | PHARMACEUTICALS — 9.8% | | |
| General Electric Co. | 401,100 | $ 5,719,686 | | Abbott Laboratories | 31,200 | $ 1,577,784 |
| Tyco International Ltd. | 26,800 | 899,140 | | Eli Lilly & Co. | 42,800 | 1,455,628 |
| | | 6,618,826 | | Johnson & Johnson | 56,800 | 3,354,040 |
| INSURANCE — 4.3% | | | | Merck & Co., Inc. | 95,900 | 2,966,187 |
| Allstate Corp. (The) | 70,900 | 2,096,513 | | Pfizer, Inc. | 440,286 | 7,498,070 |
| Chubb Corp. (The) | 19,700 | 955,844 | | | | 16,851,709 |
| Loews Corp. | 24,500 | 810,950 | | REAL ESTATE INVESTMENT TRUSTS (REITs) — 0.7% |
| Torchmark Corp. | 27,400 | 1,112,440 | | Host Hotels & Resorts, Inc. | 20,200 | 204,222 |
| Travelers Cos., Inc. (The) | 41,400 | 2,061,306 | | Simon Property Group, Inc. | 13,511 | 917,262 |
| XL Capital Ltd., Class A | 19,100 | 313,431 | | | | 1,121,484 |
| | | 7,350,484 | | SEMICONDUCTORS & | | |
| IT SERVICES — 1.5% | | | | SEMICONDUCTOR EQUIPMENT — 0.8% | |
| Fiserv, Inc.(1) | 14,500 | 665,115 | | Applied Materials, Inc. | 32,300 | 394,060 |
| International Business | | | | Intel Corp. | 47,600 | 909,636 |
| Machines Corp. | 16,300 | 1,965,943 | | | | 1,303,696 |
| | | 2,631,058 | | SOFTWARE — 2.1% | | |
| MACHINERY — 1.9% | | | | Activision Blizzard, Inc.(1) | 23,071 | 249,859 |
| Dover Corp. | 40,600 | 1,529,808 | | Microsoft Corp. | 77,800 | 2,157,394 |
| Ingersoll-Rand plc | 53,700 | 1,696,383 | | Oracle Corp. | 59,000 | 1,244,900 |
| | | 3,226,191 | | | | 3,652,153 |
| MEDIA — 4.3% | | | | SPECIALTY RETAIL — 2.3% | | |
| CBS Corp., Class B | 105,000 | 1,235,850 | | Best Buy Co., Inc. | 11,400 | 435,252 |
| Comcast Corp., Class A | 101,600 | 1,473,200 | | Gap, Inc. (The) | 42,200 | 900,548 |
| Time Warner Cable, Inc. | 21,252 | 838,179 | | Home Depot, Inc. (The) | 62,700 | 1,573,143 |
| Time Warner, Inc. | 72,700 | 2,189,724 | | Staples, Inc. | 49,600 | 1,076,320 |
| Viacom, Inc., Class B(1) | 60,900 | 1,680,231 | | | | 3,985,263 |
| | | 7,417,184 | | TEXTILES, APPAREL & LUXURY GOODS — 0.6% |
| METALS & MINING — 0.5% | | | | VF Corp. | 13,700 | 973,248 |
| Nucor Corp. | 20,500 | 816,925 | | TOBACCO — 1.4% | | |
| MULTILINE RETAIL — 0.7% | | | | Altria Group, Inc. | 63,600 | 1,151,796 |
| Kohl’s Corp.(1) | 21,300 | 1,218,786 | | Lorillard, Inc. | 16,800 | 1,305,696 |
| MULTI-UTILITIES — 0.7% | | | | | | 2,457,492 |
| PG&E Corp. | 30,600 | 1,251,234 | | TOTAL COMMON STOCKS | | |
| OFFICE ELECTRONICS — 0.5% | | | | (Cost $155,877,000) | | 168,934,038 |
| Xerox Corp. | 102,600 | 771,552 | | Temporary Cash Investments — 1.4% |
| OIL, GAS & CONSUMABLE FUELS — 17.7% | | | JPMorgan U.S. Treasury | | |
| Apache Corp. | 22,000 | 2,070,640 | | Plus Money Market Fund | | |
| Chevron Corp. | 83,800 | 6,414,052 | | Agency Shares | 37,180 | 37,180 |
| ConocoPhillips | 104,300 | 5,233,774 | | Repurchase Agreement, Bank of America | |
| | | | | Securities, LLC, (collateralized by various | |
| Devon Energy Corp. | 19,500 | 1,261,845 | | U.S. Treasury obligations, 1.875%-3.625%, | |
| Exxon Mobil Corp. | 120,100 | 8,607,567 | | 7/15/13-4/15/28, valued at $2,468,567), | |
| Occidental Petroleum Corp. | 21,600 | 1,639,008 | | in a joint trading account at 0.05%, | |
| | | | | dated 10/30/09, due 11/2/09 | | |
| Royal Dutch Shell plc ADR | 80,000 | 4,752,800 | | (Delivery value $2,400,010) | | 2,400,000 |
| Valero Energy Corp. | 23,400 | 423,540 | | TOTAL TEMPORARY | | |
| | | 30,403,226 | | CASH INVESTMENTS | | |
| PAPER & FOREST PRODUCTS — 0.5% | | | (Cost $2,437,180) | | 2,437,180 |
| International Paper Co. | 40,800 | 910,248 | | | | |
13
| | | | |
| Capital Value | | | | |
| | Value | | Notes to Schedule of Investments |
| TOTAL INVESTMENT | | | ADR = American Depositary Receipt |
| SECURITIES — 100.0% | | | (1) | Non-income producing. |
| (Cost $158,314,180) | $171,371,218 | | (2) | Category is less than 0.05% of total net assets. |
| OTHER ASSETS | | | | |
| AND LIABILITIES(2) | (23,514) | | | |
| TOTAL NET ASSETS — 100.0% | $171,347,704 | | Industry classifications are unaudited. |
| |
| |
| | | | See Notes to Financial Statements. |
14
|
| Statement of Assets and Liabilities |
| |
| OCTOBER 31, 2009 | |
| Assets | |
| Investment securities, at value (cost of $158,314,180) | $171,371,218 |
| Cash | 7,710 |
| Receivable for capital shares sold | 11,464 |
| Dividends and interest receivable | 277,424 |
| | 171,667,816 |
| | |
| Liabilities | |
| Payable for investments purchased | 90,919 |
| Payable for capital shares redeemed | 63,636 |
| Accrued management fees | 164,485 |
| Distribution and service fees payable | 1,072 |
| | 320,112 |
| | |
| Net Assets | $171,347,704 |
| |
| Net Assets Consist of: | |
| Capital (par value and paid-in surplus) | $189,221,847 |
| Undistributed net investment income | 2,661,811 |
| Accumulated net realized loss on investment transactions | (33,592,992) |
| Net unrealized appreciation on investments | 13,057,038 |
| | $171,347,704 |
| | |
| Investor Class, $0.01 Par Value | |
| Net assets | $158,431,346 |
| Shares outstanding | 29,800,825 |
| Net asset value per share | $5.32 |
| | |
| Institutional Class, $0.01 Par Value | |
| Net assets | $8,035,079 |
| Shares outstanding | 1,509,304 |
| Net asset value per share | $5.32 |
| | |
| Advisor Class, $0.01 Par Value | |
| Net assets | $4,881,279 |
| Shares outstanding | 920,241 |
| Net asset value per share | $5.30 |
| |
| |
| |
| See Notes to Financial Statements. | |
15
| |
| YEAR ENDED OCTOBER 31, 2009 | |
| Investment Income (Loss) | |
| Income: | |
| Dividends | $ 5,627,058 |
| Interest | 2,091 |
| | 5,629,149 |
| | |
| Expenses: | |
| Management fees | 1,788,973 |
| Distribution and service fees — Advisor Class | 13,498 |
| Directors’ fees and expenses | 6,648 |
| Other expenses | 408 |
| | 1,809,527 |
| | |
| Net investment income (loss) | 3,819,622 |
| | |
| Realized and Unrealized Gain (Loss) | |
| Net realized gain (loss) on investment transactions | (24,311,422) |
| Change in net unrealized appreciation (depreciation) on investments | 27,203,273 |
| | |
| Net realized and unrealized gain (loss) | 2,891,851 |
| | |
| Net Increase (Decrease) in Net Assets Resulting from Operations | $ 6,711,473 |
| |
| |
| |
| See Notes to Financial Statements. | |
16
|
| Statement of Changes in Net Assets |
| | |
| YEARS ENDED OCTOBER 31, 2009 AND OCTOBER 31, 2008 | | |
| Increase (Decrease) in Net Assets | 2009 | 2008 |
| Operations | | |
| Net investment income (loss) | $ 3,819,622 | $ 6,931,131 |
| Net realized gain (loss) | (24,311,422) | (8,977,268) |
| Change in net unrealized appreciation (depreciation) | 27,203,273 | (150,104,194) |
| Net increase (decrease) in net assets resulting from operations | 6,711,473 | (152,150,331) |
| | | |
| Distributions to Shareholders | | |
| From net investment income: | | |
| Investor Class | (5,825,919) | (6,799,465) |
| Institutional Class | (358,398) | (437,453) |
| Advisor Class | (211,371) | (195,244) |
| From net realized gains: | | |
| Investor Class | — | (17,205,248) |
| Institutional Class | — | (986,976) |
| Advisor Class | — | (582,280) |
| Decrease in net assets from distributions | (6,395,688) | (26,206,666) |
| | | |
| Capital Share Transactions | | |
| Net increase (decrease) in net assets from capital share transactions | (33,570,658) | (122,589,572) |
| | | |
| Net increase (decrease) in net assets | (33,254,873) | (300,946,569) |
| | | |
| Net Assets | | |
| Beginning of period | 204,602,577 | 505,549,146 |
| End of period | $171,347,704 | $ 204,602,577 |
| | | |
| Undistributed net investment income | $2,661,811 | $5,247,349 |
| |
| |
| |
| See Notes to Financial Statements. | | |
17
|
| Notes to Financial Statements |
OCTOBER 31, 2009
1. Organization and Summary of Significant Accounting Policies
Organization — American Century Mutual Funds, Inc. (the corporation) is registered under the Investment Company Act of 1940 (the 1940 Act) as an open-end management investment company. Capital Value Fund (the fund) is one fund in a series issued by the corporation. The fund is diversified under the 1940 Act. The fund’s investment objective is to seek long-term capital growth. The fund pursues its objective by investing primarily in common stocks that management believes to be undervalued at the time of purchase. The fund also seeks to minimize the impact of federal income taxes on shareholder returns by attempting to minimize taxable distributions to shareholders. The following is a summary of the fund’s significant accounting policies.
Multiple Class — The fund is authorized to issue the Investor Class, the Institutional Class and the Advisor Class. The share classes differ principally in their respective distribution and shareholder servicing expenses and arrangements. All shares of the fund represent an equal pro rata interest in the net assets of the class to which such shares belong, and have identical voting, dividend, liquidation and other rights and the same terms and conditions, except for class specific expenses and exclusive rights to vote on matters affecting only individual classes. Income, non-class specific expenses, and realized and unrealized capital gains and losses of the fund are allocated to each class of shares based on their relative net assets.
Security Valuations — Securities traded primarily on a principal securities exchange are valued at the last reported sales price, or at the mean of the latest bid and asked prices where no last sales price is available. Depending on local convention or regulation, securities traded over-the-counter are valued at the mean of the latest bid and asked prices, the last sales price, or the official close price. Investments in open-end management investment companies are valued at the reported net asset value. Debt securities not traded on a principal securities exchange are valued through a commercial pricing service or at the mean of the most recent bid and asked prices. Discount notes may be valued through a commercial pricing service or at amortized cost, which approximates fair value. Securities traded on foreign securities exchanges and ov er-the-counter markets are normally completed before the close of business on days that the New York Stock Exchange (the Exchange) is open and may also take place on days when the Exchange is not open. If an event occurs after the value of a security was established but before the net asset value per share was determined that was likely to materially change the net asset value, that security would be valued as determined in accordance with procedures adopted by the Board of Directors. If the fund determines that the market price of a portfolio security is not readily available, or that the valuation methods mentioned above do not reflect the security’s fair value, such security is valued as determined by the Board of Directors or its designee, in accordance with procedures adopted by the Board of Directors, if such determination would materially impact a fund’s net asset value. Certain other circumstances may cause the fund to use alternative procedures to value a security such as: a security has b een declared in default; trading in a security has been halted during the trading day; or there is a foreign market holiday and no trading will commence.
Security Transactions — For financial reporting purposes, security transactions are accounted for as of the trade date. Net realized gains and losses are determined on the identified cost basis, which is also used for federal income tax purposes.
Investment Income — Dividend income less foreign taxes withheld, if any, is recorded as of the ex-dividend date. Interest income is recorded on the accrual basis and includes accretion of discounts and amortization of premiums.
18
Repurchase Agreements — The fund may enter into repurchase agreements with institutions that American Century Investment Management, Inc. (ACIM) (the investment advisor) has determined are creditworthy pursuant to criteria adopted by the Board of Directors. Each repurchase agreement is recorded at cost. The fund requires that the collateral, represented by securities, received in a repurchase transaction be transferred to the custodian in a manner sufficient to enable the fund to obtain those securities in the event of a default under the repurchase agreement. ACIM monitors, on a daily basis, the securities transferred to ensure the value, including accrued interest, of the securities under each repurchase agreement is equal to or greater than amounts owed to the fund under each repurchase agreement.
Joint Trading Account — Pursuant to an Exemptive Order issued by the Securities and Exchange Commission, the fund, along with certain other funds in the American Century Investments family of funds, may transfer uninvested cash balances into a joint trading account. These balances are invested in one or more repurchase agreements that are collateralized by U.S. Treasury or Agency obligations.
Income Tax Status — It is the fund’s policy to distribute substantially all net investment income and net realized gains to shareholders and to otherwise qualify as a regulated investment company under provisions of the Internal Revenue Code. The fund is no longer subject to examination by tax authorities for years prior to 2006. At this time, management believes there are no uncertain tax positions which, based on their technical merit, would not be sustained upon examination and for which it is reasonably possible that the total amounts of unrecognized tax benefits will significantly change in the next twelve months. Accordingly, no provision has been made for federal or state income taxes. Interest and penalties associated with any federal or state income tax obligations, if any, are recorded as interest expense.
Distributions to Shareholders — Distributions to shareholders are recorded on the ex-dividend date. Distributions from net investment income and net realized gains, if any, are generally declared and paid annually.
Indemnifications — Under the corporation‘s organizational documents, its officers and directors are indemnified against certain liabilities arising out of the performance of their duties to the fund. In addition, in the normal course of business, the fund enters into contracts that provide general indemnifications. The maximum exposure under these arrangements is unknown as this would involve future claims that may be made against a fund. The risk of material loss from such claims is considered by management to be remote.
Use of Estimates — The financial statements are prepared in conformity with accounting principles generally accepted in the United States of America, which may require management to make certain estimates and assumptions at the date of the financial statements. Actual results could differ from these estimates.
Subsequent Events — Management has evaluated events or transactions that may have occurred since October 31, 2009, that would merit recognition or disclosure in the financial statements. This evaluation was completed through December 28, 2009, the date the financial statements were issued.
19
2. Fees and Transactions with Related Parties
Management Fees — The corporation has entered into a Management Agreement with ACIM, under which ACIM provides the fund with investment advisory and management services in exchange for a single, unified management fee (the fee) per class. The Agreement provides that all expenses of the fund, except brokerage commissions, taxes, interest, fees and expenses of those directors who are not considered “interested persons” as defined in the 1940 Act (including counsel fees) and extraordinary expenses, will be paid by ACIM. The fee is computed and accrued daily based on the daily net assets of the specific class of shares of the fund and paid monthly in arrears. For funds with a stepped fee schedule, the rate of the fee is determined by applying a fee rate calculation formula. This formula takes into account each fund’s assets as well as certain assets, if any, of other clients of the investment advisor outside the American Century Investments family of funds (such as subadvised funds and separate accounts) that have very similar investment teams and investment strategies (strategy assets). The annual management fee schedule for the fund ranges from 0.90% to 1.10% for the Investor Class and Advisor Class. The Institutional Class is 0.20% less at each point within the range. The effective annual management fee for each class of the fund for the year ended October 31, 2009, was 1.10% for the Investor Class and Advisor Class, and 0.90% for Institutional Class.
Distribution and Service Fees — The Board of Directors has adopted a Master Distribution and Individual Shareholder Services Plan (the plan) for the Advisor Class, pursuant to Rule 12b-1 of the 1940 Act. The plan provides that the Advisor Class will pay American Century Investment Services, Inc. (ACIS) an annual distribution and service fee of 0.25%. The fees are computed and accrued daily based on the Advisor Class’s daily net assets and paid monthly in arrears. The fees are used to pay financial intermediaries for distribution and individual shareholder services. Fees incurred under the plan during the year ended October 31, 2009, are detailed in the Statement of Operations.
Related Parties — Certain officers and directors of the corporation are also officers and/or directors, and, as a group, controlling stockholders of American Century Companies, Inc. (ACC), the parent of the corporation’s investment advisor, ACIM, the distributor of the corporation, ACIS, and the corporation’s transfer agent, American Century Services, LLC.
The fund is eligible to invest in a money market fund for temporary purposes, which is managed by J.P. Morgan Investment Management, Inc. (JPMIM). The fund has a Mutual Funds Services Agreement with J.P. Morgan Investor Services Co. (JPMIS) and a securities lending agreement with JPMorgan Chase Bank (JPMCB). JPMCB is a custodian of the fund. JPMIM, JPMIS and JPMCB are wholly owned subsidiaries of JPMorgan Chase & Co. (JPM). JPM is an equity investor in ACC.
3. Investment Transactions
Purchases and sales of investment securities, excluding short-term investments, for the year ended October 31, 2009, were $31,702,125 and $69,177,815, respectively.
20
| | | | |
| 4. Capital Share Transactions | | | | |
| |
| Transactions in shares of the fund were as follows: | | |
| | Year ended October 31, 2009 | Year ended October 31, 2008 |
| | Shares | Amount | Shares | Amount |
| Investor Class/Shares Authorized | 200,000,000 | | 200,000,000 | |
| Sold | 3,022,048 | $ 13,900,445 | 4,019,582 | $ 28,296,721 |
| Issued in reinvestment of distributions | 1,062,378 | 4,759,452 | 2,617,117 | 20,177,969 |
| Redeemed | (10,206,660) | (46,370,846) | (23,291,242) | (161,307,127) |
| | (6,122,234) | (27,710,949) | (16,654,543) | (112,832,437) |
| Institutional Class/Shares Authorized | 15,000,000 | | 15,000,000 | |
| Sold | 156,615 | 674,936 | 760,655 | 5,015,742 |
| Issued in reinvestment of distributions | 31,585 | 141,500 | 155,264 | 1,195,532 |
| Redeemed | (1,004,483) | (4,643,987) | (1,784,972) | (12,651,624) |
| | (816,283) | (3,827,551) | (869,053) | (6,440,350) |
| Advisor Class/Shares Authorized | 50,000,000 | | 50,000,000 | |
| Sold | 171,780 | 781,303 | 233,387 | 1,571,870 |
| Issued in reinvestment of distributions | 47,147 | 211,217 | 100,040 | 771,305 |
| Redeemed | (657,655) | (3,024,678) | (808,390) | (5,659,960) |
| | (438,728) | (2,032,158) | (474,963) | (3,316,785) |
| Net increase (decrease) | (7,377,245) | $(33,570,658) | (17,998,559) | $(122,589,572) |
5. Fair Value Measurements
The fund’s securities valuation process is based on several considerations and may use multiple inputs to determine the fair value of the positions held by the fund. In conformity with accounting principles generally accepted in the United States of America, the inputs used to determine a valuation are classified into three broad levels as follows:
• Level 1 valuation inputs consist of actual quoted prices in an active market for identical securities;
• Level 2 valuation inputs consist of significant direct or indirect observable market data (including quoted prices for similar securities, evaluations of subsequent market events, interest rates, prepayment speeds, credit risk, etc.); or
• Level 3 valuation inputs consist of significant unobservable inputs (including a fund’s own assumptions).
The level classification is based on the lowest level input that is significant to the fair valuation measurement. The valuation inputs are not an indication of the risks associated with investing in these securities or other financial instruments.
The following is a summary of the valuation inputs used to determine the fair value of the fund’s securities as of October 31, 2009:
| | | |
| | Level 1 | Level 2 | Level 3 |
| Investment Securities | | | |
| Domestic Common Stocks | $159,443,596 | — | — |
| Foreign Common Stocks | 9,490,442 | — | — |
| Temporary Cash Investments | 37,180 | $2,400,000 | — |
| Total Value of Investment Securities | $168,971,218 | $2,400,000 | — |
21
6. Bank Line of Credit
The fund, along with certain other funds in the American Century Investments family of funds, had a $500,000,000 unsecured bank line of credit agreement with Bank of America, N.A. The line expired December 10, 2008, and was not renewed. The agreement allowed the fund to borrow money for temporary or emergency purposes to fund shareholder redemptions. Borrowings under the agreement were subject to interest at the Federal Funds rate plus 0.40%. The fund did not borrow from the line during the year ended October 31, 2009.
7. Interfund Lending
The fund, along with certain other funds in the American Century Investments family of funds, may participate in an interfund lending program, pursuant to an Exemptive Order issued by the Securities and Exchange Commission (SEC). This program provides an alternative credit facility allowing the fund to borrow from or lend to other funds in the American Century Investments family of funds that permit such transactions. Interfund lending transactions are subject to each fund’s investment policies and borrowing and lending limits. The interfund loan rate earned/paid on interfund lending transactions is determined daily based on the average of certain current market rates. Interfund lending transactions normally extend only overnight, but can have a maximum duration of seven days. The program is subject to annual approval by the Board of Directors. During the year ended October 31, 2009, the fund did not utilize the program.
8. Federal Tax Information
The tax character of distributions paid during the years ended October 31, 2009 and October 31, 2008 were as follows:
| | |
| | 2009 | 2008 |
| Distributions Paid From | | |
| Ordinary income | $6,395,688 | $7,438,030 |
| Long-term capital gains | — | $18,768,636 |
The book-basis character of distributions made during the year from net investment income or net realized gains may differ from their ultimate characterization for federal income tax purposes. These differences reflect the differing character of certain income items and net realized gains and losses for financial statement and tax purposes, and may result in reclassification among certain capital accounts on the financial statements.
As of October 31, 2009, the federal tax cost of investments and the components of distributable earnings on a tax-basis were as follows:
| |
| Federal tax cost of investments | $158,983,999 |
| Gross tax appreciation of investments | $ 29,788,565 |
| Gross tax depreciation of investments | (17,401,346) |
| Net tax appreciation (depreciation) of investments | $ 12,387,219 |
| Undistributed ordinary income | $2,661,811 |
| Accumulated capital losses | $(32,923,173) |
The difference between book-basis and tax-basis cost and unrealized appreciation (depreciation) is attributable primarily to the tax deferral of losses on wash sales.
The accumulated capital losses listed above represent net capital loss carryovers that may be used to offset future realized capital gains for federal income tax purposes. Future capital loss carryover utilization in any given year may be subject to Internal Revenue Code limitations. The capital loss carryovers of $(8,742,213) and $(24,180,960) expire in 2016 and 2017, respectively.
22
9. Recently Issued Accounting Standards.
The Financial Accounting Standards Board (FASB) issued Accounting Standards Codification (ASC) Section 820-10 (formerly Statement of Financial Accounting Standards No. 157, “Fair Value Measurements”), in September 2006, which is effective for fiscal years beginning after November 15, 2007. ASC Section 820-10 defines fair value, establishes a framework for measuring fair value and expands the required financial statement disclosures about fair value measurements. The adoption of ASC Section 820-10 did not materially impact the determination of fair value.
In March 2008, the FASB issued ASC Section 815-10 (formerly Statement of Financial Accounting Standards No. 161, “Disclosures about Derivative Instruments and Hedging Activities — an amendment of FASB Statement No. 133”). ASC Section 815-10 is effective for interim periods beginning after November 15, 2008 and has been adopted by the fund. ASC Section 815-10 amends and expands disclosures about derivative instruments and hedging activities. ASC Section 815-10 requires qualitative disclosures about the objectives and strategies of derivative instruments, quantitative disclosures about the fair value amounts of and gains and losses on derivative instruments, and disclosures of credit-risk-related contingent features in hedging activities.
10. Other Tax Information (Unaudited)
The following information is provided pursuant to provisions of the Internal Revenue Code.
The fund hereby designates up to the maximum amount allowable as qualified dividend income for the fiscal year ended October 31, 2009.
For corporate taxpayers, the fund hereby designates $6,395,688, or up to the maximum amount allowable, of ordinary income distributions paid during the fiscal year ended October 31, 2009, as qualified for the corporate dividends received deduction.
23
| | | | | | |
| Capital Value | | | | | |
| |
| Investor Class | | | | | |
| For a Share Outstanding Throughout the Years Ended October 31 | | | |
| | | 2009 | 2008 | 2007 | 2006 | 2005 |
| Per-Share Data | | | | | |
| Net Asset Value, Beginning of Period | $5.17 | $8.78 | $8.23 | $7.15 | $6.61 |
| Income From Investment Operations | | | | | |
| Net Investment Income (Loss)(1) | 0.11 | 0.14 | 0.13 | 0.12 | 0.10 |
| Net Realized and Unrealized Gain (Loss) | 0.21 | (3.28) | 0.65 | 1.14 | 0.51 |
| Total From Investment Operations | 0.32 | (3.14) | 0.78 | 1.26 | 0.61 |
| Distributions | | | | | |
| From Net Investment Income | (0.17) | (0.13) | (0.12) | (0.10) | (0.07) |
| From Net Realized Gains | — | (0.34) | (0.11) | (0.08) | — |
| Total Distributions | (0.17) | (0.47) | (0.23) | (0.18) | (0.07) |
| Net Asset Value, End of Period | $5.32 | $5.17 | $8.78 | $8.23 | $7.15 |
| |
| Total Return(2) | 6.85% | (37.52)% | 9.66% | 18.03% | 9.29% |
| | | | | | |
| Ratios/Supplemental Data | | | | | |
| Ratio of Operating Expenses | | | | | |
| to Average Net Assets | 1.10% | 1.10% | 1.10% | 1.10% | 1.10% |
| Ratio of Net Investment Income (Loss) | | | | | |
| to Average Net Assets | 2.33% | 1.98% | 1.52% | 1.55% | 1.42% |
| Portfolio Turnover Rate | 19% | 26% | 15% | 16% | 28% |
| Net Assets, End of Period (in thousands) | $158,431 | $185,569 | $461,413 | $466,803 | $458,354 |
| (1) | Computed using average shares outstanding throughout the period. | | | | |
| (2) | Total return assumes reinvestment of net investment income and capital gains distributions, if any. The total return of the classes may not |
| | precisely reflect the class expense differences because of the impact of calculating the net asset values to two decimal places. If net asset |
| | values were calculated to three decimal places, the total return differences would more closely reflect the class expense differences. The |
| | calculation of net asset values to two decimal places is made in accordance with SEC guidelines and does not result in any gain or loss of value |
| | between one class and another. | | | | | |
| |
| |
| See Notes to Financial Statements. | | | | | |
24
| | | | | | |
| Capital Value | | | | | |
| |
| Institutional Class | | | | | |
| For a Share Outstanding Throughout the Years Ended October 31 | | | |
| | | 2009 | 2008 | 2007 | 2006 | 2005 |
| Per-Share Data | | | | | |
| Net Asset Value, Beginning of Period | $5.17 | $8.79 | $8.24 | $7.16 | $6.62 |
| Income From Investment Operations | | | | | |
| Net Investment Income (Loss)(1) | 0.12 | 0.15 | 0.15 | 0.13 | 0.12 |
| Net Realized and Unrealized Gain (Loss) | 0.21 | (3.28) | 0.65 | 1.15 | 0.51 |
| Total From Investment Operations | 0.33 | (3.13) | 0.80 | 1.28 | 0.63 |
| Distributions | | | | | |
| From Net Investment Income | (0.18) | (0.15) | (0.14) | (0.12) | (0.09) |
| From Net Realized Gains | — | (0.34) | (0.11) | (0.08) | — |
| Total Distributions | (0.18) | (0.49) | (0.25) | (0.20) | (0.09) |
| Net Asset Value, End of Period | $5.32 | $5.17 | $8.79 | $8.24 | $7.16 |
| |
| Total Return(2) | 7.07% | (37.46)% | 9.88% | 18.24% | 9.50% |
| | | | | | |
| Ratios/Supplemental Data | | | | | |
| Ratio of Operating Expenses | | | | | |
| to Average Net Assets | 0.90% | 0.90% | 0.90% | 0.90% | 0.90% |
| Ratio of Net Investment Income (Loss) | | | | | |
| to Average Net Assets | 2.53% | 2.18% | 1.72% | 1.75% | 1.62% |
| Portfolio Turnover Rate | 19% | 26% | 15% | 16% | 28% |
| Net Assets, End of Period (in thousands) | $8,035 | $12,030 | $28,077 | $31,141 | $37,523 |
| (1) | Computed using average shares outstanding throughout the period. | | | | |
| (2) | Total return assumes reinvestment of net investment income and capital gains distributions, if any. The total return of the classes may not |
| | precisely reflect the class expense differences because of the impact of calculating the net asset values to two decimal places. If net asset |
| | values were calculated to three decimal places, the total return differences would more closely reflect the class expense differences. The |
| | calculation of net asset values to two decimal places is made in accordance with SEC guidelines and does not result in any gain or loss of value |
| | between one class and another. | | | | | |
| |
| |
| See Notes to Financial Statements. | | | | | |
25
| | | | | | |
| Capital Value | | | | | |
| |
| Advisor Class | | | | | |
| For a Share Outstanding Throughout the Years Ended October 31 | | | |
| | | 2009 | 2008 | 2007 | 2006 | 2005 |
| Per-Share Data | | | | | |
| Net Asset Value, Beginning of Period | $5.15 | $8.76 | $8.21 | $7.14 | $6.60 |
| Income From Investment Operations | | | | | |
| Net Investment Income (Loss)(1) | 0.10 | 0.12 | 0.11 | 0.10 | 0.08 |
| Net Realized and Unrealized Gain (Loss) | 0.21 | (3.28) | 0.65 | 1.13 | 0.52 |
| Total From Investment Operations | 0.31 | (3.16) | 0.76 | 1.23 | 0.60 |
| Distributions | | | | | |
| From Net Investment Income | (0.16) | (0.11) | (0.10) | (0.08) | (0.06) |
| From Net Realized Gains | — | (0.34) | (0.11) | (0.08) | — |
| Total Distributions | (0.16) | (0.45) | (0.21) | (0.16) | (0.06) |
| Net Asset Value, End of Period | $5.30 | $5.15 | $8.76 | $8.21 | $7.14 |
| |
| Total Return(2) | 6.59% | (37.78)% | 9.40% | 17.62% | 9.04% |
| | | | | | |
| Ratios/Supplemental Data | | | | | |
| Ratio of Operating Expenses | | | | | |
| to Average Net Assets | 1.35% | 1.35% | 1.35% | 1.35% | 1.35% |
| Ratio of Net Investment Income (Loss) | | | | | |
| to Average Net Assets | 2.08% | 1.73% | 1.27% | 1.30% | 1.17% |
| Portfolio Turnover Rate | 19% | 26% | 15% | 16% | 28% |
| Net Assets, End of Period (in thousands) | $4,881 | $7,004 | $16,059 | $16,973 | $14,744 |
| (1) | Computed using average shares outstanding throughout the period. | | | | |
| (2) | Total return assumes reinvestment of net investment income and capital gains distributions, if any. The total return of the classes may not |
| | precisely reflect the class expense differences because of the impact of calculating the net asset values to two decimal places. If net asset |
| | values were calculated to three decimal places, the total return differences would more closely reflect the class expense differences. The |
| | calculation of net asset values to two decimal places is made in accordance with SEC guidelines and does not result in any gain or loss of value |
| | between one class and another. | | | | | |
| |
| |
| See Notes to Financial Statements. | | | | | |
26
|
| Report of Independent Registered Public Accounting Firm |
The Board of Directors and Shareholders, American Century Mutual Funds, Inc.:
We have audited the accompanying statement of assets and liabilities, including the schedule of investments, of Capital Value Fund, one of the funds constituting American Century Mutual Funds, Inc. (the “Corporation”), as of October 31, 2009, and the related statement of operations for the year then ended, the statements of changes in net assets for each of the two years in the period then ended, and the financial highlights for each of the five years in the period then ended. These financial statements and financial highlights are the responsibility of the Corporation’s management. Our responsibility is to express an opinion on these financial statements and financial highlights based on our audits.
We conducted our audits in accordance with the standards of the Public Company Accounting Oversight Board (United States). Those standards require that we plan and perform the audit to obtain reasonable assurance about whether the financial statements and financial highlights are free of material misstatement. The Corporation is not required to have, nor were we engaged to perform, an audit of its internal control over financial reporting. Our audits included consideration of internal control over financial reporting as a basis for designing audit procedures that are appropriate in the circumstances, but not for the purpose of expressing an opinion on the effectiveness of the Corporation’s internal control over financial reporting. Accordingly, we express no such opinion. An audit also includes examining, on a test basis, evidence supporting the amounts and disclosures in the financial statements, assessing the accounting principles used and significant estimates made by management, as well as evaluating the overall financial statement presentation. Our procedures included confirmation of securities owned as of October 31, 2009, by correspondence with the custodian and brokers; where replies were not received from brokers, we performed other auditing procedures. We believe that our audits provide a reasonable basis for our opinion.
In our opinion, the financial statements and financial highlights referred to above present fairly, in all material respects, the financial position of Capital Value Fund of American Century Mutual Funds, Inc., as of October 31, 2009, the results of its operations for the year then ended, the changes in its net assets for each of the two years in the period then ended, and the financial highlights for each of the five years in the period then ended, in conformity with accounting principles generally accepted in the United States of America.
Deloitte & Touche LLP
Kansas City, Missouri
December 28, 2009
27
The individuals listed below serve as directors or officers of the fund. Each director serves until his or her successor is duly elected and qualified or until he or she retires. Mandatory retirement age for independent directors is 72. Those listed as interested directors are “interested” primarily by virtue of their engagement as directors and/or officers of, or ownership interest in, American Century Companies, Inc. (ACC) or its wholly owned, direct or indirect, subsidiaries, including the fund’s investment advisor, American Century Investment Management, Inc. (ACIM); the fund’s principal underwriter, American Century Investment Services, Inc. (ACIS); and the fund’s transfer agent, American Century Services, LLC (ACS).
The other directors (more than three-fourths of the total number) are independent; that is, they have never been employees, directors or officers of, and have no financial interest in, ACC or any of its wholly owned, direct or indirect, subsidiaries, including ACIM, ACIS and ACS. The directors serve in this capacity for seven registered investment companies in the American Century Investments family of funds.
All persons named as officers of the fund also serve in similar capacities for the other 14 registered investment companies in the American Century Investments family of funds advised by ACIM or American Century Global Investment Management, Inc. (ACGIM), a wholly owned subsidiary of ACIM, unless otherwise noted. Only officers with policy-making functions are listed. No officer is compensated for his or her service as an officer of the fund. The listed officers are interested persons of the fund and are appointed or re-appointed on an annual basis.
Interested Director
Jonathan S. Thomas, 4500 Main Street, Kansas City, MO 64111
Year of Birth: 1963
Position(s) Held with Fund: Director (since 2007) and President (since 2007)
Principal Occupation(s) During Past 5 Years: President and Chief Executive Officer, ACC
(March 2007 to present); Chief Administrative Officer, ACC (February 2006 to
February 2007); Executive Vice President, ACC (November 2005 to February 2007).
Also serves as: President, Chief Executive Officer and Director, ACS; Executive
Vice President, ACIM and ACGIM; Director, ACIM, ACGIM, ACIS and other ACC
subsidiaries. Managing Director, Morgan Stanley (March 2000 to November 2005)
Number of Portfolios in Fund Complex Overseen by Director: 103
Other Directorships Held by Director: None
Independent Directors
Thomas A. Brown, 4500 Main Street, Kansas City, MO 64111
Year of Birth: 1940
Position(s) Held with Fund: Director (since 1980)
Principal Occupation(s) During Past 5 Years: Managing Member, Associated Investments, LLC
(real estate investment company); Managing Member, Brown Cascade Properties,
LLC (real estate investment company); Retired, Area Vice President, Applied
Industrial Technologies (bearings and power transmission company)
Number of Portfolios in Fund Complex Overseen by Director: 63
Other Directorships Held by Director: None
28
Andrea C. Hall, Ph.D., 4500 Main Street, Kansas City, MO 64111
Year of Birth: 1945
Position(s) Held with Fund: Director (since 1997)
Principal Occupation(s) During Past 5 Years: Retired, Advisor to the President, Midwest
Research Institute (not-for-profit, contract research organization)
Number of Portfolios in Fund Complex Overseen by Director: 63
Other Directorships Held by Director: None
James A. Olson, 4500 Main Street, Kansas City, MO 64111
Year of Birth: 1942
Position(s) Held with Fund: Director (since 2007)
Principal Occupation(s) During Past 5 Years: Member, Plaza Belmont LLC (private equity
fund manager); Chief Financial Officer, Plaza Belmont LLC (September 1999 to
September 2006)
Number of Portfolios in Fund Complex Overseen by Director: 63
Other Directorships Held by Director: Saia, Inc. and Entertainment Properties Trust
Donald H. Pratt, 4500 Main Street, Kansas City, MO 64111
Year of Birth: 1937
Position(s) Held with Fund: Director (since 1995) and Chairman of the Board (since 2005)
Principal Occupation(s) During Past 5 Years: Chairman and Chief Executive Officer, Western
Investments, Inc. (real estate company); Retired Chairman of the Board, Butler
Manufacturing Company (metal buildings producer)
Number of Portfolios in Fund Complex Overseen by Director: 63
Other Directorships Held by Director: None
Gale E. Sayers, 4500 Main Street, Kansas City, MO 64111
Year of Birth: 1943
Position(s) Held with Fund: Director (since 2000)
Principal Occupation(s) During Past 5 Years: President, Chief Executive Officer and Founder,
Sayers40, Inc. (technology products and services provider)
Number of Portfolios in Fund Complex Overseen by Director: 63
Other Directorships Held by Director: None
M. Jeannine Strandjord, 4500 Main Street, Kansas City, MO 64111
Year of Birth: 1945
Position(s) Held with Fund: Director (since 1994)
Principal Occupation(s) During Past 5 Years: Retired, formerly Senior Vice President, Sprint
Corporation (telecommunications company)
Number of Portfolios in Fund Complex Overseen by Director: 63
Other Directorships Held by Director: DST Systems, Inc.; Euronet Worldwide, Inc. and
Charming Shoppes, Inc.
John R. Whitten, 4500 Main Street, Kansas City, MO 64111
Year of Birth: 1946
Position(s) Held with Fund: Director (since 2008)
Principal Occupation(s) During Past 5 Years: Project Consultant, Celanese Corp. (industrial
chemical company) (September 2004 to January 2005)
Number of Portfolios in Fund Complex Overseen by Director: 63
Other Directorships Held by Director: Rudolph Technologies, Inc.
29
Officers
Barry Fink, 4500 Main Street, Kansas City, MO 64111
Year of Birth: 1955
Position(s) Held with Fund: Executive Vice President (since 2007)
Principal Occupation(s) During Past 5 Years: Chief Operating Officer and Executive Vice
President, ACC (September 2007 to present); President, ACS (October 2007 to
present); Managing Director, Morgan Stanley (2000 to 2007); Global General
Counsel, Morgan Stanley (2000 to 2006). Also serves as: Director, ACC, ACS, ACIS
and other ACC subsidiaries
Maryanne Roepke, 4500 Main Street, Kansas City, MO 64111
Year of Birth: 1956
Position(s) Held with Fund: Chief Compliance Officer (since 2006) and Senior Vice
President (since 2000)
Principal Occupation(s) During Past 5 Years: Chief Compliance Officer, ACIM, ACGIM and ACS
(August 2006 to present); Assistant Treasurer, ACC (January 1995 to August 2006); and
Treasurer and Chief Financial Officer, various American Century Investments funds
(July 2000 to August 2006). Also serves as: Senior Vice President, ACS
Charles A. Etherington, 4500 Main Street, Kansas City, MO 64111
Year of Birth: 1957
Position(s) Held with Fund: General Counsel (since 2007) and Senior Vice President
(since 2006)
Principal Occupation(s) During Past 5 Years: Attorney, ACC (February 1994 to present); Vice
President, ACC (November 2005 to present); General Counsel, ACC (March 2007
to present). Also serves as: General Counsel, ACIM, ACGIM, ACS, ACIS and other
ACC subsidiaries; and Senior Vice President, ACIM, ACGIM and ACS
Robert Leach, 4500 Main Street, Kansas City, MO 64111
Year of Birth: 1966
Position(s) Held with Fund: Vice President, Treasurer and Chief Financial Officer
(all since 2006)
Principal Occupation(s) During Past 5 Years: Vice President, ACS (February 2000 to present); and
Controller, various American Century Investments funds (1997 to September 2006)
David H. Reinmiller, 4500 Main Street, Kansas City, MO 64111
Year of Birth: 1963
Position(s) Held with Fund: Vice President (since September 2000)
Principal Occupation(s) During Past 5 Years: Attorney, ACC (January 1994 to present);
Associate General Counsel, ACC (January 2001 to present); Chief Compliance
Officer, American Century Investments funds, ACIM and ACGIM (January 2001 to
February 2005). Also serves as: Associate General Counsel, ACIM, ACGIM, ACS,
ACIS and other ACC subsidiaries; and Vice President, ACIM, ACGIM and ACS
Ward Stauffer, 4500 Main Street, Kansas City, MO 64111
Year of Birth: 1960
Position(s) Held with Fund: Secretary (since February 2005)
Principal Occupation(s) During Past 5 Years: Attorney, ACC (June 2003 to present)
The SAI has additional information about the fund’s directors and is available without charge, upon request, by calling 1-800-345-2021.
30
|
| Approval of Management Agreement |
Under Section 15(c) of the Investment Company Act, contracts for investment advisory services are required to be reviewed, evaluated and approved by a majority of a fund’s independent directors (the “Directors”) each year. At American Century Investments, this process is referred to as the “15(c) Process.” As a part of this process, the board reviews fund performance, shareholder services, audit and compliance information, and a variety of other reports from the advisor concerning fund operations. In addition to this annual review, the board of directors oversees and evaluates on a continuous basis at its quarterly meetings the nature and quality of significant services performed by the advisor, fund performance, audit and compliance information, and a variety of other reports relating to fund operations. The board, or committees of the board, also holds special meetings as needed.
Under a Securities and Exchange Commission rule, each fund is required to disclose in its annual or semiannual report, as appropriate, the material factors and conclusions that formed the basis for the board’s approval or renewal of any advisory agreements within the fund’s most recently completed fiscal half-year period.
Annual Contract Review Process
As part of the annual 15(c) Process undertaken during the most recent fiscal half-year period, the Directors reviewed extensive data and information compiled by the advisor and certain independent providers of evaluative data (the “15(c) Providers”) concerning Capital Value (the “Fund”) and the services provided to the Fund under the management agreement. The information considered and the discussions held at the meetings included, but were not limited to:
• the nature, extent and quality of investment management, shareholder services and other services provided to the Fund;
• the wide range of programs and services the advisor provides to the Fund and their shareholders on a routine and non-routine basis;
• the compliance policies, procedures, and regulatory experience of the advisor;
• data comparing the cost of owning the Fund to the cost of owning a similar fund;
• data comparing the Fund’s performance to appropriate benchmarks and/ or a peer group of other mutual funds with similar investment objectives and strategies;
• financial data showing the profitability of the Fund to the advisor and the overall profitability of the advisor;
• data comparing services provided and charges to other investment management clients of the advisor; and
• consideration of collateral benefits derived by the advisor from the management of the Fund and any potential economies of scale relating thereto.
31
In keeping with its practice, the Fund’s board of directors held two in-person meetings and one telephonic meeting to review and discuss the information provided. The board also had the benefit of the advice of its independent counsel throughout the period.
Factors Considered
The Directors considered all of the information provided by the advisor, the 15(c) Providers, and the board’s independent counsel, and evaluated such information for each fund for which the board has responsibility. In connec tion with their review of the Fund, the Directors did not identify any single factor as being all-important or controlling, and each Director may have attributed different levels of importance to different factors. In deciding to renew the management and subadvisory agreements under the terms ultimately determined by the board to be appropriate, the Directors’ decision was based on the following factors.
Nature, Extent and Quality of Services — Generally. Under the management agreement, the advisor is responsible for providing or arranging for all services necessary for the operation of the Fund. The board noted that under the management agreement, the advisor provides or arranges at its own expense a wide variety of services including:
• Fund construction and design
• portfolio security selection
• initial capitalization/funding
• securities trading
• Fund administration
• custody of Fund assets
• daily valuation of the Fund’s portfolio
• shareholder servicing and transfer agency, including shareholder
confirmations, recordkeeping and communications
• legal services
• regulatory and portfolio compliance
• financial reporting
• marketing and distribution
32
The Directors noted that many of the services provided by the advisor have expanded over time both in terms of quantity and complexity in response to shareholder demands, competition in the industry and the changing regulatory environment. They discussed with the advisor the challenges presented by these changes and the impact on the Fund. In performing their evaluation, the Directors considered information received in connection with the annual review, as well as information provided on an ongoing basis at their regularly scheduled board and committee meetings.
Investment Management Services. The nature of the investment management services provided to the Fund is quite complex and allows Fund shareholders access to professional money management, instant diversification of their investments, and liquidity. In evaluating investment performance, the board expects the advisor to manage the Fund in accordance with its investment objectives and approved strategies. Further, the Directors recognize that the advisor has an obligation to monitor trading activities, and in particular to seek the best execution of fund trades, and to evaluate the use of and payment for research. In providing these services, the advisor utilizes teams of investment professionals (portfolio managers, analysts, research assistants, and securities traders) who require extensive information technology, research, training, compl iance and other systems to conduct their business. At each quarterly meeting the Directors review investment performance information for the Fund, together with comparative information for appropriate benchmarks and/or peer groups of funds managed similarly to the Fund. The Directors also review detailed performance information during the 15(c) Process comparing the Fund’s performance with that of similar funds not managed by the advisor. If performance concerns are identified, the Directors discuss with the advisor the reasons for such results (e.g., market conditions, security selection) and any efforts being undertaken to improve performance. The fund’s quarter end performance fell just below the median for its peer group for both the one- and three-year periods during the past year. The board discussed the fund’s performance with the advisor and was satisfied with the efforts being undertaken by the advisor. The board will continue to monitor these efforts and the performance of the Fund. More detailed information about the Fund’s performance can be found in the Performance and Portfolio Commentary sections of this report.
Shareholder and Other Services. The advisor provides the Fund with a comprehensive package of transfer agency, shareholder, and other services. The Directors review reports and evaluations of such services at their regular quarterly meetings, including the annual meeting concerning contract review, and reports to the board. These reports include, but are not limited to, information regarding the operational efficiency and accuracy of the shareholder and transfer agency services provided, staffing levels, shareholder satisfaction (as measured by external as well as internal sources), technology support, new products and services offered to Fund shareholders, securities trading activities, portfolio valuation services, auditing services, and legal and operational compliance activities. Certain aspects of shareholder and transfer agency servi ce level efficiency and the quality of securities trading activities are measured by independent third party providers and are presented in comparison to other fund groups not managed by the advisor.
33
Costs of Services Provided and Profitability. The advisor provides detailed information concerning its cost of providing various services to the Fund, its profitability in managing the Fund, its overall profitability, and its financial condition. The Directors have reviewed with the advisor the methodology used to prepare this financial information. This financial information regarding the advisor is considered in order to evaluate the advisor’s financial condition, its ability to continue to provide services under the management agreement, and the reasonableness of the current management fee. The board concluded that the advisor’s profits were reasonable in light of the services provided to the Fund.
Ethics. The Directors generally consider the advisor’s commitment to providing quality services to shareholders and to conducting its business ethically. They noted that the advisor’s practices generally meet or exceed industry best practices.
Economies of Scale. The Directors review information provided by the advisor regarding the possible existence of economies of scale in connection with the management of the Fund. The Directors concluded that economies of scale are difficult to measure and predict with precision, especially on a fund-by-fund basis. The analysis of economies of scale is further complicated by the additional services and content provided by the advisor and its reinvestment in its ability to provide and expand those services. Accordingly, the Directors seek to evaluate economies of scale by reviewing other information, such as year-over-year profitability of the advisor generally, the profitability of its management of the Fund specifically, the expenses incurred by the advisor in providing various functions to the Fund, and the fees of competitive funds not m anaged by the advisor. The Directors believe the advisor is appropriately sharing economies of scale through its competitive fee structure, fee breakpoints as the Fund increases in size, and through reinvestment in its business to provide shareholders additional content and services.
Comparison to Other Funds’ Fees. The Fund pays the advisor a single, all-inclusive (or unified) management fee for providing all services necessary for the management and operation of the Fund, other than brokerage expenses, taxes, interest, extraordinary expenses, and the fees and expenses of the Fund’s independent directors (including their independent legal counsel). Under the unified fee structure, the advisor is responsible for providing all investment advisory, custody, audit, administrative, compliance, record-keeping, marketing and shareholder services, or arranging and supervising third parties to provide such services. By contrast, most other funds are charged a variety of fees, including an investment advisory fee, a transfer agency fee, an administrative fee, distribution charges and other expenses. Other than their i nvestment advisory fees and Rule 12b-1 distribution fees, all other components of the total fees charged by these other funds may be increased without shareholder approval. The board believes the unified fee structure is a benefit to Fund shareholders because it clearly discloses to shareholders the cost of owning Fund shares, and, since the unified fee cannot be increased without a vote of Fund shareholders, it shifts to the advisor the risk of increased costs of operating the Fund and provides a direct incentive to minimize administrative inefficiencies. Part of the Directors’ analysis of fee levels involves reviewing certain evaluative data
34
compiled by a 15(c) Provider comparing the Fund’s unified fee to the total expense ratio of other funds in the Fund’s peer group and performing a regression analysis to evaluate the effect of fee breakpoints as assets under management increase. The unified fee charged to shareholders of the Fund was above the median of the total expense ratios of its peer group. In addition, the Directors also reviewed updated fee level data provided by the advisor, but recognized that comparative data was particularly difficult to evaluate given the significant market developments during the past year. The board concluded that the management fee paid by the Fund to the advisor was reasonable in light of the services provided to the Fund.
Comparison to Fees and Services Provided to Other Clients of the Advisor. The Directors also requested and received information from the advisor concerning the nature of the services, fees, and profitability of its advisory services to advisory clients other than the Fund. They observed that these varying types of client accounts require different services and involve different regulatory and entrepreneurial risks than the management of the Fund. The Directors analyzed this information and concluded that the fees charged and services provided to the Fund were reasonable by comparison.
Collateral Benefits Derived by the Advisor. The Directors considered the existence of collateral benefits the advisor may receive as a result of its relationship with the Fund. They concluded that the advisor’s primary business is managing mutual funds and it generally does not use fund or shareholder information to generate profits in other lines of business, and therefore does not derive any significant collateral benefits from them. The Directors noted that the advisor receives proprietary research from broker-dealers that execute fund portfolio transactions and concluded that this research is likely to benefit fund shareholders. The Directors also determined that the advisor is able to provide investment management services to certain clients other than the Fund, at least in part, due to its existing infrastructure built to serve the fund complex. The Directors concluded, however, that the assets of those other clients are not material to the analysis and, in any event, are included with the assets of the Fund to determine breakpoints in the Fund’s fee schedule, provided they are managed using the same investment team and strategy.
Conclusions of the Directors
As a result of this process, the board, including all of the independent directors, in the absence of particular circumstances and assisted by the advice of legal counsel that is independent of the advisor, taking into account all of the factors discussed above and the information provided by the advisor concluded that the investment management agreement between the Fund and the advisor is fair and reasonable in light of the services provided and should be renewed.
35
Retirement Account Information
As required by law, distributions you receive from certain IRAs, or 403(b), 457 and qualified plans are subject to federal income tax withholding, unless you elect not to have withholding apply. Tax will be withheld on the total amount withdrawn even though you may be receiving amounts that are not subject to withholding, such as nondeductible contributions. In such case, excess amounts of withholding could occur. You may adjust your withholding election so that a greater or lesser amount will be withheld.
If you don’t want us to withhold on this amount, you must notify us to not withhold the federal income tax. You may notify us in writing or in certain situations by telephone or through other electronic means. You have the right to revoke your withholding election at any time and any election you make may remain in effect until revoked by filing a new election.
Remember, even if you elect not to have income tax withheld, you are liable for paying income tax on the taxable portion of your withdrawal. If you elect not to have income tax withheld or you don’t have enough income tax withheld, you may be responsible for payment of estimated tax. You may incur penalties under the estimated tax rules if your withholding and estimated tax payments are not sufficient. You can reduce or defer the income tax on a distribution by directly or indirectly rolling such distribution over to another IRA or eligible plan. You should consult your tax advisor for additional information.
State tax will be withheld if, at the time of your distribution, your address is within one of the mandatory withholding states and you have federal income tax withheld. State taxes will be withheld from your distribution in accordance with the respective state rules.
Proxy Voting Guidelines
American Century Investment Management, Inc., the fund’s investment advisor, is responsible for exercising the voting rights associated with the securities purchased and/or held by the fund. A description of the policies and procedures the advisor uses in fulfilling this responsibility is available without charge, upon request, by calling 1-800-345-2021. It is also available on American Century Investments’ website at americancentury.com and on the Securities and Exchange Commission’s website at sec.gov. Information regarding how the investment advisor voted proxies relating to portfolio securities during the most recent 12-month period ended June 30 is available on the “About Us” page at americancentury.com. It is also available at sec.gov.
Quarterly Portfolio Disclosure
The fund files its complete schedule of portfolio holdings with the Securities and Exchange Commission (SEC) for the first and third quarters of each fiscal year on Form N-Q. The fund’s Form N-Q is available on the SEC’s website at sec.gov, and may be reviewed and copied at the SEC’s Public Reference Room in Washington, DC. Information on the operation of the Public Reference Room may be obtained by calling 1-800-SEC-0330. The fund also makes its complete schedule of portfolio holdings for the most recent quarter of its fiscal year available on its website at americancentury.com and, upon request, by calling 1-800-345-2021.
36
The following indices are used to illustrate investment market, sector, or style performance or to serve as fund performance comparisons. They are not investment products available for purchase.
The Russell 1000® Index is a market-capitalization weighted, large-cap index created by Frank Russell Company to measure the performance of the 1,000 largest publicly traded U.S. companies, based on total market capitalization.
The Russell 1000® Growth Index measures the performance of those Russell 1000 Index companies (the 1,000 largest publicly traded U.S. companies, based on total market capitalization) with higher price-to-book ratios and higher forecasted growth values.
The Russell 1000® Value Index measures the performance of those Russell 1000 Index companies (the 1,000 largest publicly traded U.S. companies, based on total market capitalization) with lower price-to-book ratios and lower forecasted growth values.
The Russell 2000® Index is a market-capitalization weighted index created by Frank Russell Company to measure the performance of the 2,000 smallest of the 3,000 largest publicly traded U.S. companies, based on total market capitalization.
The Russell 2000® Growth Index measures the performance of those Russell 2000 Index companies (the 2,000 smallest of the 3,000 largest publicly traded U.S. companies, based on total market capitalization) with higher price-to-book ratios and higher forecasted growth values.
The Russell 2000® Value Index measures the performance of those Russell 2000 Index companies (the 2,000 smallest of the 3,000 largest publicly traded U.S. companies, based on total market capitalization) with lower price-to-book ratios and lower forecasted growth values.
The Russell Midcap® Index measures the performance of the 800 smallest of the 1,000 largest publicly traded U.S. companies, based on total market capitalization.
The Russell Midcap® Growth Index measures the performance of those Russell Midcap Index companies (the 800 smallest of the 1,000 largest publicly traded U.S. companies, based on total market capitalization) with higher price-to-book ratios and higher forecasted growth values.
The Russell Midcap® Value Index measures the performance of those Russell Midcap Index companies (the 800 smallest of the 1,000 largest publicly traded U.S. companies, based on total market capitalization) with lower price-to-book ratios and lower forecasted growth values.
The S&P 500 Index is a market value-weighted index of the stocks of 500 publicly traded U.S. companies chosen for market size, liquidity, and industry group representation that are considered to be leading firms in dominant industries. Each stock’s weight in the index is proportionate to its market value. Created by Standard & Poor’s, it is considered to be a broad measure of U.S. stock market performance.
37
38
39
40

| |
| |
| Contact Us | |
| americancentury.com | |
| Automated Information Line | 1-800-345-8765 |
| Investor Services Representative | 1-800-345-2021 or |
| | 816-531-5575 |
| Business, Not-For-Profit, Employer-Sponsored | |
| Retirement Plans | 1-800-345-3533 |
| Banks and Trust Companies, Broker-Dealers, | |
| Financial Professionals, Insurance Companies | 1-800-345-6488 |
| Telecommunications Device for the Deaf | 1-800-634-4113 |
| American Century Mutual Funds, Inc. | |
| Investment Advisor: | |
| American Century Investment Management, Inc. | |
| Kansas City, Missouri | |
This report and the statements it contains are submitted for the general
information of our shareholders. The report is not authorized for distribution to
prospective investors unless preceded or accompanied by an effective prospectus.
American Century Investment Services, Inc., Distributor
©2009 American Century Proprietary Holdings, Inc. All rights reserved.
0912
CL-ANN-67031N
|
| Annual Report |
| October 31, 2009 |

|
| American Century Investments |
Veedot® Fund
| |
| President’s Letter | 2 |
| Independent Chairman’s Letter | 3 |
| Market Perspective | 4 |
| U.S. Stock Index Returns | 4 |
| |
| Veedot | |
| |
| Performance | 5 |
| Portfolio Commentary | 7 |
| Top Ten Holdings | 9 |
| Top Five Industries | 9 |
| Types of Investments in Portfolio | 9 |
| |
| Shareholder Fee Example | 10 |
| |
| Financial Statements | |
| |
| Schedule of Investments | 12 |
| Statement of Assets and Liabilities | 15 |
| Statement of Operations | 16 |
| Statement of Changes in Net Assets | 17 |
| Notes to Financial Statements | 18 |
| Financial Highlights | 23 |
| Report of Independent Registered Public Accounting Firm | 25 |
| |
| Other Information | |
| |
| Management | 26 |
| Approval of Management Agreement | 29 |
| Additional Information | 34 |
| Index Definitions | 35 |
The opinions expressed in the Market Perspective and the Portfolio Commentary reflect those of the portfolio management team as of the date of the report, and do not necessarily represent the opinions of American Century Investments or any other person in the American Century Investments organization. Any such opinions are subject to change at any time based upon market or other conditions and American Century Investments disclaims any responsibility to update such opinions. These opinions may not be relied upon as investment advice and, because investment decisions made by American Century Investments funds are based on numerous factors, may not be relied upon as an indication of trading intent on behalf of any American Century Investments fund. Security examples are used for representational purposes only and are not intended as recommendations to purchase or sell securities. Performance information for comparative i ndices and securities is provided to American Century Investments by third party vendors. To the best of American Century Investments’ knowledge, such information is accurate at the time of printing.

Dear Investor:
Thank you for taking time to review the following pages, which provide the performance of your investment along with the perspectives of our experienced portfolio management team for the financial reporting period ended October 31, 2009. We appreciate your trust in American Century Investments® at this volatile, transitional time in the economy and investment markets.
As the upheavals associated with the “Great Recession” gradually subside, our senior management team has put considerable thought into how the investment environment has changed and what new challenges and opportunities await us. Critical factors that we are anticipating in the coming year include marked shifts in investment and spending behavior, along with consolidation in our industry.
Most importantly, we think the economic recovery will be slow and extended. The economy and capital markets have come a long way since Lehman Brothers collapsed in the third quarter of 2008, but 2010 will likely bring continuing challenges. The stock market’s rebound since last March and the third-quarter economic surge in 2009 were fueled largely by corporate cost-cutting and unprecedented monetary and fiscal stimulus, including some key programs that have since expired or been scaled back.
Meanwhile, the resilient but struggling consumer sector still faces double-digit unemployment, heavy debt burdens, tight credit conditions, and a housing market that is starting to stabilize, but remains vulnerable. Much of our investment positioning in 2009 cautiously reflected these still unstable economic fundamentals, leading to underperformance, in some cases, versus market benchmarks buoyed by the rally of riskier assets. We still support our fundamentally based positioning because we believe strongly that some markets—driven more by technical factors than fundamentals—have advanced further than underlying economic conditions warrant, and remain susceptible to the possibility of more volatility ahead.
Thank you for your continued confidence in us.
Sincerely,

Jonathan Thomas
President and Chief Executive Officer
American Century Investments
2
|
| Independent Chairman’s Letter |
In my first letter to shareholders of the American Century Investments funds, I invited you to contact me with your questions. I have been gratified with your response. Most shareholder inquiries to date have related to specific fund performance issues. As I noted in my individual responses, your board through the Fund Performance Committee continues to stress improved performance in our quarterly meetings with chief investment officers and fund managers.
An important part of our fund performance review process is a face-to-face meeting with portfolio managers. The board traveled during the second quarter to the American Century Investments office in Mountain View, California to meet with the fund of funds and asset allocation portfolio management teams. These meetings validated the importance of thorough reviews of investment opportunities by the credit management personnel resident in that office. As a result of their efforts, American Century Investments funds were able to avoid the “toxic assets” that plagued many other fund families in 2008.
From April through June 2009, the board conducted its annual review of the advisory contracts between American Century Investments and each fund. Our efforts involved a review of fund information, including assets under management; total expense ratio compared to peers; economies of scale; fee breakpoints that reduce shareholder costs as assets increase; performance compared to peers and benchmarks; and the quality of services provided to fund shareholders. A detailed discussion of board considerations in connection with advisory contract renewal is included annually in each fund’s shareholder reports. During this review, the board focuses on a detailed comparison of the competitive position of each fund and has negotiated more than 60 breakpoints or fee reductions in the past five years.
The board looks forward to another year of work on your behalf and your comments are appreciated. You are invited to email me at dhpratt@fundboardchair.com.

Don Pratt
3

By Enrique Chang, Chief Investment Officer, American Century Investments
Signs of Economic Recovery Boosted Stocks
The year ended October 31, 2009, was a period of extremes for the U.S. stock market. The market began the period in the midst of a historically steep decline, then finished the period with one of its strongest rallies since the 1930s. The market’s dramatic swings resulted from rapidly shifting expectations regarding the economic and financial environment.
Stocks fell sharply in late 2008 and early 2009 as investors grew increasingly concerned about a deep economic downturn and a lack of liquidity in the credit markets. In response, the federal government took unprecedented actions to shore up the credit sector, support the housing market, and revive the stalled economy.
These efforts began to bear fruit in the spring of 2009 as signs of economic stabilization emerged. Although the unemployment rate continued to climb, reaching a 26-year high of 10.2% by October, the broader economy showed evidence of improvement, producing real growth in the third quarter of 2009—the first positive quarterly growth in more than a year. In addition, cost-management efforts at many companies helped generate better-than-expected earnings in the second and third quarters.
As a result, the equity market reached a multi-year low on March 9 and then reversed course, rising steadily throughout the last seven months of the period. The rally helped erase the market’s earlier losses, enabling the major stock indexes to produce gains of approximately 10% overall. Growth stocks outperformed value shares by a wide margin (see the table below) across all market capitalizations, though they lagged modestly over the last six months.
Economic Challenges Remain
Although recent economic trends have been encouraging, the recovery will likely be gradual until there is sustained improvement in the delinquency levels of consumer debt and the unemployment rate. Thus far, the U.S. consumer has been conspicuously absent from the recovery, and given the weakness in the U.S. dollar and improving economic conditions elsewhere in the world, we may see an export-led recovery until the consumer gets back on firmer footing.
| | | | |
| U.S. Stock Index Returns | | | | |
| For the 12 months ended October 31, 2009 | | | |
| Russell 1000 Index (Large-Cap) | 11.20% | | Russell 2000 Index (Small-Cap) | 6.46% |
| Russell 1000 Growth Index | 17.51% | | Russell 2000 Growth Index | 11.34% |
| Russell 1000 Value Index | 4.78% | | Russell 2000 Value Index | 1.96% |
| Russell Midcap Index | 18.75% | | | |
| Russell Midcap Growth Index | 22.48% | | | |
| Russell Midcap Value Index | 14.52% | | | |
4
| | | | |
| Total Returns as of October 31, 2009 | | | |
| | | Average Annual Returns | |
| | | | Since | Inception |
| | 1 year | 5 years | Inception | Date |
| Investor Class | -11.80% | -1.42% | -0.60% | 11/30/99 |
| Russell 3000 Index(1) | 10.83% | 0.71% | -0.42% | — |
| Institutional Class | -11.79% | -1.25% | -2.61% | 8/1/00 |
| (1) Data provided by Lipper Inc. – A Reuters Company. © 2009 Reuters. All rights reserved. Any copying, republication or redistribution of Lipper |
| content, including by caching, framing or similar means, is expressly prohibited without the prior written consent of Lipper. Lipper shall not be |
| liable for any errors or delays in the content, or for any actions taken in reliance thereon. | | |
| The data contained herein has been obtained from company reports, financial reporting services, periodicals and other resources believed to be |
| reliable. Although carefully verified, data on compilations is not guaranteed by Lipper and may be incomplete. No offer or solicitations to buy or |
| sell any of the securities herein is being made by Lipper. | | | |
Data presented reflect past performance. Past performance is no guarantee of future results. Current performance may be higher or lower than the performance shown. Investment return and principal value will fluctuate, and redemption value may be more or less than original cost. To obtain performance data current to the most recent month end, please call 1-800-345-2021 or visit americancentury.com. The fund’s investment process may involve high portfolio turnover, high commission costs and high capital gains distributions. In addition, its investment approach may involve higher volatility and risk. International investing involves special risks, such as political instability and currency fluctuations. Investing in emerging markets may accentuate these risks.
Unless otherwise indicated, performance reflects Investor Class shares; performance for other share classes will vary due to differences in fee structure. For information about other share classes available, please consult the prospectus. Data assumes reinvestment of dividends and capital gains, and none of the charts reflect the deduction of taxes that a shareholder would pay on fund distributions or the redemption of fund shares. Returns for the index are provided for comparison. The fund’s total returns include operating expenses (such as transaction costs and management fees) that reduce returns, while the total returns of the index do not.
5
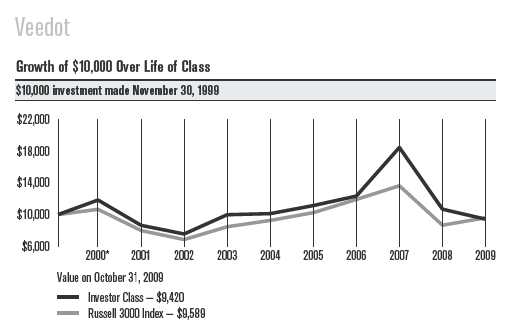
| | | | | | | | | | |
| One-Year Returns Over Life of Class | | | | | | | |
| Periods ended October 31 | | | | | | | | | |
| | 2000* | 2001 | 2002 | 2003 | 2004 | 2005 | 2006 | 2007 | 2008 | 2009 |
| Investor Class | 18.40% | -27.03% | -12.73% | 32.36% | 1.40% | 10.08% | 10.77% | 49.92% | -42.27% | -11.80% |
| Russell 3000 Index | 6.65% | -25.17% | -14.35% | 23.69% | 9.51% | 10.60% | 16.37% | 14.53% | -36.60% | 10.83% |
| *From 11/30/99, the Investor Class’s inception date. Not annualized. | | | | | | |
| | | | | | | | | | | |
| Total Annual Fund Operating Expenses | | | | | | |
| | Investor Class | | | | | Institutional Class | | |
| | 1.25% | | | | | 1.05% | | |
The total annual fund operating expenses shown is as stated in the fund’s prospectus current as of the date of this report. The prospectus may vary from the expense ratio shown elsewhere in this report because it is based on a different time period, includes acquired fund fees and expenses, and, if applicable, does not include fee waivers or expense reimbursements.
Data presented reflect past performance. Past performance is no guarantee of future results. Current performance may be higher or lower than the performance shown. Investment return and principal value will fluctuate, and redemption value may be more or less than original cost. To obtain performance data current to the most recent month end, please call 1-800-345-2021 or visit americancentury.com. The fund’s investment process may involve high portfolio turnover, high commission costs and high capital gains distributions. In addition, its investment approach may involve higher volatility and risk. International investing involves special risks, such as political instability and currency fluctuations. Investing in emerging markets may accentuate these risks.
Unless otherwise indicated, performance reflects Investor Class shares; performance for other share classes will vary due to differences in fee structure. For information about other share classes available, please consult the prospectus. Data assumes reinvestment of dividends and capital gains, and none of the charts reflect the deduction of taxes that a shareholder would pay on fund distributions or the redemption of fund shares. Returns for the index are provided for comparison. The fund’s total returns include operating expenses (such as transaction costs and management fees) that reduce returns, while the total returns of the index do not.
6
Veedot
Portfolio Managers: John Small, Jr. and Stephen Pool
Performance Summary
Veedot declined –11.80%* for the 12 months ended October 31, 2009, compared with its benchmark, the Russell 3000 Index, which returned 10.83% for the period.
As discussed in the Market Perspective on page 4, equity markets continued to struggle during the first half of the reporting period amid extreme volatility and recession. After dipping to multi-year lows on March 9, 2009, markets responded positively to generally improving economic data and rallied soundly, erasing earlier losses. Price momentum and acceleration, two factors that the Veedot team looks for in portfolio holdings, were not rewarded during this rally. Instead, lower-quality stocks that were the laggards in previous reporting periods led market strength.
In this challenging environment, Veedot’s highly systematic investment process delivered portfolio returns that trailed those of its benchmark. Stock selection in the health care and financials sectors accounted for the bulk of underperformance relative to its benchmark. Holdings in the consumer discretionary and energy sectors also hurt relative returns. Partially offsetting those losses, the information technology sector contributed to absolute and relative returns.
Health Care, Financials Detracted
Within the health care sector, Veedot maintained a beneficial underweight allocation to the pharmaceuticals industry. However, that was not nearly sufficient to compensate for detrimental holdings within the industry group. In particular, Veedot held a large overweight stake in ViroPharma Inc., whose share price declined during the reporting period as investors became concerned about constraints in its manufacturing capacity. In the health care provider industry group, a substantial overweight stake compared with the benchmark weighting in home health services company Almost Family hurt absolute and relative performance. Elsewhere in the health care sector, detrimental overweight holdings in the biotechnology sector included Alkermes and Geron.
In the financials sector, holdings in the capital markets industry group weighed on relative performance. Investment brokerage firm LaBranche & Co., in particular, saw its share price fall to a multi-year low amid a substantial decline in revenues during the reporting period. Within the diversified financial services group, non-benchmark holding Life Partners Holdings detracted significantly from returns. In the insurance industry, an overweight stake in Fidelity National hurt absolute and relative performance. The title insurance company, which benefited from increased mortgage refinance activity as a result of the government’s mortgage refinance plan, posted gains for the entire reporting period but declined while it was held in the portfolio.
*All fund returns referenced in this commentary are for Investor Class shares.
7
Veedot
Consumer Discretionary, Energy Lagged
The consumer discretionary sector was another source of underpefor-mance for Veedot. Within the sector, stock selection within the specialty retailing industry group hindered absolute and relative returns. Retail chain Foot Locker Inc. was among several retailers that weighed on relative performance. The company’s share price sank more during the time it was held in the portfolio than it did during the reporting period as a whole in the benchmark.
Elsewhere in the consumer discretionary sector, a stake in specialty textile company Unifi, a non-benchmark holding, yielded unfavorable results. The company’s share price slumped as it experienced weak sales volumes.
In the energy sector, poor stock decisions included overweight stakes in oil and gas exploration and production companies XTO Energy and Southwestern Energy. Overweight positions in several energy equipment and services companies also proved detrimental to Veedot’s absolute and relative returns.
Information Technology Contributed
Veedot’s systematic process successfully guided the portfolio to several outperforming companies in the technology sector. Within the semiconductor group, Veedot was rewarded for a large stake in non-benchmark holding NVE Corp. Software company Interactive Intelligence, not a member of the benchmark, contributed significantly to absolute and relative gains as its share price climbed 128%. An overweight position in IT services company Metavante Technologies, whose share price enjoyed triple-digit gains, also added meaningfully to returns.
Outlook
Using a systematic and technically driven process, Veedot focuses on finding companies whose fundamental characteristics meet strict requirements for accelerating earnings and revenue growth. Such companies must also have historical stock price performance that suggests impending share price appreciation.
The reporting period was a difficult environment for growth- and momentum-oriented investment styles. Looking ahead, however, we remain committed to our systematic process of identifying companies with accelerating growth and price momentum.
8
| | |
| Veedot | | |
| |
| Top Ten Holdings as of October 31, 2009 | | |
| | % of net assets | % of net assets |
| | as of 10/31/09 | as of 4/30/09 |
| Whole Foods Market, Inc. | 1.7% | 1.1% |
| Medifast, Inc. | 1.7% | — |
| Schweitzer-Mauduit International, Inc. | 1.6% | — |
| Freeport-McMoRan Copper & Gold, Inc. | 1.6% | 0.9% |
| Ruby Tuesday, Inc. | 1.5% | 1.8% |
| Tenet Healthcare Corp. | 1.5% | — |
| Hi-Tech Pharmacal Co., Inc. | 1.5% | — |
| J. Crew Group, Inc. | 1.5% | — |
| Western Digital Corp. | 1.5% | 1.0% |
| Kirkland’s, Inc. | 1.4% | — |
| |
| Top Five Industries as of October 31, 2009 | | |
| | % of net assets | % of net assets |
| | as of 10/31/09 | as of 4/30/09 |
| Specialty Retail | 11.6% | 9.2% |
| Health Care Providers & Services | 7.3% | — |
| Chemicals | 5.1% | 1.1% |
| Computers & Peripherals | 4.9% | 2.3% |
| Consumer Finance | 4.3% | — |
| |
| Types of Investments in Portfolio | | |
| | % of net assets | % of net assets |
| | as of 10/31/09 | as of 4/30/09 |
| Domestic Common Stocks | 83.1% | 87.6% |
| Foreign Common Stocks(1) | 9.8% | 11.7% |
| Total Common Stocks | 92.9% | 99.3% |
| Temporary Cash Investments | 8.2% | 0.5% |
| Other Assets and Liabilities | (1.1)% | 0.2% |
| (1) Includes depositary shares, dual listed securities and foreign ordinary shares. | | |
9
|
| Shareholder Fee Example (Unaudited) |
Fund shareholders may incur two types of costs: (1) transaction costs, including sales charges (loads) on purchase payments and redemption/ exchange fees; and (2) ongoing costs, including management fees; distribution and service (12b-1) fees; and other fund expenses. This example is intended to help you understand your ongoing costs (in dollars) of investing in your fund and to compare these costs with the ongoing cost of investing in other mutual funds.
The example is based on an investment of $1,000 made at the beginning of the period and held for the entire period from May 1, 2009 to October 31, 2009.
Actual Expenses
The table provides information about actual account values and actual expenses for each class. You may use the information, together with the amount you invested, to estimate the expenses that you paid over the period. First, identify the share class you own. Then simply divide your account value by $1,000 (for example, an $8,600 account value divided by $1,000 = 8.6), then multiply the result by the number under the heading “Expenses Paid During Period” to estimate the expenses you paid on your account during this period.
If you hold Investor Class shares of any American Century Investments fund, or Institutional Class shares of the American Century Diversified Bond Fund, in an American Century Investments account (i.e., not a financial intermediary or retirement plan account), American Century Investments may charge you a $12.50 semiannual account maintenance fee if the value of those shares is less than $10,000. We will redeem shares automatically in one of your accounts to pay the $12.50 fee. In determining your total eligible investment amount, we will include your investments in all personal accounts (including American Century Investments Brokerage accounts) registered under your Social Security number. Personal accounts include individual accounts, joint accounts, UGMA/UTMA accounts, personal trusts, Coverdell Education Savings Accounts and IRAs (including traditional, Roth, Rollover, SEP-, SARSEP- and SIMPLE-IRAs), and certain other retirement accounts. If you have only business, business retirement, employer-sponsored or American Century Investments Brokerage accounts, you are currently not subject to this fee. We will not charge the fee as long as you choose to manage your accounts exclusively online. If you are subject to the Account Maintenance Fee, your account value could be reduced by the fee amount.
Hypothetical Example for Comparison Purposes
The table also provides information about hypothetical account values and hypothetical expenses based on the actual expense ratio of each class of your fund and an assumed rate of return of 5% per year before expenses, which is not the actual return of a fund’s share class. The hypothetical account values and expenses may not be used to estimate the actual ending account balance or expenses you paid for the period. You may use this information to compare the ongoing costs of investing in your fund and other funds. To do so, compare this 5% hypothetical example with the 5% hypothetical examples that appear in the shareholder reports of the other funds.
10
Please note that the expenses shown in the table are meant to highlight your ongoing costs only and do not reflect any transactional costs, such as sales charges (loads) or redemption/exchange fees. Therefore, the table is useful in comparing ongoing costs only, and will not help you determine the relative total costs of owning different funds. In addition, if these transactional costs were included, your costs would have been higher.
| | | | |
| | Beginning | Ending | Expenses Paid | |
| | Account Value | Account Value | During Period* | Annualized |
| | 5/1/09 | 10/31/09 | 5/1/09 – 10/31/09 | Expense Ratio* |
| Actual | | | | |
| Investor Class | $1,000 | $1,105.60 | $6.63 | 1.25% |
| Institutional Class | $1,000 | $1,106.20 | $5.57 | 1.05% |
| Hypothetical | | | | |
| Investor Class | $1,000 | $1,018.90 | $6.36 | 1.25% |
| Institutional Class | $1,000 | $1,019.91 | $5.35 | 1.05% |
| *Expenses are equal to the class’s annualized expense ratio listed in the table above, multiplied by the average account value over the period, |
| multiplied by 184, the number of days in the most recent fiscal half-year, divided by 365, to reflect the one-half year period. |
11
| | | | | | |
| Veedot | | | | | | |
| |
| OCTOBER 31, 2009 | | | | | | |
| |
| | Shares | Value | | | Shares | Value |
| Common Stocks — 92.9% | | | DIVERSIFIED FINANCIAL SERVICES — 1.0% | |
| | | | | PHH Corp.(1) | 49,000 | $ 791,840 |
| AEROSPACE & DEFENSE — 1.2% | | | | | |
| Cubic Corp. | 26,500 | $ 919,815 | | DIVERSIFIED TELECOMMUNICATION | |
| | | | | SERVICES — 1.2% | | |
| AUTO COMPONENTS — 1.9% | | | | Telecom Argentina SA ADR(1) | 58,000 | 980,200 |
| Tenneco, Inc.(1) | 57,000 | 776,340 | | | | |
| | | | | ELECTRONIC EQUIPMENT, INSTRUMENTS & | |
| TRW Automotive | | | | COMPONENTS — 2.1% | | |
| Holdings Corp.(1) | 47,500 | 743,375 | | | | |
| | | | | Jabil Circuit, Inc. | 60,000 | 802,800 |
| | | 1,519,715 | | Tech Data Corp.(1) | 21,500 | 826,245 |
| BEVERAGES — 1.3% | | | | | | |
| | | | | | | 1,629,045 |
| Coca-Cola Enterprises, Inc. | 53,000 | 1,010,710 | | | | |
| | | | | ENERGY EQUIPMENT & SERVICES — 1.0% | |
| BUILDING PRODUCTS — 1.0% | | | | | | |
| | | | | Geokinetics, Inc.(1) | 47,000 | 755,760 |
| Apogee Enterprises, Inc. | 57,500 | 761,300 | | | | |
| CAPITAL MARKETS — 2.4% | | | | FOOD & STAPLES RETAILING — 1.7% | |
| | | | | Whole Foods Market, Inc.(1) | 42,500 | 1,362,550 |
| Deutsche Bank AG | 12,500 | 895,375 | | | | |
| Jefferies Group, Inc.(1) | 39,500 | 1,030,950 | | FOOD PRODUCTS — 2.2% | | |
| | | 1,926,325 | | Del Monte Foods Co. | 80,000 | 864,000 |
| | | | | Green Mountain Coffee | | |
| CHEMICALS — 5.1% | | | | Roasters, Inc.(1) | 13,500 | 898,425 |
| A. Schulman, Inc. | 41,500 | 720,855 | | | | 1,762,425 |
| Braskem SA Preference | | | | HEALTH CARE PROVIDERS & SERVICES — 7.3% |
| Shares ADR(1) | 73,500 | 964,320 | | | | |
| | | | | Air Methods Corp.(1) | 28,500 | 870,390 |
| Eastman Chemical Co. | 15,500 | 813,905 | | | | |
| NewMarket Corp. | 8,500 | 794,750 | | AmerisourceBergen Corp. | 42,500 | 941,375 |
| Omnova Solutions, Inc.(1) | 117,500 | 753,175 | | Community Health | | |
| | | | | Systems, Inc.(1) | 28,500 | 891,480 |
| | | 4,047,005 | | Emergency Medical | | |
| COMMERCIAL SERVICES & SUPPLIES — 2.3% | | Services Corp., Class A(1) | 20,500 | 984,410 |
| APAC Customer | | | | PSS World Medical, Inc.(1) | 43,000 | 869,460 |
| Services, Inc.(1) | 152,500 | 983,625 | | | | |
| | | | | Tenet Healthcare Corp.(1) | 235,000 | 1,203,200 |
| HNI Corp. | 30,500 | 802,760 | | | | 5,760,315 |
| | | 1,786,385 | | HOTELS, RESTAURANTS & LEISURE — 3.9% | |
| COMPUTERS & PERIPHERALS — 4.9% | | | Cheesecake Factory, Inc. | | |
| Dell, Inc.(1) | 56,000 | 811,440 | | (The)(1) | 43,500 | 790,830 |
| Seagate Technology | 75,000 | 1,046,250 | | Ctrip.com International Ltd. | | |
| Western Digital Corp.(1) | 34,000 | 1,145,120 | | ADR(1) | 19,500 | 1,044,030 |
| Xyratex Ltd.(1) | 79,000 | 825,550 | | Ruby Tuesday, Inc.(1) | 182,000 | 1,212,120 |
| | | 3,828,360 | | | | 3,046,980 |
| CONSUMER FINANCE — 4.3% | | | | HOUSEHOLD DURABLES — 3.1% | |
| Advance America Cash | | | | Tempur-Pedic | | |
| Advance Centers, Inc. | 154,500 | 763,230 | | International, Inc.(1) | 40,500 | 784,485 |
| American Express Co. | 23,500 | 818,740 | | Tupperware Brands Corp. | 18,500 | 832,870 |
| Discover Financial Services | 57,000 | 805,980 | | Whirlpool Corp. | 11,500 | 823,285 |
| Dollar Financial Corp.(1) | 52,000 | 976,040 | | | | 2,440,640 |
| | | 3,363,990 | | INDEPENDENT POWER PRODUCERS & | |
| CONTAINERS & PACKAGING — 2.5% | | | ENERGY TRADERS — 0.9% | | |
| | | | | NRG Energy, Inc.(1) | 31,500 | 724,185 |
| Packaging Corp of America | 46,000 | 840,880 | | | | |
| Temple-Inland, Inc. | 71,000 | 1,096,950 | | INDUSTRIAL CONGLOMERATES — 1.1% | |
| | | 1,937,830 | | 3M Co. | 12,000 | 882,840 |
12
| | | | | | |
| Veedot | | | | | | |
| |
| |
| | Shares | Value | | | Shares | Value |
| INSURANCE — 1.2% | | | | SPECIALTY RETAIL — 11.6% | | |
| FBL Financial Group, Inc., | | | | Aeropostale, Inc.(1) | 23,000 | $ 863,190 |
| Class A | 46,500 | $ 936,975 | | Bed Bath & Beyond, Inc.(1) | 25,000 | 880,250 |
| INTERNET & CATALOG RETAIL — 1.1% | | | Big 5 Sporting Goods Corp. | 59,500 | 877,625 |
| Amazon.com, Inc.(1) | 7,000 | 831,670 | | | | |
| | | | | CarMax, Inc.(1) | 41,500 | 816,305 |
| IT SERVICES — 2.5% | | | | Guess?, Inc. | 22,500 | 822,375 |
| TeleTech Holdings, Inc.(1) | 51,500 | 921,335 | | | | |
| | | | | J. Crew Group, Inc.(1) | 28,500 | 1,162,230 |
| Unisys Corp.(1) | 36,350 | 1,059,239 | | | | |
| | | | | Kirkland’s, Inc.(1) | 88,500 | 1,113,330 |
| | | 1,980,574 | | RadioShack Corp. | 56,000 | 945,840 |
| MACHINERY — 2.1% | | | | Stein Mart, Inc.(1) | 88,000 | 836,000 |
| Crane Co. | 27,500 | 765,875 | | TJX Cos., Inc. (The) | 21,500 | 803,025 |
| John Bean Technologies Corp. | 55,500 | 911,310 | | | | 9,120,170 |
| | | 1,677,185 | | TEXTILES, APPAREL & LUXURY GOODS — 2.2% |
| METALS & MINING — 2.5% | | | | Coach, Inc. | 26,000 | 857,220 |
| Freeport-McMoRan | | | | Crocs, Inc.(1) | 144,500 | 878,560 |
| Copper & Gold, Inc.(1) | 17,000 | 1,247,120 | | | | |
| Horsehead Holding Corp.(1) | 79,500 | 757,635 | | | | 1,735,780 |
| | | 2,004,755 | | TOBACCO — 1.2% | | |
| MULTILINE RETAIL — 1.3% | | | | Lorillard, Inc. | 12,000 | 932,640 |
| | | | | TOTAL COMMON STOCKS | | |
| Nordstrom, Inc. | 32,500 | 1,032,850 | | (Cost $66,326,574) | | 73,112,759 |
| MULTI-UTILITIES — 1.2% | | | | | | |
| OGE Energy Corp. | 27,500 | 913,550 | | Temporary Cash Investments — 8.2% |
| PAPER & FOREST PRODUCTS — 2.6% | | | JPMorgan U.S. Treasury | | |
| | | | | Plus Money Market Fund | | |
| KapStone Paper and | | | | Agency Shares | 26,321 | 26,321 |
| Packaging Corp.(1) | 104,500 | 725,230 | | | | |
| | | | | Repurchase Agreement, Credit Suisse First | |
| Schweitzer-Mauduit | | | | Boston, Inc., (collateralized by various | |
| International, Inc. | 25,000 | 1,291,250 | | U.S. Treasury obligations, 6.25%, 8/15/23, | |
| | | 2,016,480 | | valued at $2,454,142), in a joint trading | |
| PERSONAL PRODUCTS — 1.7% | | | | account at 0.02%, dated 10/30/09, due | |
| Medifast, Inc.(1) | 61,500 | 1,354,230 | | 11/2/09 (Delivery value $2,400,004) | 2,400,000 |
| PHARMACEUTICALS — 1.5% | | | | Repurchase Agreement, Deutsche Bank | |
| | | | | Securities, Inc., (collateralized by various | |
| Hi-Tech Pharmacal Co., Inc.(1) | 65,000 | 1,185,600 | | U.S. Treasury obligations, 1.25%, 5/12/12, | |
| REAL ESTATE MANAGEMENT & | | | | valued at $4,081,287), in a joint trading | |
| DEVELOPMENT — 1.1% | | | | account at 0.04%, dated 10/30/09, due | |
| E-House China | | | | 11/2/09 (Delivery value $4,000,013) | | 4,000,000 |
| Holdings Ltd. ADR(1) | 53,000 | 906,830 | | TOTAL TEMPORARY | | |
| SEMICONDUCTORS & SEMICONDUCTOR | | | CASH INVESTMENTS | | |
| EQUIPMENT — 4.0% | | | | (Cost $6,426,321) | | 6,426,321 |
| Atheros | | | | TOTAL INVESTMENT | | |
| Communications, Inc.(1) | 31,000 | 763,220 | | SECURITIES — 101.1% | | |
| | | | | (Cost $72,752,895) | | 79,539,080 |
| Micron Technology, Inc.(1) | 101,000 | 685,790 | | | | |
| | | | | OTHER ASSETS AND | | |
| Texas Instruments, Inc. | 35,500 | 832,475 | | LIABILITIES — (1.1)% | | (847,554) |
| Veeco Instruments, Inc.(1) | 34,500 | 840,075 | | TOTAL NET ASSETS — 100.0% | | $78,691,526 |
| | | 3,121,560 | | | | |
| SOFTWARE — 2.7% | | | | | | |
| Pegasystems, Inc. | 38,000 | 1,089,460 | | | | |
| Perfect World Co. Ltd., | | | | | | |
| Class B ADR(1) | 23,500 | 1,034,235 | | | | |
| | | 2,123,695 | | | | |
13
|
| Veedot |
|
| Notes to Schedule of Investments |
| ADR = American Depositary Receipt |
| (1) Non-income producing. |
| Industry classifications are unaudited. |
| See Notes to Financial Statements. |
14
|
| Statement of Assets and Liabilities |
| |
| OCTOBER 31, 2009 | |
| Assets | |
| Investment securities, at value (cost of $72,752,895) | $ 79,539,080 |
| Receivable for investments sold | 8,372,268 |
| Receivable for capital shares sold | 42,353 |
| Dividends and interest receivable | 34,174 |
| | 87,987,875 |
| | |
| Liabilities | |
| Payable for investments purchased | 9,175,986 |
| Payable for capital shares redeemed | 27,702 |
| Accrued management fees | 92,661 |
| | 9,296,349 |
| | |
| Net Assets | $ 78,691,526 |
| | |
| Net Assets Consist of: | |
| Capital (par value and paid-in surplus) | $154,828,887 |
| Undistributed net investment income | 55,118 |
| Accumulated net realized loss on investment transactions | (82,978,664) |
| Net unrealized appreciation on investments | 6,786,185 |
| | $ 78,691,526 |
| | |
| Investor Class, $0.01 Par Value | |
| Net assets | $75,602,561 |
| Shares outstanding | 16,058,070 |
| Net asset value per share | $4.71 |
| | |
| Institutional Class, $0.01 Par Value | |
| Net assets | $3,088,965 |
| Shares outstanding | 644,305 |
| Net asset value per share | $4.79 |
| | |
| | |
| See Notes to Financial Statements. | |
15
| |
| YEAR ENDED OCTOBER 31, 2009 | |
| Investment Income (Loss) | |
| Income: | |
| Dividends (net of foreign taxes withheld of $7,567) | $ 1,008,472 |
| Interest | 1,993 |
| | 1,010,465 |
| | |
| Expenses: | |
| Management fees | 1,028,824 |
| Directors’ fees and expenses | 3,270 |
| Other expenses | 260 |
| | 1,032,354 |
| | |
| Net investment income (loss) | (21,889) |
| | |
| Realized and Unrealized Gain (Loss) | |
| Net realized gain (loss) on investment transactions | (22,607,756) |
| Change in net unrealized appreciation (depreciation) on investments | 9,998,811 |
| Net realized and unrealized gain (loss) | (12,608,945) |
| | |
| Net Increase (Decrease) in Net Assets Resulting from Operations | $(12,630,834) |
| |
| |
| See Notes to Financial Statements. | |
16
|
| Statement of Changes in Net Assets |
| | |
| YEARS ENDED OCTOBER 31, 2009 AND OCTOBER 31, 2008 | | |
| Increase (Decrease) in Net Assets | 2009 | 2008 |
| Operations | | |
| Net investment income (loss) | $ (21,889) | $ (429,521) |
| Net realized gain (loss) | (22,607,756) | (27,791,108) |
| Change in net unrealized appreciation (depreciation) | 9,998,811 | (53,607,679) |
| Net increase (decrease) in net assets resulting from operations | (12,630,834) | (81,828,308) |
| | | |
| Capital Share Transactions | | |
| Net increase (decrease) in net assets from capital share transactions | (12,542,096) | (18,609,717)(1) |
| | | |
| Redemption Fees | | |
| Increase in net assets from redemption fees | 9,356 | —(1) |
| | | |
| Net increase (decrease) in net assets | (25,163,574) | (100,438,025) |
| | | |
| Net Assets | | |
| Beginning of period | 103,855,100 | 204,293,125 |
| End of period | $ 78,691,526 | $ 103,855,100 |
| | | |
| Undistributed net investment income | $55,118 | — |
| (1) Capital share transactions for the year ended October 31, 2008, were net of redemption fees (Note 4). | | |
| |
| See Notes to Financial Statements. | | |
17
|
| Notes to Financial Statements |
OCTOBER 31, 2009
1. Organization and Summary of Significant Accounting Policies
Organization — American Century Mutual Funds, Inc. (the corporation) is registered under the Investment Company Act of 1940 (the 1940 Act) as an open-end management investment company. Veedot Fund (the fund) is one fund in a series issued by the corporation. The fund is nondiversified under the 1940 Act. The fund’s investment objective is to seek long-term capital growth. The fund pursues its objective by investing primarily in common stocks that management believes to have better than average prospects for appreciation. The fund uses an approach to common stock investing developed by American Century Investments. This approach relies heavily on quantitative tools to identify attractive investment opportunities, regardless of company size, industry type or geographic location, on a disciplined, consistent basis. The following is a sum mary of the fund’s significant accounting policies.
Multiple Class — The fund is authorized to issue the Investor Class and the Institutional Class. The share classes differ principally in their respective distribution and shareholder servicing expenses and arrangements. All shares of the fund represent an equal pro rata interest in the net assets of the class to which such shares belong, and have identical voting, dividend, liquidation and other rights and the same terms and conditions, except for class specific expenses and exclusive rights to vote on matters affecting only individual classes. Income, non-class specific expenses, and realized and unrealized capital gains and losses of the fund are allocated to each class of shares based on their relative net assets.
Security Valuations — Securities traded primarily on a principal securities exchange are valued at the last reported sales price, or at the mean of the latest bid and asked prices where no last sales price is available. Depending on local convention or regulation, securities traded over-the-counter are valued at the mean of the latest bid and asked prices, the last sales price, or the official close price. Investments in open-end management investment companies are valued at the reported net asset value. Debt securities not traded on a principal securities exchange are valued through a commercial pricing service or at the mean of the most recent bid and asked prices. Discount notes may be valued through a commercial pricing service or at amortized cost, which approximates fair value. Securities traded on foreign securities exchanges and ov er-the-counter markets are normally completed before the close of business on days that the New York Stock Exchange (the Exchange) is open and may also take place on days when the Exchange is not open. If an event occurs after the value of a security was established but before the net asset value per share was determined that was likely to materially change the net asset value, that security would be valued as determined in accordance with procedures adopted by the Board of Directors. If the fund determines that the market price of a portfolio security is not readily available, or that the valuation methods mentioned above do not reflect the security’s fair value, such security is valued as determined by the Board of Directors or its designee, in accordance with procedures adopted by the Board of Directors, if such determination would materially impact a fund’s net asset value. Certain other circumstances may cause the fund to use alternative procedures to value a security such as: a security has b een declared in default; trading in a security has been halted during the trading day; or there is a foreign market holiday and no trading will commence.
Security Transactions — For financial reporting purposes, security transactions are accounted for as of the trade date. Net realized gains and losses are determined on the identified cost basis, which is also used for federal income tax purposes.
Investment Income — Dividend income less foreign taxes withheld, if any, is recorded as of the ex-dividend date. Interest income is recorded on the accrual basis and includes accretion of discounts and amortization of premiums.
18
Repurchase Agreements — The fund may enter into repurchase agreements with institutions that American Century Investment Management, Inc. (ACIM) (the investment advisor) has determined are creditworthy pursuant to criteria adopted by the Board of Directors. Each repurchase agreement is recorded at cost. The fund requires that the collateral, represented by securities, received in a repurchase transaction be transferred to the custodian in a manner sufficient to enable the fund to obtain those securities in the event of a default under the repurchase agreement. ACIM monitors, on a daily basis, the securities transferred to ensure the value, including accrued interest, of the securities under each repurchase agreement is equal to or greater than amounts owed to the fund under each repurchase agreement.
Joint Trading Account — Pursuant to an Exemptive Order issued by the Securities and Exchange Commission, the fund, along with certain other funds in the American Century Investments family of funds, may transfer uninvested cash balances into a joint trading account. These balances are invested in one or more repurchase agreements that are collateralized by U.S. Treasury or Agency obligations.
Income Tax Status — It is the fund’s policy to distribute substantially all net investment income and net realized gains to shareholders and to otherwise qualify as a regulated investment company under provisions of the Internal Revenue Code. The fund is no longer subject to examination by tax authorities for years prior to 2006. At this time, management believes there are no uncertain tax positions which, based on their technical merit, would not be sustained upon examination and for which it is reasonably possible that the total amounts of unrecognized tax benefits will significantly change in the next twelve months. Accordingly, no provision has been made for federal or state income taxes. Interest and penalties associated with any federal or state income tax obligations, if any, are recorded as interest expense.
Distributions to Shareholders — Distributions to shareholders are recorded on the ex-dividend date. Distributions from net investment income and net realized gains, if any, are generally declared and paid annually.
Redemption — The fund may impose a 2.00% redemption fee on shares held less than 180 days. The redemption fee is recorded as a reduction in the cost of shares redeemed. The redemption fee is retained by the fund and helps cover transaction costs that long-term investors may bear when a fund sells securities to meet investor redemptions.
Indemnifications — Under the corporation’s organizational documents, its officers and directors are indemnified against certain liabilities arising out of the performance of their duties to the fund. In addition, in the normal course of business, the fund enters into contracts that provide general indemnifications. The maximum exposure under these arrangements is unknown as this would involve future claims that may be made against a fund. The risk of material loss from such claims is considered by management to be remote.
Use of Estimates — The financial statements are prepared in conformity with accounting principles generally accepted in the United States of America, which may require management to make certain estimates and assumptions at the date of the financial statements. Actual results could differ from these estimates.
Subsequent Events — Management has evaluated events or transactions that may have occurred since October 31, 2009, that would merit recognition or disclosure in the financial statements. This evaluation was completed through December 28, 2009, the date the financial statements were issued.
19
2. Fees and Transactions with Related Parties
Management Fees — The corporation has entered into a Management Agreement with ACIM, under which ACIM provides the fund with investment advisory and management services in exchange for a single, unified management fee (the fee) per class. The Agreement provides that all expenses of the fund, except brokerage commissions, taxes, interest, fees and expenses of those directors who are not considered “interested persons” as defined in the 1940 Act (including counsel fees) and extraordinary expenses, will be paid by ACIM. The fee is computed and accrued daily based on the daily net assets of the specific class of shares of the fund and paid monthly in arrears. For funds with a stepped fee schedule, the rate of the fee is determined by applying a fee rate calculation formula. This formula takes into account each fund’s assets as w ell as certain assets, if any, of other clients of the investment advisor outside the American Century Investments family of funds (such as subadvised funds and separate accounts) that have very similar investment teams and investment strategies (strategy assets). The annual management fee schedule for the fund ranges from 1.000% to 1.250% for the Investor Class. The Institutional Class is 0.200% less at each point within the range. The effective annual management fee for each class of the fund for the year ended October 31, 2009, was 1.25% and 1.05% for the Investor Class and Institutional Class, respectively.
Related Parties — Certain officers and directors of the corporation are also officers and/or directors, and, as a group, controlling stockholders of American Century Companies, Inc. (ACC), the parent of the corporation’s investment advisor, ACIM, the distributor of the corporation, ACIS, and the corporation’s transfer agent, American Century Services, LLC.
The fund is eligible to invest in a money market fund for temporary purposes, which is managed by J.P. Morgan Investment Management, Inc. (JPMIM). The fund has a Mutual Funds Services Agreement with J.P. Morgan Investor Services Co. (JPMIS). JPMorgan Chase Bank (JPMCB) is a custodian of the fund. JPMIM, JPMIS and JPMCB are wholly owned subsidiaries of JPMorgan Chase & Co. (JPM). JPM is an equity investor in ACC.
3. Investment Transactions
Purchases and sales of investment securities, excluding short-term investments, for the year ended October 31, 2009, were $261,655,455 and $274,388,677, respectively.
4. Capital Share Transactions
Transactions in shares of the fund were as follows:
| | | | | |
| | | Year ended October 31, 2009 | Year ended October 31, 2008 |
| | | Shares | Amount | Shares | Amount |
| Investor Class/Shares Authorized | 200,000,000 | | 200,000,000 | |
| Sold | | 588,168 | $ 2,708,394 | 1,480,565 | $ 11,492,491 |
| Redeemed | (3,060,477) | (14,058,883) | (4,036,655) | (29,538,137)(1) |
| | | (2,472,309) | (11,350,489) | (2,556,090) | (18,045,646) |
| Institutional Class/Shares Authorized | 100,000,000 | | 100,000,000 | |
| Sold | | 59,551 | 280,976 | 145,816 | 1,157,483 |
| Redeemed | (311,173) | (1,472,583) | (229,009) | (1,721,554)(2) |
| | | (251,622) | (1,191,607) | (83,193) | (564,071) |
| Net increase (decrease) | (2,723,931) | $(12,542,096) | (2,639,283) | $(18,609,717) |
| (1) | Net of redemption fees of $55,641. | | | | |
| (2) | Net of redemption fees of $9,826. | | | | |
20
5. Fair Value Measurements
The fund’s securities valuation process is based on several considerations and may use multiple inputs to determine the fair value of the positions held by the fund. In conformity with accounting principles generally accepted in the United States of America, the inputs used to determine a valuation are classified into three broad levels as follows:
• Level 1 valuation inputs consist of actual quoted prices in an active market for identical securities;
• Level 2 valuation inputs consist of significant direct or indirect observable market data (including quoted prices for similar securities, evaluations of subsequent market events, interest rates, prepayment speeds, credit risk, etc.); or
• Level 3 valuation inputs consist of significant unobservable inputs (including a fund’s own assumptions).
The level classification is based on the lowest level input that is significant to the fair valuation measurement. The valuation inputs are not an indication of the risks associated with investing in these securities or other financial instruments.
The following is a summary of the valuation inputs used to determine the fair value of the fund’s securities as of October 31, 2009:
| | | |
| | Level 1 | Level 2 | Level 3 |
| Investment Securities | | | |
| Domestic Common Stocks | $65,415,969 | — | — |
| Foreign Common Stocks | 6,732,470 | $ 964,320 | — |
| Temporary Cash Investments | 26,321 | 6,400,000 | — |
| Total Value of Investment Securities | $72,174,760 | $7,364,320 | — |
6. Risk Factors
The fund’s investment process may involve high portfolio turnover, high commission costs and high capital gains distributions. In addition, its investment approach may involve higher volatility and risk. There are certain risks involved in investing in foreign securities. These risks include those resulting from future adverse political, social, and economic developments, fluctuations in currency exchange rates, the possible imposition of exchange controls, and other foreign laws or restrictions. Investing in emerging markets may accentuate these risks.
7. Bank Line of Credit
The fund, along with certain other funds in the American Century Investments family of funds, had a $500,000,000 unsecured bank line of credit agreement with Bank of America, N.A. The line expired December 10, 2008, and was not renewed. The agreement allowed the fund to borrow money for temporary or emergency purposes to fund shareholder redemptions. Borrowings under the agreement were subject to interest at the Federal Funds rate plus 0.40%. The fund did not borrow from the line during the year ended October 31, 2009.
8. Interfund Lending
The fund, along with certain other funds in the American Century Investments family of funds, may participate in an interfund lending program, pursuant to an Exemptive Order issued by the Securities and Exchange Commission (SEC). This program provides an alternative credit facility allowing the fund to borrow from or lend to other funds in the American Century Investments family of funds that permit such transactions. Interfund
21
lending transactions are subject to each fund’s investment policies and borrowing and lending limits. The interfund loan rate earned/paid on interfund lending transactions is determined daily based on the average of certain current market rates. Interfund lending transactions normally extend only overnight, but can have a maximum duration of seven days. The program is subject to annual approval by the Board of Directors. During the year ended October 31, 2009, the fund did not utilize the program.
9. Federal Tax Information
The book-basis character of distributions made during the year from net investment income or net realized gains may differ from their ultimate characterization for federal income tax purposes. These differences reflect the differing character of certain income items and net realized gains and losses for financial statement and tax purposes, and may result in reclassification among certain capital accounts on the financial statements. There were no distributions paid by the fund during the years ended October 31, 2009 and October 31, 2008.
As of October 31, 2009, the federal tax cost of investments and the components of distributable earnings on a tax-basis were as follows:
| |
| Federal tax cost of investments | $72,752,895 |
| Gross tax appreciation of investments | $ 9,270,874 |
| Gross tax depreciation of investments | (2,484,689) |
| Net tax appreciation (depreciation) of investments | $ 6,786,185 |
| Undistributed ordinary income | $55,118 |
| Accumulated capital losses | $(82,978,664) |
The cost and unrealized appreciation (depreciation) of investments for federal income tax purposes was the same as the cost and unrealized appreciation (depreciation) for financial reporting purposes.
The accumulated capital losses listed above represent net capital loss carryovers that may be used to offset future realized capital gains for federal income tax purposes. Future capital loss carryover utilization in any given year may be subject to Internal Revenue Code limitations. Capital loss carryovers of $(32,317,452), $(27,976,449) and $(22,684,763) expire in 2010, 2016 and 2017, respectively.
10. Recently Issued Accounting Standards
The Financial Accounting Standards Board (FASB) issued Accounting Standards Codification (ASC) Section 820-10 (formerly Statement of Financial Accounting Standards No. 157, “Fair Value Measurements”), in September 2006, which is effective for fiscal years beginning after November 15, 2007. ASC Section 820-10 defines fair value, establishes a framework for measuring fair value and expands the required financial statement disclosures about fair value measurements. The adoption of ASC Section 820-10 did not materially impact the determination of fair value.
In March 2008, the FASB issued ASC Section 815-10 (formerly Statement of Financial Accounting Standards No. 161, “Disclosures about Derivative Instruments and Hedging Activities — an amendment of FASB Statement No. 133”). ASC Section 815-10 is effective for interim periods beginning after November 15, 2008 and has been adopted by the fund. ASC Section 815-10 amends and expands disclosures about derivative instruments and hedging activities. ASC Section 815-10 requires qualitative disclosures about the objectives and strategies of derivative instruments, quantitative disclosures about the fair value amounts of and gains and losses on derivative instruments, and disclosures of credit-risk-related contingent features in hedging activities.
22
| | | | | | |
| Veedot | | | | | |
| |
| Investor Class | | | | | |
| For a Share Outstanding Throughout the Years Ended October 31 | | | |
| | | 2009 | 2008 | 2007 | 2006 | 2005 |
| Per-Share Data | | | | | |
| Net Asset Value, Beginning of Period | $5.34 | $9.25 | $6.17 | $5.57 | $5.06 |
| Income From Investment Operations | | | | | |
| Net Investment Income (Loss)(1) | —(2) | (0.02) | (0.01) | (0.02) | (0.03) |
| Net Realized and Unrealized Gain (Loss) | (0.63) | (3.89) | 3.09 | 0.62 | 0.53 |
| Total From Investment Operations | (0.63) | (3.91) | 3.08 | 0.60 | 0.50 |
| Redemption Fees(1) | —(2) | —(2) | —(2) | —(2) | 0.01 |
| Net Asset Value, End of Period | $4.71 | $5.34 | $9.25 | $6.17 | $5.57 |
| |
| Total Return(3) | (11.80)% | (42.27)% | 49.92% | 10.77% | 10.08% |
| |
| Ratios/Supplemental Data | | | | | |
| Ratio of Operating Expenses | | | | | |
| to Average Net Assets | 1.25% | 1.25% | 1.25% | 1.45% | 1.50% |
| Ratio of Net Investment Income (Loss) | | | | | |
| to Average Net Assets | (0.03)% | (0.27)% | (0.18)% | (0.39)% | (0.51)% |
| Portfolio Turnover Rate | 320% | 257% | 207% | 330% | 399% |
| Net Assets, End of Period (in thousands) | $75,603 | $98,991 | $195,105 | $154,374 | $178,078 |
| (1) | Computed using average shares outstanding throughout the period. | | | | |
| (2) | Per-share amount was less than $0.005. | | | | | |
| (3) | Total return assumes reinvestment of net investment income and capital gains distributions, if any, and does not reflect applicable redemption |
| | fees. The total return of the classes may not precisely reflect the class expense differences because of the impact of calculating the net asset |
| | values to two decimal places. If net asset values were calculated to three decimal places, the total return differences would more closely reflect |
| | the class expense differences. The calculation of net asset values to two decimal places is made in accordance with SEC guidelines and does |
| | not result in any gain or loss of value between one class and another. | | | | |
| |
| |
| See Notes to Financial Statements. | | | | | |
23
| | | | | | |
| Veedot | | | | | |
| |
| Institutional Class | | | | | |
| For a Share Outstanding Throughout the Years Ended October 31 | | | |
| | | 2009 | 2008 | 2007 | 2006 | 2005 |
| Per-Share Data | | | | | |
| Net Asset Value, Beginning of Period | $5.43 | $9.38 | $6.25 | $5.63 | $5.10 |
| Income From Investment Operations | | | | | |
| Net Investment Income (Loss)(1) | 0.01 | (0.01) | —(2) | (0.01) | (0.02) |
| Net Realized and Unrealized Gain (Loss) | (0.65) | (3.94) | 3.13 | 0.63 | 0.54 |
| Total From Investment Operations | (0.64) | (3.95) | 3.13 | 0.62 | 0.52 |
| Redemption Fees(1) | —(2) | —(2) | —(2) | —(2) | 0.01 |
| Net Asset Value, End of Period | $4.79 | $5.43 | $9.38 | $6.25 | $5.63 |
| |
| Total Return(3) | (11.79)% | (42.11)% | 50.08% | 11.01% | 10.39% |
| |
| Ratios/Supplemental Data | | | | | |
| Ratio of Operating Expenses | | | | | |
| to Average Net Assets | 1.05% | 1.05% | 1.05% | 1.25% | 1.30% |
| Ratio of Net Investment Income (Loss) | | | | | |
| to Average Net Assets | 0.17% | (0.07)% | 0.02% | (0.19)% | (0.31)% |
| Portfolio Turnover Rate | 320% | 257% | 207% | 330% | 399% |
| Net Assets, End of Period (in thousands) | $3,089 | $4,864 | $9,188 | $11,237 | $11,440 |
| (1) | Computed using average shares outstanding throughout the period. | | | | |
| (2) | Per-share amount was less than $0.005. | | | | | |
| (3) | Total return assumes reinvestment of net investment income and capital gains distributions, if any, and does not reflect applicable redemption |
| | fees. The total return of the classes may not precisely reflect the class expense differences because of the impact of calculating the net asset |
| | values to two decimal places. If net asset values were calculated to three decimal places, the total return differences would more closely reflect |
| | the class expense differences. The calculation of net asset values to two decimal places is made in accordance with SEC guidelines and does |
| | not result in any gain or loss of value between one class and another. | | | | |
| |
| |
| See Notes to Financial Statements. | | | | | |
24
|
| Report of Independent Registered Public Accounting Firm |
The Board of Directors and Shareholders,
American Century Mutual Funds, Inc.:
We have audited the accompanying statement of assets and liabilities, including the schedule of investments, of Veedot Fund, one of the funds constituting American Century Mutual Funds, Inc. (the “Corporation”), as of October 31, 2009, and the related statement of operations for the year then ended, the statements of changes in net assets for each of the two years in the period then ended, and the financial highlights for each of the five years in the period then ended. These financial statements and financial highlights are the responsibility of the Corporation’s management. Our responsibility is to express an opinion on these financial statements and financial highlights based on our audits.
We conducted our audits in accordance with the standards of the Public Company Accounting Oversight Board (United States). Those standards require that we plan and perform the audit to obtain reasonable assurance about whether the financial statements and financial highlights are free of material misstatement. The Corporation is not required to have, nor were we engaged to perform, an audit of its internal control over financial reporting. Our audits included consideration of internal control over financial reporting as a basis for designing audit procedures that are appropriate in the circumstances, but not for the purpose of expressing an opinion on the effectiveness of the Corporation’s internal control over financial reporting. Accordingly, we express no such opinion. An audit also includes examining, on a test basis, evidence supporting the amounts and disclosures in the financial statements, assessing the accounting principles used and significant estimates made by management, as well as evaluating the overall financial statement presentation. Our procedures included confirmation of securities owned as of October 31, 2009, by correspondence with the custodian and brokers; where replies were not received from brokers, we performed other auditing procedures. We believe that our audits provide a reasonable basis for our opinion.
In our opinion, the financial statements and financial highlights referred to above present fairly, in all material respects, the financial position of Veedot Fund of American Century Mutual Funds, Inc., as of October 31, 2009, the results of its operations for the year then ended, the changes in its net assets for each of the two years in the period then ended, and the financial highlights for each of the five years in the period then ended, in conformity with accounting principles generally accepted in the United States of America.
Deloitte & Touche LLP
Kansas City, Missouri
December 28, 2009
25
The individuals listed below serve as directors or officers of the fund. Each director serves until his or her successor is duly elected and qualified or until he or she retires. Mandatory retirement age for independent directors is 72. Those listed as interested directors are “interested” primarily by virtue of their engagement as directors and/or officers of, or ownership interest in, American Century Companies, Inc. (ACC) or its wholly owned, direct or indirect, subsidiaries, including the fund’s investment advisor, American Century Investment Management, Inc. (ACIM); the fund’s principal underwriter, American Century Investment Services, Inc. (ACIS); and the fund’s transfer agent, American Century Services, LLC (ACS).
The other directors (more than three-fourths of the total number) are independent; that is, they have never been employees, directors or officers of, and have no financial interest in, ACC or any of its wholly owned, direct or indirect, subsidiaries, including ACIM, ACIS and ACS. The directors serve in this capacity for seven registered investment companies in the American Century Investments family of funds.
All persons named as officers of the fund also serve in similar capacities for the other 14 registered investment companies in the American Century Investments family of funds advised by ACIM or American Century Global Investment Management, Inc. (ACGIM), a wholly owned subsidiary of ACIM, unless otherwise noted. Only officers with policy-making functions are listed. No officer is compensated for his or her service as an officer of the fund. The listed officers are interested persons of the fund and are appointed or re-appointed on an annual basis.
Interested Director
Jonathan S. Thomas, 4500 Main Street, Kansas City, MO 64111
Year of Birth: 1963
Position(s) Held with Fund: Director (since 2007) and President (since 2007)
Principal Occupation(s) During Past 5 Years: President and Chief Executive Officer, ACC
(March 2007 to present); Chief Administrative Officer, ACC (February 2006 to
February 2007); Executive Vice President, ACC (November 2005 to February 2007).
Also serves as: President, Chief Executive Officer and Director, ACS; Executive
Vice President, ACIM and ACGIM; Director, ACIM, ACGIM, ACIS and other ACC
subsidiaries. Managing Director, Morgan Stanley (March 2000 to November 2005)
Number of Portfolios in Fund Complex Overseen by Director: 103
Other Directorships Held by Director: None
Independent Directors
Thomas A. Brown, 4500 Main Street, Kansas City, MO 64111
Year of Birth: 1940
Position(s) Held with Fund: Director (since 1980)
Principal Occupation(s) During Past 5 Years: Managing Member, Associated Investments, LLC
(real estate investment company); Managing Member, Brown Cascade Properties,
LLC (real estate investment company); Retired, Area Vice President, Applied
Industrial Technologies (bearings and power transmission company)
Number of Portfolios in Fund Complex Overseen by Director: 63
Other Directorships Held by Director: None
26
Andrea C. Hall, Ph.D., 4500 Main Street, Kansas City, MO 64111
Year of Birth: 1945
Position(s) Held with Fund: Director (since 1997)
Principal Occupation(s) During Past 5 Years: Retired, Advisor to the President, Midwest
Research Institute (not-for-profit, contract research organization)
Number of Portfolios in Fund Complex Overseen by Director: 63
Other Directorships Held by Director: None
James A. Olson, 4500 Main Street, Kansas City, MO 64111
Year of Birth: 1942
Position(s) Held with Fund: Director (since 2007)
Principal Occupation(s) During Past 5 Years: Member, Plaza Belmont LLC (private equity
fund manager); Chief Financial Officer, Plaza Belmont LLC (September 1999 to
September 2006)
Number of Portfolios in Fund Complex Overseen by Director: 63
Other Directorships Held by Director: Saia, Inc. and Entertainment Properties Trust
Donald H. Pratt, 4500 Main Street, Kansas City, MO 64111
Year of Birth: 1937
Position(s) Held with Fund: Director (since 1995) and Chairman of the Board (since 2005)
Principal Occupation(s) During Past 5 Years: Chairman and Chief Executive Officer, Western
Investments, Inc. (real estate company); Retired Chairman of the Board, Butler
Manufacturing Company (metal buildings producer)
Number of Portfolios in Fund Complex Overseen by Director: 63
Other Directorships Held by Director: None
Gale E. Sayers, 4500 Main Street, Kansas City, MO 64111
Year of Birth: 1943
Position(s) Held with Fund: Director (since 2000)
Principal Occupation(s) During Past 5 Years: President, Chief Executive Officer and Founder,
Sayers40, Inc. (technology products and services provider)
Number of Portfolios in Fund Complex Overseen by Director: 63
Other Directorships Held by Director: None
M. Jeannine Strandjord, 4500 Main Street, Kansas City, MO 64111
Year of Birth: 1945
Position(s) Held with Fund: Director (since 1994)
Principal Occupation(s) During Past 5 Years: Retired, formerly Senior Vice President, Sprint
Corporation (telecommunications company)
Number of Portfolios in Fund Complex Overseen by Director: 63
Other Directorships Held by Director: DST Systems, Inc.; Euronet Worldwide, Inc. and
Charming Shoppes, Inc.
John R. Whitten, 4500 Main Street, Kansas City, MO 64111
Year of Birth: 1946
Position(s) Held with Fund: Director (since 2008)
Principal Occupation(s) During Past 5 Years: Project Consultant, Celanese Corp. (industrial
chemical company) (September 2004 to January 2005)
Number of Portfolios in Fund Complex Overseen by Director: 63
Other Directorships Held by Director: Rudolph Technologies, Inc.
27
Officers
Barry Fink, 4500 Main Street, Kansas City, MO 64111
Year of Birth: 1955
Position(s) Held with Fund: Executive Vice President (since 2007)
Principal Occupation(s) During Past 5 Years: Chief Operating Officer and Executive Vice
President, ACC (September 2007 to present); President, ACS (October 2007 to
present); Managing Director, Morgan Stanley (2000 to 2007); Global General
Counsel, Morgan Stanley (2000 to 2006). Also serves as: Director, ACC, ACS, ACIS
and other ACC subsidiaries
Maryanne Roepke, 4500 Main Street, Kansas City, MO 64111
Year of Birth: 1956
Position(s) Held with Fund: Chief Compliance Officer (since 2006) and Senior Vice
President (since 2000)
Principal Occupation(s) During Past 5 Years: Chief Compliance Officer, ACIM, ACGIM and ACS
(August 2006 to present); Assistant Treasurer, ACC (January 1995 to August 2006);
and Treasurer and Chief Financial Officer, various American Century Investments
funds (July 2000 to August 2006). Also serves as: Senior Vice President, ACS
Charles A. Etherington, 4500 Main Street, Kansas City, MO 64111
Year of Birth: 1957
Position(s) Held with Fund: General Counsel (since 2007) and Senior Vice President
(since 2006)
Principal Occupation(s) During Past 5 Years: Attorney, ACC (February 1994 to present); Vice
President, ACC (November 2005 to present); General Counsel, ACC (March 2007
to present). Also serves as: General Counsel, ACIM, ACGIM, ACS, ACIS and other
ACC subsidiaries; and Senior Vice President, ACIM, ACGIM and ACS
Robert Leach, 4500 Main Street, Kansas City, MO 64111
Year of Birth: 1966
Position(s) Held with Fund: Vice President, Treasurer and Chief Financial Officer
(all since 2006)
Principal Occupation(s) During Past 5 Years: Vice President, ACS (February 2000 to present);
and Controller, various American Century Investments funds (1997 to
September 2006)
David H. Reinmiller, 4500 Main Street, Kansas City, MO 64111
Year of Birth: 1963
Position(s) Held with Fund: Vice President (since September 2000)
Principal Occupation(s) During Past 5 Years: Attorney, ACC (January 1994 to present);
Associate General Counsel, ACC (January 2001 to present); Chief Compliance
Officer, American Century Investments funds, ACIM and ACGIM (January 2001 to
February 2005). Also serves as: Associate General Counsel, ACIM, ACGIM, ACS,
ACIS and other ACC subsidiaries; and Vice President, ACIM, ACGIM and ACS
Ward Stauffer, 4500 Main Street, Kansas City, MO 64111
Year of Birth: 1960
Position(s) Held with Fund: Secretary (since February 2005)
Principal Occupation(s) During Past 5 Years: Attorney, ACC (June 2003 to present)
The SAI has additional information about the fund’s directors and is available without charge, upon request, by calling 1-800-345-2021.
28
|
| Approval of Management Agreement |
Under Section 15(c) of the Investment Company Act, contracts for investment advisory services are required to be reviewed, evaluated and approved by a majority of a fund’s independent directors (the “Directors”) each year. At American Century Investments, this process is referred to as the “15(c) Process.” As a part of this process, the board reviews fund performance, shareholder services, audit and compliance information, and a variety of other reports from the advisor concerning fund operations. In addition to this annual review, the board of directors oversees and evaluates on a continuous basis at its quarterly meetings the nature and quality of significant services performed by the advisor, fund performance, audit and compliance information, and a variety of other reports relating to fund operations. The board, or committees of the board, also holds special meetings as needed.
Under a Securities and Exchange Commission rule, each fund is required to disclose in its annual or semiannual report, as appropriate, the material factors and conclusions that formed the basis for the board’s approval or renewal of any advisory agreements within the fund’s most recently completed fiscal half-year period.
Annual Contract Review Process
As part of the annual 15(c) Process undertaken during the most recent fiscal half-year period, the Directors reviewed extensive data and information compiled by the advisor and certain independent providers of evaluative data (the “15(c) Providers”) concerning Veedot (the “Fund”) and the services provided to the Fund under the management agreement. The information considered and the discussions held at the meetings included, but were not limited to:
• the nature, extent and quality of investment management, shareholder services and other services provided to the Fund;
• the wide range of programs and services the advisor provides to the Fund and its shareholders on a routine and non-routine basis;
• the compliance policies, procedures, and regulatory experience of the advisor;
• data comparing the cost of owning the Fund to the cost of owning a similar fund;
• data comparing the Fund’s performance to appropriate benchmarks and/ or a peer group of other mutual funds with similar investment objectives and strategies;
• financial data showing the profitability of the Fund to the advisor and the overall profitability of the advisor;
• data comparing services provided and charges to other investment management clients of the advisor; and
29
• consideration of collateral benefits derived by the advisor from the management of the Fund and any potential economies of scale relating thereto.
In keeping with its practice, the Fund’s board of directors held two in-person meetings and one telephonic meeting to review and discuss the information provided. The board also had the benefit of the advice of its independent counsel throughout the period.
Factors Considered
The Directors considered all of the information provided by the advisor, the 15(c) Providers, and the board’s independent counsel, and evaluated such information for each fund for which the board has responsibility. In connection with their review of the Fund, the Directors did not identify any single factor as being all-important or controlling, and each Director may have attributed different levels of importance to different factors. In deciding to renew the management and subadvisory agreements under the terms ultimately determined by the board to be appropriate, the Directors’ decision was based on the following factors.
Nature, Extent and Quality of Services — Generally. Under the management agreement, the advisor is responsible for providing or arranging for all services necessary for the operation of the Fund. The board noted that under the management agreement, the advisor provides or arranges at its own expense a wide variety of services including:
• Fund construction and design
• portfolio security selection
• initial capitalization/funding
• securities trading
• Fund administration
• custody of Fund assets
• daily valuation of the Fund’s portfolio
• shareholder servicing and transfer agency, including shareholder confirmations, recordkeeping and communications
• legal services
• regulatory and portfolio compliance
• financial reporting
• marketing and distribution
30
The Directors noted that many of the services provided by the advisor have expanded over time both in terms of quantity and complexity in response to shareholder demands, competition in the industry and the changing regulatory environment. They discussed with the advisor the challenges presented by these changes and the impact on the Fund. In performing their evaluation, the Directors considered information received in connection with the annual review, as well as information provided on an ongoing basis at their regularly scheduled board and committee meetings.
Investment Management Services. The nature of the investment management services provided to the Fund is quite complex and allows Fund shareholders access to professional money management, instant diversification of their investments, and liquidity. In evaluating investment performance, the board expects the advisor to manage the Fund in accordance with its investment objectives and approved strategies. Further, the Directors recognize that the advisor has an obligation to monitor trading activities, and in particular to seek the best execution of fund trades, and to evaluate the use of and payment for research. In providing these services, the advisor utilizes teams of investment professionals (portfolio managers, analysts, research assistants, and securities traders) who require extensive information technology, research, training, compl iance and other systems to conduct their business. At each quarterly meeting the Directors review investment performance information for the Fund, together with comparative information for appropriate benchmarks and/or peer groups of funds managed similarly to the Fund. The Directors also review detailed performance information during the 15(c) Process comparing the Fund’s performance with that of similar funds not managed by the advisor. If performance concerns are identified, the Directors discuss with the advisor the reasons for such results (e.g., market conditions, security selection) and any efforts being undertaken to improve performance. The Fund’s performance was above the median for its peer group for the three-year period and below the median for the one-year period. The board discussed the fund’s performance with the advisor and was satisfied with the efforts being undertaken by the advisor. The board will continue to monitor these efforts and the performance of the Fund. More deta iled information about the Fund’s performance can be found in the Performance and Portfolio Commentary sections of this report.
Shareholder and Other Services. The advisor provides the Fund with a comprehensive package of transfer agency, shareholder, and other services. The Directors review reports and evaluations of such services at their regular quarterly meetings, including the annual meeting concerning contract review, and reports to the board. These reports include, but are not limited to, information regarding the operational efficiency and accuracy of the shareholder and transfer agency services provided, staffing levels, shareholder satisfaction (as measured by external as well as internal sources), technology support, new products and services offered to Fund shareholders, securities trading activities, portfolio valuation services, auditing services, and legal and operational compliance activities. Certain aspects of shareholder and transfer agency servi ce level efficiency and the quality of securities trading activities are measured by independent third party providers and are presented in comparison to other fund groups not managed by the advisor.
31
Costs of Services Provided and Profitability. The advisor provides detailed information concerning its cost of providing various services to the Fund, its profitability in managing the Fund, its overall profitability, and its financial condition. The Directors have reviewed with the advisor the methodology used to prepare this financial information. This financial information regarding the advisor is considered in order to evaluate the advisor’s financial condition, its ability to continue to provide services under the management agreement, and the reasonableness of the current management fee. The board concluded that the advisor’s profits were reasonable in light of the services provided to the Fund.
Ethics. The Directors generally consider the advisor’s commitment to providing quality services to shareholders and to conducting its business ethically. They noted that the advisor’s practices generally meet or exceed industry best practices.
Economies of Scale. The Directors review information provided by the advisor regarding the possible existence of economies of scale in connection with the management of the Fund. The Directors concluded that economies of scale are difficult to measure and predict with precision, especially on a fund-by-fund basis. The analysis of economies of scale is further complicated by the additional services and content provided by the advisor and its reinvestment in its ability to provide and expand those services. Accordingly, the Directors seek to evaluate economies of scale by reviewing other information, such as year-over-year profitability of the advisor generally, the profitability of its management of the Fund specifically, the expenses incurred by the advisor in providing various functions to the Fund, and the fees of competitive funds not m anaged by the advisor. The Directors believe the advisor is appropriately sharing economies of scale through its competitive fee structure, fee breakpoints as the Fund increases in size, and through reinvestment in its business to provide shareholders additional content and services.
Comparison to Other Funds’ Fees. The Fund pays the advisor a single, all-inclusive (or unified) management fee for providing all services necessary for the management and operation of the Fund, other than brokerage expenses, taxes, interest, extraordinary expenses, and the fees and expenses of the Fund’s independent directors (including their independent legal counsel). Under the unified fee structure, the advisor is responsible for providing all investment advisory, custody, audit, administrative, compliance, record-keeping, marketing and shareholder services, or arranging and supervising third parties to provide such services. By contrast, most other funds are charged a variety of fees, including an investment advisory fee, a transfer agency fee, an administrative fee, distribution charges and other expenses. Other than their i nvestment advisory fees and Rule 12b-1 distribution fees, all other components of the total fees charged by these other funds may be increased without shareholder approval. The board believes the unified fee structure is a benefit to Fund shareholders because it clearly discloses to shareholders the cost of owning Fund shares, and, since the unified fee cannot be increased without a vote of Fund shareholders, it shifts to the advisor the risk of increased costs of operating the Fund and provides a
32
direct incentive to minimize administrative inefficiencies. Part of the Directors’ analysis of fee levels involves reviewing certain evaluative data compiled by a 15(c) Provider comparing the Fund’s unified fee to the total expense ratio of other funds in the Fund’s peer group and performing a regression analysis to evaluate the effect of fee breakpoints as assets under management increase. The unified fee charged to shareholders of the Fund was near the median of the total expense ratios of its peer group. In addition, the Directors also reviewed updated fee level data provided by the advisor, but recognized that comparative data was particularly difficult to evaluate given the significant market developments during the past year. The board concluded that the management fee paid by the Fund to the advisor was reasonable in light of the services provided to the Fund.
Comparison to Fees and Services Provided to Other Clients of the Advisor. The Directors also requested and received information from the advisor concerning the nature of the services, fees, and profitability of its advisory services to advisory clients other than the Fund. They observed that these varying types of client accounts require different services and involve different regulatory and entrepreneurial risks than the management of the Fund. The Directors analyzed this information and concluded that the fees charged and services provided to the Fund were reasonable by comparison.
Collateral Benefits Derived by the Advisor. The Directors considered the existence of collateral benefits the advisor may receive as a result of its relationship with the Fund. They concluded that the advisor’s primary business is managing mutual funds and it generally does not use fund or shareholder information to generate profits in other lines of business, and therefore does not derive any significant collateral benefits from them. The Directors noted that the advisor receives proprietary research from broker-dealers that execute fund portfolio transactions and concluded that this research is likely to benefit fund shareholders. The Directors also determined that the advisor is able to provide investment management services to certain clients other than the Fund, at least in part, due to its existing infrastructure built to serve the fund complex. The Directors concluded, however, that the assets of those other clients are not material to the analysis and, in any event, are included with the assets of the Fund to determine breakpoints in the Fund’s fee schedule, provided they are managed using the same investment team and strategy.
Conclusions of the Directors
As a result of this process, the board, including all of the independent directors, in the absence of particular circumstances and assisted by the advice of legal counsel that is independent of the advisor, taking into account all of the factors discussed above and the information provided by the advisor concluded that the investment management agreement between the Fund and the advisor is fair and reasonable in light of the services provided and should be renewed.
33
Retirement Account Information
As required by law, distributions you receive from certain IRAs, or 403(b), 457 and qualified plans are subject to federal income tax withholding, unless you elect not to have withholding apply. Tax will be withheld on the total amount withdrawn even though you may be receiving amounts that are not subject to withholding, such as nondeductible contributions. In such case, excess amounts of withholding could occur. You may adjust your withholding election so that a greater or lesser amount will be withheld.
If you don’t want us to withhold on this amount, you must notify us to not withhold the federal income tax. You may notify us in writing or in certain situations by telephone or through other electronic means. You have the right to revoke your withholding election at any time and any election you make may remain in effect until revoked by filing a new election.
Remember, even if you elect not to have income tax withheld, you are liable for paying income tax on the taxable portion of your withdrawal. If you elect not to have income tax withheld or you don’t have enough income tax withheld, you may be responsible for payment of estimated tax. You may incur penalties under the estimated tax rules if your withholding and estimated tax payments are not sufficient. You can reduce or defer the income tax on a distribution by directly or indirectly rolling such distribution over to another IRA or eligible plan. You should consult your tax advisor for additional information.
State tax will be withheld if, at the time of your distribution, your address is within one of the mandatory withholding states and you have federal income tax withheld. State taxes will be withheld from your distribution in accordance with the respective state rules.
Proxy Voting Guidelines
American Century Investment Management, Inc., the fund’s investment advisor, is responsible for exercising the voting rights associated with the securities purchased and/or held by the fund. A description of the policies and procedures the advisor uses in fulfilling this responsibility is available without charge, upon request, by calling 1-800-345-2021. It is also available on American Century Investments’ website at americancentury.com and on the Securities and Exchange Commission’s website at sec.gov. Information regarding how the investment advisor voted proxies relating to portfolio securities during the most recent 12-month period ended June 30 is available on the “About Us” page at americancentury.com. It is also available at sec.gov.
Quarterly Portfolio Disclosure
The fund files its complete schedule of portfolio holdings with the Securities and Exchange Commission (SEC) for the first and third quarters of each fiscal year on Form N-Q. The fund’s Form N-Q is available on the SEC’s website at sec.gov, and may be reviewed and copied at the SEC’s Public Reference Room in Washington, DC. Information on the operation of the Public Reference Room may be obtained by calling 1-800-SEC-0330. The fund also makes its complete schedule of portfolio holdings for the most recent quarter of its fiscal year available on its website at americancentury.com and, upon request, by calling 1-800-345-2021.
34
The following indices are used to illustrate investment market, sector, or style performance or to serve as fund performance comparisons. They are not investment products available for purchase.
The Russell 1000® Index is a market-capitalization weighted, large-cap index created by Frank Russell Company to measure the performance of the 1,000 largest publicly traded U.S. companies, based on total market capitalization.
The Russell 1000® Growth Index measures the performance of those Russell 1000 Index companies (the 1,000 largest publicly traded U.S. companies, based on total market capitalization) with higher price-to-book ratios and higher forecasted growth values.
The Russell 1000® Value Index measures the performance of those Russell 1000 Index companies (the 1,000 largest publicly traded U.S. companies, based on total market capitalization) with lower price-to-book ratios and lower forecasted growth values.
The Russell 2000® Index is a market-capitalization weighted index created by Frank Russell Company to measure the performance of the 2,000 smallest of the 3,000 largest publicly traded U.S. companies, based on total market capitalization.
The Russell 2000® Growth Index measures the performance of those Russell 2000 Index companies (the 2,000 smallest of the 3,000 largest publicly traded U.S. companies, based on total market capitalization) with higher price-to-book ratios and higher forecasted growth values.
The Russell 2000® Value Index measures the performance of those Russell 2000 Index companies (the 2,000 smallest of the 3,000 largest publicly traded U.S. companies, based on total market capitalization) with lower price-to-book ratios and lower forecasted growth values.
The Russell 3000® Index measures the performance of the 3,000 largest U.S. companies based on total market capitalization, which represents approximately 98% of the investable U.S. equity market.
The Russell Midcap® Index measures the performance of the 800 smallest of the 1,000 largest publicly traded U.S. companies, based on total market capitalization.
The Russell Midcap® Growth Index measures the performance of those Russell Midcap Index companies (the 800 smallest of the 1,000 largest publicly traded U.S. companies, based on total market capitalization) with higher price-to-book ratios and higher forecasted growth values.
The Russell Midcap® Value Index measures the performance of those Russell Midcap Index companies (the 800 smallest of the 1,000 largest publicly traded U.S. companies, based on total market capitalization) with lower price-to-book ratios and lower forecasted growth values.
35
36

| |
| |
| Contact Us | |
| americancentury.com | |
| Automated Information Line | 1-800-345-8765 |
| Investor Services Representative | 1-800-345-2021 or |
| | 816-531-5575 |
| Business, Not-For-Profit, Employer-Sponsored | |
| Retirement Plans | 1-800-345-3533 |
| Banks and Trust Companies, Broker-Dealers, | |
| Financial Professionals, Insurance Companies | 1-800-345-6488 |
| Telecommunications Device for the Deaf | 1-800-634-4113 |
| American Century Mutual Funds, Inc. | |
| Investment Advisor: | |
| American Century Investment Management, Inc. | |
| Kansas City, Missouri | |
This report and the statements it contains are submitted for the general information of our shareholders. The report is not authorized for distribution to prospective investors unless preceded or accompanied by an effective prospectus.
American Century Investment Services, Inc., Distributor
©2009 American Century Proprietary Holdings, Inc. All rights reserved.
0912
CL-ANN-67035S
|
| Annual Report |
| October 31, 2009 |

|
| American Century Investments |
NT Growth Fund
NT VistaSM Fund
| |
| President’s Letter | 2 |
| Independent Chairman’s Letter | 3 |
| Market Perspective | 4 |
| U.S. Stock Index Returns | 4 |
| |
| NT Growth | |
| |
| Performance | 5 |
| Portfolio Commentary | 7 |
| Top Ten Holdings | 9 |
| Top Five Industries | 9 |
| Types of Investments in Portfolio | 9 |
| |
| NT Vista | |
| |
| Performance | 10 |
| Portfolio Commentary | 12 |
| Top Ten Holdings | 14 |
| Top Five Industries | 14 |
| Types of Investments in Portfolio | 14 |
| |
| Shareholder Fee Examples | 15 |
| |
| Financial Statements | |
| |
| Schedule of Investments | 17 |
| Statement of Assets and Liabilities | 23 |
| Statement of Operations | 24 |
| Statement of Changes in Net Assets | 25 |
| Notes to Financial Statements | 26 |
| Financial Highlights | 33 |
| Report of Independent Registered Public Accounting Firm | 35 |
| |
| Other Information | |
| |
| Management | 36 |
| Approval of Management Agreements | 39 |
| Additional Information | 44 |
| Index Definitions | 45 |
The opinions expressed in the Market Perspective and each of the Portfolio Commentaries reflect those of the portfolio management team as of the date of the report, and do not necessarily represent the opinions of American Century Investments or any other person in the American Century Investments organization. Any such opinions are subject to change at any time based upon market or other conditions and American Century Investments disclaims any responsibility to update such opinions. These opinions may not be relied upon as investment advice and, because investment decisions made by American Century Investments funds are based on numerous factors, may not be relied upon as an indication of trading intent on behalf of any American Century Investments fund. Security examples are used for representational purposes only and are not intended as recommendations to purchase or sell securities. Performance information for com parative indices and securities is provided to American Century Investments by third party vendors. To the best of American Century Investments’ knowledge, such information is accurate at the time of printing.

Dear Investor:
Thank you for taking time to review the following pages, which provide the performance of your investment along with the perspectives of our experienced portfolio management team for the financial reporting period ended October 31, 2009. We appreciate your trust in American Century Investments® at this volatile, transitional time in the economy and investment markets.
As the upheavals associated with the “Great Recession” gradually subside, our senior management team has put considerable thought into how the investment environment has changed and what new challenges and opportunities await us. Critical factors that we are anticipating in the coming year include marked shifts in investment and spending behavior, along with consolidation in our industry.
Most importantly, we think the economic recovery will be slow and extended. The economy and capital markets have come a long way since Lehman Brothers collapsed in the third quarter of 2008, but 2010 will likely bring continuing challenges. The stock market’s rebound since last March and the third-quarter economic surge in 2009 were fueled largely by corporate cost-cutting and unprecedented monetary and fiscal stimulus, including some key programs that have since expired or been scaled back.
Meanwhile, the resilient but struggling consumer sector still faces double-digit unemployment, heavy debt burdens, tight credit conditions, and a housing market that is starting to stabilize, but remains vulnerable. Much of our investment positioning in 2009 cautiously reflected these still unstable economic fundamentals, leading to underperformance, in some cases, versus market benchmarks buoyed by the rally of riskier assets. We still support our fundamentally based positioning because we believe strongly that some markets—driven more by technical factors than fundamentals—have advanced further than underlying economic conditions warrant, and remain susceptible to the possibility of more volatility ahead.
Thank you for your continued confidence in us.
Sincerely,

Jonathan Thomas
President and Chief Executive Officer
American Century Investments
2
|
| Independent Chairman’s Letter |

In my first letter to shareholders of the American Century Investments funds, I invited you to contact me with your questions. I have been gratified with your response. Most shareholder inquiries to date have related to specific fund performance issues. As I noted in my individual responses, your board through the Fund Performance Committee continues to stress improved performance in our quarterly meetings with chief investment officers and fund managers.
An important part of our fund performance review process is a face-to-face meeting with portfolio managers. The board traveled during the second quarter to the American Century Investments office in Mountain View, California to meet with the fund of funds and asset allocation portfolio management teams. These meetings validated the importance of thorough reviews of investment opportunities by the credit management personnel resident in that office. As a result of their efforts, American Century Investments funds were able to avoid the “toxic assets” that plagued many other fund families in 2008.
From April through June 2009, the board conducted its annual review of the advisory contracts between American Century Investments and each fund. Our efforts involved a review of fund information, including assets under management; total expense ratio compared to peers; economies of scale; fee breakpoints that reduce shareholder costs as assets increase; performance compared to peers and benchmarks; and the quality of services provided to fund shareholders. A detailed discussion of board considerations in connection with advisory contract renewal is included annually in each fund’s shareholder reports. During this review, the board focuses on a detailed comparison of the competitive position of each fund and has negotiated more than 60 breakpoints or fee reductions in the past five years.
The board looks forward to another year of work on your behalf and your comments are appreciated. You are invited to email me at dhpratt@fundboardchair.com.

3

By Enrique Chang — Chief Investment Officer, American Century Investments (far left) and Greg Woodhams — Chief Investment Officer, U.S. Growth Equity — Large Cap
Signs of Economic Recovery Boosted Stocks
The year ended October 31, 2009, was a period of extremes for the U.S. stock market. The market began the period in the midst of a historically steep decline, then finished the period with one of its strongest rallies since the 1930s. The market’s dramatic swings resulted from rapidly shifting expectations regarding the economic and financial environment.
Stocks fell sharply in late 2008 and early 2009 as investors grew increasingly concerned about a deep economic downturn and a lack of liquidity in the credit markets. In response, the federal government took unprecedented actions to shore up the credit sector, support the housing market, and revive the stalled economy.
These efforts began to bear fruit in the spring of 2009 as signs of economic stabilization emerged. Although the unemployment rate continued to climb, reaching a 26-year high of 10.2% by October, the broader economy showed evidence of improvement, producing real growth in the third quarter of 2009—the first positive quarterly growth in more than a year. In addition, cost-management efforts at many companies helped generate better-than-expected earnings in the second and third quarters.
As a result, the equity market reached a multi-year low on March 9 and then reversed course, rising steadily throughout the last seven months of the period. The rally helped erase the market’s earlier losses, enabling the major stock indexes to produce gains of approximately 10% overall. Growth stocks outperformed value shares by a wide margin (see the table below) across all market capitalizations, though they lagged modestly over the last six months.
Economic Challenges Remain
Although recent economic trends have been encouraging, the recovery will likely be gradual until there is sustained improvement in the delinquency levels of consumer debt and the unemployment rate. Thus far, the U.S. consumer has been conspicuously absent from the recovery, and given the weakness in the U.S. dollar and improving economic conditions elsewhere in the world, we may see an export-led recovery until the consumer gets back on firmer footing.
| | | | |
| U.S. Stock Index Returns | | | | |
| For the 12 months ended October 31, 2009 | | | |
| Russell 1000 Index (Large-Cap) | 11.20% | | Russell 2000 Index (Small-Cap) | 6.46% |
| Russell 1000 Growth Index | 17.51% | | Russell 2000 Growth Index | 11.34% |
| Russell 1000 Value Index | 4.78% | | Russell 2000 Value Index | 1.96% |
| Russell Midcap Index | 18.75% | | | |
| Russell Midcap Growth Index | 22.48% | | | |
| Russell Midcap Value Index | 14.52% | | | |
4
| | | |
| NT Growth | | | |
| |
| Total Returns as of October 31, 2009 | | | |
| | | Average | |
| | | Annual Returns | |
| | | Since | Inception |
| | 1 year | Inception | Date |
| Institutional Class | 15.88% | -0.23% | 5/12/06 |
| Russell 1000 Growth Index | 17.51% | -2.07% | — |
Data presented reflect past performance. Past performance is no guarantee of future results. Current performance may be higher or lower than the performance shown. Investment return and principal value will fluctuate, and redemption value may be more or less than original cost. To obtain performance data current to the most recent month end, please call 1-800-345-2021 or visit americancentury.com.
Data assumes reinvestment of dividends and capital gains, and none of the charts reflect the deduction of taxes that a shareholder would pay on fund distributions or the redemption of fund shares. Returns for the index are provided for comparison. The fund’s total returns include operating expenses (such as transaction costs and management fees) that reduce returns, while the total returns of the index do not.
5
NT Growth
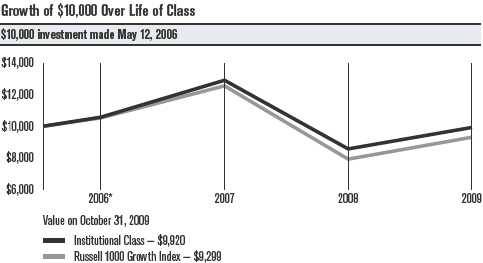
| | | | | |
| One-Year Returns Over Life of Class | | | |
| Periods ended October 31 | | | | |
| | | 2006* | 2007 | 2008 | 2009 |
| Institutional Class | | 5.70% | 22.12% | -33.68% | 15.88% |
| Russell 1000 Growth Index | 5.28% | 19.23% | -36.95% | 17.51% |
| *From 5/12/06, the Institutional Class’s inception date. Not annualized. | | | |
| | | | | |
| Total Annual Fund Operating Expenses | | | |
| Institutional Class | 0.81% | | | | |
The total annual fund operating expenses shown is as stated in the fund’s prospectus current as of the date of this report. The prospectus may vary from the expense ratio shown elsewhere in this report because it is based on a different time period, includes acquired fund fees and expenses, and, if applicable, does not include fee waivers or expense reimbursements.
Data presented reflect past performance. Past performance is no guarantee of future results. Current performance may be higher or lower than the performance shown. Investment return and principal value will fluctuate, and redemption value may be more or less than original cost. To obtain performance data current to the most recent month end, please call 1-800-345-2021 or visit americancentury.com.
Data assumes reinvestment of dividends and capital gains, and none of the charts reflect the deduction of taxes that a shareholder would pay on fund distributions or the redemption of fund shares. Returns for the index are provided for comparison. The fund’s total returns include operating expenses (such as transaction costs and management fees) that reduce returns, while the total returns of the index do not.
6
NT Growth
Portfolio Managers: Greg Woodhams and Prescott LeGard
Performance Summary
NT Growth gained 15.88% in the 12 months ended October 31, 2009. By comparison, the Russell 1000 Growth Index (the fund’s benchmark) returned 17.51%. However, the portfolio continues to outperform its benchmark in the period since its May 12, 2006, inception (see pages 5 and 6).
The portfolio enjoyed double-digit returns during a remarkable period that included the depths of the credit crisis and subsequent rebound by financial markets (see the Market Perspective on page 4). In terms of absolute returns, holdings in the information technology sector contributed most; no sector detracted from absolute performance. Relative to its benchmark, positioning in the energy sector hurt most, while consumer discretionary shares were the leading contributors for the 12 months.
Energy Shares Detracted Most
Energy shares were the leading detractors from relative performance, as it hurt to be underweight oil services stocks during the first half of the fiscal year. Oil services companies outperformed the exploration and production companies we favored during that time. The largest single detractor from relative results was Devon Energy, which was hurt by declining prices for natural gas. We eliminated the position. In addition, it hurt to be under-represented in shares of Exxon Mobil early in the fiscal year. In the energy equipment and services industry segment, the leading detractor was oil rig operator Transocean, which underperformed because of slack demand for its deep-ocean rigs.
Other Detractors
In information technology, positioning among IT services companies detracted most from performance. The leading detractor was Global Payments, whose earnings were hurt by difficult macroeconomic conditions and negative currency effects. Exposure to consumer credit firm Visa and game maker Activision Blizzard also detracted from relative results. In addition, it hurt to be underrepresented in shares of IBM, Cognizant Technology Solutions, and Adobe Systems.
Stock selection and an underweight position meant materials shares also detracted. Chemical firm Mosaic was the leading detractor in the sector. Positioning in the health care sector also hurt relative performance, led by holdings in the pharmaceutical and health care equipment industries. In general, performance in the sector reflected a trend evident across the market—the higher-beta, higher-volatility shares that underperformed in 2008 and early 2009 generally did best in the rally since March. Higher-quality, lower-beta securities—including many in the health care sector—did not participate fully in the rebound. The leading individual detractors in this space were pharmaceutical companies Schering-Plough—which was acquired at a premium and to which the portfolio had no exposure—and Abbott Laboratories.
7
NT Growth
Key Contributors
The largest contribution to relative return by far came from stock choices among consumer discretionary shares. Specialty retailer J. Crew Group was the number-one contributor to relative results for the year, thanks to good sales trends and margin control. Mid-price retailer Kohl’s was another key contributor after demonstrating stronger same-store sales and margins in recent quarters. Auto component manufacturer BorgWarner also helped relative results. The NT Growth management team added to this position late in 2008 when the stock underperformed. That helped performance in 2009, as the shares benefited from a return of investor focus to the growing demand for more fuel-efficient, cleaner-burning engines. Among other notable contributors in the sector were CarMax, Advance Auto Parts, and O’Reilly Automotive.
The portfolio also benefited from a number of holdings in the industrial sector. Valmont Industries was the key contributor in this space, driven by strong demand for its products relating to cellular towers, power poles, and mechanized irrigation systems. Commercial truck manufacturer Navistar International was another source of strength, as these economically sensitive shares benefited from signs of economic stability in 2009.
Other stocks making significant contributions to relative return were multinational semiconductor firm Marvell Technology Group and chemicals and materials firm Celanese. Marvell benefited from better pricing for its computer chips. Celanese enjoyed cost advantages over its competitors and provided a more favorable outlook than expected.
Outlook
Despite the volatile investment climate of recent years, the portfolio managers continue to work to consistently execute their disciplined process. They recognize that each environment presents its own unique challenges; nevertheless, their emphasis on stock selection as the principal generator of alpha (excess return above a market benchmark) and focus on risk management remain constant.
As a result, the portfolio’s sector and industry selection as well as capitalization range allocations are primarily a result of identifying what the managers believe to be superior individual securities. As of October 31, 2009, they found opportunity in the consumer discretionary, health care, and financials sectors, the portfolio’s largest overweight positions. The most notable sector underweights were in industrial and material shares.
8
| | |
| NT Growth | | |
| |
| Top Ten Holdings as of October 31, 2009 | | |
| | % of net assets | % of net assets |
| | as of 10/31/09 | as of 4/30/09 |
| Microsoft Corp. | 4.6% | 3.7% |
| Google, Inc., Class A | 3.8% | 2.8% |
| Apple, Inc. | 3.5% | 2.7% |
| Abbott Laboratories | 2.9% | 2.1% |
| Coca-Cola Co. (The) | 2.7% | 2.5% |
| Cisco Systems, Inc. | 2.6% | 2.0% |
| PepsiCo, Inc. | 2.6% | 1.6% |
| Procter & Gamble Co. (The) | 2.3% | 1.3% |
| Express Scripts, Inc. | 2.0% | 1.4% |
| Amgen, Inc. | 1.9% | 0.5% |
| |
| Top Five Industries as of October 31, 2009 | | |
| | % of net assets | % of net assets |
| | as of 10/31/09 | as of 4/30/09 |
| Computers & Peripherals | 9.7% | 5.9% |
| Software | 7.5% | 6.9% |
| Communications Equipment | 5.9% | 5.7% |
| Pharmaceuticals | 5.3% | 2.6% |
| Beverages | 5.3% | 4.1% |
| |
| Types of Investments in Portfolio | | |
| | % of net assets | % of net assets |
| | as of 10/31/09 | as of 4/30/09 |
| Common Stocks | 97.8% | 99.7% |
| Temporary Cash Investments | 1.5% | 0.6% |
| Other Assets and Liabilities | 0.7% | (0.3)% |
9
| | | |
| NT Vista | | | |
| |
| Total Returns as of October 31, 2009 | | | |
| | | Average | |
| | | Annual Returns | |
| | | Since | Inception |
| | 1 year | Inception | Date |
| Institutional Class | -1.71% | -7.92% | 5/12/06 |
| Russell Midcap Growth Index | 22.48% | -4.65% | — |
Data presented reflect past performance. Past performance is no guarantee of future results. Current performance may be higher or lower than the performance shown. Investment return and principal value will fluctuate, and redemption value may be more or less than original cost. To obtain performance data current to the most recent month end, please call 1-800-345-2021 or visit americancentury.com. International investing involves special risks, such as political instability and currency fluctuations.
Data assumes reinvestment of dividends and capital gains, and none of the charts reflect the deduction of taxes that a shareholder would pay on fund distributions or the redemption of fund shares. Returns for the index are provided for comparison. The fund’s total returns include operating expenses (such as transaction costs and management fees) that reduce returns, while the total returns of the index do not.
10
NT Vista
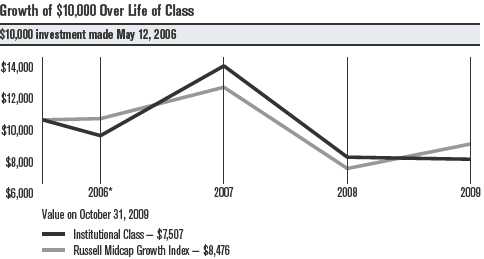
| | | | | |
| One-Year Returns Over Life of Class | | | |
| Periods ended October 31 | | | | |
| | | 2006* | 2007 | 2008 | 2009 |
| Institutional Class | | -10.00% | 49.11% | -43.09% | -1.71% |
| Russell Midcap Growth Index | 0.79% | 19.72% | -42.65% | 22.48% |
| *From 5/12/06, the Institutional Class’s inception date. Not annualized. | | | |
| | | | | |
| Total Annual Fund Operating Expenses | | | |
| Institutional Class | 0.81% | | | | |
The total annual fund operating expenses shown is as stated in the fund’s prospectus current as of the date of this report. The prospectus may vary from the expense ratio shown elsewhere in this report because it is based on a different time period, includes acquired fund fees and expenses, and, if applicable, does not include fee waivers or expense reimbursements.
Data presented reflect past performance. Past performance is no guarantee of future results. Current performance may be higher or lower than the performance shown. Investment return and principal value will fluctuate, and redemption value may be more or less than original cost. To obtain performance data current to the most recent month end, please call 1-800-345-2021 or visit americancentury.com. International investing involves special risks, such as political instability and currency fluctuations.
Data assumes reinvestment of dividends and capital gains, and none of the charts reflect the deduction of taxes that a.shareholder would pay on fund distributions or the redemption of fund shares. Returns for the index are provided for comparison. The fund’s total returns include operating expenses (such as transaction costs and management fees) that reduce returns, while the total returns of the index do not.
11
NT Vista
Portfolio Manager: Brad Eixmann
In September 2009, portfolio manager Glenn Fogle took a personal leave of absence from American Century Investments. Brad Eixmann continues as manager for NT Vista.
Performance Summary
NT Vista declined 1.71% for the 12 months ended October 31, 2009, underperforming the 22.48% return of its benchmark, the Russell Midcap Growth Index.
As discussed in the Market Perspective on page 4, equity markets continued to struggle during the first half of the reporting period amid extreme volatility and recession. After dipping to multi-year lows on March 9, 2009, markets responded positively to generally improving economic data and rallied soundly, erasing losses sustained early in the reporting period. Stocks that exhibit accelerating growth and improving price momentum, the two main factors that the NT Vista team looks for in portfolio holdings, suffered historic losses during this rally. On the other hand, lower-quality stocks that were the laggards in previous reporting periods led market strength.
Within the portfolio, security selection in the consumer discretionary and industrials sectors accounted for the majority of underperformance relative to the benchmark. Holdings in the information technology, financials, and health care sectors further detracted from relative returns.
Consumer Discretionary Detracted, but Some Holdings Contributed
Stock selection in the consumer discretionary sector detracted from absolute and relative performance. Within the sector, NT Vista held a number of detrimental positions within the specialty retail and discount retail industry groups. Discount chain Family Dollar Stores, Inc. had benefited from the weak economy causing consumers to trade down in their buying habits, and investors had viewed that stock and similar ones as safe havens during the downturn. As investors’ appetite for risk increased, however, these types of securities were abandoned in favor of more aggressive stocks despite generally positive continued fundamentals.
Also in the consumer discretionary sector, an overweight position in private education company ITT Educational Services added positively to both absolute and relative performance. The company benefited from expanding student enrollments as a result of corporate layoffs and fewer job opportunities. ITT was NT Vista’s largest contributor to relative returns for the reporting period.
Industrials, Information Technology Underperformed, but Some Holdings Helped
The industrials sector was a key source of underperformance relative to NT Vista’s benchmark. An overweight allocation to the construction and engineering industry reflected a focus on AECOM Technology Corp. Although the company is a likely beneficiary of infrastructure buildout
12
NT Vista
initiatives under the Obama administration, its stock price has been hindered by lower energy prices and uncertainty about the timing and magnitude of demand for its services.
Holdings in the electrical equipment industry also trimmed returns. In this group, the portfolio held companies involved with alternative energy, including China-based Suntech Power, that have been some of the largest beneficiaries of increasing demand in the past. During the reporting period, though, these holdings collectively declined amid lower energy prices, slower demand, and falling product prices.
Elsewhere in the industrials sector, NT Vista benefited from solid stock selection in the machinery industry through its exposure to mining equipment company Bucyrus International. As the economies of China and other emerging markets have rebounded this year and commodity prices have risen, this company has seen an improvement in orders for machinery used to mine coal, copper, oil sands, and iron ore.
The information technology sector also weighed on relative performance, although NT Vista derived absolute gains from the sector. Within the sector, an overweight allocation and poor stock selection in the semiconductor group detracted meaningfully from relative returns.
Financials, Health Care Hurt
In the financials sector, overweight holding Fidelity National detracted significantly from absolute and relative returns. The title insurance company, which benefited from increased mortgage refinance activity as a result of lower mortgage rates, posted gains for the entire reporting period but declined while it was held in the portfolio.
The health care sector was also home to underperforming holdings. Within the sector, stakes in pharmaceutical companies and health care providers weighed on absolute and relative returns. In particular, a position in UnitedHealth Group, which is not a constituent of the benchmark, hurt returns as its share price declined in the portfolio.
Outlook
Our investment process focuses on medium-sized and smaller companies with accelerating earnings growth rates and share-price momentum. We believe that active investing in such companies will generate outperformance over time compared with the Russell Midcap Growth Index.
Despite the challenging market environment, the NT Vista team has identified three areas of opportunity moving forward: industry groups that we believe will benefit from a rebound in economic activity; companies that are experiencing diminished competition as a result of the economic environment; and companies with unique products or services. As always, we will rely on our process of identifying companies with accelerating growth and price momentum and currently see a significant number of companies demonstrating such characteristics.
13
| | |
| NT Vista | | |
| |
| Top Ten Holdings as of October 31, 2009 | | |
| | % of net assets | % of net assets |
| | as of 10/31/09 | as of 4/30/09 |
| SBA Communications Corp., Class A | 2.9% | 3.2% |
| Jefferies Group, Inc. | 2.4% | 0.5% |
| Life Technologies Corp. | 2.2% | — |
| Express Scripts, Inc. | 2.2% | 1.6% |
| Lazard Ltd., Class A | 2.2% | 0.6% |
| Legg Mason, Inc. | 2.0% | — |
| Petrohawk Energy Corp. | 2.0% | 2.2% |
| ASML Holding NV New York Shares | 1.9% | 0.5% |
| Walter Energy, Inc. | 1.8% | — |
| Bucyrus International, Inc. | 1.8% | — |
| |
| Top Five Industries as of October 31, 2009 | | |
| | % of net assets | % of net assets |
| | as of 10/31/09 | as of 4/30/09 |
| Semiconductors & Semiconductor Equipment | 10.7% | 7.5% |
| Capital Markets | 9.3% | 3.5% |
| Hotels, Restaurants & Leisure | 5.6% | 3.8% |
| Health Care Providers & Services | 5.3% | 5.3% |
| Specialty Retail | 5.3% | 7.4% |
| |
| Types of Investments in Portfolio | | |
| | % of net assets | % of net assets |
| | as of 10/31/09 | as of 4/30/09 |
| Domestic Common Stocks | 83.3% | 86.7% |
| Foreign Common Stocks(1) | 13.6% | 10.3% |
| Total Common Stocks | 96.9% | 97.0% |
| Temporary Cash Investments | 4.1% | 1.9% |
| Other Assets and Liabilities | (1.0)% | 1.1% |
| (1) Includes depositary shares, dual listed securities and foreign ordinary shares. | | |
14
|
| Shareholder Fee Examples (Unaudited) |
Fund shareholders may incur two types of costs: (1) transaction costs, including sales charges (loads) on purchase payments and redemption/ exchange fees; and (2) ongoing costs, including management fees; distribution and service (12b-1) fees; and other fund expenses. This example is intended to help you understand your ongoing costs (in dollars) of investing in your fund and to compare these costs with the ongoing cost of investing in other mutual funds.
The example is based on an investment of $1,000 made at the beginning of the period and held for the entire period from May 1, 2009 to October 31, 2009.
Actual Expenses
The table provides information about actual account values and actual expenses for each class. You may use the information, together with the amount you invested, to estimate the expenses that you paid over the period. First, identify the share class you own. Then simply divide your account value by $1,000 (for example, an $8,600 account value divided by $1,000 = 8.6), then multiply the result by the number under the heading “Expenses Paid During Period” to estimate the expenses you paid on your account during this period.
If you hold Investor Class shares of any American Century Investments fund, or Institutional Class shares of the American Century Diversified Bond Fund, in an American Century Investments account (i.e., not a financial intermediary or retirement plan account), American Century Investments may charge you a $12.50 semiannual account maintenance fee if the value of those shares is less than $10,000. We will redeem shares automatically in one of your accounts to pay the $12.50 fee. In determining your total eligible investment amount, we will include your investments in all personal accounts (including American Century Investments Brokerage accounts) registered under your Social Security number. Personal accounts include individual accounts, joint accounts, UGMA/UTMA accounts, personal trusts, Coverdell Education Savings Accounts and IRAs (including traditional, Roth, Rollover, SEP-, SARSEP- and SIMPLE-IRAs), and certain other retirement accounts. If you have only business, business retirement, employer-sponsored or American Century Investments Brokerage accounts, you are currently not subject to this fee. We will not charge the fee as long as you choose to manage your accounts exclusively online. If you are subject to the Account Maintenance Fee, your account value could be reduced by the fee amount.
Hypothetical Example for Comparison Purposes
The table also provides information about hypothetical account values and hypothetical expenses based on the actual expense ratio of each class of your fund and an assumed rate of return of 5% per year before expenses, which is not the actual return of a fund’s share class. The hypothetical account values and expenses may not be used to estimate the actual ending account balance or expenses you paid for the period. You may use this information to compare the ongoing costs of investing in your fund and other funds. To do so, compare this 5% hypothetical example with the 5% hypothetical examples that appear in the shareholder reports of the other funds.
15
Please note that the expenses shown in the table are meant to highlight your ongoing costs only and do not reflect any transactional costs, such as sales charges (loads) or redemption/exchange fees. Therefore, the table is useful in comparing ongoing costs only, and will not help you determine the relative total costs of owning different funds. In addition, if these transactional costs were included, your costs would have been higher.
| | | | |
| | Beginning | Ending | Expenses Paid | |
| | Account Value | Account Value | During Period* | Annualized |
| | 5/1/09 | 10/31/09 | 5/1/09 – 10/31/09 | Expense Ratio* |
| NT Growth — Institutional Class | | | |
| Actual | $1,000 | $1,180.80 | $4.40 | 0.80% |
| Hypothetical | $1,000 | $1,021.17 | $4.08 | 0.80% |
| NT Vista — Institutional Class | | | |
| Actual | $1,000 | $1,082.40 | $4.20 | 0.80% |
| Hypothetical | $1,000 | $1,021.17 | $4.08 | 0.80% |
| *Expenses are equal to the class’s annualized expense ratio listed in the table above, multiplied by the average account value over the period, |
| multiplied by 184, the number of days in the most recent fiscal half-year, divided by 365, to reflect the one-half year period. |
16
| | | | | | |
| NT Growth | | | | | | |
| |
| OCTOBER 31, 2009 | | | | | | |
| | Shares | Value | | | Shares | Value |
| Common Stocks — 97.8% | | | Hewlett-Packard Co. | 82,400 | $ 3,910,704 |
| AEROSPACE & DEFENSE — 1.9% | | | Lexmark International, Inc., | | |
| | | | | Class A(1) | 29,000 | 739,500 |
| Honeywell International, Inc. | 40,700 | $ 1,460,723 | | NetApp, Inc.(1) | 65,700 | 1,777,185 |
| Rockwell Collins, Inc. | 47,900 | 2,413,202 | | QLogic Corp.(1) | 85,700 | 1,503,178 |
| | | 3,873,925 | | | | |
| | | | | | | 20,137,250 |
| AIR FREIGHT & LOGISTICS — 1.0% | | | | | |
| | | | | CONSUMER FINANCE — 1.4% | | |
| United Parcel Service, Inc., | | | | | | |
| Class B | 39,800 | 2,136,464 | | American Express Co. | 84,000 | 2,926,560 |
| AUTO COMPONENTS — 1.1% | | | | DIVERSIFIED — 0.5% | | |
| BorgWarner, Inc. | 77,400 | 2,346,768 | | iShares Russell 1000 Growth | | |
| | | | | Index Fund | 21,000 | 960,120 |
| BEVERAGES — 5.3% | | | | | | |
| | | | | ELECTRICAL EQUIPMENT — 0.5% | |
| Coca-Cola Co. (The) | 106,600 | 5,682,846 | | | | |
| | | | | Rockwell Automation, Inc. | 27,008 | 1,105,978 |
| PepsiCo, Inc. | 88,300 | 5,346,565 | | | | |
| | | | | ELECTRONIC EQUIPMENT, | | |
| | | 11,029,411 | | INSTRUMENTS & COMPONENTS — 0.9% | |
| BIOTECHNOLOGY — 3.9% | | | | Jabil Circuit, Inc. | 147,000 | 1,966,860 |
| Alexion | | | | ENERGY EQUIPMENT & SERVICES — 1.3% | |
| Pharmaceuticals, Inc.(1) | 25,700 | 1,141,337 | | | | |
| | | | | Schlumberger Ltd. | 36,600 | 2,276,520 |
| Amgen, Inc.(1) | 73,000 | 3,922,290 | | | | |
| | | | | Transocean Ltd.(1) | 6,200 | 520,242 |
| Gilead Sciences, Inc.(1) | 47,800 | 2,033,890 | | | | |
| | | | | | | 2,796,762 |
| Talecris Biotherapeutics | | | | | | |
| Holdings Corp.(1) | 27,105 | 543,726 | | FOOD & STAPLES RETAILING — 3.1% | |
| Vertex | | | | Walgreen Co. | 92,500 | 3,499,275 |
| Pharmaceuticals, Inc.(1) | 16,400 | 550,384 | | Wal-Mart Stores, Inc. | 59,400 | 2,950,992 |
| | | 8,191,627 | | | | 6,450,267 |
| CAPITAL MARKETS — 2.1% | | | | FOOD PRODUCTS — 3.7% | | |
| Charles Schwab Corp. (The) | 100,000 | 1,734,000 | | Archer-Daniels-Midland Co. | 57,100 | 1,719,852 |
| Goldman Sachs Group, Inc. | | | | General Mills, Inc. | 46,500 | 3,065,280 |
| (The) | 15,200 | 2,586,584 | | Kellogg Co. | 57,403 | 2,958,551 |
| | | 4,320,584 | | | | 7,743,683 |
| CHEMICALS — 1.4% | | | | HEALTH CARE EQUIPMENT & SUPPLIES — 4.5% |
| Airgas, Inc. | 21,000 | 931,560 | | Alcon, Inc. | 9,500 | 1,356,505 |
| Celanese Corp., Series A | 76,248 | 2,093,008 | | Baxter International, Inc. | 63,037 | 3,407,780 |
| | | 3,024,568 | | Becton, Dickinson & Co. | 8,596 | 587,623 |
| COMMERCIAL BANKS — 1.3% | | | | Covidien plc | 36,700 | 1,545,804 |
| Wells Fargo & Co. | 96,403 | 2,653,010 | | Edwards | | |
| COMMUNICATIONS EQUIPMENT — 5.9% | | | Lifesciences Corp.(1) | 22,800 | 1,754,232 |
| Arris Group, Inc.(1) | 69,800 | 716,148 | | Gen-Probe, Inc.(1) | 15,100 | 629,972 |
| Cisco Systems, Inc.(1) | 234,000 | 5,346,900 | | | | 9,281,916 |
| F5 Networks, Inc.(1) | 39,700 | 1,782,133 | | HEALTH CARE PROVIDERS & SERVICES — 2.0% |
| Palm, Inc.(1) | 56,824 | 659,727 | | Express Scripts, Inc.(1) | 51,200 | 4,091,904 |
| QUALCOMM, Inc. | 92,700 | 3,838,707 | | HOTELS, RESTAURANTS & LEISURE — 1.1% | |
| | | 12,343,615 | | Chipotle Mexican Grill, Inc., | | |
| | | | | Class A(1) | 7,900 | 643,771 |
| COMPUTERS & PERIPHERALS — 9.7% | | | | | |
| | | | | Starwood Hotels & Resorts | | |
| Apple, Inc.(1) | 38,500 | 7,257,250 | | Worldwide, Inc. | 53,905 | 1,566,479 |
| Dell, Inc.(1) | 201,200 | 2,915,388 | | | | 2,210,250 |
| EMC Corp.(1) | 123,500 | 2,034,045 | | | | |
17
| | | | | | |
| NT Growth | | | | | | |
| Shares | Value | | | Shares | Value |
| HOUSEHOLD DURABLES — 1.1% | | | | PHARMACEUTICALS — 5.3% | | |
| Whirlpool Corp. | 31,600 | $ 2,262,244 | | Abbott Laboratories | 120,200 | $ 6,078,514 |
| HOUSEHOLD PRODUCTS — 3.1% | | | | Johnson & Johnson | 62,600 | 3,696,530 |
| Colgate-Palmolive Co. | 20,300 | 1,596,189 | | Novo Nordisk A/S B Shares | 21,000 | 1,305,976 |
| Procter & Gamble Co. (The) | 83,600 | 4,848,800 | | | | 11,081,020 |
| | | 6,444,989 | | ROAD & RAIL — 0.8% | | |
| INDUSTRIAL CONGLOMERATES — 1.5% | | | Union Pacific Corp. | 29,400 | 1,621,116 |
| 3M Co. | 41,900 | 3,082,583 | | SEMICONDUCTORS & | | |
| INSURANCE — 1.2% | | | | SEMICONDUCTOR EQUIPMENT — 2.5% | |
| Aflac, Inc. | 58,900 | 2,443,761 | | Broadcom Corp., Class A(1) | 39,000 | 1,037,790 |
| INTERNET & CATALOG RETAIL — 0.7% | | | Cree, Inc.(1) | 26,500 | 1,115,650 |
| Amazon.com, Inc.(1) | 12,800 | 1,520,768 | | Linear Technology Corp. | 103,200 | 2,670,816 |
| INTERNET SOFTWARE & SERVICES — 3.8% | | | Skyworks Solutions, Inc.(1) | 45,400 | 473,522 |
| Google, Inc., Class A(1) | 14,700 | 7,880,964 | | | | 5,297,778 |
| IT SERVICES — 1.2% | | | | SOFTWARE — 7.5% | | |
| International Business | | | | Adobe Systems, Inc.(1) | 51,183 | 1,685,968 |
| Machines Corp. | 20,300 | 2,448,383 | | Microsoft Corp. | 348,800 | 9,672,224 |
| LIFE SCIENCES TOOLS & SERVICES — 0.7% | | | Oracle Corp. | 167,000 | 3,523,700 |
| Thermo Fisher | | | | salesforce.com, inc.(1) | 13,600 | 771,800 |
| Scientific, Inc.(1) | 31,800 | 1,431,000 | | | | |
| | | | | | | 15,653,692 |
| MACHINERY — 2.5% | | | | SPECIALTY RETAIL — 3.3% | | |
| Caterpillar, Inc. | 13,200 | 726,792 | | Abercrombie & Fitch Co., | | |
| Eaton Corp. | 27,400 | 1,656,330 | | Class A | 41,400 | 1,358,748 |
| Illinois Tool Works, Inc. | 62,800 | 2,883,776 | | Chico’s FAS, Inc.(1) | 74,600 | 891,470 |
| | | 5,266,898 | | Home Depot, Inc. (The) | 65,400 | 1,640,886 |
| MEDIA — 0.7% | | | | J. Crew Group, Inc.(1) | 40,600 | 1,655,668 |
| Scripps Networks | | | | Lowe’s Cos., Inc. | 66,400 | 1,299,448 |
| Interactive, Inc., Class A | 40,400 | 1,525,504 | | | | |
| | | | | | | 6,846,220 |
| METALS & MINING — 1.4% | | | | | | |
| | | | | TEXTILES, APPAREL & LUXURY GOODS — 0.5% |
| Freeport-McMoRan Copper | | | | | | |
| & Gold, Inc.(1) | 13,800 | 1,012,368 | | Polo Ralph Lauren Corp. | 13,300 | 989,786 |
| Newmont Mining Corp. | 44,900 | 1,951,354 | | WIRELESS TELECOMMUNICATION SERVICES — 1.2% |
| | | 2,963,722 | | American Tower Corp., | | |
| | | | | Class A(1) | 70,500 | 2,595,810 |
| MULTILINE RETAIL — 2.9% | | | | | | |
| | | | | TOTAL COMMON STOCKS | | |
| Kohl’s Corp.(1) | 45,500 | 2,603,510 | | (Cost $173,587,564) | | 203,790,470 |
| Target Corp. | 71,500 | 3,462,745 | | | | |
| | | 6,066,255 | | Temporary Cash Investments — 1.5% |
| OIL, GAS & CONSUMABLE FUELS — 2.9% | | | JPMorgan U.S. Treasury | | |
| | | | | Plus Money Market Fund | | |
| Apache Corp. | 13,800 | 1,298,856 | | Agency Shares | 74,576 | 74,576 |
| Exxon Mobil Corp. | 25,500 | 1,827,585 | | Repurchase Agreement, Bank of America | |
| Occidental Petroleum Corp. | 29,400 | 2,230,872 | | Securities, LLC, (collateralized by various | |
| Quicksilver Resources, Inc.(1) | 54,800 | 668,560 | | U.S. Treasury obligations, 1.875%-3.625%, | |
| | | | | 7/15/13-4/15/28, valued at $3,085,709), | |
| | | 6,025,873 | | in a joint trading account at 0.05%, | |
| PERSONAL PRODUCTS — 0.4% | | | | dated 10/30/09, due 11/2/09 | | |
| Mead Johnson Nutrition Co., | | | | (Delivery value $3,000,012) | | 3,000,000 |
| Class A | 17,854 | 750,582 | | TOTAL TEMPORARY | | |
| | | | | CASH INVESTMENTS | | |
| | | | | (Cost $3,074,576) | | 3,074,576 |
18
| | | |
| NT Growth | | | |
| | Value | | |
| TOTAL INVESTMENT | | | |
| SECURITIES — 99.3% | | | |
| (Cost $176,662,140) | $206,865,046 | | |
| OTHER ASSETS | | | |
| AND LIABILITIES — 0.7% | 1,471,804 | | |
| TOTAL NET ASSETS — 100.0% | $208,336,850 | | |
| |
| Forward Foreign Currency Exchange Contracts | | |
| Contracts to Sell | Settlement Date | Value | Unrealized Gain (Loss) |
| 4,258,800 DKK for USD | 11/30/09 | $841,668 | $4,385 |
| (Value on Settlement Date $846,053) | | | |
| |
| Notes to Schedule of Investments | | |
| DKK = Danish Krone | | | |
| USD = United States Dollar | | | |
| (1) Non-income producing. | | | |
| |
| Industry classifications are unaudited. | | | |
| |
| |
| See Notes to Financial Statements. | | | |
19
| | | | | | |
| NT Vista | | | | | | |
| |
| OCTOBER 31, 2009 | | | | | | |
| | Shares | Value | | | Shares | Value |
| Common Stocks — 96.9% | | | CONSUMER FINANCE — 0.8% | | |
| AEROSPACE & DEFENSE — 1.2% | | | Discover Financial Services | 49,900 | $ 705,586 |
| BE Aerospace, Inc.(1) | 36,200 | $ 641,826 | | CONTAINERS & PACKAGING — 1.3% | |
| | | | | Crown Holdings, Inc.(1) | 46,063 | 1,227,579 |
| Precision Castparts Corp. | 4,700 | 448,991 | | | | |
| | | 1,090,817 | | DIVERSIFIED FINANCIAL SERVICES — 0.6% | |
| AIR FREIGHT & LOGISTICS — 0.7% | | | IntercontinentalExchange, | | |
| | | | | Inc.(1) | 5,500 | 551,045 |
| FedEx Corp. | 9,300 | 676,017 | | ELECTRONIC EQUIPMENT, | | |
| AUTO COMPONENTS — 0.8% | | | | INSTRUMENTS & COMPONENTS — 0.8% | |
| Autoliv, Inc. | 22,400 | 752,192 | | Molex, Inc. | 37,200 | 694,524 |
| BIOTECHNOLOGY — 1.1% | | | | ENERGY EQUIPMENT & SERVICES — 3.4% | |
| Alexion | | | | Atwood Oceanics, Inc.(1) | 35,100 | 1,245,699 |
| Pharmaceuticals, Inc.(1) | 22,500 | 999,225 | | | | |
| | | | | Cameron | | |
| CAPITAL MARKETS — 9.3% | | | | International Corp.(1) | 31,400 | 1,160,858 |
| Janus Capital Group, Inc. | 112,200 | 1,472,064 | | Oceaneering | | |
| Jefferies Group, Inc.(1) | 85,500 | 2,231,550 | | International, Inc.(1) | 13,800 | 705,180 |
| Lazard Ltd., Class A | 52,300 | 1,974,325 | | | | 3,111,737 |
| Legg Mason, Inc. | 64,100 | 1,865,951 | | FOOD PRODUCTS — 0.5% | | |
| Morgan Stanley | 13,600 | 436,832 | | Green Mountain Coffee | | |
| Waddell & Reed | | | | Roasters, Inc.(1) | 6,700 | 445,885 |
| Financial, Inc., Class A | 17,500 | 491,050 | | HEALTH CARE PROVIDERS & SERVICES — 5.3% |
| | | 8,471,772 | | Express Scripts, Inc.(1) | 25,000 | 1,998,000 |
| CHEMICALS — 2.1% | | | | Health Management | | |
| Celanese Corp., Series A | 34,900 | 958,005 | | Associates, Inc., Class A(1) | 107,300 | 654,530 |
| CF Industries Holdings, Inc. | 5,500 | 457,875 | | Medco Health | | |
| | | | | Solutions, Inc.(1) | 26,800 | 1,504,016 |
| Scotts Miracle-Gro Co. | | | | | | |
| (The), Class A | 11,600 | 471,192 | | Tenet Healthcare Corp.(1) | 133,100 | 681,472 |
| | | 1,887,072 | | | | 4,838,018 |
| COMMERCIAL BANKS — 0.5% | | | | HEALTH CARE TECHNOLOGY — 0.7% | |
| Fifth Third Bancorp. | 50,500 | 451,470 | | Allscripts-Misys Healthcare | | |
| | | | | Solutions, Inc.(1) | 34,500 | 672,750 |
| COMMERCIAL SERVICES & SUPPLIES — 0.6% | | | | |
| Tetra Tech, Inc.(1) | 19,700 | 506,881 | | HOTELS, RESTAURANTS & LEISURE — 5.6% | |
| | | | | Bally Technologies, Inc.(1) | 17,600 | 693,264 |
| COMMUNICATIONS EQUIPMENT — 1.7% | | | | | |
| | | | | Boyd Gaming Corp.(1) | 26,300 | 193,568 |
| Alcatel-Lucent ADR(1) | 112,200 | 414,018 | | | | |
| CommScope, Inc.(1) | 27,900 | 753,858 | | Ctrip.com International Ltd. | | |
| | | | | ADR(1) | 16,100 | 861,994 |
| Tellabs, Inc.(1) | 65,100 | 391,902 | | International | | |
| | | 1,559,778 | | Game Technology | 47,800 | 852,752 |
| COMPUTERS & PERIPHERALS — 2.0% | | | Las Vegas Sands Corp.(1) | 51,400 | 775,626 |
| Seagate Technology | 49,400 | 689,130 | | Starwood Hotels & Resorts | | |
| Western Digital Corp.(1) | 34,800 | 1,172,064 | | Worldwide, Inc. | 22,000 | 639,320 |
| | | 1,861,194 | | WMS Industries, Inc.(1) | 17,000 | 679,660 |
| CONSTRUCTION & ENGINEERING — 3.1% | | | Wynn Resorts Ltd.(1) | 7,600 | 412,072 |
| AECOM Technology Corp.(1) | 48,024 | 1,212,126 | | | | 5,108,256 |
| Chicago Bridge & Iron Co. | | | | | | |
| New York Shares | 36,000 | 677,160 | | | | |
| Quanta Services, Inc.(1) | 42,406 | 899,007 | | | | |
| | | 2,788,293 | | | | |
20
| | | | | | |
| NT Vista | | | | | | |
| Shares | Value | | | Shares | Value |
| HOUSEHOLD DURABLES — 2.5% | | | | REAL ESTATE MANAGEMENT | | |
| KB Home | 54,100 | $ 767,138 | | & DEVELOPMENT — 0.5% | | |
| NVR, Inc.(1) | 1,500 | 993,405 | | E-House China Holdings Ltd. | | |
| | | | | ADR(1) | 24,100 | $ 412,351 |
| Tupperware Brands Corp. | 10,900 | 490,718 | | | | |
| | | | | ROAD & RAIL — 1.0% | | |
| | | 2,251,261 | | | | |
| | | | | Avis Budget Group, Inc.(1) | 36,800 | 309,120 |
| INDUSTRIAL CONGLOMERATES — 1.4% | | | | | |
| | | | | Kansas City Southern(1) | 26,000 | 629,980 |
| McDermott | | | | | | |
| International, Inc.(1) | 58,400 | 1,298,232 | | | | 939,100 |
| INTERNET SOFTWARE & SERVICES — 1.5% | | | SEMICONDUCTORS & | | |
| Equinix, Inc.(1) | 16,200 | 1,382,184 | | SEMICONDUCTOR EQUIPMENT — 10.7% | |
| LIFE SCIENCES TOOLS & SERVICES — 2.2% | | | Altera Corp. | 35,300 | 698,587 |
| Life Technologies Corp.(1) | 43,200 | 2,037,744 | | Analog Devices, Inc. | 35,500 | 909,865 |
| | | | | ASML Holding NV | | |
| MACHINERY — 4.2% | | | | New York Shares | 65,300 | 1,759,182 |
| Bucyrus International, Inc. | 37,200 | 1,652,424 | | Atheros | | |
| Flowserve Corp. | 6,500 | 638,365 | | Communications, Inc.(1) | 29,500 | 726,290 |
| Ingersoll-Rand plc | 33,100 | 1,045,629 | | KLA-Tencor Corp. | 27,500 | 894,025 |
| Joy Global, Inc. | 10,400 | 524,264 | | Marvell Technology | | |
| | | 3,860,682 | | Group Ltd.(1) | 76,700 | 1,052,324 |
| METALS & MINING — 5.1% | | | | NVIDIA Corp.(1) | 67,600 | 808,496 |
| AK Steel Holding Corp. | 44,356 | 703,930 | | PMC - Sierra, Inc.(1) | 118,600 | 1,010,472 |
| Cia Siderurgica Nacional | | | | Silicon Laboratories, Inc.(1) | 17,100 | 716,490 |
| SA ADR | 34,000 | 1,127,440 | | Teradyne, Inc.(1) | 147,300 | 1,232,901 |
| Freeport-McMoRan Copper | | | | | | 9,808,632 |
| & Gold, Inc.(1) | 15,500 | 1,137,080 | | | | |
| Walter Energy, Inc. | 28,500 | 1,667,250 | | SOFTWARE — 4.0% | | |
| | | | | Cerner Corp.(1) | 11,800 | 897,272 |
| | | 4,635,700 | | | | |
| MULTILINE RETAIL — 2.9% | | | | Perfect World Co. Ltd., | | |
| | | | | Class B ADR(1) | 19,600 | 862,596 |
| Dollar Tree, Inc.(1) | 21,000 | 947,730 | | | | |
| | | | | Rovi Corp.(1) | 50,400 | 1,388,520 |
| Family Dollar Stores, Inc. | 25,900 | 732,970 | | Shanda Games Ltd. ADR(1) | 45,860 | 456,766 |
| Macy’s, Inc. | 26,900 | 472,633 | | | | 3,605,154 |
| Nordstrom, Inc. | 14,500 | 460,810 | | SPECIALTY RETAIL — 5.3% | | |
| | | 2,614,143 | | Aeropostale, Inc.(1) | 23,400 | 878,202 |
| OIL, GAS & CONSUMABLE FUELS — 4.7% | | | | | |
| | | | | Bed Bath & Beyond, Inc.(1) | 12,700 | 447,167 |
| Brigham Exploration Co.(1) | 22,600 | 214,700 | | | | |
| | | | | Chico’s FAS, Inc.(1) | 89,900 | 1,074,305 |
| Continental | | | | | | |
| Resources, Inc.(1) | 23,500 | 874,435 | | J. Crew Group, Inc.(1) | 5,900 | 240,602 |
| Petrohawk Energy Corp.(1) | 75,989 | 1,787,261 | | Ross Stores, Inc. | 21,909 | 964,215 |
| Southwestern Energy Co.(1) | 9,900 | 431,442 | | TJX Cos., Inc. (The) | 20,300 | 758,205 |
| Whiting Petroleum Corp.(1) | 17,200 | 970,080 | | Williams-Sonoma, Inc. | 23,800 | 446,964 |
| | | 4,277,918 | | | | 4,809,660 |
| PAPER & FOREST PRODUCTS — 0.8% | | | TEXTILES, APPAREL & LUXURY GOODS — 3.2% |
| MeadWestvaco Corp. | 33,100 | 755,673 | | Coach, Inc. | 24,400 | 804,468 |
| PERSONAL PRODUCTS — 1.0% | | | | Fuqi International, Inc.(1) | 15,700 | 321,693 |
| Avon Products, Inc. | 29,200 | 935,860 | | Jones Apparel Group, Inc. | 47,200 | 844,408 |
| | | | | Phillips-Van Heusen Corp. | 23,000 | 923,450 |
| | | | | | | 2,894,019 |
21
| | | | | |
| NT Vista | | | | | |
| | Shares | Value | | Geographic Diversification | |
| WIRELESS TELECOMMUNICATION SERVICES — 3.8% | | (as a % of net assets) | |
| American Tower Corp., | | | | United States | 83.3% |
| Class A(1) | 23,800 | $ 876,316 | | Bermuda | 3.3% |
| SBA Communications Corp., | | | | People’s Republic of China | 3.2% |
| Class A(1) | 92,302 | 2,603,839 | | | |
| | | | | Netherlands | 2.7% |
| | | 3,480,155 | | Brazil | 1.2% |
| TOTAL COMMON STOCKS | | | | | |
| (Cost $77,068,854) | | 88,398,559 | | Ireland | 1.1% |
| | | | | Sweden | 0.8% |
| Temporary Cash Investments — 4.1% | | Cayman Islands | 0.8% |
| JPMorgan U.S. Treasury | | | | France | 0.5% |
| Plus Money Market Fund | | | | | |
| Agency Shares | 76,395 | 76,395 | | Cash and Equivalents* | 3.1% |
| Repurchase Agreement, Bank of America | | | *Includes temporary cash investments and other assets and liabilities. |
| Securities, LLC, (collateralized by various | | | | |
| U.S. Treasury obligations, 1.875%-3.625%, | | | | |
| 7/15/13-4/15/28, valued at $3,805,707), | | | Notes to Schedule of Investments | |
| in a joint trading account at 0.05%, | | | ADR = American Depositary Receipt | |
| dated 10/30/09, due 11/2/09 | | | | (1) Non-income producing. | |
| (Delivery value $3,700,015) | | 3,700,000 | | | |
| TOTAL TEMPORARY | | | | | |
| CASH INVESTMENTS | | | | Industry classifications and geographic diversification are unaudited. |
| (Cost $3,776,395) | | 3,776,395 | | | |
| TOTAL INVESTMENT | | | | | |
| SECURITIES — 101.0% | | | | See Notes to Financial Statements. | |
| (Cost $80,845,249) | | 92,174,954 | | | |
| OTHER ASSETS | | | | | |
| AND LIABILITIES — (1.0)% | | (938,239) | | | |
| TOTAL NET ASSETS — 100.0% | | $91,236,715 | | | |
22
|
| Statement of Assets and Liabilities |
| | |
| OCTOBER 31, 2009 | | |
| | NT Growth | NT Vista |
| Assets | | |
| Investment securities, at value (cost of $176,662,140 and $80,845,249, respectively) | $206,865,046 | $92,174,954 |
| Foreign currency holdings, at value (cost of $45,934 and $—, respectively) | 46,296 | — |
| Receivable for investments sold | 2,631,079 | 1,832,403 |
| Receivable for forward foreign currency exchange contracts | 4,385 | — |
| Receivable for capital shares sold | 767,337 | 358,561 |
| Dividends and interest receivable | 185,793 | 16,792 |
| | 210,499,936 | 94,382,710 |
| | | |
| Liabilities | | |
| Payable for investments purchased | 1,988,848 | 3,068,179 |
| Payable for capital shares purchased | 32,980 | 12,688 |
| Accrued management fees | 141,258 | 65,128 |
| | 2,163,086 | 3,145,995 |
| | | |
| Net Assets | $208,336,850 | $91,236,715 |
| | | |
| Institutional Class Capital Shares, $0.01 Par Value | | |
| Authorized | 150,000,000 | 150,000,000 |
| Outstanding | 22,297,707 | 12,172,884 |
| | | |
| Net Asset Value Per Share | $9.34 | $7.50 |
| | | |
| Net Assets Consist of: | | |
| Capital (par value and paid-in surplus) | $201,098,422 | $ 97,404,996 |
| Undistributed net investment income | 665,966 | — |
| Accumulated net realized loss on investment and foreign currency transactions | (23,636,955) | (17,498,650) |
| Net unrealized appreciation on investments and translation of assets | | |
| and liabilities in foreign currencies | 30,209,417 | 11,330,369 |
| | $208,336,850 | $ 91,236,715 |
| |
| |
| See Notes to Financial Statements. | | |
23
| | |
| YEAR ENDED OCTOBER 31, 2009 | | |
| | NT Growth | NT Vista |
| Investment Income (Loss) | | |
| Income: | | |
| Dividends (net of foreign taxes withheld of $10,194 and $5,174, respectively) | $ 2,128,695 | $ 296,175 |
| Interest | 1,956 | 2,496 |
| | 2,130,651 | 298,671 |
| | | |
| Expenses: | | |
| Management fees | 1,150,004 | 525,965 |
| Directors’ fees and expenses | 5,425 | 2,469 |
| Other expenses | 101 | 44 |
| | 1,155,530 | 528,478 |
| | | |
| Net investment income (loss) | 975,121 | (229,807) |
| | | |
| Realized and Unrealized Gain (Loss) | | |
| Net realized gain (loss) on: | | |
| Investment transactions | (16,086,399) | (11,432,987) |
| Foreign currency transactions | (136,005) | (25,605) |
| | (16,222,404) | (11,458,592) |
| | | |
| Change in net unrealized appreciation (depreciation) on: | | |
| Investments | 44,052,045 | 13,723,728 |
| Translation of assets and liabilities in foreign currencies | (29,414) | (7,970) |
| | 44,022,631 | 13,715,758 |
| | | |
| Net realized and unrealized gain (loss) | 27,800,227 | 2,257,166 |
| | | |
| Net Increase (Decrease) in Net Assets Resulting from Operations | $ 28,775,348 | $ 2,027,359 |
| |
| |
| See Notes to Financial Statements. | | |
24
|
| Statement of Changes in Net Assets |
| | | | |
| YEARS ENDED OCTOBER 31, 2009 AND OCTOBER 31, 2008 | | | |
| | NT Growth | NT Vista |
| Increase (Decrease) in Net Assets | 2009 | 2008 | 2009 | 2008 |
| Operations | | | | |
| Net investment income (loss) | $ 975,121 | $ 341,835 | $ (229,807) | $ (146,899) |
| Net realized gain (loss) | (16,222,404) | (7,121,636) | (11,458,592) | (5,806,400) |
| Change in net unrealized | | | | |
| appreciation (depreciation) | 44,022,631 | (28,414,212) | 13,715,758 | (15,759,786) |
| Net increase (decrease) in net assets | | | | |
| resulting from operations | 28,775,348 | (35,194,013) | 2,027,359 | (21,713,085) |
| | | | | |
| Distributions to Shareholders | | | | |
| From net investment income | (665,262) | (194,614) | — | — |
| From net realized gains | — | (3,783,853) | — | (87,218) |
| Decrease in net assets from distributions | (665,262) | (3,978,467) | — | (87,218) |
| | | | | |
| Capital Share Transactions | | | | |
| Proceeds from shares sold | 120,029,054 | 48,892,848 | 56,403,239 | 28,341,744 |
| Payments for shares redeemed | (23,241,910) | (14,726,562) | (7,329,572) | (11,057,975) |
| Net increase (decrease) in net assets | | | | |
| from capital share transactions | 96,787,144 | 34,166,286 | 49,073,667 | 17,283,769 |
| | | | | |
| Net increase (decrease) in net assets | 124,897,230 | (5,006,194) | 51,101,026 | (4,516,534) |
| | | | | |
| Net Assets | | | | |
| Beginning of period | 83,439,620 | 88,445,814 | 40,135,689 | 44,652,223 |
| End of period | $208,336,850 | $ 83,439,620 | $ 91,236,715 | $ 40,135,689 |
| | | | | |
| Accumulated undistributed | | | | |
| net investment income (loss) | $665,966 | $494,226 | — | $(8,523) |
| | | | | |
| Transactions in Shares of the Funds | | | | |
| Sold | 15,002,239 | 4,697,976 | 7,996,150 | 2,867,449 |
| Redeemed | (2,964,057) | (1,311,665) | (1,091,260) | (926,513) |
| Net increase (decrease) in | | | | |
| shares of the funds | 12,038,182 | 3,386,311 | 6,904,890 | 1,940,936 |
| |
| |
| See Notes to Financial Statements. | | | | |
25
|
| Notes to Financial Statements |
OCTOBER 31, 2009
1. Organization and Summary of Significant Accounting Policies
Organization — American Century Mutual Funds, Inc. (the corporation) is registered under the Investment Company Act of 1940 (the 1940 Act) as an open-end management investment company. NT Growth Fund (NT Growth) and NT Vista Fund (NT Vista) (collectively, the funds) are two funds in a series issued by the corporation. The funds are diversified under the 1940 Act. The funds’ investment objective is to seek long-term capital growth. The funds pursue this objective by investing primarily in equity securities. NT Growth generally invests in larger-sized companies that management believes will increase in value but may purchase companies of any size. NT Vista generally invests in companies that are medium-sized and smaller at the time of purchase that management believes will increase in value. The funds are not permitted to invest in any securities issued by companies assigned the Global Industry Classification Standard for the tobacco industry. The following is a summary of the funds’ significant accounting policies.
Security Valuations — Securities traded primarily on a principal securities exchange are valued at the last reported sales price, or at the mean of the latest bid and asked prices where no last sales price is available. Depending on local convention or regulation, securities traded over-the-counter are valued at the mean of the latest bid and asked prices, the last sales price, or the official close price. Investments in open-end management investment companies are valued at the reported net asset value. Debt securities not traded on a principal securities exchange are valued through a commercial pricing service or at the mean of the most recent bid and asked prices. Discount notes may be valued through a commercial pricing service or at amortized cost, which approximates fair value. Securities traded on foreign securities exchanges and ov er-the-counter markets are normally completed before the close of business on days that the New York Stock Exchange (the Exchange) is open and may also take place on days when the Exchange is not open. If an event occurs after the value of a security was established but before the net asset value per share was determined that was likely to materially change the net asset value, that security would be valued as determined in accordance with procedures adopted by the Board of Directors. If the funds determine that the market price of a portfolio security is not readily available, or that the valuation methods mentioned above do not reflect the security’s fair value, such security is valued as determined by the Board of Directors or its designee, in accordance with procedures adopted by the Board of Directors, if such determination would materially impact a fund’s net asset value. Certain other circumstances may cause the funds to use alternative procedures to value a security such as: a security has been declared in default; trading in a security has been halted during the trading day; or there is a foreign market holiday and no trading will commence.
Security Transactions — For financial reporting purposes, security transactions are accounted for as of the trade date. Net realized gains and losses are determined on the identified cost basis, which is also used for federal income tax purposes.
Investment Income — Dividend income less foreign taxes withheld, if any, is recorded as of the ex-dividend date. Interest income is recorded on the accrual basis and includes accretion of discounts and amortization of premiums.
Foreign Currency Translations — All assets and liabilities initially expressed in foreign currencies are translated into U.S. dollars at prevailing exchange rates at period end. The funds may enter into spot foreign currency exchange contracts to facilitate transactions denominated in a foreign currency. Purchases and sales of investment securities, dividend and interest income, spot foreign currency exchange contracts, and certain expenses are translated at the rates of exchange prevailing on the respective dates of such transactions. For assets and liabilities, other than investments in securities, net realized and unrealized gains and losses from foreign currency translations arise from changes in currency exchange rates.
26
Net realized and unrealized foreign currency exchange gains or losses occurring during the holding period of investment securities are a component of net realized gain (loss) on investment transactions and net unrealized appreciation (depreciation) on investments, respectively. Certain countries may impose taxes on the contract amount of purchases and sales of foreign currency contracts in their currency. The funds record the foreign tax expense, if any, as a reduction to the net realized gain (loss) on foreign currency transactions.
Repurchase Agreements — The funds may enter into repurchase agreements with institutions that American Century Investment Management, Inc. (ACIM) (the investment advisor) has determined are creditworthy pursuant to criteria adopted by the Board of Directors. Each repurchase agreement is recorded at cost. Each fund requires that the collateral, represented by securities, received in a repurchase transaction be transferred to the custodian in a manner sufficient to enable each fund to obtain those securities in the event of a default under the repurchase agreement. ACIM monitors, on a daily basis, the securities transferred to ensure the value, including accrued interest, of the securities under each repurchase agreement is equal to or greater than amounts owed to each fund under each repurchase agreement.
Joint Trading Account — Pursuant to an Exemptive Order issued by the Securities and Exchange Commission, each fund, along with certain other funds in the American Century Investments family of funds, may transfer uninvested cash balances into a joint trading account. These balances are invested in one or more repurchase agreements that are collateralized by U.S. Treasury or Agency obligations.
Exchange Traded Funds — The funds may invest in exchange traded funds (ETFs). ETFs are a type of index fund bought and sold on a securities exchange. An ETF trades like common stock and represents a fixed portfolio of securities designed to track the performance and dividend yield of a particular domestic or foreign market index. A fund may purchase an ETF to temporarily gain exposure to a portion of the U.S. or a foreign market while awaiting purchase of underlying securities. The risks of owning an ETF generally reflect the risks of owning the underlying securities they are designed to track, although the lack of liquidity on an ETF could result in it being more volatile. Additionally, ETFs have fees and expenses that reduce their value.
Income Tax Status — It is each fund’s policy to distribute substantially all net investment income and net realized gains to shareholders and to otherwise qualify as a regulated investment company under provisions of the Internal Revenue Code. All tax years for the funds remain subject to examination by tax authorities. At this time, management believes there are no uncertain tax positions which, based on their technical merit, would not be sustained upon examination and for which it is reasonably possible that the total amounts of unrecognized tax benefits will significantly change in the next twelve months. Accordingly, no provision has been made for federal or state income taxes. Interest and penalties associated with any federal or state income tax obligations, if any, are recorded as interest expense.
Distributions to Shareholders — Distributions to shareholders are recorded on the ex-dividend date. Distributions from net investment income and net realized gains, if any, are generally declared and paid annually.
Indemnifications — Under the corporation’s organizational documents, its officers and directors are indemnified against certain liabilities arising out of the performance of their duties to the funds. In addition, in the normal course of business, the funds enter into contracts that provide general indemnifications. The maximum exposure under these arrangements is unknown as this would involve future claims that may be made against a fund. The risk of material loss from such claims is considered by management to be remote.
27
Use of Estimates — The financial statements are prepared in conformity with accounting principles generally accepted in the United States of America, which may require management to make certain estimates and assumptions at the date of the financial statements. Actual results could differ from these estimates.
Subsequent Events — Management has evaluated events or transactions that may have occurred since October 31, 2009, that would merit recognition or disclosure in the financial statements. This evaluation was completed through December 28, 2009, the date the financial statements were issued.
2. Fees and Transactions with Related Parties
Management Fees — The corporation has entered into a Management Agreement with ACIM, under which ACIM provides the funds with investment advisory and management services in exchange for a single, unified management fee (the fee). The Agreement provides that all expenses of the funds, except brokerage commissions, taxes, interest, fees and expenses of those directors who are not considered “interested persons” as defined in the 1940 Act (including counsel fees) and extraordinary expenses, will be paid by ACIM. The fee is computed and accrued daily based on the daily net assets of each fund and paid monthly in arrears. For funds with a stepped fee schedule, the rate of the fee is determined by applying a fee rate calculation formula. This formula takes into account each fund’s assets as well as certain assets, if any, of other clients of the investment advisor outside the American Century Investments family of funds (such as subadvised funds and separate accounts) that have very similar investment teams and investment strategies (strategy assets). The annual management fee schedule for NT Growth ranges from 0.600% to 0.800%. The effective annual management fee for NT Growth for the year ended October 31, 2009 was 0.80%. The annual management fee for NT Vista is 0.80%.
Related Parties — Certain officers and directors of the corporation are also officers and/or directors, and, as a group, controlling stockholders of American Century Companies, Inc. (ACC), the parent of the corporation’s investment advisor, ACIM, the distributor of the corporation, American Century Investment Services, Inc., and the corporation’s transfer agent, American Century Services, LLC. The funds are wholly owned, in aggregate, by various funds in a series issued by American Century Asset Allocation Portfolios, Inc. (ACAAP). ACAAP does not invest in the funds for the purpose of exercising management or control.
The funds are eligible to invest in a money market fund for temporary purposes, which is managed by J.P. Morgan Investment Management, Inc. (JPMIM). The funds have a Mutual Funds Services Agreement with J.P. Morgan Investor Services Co. (JPMIS). JPMorgan Chase Bank (JPMCB) is a custodian of the funds. NT Growth has a securities lending agreement with JPMCB. JPMIM, JPMIS and JPMCB are wholly owned subsidiaries of JPMorgan Chase & Co. (JPM). JPM is an equity investor in ACC.
3. Investment Transactions
Investment transactions, excluding short-term investments, for the year ended October 31, 2009, were as follows:
| | |
| | NT Growth | NT Vista |
| Purchases | $279,646,276 | $166,409,478 |
| Sales | $186,199,190 | $119,382,541 |
28
4. Fair Value Measurements
The funds’ securities valuation process is based on several considerations and may use multiple inputs to determine the fair value of the positions held by the funds. In conformity with accounting principles generally accepted in the United States of America, the inputs used to determine a valuation are classified into three broad levels as follows:
• Level 1 valuation inputs consist of actual quoted prices in an active market for identical securities;
• Level 2 valuation inputs consist of significant direct or indirect observable market data (including quoted prices for similar securities, evaluations of subsequent market events, interest rates, prepayment speeds, credit risk, etc.); or
• Level 3 valuation inputs consist of significant unobservable inputs (including a fund’s own assumptions).
The level classification is based on the lowest level input that is significant to the fair valuation measurement. The valuation inputs are not an indication of the risks associated with investing in these securities or other financial instruments.
The following is a summary of the valuation inputs used to determine the fair value of the funds’ securities and other financial instruments as of October 31, 2009:
| | | |
| | Level 1 | Level 2 | Level 3 |
| |
| NT Growth | | | |
| Investment Securities | | | |
| Common Stocks | $202,484,494 | $1,305,976 | — |
| Temporary Cash Investments | 74,576 | 3,000,000 | — |
| Total Value of Investment Securities | $202,559,070 | $4,305,976 | — |
| |
| Other Financial Instruments | | | |
| Total Unrealized Gain (Loss) on Forward | | | |
| Foreign Currency Exchange Contracts | — | $4,385 | — |
| |
| NT Vista | | | |
| Investment Securities | | | |
| Domestic Common Stocks | $75,991,759 | — | — |
| Foreign Common Stocks | 12,406,800 | — | — |
| Temporary Cash Investments | 76,395 | $3,700,000 | — |
| Total Value of Investment Securities | $88,474,954 | $3,700,000 | — |
29
5. Derivative Instruments
Foreign Currency Risk — NT Growth and NT Vista are subject to foreign currency exchange rate risk in the normal course of pursuing their investment objectives. The value of foreign investments held by a fund may be significantly affected by changes in foreign currency exchange rates. The dollar value of a foreign security generally decreases when the value of the dollar rises against the foreign currency in which the security is denominated and tends to increase when the value of the dollar declines against such foreign currency. A fund may enter into forward foreign currency exchange contracts to reduce a fund’s exposure to foreign currency exchange rate fluctuations. The net U.S. dollar value of foreign currency underlying all contractual commitments held by a fund and the resulting unrealized appreciation or depreciation are determined daily using prevailing exchange rates. Realized gain or loss is recorded upon the termination of the contract. Net realized and unrealized gains or losses occurring during the holding period of forward foreign currency exchange contracts are a component of net realized gain (loss) on foreign currency transactions and change in net unrealized appreciation (depreciation) on translation of assets and liabilities in foreign currencies, respectively. A fund bears the risk of an unfavorable change in the foreign currency exchange rate underlying the forward contract. Additionally, losses, up to the fair value, may arise if the counterparties do not perform under the contract terms. The risk of loss from non-performance by the counterparty may be reduced by the use of master netting agreements. During the year ended October 31, 2009, the funds participated in forward foreign currency exchange contracts.
For NT Growth, the value of foreign currency risk derivatives as of October 31, 2009, is disclosed on the Statement of Assets and Liabilities as an asset of $4,385 in receivable for forward foreign currency exchange contracts. For NT Growth, for the year ended October 31, 2009, the effect of foreign currency risk derivatives on the Statement of Operations was $(146,045) in net realized gain (loss) on foreign currency transactions and $(31,420) in change in net unrealized appreciation (depreciation) on translation of assets and liabilities in foreign currencies.
At October 31, 2009, NT Vista did not have any derivative instruments disclosed on the Statement of Assets and Liabilities. For NT Vista, for the year ended October 31, 2009, the effect of foreign currency risk derivatives on the Statement of Operations was $(33,654) in net realized gain (loss) on foreign currency transactions and $(8,923) in change in net unrealized appreciation (depreciation) on translation of assets and liabilities in foreign currencies.
For NT Growth, the derivative instruments at period end as disclosed on the Schedule of Investments are indicative of the fund’s typical volume.
For NT Vista, there were no derivative instruments at period end, though the fund occasionally held derivative instruments during the period.
6. Bank Line of Credit
The funds, along with certain other funds in the American Century Investments family of funds, had a $500,000,000 unsecured bank line of credit agreement with Bank of America, N.A. The line expired December 10, 2008, and was not renewed. The agreement allowed the funds to borrow money for temporary or emergency purposes to fund shareholder redemptions. Borrowings under the agreement were subject to interest at the Federal Funds rate plus 0.40%. The funds did not borrow from the line during the year ended October 31, 2009.
30
7. Interfund Lending
The funds, along with certain other funds in the American Century Investments family of funds, may participate in an interfund lending program, pursuant to an Exemptive Order issued by the Securities and Exchange Commission (SEC). This program provides an alternative credit facility allowing the funds to borrow from or lend to other funds in the American Century Investments family of funds that permit such transactions. Interfund lending transactions are subject to each fund’s investment policies and borrowing and lending limits. The interfund loan rate earned/paid on interfund lending transactions is determined daily based on the average of certain current market rates. Interfund lending transactions normally extend only overnight, but can have a maximum duration of seven days. The program is subject to annual approval by the Board of Directors. During the year ended October 31, 2009, the funds did not utilize the program .
8. Risk Factors
There are certain risks involved in investing in foreign securities. These risks include those resulting from future adverse political, social, and economic developments, fluctuations in currency exchange rates, the possible imposition of exchange controls, and other foreign laws or restrictions.
9. Federal Tax Information
The tax character of distributions paid during the years ended October 31, 2009 and October 31, 2008 were as follows:
| | | | |
| | NT Growth | NT Vista |
| | 2009 | 2008 | 2009 | 2008 |
| Distributions Paid From | | | | |
| Ordinary income | $665,262 | $1,297,574 | — | — |
| Long-term capital gains | — | $2,680,893 | — | $87,218 |
The book-basis character of distributions made during the year from net investment income or net realized gains may differ from their ultimate characterization for federal income tax purposes. These differences reflect the differing character of certain income items and net realized gains and losses for financial statement and tax purposes, and may result in reclassification among certain capital accounts on the financial statements.
As of October 31, 2009, the federal tax cost of investments and the components of distributable earnings on a tax-basis were as follows:
| | |
| | NT Growth | NT Vista |
| Federal tax cost of investments | $182,382,918 | $81,643,286 |
| Gross tax appreciation of investments | $26,183,905 | $12,281,839 |
| Gross tax depreciation of investments | (1,701,777) | (1,750,171) |
| Net tax appreciation (depreciation) of investments | $24,482,128 | $10,531,668 |
| Net tax appreciation (depreciation) on derivatives | | |
| and translation of assets and liabilities in foreign currencies | $6,511 | $664 |
| Net tax appreciation (depreciation) | $24,488,639 | $10,532,332 |
| Undistributed ordinary income | $665,966 | — |
| Accumulated capital losses | $(17,916,177) | $(16,700,613) |
The difference between book-basis and tax-basis cost and unrealized appreciation (depreciation) is attributable primarily to the tax deferral of losses on wash sales.
31
The accumulated capital losses on the previous page represent net capital loss carryovers that may be used to offset future realized capital gains for federal income tax purposes. Future capital loss carryover utilization in any given year may be subject to Internal Revenue Code limitations. The capital loss carryovers expire as follows:
| | |
| | 2016 | 2017 |
| NT Growth | $(5,069,723) | $(12,846,454) |
| NT Vista | $(4,315,394) | $(12,385,219) |
10. Recently Issued Accounting Standards
The Financial Accounting Standards Board (FASB) issued Accounting Standards Codification (ASC) Section 820-10 (formerly Statement of Financial Accounting Standards No. 157, “Fair Value Measurements”), in September 2006, which is effective for fiscal years beginning after November 15, 2007. ASC Section 820-10 defines fair value, establishes a framework for measuring fair value and expands the required financial statement disclosures about fair value measurements. The adoption of ASC Section 820-10 did not materially impact the determination of fair value.
In March 2008, the FASB issued ASC Section 815-10 (formerly Statement of Financial Accounting Standards No. 161, “Disclosures about Derivative Instruments and Hedging Activities — an amendment of FASB Statement No. 133”). ASC Section 815-10 is effective for interim periods beginning after November 15, 2008 and has been adopted by the funds. ASC Section 815-10 amends and expands disclosures about derivative instruments and hedging activities. ASC Section 815-10 requires qualitative disclosures about the objectives and strategies of derivative instruments, quantitative disclosures about the fair value amounts of and gains and losses on derivative instruments, and disclosures of credit-risk-related contingent features in hedging activities.
11. Other Tax Information (Unaudited)
The following information is provided pursuant to provisions of the Internal Revenue Code.
NT Growth hereby designates up to the maximum amount allowable as qualified dividend income for the fiscal year ended October 31, 2009.
For corporate taxpayers, NT Growth hereby designates $665,262, or up to the maximum amount allowable, of ordinary income distributions paid during the fiscal year ended October 31, 2009 as qualified for the corporate dividends received deduction.
32
| | | | | |
| NT Growth | | | | |
| |
| Institutional Class | | | | |
| For a Share Outstanding Throughout the Years Ended October 31 (except as noted) | | |
| | | 2009 | 2008 | 2007 | 2006(1) |
| Per-Share Data | | | | |
| Net Asset Value, Beginning of Period | $8.13 | $12.87 | $10.57 | $10.00 |
| Income From Investment Operations | | | | |
| Net Investment Income (Loss) | 0.06(2) | 0.04(2) | 0.04 | 0.01 |
| Net Realized and Unrealized Gain (Loss) | 1.21 | (4.19) | 2.29 | 0.56 |
| Total From Investment Operations | 1.27 | (4.15) | 2.33 | 0.57 |
| Distributions | | | | |
| From Net Investment Income | (0.06) | (0.03) | (0.03) | — |
| From Net Realized Gains | — | (0.56) | — | — |
| Total Distributions | (0.06) | (0.59) | (0.03) | — |
| Net Asset Value, End of Period | $9.34 | $8.13 | $12.87 | $10.57 |
| |
| Total Return(3) | 15.88% | (33.68)% | 22.12% | 5.70% |
| | | | | |
| Ratios/Supplemental Data | | | | |
| Ratio of Operating Expenses to Average Net Assets | 0.80% | 0.80% | 0.80% | 0.80%(4) |
| Ratio of Net Investment Income (Loss) to Average Net Assets | 0.67% | 0.38% | 0.35% | 0.36%(4) |
| Portfolio Turnover Rate | 132% | 136% | 140% | 57% |
| Net Assets, End of Period (in thousands) | $208,337 | $83,440 | $88,446 | $58,983 |
| (1) | May 12, 2006 (fund inception) through October 31, 2006. | | | | |
| (2) | Computed using average shares outstanding throughout the period. | | | | |
| (3) | Total return assumes reinvestment of net investment income and capital gains distributions, if any. Total returns for periods less than one year |
| | are not annualized. | | | | |
| (4) | Annualized. | | | | |
| |
| |
| See Notes to Financial Statements. | | | | |
33
| | | | | |
| NT Vista | | | | |
| |
| Institutional Class | | | | |
| For a Share Outstanding Throughout the Years Ended October 31 (except as noted) | | |
| | | 2009 | 2008 | 2007 | 2006(1) |
| Per-Share Data | | | | |
| Net Asset Value, Beginning of Period | $7.62 | $13.42 | $9.00 | $10.00 |
| Income From Investment Operations | | | | |
| Net Investment Income (Loss) | (0.02)(2) | (0.04)(2) | (0.04) | (0.01) |
| Net Realized and Unrealized Gain (Loss) | (0.10) | (5.73) | 4.46 | (0.99) |
| Total From Investment Operations | (0.12) | (5.77) | 4.42 | (1.00) |
| Distributions | | | | |
| From Net Realized Gains | — | (0.03) | — | — |
| Net Asset Value, End of Period | $7.50 | $7.62 | $13.42 | $9.00 |
| |
| Total Return(3) | (1.71)% | (43.09)% | 49.11% | (10.00)% |
| | | | | |
| Ratios/Supplemental Data | | | | |
| Ratio of Operating Expenses to Average Net Assets | 0.80% | 0.81% | 0.80% | 0.80%(4) |
| Ratio of Net Investment Income (Loss) to Average Net Assets | (0.35)% | (0.35)% | (0.36)% | (0.27)%(4) |
| Portfolio Turnover Rate | 190% | 183% | 147% | 109% |
| Net Assets, End of Period (in thousands) | $91,237 | $40,136 | $44,652 | $25,678 |
| (1) | May 12, 2006 (fund inception) through October 31, 2006. | | | | |
| (2) | Computed using average shares outstanding throughout the period. | | | | |
| (3) | Total return assumes reinvestment of net investment income and capital gains distributions, if any. Total returns are calculated based on the net |
| | asset value of the last business day. Total returns for periods less than one year are not annualized. | | |
| (4) | Annualized. | | | | |
| |
| |
| See Notes to Financial Statements. | | | | |
34
|
| Report of Independent Registered Public Accounting Firm |
The Board of Directors and Shareholders, American Century Mutual Funds, Inc.:
We have audited the accompanying statements of assets and liabilities, including the schedules of investments, of NT Growth Fund and NT Vista Fund, two of the funds constituting American Century Mutual Funds, Inc. (the “Corporation”), as of October 31, 2009, and the related statements of operations for the year then ended, the statements of changes in net assets for each of the two years in the period then ended, and the financial highlights for each of the three years in the period then ended and for the period May 12, 2006 (inception of the funds) through October 31, 2006. These financial statements and financial highlights are the responsibility of the Corporation’s management. Our responsibility is to express an opinion on these financial statements and financial highlights based on our audits.
We conducted our audits in accordance with the standards of the Public Company Accounting Oversight Board (United States). Those standards require that we plan and perform the audit to obtain reasonable assurance about whether the financial statements and financial highlights are free of material misstatement. The Corporation is not required to have, nor were we engaged to perform, an audit of its internal control over financial reporting. Our audits included consideration of internal control over financial reporting as a basis for designing audit procedures that are appropriate in the circumstances, but not for the purpose of expressing an opinion on the effectiveness of the Corporation’s internal control over financial reporting. Accordingly, we express no such opinion. An audit also includes examining, on a test basis, evidence supporting the amounts and disclosures in the financial statements, assessing the accounting principles used and significant estimates made by management, as well as evaluating the overall financial statement presentation. Our procedures included confirmation of securities owned as of October 31, 2009, by correspondence with the custodian and brokers; where replies were not received from brokers, we performed other auditing procedures. We believe that our audits provide a reasonable basis for our opinion.
In our opinion, the financial statements and financial highlights referred to above present fairly, in all material respects, the respective financial positions of NT Growth Fund and NT Vista Fund of American Century Mutual Funds, Inc., as of October 31, 2009, the results of their operations for the year then ended, the changes in their net assets for each of the two years in the period then ended, and the financial highlights for each of the three years in the period then ended and for the period May 12, 2006 through October 31, 2006, in conformity with accounting principles generally accepted in the United States of America.
Deloitte & Touche LLP
Kansas City, Missouri
December 28, 2009
35
The individuals listed below serve as directors or officers of the funds. Each director serves until his or her successor is duly elected and qualified or until he or she retires. Mandatory retirement age for independent directors is 72. Those listed as interested directors are “interested” primarily by virtue of their engagement as directors and/or officers of, or ownership interest in, American Century Companies, Inc. (ACC) or its wholly owned, direct or indirect, subsidiaries, including the funds’ investment advisor, American Century Investment Management, Inc. (ACIM); the funds’ principal underwriter, American Century Investment Services, Inc. (ACIS); and the funds’ transfer agent, American Century Services, LLC (ACS).
The other directors (more than three-fourths of the total number) are independent; that is, they have never been employees, directors or officers of, and have no financial interest in, ACC or any of its wholly owned, direct or indirect, subsidiaries, including ACIM, ACIS and ACS. The directors serve in this capacity for seven registered investment companies in the American Century Investments family of funds.
All persons named as officers of the funds also serve in similar capacities for the other 14 registered investment companies in the American Century Investments family of funds advised by ACIM or American Century Global Investment Management, Inc. (ACGIM), a wholly owned subsidiary of ACIM, unless otherwise noted. Only officers with policy-making functions are listed. No officer is compensated for his or her service as an officer of the funds. The listed officers are interested persons of the funds and are appointed or re-appointed on an annual basis.
Interested Director
Jonathan S. Thomas, 4500 Main Street, Kansas City, MO 64111
Year of Birth: 1963
Position(s) Held with Funds: Director (since 2007) and President (since 2007)
Principal Occupation(s) During Past 5 Years: President and Chief Executive Officer, ACC
(March 2007 to present); Chief Administrative Officer, ACC (February 2006 to
February 2007); Executive Vice President, ACC (November 2005 to February 2007).
Also serves as: President, Chief Executive Officer and Director, ACS; Executive
Vice President, ACIM and ACGIM; Director, ACIM, ACGIM, ACIS and other ACC
subsidiaries. Managing Director, Morgan Stanley (March 2000 to November 2005)
Number of Portfolios in Fund Complex Overseen by Director: 103
Other Directorships Held by Director: None
Independent Directors
Thomas A. Brown, 4500 Main Street, Kansas City, MO 64111
Year of Birth: 1940
Position(s) Held with Funds: Director (since 1980)
Principal Occupation(s) During Past 5 Years: Managing Member, Associated Investments, LLC
(real estate investment company); Managing Member, Brown Cascade Properties,
LLC (real estate investment company); Retired, Area Vice President, Applied
Industrial Technologies (bearings and power transmission company)
Number of Portfolios in Fund Complex Overseen by Director: 63
Other Directorships Held by Director: None
36
Andrea C. Hall, Ph.D., 4500 Main Street, Kansas City, MO 64111
Year of Birth: 1945
Position(s) Held with Funds: Director (since 1997)
Principal Occupation(s) During Past 5 Years: Retired, Advisor to the President, Midwest
Research Institute (not-for-profit, contract research organization)
Number of Portfolios in Fund Complex Overseen by Director: 63
Other Directorships Held by Director: None
James A. Olson, 4500 Main Street, Kansas City, MO 64111
Year of Birth: 1942
Position(s) Held with Funds: Director (since 2007)
Principal Occupation(s) During Past 5 Years: Member, Plaza Belmont LLC (private equity
fund manager); Chief Financial Officer, Plaza Belmont LLC (September 1999 to
September 2006)
Number of Portfolios in Fund Complex Overseen by Director: 63
Other Directorships Held by Director: Saia, Inc. and Entertainment Properties Trust
Donald H. Pratt, 4500 Main Street, Kansas City, MO 64111
Year of Birth: 1937
Position(s) Held with Funds: Director (since 1995) and Chairman of the Board (since 2005)
Principal Occupation(s) During Past 5 Years: Chairman and Chief Executive Officer, Western
Investments, Inc. (real estate company); Retired Chairman of the Board, Butler
Manufacturing Company (metal buildings producer)
Number of Portfolios in Fund Complex Overseen by Director: 63
Other Directorships Held by Director: None
Gale E. Sayers, 4500 Main Street, Kansas City, MO 64111
Year of Birth: 1943
Position(s) Held with Funds: Director (since 2000)
Principal Occupation(s) During Past 5 Years: President, Chief Executive Officer and Founder,
Sayers40, Inc. (technology products and services provider)
Number of Portfolios in Fund Complex Overseen by Director: 63
Other Directorships Held by Director: None
M. Jeannine Strandjord, 4500 Main Street, Kansas City, MO 64111
Year of Birth: 1945
Position(s) Held with Funds: Director (since 1994)
Principal Occupation(s) During Past 5 Years: Retired, formerly Senior Vice President, Sprint
Corporation (telecommunications company)
Number of Portfolios in Fund Complex Overseen by Director: 63
Other Directorships Held by Director: DST Systems, Inc.; Euronet Worldwide, Inc. and
Charming Shoppes, Inc.
John R. Whitten, 4500 Main Street, Kansas City, MO 64111
Year of Birth: 1946
Position(s) Held with Funds: Director (since 2008)
Principal Occupation(s) During Past 5 Years: Project Consultant, Celanese Corp. (industrial
chemical company) (September 2004 to January 2005)
Number of Portfolios in Fund Complex Overseen by Director: 63
Other Directorships Held by Director: Rudolph Technologies, Inc.
37
Officers
Barry Fink, 4500 Main Street, Kansas City, MO 64111
Year of Birth: 1955
Position(s) Held with Funds: Executive Vice President (since 2007)
Principal Occupation(s) During Past 5 Years: Chief Operating Officer and Executive Vice
President, ACC (September 2007 to present); President, ACS (October 2007 to
present); Managing Director, Morgan Stanley (2000 to 2007); Global General
Counsel, Morgan Stanley (2000 to 2006). Also serves as: Director, ACC, ACS, ACIS
and other ACC subsidiaries
Maryanne Roepke, 4500 Main Street, Kansas City, MO 64111
Year of Birth: 1956
Position(s) Held with Funds: Chief Compliance Officer (since 2006) and Senior Vice
President (since 2000)
Principal Occupation(s) During Past 5 Years: Chief Compliance Officer, ACIM, ACGIM and ACS
(August 2006 to present); Assistant Treasurer, ACC (January 1995 to August 2006);
and Treasurer and Chief Financial Officer, various American Century Investments
funds (July 2000 to August 2006). Also serves as: Senior Vice President, ACS
Charles A. Etherington, 4500 Main Street, Kansas City, MO 64111
Year of Birth: 1957
Position(s) Held with Funds: General Counsel (since 2007) and Senior Vice President
(since 2006)
Principal Occupation(s) During Past 5 Years: Attorney, ACC (February 1994 to present); Vice
President, ACC (November 2005 to present); General Counsel, ACC (March 2007
to present). Also serves as: General Counsel, ACIM, ACGIM, ACS, ACIS and other
ACC subsidiaries; and Senior Vice President, ACIM, ACGIM and ACS
Robert Leach, 4500 Main Street, Kansas City, MO 64111
Year of Birth: 1966
Position(s) Held with Funds: Vice President, Treasurer and Chief Financial Officer
(all since 2006)
Principal Occupation(s) During Past 5 Years: Vice President, ACS (February 2000 to present); and
Controller, various American Century Investments funds (1997 to September 2006)
David H. Reinmiller, 4500 Main Street, Kansas City, MO 64111
Year of Birth: 1963
Position(s) Held with Funds: Vice President (since September 2000)
Principal Occupation(s) During Past 5 Years: Attorney, ACC (January 1994 to present);
Associate General Counsel, ACC (January 2001 to present); Chief Compliance
Officer, American Century Investments funds, ACIM and ACGIM (January 2001 to
February 2005). Also serves as: Associate General Counsel, ACIM, ACGIM, ACS,
ACIS and other ACC subsidiaries; and Vice President, ACIM, ACGIM and ACS
Ward Stauffer, 4500 Main Street, Kansas City, MO 64111
Year of Birth: 1960
Position(s) Held with Funds: Secretary (since February 2005)
Principal Occupation(s) During Past 5 Years: Attorney, ACC (June 2003 to present)
The SAI has additional information about the funds’ directors and is available without charge, upon request, by calling 1-800-345-2021.
38
|
| Approval of Management Agreements |
Under Section 15(c) of the Investment Company Act, contracts for investment advisory services are required to be reviewed, evaluated and approved by a majority of a fund’s independent directors (the “Directors”) each year. At American Century Investments, this process is referred to as the “15(c) Process.” As a part of this process, the board reviews fund performance, shareholder services, audit and compliance information, and a variety of other reports from the advisor concerning fund operations. In addition to this annual review, the board of directors oversees and evaluates on a continuous basis at its quarterly meetings the nature and quality of significant services performed by the advisor, fund performance, audit and compliance information, and a variety of other reports relating to fund operations. The board, or committees of the board, also holds special meetings as needed.
Under a Securities and Exchange Commission rule, each fund is required to disclose in its annual or semiannual report, as appropriate, the material factors and conclusions that formed the basis for the board’s approval or renewal of any advisory agreements within the fund’s most recently completed fiscal half-year period.
Annual Contract Review Process
As part of the annual 15(c) Process undertaken during the most recent fiscal half-year period, the Directors reviewed extensive data and information compiled by the advisor and certain independent providers of evaluative data (the “15(c) Providers”) concerning NT Growth and NT Vista (the “Funds”) and the services provided to the Funds under the management agreement. The information considered and the discussions held at the meetings included, but were not limited to:
• the nature, extent and quality of investment management, shareholder services and other services provided to the Funds;
• the wide range of programs and services the advisor provides to the Funds and their shareholders on a routine and non-routine basis;
• the compliance policies, procedures, and regulatory experience of the advisor;
• data comparing the cost of owning the Funds to the cost of owning a similar fund;
• data comparing the Funds’ performance to appropriate benchmarks and/ or a peer group of other mutual funds with similar investment objectives and strategies;
• financial data showing the profitability of the Funds to the advisor and the overall profitability of the advisor;
• data comparing services provided and charges to other investment management clients of the advisor; and
• consideration of collateral benefits derived by the advisor from the management of the Funds and any potential economies of scale relating thereto.
39
In keeping with its practice, the Funds’ board of directors held two in-person meetings and one telephonic meeting to review and discuss the information provided. The board also had the benefit of the advice of its independent counsel throughout the period.
Factors Considered
The Directors considered all of the information provided by the advisor, the 15(c) Providers, and the board’s independent counsel, and evaluated such information for each fund for which the board has responsibility. In connection with their review of the Funds, the Directors did not identify any single factor as being all-important or controlling, and each Director may have attributed different levels of importance to different factors. In deciding to renew the management and subadvisory agreements under the terms ultimately determined by the board to be appropriate, the Directors’ decision was based on the following factors.
Nature, Extent and Quality of Services — Generally. Under the management agreement, the advisor is responsible for providing or arranging for all services necessary for the operation of the Funds. The board noted that under the management agreement, the advisor provides or arranges at its own expense a wide variety of services including:
• Fund construction and design
• portfolio security selection
• initial capitalization/funding
• securities trading
• Fund administration
• custody of Fund assets
• daily valuation of each Fund’s portfolio
• shareholder servicing and transfer agency, including shareholder
confirmations, recordkeeping and communications
• legal services
• regulatory and portfolio compliance
• financial reporting
• marketing and distribution
40
The Directors noted that many of the services provided by the advisor have expanded over time both in terms of quantity and complexity in response to shareholder demands, competition in the industry and the changing regulatory environment. They discussed with the advisor the challenges presented by these changes and the impact on the Funds. In performing their evaluation, the Directors considered information received in connection with the annual review, as well as information provided on an ongoing basis at their regularly scheduled board and committee meetings.
Investment Management Services. The nature of the investment management services provided to the Funds is quite complex and allows Fund shareholders access to professional money management, instant diversification of their investments, and liquidity. In evaluating investment performance, the board expects the advisor to manage the Funds in accordance with its investment objectives and approved strategies. Further, the Directors recognize that the advisor has an obligation to monitor trading activities, and in particular to seek the best execution of fund trades, and to evaluate the use of and payment for research. In providing these services, the advisor utilizes teams of investment professionals (portfolio managers, analysts, research assistants, and securities traders) who require extensive information technology, research, training, com pliance and other systems to conduct their business. At each quarterly meeting the Directors review investment performance information for the Funds, together with comparative information for appropriate benchmarks and/or peer groups of funds managed similarly to the Funds. The Directors also review detailed performance information during the 15(c) Process comparing each Fund’s performance with that of similar funds not managed by the advisor. If performance concerns are identified, the Directors discuss with the advisor the reasons for such results (e.g., market conditions, security selection) and any efforts being undertaken to improve performance. NT Growth’s performance for both the one- and three-year periods was above the median for its peer group. NT Vista’s performance was above the median for its peer group for the three-year period and below the median for the one-year period.
Shareholder and Other Services. The advisor provides the Funds with a comprehensive package of transfer agency, shareholder, and other services. The Directors review reports and evaluations of such services at their regular quarterly meetings, including the annual meeting concerning contract review, and reports to the board. These reports include, but are not limited to, information regarding the operational efficiency and accuracy of the shareholder and transfer agency services provided, staffing levels, shareholder satisfaction (as measured by external as well as internal sources), technology support, new products and services offered to Fund shareholders, securities trading activities, portfolio valuation services, auditing services, and legal and operational compliance activities. Certain aspects of shareholder and transfer agency serv ice level efficiency and the quality of securities trading activities are measured by independent third party providers and are presented in comparison to other fund groups not managed by the advisor.
41
Costs of Services Provided and Profitability. The advisor provides detailed information concerning its cost of providing various services to the Funds, its profitability in managing the Funds, its overall profitability, and its financial condition. The Directors have reviewed with the advisor the methodology used to prepare this financial information. This financial information regarding the advisor is considered in order to evaluate the advisor’s financial condition, its ability to continue to provide services under the management agreement, and the reasonableness of the current management fee. The board concluded that the advisor’s profits were reasonable in light of the services provided to the Funds.
Ethics. The Directors generally consider the advisor’s commitment to providing quality services to shareholders and to conducting its business ethically. They noted that the advisor’s practices generally meet or exceed industry best practices.
Economies of Scale. The Directors review information provided by the advisor regarding the possible existence of economies of scale in connection with the management of the Funds. The Directors concluded that economies of scale are difficult to measure and predict with precision, especially on a fund-by-fund basis. The analysis of economies of scale is further complicated by the additional services and content provided by the advisor and its reinvestment in its ability to provide and expand those services. Accordingly, the Directors seek to evaluate economies of scale by reviewing other information, such as year-over-year profitability of the advisor generally, the profitability of its management of the Funds specifically, the expenses incurred by the advisor in providing various functions to the Funds, and the fees of competitive funds no t managed by the advisor. The Directors believe the advisor is appropriately sharing economies of scale through its competitive fee structure, fee breakpoints as each Fund increases in size, and through reinvestment in its business to provide shareholders additional content and services.
Comparison to Other Funds’ Fees. The Funds pay the advisor a single, all-inclusive (or unified) management fee for providing all services necessary for the management and operation of the Funds, other than brokerage expenses, taxes, interest, extraordinary expenses, and the fees and expenses of each Fund’s independent directors (including their independent legal counsel). Under the unified fee structure, the advisor is responsible for providing all investment advisory, custody, audit, administrative, compliance, record-keeping, marketing and shareholder services, or arranging and supervising third parties to provide such services. By contrast, most other funds are charged a variety of fees, including an investment advisory fee, a transfer agency fee, an administrative fee, distribution charges and other expenses. Other than their investment advisory fees and Rule 12b-1 distribution fees, all other components of the total fees charged by these other funds may be increased without shareholder approval. The board believes the unified fee structure is a benefit to Fund shareholders because it clearly discloses to shareholders the cost of owning Fund shares, and, since the unified fee cannot be increased without a vote of Fund shareholders, it shifts to the advisor the risk of increased costs of operating the Funds and provides a direct incentive to minimize administrative inefficiencies. Part of the
42
Directors’ analysis of fee levels involves reviewing certain evaluative data compiled by a 15(c) Provider comparing each Fund’s unified fee to the total expense ratio of other funds in the Funds’ peer group and performing a regression analysis to evaluate the effect of fee breakpoints as assets under management increase. The unified fee charged to shareholders of each of the Funds was below the median of the total expense ratios of its respective peer group. In addition, the Directors also reviewed updated fee level data provided by the advisor, but recognized that comparative data was particularly difficult to evaluate given the significant market developments during the past year. The board concluded that the management fee paid by each Fund to the advisor was reasonable in light of the services provided to the Funds.
Comparison to Fees and Services Provided to Other Clients of the Advisor. The Directors also requested and received information from the advisor concerning the nature of the services, fees, and profitability of its advisory services to advisory clients other than the Funds. They observed that these varying types of client accounts require different services and involve different regulatory and entrepreneurial risks than the management of the Funds. The Directors analyzed this information and concluded that the fees charged and services provided to the Funds were reasonable by comparison.
Collateral Benefits Derived by the Advisor. The Directors considered the existence of collateral benefits the advisor may receive as a result of its relationship with the Funds. They concluded that the advisor’s primary business is managing mutual funds and it generally does not use fund or shareholder information to generate profits in other lines of business, and therefore does not derive any significant collateral benefits from them. The Directors noted that the advisor receives proprietary research from broker-dealers that execute fund portfolio transactions and concluded that this research is likely to benefit fund shareholders. The Directors also determined that the advisor is able to provide investment management services to certain clients other than the Funds, at least in part, due to its existing infrastructure built to serv e the fund complex. The Directors concluded, however, that the assets of those other clients are not material to the analysis and, in any event, are included with the assets of the Funds to determine breakpoints in each Fund’s fee schedule, provided they are managed using the same investment team and strategy.
Conclusions of the Directors
As a result of this process, the board, including all of the independent directors, in the absence of particular circumstances and assisted by the advice of legal counsel that is independent of the advisor, taking into account all of the factors discussed above and the information provided by the advisor concluded that the investment management agreement between each Fund and the advisor is fair and reasonable in light of the services provided and should be renewed.
43
Retirement Account Information
As required by law, distributions you receive from certain IRAs, or 403(b), 457 and qualified plans are subject to federal income tax withholding, unless you elect not to have withholding apply. Tax will be withheld on the total amount withdrawn even though you may be receiving amounts that are not subject to withholding, such as nondeductible contributions. In such case, excess amounts of withholding could occur. You may adjust your withholding election so that a greater or lesser amount will be withheld.
If you don’t want us to withhold on this amount, you must notify us to not withhold the federal income tax. You may notify us in writing or in certain situations by telephone or through other electronic means. You have the right to revoke your withholding election at any time and any election you make may remain in effect until revoked by filing a new election.
Remember, even if you elect not to have income tax withheld, you are liable for paying income tax on the taxable portion of your withdrawal. If you elect not to have income tax withheld or you don’t have enough income tax withheld, you may be responsible for payment of estimated tax. You may incur penalties under the estimated tax rules if your withholding and estimated tax payments are not sufficient. You can reduce or defer the income tax on a distribution by directly or indirectly rolling such distribution over to another IRA or eligible plan. You should consult your tax advisor for additional information.
State tax will be withheld if, at the time of your distribution, your address is within one of the mandatory withholding states and you have federal income tax withheld. State taxes will be withheld from your distribution in accordance with the respective state rules.
Proxy Voting Guidelines
American Century Investment Management, Inc., the funds’ investment advisor, is responsible for exercising the voting rights associated with the securities purchased and/or held by the funds. A description of the policies and procedures the advisor uses in fulfilling this responsibility is available without charge, upon request, by calling 1-800-345-2021. It is also available on American Century Investments’ website at americancentury.com and on the Securities and Exchange Commission’s website at sec.gov. Information regarding how the investment advisor voted proxies relating to portfolio securities during the most recent 12-month period ended June 30 is available on the “About Us” page at americancentury.com. It is also available at sec.gov.
Quarterly Portfolio Disclosure
The funds file their complete schedule of portfolio holdings with the Securities and Exchange Commission (SEC) for the first and third quarters of each fiscal year on Form N-Q. The funds’ Forms N-Q are available on the SEC’s website at sec.gov, and may be reviewed and copied at the SEC’s Public Reference Room in Washington, DC. Information on the operation of the Public Reference Room may be obtained by calling 1-800-SEC-0330. The funds also make their complete schedule of portfolio holdings for the most recent quarter of their fiscal year available on their website at americancentury.com and, upon request, by calling 1-800-345-2021.
44
The following indices are used to illustrate investment market, sector, or style performance or to serve as fund performance comparisons. They are not investment products available for purchase.
The Russell 1000® Index is a market-capitalization weighted, large-cap index created by Frank Russell Company to measure the performance of the 1,000 largest publicly traded U.S. companies, based on total market capitalization.
The Russell 1000® Growth Index measures the performance of those Russell 1000 Index companies (the 1,000 largest publicly traded U.S. companies, based on total market capitalization) with higher price-to-book ratios and higher forecasted growth values.
The Russell 1000® Value Index measures the performance of those Russell 1000 Index companies (the 1,000 largest publicly traded U.S. companies, based on total market capitalization) with lower price-to-book ratios and lower forecasted growth values.
The Russell 2000® Index is a market-capitalization weighted index created by Frank Russell Company to measure the performance of the 2,000 smallest of the 3,000 largest publicly traded U.S. companies, based on total market capitalization.
The Russell 2000® Growth Index measures the performance of those Russell 2000 Index companies (the 2,000 smallest of the 3,000 largest publicly traded U.S. companies, based on total market capitalization) with higher price-to-book ratios and higher forecasted growth values.
The Russell 2000® Value Index measures the performance of those Russell 2000 Index companies (the 2,000 smallest of the 3,000 largest publicly traded U.S. companies, based on total market capitalization) with lower price-to-book ratios and lower forecasted growth values.
The Russell Midcap® Index measures the performance of the 800 smallest of the 1,000 largest publicly traded U.S. companies, based on total market capitalization.
The Russell Midcap® Growth Index measures the performance of those Russell Midcap Index companies (the 800 smallest of the 1,000 largest publicly traded U.S. companies, based on total market capitalization) with higher price-to-book ratios and higher forecasted growth values.
The Russell Midcap® Value Index measures the performance of those Russell Midcap Index companies (the 800 smallest of the 1,000 largest publicly traded U.S. companies, based on total market capitalization) with lower price-to-book ratios and lower forecasted growth values.
45
46
47
48

| |
| |
| Contact Us | |
| americancentury.com | |
| Automated Information Line | 1-800-345-8765 |
| Investor Services Representative | 1-800-345-2021 or |
| | 816-531-5575 |
| Business, Not-For-Profit, Employer-Sponsored | |
| Retirement Plans | 1-800-345-3533 |
| Banks and Trust Companies, Broker-Dealers, | |
| Financial Professionals, Insurance Companies | 1-800-345-6488 |
| Telecommunications Device for the Deaf | 1-800-634-4113 |
| American Century Mutual Funds, Inc. | |
| Investment Advisor: | |
| American Century Investment Management, Inc. | |
| Kansas City, Missouri | |
This report and the statements it contains are submitted for the general
information of our shareholders. The report is not authorized for distribution to
prospective investors unless preceded or accompanied by an effective prospectus.
American Century Investment Services, Inc., Distributor
©2009 American Century Proprietary Holdings, Inc. All rights reserved.
0912
CL-ANN-67037N
ITEM 2. CODE OF ETHICS.
| | |
| (a) | The registrant has adopted a Code of Ethics for Senior Financial Officers that applies to the |
| | registrant’s principal executive officer, principal financial officer, principal accounting officer, |
| | and persons performing similar functions. |
| (b) | No response required. |
| (c) | None. | |
| (d) | None. | |
| (e) | Not applicable. |
| (f) | The registrant’s Code of Ethics for Senior Financial Officers was filed as Exhibit 12 (a)(1) to |
| | American Century Asset Allocation Portfolios, Inc.’s Annual Certified Shareholder Report on |
| | Form N-CSR, File No. 811-21591, on September 29, 2005, and is incorporated herein by |
| | reference. | |
|
| ITEM 3. AUDIT COMMITTEE FINANCIAL EXPERT. |
| (a)(1) | The registrant’s board has determined that the registrant has at least one audit committee |
| | financial expert serving on its audit committee. |
| (a)(2) | James A. Olson, Thomas A. Brown and Gale E. Sayers are the registrant’s designated audit |
| | committee financial experts. They are “independent” as defined in Item 3 of Form N-CSR. |
| (a)(3) | Not applicable. |
| (b) | No response required. |
| (c) | No response required. |
| (d) | No response required. |
|
| ITEM 4. PRINCIPAL ACCOUNTANT FEES AND SERVICES. |
| (a) | Audit Fees. | |
| The aggregate fees billed for each of the last two fiscal years for professional services rendered by the |
| principal accountant for the audit of the registrant’s annual financial statements or services that are |
| normally provided by the accountant in connection with statutory and regulatory filings or engagements |
| for those fiscal years were as follows: |
| | FY 2008: | $317,528 |
| | FY 2009: | $281,906 |
| (b) | Audit-Related Fees. |
| The aggregate fees billed in each of the last two fiscal years for assurance and related services by the |
| principal accountant that are reasonably related to the performance of the audit of the registrant’s |
| financial statements and are not reported under paragraph (a) of this Item were as follows: |
| | |
| | For services rendered to the registrant: |
| |
| | FY 2008: | $0 |
| | FY 2009: | $0 |
| |
| | Fees required to be approved pursuant to paragraph (c)(7)(ii) of Rule 2-01 of Regulation S-X |
| | (relating to certain engagements for non-audit services with the registrant’s investment adviser |
| | and its affiliates): |
| |
| | FY 2008: | $0 |
| | FY 2009: | $0 |
| |
| (c) | Tax Fees. | |
| |
| The aggregate fees billed in each of the last two fiscal years for professional services rendered by the |
| principal accountant for tax compliance, tax advice, and tax planning were as follows: |
| |
| | For services rendered to the registrant: |
| |
| | FY 2008: | $0 |
| | FY 2009: | $0 |
| |
| | Fees required to be approved pursuant to paragraph (c)(7)(ii) of Rule 2-01 of Regulation S-X |
| | (relating to certain engagements for non-audit services with the registrant’s investment adviser |
| | and its affiliates): |
| |
| | FY 2008: | $0 |
| | FY 2009: | $0 |
| |
| (d) | All Other Fees. |
| |
| The aggregate fees billed in each of the last two fiscal years for products and services provided by the |
| principal accountant, other than the services reported in paragraphs (a) through (c) of this Item were as |
| follows: | | |
| |
| | For services rendered to the registrant: |
| |
| | FY 2008: | $0 |
| | FY 2009: | $0 |
| |
| | Fees required to be approved pursuant to paragraph (c)(7)(ii) of Rule 2-01 of Regulation S-X |
| | (relating to certain engagements for non-audit services with the registrant’s investment adviser |
| | and its affiliates): |
| |
| | FY 2008: | $0 |
| | FY 2009: | $0 |
| | |
| (e)(1) | In accordance with paragraph (c)(7)(i)(A) of Rule 2-01 of Regulation S-X, before the |
| | accountant is engaged by the registrant to render audit or non-audit services, the engagement is |
| | approved by the registrant’s audit committee. Pursuant to paragraph (c)(7)(ii) of Rule 2-01 of |
| | Regulation S-X, the registrant’s audit committee also pre-approves its accountant’s |
| | engagements for non-audit services with the registrant’s investment adviser, its parent company, |
| | and any entity controlled by, or under common control with the investment adviser that |
| | provides ongoing services to the registrant, if the engagement relates directly to the operations |
| | and financial reporting of the registrant. |
| |
| (e)(2) | All services described in each of paragraphs (b) through (d) of this Item were pre-approved |
| | before the engagement by the registrant’s audit committee pursuant to paragraph (c)(7)(i)(A) of |
| | Rule 2-01 of Regulation S-X. Consequently, none of such services were required to be |
| | approved by the audit committee pursuant to paragraph (c)(7)(i)(C). |
| |
| (f) | The percentage of hours expended on the principal accountant’s engagement to audit the |
| | registrant’s financial statements for the most recent fiscal year that were attributed to work |
| | performed by persons other than the principal accountant’s full-time, permanent employees was |
| | less than 50%. |
| |
| (g) | The aggregate non-audit fees billed by the registrant’s accountant for services rendered to the |
| | registrant, and rendered to the registrant’s investment adviser (not including any sub-adviser |
| | whose role is primarily portfolio management and is subcontracted with or overseen by another |
| | investment adviser), and any entity controlling, controlled by, or under common control with |
| | the adviser that provides ongoing services to the registrant for each of the last two fiscal years |
| | of the registrant were as follows: |
| |
| | FY 2008: | $80,618 |
| | FY 2009: | $76,542 |
| |
| (h) | The registrant’s investment adviser and accountant have notified the registrant’s audit committee |
| of all non-audit services that were rendered by the registrant’s accountant to the registrant’s investment |
| adviser, its parent company, and any entity controlled by, or under common control with the investment |
| adviser that provides services to the registrant, which services were not required to be pre-approved |
| pursuant to paragraph (c)(7)(ii) of Rule 2-01 of Regulation S-X. The notification provided to the |
| registrant’s audit committee included sufficient details regarding such services to allow the registrant’s |
| audit committee to consider the continuing independence of its principal accountant. |
| |
| ITEM 5. AUDIT COMMITTEE OF LISTED REGISTRANTS. |
| |
| Not applicable. | |
| |
| ITEM 6. INVESTMENTS. |
| |
| (a) | The schedule of investments is included as part of the report to stockholders filed under Item 1 |
| | of this Form. | |
| |
| (b) | Not applicable. |
| |
| ITEM 7. DISCLOSURE OF PROXY VOTING POLICIES AND PROCEDURES FOR |
| CLOSED-END MANAGEMENT INVESTMENT COMPANIES. |
| |
| Not applicable. | |
| |
| ITEM 8. PORTFOLIO MANAGERS OF CLOSED-END MANAGEMENT |
| INVESTMENT COMPANIES. |
| |
| Not applicable. |
| |
| ITEM 9. PURCHASES OF EQUITY SECURITIES BY CLOSED-END MANAGEMENT |
| INVESTMENT COMPANY AND AFFILIATED PURCHASERS. |
| |
| Not applicable. |
| |
| ITEM 10. SUBMISSION OF MATTERS TO A VOTE OF SECURITY HOLDERS. |
| |
| During the reporting period, there were no material changes to the procedures by which shareholders may |
| recommend nominees to the registrant’s board. |
| |
| ITEM 11. CONTROLS AND PROCEDURES. |
| |
| (a) | The registrant's principal executive officer and principal financial officer have concluded that |
| | the registrant's disclosure controls and procedures (as defined in Rule 30a-3(c) under the |
| | Investment Company Act of 1940) are effective based on their evaluation of these controls and |
| | procedures as of a date within 90 days of the filing date of this report. |
| |
| (b) | There were no changes in the registrant's internal control over financial reporting (as defined in |
| | Rule 30a-3(d) under the Investment Company Act of 1940) that occurred during the registrant's |
| | second fiscal quarter of the period covered by this report that have materially affected, or are |
| | reasonably likely to materially affect, the registrant's internal control over financial reporting. |
| |
| ITEM 12. EXHIBITS. |
| |
| (a)(1) | Registrant’s Code of Ethics for Senior Financial Officers, which is the subject of the disclosure |
| | required by Item 2 of Form N-CSR, was filed as Exhibit 12(a)(1) to American Century Asset |
| | Allocation Portfolios, Inc.’s Certified Shareholder Report on Form N-CSR, File No. 811-21591, |
| | on September 29, 2005. |
| |
| (a)(2) | Separate certifications by the registrant’s principal executive officer and principal financial |
| | officer, pursuant to Section 302 of the Sarbanes-Oxley Act of 2002 and Rule 30a-2(a) under the |
| | Investment Company Act of 1940, are filed and attached hereto as EX-99.CERT. |
| |
| (a)(3) | Not applicable. |
| |
| (b) | A certification by the registrant’s chief executive officer and chief financial officer, pursuant to |
| | Section 906 of the Sarbanes-Oxley Act of 2002, is furnished and attached hereto as EX- |
| | 99.906CERT. |
SIGNATURES
Pursuant to the requirements of the Securities Exchange Act of 1934 and the Investment Company Act of 1940, the registrant has duly caused this report to be signed on its behalf by the undersigned, thereunto duly authorized.
| | |
| Registrant: | American Century Mutual Funds, Inc. |
| |
| By: | /s/ Jonathan S. Thomas |
| | Name: | Jonathan S. Thomas |
| | Title: | President |
| |
| Date: | December 30, 2009 |
Pursuant to the requirements of the Securities Exchange Act of 1934 and the Investment Company Act of 1940, this report has been signed below by the following persons on behalf of the registrant and in the capacities and on the dates indicated.
| | |
| By: | /s/ Jonathan S. Thomas |
| | Name: | Jonathan S. Thomas |
| | Title: | President |
| | | (principal executive officer) |
| |
| Date: | December 30, 2009 |
| | |
| By: | /s/ Robert J. Leach |
| | Name: | Robert J. Leach |
| | Title: | Vice President, Treasurer, and |
| | | Chief Financial Officer |
| | | (principal financial officer) |
| |
| Date: | December 30, 2009 |