American Century Investment Services, Inc., Distributor
©2010 American Century Proprietary Holdings, Inc. All rights reserved.
| Annual Report |
| October 31, 2010 |
American Century Investments®
| | President’s Letter | 2 |
| | Independent Chairman’s Letter | 3 |
| | Market Perspective | 4 |
| | U.S. Stock Index Returns | 4 |
| | | |
| Heritage |
| |
| | Performance | 5 |
| | Portfolio Commentary | 7 |
| | Top Ten Holdings | 9 |
| | Top Five Industries | 9 |
| | Types of Investments in Portfolio | 9 |
| | | |
| | Shareholder Fee Example | 10 |
| | | |
| Financial Statements |
| |
| | Schedule of Investments | 12 |
| | Statement of Assets and Liabilities | 15 |
| | Statement of Operations | 16 |
| | Statement of Changes in Net Assets | 17 |
| | Notes to Financial Statements | 18 |
| | Financial Highlights | 25 |
| | Report of Independent Registered Public Accounting Firm | 31 |
| | | |
| Other Information |
| |
| | Proxy Voting Results | 32 |
| | Management | 33 |
| | Additional Information | 37 |
| | Index Definitions | 38 |
Any opinions expressed in this report reflect those of the author as of the date of the report, and do not necessarily represent the opinions of American Century Investments or any other person in the American Century Investments organization. Any such opinions are subject to change at any time based upon market or other conditions and American Century Investments disclaims any responsibility to update such opinions. These opinions may not be relied upon as investment advice and, because investment decisions made by American Century Investments funds are based on numerous factors, may not be relied upon as an indication of trading intent on behalf of any American Century Investments fund. Security examples are used for representational purposes only and are not intended as recommendations to purchase or sell securities. Performance information for comparative indices and securities is provided to American Century Investments by third party vendors. To the best of American Century Investments’ knowledge, such information is accurate at the time of printing.
Jonathan Thomas
Dear Investor:
To learn more about the capital markets, your investment, and the portfolio management strategies American Century Investments provides, we encourage you to review this shareholder report for the financial reporting period ended October 31, 2010.
On the following pages, you will find investment performance and portfolio information, presented with the expert perspective and commentary of our portfolio management team. This report remains one of our most important vehicles for conveying the information you need about your investment performance, and about the market factors and strategies that affect fund returns. For additional information on the markets, we encourage you to visit the “Insights & News” tab at our Web site, americancentury.com, for updates and further expert commentary.
The top of our Web site’s home page also provides a link to “Our Story,” which, first and foremost, outlines our commitment—since 1958—to helping clients reach their financial goals. We believe strongly that we will only be successful when our clients are successful. That’s who we are.
Another important, unique facet of our story and who we are is “Profits with a Purpose,” which describes our bond with the Stowers Institute for Medical Research (SIMR). SIMR is a world-class biomedical organization—founded by our company founder James E. Stowers, Jr. and his wife Virginia—that is dedicated to researching the causes, treatment, and prevention of gene-based diseases, including cancer. Through American Century Investments’ private ownership structure, more than 40% of our profits support SIMR.
Mr. Stowers’ example of achieving financial success and using that platform to help humanity motivates our entire American Century Investments team. His story inspires us to help each of our clients achieve success. Thank you for sharing your financial journey with us.
Sincerely,
Jonathan Thomas
President and Chief Executive Officer
American Century Investments
Independent Chairman’s Letter
Don Pratt
Dear Fellow Shareholders,
As regulators and the markets continue to sort out the events of the credit crisis, a consistent theme has been that financial services firms should re-examine their risk management practices. Risk management has been a regular part of American Century Investments’ activities for many years. However, recently American Century and your mutual fund board have been spending additional time focusing on our risk oversight processes.
The board’s efforts are now organized around three categories of risk: investment risk, operational risk, and enterprise risk. This approach has facilitated a realignment of many risk oversight tasks that the board has historically conducted. Investment risk tasks include a review of portfolio risk, monitoring the use of derivatives, and performance assessment. Operational risk focuses on compliance, valuation, shareholder services, and trading activities. Enterprise risk addresses the financial condition of the advisor, human resource development, and reputational risks. Risk oversight tasks are addressed in every quarterly board meeting, and a review of the advisor’s entire risk management program is undertaken annually. We acknowledge and support the approach that American Century Investments takes to its risk management responsibilities. While the board has refocused its efforts in this important oversight area, we recognize that risk oversight is a journey and we expect to continue to improve our processes.
Our September quarterly board meeting was held in the New York offices of American Century Investments. This gave the directors an opportunity to meet with the portfolio management teams for each of the global and international funds overseen by the board. Each team uses sophisticated investment tools and daily risk analysis in managing client assets. We also were impressed with the “bench strength” that has been developed under the leadership of the Global and Non-U.S. Equity CIO Mark Kopinski. These face-to-face meetings provide an opportunity for the directors—working on behalf of shareholders—to validate the advisor’s efforts and the investment management approach being followed.
I thank you for your continued confidence in American Century during this turbulent time in the economy and investment markets. If you have thoughts or questions you would like to share with the board send them to me at dhpratt@fundboardchair.com.
Best regards,
Don Pratt
By David Hollond, Chief Investment Officer, U.S. Growth Equity—Mid & Small Cap
Stocks Rallied Amid Growing Volatility
U.S. stocks advanced for the 12 months ended October 31, 2010, as the broad equity indices posted double-digit gains. Virtually all of the market’s gains occurred in the first six months of the period, when stocks continued to climb after reaching a multi-year low in March 2009. The key factors behind the rally included favorable economic data, which provided evidence of a burgeoning recovery, and better-than-expected corporate earnings, which resulted largely from cost-cutting measures by many businesses to widen profit margins.
Market conditions changed abruptly in late April as evidence of a pullback in economic activity led to concerns about a relapse into recession. These concerns were amplified by a sovereign debt crisis in Greece that began to spread across Europe. In response, the equity market declined sharply throughout May and June as market volatility increased substantially.
The equity market remained volatile in the third quarter, gaining ground in July and falling back in August amid a tug-of-war between positive corporate earnings reports and an increasingly sluggish economic environment. However, stocks staged a resurgence during the final two months of the period as investors expressed confidence in the Federal Reserve’s plan to revive the economic recovery via another round of quantitative easing.
Small- and Mid-Cap Growth Stocks Outperformed
While stocks advanced across the board, the 12-month period was especially favorable for mid- and small-cap growth stocks. The small- and mid-cap segments of the market led the overall advance, returning more than 25% (see the table below). Smaller companies suffered the largest losses during the downturn in late 2008 and early 2009 and thus far have enjoyed the highest returns during the market’s recovery.
In addition, growth-oriented issues outpaced value shares across all market capitalizations. The best-performing sectors in the market were those traditionally associated with growth, such as information technology and consumer discretionary. In addition, the financials sector—a major component in value indices—underperformed during the period.
| U.S. Stock Index Returns |
| For the 12 months ended October 31, 2010 |
| Russell 1000 Index (Large-Cap) | 17.67% | | Russell 2000 Index (Small-Cap) | 26.58% |
| Russell 1000 Growth Index | 19.65% | | Russell 2000 Growth Index | 28.67% |
| Russell 1000 Value Index | 15.71% | | Russell 2000 Value Index | 24.43% |
| Russell Midcap Index | 27.71% | | |
| Russell Midcap Growth Index | 28.03% | | | |
| Russell Midcap Value Index | 27.49% | | | |
Heritage
| Total Returns as of October 31, 2010 |
| | | | Average Annual Returns | |
| | Ticker Symbol | 1 year(1) | 5 years | 10 years | Since Inception | Inception Date |
| Investor Class | TWHIX | 34.15% | 10.19% | 3.76% | 11.53% | 11/10/87 |
Russell Midcap Growth Index | — | 28.03% | 4.28% | 0.20% | 10.38%(2) | — |
| Russell Midcap Index | — | 27.71% | 4.01% | 5.42% | 11.70%(2) | — |
| Institutional Class | ATHIX | 34.44% | 10.42% | 3.98% | 8.30% | 6/16/97 |
A Class(3) No sales charge* With sales charge* | ATHAX | 33.76% 26.10% | 9.91% 8.61% | 3.49% 2.88% | 7.48% 7.00% | 7/11/97 |
B Class No sales charge* With sales charge* | ATHBX | 32.84% 28.84% | — — | — — | -2.70% -3.74% | 9/28/07 |
| C Class | AHGCX | 32.85% | 9.10% | — | 5.19% | 6/26/01 |
| R Class | ATHWX | 33.50% | — | — | -2.21% | 9/28/07 |
*Sales charges include initial sales charges and contingent deferred sales charges (CDSCs), as applicable. A Class shares have a 5.75% maximum initial sales charge for equity funds and may be subject to a maximum CDSC of 1.00%. B Class shares redeemed within six years of purchase are subject to a CDSC that declines from 5.00% during the first year after purchase to 0.00% the sixth year after purchase. C Class shares redeemed within 12 months of purchase are subject to a maximum CDSC of 1.00%. The SEC requires that mutual funds provide performance information net of maximum sales charges in all cases where charges could be applied.
| (1) | Extraordinary performance is attributable in part to unusually favorable market conditions and may not be repeated or consistently achieved in the future. |
| (2) | Since 10/31/87, the date nearest the Investor Class’s inception for which data are available. |
| (3) | Prior to September 4, 2007, the A Class was referred to as the Advisor Class and did not have a front-end sales charge. Performance prior to that date has been adjusted to reflect this charge. |
Data presented reflect past performance. Past performance is no guarantee of future results. Current performance may be higher or lower than the performance shown. Investment return and principal value will fluctuate, and redemption value may be more or less than original cost. To obtain performance data current to the most recent month end, please call 1-800-345-2021 or visit americancentury.com. International investing involves special risks, such as political instability and currency fluctuations. Investing in emerging markets may accentuate these risks.
Unless otherwise indicated, performance reflects Investor Class shares; performance for other share classes will vary due to differences in fee structure. For information about other share classes available, please consult the prospectus. Data assumes reinvestment of dividends and capital gains, and none of the charts reflect the deduction of taxes that a shareholder would pay on fund distributions or the redemption of fund shares. Returns for the indices are provided for comparison. The fund’s total returns include operating expenses (such as transaction costs and management fees) that reduce returns, while the total returns of the indices do not.
Heritage
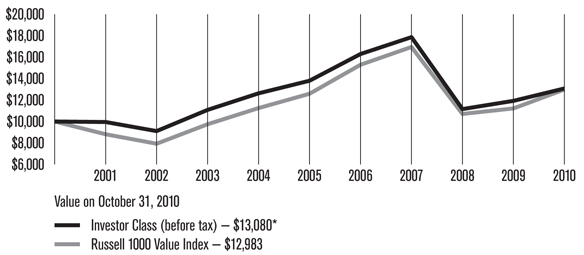
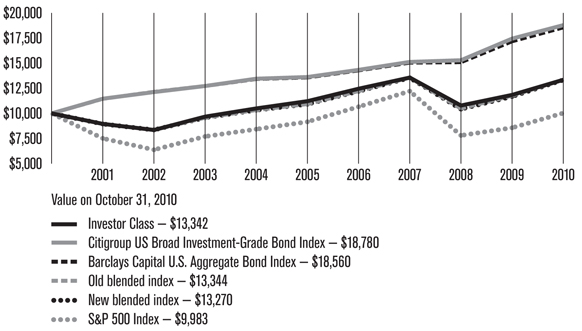
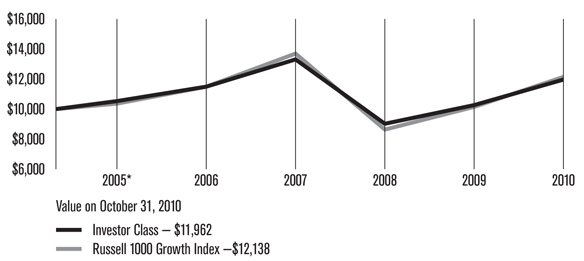
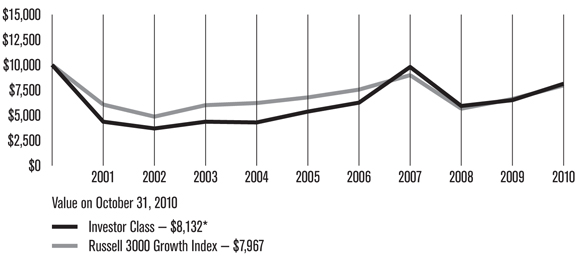
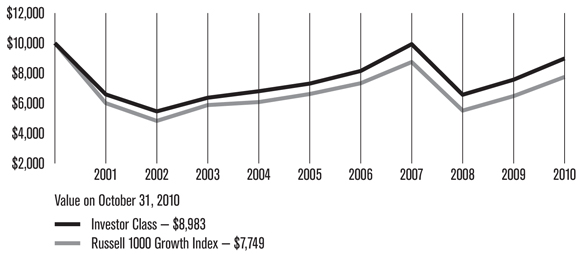
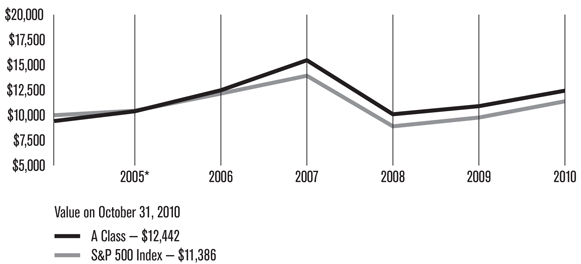
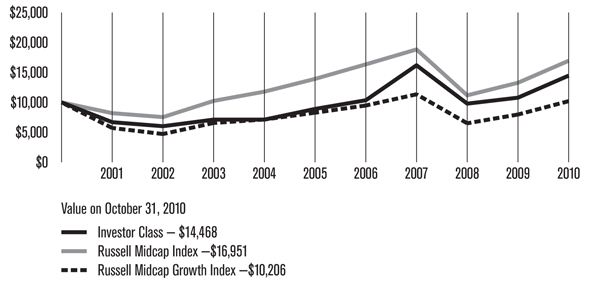
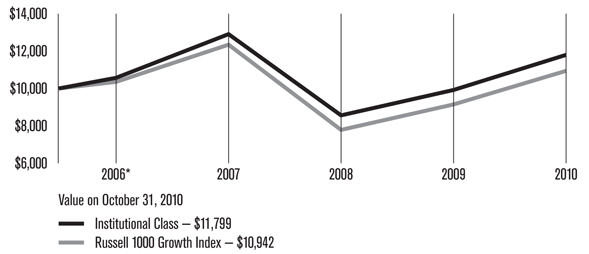
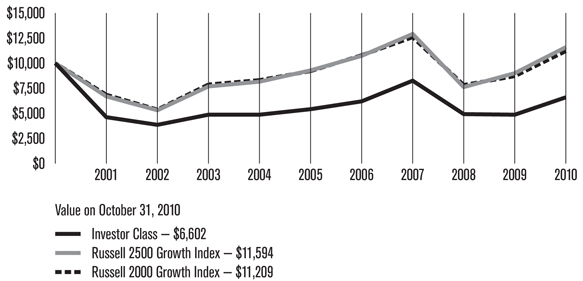
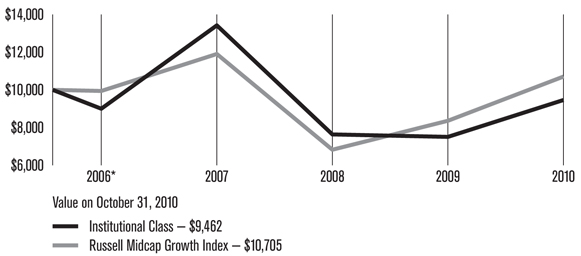
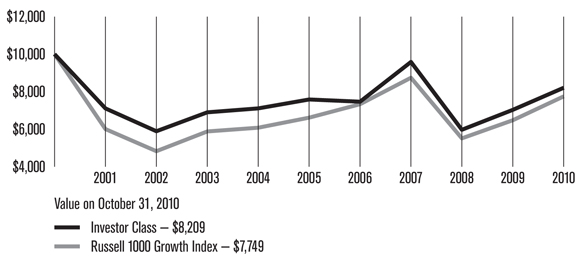
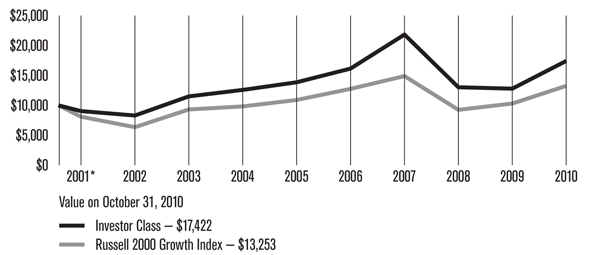
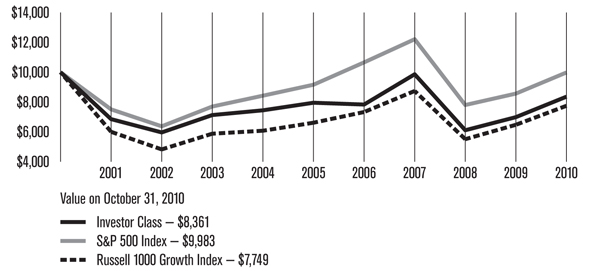
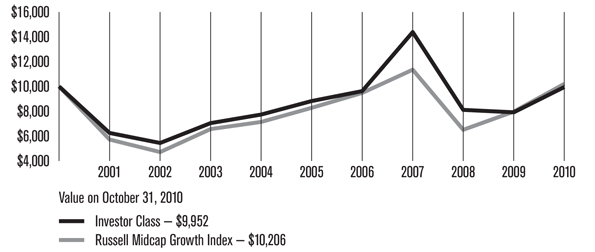
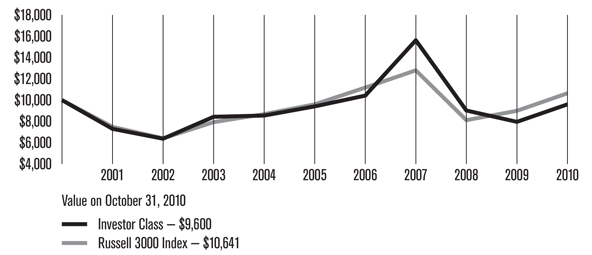
| Growth of $10,000 Over 10 Years |
| $10,000 investment made October 31, 2000 |
| Total Annual Fund Operating Expenses |
| Investor Class | Institutional Class | A Class | B Class | C Class | R Class |
| 1.01% | 0.81% | 1.26% | 2.01% | 2.01% | 1.51% |
The total annual fund operating expenses shown is as stated in the fund’s prospectus current as of the date of this report. The prospectus may vary from the expense ratio shown elsewhere in this report because it is based on a different time period, includes acquired fund fees and expenses, and, if applicable, does not include fee waivers or expense reimbursements.
Data presented reflect past performance. Past performance is no guarantee of future results. Current performance may be higher or lower than the performance shown. Investment return and principal value will fluctuate, and redemption value may be more or less than original cost. To obtain performance data current to the most recent month end, please call 1-800-345-2021 or visit americancentury.com. International investing involves special risks, such as political instability and currency fluctuations. Investing in emerging markets may accentuate these risks.
Unless otherwise indicated, performance reflects Investor Class shares; performance for other share classes will vary due to differences in fee structure. For information about other share classes available, please consult the prospectus. Data assumes reinvestment of dividends and capital gains, and none of the charts reflect the deduction of taxes that a shareholder would pay on fund distributions or the redemption of fund shares. Returns for the indices are provided for comparison. The fund’s total returns include operating expenses (such as transaction costs and management fees) that reduce returns, while the total returns of the indices do not.
Heritage
Portfolio Managers: David Hollond and Greg Walsh
Performance Summary
Heritage returned 34.15%* for the 12 months ended October 31, 2010, outpacing the 28.03% return of the portfolio’s benchmark, the Russell Midcap Growth Index.
As discussed in the Market Perspective on page 4, equity indices generally gained during the reporting period, as investors faced a mixture of economic and market information. Price momentum and acceleration, two factors that the Heritage team looks for in portfolio holdings, started to be rewarded toward the end of the reporting period. As the environment for the team’s process has improved, Heritage has delivered portfolio returns that outperformed those of its benchmark.
Heritage derived double-digit returns from all ten major industrial sectors during the reporting period. The portfolio’s relative performance benefited the most from investment decisions in the information technology sector. Stock selection in the industrials and energy sectors also contributed meaningfully to returns, as did the materials and consumer discretionary sectors. These gains were modestly trimmed by holdings in the consumer staples sector. Roughly half of Heritage’s gains for the period, relative to the benchmark, were derived from holdings in foreign securities.
Information Technology Led Gains
The information technology sector was the largest source of Heritage’s outperformance relative to its benchmark. Within the sector, Heritage was rewarded for an overweight stake in personal computer maker Apple, Inc. The company announced higher-than-expected earnings due to solid sales growth during the period, largely from the popularity of its iPhone smart phone and iPad device.
In the communications equipment industry group, Heritage held an overweight stake in networking company F5 Networks, which was the largest single contributor to relative gains. The company, which manages networks to optimize online application use, benefited from increased demand as a result of the popularity of social networking sites and e-commerce. During the reporting period, F5 delivered earnings that were in excess of analysts’ expectations and increased guidance for future earnings.
Heritage also held a significant position in Baidu, Inc., China’s dominant internet search engine. The company experienced acceleration in sales as more Chinese companies increased their internet presence through Web sites and online retail stores. Stock decisions in the IT services industry group also helped Heritage’s relative gains within the information technology sector.
Industrials, Energy Helped
The industrials sector was a key source of outperformance for Heritage. In the sector, Heritage benefited from an overweight position in railroad company Kansas City Southern. An improvement in economic activity during the period led to increased shipping demand, translating into accelerating volumes for the company.
*All fund returns referenced in this commentary are for Investor Class shares.
BE Aerospace also contributed meaningfully to relative returns. The maker of aircraft interiors demonstrated accelerating growth that the investment team expects to continue due to a strong 2011 wide-body delivery cycle, strong passenger travel demand, and record backlog.
Elsewhere in the industrials sector, the portfolio benefited from an overweight stake in Fastenal Co. The distributor of industrial and construction supplies experienced improved earnings during the reporting period as sales climbed.
The energy sector also contributed to outperformance relative to the benchmark, particularly within the energy equipment and services industry group. Here, Heritage successfully avoided a number of underperforming companies while holding overweight stakes in select holdings that outperformed.
Materials, Consumer Discretionary Helped
In the materials sector, an overweight stake in the metals and mining group drove relative outperformance. Cliffs Natural Resources, which benefited from improved pricing for iron ore as global economies improved, was a significant contributor to relative gains for the period. AK Steel Holding Corp., which is not a member of the benchmark, also added to returns as it benefited from improving economic conditions.
In the consumer discretionary sector, Heritage held a beneficial stake in Chinese online travel company Ctrip.com. The company experienced increased demand amid a resurgence in worldwide travel during the reporting period.
Consumer Staples Detracted
Although the consumer staples sector contributed to absolute gains for Heritage, it lagged the sector returns for the benchmark. In particular, Heritage held a detrimental overweight position in membership warehouse chain Costco Wholesale. The company had fared well in the weak economic environment, and investors viewed the company’s stock as a defensive position. As market conditions improved, however, Costco’s share price return was more moderate.
Outlook
Heritage’s investment process focuses on medium-sized and smaller companies with accelerating revenue and earnings growth rates, which are also exhibiting share-price strength. This process, which has historically added value over time, had faced unprecedented headwinds during the market rally that began in March 2009. Despite this challenge, Heritage provided solid absolute and relative returns during the reporting period. Recently, we have seen the relative headwinds from price momentum and acceleration subside as markets appear to have moved past the inflection point driven by market sentiment and into a period where fundamentals, and specifically fundamental improvement, is being recognized and rewarded by investors.
Heritage
| Top Ten Holdings |
| | % of net assets as of 10/31/10 |
| F5 Networks, Inc. | 3.1% |
| O’Reilly Automotive, Inc. | 2.6% |
| priceline.com, Inc. | 2.6% |
| Netflix, Inc. | 2.3% |
| BE Aerospace, Inc. | 2.2% |
| Royal Caribbean Cruises Ltd. | 2.2% |
| SBA Communications Corp., Class A | 2.2% |
| Apple, Inc. | 1.9% |
| Cummins, Inc. | 1.8% |
| NetApp, Inc. | 1.7% |
| Top Five Industries |
| | % of net assets as of 10/31/10 |
| Hotels, Restaurants & Leisure | 7.6% |
| Specialty Retail | 5.6% |
| Internet & Catalog Retail | 5.1% |
| Software | 4.8% |
| Internet Software & Services | 4.5% |
| Types of Investments in Portfolio |
| | % of net assets as of 10/31/10 |
| Domestic Common Stocks | 86.3% |
| Foreign Common Stocks* | 11.3% |
| Total Common Stocks | 97.6% |
| Temporary Cash Investments | 1.2% |
| Other Assets and Liabilities | 1.2% |
*Includes depositary shares, dual listed securities and foreign ordinary shares.
Shareholder Fee Example (Unaudited)
Fund shareholders may incur two types of costs: (1) transaction costs, including sales charges (loads) on purchase payments and redemption/exchange fees; and (2) ongoing costs, including management fees; distribution and service (12b-1) fees; and other fund expenses. This example is intended to help you understand your ongoing costs (in dollars) of investing in your fund and to compare these costs with the ongoing cost of investing in other mutual funds.
The example is based on an investment of $1,000 made at the beginning of the period and held for the entire period from May 1, 2010 to October 31, 2010.
Actual Expenses
The table provides information about actual account values and actual expenses for each class. You may use the information, together with the amount you invested, to estimate the expenses that you paid over the period. First, identify the share class you own. Then simply divide your account value by $1,000 (for example, an $8,600 account value divided by $1,000 = 8.6), then multiply the result by the number under the heading “Expenses Paid During Period” to estimate the expenses you paid on your account during this period.
If you hold Investor Class shares of any American Century Investments fund, or Institutional Class shares of the American Century Diversified Bond Fund, in an American Century Investments account (i.e., not a financial intermediary or retirement plan account), American Century Investments may charge you a $12.50 semiannual account maintenance fee if the value of those shares is less than $10,000. We will redeem shares automatically in one of your accounts to pay the $12.50 fee. In determining your total eligible investment amount, we will include your investments in all personal accounts (including American Century Investments Brokerage accounts) regis tered under your Social Security number. Personal accounts include individual accounts, joint accounts, UGMA/UTMA accounts, personal trusts, Coverdell Education Savings Accounts and IRAs (including traditional, Roth, Rollover, SEP-, SARSEP- and SIMPLE-IRAs), and certain other retirement accounts. If you have only business, business retirement, employer-sponsored or American Century Investments Brokerage accounts, you are currently not subject to this fee. We will not charge the fee as long as you choose to manage your accounts exclusively online. If you are subject to the Account Maintenance Fee, your account value could be reduced by the fee amount.
Hypothetical Example for Comparison Purposes
The table also provides information about hypothetical account values and hypothetical expenses based on the actual expense ratio of each class of your fund and an assumed rate of return of 5% per year before expenses, which is not the actual return of a fund’s share class. The hypothetical account values and expenses may not be used to estimate the actual ending account balance or expenses you paid for the period. You may use this information to compare the ongoing costs of investing in your fund and other funds. To do so, compare this 5% hypothetical example with the 5% hypothetical examples that appear in the shareholder reports of the other funds.
Please note that the expenses shown in the table are meant to highlight your ongoing costs only and do not reflect any transactional costs, such as sales charges (loads) or redemption/exchange fees. Therefore, the table is useful in comparing ongoing costs only, and will not help you determine the relative total costs of owning different funds. In addition, if these transactional costs were included, your costs would have been higher.
| | | | | |
| | Beginning Account Value 5/1/10 | Ending Account Value 10/31/10 | Expenses Paid During Period* 5/1/10 - 10/31/10 | Annualized Expense Ratio* |
| Actual |
| Investor Class | $1,000 | $1,070.80 | $5.27 | 1.01% |
| Institutional Class | $1,000 | $1,072.10 | $4.23 | 0.81% |
| A Class | $1,000 | $1,069.20 | $6.57 | 1.26% |
| B Class | $1,000 | $1,065.10 | $10.46 | 2.01% |
| C Class | $1,000 | $1,065.60 | $10.46 | 2.01% |
| R Class | $1,000 | $1,068.00 | $7.87 | 1.51% |
| Hypothetical |
| Investor Class | $1,000 | $1,020.11 | $5.14 | 1.01% |
| Institutional Class | $1,000 | $1,021.12 | $4.13 | 0.81% |
| A Class | $1,000 | $1,018.85 | $6.41 | 1.26% |
| B Class | $1,000 | $1,015.07 | $10.21 | 2.01% |
| C Class | $1,000 | $1,015.07 | $10.21 | 2.01% |
| R Class | $1,000 | $1,017.59 | $7.68 | 1.51% |
*Expenses are equal to the class’s annualized expense ratio listed in the table above, multiplied by the average account value over the period, multiplied by 184, the number of days in the most recent fiscal half-year, divided by 365, to reflect the one-half year period.
| | | |
| | Shares | Value |
| Common Stocks — 97.6% |
| AEROSPACE & DEFENSE — 3.3% |
BE Aerospace, Inc.(1) | 1,755,785 | $64,542,657 |
| Precision Castparts Corp. | 83,600 | 11,418,088 |
TransDigm Group, Inc.(1) | 294,500 | 19,516,515 |
| | | 95,477,260 |
| AIR FREIGHT & LOGISTICS — 1.1% |
| Expeditors International of Washington, Inc. | 668,300 | 32,987,288 |
| AIRLINES — 1.4% |
AMR Corp.(1) | 2,374,000 | 18,707,120 |
United Continental Holdings, Inc.(1) | 814,900 | 23,664,696 |
| | | 42,371,816 |
| AUTO COMPONENTS — 0.5% |
BorgWarner, Inc.(1) | 264,400 | 14,835,484 |
| AUTOMOBILES — 0.8% |
| Bayerische Motoren Werke AG | 205,800 | 14,754,135 |
Brilliance China Automotive Holdings Ltd.(1) | 9,672,000 | 8,485,031 |
| | | 23,239,166 |
| BIOTECHNOLOGY — 2.6% |
Alexion Pharmaceuticals, Inc.(1) | 454,600 | 31,049,180 |
United Therapeutics Corp.(1) | 467,700 | 28,062,000 |
Vertex Pharmaceuticals, Inc.(1) | 404,200 | 15,492,986 |
| | | 74,604,166 |
| CAPITAL MARKETS — 0.7% |
| Lazard Ltd., Class A | 553,612 | 20,428,283 |
| CHEMICALS — 3.0% |
| Albemarle Corp. | 847,600 | 42,490,188 |
| CF Industries Holdings, Inc. | 178,900 | 21,920,617 |
| Ecolab, Inc. | 232,700 | 11,476,764 |
| Sigma-Aldrich Corp. | 181,900 | 11,536,098 |
| | | 87,423,667 |
| COMMERCIAL BANKS — 0.2% |
| Comerica, Inc. | 160,400 | 5,739,112 |
| COMMERCIAL SERVICES & SUPPLIES — 0.8% |
Stericycle, Inc.(1) | 344,500 | 24,714,430 |
| COMMUNICATIONS EQUIPMENT — 3.6% |
F5 Networks, Inc.(1) | 778,900 | 91,676,530 |
JDS Uniphase Corp.(1) | 1,264,600 | 13,290,946 |
| | | 104,967,476 |
| COMPUTERS & PERIPHERALS — 4.5% |
Apple, Inc.(1) | 185,427 | $55,789,421 |
Lexmark International, Inc., Class A(1) | 622,500 | 23,673,675 |
NetApp, Inc.(1) | 946,600 | 50,406,450 |
| | | 129,869,546 |
| CONSUMER FINANCE — 1.2% |
| Discover Financial Services | 1,940,104 | 34,242,836 |
| ELECTRICAL EQUIPMENT — 1.8% |
American Superconductor Corp.(1) | 393,800 | 13,251,370 |
| Cooper Industries plc | 577,300 | 30,262,066 |
| Rockwell Automation, Inc. | 167,500 | 10,446,975 |
| | | 53,960,411 |
| ELECTRONIC EQUIPMENT, INSTRUMENTS & COMPONENTS — 2.5% |
Agilent Technologies, Inc.(1) | 682,500 | 23,751,000 |
| Amphenol Corp., Class A | 371,200 | 18,608,256 |
Dolby Laboratories, Inc., Class A(1) | 481,100 | 29,674,248 |
| | | 72,033,504 |
| ENERGY EQUIPMENT & SERVICES — 3.7% |
Atwood Oceanics, Inc.(1) | 272,838 | 8,869,964 |
Complete Production Services, Inc.(1) | 1,042,905 | 24,435,264 |
| Core Laboratories NV | 331,500 | 25,780,755 |
Dril-Quip, Inc.(1) | 259,500 | 17,931,450 |
FMC Technologies, Inc.(1) | 430,200 | 31,017,420 |
| | | 108,034,853 |
| FOOD & STAPLES RETAILING — 1.7% |
| Costco Wholesale Corp. | 206,100 | 12,936,897 |
Whole Foods Market, Inc.(1) | 958,300 | 38,092,425 |
| | | 51,029,322 |
| FOOD PRODUCTS — 1.1% |
| Mead Johnson Nutrition Co. | 547,900 | 32,227,478 |
| GAS UTILITIES — 0.6% |
| National Fuel Gas Co. | 313,100 | 17,276,858 |
| HEALTH CARE EQUIPMENT & SUPPLIES — 3.1% |
| C.R. Bard, Inc. | 453,200 | 37,669,984 |
| Masimo Corp. | 647,200 | 19,526,024 |
Varian Medical Systems, Inc.(1) | 522,500 | 33,032,450 |
| | | 90,228,458 |
| HEALTH CARE PROVIDERS & SERVICES — 1.5% |
Express Scripts, Inc.(1) | 918,100 | 44,546,212 |
Heritage
| HEALTH CARE TECHNOLOGY — 1.5% |
SXC Health Solutions Corp.(1) | 1,105,370 | $43,065,215 |
| HOTELS, RESTAURANTS & LEISURE — 7.6% |
Chipotle Mexican Grill, Inc.(1) | 123,400 | 25,939,914 |
Ctrip.com International Ltd. ADR(1) | 734,240 | 38,231,877 |
Home Inns & Hotels Management, Inc. ADR(1) | 492,500 | 25,196,300 |
Las Vegas Sands Corp.(1) | 688,500 | 31,588,380 |
Panera Bread Co., Class A(1) | 160,372 | 14,354,898 |
Royal Caribbean Cruises Ltd.(1) | 1,600,200 | 63,271,908 |
| Starwood Hotels & Resorts Worldwide, Inc. | 440,000 | 23,821,600 |
| | | 222,404,877 |
| HOUSEHOLD PRODUCTS — 0.5% |
| Church & Dwight Co., Inc. | 215,700 | 14,203,845 |
| INTERNET & CATALOG RETAIL — 5.1% |
MakeMyTrip Ltd.(1) | 134,100 | 4,847,715 |
Netflix, Inc.(1) | 393,400 | 68,254,900 |
priceline.com, Inc.(1) | 197,111 | 74,273,396 |
| | | 147,376,011 |
| INTERNET SOFTWARE & SERVICES — 4.5% |
Akamai Technologies, Inc.(1) | 587,300 | 30,345,791 |
Baidu, Inc. ADR(1) | 398,500 | 43,838,985 |
OpenTable, Inc.(1) | 61,700 | 3,785,295 |
VeriSign, Inc.(1) | 962,800 | 33,457,300 |
WebMD Health Corp.(1) | 386,189 | 20,189,961 |
| | | 131,617,332 |
| IT SERVICES — 1.4% |
Cognizant Technology Solutions Corp., Class A(1) | 632,700 | 41,245,713 |
| LEISURE EQUIPMENT & PRODUCTS — 0.5% |
| Polaris Industries, Inc. | 200,200 | 14,232,218 |
| LIFE SCIENCES TOOLS & SERVICES — 1.8% |
Illumina, Inc.(1) | 608,000 | 33,020,480 |
Life Technologies Corp.(1) | 363,700 | 18,250,466 |
| | | 51,270,946 |
| MACHINERY — 4.3% |
AGCO Corp.(1) | 582,500 | 24,738,775 |
ArvinMeritor, Inc.(1) | 918,600 | 15,230,388 |
| Bucyrus International, Inc. | 257,500 | 17,551,200 |
| Cummins, Inc. | 610,700 | 53,802,670 |
| Flowserve Corp. | 136,187 | 13,618,700 |
| | | 124,941,733 |
| MEDIA — 1.1% |
Imax Corp.(1) | 1,441,700 | $31,212,805 |
| MULTILINE RETAIL — 1.3% |
Dollar Tree, Inc.(1) | 766,600 | 39,334,246 |
| OIL, GAS & CONSUMABLE FUELS — 2.3% |
Concho Resources, Inc.(1) | 537,300 | 36,896,391 |
| Pioneer Natural Resources Co. | 425,100 | 29,671,980 |
| | | 66,568,371 |
| PHARMACEUTICALS — 1.4% |
Salix Pharmaceuticals Ltd.(1) | 324,300 | 12,268,269 |
| Shire plc ADR | 397,700 | 27,878,770 |
| | | 40,147,039 |
| REAL ESTATE INVESTMENT TRUSTS (REITs) — 1.1% |
| AvalonBay Communities, Inc. | 131,300 | 13,958,503 |
| Digital Realty Trust, Inc. | 332,700 | 19,872,171 |
| | | 33,830,674 |
| REAL ESTATE MANAGEMENT & DEVELOPMENT — 1.8% |
CB Richard Ellis Group, Inc., Class A(1) | 2,029,900 | 37,248,665 |
| Jones Lang LaSalle, Inc. | 179,400 | 14,003,964 |
| | | 51,252,629 |
| ROAD & RAIL — 1.4% |
| J.B. Hunt Transport Services, Inc. | 539,400 | 19,396,824 |
Kansas City Southern(1) | 476,600 | 20,884,612 |
| | | 40,281,436 |
| SEMICONDUCTORS & SEMICONDUCTOR EQUIPMENT — 2.5% |
| Analog Devices, Inc. | 337,800 | 11,373,726 |
| ARM Holdings plc | 2,874,800 | 16,735,181 |
Cavium Networks, Inc.(1) | 642,200 | 20,466,914 |
Veeco Instruments, Inc.(1) | 553,000 | 23,143,050 |
| | | 71,718,871 |
| SOFTWARE — 4.8% |
Citrix Systems, Inc.(1) | 526,692 | 33,745,156 |
Intuit, Inc.(1) | 595,200 | 28,569,600 |
Rovi Corp.(1) | 446,600 | 22,620,290 |
salesforce.com, inc.(1) | 382,600 | 44,408,382 |
VanceInfo Technologies, Inc. ADR(1) | 251,253 | 9,138,072 |
| | | 138,481,500 |
| SPECIALTY RETAIL — 5.6% |
AutoZone, Inc.(1) | 52,200 | $12,404,286 |
O’Reilly Automotive, Inc.(1) | 1,286,100 | 75,236,850 |
| PetSmart, Inc. | 913,100 | 34,177,333 |
| Williams-Sonoma, Inc. | 1,246,500 | 40,349,205 |
| | | 162,167,674 |
| TEXTILES, APPAREL & LUXURY GOODS — 1.4% |
Fossil, Inc.(1) | 345,500 | 20,381,045 |
Lululemon Athletica, Inc.(1) | 436,300 | 19,336,816 |
| | | 39,717,861 |
| TRADING COMPANIES & DISTRIBUTORS — 2.2% |
| Fastenal Co. | 910,200 | 46,857,096 |
| MSC Industrial Direct Co., Class A | 325,464 | 18,531,920 |
| | | 65,389,016 |
| WIRELESS TELECOMMUNICATION SERVICES — 3.8% |
NII Holdings, Inc.(1) | 1,141,500 | 47,726,115 |
SBA Communications Corp., Class A(1) | 1,609,332 | 63,182,374 |
| | | 110,908,489 |
TOTAL COMMON STOCKS (Cost $2,066,149,519) | 2,841,606,127 |
| Temporary Cash Investments — 1.2% |
| JPMorgan U.S. Treasury Plus Money Market Fund Agency Shares | 82,476 | $82,476 |
Repurchase Agreement, Bank of America Securities, LLC, (collateralized by various U.S. Treasury obligations, 1.375%, 5/15/12, valued at $35,305,771), in a joint trading account at 0.18%, dated 10/29/10, due 11/1/10 (Delivery value $34,600,519) | 34,600,000 |
TOTAL TEMPORARY CASH INVESTMENTS (Cost $34,682,476) | 34,682,476 |
TOTAL INVESTMENT SECURITIES — 98.8% (Cost $2,100,831,995) | 2,876,288,603 |
| OTHER ASSETS AND LIABILITIES — 1.2% | 36,315,701 |
| TOTAL NET ASSETS — 100.0% | $2,912,604,304 |
| Geographic Diversification |
| (as a % of net assets) | |
| United States | 86.3% |
| People’s Republic of China | 4.0% |
| Canada | 3.2% |
| Ireland | 0.9% |
| Netherlands | 0.9% |
| Bermuda | 0.7% |
| United Kingdom | 0.6% |
| Germany | 0.5% |
| Hong Kong | 0.3% |
| India | 0.2% |
| Cash and Equivalents* | 2.4% |
*Includes temporary cash investments and other assets and liabilities.
| Forward Foreign Currency Exchange Contracts |
| Contracts to Sell | Counterparty | Settlement Date | Value | Unrealized Gain (Loss) |
| 7,785,414 | EUR for USD | UBS AG | 11/30/10 | $10,832,833 | $(110,216) |
| 7,895,638 | GBP for USD | Bank of America | 11/30/10 | 12,649,365 | (190,048) |
| | | | | $23,482,198 | $(300,264) |
(Value on Settlement Date $23,181,934)
Notes to Schedule of Investments
ADR = American Depositary Receipt
EUR = Euro
USD = United States Dollar
See Notes to Financial Statements.
Statement of Assets and Liabilities
| OCTOBER 31, 2010 |
| Assets |
| Investment securities, at value (cost of $2,100,831,995) | $2,876,288,603 |
| Receivable for investments sold | 80,975,297 |
| Receivable for capital shares sold | 28,071,039 |
| Dividends and interest receivable | 948,190 |
| | 2,986,283,129 |
| |
| Liabilities |
| Payable for investments purchased | 68,297,813 |
| Payable for capital shares redeemed | 2,487,783 |
| Unrealized loss on forward foreign currency exchange contracts | 300,264 |
| Accrued management fees | 2,348,577 |
| Distribution and service fees payable | 244,388 |
| | 73,678,825 |
| Net Assets | $2,912,604,304 |
| | |
| Net Assets Consist of: |
| Capital (par value and paid-in surplus) | $2,412,592,100 |
| Undistributed net investment income | 300,264 |
| Accumulated net realized loss | (275,444,448) |
| Net unrealized appreciation | 775,156,388 |
| | $2,912,604,304 |
| | | | |
| | Net assets | Shares outstanding | Net asset value per share |
| Investor Class, $0.01 Par Value | $1,886,728,985 | | 98,234,972 | | $19.21 | |
| Institutional Class, $0.01 Par Value | $115,261,180 | | 5,875,698 | | $19.62 | |
| A Class, $0.01 Par Value | $803,691,828 | | 42,972,259 | | $18.70* | |
| B Class, $0.01 Par Value | $3,997,087 | | 212,476 | | $18.81 | |
| C Class, $0.01 Par Value | $85,380,884 | | 4,865,749 | | $17.55 | |
| R Class, $0.01 Par Value | $17,544,340 | | 923,039 | | $19.01 | |
*Maximum offering price $19.84 (net asset value divided by 0.9425)
See Notes to Financial Statements.
| YEAR ENDED OCTOBER 31, 2010 |
| Investment Income (Loss) |
| Income: | |
| Dividends (net of foreign taxes withheld of $216,375) | $13,486,970 |
| Interest | 39,960 |
| | 13,526,930 |
| Expenses: | |
| Management fees | 23,980,129 |
| Distribution and service fees: | |
| A Class | 1,624,800 |
| B Class | 38,647 |
| C Class | 686,535 |
| R Class | 50,737 |
| Directors’ fees and expenses | 97,380 |
| Other expenses | 116,862 |
| | 26,595,090 |
| | |
| Net investment income (loss) | (13,068,160) |
| | |
| Realized and Unrealized Gain (Loss) |
| Net realized gain (loss) on: | |
| Investment transactions | 210,300,299 |
| Foreign currency transactions | (1,047,545) |
| | 209,252,754 |
| | |
| Change in net unrealized appreciation (depreciation) on: | |
| Investments | 502,492,777 |
| Translation of assets and liabilities in foreign currencies | (278,192) |
| | 502,214,585 |
| | |
| Net realized and unrealized gain (loss) | 711,467,339 |
| | |
| Net Increase (Decrease) in Net Assets Resulting from Operations | $698,399,179 |
See Notes to Financial Statements.
Statement of Changes in Net Assets
| YEARS ENDED OCTOBER 31, 2010 AND OCTOBER 31, 2009 |
| Increase (Decrease) in Net Assets | 2010 | 2009 |
| Operations |
| Net investment income (loss) | $(13,068,160) | $(4,438,326) |
| Net realized gain (loss) | 209,252,754 | (269,812,367) |
| Change in net unrealized appreciation (depreciation) | 502,214,585 | 446,528,478 |
| Net increase (decrease) in net assets resulting from operations | 698,399,179 | 172,277,785 |
| | | |
| Distributions to Shareholders |
| From net investment income: | | |
| Investor Class | — | (11,939,054) |
| Institutional Class | (45,786) | (936,743) |
| A Class | — | (2,902,861) |
| B Class | — | (2,133) |
| C Class | — | (43,759) |
| R Class | — | (4,033) |
| Decrease in net assets from distributions | (45,786) | (15,828,583) |
| | | |
| Capital Share Transactions |
| Net increase (decrease) in net assets from capital share transactions | 200,776,280 | 121,367,022 |
| | | |
| Net increase (decrease) in net assets | 899,129,673 | 277,816,224 |
| | | |
| Net Assets |
| Beginning of period | 2,013,474,631 | 1,735,658,407 |
| End of period | $2,912,604,304 | $2,013,474,631 |
| | | |
| Undistributed net investment income | $300,264 | $23,333 |
See Notes to Financial Statements.
Notes to Financial Statements
OCTOBER 31, 2010
1. Organization
American Century Mutual Funds, Inc. (the corporation) is registered under the Investment Company Act of 1940 (the 1940 Act) as an open-end management investment company and is organized as a Maryland corporation. Heritage Fund (the fund) is one fund in a series issued by the corporation. The fund is diversified as defined under the 1940 Act. The fund’s investment objective is to seek long-term capital growth. The fund pursues its objective by investing in companies that are medium-sized and smaller at the time of purchase that management believes will increase in value over time. The fund is authorized to issue the Investor Class, the Institutional Class, the A Class, the B Class, the C Class and the R Class. The A Class may incur an initial sales charge. The A Class, B Class and C Class may be subject to a contin gent deferred sales charge. The share classes differ principally in their respective sales charges and distribution and shareholder servicing expenses and arrangements. The Institutional Class is made available to institutional shareholders or through financial intermediaries whose clients do not require the same level of shareholder and administrative services as shareholders of other classes. As a result, the Institutional Class is charged a lower unified management fee.
2. Significant Accounting Policies
The following is a summary of significant accounting policies consistently followed by the fund in preparation of its financial statements. The financial statements are prepared in conformity with accounting principles generally accepted in the United States of America, which may require management to make certain estimates and assumptions at the date of the financial statements. Actual results could differ from these estimates.
Investment Valuations — The fund determines the fair value of its investments and computes its net asset value per share as of the close of regular trading (usually 4 p.m. Eastern time) on the New York Stock Exchange (NYSE) on each day the NYSE is open.
Equity securities that are listed or traded on a domestic securities exchange are valued at the last reported sales price or at the official closing price as provided by the exchange. Equity securities traded on foreign securities exchanges are typically valued at the closing price on the exchange where primarily traded or as of the close of the NYSE, if that is earlier. If no last sales price is reported, or if local convention or regulation so provides, the mean of the latest bid and asked prices is used. Depending on local convention or regulation, securities traded over-the-counter are valued at the mean of the latest bid and asked prices, the last sales price, or the official closing price. In its determination of fair value, the fund may review several factors including: market information specific to a security; news developments in U.S. and foreign markets; the performance of particular U.S. and foreign securities, indices, comparable securities, American Depositary Receipts, Exchange Traded Funds, and other relevant market indicators.
Debt securities maturing within 60 days at the time of purchase may be valued at cost, plus or minus any amortized discount or premium or at the evaluated mean as provided by an independent pricing service. Evaluated mean prices are commonly derived through utilization of market models, which may consider, among other factors, trade data, quotations from dealers and active market makers, relevant yield curve and spread data, related sector levels, creditworthiness, and other relevant market information on the same or comparable securities.
Investments in open-end management investment companies are valued at the reported net asset value per share. Repurchase agreements are valued at cost. Forward foreign currency exchange contracts are valued at the mean of the latest bid and asked prices of the forward currency rates as provided by an independent pricing service.
The value of investments initially expressed in foreign currencies is translated into U.S. dollars at prevailing exchange rates.
If the fund determines that the market price for a portfolio security is not readily available or the valuation methods mentioned above do not reflect a security’s fair value, such security is valued as determined in good faith by the Board of Directors or its designee, in accordance with procedures adopted by the Board of Directors. Circumstances that may cause the fund to use these procedures to value a security include, but are not limited to: a security has been declared in default; trading in a security has been halted during the trading day; there is a foreign market holiday and no trading occurred; or an event occurred between the close of a foreign exchange and the NYSE that may affect the value of a security.
Security Transactions — Security transactions are accounted for as of the trade date. Net realized gains and losses are determined on the identified cost basis, which is also used for federal income tax purposes.
Investment Income — Dividend income less foreign taxes withheld, if any, is recorded as of the ex-dividend date. Interest income is recorded on the accrual basis and includes accretion of discounts and amortization of premiums.
Foreign Currency Translations — All assets and liabilities initially expressed in foreign currencies are translated into U.S. dollars at prevailing exchange rates at period end. The fund may enter into spot foreign currency exchange contracts to facilitate transactions denominated in a foreign currency. Purchases and sales of investment securities, dividend and interest income, spot foreign currency exchange contracts, and expenses are translated at the rates of exchange prevailing on the respective dates of such transactions. Net realized and unrealized foreign currency exchange gains or losses related to investment securities are a component of net realized gain (loss) on investment transactions and net unrealized appreciation (depreciation) on investments, respectively.
Repurchase Agreements — The fund may enter into repurchase agreements with institutions that American Century Investment Management, Inc. (ACIM) (the investment advisor) has determined are creditworthy pursuant to criteria adopted by the Board of Directors. The fund requires that the collateral, represented by securities, received in a repurchase transaction be transferred to the custodian in a manner sufficient to enable the fund to obtain those securities in the event of a default under the repurchase agreement. ACIM monitors, on a daily basis, the securities transferred to ensure the value, including accrued interest, of the securities under each repurchase agreement is equal to or greater than amounts owed to the fund under each repurchase agreement.
Joint Trading Account — Pursuant to an Exemptive Order issued by the Securities and Exchange Commission, the fund, along with certain other funds in the American Century Investments family of funds, may transfer uninvested cash balances into a joint trading account. These balances are invested in one or more repurchase agreements that are collateralized by U.S. Treasury or Agency obligations.
Income Tax Status — It is the fund’s policy to distribute substantially all net investment income and net realized gains to shareholders and to otherwise qualify as a regulated investment company under provisions of the Internal Revenue Code. The fund is no longer subject to examination by tax authorities for years prior to 2007. Additionally, non-U.S. tax returns filed by the fund due to investments in certain foreign securities remain subject to examination by the relevant taxing authority for 7 years from the date of the filing. At this time, management believes there are no uncertain tax positions which, based on their technical merit, would not be sustained upon examination and for which it is reasonably possible that the total amounts of unrecognized tax benefits will significantly change in the next twelve months. Accordingly, no provision has been made for federal or state income taxes.
Multiple Class — All shares of the fund represent an equal pro rata interest in the net assets of the class to which such shares belong, and have identical voting, dividend, liquidation and other rights and the same terms and conditions, except for class specific expenses and exclusive rights to vote on matters affecting only individual classes. Income, non-class specific expenses, and realized and unrealized capital gains and losses of the fund are allocated to each class of shares based on their relative net assets.
Distributions to Shareholders — Distributions to shareholders are recorded on the ex-dividend date. Distributions from net investment income and net realized gains, if any, are generally declared and paid annually.
Indemnifications — Under the corporation’s organizational documents, its officers and directors are indemnified against certain liabilities arising out of the performance of their duties to the fund. In addition, in the normal course of business, the fund enters into contracts that provide general indemnifications. The maximum exposure under these arrangements is unknown as this would involve future claims that may be made against a fund. The risk of material loss from such claims is considered by management to be remote.
3. Fees and Transactions with Related Parties
Management Fees — The corporation has entered into a management agreement with ACIM, under which ACIM provides the fund with investment advisory and management services in exchange for a single, unified management fee (the fee) per class. The agreement provides that all expenses of managing and operating the fund, except distribution and service fees, brokerage expenses, taxes, interest, fees and expenses of the independent directors (including legal counsel fees), and extraordinary expenses, will be paid by ACIM. The fee is computed and accrued daily based on each class’s daily net assets and paid monthly in arrears. The annual management fee for each class is 1.000% for the Investor Class, A Class, B Class, C Class and R Class and 0.800% for the Institutional Class.
Distribution and Service Fees — The Board of Directors has adopted a separate Master Distribution and Individual Shareholder Services Plan for each of the A Class, B Class, C Class and R Class (collectively the plans), pursuant to Rule 12b-1 of the 1940 Act. The plans provide that the A Class will pay American Century Investment Services, Inc. (ACIS) an annual distribution and service fee of 0.25%. The plans provide that the B Class and C Class will each pay ACIS an annual distribution and service fee of 1.00%, of which 0.25% is paid for individual shareholder services and 0.75% is paid for distribution services. The plans provide that the R Class will pay ACIS an annual distribution and service fee of 0.50%. The fees are computed and accrued daily based on each class’s daily net assets and paid monthly in arrears. The fees are used to pay financial intermediaries for distribution and individual shareholder services. Fees incurred under the plans during the year ended October 31, 2010, are detailed in the Statement of Operations.
Related Parties — Certain officers and directors of the corporation are also officers and/or directors of American Century Companies, Inc. (ACC), the parent of the corporation’s investment advisor, ACIM, the distributor of the corporation, ACIS, and the corporation’s transfer agent, American Century Services, LLC.
The fund is eligible to invest in a money market fund for temporary purposes, which is managed by J.P. Morgan Investment Management, Inc. (JPMIM). The fund has a mutual funds services agreement with J.P. Morgan Investor Services Co. (JPMIS). JPMorgan Chase Bank (JPMCB) is a custodian of the fund. JPMIM, JPMIS and JPMCB are wholly owned subsidiaries of JPMorgan Chase & Co. (JPM). JPM is an equity investor in ACC.
4. Investment Transactions
Purchases and sales of investment securities, excluding short-term investments, for the year ended October 31, 2010, were $2,814,119,528 and $2,693,391,781, respectively.
5. Capital Share Transactions
Transactions in shares of the fund were as follows:
| | Year ended October 31, 2010 | Year ended October 31, 2009 |
| | Shares | Amount | Shares | Amount |
| Investor Class/Shares Authorized | 400,000,000 | | 400,000,000 | |
| Sold | 24,446,309 | $416,217,265 | 21,287,744 | $269,895,757 |
| Issued in reinvestment of distributions | — | — | 1,038,518 | 11,506,781 |
| Redeemed | (19,973,254) | (330,354,418) | (24,501,467) | (300,017,434) |
| | 4,473,055 | 85,862,847 | (2,175,205) | (18,614,896) |
| Institutional Class/Shares Authorized | 40,000,000 | | 40,000,000 | |
| Sold | 1,592,345 | 27,658,160 | 1,465,590 | 18,547,939 |
| Issued in reinvestment of distributions | 2,804 | 45,786 | 83,029 | 936,563 |
| Redeemed | (2,044,059) | (34,815,396) | (1,699,463) | (20,369,382) |
| | (448,910) | (7,111,450) | (150,844) | (884,880) |
| A Class/Shares Authorized | 200,000,000 | | 200,000,000 | |
| Sold | 16,547,628 | 270,449,421 | 20,552,782 | 250,958,298 |
| Issued in reinvestment of distributions | — | — | 257,512 | 2,791,428 |
| Redeemed | (10,692,346) | (173,010,082) | (11,102,089) | (132,976,948) |
| | 5,855,282 | 97,439,339 | 9,708,205 | 120,772,778 |
| B Class/Shares Authorized | 35,000,000 | | 35,000,000 | |
| Sold | 17,058 | 265,517 | 139,787 | 1,746,511 |
| Issued in reinvestment of distributions | — | — | 178 | 1,969 |
| Redeemed | (46,411) | (756,266) | (34,173) | (415,624) |
| | (29,353) | (490,749) | 105,792 | 1,332,856 |
| C Class/Shares Authorized | 35,000,000 | | 35,000,000 | |
| Sold | 2,174,035 | 33,791,342 | 2,011,575 | 24,044,708 |
| Issued in reinvestment of distributions | — | — | 3,445 | 35,514 |
| Redeemed | (1,225,116) | (18,799,544) | (802,497) | (9,141,997) |
| | 948,919 | 14,991,798 | 1,212,523 | 14,938,225 |
| R Class/Shares Authorized | 30,000,000 | | 30,000,000 | |
| Sold | 873,774 | 14,881,532 | 385,148 | 5,060,155 |
| Issued in reinvestment of distributions | — | — | 364 | 4,030 |
| Redeemed | (286,027) | (4,797,037) | (88,131) | (1,241,246) |
| | 587,747 | 10,084,495 | 297,381 | 3,822,939 |
| Net increase (decrease) | 11,386,740 | $200,776,280 | 8,997,852 | $121,367,022 |
6. Fair Value Measurements
The fund’s securities valuation process is based on several considerations and may use multiple inputs to determine the fair value of the positions held by the fund. In conformity with accounting principles generally accepted in the United States of America, the inputs used to determine a valuation are classified into three broad levels as follows:
| • | Level 1 valuation inputs consist of unadjusted quoted prices in an active market for identical securities; |
| • | Level 2 valuation inputs consist of direct or indirect observable market data (including quoted prices for similar securities, evaluations of subsequent market events, interest rates, prepayment speeds, credit risk, etc.); or |
| • | Level 3 valuation inputs consist of unobservable data (including a fund’s own assumptions). |
The level classification is based on the lowest level input that is significant to the fair valuation measurement. The valuation inputs are not necessarily an indication of the risks associated with investing in these securities or other financial instruments.
The following is a summary of the level classifications as of period end. The Schedule of Investments provides additional information on the fund’s portfolio holdings.
| | | | |
| | Level 1 | Level 2 | Level 3 |
| Investment Securities | | | |
| Domestic Common Stocks | $2,512,676,187 | — | — |
| Foreign Common Stocks | 288,955,593 | $39,974,347 | — |
| Temporary Cash Investments | 82,476 | 34,600,000 | — |
| Total Value of Investment Securities | $2,801,714,256 | $74,574,347 | — |
| | | | |
| Other Financial Instruments |
Total Unrealized Gain (Loss) on Forward Foreign Currency Exchange Contracts | — | $(300,264) | — |
7. Derivative Instruments
Foreign Currency Risk — The fund is subject to foreign currency exchange rate risk in the normal course of pursuing its investment objectives. The value of foreign investments held by a fund may be significantly affected by changes in foreign currency exchange rates. The dollar value of a foreign security generally decreases when the value of the dollar rises against the foreign currency in which the security is denominated and tends to increase when the value of the dollar declines against such foreign currency. A fund may enter into forward foreign currency exchange contracts to reduce a fund’s exposure to foreign currency exchange rate fluctuations. The net U.S. dollar value of foreign currency underlying all contractual commitments held by a fund and the resulting unrealized appreciation or depreciation are determined daily using prevailing exchange rates. Realized gain or loss is recorded upon the termination of the contract. Net realized and unrealized gains or losses occurring during the holding period of forward foreign currency exchange contracts are a component of net realized gain (loss) on foreign currency transactions and change in net unrealized appreciation (depreciation) on translation of assets and liabilities in foreign currencies, respectively. A fund bears the risk of an unfavorable change in the foreign currency exchange rate underlying the forward contract. Additionally, losses, up to the fair value, may arise if the counterparties do not perform under the contract terms. The risk of loss from non-performance by the counterparty may be reduced by the use of master netting agreements. The fund participated in foreign currency risk derivative instruments during the period consistent with its exposure to foreign denominated securities. The foreign currency risk derivative instruments held at period end as disclosed on the Schedule of Investments are indicative of the fund’s typical volume.
The value of foreign currency risk derivative instruments as of October 31, 2010, is disclosed on the Statement of Assets and Liabilities as a liability of $300,264 in unrealized loss on forward foreign currency exchange contracts. For the year ended October 31, 2010, the effect of foreign currency risk derivative instruments on the Statement of Operations was $(1,014,185) in net realized gain (loss) on foreign currency transactions and $(276,931) in change in net unrealized appreciation (depreciation) on translation of assets and liabilities in foreign currencies.
8. Risk Factors
There are certain risks involved in investing in foreign securities. These risks include those resulting from future adverse political, social, and economic developments, fluctuations in currency exchange rates, the possible imposition of exchange controls, and other foreign laws or restrictions. Investing in emerging markets may accentuate these risks.
9. Federal Tax Information
The tax character of distributions paid during the years ended October 31, 2010 and October 31, 2009 were as follows:
| | 2010 | 2009 |
| Distributions Paid From |
| Ordinary income | $45,786 | $15,828,583 |
| Long-term capital gains | — | — |
The book-basis character of distributions made during the year from net investment income or net realized gains may differ from their ultimate characterization for federal income tax purposes. These differences reflect the differing character of certain income items and net realized gains and losses for financial statement and tax purposes, and may result in reclassification among certain capital accounts on the financial statements.
As of October 31, 2010, the federal tax cost of investments and the components of distributable earnings on a tax-basis were as follows:
| Federal tax cost of investments | $2,102,020,154 |
| Gross tax appreciation of investments | $778,814,758 |
| Gross tax depreciation of investments | (4,546,309) |
| Net tax appreciation (depreciation) of investments | $774,268,449 |
Net tax appreciation (depreciation) on derivatives and translation of assets and liabilities in foreign currencies | $44 |
| Net tax appreciation (depreciation) | $774,268,493 |
| Undistributed ordinary income | — |
| Accumulated capital losses | $(274,256,289) |
The difference between book-basis and tax-basis cost and unrealized appreciation (depreciation) is attributable primarily to the tax deferral of losses on wash sales and the realization for tax purposes of unrealized gains (losses) on certain forward foreign currency exchange contracts.
The accumulated capital losses represent net capital loss carryovers that may be used to offset future realized capital gains for federal income tax purposes. Future capital loss carryover utilization in any given year may be subject to Internal Revenue Code limitations. Capital loss carryovers expire in 2017.
10. Corporate Event
As part of a long-standing estate and business succession plan established by James E. Stowers, Jr., the founder of American Century Investments, ACC Chairman Richard W. Brown succeeded Mr. Stowers as trustee of a trust that holds a greater-than-25% voting interest in ACC, the parent corporation of the fund’s advisor. Under the 1940 Act, this is presumed to represent control of ACC even though it is less than a majority interest. The change of trustee was considered a change of control of ACC and therefore also a change of control of the fund’s advisor even though there has been no change to its management and none is anticipated. The change of control resulted in the assignment of the fund’s investment advisory agreement. As required by the 1940 Act, the assignment automatically terminated such agreem ent, making the approval of a new agreement necessary.
On February 18, 2010, the Board of Directors approved an interim investment advisory agreement under which the fund was managed until a new agreement was approved. The new agreement for the fund was approved by the Board of Directors on March 29, 2010, and by shareholders at a Special Meeting of Shareholders on June 16, 2010. It went into effect on July 16, 2010. The new agreement, which is substantially identical to the terminated agreement (with the exception of different effective and termination dates), did not result in changes in the management of American Century Investments, the fund, its investment objectives, fees or services provided.
11. Other Tax Information (Unaudited)
The following information is provided pursuant to provisions of the Internal Revenue Code.
The fund hereby designates up to the maximum amount allowable as qualified dividend income for the fiscal year ended October 31, 2010.
For corporate taxpayers, the fund hereby designates $45,786, or up to the maximum amount allowable, of ordinary income distributions paid during the fiscal year ended October 31, 2010 as qualified for the corporate dividends received deduction.
Heritage
| Investor Class |
| For a Share Outstanding Throughout the Years Ended October 31 |
| | 2010 | 2009 | 2008 | 2007 | 2006 |
| Per-Share Data |
| Net Asset Value, Beginning of Period | $14.32 | $13.15 | $22.83 | $15.58 | $13.48 |
| Income From Investment Operations | | | | | |
Net Investment Income (Loss)(1) | (0.07) | (0.02) | (0.09) | (0.10) | (0.03) |
| Net Realized and Unrealized Gain (Loss) | 4.96 | 1.32 | (8.53) | 8.42 | 2.22 |
| Total From Investment Operations | 4.89 | 1.30 | (8.62) | 8.32 | 2.19 |
| Distributions | | | | | |
| From Net Investment Income | — | (0.13) | — | — | — |
| From Net Realized Gains | — | — | (1.06) | (1.07) | (0.09) |
| Total Distributions | — | (0.13) | (1.06) | (1.07) | (0.09) |
| Net Asset Value, End of Period | $19.21 | $14.32 | $13.15 | $22.83 | $15.58 |
| | | | | | |
Total Return(2) | 34.15% | 10.16% | (39.54)% | 56.41% | 16.26% |
| | | | | | |
| Ratios/Supplemental Data |
Ratio of Operating Expenses to Average Net Assets | 1.01% | 1.01% | 1.00% | 1.00% | 1.00% |
Ratio of Net Investment Income (Loss) to Average Net Assets | (0.45)% | (0.19)% | (0.47)% | (0.56)% | (0.22)% |
| Portfolio Turnover Rate | 114% | 155% | 172% | 128% | 230% |
| Net Assets, End of Period (in millions) | $1,887 | $1,342 | $1,262 | $2,478 | $1,037 |
| (1) | Computed using average shares outstanding throughout the period. |
| (2) | Total returns are calculated based on the net asset value of the last business day. Total returns for periods less than one year are not annualized. |
See Notes to Financial Statements.
Heritage
| Institutional Class |
| For a Share Outstanding Throughout the Years Ended October 31 |
| | 2010 | 2009 | 2008 | 2007 | 2006 |
| Per-Share Data |
| Net Asset Value, Beginning of Period | $14.60 | $13.41 | $23.21 | $15.80 | $13.63 |
| Income From Investment Operations | | | | | |
Net Investment Income (Loss)(1) | (0.04) | —(2) | (0.05) | (0.07) | —(2) |
| Net Realized and Unrealized Gain (Loss) | 5.07 | 1.34 | (8.69) | 8.55 | 2.26 |
| Total From Investment Operations | 5.03 | 1.34 | (8.74) | 8.48 | 2.26 |
| Distributions | | | | | |
| From Net Investment Income | (0.01) | (0.15) | — | — | — |
| From Net Realized Gains | — | — | (1.06) | (1.07) | (0.09) |
| Total Distributions | (0.01) | (0.15) | (1.06) | (1.07) | (0.09) |
| Net Asset Value, End of Period | $19.62 | $14.60 | $13.41 | $23.21 | $15.80 |
| | | | | | |
Total Return(3) | 34.44% | 10.33% | (39.41)% | 56.66% | 16.59% |
| | | | | | |
| Ratios/Supplemental Data |
Ratio of Operating Expenses to Average Net Assets | 0.81% | 0.81% | 0.80% | 0.80% | 0.80% |
Ratio of Net Investment Income (Loss) to Average Net Assets | (0.25)% | 0.01% | (0.27)% | (0.36)% | (0.02)% |
| Portfolio Turnover Rate | 114% | 155% | 172% | 128% | 230% |
| Net Assets, End of Period (in thousands) | $115,261 | $92,343 | $86,835 | $155,885 | $57,039 |
| (1) | Computed using average shares outstanding throughout the period. |
| (2) | Per-share amount was less than $0.005. |
| (3) | Total returns are calculated based on the net asset value of the last business day. Total returns for periods less than one year are not annualized. |
See Notes to Financial Statements.
Heritage
A Class(1) |
| For a Share Outstanding Throughout the Years Ended October 31 |
| | 2010 | 2009 | 2008 | 2007 | 2006 |
| Per-Share Data |
| Net Asset Value, Beginning of Period | $13.98 | $12.84 | $22.37 | $15.32 | $13.29 |
| Income From Investment Operations | | | | | |
Net Investment Income (Loss)(2) | (0.11) | (0.06) | (0.13) | (0.15) | (0.08) |
| Net Realized and Unrealized Gain (Loss) | 4.83 | 1.30 | (8.34) | 8.27 | 2.20 |
| Total From Investment Operations | 4.72 | 1.24 | (8.47) | 8.12 | 2.12 |
| Distributions | | | | | |
| From Net Investment Income | — | (0.10) | — | — | — |
| From Net Realized Gains | — | — | (1.06) | (1.07) | (0.09) |
| Total Distributions | — | (0.10) | (1.06) | (1.07) | (0.09) |
| Net Asset Value, End of Period | $18.70 | $13.98 | $12.84 | $22.37 | $15.32 |
| | | | | | |
Total Return(3) | 33.76% | 9.89% | (39.69)% | 56.05% | 15.96% |
| | | | | | |
| Ratios/Supplemental Data |
Ratio of Operating Expenses to Average Net Assets | 1.26% | 1.26% | 1.25% | 1.25% | 1.25% |
Ratio of Net Investment Income (Loss) to Average Net Assets | (0.70)% | (0.44)% | (0.72)% | (0.81)% | (0.47)% |
| Portfolio Turnover Rate | 114% | 155% | 172% | 128% | 230% |
| Net Assets, End of Period (in thousands) | $803,692 | $518,768 | $351,962 | $291,674 | $57,995 |
| (1) | Prior to September 4, 2007, the A Class was referred to as the Advisor Class. |
| (2) | Computed using average shares outstanding throughout the period. |
| (3) | Total returns are calculated based on the net asset value of the last business day and do not reflect applicable sales charges. Total returns for periods less than one year are not annualized. |
See Notes to Financial Statements.
Heritage
| B Class |
| For a Share Outstanding Throughout the Years Ended October 31 (except as noted) |
| | 2010 | 2009 | 2008 | 2007(1) |
| Per-Share Data |
| Net Asset Value, Beginning of Period | $14.16 | $13.01 | $22.82 | $21.52 |
| Income From Investment Operations | | | | |
Net Investment Income (Loss)(2) | (0.24) | (0.16) | (0.26) | (0.03) |
| Net Realized and Unrealized Gain (Loss) | 4.89 | 1.33 | (8.49) | 1.33 |
| Total From Investment Operations | 4.65 | 1.17 | (8.75) | 1.30 |
| Distributions | | | | |
| From Net Investment Income | — | (0.02) | — | — |
| From Net Realized Gains | — | — | (1.06) | — |
| Total Distributions | — | (0.02) | (1.06) | — |
| Net Asset Value, End of Period | $18.81 | $14.16 | $13.01 | $22.82 |
| | | | | |
Total Return(3) | 32.84% | 8.99% | (40.16)% | 6.04% |
| | | | | |
| Ratios/Supplemental Data |
Ratio of Operating Expenses to Average Net Assets | 2.01% | 2.01% | 2.00% | 2.00%(4) |
Ratio of Net Investment Income (Loss) to Average Net Assets | (1.45)% | (1.19)% | (1.47)% | (1.81)%(4) |
| Portfolio Turnover Rate | 114% | 155% | 172% | 128%(5) |
| Net Assets, End of Period (in thousands) | $3,997 | $3,425 | $1,770 | $83 |
| (1) | September 28, 2007 (commencement of sale) through October 31, 2007. |
| (2) | Computed using average shares outstanding throughout the period. |
| (3) | Total returns are calculated based on the net asset value of the last business day and do not reflect applicable sales charges. Total returns for periods less than one year are not annualized. |
| (5) | Portfolio turnover is calculated at the fund level. Percentage indicated was calculated for the year ended October 31, 2007. |
See Notes to Financial Statements.
Heritage
| C Class |
| For a Share Outstanding Throughout the Years Ended October 31 |
| | 2010 | 2009 | 2008 | 2007 | 2006 |
| Per-Share Data |
| Net Asset Value, Beginning of Period | $13.21 | $12.13 | $21.35 | $14.77 | $12.91 |
| Income From Investment Operations | | | | | |
Net Investment Income (Loss)(1) | (0.22) | (0.14) | (0.26) | (0.29) | (0.18) |
| Net Realized and Unrealized Gain (Loss) | 4.56 | 1.24 | (7.90) | 7.94 | 2.13 |
| Total From Investment Operations | 4.34 | 1.10 | (8.16) | 7.65 | 1.95 |
| Distributions | | | | | |
| From Net Investment Income | — | (0.02) | — | — | — |
| From Net Realized Gains | — | — | (1.06) | (1.07) | (0.09) |
| Total Distributions | — | (0.02) | (1.06) | (1.07) | (0.09) |
| Net Asset Value, End of Period | $17.55 | $13.21 | $12.13 | $21.35 | $14.77 |
| | | | | | |
Total Return(2) | 32.85% | 9.07% | (40.16)% | 54.88% | 15.11% |
| | | | | | |
| Ratios/Supplemental Data |
Ratio of Operating Expenses to Average Net Assets | 2.01% | 2.01% | 2.00% | 2.00% | 2.00% |
Ratio of Net Investment Income (Loss) to Average Net Assets | (1.45)% | (1.19)% | (1.47)% | (1.56)% | (1.22)% |
| Portfolio Turnover Rate | 114% | 155% | 172% | 128% | 230% |
| Net Assets, End of Period (in thousands) | $85,381 | $51,745 | $32,812 | $21,692 | $2,334 |
| (1) | Computed using average shares outstanding throughout the period. |
| (2) | Total returns are calculated based on the net asset value of the last business day and do not reflect applicable sales charges. Total returns for periods less than one year are not annualized. |
See Notes to Financial Statements.
Heritage
| R Class |
| For a Share Outstanding Throughout the Years Ended October 31 (except as noted) |
| | 2010 | 2009 | 2008 | 2007(1) |
| Per-Share Data |
| Net Asset Value, Beginning of Period | $14.24 | $13.08 | $22.83 | $21.52 |
| Income From Investment Operations | | | | |
Net Investment Income (Loss)(2) | (0.16) | (0.11) | (0.17) | (0.02) |
| Net Realized and Unrealized Gain (Loss) | 4.93 | 1.34 | (8.52) | 1.33 |
| Total From Investment Operations | 4.77 | 1.23 | (8.69) | 1.31 |
| Distributions | | | | |
| From Net Investment Income | — | (0.07) | — | — |
| From Net Realized Gains | — | — | (1.06) | — |
| Total Distributions | — | (0.07) | (1.06) | — |
| Net Asset Value, End of Period | $19.01 | $14.24 | $13.08 | $22.83 |
| | | | | |
Total Return(3) | 33.50% | 9.58% | (39.86)% | 6.09% |
| | | | | |
| Ratios/Supplemental Data |
Ratio of Operating Expenses to Average Net Assets | 1.51% | 1.51% | 1.50% | 1.50%(4) |
Ratio of Net Investment Income (Loss) to Average Net Assets | (0.95)% | (0.69)% | (0.97)% | (1.22)%(4) |
| Portfolio Turnover Rate | 114% | 155% | 172% | 128%(5) |
| Net Assets, End of Period (in thousands) | $17,544 | $4,775 | $496 | $27 |
| (1) | September 28, 2007 (commencement of sale) through October 31, 2007. |
| (2) | Computed using average shares outstanding throughout the period. |
| (3) | Total returns are calculated based on the net asset value of the last business day. Total returns for periods less than one year are not annualized. |
| (5) | Portfolio turnover is calculated at the fund level. Percentage indicated was calculated for the year ended October 31, 2007. |
See Notes to Financial Statements.
Report of Independent Registered Public Accounting Firm
The Board of Directors and Shareholders,
American Century Mutual Funds, Inc.:
We have audited the accompanying statement of assets and liabilities, including the schedule of investments, of Heritage Fund, one of the funds constituting American Century Mutual Funds, Inc. (the “Corporation”), as of October 31, 2010, and the related statement of operations for the year then ended, the statements of changes in net assets for each of the two years in the period then ended, and the financial highlights for each of the five years in the period then ended. These financial statements and financial highlights are the responsibility of the Corporation’s management. Our responsibility is to express an opinion on these financial statements and financial highlights based on our audits.
We conducted our audits in accordance with the standards of the Public Company Accounting Oversight Board (United States). Those standards require that we plan and perform the audit to obtain reasonable assurance about whether the financial statements and financial highlights are free of material misstatement. The Corporation is not required to have, nor were we engaged to perform, an audit of its internal control over financial reporting. Our audits included consideration of internal control over financial reporting as a basis for designing audit procedures that are appropriate in the circumstances, but not for the purpose of expressing an opinion on the effectiveness of the Corporation’s internal control over financial reporting. Accordingly, we express no such opinion. An audit also includes examining, on a te st basis, evidence supporting the amounts and disclosures in the financial statements, assessing the accounting principles used and significant estimates made by management, as well as evaluating the overall financial statement presentation. Our procedures included confirmation of securities owned as of October 31, 2010, by correspondence with the custodian and brokers; where replies were not received from brokers, we performed other auditing procedures. We believe that our audits provide a reasonable basis for our opinion.
In our opinion, the financial statements and financial highlights referred to above present fairly, in all material respects, the financial position of Heritage Fund of American Century Mutual Funds, Inc., as of October 31, 2010, the results of its operations for the year then ended, the changes in its net assets for each of the two years in the period then ended, and the financial highlights for each of the five years in the period then ended, in conformity with accounting principles generally accepted in the United States of America.
Deloitte & Touche LLP
Kansas City, Missouri
December 20, 2010
A special meeting of shareholders was held on June 16, 2010, to vote on the following proposals. Each proposal received the required number of votes and was adopted. A summary of voting results is listed below each proposal.
Proposal 1:
To elect one Director to the Board of Directors of American Century Mutual Funds, Inc. (the proposal was voted on by all shareholders of funds issued by American Century Mutual Funds, Inc.):
| | | | | |
| | John R. Whitten | For: | 13,907,426,552 | |
| | | Withhold: | 629,801,798 | |
| | | Abstain: | 0 | |
| | | Broker Non-Vote: | 0 | |
The other directors whose term of office continued after the meeting include Jonathan S. Thomas, Thomas A. Brown, Andrea C. Hall, James A. Olson, Donald H. Pratt, and M. Jeannine Strandjord.
Proposal 2:
To approve a management agreement between the fund and American Century Investment Management, Inc.:
| | | | | |
| | Investor, A, B, C and R Classes | | | |
| | | For: | 1,213,738,072 | |
| | | Against: | 21,233,769 | |
| | | Abstain: | 56,109,237 | |
| | | Broker Non-Vote: | 384,641,177 | |
| | | | | |
| | Institutional Class | | | |
| | | For: | 77,278,883 | |
| | | Against: | 27,552 | |
| | | Abstain: | 100,016 | |
| | | Broker Non-Vote: | 1,282,102 | |
Proposal 3:
To approve an amendment to the Articles of Incorporation to limit certain director liability to the extent permitted by Maryland law (the proposal was voted on by all shareholders of funds issued by American Century Mutual Funds, Inc.):
| | | | | |
| | | For: | 12,112,932,038 | |
| | | Against: | 769,504,652 | |
| | | Abstain: | 420,034,445 | |
| | | Broker Non-Vote: | 1,234,757,216 | |
The Board of Directors
The individuals listed below serve as directors of the fund. Each director will continue to serve in this capacity until death, retirement, resignation or removal from office. The mandatory retirement age for directors who are not “interested persons,” as that term is defined in the Investment Company Act (independent directors), is 72. However, the mandatory retirement age for an individual director may be extended with the approval of the remaining independent directors.
Mr. Thomas is the only director who is an “interested person” because he currently serves as President and Chief Executive Officer of American Century Companies, Inc. (ACC), the parent company of American Century Investment Management, Inc. (ACIM or the advisor).
The other directors (more than three-fourths of the total number) are independent; that is, they have never been employees, directors or officers of, and have no financial interest in, ACC or any of its wholly owned, direct or indirect, subsidiaries, including ACIM, American Century Investment Services, Inc. (ACIS) and American Century Services, LLC (ACS). The directors serve in this capacity for seven (in the case of Mr. Thomas, 15) registered investment companies in the American Century Investments family of funds.
The following presents additional information about the directors. The mailing address for each director is 4500 Main Street, Kansas City, Missouri 64111.
Independent Directors
Thomas A. Brown
Year of Birth: 1940
Position(s) with the Fund: Director
Length of Time Served: Since 1980
Principal Occupation(s) During the Past Five Years: Managing Member, Associated Investments, LLC (real estate investment company); Brown Cascade Properties, LLC (real estate investment company) (2001 to 2009)
Number of Funds in Fund Complex Overseen by Director: 61
Other Directorships Held by Director During the Past Five Years: None
Education/Other Professional Experience: BS in Mechanical Engineering, University of Kansas; formerly, Chief Executive Officer, Associated Bearings Company; formerly, Area Vice President, Applied Industrial Technologies (bearings and power transmission company)
Andrea C. Hall
Year of Birth: 1945
Position(s) with the Fund: Director
Length of Time Served: Since 1997
Principal Occupation(s) During the Past Five Years: Retired as advisor to the President, Midwest Research Institute (not-for-profit research organization) (June 2006)
Number of Funds in Fund Complex Overseen by Director: 61
Other Directorships Held by Director During the Past Five Years: None
Education/Other Professional Experience: BS in Biology, Florida State University; PhD in Biology, Georgetown University; formerly, Senior Vice President and Director of Research Operations, Midwest Research Institute
James A. Olson
Year of Birth: 1942
Position(s) with the Fund: Director
Length of Time Served: Since 2007
Principal Occupation(s) During the Past Five Years: Member, Plaza Belmont LLC (private equity fund manager); Chief Financial Officer, Plaza Belmont LLC (September 1999 to September 2006)
Number of Funds in Fund Complex Overseen by Director: 61
Other Directorships Held by Director During the Past Five Years: Saia, Inc. and Entertainment Properties Trust
Education/Other Professional Experience: BS in Business Administration and MBA, St. Louis University; CPA; 21 years of experience as a partner in the accounting firm of Ernst & Young LLP
Donald H. Pratt
Year of Birth: 1937
Position(s) with the Fund: Director, Chairman of the Board
Length of Time Served: Since 1995 (Chairman since 2005)
Principal Occupation(s) During the Past Five Years: Chairman and Chief Executive Officer, Western Investments, Inc. (real estate company)
Number of Funds in Fund Complex Overseen by Director: 61
Other Directorships Held by Director During the Past Five Years: None
Education/Other Professional Experience: BS in Industrial Engineering, Wichita State University; MBA, Harvard Business School; serves on the Board of Governors of the Independent Directors Council and Investment Company Institute; formerly, Chairman of the Board, Butler Manufacturing Company (metal buildings producer)
M. Jeannine Strandjord
Year of Birth: 1945
Position(s) with the Fund: Director
Length of Time Served: Since 1994
Principal Occupation(s) During the Past Five Years: Retired, formerly, Senior Vice President, Process Excellence, Sprint Corporation (telecommunications company) (January 2005 to September 2005)
Number of Funds in Fund Complex Overseen by Director: 61
Other Directorships Held by Director During the Past Five Years: DST Systems Inc., Euronet Worldwide Inc., Charming Shoppes, Inc.
Education/Other Professional Experience: BS in Business Administration and Accounting, University of Kansas; CPA; formerly, Senior Vice President of Financial Services and Treasurer and Chief Financial Officer, Global Markets Group; Sprint Corporation; formerly, with the accounting firm of Ernst and Whinney
John R. Whitten
Year of Birth: 1946
Position(s) with the Fund: Director
Length of Time Served: Since 2008
Principal Occupation(s) During the Past Five Years: Project Consultant, Celanese Corp. (industrial chemical company)
Number of Funds in Fund Complex Overseen by Director: 61
Other Directorships Held by Director During the Past Five Years: Rudolph Technologies, Inc.
Professional Education/Experience: BS in Business Administration, Cleveland State University; CPA; formerly, Chief Financial Officer and Treasurer, Applied Industrial Technologies, Inc.; thirteen years of experience with accounting firm Deloitte & Touche LLP
Interested Director
Jonathan S. Thomas
Year of Birth: 1963
Position(s) with the Fund: Director and President
Length of Time Served: Since 2007
Principal Occupation(s) During the Past Five Years: President and Chief Executive Officer, ACC (March 2007 to present); Chief Administrative Officer, ACC (February 2006 to February 2007); Executive Vice President, ACC (November 2005 to February 2007). Also serves as: Chief Executive Officer and Manager, ACS; Executive Vice President, ACIM; Director, ACC, ACIM and other ACC subsidiaries
Number of Funds in Fund Complex Overseen by Director: 101
Other Directorships Held by Director During the Past Five Years: None
Education/Other Professional Experience: BA in Economics, University of Massachusetts; MBA, Boston College; formerly held senior leadership roles with Fidelity Investments, Boston Financial Services, Bank of America and Morgan Stanley; serves on the Board of Governors of the Investment Company Institute
Officers
The following table presents certain information about the executive officers of the fund. Each officer serves as an officer for each of the 15 investment companies in the American Century family of funds, unless otherwise noted. No officer is compensated for his or her service as an officer of the fund. The listed officers are interested persons of the fund and are appointed or re-appointed on an annual basis. The mailing address for each of the officers listed below is 4500 Main Street, Kansas City, Missouri 64111.
| | Name (Year of Birth) | Offices with the Fund | Principal Occupation(s) During the Past Five Years |
| | Jonathan S. Thomas (1963) | Director and President since 2007 | President and Chief Executive Officer, ACC (March 2007 to present); Chief Administrative Officer, ACC (February 2006 to February 2007); Executive Vice President, ACC (November 2005 to February 2007). Also serves as: Chief Executive Officer and Manager, ACS; Executive Vice President, ACIM; Director, ACC, ACIM and other ACC subsidiaries |
| | Barry Fink (1955) | Executive Vice President since 2007 | Chief Operating Officer and Executive Vice President, ACC (September 2007 to present); President, ACS (October 2007 to present); Managing Director, Morgan Stanley (2000 to 2007); Global General Counsel, Morgan Stanley (2000 to 2006). Also serves as: Manager, ACS and Director, ACC and certain ACC subsidiaries |
| | Maryanne L. Roepke (1956) | Chief Compliance Officer since 2006 and Senior Vice President since 2000 | Chief Compliance Officer, American Century funds, ACIM and ACS (August 2006 to present); Assistant Treasurer, ACC (January 1995 to August 2006); and Treasurer and Chief Financial Officer, various American Century funds (July 2000 to August 2006). Also serves as: Senior Vice President, ACS |
| | Charles A. Etherington (1957) | General Counsel since 2007 and Senior Vice President since 2006 | Attorney, ACC (February 1994 to present); Vice President, ACC (November 2005 to present), General Counsel, ACC (March 2007 to present); Also serves as General Counsel, ACIM, ACS, ACIS and other ACC subsidiaries; and Senior Vice President, ACIM and ACS |
| | Robert J. Leach (1966) | Vice President, Treasurer and Chief Financial Officer since 2006 | Vice President, ACS (February 2000 to present); and Controller, various American Century funds (1997 to September 2006) |
| | David H. Reinmiller (1963) | Vice President since 2000 | Attorney, ACC (January 1994 to present); Associate General Counsel, ACC (January 2001 to present); Chief Compliance Officer, American Century funds and ACIM (January 2001 to February 2005). Also serves as Vice President, ACIM and ACS |
| | Ward D. Stauffer (1960) | Secretary since 2005 | Attorney, ACC (June 2003 to present) |
The Statement of Additional Information has additional information about the fund’s directors and is available without charge, upon request, by calling 1-800-345-2021.
Retirement Account Information
As required by law, distributions you receive from certain IRAs, or 403(b), 457 and qualified plans are subject to federal income tax withholding, unless you elect not to have withholding apply. Tax will be withheld on the total amount withdrawn even though you may be receiving amounts that are not subject to withholding, such as nondeductible contributions. In such case, excess amounts of withholding could occur. You may adjust your withholding election so that a greater or lesser amount will be withheld.
If you don’t want us to withhold on this amount, you must notify us to not withhold the federal income tax. You may notify us in writing or in certain situations by telephone or through other electronic means. You have the right to revoke your withholding election at any time and any election you make may remain in effect until revoked by filing a new election.
Remember, even if you elect not to have income tax withheld, you are liable for paying income tax on the taxable portion of your withdrawal. If you elect not to have income tax withheld or you don’t have enough income tax withheld, you may be responsible for payment of estimated tax. You may incur penalties under the estimated tax rules if your withholding and estimated tax payments are not sufficient. You can reduce or defer the income tax on a distribution by directly or indirectly rolling such distribution over to another IRA or eligible plan. You should consult your tax advisor for additional information.
State tax will be withheld if, at the time of your distribution, your address is within one of the mandatory withholding states and you have federal income tax withheld. State taxes will be withheld from your distribution in accordance with the respective state rules.
Proxy Voting Guidelines
American Century Investment Management, Inc., the fund’s investment advisor, is responsible for exercising the voting rights associated with the securities purchased and/or held by the fund. A description of the policies and procedures the advisor uses in fulfilling this responsibility is available without charge, upon request, by calling 1-800-345-2021. It is also available on American Century Investments’ website at americancentury.com and on the Securities and Exchange Commission’s website at sec.gov. Information regarding how the investment advisor voted proxies relating to portfolio securities during the most recent 12-month period ended June 30 is available on the “About Us” page at americancentury.com. It is also available at sec.gov.
Quarterly Portfolio Disclosure
The fund files its complete schedule of portfolio holdings with the Securities and Exchange Commission (SEC) for the first and third quarters of each fiscal year on Form N-Q. The fund’s Forms N-Q are available on the SEC’s website at sec.gov, and may be reviewed and copied at the SEC’s Public Reference Room in Washington, DC. Information on the operation of the Public Reference Room may be obtained by calling 1-800-SEC-0330. The fund also makes its complete schedule of portfolio holdings for the most recent quarter of its fiscal year available on its website at americancentury.com and, upon request, by calling 1-800-345-2021.
The following indices are used to illustrate investment market, sector, or style performance or to serve as fund performance comparisons. They are not investment products available for purchase.
The Russell 1000® Index is a market-capitalization weighted, large-cap index created by Frank Russell Company to measure the performance of the 1,000 largest publicly traded U.S. companies, based on total market capitalization.
The Russell 1000® Growth Index measures the performance of those Russell 1000 Index companies (the 1,000 largest publicly traded U.S. companies, based on total market capitalization) with higher price-to-book ratios and higher forecasted growth values.
The Russell 1000® Value Index measures the performance of those Russell 1000 Index companies (the 1,000 largest publicly traded U.S. companies, based on total market capitalization) with lower price-to-book ratios and lower forecasted growth values.
The Russell 2000® Index is a market-capitalization weighted index created by Frank Russell Company to measure the performance of the 2,000 smallest of the 3,000 largest publicly traded U.S. companies, based on total market capitalization.
The Russell 2000® Growth Index measures the performance of those Russell 2000 Index companies (the 2,000 smallest of the 3,000 largest publicly traded U.S. companies, based on total market capitalization) with higher price-to-book ratios and higher forecasted growth values.
The Russell 2000® Value Index measures the performance of those Russell 2000 Index companies (the 2,000 smallest of the 3,000 largest publicly traded U.S. companies, based on total market capitalization) with lower price-to-book ratios and lower forecasted growth values.
The Russell Midcap® Index measures the performance of the 800 smallest of the 1,000 largest publicly traded U.S. companies, based on total market capitalization.
The Russell Midcap® Growth Index measures the performance of those Russell Midcap Index companies (the 800 smallest of the 1,000 largest publicly traded U.S. companies, based on total market capitalization) with higher price-to-book ratios and higher forecasted growth values.
The Russell Midcap® Value Index measures the performance of those Russell Midcap Index companies (the 800 smallest of the 1,000 largest publicly traded U.S. companies, based on total market capitalization) with lower price-to-book ratios and lower forecasted growth values.
Notes
Notes
 |
| | |
| Contact Us | |
| | |
| americancentury.com | |
| | |
| Automated Information Line | 1-800-345-8765 |
| | |
| Investor Services Representative | 1-800-345-2021 or 816-531-5575 |
| | |
| Investors Using Advisors | 1-800-378-9878 |
| | |
| Business, Not-For-Profit, Employer-Sponsored Retirement Plans | 1-800-345-3533 |
| | |
| Banks and Trust Companies, Broker-Dealers, Financial Professionals, Insurance Companies | 1-800-345-6488 |
| | |
| Telecommunications Device for the Deaf | 1-800-634-4113 |
| | |
| American Century Mutual Funds, Inc. |
| |
Investment Advisor: American Century Investment Management, Inc. Kansas City, Missouri |
| |
| This report and the statements it contains are submitted for the general information of our shareholders. The report is not authorized for distribution to prospective investors unless preceded or accompanied by an effective prospectus. |
American Century Investment Services, Inc., Distributor
©2010 American Century Proprietary Holdings, Inc. All rights reserved.
| Annual Report |
| October 31, 2010 |
American Century Investments®
| | President’s Letter | 2 |
| | Independent Chairman’s Letter | 3 |
| | Market Perspective | 4 |
| | U.S. Stock Index Returns | 4 |
| | | |
| NT Growth |
| |
| | Performance | 5 |
| | Portfolio Commentary | 6 |
| | Top Ten Holdings | 8 |
| | Top Five Industries | 8 |
| | Types of Investments in Portfolio | 8 |
| | | |
| | Shareholder Fee Example | 9 |
| | | |
| Financial Statements |
| |
| | Schedule of Investments | 11 |
| | Statement of Assets and Liabilities | 14 |
| | Statement of Operations | 15 |
| | Statement of Changes in Net Assets | 16 |
| | Notes to Financial Statements | 17 |
| | Financial Highlights | 23 |
| | Report of Independent Registered Public Accounting Firm | 24 |
| | | |
| Other Information |
| |
| | Proxy Voting Results | 25 |
| | Management | 26 |
| | Additional Information | 30 |
| | Index Definitions | 31 |
Any opinions expressed in this report reflect those of the author as of the date of the report, and do not necessarily represent the opinions of American Century Investments or any other person in the American Century Investments organization. Any such opinions are subject to change at any time based upon market or other conditions and American Century Investments disclaims any responsibility to update such opinions. These opinions may not be relied upon as investment advice and, because investment decisions made by American Century Investments funds are based on numerous factors, may not be relied upon as an indication of trading intent on behalf of any American Century Investments fund. Security examples are used for representational purposes only and are not intended as recommendations to purchase or sell securities. Performance information for comparative indices and securities is provided to American Century Investments by third party vendors. To the best of American Century Investments’ knowledge, such information is accurate at the time of printing.
Jonathan Thomas
Dear Investor:
To learn more about the capital markets, your investment, and the portfolio management strategies American Century Investments provides, we encourage you to review this shareholder report for the financial reporting period ended October 31, 2010.
On the following pages, you will find investment performance and portfolio information, presented with the expert perspective and commentary of our portfolio management team. This report remains one of our most important vehicles for conveying the information you need about your investment performance, and about the market factors and strategies that affect fund returns. For additional information on the markets, we encourage you to visit the “Insights & News” tab at our Web site, americancentury.com, for updates and further expert commentary.
The top of our Web site’s home page also provides a link to “Our Story,” which, first and foremost, outlines our commitment—since 1958—to helping clients reach their financial goals. We believe strongly that we will only be successful when our clients are successful. That’s who we are.
Another important, unique facet of our story and who we are is “Profits with a Purpose,” which describes our bond with the Stowers Institute for Medical Research (SIMR). SIMR is a world-class biomedical organization—founded by our company founder James E. Stowers, Jr. and his wife Virginia—that is dedicated to researching the causes, treatment, and prevention of gene-based diseases, including cancer. Through American Century Investments’ private ownership structure, more than 40% of our profits support SIMR.
Mr. Stowers’ example of achieving financial success and using that platform to help humanity motivates our entire American Century Investments team. His story inspires us to help each of our clients achieve success. Thank you for sharing your financial journey with us.
Sincerely,
Jonathan Thomas
President and Chief Executive Officer
American Century Investments
Independent Chairman’s Letter
Don Pratt
Dear Fellow Shareholders,
As regulators and the markets continue to sort out the events of the credit crisis, a consistent theme has been that financial services firms should re-examine their risk management practices. Risk management has been a regular part of American Century Investments’ activities for many years. However, recently American Century and your mutual fund board have been spending additional time focusing on our risk oversight processes.
The board’s efforts are now organized around three categories of risk: investment risk, operational risk, and enterprise risk. This approach has facilitated a realignment of many risk oversight tasks that the board has historically conducted. Investment risk tasks include a review of portfolio risk, monitoring the use of derivatives, and performance assessment. Operational risk focuses on compliance, valuation, shareholder services, and trading activities. Enterprise risk addresses the financial condition of the advisor, human resource development, and reputational risks. Risk oversight tasks are addressed in every quarterly board meeting, and a review of the advisor’s entire risk management program is undertaken annually. We acknowledge and support the approach that American Century Investments takes to its risk management responsibilities. While the board has refocused its efforts in this important oversight area, we recognize that risk oversight is a journey and we expect to continue to improve our processes.
Our September quarterly board meeting was held in the New York offices of American Century Investments. This gave the directors an opportunity to meet with the portfolio management teams for each of the global and international funds overseen by the board. Each team uses sophisticated investment tools and daily risk analysis in managing client assets. We also were impressed with the “bench strength” that has been developed under the leadership of the Global and Non-U.S. Equity CIO Mark Kopinski. These face-to-face meetings provide an opportunity for the directors—working on behalf of shareholders—to validate the advisor’s efforts and the investment management approach being followed.
I thank you for your continued confidence in American Century during this turbulent time in the economy and investment markets. If you have thoughts or questions you would like to share with the board send them to me at dhpratt@fundboardchair.com.
Best regards,
Don Pratt
By Greg Woodhams, Chief Investment Officer, U.S. Growth Equity—Large Cap
Stocks Advanced, But Volatility Increased
The U.S. stock market posted double-digit gains for the 12 months ended October 31, 2010. The bulk of the advance occurred in the first half of the period as stocks extended a rally that began in March 2009. The market’s gains were driven by improving economic conditions, as evidenced by robust gross domestic product growth in the fourth quarter of 2009 and first quarter of 2010, and a rebound in corporate earnings as many companies significantly reduced costs to boost profit margins.
Market conditions grew more volatile during the last half of the period. Concerns about the European financial system and the strength of the economic recovery in the U.S. led to a stock market decline in May and June. However, the equity market finished the period on a positive note, staging a rally during the last two months of the period as economic indicators pointed to improved growth in the third quarter.
For the 12-month period, the broad equity indices returned approximately 18%. As the table below illustrates, mid- and small-cap issues led the market’s advance, returning more than 25% overall.
Growth Stocks Outperformed
Growth stocks outpaced value issues across all market capitalizations during the period, particularly over the last six months. The economically sensitive segments of the market—information technology, consumer discretionary, and industrials—were among the top performers for the 12 months. In contrast, the financials sector, which is the most prominent sector weighting in most value indices, lagged amid continued weakness in the housing market and uncertainty regarding the impact of recent financial reform legislation.
| U.S. Stock Index Returns |
| For the 12 months ended October 31, 2010 |
| Russell 1000 Index (Large-Cap) | 17.67% | | Russell 2000 Index (Small-Cap) | 26.58% |
| Russell 1000 Growth Index | 19.65% | | Russell 2000 Growth Index | 28.67% |
| Russell 1000 Value Index | 15.71% | | Russell 2000 Value Index | 24.43% |
| Russell Midcap Index | 27.71% | | |
| Russell Midcap Growth Index | 28.03% | | | |
| Russell Midcap Value Index | 27.49% | | | |
NT Growth
| Total Returns as of October 31, 2010 |
| | | | Average Annual Returns | |
| | Ticker Symbol | 1 year | Since Inception | Inception Date |
| Institutional Class | ACLTX | 18.94% | 3.77% | 5/12/06 |
| Russell 1000 Growth Index | — | 19.65% | 2.02%(1) | — |
| (1) | Since 4/30/06, the date nearest the Institutional Class’s inception for which data are available. |
| Growth of $10,000 Over Life of Class |
| $10,000 investment made May 12, 2006 |
*From 5/12/06, the Institutional Class’s inception date. Index data from 4/30/06, the date nearest the Institutional Class’s inception for which data are available. Not annualized.
| Total Annual Fund Operating Expenses |
Institutional Class 0.80% |
The total annual fund operating expenses shown is as stated in the fund’s prospectus current as of the date of this report. The prospectus may vary from the expense ratio shown elsewhere in this report because it is based on a different time period, includes acquired fund fees and expenses, and, if applicable, does not include fee waivers or expense reimbursements.
Data presented reflect past performance. Past performance is no guarantee of future results. Current performance may be higher or lower than the performance shown. Investment return and principal value will fluctuate, and redemption value may be more or less than original cost. To obtain performance data current to the most recent month end, please call 1-800-345-2021 or visit americancentury.com.
Data assumes reinvestment of dividends and capital gains, and none of the charts reflect the deduction of taxes that a shareholder would pay on fund distributions or the redemption of fund shares. Returns for the index are provided for comparison. The fund’s total returns include operating expenses (such as transaction costs and management fees) that reduce returns, while the total returns of the index do not.
NT Growth
Portfolio Managers: Greg Woodhams and Prescott LeGard
Performance Summary
NT Growth gained 18.94% in the 12 months ended October 31, 2010. By comparison, the Russell 1000 Growth Index (the fund’s benchmark) returned 19.65%. The portfolio outperformed its benchmark for the period from its May 2006 inception to October 2010 (see the previous page).
In terms of NT Growth’s absolute returns for the fiscal year, information technology shares contributed most to performance; no sector had negative returns for the period. Relative to the benchmark, stock selection made the consumer staples and financials sectors the leading detractors. Stock choices in the materials sector contributed most to relative performance, followed by contributions from positioning in the information technology and consumer discretionary segments.
Leading Detractors
Stock choices made consumer staples shares the leading detractors from relative results. Drug retailer Walgreen underperformed after issuing a cautious outlook despite reporting positive results. A stake in agricultural products processor Archer Daniels Midland also hurt performance, as soy crush margins declined. We eliminated our position in Archer Daniels Midland during the period. It also detracted from relative performance to have no exposure to tobacco firms (consistent with the fund’s investment guidelines) Altria Group and Philip Morris International.
Stock selection also hurt relative returns in the financials sector, led by positioning among capital market firms and commercial banks. A stake in Goldman Sachs detracted from performance amid an ongoing government investigation into its conduct in the buildup to the financial crisis. Broker and asset manager Charles Schwab and commercial bank Wells Fargo were other notable detractors. It also hurt relative performance to have no exposure to real estate investment trusts.
An overweight position in the lagging health care sector also hurt relative returns, as did stock choices in the biotechnology and health care equipment industries. Medical equipment companies Baxter International and Covidien were the leading detractors in this sector.
Though consumer discretionary shares were positive contributors overall, a number of notable individual detractors came from the sector. Stakes in multiline retailers Kohl’s and Target hurt performance. It also detracted to be underrepresented in shares of internet retailers priceline.com and Amazon.com, which did well during the year despite a challenging consumer environment.
Materials Shares Contributed Most
Stock selection made the materials sector the leading contributor to relative return. Positioning in the chemicals industry contributed most, where it helped to hold stakes in PPG Industries and Airgas. It was also beneficial to be underrepresented in shares of Monsanto. Metals and mining firms Freeport-McMoRan Copper & Gold and Newmont Mining were other sources of strength, benefiting from rising gold prices.
IT and Consumer Discretionary Stocks Also Helped
Stock choices meant the information technology sector was another important source of outperformance. Communications equipment company F5 Networks continued to benefit from web traffic trends and data center consolidation, making this one of the largest individual contributors to relative results for the year. Relative performance was also aided by stakes in semiconductor firms Broadcom, Cree, and Linear Technology.
Another key contribution to relative results came from positioning in the consumer discretionary sector, led by holdings in the auto components, specialty retail, and hotels, restaurant, and leisure industry segments. The largest individual contributor for the year was auto parts manufacturer BorgWarner, which benefited from the rebound in the auto industry and demand for new turbo-diesel and gasoline direct-injection engines. Fast food retailer Chipotle Mexican Grill enjoyed better-than-expected same-store sales and good growth dynamics. Starwood Hotels & Resorts was another leading contributor for the year, benefiting from rising room rates and favorable supply/demand factors.
Finally, stock selection and an underweight position made energy shares other positive contributors to performance relative to the benchmark. Energy stocks underperformed in part because of negative sentiment resulting from the Gulf of Mexico disaster.
Outlook
We believe stock selection—rather than sector allocation or market timing via the use of cash—is the most efficient means of generating superior risk-adjusted returns relative to the Russell 1000 Growth Index. Using stock selection as the principal tool for alpha generation has advantages for generating higher risk-adjusted returns, and does so in a manner that provides an investor with the desired asset allocation. Superior risk-adjusted returns can be achieved because of the diversification in multiple stock decisions versus the all-or-none approach of a market call. In other words, an 80-stock portfolio reflects 80 investment decisions, while a top-down market-timing approach (via cash or some other sector or asset allocation technique) is really one decision executed through 80 positions.
As a result of this approach, the portfolio’s sector and industry selection as well as capitalization range allocations are primarily a result of identifying what we believe to be superior individual securities. As of October 31, 2010, we found opportunity in the industrials, telecommunication services, and health care sectors, the portfolio’s largest overweight positions relative to the benchmark. The most notable sector underweight was in information technology shares, though the sector remains the portfolio’s single largest sector allocation on an absolute basis.
NT Growth
| Top Ten Holdings |
| | % of net assets as of 10/31/10 |
| Apple, Inc. | 4.7% |
| Exxon Mobil Corp. | 4.3% |
| Google, Inc., Class A | 3.0% |
| Coca-Cola Co. (The) | 2.7% |
| Oracle Corp. | 2.5% |
| Schlumberger Ltd. | 2.4% |
| EMC Corp. | 1.9% |
| Microsoft Corp. | 1.8% |
| United Parcel Service, Inc., Class B | 1.8% |
| QUALCOMM, Inc. | 1.7% |
| | |
| Top Five Industries |
| | % of net assets as of 10/31/10 |
| Software | 8.2% |
| Computers & Peripherals | 7.7% |
| Oil, Gas & Consumable Fuels | 6.9% |
| Machinery | 4.9% |
| Communications Equipment | 4.1% |
| | |
| Types of Investments in Portfolio |
| | % of net assets as of 10/31/10 |
| Common Stocks | 99.2% |
| Temporary Cash Investments | 0.7% |
| Other Assets and Liabilities | 0.1% |
Shareholder Fee Example (Unaudited)
Fund shareholders may incur two types of costs: (1) transaction costs, including sales charges (loads) on purchase payments and redemption/exchange fees; and (2) ongoing costs, including management fees; distribution and service (12b-1) fees; and other fund expenses. This example is intended to help you understand your ongoing costs (in dollars) of investing in your fund and to compare these costs with the ongoing cost of investing in other mutual funds.
The example is based on an investment of $1,000 made at the beginning of the period and held for the entire period from May 1, 2010 to October 31, 2010.
Actual Expenses
The table provides information about actual account values and actual expenses for each class. You may use the information, together with the amount you invested, to estimate the expenses that you paid over the period. First, identify the share class you own. Then simply divide your account value by $1,000 (for example, an $8,600 account value divided by $1,000 = 8.6), then multiply the result by the number under the heading “Expenses Paid During Period” to estimate the expenses you paid on your account during this period.
If you hold Investor Class shares of any American Century Investments fund, or Institutional Class shares of the American Century Diversified Bond Fund, in an American Century Investments account (i.e., not a financial intermediary or retirement plan account), American Century Investments may charge you a $12.50 semiannual account maintenance fee if the value of those shares is less than $10,000. We will redeem shares automatically in one of your accounts to pay the $12.50 fee. In determining your total eligible investment amount, we will include your investments in all personal accounts (including American Century Investments Brokerage accounts) regis tered under your Social Security number. Personal accounts include individual accounts, joint accounts, UGMA/UTMA accounts, personal trusts, Coverdell Education Savings Accounts and IRAs (including traditional, Roth, Rollover, SEP-, SARSEP- and SIMPLE-IRAs), and certain other retirement accounts. If you have only business, business retirement, employer-sponsored or American Century Investments Brokerage accounts, you are currently not subject to this fee. We will not charge the fee as long as you choose to manage your accounts exclusively online. If you are subject to the Account Maintenance Fee, your account value could be reduced by the fee amount.
Hypothetical Example for Comparison Purposes
The table also provides information about hypothetical account values and hypothetical expenses based on the actual expense ratio of each class of your fund and an assumed rate of return of 5% per year before expenses, which is not the actual return of a fund’s share class. The hypothetical account values and expenses may not be used to estimate the actual ending account balance or expenses you paid for the period. You may use this information to compare the ongoing costs of investing in your fund and other funds. To do so, compare this 5% hypothetical example with the 5% hypothetical examples that appear in the shareholder reports of the other funds.
Please note that the expenses shown in the table are meant to highlight your ongoing costs only and do not reflect any transactional costs, such as sales charges (loads) or redemption/exchange fees. Therefore, the table is useful in comparing ongoing costs only, and will not help you determine the relative total costs of owning different funds. In addition, if these transactional costs were included, your costs would have been higher.
| | Beginning Account Value 5/1/10 | Ending Account Value 10/31/10 | Expenses Paid During Period* 5/1/10 – 10/31/10 | Annualized Expense Ratio |
| Actual | $1,000 | $1,023.10 | $4.03 | 0.79% |
| Hypothetical | $1,000 | $1,021.22 | $4.02 | 0.79% |
*Expenses are equal to the fund’s annualized expense ratio listed in the table above, multiplied by the average account value over the period, multiplied by 184, the number of days in the most recent fiscal half-year, divided by 365, to reflect the one-half year period.
| | Shares | Value |
| Common Stocks — 99.2% |
| AEROSPACE & DEFENSE — 2.2% |
| Honeywell International, Inc. | 77,224 | $ 3,638,023 |
| Rockwell Collins, Inc. | 65,801 | 3,981,618 |
| | | 7,619,641 |
| AIR FREIGHT & LOGISTICS — 1.8% |
| United Parcel Service, Inc., Class B | 91,671 | 6,173,125 |
| AUTO COMPONENTS — 1.6% |
BorgWarner, Inc.(1) | 98,498 | 5,526,723 |
| AUTOMOBILES — 0.8% |
Ford Motor Co.(1) | 186,856 | 2,640,275 |
| BEVERAGES — 3.6% |
| Coca-Cola Co. (The) | 150,968 | 9,257,358 |
| PepsiCo, Inc. | 45,915 | 2,998,249 |
| | | 12,255,607 |
| BIOTECHNOLOGY — 1.6% |
Alexion Pharmaceuticals, Inc.(1) | 12,508 | 854,296 |
Amgen, Inc.(1) | 36,999 | 2,115,973 |
Gilead Sciences, Inc.(1) | 64,285 | 2,550,186 |
| | | 5,520,455 |
| CAPITAL MARKETS — 1.5% |
| BlackRock, Inc. | 11,058 | 1,890,807 |
| Charles Schwab Corp. (The) | 87,614 | 1,349,256 |
| Goldman Sachs Group, Inc. (The) | 11,683 | 1,880,379 |
| | | 5,120,442 |
| CHEMICALS — 3.0% |
| E.I. du Pont de Nemours & Co. | 74,218 | 3,509,027 |
| PPG Industries, Inc. | 62,442 | 4,789,301 |
| Sigma-Aldrich Corp. | 32,061 | 2,033,309 |
| | | 10,331,637 |
| COMMUNICATIONS EQUIPMENT — 4.1% |
Cisco Systems, Inc.(1) | 238,142 | 5,436,782 |
F5 Networks, Inc.(1) | 21,897 | 2,577,277 |
| QUALCOMM, Inc. | 127,856 | 5,770,141 |
| | | 13,784,200 |
| COMPUTERS & PERIPHERALS — 7.7% |
Apple, Inc.(1) | 52,983 | 15,940,995 |
EMC Corp.(1) | 302,558 | 6,356,744 |
NetApp, Inc.(1) | 74,347 | 3,958,978 |
| | | 26,256,717 |
| CONSUMER FINANCE — 1.5% |
| American Express Co. | 123,956 | 5,139,216 |
| DIVERSIFIED — 0.2% |
| iShares Russell 1000 Growth Index Fund | 12,601 | 679,068 |
| ELECTRICAL EQUIPMENT — 2.2% |
| Emerson Electric Co. | 51,337 | 2,818,401 |
| Rockwell Automation, Inc. | 76,786 | 4,789,143 |
| | | 7,607,544 |
| ELECTRONIC EQUIPMENT, INSTRUMENTS & COMPONENTS — 0.6% |
| Jabil Circuit, Inc. | 131,239 | 2,013,206 |
| ENERGY EQUIPMENT & SERVICES — 3.2% |
| Halliburton Co. | 85,982 | 2,739,387 |
| Schlumberger Ltd. | 115,697 | 8,086,063 |
| | | 10,825,450 |
| FOOD & STAPLES RETAILING — 2.1% |
| Costco Wholesale Corp. | 76,173 | 4,781,379 |
| Wal-Mart Stores, Inc. | 44,449 | 2,407,803 |
| | | 7,189,182 |
| FOOD PRODUCTS — 1.9% |
| General Mills, Inc. | 73,342 | 2,753,259 |
| Hershey Co. (The) | 41,063 | 2,032,208 |
| Kellogg Co. | 16,347 | 821,600 |
| Mead Johnson Nutrition Co. | 14,298 | 841,008 |
| | | 6,448,075 |
| HEALTH CARE EQUIPMENT & SUPPLIES — 2.8% |
| Covidien plc | 90,068 | 3,591,011 |
Edwards Lifesciences Corp.(1) | 18,587 | 1,187,895 |
Gen-Probe, Inc.(1) | 20,811 | 1,007,877 |
Intuitive Surgical, Inc.(1) | 5,375 | 1,413,356 |
| Masimo Corp. | 27,788 | 838,364 |
Zimmer Holdings, Inc.(1) | 27,548 | 1,306,877 |
| | | 9,345,380 |
| HEALTH CARE PROVIDERS & SERVICES — 2.3% |
| Aetna, Inc. | 15,640 | 467,011 |
Express Scripts, Inc.(1) | 116,039 | 5,630,212 |
Medco Health Solutions, Inc.(1) | 34,989 | 1,837,972 |
| | | 7,935,195 |
| HOTELS, RESTAURANTS & LEISURE — 2.9% |
Chipotle Mexican Grill, Inc.(1) | 7,510 | 1,578,677 |
| McDonald’s Corp. | 55,237 | 4,295,782 |
| Starwood Hotels & Resorts Worldwide, Inc. | 72,717 | 3,936,898 |
| | | 9,811,357 |
| HOUSEHOLD DURABLES — 0.4% |
| Whirlpool Corp. | 18,067 | 1,370,021 |
| HOUSEHOLD PRODUCTS — 0.8% |
| Procter & Gamble Co. (The) | 43,592 | $ 2,771,143 |
| INDUSTRIAL CONGLOMERATES — 1.3% |
| 3M Co. | 14,798 | 1,246,287 |
| Textron, Inc. | 145,606 | 3,031,517 |
| | | 4,277,804 |
| INSURANCE — 1.7% |
| Aflac, Inc. | 70,521 | 3,941,418 |
| Chubb Corp. (The) | 14,291 | 829,164 |
| Travelers Cos., Inc. (The) | 18,305 | 1,010,436 |
| | | 5,781,018 |
| INTERNET & CATALOG RETAIL — 0.2% |
Netflix, Inc.(1) | 3,900 | 676,650 |
| INTERNET SOFTWARE & SERVICES — 3.5% |
Akamai Technologies, Inc.(1) | 35,111 | 1,814,185 |
Google, Inc., Class A(1) | 16,602 | 10,176,860 |
| | | 11,991,045 |
| IT SERVICES — 3.6% |
| Accenture plc, Class A | 79,619 | 3,559,766 |
| International Business Machines Corp. | 32,715 | 4,697,874 |
| MasterCard, Inc., Class A | 16,371 | 3,930,022 |
| | | 12,187,662 |
| LIFE SCIENCES TOOLS & SERVICES — 0.7% |
Bruker Corp.(1) | 43,793 | 656,457 |
Thermo Fisher Scientific, Inc.(1) | 30,929 | 1,590,369 |
| | | 2,246,826 |
| MACHINERY — 4.9% |
| Bucyrus International, Inc. | 15,732 | 1,072,293 |
| Caterpillar, Inc. | 34,627 | 2,721,682 |
| Deere & Co. | 45,617 | 3,503,386 |
| Eaton Corp. | 54,390 | 4,831,464 |
| Illinois Tool Works, Inc. | 99,027 | 4,525,534 |
| | | 16,654,359 |
| MEDIA — 1.9% |
| Scripps Networks Interactive, Inc., Class A | 49,726 | 2,530,556 |
| Walt Disney Co. (The) | 111,249 | 4,017,202 |
| | | 6,547,758 |
| METALS & MINING — 2.2% |
| Cliffs Natural Resources, Inc. | 30,848 | 2,011,290 |
| Freeport-McMoRan Copper & Gold, Inc. | 39,358 | 3,726,415 |
| Newmont Mining Corp. | 26,377 | 1,605,568 |
| | | 7,343,273 |
| MULTILINE RETAIL — 2.2% |
Kohl’s Corp.(1) | 60,700 | 3,107,840 |
| Target Corp. | 85,442 | 4,437,857 |
| | | 7,545,697 |
| OIL, GAS & CONSUMABLE FUELS — 6.9% |
| Cimarex Energy Co. | 21,217 | 1,628,405 |
| ConocoPhillips | 39,309 | 2,334,955 |
| EOG Resources, Inc. | 11,015 | 1,054,356 |
| Exxon Mobil Corp. | 220,591 | 14,662,684 |
| Occidental Petroleum Corp. | 34,766 | 2,733,650 |
Southwestern Energy Co.(1) | 32,716 | 1,107,436 |
| | | 23,521,486 |
| PERSONAL PRODUCTS — 0.7% |
| Estee Lauder Cos., Inc. (The), Class A | 32,640 | 2,322,989 |
| PHARMACEUTICALS — 2.9% |
| Abbott Laboratories | 84,960 | 4,360,147 |
| Allergan, Inc. | 41,886 | 3,032,965 |
| Novo Nordisk A/S B Shares | 15,741 | 1,656,917 |
| Perrigo Co. | 11,005 | 725,009 |
| | | 9,775,038 |
| ROAD & RAIL — 0.7% |
| Union Pacific Corp. | 26,770 | 2,347,194 |
| SEMICONDUCTORS & SEMICONDUCTOR EQUIPMENT — 3.5% |
| Broadcom Corp., Class A | 114,270 | 4,655,360 |
Cree, Inc.(1) | 8,989 | 461,046 |
| Linear Technology Corp. | 121,428 | 3,913,624 |
| Microchip Technology, Inc. | 13,789 | 443,730 |
| Texas Instruments, Inc. | 87,287 | 2,581,077 |
| | | 12,054,837 |
| SOFTWARE — 8.2% |
Citrix Systems, Inc.(1) | 21,412 | 1,371,867 |
CommVault Systems, Inc.(1) | 19,882 | 575,186 |
Electronic Arts, Inc.(1) | 131,841 | 2,089,680 |
Intuit, Inc.(1) | 60,071 | 2,883,408 |
| Microsoft Corp. | 235,220 | 6,266,261 |
| Oracle Corp. | 287,657 | 8,457,116 |
Quest Software, Inc.(1) | 39,309 | 1,028,716 |
salesforce.com, inc.(1) | 9,895 | 1,148,513 |
Symantec Corp.(1) | 163,655 | 2,647,938 |
VMware, Inc., Class A(1) | 20,068 | 1,534,399 |
| | | 28,003,084 |
| SPECIALTY RETAIL — 3.8% |
| American Eagle Outfitters, Inc. | 92,978 | $ 1,488,578 |
| Home Depot, Inc. (The) | 169,043 | 5,220,048 |
| Limited Brands, Inc. | 99,755 | 2,931,799 |
OfficeMax, Inc.(1) | 80,268 | 1,420,744 |
| Williams-Sonoma, Inc. | 58,087 | 1,880,276 |
| | | 12,941,445 |
| WIRELESS TELECOMMUNICATION SERVICES — 1.5% |
Crown Castle International Corp.(1) | 102,566 | 4,422,646 |
SBA Communications Corp., Class A(1) | 20,285 | 796,389 |
| | | 5,219,035 |
TOTAL COMMON STOCKS(Cost $272,494,219) | 337,800,859 |
| Temporary Cash Investments — 0.7% |
| JPMorgan U.S. Treasury Plus Money Market Fund Agency Shares | 55,819 | $ 55,819 |
Repurchase Agreement, Bank of America Securities, LLC, (collateralized by various U.S. Treasury obligations, 1.375%, 5/15/12, valued at $2,244,876), in a joint trading account at 0.18%, dated 10/29/10, due 11/1/10 (Delivery value $2,200,033) | 2,200,000 |
TOTAL TEMPORARY CASH INVESTMENTS (Cost $2,255,819) | 2,255,819 |
TOTAL INVESTMENT SECURITIES — 99.9%(Cost $274,750,038) | 340,056,678 |
| OTHER ASSETS AND LIABILITIES — 0.1% | 360,248 |
| TOTAL NET ASSETS — 100.0% | $340,416,926 |
| Forward Foreign Currency Exchange Contracts |
| Contracts to Sell | Counterparty | Settlement Date | Value | Unrealized Gain (Loss) |
| 5,560,902 | DKK for USD | UBS AG | 11/30/10 | $1,037,579 | $(2,877) |
(Value on Settlement Date $1,034,702)
Notes to Schedule of Investments
DKK = Danish Krone
USD = United States Dollar
See Notes to Financial Statements.
Statement of Assets and Liabilities
| OCTOBER 31, 2010 |
| Assets |
| Investment securities, at value (cost of $274,750,038) | $340,056,678 |
| Foreign currency holdings, at value (cost of $33,273) | 35,071 |
| Receivable for investments sold | 6,753,616 |
| Receivable for capital shares sold | 39,382 |
| Dividends and interest receivable | 279,790 |
| | 347,164,537 |
| | |
| Liabilities | |
| Disbursements in excess of demand deposit cash | 3,711 |
| Payable for investments purchased | 6,462,663 |
| Payable for capital shares redeemed | 56,393 |
| Unrealized loss on forward foreign currency exchange contracts | 2,877 |
| Accrued management fees | 221,967 |
| | 6,747,611 |
| | |
| Net Assets | $340,416,926 |
| | |
| Institutional Class Capital Shares, $0.01 Par Value | |
| Shares authorized | 150,000,000 |
| Shares outstanding | 30,788,091 |
| | |
| Net Asset Value Per Share | $11.06 |
| | |
| Net Assets Consist of: | |
| Capital (par value and paid-in surplus) | $286,241,780 |
| Undistributed net investment income | 1,402,229 |
| Accumulated net realized loss | (12,534,712) |
| Net unrealized appreciation | 65,307,629 |
| | $340,416,926 |
See Notes to Financial Statements.
| YEAR ENDED OCTOBER 31, 2010 |
| Investment Income (Loss) |
| Income: | |
| Dividends (net of foreign taxes withheld of $171) | $ 3,817,704 |
| Interest | 4,830 |
| | 3,822,534 |
| Expenses: | |
| Management fees | 2,122,695 |
| Directors’ fees and expenses | 8,083 |
| Other expenses | 998 |
| | 2,131,776 |
| | |
| Net investment income (loss) | 1,690,758 |
| | |
| Realized and Unrealized Gain (Loss) | |
| Net realized gain (loss) on: | |
| Investment transactions | 11,110,148 |
| Futures contract transactions | (22,579) |
| Foreign currency transactions | 57,021 |
| | 11,144,590 |
| | |
| Change in net unrealized appreciation (depreciation) on: | |
| Investments | 35,103,734 |
| Translation of assets and liabilities in foreign currencies | (5,522) |
| | 35,098,212 |
| | |
| Net realized and unrealized gain (loss) | 46,242,802 |
| | |
| Net Increase (Decrease) in Net Assets Resulting from Operations | $47,933,560 |
See Notes to Financial Statements.
Statement of Changes in Net Assets
| YEARS ENDED OCTOBER 31, 2010 AND OCTOBER 31, 2009 |
| Increase (Decrease) in Net Assets | 2010 | 2009 |
| Operations |
| Net investment income (loss) | $ 1,690,758 | $ 975,121 |
| Net realized gain (loss) | 11,144,590 | (16,222,404) |
| Change in net unrealized appreciation (depreciation) | 35,098,212 | 44,022,631 |
| Net increase (decrease) in net assets resulting from operations | 47,933,560 | 28,775,348 |
| | | |
| Distributions to Shareholders | | |
| From net investment income | (996,841) | (665,262) |
| | | |
| Capital Share Transactions | | |
| Proceeds from shares sold | 100,015,427 | 120,029,054 |
| Payments for shares redeemed | (14,872,070) | (23,241,910) |
| Net increase (decrease) in net assets from capital share transactions | 85,143,357 | 96,787,144 |
| | | |
| Net increase (decrease) in net assets | 132,080,076 | 124,897,230 |
| | | |
| Net Assets | | |
| Beginning of period | 208,336,850 | 83,439,620 |
| End of period | $340,416,926 | $208,336,850 |
| | | |
| Undistributed net investment income | $1,402,229 | $665,966 |
| | | |
| Transactions in Shares of the Fund | | |
| Sold | 9,964,567 | 15,002,239 |
| Redeemed | (1,474,183) | (2,964,057) |
| Net increase (decrease) in shares of the fund | 8,490,384 | 12,038,182 |
See Notes to Financial Statements.
Notes to Financial Statements
OCTOBER 31, 2010
1. Organization
American Century Mutual Funds, Inc. (the corporation) is registered under the Investment Company Act of 1940 (the 1940 Act) as an open-end management investment company and is organized as a Maryland corporation. NT Growth Fund (the fund) is one fund in a series issued by the corporation. The fund is diversified as defined under the 1940 Act. The fund’s investment objective is to seek long-term capital growth. The fund pursues its objective by investing primarily in equity securities of larger-sized companies that management believes will increase in value but may purchase companies of any size. The fund is not permitted to invest in any securities issued by companies assigned the Global Industry Classification Standard for the tobacco industry.
2. Significant Accounting Policies
The following is a summary of significant accounting policies consistently followed by the fund in preparation of its financial statements. The financial statements are prepared in conformity with accounting principles generally accepted in the United States of America, which may require management to make certain estimates and assumptions at the date of the financial statements. Actual results could differ from these estimates.
Investment Valuations — The fund determines the fair value of its investments and computes its net asset value per share as of the close of regular trading (usually 4 p.m. Eastern time) on the New York Stock Exchange (NYSE) on each day the NYSE is open.
Equity securities that are listed or traded on a domestic securities exchange are valued at the last reported sales price or at the official closing price as provided by the exchange. Equity securities traded on foreign securities exchanges are typically valued at the closing price on the exchange where primarily traded or as of the close of the NYSE, if that is earlier. If no last sales price is reported, or if local convention or regulation so provides, the mean of the latest bid and asked prices is used. Depending on local convention or regulation, securities traded over-the-counter are valued at the mean of the latest bid and asked prices, the last sales price, or the official closing price. In its determination of fair value, the fund may review several factors including: market information specific to a security; news developments in U.S. and foreign markets; the performance of particular U.S. and foreign securities, indices, comparable securities, American Depositary Receipts, Exchange Traded Funds, and other relevant market indicators.
Debt securities maturing within 60 days at the time of purchase may be valued at cost, plus or minus any amortized discount or premium or at the evaluated mean as provided by an independent pricing service. Evaluated mean prices are commonly derived through utilization of market models, which may consider, among other factors, trade data, quotations from dealers and active market makers, relevant yield curve and spread data, related sector levels, creditworthiness, and other relevant market information on the same or comparable securities.
Investments in open-end management investment companies are valued at the reported net asset value per share. Repurchase agreements are valued at cost. Exchange-traded futures contracts are valued at the settlement price as provided by the appropriate clearing corporation. Forward foreign currency exchange contracts are valued at the mean of the latest bid and asked prices of the forward currency rates as provided by an independent pricing service.
The value of investments initially expressed in foreign currencies is translated into U.S. dollars at prevailing exchange rates.
If the fund determines that the market price for a portfolio security is not readily available or the valuation methods mentioned above do not reflect a security’s fair value, such security is valued as determined in good faith by the Board of Directors or its designee, in accordance with procedures adopted by the Board of Directors. Circumstances that may cause the fund to use these procedures to value a security include, but are not limited to: a security has been declared in default; trading in a security has been halted during the trading day; there is a foreign market holiday and no trading occurred; or an event occurred between the close of a foreign exchange and the NYSE that may affect the value of a security.
Security Transactions — Security transactions are accounted for as of the trade date. Net realized gains and losses are determined on the identified cost basis, which is also used for federal income tax purposes.
Investment Income — Dividend income less foreign taxes withheld, if any, is recorded as of the ex-dividend date. Interest income is recorded on the accrual basis and includes accretion of discounts and amortization of premiums.
Foreign Currency Translations — All assets and liabilities initially expressed in foreign currencies are translated into U.S. dollars at prevailing exchange rates at period end. The fund may enter into spot foreign currency exchange contracts to facilitate transactions denominated in a foreign currency. Purchases and sales of investment securities, dividend and interest income, spot foreign currency exchange contracts, and expenses are translated at the rates of exchange prevailing on the respective dates of such transactions. Net realized and unrealized foreign currency exchange gains or losses related to investment securities are a component of net realized gain (loss) on investment transactions and net unrealized appreciation (depreciation) on investments, respectively.
Repurchase Agreements — The fund may enter into repurchase agreements with institutions that American Century Investment Management, Inc. (ACIM) (the investment advisor) has determined are creditworthy pursuant to criteria adopted by the Board of Directors. The fund requires that the collateral, represented by securities, received in a repurchase transaction be transferred to the custodian in a manner sufficient to enable the fund to obtain those securities in the event of a default under the repurchase agreement. ACIM monitors, on a daily basis, the securities transferred to ensure the value, including accrued interest, of the securities under each repurchase agreement is equal to or greater than amounts owed to the fund under each repurchase agreement.
Joint Trading Account — Pursuant to an Exemptive Order issued by the Securities and Exchange Commission, the fund, along with certain other funds in the American Century Investments family of funds, may transfer uninvested cash balances into a joint trading account. These balances are invested in one or more repurchase agreements that are collateralized by U.S. Treasury or Agency obligations.
Income Tax Status — It is the fund’s policy to distribute substantially all net investment income and net realized gains to shareholders and to otherwise qualify as a regulated investment company under provisions of the Internal Revenue Code. The fund is no longer subject to examination by tax authorities for years prior to 2007. At this time, management believes there are no uncertain tax positions which, based on their technical merit, would not be sustained upon examination and for which it is reasonably possible that the total amounts of unrecognized tax benefits will significantly change in the next twelve months. Accordingly, no provision has been made for federal or state income taxes.
Distributions to Shareholders — Distributions to shareholders are recorded on the ex-dividend date. Distributions from net investment income and net realized gains, if any, are generally declared and paid annually.
Indemnifications — Under the corporation’s organizational documents, its officers and directors are indemnified against certain liabilities arising out of the performance of their duties to the fund. In addition, in the normal course of business, the fund enters into contracts that provide general indemnifications. The maximum exposure under these arrangements is unknown as this would involve future claims that may be made against a fund. The risk of material loss from such claims is considered by management to be remote.
3. Fees and Transactions with Related Parties
Management Fees — The corporation has entered into a management agreement with ACIM, under which ACIM provides the fund with investment advisory and management services in exchange for a single, unified management fee (the fee). The agreement provides that all expenses of managing and operating the fund, except distribution and service fees, brokerage expenses, taxes, interest, fees and expenses of the independent directors (including legal counsel fees), and extraordinary expenses, will be paid by ACIM. The fee is computed and accrued daily based on the daily net assets of the fund and paid monthly in arrears. The rate of the fee is determined by applying a fee rate calculation formula. This formula takes into account the fund’s assets as well as certain assets, if any , of other clients of the investment advisor outside the American Century Investments family of funds (such as subadvised funds and separate accounts) that have very similar investment teams and investment strategies (strategy assets). The annual management fee schedule ranges from 0.600% to 0.800%. The effective annual management fee for the year ended October 31, 2010 was 0.79%.
Related Parties — Certain officers and directors of the corporation are also officers and/or directors of American Century Companies, Inc. (ACC), the parent of the corporation’s investment advisor, ACIM, the distributor of the corporation, American Century Investment Services, Inc., and the corporation’s transfer agent, American Century Services, LLC. The fund is wholly owned, in aggregate, by various funds in a series issued by American Century Asset Allocation Portfolios, Inc. (ACAAP). ACAAP does not invest in the fund for the purpose of exercising management or control.
The fund is eligible to invest in a money market fund for temporary purposes, which is managed by J.P. Morgan Investment Management, Inc. (JPMIM). The fund has a securities lending agreement with JPMorgan Chase Bank (JPMCB) and a mutual funds services agreement with J.P. Morgan Investor Services Co. (JPMIS). JPMCB is a custodian of the fund. JPMIM, JPMIS and JPMCB are wholly owned subsidiaries of JPMorgan Chase & Co. (JPM). JPM is an equity investor in ACC.
4. Investment Transactions
Purchases and sales of investment securities, excluding short-term investments, for the year ended October 31, 2010, were $335,381,399 and $247,584,880, respectively.
5. Fair Value Measurements
The fund’s securities valuation process is based on several considerations and may use multiple inputs to determine the fair value of the positions held by the fund. In conformity with accounting principles generally accepted in the United States of America, the inputs used to determine a valuation are classified into three broad levels as follows:
| • | Level 1 valuation inputs consist of unadjusted quoted prices in an active market for identical securities; |
| • | Level 2 valuation inputs consist of direct or indirect observable market data (including quoted prices for similar securities, evaluations of subsequent market events, interest rates, prepayment speeds, credit risk, etc.); or |
| • | Level 3 valuation inputs consist of unobservable data (including a fund’s own assumptions). |
The level classification is based on the lowest level input that is significant to the fair valuation measurement. The valuation inputs are not necessarily an indication of the risks associated with investing in these securities or other financial instruments.
The following is a summary of the level classifications as of period end. The Schedule of Investments provides additional information on the fund’s portfolio holdings.
| | Level 1 | Level 2 | Level 3 |
| Investment Securities | | | |
| Common Stocks | $336,143,942 | $1,656,917 | — |
| Temporary Cash Investments | 55,819 | 2,200,000 | — |
| Total Value of Investment Securities | $336,199,761 | $3,856,917 | — |
| | | | |
| Other Financial Instruments | | | |
Total Unrealized Gain (Loss) on Forward Foreign Currency Exchange Contracts | — | $(2,877) | — |
6. Derivative Instruments
Equity Price Risk — The fund is subject to equity price risk in the normal course of pursuing its investment objectives. A fund may enter into futures contracts based on an equity index in order to manage its exposure to changes in market conditions. A fund may purchase futures contracts to gain exposure to increases in market value or sell futures contracts to protect against a decline in market value. Upon entering into a futures contract, a fund is required to deposit either cash or securities in an amount equal to a certain percentage of the contract value (initial margin). Subsequent payments (variation margin) are made or received daily, in cash, by a fund. The variation margin is equal to the daily change in the contract value and is recorded as unrealized gains and losses. A fund recognizes a realized gain or loss when the contract is closed or expires. Net realized and unrealized gains or losses occurring during the holding period of futures contracts are a component of net realized gain (loss) on futures contract transactions and change in net unrealized appreciation (depreciation) on futures contracts, respectively. One of the risks of entering into futures contracts is the possibility that the change in value of the contract may not correlate with the changes in value of the underlying securities. The fund held no equity price risk derivative instruments at period end. During the period, the fund infrequently purchased equity price risk derivative instruments for temporary investment purposes.
Foreign Currency Risk — The fund is subject to foreign currency exchange rate risk in the normal course of pursuing its investment objectives. The value of foreign investments held by a fund may be significantly affected by changes in foreign currency exchange rates. The dollar value of a foreign security generally decreases when the value of the dollar rises against the foreign currency in which the security is denominated and tends to increase when the value of the dollar declines against such foreign currency. A fund may enter into forward foreign currency exchange contracts to reduce a fund’s exposure to foreign currency exchange rate fluctuations. The net U.S. dollar value of foreign currency underlying all contractual commitments held by a fund and the resulting unrealized appreciation or depreciation are determined daily using prevailing exchange rates. Realized gain or loss is recorded upon the termination of the contract. Net realized and unrealized gains or losses occurring during the holding period of forward foreign currency exchange contracts are a component of net realized gain (loss) on foreign currency transactions and change in net unrealized appreciation (depreciation) on translation of assets and liabilities in foreign currencies, respectively. A fund bears the risk of an unfavorable change in the foreign currency exchange rate underlying the forward contract. Additionally, losses, up to the fair value, may arise if the counterparties do not perform under the contract terms. The risk of loss from non-performance by the counterparty may be reduced by the use of master netting agreements. The foreign currency risk derivative instruments held at period end as disclosed on the Schedule of Investments are indicative of the fund’s typical volume during the period.
Value of Derivative Instruments as of October 31, 2010 |
| | Asset Derivatives | | Liability Derivatives |
Type of Risk Exposure | Location on Statement of Assets and Liabilities | Value | | Location on Statement of Assets and Liabilities | Value |
| Foreign Currency Risk | Unrealized gain on forward foreign currency exchange contracts | — | | Unrealized loss on forward foreign currency exchange contracts | $2,877 |
| |
Effect of Derivative Instruments on the Statement of Operations for the Year Ended October 31, 2010 |
| | Net Realized Gain (Loss) | | Change in Net Unrealized Appreciation (Depreciation) |
Type of Risk Exposure | Location on Statement of Operations | | | Location on Statement of Operations | |
| Equity Price Risk | Net realized gain (loss) on futures contract transactions | $(22,579) | | Change in net unrealized appreciation (depreciation) on futures contracts | — |
| Foreign Currency Risk | Net realized gain (loss) on foreign currency transactions | 56,976 | | Change in net unrealized appreciation (depreciation) on translation of assets and liabilities in foreign currencies | $(7,262) |
| | | $ 34,397 | | | $(7,262) |
7. Federal Tax Information
On December 14, 2010, the fund declared and paid a $0.0765 per-share distribution from net investment income to Institutional Class shareholders of record on December 13, 2010.
The tax character of distributions paid during the years ended October 31, 2010 and October 31, 2009 were as follows:
| | 2010 | 2009 |
| Distributions Paid From | | |
| Ordinary income | $996,841 | $665,262 |
| Long-term capital gains | — | — |
The book-basis character of distributions made during the year from net investment income or net realized gains may differ from their ultimate characterization for federal income tax purposes. These differences reflect the differing character of certain income items and net realized gains and losses for financial statement and tax purposes, and may result in reclassification among certain capital accounts on the financial statements.
As of October 31, 2010, the federal tax cost of investments and the components of distributable earnings on a tax-basis were as follows:
| Federal tax cost of investments | $280,045,013 |
| Gross tax appreciation of investments | $61,576,025 |
| Gross tax depreciation of investments | (1,564,360) |
| Net tax appreciation (depreciation) of investments | $60,011,665 |
Net tax appreciation (depreciation) of derivatives and translation of assets and liabilities in foreign currencies | $ 989 |
| Net tax appreciation (depreciation) | $60,012,654 |
| Undistributed ordinary income | $1,402,229 |
| Accumulated capital losses | $(7,239,737) |
The difference between book-basis and tax-basis cost and unrealized appreciation (depreciation) is attributable primarily to the tax deferral of losses on wash sales.
The accumulated capital losses represent net capital loss carryovers that may be used to offset future realized capital gains for federal income tax purposes. Future capital loss carryover utilization in any given year may be subject to Internal Revenue Code limitations. Capital loss carryovers expire in 2017.
8. Corporate Event
As part of a long-standing estate and business succession plan established by James E. Stowers, Jr., the founder of American Century Investments, ACC Chairman Richard W. Brown succeeded Mr. Stowers as trustee of a trust that holds a greater-than-25% voting interest in ACC, the parent corporation of the fund’s advisor. Under the 1940 Act, this is presumed to represent control of ACC even though it is less than a majority interest. The change of trustee was considered a change of control of ACC and therefore also a change of control of the fund’s advisor even though there has been no change to its management and none is anticipated. The change of control resulted in the assignment of the fund’s investment advisory agreement. As required by the 1940 Act, the assignment automatically terminated such agreem ent, making the approval of a new agreement necessary.
On February 18, 2010, the Board of Directors approved an interim investment advisory agreement under which the fund was managed until a new agreement was approved. The new agreement for the fund was approved by the Board of Directors on March 29, 2010, and by shareholders at a Special Meeting of Shareholders on June 16, 2010. It went into effect on July 16, 2010. The new agreement, which is substantially identical to the terminated agreement (with the exception of different effective and termination dates), did not result in changes in the management of American Century Investments, the fund, its investment objectives, fees or services provided.
9. Other Tax Information (Unaudited)
The following information is provided pursuant to provisions of the Internal Revenue Code.
The fund hereby designates up to the maximum amount allowable as qualified dividend income for the fiscal year ended October 31, 2010.
For corporate taxpayers, the fund hereby designates $996,841, or up to the maximum amount allowable, of ordinary income distributions paid during the fiscal year ended October 31, 2010 as qualified for the corporate dividends received deduction.
NT Growth
| Institutional Class |
| For a Share Outstanding Throughout the Years Ended October 31 (except as noted) |
| | 2010 | 2009 | 2008 | 2007 | 2006(1) |
| Per-Share Data |
| Net Asset Value, Beginning of Period | $9.34 | $8.13 | $12.87 | $10.57 | $10.00 |
| Income From Investment Operations | | | | | |
| Net Investment Income (Loss) | 0.06(2) | 0.06(2) | 0.04(2) | 0.04 | 0.01 |
| Net Realized and Unrealized Gain (Loss) | 1.71 | 1.21 | (4.19) | 2.29 | 0.56 |
| Total From Investment Operations | 1.77 | 1.27 | (4.15) | 2.33 | 0.57 |
| Distributions | | | | | |
| From Net Investment Income | (0.05) | (0.06) | (0.03) | (0.03) | — |
| From Net Realized Gains | — | — | (0.56) | — | — |
| Total Distributions | (0.05) | (0.06) | (0.59) | (0.03) | — |
| Net Asset Value, End of Period | $11.06 | $9.34 | $8.13 | $12.87 | $10.57 |
| | | | | | |
Total Return(3) | 18.94% | 15.88% | (33.68)% | 22.12% | 5.70% |
| | | | | | |
| Ratios/Supplemental Data |
Ratio of Operating Expenses to Average Net Assets | 0.79% | 0.80% | 0.80% | 0.80% | 0.80%(4) |
Ratio of Net Investment Income (Loss) to Average Net Assets | 0.63% | 0.67% | 0.38% | 0.35% | 0.36%(4) |
| Portfolio Turnover Rate | 95% | 132% | 136% | 140% | 57% |
| Net Assets, End of Period (in thousands) | $340,417 | $208,337 | $83,440 | $88,446 | $58,983 |
| (1) | May 12, 2006 (fund inception) through October 31, 2006. |
| (2) | Computed using average shares outstanding throughout the period. |
| (3) | Total returns are calculated based on the net asset value of the last business day. Total returns for periods less than one year are not annualized. |
See Notes to Financial Statements.
Report of Independent Registered Public Accounting Firm
The Board of Directors and Shareholders,
American Century Mutual Funds, Inc.:
We have audited the accompanying statement of assets and liabilities, including the schedule of investments, of NT Growth Fund, one of the funds constituting American Century Mutual Funds, Inc. (the “Corporation”), as of October 31, 2010, and the related statement of operations for the year then ended, the statements of changes in net assets for each of the two years in the period then ended, and the financial highlights for each of the periods presented. These financial statements and financial highlights are the responsibility of the Corporation’s mana gement. Our responsibility is to express an opinion on these financial statements and financial highlights based on our audits.
We conducted our audits in accordance with the standards of the Public Company Accounting Oversight Board (United States). Those standards require that we plan and perform the audit to obtain reasonable assurance about whether the financial statements and financial highlights are free of material misstatement. The Corporation is not required to have, nor were we engaged to perform, an audit of its internal control over financial reporting. Our audits included consideration of internal control over financial reporting as a basis for designing audit procedures that are appropriate in the circumstances, but not for the purpose of expressing an opinion on the effectiveness of the Corporation’s internal control over financial reporting . Accordingly, we express no such opinion. An audit also includes examining, on a test basis, evidence supporting the amounts and disclosures in the financial statements, assessing the accounting principles used and significant estimates made by management, as well as evaluating the overall financial statement presentation. Our procedures included confirmation of securities owned as of October 31, 2010, by correspondence with the custodian and brokers; where replies were not received from brokers, we performed other auditing procedures. We believe that our audits provide a reasonable basis for our opinion.
In our opinion, the financial statements and financial highlights referred to above present fairly, in all material respects, the financial position of NT Growth Fund of American Century Mutual Funds, Inc., as of October 31, 2010, the results of its operations for the year then ended, the changes in its net assets for each of the two years in the period then ended, and the financial highlights for each of the periods presented, in conformity with accounting principles generally accepted in the United States of America.
Deloitte & Touche LLP
Kansas City, Missouri
December 20, 2010
A special meeting of shareholders was held on June 16, 2010, to vote on the following proposals. Each proposal received the required number of votes and was adopted. A summary of voting results is listed below each proposal.
Proposal 1:
To elect one Director to the Board of Directors of American Century Mutual Funds, Inc. (the proposal was voted on by all shareholders of funds issued by American Century Mutual Funds, Inc.):
| | | | | |
| | John R. Whitten | For: | 13,907,426,552 | |
| | | Withhold: | 629,801,798 | |
| | | Abstain: | 0 | |
| | | Broker Non-Vote: | 0 | |
The other directors whose term of office continued after the meeting include Jonathan S. Thomas, Thomas A. Brown, Andrea C. Hall, James A. Olson, Donald H. Pratt, and M. Jeannine Strandjord.
Proposal 2:
To approve a management agreement between the fund and American Century Investment Management, Inc.:
| | | | | |
| | Institutional Class | For: | 246,845,967 | |
| | | Against: | 5,090,860 | |
| | | Abstain: | 11,428,182 | |
| | | Broker Non-Vote: | 0 | |
Proposal 3:
To approve an amendment to the Articles of Incorporation to limit certain director liability to the extent permitted by Maryland law (the proposal was voted on by all shareholders of funds issued by American Century Mutual Funds, Inc.):
| | | | | |
| | | For: | 12,112,932,038 | |
| | | Against: | 769,504,652 | |
| | | Abstain: | 420,034,445 | |
| | | Broker Non-Vote: | 1,234,757,216 | |
The Board of Directors
The individuals listed below serve as directors of the fund. Each director will continue to serve in this capacity until death, retirement, resignation or removal from office. The mandatory retirement age for directors who are not “interested persons,” as that term is defined in the Investment Company Act (independent directors), is 72. However, the mandatory retirement age for an individual director may be extended with the approval of the remaining independent directors.
Mr. Thomas is the only director who is an “interested person” because he currently serves as President and Chief Executive Officer of American Century Companies, Inc. (ACC), the parent company of American Century Investment Management, Inc. (ACIM or the advisor).
The other directors (more than three-fourths of the total number) are independent; that is, they have never been employees, directors or officers of, and have no financial interest in, ACC or any of its wholly owned, direct or indirect, subsidiaries, including ACIM, American Century Investment Services, Inc. (ACIS) and American Century Services, LLC (ACS). The directors serve in this capacity for seven (in the case of Mr. Thomas, 15) registered investment companies in the American Century Investments family of funds.
The following presents additional information about the directors. The mailing address for each director is 4500 Main Street, Kansas City, Missouri 64111.
Independent Directors
Thomas A. Brown
Year of Birth: 1940
Position(s) with the Fund: Director
Length of Time Served: Since 1980
Principal Occupation(s) During the Past Five Years: Managing Member, Associated Investments, LLC (real estate investment company); Brown Cascade Properties, LLC (real estate investment company) (2001 to 2009)
Number of Funds in Fund Complex Overseen by Director: 61
Other Directorships Held by Director During the Past Five Years: None
Education/Other Professional Experience: BS in Mechanical Engineering, University of Kansas; formerly, Chief Executive Officer, Associated Bearings Company; formerly, Area Vice President, Applied Industrial Technologies (bearings and power transmission company)
Andrea C. Hall
Year of Birth: 1945
Position(s) with the Fund: Director
Length of Time Served: Since 1997
Principal Occupation(s) During the Past Five Years: Retired as advisor to the President, Midwest Research Institute (not-for-profit research organization) (June 2006)
Number of Funds in Fund Complex Overseen by Director: 61
Other Directorships Held by Director During the Past Five Years: None
Education/Other Professional Experience: BS in Biology, Florida State University; PhD in Biology, Georgetown University; formerly, Senior Vice President and Director of Research Operations, Midwest Research Institute
James A. Olson
Year of Birth: 1942
Position(s) with the Fund: Director
Length of Time Served: Since 2007
Principal Occupation(s) During the Past Five Years: Member, Plaza Belmont LLC (private equity fund manager); Chief Financial Officer, Plaza Belmont LLC (September 1999 to September 2006)
Number of Funds in Fund Complex Overseen by Director: 61
Other Directorships Held by Director During the Past Five Years: Saia, Inc. and Entertainment Properties Trust
Education/Other Professional Experience: BS in Business Administration and MBA, St. Louis University; CPA; 21 years of experience as a partner in the accounting firm of Ernst & Young LLP
Donald H. Pratt
Year of Birth: 1937
Position(s) with the Fund: Director, Chairman of the Board
Length of Time Served: Since 1995 (Chairman since 2005)
Principal Occupation(s) During the Past Five Years: Chairman and Chief Executive Officer, Western Investments, Inc. (real estate company)
Number of Funds in Fund Complex Overseen by Director: 61
Other Directorships Held by Director During the Past Five Years: None
Education/Other Professional Experience: BS in Industrial Engineering, Wichita State University; MBA, Harvard Business School; serves on the Board of Governors of the Independent Directors Council and Investment Company Institute; formerly, Chairman of the Board, Butler Manufacturing Company (metal buildings producer)
M. Jeannine Strandjord
Year of Birth: 1945
Position(s) with the Fund: Director
Length of Time Served: Since 1994
Principal Occupation(s) During the Past Five Years: Retired, formerly, Senior Vice President, Process Excellence, Sprint Corporation (telecommunications company) (January 2005 to September 2005)
Number of Funds in Fund Complex Overseen by Director: 61
Other Directorships Held by Director During the Past Five Years: DST Systems Inc., Euronet Worldwide Inc., Charming Shoppes, Inc.
Education/Other Professional Experience: BS in Business Administration and Accounting, University of Kansas; CPA; formerly, Senior Vice President of Financial Services and Treasurer and Chief Financial Officer, Global Markets Group; Sprint Corporation; formerly, with the accounting firm of Ernst and Whinney
John R. Whitten
Year of Birth: 1946
Position(s) with the Fund: Director
Length of Time Served: Since 2008
Principal Occupation(s) During the Past Five Years: Project Consultant, Celanese Corp. (industrial chemical company)
Number of Funds in Fund Complex Overseen by Director: 61
Other Directorships Held by Director During the Past Five Years: Rudolph Technologies, Inc.
Professional Education/Experience: BS in Business Administration, Cleveland State University; CPA; formerly, Chief Financial Officer and Treasurer, Applied Industrial Technologies, Inc.; thirteen years of experience with accounting firm Deloitte & Touche LLP
Interested Director
Jonathan S. Thomas
Year of Birth: 1963
Position(s) with the Fund: Director and President
Length of Time Served: Since 2007
Principal Occupation(s) During the Past Five Years: President and Chief Executive Officer, ACC (March 2007 to present); Chief Administrative Officer, ACC (February 2006 to February 2007); Executive Vice President, ACC (November 2005 to February 2007). Also serves as: Chief Executive Officer and Manager, ACS; Executive Vice President, ACIM; Director, ACC, ACIM and other ACC subsidiaries
Number of Funds in Fund Complex Overseen by Director: 101
Other Directorships Held by Director During the Past Five Years: None
Education/Other Professional Experience: BA in Economics, University of Massachusetts; MBA, Boston College; formerly held senior leadership roles with Fidelity Investments, Boston Financial Services, Bank of America and Morgan Stanley; serves on the Board of Governors of the Investment Company Institute
Officers
The following table presents certain information about the executive officers of the fund. Each officer serves as an officer for each of the 15 investment companies in the American Century family of funds, unless otherwise noted. No officer is compensated for his or her service as an officer of the fund. The listed officers are interested persons of the fund and are appointed or re-appointed on an annual basis. The mailing address for each of the officers listed below is 4500 Main Street, Kansas City, Missouri 64111.
| | Name (Year of Birth) | Offices with the Fund | Principal Occupation(s) During the Past Five Years |
| | Jonathan S. Thomas (1963) | Director and President since 2007 | President and Chief Executive Officer, ACC (March 2007 to present); Chief Administrative Officer, ACC (February 2006 to February 2007); Executive Vice President, ACC (November 2005 to February 2007). Also serves as: Chief Executive Officer and Manager, ACS; Executive Vice President, ACIM; Director, ACC, ACIM and other ACC subsidiaries |
| | Barry Fink (1955) | Executive Vice President since 2007 | Chief Operating Officer and Executive Vice President, ACC (September 2007 to present); President, ACS (October 2007 to present); Managing Director, Morgan Stanley (2000 to 2007); Global General Counsel, Morgan Stanley (2000 to 2006). Also serves as: Manager, ACS and Director, ACC and certain ACC subsidiaries |
| | Maryanne L. Roepke (1956) | Chief Compliance Officer since 2006 and Senior Vice President since 2000 | Chief Compliance Officer, American Century funds, ACIM and ACS (August 2006 to present); Assistant Treasurer, ACC (January 1995 to August 2006); and Treasurer and Chief Financial Officer, various American Century funds (July 2000 to August 2006). Also serves as: Senior Vice President, ACS |
| | Charles A. Etherington (1957) | General Counsel since 2007 and Senior Vice President since 2006 | Attorney, ACC (February 1994 to present); Vice President, ACC (November 2005 to present), General Counsel, ACC (March 2007 to present); Also serves as General Counsel, ACIM, ACS, ACIS and other ACC subsidiaries; and Senior Vice President, ACIM and ACS |
| | Robert J. Leach (1966) | Vice President, Treasurer and Chief Financial Officer since 2006 | Vice President, ACS (February 2000 to present); and Controller, various American Century funds (1997 to September 2006) |
| | David H. Reinmiller (1963) | Vice President since 2000 | Attorney, ACC (January 1994 to present); Associate General Counsel, ACC (January 2001 to present); Chief Compliance Officer, American Century funds and ACIM (January 2001 to February 2005). Also serves as Vice President, ACIM and ACS |
| | Ward D. Stauffer (1960) | Secretary since 2005 | Attorney, ACC (June 2003 to present) |
The Statement of Additional Information has additional information about the fund’s directors and is available without charge, upon request, by calling 1-800-345-2021.
Retirement Account Information
As required by law, distributions you receive from certain IRAs, or 403(b), 457 and qualified plans are subject to federal income tax withholding, unless you elect not to have withholding apply. Tax will be withheld on the total amount withdrawn even though you may be receiving amounts that are not subject to withholding, such as nondeductible contributions. In such case, excess amounts of withholding could occur. You may adjust your withholding election so that a greater or lesser amount will be withheld.
If you don’t want us to withhold on this amount, you must notify us to not withhold the federal income tax. You may notify us in writing or in certain situations by telephone or through other electronic means. You have the right to revoke your withholding election at any time and any election you make may remain in effect until revoked by filing a new election.
Remember, even if you elect not to have income tax withheld, you are liable for paying income tax on the taxable portion of your withdrawal. If you elect not to have income tax withheld or you don’t have enough income tax withheld, you may be responsible for payment of estimated tax. You may incur penalties under the estimated tax rules if your withholding and estimated tax payments are not sufficient. You can reduce or defer the income tax on a distribution by directly or indirectly rolling such distribution over to another IRA or eligible plan. You should consult your tax advisor for additional information.
State tax will be withheld if, at the time of your distribution, your address is within one of the mandatory withholding states and you have federal income tax withheld. State taxes will be withheld from your distribution in accordance with the respective state rules.
Proxy Voting Guidelines
American Century Investment Management, Inc., the fund’s investment advisor, is responsible for exercising the voting rights associated with the securities purchased and/or held by the fund. A description of the policies and procedures the advisor uses in fulfilling this responsibility is available without charge, upon request, by calling 1-800-345-2021. It is also available on American Century Investments’ website at americancentury.com and on the Securities and Exchange Commission’s website at sec.gov. Information regarding how the investment advisor voted proxies relating to portfolio securities during the most recent 12-month period ended June 30 is available on the “About Us” page at americancentury.co m. It is also available at sec.gov.
Quarterly Portfolio Disclosure
The fund files its complete schedule of portfolio holdings with the Securities and Exchange Commission (SEC) for the first and third quarters of each fiscal year on Form N-Q. The fund’s Forms N-Q are available on the SEC’s website at sec.gov, and may be reviewed and copied at the SEC’s Public Reference Room in Washington, DC. Information on the operation of the Public Reference Room may be obtained by calling 1-800-SEC-0330. The fund also makes its complete schedule of portfolio holdings for the most recent quarter of its fiscal year available on its website at americancentury.com and, upon request, by calling 1-800-345-2021.
The following indices are used to illustrate investment market, sector, or style performance or to serve as fund performance comparisons. They are not investment products available for purchase.
The Russell 1000® Index is a market-capitalization weighted, large-cap index created by Frank Russell Company to measure the performance of the 1,000 largest publicly traded U.S. companies, based on total market capitalization.
The Russell 1000® Growth Index measures the performance of those Russell 1000 Index companies (the 1,000 largest publicly traded U.S. companies, based on total market capitalization) with higher price-to-book ratios and higher forecasted growth values.
The Russell 1000® Value Index measures the performance of those Russell 1000 Index companies (the 1,000 largest publicly traded U.S. companies, based on total market capitalization) with lower price-to-book ratios and lower forecasted growth values.
The Russell 2000® Index is a market-capitalization weighted index created by Frank Russell Company to measure the performance of the 2,000 smallest of the 3,000 largest publicly traded U.S. companies, based on total market capitalization.
The Russell 2000® Growth Index measures the performance of those Russell 2000 Index companies (the 2,000 smallest of the 3,000 largest publicly traded U.S. companies, based on total market capitalization) with higher price-to-book ratios and higher forecasted growth values.
The Russell 2000® Value Index measures the performance of those Russell 2000 Index companies (the 2,000 smallest of the 3,000 largest publicly traded U.S. companies, based on total market capitalization) with lower price-to-book ratios and lower forecasted growth values.
The Russell Midcap® Index measures the performance of the 800 smallest of the 1,000 largest publicly traded U.S. companies, based on total market capitalization.
The Russell Midcap® Growth Index measures the performance of those Russell Midcap Index companies (the 800 smallest of the 1,000 largest publicly traded U.S. companies, based on total market capitalization) with higher price-to-book ratios and higher forecasted growth values.
The Russell Midcap® Value Index measures the performance of those Russell Midcap Index companies (the 800 smallest of the 1,000 largest publicly traded U.S. companies, based on total market capitalization) with lower price-to-book ratios and lower forecasted growth values.
Notes
| |
| | |
| Contact Us | |
| | |
| americancentury.com | |
| | |
| Automated Information Line | 1-800-345-8765 |
| | |
| Investor Services Representative | 1-800-345-2021 or 816-531-5575 |
| | |
| Investors Using Advisors | 1-800-378-9878 |
| | |
| Business, Not-For-Profit, Employer-Sponsored Retirement Plans | 1-800-345-3533 |
| | |
| Banks and Trust Companies, Broker-Dealers, Financial Professionals, Insurance Companies | 1-800-345-6488 |
| | |
| Telecommunications Device for the Deaf | 1-800-634-4113 |
| | |
| American Century Mutual Funds, Inc. |
| |
Investment Advisor: American Century Investment Management, Inc. Kansas City, Missouri |
| |
| This report and the statements it contains are submitted for the general information of our shareholders. The report is not authorized for distribution to prospective investors unless preceded or accompanied by an effective prospectus. |
American Century Investment Services, Inc., Distributor
©2010 American Century Proprietary Holdings, Inc. All rights reserved.
| Annual Report |
| October 31, 2010 |
American Century Investments®
| | President’s Letter | 2 |
| | Independent Chairman’s Letter | 3 |
| | Market Perspective | 4 |
| | U.S. Stock Index Returns | 4 |
| | | |
| New Opportunities |
| |
| | Performance | 5 |
| | Portfolio Commentary | 7 |
| | Top Ten Holdings | 9 |
| | Top Five Industries | 9 |
| | Types of Investments in Portfolio | 9 |
| | | |
| | Shareholder Fee Example | 10 |
| | | |
| Financial Statements |
| |
| | Schedule of Investments | 12 |
| | Statement of Assets and Liabilities | 17 |
| | Statement of Operations | 18 |
| | Statement of Changes in Net Assets | 19 |
| | Notes to Financial Statements | 20 |
| | Financial Highlights | 25 |
| | Report of Independent Registered Public Accounting Firm | 30 |
| | | |
| Other Information |
| |
| | Proxy Voting Results | 31 |
| | Management | 32 |
| | Additional Information | 36 |
| | Index Definitions | 37 |
Any opinions expressed in this report reflect those of the author as of the date of the report, and do not necessarily represent the opinions of American Century Investments or any other person in the American Century Investments organization. Any such opinions are subject to change at any time based upon market or other conditions and American Century Investments disclaims any responsibility to update such opinions. These opinions may not be relied upon as investment advice and, because investment decisions made by American Century Investments funds are based on numerous factors, may not be relied upon as an indication of trading intent on behalf of any American Century Investments fund. Security examples are used for representational purposes only and are not intended as recommendations to purchase or sell securities. Performance information for comparative indices and securities is provided to American Century Investments by third party vendors. To the best of American Century Investments’ knowledge, such information is accurate at the time of printing.
Jonathan Thomas
Dear Investor:
To learn more about the capital markets, your investment, and the portfolio management strategies American Century Investments provides, we encourage you to review this shareholder report for the financial reporting period ended October 31, 2010.
On the following pages, you will find investment performance and portfolio information, presented with the expert perspective and commentary of our portfolio management team. This report remains one of our most important vehicles for conveying the information you need about your investment performance, and about the market factors and strategies that affect fund returns. For additional information on the markets, we encourage you to visit the “Insights & News” tab at our Web site, americancentury.com, for updates and further expert commentary.
The top of our Web site’s home page also provides a link to “Our Story,” which, first and foremost, outlines our commitment—since 1958—to helping clients reach their financial goals. We believe strongly that we will only be successful when our clients are successful. That’s who we are.
Another important, unique facet of our story and who we are is “Profits with a Purpose,” which describes our bond with the Stowers Institute for Medical Research (SIMR). SIMR is a world-class biomedical organization—founded by our company founder James E. Stowers, Jr. and his wife Virginia—that is dedicated to researching the causes, treatment, and prevention of gene-based diseases, including cancer. Through American Century Investments’ private ownership structure, more than 40% of our profits support SIMR.
Mr. Stowers’ example of achieving financial success and using that platform to help humanity motivates our entire American Century Investments team. His story inspires us to help each of our clients achieve success. Thank you for sharing your financial journey with us.
Sincerely,
Jonathan Thomas
President and Chief Executive Officer
American Century Investments
Independent Chairman’s Letter
Don Pratt
Dear Fellow Shareholders,
As regulators and the markets continue to sort out the events of the credit crisis, a consistent theme has been that financial services firms should re-examine their risk management practices. Risk management has been a regular part of American Century Investments’ activities for many years. However, recently American Century and your mutual fund board have been spending additional time focusing on our risk oversight processes.
The board’s efforts are now organized around three categories of risk: investment risk, operational risk, and enterprise risk. This approach has facilitated a realignment of many risk oversight tasks that the board has historically conducted. Investment risk tasks include a review of portfolio risk, monitoring the use of derivatives, and performance assessment. Operational risk focuses on compliance, valuation, shareholder services, and trading activities. Enterprise risk addresses the financial condition of the advisor, human resource development, and reputational risks. Risk oversight tasks are addressed in every quarterly board meeting, and a review of the advisor’s entire risk management program is undertaken annually. We acknowledge and support the approach that American Century Investments takes to its risk management responsibilities. While the board has refocused its efforts in this important oversight area, we recognize that risk oversight is a journey and we expect to continue to improve our processes.
Our September quarterly board meeting was held in the New York offices of American Century Investments. This gave the directors an opportunity to meet with the portfolio management teams for each of the global and international funds overseen by the board. Each team uses sophisticated investment tools and daily risk analysis in managing client assets. We also were impressed with the “bench strength” that has been developed under the leadership of the Global and Non-U.S. Equity CIO Mark Kopinski. These face-to-face meetings provide an opportunity for the directors—working on behalf of shareholders—to validate the advisor’s efforts and the investment management approach being followed.
I thank you for your continued confidence in American Century during this turbulent time in the economy and investment markets. If you have thoughts or questions you would like to share with the board send them to me at dhpratt@fundboardchair.com.
Best regards,
Don Pratt
By David Hollond, Chief Investment Officer, U.S. Growth Equity—Mid & Small Cap
Stocks Rallied Amid Growing Volatility
U.S. stocks advanced for the 12 months ended October 31, 2010, as the broad equity indices posted double-digit gains. Virtually all of the market’s gains occurred in the first six months of the period, when stocks continued to climb after reaching a multi-year low in March 2009. The key factors behind the rally included favorable economic data, which provided evidence of a burgeoning recovery, and better-than-expected corporate earnings, which resulted largely from cost-cutting measures by many businesses to widen profit margins.
Market conditions changed abruptly in late April as evidence of a pullback in economic activity led to concerns about a relapse into recession. These concerns were amplified by a sovereign debt crisis in Greece that began to spread across Europe. In response, the equity market declined sharply throughout May and June as market volatility increased substantially.
The equity market remained volatile in the third quarter, gaining ground in July and falling back in August amid a tug-of-war between positive corporate earnings reports and an increasingly sluggish economic environment. However, stocks staged a resurgence during the final two months of the period as investors expressed confidence in the Federal Reserve’s plan to revive the economic recovery via another round of quantitative easing.
Small- and Mid-Cap Growth Stocks Outperformed
While stocks advanced across the board, the 12-month period was especially favorable for mid- and small-cap growth stocks. The small- and mid-cap segments of the market led the overall advance, returning more than 25% (see the table below). Smaller companies suffered the largest losses during the downturn in late 2008 and early 2009 and thus far have enjoyed the highest returns during the market’s recovery.
In addition, growth-oriented issues outpaced value shares across all market capitalizations. The best-performing sectors in the market were those traditionally associated with growth, such as information technology and consumer discretionary. In addition, the financials sector—a major component in value indices—underperformed during the period.
| U.S. Stock Index Returns |
| For the 12 months ended October 31, 2010 |
| Russell 1000 Index (Large-Cap) | 17.67% | | Russell 2000 Index (Small-Cap) | 26.58% |
| Russell 1000 Growth Index | 19.65% | | Russell 2000 Growth Index | 28.67% |
| Russell 1000 Value Index | 15.71% | | Russell 2000 Value Index | 24.43% |
| Russell Midcap Index | 27.71% | | |
| Russell Midcap Growth Index | 28.03% | | | |
| Russell Midcap Value Index | 27.49% | | | |
New Opportunities
| Total Returns as of October 31, 2010 |
| | | | Average Annual Returns | |
| | Ticker Symbol | 1 year(1) | 5 years | 10 years | Since Inception | Inception Date |
| Investor Class | TWNOX | 35.57% | 4.03% | -4.07% | 5.91% | 12/26/96 |
Russell 2500 Growth Index(2) | — | 28.76% | 4.55% | 1.49% | 5.44%(3) | — |
Russell 2000 Growth Index | — | 28.67% | 3.99% | 1.15% | 3.63%(3) | — |
| Institutional Class | TWNIX | — | — | — | 13.18%(4) | 3/1/10 |
A Class No sales charge* With sales charge* | TWNAX | — — | — — | — — | 12.85%(4) 6.37%(4) | 3/1/10 |
C Class No sales charge* With sales charge* | TWNCX | — — | — — | — — | 12.19%(4) 11.19%(4) | 3/1/10 |
| R Class | TWNRX | — | — | — | 12.69%(4) | 3/1/10 |
| * | Sales charges include initial sales charges and contingent deferred sales charges (CDSCs), as applicable. A Class shares have a 5.75% maximum initial sales charge for equity funds and may be subject to a maximum CDSC of 1.00%. C Class shares redeemed within 12 months of purchase are subject to a maximum CDSC of 1.00%. The SEC requires that mutual funds provide performance information net of maximum sales charges in all cases where charges could be applied. |
| (1) | Extraordinary performance is attributable in part to unusually favorable market conditions and may not be repeated or consistently achieved in the future. |
| (2) | In December 2009, the fund’s benchmark changed from the Russell 2000 Growth Index to the Russell 2500 Growth Index. This reflects a change in the fund’s investment strategy to include stocks of small- and mid-sized companies. |
| (3) | Since 12/31/96, the date nearest the Investor Class’s inception for which data are available. |
| (4) | Total returns for periods less than one year are not annualized. |
Data presented reflect past performance. Past performance is no guarantee of future results. Current performance may be higher or lower than the performance shown. Investment return and principal value will fluctuate, and redemption value may be more or less than original cost. To obtain performance data current to the most recent month end, please call 1-800-345-2021 or visit americancentury.com. Historically, small company stocks have been more volatile than the stocks of larger, more established companies. The fund’s investment process may result in high portfolio turnover, high commission costs and high capital gains distributions. In addition, its investment approach may involve higher volatility and risk.
Unless otherwise indicated, performance reflects Investor Class shares; performance for other share classes will vary due to differences in fee structure. For information about other share classes available, please consult the prospectus. Data assumes reinvestment of dividends and capital gains, and none of the charts reflect the deduction of taxes that a shareholder would pay on fund distributions or the redemption of fund shares. Returns for the indices are provided for comparison. The fund’s total returns include operating expenses (such as transaction costs and management fees) that reduce returns, while the total returns of the indices do not.
New Opportunities
| Growth of $10,000 Over 10 Years |
| $10,000 investment made October 31, 2000 |
| Total Annual Fund Operating Expenses |
| Investor Class | Institutional Class | A Class | C Class | R Class |
| 1.51% | 1.31% | 1.76% | 2.51% | 2.01% |
The total annual fund operating expenses shown is as stated in the fund’s prospectus current as of the date of this report. The prospectus may vary from the expense ratio shown elsewhere in this report because it is based on a different time period, includes acquired fund fees and expenses, and, if applicable, does not include fee waivers or expense reimbursements.
Data presented reflect past performance. Past performance is no guarantee of future results. Current performance may be higher or lower than the performance shown. Investment return and principal value will fluctuate, and redemption value may be more or less than original cost. To obtain performance data current to the most recent month end, please call 1-800-345-2021 or visit americancentury.com. Historically, small company stocks have been more volatile than the stocks of larger, more established companies. The fund’s investment process may result in high portfolio turnover, high commission costs and high capital gains distributions. In addition, its investment approach may involve higher volatility and risk.
Unless otherwise indicated, performance reflects Investor Class shares; performance for other share classes will vary due to differences in fee structure. For information about other share classes available, please consult the prospectus. Data assumes reinvestment of dividends and capital gains, and none of the charts reflect the deduction of taxes that a shareholder would pay on fund distributions or the redemption of fund shares. Returns for the indices are provided for comparison. The fund’s total returns include operating expenses (such as transaction costs and management fees) that reduce returns, while the total returns of the indices do not.
New Opportunities
Portfolio Managers: Stafford Southwick and Matthew Ferretti
Performance Summary
New Opportunities returned 35.57%* for the 12 months ended October 31, 2010, its best fiscal-year return in 10 years. The fund outpaced the 28.76% return of its benchmark, the Russell 2500 Growth Index.
The robust return for New Opportunities reflected the strong performance of small- and mid-cap growth stocks, which led the equity market’s advance for the 12-month period. Although price momentum and accelerating growth—two key factors in the fund’s investment process—were out of favor during the first half of the period, the market began to reward stocks with these characteristics later in the period. Favorable stock selection was another important factor contributing to the fund’s outperformance of its benchmark, adding value in eight of ten market sectors.
Industrials and Consumer Discretionary Outperformed
By far, stock selection was most successful in the industrials and consumer discretionary sectors of the portfolio. Security selection among road and rail companies and an overweight position in airlines contributed the most to outperformance in the industrials sector. The fund’s top individual performance contributor was rental car agency Dollar Thrifty Automotive, a significant portfolio overweight and the fund’s second-largest holding for the 12-month period. A bidding war between competitors Hertz Global Holdings and Avis Budget Group to acquire Dollar Thrifty provided a substantial boost to the stock, which gained 150% for the reporting period.
Among airline stocks, the best contributor was United Continental Holdings, which was known as UAL until October 2010, when its merger with Continental Airlines was completed. Improving fundamentals in the airline industry enabled United Continental, the world’s largest airline by traffic volume, to return to profitability after struggling with losses and declining traffic during the economic downturn in late 2008 and early 2009.
In the consumer discretionary sector, household durable products makers and consumer services providers were the most significant contributors to performance versus the benchmark index. In the consumer services industry, avoiding for-profit education companies contributed positively as these stocks struggled with declining enrollment and tighter student loan regulations. In contrast, our primary holding in this sector was art auctioneer Sotheby’s, which rallied sharply thanks to a recovery in the auction market.
Other top performers in this sector included online travel agency Priceline.com, auto parts maker TRW Automotive, and specialty mattress maker Tempur-Pedic International. Priceline benefited from a recovery in travel and strong growth in its international business; TRW advanced as a rebound in the auto industry led to a rapid increase in revenues and earnings for the company; and Tempur-Pedic benefited from increased demand and repeatedly exceeded earnings expectations.
*All fund returns referenced in this commentary are for Investor Class shares.
New Opportunities
Technology Also Added Value
The portfolio’s information technology holdings were also major contributors to the fund’s outperformance of the Russell 2500 Growth Index. Stock selection among communications equipment makers and an overweight position in semiconductor manufacturers produced the lion’s share of the outperformance.
The big winner in this sector was communications equipment maker Acme Packet, which makes products that provide secure communications delivery between IP networks. The company benefited from upgrades to IP networks and growth in the enterprise market. Another top contributor was mobile data services provider Motricity, which rallied as the company expanded its international offerings. Motricity went public in July and was one of several initial public offerings (IPOs) in which we participated during the 12-month period.
Financials and Utilities Lagged
The only two sectors of the portfolio to meaningfully detract from performance versus the benchmark index were financials and utilities. As both of these sectors were among the weaker performers in the index, the underperformance resulted primarily from the fund’s overweight position in each sector. While no industry within the utilities sector stood out in terms of performance impact, consumer finance companies detracted the most in the financials sector as weaker economic conditions and a changing regulatory environment weighed on the industry. The most notable detractors included consumer lending firms Dollar Financial and World Acceptance.
The largest individual detractors in the New Opportunities portfolio for the 12 months included data services provider TNS, specialty apparel retailer Talbots, and greeting card company American Greetings. TNS faced greater competition in its credit card and ATM transaction business; Talbots lowered its revenue forecast for 2010 and announced store closings; and American Greetings tumbled as higher expenses and declining sales led to earnings that disappointed the market.
A Look Ahead
Over the past 12 months, the economic outlook has become less promising and more uncertain. Consumers continue to deleverage, the housing market remains in the doldrums, and the unemployment rate still hovers above 9%. It remains to be seen whether the Federal Reserve’s recent quantitative easing efforts will help reverse these trends.
Importantly, our investment process is not dependent on making macroeconomic predictions. We focus on selecting individual companies exhibiting accelerating business fundamentals, positive relative strength, and reasonable valuations. We believe that products exhibiting these characteristics provide greater probability of outperforming the market over the long term.
New Opportunities
| Top Ten Holdings |
| | % of net assets as of 10/31/10 |
| United Continental Holdings, Inc. | 3.1% |
| US Airways Group, Inc. | 1.7% |
| Triumph Group, Inc. | 1.5% |
| Tempur-Pedic International, Inc. | 1.5% |
| Motricity, Inc. | 1.3% |
| EnPro Industries, Inc. | 1.2% |
| Iconix Brand Group, Inc. | 1.1% |
| Complete Production Services, Inc. | 1.1% |
| Domino’s Pizza, Inc. | 1.1% |
| Acme Packet, Inc. | 1.1% |
| Top Five Industries |
| | % of net assets as of 10/31/10 |
| Machinery | 9.1% |
| Software | 5.7% |
| Communications Equipment | 5.0% |
| Airlines | 4.8% |
| Semiconductors & Semiconductor Equipment | 4.7% |
| Types of Investments in Portfolio |
| | % of net assets as of 10/31/10 |
| Common Stocks | 97.7% |
| Temporary Cash Investments | 1.1% |
| Other Assets and Liabilities | 1.2% |
Shareholder Fee Example (Unaudited)
Fund shareholders may incur two types of costs: (1) transaction costs, including sales charges (loads) on purchase payments and redemption/exchange fees; and (2) ongoing costs, including management fees; distribution and service (12b-1) fees; and other fund expenses. This example is intended to help you understand your ongoing costs (in dollars) of investing in your fund and to compare these costs with the ongoing cost of investing in other mutual funds.
The example is based on an investment of $1,000 made at the beginning of the period and held for the entire period from May 1, 2010 to October 31, 2010.
Actual Expenses
The table provides information about actual account values and actual expenses for each class. You may use the information, together with the amount you invested, to estimate the expenses that you paid over the period. First, identify the share class you own. Then simply divide your account value by $1,000 (for example, an $8,600 account value divided by $1,000 = 8.6), then multiply the result by the number under the heading “Expenses Paid During Period” to estimate the expenses you paid on your account during this period.
If you hold Investor Class shares of any American Century Investments fund, or Institutional Class shares of the American Century Diversified Bond Fund, in an American Century Investments account (i.e., not a financial intermediary or retirement plan account), American Century Investments may charge you a $12.50 semiannual account maintenance fee if the value of those shares is less than $10,000. We will redeem shares automatically in one of your accounts to pay the $12.50 fee. In determining your total eligible investment amount, we will include your investments in all personal accounts (including American Century Investments Brokerage accounts) registered under your Social Security number. Personal accounts include individual accounts, joint accounts, UGMA/UTMA accounts, personal trusts, Coverdell Education Savings Accounts and IRAs (including traditional, Roth, Rollover, SEP-, SARSEP- and SIMPLE-IRAs), and certain other retirement accounts. If you have only business, business retirement, employer-sponsored or American Century Investments Brokerage accounts, you are currently not subject to this fee. We will not charge the fee as long as you choose to manage your accounts exclusively online. If you are subject to the Account Maintenance Fee, your account value could be reduced by the fee amount.
Hypothetical Example for Comparison Purposes
The table also provides information about hypothetical account values and hypothetical expenses based on the actual expense ratio of each class of your fund and an assumed rate of return of 5% per year before expenses, which is not the actual return of a fund’s share class. The hypothetical account values and expenses may not be used to estimate the actual ending account balance or expenses you paid for the period. You may use this information to compare the ongoing costs of investing in your fund and other funds. To do so, compare this 5% hypothetical example with the 5% hypothetical examples that appear in the shareholder reports of the other funds.
Please note that the expenses shown in the table are meant to highlight your ongoing costs only and do not reflect any transactional costs, such as sales charges (loads) or redemption/exchange fees. Therefore, the table is useful in comparing ongoing costs only, and will not help you determine the relative total costs of owning different funds. In addition, if these transactional costs were included, your costs would have been higher.
| | Beginning Account Value 5/1/10 | Ending Account Value 10/31/10 | Expenses Paid During Period* 5/1/10 - 10/31/10 | Annualized Expense Ratio* |
| Actual | | | | |
| Investor Class | $1,000 | $1,047.30 | $7.79 | 1.51% |
| Institutional Class | $1,000 | $1,048.90 | $6.77 | 1.31% |
| A Class | $1,000 | $1,045.80 | $9.08 | 1.76% |
| C Class | $1,000 | $1,041.30 | $12.91 | 2.51% |
| R Class | $1,000 | $1,044.30 | $10.36 | 2.01% |
| Hypothetical |
| Investor Class | $1,000 | $1,017.59 | $7.68 | 1.51% |
| Institutional Class | $1,000 | $1,018.60 | $6.67 | 1.31% |
| A Class | $1,000 | $1,016.33 | $8.94 | 1.76% |
| C Class | $1,000 | $1,012.55 | $12.73 | 2.51% |
| R Class | $1,000 | $1,015.07 | $10.21 | 2.01% |
*Expenses are equal to the class’s annualized expense ratio listed in the table above, multiplied by the average account value over the period, multiplied by 184, the number of days in the most recent fiscal half-year, divided by 365, to reflect the one-half year period.
| | Shares | Value |
| Common Stocks — 97.7% |
| AEROSPACE & DEFENSE — 3.1% |
AerCap Holdings NV(1) | 21,832 | $281,851 |
BE Aerospace, Inc.(1) | 8,479 | 311,688 |
Ladish Co., Inc.(1) | 38,401 | 1,228,448 |
TransDigm Group, Inc.(1) | 6,578 | 435,924 |
| Triumph Group, Inc. | 27,174 | 2,271,475 |
| | | 4,529,386 |
| AIR FREIGHT & LOGISTICS — 0.1% |
Atlas Air Worldwide Holdings, Inc.(1) | 2,204 | 115,181 |
| AIRLINES — 4.8% |
United Continental Holdings, Inc.(1) | 156,492 | 4,544,528 |
US Airways Group, Inc.(1) | 207,917 | 2,451,341 |
| | | 6,995,869 |
| AUTO COMPONENTS — 3.0% |
American Axle & Manufacturing Holdings, Inc.(1) | 101,937 | 939,859 |
Amerigon, Inc.(1) | 65,825 | 709,594 |
BorgWarner, Inc.(1) | 28,542 | 1,601,492 |
| Cooper Tire & Rubber Co. | 5,074 | 99,501 |
Dorman Products, Inc.(1) | 21,603 | 788,293 |
Goodyear Tire & Rubber Co. (The)(1) | 25,292 | 258,484 |
| | | 4,397,223 |
| BIOTECHNOLOGY — 2.7% |
Acorda Therapeutics, Inc.(1) | 4,874 | 131,793 |
Alexion Pharmaceuticals, Inc.(1) | 11,342 | 774,659 |
Amylin Pharmaceuticals, Inc.(1) | 19,325 | 251,805 |
BioMarin Pharmaceutical, Inc.(1) | 12,967 | 339,217 |
Cepheid, Inc.(1) | 7,551 | 158,873 |
Cubist Pharmaceuticals, Inc.(1) | 7,456 | 173,576 |
Human Genome Sciences, Inc.(1) | 24,038 | 646,141 |
Incyte Corp. Ltd.(1) | 11,012 | 183,460 |
Isis Pharmaceuticals, Inc.(1) | 11,154 | 101,947 |
Onyx Pharmaceuticals, Inc.(1) | 7,677 | 205,974 |
Regeneron Pharmaceuticals, Inc.(1) | 8,073 | 210,544 |
Seattle Genetics, Inc.(1) | 10,852 | $177,864 |
Theravance, Inc.(1) | 7,946 | 161,939 |
United Therapeutics Corp.(1) | 6,616 | 396,960 |
| | | 3,914,752 |
| CAPITAL MARKETS — 0.9% |
| BGC Partners, Inc., Class A | 28,334 | 196,638 |
| Eaton Vance Corp. | 13,242 | 380,972 |
| Lazard Ltd., Class A | 10,276 | 379,184 |
| SEI Investments Co. | 16,817 | 372,497 |
| | | 1,329,291 |
| CHEMICALS — 4.3% |
| Albemarle Corp. | 19,055 | 955,227 |
| Arch Chemicals, Inc. | 18,037 | 640,494 |
| Balchem Corp. | 17,800 | 543,968 |
| International Flavors & Fragrances, Inc. | 9,794 | 491,267 |
Kraton Performance Polymers, Inc.(1) | 25,597 | 830,879 |
| Lubrizol Corp. | 2,874 | 294,556 |
| Nalco Holding Co. | 15,090 | 425,236 |
OM Group, Inc.(1) | 13,049 | 434,140 |
Solutia, Inc.(1) | 61,079 | 1,106,141 |
TPC Group, Inc.(1) | 23,493 | 644,883 |
| | | 6,366,791 |
| COMMERCIAL BANKS — 0.6% |
| Danvers Bancorp., Inc. | 24,321 | 365,545 |
| Sandy Spring Bancorp, Inc. | 26,385 | 459,099 |
| | | 824,644 |
| COMMERCIAL SERVICES & SUPPLIES — 0.6% |
| Deluxe Corp. | 23,546 | 481,280 |
| Waste Connections, Inc. | 9,744 | 396,971 |
| | | 878,251 |
| COMMUNICATIONS EQUIPMENT — 5.0% |
Acme Packet, Inc.(1) | 40,861 | 1,616,052 |
Blue Coat Systems, Inc.(1) | 15,644 | 421,919 |
F5 Networks, Inc.(1) | 7,948 | 935,480 |
Finisar Corp.(1) | 20,102 | 341,935 |
Netgear, Inc.(1) | 30,780 | 948,332 |
Oplink Communications, Inc.(1) | 46,546 | 813,624 |
RADWARE Ltd.(1) | 22,807 | 806,683 |
Riverbed Technology, Inc.(1) | 8,434 | 485,292 |
| Sycamore Networks, Inc. | 21,781 | 664,103 |
Viasat, Inc.(1) | 7,347 | 302,476 |
| | | 7,335,896 |
| COMPUTERS & PERIPHERALS — 0.2% |
Stratasys, Inc.(1) | 7,902 | $247,491 |
| CONSTRUCTION MATERIALS — 0.3% |
| Martin Marietta Materials, Inc. | 5,624 | 452,620 |
| CONSUMER FINANCE — 0.8% |
NetSpend Holdings, Inc.(1) | 31,331 | 429,862 |
World Acceptance Corp.(1) | 16,382 | 706,883 |
| | | 1,136,745 |
| CONTAINERS & PACKAGING — 0.4% |
Crown Holdings, Inc.(1) | 19,401 | 624,518 |
| DIVERSIFIED CONSUMER SERVICES — 1.3% |
| DeVry, Inc. | 5,362 | 256,625 |
ITT Educational Services, Inc.(1) | 2,499 | 161,261 |
| Sotheby’s | 33,348 | 1,461,976 |
| | | 1,879,862 |
| DIVERSIFIED FINANCIAL SERVICES — 0.3% |
MSCI, Inc., Class A(1) | 13,336 | 478,096 |
| DIVERSIFIED TELECOMMUNICATION SERVICES — 0.7% |
General Communication, Inc., Class A(1) | 45,527 | 475,757 |
Vonage Holdings Corp.(1) | 233,044 | 594,262 |
| | | 1,070,019 |
| ELECTRICAL EQUIPMENT — 0.7% |
American Superconductor Corp.(1) | 9,539 | 320,988 |
| AMETEK, Inc. | 13,224 | 714,757 |
| | | 1,035,745 |
| ELECTRONIC EQUIPMENT, INSTRUMENTS & COMPONENTS — 4.4% |
| Cognex Corp. | 54,740 | 1,461,558 |
| Daktronics, Inc. | 47,087 | 514,190 |
FLIR Systems, Inc.(1) | 18,081 | 503,375 |
Kemet Corp.(1) | 279,773 | 1,046,351 |
Littelfuse, Inc.(1) | 33,078 | 1,403,500 |
SMART Modular Technologies (WWH), Inc.(1) | 100,318 | 741,350 |
Trimble Navigation Ltd.(1) | 22,207 | 795,899 |
| | | 6,466,223 |
| ENERGY EQUIPMENT & SERVICES — 2.0% |
Complete Production Services, Inc.(1) | 69,819 | 1,635,859 |
| Core Laboratories NV | 4,549 | 353,776 |
Dril-Quip, Inc.(1) | 9,257 | 639,658 |
Pioneer Drilling Co.(1) | 45,212 | 278,506 |
| | | 2,907,799 |
| FOOD & STAPLES RETAILING — 0.6% |
| PriceSmart, Inc. | 30,413 | $892,013 |
| HEALTH CARE EQUIPMENT & SUPPLIES — 2.7% |
Align Technology, Inc.(1) | 7,842 | 133,549 |
American Medical Systems Holdings, Inc.(1) | 9,950 | 200,990 |
Gen-Probe, Inc.(1) | 6,392 | 309,565 |
Haemonetics Corp.(1) | 3,073 | 167,939 |
IDEXX Laboratories, Inc.(1) | 7,073 | 424,097 |
Immucor, Inc.(1) | 9,127 | 158,810 |
Integra LifeSciences Holdings Corp.(1) | 2,819 | 121,273 |
| Masimo Corp. | 6,530 | 197,010 |
Mettler-Toledo International, Inc.(1) | 4,225 | 551,616 |
NuVasive, Inc.(1) | 4,888 | 128,066 |
Resmed, Inc.(1) | 18,864 | 601,196 |
Sirona Dental Systems, Inc.(1) | 4,298 | 161,820 |
| STERIS Corp. | 7,078 | 242,209 |
Thoratec Corp.(1) | 7,182 | 234,421 |
Volcano Corp.(1) | 6,145 | 150,061 |
| West Pharmaceutical Services, Inc. | 4,505 | 160,783 |
| | | 3,943,405 |
| HEALTH CARE PROVIDERS & SERVICES — 1.7% |
Amedisys, Inc.(1) | 4,260 | 108,460 |
Catalyst Health Solutions, Inc.(1) | 4,818 | 182,361 |
| Chemed Corp. | 3,004 | 177,056 |
Emergency Medical Services Corp., Class A(1) | 3,613 | 196,475 |
HealthSouth Corp.(1) | 11,369 | 205,665 |
HMS Holdings Corp.(1) | 3,368 | 202,451 |
| Lincare Holdings, Inc. | 12,620 | 330,896 |
Mednax, Inc.(1) | 5,815 | 344,306 |
| Owens & Minor, Inc. | 6,683 | 190,332 |
| Patterson Cos., Inc. | 13,354 | 369,238 |
PSS World Medical, Inc.(1) | 7,349 | 173,657 |
| | | 2,480,897 |
| HEALTH CARE TECHNOLOGY — 0.7% |
Allscripts Healthcare Solutions, Inc.(1) | 16,303 | 311,224 |
athenahealth, Inc.(1) | 4,495 | 179,665 |
MedAssets, Inc.(1) | 5,449 | 101,025 |
| Quality Systems, Inc. | 2,359 | 151,589 |
SXC Health Solutions Corp.(1) | 8,652 | 337,082 |
| | | 1,080,585 |
| HOTELS, RESTAURANTS & LEISURE — 2.2% |
Chipotle Mexican Grill, Inc.(1) | 6,028 | $1,267,146 |
Ctrip.com International Ltd. ADR(1) | 5,613 | 292,269 |
Domino’s Pizza, Inc.(1) | 109,024 | 1,617,916 |
| | | 3,177,331 |
| HOUSEHOLD DURABLES — 1.8% |
NVR, Inc.(1) | 702 | 440,442 |
Tempur-Pedic International, Inc.(1) | 62,114 | 2,142,933 |
| | | 2,583,375 |
| INDUSTRIAL CONGLOMERATES — 0.7% |
| Raven Industries, Inc. | 24,051 | 988,977 |
| INSURANCE — 0.7% |
| Amtrust Financial Services, Inc. | 18,496 | 276,885 |
FPIC Insurance Group, Inc.(1) | 8,446 | 299,158 |
| Safety Insurance Group, Inc. | 9,481 | 440,487 |
| | | 1,016,530 |
| INTERNET & CATALOG RETAIL — 1.8% |
HSN, Inc.(1) | 36,720 | 1,099,397 |
Netflix, Inc.(1) | 2,611 | 453,008 |
priceline.com, Inc.(1) | 3,076 | 1,159,068 |
| | | 2,711,473 |
| INTERNET SOFTWARE & SERVICES — 3.3% |
Ancestry.com, Inc.(1) | 35,036 | 934,410 |
Dice Holdings, Inc.(1) | 68,834 | 622,948 |
Equinix, Inc.(1) | 5,912 | 498,027 |
KIT Digital, Inc.(1) | 25,067 | 345,172 |
Limelight Networks, Inc.(1) | 108,115 | 733,020 |
Rackspace Hosting, Inc.(1) | 14,073 | 351,262 |
Vocus, Inc.(1) | 43,062 | 953,823 |
WebMD Health Corp.(1) | 7,657 | 400,308 |
| | | 4,838,970 |
| IT SERVICES — 0.6% |
Alliance Data Systems Corp.(1) | 5,691 | 345,557 |
| Global Payments, Inc. | 10,327 | 402,340 |
| MAXIMUS, Inc. | 2,936 | 178,010 |
| | | 925,907 |
| LEISURE EQUIPMENT & PRODUCTS — 0.6% |
| Polaris Industries, Inc. | 13,428 | 954,596 |
| LIFE SCIENCES TOOLS & SERVICES — 0.9% |
Bruker Corp.(1) | 979 | $14,675 |
Covance, Inc.(1) | 8,501 | 399,462 |
Dionex Corp.(1) | 2,200 | 196,306 |
PAREXEL International Corp.(1) | 7,715 | 165,873 |
| Pharmaceutical Product Development, Inc. | 13,141 | 339,169 |
| TECHNE Corp. | 4,735 | 288,456 |
| | | 1,403,941 |
| MACHINERY — 9.1% |
3D Systems Corp.(1) | 10,184 | 263,155 |
AGCO Corp.(1) | 10,858 | 461,139 |
ArvinMeritor, Inc.(1) | 43,426 | 720,003 |
| Bucyrus International, Inc. | 10,725 | 731,016 |
| Cascade Corp. | 13,802 | 488,453 |
| Donaldson Co., Inc. | 9,081 | 442,426 |
EnPro Industries, Inc.(1) | 49,366 | 1,734,721 |
| Lindsay Corp. | 24,533 | 1,414,327 |
Middleby Corp.(1) | 12,721 | 949,750 |
| NACCO Industries, Inc., Class A | 5,970 | 592,582 |
Navistar International Corp.(1) | 8,343 | 401,966 |
| Pall Corp. | 17,527 | 747,877 |
| Robbins & Myers, Inc. | 31,546 | 915,780 |
Sauer-Danfoss, Inc.(1) | 26,980 | 596,528 |
| Titan International, Inc. | 88,616 | 1,344,305 |
Wabash National Corp.(1) | 196,499 | 1,583,782 |
| | | 13,387,810 |
| MEDIA — 1.1% |
AirMedia Group, Inc. ADR(1) | 39,193 | 270,824 |
Interpublic Group of Cos., Inc. (The)(1) | 58,830 | 608,890 |
Sirius XM Radio, Inc.(1) | 455,276 | 680,638 |
| | | 1,560,352 |
| METALS & MINING — 1.7% |
Allied Nevada Gold Corp.(1) | 20,516 | 506,335 |
Brush Engineered Materials, Inc.(1) | 28,854 | 956,510 |
| Compass Minerals International, Inc. | 4,232 | 333,778 |
| Globe Specialty Metals, Inc. | 43,031 | 668,702 |
| | | 2,465,325 |
| OIL, GAS & CONSUMABLE FUELS — 4.6% |
Alpha Natural Resources, Inc.(1) | 23,270 | $1,051,106 |
| BP Prudhoe Bay Royalty Trust | 7,705 | 792,151 |
Concho Resources, Inc.(1) | 13,218 | 907,680 |
| Crosstex Energy LP | 63,858 | 893,373 |
Forest Oil Corp.(1) | 29,514 | 906,965 |
| Knightsbridge Tankers Ltd. | 35,623 | 774,088 |
| Permian Basin Royalty Trust | 40,549 | 851,124 |
| Teekay Tankers Ltd., Class A | 52,639 | 625,351 |
| | | 6,801,838 |
| PAPER & FOREST PRODUCTS — 1.0% |
Clearwater Paper Corp.(1) | 18,491 | 1,493,148 |
| PHARMACEUTICALS — 0.5% |
Auxilium Pharmaceuticals, Inc.(1) | 5,175 | 128,081 |
Impax Laboratories, Inc.(1) | 7,205 | 135,742 |
Nektar Therapeutics(1) | 11,556 | 168,371 |
Salix Pharmaceuticals Ltd.(1) | 7,026 | 265,794 |
| | | 697,988 |
| PROFESSIONAL SERVICES — 1.2% |
Kelly Services, Inc., Class A(1) | 79,263 | 1,177,055 |
| Robert Half International, Inc. | 22,443 | 608,430 |
| | | 1,785,485 |
| REAL ESTATE INVESTMENT TRUSTS (REITs) — 1.6% |
Ashford Hospitality Trust, Inc.(1) | 88,783 | 901,147 |
| Digital Realty Trust, Inc. | 10,061 | 600,944 |
| Post Properties, Inc. | 28,069 | 854,420 |
| | | 2,356,511 |
| REAL ESTATE MANAGEMENT & DEVELOPMENT — 0.8% |
CB Richard Ellis Group, Inc., Class A(1) | 43,405 | 796,482 |
| Jones Lang LaSalle, Inc. | 5,545 | 432,842 |
| | | 1,229,324 |
| ROAD & RAIL — 0.4% |
Kansas City Southern(1) | 14,504 | 635,565 |
| SEMICONDUCTORS & SEMICONDUCTOR EQUIPMENT — 4.7% |
Atheros Communications, Inc.(1) | 7,865 | 244,130 |
Cavium Networks, Inc.(1) | 11,114 | 354,203 |
Cirrus Logic, Inc.(1) | 19,333 | 248,429 |
Entegris, Inc.(1) | 50,223 | $300,333 |
GT Solar International, Inc.(1) | 101,138 | 832,366 |
MIPS Technologies, Inc.(1) | 82,074 | 1,206,488 |
ON Semiconductor Corp.(1) | 58,196 | 446,363 |
Photronics, Inc.(1) | 90,499 | 568,334 |
Silicon Image, Inc.(1) | 84,694 | 520,868 |
Skyworks Solutions, Inc.(1) | 64,777 | 1,484,041 |
Ultratech, Inc.(1) | 33,133 | 606,665 |
Veeco Instruments, Inc.(1) | 3,781 | 158,235 |
| | | 6,970,455 |
| SOFTWARE — 5.7% |
ANSYS, Inc.(1) | 10,956 | 495,759 |
Ariba, Inc.(1) | 15,115 | 283,860 |
| FactSet Research Systems, Inc. | 5,082 | 446,098 |
Fortinet, Inc.(1) | 8,662 | 259,860 |
Informatica Corp.(1) | 6,261 | 254,760 |
Interactive Intelligence, Inc.(1) | 21,568 | 532,945 |
Motricity, Inc.(1) | 85,934 | 1,887,970 |
Nuance Communications, Inc.(1) | 27,414 | 430,674 |
Progress Software Corp.(1) | 3,303 | 123,433 |
Radiant Systems, Inc.(1) | 53,190 | 1,037,737 |
Rovi Corp.(1) | 16,082 | 814,553 |
Smith Micro Software, Inc.(1) | 52,014 | 632,490 |
Sourcefire, Inc.(1) | 6,217 | 146,659 |
Taleo Corp., Class A(1) | 10,099 | 289,741 |
TIBCO Software, Inc.(1) | 21,650 | 416,113 |
VanceInfo Technologies, Inc. ADR(1) | 8,756 | 318,456 |
| | | 8,371,108 |
| SPECIALTY RETAIL — 3.5% |
CarMax, Inc.(1) | 29,972 | 928,832 |
| Finish Line, Inc. (The), Class A | 48,885 | 747,941 |
Jos. A. Bank Clothiers, Inc.(1) | 6,479 | 282,484 |
| Monro Muffler Brake, Inc. | 30,972 | 1,478,603 |
| PetSmart, Inc. | 23,594 | 883,124 |
Pier 1 Imports, Inc.(1) | 35,596 | 308,973 |
| Williams-Sonoma, Inc. | 14,243 | 461,046 |
| | | 5,091,003 |
| TEXTILES, APPAREL & LUXURY GOODS — 4.5% |
Crocs, Inc.(1) | 41,218 | $574,167 |
Deckers Outdoor Corp.(1) | 19,119 | 1,110,814 |
G-III Apparel Group Ltd.(1) | 34,655 | 914,892 |
Iconix Brand Group, Inc.(1) | 95,118 | 1,664,565 |
Lululemon Athletica, Inc.(1) | 4,337 | 192,216 |
Maidenform Brands, Inc.(1) | 26,594 | 711,655 |
Steven Madden Ltd.(1) | 33,012 | 1,396,407 |
| | | 6,564,716 |
| TRADING COMPANIES & DISTRIBUTORS — 1.1% |
United Rentals, Inc.(1) | 85,159 | 1,600,138 |
| WIRELESS TELECOMMUNICATION SERVICES — 1.7% |
MetroPCS Communications, Inc.(1) | 58,634 | 610,380 |
SBA Communications Corp., Class A(1) | 14,621 | 574,020 |
Syniverse Holdings, Inc.(1) | 43,218 | 1,317,717 |
| | | 2,502,117 |
TOTAL COMMON STOCKS (Cost $120,030,053) | 143,497,285 |
| Temporary Cash Investments — 1.1% |
| JPMorgan U.S. Treasury Plus Money Market Fund Agency Shares | 45,375 | $45,375 |
Repurchase Agreement, Bank of America Securities, LLC, (collateralized by various U.S. Treasury obligations, 1.375%, 5/15/12, valued at $1,632,637), in a joint trading account at 0.18%, dated 10/29/10, due 11/1/10 (Delivery value $1,600,024) | 1,600,000 |
TOTAL TEMPORARY CASH INVESTMENTS (Cost $1,645,375) | 1,645,375 |
TOTAL INVESTMENT SECURITIES — 98.8% (Cost $121,675,428) | 145,142,660 |
| OTHER ASSETS AND LIABILITIES — 1.2% | 1,823,108 |
| TOTAL NET ASSETS — 100.0% | $146,965,768 |
Notes to Schedule of Investments
| ADR = American Depositary Receipt |
See Notes to Financial Statements.
Statement of Assets and Liabilities
| OCTOBER 31, 2010 |
| Assets |
| Investment securities, at value (cost of $121,675,428) | $145,142,660 |
| Receivable for investments sold | 4,526,736 |
| Receivable for capital shares sold | 36,690 |
| Dividends and interest receivable | 36,652 |
| | 149,742,738 |
| | |
| Liabilities |
| Disbursements in excess of demand deposit cash | 605 |
| Payable for investments purchased | 2,433,794 |
| Payable for capital shares redeemed | 160,258 |
| Accrued management fees | 182,243 |
| Distribution and service fees payable | 70 |
| | 2,776,970 |
| | |
| Net Assets | $146,965,768 |
| | |
| Net Assets Consist of: |
| Capital (par value and paid-in surplus) | $190,334,693 |
| Accumulated net realized loss | (66,836,157) |
| Net unrealized appreciation | 23,467,232 |
| | $146,965,768 |
| | Net assets | Shares outstanding | Net asset value per share |
| Investor Class, $0.01 Par Value | $146,746,945 | | 21,388,325 | | $6.86 | |
| Institutional Class, $0.01 Par Value | $28,287 | | 4,119 | | $6.87 | |
| A Class, $0.01 Par Value | $121,404 | | 17,724 | | $6.85* | |
| C Class, $0.01 Par Value | $39,827 | | 5,845 | | $6.81 | |
| R Class, $0.01 Par Value | $29,305 | | 4,287 | | $6.84 | |
*Maximum offering price $7.27 (net asset value divided by 0.9425)
See Notes to Financial Statements.
| YEAR ENDED OCTOBER 31, 2010 |
| Investment Income (Loss) |
| Income: | |
| Dividends (net of foreign taxes withheld of $669) | $1,243,495 |
| Interest | 1,820 |
| | 1,245,315 |
| Expenses: | |
| Management fees | 2,031,657 |
| Distribution and service fees: | |
| A Class | 100 |
| C Class | 192 |
| R Class | 89 |
| Directors’ fees and expenses | 4,120 |
| Other expenses | 3,613 |
| | 2,039,771 |
| | |
| Net investment income (loss) | (794,456) |
| | |
| Realized and Unrealized Gain (Loss) |
| Net realized gain (loss) on investment transactions | 28,645,395 |
| Change in net unrealized appreciation (depreciation) on investments | 12,832,897 |
| | |
| Net realized and unrealized gain (loss) | 41,478,292 |
| | |
| Net Increase (Decrease) in Net Assets Resulting from Operations | $40,683,836 |
See Notes to Financial Statements.
Statement of Changes in Net Assets
| YEARS ENDED OCTOBER 31, 2010 AND OCTOBER 31, 2009 |
| Increase (Decrease) in Net Assets | 2010 | 2009 |
| Operations |
| Net investment income (loss) | $(794,456) | $(592,241) |
| Net realized gain (loss) | 28,645,395 | (32,090,793) |
| Change in net unrealized appreciation (depreciation) | 12,832,897 | 28,631,261 |
| Net increase (decrease) in net assets resulting from operations | 40,683,836 | (4,051,773) |
| | | |
| Capital Share Transactions |
| Net increase (decrease) in net assets from capital share transactions | (13,020,566) | (23,600,401) |
| | | |
| Redemption Fees |
| Increase in net assets from redemption fees | 15,637 | 7,327 |
| | | |
| Net increase (decrease) in net assets | 27,678,907 | (27,644,847) |
| | | |
| Net Assets |
| Beginning of period | 119,286,861 | 146,931,708 |
| End of period | $146,965,768 | $119,286,861 |
| | | |
| Accumulated net investment loss | — | $(131,144) |
See Notes to Financial Statements.
Notes to Financial Statements
OCTOBER 31, 2010
1. Organization
American Century Mutual Funds, Inc. (the corporation) is registered under the Investment Company Act of 1940 (the 1940 Act) as an open-end management investment company and is organized as a Maryland corporation. New Opportunities Fund (the fund) is one fund in a series issued by the corporation. The fund is diversified as defined under the 1940 Act. The fund’s investment objective is to seek long-term capital growth. The fund pursues its objective by investing primarily in common stocks of small- and mid-sized companies that management believes will increase in value over time. Prior to December 1, 2009, the fund invested primarily in common stocks of smaller-sized companies. The fund is authorized to issue the Investor Class, the Institutional Class, the A Class, the C Class and the R Class. The A Class may incu r an initial sales charge. The A Class and C Class may be subject to a contingent deferred sales charge. The share classes differ principally in their respective sales charges and distribution and shareholder servicing expenses and arrangements. The Institutional Class is made available to institutional shareholders or through financial intermediaries whose clients do not require the same level of shareholder and administrative services as shareholders of other classes. As a result, the Institutional Class is charged a lower unified management fee. Sale of the Institutional Class, A Class, C Class and R Class commenced on March 1, 2010.
2. Significant Accounting Policies
The following is a summary of significant accounting policies consistently followed by the fund in preparation of its financial statements. The financial statements are prepared in conformity with accounting principles generally accepted in the United States of America, which may require management to make certain estimates and assumptions at the date of the financial statements. Actual results could differ from these estimates.
Investment Valuations — The fund determines the fair value of its investments and computes its net asset value per share as of the close of regular trading (usually 4 p.m. Eastern time) on the New York Stock Exchange (NYSE) on each day the NYSE is open.
Equity securities that are listed or traded on a domestic securities exchange are valued at the last reported sales price or at the official closing price as provided by the exchange. Equity securities traded on foreign securities exchanges are typically valued at the closing price on the exchange where primarily traded or as of the close of the NYSE, if that is earlier. If no last sales price is reported, or if local convention or regulation so provides, the mean of the latest bid and asked prices is used. Depending on local convention or regulation, securities traded over-the-counter are valued at the mean of the latest bid and asked prices, the last sales price, or the official closing price. In its determination of fair value, the fund may review several factors including: market information specific to a security; news developments in U.S. and foreign markets; the performance of particular U.S. and foreign securities, indices, comparable securities, American Depositary Receipts, Exchange Traded Funds, and other relevant market indicators.
Debt securities maturing within 60 days at the time of purchase may be valued at cost, plus or minus any amortized discount or premium or at the evaluated mean as provided by an independent pricing service. Evaluated mean prices are commonly derived through utilization of market models, which may consider, among other factors, trade data, quotations from dealers and active market makers, relevant yield curve and spread data, related sector levels, creditworthiness, and other relevant market information on the same or comparable securities.
Investments in open-end management investment companies are valued at the reported net asset value per share. Repurchase agreements are valued at cost.
The value of investments initially expressed in foreign currencies is translated into U.S. dollars at prevailing exchange rates.
If the fund determines that the market price for a portfolio security is not readily available or the valuation methods mentioned above do not reflect a security’s fair value, such security is valued as determined in good faith by the Board of Directors or its designee, in accordance with procedures adopted by the Board of Directors. Circumstances that may cause the fund to use these procedures to value a security include, but are not limited to: a security has been declared in default; trading in a security has been halted during the trading day; there is a foreign market holiday and no trading occurred; or an event occurred between the close of a foreign exchange and the NYSE that may affect the value of a security.
Security Transactions — Security transactions are accounted for as of the trade date. Net realized gains and losses are determined on the identified cost basis, which is also used for federal income tax purposes.
Investment Income — Dividend income less foreign taxes withheld, if any, is recorded as of the ex-dividend date. Distributions received on securities that represent a return of capital or capital gain are recorded as a reduction of cost of investments and/or as a realized gain. The fund estimates the components of distributions received that may be considered nontaxable distributions or capital gain distributions for income tax purposes. Interest income is recorded on the accrual basis and includes accretion of discounts and amortization of premiums.
Repurchase Agreements — The fund may enter into repurchase agreements with institutions that American Century Investment Management, Inc. (ACIM) (the investment advisor) has determined are creditworthy pursuant to criteria adopted by the Board of Directors. The fund requires that the collateral, represented by securities, received in a repurchase transaction be transferred to the custodian in a manner sufficient to enable the fund to obtain those securities in the event of a default under the repurchase agreement. ACIM monitors, on a daily basis, the securities transferred to ensure the value, including accrued interest, of the securities under each repurchase agreement is equal to or greater than amounts owed to the fund under each repurchase agreement.
Joint Trading Account — Pursuant to an Exemptive Order issued by the Securities and Exchange Commission, the fund, along with certain other funds in the American Century Investments family of funds, may transfer uninvested cash balances into a joint trading account. These balances are invested in one or more repurchase agreements that are collateralized by U.S. Treasury or Agency obligations.
Income Tax Status — It is the fund’s policy to distribute substantially all net investment income and net realized gains to shareholders and to otherwise qualify as a regulated investment company under provisions of the Internal Revenue Code. The fund is no longer subject to examination by tax authorities for years prior to 2007. At this time, management believes there are no uncertain tax positions which, based on their technical merit, would not be sustained upon examination and for which it is reasonably possible that the total amounts of unrecognized tax benefits will significantly change in the next twelve months. Accordingly, no provision has been made for federal or state income taxes.
Multiple Class — All shares of the fund represent an equal pro rata interest in the net assets of the class to which such shares belong, and have identical voting, dividend, liquidation and other rights and the same terms and conditions, except for class specific expenses and exclusive rights to vote on matters affecting only individual classes. Income, non-class specific expenses, and realized and unrealized capital gains and losses of the fund are allocated to each class of shares based on their relative net assets.
Distributions to Shareholders — Distributions to shareholders are recorded on the ex-dividend date. Distributions from net investment income and net realized gains, if any, are generally declared and paid annually.
Redemption — The fund may impose a 2.00% redemption fee on shares held less than 180 days. The fee may not be applicable to all classes. The redemption fee is retained by the fund and helps cover transaction costs that long-term investors may bear when the fund sells securities to meet investor redemptions.
Indemnifications — Under the corporation’s organizational documents, its officers and directors are indemnified against certain liabilities arising out of the performance of their duties to the fund. In addition, in the normal course of business, the fund enters into contracts that provide general indemnifications. The maximum exposure under these arrangements is unknown as this would involve future claims that may be made against a fund. The risk of material loss from such claims is considered by management to be remote.
3. Fees and Transactions with Related Parties
Management Fees — The corporation has entered into a management agreement with ACIM, under which ACIM provides the fund with investment advisory and management services in exchange for a single, unified management fee (the fee) per class. The agreement provides that all expenses of managing and operating the fund, except distribution and service fees, brokerage expenses, taxes, interest, fees and expenses of the independent directors (including legal counsel fees), and extraordinary expenses, will be paid by ACIM. The fee is computed and accrued daily based on each class’s daily net assets and paid monthly in arrears. The rate of the fee is determined by applying a fee rate calculation formula. This formula takes into account the fund’s assets as well as certain a ssets, if any, of other clients of the investment advisor outside the American Century Investments family of funds (such as subadvised funds and separate accounts) that have very similar investment teams and investment strategies (strategy assets). The annual management fee schedule ranges from 1.100% to 1.500% for the Investor Class, A Class, C Class and R Class. The Institutional Class is 0.200% less at each point within the range. The effective annual management fee for each class for the year ended October 31, 2010 was 1.50% for the Investor Class, A Class, C Class and R Class and 1.30% for the Institutional Class.
Distribution and Service Fees — The Board of Directors has adopted a separate Master Distribution and Individual Shareholder Services Plan for each of the A Class, C Class and R Class (collectively the plans), pursuant to Rule 12b-1 of the 1940 Act. The plans provide that the A Class will pay American Century Investment Services, Inc. (ACIS) an annual distribution and service fee of 0.25%. The plans provide that the C Class will pay ACIS an annual distribution and service fee of 1.00%, of which 0.25% is paid for individual shareholder services and 0.75% is paid for distribution services. The plans provide that the R Class will pay ACIS an annual distribution and service fee of 0.50%. The fees are computed and accrued daily based on each class’s daily net assets and paid monthly in arrears. The fees are used to pay financial intermediaries for distribution and individual shareholder services. Fees incurred under the plans during the year ended October 31, 2010, are detailed in the Statement of Operations.
Related Parties — Certain officers and directors of the corporation are also officers and/or directors of American Century Companies, Inc. (ACC), the parent of the corporation’s investment advisor, ACIM, the distributor of the corporation, ACIS, and the corporation’s transfer agent, American Century Services, LLC.
The fund is eligible to invest in a money market fund for temporary purposes, which is managed by J.P. Morgan Investment Management, Inc. (JPMIM). The fund has a mutual funds services agreement with J.P. Morgan Investor Services Co. (JPMIS). JPMorgan Chase Bank (JPMCB) is a custodian of the fund. JPMIM, JPMIS and JPMCB are wholly owned subsidiaries of JPMorgan Chase & Co. (JPM). JPM is an equity investor in ACC.
4. Investment Transactions
Purchases and sales of investment securities, excluding short-term investments, for the year ended October 31, 2010, were $239,074,531 and $255,812,057, respectively.
5. Capital Share Transactions
Transactions in shares of the fund were as follows:
| | Year ended October 31, 2010(1) | Year ended October 31, 2009 |
| | Shares | Amount | Shares | Amount |
| Investor Class/Shares Authorized | 200,000,000 | | 300,000,000 | |
| Sold | 1,028,023 | $6,286,589 | 972,792 | $4,381,201 |
| Redeemed | (3,220,394) | (19,503,133) | (6,114,009) | (27,981,602) |
| | (2,192,371) | (13,216,544) | (5,141,217) | (23,600,401) |
| Institutional Class/Shares Authorized | 25,000,000 | | N/A | |
| Sold | 4,119 | 25,000 | | |
| A Class/Shares Authorized | 25,000,000 | | N/A | |
| Sold | 19,550 | 120,712 | | |
| Redeemed | (1,826) | (11,798) | | |
| | 17,724 | 108,914 | | |
| C Class/Shares Authorized | 25,000,000 | | N/A | |
| Sold | 5,845 | 36,000 | | |
| R Class/Shares Authorized | 25,000,000 | | N/A | |
| Sold | 4,287 | 26,064 | | |
| Net increase (decrease) | (2,160,396) | $(13,020,566) | (5,141,217) | $(23,600,401) |
| (1) | March 1, 2010 (commencement of sale) through October 31, 2010 for the Institutional Class, A Class, C Class and R Class. |
6. Fair Value Measurements
The fund’s securities valuation process is based on several considerations and may use multiple inputs to determine the fair value of the positions held by the fund. In conformity with accounting principles generally accepted in the United States of America, the inputs used to determine a valuation are classified into three broad levels as follows:
| • | Level 1 valuation inputs consist of unadjusted quoted prices in an active market for identical securities; |
| • | Level 2 valuation inputs consist of direct or indirect observable market data (including quoted prices for similar securities, evaluations of subsequent market events, interest rates, prepayment speeds, credit risk, etc.); or |
| • | Level 3 valuation inputs consist of unobservable data (including a fund’s own assumptions). |
The level classification is based on the lowest level input that is significant to the fair valuation measurement. The valuation inputs are not necessarily an indication of the risks associated with investing in these securities or other financial instruments.
The following is a summary of the level classifications as of period end. The Schedule of Investments provides additional information on the fund’s portfolio holdings.
| | Level 1 | Level 2 | Level 3 |
| Investment Securities | | | |
| Common Stocks | $143,497,285 | — | — |
| Temporary Cash Investments | 45,375 | $1,600,000 | — |
| Total Value of Investment Securities | $143,542,660 | $1,600,000 | — |
7. Risk Factors
The fund invests in common stocks of small companies. Because of this, it may be subject to greater risk and market fluctuations than a fund investing in larger, more established companies.
The fund’s investment process may involve high portfolio turnover, high commission costs and high capital gains distributions. In addition, its investment approach may involve higher volatility and risk.
8. Federal Tax Information
The book-basis character of distributions made during the year from net investment income or net realized gains may differ from their ultimate characterization for federal income tax purposes. These differences reflect the differing character of certain income items and net realized gains and losses for financial statement and tax purposes, and may result in reclassification among certain capital accounts on the financial statements. There were no distributions paid during the years ended October 31, 2010 and October 31, 2009.
As of October 31, 2010, the federal tax cost of investments and the components of distributable earnings on a tax-basis were as follows:
| Federal tax cost of investments | $121,885,021 |
| Gross tax appreciation of investments | $25,531,507 |
| Gross tax depreciation of investments | (2,273,868) |
| Net tax appreciation (depreciation) of investments | $23,257,639 |
| Undistributed ordinary income | — |
| Accumulated capital losses | $(66,626,564) |
The difference between book-basis and tax-basis cost and unrealized appreciation (depreciation) is attributable primarily to the tax deferral of losses on wash sales.
The accumulated capital losses represent net capital loss carryovers that may be used to offset future realized capital gains for federal income tax purposes. Future capital loss carryover utilization in any given year may be subject to Internal Revenue Code limitations. Capital loss carryovers of $(33,198,598) and $(33,427,966) expire in 2016 and 2017, respectively.
9. Corporate Event
As part of a long-standing estate and business succession plan established by James E. Stowers, Jr., the founder of American Century Investments, ACC Chairman Richard W. Brown succeeded Mr. Stowers as trustee of a trust that holds a greater-than-25% voting interest in ACC, the parent corporation of the fund’s advisor. Under the 1940 Act, this is presumed to represent control of ACC even though it is less than a majority interest. The change of trustee was considered a change of control of ACC and therefore also a change of control of the fund’s advisor even though there has been no change to its management and none is anticipated. The change of control resulted in the assignment of the fund’s investment advisory agreement. As required by the 1940 Act, the assignment automatically terminated such agreem ent, making the approval of a new agreement necessary.
On February 18, 2010, the Board of Directors approved an interim investment advisory agreement under which the fund was managed until a new agreement was approved. The new agreement for the fund was approved by the Board of Directors on March 29, 2010, and by shareholders at a Special Meeting of Shareholders on June 16, 2010. It went into effect on July 16, 2010. The new agreement, which is substantially identical to the terminated agreement (with the exception of different effective and termination dates), did not result in changes in the management of American Century Investments, the fund, its investment objectives, fees or services provided. Management agreements for new share classes that were launched after February 18, 2010 did not terminate, were not replaced by interim agreements, and did not require approval o f new agreements.
New Opportunities
| Investor Class |
| For a Share Outstanding Throughout the Years Ended October 31 |
| | 2010 | 2009 | 2008 | 2007 | 2006 |
| Per-Share Data |
| Net Asset Value, Beginning of Period | $5.06 | $5.12 | $8.58 | $6.44 | $5.63 |
| Income From Investment Operations | | | | | |
| Net Investment Income (Loss) | (0.04)(1) | (0.02)(1) | (0.05)(1) | (0.07) | (0.06) |
| Net Realized and Unrealized Gain (Loss) | 1.84 | (0.04) | (3.41) | 2.21 | 0.87 |
| Total From Investment Operations | 1.80 | (0.06) | (3.46) | 2.14 | 0.81 |
| Net Asset Value, End of Period | $6.86 | $5.06 | $5.12 | $8.58 | $6.44 |
| | | | | | |
Total Return(2) | 35.57% | (1.17)% | (40.33)% | 33.23% | 14.39% |
| | | | | | |
| Ratios/Supplemental Data |
Ratio of Operating Expenses to Average Net Assets | 1.51% | 1.50% | 1.50% | 1.50% | 1.50% |
Ratio of Net Investment Income (Loss) to Average Net Assets | (0.59)% | (0.51)% | (0.66)% | (0.83)% | (0.84)% |
| Portfolio Turnover Rate | 181% | 206% | 159% | 201% | 298% |
| Net Assets, End of Period (in thousands) | $146,747 | $119,287 | $146,932 | $270,428 | $247,876 |
| (1) | Computed using average shares outstanding throughout the period. |
| (2) | Total returns are calculated based on the net asset value of the last business day. Total returns for periods less than one year are not annualized. |
See Notes to Financial Statements.
New Opportunities
| Institutional Class |
| For a Share Outstanding Throughout the Years Ended October 31 (except as noted) |
| | 2010(1) |
| Per-Share Data |
| Net Asset Value, Beginning of Period | $6.07 |
| Income From Investment Operations | |
Net Investment Income (Loss)(2) | (0.01) |
| Net Realized and Unrealized Gain (Loss) | 0.81 |
| Total From Investment Operations | 0.80 |
| Net Asset Value, End of Period | $6.87 |
| | |
Total Return(3) | 13.18% |
| | |
| Ratios/Supplemental Data |
| Ratio of Operating Expenses to Average Net Assets | 1.31%(4) |
| Ratio of Net Investment Income (Loss) to Average Net Assets | (0.29)%(4) |
| Portfolio Turnover Rate | 181%(5) |
| Net Assets, End of Period (in thousands) | $28 |
| (1) | March 1, 2010 (commencement of sale) through October 31, 2010. |
| (2) | Computed using average shares outstanding throughout the period. |
| (3) | Total returns are calculated based on the net asset value of the last business day. Total returns for periods less than one year are not annualized. |
| (5) | Portfolio turnover is calculated at the fund level. Percentage indicated was calculated for the year ended October 31, 2010. |
See Notes to Financial Statements.
New Opportunities
| A Class |
| For a Share Outstanding Throughout the Years Ended October 31 (except as noted) |
| | 2010(1) |
| Per-Share Data |
| Net Asset Value, Beginning of Period | $6.07 |
| Income From Investment Operations | |
Net Investment Income (Loss)(2) | (0.03) |
| Net Realized and Unrealized Gain (Loss) | 0.81 |
| Total From Investment Operations | 0.78 |
| Net Asset Value, End of Period | $6.85 |
| | |
Total Return(3) | 12.85% |
| | |
| Ratios/Supplemental Data |
| Ratio of Operating Expenses to Average Net Assets | 1.76%(4) |
| Ratio of Net Investment Income (Loss) to Average Net Assets | (0.67)%(4) |
| Portfolio Turnover Rate | 181%(5) |
| Net Assets, End of Period (in thousands) | $121 |
| (1) | March 1, 2010 (commencement of sale) through October 31, 2010. |
| (2) | Computed using average shares outstanding throughout the period. |
| (3) | Total returns are calculated based on the net asset value of the last business day and do not reflect applicable sales charges. Total returns for periods less than one year are not annualized. |
| (5) | Portfolio turnover is calculated at the fund level. Percentage indicated was calculated for the year ended October 31, 2010. |
See Notes to Financial Statements.
New Opportunities
| C Class |
| For a Share Outstanding Throughout the Years Ended October 31 (except as noted) |
| | 2010(1) |
| Per-Share Data |
| Net Asset Value, Beginning of Period | $6.07 |
| Income From Investment Operations | |
Net Investment Income (Loss)(2) | (0.06) |
| Net Realized and Unrealized Gain (Loss) | 0.80 |
| Total From Investment Operations | 0.74 |
| Net Asset Value, End of Period | $6.81 |
| | |
Total Return(3) | 12.19% |
| | |
| Ratios/Supplemental Data |
| Ratio of Operating Expenses to Average Net Assets | 2.51%(4) |
| Ratio of Net Investment Income (Loss) to Average Net Assets | (1.46)%(4) |
| Portfolio Turnover Rate | 181%(5) |
| Net Assets, End of Period (in thousands) | $40 |
| (1) | March 1, 2010 (commencement of sale) through October 31, 2010. |
| (2) | Computed using average shares outstanding throughout the period. |
| (3) | Total returns are calculated based on the net asset value of the last business day and do not reflect applicable sales charges. Total returns for periods less than one year are not annualized. |
| (5) | Portfolio turnover is calculated at the fund level. Percentage indicated was calculated for the year ended October 31, 2010. |
See Notes to Financial Statements.
New Opportunities
| R Class |
| For a Share Outstanding Throughout the Years Ended October 31 (except as noted) |
| | 2010(1) |
| Per-Share Data |
| Net Asset Value, Beginning of Period | $6.07 |
| Income From Investment Operations | |
Net Investment Income (Loss)(2) | (0.04) |
| Net Realized and Unrealized Gain (Loss) | 0.81 |
| Total From Investment Operations | 0.77 |
| Net Asset Value, End of Period | $6.84 |
| | |
Total Return(3) | 12.69% |
| | |
| Ratios/Supplemental Data |
| Ratio of Operating Expenses to Average Net Assets | 2.01%(4) |
| Ratio of Net Investment Income (Loss) to Average Net Assets | (0.99)%(4) |
| Portfolio Turnover Rate | 181%(5) |
| Net Assets, End of Period (in thousands) | $29 |
| (1) | March 1, 2010 (commencement of sale) through October 31, 2010. |
| (2) | Computed using average shares outstanding throughout the period. |
| (3) | Total returns are calculated based on the net asset value of the last business day. Total returns for periods less than one year are not annualized. |
| (5) | Portfolio turnover is calculated at the fund level. Percentage indicated was calculated for the year ended October 31, 2010. |
See Notes to Financial Statements.
Report of Independent Registered Public Accounting Firm
The Board of Directors and Shareholders,
American Century Mutual Funds, Inc.:
We have audited the accompanying statement of assets and liabilities, including the schedule of investments, of New Opportunities Fund, one of the funds constituting American Century Mutual Funds, Inc. (the “Corporation”), as of October 31, 2010, and the related statement of operations for the year then ended, the statements of changes in net assets for each of the two years in the period then ended, and the financial highlights for each of the periods presented. These financial statements and financial highlights are the responsibility of the Corporation’s management. Our responsibility is to express an opinion on these financial statements and financial highlights based on our audits.
We conducted our audits in accordance with the standards of the Public Company Accounting Oversight Board (United States). Those standards require that we plan and perform the audit to obtain reasonable assurance about whether the financial statements and financial highlights are free of material misstatement. The Corporation is not required to have, nor were we engaged to perform, an audit of its internal control over financial reporting. Our audits included consideration of internal control over financial reporting as a basis for designing audit procedures that are appropriate in the circumstances, but not for the purpose of expressing an opinion on the effectiveness of the Corporation’s internal control over financial reporting. Accordingly, we express no such opinion. An audit also includes examining, on a te st basis, evidence supporting the amounts and disclosures in the financial statements, assessing the accounting principles used and significant estimates made by management, as well as evaluating the overall financial statement presentation. Our procedures included confirmation of securities owned as of October 31, 2010, by correspondence with the custodian and brokers; where replies were not received from brokers, we performed other auditing procedures. We believe that our audits provide a reasonable basis for our opinion.
In our opinion, the financial statements and financial highlights referred to above present fairly, in all material respects, the financial position of New Opportunities Fund of American Century Mutual Funds, Inc., as of October 31, 2010, the results of its operations for the year then ended, the changes in its net assets for each of the two years in the period then ended, and the financial highlights for each of the periods presented, in conformity with accounting principles generally accepted in the United States of America.
Deloitte & Touche LLP
Kansas City, Missouri
December 20, 2010
A special meeting of shareholders was held on June 16, 2010, to vote on the following proposals. Each proposal received the required number of votes and was adopted. A summary of voting results is listed below each proposal.
Proposal 1:
To elect one Director to the Board of Directors of American Century Mutual Funds, Inc. (the proposal was voted on by all shareholders of funds issued by American Century Mutual Funds, Inc.):
| | | | | |
| | John R. Whitten | For: | 13,907,426,552 | |
| | | Withhold: | 629,801,798 | |
| | | Abstain: | 0 | |
| | | Broker Non-Vote: | 0 | |
The other directors whose term of office continued after the meeting include Jonathan S. Thomas, Thomas A. Brown, Andrea C. Hall, James A. Olson, Donald H. Pratt, and M. Jeannine Strandjord.
Proposal 2:
To approve a management agreement between the fund and American Century Investment Management, Inc.:
| | | | | |
| | Investor Class | For: | 100,728,913 | |
| | | Against: | 2,011,501 | |
| | | Abstain: | 2,270,803 | |
| | | Broker Non-Vote: | 1,572,815 | |
Proposal 3:
To approve an amendment to the Articles of Incorporation to limit certain director liability to the extent permitted by Maryland law (the proposal was voted on by all shareholders of funds issued by American Century Mutual Funds, Inc.):
| | | | | |
| | | For: | 12,112,932,038 | |
| | | Against: | 769,504,652 | |
| | | Abstain: | 420,034,445 | |
| | | Broker Non-Vote: | 1,234,757,216 | |
The Board of Directors
The individuals listed below serve as directors of the fund. Each director will continue to serve in this capacity until death, retirement, resignation or removal from office. The mandatory retirement age for directors who are not “interested persons,” as that term is defined in the Investment Company Act (independent directors), is 72. However, the mandatory retirement age for an individual director may be extended with the approval of the remaining independent directors.
Mr. Thomas is the only director who is an “interested person” because he currently serves as President and Chief Executive Officer of American Century Companies, Inc. (ACC), the parent company of American Century Investment Management, Inc. (ACIM or the advisor).
The other directors (more than three-fourths of the total number) are independent; that is, they have never been employees, directors or officers of, and have no financial interest in, ACC or any of its wholly owned, direct or indirect, subsidiaries, including ACIM, American Century Investment Services, Inc. (ACIS) and American Century Services, LLC (ACS). The directors serve in this capacity for seven (in the case of Mr. Thomas, 15) registered investment companies in the American Century Investments family of funds.
The following presents additional information about the directors. The mailing address for each director is 4500 Main Street, Kansas City, Missouri 64111.
Independent Directors
Thomas A. Brown
Year of Birth: 1940
Position(s) with the Fund: Director
Length of Time Served: Since 1980
Principal Occupation(s) During the Past Five Years: Managing Member, Associated Investments, LLC (real estate investment company); Brown Cascade Properties, LLC (real estate investment company) (2001 to 2009)
Number of Funds in Fund Complex Overseen by Director: 61
Other Directorships Held by Director During the Past Five Years: None
Education/Other Professional Experience: BS in Mechanical Engineering, University of Kansas; formerly, Chief Executive Officer, Associated Bearings Company; formerly, Area Vice President, Applied Industrial Technologies (bearings and power transmission company)
Andrea C. Hall
Year of Birth: 1945
Position(s) with the Fund: Director
Length of Time Served: Since 1997
Principal Occupation(s) During the Past Five Years: Retired as advisor to the President, Midwest Research Institute (not-for-profit research organization) (June 2006)
Number of Funds in Fund Complex Overseen by Director: 61
Other Directorships Held by Director During the Past Five Years: None
Education/Other Professional Experience: BS in Biology, Florida State University; PhD in Biology, Georgetown University; formerly, Senior Vice President and Director of Research Operations, Midwest Research Institute
James A. Olson
Year of Birth: 1942
Position(s) with the Fund: Director
Length of Time Served: Since 2007
Principal Occupation(s) During the Past Five Years: Member, Plaza Belmont LLC (private equity fund manager); Chief Financial Officer, Plaza Belmont LLC (September 1999 to September 2006)
Number of Funds in Fund Complex Overseen by Director: 61
Other Directorships Held by Director During the Past Five Years: Saia, Inc. and Entertainment Properties Trust
Education/Other Professional Experience: BS in Business Administration and MBA, St. Louis University; CPA; 21 years of experience as a partner in the accounting firm of Ernst & Young LLP
Donald H. Pratt
Year of Birth: 1937
Position(s) with the Fund: Director, Chairman of the Board
Length of Time Served: Since 1995 (Chairman since 2005)
Principal Occupation(s) During the Past Five Years: Chairman and Chief Executive Officer, Western Investments, Inc. (real estate company)
Number of Funds in Fund Complex Overseen by Director: 61
Other Directorships Held by Director During the Past Five Years: None
Education/Other Professional Experience: BS in Industrial Engineering, Wichita State University; MBA, Harvard Business School; serves on the Board of Governors of the Independent Directors Council and Investment Company Institute; formerly, Chairman of the Board, Butler Manufacturing Company (metal buildings producer)
M. Jeannine Strandjord
Year of Birth: 1945
Position(s) with the Fund: Director
Length of Time Served: Since 1994
Principal Occupation(s) During the Past Five Years: Retired, formerly, Senior Vice President, Process Excellence, Sprint Corporation (telecommunications company) (January 2005 to September 2005)
Number of Funds in Fund Complex Overseen by Director: 61
Other Directorships Held by Director During the Past Five Years: DST Systems Inc., Euronet Worldwide Inc., Charming Shoppes, Inc.
Education/Other Professional Experience: BS in Business Administration and Accounting, University of Kansas; CPA; formerly, Senior Vice President of Financial Services and Treasurer and Chief Financial Officer, Global Markets Group; Sprint Corporation; formerly, with the accounting firm of Ernst and Whinney
John R. Whitten
Year of Birth: 1946
Position(s) with the Fund: Director
Length of Time Served: Since 2008
Principal Occupation(s) During the Past Five Years: Project Consultant, Celanese Corp. (industrial chemical company)
Number of Funds in Fund Complex Overseen by Director: 61
Other Directorships Held by Director During the Past Five Years: Rudolph Technologies, Inc.
Professional Education/Experience: BS in Business Administration, Cleveland State University; CPA; formerly, Chief Financial Officer and Treasurer, Applied Industrial Technologies, Inc.; thirteen years of experience with accounting firm Deloitte & Touche LLP
Interested Director
Jonathan S. Thomas
Year of Birth: 1963
Position(s) with the Fund: Director and President
Length of Time Served: Since 2007
Principal Occupation(s) During the Past Five Years: President and Chief Executive Officer, ACC (March 2007 to present); Chief Administrative Officer, ACC (February 2006 to February 2007); Executive Vice President, ACC (November 2005 to February 2007). Also serves as: Chief Executive Officer and Manager, ACS; Executive Vice President, ACIM; Director, ACC, ACIM and other ACC subsidiaries
Number of Funds in Fund Complex Overseen by Director: 101
Other Directorships Held by Director During the Past Five Years: None
Education/Other Professional Experience: BA in Economics, University of Massachusetts; MBA, Boston College; formerly held senior leadership roles with Fidelity Investments, Boston Financial Services, Bank of America and Morgan Stanley; serves on the Board of Governors of the Investment Company Institute
Officers
The following table presents certain information about the executive officers of the fund. Each officer serves as an officer for each of the 15 investment companies in the American Century family of funds, unless otherwise noted. No officer is compensated for his or her service as an officer of the fund. The listed officers are interested persons of the fund and are appointed or re-appointed on an annual basis. The mailing address for each of the officers listed below is 4500 Main Street, Kansas City, Missouri 64111.
| | Name (Year of Birth) | Offices with the Fund | Principal Occupation(s) During the Past Five Years |
| | Jonathan S. Thomas (1963) | Director and President since 2007 | President and Chief Executive Officer, ACC (March 2007 to present); Chief Administrative Officer, ACC (February 2006 to February 2007); Executive Vice President, ACC (November 2005 to February 2007). Also serves as: Chief Executive Officer and Manager, ACS; Executive Vice President, ACIM; Director, ACC, ACIM and other ACC subsidiaries |
| | Barry Fink (1955) | Executive Vice President since 2007 | Chief Operating Officer and Executive Vice President, ACC (September 2007 to present); President, ACS (October 2007 to present); Managing Director, Morgan Stanley (2000 to 2007); Global General Counsel, Morgan Stanley (2000 to 2006). Also serves as: Manager, ACS and Director, ACC and certain ACC subsidiaries |
| | Maryanne L. Roepke (1956) | Chief Compliance Officer since 2006 and Senior Vice President since 2000 | Chief Compliance Officer, American Century funds, ACIM and ACS (August 2006 to present); Assistant Treasurer, ACC (January 1995 to August 2006); and Treasurer and Chief Financial Officer, various American Century funds (July 2000 to August 2006). Also serves as: Senior Vice President, ACS |
| | Charles A. Etherington (1957) | General Counsel since 2007 and Senior Vice President since 2006 | Attorney, ACC (February 1994 to present); Vice President, ACC (November 2005 to present), General Counsel, ACC (March 2007 to present); Also serves as General Counsel, ACIM, ACS, ACIS and other ACC subsidiaries; and Senior Vice President, ACIM and ACS |
| | Robert J. Leach (1966) | Vice President, Treasurer and Chief Financial Officer since 2006 | Vice President, ACS (February 2000 to present); and Controller, various American Century funds (1997 to September 2006) |
| | David H. Reinmiller (1963) | Vice President since 2000 | Attorney, ACC (January 1994 to present); Associate General Counsel, ACC (January 2001 to present); Chief Compliance Officer, American Century funds and ACIM (January 2001 to February 2005). Also serves as Vice President, ACIM and ACS |
| | Ward D. Stauffer (1960) | Secretary since 2005 | Attorney, ACC (June 2003 to present) |
The Statement of Additional Information has additional information about the fund’s directors and is available without charge, upon request, by calling 1-800-345-2021.
Retirement Account Information
As required by law, distributions you receive from certain IRAs, or 403(b), 457 and qualified plans are subject to federal income tax withholding, unless you elect not to have withholding apply. Tax will be withheld on the total amount withdrawn even though you may be receiving amounts that are not subject to withholding, such as nondeductible contributions. In such case, excess amounts of withholding could occur. You may adjust your withholding election so that a greater or lesser amount will be withheld.
If you don’t want us to withhold on this amount, you must notify us to not withhold the federal income tax. You may notify us in writing or in certain situations by telephone or through other electronic means. You have the right to revoke your withholding election at any time and any election you make may remain in effect until revoked by filing a new election.
Remember, even if you elect not to have income tax withheld, you are liable for paying income tax on the taxable portion of your withdrawal. If you elect not to have income tax withheld or you don’t have enough income tax withheld, you may be responsible for payment of estimated tax. You may incur penalties under the estimated tax rules if your withholding and estimated tax payments are not sufficient. You can reduce or defer the income tax on a distribution by directly or indirectly rolling such distribution over to another IRA or eligible plan. You should consult your tax advisor for additional information.
State tax will be withheld if, at the time of your distribution, your address is within one of the mandatory withholding states and you have federal income tax withheld. State taxes will be withheld from your distribution in accordance with the respective state rules.
Proxy Voting Guidelines
American Century Investment Management, Inc., the fund’s investment advisor, is responsible for exercising the voting rights associated with the securities purchased and/or held by the fund. A description of the policies and procedures the advisor uses in fulfilling this responsibility is available without charge, upon request, by calling 1-800-345-2021. It is also available on American Century Investments’ website at americancentury.com and on the Securities and Exchange Commission’s website at sec.gov. Information regarding how the investment advisor voted proxies relating to portfolio securities during the most recent 12-month period ended June 30 is available on the “About Us” page at americancentury.co m. It is also available at sec.gov.
Quarterly Portfolio Disclosure
The fund files its complete schedule of portfolio holdings with the Securities and Exchange Commission (SEC) for the first and third quarters of each fiscal year on Form N-Q. The fund’s Form N-Q is available on the SEC’s website at sec.gov, and may be reviewed and copied at the SEC’s Public Reference Room in Washington, DC. Information on the operation of the Public Reference Room may be obtained by calling 1-800-SEC-0330. The fund also makes its complete schedule of portfolio holdings for the most recent quarter of its fiscal year available on its website at americancentury.com and, upon request, by calling 1-800-345-2021.
The following indices are used to illustrate investment market, sector, or style performance or to serve as fund performance comparisons. They are not investment products available for purchase.
The Russell 1000® Index is a market-capitalization weighted, large-cap index created by Frank Russell Company to measure the performance of the 1,000 largest publicly traded U.S. companies, based on total market capitalization.
The Russell 1000® Growth Index measures the performance of those Russell 1000 Index companies (the 1,000 largest publicly traded U.S. companies, based on total market capitalization) with higher price-to-book ratios and higher forecasted growth values.
The Russell 1000® Value Index measures the performance of those Russell 1000 Index companies (the 1,000 largest publicly traded U.S. companies, based on total market capitalization) with lower price-to-book ratios and lower forecasted growth values.
The Russell 2000® Index is a market-capitalization weighted index created by Frank Russell Company to measure the performance of the 2,000 smallest of the 3,000 largest publicly traded U.S. companies, based on total market capitalization.
The Russell 2000® Growth Index measures the performance of those Russell 2000 Index companies (the 2,000 smallest of the 3,000 largest publicly traded U.S. companies, based on total market capitalization) with higher price-to-book ratios and higher forecasted growth values.
The Russell 2000® Value Index measures the performance of those Russell 2000 Index companies (the 2,000 smallest of the 3,000 largest publicly traded U.S. companies, based on total market capitalization) with lower price-to-book ratios and lower forecasted growth values.
The Russell 2500® Growth Index measures the performance of those Russell 2500 Index companies (the 2,500 smallest of the 3,000 largest publicly traded U.S. companies, based on total market capitalization) with higher price-to-book ratios and higher forecasted growth values.
The Russell Midcap® Index measures the performance of the 800 smallest of the 1,000 largest publicly traded U.S. companies, based on total market capitalization.
The Russell Midcap® Growth Index measures the performance of those Russell Midcap Index companies (the 800 smallest of the 1,000 largest publicly traded U.S. companies, based on total market capitalization) with higher price-to-book ratios and higher forecasted growth values.
The Russell Midcap® Value Index measures the performance of those Russell Midcap Index companies (the 800 smallest of the 1,000 largest publicly traded U.S. companies, based on total market capitalization) with lower price-to-book ratios and lower forecasted growth values.
Notes
Notes
Notes
| |
| | |
| Contact Us | |
| | |
| americancentury.com | |
| | |
| Automated Information Line | 1-800-345-8765 |
| | |
| Investor Services Representative | 1-800-345-2021 or 816-531-5575 |
| | |
| Investors Using Advisors | 1-800-378-9878 |
| | |
| Business, Not-For-Profit, Employer-Sponsored Retirement Plans | 1-800-345-3533 |
| | |
| Banks and Trust Companies, Broker-Dealers, Financial Professionals, Insurance Companies | 1-800-345-6488 |
| | |
| Telecommunications Device for the Deaf | 1-800-634-4113 |
| | |
| American Century Mutual Funds, Inc. |
| |
Investment Advisor: American Century Investment Management, Inc. Kansas City, Missouri |
| |
| This report and the statements it contains are submitted for the general information of our shareholders. The report is not authorized for distribution to prospective investors unless preceded or accompanied by an effective prospectus. |
American Century Investment Services, Inc., Distributor
©2010 American Century Proprietary Holdings, Inc. All rights reserved.
| Annual Report |
| October 31, 2010 |
American Century Investments®
| | President’s Letter | 2 |
| | Independent Chairman’s Letter | 3 |
| | Market Perspective | 4 |
| | U.S. Stock Index Returns | 4 |
| | | |
| NT Vista |
| |
| | Performance | 5 |
| | Portfolio Commentary | 6 |
| | Top Ten Holdings | 8 |
| | Top Five Industries | 8 |
| | Types of Investments in Portfolio | 8 |
| | | |
| | Shareholder Fee Example | 9 |
| | | |
| Financial Statements |
| |
| | Schedule of Investments | 11 |
| | Statement of Assets and Liabilities | 14 |
| | Statement of Operations | 15 |
| | Statement of Changes in Net Assets | 16 |
| | Notes to Financial Statements | 17 |
| | Financial Highlights | 23 |
| | Report of Independent Registered Public Accounting Firm | 24 |
| | | |
| Other Information |
| |
| | Proxy Voting Results | 25 |
| | Management | 26 |
| | Additional Information | 30 |
| | Index Definitions | 31 |
Any opinions expressed in this report reflect those of the author as of the date of the report, and do not necessarily represent the opinions of American Century Investments or any other person in the American Century Investments organization. Any such opinions are subject to change at any time based upon market or other conditions and American Century Investments disclaims any responsibility to update such opinions. These opinions may not be relied upon as investment advice and, because investment decisions made by American Century Investments funds are based on numerous factors, may not be relied upon as an indication of trading intent on behalf of any American Century Investments fund. Security examples are used for representational purposes only and are not intended as recommendations to purchase or sell securities. Performance information for comparative indices and securities is provided to American Century Investments by third party vendors. To the best of American Century Investments’ knowledge, such information is accurate at the time of printing.
Jonathan Thomas
Dear Investor:
To learn more about the capital markets, your investment, and the portfolio management strategies American Century Investments provides, we encourage you to review this shareholder report for the financial reporting period ended October 31, 2010.
On the following pages, you will find investment performance and portfolio information, presented with the expert perspective and commentary of our portfolio management team. This report remains one of our most important vehicles for conveying the information you need about your investment performance, and about the market factors and strategies that affect fund returns. For additional information on the markets, we encourage you to visit the “Insights & News” tab at our Web site, americancentury.com, for updates and further expert commentary.
The top of our Web site’s home page also provides a link to “Our Story,” which, first and foremost, outlines our commitment—since 1958—to helping clients reach their financial goals. We believe strongly that we will only be successful when our clients are successful. That’s who we are.
Another important, unique facet of our story and who we are is “Profits with a Purpose,” which describes our bond with the Stowers Institute for Medical Research (SIMR). SIMR is a world-class biomedical organization—founded by our company founder James E. Stowers, Jr. and his wife Virginia—that is dedicated to researching the causes, treatment, and prevention of gene-based diseases, including cancer. Through American Century Investments’ private ownership structure, more than 40% of our profits support SIMR.
Mr. Stowers’ example of achieving financial success and using that platform to help humanity motivates our entire American Century Investments team. His story inspires us to help each of our clients achieve success. Thank you for sharing your financial journey with us.
Sincerely,
Jonathan Thomas
President and Chief Executive Officer
American Century Investments
Independent Chairman’s Letter
Don Pratt
Dear Fellow Shareholders,
As regulators and the markets continue to sort out the events of the credit crisis, a consistent theme has been that financial services firms should re-examine their risk management practices. Risk management has been a regular part of American Century Investments’ activities for many years. However, recently American Century and your mutual fund board have been spending additional time focusing on our risk oversight processes.
The board’s efforts are now organized around three categories of risk: investment risk, operational risk, and enterprise risk. This approach has facilitated a realignment of many risk oversight tasks that the board has historically conducted. Investment risk tasks include a review of portfolio risk, monitoring the use of derivatives, and performance assessment. Operational risk focuses on compliance, valuation, shareholder services, and trading activities. Enterprise risk addresses the financial condition of the advisor, human resource development, and reputational risks. Risk oversight tasks are addressed in every quarterly board meeting, and a review of the advisor’s entire risk management program is undertaken annually. We acknowledge and support the approach that American Century Investments takes to its risk management responsibilities. While the board has refocused its efforts in this important oversight area, we recognize that risk oversight is a journey and we expect to continue to improve our processes.
Our September quarterly board meeting was held in the New York offices of American Century Investments. This gave the directors an opportunity to meet with the portfolio management teams for each of the global and international funds overseen by the board. Each team uses sophisticated investment tools and daily risk analysis in managing client assets. We also were impressed with the “bench strength” that has been developed under the leadership of the Global and Non-U.S. Equity CIO Mark Kopinski. These face-to-face meetings provide an opportunity for the directors – working on behalf of shareholders – to validate the advisor’s efforts and the investment management approach being followed.
I thank you for your continued confidence in American Century during this turbulent time in the economy and investment markets. If you have thoughts or questions you would like to share with the board send them to me at dhpratt@fundboardchair.com.
Best regards,
Don Pratt
By David Hollond, Chief Investment Officer, U.S. Growth Equity—Mid & Small Cap
Stocks Rallied Amid Growing Volatility
U.S. stocks advanced for the 12 months ended October 31, 2010, as the broad equity indices posted double-digit gains. Virtually all of the market’s gains occurred in the first six months of the period, when stocks continued to climb after reaching a multi-year low in March 2009. The key factors behind the rally included favorable economic data, which provided evidence of a burgeoning recovery, and better-than-expected corporate earnings, which resulted largely from cost-cutting measures by many businesses to widen profit margins.
Market conditions changed abruptly in late April as evidence of a pullback in economic activity led to concerns about a relapse into recession. These concerns were amplified by a sovereign debt crisis in Greece that began to spread across Europe. In response, the equity market declined sharply throughout May and June as market volatility increased substantially.
The equity market remained volatile in the third quarter, gaining ground in July and falling back in August amid a tug-of-war between positive corporate earnings reports and an increasingly sluggish economic environment. However, stocks staged a resurgence during the final two months of the period as investors expressed confidence in the Federal Reserve’s plan to revive the economic recovery via another round of quantitative easing.
Small- and Mid-Cap Growth Stocks Outperformed
While stocks advanced across the board, the 12-month period was especially favorable for mid- and small-cap growth stocks. The small- and mid-cap segments of the market led the overall advance, returning more than 25% (see the table below). Smaller companies suffered the largest losses during the downturn in late 2008 and early 2009 and thus far have enjoyed the highest returns during the market’s recovery.
In addition, growth-oriented issues outpaced value shares across all market capitalizations. The best-performing sectors in the market were those traditionally associated with growth, such as information technology and consumer discretionary. In addition, the financials sector—a major component in value indices—underperformed during the period.
| U.S. Stock Index Returns |
| For the 12 months ended October 31, 2010 |
| Russell 1000 Index (Large-Cap) | 17.67% | | Russell 2000 Index (Small-Cap) | 26.58% |
| Russell 1000 Growth Index | 19.65% | | Russell 2000 Growth Index | 28.67% |
| Russell 1000 Value Index | 15.71% | | Russell 2000 Value Index | 24.43% |
| Russell Midcap Index | 27.71% | | | |
| Russell Midcap Growth Index | 28.03% | | | |
| Russell Midcap Value Index | 27.49% | | | |
NT Vista
| Total Returns as of October 31, 2010 |
| | | | Average Annual Returns | |
| | Ticker Symbol | 1 year | Since Inception | Inception Date |
| Institutional Class | ACLWX | 26.05% | -1.23% | 5/12/06 |
| Russell Midcap Growth Index | — | 28.03% | 1.52%(1) | — |
| (1) | Since 4/30/06, the date nearest the Institutional Class’s inception for which data are available. |
| Growth of $10,000 Over Life of Class |
| $10,000 investment made May 12, 2006 |
*From 5/12/06, the Institutional Class’s inception date. Index data from 4/30/06, the date nearest the Institutional Class’s inception for which data are available. Not annualized.
| Total Annual Fund Operating Expenses |
Institutional Class 0.81% |
The total annual fund operating expenses shown is as stated in the fund’s prospectus current as of the date of this report. The prospectus may vary from the expense ratio shown elsewhere in this report because it is based on a different time period, includes acquired fund fees and expenses, and, if applicable, does not include fee waivers or expense reimbursements.
Data presented reflect past performance. Past performance is no guarantee of future results. Current performance may be higher or lower than the performance shown. Investment return and principal value will fluctuate, and redemption value may be more or less than original cost. To obtain performance data current to the most recent month end, please call 1-800-345-2021 or visit americancentury.com. International investing involves special risks, such as political instability and currency fluctuations.
Data assumes reinvestment of dividends and capital gains, and none of the charts reflect the deduction of taxes that a shareholder would pay on fund distributions or the redemption of fund shares. Returns for the index are provided for comparison. The fund’s total returns include operating expenses (such as transaction costs and management fees) that reduce returns, while the total returns of the index do not.
NT Vista
Portfolio Managers: Brad Eixmann and Bryan Unterhalter
Performance Summary
NT Vista returned 26.05% for the 12 months ended October 31, 2010, compared with the 28.03% return of its benchmark, the Russell Midcap Growth Index.
As discussed in the Market Perspective on page 4, equity indices generally gained during the reporting period, as investors faced mixed economic and market data. Price momentum and acceleration, two factors that the NT Vista team looks for in portfolio holdings, were not rewarded consistently during the reporting period, although their margin of underperformance narrowed. Instead, lower quality stocks continued to drive market strength.
Within the portfolio, security selection in the financials, health care, and materials sectors accounted for the majority of underperformance relative to the benchmark. Effective stock choices in the information technology, energy, and consumer discretionary sectors partially offset those relative losses.
Financials Lagged Benchmark
The financials sector was NT Vista’s largest source of underperformance relative to its benchmark. Within the sector, a detrimental overweight stake in the capital markets industry included Jefferies Group, Inc. The company underperformed during the period due to a slowdown in its fixed income trading and investment banking operations. An overweight position in Lazard Ltd. also weighed on relative performance. Although the company’s earnings reflected improvement, unexpectedly higher compensation costs and a trust share sale overhang created underperformance.
Health Care, Materials Gained, but Lagged Benchmark
The health care sector was a source of underperformance relative to the benchmark, although it contributed positively to absolute returns. Within the sector, NT Vista did not own some of the stronger performers within the pharmaceutical and life science tools and services industries that contributed to benchmark returns for the sector. Within the health care provider industry group, NT Vista held a detrimental overweight position in Medco Health Solutions, Inc. The company experienced a share price decline in the period as concerns over industry contract pricing and competition surfaced.
Similarly, NT Vista’s holdings in the materials sector contributed to absolute gains, but collectively lagged the performance of the materials sector in the benchmark. Within the sector, NT Vista held a position in fertilizer company Mosaic Co. While volume growth of its products accelerated significantly, pricing was not as strong as some analysts had predicted and increases in key input costs weighed on margins.
Although an overweight allocation to the metals and mining industry helped absolute and relative returns, overweight stakes in mining company Freeport-McMoRan Copper & Gold, Inc., among others, detracted from relative performance. Benefiting from continued reports of global economic improvement and positive earnings releases, the company logged sound share price gains during the reporting period. However, its share price gain while it was held in the portfolio was more moderate.
Information Technology Helped
The information technology sector was a source of outperformance relative to the benchmark. In the communications equipment industry group, NT Vista held an overweight stake in networking company F5 Networks, which was the largest single contributor to relative gains. The company, whose products help optimize the performance of applications over IT networks, benefited from market share gains amid increasing complexity of data networks and strong mobile data growth. During the reporting period, F5 delivered earnings that were in excess of analysts’ expectations and increased guidance for future earnings. Elsewhere in the sector, effective stock selection in the IT services industry group also helped relative returns.
Energy, Consumer Discretionary Contributed
The energy sector contributed to absolute and relative portfolio gains. An overweight stake in onshore oil driller Whiting Petroleum, in particular, added significantly to gains, benefiting from a rotation to onshore drillers in the wake of the oil spill in the Gulf of Mexico.
Within the consumer discretionary sector, NT Vista held beneficial overweight positions in a number of companies in the hotels, restaurants, and leisure industry group, including Starwood Hotels & Resorts. The hotel chain experienced an upswing in revenues and earnings amid an industry-wide improvement in travel trends.
Outlook
Our investment process focuses on medium-sized and smaller companies with accelerating earnings growth rates and share-price momentum. We believe that active investing in such companies will generate outperformance over time compared with the Russell Midcap Growth Index.
This process, which has historically added value, has faced unprecedented headwinds during the market rally that began in March 2009. Based on historical trends, we believe we will move past this environment of extreme underperformance for stocks exhibiting price momentum and acceleration and into a period where fundamentals, and specifically fundamental improvement, is recognized and rewarded by the market. We are possibly witnessing the early stages of this positive shift in favor of our process as evidenced by improved recent performance.
NT Vista
| Top Ten Holdings |
| | % of net assets as of 10/31/10 |
| SBA Communications Corp., Class A | 2.5% |
| Dollar Tree, Inc. | 2.5% |
| F5 Networks, Inc. | 2.4% |
| O’Reilly Automotive, Inc. | 2.4% |
| priceline.com, Inc. | 2.1% |
| BE Aerospace, Inc. | 2.1% |
| Netflix, Inc. | 1.9% |
| Cummins, Inc. | 1.8% |
| salesforce.com, inc. | 1.6% |
| Royal Caribbean Cruises Ltd. | 1.5% |
| |
| Top Five Industries |
| | % of net assets as of 10/31/10 |
| Hotels, Restaurants & Leisure | 6.4% |
| Specialty Retail | 5.8% |
| Software | 5.6% |
| Machinery | 4.7% |
| Wireless Telecommunication Services | 4.6% |
| |
| Types of Investments in Portfolio |
| | % of net assets as of 10/31/10 |
| Domestic Common Stocks | 89.4% |
| Foreign Common Stocks* | 9.3% |
| Total Common Stocks | 98.7% |
| Temporary Cash Investments | 2.2% |
| Other Assets and Liabilities | (0.9)% |
*Includes depositary shares, dual listed securities and foreign ordinary shares.
Shareholder Fee Example (Unaudited)
Fund shareholders may incur two types of costs: (1) transaction costs, including sales charges (loads) on purchase payments and redemption/exchange fees; and (2) ongoing costs, including management fees; distribution and service (12b-1) fees; and other fund expenses. This example is intended to help you understand your ongoing costs (in dollars) of investing in your fund and to compare these costs with the ongoing cost of investing in other mutual funds.
The example is based on an investment of $1,000 made at the beginning of the period and held for the entire period from May 1, 2010 to October 31, 2010.
Actual Expenses
The table provides information about actual account values and actual expenses for each class. You may use the information, together with the amount you invested, to estimate the expenses that you paid over the period. First, identify the share class you own. Then simply divide your account value by $1,000 (for example, an $8,600 account value divided by $1,000 = 8.6), then multiply the result by the number under the heading “Expenses Paid During Period” to estimate the expenses you paid on your account during this period.
If you hold Investor Class shares of any American Century Investments fund, or Institutional Class shares of the American Century Diversified Bond Fund, in an American Century Investments account (i.e., not a financial intermediary or retirement plan account), American Century Investments may charge you a $12.50 semiannual account maintenance fee if the value of those shares is less than $10,000. We will redeem shares automatically in one of your accounts to pay the $12.50 fee. In determining your total eligible investment amount, we will include your investments in all personal accounts (including American Century Investments Brokerage accounts) registered under your Social Security number. Personal accounts include individual accounts, joint accounts, UGMA/UTMA accounts, personal trusts, Coverdell Education Savings Accounts and IRAs (including traditional, Roth, Rollover, SEP-, SARSEP- and SIMPLE-IRAs), and certain other retirement accounts. If you have only business, business retirement, employer-sponsored or American Century Investments Brokerage accounts, you are currently not subject to this fee. We will not charge the fee as long as you choose to manage your accounts exclusively online. If you are subject to the Account Maintenance Fee, your account value could be reduced by the fee amount.
Hypothetical Example for Comparison Purposes
The table also provides information about hypothetical account values and hypothetical expenses based on the actual expense ratio of each class of your fund and an assumed rate of return of 5% per year before expenses, which is not the actual return of a fund’s share class. The hypothetical account values and expenses may not be used to estimate the actual ending account balance or expenses you paid for the period. You may use this information to compare the ongoing costs of investing in your fund and other funds. To do so, compare this 5% hypothetical example with the 5% hypothetical examples that appear in the shareholder reports of the other funds.
Please note that the expenses shown in the table are meant to highlight your ongoing costs only and do not reflect any transactional costs, such as sales charges (loads) or redemption/exchange fees. Therefore, the table is useful in comparing ongoing costs only, and will not help you determine the relative total costs of owning different funds. In addition, if these transactional costs were included, your costs would have been higher.
| | Beginning Account Value 5/1/10 | Ending Account Value 10/31/10 | Expenses Paid During Period* 5/1/10 – 10/31/10 | Annualized Expense Ratio* |
| Actual | $1,000 | $1,039.60 | $4.11 | 0.80% |
| Hypothetical | $1,000 | $1,021.17 | $4.08 | 0.80% |
*Expenses are equal to the fund’s annualized expense ratio listed in the table above, multiplied by the average account value over the period, multiplied by 184, the number of days in the most recent fiscal half-year, divided by 365, to reflect the one-half year period.
| | | |
| | Shares | Value |
| Common Stocks — 98.7% |
| AEROSPACE & DEFENSE — 3.7% |
BE Aerospace, Inc.(1) | 90,517 | $ 3,327,405 |
| Goodrich Corp. | 11,700 | 960,219 |
TransDigm Group, Inc.(1) | 25,500 | 1,689,885 |
| | | 5,977,509 |
| AIR FREIGHT & LOGISTICS — 2.3% |
| C.H. Robinson Worldwide, Inc. | 30,700 | 2,163,736 |
| Expeditors International of Washington, Inc. | 31,000 | 1,530,160 |
| | | 3,693,896 |
| AIRLINES — 1.3% |
Alaska Air Group, Inc.(1) | 16,500 | 871,200 |
United Continental Holdings, Inc.(1) | 40,200 | 1,167,408 |
| | | 2,038,608 |
| AUTO COMPONENTS — 0.5% |
BorgWarner, Inc.(1) | 14,600 | 819,206 |
| AUTOMOBILES — 0.3% |
Brilliance China Automotive Holdings Ltd.(1) | 472,000 | 414,075 |
| BIOTECHNOLOGY — 1.0% |
Alexion Pharmaceuticals, Inc.(1) | 23,500 | 1,605,050 |
| CHEMICALS — 4.3% |
| Albemarle Corp. | 45,600 | 2,285,928 |
| CF Industries Holdings, Inc. | 18,300 | 2,242,299 |
| Cytec Industries, Inc. | 14,700 | 727,944 |
| Ecolab, Inc. | 15,200 | 749,664 |
| International Flavors & Fragrances, Inc. | 17,200 | 862,752 |
| | | 6,868,587 |
| COMMERCIAL SERVICES & SUPPLIES — 1.6% |
Stericycle, Inc.(1) | 22,100 | 1,585,454 |
| Waste Connections, Inc. | 24,900 | 1,014,426 |
| | | 2,599,880 |
| COMMUNICATIONS EQUIPMENT — 2.4% |
F5 Networks, Inc.(1) | 33,200 | 3,907,640 |
| COMPUTERS & PERIPHERALS — 1.8% |
Lexmark International, Inc., Class A(1) | 27,400 | 1,042,022 |
NetApp, Inc.(1) | 33,900 | 1,805,175 |
| | | 2,847,197 |
| CONSUMER FINANCE — 0.5% |
| Discover Financial Services | 45,900 | 810,135 |
| ELECTRICAL EQUIPMENT — 0.8% |
| Rockwell Automation, Inc. | 19,500 | 1,216,215 |
| ELECTRONIC EQUIPMENT, INSTRUMENTS & COMPONENTS — 1.6% |
Agilent Technologies, Inc.(1) | 23,000 | 800,400 |
Dolby Laboratories, Inc., Class A(1) | 28,700 | 1,770,216 |
| | | 2,570,616 |
| ENERGY EQUIPMENT & SERVICES — 2.8% |
Complete Production Services, Inc.(1) | 32,475 | 760,889 |
| Core Laboratories NV | 19,500 | 1,516,515 |
Dril-Quip, Inc.(1) | 11,700 | 808,470 |
FMC Technologies, Inc.(1) | 20,875 | 1,505,088 |
| | | 4,590,962 |
| FOOD & STAPLES RETAILING — 1.2% |
Whole Foods Market, Inc.(1) | 49,400 | 1,963,650 |
| FOOD PRODUCTS — 2.0% |
| H.J. Heinz Co. | 16,100 | 790,671 |
| Mead Johnson Nutrition Co. | 41,100 | 2,417,502 |
| | | 3,208,173 |
| HEALTH CARE EQUIPMENT & SUPPLIES — 2.0% |
| C.R. Bard, Inc. | 19,200 | 1,595,904 |
Varian Medical Systems, Inc.(1) | 26,300 | 1,662,686 |
| | | 3,258,590 |
| HEALTH CARE PROVIDERS & SERVICES — 2.6% |
| AmerisourceBergen Corp. | 40,500 | 1,329,210 |
Express Scripts, Inc.(1) | 41,800 | 2,028,136 |
Medco Health Solutions, Inc.(1) | 16,000 | 840,480 |
| | | 4,197,826 |
| HEALTH CARE TECHNOLOGY — 1.2% |
SXC Health Solutions Corp.(1) | 50,200 | 1,955,792 |
| HOTELS, RESTAURANTS & LEISURE — 6.4% |
Chipotle Mexican Grill, Inc.(1) | 7,500 | 1,576,575 |
Ctrip.com International Ltd. ADR(1) | 32,700 | 1,702,689 |
Home Inns & Hotels Management, Inc. ADR(1) | 15,000 | 767,400 |
Las Vegas Sands Corp.(1) | 39,700 | 1,821,436 |
Royal Caribbean Cruises Ltd.(1) | 61,500 | 2,431,710 |
| Starwood Hotels & Resorts Worldwide, Inc. | 38,700 | 2,095,218 |
| | | 10,395,028 |
| HOUSEHOLD PRODUCTS — 0.7% |
| Church & Dwight Co., Inc. | 18,100 | $ 1,191,885 |
| INTERNET & CATALOG RETAIL — 4.0% |
Netflix, Inc.(1) | 17,700 | 3,070,950 |
priceline.com, Inc.(1) | 9,200 | 3,466,652 |
| | | 6,537,602 |
| INTERNET SOFTWARE & SERVICES — 4.5% |
Akamai Technologies, Inc.(1) | 16,300 | 842,221 |
Baidu, Inc. ADR(1) | 20,400 | 2,244,204 |
MercadoLibre, Inc.(1) | 12,634 | 835,486 |
VeriSign, Inc.(1) | 57,000 | 1,980,750 |
WebMD Health Corp.(1) | 26,500 | 1,385,420 |
| | | 7,288,081 |
| IT SERVICES — 1.4% |
Cognizant Technology Solutions Corp., Class A(1) | 35,500 | 2,314,245 |
| LIFE SCIENCES TOOLS & SERVICES — 2.4% |
Illumina, Inc.(1) | 34,000 | 1,846,540 |
Life Technologies Corp.(1) | 16,500 | 827,970 |
Waters Corp.(1) | 16,500 | 1,223,145 |
| | | 3,897,655 |
| MACHINERY — 4.7% |
AGCO Corp.(1) | 28,900 | 1,227,383 |
ArvinMeritor, Inc.(1) | 69,000 | 1,144,020 |
| Cummins, Inc. | 33,800 | 2,977,780 |
| Dover Corp. | 22,500 | 1,194,750 |
| Timken Co. | 25,394 | 1,051,819 |
| | | 7,595,752 |
| MEDIA — 2.2% |
| CBS Corp., Class B | 45,100 | 763,543 |
Discovery Communications, Inc., Class A(1) | 23,300 | 1,039,413 |
Discovery Communications, Inc., Class C(1) | 16,875 | 655,763 |
Imax Corp.(1) | 49,700 | 1,076,005 |
| | | 3,534,724 |
| METALS & MINING — 1.9% |
| Cliffs Natural Resources, Inc. | 28,400 | 1,851,680 |
| Walter Energy, Inc. | 13,300 | 1,169,868 |
| | | 3,021,548 |
| MULTILINE RETAIL — 3.2% |
Dollar Tree, Inc.(1) | 78,350 | 4,020,138 |
| Family Dollar Stores, Inc. | 25,400 | 1,172,718 |
| | | 5,192,856 |
| OIL, GAS & CONSUMABLE FUELS — 3.3% |
Brigham Exploration Co.(1) | 37,100 | 782,439 |
Concho Resources, Inc.(1) | 32,200 | 2,211,174 |
| Pioneer Natural Resources Co. | 11,800 | 823,640 |
Whiting Petroleum Corp.(1) | 15,100 | 1,516,644 |
| | | 5,333,897 |
| PHARMACEUTICALS — 1.3% |
Salix Pharmaceuticals Ltd.(1) | 23,700 | 896,571 |
| Shire plc | 50,700 | 1,195,028 |
| | | 2,091,599 |
| REAL ESTATE INVESTMENT TRUSTS (REITs) — 2.0% |
| AvalonBay Communities, Inc. | 11,400 | 1,211,934 |
| Digital Realty Trust, Inc. | 19,500 | 1,164,735 |
| DuPont Fabros Technology, Inc. | 31,100 | 780,610 |
| | | 3,157,279 |
| REAL ESTATE MANAGEMENT & DEVELOPMENT — 1.7% |
CB Richard Ellis Group, Inc., Class A(1) | 75,400 | 1,383,590 |
| Jones Lang LaSalle, Inc. | 17,700 | 1,381,662 |
| | | 2,765,252 |
| ROAD & RAIL — 1.3% |
| J.B. Hunt Transport Services, Inc. | 21,500 | 773,140 |
Kansas City Southern(1) | 29,900 | 1,310,218 |
| | | 2,083,358 |
| SEMICONDUCTORS & SEMICONDUCTOR EQUIPMENT — 4.2% |
| Altera Corp. | 41,100 | 1,282,731 |
| ARM Holdings plc | 278,100 | 1,618,914 |
Cavium Networks, Inc.(1) | 43,200 | 1,376,784 |
Skyworks Solutions, Inc.(1) | 70,400 | 1,612,864 |
Veeco Instruments, Inc.(1) | 21,300 | 891,405 |
| | | 6,782,698 |
| SOFTWARE — 5.6% |
Citrix Systems, Inc.(1) | 35,200 | 2,255,264 |
Intuit, Inc.(1) | 25,000 | 1,200,000 |
Rovi Corp.(1) | 40,700 | 2,061,455 |
salesforce.com, inc.(1) | 22,100 | 2,565,147 |
VanceInfo Technologies, Inc. ADR(1) | 25,000 | 909,250 |
| | | 8,991,116 |
| SPECIALTY RETAIL — 5.8% |
AutoZone, Inc.(1) | 4,700 | 1,116,861 |
O’Reilly Automotive, Inc.(1) | 65,300 | 3,820,050 |
| PetSmart, Inc. | 54,010 | 2,021,594 |
| Williams-Sonoma, Inc. | 71,800 | 2,324,166 |
| | | 9,282,671 |
| TEXTILES, APPAREL & LUXURY GOODS — 2.1% |
Fossil, Inc.(1) | 24,200 | $ 1,427,558 |
Lululemon Athletica, Inc.(1) | 18,600 | 824,352 |
| Phillips-Van Heusen Corp. | 18,100 | 1,110,254 |
| | | 3,362,164 |
| TRADING COMPANIES & DISTRIBUTORS — 1.5% |
| Fastenal Co. | 30,200 | 1,554,696 |
| W.W. Grainger, Inc. | 6,600 | 818,598 |
| | | 2,373,294 |
| WIRELESS TELECOMMUNICATION SERVICES — 4.6% |
American Tower Corp., Class A(1) | 31,200 | 1,610,232 |
NII Holdings, Inc.(1) | 44,300 | 1,852,183 |
SBA Communications Corp., Class A(1) | 102,702 | 4,032,081 |
| | | 7,494,496 |
TOTAL COMMON STOCKS (Cost $126,138,863) | 159,230,807 |
| Temporary Cash Investments — 2.2% |
| JPMorgan U.S. Treasury Plus Money Market Fund Agency Shares | 87,882 | $ 87,882 |
Repurchase Agreement, Credit Suisse First Boston, Inc., (collateralized by various U.S. Treasury obligations, 1.00%, 3/31/12, valued at $3,467,991), in a joint trading account at 0.16%, dated 10/29/10, due 11/1/10 (Delivery value $3,400,045) | 3,400,000 |
TOTAL TEMPORARY CASH INVESTMENTS (Cost $3,487,882) | 3,487,882 |
TOTAL INVESTMENT SECURITIES — 100.9% (Cost $129,626,745) | 162,718,689 |
| OTHER ASSETS AND LIABILITIES — (0.9)% | (1,415,104) |
| TOTAL NET ASSETS — 100.0% | $161,303,585 |
| Forward Foreign Currency Exchange Contracts |
| Contracts to Sell | Counterparty | Settlement Date | Value | Unrealized Gain (Loss) |
| 1,138,402 | GBP for USD | Bank of America | 11/30/10 | $1,823,800 | $(27,401) |
(Value on Settlement Date $1,796,399)
Notes to Schedule of Investments
ADR = American Depositary Receipt
GBP = British Pound
USD = United States Dollar
See Notes to Financial Statements.
Statement of Assets and Liabilities
| OCTOBER 31, 2010 |
| Assets |
| Investment securities, at value (cost of $129,626,745) | $162,718,689 |
| Receivable for investments sold | 1,886,837 |
| Dividends and interest receivable | 34,723 |
| | 164,640,249 |
| | |
| Liabilities | |
| Payable for investments purchased | 3,043,072 |
| Payable for capital shares redeemed | 160,040 |
| Unrealized loss on forward foreign currency exchange contracts | 27,401 |
| Accrued management fees | 106,151 |
| | 3,336,664 |
| | |
| Net Assets | $161,303,585 |
| | |
| Institutional Class Capital Shares, $0.01 Par Value |
| Shares authorized | 150,000,000 |
| Shares outstanding | 17,081,806 |
| | |
| Net Asset Value Per Share | $9.44 |
| | |
| Net Assets Consist of: |
| Capital (par value and paid-in surplus) | $137,161,585 |
| Undistributed net investment income | 25,905 |
| Accumulated net realized loss | (8,949,421) |
| Net unrealized appreciation | 33,065,516 |
| | $161,303,585 |
See Notes to Financial Statements.
| YEAR ENDED OCTOBER 31, 2010 |
| Investment Income (Loss) |
| Income: | |
| Dividends (net of foreign taxes withheld of $2,649) | $ 678,502 |
| Interest | 3,972 |
| | 682,474 |
| | |
| Expenses: | |
| Management fees | 999,873 |
| Directors’ fees and expenses | 3,731 |
| Other expenses | 1,010 |
| | 1,004,614 |
| | |
| Net investment income (loss) | (322,140) |
| | |
| Realized and Unrealized Gain (Loss) |
| Net realized gain (loss) on: | |
| Investment transactions | 8,529,265 |
| Foreign currency transactions | (36,302) |
| | 8,492,963 |
| | |
| Change in net unrealized appreciation (depreciation) on: | |
| Investments | 21,762,239 |
| Translation of assets and liabilities in foreign currencies | (27,092) |
| | 21,735,147 |
| | |
| Net realized and unrealized gain (loss) | 30,228,110 |
| | |
| Net Increase (Decrease) in Net Assets Resulting from Operations | $29,905,970 |
See Notes to Financial Statements.
Statement of Changes in Net Assets
| YEARS ENDED OCTOBER 31, 2010 AND OCTOBER 31, 2009 |
| Increase (Decrease) in Net Assets | 2010 | 2009 |
| Operations |
| Net investment income (loss) | $ (322,140) | $ (229,807) |
| Net realized gain (loss) | 8,492,963 | (11,458,592) |
| Change in net unrealized appreciation (depreciation) | 21,735,147 | 13,715,758 |
| Net increase (decrease) in net assets resulting from operations | 29,905,970 | 2,027,359 |
| | | |
| Distributions to Shareholders |
| From net investment income | (11,506) | — |
| | | |
| Capital Share Transactions | | |
| Proceeds from shares sold | 46,264,949 | 56,403,239 |
| Payments for shares redeemed | (6,092,543) | (7,329,572) |
| Net increase (decrease) in net assets from capital share transactions | 40,172,406 | 49,073,667 |
| | | |
| Net increase (decrease) in net assets | 70,066,870 | 51,101,026 |
| | | |
| Net Assets |
| Beginning of period | 91,236,715 | 40,135,689 |
| End of period | $161,303,585 | $ 91,236,715 |
| | | |
| Undistributed net investment income | $25,905 | — |
| | | |
| Transactions in Shares of the Fund |
| Sold | 5,628,784 | 7,996,150 |
| Redeemed | (719,862) | (1,091,260) |
| Net increase (decrease) in shares of the fund | 4,908,922 | 6,904,890 |
See Notes to Financial Statements.
Notes to Financial Statements
OCTOBER 31, 2010
1. Organization
American Century Mutual Funds, Inc. (the corporation) is registered under the Investment Company Act of 1940 (the 1940 Act) as an open-end management investment company and is organized as a Maryland corporation. NT Vista Fund (the fund) is one fund in a series issued by the corporation. The fund is diversified as defined under the 1940 Act. The fund’s investment objective is to seek long-term capital growth. The fund pursues its objective by investing primarily in equity securities of companies that are medium-sized and smaller at the time of purchase that management believes will increase in value. The fund is not permitted to invest in any securities issued by companies assigned the Global Industry Classification Standard for the tobacco industry.
2. Significant Accounting Policies
The following is a summary of significant accounting policies consistently followed by the fund in preparation of its financial statements. The financial statements are prepared in conformity with accounting principles generally accepted in the United States of America, which may require management to make certain estimates and assumptions at the date of the financial statements. Actual results could differ from these estimates.
Investment Valuations — The fund determines the fair value of its investments and computes its net asset value per share as of the close of regular trading (usually 4 p.m. Eastern time) on the New York Stock Exchange (NYSE) on each day the NYSE is open.
Equity securities that are listed or traded on a domestic securities exchange are valued at the last reported sales price or at the official closing price as provided by the exchange. Equity securities traded on foreign securities exchanges are typically valued at the closing price on the exchange where primarily traded or as of the close of the NYSE, if that is earlier. If no last sales price is reported, or if local convention or regulation so provides, the mean of the latest bid and asked prices is used. Depending on local convention or regulation, securities traded over-the-counter are valued at the mean of the latest bid and asked prices, the last sales price, or the official closing price. In its determination of fair value, the fund may review several factors including: market information specific to a security; news developments in U.S. and foreign markets; the performance of particular U.S. and foreign securities, indices, comparable securities, American Depositary Receipts, Exchange Traded Funds, and other relevant market indicators.
Debt securities maturing within 60 days at the time of purchase may be valued at cost, plus or minus any amortized discount or premium or at the evaluated mean as provided by an independent pricing service. Evaluated mean prices are commonly derived through utilization of market models, which may consider, among other factors, trade data, quotations from dealers and active market makers, relevant yield curve and spread data, related sector levels, creditworthiness, and other relevant market information on the same or comparable securities.
Investments in open-end management investment companies are valued at the reported net asset value per share. Repurchase agreements are valued at cost. Forward foreign currency exchange contracts are valued at the mean of the latest bid and asked prices of the forward currency rates as provided by an independent pricing service.
The value of investments initially expressed in foreign currencies is translated into U.S. dollars at prevailing exchange rates.
If the fund determines that the market price for a portfolio security is not readily available or the valuation methods mentioned above do not reflect a security’s fair value, such security is valued as determined in good faith by the Board of Directors or its designee, in accordance with procedures adopted by the Board of Directors. Circumstances that may cause the fund to use these procedures to value a security include, but are not limited to:
a security has been declared in default; trading in a security has been halted during the trading day; there is a foreign market holiday and no trading occurred; or an event occurred between the close of a foreign exchange and the NYSE that may affect the value of a security.
Security Transactions — Security transactions are accounted for as of the trade date. Net realized gains and losses are determined on the identified cost basis, which is also used for federal income tax purposes.
Investment Income — Dividend income less foreign taxes withheld, if any, is recorded as of the ex-dividend date. Interest income is recorded on the accrual basis and includes accretion of discounts and amortization of premiums.
Foreign Currency Translations — All assets and liabilities initially expressed in foreign currencies are translated into U.S. dollars at prevailing exchange rates at period end. The fund may enter into spot foreign currency exchange contracts to facilitate transactions denominated in a foreign currency. Purchases and sales of investment securities, dividend and interest income, spot foreign currency exchange contracts, and expenses are translated at the rates of exchange prevailing on the respective dates of such transactions. Net realized and unrealized foreign currency exchange gains or losses related to investment securities are a component of net realized gain (loss) on investment transactions and net unrealized appreciation (depreciation) on investments, respectively.
Repurchase Agreements — The fund may enter into repurchase agreements with institutions that American Century Investment Management, Inc. (ACIM) (the investment advisor) has determined are creditworthy pursuant to criteria adopted by the Board of Directors. The fund requires that the collateral, represented by securities, received in a repurchase transaction be transferred to the custodian in a manner sufficient to enable the fund to obtain those securities in the event of a default under the repurchase agreement. ACIM monitors, on a daily basis, the securities transferred to ensure the value, including accrued interest, of the securities under each repurchase agreement is equal to or greater than amounts owed to the fund under each repurchase agreement.
Joint Trading Account — Pursuant to an Exemptive Order issued by the Securities and Exchange Commission, the fund, along with certain other funds in the American Century Investments family of funds, may transfer uninvested cash balances into a joint trading account. These balances are invested in one or more repurchase agreements that are collateralized by U.S. Treasury or Agency obligations.
Income Tax Status — It is the fund’s policy to distribute substantially all net investment income and net realized gains to shareholders and to otherwise qualify as a regulated investment company under provisions of the Internal Revenue Code. The fund is no longer subject to examination by tax authorities for years prior to 2007. Additionally, non-U.S. tax returns filed by the fund due to investments in certain foreign securities remain subject to examination by the relevant taxing authority for 7 years from the date of filing. At this time, management believes there are no uncertain tax positions which, based on their technical merit, would not be sustained upon examination and for which it is reasonably possible that the total amounts of unrecognized tax benefits will significantly change in the next twelve months. Accordingly, no provision has been made for federal or state income taxes.
Distributions to Shareholders — Distributions to shareholders are recorded on the ex-dividend date. Distributions from net investment income and net realized gains, if any, are generally declared and paid annually.
Indemnifications — Under the corporation’s organizational documents, its officers and directors are indemnified against certain liabilities arising out of the performance of their duties to the fund. In addition, in the normal course of business, the fund enters into contracts that provide general indemnifications. The maximum exposure under these arrangements is unknown as this would involve future claims that may be made against a fund. The risk of material loss from such claims is considered by management to be remote.
3. Fees and Transactions with Related Parties
Management Fees — The corporation has entered into a management agreement with ACIM, under which ACIM provides the fund with investment advisory and management services in exchange for a single, unified management fee (the fee). The agreement provides that all expenses of managing and operating the fund, except distribution and service fees, brokerage expenses, taxes, interest, fees and expenses of the independent directors (including legal counsel fees), and extraordinary expenses, will be paid by ACIM. The fee is computed and accrued daily based on the daily net assets of the fund and paid monthly in arrears. The annual management fee is 0.80%.
Related Parties — Certain officers and directors of the corporation are also officers and/or directors of American Century Companies, Inc. (ACC), the parent of the corporation’s investment advisor, ACIM, the distributor of the corporation, American Century Investment Services, Inc., and the corporation’s transfer agent, American Century Services, LLC. The fund is wholly owned, in aggregate, by various funds in a series issued by American Century Asset Allocation Portfolios, Inc. (ACAAP). ACAAP does not invest in the fund for the purpose of exercising management or control.
The fund is eligible to invest in a money market fund for temporary purposes, which is managed by J.P. Morgan Investment Management, Inc. (JPMIM). The fund has a mutual funds services agreement with J.P. Morgan Investor Services Co. (JPMIS). JPMorgan Chase Bank (JPMCB) is a custodian of the fund. JPMIM, JPMIS and JPMCB are wholly owned subsidiaries of JPMorgan Chase & Co. (JPM). JPM is an equity investor in ACC.
4. Investment Transactions
Purchases and sales of investment securities, excluding short-term investments, for the year ended October 31, 2010, were $223,595,662 and $183,054,921, respectively.
5. Fair Value Measurements
The fund’s securities valuation process is based on several considerations and may use multiple inputs to determine the fair value of the positions held by the fund. In conformity with accounting principles generally accepted in the United States of America, the inputs used to determine a valuation are classified into three broad levels as follows:
| • | Level 1 valuation inputs consist of unadjusted quoted prices in an active market for identical securities; |
| • | Level 2 valuation inputs consist of direct or indirect observable market data (including quoted prices for similar securities, evaluations of subsequent market events, interest rates, prepayment speeds, credit risk, etc.); or |
| • | Level 3 valuation inputs consist of unobservable data (including a fund’s own assumptions). |
The level classification is based on the lowest level input that is significant to the fair valuation measurement. The valuation inputs are not necessarily an indication of the risks associated with investing in these securities or other financial instruments.
The following is a summary of the level classifications as of period end. The Schedule of Investments provides additional information on the fund’s portfolio holdings.
| | Level 1 | Level 2 | Level 3 |
| Investment Securities |
| Domestic Common Stocks | $144,171,097 | — | — |
| Foreign Common Stocks | 11,831,693 | $3,228,017 | — |
| Temporary Cash Investments | 87,882 | 3,400,000 | — |
| Total Value of Investment Securities | $156,090,672 | $6,628,017 | — |
| |
| Other Financial Instruments |
Total Unrealized Gain (Loss) on Forward Foreign Currency Exchange Contracts | — | $(27,401) | — |
6. Derivative Instruments
Foreign Currency Risk — The fund is subject to foreign currency exchange rate risk in the normal course of pursuing its investment objectives. The value of foreign investments held by a fund may be significantly affected by changes in foreign currency exchange rates. The dollar value of a foreign security generally decreases when the value of the dollar rises against the foreign currency in which the security is denominated and tends to increase when the value of the dollar declines against such foreign currency. A fund may enter into forward foreign currency exchange contracts to reduce a fund’s exposure to foreign currency exchange rate fluctuations. The net U.S. dollar value of foreign currency underlying all contractual commitments held by a fund and the resulting unrealized appreciation or depreciation are determined daily using prevailing exchange rates. Realized gain or loss is recorded upon the termination of the contract. Net realized and unrealized gains or losses occurring during the holding period of forward foreign currency exchange contracts are a component of net realized gain (loss) on foreign currency transactions and change in net unrealized appreciation (depreciation) on translation of assets and liabilities in foreign currencies, respectively. A fund bears the risk of an unfavorable change in the foreign currency exchange rate underlying the forward contract. Additionally, losses, up to the fair value, may arise if the counterparties do not perform under the contract terms. The risk of loss from non-performance by the counterparty may be reduced by the use of master netting agreements. The foreign currency risk derivative instruments held at period end as disclosed on the Schedule of Investments are indicative of the fund’s typical volume during the period.
The value of foreign currency risk derivative instruments as of October 31, 2010, is disclosed on the Statement of Assets and Liabilities as a liability of $27,401 in unrealized loss on forward foreign currency exchange contracts. For the year ended October 31, 2010, the effect of foreign currency risk derivative instruments on the Statement of Operations was $(37,515) in net realized gain (loss) on foreign currency transactions and $(27,401) in change in net unrealized appreciation (depreciation) on translation of assets and liabilities in foreign currencies.
7. Risk Factors
There are certain risks involved in investing in foreign securities. These risks include those resulting from future adverse political, social, and economic developments, fluctuations in currency exchange rates, the possible imposition of exchange controls, and other foreign laws or restrictions.
8. Federal Tax Information
The tax character of distributions paid during the years ended October 31, 2010 and October 31, 2009 were as follows:
| | 2010 | 2009 |
| Distributions Paid From |
| Ordinary income | $11,506 | — |
| Long-term capital gains | — | — |
The book-basis character of distributions made during the year from net investment income or net realized gains may differ from their ultimate characterization for federal income tax purposes. These differences reflect the differing character of certain income items and net realized gains and losses for financial statement and tax purposes, and may result in reclassification among certain capital accounts on the financial statements.
As of October 31, 2010, the federal tax cost of investments and the components of distributable earnings on a tax-basis were as follows:
| Federal tax cost of investments | $130,117,823 |
| Gross tax appreciation of investments | $32,835,824 |
| Gross tax depreciation of investments | (234,958) |
| Net tax appreciation (depreciation) of investments | $32,600,866 |
Net tax appreciation (depreciation) on derivatives and translation of assets and liabilities in foreign currencies | $(523) |
| Net tax appreciation (depreciation) | $32,600,343 |
| Undistributed ordinary income | — |
| Accumulated capital losses | $(8,458,343) |
The difference between book-basis and tax-basis cost and unrealized appreciation (depreciation) is attributable primarily to the tax deferral of losses on wash sales.
The accumulated capital losses represent net capital loss carryovers that may be used to offset future realized capital gains for federal income tax purposes. Future capital loss carryover utilization in any given year may be subject to Internal Revenue Code limitations. Capital loss carryovers expire in 2017.
9. Corporate Event
As part of a long-standing estate and business succession plan established by James E. Stowers, Jr., the founder of American Century Investments, ACC Chairman Richard W. Brown succeeded Mr. Stowers as trustee of a trust that holds a greater-than-25% voting interest in ACC, the parent corporation of the fund’s advisor. Under the 1940 Act, this is presumed to represent control of ACC even though it is less than a majority interest. The change of trustee was considered a change of control of ACC and therefore also a change of control of the fund’s advisor even though there has been no change to its management and none is anticipated. The change of control resulted in the assignment of the fund’s investment advisory agreement. As required by the 1940 Act, the assignment automatically terminated such agreem ent, making the approval of a new agreement necessary.
On February 18, 2010, the Board of Directors approved an interim investment advisory agreement under which the fund was managed until a new agreement was approved. The new agreement for the fund was approved by the Board of Directors on March 29, 2010, and by shareholders at a Special Meeting of Shareholders on June 16, 2010. It went into effect on July 16, 2010. The new agreement, which is substantially identical to the terminated agreement (with the exception of different effective and termination dates), did not result in changes in the management of American Century Investments, the fund, its investment objectives, fees or services provided.
10. Other Tax Information (Unaudited)
The following information is provided pursuant to provisions of the Internal Revenue Code.
The fund hereby designates up to the maximum amount allowable as qualified dividend income for the fiscal year ended October 31, 2010.
For corporate taxpayers, the fund hereby designates $11,506, or up to the maximum amount allowable, of ordinary income distributions paid during the fiscal year ended October 31, 2010 as qualified for the corporate dividends received deduction.
NT Vista
| Institutional Class |
| For a Share Outstanding Throughout the Years Ended October 31 (except as noted) |
| | 2010 | 2009 | 2008 | 2007 | 2006(1) |
| Per-Share Data |
| Net Asset Value, Beginning of Period | $7.50 | $7.62 | $13.42 | $9.00 | $10.00 |
| Income From Investment Operations | | | | | |
| Net Investment Income (Loss) | (0.02)(2) | (0.02)(2) | (0.04)(2) | (0.04) | (0.01) |
| Net Realized and Unrealized Gain (Loss) | 1.96 | (0.10) | (5.73) | 4.46 | (0.99) |
| Total From Investment Operations | 1.94 | (0.12) | (5.77) | 4.42 | (1.00) |
| Distributions | | | | | |
| From Net Investment Income | —(3) | — | — | — | — |
| From Net Realized Gains | — | — | (0.03) | — | — |
| Total Distributions | —(3) | — | (0.03) | — | — |
| Net Asset Value, End of Period | $9.44 | $7.50 | $7.62 | $13.42 | $9.00 |
| | | | | | |
Total Return(4) | 26.05% | (1.71)% | (43.09)% | 49.11% | (10.00)% |
| | | | | | |
| Ratios/Supplemental Data |
Ratio of Operating Expenses to Average Net Assets | 0.80% | 0.80% | 0.81% | 0.80% | 0.80%(5) |
Ratio of Net Investment Income (Loss) to Average Net Assets | (0.26)% | (0.35)% | (0.35)% | (0.36)% | (0.27)%(5) |
| Portfolio Turnover Rate | 152% | 190% | 183% | 147% | 109% |
| Net Assets, End of Period (in thousands) | $161,304 | $91,237 | $40,136 | $44,652 | $25,678 |
| (1) | May 12, 2006 (fund inception) through October 31, 2006. |
| (2) | Computed using average shares outstanding throughout the period. |
| (3) | Per-share amount was less than $0.005. |
| (4) | Total returns are calculated based on the net asset value of the last business day. Total returns for periods less than one year are not annualized. |
See Notes to Financial Statements.
Report of Independent Registered Public Accounting Firm
The Board of Directors and Shareholders,
American Century Mutual Funds, Inc.:
We have audited the accompanying statement of assets and liabilities, including the schedule of investments, of NT Vista Fund, one of the funds constituting American Century Mutual Funds, Inc. (the “Corporation”), as of October 31, 2010, and the related statement of operations for the year then ended, the statements of changes in net assets for each of the two years in the period then ended, and the financial highlights for each of the periods presented. These financial statements and financial highlights are the responsibility of the Corporation’s management. Our responsibility is to express an opinion on these financial statements and financial highlights based on our audits.
We conducted our audits in accordance with the standards of the Public Company Accounting Oversight Board (United States). Those standards require that we plan and perform the audit to obtain reasonable assurance about whether the financial statements and financial highlights are free of material misstatement. The Corporation is not required to have, nor were we engaged to perform, an audit of its internal control over financial reporting. Our audits included consideration of internal control over financial reporting as a basis for designing audit procedures that are appropriate in the circumstances, but not for the purpose of expressing an opinion on the effectiveness of the Corporation’s internal control over financial reporting. Accordingly, we express no such opinion. An audit also includes examining, on a te st basis, evidence supporting the amounts and disclosures in the financial statements, assessing the accounting principles used and significant estimates made by management, as well as evaluating the overall financial statement presentation. Our procedures included confirmation of securities owned as of October 31, 2010, by correspondence with the custodian and brokers; where replies were not received from brokers, we performed other auditing procedures. We believe that our audits provide a reasonable basis for our opinion.
In our opinion, the financial statements and financial highlights referred to above present fairly, in all material respects, the financial position of NT Vista Fund of American Century Mutual Funds, Inc., as of October 31, 2010, the results of its operations for the year then ended, the changes in its net assets for each of the two years in the period then ended, and the financial highlights for each of the periods presented, in conformity with accounting principles generally accepted in the United States of America.
Deloitte & Touche LLP
Kansas City, Missouri
December 20, 2010
A special meeting of shareholders was held on June 16, 2010, to vote on the following proposals. Each proposal received the required number of votes and was adopted. A summary of voting results is listed below each proposal.
Proposal 1:
To elect one Director to the Board of Directors of American Century Mutual Funds, Inc. (the proposal was voted on by all shareholders of funds issued by American Century Mutual Funds, Inc.):
| | | | | |
| | John R. Whitten | For: | 13,907,426,552 | |
| | | Withhold: | 629,801,798 | |
| | | Abstain: | 0 | |
| | | Broker Non-Vote: | 0 | |
The other directors whose term of office continued after the meeting include Jonathan S. Thomas, Thomas A. Brown, Andrea C. Hall, James A. Olson, Donald H. Pratt, and M. Jeannine Strandjord.
Proposal 2:
To approve a management agreement between the fund and American Century Investment Management, Inc.:
| | | | | |
| | Institutional Class | For: | 120,763,469 | |
| | | Against: | 495,655 | |
| | | Abstain: | 125,703 | |
| | | Broker Non-Vote: | 0 | |
Proposal 3:
To approve an amendment to the Articles of Incorporation to limit certain director liability to the extent permitted by Maryland law (the proposal was voted on by all shareholders of funds issued by American Century Mutual Funds, Inc.):
| | | | | |
| | | For: | 12,112,932,038 | |
| | | Against: | 769,504,652 | |
| | | Abstain: | 420,034,445 | |
| | | Broker Non-Vote: | 1,234,757,216 | |
The Board of Directors
The individuals listed below serve as directors of the fund. Each director will continue to serve in this capacity until death, retirement, resignation or removal from office. The mandatory retirement age for directors who are not “interested persons,” as that term is defined in the Investment Company Act (independent directors), is 72. However, the mandatory retirement age for an individual director may be extended with the approval of the remaining independent directors.
Mr. Thomas is the only director who is an “interested person” because he currently serves as President and Chief Executive Officer of American Century Companies, Inc. (ACC), the parent company of American Century Investment Management, Inc. (ACIM or the advisor).
The other directors (more than three-fourths of the total number) are independent; that is, they have never been employees, directors or officers of, and have no financial interest in, ACC or any of its wholly owned, direct or indirect, subsidiaries, including ACIM, American Century Investment Services, Inc. (ACIS) and American Century Services, LLC (ACS). The directors serve in this capacity for seven (in the case of Mr. Thomas, 15) registered investment companies in the American Century Investments family of funds.
The following presents additional information about the directors. The mailing address for each director is 4500 Main Street, Kansas City, Missouri 64111.
Independent Directors
Thomas A. Brown
Year of Birth: 1940
Position(s) with the Fund: Director
Length of Time Served: Since 1980
Principal Occupation(s) During the Past Five Years: Managing Member, Associated Investments, LLC (real estate investment company); Brown Cascade Properties, LLC (real estate investment company) (2001 to 2009)
Number of Funds in Fund Complex Overseen by Director: 61
Other Directorships Held by Director During the Past Five Years: None
Education/Other Professional Experience: BS in Mechanical Engineering, University of Kansas; formerly, Chief Executive Officer, Associated Bearings Company; formerly, Area Vice President, Applied Industrial Technologies (bearings and power transmission company)
Andrea C. Hall
Year of Birth: 1945
Position(s) with the Fund: Director
Length of Time Served: Since 1997
Principal Occupation(s) During the Past Five Years: Retired as advisor to the President, Midwest Research Institute (not-for-profit research organization) (June 2006)
Number of Funds in Fund Complex Overseen by Director: 61
Other Directorships Held by Director During the Past Five Years: None
Education/Other Professional Experience: BS in Biology, Florida State University; PhD in Biology, Georgetown University; formerly, Senior Vice President and Director of Research Operations, Midwest Research Institute
James A. Olson
Year of Birth: 1942
Position(s) with the Fund: Director
Length of Time Served: Since 2007
Principal Occupation(s) During the Past Five Years: Member, Plaza Belmont LLC (private equity fund manager); Chief Financial Officer, Plaza Belmont LLC (September 1999 to September 2006)
Number of Funds in Fund Complex Overseen by Director: 61
Other Directorships Held by Director During the Past Five Years: Saia, Inc. and Entertainment Properties Trust
Education/Other Professional Experience: BS in Business Administration and MBA, St. Louis University; CPA; 21 years of experience as a partner in the accounting firm of Ernst & Young LLP
Donald H. Pratt
Year of Birth: 1937
Position(s) with the Fund: Director, Chairman of the Board
Length of Time Served: Since 1995 (Chairman since 2005)
Principal Occupation(s) During the Past Five Years: Chairman and Chief Executive Officer, Western Investments, Inc. (real estate company)
Number of Funds in Fund Complex Overseen by Director: 61
Other Directorships Held by Director During the Past Five Years: None
Education/Other Professional Experience: BS in Industrial Engineering, Wichita State University; MBA, Harvard Business School; serves on the Board of Governors of the Independent Directors Council and Investment Company Institute; formerly, Chairman of the Board, Butler Manufacturing Company (metal buildings producer)
M. Jeannine Strandjord
Year of Birth: 1945
Position(s) with the Fund: Director
Length of Time Served: Since 1994
Principal Occupation(s) During the Past Five Years: Retired, formerly, Senior Vice President, Process Excellence, Sprint Corporation (telecommunications company) (January 2005 to September 2005)
Number of Funds in Fund Complex Overseen by Director: 61
Other Directorships Held by Director During the Past Five Years: DST Systems Inc., Euronet Worldwide Inc., Charming Shoppes, Inc.
Education/Other Professional Experience: BS in Business Administration and Accounting, University of Kansas; CPA; formerly, Senior Vice President of Financial Services and Treasurer and Chief Financial Officer, Global Markets Group; Sprint Corporation; formerly, with the accounting firm of Ernst and Whinney
John R. Whitten
Year of Birth: 1946
Position(s) with the Fund: Director
Length of Time Served: Since 2008
Principal Occupation(s) During the Past Five Years: Project Consultant, Celanese Corp. (industrial chemical company)
Number of Funds in Fund Complex Overseen by Director: 61
Other Directorships Held by Director During the Past Five Years: Rudolph Technologies, Inc.
Professional Education/Experience: BS in Business Administration, Cleveland State University; CPA; formerly, Chief Financial Officer and Treasurer, Applied Industrial Technologies, Inc.; thirteen years of experience with accounting firm Deloitte & Touche LLP
Interested Director
Jonathan S. Thomas
Year of Birth: 1963
Position(s) with the Fund: Director and President
Length of Time Served: Since 2007
Principal Occupation(s) During the Past Five Years: President and Chief Executive Officer, ACC (March 2007 to present); Chief Administrative Officer, ACC (February 2006 to February 2007); Executive Vice President, ACC (November 2005 to February 2007). Also serves as: Chief Executive Officer and Manager, ACS; Executive Vice President, ACIM; Director, ACC, ACIM and other ACC subsidiaries
Number of Funds in Fund Complex Overseen by Director: 101
Other Directorships Held by Director During the Past Five Years: None
Education/Other Professional Experience: BA in Economics, University of Massachusetts; MBA, Boston College; formerly held senior leadership roles with Fidelity Investments, Boston Financial Services, Bank of America and Morgan Stanley; serves on the Board of Governors of the Investment Company Institute
Officers
The following table presents certain information about the executive officers of the fund. Each officer serves as an officer for each of the 15 investment companies in the American Century family of funds, unless otherwise noted. No officer is compensated for his or her service as an officer of the fund. The listed officers are interested persons of the fund and are appointed or re-appointed on an annual basis. The mailing address for each of the officers listed below is 4500 Main Street, Kansas City, Missouri 64111.
| | Name (Year of Birth) | Offices with the Fund | Principal Occupation(s) During the Past Five Years |
| | Jonathan S. Thomas (1963) | Director and President since 2007 | President and Chief Executive Officer, ACC (March 2007 to present); Chief Administrative Officer, ACC (February 2006 to February 2007); Executive Vice President, ACC (November 2005 to February 2007). Also serves as: Chief Executive Officer and Manager, ACS; Executive Vice President, ACIM; Director, ACC, ACIM and other ACC subsidiaries |
| | Barry Fink (1955) | Executive Vice President since 2007 | Chief Operating Officer and Executive Vice President, ACC (September 2007 to present); President, ACS (October 2007 to present); Managing Director, Morgan Stanley (2000 to 2007); Global General Counsel, Morgan Stanley (2000 to 2006). Also serves as: Manager, ACS and Director, ACC and certain ACC subsidiaries |
| | Maryanne L. Roepke (1956) | Chief Compliance Officer since 2006 and Senior Vice President since 2000 | Chief Compliance Officer, American Century funds, ACIM and ACS (August 2006 to present); Assistant Treasurer, ACC (January 1995 to August 2006); and Treasurer and Chief Financial Officer, various American Century funds (July 2000 to August 2006). Also serves as: Senior Vice President, ACS |
| | Charles A. Etherington (1957) | General Counsel since 2007 and Senior Vice President since 2006 | Attorney, ACC (February 1994 to present); Vice President, ACC (November 2005 to present), General Counsel, ACC (March 2007 to present); Also serves as General Counsel, ACIM, ACS, ACIS and other ACC subsidiaries; and Senior Vice President, ACIM and ACS |
| | Robert J. Leach (1966) | Vice President, Treasurer and Chief Financial Officer since 2006 | Vice President, ACS (February 2000 to present); and Controller, various American Century funds (1997 to September 2006) |
| | David H. Reinmiller (1963) | Vice President since 2000 | Attorney, ACC (January 1994 to present); Associate General Counsel, ACC (January 2001 to present); Chief Compliance Officer, American Century funds and ACIM (January 2001 to February 2005). Also serves as Vice President, ACIM and ACS |
| | Ward D. Stauffer (1960) | Secretary since 2005 | Attorney, ACC (June 2003 to present) |
The Statement of Additional Information has additional information about the fund’s directors and is available without charge, upon request, by calling 1-800-345-2021.
Retirement Account Information
As required by law, distributions you receive from certain IRAs, or 403(b), 457 and qualified plans are subject to federal income tax withholding, unless you elect not to have withholding apply. Tax will be withheld on the total amount withdrawn even though you may be receiving amounts that are not subject to withholding, such as nondeductible contributions. In such case, excess amounts of withholding could occur. You may adjust your withholding election so that a greater or lesser amount will be withheld.
If you don’t want us to withhold on this amount, you must notify us to not withhold the federal income tax. You may notify us in writing or in certain situations by telephone or through other electronic means. You have the right to revoke your withholding election at any time and any election you make may remain in effect until revoked by filing a new election.
Remember, even if you elect not to have income tax withheld, you are liable for paying income tax on the taxable portion of your withdrawal. If you elect not to have income tax withheld or you don’t have enough income tax withheld, you may be responsible for payment of estimated tax. You may incur penalties under the estimated tax rules if your withholding and estimated tax payments are not sufficient. You can reduce or defer the income tax on a distribution by directly or indirectly rolling such distribution over to another IRA or eligible plan. You should consult your tax advisor for additional information.
State tax will be withheld if, at the time of your distribution, your address is within one of the mandatory withholding states and you have federal income tax withheld. State taxes will be withheld from your distribution in accordance with the respective state rules.
Proxy Voting Guidelines
American Century Investment Management, Inc., the fund’s investment advisor, is responsible for exercising the voting rights associated with the securities purchased and/or held by the fund. A description of the policies and procedures the advisor uses in fulfilling this responsibility is available without charge, upon request, by calling 1-800-345-2021. It is also available on American Century Investments’ website at americancentury.com and on the Securities and Exchange Commission’s website at sec.gov. Information regarding how the investment advisor voted proxies relating to portfolio securities during the most recent 12-month period ended June 30 is available on the “About Us” page at americancentury.com. It is also available at sec.gov.
Quarterly Portfolio Disclosure
The fund files its complete schedule of portfolio holdings with the Securities and Exchange Commission (SEC) for the first and third quarters of each fiscal year on Form N-Q. The fund’s Forms N-Q are available on the SEC’s website at sec.gov, and may be reviewed and copied at the SEC’s Public Reference Room in Washington, DC. Information on the operation of the Public Reference Room may be obtained by calling 1-800-SEC-0330. The fund also makes its complete schedule of portfolio holdings for the most recent quarter of its fiscal year available on its website at americancentury.com and, upon request, by calling 1-800-345-2021.
The following indices are used to illustrate investment market, sector, or style performance or to serve as fund performance comparisons. They are not investment products available for purchase.
The Russell 1000® Index is a market-capitalization weighted, large-cap index created by Frank Russell Company to measure the performance of the 1,000 largest publicly traded U.S. companies, based on total market capitalization.
The Russell 1000® Growth Index measures the performance of those Russell 1000 Index companies (the 1,000 largest publicly traded U.S. companies, based on total market capitalization) with higher price-to-book ratios and higher forecasted growth values.
The Russell 1000® Value Index measures the performance of those Russell 1000 Index companies (the 1,000 largest publicly traded U.S. companies, based on total market capitalization) with lower price-to-book ratios and lower forecasted growth values.
The Russell 2000® Index is a market-capitalization weighted index created by Frank Russell Company to measure the performance of the 2,000 smallest of the 3,000 largest publicly traded U.S. companies, based on total market capitalization.
The Russell 2000® Growth Index measures the performance of those Russell 2000 Index companies (the 2,000 smallest of the 3,000 largest publicly traded U.S. companies, based on total market capitalization) with higher price-to-book ratios and higher forecasted growth values.
The Russell 2000® Value Index measures the performance of those Russell 2000 Index companies (the 2,000 smallest of the 3,000 largest publicly traded U.S. companies, based on total market capitalization) with lower price-to-book ratios and lower forecasted growth values.
The Russell Midcap® Index measures the performance of the 800 smallest of the 1,000 largest publicly traded U.S. companies, based on total market capitalization.
The Russell Midcap® Growth Index measures the performance of those Russell Midcap Index companies (the 800 smallest of the 1,000 largest publicly traded U.S. companies, based on total market capitalization) with higher price-to-book ratios and higher forecasted growth values.
The Russell Midcap® Value Index measures the performance of those Russell Midcap Index companies (the 800 smallest of the 1,000 largest publicly traded U.S. companies, based on total market capitalization) with lower price-to-book ratios and lower forecasted growth values.
Notes
| |
| | |
| Contact Us | |
| | |
| americancentury.com | |
| | |
| Automated Information Line | 1-800-345-8765 |
| | |
| Investor Services Representative | 1-800-345-2021 or 816-531-5575 |
| | |
| Investors Using Advisors | 1-800-378-9878 |
| | |
| Business, Not-For-Profit, Employer-Sponsored Retirement Plans | 1-800-345-3533 |
| | |
| Banks and Trust Companies, Broker-Dealers, Financial Professionals, Insurance Companies | 1-800-345-6488 |
| | |
| Telecommunications Device for the Deaf | 1-800-634-4113 |
| | |
| American Century Mutual Funds, Inc. |
| |
Investment Advisor: American Century Investment Management, Inc. Kansas City, Missouri |
| |
| This report and the statements it contains are submitted for the general information of our shareholders. The report is not authorized for distribution to prospective investors unless preceded or accompanied by an effective prospectus. |
American Century Investment Services, Inc., Distributor
©2010 American Century Proprietary Holdings, Inc. All rights reserved.
| Annual Report |
| October 31, 2010 |
American Century Investments®
| | President’s Letter | 2 |
| | Independent Chairman’s Letter | 3 |
| | Market Perspective | 4 |
| | U.S. Stock Index Returns | 4 |
| | | |
| Select |
| |
| | Performance | 5 |
| | Portfolio Commentary | 7 |
| | Top Ten Holdings | 9 |
| | Top Five Industries | 9 |
| | Types of Investments in Portfolio | 9 |
| | | |
| | Shareholder Fee Example | 10 |
| | | |
| Financial Statements |
| |
| | Schedule of Investments | 12 |
| | Statement of Assets and Liabilities | 14 |
| | Statement of Operations | 15 |
| | Statement of Changes in Net Assets | 16 |
| | Notes to Financial Statements | 17 |
| | Financial Highlights | 24 |
| | Report of Independent Registered Public Accounting Firm | 30 |
| | | |
| Other Information |
| |
| | Proxy Voting Results | 31 |
| | Management | 32 |
| | Additional Information | 36 |
| | Index Definitions | 37 |
Any opinions expressed in this report reflect those of the author as of the date of the report, and do not necessarily represent the opinions of American Century Investments or any other person in the American Century Investments organization. Any such opinions are subject to change at any time based upon market or other conditions and American Century Investments disclaims any responsibility to update such opinions. These opinions may not be relied upon as investment advice and, because investment decisions made by American Century Investments funds are based on numerous factors, may not be relied upon as an indication of trading intent on behalf of any American Century Investments fund. Security examples are used for representational purposes only and are not intended as recommendations to purchase or sell securities. Performance information for comparative indices and securities is provided to American Century Investments by third party vendors. To the best of American Century Investments’ knowledge, such information is accurate at the time of printing.
Jonathan Thomas
Dear Investor:
To learn more about the capital markets, your investment, and the portfolio management strategies American Century Investments provides, we encourage you to review this shareholder report for the financial reporting period ended October 31, 2010.
On the following pages, you will find investment performance and portfolio information, presented with the expert perspective and commentary of our portfolio management team. This report remains one of our most important vehicles for conveying the information you need about your investment performance, and about the market factors and strategies that affect fund returns. For additional information on the markets, we encourage you to visit the “Insights & News” tab at our Web site, americancentury.com, for updates and further expert commentary.
The top of our Web site’s home page also provides a link to “Our Story,” which, first and foremost, outlines our commitment—since 1958—to helping clients reach their financial goals. We believe strongly that we will only be successful when our clients are successful. That’s who we are.
Another important, unique facet of our story and who we are is “Profits with a Purpose,” which describes our bond with the Stowers Institute for Medical Research (SIMR). SIMR is a world-class biomedical organization—founded by our company founder James E. Stowers, Jr. and his wife Virginia—that is dedicated to researching the causes, treatment, and prevention of gene-based diseases, including cancer. Through American Century Investments’ private ownership structure, more than 40% of our profits support SIMR.
Mr. Stowers’ example of achieving financial success and using that platform to help humanity motivates our entire American Century Investments team. His story inspires us to help each of our clients achieve success. Thank you for sharing your financial journey with us.
Sincerely,
Jonathan Thomas
President and Chief Executive Officer
American Century Investments
Independent Chairman’s Letter
Don Pratt
Dear Fellow Shareholders,
As regulators and the markets continue to sort out the events of the credit crisis, a consistent theme has been that financial services firms should re-examine their risk management practices. Risk management has been a regular part of American Century Investments’ activities for many years. However, recently American Century and your mutual fund board have been spending additional time focusing on our risk oversight processes.
The board’s efforts are now organized around three categories of risk: investment risk, operational risk, and enterprise risk. This approach has facilitated a realignment of many risk oversight tasks that the board has historically conducted. Investment risk tasks include a review of portfolio risk, monitoring the use of derivatives, and performance assessment. Operational risk focuses on compliance, valuation, shareholder services, and trading activities. Enterprise risk addresses the financial condition of the advisor, human resource development, and reputational risks. Risk oversight tasks are addressed in every quarterly board meeting, and a review of the advisor’s entire risk management program is undertaken annually. We acknowledge and support the approach that American Century Investments takes to its risk management responsibilities. While the board has refocused its efforts in this important oversight area, we recognize that risk oversight is a journey and we expect to continue to improve our processes.
Our September quarterly board meeting was held in the New York offices of American Century Investments. This gave the directors an opportunity to meet with the portfolio management teams for each of the global and international funds overseen by the board. Each team uses sophisticated investment tools and daily risk analysis in managing client assets. We also were impressed with the “bench strength” that has been developed under the leadership of the Global and Non-U.S. Equity CIO Mark Kopinski. These face-to-face meetings provide an opportunity for the directors – working on behalf of shareholders – to validate the advisor’s efforts and the investment management approach being followed.
I thank you for your continued confidence in American Century during this turbulent time in the economy and investment markets. If you have thoughts or questions you would like to share with the board send them to me at dhpratt@fundboardchair.com.
Best regards,
Don Pratt
By Greg Woodhams, Chief Investment Officer, U.S. Growth Equity — Large Cap
Stocks Advanced, But Volatility Increased
The U.S. stock market posted double-digit gains for the 12 months ended October 31, 2010. The bulk of the advance occurred in the first half of the period as stocks extended a rally that began in March 2009. The market’s gains were driven by improving economic conditions, as evidenced by robust gross domestic product growth in the fourth quarter of 2009 and first quarter of 2010, and a rebound in corporate earnings as many companies significantly reduced costs to boost profit margins.
Market conditions grew more volatile during the last half of the period. Concerns about the European financial system and the strength of the economic recovery in the U.S. led to a stock market decline in May and June. However, the equity market finished the period on a positive note, staging a rally during the last two months of the period as economic indicators pointed to improved growth in the third quarter.
For the 12-month period, the broad equity indices returned approximately 18%. As the table below illustrates, mid- and small-cap issues led the market’s advance, returning more than 25% overall.
Growth Stocks Outperformed
Growth stocks outpaced value issues across all market capitalizations during the period, particularly over the last six months. The economically sensitive segments of the market—information technology, consumer discretionary, and industrials—were among the top performers for the 12 months. In contrast, the financials sector, which is the most prominent sector weighting in most value indices, lagged amid continued weakness in the housing market and uncertainty regarding the impact of recent financial reform legislation.
| U.S. Stock Index Returns |
| For the 12 months ended October 31, 2010 |
| Russell 1000 Index (Large-Cap) | 17.67% | | Russell 2000 Index (Small-Cap) | 26.58% |
| Russell 1000 Growth Index | 19.65% | | Russell 2000 Growth Index | 28.67% |
| Russell 1000 Value Index | 15.71% | | Russell 2000 Value Index | 24.43% |
| Russell Midcap Index | 27.71% | | | |
| Russell Midcap Growth Index | 28.03% | | | |
| Russell Midcap Value Index | 27.49% | | | |
Select
| Total Returns as of October 31, 2010 |
| | | | Average Annual Returns | |
| | Ticker Symbol | 1 year | 5 years | 10 years | Since Inception | Inception Date |
| Investor Class | TWCIX | 16.78% | 1.60% | -1.95% | 12.08% | 6/30/71(1) |
Russell 1000 Growth Index | — | 19.65% | 3.21% | -2.52% | N/A(2) | — |
| Institutional Class | TWSIX | 17.02% | 1.80% | -1.75% | 4.15% | 3/13/97 |
A Class(3) No sales charge* With sales charge* | TWCAX | 16.48% 9.77% | 1.34% 0.15% | -2.21% -2.79% | 2.27% 1.81% | 8/8/97 |
B Class No sales charge* With sales charge* | ABSLX | 15.61% 11.61% | 0.58% 0.38% | — — | 3.84% 3.84% | 1/31/03 |
| C Class | ACSLX | 15.63% | 0.58% | — | 3.86% | 1/31/03 |
| R Class | ASERX | 16.20% | 1.09% | — | 0.36% | 7/29/05 |
| Sales charges include initial sales charges and contingent deferred sales charges (CDSCs), as applicable. A Class shares have a 5.75% maximum initial sales charge for equity funds and may be subject to a maximum CDSC of 1.00%. B Class shares redeemed within six years of purchase are subject to a CDSC that declines from 5.00% during the first year after purchase to 0.00% the sixth year after purchase. C Class shares redeemed within 12 months of purchase are subject to a maximum CDSC of 1.00%. The SEC requires that mutual funds provide performance information net of maximum sales charges in all cases where charges could be applied. |
| (1) | Although the fund’s actual inception date was 10/31/58, this inception date corresponds with the investment advisor’s implementation of its current investment philosophy and practices. |
| (2) | Benchmark began 12/29/78. |
| (3) | Prior to September 4, 2007, the A Class was referred to as the Advisor Class and did not have a front-end sales charge. Performance prior to that date has been adjusted to reflect this charge. |
Data presented reflect past performance. Past performance is no guarantee of future results. Current performance may be higher or lower than the performance shown. Investment return and principal value will fluctuate, and redemption value may be more or less than original cost. To obtain performance data current to the most recent month end, please call 1-800-345-2021 or visit americancentury.com. International investing involves special risks, such as political instability and currency fluctuations.
Unless otherwise indicated, performance reflects Investor Class shares; performance for other share classes will vary due to differences in fee structure. For information about other share classes available, please consult the prospectus. Data assumes reinvestment of dividends and capital gains, and none of the charts reflect the deduction of taxes that a shareholder would pay on fund distributions or the redemption of fund shares. Returns for the index are provided for comparison. The fund’s total returns include operating expenses (such as transaction costs and management fees) that reduce returns, while the total returns of the index do not.
Select
| Growth of $10,000 Over 10 Years |
| $10,000 investment made October 31, 2000 |
| Total Annual Fund Operating Expenses |
| Investor Class | Institutional Class | A Class | B Class | C Class | R Class |
| 1.00% | 0.80% | 1.25% | 2.00% | 2.00% | 1.50% |
The total annual fund operating expenses shown is as stated in the fund’s prospectus current as of the date of this report. The prospectus may vary from the expense ratio shown elsewhere in this report because it is based on a different time period, includes acquired fund fees and expenses, and, if applicable, does not include fee waivers or expense reimbursements.
Data presented reflect past performance. Past performance is no guarantee of future results. Current performance may be higher or lower than the performance shown. Investment return and principal value will fluctuate, and redemption value may be more or less than original cost. To obtain performance data current to the most recent month end, please call 1-800-345-2021 or visit americancentury.com. International investing involves special risks, such as political instability and currency fluctuations.
Unless otherwise indicated, performance reflects Investor Class shares; performance for other share classes will vary due to differences in fee structure. For information about other share classes available, please consult the prospectus. Data assumes reinvestment of dividends and capital gains, and none of the charts reflect the deduction of taxes that a shareholder would pay on fund distributions or the redemption of fund shares. Returns for the index are provided for comparison. The fund’s total returns include operating expenses (such as transaction costs and management fees) that reduce returns, while the total returns of the index do not.
Select
Portfolio Managers: Keith Lee and Michael Li
Performance Summary
Select returned 16.78%* for the 12 months ended October 31, 2010, compared with the 19.65% return of its benchmark, the Russell 1000 Growth Index, and the 16.52%** return of the S&P 500 Index, a broader market measure.
As discussed in the Market Perspective on page 4, equity indices generally gained during the reporting period, as investors faced a mixture of economic and market information. Stocks with low P/E (price-to-earnings) ratios, one of the primary characteristics of stocks in the portfolio, generally underperformed during the period. High growth companies generally lagged in the first half of the period, but their performance improved nicely in the second half. Price momentum, a third characteristic of fund holdings, was out of favor for most of the reporting period but improved in September and October.
Within the portfolio, security selection in the health care and financials sectors accounted for the bulk of Select’s underperformance relative to the benchmark, although the portfolio derived positive absolute results from these sectors. Stock selection in the industrials and consumer discretionary sectors also trimmed relative returns but contributed meaningfully to absolute gains. Partially offsetting those relative losses, effective stock decisions in the information technology sector modestly helped relative performance.
Health Care, Financials Detracted from Relative Returns
The health care sector was a key source of underperformance relative to the benchmark. Holdings in the biotechnology industry included an overweight stake in Gilead Sciences, Inc. The drug maker lowered guidance due to health care reform legislation. Similarly, within the health care equipment industry, a significant overweight stake in Baxter International hurt absolute and relative returns as the medical device company revised guidance downward to account for health care reform. Health care provider Medco Health Solutions, Inc. also experienced a share price decline as it lowered its forecast for future growth.
The financials sector also was home to underperforming holdings. Detrimental positions in the diversified financial services industry included JPMorgan Chase. The company’s share price stumbled during the period as it reported lower-than-expected fourth quarter 2009 earnings amid rising credit costs. Elsewhere in the financials sector, poor stock decisions in the insurance industry detracted from relative performance.
Industrials Lagged Benchmark
Within the industrials sector, stock decisions in the aerospace and defense industry contributed to absolute returns but hindered relative performance, as Select’s holdings underperformed benchmark stocks in the industry group. Select avoided the airlines industry altogether. This decision proved detrimental as the industry group rebounded during the period as demand increased. Likewise, maintaining underweight allocations to the air freight and logistics industry, as well as railroad stocks, hurt relative performance. Increased industrial production during the reporting period translated into rising shipping volumes, lifting the share prices of these companies in the benchmark. Select did not fully participate in this rebound.
| * | All fund returns referenced in this commentary are for Investor Class shares. |
| ** | The S&P 500 Index average annual returns were 1.73% and -0.02% for the five- and 10-year periods ended October 31, 2010, respectively. |
Select
Consumer Discretionary Underperformed, but Some Holdings Helped
The consumer discretionary sector was a source of overall underperformance relative to the benchmark, although Select derived positive absolute results from the sector and some sector members contributed significantly to relative gains. An overweight position in International Game Technology curbed relative returns. The manufacturer of gaming machines experienced a decline in share price amid shrinking demand from casinos. Within the household durables industry group, an overweight stake in Harman International Industries proved detrimental. The maker of audio products had benefited from previous design wins amid a recovery in automobile demand and also from aggressive cost-cutting actions. During the reporting period, however, the company’s earnings and guidance for future earnings were lowered due to slowing de mand.
Elsewhere in the consumer discretionary sector, toy maker Hasbro benefited absolute and relative returns. The company is successfully expanding from a core toy manufacturer into other growth areas for its products, including entertainment and licensing, as well as adding new toys for girls and infants to its lineup. Luxury goods retailer Coach also added to relative gains as it experienced strong trends in North America, rising sales levels in Japan, and double-digit revenue growth in China.
Information Technology Contributed
The information technology sector was a source of relative outperformance for Select. The portfolio held a significant stake in Baidu, Inc., China’s dominant internet search engine. The company experienced accelerating sales as more Chinese companies increased their internet presence through web sites and online retail stores. For the reporting period, Baidu represented the largest single contribution to Select’s relative gains. Within the IT services industry group, effective stock decisions included an overweight stake in Teradata Corp. which benefited from increased corporate IT spending and expansion into new territories. Successful stock choices in the semiconductor industry also added to portfolio gains.
Starting Point for Next Reporting Period
The environment for momentum-oriented investment styles continued to be challenged during the reporting period and Select’s investment process experienced a significant headwind as a result. Going forward, we remain confident in our investment beliefs that stocks which exhibit high quality, accelerating fundamentals, positive relative strength, and attractive valuations will outperform in the long term.
Select
| Top Ten Holdings |
| | % of net assets as of 10/31/10 |
| Apple, Inc. | 6.1% |
| Google, Inc., Class A | 4.8% |
| Exxon Mobil Corp. | 2.8% |
| Teradata Corp. | 2.4% |
| EMC Corp. | 2.4% |
| Coach, Inc. | 2.3% |
| Microsoft Corp. | 2.3% |
| Linear Technology Corp. | 2.3% |
| Schlumberger Ltd. | 2.3% |
| Emerson Electric Co. | 2.2% |
| |
| Top Five Industries |
| | % of net assets as of 10/31/10 |
| Computers & Peripherals | 9.4% |
| Internet Software & Services | 6.4% |
| Software | 5.6% |
| Energy Equipment & Services | 5.3% |
| IT Services | 5.2% |
| |
| Types of Investments in Portfolio |
| | % of net assets as of 10/31/10 |
| Domestic Common Stocks | 89.8% |
| Foreign Common Stocks* | 8.8% |
| Total Common Stocks | 98.6% |
| Temporary Cash Investments | 1.3% |
| Other Assets and Liabilities | 0.1% |
| *Includes depositary shares, dual listed securities and foreign ordinary shares. |
Shareholder Fee Example (Unaudited)
Fund shareholders may incur two types of costs: (1) transaction costs, including sales charges (loads) on purchase payments and redemption/exchange fees; and (2) ongoing costs, including management fees; distribution and service (12b-1) fees; and other fund expenses. This example is intended to help you understand your ongoing costs (in dollars) of investing in your fund and to compare these costs with the ongoing cost
of investing in other mutual funds.
The example is based on an investment of $1,000 made at the beginning of the period and held for the entire period from May 1, 2010 to October 31, 2010.
Actual Expenses
The table provides information about actual account values and actual expenses for each class. You may use the information, together with the amount you invested, to estimate the expenses that you paid over the period. First, identify the share class you own. Then simply divide your account value by $1,000 (for example, an $8,600 account value divided by $1,000 = 8.6), then multiply the result by the number under the heading “Expenses Paid During Period” to estimate the expenses you paid on your account during this period.
If you hold Investor Class shares of any American Century Investments fund, or Institutional Class shares of the American Century Diversified Bond Fund, in an American Century Investments account (i.e., not a financial intermediary or retirement plan account), American Century Investments may charge you a $12.50 semiannual account maintenance fee if the value of those shares is less than $10,000. We will redeem shares automatically in one of your accounts to pay the $12.50 fee. In determining your total eligible investment amount, we will include your investments in all personal accounts (including American Century Investments Brokerage accounts) registered under your Social Security number. Personal accounts include individual accounts, joint accounts, UGMA/UTMA accounts, personal trusts, Coverdell Education Savings Accounts and IRAs (including traditional, Roth, Rollover, SEP-, SARSEP- and SIMPLE-IRAs), and certain other retirement accounts. If you have only business, business retirement, employer-sponsored or American Century Investments Brokerage accounts, you are currently not subject to this fee. We will not charge the fee as long as you choose to manage your accounts exclusively online. If you are subject to the Account Maintenance Fee, your account value could be reduced by the fee amount.
Hypothetical Example for Comparison Purposes
The table also provides information about hypothetical account values and hypothetical expenses based on the actual expense ratio of each class of your fund and an assumed rate of return of 5% per year before expenses, which is not the actual return of a fund’s share class. The hypothetical account values and expenses may not be used to estimate the actual ending account balance or expenses you paid for the period. You may use this information to compare the ongoing costs of investing in your fund and other funds. To do so, compare this 5% hypothetical example with the 5% hypothetical examples that appear in the shareholder reports of the other funds.
Please note that the expenses shown in the table are meant to highlight your ongoing costs only and do not reflect any transactional costs, such as sales charges (loads) or redemption/exchange fees. Therefore, the table is useful in comparing ongoing costs only, and will not help you determine the relative total costs of owning different funds. In addition, if these transactional costs were included, your costs would have been higher.
| | | | | |
| | Beginning Account Value 5/1/10 | Ending Account Value 10/31/10 | Expenses Paid During Period* 5/1/10 – 10/31/10 | Annualized Expense Ratio* |
| Actual |
| Investor Class | $1,000 | $1,033.70 | $5.18 | 1.01% |
| Institutional Class | $1,000 | $1,034.50 | $4.15 | 0.81% |
| A Class | $1,000 | $1,032.50 | $6.45 | 1.26% |
| B Class | $1,000 | $1,028.40 | $10.28 | 2.01% |
| C Class | $1,000 | $1,028.70 | $10.28 | 2.01% |
| R Class | $1,000 | $1,031.10 | $7.73 | 1.51% |
| Hypothetical |
| Investor Class | $1,000 | $1,020.11 | $5.14 | 1.01% |
| Institutional Class | $1,000 | $1,021.12 | $4.13 | 0.81% |
| A Class | $1,000 | $1,018.85 | $6.41 | 1.26% |
| B Class | $1,000 | $1,015.07 | $10.21 | 2.01% |
| C Class | $1,000 | $1,015.07 | $10.21 | 2.01% |
| R Class | $1,000 | $1,017.59 | $7.68 | 1.51% |
*Expenses are equal to the class’s annualized expense ratio listed in the table above, multiplied by the average account value over the period, multiplied by 184, the number of days in the most recent fiscal half-year, divided by 365, to reflect the one-half year period.
| | | |
| | Shares | Value |
| Common Stocks — 98.6% |
| AEROSPACE & DEFENSE — 4.0% |
| General Dynamics Corp. | 515,100 | $ 35,088,612 |
| Rockwell Collins, Inc. | 570,000 | 34,490,700 |
| | | 69,579,312 |
| AIR FREIGHT & LOGISTICS — 1.3% |
| United Parcel Service, Inc., Class B | 335,500 | 22,592,570 |
| BEVERAGES — 1.3% |
| Diageo plc | 1,251,800 | 23,107,066 |
| BIOTECHNOLOGY — 2.1% |
Gilead Sciences, Inc.(1) | 929,000 | 36,853,430 |
| CAPITAL MARKETS — 2.4% |
| Bank of New York Mellon Corp. (The) | 632,500 | 15,850,450 |
| Franklin Resources, Inc. | 229,300 | 26,300,710 |
| | | 42,151,160 |
| CHEMICALS — 3.0% |
| Eastman Chemical Co. | 134,500 | 10,567,665 |
| Monsanto Co. | 317,800 | 18,883,676 |
| Potash Corp. of Saskatchewan, Inc. | 154,700 | 22,445,423 |
| | | 51,896,764 |
| COMMUNICATIONS EQUIPMENT — 3.4% |
Cisco Systems, Inc.(1) | 1,627,456 | 37,154,820 |
| QUALCOMM, Inc. | 486,800 | 21,969,284 |
| | | 59,124,104 |
| COMPUTERS & PERIPHERALS — 9.4% |
Apple, Inc.(1) | 352,000 | 105,906,240 |
EMC Corp.(1) | 1,980,700 | 41,614,507 |
| Hewlett-Packard Co. | 400,000 | 16,824,000 |
| | | 164,344,747 |
| DIVERSIFIED FINANCIAL SERVICES — 2.8% |
| CME Group, Inc. | 71,400 | 20,681,010 |
| Hong Kong Exchanges and Clearing Ltd. | 628,500 | 13,832,879 |
| JPMorgan Chase & Co. | 405,900 | 15,274,017 |
| | | 49,787,906 |
| ELECTRICAL EQUIPMENT — 3.6% |
ABB Ltd. ADR(1) | 1,178,400 | 24,381,096 |
| Emerson Electric Co. | 712,700 | 39,127,230 |
| | | 63,508,326 |
| ENERGY EQUIPMENT & SERVICES — 5.3% |
| Halliburton Co. | 710,100 | 22,623,786 |
| National Oilwell Varco, Inc. | 570,700 | 30,680,832 |
| Schlumberger Ltd. | 566,300 | 39,578,707 |
| | | 92,883,325 |
| FOOD & STAPLES RETAILING — 3.1% |
| Costco Wholesale Corp. | 596,500 | 37,442,305 |
| Wal-Mart Stores, Inc. | 316,000 | 17,117,720 |
| | | 54,560,025 |
| FOOD PRODUCTS — 1.7% |
| Hershey Co. (The) | 210,100 | 10,397,849 |
| Mead Johnson Nutrition Co. | 339,000 | 19,939,980 |
| | | 30,337,829 |
| HEALTH CARE EQUIPMENT & SUPPLIES — 0.7% |
Intuitive Surgical, Inc.(1) | 43,500 | 11,438,325 |
| HEALTH CARE PROVIDERS & SERVICES — 3.8% |
Medco Health Solutions, Inc.(1) | 700,115 | 36,777,041 |
| UnitedHealth Group, Inc. | 805,700 | 29,045,485 |
| | | 65,822,526 |
| HOTELS, RESTAURANTS & LEISURE — 2.0% |
| McDonald’s Corp. | 450,700 | 35,050,939 |
| HOUSEHOLD DURABLES — 1.0% |
Harman International Industries, Inc.(1) | 515,400 | 17,291,670 |
| HOUSEHOLD PRODUCTS — 0.4% |
| Colgate-Palmolive Co. | 87,200 | 6,724,864 |
| INSURANCE — 1.1% |
| Travelers Cos., Inc. (The) | 352,800 | 19,474,560 |
| INTERNET & CATALOG RETAIL — 2.6% |
Amazon.com, Inc.(1) | 173,400 | 28,635,276 |
Netflix, Inc.(1) | 94,900 | 16,465,150 |
| | | 45,100,426 |
| INTERNET SOFTWARE & SERVICES — 6.4% |
Baidu, Inc. ADR(1) | 240,800 | 26,490,408 |
Google, Inc., Class A(1) | 135,700 | 83,182,743 |
SouFun Holdings Ltd. ADR(1) | 39,300 | 2,888,550 |
| | | 112,561,701 |
| IT SERVICES — 5.2% |
| Infosys Technologies Ltd. ADR | 209,600 | 14,135,424 |
| MasterCard, Inc., Class A | 143,600 | 34,472,616 |
Teradata Corp.(1) | 1,082,500 | 42,607,200 |
| | | 91,215,240 |
| LEISURE EQUIPMENT & PRODUCTS — 2.0% |
| Hasbro, Inc. | 761,800 | 35,233,250 |
| MACHINERY — 1.8% |
| Parker-Hannifin Corp. | 411,700 | $ 31,515,635 |
| METALS & MINING — 2.5% |
| Freeport-McMoRan Copper & Gold, Inc. | 251,600 | 23,821,488 |
| Walter Energy, Inc. | 223,900 | 19,694,244 |
| | | 43,515,732 |
| OIL, GAS & CONSUMABLE FUELS — 4.8% |
| Exxon Mobil Corp. | 732,800 | 48,709,216 |
| Occidental Petroleum Corp. | 445,500 | 35,029,665 |
| | | 83,738,881 |
| PHARMACEUTICALS — 3.2% |
| Allergan, Inc. | 483,800 | 35,031,958 |
| Teva Pharmaceutical Industries Ltd. ADR | 399,900 | 20,754,810 |
| | | 55,786,768 |
| PROFESSIONAL SERVICES — 1.3% |
IHS, Inc., Class A(1) | 50,000 | 3,612,000 |
| Robert Half International, Inc. | 441,100 | 11,958,221 |
Verisk Analytics, Inc., Class A(1) | 237,100 | 7,067,951 |
| | | 22,638,172 |
| ROAD & RAIL — 0.6% |
| J.B. Hunt Transport Services, Inc. | 290,700 | 10,453,572 |
| SEMICONDUCTORS & SEMICONDUCTOR EQUIPMENT — 2.3% |
| Linear Technology Corp. | 1,237,300 | 39,878,179 |
| SOFTWARE — 5.6% |
Adobe Systems, Inc.(1) | 586,400 | 16,507,160 |
| Microsoft Corp. | 1,516,700 | 40,404,888 |
| Nintendo Co. Ltd. | 25,100 | 6,503,480 |
| Oracle Corp. | 1,153,200 | 33,904,080 |
| | | 97,319,608 |
| SPECIALTY RETAIL — 2.4% |
| Lowe’s Cos., Inc. | 521,500 | 11,123,595 |
| TJX Cos., Inc. (The) | 689,500 | 31,641,155 |
| | | 42,764,750 |
| TEXTILES, APPAREL & LUXURY GOODS — 3.7% |
| Coach, Inc. | 817,300 | 40,865,000 |
Hanesbrands, Inc.(1) | 979,300 | 24,286,640 |
| | | 65,151,640 |
| TOBACCO — 1.8% |
| Philip Morris International, Inc. | 545,000 | 31,882,500 |
TOTAL COMMON STOCKS(Cost $1,361,481,842) | 1,725,285,502 |
| Temporary Cash Investments — 1.3% |
| JPMorgan U.S. Treasury Plus Money Market Fund Agency Shares | 81,519 | 81,519 |
Repurchase Agreement, Credit Suisse First Boston, Inc., (collateralized by various U.S. Treasury obligations, 1.00%, 3/31/12, valued at $23,663,941), in a joint trading account at 0.16%, dated 10/29/10, due 11/1/10 (Delivery value $23,200,309) | 23,200,000 |
TOTAL TEMPORARY CASH INVESTMENTS (Cost $23,281,519) | 23,281,519 |
TOTAL INVESTMENT SECURITIES — 99.9%(Cost $1,384,763,361) | 1,748,567,021 |
| OTHER ASSETS AND LIABILITIES — 0.1% | 994,711 |
| TOTAL NET ASSETS — 100.0% | $1,749,561,732 |
| Forward Foreign Currency Exchange Contracts |
| Contracts to Sell | Counterparty | Settlement Date | Value | Unrealized Gain (Loss) |
| 11,134,761 | GBP for USD | Bank of America | 11/30/10 | $17,838,667 | $(226,147) |
| 404,549,250 | JPY for USD | Bank of America | 11/30/10 | 5,028,426 | (66,519) |
| | | | | $22,867,093 | $(292,666) |
(Value on Settlement Date $22,574,427)
Notes to Schedule of Investments
ADR = American Depositary Receipt
GBP = British Pound
JPY = Japanese Yen
USD = United States Dollar
See Notes to Financial Statements.
Statement of Assets and Liabilities
| OCTOBER 31, 2010 |
| Assets |
| Investment securities, at value (cost of $1,384,763,361) | $1,748,567,021 |
| Cash | 20,295 |
| Receivable for investments sold | 5,800,900 |
| Receivable for capital shares sold | 128,397 |
| Dividends and interest receivable | 898,332 |
| | 1,755,414,945 |
| | |
| Liabilities |
| Payable for investments purchased | 3,335,558 |
| Payable for capital shares redeemed | 759,584 |
| Unrealized loss on forward foreign currency exchange contracts | 292,666 |
| Accrued management fees | 1,459,252 |
| Distribution and service fees payable | 6,153 |
| | 5,853,213 |
| | |
| Net Assets | $1,749,561,732 |
| | |
| Net Assets Consist of: |
| Capital (par value and paid-in surplus) | $1,595,424,230 |
| Undistributed net investment income | 6,260,277 |
| Accumulated net realized loss | (215,635,527) |
| Net unrealized appreciation | 363,512,752 |
| | $1,749,561,732 |
| | | | |
| | Net assets | Shares outstanding | Net asset value per share |
| Investor Class, $0.01 Par Value | $1,722,137,611 | | 48,462,955 | | $35.54 | |
| Institutional Class, $0.01 Par Value | $4,563,250 | | 126,930 | | $35.95 | |
| A Class, $0.01 Par Value | $20,666,157 | | 590,619 | | $34.99* | |
| B Class, $0.01 Par Value | $1,776,173 | | 52,700 | | $33.70 | |
| C Class, $0.01 Par Value | $390,011 | | 11,560 | | $33.74 | |
| R Class, $0.01 Par Value | $28,530 | | 812 | | $35.14 | |
*Maximum offering price $37.12 (net asset value divided by 0.9425)
See Notes to Financial Statements.
| YEAR ENDED OCTOBER 31, 2010 |
| Investment Income (Loss) |
| Income: | |
| Dividends (net of foreign taxes withheld of $15,115) | $ 22,663,477 |
| Interest | 21,836 |
| | 22,685,313 |
| | |
| Expenses: | |
| Management fees | 16,812,330 |
| Distribution and service fees: | |
| A Class | 50,527 |
| B Class | 19,111 |
| C Class | 3,815 |
| R Class | 133 |
| Directors’ fees and expenses | 51,906 |
| Other expenses | 65,442 |
| | 17,003,264 |
| | |
| Net investment income (loss) | 5,682,049 |
| | |
| Realized and Unrealized Gain (Loss) |
| Net realized gain (loss) on: | |
| Investment transactions | (21,070,225) |
| Foreign currency transactions | 455,168 |
| | (20,615,057) |
| | |
| Change in net unrealized appreciation (depreciation) on: | |
| Investments | 275,918,816 |
| Translation of assets and liabilities in foreign currencies | (179,257) |
| | 275,739,559 |
| | |
| Net realized and unrealized gain (loss) | 255,124,502 |
| | |
| Net Increase (Decrease) in Net Assets Resulting from Operations | $260,806,551 |
See Notes to Financial Statements.
Statement of Changes in Net Assets
| YEARS ENDED OCTOBER 31, 2010 AND OCTOBER 31, 2009 |
| Increase (Decrease) in Net Assets | 2010 | 2009 |
| Operations |
| Net investment income (loss) | $ 5,682,049 | $ 11,116,283 |
| Net realized gain (loss) | (20,615,057) | (174,653,037) |
| Change in net unrealized appreciation (depreciation) | 275,739,559 | 412,450,732 |
| Net increase (decrease) in net assets resulting from operations | 260,806,551 | 248,913,978 |
| | | |
| Distributions to Shareholders |
| From net investment income: | | |
| Investor Class | (8,227,971) | (14,095,648) |
| Institutional Class | (28,810) | (1,087,962) |
| A Class | (49,312) | (144,697) |
| B Class | — | (1,824) |
| C Class | — | (287) |
| R Class | — | (175) |
| Decrease in net assets from distributions | (8,306,093) | (15,330,593) |
| | | |
| Capital Share Transactions |
| Net increase (decrease) in net assets from capital share transactions | (120,734,647) | (181,643,233) |
| | | |
| Net increase (decrease) in net assets | 131,765,811 | 51,940,152 |
| | | |
| Net Assets |
| Beginning of period | 1,617,795,921 | 1,565,855,769 |
| End of period | $1,749,561,732 | $1,617,795,921 |
| | | |
| Undistributed net investment income | $6,260,277 | $8,429,153 |
See Notes to Financial Statements.
Notes to Financial Statements
OCTOBER 31, 2010
1. Organization
American Century Mutual Funds, Inc. (the corporation) is registered under the Investment Company Act of 1940 (the 1940 Act) as an open-end management investment company and is organized as a Maryland corporation. Select Fund (the fund) is one fund in a series issued by the corporation. The fund is diversified as defined under the 1940 Act. The fund’s investment objective is to seek long-term capital growth. The fund pursues its objective by purchasing stocks of larger-sized companies that management believes will increase in value over time. The fund is authorized to issue the Investor Class, the Institutional Class, the A Class, the B Class, the C Class and the R Class. The A Class may incur an initial sales charge. The A Class, B Class and C Class may be subject to a contingent deferred sales charge. The share classes differ principally in their respective sales charges and distribution and shareholder servicing expenses and arrangements. The Institutional Class is made available to institutional shareholders or through financial intermediaries whose clients do not require the same level of shareholder and administrative services as shareholders of other classes. As a result, the Institutional Class is charged a lower unified management fee.
2. Significant Accounting Policies
The following is a summary of significant accounting policies consistently followed by the fund in preparation of its financial statements. The financial statements are prepared in conformity with accounting principles generally accepted in the United States of America, which may require management to make certain estimates and assumptions at the date of the financial statements. Actual results could differ from these estimates.
Investment Valuations — The fund determines the fair value of its investments and computes its net asset value per share as of the close of regular trading (usually 4 p.m. Eastern time) on the New York Stock Exchange (NYSE) on each day the NYSE is open.
Equity securities that are listed or traded on a domestic securities exchange are valued at the last reported sales price or at the official closing price as provided by the exchange. Equity securities traded on foreign securities exchanges are typically valued at the closing price on the exchange where primarily traded or as of the close of the NYSE, if that is earlier. If no last sales price is reported, or if local convention or regulation so provides, the mean of the latest bid and asked prices is used. Depending on local convention or regulation, securities traded over-the-counter are valued at the mean of the latest bid and asked prices, the last sales price, or the official closing price. In its determination of fair value, the fund may review several factors including: market information specific to a security; news developments in U.S. and foreign markets; the performance of particular U.S. and foreign securities, indices, comparable securities, American Depositary Receipts, Exchange Traded Funds, and other relevant market indicators.
Debt securities maturing within 60 days at the time of purchase may be valued at cost, plus or minus any amortized discount or premium or at the evaluated mean as provided by an independent pricing service. Evaluated mean prices are commonly derived through utilization of market models, which may consider, among other factors, trade data, quotations from dealers and active market makers, relevant yield curve and spread data, related sector levels, creditworthiness, and other relevant market information on the same or comparable securities.
Investments in open-end management investment companies are valued at the reported net asset value per share. Repurchase agreements are valued at cost. Forward foreign currency exchange contracts are valued at the mean of the latest bid and asked prices of the forward currency rates as provided by an independent pricing service.
The value of investments initially expressed in foreign currencies is translated into U.S. dollars at prevailing exchange rates.
If the fund determines that the market price for a portfolio security is not readily available or the valuation methods mentioned above do not reflect a security’s fair value, such security is valued as determined in good faith by the Board of Directors or its designee, in accordance with procedures adopted by the Board of Directors. Circumstances that may cause the fund to use these procedures to value a security include, but are not limited to: a security has been declared in default; trading in a security has been halted during the trading day; there is a foreign market holiday and no trading occurred; or an event occurred between the close of a foreign exchange and the NYSE that may affect the value of a security.
Security Transactions — Security transactions are accounted for as of the trade date. Net realized gains and losses are determined on the identified cost basis, which is also used
for federal income tax purposes.
Investment Income — Dividend income less foreign taxes withheld, if any, is recorded as of the ex-dividend date. Interest income is recorded on the accrual basis and includes accretion of discounts and amortization of premiums.
Foreign Currency Translations — All assets and liabilities initially expressed in foreign currencies are translated into U.S. dollars at prevailing exchange rates at period end. The fund may enter into spot foreign currency exchange contracts to facilitate transactions denominated in a foreign currency. Purchases and sales of investment securities, dividend and interest income, spot foreign currency exchange contracts, and expenses are translated at the rates of exchange prevailing on the respective dates of such transactions. Net realized and unrealized foreign currency exchange gains or losses related to investment securities are a component of net realized gain (loss) on investment transactions and net unrealized appreciation (depreciation) on investments, respectively.
Repurchase Agreements — The fund may enter into repurchase agreements with institutions that American Century Investment Management, Inc. (ACIM) (the investment advisor) has determined are creditworthy pursuant to criteria adopted by the Board of Directors. The fund requires that the collateral, represented by securities, received in a repurchase transaction be transferred to the custodian in a manner sufficient to enable the fund to obtain those securities in the event of a default under the repurchase agreement. ACIM monitors, on a daily basis, the securities transferred to ensure the value, including accrued interest, of the securities under each repurchase agreement is equal to or greater than amounts owed to the fund under each repurchase agreement.
Joint Trading Account — Pursuant to an Exemptive Order issued by the Securities and Exchange Commission, the fund, along with certain other funds in the American Century Investments family of funds, may transfer uninvested cash balances into a joint trading account. These balances are invested in one or more repurchase agreements that are collateralized by U.S. Treasury or Agency obligations.
Income Tax Status — It is the fund’s policy to distribute substantially all net investment income and net realized gains to shareholders and to otherwise qualify as a regulated investment company under provisions of the Internal Revenue Code. The fund is no longer subject to examination by tax authorities for years prior to 2007. At this time, management believes there are no uncertain tax positions which, based on their technical merit, would not be sustained upon examination and for which it is reasonably possible that the total amounts of unrecognized tax benefits will significantly change in the next twelve months. Accordingly, no provision has been made for federal or state income taxes.
Multiple Class — All shares of the fund represent an equal pro rata interest in the net assets of the class to which such shares belong, and have identical voting, dividend, liquidation and other rights and the same terms and conditions, except for class specific expenses and exclusive rights to vote on matters affecting only individual classes. Income, non-class specific expenses, and realized and unrealized capital gains and losses of the fund are allocated to each class of shares based on their relative net assets.
Distributions to Shareholders — Distributions to shareholders are recorded on the ex-dividend date. Distributions from net investment income and net realized gains, if any, are generally declared and paid annually.
Indemnifications — Under the corporation’s organizational documents, its officers and directors are indemnified against certain liabilities arising out of the performance of their duties to the fund. In addition, in the normal course of business, the fund enters into contracts that provide general indemnifications. The maximum exposure under these arrangements is unknown as this would involve future claims that may be made against a fund. The risk of material loss from such claims is considered by management to be remote.
3. Fees and Transactions with Related Parties
Management Fees — The corporation has entered into a management agreement with ACIM, under which ACIM provides the fund with investment advisory and management services in exchange for a single, unified management fee (the fee) per class. The agreement provides that all expenses of managing and operating the fund, except distribution and service fees, brokerage expenses, taxes, interest, fees and expenses of the independent directors (including legal counsel fees), and extraordinary expenses, will be paid by ACIM. The fee is computed and accrued daily based on each class’s daily net assets and paid monthly in arrears. The rate of the fee is determined by applying a fee rate calculation formula. This formula takes into account the fund’s assets as well as certain a ssets, if any, of other clients of the investment advisor outside the American Century Investments family of funds (such as subadvised funds and separate accounts) that have very similar investment teams and investment strategies (strategy assets). The annual management fee schedule ranges from 0.800% to 1.000% for the Investor Class, A Class, B Class, C Class and R Class. The Institutional Class is 0.200% less at each point within the range. The effective annual management fee for each class for the year ended October 31, 2010 was 1.00% for the Investor Class, A Class, B Class, C Class and R Class and 0.80% for the Institutional Class.
Distribution and Service Fees — The Board of Directors has adopted a separate Master Distribution and Individual Shareholder Services Plan for each of the A Class, B Class, C Class and R Class (collectively the plans), pursuant to Rule 12b-1 of the 1940 Act. The plans provide that the A Class will pay American Century Investment Services, Inc. (ACIS) an annual distribution and service fee of 0.25%. The plans provide that the B Class and C Class will each pay ACIS an annual distribution and service fee of 1.00%, of which 0.25% is paid for individual shareholder services and 0.75% is paid for distribution service s. The plans provide that the R Class will pay ACIS an annual distribution and service fee of 0.50%. The fees are computed and accrued daily based on each class’s daily net assets and paid monthly in arrears. The fees are used to pay financial intermediaries for distribution and individual shareholder services. Fees incurred under the plans during the year ended October 31, 2010, are detailed in the Statement of Operations.
Related Parties — Certain officers and directors of the corporation are also officers and/or directors of American Century Companies, Inc. (ACC), the parent of the corporation’s investment advisor, ACIM, the distributor of the corporation, ACIS, and the corporation’s transfer agent, American Century Services, LLC.
The fund is eligible to invest in a money market fund for temporary purposes, which is managed by J.P. Morgan Investment Management, Inc. (JPMIM). The fund has a securities lending agreement with JPMorgan Chase Bank (JPMCB) and a mutual funds services agreement with J.P. Morgan Investor Services Co. (JPMIS). JPMCB is a custodian of the fund. JPMIM, JPMIS and JPMCB are wholly owned subsidiaries of JPMorgan Chase & Co. (JPM). JPM is an equity investor in ACC.
4. Investment Transactions
Purchases and sales of investment securities, excluding short-term investments, for the year ended October 31, 2010, were $573,816,252 and $716,429,479, respectively.
5. Capital Share Transactions
Transactions in shares of the fund were as follows:
| | | |
| | Year ended October 31, 2010 | Year ended October 31, 2009 |
| | Shares | Amount | Shares | Amount |
| Investor Class/Shares Authorized | 300,000,000 | | 300,000,000 | |
| Sold | 1,050,151 | $ 34,737,773 | 1,400,628 | $ 36,567,221 |
| Issued in reinvestment of distributions | 238,915 | 7,886,605 | 571,178 | 13,496,935 |
| Redeemed | (4,873,529) | (160,602,909) | (5,114,851) | (131,631,069) |
| | (3,584,463) | (117,978,531) | (3,143,045) | (81,566,913) |
| Institutional Class/Shares Authorized | 40,000,000 | | 40,000,000 | |
| Sold | 22,888 | 771,300 | 24,800 | 656,737 |
| Issued in reinvestment of distributions | 851 | 28,366 | 45,572 | 1,087,343 |
| Redeemed | (24,480) | (817,754) | (3,498,181) | (98,618,933) |
| | (741) | (18,088) | (3,427,809) | (96,874,853) |
| A Class/Shares Authorized | 75,000,000 | | 75,000,000 | |
| Sold | 64,941 | 2,090,917 | 108,639 | 2,795,413 |
| Issued in reinvestment of distributions | 1,473 | 47,993 | 6,049 | 140,997 |
| Redeemed | (134,115) | (4,336,286) | (208,719) | (5,214,096) |
| | (67,701) | (2,197,376) | (94,031) | (2,277,686) |
| B Class/Shares Authorized | 25,000,000 | | 25,000,000 | |
| Sold | 925 | 27,964 | 3,185 | 78,585 |
| Issued in reinvestment of distributions | — | — | 76 | 1,743 |
| Redeemed | (18,364) | (576,033) | (37,234) | (895,666) |
| | (17,439) | (548,069) | (33,973) | (815,338) |
| C Class/Shares Authorized | 25,000,000 | | 25,000,000 | |
| Sold | 5,833 | 180,826 | 2,023 | 54,994 |
| Issued in reinvestment of distributions | — | — | 9 | 204 |
| Redeemed | (5,028) | (153,876) | (7,003) | (170,151) |
| | 805 | 26,950 | (4,971) | (114,953) |
| R Class/Shares Authorized | 50,000,000 | | 50,000,000 | |
| Sold | 72 | 2,323 | 434 | 12,430 |
| Issued in reinvestment of distributions | — | — | 7 | 175 |
| Redeemed | (676) | (21,856) | (276) | (6,095) |
| | (604) | (19,533) | 165 | 6,510 |
| Net increase (decrease) | (3,670,143) | $(120,734,647) | (6,703,664) | $(181,643,233) |
6. Fair Value Measurements
The fund’s securities valuation process is based on several considerations and may use multiple inputs to determine the fair value of the positions held by the fund. In conformity with accounting principles generally accepted in the United States of America, the inputs used to determine a valuation are classified into three broad levels as follows:
| • | Level 1 valuation inputs consist of unadjusted quoted prices in an active market for identical securities; |
| • | Level 2 valuation inputs consist of direct or indirect observable market data (including quoted prices for similar securities, evaluations of subsequent market events, interest rates, prepayment speeds, credit risk, etc.); or |
| • | Level 3 valuation inputs consist of unobservable data (including a fund’s own assumptions). |
The level classification is based on the lowest level input that is significant to the fair valuation measurement. The valuation inputs are not necessarily an indication of the risks associated with investing in these securities or other financial instruments.
The following is a summary of the level classifications as of period end. The Schedule of Investments provides additional information on the fund’s portfolio holdings.
| | | | |
| | Level 1 | Level 2 | Level 3 |
| Investment Securities | | | |
| Domestic Common Stocks | $1,570,746,366 | — | — |
| Foreign Common Stocks | 111,095,711 | $43,443,425 | — |
| Temporary Cash Investments | 81,519 | 23,200,000 | — |
| Total Value of Investment Securities | $1,681,923,596 | $66,643,425 | — |
| | | | |
| Other Financial Instruments | | | |
Total Unrealized Gain (Loss) on Forward Foreign Currency Exchange Contracts | — | $(292,666) | — |
7. Derivative Instruments
Foreign Currency Risk — The fund is subject to foreign currency exchange rate risk in the normal course of pursuing its investment objectives. The value of foreign investments held by a fund may be significantly affected by changes in foreign currency exchange rates. The dollar value of a foreign security generally decreases when the value of the dollar rises against the foreign currency in which the security is denominated and tends to increase when the value of the dollar declines against such foreign currency. A fund may enter into forward foreign currency exchange contracts to reduce a fund’s exposure to foreign currency exchange rate fluctuations. The net U.S. dollar value of foreign currency underlying all contractual commitments held by a fund and the resulting unrealized appreciation or depreciation are determined daily using prevailing exchange rates. Realized gain or loss is recorded upon the termination of the contract. Net realized and unrealized gains or losses occurring during the holding period of forward foreign currency exchange contracts are a component of net realized gain (loss) on foreign currency transactions and change in net unrealized appreciation (depreciation) on translation of assets and liabilities in foreign currencies, respectively. A fund bears the risk of an unfavorable change in the foreign currency exchange rate underlying the forward contract. Additionally, losses, up to the fair value, may arise if the counterparties do not perform under the contract terms. The risk of loss from non-performance by the counterparty may be reduced by the use of master netting agreements. The foreign currency risk derivative instruments held at period end as disclosed on the Schedule of Investments are indicative of the fund’s typical volume during the period.
The value of foreign currency risk derivative instruments as of October 31, 2010, is disclosed on the Statement of Assets and Liabilities as a liability of $292,666 in unrealized loss on forward foreign currency exchange contracts. For the year ended October 31, 2010, the effect of foreign currency risk derivative instruments on the Statement of Operations was $418,802 in net realized gain (loss) on foreign currency transactions and $(163,359) in change in net unrealized appreciation (depreciation) on translation of assets and liabilities in foreign currencies.
8. Risk Factors
There are certain risks involved in investing in foreign securities. These risks include those resulting from future adverse political, social, and economic developments, fluctuations in currency exchange rates, the possible imposition of exchange controls, and other foreign laws or restrictions.
9. Federal Tax Information
On December 14, 2010, the fund declared and paid the following per-share distributions from net investment income to shareholders of record on December 13, 2010:
| | | | | | |
| Investor | Institutional | A | B | C | R |
| $0.1238 | $0.1993 | $0.0295 | — | — | — |
The tax character of distributions paid during the years ended October 31, 2010 and October 31, 2009 were as follows:
| | | |
| | 2010 | 2009 |
| Distributions Paid From |
| Ordinary income | $8,306,093 | $15,330,593 |
| Long-term capital gains | — | — |
The book-basis character of distributions made during the year from net investment income or net realized gains may differ from their ultimate characterization for federal income tax purposes. These differences reflect the differing character of certain income items and net realized gains and losses for financial statement and tax purposes, and may result in reclassification among certain capital accounts on the financial statements.
As of October 31, 2010, the federal tax cost of investments and the components of distributable earnings on a tax-basis were as follows:
| | |
| Federal tax cost of investments | $1,389,284,541 |
| Gross tax appreciation of investments | $379,021,681 |
| Gross tax depreciation of investments | (19,739,201) |
| Net tax appreciation (depreciation) of investments | $359,282,480 |
Net tax appreciation (depreciation) on derivatives and translation of assets and liabilities in foreign currencies | $1,758 |
| Net tax appreciation (depreciation) | $359,284,238 |
| Undistributed ordinary income | $5,967,611 |
| Accumulated capital losses | $(211,114,347) |
The difference between book-basis and tax-basis cost and unrealized appreciation (depreciation) is attributable primarily to the tax deferral of losses on wash sales and the realization for tax purposes of unrealized gains (losses) on certain forward foreign currency exchange contracts.
The accumulated capital losses represent net capital loss carryovers that may be used to offset future realized capital gains for federal income tax purposes. Future capital loss carryover utilization in any given year may be subject to Internal Revenue Code limitations. Capital loss carryovers of $(14,707,162), $(175,918,131) and $(20,489,054) expire in 2016, 2017 and 2018, respectively.
10. Corporate Event
As part of a long-standing estate and business succession plan established by James E. Stowers, Jr., the founder of American Century Investments, ACC Chairman Richard W. Brown succeeded Mr. Stowers as trustee of a trust that holds a greater-than-25% voting interest in ACC, the parent corporation of the fund’s advisor. Under the 1940 Act, this is presumed to represent control of ACC even though it is less than a majority interest. The change of trustee was considered a change of control of ACC and therefore also a change of control of the fund’s advisor even though there has been no change to its management and none is anticipated. The change of control resulted in the assignment of the fund’s investment advisory agreement. As required by the 1940 Act, the assignment automatically terminated such agreem ent, making the approval of a new agreement necessary.
On February 18, 2010, the Board of Directors approved an interim investment advisory agreement under which the fund was managed until a new agreement was approved. The new agreement for the fund was approved by the Board of Directors on March 29, 2010, and by shareholders at a Special Meeting of Shareholders on June 16, 2010. It went into effect on July 16, 2010. The new agreement, which is substantially identical to the terminated agreement (with the exception of different effective and termination dates), did not result in changes in the management of American Century Investments, the fund, its investment objectives, fees or services provided.
11. Other Tax Information (Unaudited)
The following information is provided pursuant to provisions of the Internal Revenue Code.
The fund hereby designates up to the maximum amount allowable as qualified dividend income for the fiscal year ended October 31, 2010.
For corporate taxpayers, the fund hereby designates $8,306,093, or up to the maximum amount allowable, of ordinary income distributions paid during the fiscal year ended October 31, 2010 as qualified for the corporate dividends received deduction.
Select
| |
| Investor Class |
| For a Share Outstanding Throughout the Years Ended October 31 |
| | 2010 | 2009 | 2008 | 2007 | 2006 |
| Per-Share Data |
| Net Asset Value, Beginning of Period | $30.58 | $26.25 | $45.58 | $36.22 | $37.04 |
| Income From Investment Operations | | | | | |
Net Investment Income (Loss)(1) | 0.11 | 0.19 | 0.07 | 0.04 | 0.21 |
| Net Realized and Unrealized Gain (Loss) | 5.01 | 4.40 | (16.10) | 10.06 | (0.77) |
| Total From Investment Operations | 5.12 | 4.59 | (16.03) | 10.10 | (0.56) |
| Distributions | | | | | |
| From Net Investment Income | (0.16) | (0.26) | — | (0.16) | (0.26) |
| From Net Realized Gains | — | — | (3.30) | (0.58) | — |
| Total Distributions | (0.16) | (0.26) | (3.30) | (0.74) | (0.26) |
| Net Asset Value, End of Period | $35.54 | $30.58 | $26.25 | $45.58 | $36.22 |
| | | | | | |
Total Return(2) | 16.78% | 17.77% | (37.71)% | 28.37% | (1.55)% |
| | | | | | |
| Ratios/Supplemental Data |
Ratio of Operating Expenses to Average Net Assets | 1.01% | 1.00% | 1.00% | 1.00% | 1.00% |
Ratio of Net Investment Income (Loss) to Average Net Assets | 0.34% | 0.75% | 0.19% | 0.11% | 0.57% |
| Portfolio Turnover Rate | 35% | 31% | 64% | 79% | 206% |
| Net Assets, End of Period (in millions) | $1,722 | $1,592 | $1,449 | $2,550 | $2,576 |
| (1) | Computed using average shares outstanding throughout the period. |
| (2) | Total returns are calculated based on the net asset value of the last business day. Total returns for periods less than one year are not annualized. |
See Notes to Financial Statements.
Select
| Institutional Class |
| For a Share Outstanding Throughout the Years Ended October 31 |
| | 2010 | 2009 | 2008 | 2007 | 2006 |
| Per-Share Data |
| Net Asset Value, Beginning of Period | $30.94 | $26.56 | $45.98 | $36.53 | $37.35 |
| Income From Investment Operations | | | | | |
Net Investment Income (Loss)(1) | 0.18 | 0.28 | 0.15 | 0.12 | 0.30 |
| Net Realized and Unrealized Gain (Loss) | 5.06 | 4.41 | (16.27) | 10.15 | (0.78) |
| Total From Investment Operations | 5.24 | 4.69 | (16.12) | 10.27 | (0.48) |
| Distributions | | | | | |
| From Net Investment Income | (0.23) | (0.31) | — | (0.24) | (0.34) |
| From Net Realized Gains | — | — | (3.30) | (0.58) | — |
| Total Distributions | (0.23) | (0.31) | (3.30) | (0.82) | (0.34) |
| Net Asset Value, End of Period | $35.95 | $30.94 | $26.56 | $45.98 | $36.53 |
| | | | | | |
Total Return(2) | 17.02% | 18.00% | (37.60)% | 28.63% | (1.35)% |
| | | | | | |
| Ratios/Supplemental Data |
Ratio of Operating Expenses to Average Net Assets | 0.81% | 0.80% | 0.80% | 0.80% | 0.80% |
Ratio of Net Investment Income (Loss) to Average Net Assets | 0.54% | 0.95% | 0.39% | 0.31% | 0.77% |
| Portfolio Turnover Rate | 35% | 31% | 64% | 79% | 206% |
| Net Assets, End of Period (in thousands) | $4,563 | $3,950 | $94,419 | $168,441 | $148,717 |
| (1) | Computed using average shares outstanding throughout the period. |
| (2) | Total returns are calculated based on the net asset value of the last business day. Total returns for periods less than one year are not annualized. |
See Notes to Financial Statements.
Select
A Class(1) |
| For a Share Outstanding Throughout the Years Ended October 31 |
| | 2010 | 2009 | 2008 | 2007 | 2006 |
| Per-Share Data |
| Net Asset Value, Beginning of Period | $30.11 | $25.85 | $45.05 | $35.80 | $36.63 |
| Income From Investment Operations | | | | | |
Net Investment Income (Loss)(2) | 0.03 | 0.13 | (0.02) | (0.09) | 0.12 |
| Net Realized and Unrealized Gain (Loss) | 4.93 | 4.33 | (15.88) | 9.99 | (0.76) |
| Total From Investment Operations | 4.96 | 4.46 | (15.90) | 9.90 | (0.64) |
| Distributions | | | | | |
| From Net Investment Income | (0.08) | (0.20) | — | (0.07) | (0.19) |
| From Net Realized Gains | — | — | (3.30) | (0.58) | — |
| Total Distributions | (0.08) | (0.20) | (3.30) | (0.65) | (0.19) |
| Net Asset Value, End of Period | $34.99 | $30.11 | $25.85 | $45.05 | $35.80 |
| | | | | | |
Total Return(3) | 16.48% | 17.47% | (37.88)% | 28.07% | (1.79)% |
| | | | | | |
| Ratios/Supplemental Data |
Ratio of Operating Expenses to Average Net Assets | 1.26% | 1.25% | 1.25% | 1.25% | 1.25% |
Ratio of Net Investment Income (Loss) to Average Net Assets | 0.09% | 0.50% | (0.06)% | (0.14)% | 0.32% |
| Portfolio Turnover Rate | 35% | 31% | 64% | 79% | 206% |
| Net Assets, End of Period (in thousands) | $20,666 | $19,824 | $19,450 | $42,770 | $21,455 |
| (1) | Prior to September 4, 2007, the A Class was referred to as the Advisor Class. |
| (2) | Computed using average shares outstanding throughout the period. |
| (3) | Total returns are calculated based on the net asset value of the last business day and do not reflect applicable sales charges. Total returns for periods less than one year are not annualized. |
See Notes to Financial Statements.
Select
| B Class |
| For a Share Outstanding Throughout the Years Ended October 31 |
| | 2010 | 2009 | 2008 | 2007 | 2006 |
| Per-Share Data |
| Net Asset Value, Beginning of Period | $29.15 | $25.03 | $44.03 | $35.21 | $36.12 |
| Income From Investment Operations | | | | | |
Net Investment Income (Loss)(1) | (0.21) | (0.06) | (0.29) | (0.34) | (0.12) |
| Net Realized and Unrealized Gain (Loss) | 4.76 | 4.20 | (15.41) | 9.74 | (0.79) |
| Total From Investment Operations | 4.55 | 4.14 | (15.70) | 9.40 | (0.91) |
| Distributions | | | | | |
| From Net Investment Income | — | (0.02) | — | — | — |
| From Net Realized Gains | — | — | (3.30) | (0.58) | — |
| Total Distributions | — | (0.02) | (3.30) | (0.58) | — |
| Net Asset Value, End of Period | $33.70 | $29.15 | $25.03 | $44.03 | $35.21 |
| | | | | | |
Total Return(2) | 15.61% | 16.60% | (38.36)% | 27.07% | (2.52)% |
| | | | | | |
| Ratios/Supplemental Data |
Ratio of Operating Expenses to Average Net Assets | 2.01% | 2.00% | 2.00% | 2.00% | 2.00% |
Ratio of Net Investment Income (Loss) to Average Net Assets | (0.66)% | (0.25)% | (0.81)% | (0.89)% | (0.43)% |
| Portfolio Turnover Rate | 35% | 31% | 64% | 79% | 206% |
| Net Assets, End of Period (in thousands) | $1,776 | $2,045 | $2,605 | $5,567 | $5,880 |
| (1) | Computed using average shares outstanding throughout the period. |
| (2) | Total returns are calculated based on the net asset value of the last business day and do not reflect applicable sales charges. Total returns for periods less than one year are not annualized. |
See Notes to Financial Statements.
Select
| C Class |
| For a Share Outstanding Throughout the Years Ended October 31 |
| | 2010 | 2009 | 2008 | 2007 | 2006 |
| Per-Share Data |
| Net Asset Value, Beginning of Period | $29.19 | $25.05 | $44.07 | $35.24 | $36.15 |
| Income From Investment Operations | | | | | |
Net Investment Income (Loss)(1) | (0.20) | (0.06) | (0.29) | (0.34) | (0.16) |
| Net Realized and Unrealized Gain (Loss) | 4.75 | 4.22 | (15.43) | 9.75 | (0.75) |
| Total From Investment Operations | 4.55 | 4.16 | (15.72) | 9.41 | (0.91) |
| Distributions | | | | | |
| From Net Investment Income | — | (0.02) | — | — | — |
| From Net Realized Gains | — | — | (3.30) | (0.58) | — |
| Total Distributions | — | (0.02) | (3.30) | (0.58) | — |
| Net Asset Value, End of Period | $33.74 | $29.19 | $25.05 | $44.07 | $35.24 |
| | | | | | |
Total Return(2) | 15.63% | 16.58% | (38.34)% | 27.07% | (2.52)% |
| | | | | | |
| Ratios/Supplemental Data |
Ratio of Operating Expenses to Average Net Assets | 2.01% | 2.00% | 2.00% | 2.00% | 2.00% |
Ratio of Net Investment Income (Loss) to Average Net Assets | (0.66)% | (0.25)% | (0.81)% | (0.89)% | (0.43)% |
| Portfolio Turnover Rate | 35% | 31% | 64% | 79% | 206% |
| Net Assets, End of Period (in thousands) | $390 | $314 | $394 | $1,001 | $1,540 |
| (1) | Computed using average shares outstanding throughout the period. |
| (2) | Total returns are calculated based on the net asset value of the last business day and do not reflect applicable sales charges. Total returns for periods less than one year are not annualized. |
See Notes to Financial Statements.
Select
| R Class |
| For a Share Outstanding Throughout the Years Ended October 31 |
| | 2010 | 2009 | 2008 | 2007 | 2006 |
| Per-Share Data |
| Net Asset Value, Beginning of Period | $30.24 | $25.96 | $45.33 | $36.05 | $37.00 |
| Income From Investment Operations | | | | | |
Net Investment Income (Loss)(1) | (0.05) | 0.06 | (0.11) | (0.15) | 0.03 |
| Net Realized and Unrealized Gain (Loss) | 4.95 | 4.36 | (15.96) | 10.01 | (0.77) |
| Total From Investment Operations | 4.90 | 4.42 | (16.07) | 9.86 | (0.74) |
| Distributions | | | | | |
| From Net Investment Income | — | (0.14) | — | — | (0.21) |
| From Net Realized Gains | — | — | (3.30) | (0.58) | — |
| Total Distributions | — | (0.14) | (3.30) | (0.58) | (0.21) |
| Net Asset Value, End of Period | $35.14 | $30.24 | $25.96 | $45.33 | $36.05 |
| | | | | | |
Total Return(2) | 16.20% | 17.17% | (38.03)% | 27.72% | (2.04)% |
| | | | | | |
| Ratios/Supplemental Data |
Ratio of Operating Expenses to Average Net Assets | 1.51% | 1.50% | 1.50% | 1.50% | 1.50% |
Ratio of Net Investment Income (Loss) to Average Net Assets | (0.16)% | 0.25% | (0.31)% | (0.39)% | 0.07% |
| Portfolio Turnover Rate | 35% | 31% | 64% | 79% | 206% |
| Net Assets, End of Period (in thousands) | $29 | $43 | $32 | $32 | $24 |
| (1) | Computed using average shares outstanding throughout the period. |
| (2) | Total returns are calculated based on the net asset value of the last business day. Total returns for periods less than one year are not annualized. |
See Notes to Financial Statements.
Report of Independent Registered Public Accounting Firm
The Board of Directors and Shareholders,
American Century Mutual Funds, Inc.:
We have audited the accompanying statement of assets and liabilities, including the schedule of investments, of Select Fund, one of the funds constituting American Century Mutual Funds, Inc. (the “Corporation”), as of October 31, 2010, and the related statement of operations for the year then ended, the statements of changes in net assets for each of the two years in the period then ended, and the financial highlights for each of the five years in the period then ended. These financial statements and financial highlights are the responsibility of the Corporation’s management. Our responsibility is to express an opinion on these financial statements and financial highlights based on our audits.
We conducted our audits in accordance with the standards of the Public Company Accounting Oversight Board (United States). Those standards require that we plan and perform the audit to obtain reasonable assurance about whether the financial statements and financial highlights are free of material misstatement. The Corporation is not required to have, nor were we engaged to perform, an audit of its internal control over financial reporting. Our audits included consideration of internal control over financial reporting as a basis for designing audit procedures that are appropriate in the circumstances, but not for the purpose of expressing an opinion on the effectiveness of the Corporation’s internal control over financial reporting. Accordingly, we express no such opinion. An audit also includes examining, on a te st basis, evidence supporting the amounts and disclosures in the financial statements, assessing the accounting principles used and significant estimates made by management, as well as evaluating the overall financial statement presentation. Our procedures included confirmation of securities owned as of October 31, 2010, by correspondence with the custodian and brokers; where replies were not received from brokers, we performed other auditing procedures. We believe that our audits provide a reasonable basis for our opinion.
In our opinion, the financial statements and financial highlights referred to above present fairly, in all material respects, the financial position of Select Fund of American Century Mutual Funds, Inc., as of October 31, 2010, the results of its operations for the year then ended, the changes in its net assets for each of the two years in the period then ended, and the financial highlights for each of the five years in the period then ended, in conformity with accounting principles generally accepted in the United States of America.
Deloitte & Touche LLP
Kansas City, Missouri
December 20, 2010
A special meeting of shareholders was held on June 16, 2010, to vote on the following proposals. Each proposal received the required number of votes and was adopted. A summary of voting results is listed below each proposal.
Proposal 1:
To elect one Director to the Board of Directors of American Century Mutual Funds, Inc. (the proposal was voted on by all shareholders of funds issued by American Century Mutual Funds, Inc.):
| | | | | |
| | John R. Whitten | For: | 13,907,426,552 | |
| | | Withhold: | 629,801,798 | |
| | | Abstain: | 0 | |
| | | Broker Non-Vote: | 0 | |
The other directors whose term of office continued after the meeting include Jonathan S. Thomas, Thomas A. Brown, Andrea C. Hall, James A. Olson, Donald H. Pratt, and M. Jeannine Strandjord.
Proposal 2:
To approve a management agreement between the fund and American Century Investment Management, Inc.:
| | | | | |
| | Investor, A, B, C and R Classes | For: | 1,129,290,760 | |
| | | Against: | 21,257,428 | |
| | | Abstain: | 35,975,917 | |
| | | Broker Non-Vote: | 68,939,336 | |
| | | |
| | Institutional Class | For: | 4,669,617 | |
| | | Against: | 0 | |
| | | Abstain: | 0 | |
| | | Broker Non-Vote: | 15 | |
Proposal 3:
To approve an amendment to the Articles of Incorporation to limit certain director liability to the extent permitted by Maryland law (the proposal was voted on by all shareholders of funds issued by American Century Mutual Funds, Inc.):
| | | | | |
| | | For: | 12,112,932,038 | |
| | | Against: | 769,504,652 | |
| | | Abstain: | 420,034,445 | |
| | | Broker Non-Vote: | 1,234,757,216 | |
The Board of Directors
The individuals listed below serve as directors of the fund. Each director will continue to serve in this capacity until death, retirement, resignation or removal from office. The mandatory retirement age for directors who are not “interested persons,” as that term is defined in the Investment Company Act (independent directors), is 72. However, the mandatory retirement age for an individual director may be extended with the approval of the remaining independent directors.
Mr. Thomas is the only director who is an “interested person” because he currently serves as President and Chief Executive Officer of American Century Companies, Inc. (ACC), the parent company of American Century Investment Management, Inc. (ACIM or the advisor).
The other directors (more than three-fourths of the total number) are independent; that is, they have never been employees, directors or officers of, and have no financial interest in, ACC or any of its wholly owned, direct or indirect, subsidiaries, including ACIM, American Century Investment Services, Inc. (ACIS) and American Century Services, LLC (ACS). The directors serve in this capacity for seven (in the case of Mr. Thomas, 15) registered investment companies in the American Century Investments family of funds.
The following presents additional information about the directors. The mailing address for each director is 4500 Main Street, Kansas City, Missouri 64111.
Independent Directors
Thomas A. Brown
Year of Birth: 1940
Position(s) with the Fund: Director
Length of Time Served: Since 1980
Principal Occupation(s) During the Past Five Years: Managing Member, Associated Investments, LLC (real estate investment company); Brown Cascade Properties, LLC (real estate investment company) (2001 to 2009)
Number of Funds in Fund Complex Overseen by Director: 61
Other Directorships Held by Director During the Past Five Years: None
Education/Other Professional Experience: BS in Mechanical Engineering, University of Kansas; formerly, Chief Executive Officer, Associated Bearings Company; formerly, Area Vice President, Applied Industrial Technologies (bearings and power transmission company)
Andrea C. Hall
Year of Birth: 1945
Position(s) with the Fund: Director
Length of Time Served: Since 1997
Principal Occupation(s) During the Past Five Years: Retired as advisor to the President, Midwest Research Institute (not-for-profit research organization) (June 2006)
Number of Funds in Fund Complex Overseen by Director: 61
Other Directorships Held by Director During the Past Five Years: None
Education/Other Professional Experience: BS in Biology, Florida State University; PhD in Biology, Georgetown University; formerly, Senior Vice President and Director of Research Operations, Midwest Research Institute
James A. Olson
Year of Birth: 1942
Position(s) with the Fund: Director
Length of Time Served: Since 2007
Principal Occupation(s) During the Past Five Years: Member, Plaza Belmont LLC (private equity fund manager); Chief Financial Officer, Plaza Belmont LLC (September 1999 to September 2006)
Number of Funds in Fund Complex Overseen by Director: 61
Other Directorships Held by Director During the Past Five Years: Saia, Inc. and Entertainment Properties Trust
Education/Other Professional Experience: BS in Business Administration and MBA, St. Louis University; CPA; 21 years of experience as a partner in the accounting firm of Ernst & Young LLP
Donald H. Pratt
Year of Birth: 1937
Position(s) with the Fund: Director, Chairman of the Board
Length of Time Served: Since 1995 (Chairman since 2005)
Principal Occupation(s) During the Past Five Years: Chairman and Chief Executive Officer, Western Investments, Inc. (real estate company)
Number of Funds in Fund Complex Overseen by Director: 61
Other Directorships Held by Director During the Past Five Years: None
Education/Other Professional Experience: BS in Industrial Engineering, Wichita State University; MBA, Harvard Business School; serves on the Board of Governors of the Independent Directors Council and Investment Company Institute; formerly, Chairman of the Board, Butler Manufacturing Company (metal buildings producer)
M. Jeannine Strandjord
Year of Birth: 1945
Position(s) with the Fund: Director
Length of Time Served: Since 1994
Principal Occupation(s) During the Past Five Years: Retired, formerly, Senior Vice President, Process Excellence, Sprint Corporation (telecommunications company) (January 2005 to September 2005)
Number of Funds in Fund Complex Overseen by Director: 61
Other Directorships Held by Director During the Past Five Years: DST Systems Inc., Euronet Worldwide Inc., Charming Shoppes, Inc.
Education/Other Professional Experience: BS in Business Administration and Accounting, University of Kansas; CPA; formerly, Senior Vice President of Financial Services and Treasurer and Chief Financial Officer, Global Markets Group; Sprint Corporation; formerly, with the accounting firm of Ernst and Whinney
John R. Whitten
Year of Birth: 1946
Position(s) with the Fund: Director
Length of Time Served: Since 2008
Principal Occupation(s) During the Past Five Years: Project Consultant, Celanese Corp. (industrial chemical company)
Number of Funds in Fund Complex Overseen by Director: 61
Other Directorships Held by Director During the Past Five Years: Rudolph Technologies, Inc.
Professional Education/Experience: BS in Business Administration, Cleveland State University; CPA; formerly, Chief Financial Officer and Treasurer, Applied Industrial Technologies, Inc.; thirteen years of experience with accounting firm Deloitte & Touche LLP
Interested Director
Jonathan S. Thomas
Year of Birth: 1963
Position(s) with the Fund: Director and President
Length of Time Served: Since 2007
Principal Occupation(s) During the Past Five Years: President and Chief Executive Officer, ACC (March 2007 to present); Chief Administrative Officer, ACC (February 2006 to February 2007); Executive Vice President, ACC (November 2005 to February 2007). Also serves as: Chief Executive Officer and Manager, ACS; Executive Vice President, ACIM; Director, ACC, ACIM and other ACC subsidiaries
Number of Funds in Fund Complex Overseen by Director: 101
Other Directorships Held by Director During the Past Five Years: None
Education/Other Professional Experience: BA in Economics, University of Massachusetts; MBA, Boston College; formerly held senior leadership roles with Fidelity Investments, Boston Financial Services, Bank of America and Morgan Stanley; serves on the Board of Governors of the Investment Company Institute
Officers
The following table presents certain information about the executive officers of the fund. Each officer serves as an officer for each of the 15 investment companies in the American Century family of funds, unless otherwise noted. No officer is compensated for his or her service as an officer of the fund. The listed officers are interested persons of the fund and are appointed or re-appointed on an annual basis. The mailing address for each of the officers listed below is 4500 Main Street, Kansas City, Missouri 64111.
| | | | |
| | Name (Year of Birth) | Offices with the Fund | Principal Occupation(s) During the Past Five Years |
| | Jonathan S. Thomas (1963) | Director and President since 2007 | President and Chief Executive Officer, ACC (March 2007 to present); Chief Administrative Officer, ACC (February 2006 to February 2007); Executive Vice President, ACC (November 2005 to February 2007). Also serves as: Chief Executive Officer and Manager, ACS; Executive Vice President, ACIM; Director, ACC, ACIM and other ACC subsidiaries |
| | Barry Fink (1955) | Executive Vice President since 2007 | Chief Operating Officer and Executive Vice President, ACC (September 2007 to present); President, ACS (October 2007 to present); Managing Director, Morgan Stanley (2000 to 2007); Global General Counsel, Morgan Stanley (2000 to 2006). Also serves as: Manager, ACS and Director, ACC and certain ACC subsidiaries |
| | Maryanne L. Roepke (1956) | Chief Compliance Officer since 2006 and Senior Vice President since 2000 | Chief Compliance Officer, American Century funds, ACIM and ACS (August 2006 to present); Assistant Treasurer, ACC (January 1995 to August 2006); and Treasurer and Chief Financial Officer, various American Century funds (July 2000 to August 2006). Also serves as: Senior Vice President, ACS |
| | Charles A. Etherington (1957) | General Counsel since 2007 and Senior Vice President since 2006 | Attorney, ACC (February 1994 to present); Vice President, ACC (November 2005 to present), General Counsel, ACC (March 2007 to present); Also serves as General Counsel, ACIM, ACS, ACIS and other ACC subsidiaries; and Senior Vice President, ACIM and ACS |
| | Robert J. Leach (1966) | Vice President, Treasurer and Chief Financial Officer since 2006 | Vice President, ACS (February 2000 to present); and Controller, various American Century funds (1997 to September 2006) |
| | David H. Reinmiller (1963) | Vice President since 2000 | Attorney, ACC (January 1994 to present); Associate General Counsel, ACC (January 2001 to present); Chief Compliance Officer, American Century funds and ACIM (January 2001 to February 2005). Also serves as Vice President, ACIM and ACS |
| | Ward D. Stauffer (1960) | Secretary since 2005 | Attorney, ACC (June 2003 to present) |
The Statement of Additional Information has additional information about the fund’s directors and is available without charge, upon request, by calling 1-800-345-2021.
Retirement Account Information
As required by law, distributions you receive from certain IRAs, or 403(b), 457 and qualified plans are subject to federal income tax withholding, unless you elect not to have withholding apply. Tax will be withheld on the total amount withdrawn even though you may be receiving amounts that are not subject to withholding, such as nondeductible contributions. In such case, excess amounts of withholding could occur. You may adjust your withholding election so that a greater or lesser amount will be withheld.
If you don’t want us to withhold on this amount, you must notify us to not withhold the federal income tax. You may notify us in writing or in certain situations by telephone or through other electronic means. You have the right to revoke your withholding election at any time and any election you make may remain in effect until revoked by filing a new election.
Remember, even if you elect not to have income tax withheld, you are liable for paying income tax on the taxable portion of your withdrawal. If you elect not to have income tax withheld or you don’t have enough income tax withheld, you may be responsible for payment of estimated tax. You may incur penalties under the estimated tax rules if your withholding and estimated tax payments are not sufficient. You can reduce or defer the income tax on a distribution by directly or indirectly rolling such distribution over to another IRA or eligible plan. You should consult your tax advisor for additional information.
State tax will be withheld if, at the time of your distribution, your address is within one of the mandatory withholding states and you have federal income tax withheld. State taxes will be withheld from your distribution in accordance with the respective state rules.
Proxy Voting Guidelines
American Century Investment Management, Inc., the fund’s investment advisor, is responsible for exercising the voting rights associated with the securities purchased and/or held by the fund. A description of the policies and procedures the advisor uses in fulfilling this responsibility is available without charge, upon request, by calling 1-800-345-2021. It is also available on American Century Investments’ website at americancentury.com and on the Securities and Exchange Commission’s website at sec.gov. Information regarding how the investment advisor voted proxies relating to portfolio securities during the most recent 12-month period ended June 30 is available on the “About Us” page at americancentury.com. It is also available at sec.gov.
Quarterly Portfolio Disclosure
The fund files its complete schedule of portfolio holdings with the Securities and Exchange Commission (SEC) for the first and third quarters of each fiscal year on Form N-Q. The fund’s Forms N-Q are available on the SEC’s website at sec.gov, and may be reviewed and copied at the SEC’s Public Reference Room in Washington, DC. Information on the operation of the Public Reference Room may be obtained by calling 1-800-SEC-0330. The fund also makes its complete schedule of portfolio holdings for the most recent quarter of
its fiscal year available on its website at americancentury.com and, upon request, by calling 1-800-345-2021.
The following indices are used to illustrate investment market, sector, or style performance or to serve as fund performance comparisons. They are not investment products available for purchase.
The Russell 1000® Index is a market-capitalization weighted, large-cap index created by Frank Russell Company to measure the performance of the 1,000 largest publicly traded U.S. companies, based on total market capitalization.
The Russell 1000® Growth Index measures the performance of those Russell 1000 Index companies (the 1,000 largest publicly traded U.S. companies, based on total market capitalization) with higher price-to-book ratios and higher forecasted growth values.
The Russell 1000® Value Index measures the performance of those Russell 1000 Index companies (the 1,000 largest publicly traded U.S. companies, based on total market capitalization) with lower price-to-book ratios and lower forecasted growth values.
The Russell 2000® Index is a market-capitalization weighted index created by Frank Russell Company to measure the performance of the 2,000 smallest of the 3,000 largest publicly traded U.S. companies, based on total market capitalization.
The Russell 2000® Growth Index measures the performance of those Russell 2000 Index companies (the 2,000 smallest of the 3,000 largest publicly traded U.S. companies, based on total market capitalization) with higher price-to-book ratios and higher forecasted growth values.
The Russell 2000® Value Index measures the performance of those Russell 2000 Index companies (the 2,000 smallest of the 3,000 largest publicly traded U.S. companies, based on total market capitalization) with lower price-to-book ratios and lower forecasted growth values.
The Russell Midcap® Index measures the performance of the 800 smallest of the 1,000 largest publicly traded U.S. companies, based on total market capitalization.
The Russell Midcap® Growth Index measures the performance of those Russell Midcap Index companies (the 800 smallest of the 1,000 largest publicly traded U.S. companies, based on total market capitalization) with higher price-to-book ratios and higher forecasted growth values.
The Russell Midcap® Value Index measures the performance of those Russell Midcap Index companies (the 800 smallest of the 1,000 largest publicly traded U.S. companies, based on total market capitalization) with lower price-to-book ratios and lower forecasted growth values.
The S&P 500 Index is a market value-weighted index of the stocks of 500 publicly traded U.S. companies chosen for market size, liquidity, and industry group representation that are considered to be leading firms in dominant industries. Each stock’s weight in the index is proportionate to its market value. Created by Standard & Poor’s, it is considered to be a broad measure of U.S. stock market performance.
Notes
| |
| | |
| Contact Us | |
| | |
| americancentury.com | |
| | |
| Automated Information Line | 1-800-345-8765 |
| | |
| Investor Services Representative | 1-800-345-2021 or 816-531-5575 |
| | |
| Investors Using Advisors | 1-800-378-9878 |
| | |
| Business, Not-For-Profit, Employer-Sponsored Retirement Plans | 1-800-345-3533 |
| | |
| Banks and Trust Companies, Broker-Dealers, Financial Professionals, Insurance Companies | 1-800-345-6488 |
| | |
| Telecommunications Device for the Deaf | 1-800-634-4113 |
| | |
| American Century Mutual Funds, Inc. |
| |
Investment Advisor: American Century Investment Management, Inc. Kansas City, Missouri |
| |
| This report and the statements it contains are submitted for the general information of our shareholders. The report is not authorized for distribution to prospective investors unless preceded or accompanied by an effective prospectus. |
American Century Investment Services, Inc., Distributor
©2010 American Century Proprietary Holdings, Inc. All rights reserved.
| Annual Report |
| October 31, 2010 |
American Century Investments®
| | President’s Letter | 2 |
| | Independent Chairman’s Letter | 3 |
| | Market Perspective | 4 |
| | U.S. Stock Index Returns | 4 |
| | | |
| Small Cap Growth |
| |
| | Performance | 5 |
| | Portfolio Commentary | 7 |
| | Top Ten Holdings | 9 |
| | Top Five Industries | 9 |
| | Types of Investments in Portfolio | 9 |
| | | |
| | Shareholder Fee Example | 10 |
| | | |
| Financial Statements |
| |
| | Schedule of Investments | 12 |
| | Statement of Assets and Liabilities | 16 |
| | Statement of Operations | 17 |
| | Statement of Changes in Net Assets | 18 |
| | Notes to Financial Statements | 19 |
| | Financial Highlights | 26 |
| | Report of Independent Registered Public Accounting Firm | 32 |
| | | |
| Other Information |
| |
| | Proxy Voting Results | 33 |
| | Management | 34 |
| | Additional Information | 38 |
| | Index Definitions | 39 |
Any opinions expressed in this report reflect those of the author as of the date of the report, and do not necessarily represent the opinions of American Century Investments or any other person in the American Century Investments organization. Any such opinions are subject to change at any time based upon market or other conditions and American Century Investments disclaims any responsibility to update such opinions. These opinions may not be relied upon as investment advice and, because investment decisions made by American Century Investments funds are based on numerous factors, may not be relied upon as an indication of trading intent on behalf of any American Century Investments fund. Security examples are used for representational purposes only and are not intended as recommendations to purchase or sell securities. Performance information for comparative indices and securities is provided to American Century Investments by third party vendors. To the best of American Century Investments’ knowledge, such information is accurate at the time of printing.
Jonathan Thomas
Dear Investor:
To learn more about the capital markets, your investment, and the portfolio management strategies American Century Investments provides, we encourage you to review this shareholder report for the financial reporting period ended October 31, 2010.
On the following pages, you will find investment performance and portfolio information, presented with the expert perspective and commentary of our portfolio management team. This report remains one of our most important vehicles for conveying the information you need about your investment performance, and about the market factors and strategies that affect fund returns. For additional information on the markets, we encourage you to visit the “Insights & News” tab at our Web site, americancentury.com, for updates and further expert commentary.
The top of our Web site’s home page also provides a link to “Our Story,” which, first and foremost, outlines our commitment—since 1958—to helping clients reach their financial goals. We believe strongly that we will only be successful when our clients are successful. That’s who we are.
Another important, unique facet of our story and who we are is “Profits with a Purpose,” which describes our bond with the Stowers Institute for Medical Research (SIMR). SIMR is a world-class biomedical organization—founded by our company founder James E. Stowers, Jr. and his wife Virginia—that is dedicated to researching the causes, treatment, and prevention of gene-based diseases, including cancer. Through American Century Investments’ private ownership structure, more than 40% of our profits support SIMR.
Mr. Stowers’ example of achieving financial success and using that platform to help humanity motivates our entire American Century Investments team. His story inspires us to help each of our clients achieve success. Thank you for sharing your financial journey with us.
Sincerely,
Jonathan Thomas
President and Chief Executive Officer
American Century Investments
Independent Chairman’s Letter
Don Pratt
Dear Fellow Shareholders,
As regulators and the markets continue to sort out the events of the credit crisis, a consistent theme has been that financial services firms should re-examine their risk management practices. Risk management has been a regular part of American Century Investments’ activities for many years. However, recently American Century and your mutual fund board have been spending additional time focusing on our risk oversight processes.
The board’s efforts are now organized around three categories of risk: investment risk, operational risk, and enterprise risk. This approach has facilitated a realignment of many risk oversight tasks that the board has historically conducted. Investment risk tasks include a review of portfolio risk, monitoring the use of derivatives, and performance assessment. Operational risk focuses on compliance, valuation, shareholder services, and trading activities. Enterprise risk addresses the financial condition of the advisor, human resource development, and reputational risks. Risk oversight tasks are addressed in every quarterly board meeting, and a review of the advisor’s entire risk management program is undertaken annually. We acknowledge and support the approach that American Century Investments takes to its risk management responsibilities. While the board has refocused its efforts in this important oversight area, we recognize that risk oversight is a journey and we expect to continue to improve our processes.
Our September quarterly board meeting was held in the New York offices of American Century Investments. This gave the directors an opportunity to meet with the portfolio management teams for each of the global and international funds overseen by the board. Each team uses sophisticated investment tools and daily risk analysis in managing client assets. We also were impressed with the “bench strength” that has been developed under the leadership of the Global and Non-U.S. Equity CIO Mark Kopinski. These face-to-face meetings provide an opportunity for the directors – working on behalf of shareholders – to validate the advisor’s efforts and the investment management approach being followed.
I thank you for your continued confidence in American Century during this turbulent time in the economy and investment markets. If you have thoughts or questions you would like to share with the board send them to me at dhpratt@fundboardchair.com.
Best regards,
Don Pratt
By David Hollond, Chief Investment Officer,
U.S. Growth Equity—Mid & Small Cap
Stocks Rallied Amid Growing Volatility
U.S. stocks advanced for the 12 months ended October 31, 2010, as the broad equity indices posted double-digit gains. Virtually all of the market’s gains occurred in the first six months of the period, when stocks continued to climb after reaching a multi-year low in March 2009. The key factors behind the rally included favorable economic data, which provided evidence of a burgeoning recovery, and better-than-expected corporate earnings, which resulted largely from cost-cutting measures by many businesses to widen profit margins.
Market conditions changed abruptly in late April as evidence of a pullback in economic activity led to concerns about a relapse into recession. These concerns were amplified by a sovereign debt crisis in Greece that began to spread across Europe. In response, the equity market declined sharply throughout May and June as market volatility increased substantially.
The equity market remained volatile in the third quarter, gaining ground in July and falling back in August amid a tug-of-war between positive corporate earnings reports and an increasingly sluggish economic environment. However, stocks staged a resurgence during the final two months of the period as investors expressed confidence in the Federal Reserve’s plan to revive the economic recovery via another round of quantitative easing.
Small- and Mid-Cap Growth Stocks Outperformed
While stocks advanced across the board, the 12-month period was especially favorable for mid- and small-cap growth stocks. The small- and mid-cap segments of the market led the overall advance, returning more than 25% (see the table below). Smaller companies suffered the largest losses during the downturn in late 2008 and early 2009 and thus far have enjoyed the highest returns during the market’s recovery.
In addition, growth-oriented issues outpaced value shares across all market capitalizations. The best-performing sectors in the market were those traditionally associated with growth, such as information technology and consumer discretionary. In addition, the financials sector—a major component in value indices—underperformed during the period.
| U.S. Stock Index Returns |
| For the 12 months ended October 31, 2010 |
| Russell 1000 Index (Large-Cap) | 17.67% | | Russell 2000 Index (Small-Cap) | 26.58% |
| Russell 1000 Growth Index | 19.65% | | Russell 2000 Growth Index | 28.67% |
| Russell 1000 Value Index | 15.71% | | Russell 2000 Value Index | 24.43% |
| Russell Midcap Index | 27.71% | | |
| Russell Midcap Growth Index | 28.03% | | | |
| Russell Midcap Value Index | 27.49% | | | |
Small Cap Growth
| Total Returns as of October 31, 2010 |
| | | | Average Annual Returns | |
| | Ticker Symbol | 1 year(1) | 5 years | Since Inception | Inception Date |
| Investor Class | ANOIX | 36.20% | 4.69% | 6.07% | 6/1/01 |
| Russell 2000 Growth Index | — | 28.67% | 3.99% | 3.04%(2) | — |
| Institutional Class | ANONX | 36.61% | — | -2.53% | 5/18/07 |
A Class No sales charge* With sales charge* | ANOAX | 35.86% 28.05% | 4.41% 3.18% | 9.75% 8.93% | 1/31/03 |
B Class No sales charge* With sales charge* | ANOBX | 34.98% 30.98% | 3.66% 3.49% | 8.95% 8.95% | 1/31/03 |
| C Class | ANOCX | 35.04% | 3.65% | 9.00%(3) | 1/31/03 |
| R Class | ANORX | 35.49% | — | -6.21% | 9/28/07 |
| Sales charges include initial sales charges and contingent deferred sales charges (CDSCs), as applicable. A Class shares have a 5.75% maximum initial sales charge for equity funds and may be subject to a maximum CDSC of 1.00%. B Class shares redeemed within six years of purchase are subject to a CDSC that declines from 5.00% during the first year after purchase to 0.00% the sixth year after purchase. C Class shares redeemed within 12 months of purchase are subject to a maximum CDSC of 1.00%. The SEC requires that mutual funds provide performance information net of maximum sales charges in all cases where charges could be applied. |
| (1) | Extraordinary performance is attributable in part to unusually favorable market conditions and may not be repeated or consistently achieved in the future. |
| (2) | Since 5/31/01, the date nearest the Investor Class’s inception for which data are available. |
| (3) | Returns would have been lower if a portion of distribution and service fees had not been waived. |
Data presented reflect past performance. Past performance is no guarantee of future results. Current performance may be higher or lower than the performance shown. Investment return and principal value will fluctuate, and redemption value may be more or less than original cost. To obtain performance data current to the most recent month end, please call 1-800-345-2021 or visit americancentury.com. Historically, small company stocks have been more volatile than the stocks of larger, more established companies. The fund’s investment process may result in high portfolio turnover, high commission costs and high capital gains distributions. In addition, its investment approach may involve higher volatility and risk.
Unless otherwise indicated, performance reflects Investor Class shares; performance for other share classes will vary due to differences in fee structure. For information about other share classes available, please consult the prospectus. Data assumes reinvestment of dividends and capital gains, and none of the charts reflect the deduction of taxes that a shareholder would pay on fund distributions or the redemption of fund shares. Returns for the index are provided for comparison. The fund’s total returns include operating expenses (such as transaction costs and management fees) that reduce returns, while the total returns of the index do not.
Small Cap Growth
| Growth of $10,000 Over Life of Class |
| $10,000 investment made June 1, 2001 |
| * | From 6/1/01, the Investor Class’s inception date. Index data from 5/31/01, the date nearest the Investor Class’s inception for which data are available. Not annualized. |
| Total Annual Fund Operating Expenses |
| Investor Class | Institutional Class | A Class | B Class | C Class | R Class |
| 1.42% | 1.22% | 1.67% | 2.42% | 2.42% | 1.92% |
The total annual fund operating expenses shown is as stated in the fund’s prospectus current as of the date of this report. The prospectus may vary from the expense ratio shown elsewhere in this report because it is based on a different time period, includes acquired fund fees and expenses, and, if applicable, does not include fee waivers or expense reimbursements.
Data presented reflect past performance. Past performance is no guarantee of future results. Current performance may be higher or lower than the performance shown. Investment return and principal value will fluctuate, and redemption value may be more or less than original cost. To obtain performance data current to the most recent month end, please call 1-800-345-2021 or visit americancentury.com. Historically, small company stocks have been more volatile than the stocks of larger, more established companies. The fund’s investment process may result in high portfolio turnover, high commission costs and high capital gains distributions. In addition, its investment approach may involve higher volatility and risk.
Unless otherwise indicated, performance reflects Investor Class shares; performance for other share classes will vary due to differences in fee structure. For information about other share classes available, please consult the prospectus. Data assumes reinvestment of dividends and capital gains, and none of the charts reflect the deduction of taxes that a shareholder would pay on fund distributions or the redemption of fund shares. Returns for the index are provided for comparison. The fund’s total returns include operating expenses (such as transaction costs and management fees) that reduce returns, while the total returns of the index do not.
Small Cap Growth
Portfolio Managers: Stafford Southwick and Matthew Ferretti
Performance Summary
Small Cap Growth returned 36.20%* for the 12 months ended October 31, 2010, its best fiscal-year return in seven years. The fund outpaced the 28.67% return of its benchmark, the Russell 2000 Growth Index.
Small Cap Growth’s robust return reflected the strong performance of small-cap growth stocks, which led the equity market’s advance for the 12-month period. Although price momentum and accelerating growth— two key factors in the fund’s investment process—were out of favor during the first half of the period, the market began to reward stocks with these characteristics later in the period. Favorable stock selection was another important factor contributing to the fund’s outperformance of its benchmark, adding value in nine of ten market sectors.
Industrials and Consumer Discretionary Outperformed
By far, stock selection was most successful in the industrials and consumer discretionary sectors of the portfolio. Security selection among road and rail companies and an overweight position in airlines contributed the most to outperformance in the industrials sector. Small Cap Growth’s top individual performance contributor was rental car agency Dollar Thrifty Automotive, a significant portfolio overweight and the fund’s second-largest holding for the 12-month period. A bidding war between competitors Hertz Global Holdings and Avis Budget Group to acquire Dollar Thrifty provided a substantial boost to the stock, which gained 150% for the reporting period.
Among airline stocks, the best contributor was United Continental Holdings, which was known as UAL until October 2010, when its merger with Continental Airlines was completed. Improving fundamentals in the airline industry enabled United Continental, the world’s largest airline by traffic volume, to return to profitability after struggling with losses and declining traffic during the economic downturn in late 2008 and early 2009.
In the consumer discretionary sector, consumer services providers and apparel makers were the most significant contributors to performance versus the benchmark index. In the consumer services industry, avoiding for-profit education companies contributed positively as these stocks struggled with declining enrollment and tighter student loan regulations. In contrast, our primary holding in this sector was art auctioneer Sotheby’s, which rallied sharply thanks to a recovery in the auction market.
Other top performers in this sector included auto parts maker TRW Automotive, which advanced as a rebound in the auto industry led to a rapid increase in revenues and earnings for the company, and specialty mattress maker Tempur-Pedic International, which benefited from increased demand and repeatedly exceeded earnings expectations.
*All fund returns referenced in this commentary are for Investor Class shares.
Winners in Materials and Technology
The portfolio’s holdings in the materials sector were also major contributors to the fund’s outperformance of the Russell 2000 Growth Index. Virtually all of the outperformance in this sector resulted from stock selection among from paper producers and metals and mining companies. The top contributor was Mesabi Trust, which holds interests in various iron ore properties. Growing demand for iron ore and a sharp rebound in commodity prices lifted the stock.
Stock selection also added value in the information technology sector, which was the best-performing segment in the benchmark index. However, our favorable stock selection was offset by an underweight position in the sector. The big winners in this sector included communications equipment maker Acme Packet, which benefited from upgrades to IP networks and growth in the enterprise market, and mobile data services provider Motricity, which rallied as the company expanded its international offerings. Motricity went public in July and was one of several initial public offerings (IPOs) in which we participated during the 12-month period.
Financials Lagged
The only sector of the portfolio to meaningfully detract from performance versus the benchmark index was financials, and the underperformance resulted entirely from our overweight position in the sector. From a stock selection perspective, consumer finance companies had the biggest negative impact as weaker economic conditions and a changing regulatory environment weighed on the industry. The most notable detractors included consumer lending firms Dollar Financial and World Acceptance.
The largest detractor in the portfolio for the 12 months was LodgeNet Interactive, which is the leading provider of video-on-demand services for hotels. LodgeNet reported earnings that failed to meet analyst expectations in two consecutive quarters, and the stock sold off. Other noteworthy decliners in the portfolio included apparel retailer Aeropostale, which faced challenging price competition and tighter consumer spending, and data services provider TNS, which experienced greater competition in its credit card and ATM transaction business.
A Look Ahead
Over the past 12 months, the economic outlook has become less promising and more uncertain. Consumers continue to deleverage, the housing market remains in the doldrums, and the unemployment rate still hovers above 9%. It remains to be seen whether the Federal Reserve’s recent quantitative easing efforts will help reverse these trends.
Importantly, our investment process is not dependent on making macroeconomic predictions. We focus on selecting individual companies exhibiting accelerating business fundamentals, positive relative strength, and reasonable valuations. We believe that products exhibiting these characteristics provide greater probability of outperforming the market over the long term.
Small Cap Growth
| Top Ten Holdings |
| | % of net assets as of 10/31/10 |
| United Continental Holdings, Inc. | 2.4% |
| Wabash National Corp. | 2.2% |
| US Airways Group, Inc. | 1.8% |
| Tempur-Pedic International, Inc. | 1.6% |
| Triumph Group, Inc. | 1.6% |
| MIPS Technologies, Inc. | 1.4% |
| EnPro Industries, Inc. | 1.3% |
| Motricity, Inc. | 1.3% |
| Mesabi Trust | 1.3% |
| Complete Production Services, Inc. | 1.2% |
| | |
| Top Five Industries |
| | % of net assets as of 10/31/10 |
| Machinery | 9.6% |
| Semiconductors & Semiconductor Equipment | 6.5% |
| Textiles, Apparel & Luxury Goods | 5.5% |
| Communications Equipment | 5.4% |
| Software | 5.2% |
| | |
| Types of Investments in Portfolio |
| | % of net assets as of 10/31/10 |
| Common Stocks | 97.6% |
| Temporary Cash Investments | 1.0% |
| Other Assets and Liabilities | 1.4% |
Shareholder Fee Example (Unaudited)
Fund shareholders may incur two types of costs: (1) transaction costs, including sales charges (loads) on purchase payments and redemption/exchange fees; and (2) ongoing costs, including management fees; distribution and service (12b-1) fees; and other fund expenses. This example is intended to help you understand your ongoing costs (in dollars) of investing in your fund and to compare these costs with the ongoing cost of investing in other mutual funds.
The example is based on an investment of $1,000 made at the beginning of the period and held for the entire period from May 1, 2010 to October 31, 2010.
Actual Expenses
The table provides information about actual account values and actual expenses for each class. You may use the information, together with the amount you invested, to estimate the expenses that you paid over the period. First, identify the share class you own. Then simply divide your account value by $1,000 (for example, an $8,600 account value divided by $1,000 = 8.6), then multiply the result by the number under the heading “Expenses Paid During Period” to estimate the expenses you paid on your account during this period.
If you hold Investor Class shares of any American Century Investments fund, or Institutional Class shares of the American Century Diversified Bond Fund, in an American Century Investments account (i.e., not a financial intermediary or retirement plan account), American Century Investments may charge you a $12.50 semiannual account maintenance fee if the value of those shares is less than $10,000. We will redeem shares automatically in one of your accounts to pay the $12.50 fee. In determining your total eligible investment amount, we will include your investments in all personal accounts (including American Century Investments Brokerage accounts) regis tered under your Social Security number. Personal accounts include individual accounts, joint accounts, UGMA/UTMA accounts, personal trusts, Coverdell Education Savings Accounts and IRAs (including traditional, Roth, Rollover, SEP-, SARSEP- and SIMPLE-IRAs), and certain other retirement accounts. If you have only business, business retirement, employer-sponsored or American Century Investments Brokerage accounts, you are currently not subject to this fee. We will not charge the fee as long as you choose to manage your accounts exclusively online. If you are subject to the Account Maintenance Fee, your account value could be reduced by the fee amount.
Hypothetical Example for Comparison Purposes
The table also provides information about hypothetical account values and hypothetical expenses based on the actual expense ratio of each class of your fund and an assumed rate of return of 5% per year before expenses, which is not the actual return of a fund’s share class. The hypothetical account values and expenses may not be used to estimate the actual ending account balance or expenses you paid for the period. You may use this information to compare the ongoing costs of investing in your fund and other funds. To do so, compare this 5% hypothetical example with the 5% hypothetical examples that appear in the shareholder reports of the other funds.
Please note that the expenses shown in the table are meant to highlight your ongoing costs only and do not reflect any transactional costs, such as sales charges (loads) or redemption/exchange fees. Therefore, the table is useful in comparing ongoing costs only, and will not help you determine the relative total costs of owning different funds. In addition, if these transactional costs were included, your costs would have been higher.
| | | | | |
| | Beginning Account Value 5/1/10 | Ending Account Value 10/31/10 | Expenses Paid During Period* 5/1/10 – 10/31/10 | Annualized Expense Ratio* |
| Actual | | | | |
| Investor Class | $1,000 | $1,037.60 | $7.34 | 1.43% |
| Institutional Class | $1,000 | $1,037.30 | $6.32 | 1.23% |
| A Class | $1,000 | $1,035.20 | $8.62 | 1.68% |
| B Class | $1,000 | $1,032.00 | $12.45 | 2.43% |
| C Class | $1,000 | $1,031.80 | $12.44 | 2.43% |
| R Class | $1,000 | $1,033.90 | $9.89 | 1.93% |
| Hypothetical | | | | |
| Investor Class | $1,000 | $1,018.00 | $7.27 | 1.43% |
| Institutional Class | $1,000 | $1,019.00 | $6.26 | 1.23% |
| A Class | $1,000 | $1,016.74 | $8.54 | 1.68% |
| B Class | $1,000 | $1,012.96 | $12.33 | 2.43% |
| C Class | $1,000 | $1,012.96 | $12.33 | 2.43% |
| R Class | $1,000 | $1,015.48 | $9.80 | 1.93% |
| * | Expenses are equal to the class’s annualized expense ratio listed in the table above, multiplied by the average account value over the period, multiplied by 184, the number of days in the most recent fiscal half-year, divided by 365, to reflect the one-half year period. |
| | | |
| | Shares | Value |
| Common Stocks — 97.6% |
| AEROSPACE & DEFENSE — 3.2% |
AerCap Holdings NV(1) | 83,903 | $ 1,083,188 |
| Applied Signal Technology, Inc. | 21,248 | 713,083 |
Ladish Co., Inc.(1) | 150,459 | 4,813,183 |
| Triumph Group, Inc. | 76,446 | 6,390,121 |
| | | 12,999,575 |
| AIR FREIGHT & LOGISTICS — 0.3% |
Atlas Air Worldwide Holdings, Inc.(1) | 21,103 | 1,102,843 |
| AIRLINES — 4.2% |
United Continental Holdings, Inc.(1) | 331,849 | 9,636,895 |
US Airways Group, Inc.(1) | 601,649 | 7,093,442 |
| | | 16,730,337 |
| AUTO COMPONENTS — 2.0% |
American Axle & Manufacturing Holdings, Inc.(1) | 314,283 | 2,897,689 |
Amerigon, Inc.(1) | 192,978 | 2,080,303 |
| Cooper Tire & Rubber Co. | 31,661 | 620,872 |
Dorman Products, Inc.(1) | 67,328 | 2,456,799 |
| | | 8,055,663 |
| BIOTECHNOLOGY — 2.8% |
Acorda Therapeutics, Inc.(1) | 27,679 | 748,440 |
Alkermes, Inc.(1) | 20,673 | 239,187 |
AMAG Pharmaceuticals, Inc.(1) | 15,586 | 247,973 |
Cepheid, Inc.(1) | 42,886 | 902,321 |
Cubist Pharmaceuticals, Inc.(1) | 42,326 | 985,349 |
ImmunoGen, Inc.(1) | 47,756 | 392,554 |
Incyte Corp. Ltd.(1) | 64,512 | 1,074,770 |
InterMune, Inc.(1) | 32,547 | 427,668 |
Isis Pharmaceuticals, Inc.(1) | 69,978 | 639,599 |
Momenta Pharmaceuticals, Inc.(1) | 28,793 | 481,131 |
Onyx Pharmaceuticals, Inc.(1) | 46,237 | 1,240,539 |
| PDL BioPharma, Inc. | 92,066 | 481,505 |
Pharmasset, Inc.(1) | 21,510 | 806,625 |
Savient Pharmaceuticals, Inc.(1) | 50,345 | 624,782 |
Seattle Genetics, Inc.(1) | 63,147 | 1,034,979 |
Theravance, Inc.(1) | 46,107 | 939,661 |
| | | 11,267,083 |
| CAPITAL MARKETS — 0.6% |
| BGC Partners, Inc., Class A | 102,142 | 708,866 |
| Cohen & Steers, Inc. | 8,112 | 203,368 |
HFF, Inc., Class A(1) | 143,086 | 1,406,535 |
| | | 2,318,769 |
| CHEMICALS — 3.2% |
| Arch Chemicals, Inc. | 49,271 | 1,749,613 |
| Balchem Corp. | 53,827 | 1,644,953 |
Kraton Performance Polymers, Inc.(1) | 72,786 | 2,362,634 |
OM Group, Inc.(1) | 51,601 | 1,716,765 |
Solutia, Inc.(1) | 197,937 | 3,584,639 |
TPC Group, Inc.(1) | 70,388 | 1,932,151 |
| | | 12,990,755 |
| COMMERCIAL BANKS — 0.6% |
| Danvers Bancorp., Inc. | 74,366 | 1,117,721 |
| Sandy Spring Bancorp, Inc. | 78,983 | 1,374,304 |
| | | 2,492,025 |
| COMMERCIAL SERVICES & SUPPLIES — 0.7% |
| Deluxe Corp. | 75,974 | 1,552,909 |
| Waste Connections, Inc. | 31,757 | 1,293,780 |
| | | 2,846,689 |
| COMMUNICATIONS EQUIPMENT — 5.4% |
Acme Packet, Inc.(1) | 120,017 | 4,746,672 |
Blue Coat Systems, Inc.(1) | 56,703 | 1,529,280 |
Finisar Corp.(1) | 69,334 | 1,179,371 |
KVH Industries, Inc.(1) | 28,149 | 395,212 |
Netgear, Inc.(1) | 117,761 | 3,628,216 |
Oplink Communications, Inc.(1) | 151,353 | 2,645,650 |
RADWARE Ltd.(1) | 69,770 | 2,467,765 |
Riverbed Technology, Inc.(1) | 42,005 | 2,416,968 |
| Sycamore Networks, Inc. | 65,054 | 1,983,497 |
Viasat, Inc.(1) | 20,174 | 830,564 |
| | | 21,823,195 |
| COMPUTERS & PERIPHERALS — 0.5% |
Cray, Inc.(1) | 150,855 | 902,113 |
Stratasys, Inc.(1) | 29,775 | 932,553 |
| | | 1,834,666 |
| CONSUMER FINANCE — 0.9% |
NetSpend Holdings, Inc.(1) | 86,205 | 1,182,733 |
World Acceptance Corp.(1) | 59,197 | 2,554,350 |
| | | 3,737,083 |
| DIVERSIFIED CONSUMER SERVICES — 1.1% |
| Sotheby’s | 102,559 | 4,496,186 |
| DIVERSIFIED TELECOMMUNICATION SERVICES — 0.7% |
General Communication, Inc., Class A(1) | 129,664 | $ 1,354,989 |
Vonage Holdings Corp.(1) | 644,880 | 1,644,444 |
| | | 2,999,433 |
| ELECTRICAL EQUIPMENT — 0.3% |
American Superconductor Corp.(1) | 32,277 | 1,086,121 |
| ELECTRONIC EQUIPMENT, INSTRUMENTS & COMPONENTS — 5.1% |
| Cognex Corp. | 155,603 | 4,154,600 |
| Daktronics, Inc. | 276,228 | 3,016,410 |
| DDi Corp. | 154,981 | 1,593,205 |
Kemet Corp.(1) | 910,331 | 3,404,638 |
Littelfuse, Inc.(1) | 98,372 | 4,173,924 |
SMART Modular Technologies (WWH), Inc.(1) | 373,501 | 2,760,172 |
| Technitrol, Inc. | 270,601 | 1,244,764 |
| | | 20,347,713 |
| ENERGY EQUIPMENT & SERVICES — 2.0% |
Complete Production Services, Inc.(1) | 211,215 | 4,948,767 |
Dril-Quip, Inc.(1) | 27,759 | 1,918,147 |
Newpark Resources, Inc.(1) | 33,876 | 199,191 |
Pioneer Drilling Co.(1) | 155,004 | 954,825 |
| | | 8,020,930 |
| FOOD & STAPLES RETAILING — 0.6% |
| PriceSmart, Inc. | 86,054 | 2,523,964 |
| HEALTH CARE EQUIPMENT & SUPPLIES — 3.8% |
Abaxis, Inc.(1) | 16,472 | 395,493 |
Align Technology, Inc.(1) | 44,061 | 750,359 |
American Medical Systems Holdings, Inc.(1) | 54,690 | 1,104,738 |
Arthrocare Corp.(1) | 19,544 | 533,160 |
Cyberonics, Inc.(1) | 20,606 | 566,871 |
DexCom, Inc.(1) | 43,479 | 597,836 |
Haemonetics Corp.(1) | 18,226 | 996,051 |
HeartWare International, Inc.(1) | 6,969 | 476,262 |
Immucor, Inc.(1) | 51,613 | 898,066 |
Insulet Corp.(1) | 30,186 | 481,467 |
Integra LifeSciences Holdings Corp.(1) | 15,090 | 649,172 |
| Masimo Corp. | 37,355 | 1,127,000 |
| Meridian Bioscience, Inc. | 30,062 | 688,119 |
Neogen Corp.(1) | 16,593 | 554,538 |
NuVasive, Inc.(1) | 28,900 | 757,180 |
Sirona Dental Systems, Inc.(1) | 24,317 | 915,535 |
| STERIS Corp. | 41,301 | 1,413,320 |
Volcano Corp.(1) | 36,513 | 891,647 |
| West Pharmaceutical Services, Inc. | 24,333 | 868,445 |
Zoll Medical Corp.(1) | 15,925 | 518,040 |
| | | 15,183,299 |
| HEALTH CARE PROVIDERS & SERVICES — 2.1% |
Amedisys, Inc.(1) | 20,388 | 519,078 |
Bio-Reference Labs, Inc.(1) | 18,437 | 397,502 |
Catalyst Health Solutions, Inc.(1) | 27,774 | 1,051,246 |
| Chemed Corp. | 16,323 | 962,078 |
HealthSouth Corp.(1) | 65,388 | 1,182,869 |
HMS Holdings Corp.(1) | 19,796 | 1,189,938 |
| Landauer, Inc. | 6,817 | 416,451 |
MWI Veterinary Supply, Inc.(1) | 8,981 | 513,713 |
| Owens & Minor, Inc. | 36,338 | 1,034,906 |
PSS World Medical, Inc.(1) | 42,723 | 1,009,544 |
| | | 8,277,325 |
| HEALTH CARE TECHNOLOGY — 0.6% |
athenahealth, Inc.(1) | 23,999 | 959,240 |
MedAssets, Inc.(1) | 30,571 | 566,786 |
| Quality Systems, Inc. | 13,859 | 890,580 |
| | | 2,416,606 |
| HOTELS, RESTAURANTS & LEISURE — 1.2% |
Domino’s Pizza, Inc.(1) | 323,933 | 4,807,166 |
| HOUSEHOLD DURABLES — 2.0% |
Deer Consumer Products, Inc.(1) | 127,238 | 1,456,875 |
Tempur-Pedic International, Inc.(1) | 186,758 | 6,443,151 |
| | | 7,900,026 |
| INDUSTRIAL CONGLOMERATES — 0.7% |
| Raven Industries, Inc. | 69,109 | 2,841,762 |
| INSURANCE — 0.9% |
AMERISAFE, Inc.(1) | 10,459 | 199,662 |
| Amtrust Financial Services, Inc. | 77,074 | 1,153,798 |
FPIC Insurance Group, Inc.(1) | 24,267 | 859,537 |
| Safety Insurance Group, Inc. | 33,650 | 1,563,379 |
| | | 3,776,376 |
| INTERNET & CATALOG RETAIL — 1.5% |
HSN, Inc.(1) | 116,364 | $ 3,483,938 |
priceline.com, Inc.(1) | 6,838 | 2,576,627 |
| | | 6,060,565 |
| INTERNET SOFTWARE & SERVICES — 3.9% |
Ancestry.com, Inc.(1) | 103,124 | 2,750,317 |
Dice Holdings, Inc.(1) | 215,397 | 1,949,343 |
KIT Digital, Inc.(1) | 74,919 | 1,031,635 |
Limelight Networks, Inc.(1) | 302,362 | 2,050,014 |
Liquidity Services, Inc.(1) | 76,462 | 1,223,392 |
Rackspace Hosting, Inc.(1) | 54,998 | 1,372,750 |
Vocus, Inc.(1) | 129,362 | 2,865,368 |
Zix Corp.(1) | 628,361 | 2,444,324 |
| | | 15,687,143 |
| IT SERVICES — 0.4% |
| Cass Information Systems, Inc. | 17,201 | 593,950 |
| MAXIMUS, Inc. | 14,722 | 892,595 |
| | | 1,486,545 |
| LEISURE EQUIPMENT & PRODUCTS — 0.8% |
| Polaris Industries, Inc. | 46,264 | 3,288,908 |
| LIFE SCIENCES TOOLS & SERVICES — 0.8% |
Bruker Corp.(1) | 53,616 | 803,704 |
Dionex Corp.(1) | 12,828 | 1,144,642 |
Luminex Corp.(1) | 26,782 | 482,344 |
PAREXEL International Corp.(1) | 42,246 | 908,289 |
| | | 3,338,979 |
| MACHINERY — 9.6% |
3D Systems Corp.(1) | 43,155 | 1,115,125 |
ArvinMeritor, Inc.(1) | 139,129 | 2,306,759 |
| Cascade Corp. | 43,476 | 1,538,616 |
Commercial Vehicle Group, Inc.(1) | 145,921 | 1,959,719 |
EnPro Industries, Inc.(1) | 152,198 | 5,348,238 |
| Lindsay Corp. | 70,908 | 4,087,846 |
Middleby Corp.(1) | 35,619 | 2,659,314 |
| NACCO Industries, Inc., Class A | 18,407 | 1,827,079 |
NN, Inc.(1) | 97,470 | 810,950 |
| Robbins & Myers, Inc. | 86,470 | 2,510,224 |
Sauer-Danfoss, Inc.(1) | 75,675 | 1,673,174 |
| Titan International, Inc. | 255,764 | 3,879,940 |
Wabash National Corp.(1) | 1,085,059 | 8,745,576 |
| | | 38,462,560 |
| MEDIA — 0.4% |
AirMedia Group, Inc. ADR(1) | 117,673 | 813,120 |
Ballantyne Strong, Inc.(1) | 63,234 | 532,430 |
LodgeNet Interactive Corp.(1) | 121,316 | 309,356 |
| | | 1,654,906 |
| METALS & MINING — 3.0% |
Allied Nevada Gold Corp.(1) | 72,389 | 1,786,561 |
Brush Engineered Materials, Inc.(1) | 90,710 | 3,007,036 |
| Globe Specialty Metals, Inc. | 123,248 | 1,915,274 |
| Mesabi Trust | 127,598 | 5,286,385 |
| | | 11,995,256 |
| OIL, GAS & CONSUMABLE FUELS — 3.9% |
| BP Prudhoe Bay Royalty Trust | 24,734 | 2,542,902 |
| Crosstex Energy LP | 190,541 | 2,665,669 |
Forest Oil Corp.(1) | 82,194 | 2,525,822 |
| Knightsbridge Tankers Ltd. | 103,939 | 2,258,594 |
| Permian Basin Royalty Trust | 176,996 | 3,715,146 |
| Teekay Tankers Ltd., Class A | 167,437 | 1,989,152 |
| | | 15,697,285 |
| PAPER & FOREST PRODUCTS — 2.4% |
| Buckeye Technologies, Inc. | 136,287 | 2,459,980 |
Clearwater Paper Corp.(1) | 51,084 | 4,125,033 |
KapStone Paper and Packaging Corp.(1) | 252,750 | 3,235,200 |
| | | 9,820,213 |
| PHARMACEUTICALS — 1.3% |
Auxilium Pharmaceuticals, Inc.(1) | 30,258 | 748,886 |
Impax Laboratories, Inc.(1) | 40,206 | 757,481 |
Nektar Therapeutics(1) | 68,768 | 1,001,950 |
Questcor Pharmaceuticals, Inc.(1) | 38,041 | 466,763 |
Salix Pharmaceuticals Ltd.(1) | 41,594 | 1,573,501 |
VIVUS, Inc.(1) | 61,576 | 476,598 |
| | | 5,025,179 |
| PROFESSIONAL SERVICES — 0.9% |
Kelly Services, Inc., Class A(1) | 230,374 | 3,421,054 |
| REAL ESTATE INVESTMENT TRUSTS (REITs) — 1.7% |
| Agree Realty Corp. | 14,794 | 377,247 |
Ashford Hospitality Trust, Inc.(1) | 375,232 | 3,808,605 |
| Post Properties, Inc. | 80,669 | 2,455,564 |
| | | 6,641,416 |
| SEMICONDUCTORS & SEMICONDUCTOR EQUIPMENT — 6.5% |
Amtech Systems, Inc.(1) | 43,229 | $ 723,654 |
Atheros Communications, Inc.(1) | 37,921 | 1,177,068 |
Cavium Networks, Inc.(1) | 30,744 | 979,811 |
Cirrus Logic, Inc.(1) | 77,328 | 993,665 |
Entegris, Inc.(1) | 167,449 | 1,001,345 |
GT Solar International, Inc.(1) | 283,045 | 2,329,460 |
Mindspeed Technologies, Inc.(1) | 190,523 | 1,406,060 |
MIPS Technologies, Inc.(1) | 379,912 | 5,584,706 |
Photronics, Inc.(1) | 260,328 | 1,634,860 |
Silicon Image, Inc.(1) | 239,654 | 1,473,872 |
Silicon Motion Technology Corp. ADR(1) | 297,498 | 1,606,489 |
Skyworks Solutions, Inc.(1) | 210,157 | 4,814,697 |
Ultratech, Inc.(1) | 93,260 | 1,707,591 |
Veeco Instruments, Inc.(1) | 18,657 | 780,795 |
| | | 26,214,073 |
| SOFTWARE — 5.2% |
Ariba, Inc.(1) | 66,607 | 1,250,879 |
Fortinet, Inc.(1) | 37,703 | 1,131,090 |
Interactive Intelligence, Inc.(1) | 59,089 | 1,460,089 |
Motricity, Inc.(1) | 241,103 | 5,297,033 |
Progress Software Corp.(1) | 37,304 | 1,394,050 |
Radiant Systems, Inc.(1) | 158,670 | 3,095,652 |
Smith Micro Software, Inc.(1) | 210,563 | 2,560,446 |
Sourcefire, Inc.(1) | 28,854 | 680,666 |
Taleo Corp., Class A(1) | 41,357 | 1,186,532 |
TIBCO Software, Inc.(1) | 88,944 | 1,709,504 |
Tyler Technologies, Inc.(1) | 509 | 10,389 |
VanceInfo Technologies, Inc. ADR(1) | 25,668 | 933,545 |
| | | 20,709,875 |
| SPECIALTY RETAIL — 2.3% |
Children’s Place Retail Stores, Inc. (The)(1) | 5,436 | 239,510 |
| Finish Line, Inc. (The), Class A | 158,099 | 2,418,915 |
Jos. A. Bank Clothiers, Inc.(1) | 22,185 | 967,266 |
| Monro Muffler Brake, Inc. | 98,041 | 4,680,477 |
Pier 1 Imports, Inc.(1) | 121,717 | 1,056,504 |
| | | 9,362,672 |
| TEXTILES, APPAREL & LUXURY GOODS — 5.5% |
Crocs, Inc.(1) | 127,619 | 1,777,733 |
Deckers Outdoor Corp.(1) | 69,367 | 4,030,223 |
G-III Apparel Group Ltd.(1) | 167,871 | 4,431,794 |
Iconix Brand Group, Inc.(1) | 275,908 | 4,828,390 |
Maidenform Brands, Inc.(1) | 80,651 | 2,158,221 |
Steven Madden Ltd.(1) | 111,001 | 4,695,342 |
| | | 21,921,703 |
| TRADING COMPANIES & DISTRIBUTORS — 1.1% |
United Rentals, Inc.(1) | 239,982 | 4,509,262 |
| WIRELESS TELECOMMUNICATION SERVICES — 0.9% |
Syniverse Holdings, Inc.(1) | 122,167 | 3,724,872 |
TOTAL COMMON STOCKS(Cost $305,469,464) | 391,898,056 |
| Temporary Cash Investments — 1.0% |
| JPMorgan U.S. Treasury Plus Money Market Fund Agency Shares | 71,150 | 71,150 |
Repurchase Agreement, Credit Suisse First Boston, Inc., (collateralized by various U.S. Treasury obligations, 1.00%, 3/31/12, valued at $3,977,990), in a joint trading account at 0.16%, dated 10/29/10, due 11/1/10 (Delivery value $3,900,052) | 3,900,000 |
TOTAL TEMPORARY CASH INVESTMENTS (Cost $3,971,150) | 3,971,150 |
TOTAL INVESTMENT SECURITIES — 98.6% (Cost $309,440,614) | 395,869,206 |
| OTHER ASSETS AND LIABILITIES — 1.4% | 5,781,324 |
| TOTAL NET ASSETS — 100.0% | $401,650,530 |
Notes to Schedule of Investments
ADR = American Depositary Receipt
| (1) | Non-income producing. |
See Notes to Financial Statements.
Statement of Assets and Liabilities
| OCTOBER 31, 2010 |
| Assets |
| Investment securities, at value (cost of $309,440,614) | $395,869,206 |
| Cash | 606 |
| Receivable for investments sold | 11,587,490 |
| Receivable for capital shares sold | 129,981 |
| Dividends and interest receivable | 239,419 |
| | 407,826,702 |
| | |
| Liabilities | |
| Payable for investments purchased | 5,204,941 |
| Payable for capital shares redeemed | 479,886 |
| Accrued management fees | 450,591 |
| Distribution and service fees payable | 40,754 |
| | 6,176,172 |
| Net Assets | $401,650,530 |
| | |
| Net Assets Consist of: | |
| Capital (par value and paid-in surplus) | $ 641,706,394 |
| Accumulated net realized loss | (326,484,456) |
| Net unrealized appreciation | 86,428,592 |
| | $ 401,650,530 |
| | | | | | | |
| | Net assets | Shares outstanding | Net asset value per share |
| Investor Class, $0.01 Par Value | $142,793,471 | | 19,171,833 | | $7.45 | |
| Institutional Class, $0.01 Par Value | $114,512,556 | | 15,267,311 | | $7.50 | |
| A Class, $0.01 Par Value | $126,763,180 | | 17,239,626 | | $7.35* | |
| B Class, $0.01 Par Value | $3,106,841 | | 437,758 | | $7.10 | |
| C Class, $0.01 Par Value | $13,476,408 | | 1,891,374 | | $7.13 | |
| R Class, $0.01 Par Value | $998,074 | | 136,125 | | $7.33 | |
*Maximum offering price $7.80 (net asset value divided by 0.9425)
See Notes to Financial Statements.
| YEAR ENDED OCTOBER 31, 2010 |
| Investment Income (Loss) |
| Income: | |
| Dividends | $ 3,784,136 |
| Interest | 5,603 |
| | 3,789,739 |
| | |
| Expenses: | |
| Management fees | 5,425,678 |
| Distribution and service fees: | |
| A Class | 309,980 |
| B Class | 31,003 |
| C Class | 131,265 |
| R Class | 3,885 |
| Directors’ fees and expenses | 17,123 |
| Other expenses | 47,148 |
| | 5,966,082 |
| | |
| Net investment income (loss) | (2,176,343) |
| | |
| Realized and Unrealized Gain (Loss) | |
| Net realized gain (loss) on: | |
| Investment transactions (including $85,994 from affiliates) | 93,802,021 |
| Futures contract transactions | 827,160 |
| | 94,629,181 |
| | |
| Change in net unrealized appreciation (depreciation) on investments | 36,489,688 |
| | |
| Net realized and unrealized gain (loss) | 131,118,869 |
| | |
| Net Increase (Decrease) in Net Assets Resulting from Operations | $128,942,526 |
See Notes to Financial Statements.
Statement of Changes in Net Assets
| YEARS ENDED OCTOBER 31, 2010 AND OCTOBER 31, 2009 |
| Increase (Decrease) in Net Assets | 2010 | 2009 |
| Operations |
| Net investment income (loss) | $ (2,176,343) | $ (1,860,087) |
| Net realized gain (loss) | 94,629,181 | (103,796,885) |
| Change in net unrealized appreciation (depreciation) | 36,489,688 | 87,749,913 |
| Net increase (decrease) in net assets resulting from operations | 128,942,526 | (17,907,059) |
| | | |
| Capital Share Transactions | | |
| Net increase (decrease) in net assets from capital share transactions | (135,018,924) | (34,342,691) |
| | | |
| Redemption Fees | | |
| Increase in net assets from redemption fees | 185,421 | 255,189 |
| | | |
| Net increase (decrease) in net assets | (5,890,977) | (51,994,561) |
| | | |
| Net Assets | | |
| Beginning of period | 407,541,507 | 459,536,068 |
| End of period | $ 401,650,530 | $ 407,541,507 |
| | | |
| Accumulated net investment loss | — | $(599,780) |
See Notes to Financial Statements.
Notes to Financial Statements
OCTOBER 31, 2010
1. Organization
American Century Mutual Funds, Inc. (the corporation) is registered under the Investment Company Act of 1940 (the 1940 Act) as an open-end management investment company and is organized as a Maryland corporation. Small Cap Growth Fund (the fund) (formerly New Opportunities II Fund) is one fund in a series issued by the corporation. The fund is diversified as defined under the 1940 Act. The fund’s investment objective is to seek long-term capital growth. The fund pursues its objective by investing primarily in small cap companies that management believes will increase in value over time. The fund is authorized to issue the Investor Class, the Institutional Class, the A Class, the B Class, the C Class and the R Class. The A Class may incur an initial sales charge. The A Class, B Class and C Class may be subject to a contingent deferred sales charge. The share classes differ principally in their respective sales charges and distribution and shareholder servicing expenses and arrangements. The Institutional Class is made available to institutional shareholders or through financial intermediaries whose clients do not require the same level of shareholder and administrative services as shareholders of other classes. As a result, the Institutional Class is charged a lower unified management fee.
2. Significant Accounting Policies
The following is a summary of significant accounting policies consistently followed by the fund in preparation of its financial statements. The financial statements are prepared in conformity with accounting principles generally accepted in the United States of America, which may require management to make certain estimates and assumptions at the date of the financial statements. Actual results could differ from these estimates.
Investment Valuations — The fund determines the fair value of its investments and computes its net asset value per share as of the close of regular trading (usually 4 p.m. Eastern time) on the New York Stock Exchange (NYSE) on each day the NYSE is open.
Equity securities that are listed or traded on a domestic securities exchange are valued at the last reported sales price or at the official closing price as provided by the exchange. Equity securities traded on foreign securities exchanges are typically valued at the closing price on the exchange where primarily traded or as of the close of the NYSE, if that is earlier. If no last sales price is reported, or if local convention or regulation so provides, the mean of the latest bid and asked prices is used. Depending on local convention or regulation, securities traded over-the-counter are valued at the mean of the latest bid and asked prices, the last sales price, or the official closing price. In its determination of fair value, the fund may review several factors including: market information specific to a security; news developments in U.S. and foreign markets; the performance of particular U.S. and foreign securities, indices, comparable securities, American Depositary Receipts, Exchange Traded Funds, and other relevant market indicators.
Debt securities maturing within 60 days at the time of purchase may be valued at cost, plus or minus any amortized discount or premium or at the evaluated mean as provided by an independent pricing service. Evaluated mean prices are commonly derived through utilization of market models, which may consider, among other factors, trade data, quotations from dealers and active market makers, relevant yield curve and spread data, related sector levels, creditworthiness, and other relevant market information on the same or comparable securities.
Investments in open-end management investment companies are valued at the reported net asset value per share. Repurchase agreements are valued at cost. Exchange-traded futures contracts are valued at the settlement price as provided by the appropriate clearing corporation.
The value of investments initially expressed in foreign currencies is translated into U.S. dollars at prevailing exchange rates.
If the fund determines that the market price for a portfolio security is not readily available or the valuation methods mentioned above do not reflect a security’s fair value, such security is valued as determined in good faith by the Board of Directors or its designee, in accordance with procedures adopted by the Board of Directors. Circumstances that may cause the fund to use these procedures to value a security include, but are not limited to: a security has been declared in default; trading in a security has been halted during the trading day; there is a foreign market holiday and no trading occurred; or an event occurred between the close of a foreign exchange and the NYSE that may affect the value of a security.
Security Transactions — Security transactions are accounted for as of the trade date. Net realized gains and losses are determined on the identified cost basis, which is also used for federal income tax purposes.
Investment Income — Dividend income less foreign taxes withheld, if any, is recorded as of the ex-dividend date. Distributions received on securities that represent a return of capital or capital gain are recorded as a reduction of cost of investments and/or as a realized gain. The fund estimates the components of distributions received that may be considered nontaxable distributions or capital gain distributions for income tax purposes. Interest income is recorded on the accrual basis and includes accretion of discounts and amortization of premiums.
Repurchase Agreements — The fund may enter into repurchase agreements with institutions that American Century Investment Management, Inc. (ACIM) (the investment advisor) has determined are creditworthy pursuant to criteria adopted by the Board of Directors. The fund requires that the collateral, represented by securities, received in a repurchase transaction be transferred to the custodian in a manner sufficient to enable the fund to obtain those securities in the event of a default under the repurchase agreement. ACIM monitors, on a daily basis, the securities transferred to ensure the value, including accrued interest, of the securities under each repurchase agreement is equal to or greater than amounts owed to the fund under each repurchase agreement.
Joint Trading Account — Pursuant to an Exemptive Order issued by the Securities and Exchange Commission, the fund, along with certain other funds in the American Century Investments family of funds, may transfer uninvested cash balances into a joint trading account. These balances are invested in one or more repurchase agreements that are collateralized by U.S. Treasury or Agency obligations.
Income Tax Status — It is the fund’s policy to distribute substantially all net investment income and net realized gains to shareholders and to otherwise qualify as a regulated investment company under provisions of the Internal Revenue Code. The fund is no longer subject to examination by tax authorities for years prior to 2007. At this time, management believes there are no uncertain tax positions which, based on their technical merit, would not be sustained upon examination and for which it is reasonably possible that the total amounts of unrecognized tax benefits will significantly change in the next twelve months. Accordingly, no provision has been made for federal or state income taxes.
Multiple Class — All shares of the fund represent an equal pro rata interest in the net assets of the class to which such shares belong, and have identical voting, dividend, liquidation and other rights and the same terms and conditions, except for class specific expenses and exclusive rights to vote on matters affecting only individual classes. Income, non-class specific expenses, and realized and unrealized capital gains and losses of the fund are allocated to each class of shares based on their relative net assets.
Distributions to Shareholders — Distributions to shareholders are recorded on the ex-dividend date. Distributions from net investment income and net realized gains, if any, are generally declared and paid annually.
Redemption — The fund may impose a 2.00% redemption fee on shares held less than 180 days. The fee may not be applicable to all classes. The redemption fee is retained by the fund and helps cover transaction costs that long-term investors may bear when the fund sells securities to meet investor redemptions.
Indemnifications — Under the corporation’s organizational documents, its officers and directors are indemnified against certain liabilities arising out of the performance of their duties to the fund. In addition, in the normal course of business, the fund enters into contracts that provide general indemnifications. The maximum exposure under these arrangements is unknown as this would involve future claims that may be made against a fund. The risk of material loss from such claims is considered by management to be remote.
3. Fees and Transactions with Related Parties
Management Fees — The corporation has entered into a management agreement with ACIM, under which ACIM provides the fund with investment advisory and management services in exchange for a single, unified management fee (the fee) per class. The agreement provides that all expenses of managing and operating the fund, except distribution and service fees, brokerage expenses, taxes, interest, fees and expenses of the independent directors (including legal counsel fees), and extraordinary expenses, will be paid by ACIM. The fee is computed and accrued daily based on each class’s daily net assets and paid monthly in arrears. The rate of the fee is determined by applying a fee rate calculation formula. This formula takes into account the fund’s assets as well as certain a ssets, if any, of other clients of the investment advisor outside the American Century Investments family of funds (such as subadvised funds and separate accounts) that have very similar investment teams and investment strategies (strategy assets). The annual management fee schedule ranges from 1.10% to 1.50% for the Investor Class, A Class, B Class, C Class and R Class. The Institutional Class is 0.200% less at each point within the range. The effective annual management fee for each class for the year ended October 31, 2010 was 1.40% for the Investor Class, A Class, B Class, C Class and R Class and 1.20% for the Institutional Class.
Distribution and Service Fees — The Board of Directors has adopted a separate Master Distribution and Individual Shareholder Services Plan for each of the A Class, B Class, C Class and R Class (collectively the plans), pursuant to Rule 12b-1 of the 1940 Act. The plans provide that the A Class will pay American Century Investment Services, Inc. (ACIS) an annual distribution and service fee of 0.25%. The plans provide that the B Class and C Class will each pay ACIS an annual distribution and service fee of 1.00%, of which 0.25% is paid for individual shareholder services and 0.75% is paid for distribution services. The plans provide that the R Class will pay ACIS an annual distribution and servi ce fee of 0.50%. The fees are computed and accrued daily based on each class’s daily net assets and paid monthly in arrears. The fees are used to pay financial intermediaries for distribution and individual shareholder services. Fees incurred under the plans during the year ended October 31, 2010, are detailed in the Statement of Operations.
Related Parties — Certain officers and directors of the corporation are also officers and/or directors of American Century Companies, Inc. (ACC), the parent of the corporation’s investment advisor, ACIM, the distributor of the corporation, ACIS, and the corporation’s transfer agent, American Century Services, LLC.
The fund is eligible to invest in a money market fund for temporary purposes, which is managed by J.P. Morgan Investment Management, Inc. (JPMIM). The fund has a mutual funds services agreement with J.P. Morgan Investor Services Co. (JPMIS). JPMorgan Chase Bank (JPMCB) is a custodian of the fund. JPMIM, JPMIS and JPMCB are wholly owned subsidiaries of JPMorgan Chase & Co. (JPM). JPM is an equity investor in ACC.
4. Investment Transactions
Purchases and sales of investment securities, excluding short-term investments, for the year ended October 31, 2010, were $720,764,034 and $866,556,632, respectively.
5. Capital Share Transactions
Transactions in shares of the fund were as follows:
| | | |
| | Year ended October 31, 2010 | Year ended October 31, 2009 |
| | Shares | Amount | Shares | Amount |
| Investor Class/Shares Authorized | 165,000,000 | | 165,000,000 | |
| Sold | 6,784,305 | $ 43,916,604 | 16,295,442 | $ 85,307,455 |
| Redeemed | (18,735,868) | (122,423,452) | (25,021,496) | (122,029,987) |
| | (11,951,563) | (78,506,848) | (8,726,054) | (36,722,532) |
| Institutional Class/Shares Authorized | 150,000,000 | | 150,000,000 | |
| Sold | 2,660,213 | 17,212,447 | 11,827,728 | 58,268,863 |
| Redeemed | (7,096,717) | (46,645,112) | (8,547,304) | (43,412,649) |
| | (4,436,504) | (29,432,665) | 3,280,424 | 14,856,214 |
| A Class/Shares Authorized | 110,000,000 | | 110,000,000 | |
| Sold | 2,350,237 | 15,349,838 | 5,152,254 | 25,297,336 |
| Redeemed | (6,185,109) | (39,950,252) | (7,556,245) | (37,383,702) |
| | (3,834,872) | (24,600,414) | (2,403,991) | (12,086,366) |
| B Class/Shares Authorized | 20,000,000 | | 20,000,000 | |
| Sold | 4,481 | 27,688 | 161,020 | 741,803 |
| Redeemed | (132,247) | (828,181) | (121,098) | (582,619) |
| | (127,766) | (800,493) | 39,922 | 159,184 |
| C Class/Shares Authorized | 20,000,000 | | 20,000,000 | |
| Sold | 413,664 | 2,630,469 | 607,886 | 2,915,777 |
| Redeemed | (719,773) | (4,536,633) | (797,746) | (3,877,579) |
| | (306,109) | (1,906,164) | (189,860) | (961,802) |
| R Class/Shares Authorized | 20,000,000 | | 20,000,000 | |
| Sold | 68,676 | 446,713 | 97,427 | 497,692 |
| Redeemed | (33,289) | (219,053) | (16,219) | (85,081) |
| | 35,387 | 227,660 | 81,208 | 412,611 |
| Net increase (decrease) | (20,621,427) | $(135,018,924) | (7,918,351) | $ (34,342,691) |
6. Affiliated Company Transactions
If a fund’s holding represents ownership of 5% or more of the voting securities of a company, the company is affiliated as defined in the 1940 Act. A summary of transactions for each company which is or was an affiliate at or during the year ended October 31, 2010 follows:
| | October 31, 2009 | | | | | October 31, 2010 |
| Company | Share Balance | Purchase Cost | Sales Cost | Realized Gain (Loss) | Dividend Income | Share Balance | Market Value |
LodgeNet Interactive Corp.(1)(2) | 955,978 | $1,773,465 | $5,130,239 | $85,994 | — | 121,316 | (2) |
| (2) | Company was not an affiliate at October 31, 2010. |
7. Fair Value Measurements
The fund’s securities valuation process is based on several considerations and may use multiple inputs to determine the fair value of the positions held by the fund. In conformity with accounting principles generally accepted in the United States of America, the inputs used to determine a valuation are classified into three broad levels as follows:
| • | Level 1 valuation inputs consist of unadjusted quoted prices in an active market for identical securities; |
| • | Level 2 valuation inputs consist of direct or indirect observable market data (including quoted prices for similar securities, evaluations of subsequent market events, interest rates, prepayment speeds, credit risk, etc.); or |
| • | Level 3 valuation inputs consist of unobservable data (including a fund’s own assumptions). |
The level classification is based on the lowest level input that is significant to the fair valuation measurement. The valuation inputs are not necessarily an indication of the risks associated with investing in these securities or other financial instruments.
The following is a summary of the level classifications as of period end. The Schedule of Investments provides additional information on the fund’s portfolio holdings.
| | | | |
| | Level 1 | Level 2 | Level 3 |
| Investment Securities | | | |
| Common Stocks | $391,898,056 | — | — |
| Temporary Cash Investments | 71,150 | $3,900,000 | — |
| Total Value of Investment Securities | $391,969,206 | $3,900,000 | — |
8. Derivative Instruments
Equity Price Risk — The fund is subject to equity price risk in the normal course of pursuing its investment objectives. A fund may enter into futures contracts based on an equity index in order to manage its exposure to changes in market conditions. A fund may purchase futures contracts to gain exposure to increases in market value or sell futures contracts to protect against a decline in market value. Upon entering into a futures contract, a fund is required to deposit either cash or securities in an amount equal to a certain percentage of the contract value (initial margin). Subsequent payments (variation margin) are made or received daily, in cash, by a fund. The variation margin is equal to the daily change in the contract value and is recorded as unrealized gains and lo sses. A fund recognizes a realized gain or loss when the contract is closed or expires. Net realized and unrealized gains or losses occurring during the holding period of futures contracts are a component of net realized gain (loss) on futures contract transactions and change in net unrealized appreciation (depreciation) on futures contracts, respectively. One of the risks of entering into futures contracts is the possibility that the change in value of the contract may not correlate with the changes in value of the underlying securities. During the period, the fund infrequently purchased equity price risk derivative instruments for temporary investment purposes.
As of period end, the fund did not have any equity price risk derivative instruments disclosed on the Statement of Assets and Liabilities. For the year ended October 31, 2010, the effect of equity price risk derivative instruments on the Statement of Operations was $827,160 in net realized gain (loss) on futures contract transactions.
9. Risk Factors
The fund concentrates its investments in common stocks of small companies. Because of this, it may be subject to greater risk and market fluctuations than a fund investing in larger, more established companies.
The fund’s investment process may result in high portfolio turnover, high commission costs and high capital gains distributions. In addition, its investment approach may involve higher volatility and risk.
10. Federal Tax Information
The book-basis character of distributions made during the year from net investment income or net realized gains may differ from their ultimate characterization for federal income tax purposes. These differences reflect the differing character of certain income items and net realized gains and losses for financial statement and tax purposes, and may result in reclassification among certain capital accounts on the financial statements. There were no distributions paid during the years ended October 31, 2010 and October 31, 2009.
As of October 31, 2010, the federal tax cost of investments and the components of distributable earnings on a tax-basis were as follows:
| | |
| Federal tax cost of investments | $311,237,291 |
| Gross tax appreciation of investments | $87,566,568 |
| Gross tax depreciation of investments | (2,934,653) |
| Net tax appreciation (depreciation) of investments | $84,631,915 |
| Undistributed ordinary income | — |
| Accumulated capital losses | $(324,687,779) |
The difference between book-basis and tax-basis cost and unrealized appreciation (depreciation) is attributable primarily to the tax deferral of losses on wash sales.
The accumulated capital losses represent net capital loss carryovers that may be used to offset future realized capital gains for federal income tax purposes. Future capital loss carryover utilization in any given year may be subject to Internal Revenue Code limitations. The capital loss carryovers expire as follows:
| | | | |
| 2014 | 2015 | 2016 | 2017 |
| $(87,145,230) | — | $(125,173,360) | $(112,369,189) |
11. Corporate Event
As part of a long-standing estate and business succession plan established by James E. Stowers, Jr., the founder of American Century Investments, ACC Chairman Richard W. Brown succeeded Mr. Stowers as trustee of a trust that holds a greater-than-25% voting interest in ACC, the parent corporation of the fund’s advisor. Under the 1940 Act, this is presumed to represent control of ACC even though it is less than a majority interest. The change of trustee was considered a change of control of ACC and therefore also a change of control of the fund’s advisor even though there has been no change to its management and none is anticipated. The change of control resulted in the assignment of the fund’s investment advisory agreement. As required by the 1940 Act, the assignment automatically terminated such agreem ent, making the approval of a new agreement necessary.
On February 18, 2010, the Board of Directors approved an interim investment advisory agreement under which the fund was managed until a new agreement was approved. The new agreement for the fund was approved by the Board of Directors on March 29, 2010, and by shareholders at a Special Meeting of Shareholders on June 16, 2010. It went into effect on July 16, 2010. The new agreement, which is substantially identical to the terminated agreement (with the exception of different effective and termination dates), did not result in changes in the management of American Century Investments, the fund, its investment objectives, fees or services provided.
Small Cap Growth
| Investor Class |
| For a Share Outstanding Throughout the Years Ended October 31 |
| | 2010 | 2009 | 2008 | 2007 | 2006 |
| Per-Share Data |
| Net Asset Value, Beginning of Period | $5.47 | $5.57 | $9.42 | $7.63 | $6.75 |
| Income From Investment Operations | | | | | |
Net Investment Income (Loss)(1) | (0.03) | (0.02) | (0.04) | (0.05) | (0.06) |
| Net Realized and Unrealized Gain (Loss) | 2.01 | (0.08) | (3.73) | 2.52 | 1.16 |
| Total From Investment Operations | 1.98 | (0.10) | (3.77) | 2.47 | 1.10 |
| Distributions | | | | | |
| From Net Realized Gains | — | — | (0.08) | (0.68) | (0.22) |
| Net Asset Value, End of Period | $7.45 | $5.47 | $5.57 | $9.42 | $7.63 |
| | | | | | |
Total Return(2) | 36.20% | (1.80)% | (40.34)% | 35.22% | 16.52% |
| | | | | | |
| Ratios/Supplemental Data |
Ratio of Operating Expenses to Average Net Assets | 1.42% | 1.41% | 1.36% | 1.41% | 1.50% |
Ratio of Net Investment Income (Loss) to Average Net Assets | (0.48)% | (0.40)% | (0.49)% | (0.70)% | (0.80)% |
| Portfolio Turnover Rate | 183% | 204% | 148% | 204% | 299% |
| Net Assets, End of Period (in thousands) | $142,793 | $170,125 | $222,017 | $303,189 | $51,336 |
| (1) | Computed using average shares outstanding throughout the period. |
| (2) | Total returns are calculated based on the net asset value of the last business day. Total returns for periods less than one year are not annualized. |
See Notes to Financial Statements.
Small Cap Growth
| Institutional Class |
| For a Share Outstanding Throughout the Years Ended October 31 (except as noted) |
| | 2010 | 2009 | 2008 | 2007(1) |
| Per-Share Data |
| Net Asset Value, Beginning of Period | $5.49 | $5.59 | $9.43 | $8.27 |
| Income From Investment Operations | | | | |
Net Investment Income (Loss)(2) | (0.02) | (0.01) | (0.02) | (0.03) |
| Net Realized and Unrealized Gain (Loss) | 2.03 | (0.09) | (3.74) | 1.19 |
| Total From Investment Operations | 2.01 | (0.10) | (3.76) | 1.16 |
| Distributions | | | | |
| From Net Realized Gains | — | — | (0.08) | — |
| Net Asset Value, End of Period | $7.50 | $5.49 | $5.59 | $9.43 |
| | | | | |
Total Return(3) | 36.61% | (1.79)% | (40.19)% | 14.03% |
| | | | | |
| Ratios/Supplemental Data |
| Ratio of Operating Expenses to Average Net Assets | 1.22% | 1.21% | 1.16% | 1.21%(4) |
| Ratio of Net Investment Income (Loss) to Average Net Assets | (0.28)% | (0.20)% | (0.29)% | (0.65)%(4) |
| Portfolio Turnover Rate | 183% | 204% | 148% | 204%(5) |
| Net Assets, End of Period (in thousands) | $114,513 | $108,261 | $91,791 | $18,384 |
| (1) | May 18, 2007 (commencement of sale) through October 31, 2007. |
| (2) | Computed using average shares outstanding throughout the period. |
| (3) | Total returns are calculated based on the net asset value of the last business day. Total returns for periods less than one year are not annualized. |
| (5) | Portfolio turnover is calculated at the fund level. Percentage indicated was calculated for the year ended October 31, 2007. |
See Notes to Financial Statements.
Small Cap Growth
| A Class |
| For a Share Outstanding Throughout the Years Ended October 31 |
| | 2010 | 2009 | 2008 | 2007 | 2006 |
| Per-Share Data |
| Net Asset Value, Beginning of Period | $5.41 | $5.53 | $9.37 | $7.59 | $6.72 |
| Income From Investment Operations | | | | | |
Net Investment Income (Loss)(1) | (0.05) | (0.03) | (0.06) | (0.07) | (0.08) |
| Net Realized and Unrealized Gain (Loss) | 1.99 | (0.09) | (3.70) | 2.51 | 1.16 |
| Total From Investment Operations | 1.94 | (0.12) | (3.76) | 2.44 | 1.08 |
| Distributions | | | | | |
| From Net Realized Gains | — | — | (0.08) | (0.66) | (0.21) |
| Net Asset Value, End of Period | $7.35 | $5.41 | $5.53 | $9.37 | $7.59 |
| | | | | | |
Total Return(2) | 35.86% | (2.17)% | (40.45)% | 34.91% | 16.22% |
| | | | | | |
| Ratios/Supplemental Data |
Ratio of Operating Expenses to Average Net Assets | 1.67% | 1.66% | 1.61% | 1.66% | 1.75% |
Ratio of Net Investment Income (Loss) to Average Net Assets | (0.73)% | (0.65)% | (0.74)% | (0.95)% | (1.05)% |
| Portfolio Turnover Rate | 183% | 204% | 148% | 204% | 299% |
| Net Assets, End of Period (in thousands) | $126,763 | $114,026 | $129,791 | $202,515 | $73,383 |
| (1) | Computed using average shares outstanding throughout the period. |
| (2) | Total returns are calculated based on the net asset value of the last business day and do not reflect applicable sales charges. Total returns for periods less than one year are not annualized. |
See Notes to Financial Statements.
Small Cap Growth
| B Class |
| For a Share Outstanding Throughout the Years Ended October 31 |
| | 2010 | 2009 | 2008 | 2007 | 2006 |
| Per-Share Data |
| Net Asset Value, Beginning of Period | $5.26 | $5.41 | $9.25 | $7.49 | $6.63 |
| Income From Investment Operations | | | | | |
Net Investment Income (Loss)(1) | (0.09) | (0.07) | (0.11) | (0.13) | (0.14) |
| Net Realized and Unrealized Gain (Loss) | 1.93 | (0.08) | (3.65) | 2.49 | 1.15 |
| Total From Investment Operations | 1.84 | (0.15) | (3.76) | 2.36 | 1.01 |
| Distributions | | | | | |
| From Net Realized Gains | — | — | (0.08) | (0.60) | (0.15) |
| Net Asset Value, End of Period | $7.10 | $5.26 | $5.41 | $9.25 | $7.49 |
| | | | | | |
Total Return(2) | 34.98% | (2.77)% | (40.97)% | 33.84% | 15.46% |
| | | | | | |
| Ratios/Supplemental Data |
Ratio of Operating Expenses to Average Net Assets | 2.42% | 2.41% | 2.36% | 2.41% | 2.50% |
Ratio of Net Investment Income (Loss) to Average Net Assets | (1.48)% | (1.40)% | (1.49)% | (1.70)% | (1.80)% |
| Portfolio Turnover Rate | 183% | 204% | 148% | 204% | 299% |
| Net Assets, End of Period (in thousands) | $3,107 | $2,976 | $2,846 | $4,549 | $3,383 |
| (1) | Computed using average shares outstanding throughout the period. |
| (2) | Total returns are calculated based on the net asset value of the last business day and do not reflect applicable sales charges. Total returns for periods less than one year are not annualized. |
See Notes to Financial Statements.
Small Cap Growth
| C Class |
| For a Share Outstanding Throughout the Years Ended October 31 |
| | 2010 | 2009 | 2008 | 2007 | 2006 |
| Per-Share Data |
| Net Asset Value, Beginning of Period | $5.28 | $5.44 | $9.29 | $7.52 | $6.66 |
| Income From Investment Operations | | | | | |
Net Investment Income (Loss)(1) | (0.09) | (0.07) | (0.11) | (0.13) | (0.14) |
| Net Realized and Unrealized Gain (Loss) | 1.94 | (0.09) | (3.66) | 2.50 | 1.15 |
| Total From Investment Operations | 1.85 | (0.16) | (3.77) | 2.37 | 1.01 |
| Distributions | | | | | |
| From Net Realized Gains | — | — | (0.08) | (0.60) | (0.15) |
| Net Asset Value, End of Period | $7.13 | $5.28 | $5.44 | $9.29 | $7.52 |
| | | | | | |
Total Return(2) | 35.04% | (2.94)% | (40.91)% | 34.02% | 15.24% |
| | | | | | |
| Ratios/Supplemental Data |
Ratio of Operating Expenses to Average Net Assets | 2.42% | 2.41% | 2.36% | 2.41% | 2.50% |
Ratio of Net Investment Income (Loss) to Average Net Assets | (1.48)% | (1.40)% | (1.49)% | (1.70)% | (1.80)% |
| Portfolio Turnover Rate | 183% | 204% | 148% | 204% | 299% |
| Net Assets, End of Period (in thousands) | $13,476 | $11,608 | $12,983 | $16,406 | $4,424 |
| (1) | Computed using average shares outstanding throughout the period. |
| (2) | Total returns are calculated based on the net asset value of the last business day and do not reflect applicable sales charges. Total returns for periods less than one year are not annualized. |
See Notes to Financial Statements.
Small Cap Growth
| R Class |
| For a Share Outstanding Throughout the Years Ended October 31 (except as noted) |
| | 2010 | 2009 | 2008 | 2007(1) |
| Per-Share Data |
| Net Asset Value, Beginning of Period | $5.41 | $5.54 | $9.42 | $9.02 |
| Income From Investment Operations | | | | |
Net Investment Income (Loss)(2) | (0.06) | (0.06) | (0.06) | (0.01) |
| Net Realized and Unrealized Gain (Loss) | 1.98 | (0.07) | (3.74) | 0.41 |
| Total From Investment Operations | 1.92 | (0.13) | (3.80) | 0.40 |
| Distributions | | | | |
| From Net Realized Gains | — | — | (0.08) | — |
| Net Asset Value, End of Period | $7.33 | $5.41 | $5.54 | $9.42 |
| | | | | |
Total Return(3) | 35.49% | (2.35)% | (40.66)% | 4.43% |
| | | | | |
| Ratios/Supplemental Data |
| Ratio of Operating Expenses to Average Net Assets | 1.92% | 1.91% | 1.86% | 1.91%(4) |
| Ratio of Net Investment Income (Loss) to Average Net Assets | (0.98)% | (0.90)% | (0.99)% | (1.61)%(4) |
| Portfolio Turnover Rate | 183% | 204% | 148% | 204%(5) |
| Net Assets, End of Period (in thousands) | $998 | $545 | $108 | $26 |
| (1) | September 28, 2007 (commencement of sale) through October 31, 2007. |
| (2) | Computed using average shares outstanding throughout the period. |
| (3) | Total returns are calculated based on the net asset value of the last business day. Total returns for periods less than one year are not annualized. |
| (5) | Portfolio turnover is calculated at the fund level. Percentage indicated was calculated for the year ended October 31, 2007. |
See Notes to Financial Statements.
Report of Independent Registered Public Accounting Firm
The Board of Directors and Shareholders,
American Century Mutual Funds, Inc.:
We have audited the accompanying statement of assets and liabilities, including the schedule of investments, of Small Cap Growth Fund (formerly, New Opportunities II Fund), one of the funds constituting American Century Mutual Funds, Inc. (the “Corporation”), as of October 31, 2010, and the related statement of operations for the year then ended, the statements of changes in net assets for each of the two years in the period then ended, and the financial highlights for each of the periods presented. These financial statements and financial highlights are the responsibility of the Corporation’s management. Our responsibility is to express an opinion on these financial statements and financial highlights based on our aud its.
We conducted our audits in accordance with the standards of the Public Company Accounting Oversight Board (United States). Those standards require that we plan and perform the audit to obtain reasonable assurance about whether the financial statements and financial highlights are free of material misstatement. The Corporation is not required to have, nor were we engaged to perform, an audit of its internal control over financial reporting. Our audits included consideration of internal control over financial reporting as a basis for designing audit procedures that are appropriate in the circumstances, but not for the purpose of expressing an opinion on the effectiveness of the Corporation’s internal control over financial reporting. Accordingly, we express no such opinion. An audit also includes examining, on a te st basis, evidence supporting the amounts and disclosures in the financial statements, assessing the accounting principles used and significant estimates made by management, as well as evaluating the overall financial statement presentation. Our procedures included confirmation of securities owned as of October 31, 2010, by correspondence with the custodian and brokers; where replies were not received from brokers, we performed other auditing procedures. We believe that our audits provide a reasonable basis for our opinion.
In our opinion, the financial statements and financial highlights referred to above present fairly, in all material respects, the financial position of Small Cap Growth Fund (formerly, New Opportunities II Fund) of American Century Mutual Funds, Inc., as of October 31, 2010, the results of its operations for the year then ended, the changes in its net assets for each of the two years in the period then ended, and the financial highlights for each of the periods presented in conformity with accounting principles generally accepted in the United States of America.
Deloitte & Touche LLP
Kansas City, Missouri
December 20, 2010
A special meeting of shareholders was held on June 16, 2010, to vote on the following proposals. Each proposal received the required number of votes and was adopted. A summary of voting results is listed below each proposal.
Proposal 1:
To elect one Director to the Board of Directors of American Century Mutual Funds, Inc. (the proposal was voted on by all shareholders of funds issued by American Century Mutual Funds, Inc.):
| | | | | |
| | John R. Whitten | For: | 13,907,426,552 | |
| | | Withhold: | 629,801,798 | |
| | | Abstain: | 0 | |
| | | Broker Non-Vote: | 0 | |
The other directors whose term of office continued after the meeting include Jonathan S. Thomas, Thomas A. Brown, Andrea C. Hall, James A. Olson, Donald H. Pratt, and M. Jeannine Strandjord.
Proposal 2:
To approve a management agreement between the fund and American Century Investment Management, Inc.:
| | | | | |
| | Investor, A, B, C and R Classes | For: | 133,347,483 | |
| | | Against: | 3,490,038 | |
| | | Abstain: | 4,957,455 | |
| | | Broker Non-Vote: | 52,256,165 | |
| | | | | |
| | Institutional Class | For: | 102,613,198 | |
| | | Against: | 123,162 | |
| | | Abstain: | 23,576 | |
| | | Broker Non-Vote: | 5,208,535 | |
Proposal 3:
To approve an amendment to the Articles of Incorporation to limit certain director liability to the extent permitted by Maryland law (the proposal was voted on by all shareholders of funds issued by American Century Mutual Funds, Inc.):
| | | | | |
| | | For: | 12,112,932,038 | |
| | | Against: | 769,504,652 | |
| | | Abstain: | 420,034,445 | |
| | | Broker Non-Vote: | 1,234,757,216 | |
The Board of Directors
The individuals listed below serve as directors of the fund. Each director will continue to serve in this capacity until death, retirement, resignation or removal from office. The mandatory retirement age for directors who are not “interested persons,” as that term is defined in the Investment Company Act (independent directors), is 72. However, the mandatory retirement age for an individual director may be extended with the approval of the remaining independent directors.
Mr. Thomas is the only director who is an “interested person” because he currently serves as President and Chief Executive Officer of American Century Companies, Inc. (ACC), the parent company of American Century Investment Management, Inc. (ACIM or the advisor).
The other directors (more than three-fourths of the total number) are independent; that is, they have never been employees, directors or officers of, and have no financial interest in, ACC or any of its wholly owned, direct or indirect, subsidiaries, including ACIM, American Century Investment Services, Inc. (ACIS) and American Century Services, LLC (ACS). The directors serve in this capacity for seven (in the case of Mr. Thomas, 15) registered investment companies in the American Century Investments family of funds.
The following presents additional information about the directors. The mailing address for each director is 4500 Main Street, Kansas City, Missouri 64111.
Independent Directors
Thomas A. Brown
Year of Birth: 1940
Position(s) with the Fund: Director
Length of Time Served: Since 1980
Principal Occupation(s) During the Past Five Years: Managing Member, Associated Investments, LLC (real estate investment company); Brown Cascade Properties, LLC (real estate investment company) (2001 to 2009)
Number of Funds in Fund Complex Overseen by Director: 61
Other Directorships Held by Director During the Past Five Years: None
Education/Other Professional Experience: BS in Mechanical Engineering, University of Kansas; formerly, Chief Executive Officer, Associated Bearings Company; formerly, Area Vice President, Applied Industrial Technologies (bearings and power transmission company)
Andrea C. Hall
Year of Birth: 1945
Position(s) with the Fund: Director
Length of Time Served: Since 1997
Principal Occupation(s) During the Past Five Years: Retired as advisor to the President, Midwest Research Institute (not-for-profit research organization) (June 2006)
Number of Funds in Fund Complex Overseen by Director: 61
Other Directorships Held by Director During the Past Five Years: None
Education/Other Professional Experience: BS in Biology, Florida State University; PhD in Biology, Georgetown University; formerly, Senior Vice President and Director of Research Operations, Midwest Research Institute
James A. Olson
Year of Birth: 1942
Position(s) with the Fund: Director
Length of Time Served: Since 2007
Principal Occupation(s) During the Past Five Years: Member, Plaza Belmont LLC (private equity fund manager); Chief Financial Officer, Plaza Belmont LLC (September 1999 to September 2006)
Number of Funds in Fund Complex Overseen by Director: 61
Other Directorships Held by Director During the Past Five Years: Saia, Inc. and Entertainment Properties Trust
Education/Other Professional Experience: BS in Business Administration and MBA, St. Louis University; CPA; 21 years of experience as a partner in the accounting firm of Ernst & Young LLP
Donald H. Pratt
Year of Birth: 1937
Position(s) with the Fund: Director, Chairman of the Board
Length of Time Served: Since 1995 (Chairman since 2005)
Principal Occupation(s) During the Past Five Years: Chairman and Chief Executive Officer, Western Investments, Inc. (real estate company)
Number of Funds in Fund Complex Overseen by Director: 61
Other Directorships Held by Director During the Past Five Years: None
Education/Other Professional Experience: BS in Industrial Engineering, Wichita State University; MBA, Harvard Business School; serves on the Board of Governors of the Independent Directors Council and Investment Company Institute; formerly, Chairman of the Board, Butler Manufacturing Company (metal buildings producer)
M. Jeannine Strandjord
Year of Birth: 1945
Position(s) with the Fund: Director
Length of Time Served: Since 1994
Principal Occupation(s) During the Past Five Years: Retired, formerly, Senior Vice President, Process Excellence, Sprint Corporation (telecommunications company) (January 2005 to September 2005)
Number of Funds in Fund Complex Overseen by Director: 61
Other Directorships Held by Director During the Past Five Years: DST Systems Inc., Euronet Worldwide Inc., Charming Shoppes, Inc.
Education/Other Professional Experience: BS in Business Administration and Accounting, University of Kansas; CPA; formerly, Senior Vice President of Financial Services and Treasurer and Chief Financial Officer, Global Markets Group; Sprint Corporation; formerly, with the accounting firm of Ernst and Whinney
John R. Whitten
Year of Birth: 1946
Position(s) with the Fund: Director
Length of Time Served: Since 2008
Principal Occupation(s) During the Past Five Years: Project Consultant, Celanese Corp. (industrial chemical company)
Number of Funds in Fund Complex Overseen by Director: 61
Other Directorships Held by Director During the Past Five Years: Rudolph Technologies, Inc.
Professional Education/Experience: BS in Business Administration, Cleveland State University; CPA; formerly, Chief Financial Officer and Treasurer, Applied Industrial Technologies, Inc.; thirteen years of experience with accounting firm Deloitte & Touche LLP
Interested Director
Jonathan S. Thomas
Year of Birth: 1963
Position(s) with the Fund: Director and President
Length of Time Served: Since 2007
Principal Occupation(s) During the Past Five Years: President and Chief Executive Officer, ACC (March 2007 to present); Chief Administrative Officer, ACC (February 2006 to February 2007); Executive Vice President, ACC (November 2005 to February 2007). Also serves as: Chief Executive Officer and Manager, ACS; Executive Vice President, ACIM; Director, ACC, ACIM and other ACC subsidiaries
Number of Funds in Fund Complex Overseen by Director: 101
Other Directorships Held by Director During the Past Five Years: None
Education/Other Professional Experience: BA in Economics, University of Massachusetts; MBA, Boston College; formerly held senior leadership roles with Fidelity Investments, Boston Financial Services, Bank of America and Morgan Stanley; serves on the Board of Governors of the Investment Company Institute
Officers
The following table presents certain information about the executive officers of the fund. Each officer serves as an officer for each of the 15 investment companies in the American Century family of funds, unless otherwise noted. No officer is compensated for his or her service as an officer of the fund. The listed officers are interested persons of the fund and are appointed or re-appointed on an annual basis. The mailing address for each of the officers listed below is 4500 Main Street, Kansas City, Missouri 64111.
| | | | |
| | Name (Year of Birth) | Offices with the Fund | Principal Occupation(s) During the Past Five Years |
| | Jonathan S. Thomas (1963) | Director and President since 2007 | President and Chief Executive Officer, ACC (March 2007 to present); Chief Administrative Officer, ACC (February 2006 to February 2007); Executive Vice President, ACC (November 2005 to February 2007). Also serves as: Chief Executive Officer and Manager, ACS; Executive Vice President, ACIM; Director, ACC, ACIM and other ACC subsidiaries |
| | Barry Fink (1955) | Executive Vice President since 2007 | Chief Operating Officer and Executive Vice President, ACC (September 2007 to present); President, ACS (October 2007 to present); Managing Director, Morgan Stanley (2000 to 2007); Global General Counsel, Morgan Stanley (2000 to 2006). Also serves as: Manager, ACS and Director, ACC and certain ACC subsidiaries |
| | Maryanne L. Roepke (1956) | Chief Compliance Officer since 2006 and Senior Vice President since 2000 | Chief Compliance Officer, American Century funds, ACIM and ACS (August 2006 to present); Assistant Treasurer, ACC (January 1995 to August 2006); and Treasurer and Chief Financial Officer, various American Century funds (July 2000 to August 2006). Also serves as: Senior Vice President, ACS |
| | Charles A. Etherington (1957) | General Counsel since 2007 and Senior Vice President since 2006 | Attorney, ACC (February 1994 to present); Vice President, ACC (November 2005 to present), General Counsel, ACC (March 2007 to present); Also serves as General Counsel, ACIM, ACS, ACIS and other ACC subsidiaries; and Senior Vice President, ACIM and ACS |
| | Robert J. Leach (1966) | Vice President, Treasurer and Chief Financial Officer since 2006 | Vice President, ACS (February 2000 to present); and Controller, various American Century funds (1997 to September 2006) |
| | David H. Reinmiller (1963) | Vice President since 2000 | Attorney, ACC (January 1994 to present); Associate General Counsel, ACC (January 2001 to present); Chief Compliance Officer, American Century funds and ACIM (January 2001 to February 2005). Also serves as Vice President, ACIM and ACS |
| | Ward D. Stauffer (1960) | Secretary since 2005 | Attorney, ACC (June 2003 to present) |
| | | | |
| | The Statement of Additional Information has additional information about the fund’s directors and is available without charge, upon request, by calling 1-800-345-2021. |
Retirement Account Information
As required by law, distributions you receive from certain IRAs, or 403(b), 457 and qualified plans are subject to federal income tax withholding, unless you elect not to have withholding apply. Tax will be withheld on the total amount withdrawn even though you may be receiving amounts that are not subject to withholding, such as nondeductible contributions. In such case, excess amounts of withholding could occur. You may adjust your withholding election so that a greater or lesser amount will be withheld.
If you don’t want us to withhold on this amount, you must notify us to not withhold the federal income tax. You may notify us in writing or in certain situations by telephone or through other electronic means. You have the right to revoke your withholding election at any time and any election you make may remain in effect until revoked by filing a new election.
Remember, even if you elect not to have income tax withheld, you are liable for paying income tax on the taxable portion of your withdrawal. If you elect not to have income tax withheld or you don’t have enough income tax withheld, you may be responsible for payment of estimated tax. You may incur penalties under the estimated tax rules if your withholding and estimated tax payments are not sufficient. You can reduce or defer the income tax on a distribution by directly or indirectly rolling such distribution over to another IRA or eligible plan. You should consult your tax advisor for additional information.
State tax will be withheld if, at the time of your distribution, your address is within one of the mandatory withholding states and you have federal income tax withheld. State taxes will be withheld from your distribution in accordance with the respective state rules.
Proxy Voting Guidelines
American Century Investment Management, Inc., the fund’s investment advisor, is responsible for exercising the voting rights associated with the securities purchased and/or held by the fund. A description of the policies and procedures the advisor uses in fulfilling this responsibility is available without charge, upon request, by calling 1-800-345-2021. It is also available on American Century Investments’ website at americancentury.com and on the Securities and Exchange Commission’s website at sec.gov. Information regarding how the investment advisor voted proxies relating to portfolio securities during the most recent 12-month period ended June 30 is available on the “About Us” page at americancentury.com. It is also available at sec.gov.
Quarterly Portfolio Disclosure
The fund files its complete schedule of portfolio holdings with the Securities and Exchange Commission (SEC) for the first and third quarters of each fiscal year on Form N-Q. The fund’s Forms N-Q are available on the SEC’s website at sec.gov, and may be reviewed and copied at the SEC’s Public Reference Room in Washington, DC. Information on the operation of the Public Reference Room may be obtained by calling 1-800-SEC-0330. The fund also makes its complete schedule of portfolio holdings for the most recent quarter of its fiscal year available on its web site at americancentury.com and, upon request, by calling 1-800-345-2021.
The following indices are used to illustrate investment market, sector, or style performance or to serve as fund performance comparisons. They are not investment products available for purchase.
The Russell 1000® Index is a market-capitalization weighted, large-cap index created by Frank Russell Company to measure the performance of the 1,000 largest publicly traded U.S. companies, based on total market capitalization.
The Russell 1000® Growth Index measures the performance of those Russell 1000 Index companies (the 1,000 largest publicly traded U.S. companies, based on total market capitalization) with higher price-to-book ratios and higher forecasted growth values.
The Russell 1000® Value Index measures the performance of those Russell 1000 Index companies (the 1,000 largest publicly traded U.S. companies, based on total market capitalization) with lower price-to-book ratios and lower forecasted growth values.
The Russell 2000® Index is a market-capitalization weighted index created by Frank Russell Company to measure the performance of the 2,000 smallest of the 3,000 largest publicly traded U.S. companies, based on total market capitalization.
The Russell 2000® Growth Index measures the performance of those Russell 2000 Index companies (the 2,000 smallest of the 3,000 largest publicly traded U.S. companies, based on total market capitalization) with higher price-to-book ratios and higher forecasted growth values.
The Russell 2000® Value Index measures the performance of those Russell 2000 Index companies (the 2,000 smallest of the 3,000 largest publicly traded U.S. companies, based on total market capitalization) with lower price-to-book ratios and lower forecasted growth values.
The Russell Midcap® Index measures the performance of the 800 smallest of the 1,000 largest publicly traded U.S. companies, based on total market capitalization.
The Russell Midcap® Growth Index measures the performance of those Russell Midcap Index companies (the 800 smallest of the 1,000 largest publicly traded U.S. companies, based on total market capitalization) with higher price-to-book ratios and higher forecasted growth values.
The Russell Midcap® Value Index measures the performance of those Russell Midcap Index companies (the 800 smallest of the 1,000 largest publicly traded U.S. companies, based on total market capitalization) with lower price-to-book ratios and lower forecasted growth values.
Notes
| |
| | |
| Contact Us | |
| | |
| americancentury.com | |
| | |
| Automated Information Line | 1-800-345-8765 |
| | |
| Investor Services Representative | 1-800-345-2021 or 816-531-5575 |
| | |
| Investors Using Advisors | 1-800-378-9878 |
| | |
| Business, Not-For-Profit, Employer-Sponsored Retirement Plans | 1-800-345-3533 |
| | |
| Banks and Trust Companies, Broker-Dealers, Financial Professionals, Insurance Companies | 1-800-345-6488 |
| | |
| Telecommunications Device for the Deaf | 1-800-634-4113 |
| | |
| American Century Mutual Funds, Inc. |
| |
Investment Advisor: American Century Investment Management, Inc. Kansas City, Missouri |
| |
| This report and the statements it contains are submitted for the general information of our shareholders. The report is not authorized for distribution to prospective investors unless preceded or accompanied by an effective prospectus. |
American Century Investment Services, Inc., Distributor
©2010 American Century Proprietary Holdings, Inc. All rights reserved.
| Annual Report |
| October 31, 2010 |
American Century Investments®
| | President’s Letter | 2 |
| | Independent Chairman’s Letter | 3 |
| | Market Perspective | 4 |
| | U.S. Stock Index Returns | 4 |
| | | |
| Ultra |
| |
| | Performance | 5 |
| | Portfolio Commentary | 7 |
| | Top Ten Holdings | 9 |
| | Top Five Industries | 9 |
| | Types of Investments in Portfolio | 9 |
| | | |
| | Shareholder Fee Example | 10 |
| | | |
| Financial Statements |
| |
| | Schedule of Investments | 12 |
| | Statement of Assets and Liabilities | 15 |
| | Statement of Operations | 16 |
| | Statement of Changes in Net Assets | 17 |
| | Notes to Financial Statements | 18 |
| | Financial Highlights | 25 |
| | Report of Independent Registered Public Accounting Firm | 31 |
| | | |
| Other Information |
| |
| | Proxy Voting Results | 32 |
| | Management | 33 |
| | Additional Information | 37 |
| | Index Definitions | 38 |
Any opinions expressed in this report reflect those of the author as of the date of the report, and do not necessarily represent the opinions of American Century Investments or any other person in the American Century Investments organization. Any such opinions are subject to change at any time based upon market or other conditions and American Century Investments disclaims any responsibility to update such opinions. These opinions may not be relied upon as investment advice and, because investment decisions made by American Century Investments funds are based on numerous factors, may not be relied upon as an indication of trading intent on behalf of any American Century Investments fund. Security examples are used for representational purposes only and are not intended as recommendations to purchase or sell securities. Performance information for comparative indices and securities is provided to American Century Investments by third party vendors. To the best of American Century Investments’ knowledge, such information is accurate at the time of printing.
Jonathan Thomas
Dear Investor:
To learn more about the capital markets, your investment, and the portfolio management strategies American Century Investments provides, we encourage you to review this shareholder report for the financial reporting period ended October 31, 2010.
On the following pages, you will find investment performance and portfolio information, presented with the expert perspective and commentary of our portfolio management team. This report remains one of our most important vehicles for conveying the information you need about your investment performance, and about the market factors and strategies that affect fund returns. For additional information on the markets, we encourage you to visit the “Insights & News” tab at our Web site, americancentury.com, for updates and further expert commentary.
The top of our Web site’s home page also provides a link to “Our Story,” which, first and foremost, outlines our commitment—since 1958—to helping clients reach their financial goals. We believe strongly that we will only be successful when our clients are successful. That’s who we are.
Another important, unique facet of our story and who we are is “Profits with a Purpose,” which describes our bond with the Stowers Institute for Medical Research (SIMR). SIMR is a world-class biomedical organization—founded by our company founder James E. Stowers, Jr. and his wife Virginia—that is dedicated to researching the causes, treatment, and prevention of gene-based diseases, including cancer. Through American Century Investments’ private ownership structure, more than 40% of our profits support SIMR.
Mr. Stowers’ example of achieving financial success and using that platform to help humanity motivates our entire American Century Investments team. His story inspires us to help each of our clients achieve success. Thank you for sharing your financial journey with us.
Sincerely,
Jonathan Thomas
President and Chief Executive Officer
American Century Investments
Independent Chairman’s Letter
Don Pratt
Dear Fellow Shareholders,
As regulators and the markets continue to sort out the events of the credit crisis, a consistent theme has been that financial services firms should re-examine their risk management practices. Risk management has been a regular part of American Century Investments’ activities for many years. However, recently American Century and your mutual fund board have been spending additional time focusing on our risk oversight processes.
The board’s efforts are now organized around three categories of risk: investment risk, operational risk, and enterprise risk. This approach has facilitated a realignment of many risk oversight tasks that the board has historically conducted. Investment risk tasks include a review of portfolio risk, monitoring the use of derivatives, and performance assessment. Operational risk focuses on compliance, valuation, shareholder services, and trading activities. Enterprise risk addresses the financial condition of the advisor, human resource development, and reputational risks. Risk oversight tasks are addressed in every quarterly board meeting, and a review of the advisor’s entire risk management program is undertaken annually. We acknowledge and support the approach that American Century Investments takes to its risk management responsibilities. While the board has refocused its efforts in this important oversight area, we recognize that risk oversight is a journey and we expect to continue to improve our processes.
Our September quarterly board meeting was held in the New York offices of American Century Investments. This gave the directors an opportunity to meet with the portfolio management teams for each of the global and international funds overseen by the board. Each team uses sophisticated investment tools and daily risk analysis in managing client assets. We also were impressed with the “bench strength” that has been developed under the leadership of the Global and Non-U.S. Equity CIO Mark Kopinski. These face-to-face meetings provide an opportunity for the directors – working on behalf of shareholders – to validate the advisor’s efforts and the investment management approach being followed.
I thank you for your continued confidence in American Century during this turbulent time in the economy and investment markets. If you have thoughts or questions you would like to share with the board send them to me at dhpratt@fundboardchair.com.
Best regards,
Don Pratt
By Greg Woodhams, Chief Investment Officer, U.S. Growth Equity—Large Cap
Stocks Advanced, But Volatility Increased
The U.S. stock market posted double-digit gains for the 12 months ended October 31, 2010. The bulk of the advance occurred in the first half of the period as stocks extended a rally that began in March 2009. The market’s gains were driven by improving economic conditions, as evidenced by robust gross domestic product growth in the fourth quarter of 2009 and first quarter of 2010, and a rebound in corporate earnings as many companies significantly reduced costs to boost profit margins.
Market conditions grew more volatile during the last half of the period. Concerns about the European financial system and the strength of the economic recovery in the U.S. led to a stock market decline in May and June. However, the equity market finished the period on a positive note, staging a rally during the last two months of the period as economic indicators pointed to improved growth in the third quarter.
For the 12-month period, the broad equity indices returned approximately 18%. As the table below illustrates, mid- and small-cap issues led the market’s advance, returning more than 25% overall.
Growth Stocks Outperformed
Growth stocks outpaced value issues across all market capitalizations during the period, particularly over the last six months. The economically sensitive segments of the market—information technology, consumer discretionary, and industrials—were among the top performers for the 12 months. In contrast, the financials sector, which is the most prominent sector weighting in most value indices, lagged amid continued weakness in the housing market and uncertainty regarding the impact of recent financial reform legislation.
| U.S. Stock Index Returns |
| For the 12 months ended October 31, 2010 |
| Russell 1000 Index (Large-Cap) | 17.67% | | Russell 2000 Index (Small-Cap) | 26.58% |
| Russell 1000 Growth Index | 19.65% | | Russell 2000 Growth Index | 28.67% |
| Russell 1000 Value Index | 15.71% | | Russell 2000 Value Index | 24.43% |
| Russell Midcap Index | 27.71% | | |
| Russell Midcap Growth Index | 28.03% | | | |
| Russell Midcap Value Index | 27.49% | | | |
Ultra
| Total Returns as of October 31, 2010 |
| | | | Average Annual Returns | |
| | Ticker Symbol | 1 year | 5 years | 10 years | Since Inception | Inception Date |
| Investor Class | TWCUX | 19.63% | 1.00% | -1.77% | 10.98% | 11/2/81 |
Russell 1000 Growth Index | — | 19.65% | 3.21% | -2.52% | 9.98%(1) | — |
| S&P 500 Index | — | 16.52% | 1.73% | -0.02% | 11.10%(1) | — |
| Institutional Class | TWUIX | 19.81% | 1.19% | -1.57% | 4.13% | 11/14/96 |
A Class(2) No sales charge* With sales charge* | TWUAX | 19.24% 12.37% | 0.75% -0.44% | -2.03% -2.61% | 3.94% 3.51% | 10/2/96 |
B Class No sales charge* With sales charge* | AULBX | 18.42% 14.42% | — — | — — | -4.40% -5.48% | 9/28/07 |
| C Class | TWCCX | 18.45% | 0.00% | — | 1.01% | 10/29/01 |
| R Class | AULRX | 19.00% | 0.50% | — | 2.38% | 8/29/03 |
| Sales charges include initial sales charges and contingent deferred sales charges (CDSCs), as applicable. A Class shares have a 5.75% maximum initial sales charge for equity funds and may be subject to a maximum CDSC of 1.00%. B Class shares redeemed within six years of purchase are subject to a CDSC that declines from 5.00% during the first year after purchase to 0.00% the sixth year after purchase. C Class shares redeemed within 12 months of purchase are subject to a maximum CDSC of 1.00%. The SEC requires that mutual funds provide performance information net of maximum sales charges in all cases where charges could be applied. |
| (1) | Since 10/31/81, the date nearest the Investor Class’s inception for which data are available. |
| (2) | Prior to September 4, 2007, the A Class was referred to as the Advisor Class and did not have a front-end sales charge. Performance prior to that date has been adjusted to reflect this charge. |
Data presented reflect past performance. Past performance is no guarantee of future results. Current performance may be higher or lower than the performance shown. Investment return and principal value will fluctuate, and redemption value may be more or less than original cost. To obtain performance data current to the most recent month end, please call 1-800-345-2021 or visit americancentury.com. International investing involves special risks, such as political instability and currency fluctuations.
Unless otherwise indicated, performance reflects Investor Class shares; performance for other share classes will vary due to differences in fee structure. For information about other share classes available, please consult the prospectus. Data assumes reinvestment of dividends and capital gains, and none of the charts reflect the deduction of taxes that a shareholder would pay on fund distributions or the redemption of fund shares. Returns for the indices are provided for comparison. The fund’s total returns include operating expenses (such as transaction costs and management fees) that reduce returns, while the total returns of the indices do not.
Ultra
| Growth of $10,000 Over 10 Years |
| $10,000 investment made October 31, 2000 |
| Total Annual Fund Operating Expenses |
| Investor Class | Institutional Class | A Class | B Class | C Class | R Class |
| 1.00% | 0.80% | 1.25% | 2.00% | 2.00% | 1.50% |
The total annual fund operating expenses shown is as stated in the fund’s prospectus current as of the date of this report. The prospectus may vary from the expense ratio shown elsewhere in this report because it is based on a different time period, includes acquired fund fees and expenses, and, if applicable, does not include fee waivers or expense reimbursements.
Data presented reflect past performance. Past performance is no guarantee of future results. Current performance may be higher or lower than the performance shown. Investment return and principal value will fluctuate, and redemption value may be more or less than original cost. To obtain performance data current to the most recent month end, please call 1-800-345-2021 or visit americancentury.com. International investing involves special risks, such as political instability and currency fluctuations.
Unless otherwise indicated, performance reflects Investor Class shares; performance for other share classes will vary due to differences in fee structure. For information about other share classes available, please consult the prospectus. Data assumes reinvestment of dividends and capital gains, and none of the charts reflect the deduction of taxes that a shareholder would pay on fund distributions or the redemption of fund shares. Returns for the indices are provided for comparison. The fund’s total returns include operating expenses (such as transaction costs and management fees) that reduce returns, while the total returns of the indices do not.
Ultra
Portfolio Managers: Keith Lee and Michael Li
Performance Summary
Ultra returned 19.63%* for the 12 months ended October 31, 2010, mirroring the 19.65% return of its benchmark, the Russell 1000 Growth Index, and outpacing the 16.52% return of the broad S&P 500 Index.
Ultra’s return of nearly 20% for the fiscal year reflected solid gains for U.S. stocks in general and even better performance for growth-oriented companies. The fund performed in line with the Russell 1000 Growth Index for the 12 months, which was noteworthy because price momentum and accelerating growth—two key factors in Ultra’s investment process—were out of favor for much of the period. Instead, good stock selection and prudent risk management helped Ultra keep pace with its benchmark despite the performance headwinds.
Technology and Industrials Outperformed
Stock selection added the most value in the information technology and industrials sectors, which together comprised more than 40% of the portfolio during the period. The fund’s holdings among internet software and services firms and semiconductor manufacturers generated all of the outperformance in the information technology sector. By far, the top performance contributor in the portfolio was Baidu, China’s leading online advertising and search firm, which returned more than 185% for the 12-month period. The company benefited from the rapidly expanding internet presence of many Chinese companies, and also gained market share as competitor Google substantially reduced its presence in China.
Other notable winners among Ultra’s technology holdings included consumer electronics maker Apple and semiconductor company Altera, which makes programmable logic devices. Apple reported rapidly accelerating earnings thanks to the successful introduction of the iPad tablet computer and an upgraded release of its iPhone. Altera benefited from improving demand, particularly in China, and higher spending by wireless companies on network infrastructure.
In the industrials sector, outperformance was driven by an overweight position and favorable stock selection among machinery manufacturers. The best contributor was engine manufacturer Cummins, which benefited from stronger global demand—especially for its fuel-efficient engines—and a cyclical recovery in truck orders. Mining equipment manufacturer Joy Global reported better-than-expected revenues and earnings as rising commodity prices boosted production in the mining industry, while electrical equipment maker Emerson Electric rallied on increased orders and cost-cutting measures that boosted overall profitability.
*All fund returns referenced in this commentary are for Investor Class shares.
Ultra
Underweight Positions Added Value
When it comes to individual stock selection, we primarily discuss companies in which the fund holds larger positions than the benchmark index. Equally important, however, are the stocks represented in the index that we avoid or limit our exposure. For example, Ultra did not own any utilities stocks during the 12-month period because we were unable to find any companies in this sector that met our investment criteria. This proved to be favorable for relative performance as utilities stocks lagged the rest of the market.
Similarly, the fund’s underweight position in the consumer staples sector, particularly among household products makers and selected food retailers, contributed positively to relative results.
Financials and Materials Detracted
Ultra’s holdings in the financials and materials sectors underperformed their counterparts in the Russell 1000 Growth Index. Several of the portfolio’s financial stocks, including investment bank Goldman Sachs and diversified financial services firm JPMorgan Chase, were adversely affected by uncertainty surrounding the impact of recent financial reform legislation. Goldman Sachs was further hurt by a fraud lawsuit filed by the Securities and Exchange Commission.
The most significant detractor in the financials sector was CME Group, which operates one of the largest and most diversified options and futures exchanges. Lower trading volumes on the exchange weighed on the company’s results, sending the stock price down. Asset manager Charles Schwab slumped as the low interest rate environment led to losses resulting from fee waivers on the company’s money market funds.
The underperformance in the materials sector resulted entirely from a single holding—agricultural products maker Monsanto. The company reported disappointing earnings as results were negatively impacted by increased competition for its Roundup herbicide and below-target sales for its new enhanced seeds.
Other notable decliners included design software maker Adobe Systems, department store chain Kohl’s, and biotechnology firm Gilead Sciences. Adobe tumbled after providing a weaker-than-expected outlook for the company over the last half of 2010, Kohl’s lagged behind more cyclical retailers, and Gilead faced uncertainty regarding federal health care reform and lacked clarity for products in the pipeline.
A Look Ahead
Over the past 12 months, the economic outlook has become less promising and more uncertain. Consumers continue to deleverage, the housing market remains in the doldrums, and the unemployment rate still hovers above 9%. It remains to be seen whether the Federal Reserve’s recent quantitative easing efforts will help reverse these trends.
Importantly, our investment process is not dependent on making macroeconomic predictions. We focus on selecting individual companies exhibiting accelerating business fundamentals, positive relative strength, and reasonable valuations. We believe that products exhibiting these characteristics provide greater probability of outperforming the market over the long term.
Ultra
| Top Ten Holdings |
| | % of net assets as of 10/31/10 |
| Apple, Inc. | 6.0% |
| Google, Inc., Class A | 4.8% |
| Cisco Systems, Inc. | 2.5% |
| Microsoft Corp. | 2.5% |
| Amazon.com, Inc. | 2.4% |
| Philip Morris International, Inc. | 2.3% |
| Schlumberger Ltd. | 2.3% |
| Exxon Mobil Corp. | 2.3% |
| McDonald’s Corp. | 2.1% |
| Express Scripts, Inc. | 2.1% |
| | |
| Top Five Industries |
| | % of net assets as of 10/31/10 |
| Computers & Peripherals | 8.4% |
| Software | 7.2% |
| Internet Software & Services | 6.7% |
| Machinery | 6.1% |
| Oil, Gas & Consumable Fuels | 5.8% |
| | |
| Types of Investments in Portfolio |
| | % of net assets as of 10/31/10 |
| Domestic Common Stocks | 91.9% |
| Foreign Common Stocks* | 7.4% |
| Total Common Stocks | 99.3% |
| Temporary Cash Investments | 0.8% |
| Other Assets and Liabilities | (0.1)% |
*Includes depositary shares, dual listed securities and foreign ordinary shares.
Shareholder Fee Example (Unaudited)
Fund shareholders may incur two types of costs: (1) transaction costs, including sales charges (loads) on purchase payments and redemption/exchange fees; and (2) ongoing costs, including management fees; distribution and service (12b-1) fees; and other fund expenses. This example is intended to help you understand your ongoing costs (in dollars) of investing in your fund and to compare these costs with the ongoing cost of investing in other mutual funds.
The example is based on an investment of $1,000 made at the beginning of the period and held for the entire period from May 1, 2010 to October 31, 2010.
Actual Expenses
The table provides information about actual account values and actual expenses for each class. You may use the information, together with the amount you invested, to estimate the expenses that you paid over the period. First, identify the share class you own. Then simply divide your account value by $1,000 (for example, an $8,600 account value divided by $1,000 = 8.6), then multiply the result by the number under the heading “Expenses Paid During Period” to estimate the expenses you paid on your account during this period.
If you hold Investor Class shares of any American Century Investments fund, or Institutional Class shares of the American Century Diversified Bond Fund, in an American Century Investments account (i.e., not a financial intermediary or retirement plan account), American Century Investments may charge you a $12.50 semiannual account maintenance fee if the value of those shares is less than $10,000. We will redeem shares automatically in one of your accounts to pay the $12.50 fee. In determining your total eligible investment amount, we will include your investments in all personal accounts (including American Century Investments Brokerage accounts) regis tered under your Social Security number. Personal accounts include individual accounts, joint accounts, UGMA/UTMA accounts, personal trusts, Coverdell Education Savings Accounts and IRAs (including traditional, Roth, Rollover, SEP-, SARSEP- and SIMPLE-IRAs), and certain other retirement accounts. If you have only business, business retirement, employer-sponsored or American Century Investments Brokerage accounts, you are currently not subject to this fee. We will not charge the fee as long as you choose to manage your accounts exclusively online. If you are subject to the Account Maintenance Fee, your account value could be reduced by the fee amount.
Hypothetical Example for Comparison Purposes
The table also provides information about hypothetical account values and hypothetical expenses based on the actual expense ratio of each class of your fund and an assumed rate of return of 5% per year before expenses, which is not the actual return of a fund’s share class. The hypothetical account values and expenses may not be used to estimate the actual ending account balance or expenses you paid for the period. You may use this information to compare the ongoing costs of investing in your fund and other funds. To do so, compare this 5% hypothetical example with the 5% hypothetical examples that appear in the shareholder reports of the other funds.
Please note that the expenses shown in the table are meant to highlight your ongoing costs only and do not reflect any transactional costs, such as sales charges (loads) or redemption/exchange fees. Therefore, the table is useful in comparing ongoing costs only, and will not help you determine the relative total costs of owning different funds. In addition, if these transactional costs were included, your costs would have been higher.
| | | | | |
| | Beginning Account Value 5/1/10 | Ending Account Value 10/31/10 | Expenses Paid During Period* 5/1/10 – 10/31/10 | Annualized Expense Ratio* |
| Actual | | | | |
| Investor Class | $1,000 | $1,038.20 | $5.14 | 1.00% |
| Institutional Class | $1,000 | $1,038.80 | $4.11 | 0.80% |
| A Class | $1,000 | $1,036.70 | $6.42 | 1.25% |
| B Class | $1,000 | $1,032.80 | $10.25 | 2.00% |
| C Class | $1,000 | $1,032.80 | $10.25 | 2.00% |
| R Class | $1,000 | $1,035.80 | $7.70 | 1.50% |
| Hypothetical | | | | |
| Investor Class | $1,000 | $1,020.16 | $5.09 | 1.00% |
| Institutional Class | $1,000 | $1,021.17 | $4.08 | 0.80% |
| A Class | $1,000 | $1,018.90 | $6.36 | 1.25% |
| B Class | $1,000 | $1,015.12 | $10.16 | 2.00% |
| C Class | $1,000 | $1,015.12 | $10.16 | 2.00% |
| R Class | $1,000 | $1,017.64 | $7.63 | 1.50% |
*Expenses are equal to the class’s annualized expense ratio listed in the table above, multiplied by the average account value over the period, multiplied by 184, the number of days in the most recent fiscal half-year, divided by 365, to reflect the one-half year period.
| | | |
| | Shares | Value |
| Common Stocks — 99.3% |
| AEROSPACE & DEFENSE — 1.7% |
| General Dynamics Corp. | 1,530,000 | $ 104,223,600 |
| BEVERAGES — 0.8% |
| Coca-Cola Co. (The) | 499,000 | 30,598,680 |
| PepsiCo, Inc. | 292,000 | 19,067,600 |
| | | 49,666,280 |
| BIOTECHNOLOGY — 3.5% |
Alexion Pharmaceuticals, Inc.(1) | 575,000 | 39,272,500 |
Celgene Corp.(1) | 902,000 | 55,987,140 |
Gilead Sciences, Inc.(1) | 2,839,000 | 112,623,130 |
| | | 207,882,770 |
| CAPITAL MARKETS — 1.3% |
| BlackRock, Inc. | 180,000 | 30,778,200 |
| Charles Schwab Corp. (The) | 3,183,000 | 49,018,200 |
| | | 79,796,400 |
| CHEMICALS — 2.8% |
| Monsanto Co. | 1,095,000 | 65,064,900 |
| Nalco Holding Co. | 2,040,000 | 57,487,200 |
| Potash Corp. of Saskatchewan, Inc. | 168,000 | 24,375,120 |
| RPM International, Inc. | 1,107,000 | 22,925,970 |
| | | 169,853,190 |
| COMMUNICATIONS EQUIPMENT — 3.8% |
Cisco Systems, Inc.(1) | 6,656,000 | 151,956,480 |
| QUALCOMM, Inc. | 1,702,000 | 76,811,260 |
| | | 228,767,740 |
| COMPUTERS & PERIPHERALS — 8.4% |
Apple, Inc.(1) | 1,201,000 | 361,344,870 |
EMC Corp.(1) | 4,043,000 | 84,943,430 |
| Hewlett-Packard Co. | 1,375,000 | 57,832,500 |
| | | 504,120,800 |
| CONSUMER FINANCE — 0.9% |
| American Express Co. | 1,341,000 | 55,597,860 |
| DIVERSIFIED FINANCIAL SERVICES — 2.2% |
| CME Group, Inc. | 270,000 | 78,205,500 |
| JPMorgan Chase & Co. | 1,415,000 | 53,246,450 |
| | | 131,451,950 |
| ELECTRICAL EQUIPMENT — 4.8% |
ABB Ltd.(1) | 1,756,000 | 36,367,339 |
ABB Ltd. ADR(1) | 2,390,000 | 49,449,100 |
| Cooper Industries plc | 1,583,000 | 82,980,860 |
| Emerson Electric Co. | 2,221,000 | 121,932,900 |
| | | 290,730,199 |
| ELECTRONIC EQUIPMENT, INSTRUMENTS & COMPONENTS — 0.7% |
Dolby Laboratories, Inc., Class A(1) | 682,299 | 42,084,202 |
| ENERGY EQUIPMENT & SERVICES — 3.3% |
Cameron International Corp.(1) | 1,079,000 | 47,206,250 |
| Core Laboratories NV | 215,000 | 16,720,550 |
| Schlumberger Ltd. | 1,961,000 | 137,054,290 |
| | | 200,981,090 |
| FOOD & STAPLES RETAILING — 2.6% |
| Costco Wholesale Corp. | 1,560,000 | 97,921,200 |
| Wal-Mart Stores, Inc. | 1,096,000 | 59,370,320 |
| | | 157,291,520 |
| FOOD PRODUCTS — 2.3% |
| Hershey Co. (The) | 692,000 | 34,247,080 |
| Mead Johnson Nutrition Co. | 630,763 | 37,101,480 |
| Nestle SA | 1,207,000 | 66,111,783 |
| | | 137,460,343 |
| HEALTH CARE EQUIPMENT & SUPPLIES — 2.5% |
Edwards Lifesciences Corp.(1) | 505,000 | 32,274,550 |
Intuitive Surgical, Inc.(1) | 275,000 | 72,311,250 |
Varian Medical Systems, Inc.(1) | 753,000 | 47,604,660 |
| | | 152,190,460 |
| HEALTH CARE PROVIDERS & SERVICES — 3.3% |
Express Scripts, Inc.(1) | 2,643,000 | 128,238,360 |
Medco Health Solutions, Inc.(1) | 206,000 | 10,821,180 |
| UnitedHealth Group, Inc. | 1,631,000 | 58,797,550 |
| | | 197,857,090 |
| HOTELS, RESTAURANTS & LEISURE — 4.1% |
Chipotle Mexican Grill, Inc.(1) | 195,000 | 40,990,950 |
| Marriott International, Inc., Class A | 2,037,000 | 75,470,850 |
| McDonald’s Corp. | 1,651,000 | 128,398,270 |
| | | 244,860,070 |
| HOUSEHOLD PRODUCTS — 0.2% |
| Colgate-Palmolive Co. | 194,000 | 14,961,280 |
| INSURANCE — 1.4% |
| MetLife, Inc. | 2,066,000 | 83,321,780 |
| INTERNET & CATALOG RETAIL — 3.3% |
Amazon.com, Inc.(1) | 883,000 | 145,818,620 |
Netflix, Inc.(1) | 303,000 | 52,570,500 |
| | | 198,389,120 |
| INTERNET SOFTWARE & SERVICES — 6.7% |
Baidu, Inc. ADR(1) | 599,000 | $ 65,895,990 |
Google, Inc., Class A(1) | 469,000 | 287,492,310 |
| Tencent Holdings Ltd. | 2,090,000 | 47,860,022 |
| | | 401,248,322 |
| IT SERVICES — 2.4% |
| MasterCard, Inc., Class A | 414,000 | 99,384,840 |
| Visa, Inc., Class A | 601,000 | 46,980,170 |
| | | 146,365,010 |
| LEISURE EQUIPMENT & PRODUCTS — 1.4% |
| Hasbro, Inc. | 1,776,000 | 82,140,000 |
| MACHINERY — 6.1% |
| Cummins, Inc. | 936,000 | 82,461,600 |
| Donaldson Co., Inc. | 652,000 | 31,765,440 |
| Joy Global, Inc. | 1,434,000 | 101,742,300 |
| Parker-Hannifin Corp. | 1,182,000 | 90,482,100 |
WABCO Holdings, Inc.(1) | 894,000 | 41,499,480 |
| Wabtec Corp. | 441,000 | 20,656,440 |
| | | 368,607,360 |
| METALS & MINING — 2.2% |
| BHP Billiton Ltd. ADR | 635,000 | 52,444,650 |
| Freeport-McMoRan Copper & Gold, Inc. | 819,000 | 77,542,920 |
| | | 129,987,570 |
| MULTILINE RETAIL — 1.4% |
Kohl’s Corp.(1) | 1,675,000 | 85,760,000 |
| OIL, GAS & CONSUMABLE FUELS — 5.8% |
| EOG Resources, Inc. | 601,000 | 57,527,720 |
| Exxon Mobil Corp. | 2,060,000 | 136,928,200 |
Newfield Exploration Co.(1) | 838,000 | 49,961,560 |
| Occidental Petroleum Corp. | 1,058,000 | 83,190,540 |
Southwestern Energy Co.(1) | 639,000 | 21,630,150 |
| | | 349,238,170 |
| PHARMACEUTICALS — 1.4% |
| Teva Pharmaceutical Industries Ltd. ADR | 1,678,000 | 87,088,200 |
| SEMICONDUCTORS & SEMICONDUCTOR EQUIPMENT — 3.4% |
| Altera Corp. | 1,989,000 | 62,076,690 |
| Linear Technology Corp. | 2,586,000 | 83,346,780 |
| Microchip Technology, Inc. | 1,791,000 | 57,634,380 |
| | | 203,057,850 |
| SOFTWARE — 7.2% |
Adobe Systems, Inc.(1) | 2,154,000 | 60,635,100 |
Electronic Arts, Inc.(1) | 3,649,000 | 57,836,650 |
| Microsoft Corp. | 5,663,000 | 150,862,320 |
| Oracle Corp. | 3,857,000 | 113,395,800 |
VMware, Inc., Class A(1) | 658,000 | 50,310,680 |
| | | 433,040,550 |
| SPECIALTY RETAIL — 3.7% |
J. Crew Group, Inc.(1) | 183,000 | 5,854,170 |
| Lowe’s Cos., Inc. | 1,698,000 | 36,218,340 |
O’Reilly Automotive, Inc.(1) | 515,000 | 30,127,500 |
| Tiffany & Co. | 1,455,000 | 77,115,000 |
| TJX Cos., Inc. (The) | 1,633,000 | 74,938,370 |
| | | 224,253,380 |
| TEXTILES, APPAREL & LUXURY GOODS — 1.4% |
| NIKE, Inc., Class B | 1,010,000 | 82,254,400 |
| TOBACCO — 2.3% |
| Philip Morris International, Inc. | 2,377,000 | 139,054,500 |
TOTAL COMMON STOCKS(Cost $4,170,878,806) | 5,983,583,056 |
| Temporary Cash Investments — 0.8% |
| JPMorgan U.S. Treasury Plus Money Market Fund Agency Shares | 27,591 | 27,591 |
Repurchase Agreement, Credit Suisse First Boston, Inc., (collateralized by various U.S. Treasury obligations, 1.00%, 3/31/12, valued at $47,735,882), in a joint trading account at 0.16%, dated 10/29/10, due 11/1/10 (Delivery value $46,800,624) | 46,800,000 |
TOTAL TEMPORARY CASH INVESTMENTS (Cost $46,827,591) | 46,827,591 |
TOTAL INVESTMENT SECURITIES — 100.1% (Cost $4,217,706,397) | 6,030,410,647 |
| OTHER ASSETS AND LIABILITIES — (0.1)% | (6,200,019) |
| TOTAL NET ASSETS — 100.0% | $6,024,210,628 |
Ultra
| Forward Foreign Currency Exchange Contracts |
| Contracts to Sell | Counterparty | Settlement Date | Value | Unrealized Gain (Loss) |
| 77,016,435 | CHF for USD | UBS AG | 11/30/10 | $78,279,607 | $234,084 |
(Value on Settlement Date $78,513,691)
Notes to Schedule of Investments
ADR = American Depositary Receipt
CHF = Swiss Franc
USD = United States Dollar
See Notes to Financial Statements.
Statement of Assets and Liabilities
| OCTOBER 31, 2010 |
| Assets |
| Investment securities, at value (cost of $4,217,706,397) | $6,030,410,647 |
| Cash | 70,750 |
| Foreign currency holdings, at value (cost of $859,545) | 910,076 |
| Receivable for capital shares sold | 768,212 |
| Unrealized gain on forward foreign currency exchange contracts | 234,084 |
| Dividends and interest receivable | 3,321,498 |
| | 6,035,715,267 |
| | |
| Liabilities | |
| Payable for investments purchased | 3,574,287 |
| Payable for capital shares redeemed | 2,928,834 |
| Accrued management fees | 4,985,136 |
| Distribution and service fees payable | 16,382 |
| | 11,504,639 |
| | |
| Net Assets | $6,024,210,628 |
| | |
| Net Assets Consist of: | |
| Capital (par value and paid-in surplus) | $5,042,802,536 |
| Undistributed net investment income | 12,243,093 |
| Accumulated net realized loss | (843,899,629) |
| Net unrealized appreciation | 1,813,064,628 |
| | $6,024,210,628 |
| | | | | | | |
| | Net assets | Shares outstanding | Net asset value per share |
| Investor Class, $0.01 Par Value | $5,906,157,695 | | 278,386,732 | | $21.22 | |
| Institutional Class, $0.01 Par Value | $45,791,194 | | 2,110,813 | | $21.69 | |
| A Class, $0.01 Par Value | $68,109,488 | | 3,302,767 | | $20.62* | |
| B Class, $0.01 Par Value | $103,259 | | 4,971 | | $20.77 | |
| C Class, $0.01 Par Value | $789,411 | | 41,121 | | $19.20 | |
| R Class, $0.01 Par Value | $3,259,581 | | 158,722 | | $20.54 | |
*Maximum offering price $21.88 (net asset value divided by 0.9425)
See Notes to Financial Statements.
| YEAR ENDED OCTOBER 31, 2010 |
| Investment Income (Loss) |
| Income: | |
| Dividends (net of foreign taxes withheld of $309,789) | $ 72,392,803 |
| Interest | 76,433 |
| | 72,469,236 |
| | |
| Expenses: | |
| Management fees | 57,661,652 |
| Distribution and service fees: | |
| A Class | 176,070 |
| B Class | 952 |
| C Class | 8,620 |
| R Class | 16,000 |
| Directors’ fees and expenses | 179,365 |
| Other expenses | 398,957 |
| | 58,441,616 |
| | |
| Net investment income (loss) | 14,027,620 |
| | |
| Realized and Unrealized Gain (Loss) | |
| Net realized gain (loss) on: | |
| Investment transactions | 189,642,017 |
| Foreign currency transactions | (1,500,129) |
| | 188,141,888 |
| | |
| Change in net unrealized appreciation (depreciation) on: | |
| Investments | 836,634,187 |
| Translation of assets and liabilities in foreign currencies | 64,994 |
| | 836,699,181 |
| | |
| Net realized and unrealized gain (loss) | 1,024,841,069 |
| | |
| Net Increase (Decrease) in Net Assets Resulting from Operations | $1,038,868,689 |
See Notes to Financial Statements.
Statement of Changes in Net Assets
| YEARS ENDED OCTOBER 31, 2010 AND OCTOBER 31, 2009 |
| Increase (Decrease) in Net Assets | 2010 | 2009 |
| Operations |
| Net investment income (loss) | $ 14,027,620 | $ 34,692,826 |
| Net realized gain (loss) | 188,141,888 | (664,963,753) |
| Change in net unrealized appreciation (depreciation) | 836,699,181 | 1,318,667,736 |
| Net increase (decrease) in net assets resulting from operations | 1,038,868,689 | 688,396,809 |
| | | |
| Distributions to Shareholders | | |
| From net investment income: | | |
| Investor Class | (26,725,188) | (25,630,818) |
| Institutional Class | (528,963) | (491,887) |
| A Class | (172,872) | (226,924) |
| R Class | — | (1,496) |
| Decrease in net assets from distributions | (27,427,023) | (26,351,125) |
| | | |
| Capital Share Transactions | | |
| Net increase (decrease) in net assets from capital share transactions | (577,726,077) | (513,655,552) |
| | | |
| Net increase (decrease) in net assets | 433,715,589 | 148,390,132 |
| | | |
| Net Assets | | |
| Beginning of period | 5,590,495,039 | 5,442,104,907 |
| End of period | $6,024,210,628 | $5,590,495,039 |
| | | |
| Undistributed net investment income | $12,243,093 | $27,142,625 |
See Notes to Financial Statements.
Notes to Financial Statements
OCTOBER 31, 2010
1. Organization
American Century Mutual Funds, Inc. (the corporation) is registered under the Investment Company Act of 1940 (the 1940 Act) as an open-end management investment company and is organized as a Maryland corporation. Ultra Fund (the fund) is one fund in a series issued by the corporation. The fund is diversified as defined under the 1940 Act. The fund’s investment objective is to seek long-term capital growth. The fund pursues its objective by investing primarily in equity securities of large companies, but may invest in companies of any size. The fund is authorized to issue the Investor Class, the Institutional Class, the A Class, the B Class, the C Class and the R Class. The A Class may incur an initial sales charge. The A Class, B Class and C Class may be subject to a contingent deferred sales charge. The share cla sses differ principally in their respective sales charges and distribution and shareholder servicing expenses and arrangements. The Institutional Class is made available to institutional shareholders or through financial intermediaries whose clients do not require the same level of shareholder and administrative services as shareholders of other classes. As a result, the Institutional Class is charged a lower unified management fee.
2. Significant Accounting Policies
The following is a summary of significant accounting policies consistently followed by the fund in preparation of its financial statements. The financial statements are prepared in conformity with accounting principles generally accepted in the United States of America, which may require management to make certain estimates and assumptions at the date of the financial statements. Actual results could differ from these estimates.
Investment Valuations — The fund determines the fair value of its investments and computes its net asset value per share as of the close of regular trading (usually 4 p.m. Eastern time) on the New York Stock Exchange (NYSE) on each day the NYSE is open.
Equity securities that are listed or traded on a domestic securities exchange are valued at the last reported sales price or at the official closing price as provided by the exchange. Equity securities traded on foreign securities exchanges are typically valued at the closing price on the exchange where primarily traded or as of the close of the NYSE, if that is earlier. If no last sales price is reported, or if local convention or regulation so provides, the mean of the latest bid and asked prices is used. Depending on local convention or regulation, securities traded over-the-counter are valued at the mean of the latest bid and asked prices, the last sales price, or the official closing price. In its determination of fair value, the fund may review several factors including: market information specific to a security; news developments in U.S. and foreign markets; the performance of particular U.S. and foreign securities, indices, comparable securities, American Depositary Receipts, Exchange Traded Funds, and other relevant market indicators.
Debt securities maturing within 60 days at the time of purchase may be valued at cost, plus or minus any amortized discount or premium or at the evaluated mean as provided by an independent pricing service. Evaluated mean prices are commonly derived through utilization of market models, which may consider, among other factors, trade data, quotations from dealers and active market makers, relevant yield curve and spread data, related sector levels, creditworthiness, and other relevant market information on the same or comparable securities.
Investments in open-end management investment companies are valued at the reported net asset value per share. Repurchase agreements are valued at cost. Forward foreign currency exchange contracts are valued at the mean of the latest bid and asked prices of the forward currency rates as provided by an independent pricing service.
The value of investments initially expressed in foreign currencies is translated into U.S. dollars at prevailing exchange rates.
If the fund determines that the market price for a portfolio security is not readily available or the valuation methods mentioned above do not reflect a security’s fair value, such security is valued as determined in good faith by the Board of Directors or its designee, in accordance with procedures adopted by the Board of Directors. Circumstances that may cause the fund to use these procedures to value a security include, but are not limited to: a security has been declared in default; trading in a security has been halted during the trading day; there is a foreign market holiday and no trading occurred; or an event occurred between the close of a foreign exchange and the NYSE that may affect the value of a security.
Security Transactions — Security transactions are accounted for as of the trade date. Net realized gains and losses are determined on the identified cost basis, which is also used for federal income tax purposes.
Investment Income — Dividend income less foreign taxes withheld, if any, is recorded as of the ex-dividend date. Interest income is recorded on the accrual basis and includes accretion of discounts and amortization of premiums.
Foreign Currency Translations — All assets and liabilities initially expressed in foreign currencies are translated into U.S. dollars at prevailing exchange rates at period end. The fund may enter into spot foreign currency exchange contracts to facilitate transactions denominated in a foreign currency. Purchases and sales of investment securities, dividend and interest income, spot foreign currency exchange contracts, and expenses are translated at the rates of exchange prevailing on the respective dates of such transactions. Net realized and unrealized foreign currency exchange gains or losses related to investment securities are a component of net realized gain (loss) on investment transactions and net unrealized appreciation (depreciation) on investments, respectively.
Repurchase Agreements — The fund may enter into repurchase agreements with institutions that American Century Investment Management, Inc. (ACIM) (the investment advisor) has determined are creditworthy pursuant to criteria adopted by the Board of Directors. The fund requires that the collateral, represented by securities, received in a repurchase transaction be transferred to the custodian in a manner sufficient to enable the fund to obtain those securities in the event of a default under the repurchase agreement. ACIM monitors, on a daily basis, the securities transferred to ensure the value, including accrued interest, of the securities under each repurchase agreement is equal to or greater than amounts owed to the fund under each repurchase agreement.
Joint Trading Account — Pursuant to an Exemptive Order issued by the Securities and Exchange Commission, the fund, along with certain other funds in the American Century Investments family of funds, may transfer uninvested cash balances into a joint trading account. These balances are invested in one or more repurchase agreements that are collateralized by U.S. Treasury or Agency obligations.
Income Tax Status — It is the fund’s policy to distribute substantially all net investment income and net realized gains to shareholders and to otherwise qualify as a regulated investment company under provisions of the Internal Revenue Code. The fund is no longer subject to examination by tax authorities for years prior to 2007. At this time, management believes there are no uncertain tax positions which, based on their technical merit, would not be sustained upon examination and for which it is reasonably possible that the total amounts of unrecognized tax benefits will significantly change in the next twelve months. Accordingly, no provision has been made for federal or state income taxes.
Multiple Class — All shares of the fund represent an equal pro rata interest in the net assets of the class to which such shares belong, and have identical voting, dividend, liquidation and other rights and the same terms and conditions, except for class specific expenses and exclusive rights to vote on matters affecting only individual classes. Income, non-class specific expenses, and realized and unrealized capital gains and losses of the fund are allocated to each class of shares based on their relative net assets.
Distributions to Shareholders — Distributions to shareholders are recorded on the ex-dividend date. Distributions from net investment income and net realized gains, if any, are generally declared and paid annually.
Indemnifications — Under the corporation’s organizational documents, its officers and directors are indemnified against certain liabilities arising out of the performance of their duties to the fund. In addition, in the normal course of business, the fund enters into contracts that provide general indemnifications. The maximum exposure under these arrangements is unknown as this would involve future claims that may be made against a fund. The risk of material loss from such claims is considered by management to be remote.
3. Fees and Transactions with Related Parties
Management Fees — The corporation has entered into a management agreement with ACIM, under which ACIM provides the fund with investment advisory and management services in exchange for a single, unified management fee (the fee) per class. The agreement provides that all expenses of managing and operating the fund, except distribution and service fees, brokerage expenses, taxes, interest, fees and expenses of the independent directors (including legal counsel fees), and extraordinary expenses, will be paid by ACIM. The fee is computed and accrued daily based on each class’s daily net assets and paid monthly in arrears. The rate of the fee is determined by applying a fee rate calculation f ormula. This formula takes into account the fund’s assets as well as certain assets, if any, of other clients of the investment advisor outside the American Century Investments family of funds (such as subadvised funds and separate accounts) that have very similar investment teams and investment strategies (strategy assets). The annual management fee schedule ranges from 0.800% to 1.000% for the Investor Class, A Class, B Class, C Class and R Class. The Institutional Class is 0.200% less at each point within the range. The effective annual management fee for each class for the year ended October 31, 2010 was 0.99% for the Investor Class, A Class, B Class, C Class and R Class and 0.79% for the Institutional Class.
Distribution and Service Fees — The Board of Directors has adopted a separate Master Distribution and Individual Shareholder Services Plan for each of the A Class, B Class, C Class and R Class (collectively the plans), pursuant to Rule 12b-1 of the 1940 Act. The plans provide that the A Class will pay American Century Investment Services, Inc. (ACIS) an annual distribution and service fee of 0.25%. The plans provide that the B Class and C Class will each pay ACIS an annual distribution and service fee of 1.00%, of which 0.25% is paid for individual shareholder services and 0.75% is paid for distribution services. The plans provide that the R Class will pay ACIS an annual distribution and servi ce fee of 0.50%. The fees are computed and accrued daily based on each class’s daily net assets and paid monthly in arrears. The fees are used to pay financial intermediaries for distribution and individual shareholder services. Fees incurred under the plans during the year ended October 31, 2010, are detailed in the Statement of Operations.
Related Parties — Certain officers and directors of the corporation are also officers and/or directors of American Century Companies, Inc. (ACC), the parent of the corporation’s investment advisor, ACIM, the distributor of the corporation, ACIS, and the corporation’s transfer agent, American Century Services, LLC.
The fund is eligible to invest in a money market fund for temporary purposes, which is managed by J.P. Morgan Investment Management, Inc. (JPMIM). The fund has a securities lending agreement with JPMorgan Chase Bank (JPMCB) and a mutual funds services agreement with J.P. Morgan Investor Services Co. (JPMIS). JPMCB is a custodian of the fund. JPMIM, JPMIS and JPMCB are wholly owned subsidiaries of JPMorgan Chase & Co. (JPM). JPM is an equity investor in ACC.
4. Investment Transactions
Purchases and sales of investment securities, excluding short-term investments, for the year ended October 31, 2010, were $1,346,975,997 and $1,927,777,687, respectively.
5. Capital Share Transactions
Transactions in shares of the fund were as follows:
| | | |
| | Year ended October 31, 2010 | Year ended October 31, 2009 |
| | Shares | Amount | Shares | Amount |
| Investor Class/Shares Authorized | 3,500,000,000 | | 3,500,000,000 | |
| Sold | 8,040,692 | $ 157,299,128 | 10,713,688 | $ 162,466,559 |
| Issued in reinvestment of distributions | 1,335,312 | 25,958,465 | 1,792,590 | 24,916,998 |
| Redeemed | (35,922,123) | (700,572,950) | (44,276,980) | (673,015,336) |
| | (26,546,119) | (517,315,357) | (31,770,702) | (485,631,779) |
| Institutional Class/Shares Authorized | 200,000,000 | | 200,000,000 | |
| Sold | 729,074 | 14,762,326 | 616,942 | 9,517,688 |
| Issued in reinvestment of distributions | 25,921 | 514,529 | 33,797 | 479,581 |
| Redeemed | (2,701,567) | (53,218,916) | (1,359,616) | (20,634,403) |
| | (1,946,572) | (37,942,061) | (708,877) | (10,637,134) |
| A Class/Shares Authorized | 100,000,000 | | 100,000,000 | |
| Sold | 534,148 | 10,123,675 | 761,220 | 11,227,185 |
| Issued in reinvestment of distributions | 8,809 | 166,840 | 16,176 | 219,026 |
| Redeemed | (1,712,426) | (32,190,650) | (1,933,030) | (28,089,270) |
| | (1,169,469) | (21,900,135) | (1,155,634) | (16,643,059) |
| B Class/Shares Authorized | 50,000,000 | | 50,000,000 | |
| Sold | 6 | 112 | 2,779 | 44,188 |
| Redeemed | — | — | (429) | (7,449) |
| | 6 | 112 | 2,350 | 36,739 |
| C Class/Shares Authorized | 50,000,000 | | 50,000,000 | |
| Sold | 3,687 | 64,700 | 11,640 | 167,046 |
| Redeemed | (17,068) | (301,317) | (19,376) | (267,383) |
| | (13,381) | (236,617) | (7,736) | (100,337) |
| R Class/Shares Authorized | 50,000,000 | | 50,000,000 | |
| Sold | 41,073 | 780,064 | 73,819 | 1,103,287 |
| Issued in reinvestment of distributions | — | — | 95 | 1,278 |
| Redeemed | (59,405) | (1,112,083) | (112,765) | (1,784,547) |
| | (18,332) | (332,019) | (38,851) | (679,982) |
| Net increase (decrease) | (29,693,867) | $(577,726,077) | (33,679,450) | $(513,655,552) |
6. Fair Value Measurements
The fund’s securities valuation process is based on several considerations and may use multiple inputs to determine the fair value of the positions held by the fund. In conformity with accounting principles generally accepted in the United States of America, the inputs used to determine a valuation are classified into three broad levels as follows:
| • | Level 1 valuation inputs consist of unadjusted quoted prices in an active market for identical securities; |
| • | Level 2 valuation inputs consist of direct or indirect observable market data (including quoted prices for similar securities, evaluations of subsequent market events, interest rates, prepayment speeds, credit risk, etc.); or |
| • | Level 3 valuation inputs consist of unobservable data (including a fund’s own assumptions). |
The level classification is based on the lowest level input that is significant to the fair valuation measurement. The valuation inputs are not necessarily an indication of the risks associated with investing in these securities or other financial instruments.
The following is a summary of the level classifications as of period end. The Schedule of Investments provides additional information on the fund’s portfolio holdings.
| | | | |
| | Level 1 | Level 2 | Level 3 |
| Investment Securities | | | |
| Domestic Common Stocks | $5,537,270,302 | — | — |
| Foreign Common Stocks | 295,973,610 | $150,339,144 | — |
| Temporary Cash Investments | 27,591 | 46,800,000 | — |
| Total Value of Investment Securities | $5,833,271,503 | $197,139,144 | — |
| | | | |
| Other Financial Instruments | | | |
Total Unrealized Gain (Loss) on Forward Foreign Currency Exchange Contracts | — | $234,084 | — |
7. Derivative Instruments
Foreign Currency Risk — The fund is subject to foreign currency exchange rate risk in the normal course of pursuing its investment objectives. The value of foreign investments held by a fund may be significantly affected by changes in foreign currency exchange rates. The dollar value of a foreign security generally decreases when the value of the dollar rises against the foreign currency in which the security is denominated and tends to increase when the value of the dollar declines against such foreign currency. A fund may enter into forward foreign currency exchange contracts to reduce a fund’s exposure to foreign currency exchange rate fluctuations. The net U.S. dollar value of foreign currency underlying all contractual commitments held by a fund and the resulting u nrealized appreciation or depreciation are determined daily using prevailing exchange rates. Realized gain or loss is recorded upon the termination of the contract. Net realized and unrealized gains or losses occurring during the holding period of forward foreign currency exchange contracts are a component of net realized gain (loss) on foreign currency transactions and change in net unrealized appreciation (depreciation) on translation of assets and liabilities in foreign currencies, respectively. A fund bears the risk of an unfavorable change in the foreign currency exchange rate underlying the forward contract. Additionally, losses, up to the fair value, may arise if the counterparties do not perform under the contract terms. The risk of loss from non-performance by the counterparty may be reduced by the use of master netting agreements. The foreign currency risk derivative instruments held at period end as disclosed on the Schedule of Investments are indicative of the fund’s typical volume during t he period.
The value of foreign currency risk derivative instruments as of October 31, 2010, is disclosed on the Statement of Assets and Liabilities as an asset of $234,084 in unrealized gain on forward foreign currency exchange contracts. For the year ended October 31, 2010, the effect of foreign currency risk derivative instruments on the Statement of Operations was $(1,266,860) in net realized gain (loss) on foreign currency transactions and $(34,706) in change in net unrealized appreciation (depreciation) on translation of assets and liabilities in foreign currencies.
8. Risk Factors
There are certain risks involved in investing in foreign securities. These risks include those resulting from future adverse political, social, and economic developments, fluctuations in currency exchange rates, the possible imposition of exchange controls, and other foreign laws or restrictions.
9. Federal Tax Information
On December 14, 2010, the fund declared and paid the following per-share distributions from net investment income to shareholders of record on December 13, 2010:
| | | | | | |
| Investor | Institutional | A | B | C | R |
| $0.0448 | $0.0899 | — | — | — | — |
The tax character of distributions paid during the years ended October 31, 2010 and October 31, 2009 were as follows:
| | | |
| | 2010 | 2009 |
| Distributions Paid From | | |
| Ordinary income | $27,427,023 | $26,351,125 |
| Long-term capital gains | — | — |
The book-basis character of distributions made during the year from net investment income or net realized gains may differ from their ultimate characterization for federal income tax purposes. These differences reflect the differing character of certain income items and net realized gains and losses for financial statement and tax purposes, and may result in reclassification among certain capital accounts on the financial statements.
As of October 31, 2010, the federal tax cost of investments and the components of distributable earnings on a tax-basis were as follows:
| | |
| Federal tax cost of investments | $4,279,377,469 |
| Gross tax appreciation of investments | $1,814,416,980 |
| Gross tax depreciation of investments | (63,383,802) |
| Net tax appreciation (depreciation) of investments | $1,751,033,178 |
Net tax appreciation (depreciation) of derivatives and translation of assets and liabilities in foreign currencies | $ 126,294 |
| Net tax appreciation (depreciation) | $1,751,159,472 |
| Undistributed ordinary income | $12,477,177 |
| Accumulated capital losses | $(782,228,557) |
The difference between book-basis and tax-basis cost and unrealized appreciation (depreciation) is attributable primarily to the tax deferral of losses on wash sales and the realization for tax purposes of unrealized gains (losses) on certain forward foreign currency exchange contracts.
The accumulated capital losses represent net capital loss carryovers that may be used to offset future realized capital gains for federal income tax purposes. Future capital loss carryover utilization in any given year may be subject to Internal Revenue Code limitations. The capital loss carryovers of $(35,695,674) and $(746,532,883) expire in 2016 and 2017, respectively.
10. Corporate Event
As part of a long-standing estate and business succession plan established by James E. Stowers, Jr., the founder of American Century Investments, ACC Chairman Richard W. Brown succeeded Mr. Stowers as trustee of a trust that holds a greater-than-25% voting interest in ACC, the parent corporation of the fund’s advisor. Under the 1940 Act, this is presumed to represent control of ACC even though it is less than a majority interest. The change of trustee was considered a change of control of ACC and therefore also a change of control of the fund’s advisor even though there has been no change to its management and none is anticipated. The change of control resulted in the assignment of the fund’s investment advisory agreement. As required by the 1940 Act, the assignment automatically terminated such agreem ent, making the approval of a new agreement necessary.
On February 18, 2010, the Board of Directors approved an interim investment advisory agreement under which the fund was managed until a new agreement was approved. The new agreement for the fund was approved by the Board of Directors on March 29, 2010, and by shareholders at a Special Meeting of Shareholders on June 16, 2010. It went into effect on July 16, 2010. The new agreement, which is substantially identical to the terminated agreement (with the exception of different effective and termination dates), did not result in changes in the management of American Century Investments, the fund, its investment objectives, fees or services provided.
11. Other Tax Information (Unaudited)
The following information is provided pursuant to provisions of the Internal Revenue Code.
The fund hereby designates up to the maximum amount allowable as qualified dividend income for the fiscal year ended October 31, 2010.
For corporate taxpayers, the fund hereby designates $27,427,023, or up to the maximum amount allowable, of ordinary income distributions paid during the fiscal year ended October 31, 2010 as qualified for the corporate dividends received deduction.
Ultra
| Investor Class |
| For a Share Outstanding Throughout the Years Ended October 31 |
| | 2010 | 2009 | 2008 | 2007 | 2006 |
| Per-Share Data |
| Net Asset Value, Beginning of Period | $17.82 | $15.67 | $33.48 | $28.55 | $29.02 |
| Income From Investment Operations | | | | | |
Net Investment Income (Loss)(1) | 0.05 | 0.11 | 0.08 | (0.01) | (0.06) |
| Net Realized and Unrealized Gain (Loss) | 3.44 | 2.12 | (9.95) | 6.95 | (0.37) |
| Total From Investment Operations | 3.49 | 2.23 | (9.87) | 6.94 | (0.43) |
| Distributions | | | | | |
| From Net Investment Income | (0.09) | (0.08) | — | — | (0.04) |
| From Net Realized Gains | — | — | (7.94) | (2.01) | — |
| Total Distributions | (0.09) | (0.08) | (7.94) | (2.01) | (0.04) |
| Net Asset Value, End of Period | $21.22 | $17.82 | $15.67 | $33.48 | $28.55 |
| | | | | | |
Total Return(2) | 19.63% | 14.35% | (38.02)% | 25.89% | (1.51)% |
| | | | | | |
| Ratios/Supplemental Data |
Ratio of Operating Expenses to Average Net Assets | 1.00% | 1.00% | 0.99% | 0.99% | 0.99% |
Ratio of Net Investment Income (Loss) to Average Net Assets | 0.25% | 0.69% | 0.36% | (0.04)% | (0.15)% |
| Portfolio Turnover Rate | 24% | 53% | 152% | 93% | 62% |
| Net Assets, End of Period (in millions) | $5,906 | $5,435 | $5,276 | $10,066 | $13,482 |
| (1) | Computed using average shares outstanding throughout the period. |
| (2) | Total returns are calculated based on the net asset value of the last business day. Total returns for periods less than one year are not annualized. |
See Notes to Financial Statements.
Ultra
| Institutional Class |
| For a Share Outstanding Throughout the Years Ended October 31 |
| | 2010 | 2009 | 2008 | 2007 | 2006 |
| Per-Share Data |
| Net Asset Value, Beginning of Period | $18.22 | $16.02 | $33.98 | $28.90 | $29.38 |
| Income From Investment Operations | | | | | |
Net Investment Income (Loss)(1) | 0.09 | 0.14 | 0.15 | 0.05 | —(2) |
| Net Realized and Unrealized Gain (Loss) | 3.51 | 2.17 | (10.17) | 7.04 | (0.38) |
| Total From Investment Operations | 3.60 | 2.31 | (10.02) | 7.09 | (0.38) |
| Distributions | | | | | |
| From Net Investment Income | (0.13) | (0.11) | — | — | (0.10) |
| From Net Realized Gains | — | — | (7.94) | (2.01) | — |
| Total Distributions | (0.13) | (0.11) | (7.94) | (2.01) | (0.10) |
| Net Asset Value, End of Period | $21.69 | $18.22 | $16.02 | $33.98 | $28.90 |
| | | | | | |
Total Return(3) | 19.81% | 14.58% | (37.89)% | 26.14% | (1.33)% |
| | | | | | |
| Ratios/Supplemental Data |
Ratio of Operating Expenses to Average Net Assets | 0.80% | 0.80% | 0.79% | 0.79% | 0.79% |
Ratio of Net Investment Income (Loss) to Average Net Assets | 0.45% | 0.89% | 0.56% | 0.16% | 0.05% |
| Portfolio Turnover Rate | 24% | 53% | 152% | 93% | 62% |
| Net Assets, End of Period (in thousands) | $45,791 | $73,933 | $76,339 | $325,035 | $1,073,767 |
| (1) | Computed using average shares outstanding throughout the period. |
| (2) | Per-share amount was less than $0.005. |
| (3) | Total returns are calculated based on the net asset value of the last business day. Total returns for periods less than one year are not annualized. |
See Notes to Financial Statements.
Ultra
A Class(1) |
| For a Share Outstanding Throughout the Years Ended October 31 |
| | 2010 | 2009 | 2008 | 2007 | 2006 |
| Per-Share Data |
| Net Asset Value, Beginning of Period | $17.33 | $15.23 | $32.83 | $28.11 | $28.61 |
| Income From Investment Operations | | | | | |
Net Investment Income (Loss)(2) | —(3) | 0.07 | 0.03 | (0.08) | (0.13) |
| Net Realized and Unrealized Gain (Loss) | 3.33 | 2.07 | (9.69) | 6.81 | (0.37) |
| Total From Investment Operations | 3.33 | 2.14 | (9.66) | 6.73 | (0.50) |
| Distributions | | | | | |
| From Net Investment Income | (0.04) | (0.04) | — | — | — |
| From Net Realized Gains | — | — | (7.94) | (2.01) | — |
| Total Distributions | (0.04) | (0.04) | (7.94) | (2.01) | — |
| Net Asset Value, End of Period | $20.62 | $17.33 | $15.23 | $32.83 | $28.11 |
| | | | | | |
Total Return(4) | 19.24% | 14.14% | (38.19)% | 25.56% | (1.75)% |
| | | | | | |
| Ratios/Supplemental Data |
Ratio of Operating Expenses to Average Net Assets | 1.25% | 1.25% | 1.24% | 1.24% | 1.24% |
Ratio of Net Investment Income (Loss) to Average Net Assets | 0.00%(5) | 0.44% | 0.11% | (0.29)% | (0.40)% |
| Portfolio Turnover Rate | 24% | 53% | 152% | 93% | 62% |
| Net Assets, End of Period (in thousands) | $68,109 | $77,484 | $85,723 | $235,217 | $405,173 |
| (1) | Prior to September 4, 2007, the A Class was referred to as the Advisor Class. |
| (2) | Computed using average shares outstanding throughout the period. |
| (3) | Per-share amount was less than $0.005. |
| (4) | Total returns are calculated based on the net asset value of the last business day and do not reflect applicable sales charges. Total returns for periods less than one year are not annualized. |
| (5) | Ratio was less than 0.005%. |
See Notes to Financial Statements.
Ultra
| B Class |
| For a Share Outstanding Throughout the Years Ended October 31 (except as noted) |
| | 2010 | 2009 | 2008 | 2007(1) |
| Per-Share Data |
| Net Asset Value, Beginning of Period | $17.54 | $15.49 | $33.45 | $31.63 |
| Income From Investment Operations | | | | |
Net Investment Income (Loss)(2) | (0.15) | (0.06) | (0.16) | (0.04) |
| Net Realized and Unrealized Gain (Loss) | 3.38 | 2.11 | (9.86) | 1.86 |
| Total From Investment Operations | 3.23 | 2.05 | (10.02) | 1.82 |
| Distributions | | | | |
| From Net Realized Gains | — | — | (7.94) | — |
| Net Asset Value, End of Period | $20.77 | $17.54 | $15.49 | $33.45 |
| | | | | |
Total Return(3) | 18.42% | 13.23% | (38.64)% | 5.75% |
| | | | | |
| Ratios/Supplemental Data |
| Ratio of Operating Expenses to Average Net Assets | 2.00% | 2.00% | 1.99% | 1.99%(4) |
| Ratio of Net Investment Income (Loss) to Average Net Assets | (0.75)% | (0.31)% | (0.64)% | (1.53)%(4) |
| Portfolio Turnover Rate | 24% | 53% | 152% | 93%(5) |
| Net Assets, End of Period (in thousands) | $103 | $87 | $41 | $26 |
| (1) | September 28, 2007 (commencement of sale) through October 31, 2007. |
| (2) | Computed using average shares outstanding throughout the period. |
| (3) | Total returns are calculated based on the net asset value of the last business day and do not reflect applicable sales charges. Total returns for periods less than one year are not annualized. |
| (5) | Portfolio turnover is calculated at the fund level. Percentage indicated was calculated for the year ended October 31, 2007. |
See Notes to Financial Statements.
Ultra
| C Class |
| For a Share Outstanding Throughout the Years Ended October 31 |
| | 2010 | 2009 | 2008 | 2007 | 2006 |
| Per-Share Data |
| Net Asset Value, Beginning of Period | $16.22 | $14.32 | $31.54 | $27.26 | $27.96 |
| Income From Investment Operations | | | | | |
Net Investment Income (Loss)(1) | (0.13) | (0.04) | (0.13) | (0.29) | (0.34) |
| Net Realized and Unrealized Gain (Loss) | 3.11 | 1.94 | (9.15) | 6.58 | (0.36) |
| Total From Investment Operations | 2.98 | 1.90 | (9.28) | 6.29 | (0.70) |
| Distributions | | | | | |
| From Net Realized Gains | — | — | (7.94) | (2.01) | — |
| Net Asset Value, End of Period | $19.20 | $16.22 | $14.32 | $31.54 | $27.26 |
| | | | | | |
Total Return(2) | 18.45% | 13.20% | (38.63)% | 24.64% | (2.50)% |
| | | | | | |
| Ratios/Supplemental Data |
Ratio of Operating Expenses to Average Net Assets | 2.00% | 2.00% | 1.99% | 1.99% | 1.99% |
Ratio of Net Investment Income (Loss) to Average Net Assets | (0.75)% | (0.31)% | (0.64)% | (1.04)% | (1.15)% |
| Portfolio Turnover Rate | 24% | 53% | 152% | 93% | 62% |
| Net Assets, End of Period (in thousands) | $789 | $884 | $891 | $2,129 | $3,342 |
| (1) | Computed using average shares outstanding throughout the period. |
| (2) | Total returns are calculated based on the net asset value of the last business day and do not reflect applicable sales charges. Total returns for periods less than one year are not annualized. |
See Notes to Financial Statements.
Ultra
| R Class |
| For a Share Outstanding Throughout the Years Ended October 31 |
| | 2010 | 2009 | 2008 | 2007 | 2006 |
| Per-Share Data |
| Net Asset Value, Beginning of Period | $17.26 | $15.17 | $32.80 | $28.15 | $28.72 |
| Income From Investment Operations | | | | | |
Net Investment Income (Loss)(1) | (0.05) | 0.03 | (0.03) | (0.15) | (0.21) |
| Net Realized and Unrealized Gain (Loss) | 3.33 | 2.07 | (9.66) | 6.81 | (0.36) |
| Total From Investment Operations | 3.28 | 2.10 | (9.69) | 6.66 | (0.57) |
| Distributions | | | | | |
| From Net Investment Income | — | (0.01) | — | — | — |
| From Net Realized Gains | — | — | (7.94) | (2.01) | — |
| Total Distributions | — | (0.01) | (7.94) | (2.01) | — |
| Net Asset Value, End of Period | $20.54 | $17.26 | $15.17 | $32.80 | $28.15 |
| | | | | | |
Total Return(2) | 19.00% | 13.84% | (38.35)% | 25.26% | (1.98)% |
| | | | | | |
| Ratios/Supplemental Data |
Ratio of Operating Expenses to Average Net Assets | 1.50% | 1.50% | 1.49% | 1.49% | 1.49% |
Ratio of Net Investment Income (Loss) to Average Net Assets | (0.25)% | 0.19% | (0.14)% | (0.54)% | (0.65)% |
| Portfolio Turnover Rate | 24% | 53% | 152% | 93% | 62% |
| Net Assets, End of Period (in thousands) | $3,260 | $3,056 | $3,276 | $5,971 | $8,922 |
| (1) | Computed using average shares outstanding throughout the period. |
| (2) | Total returns are calculated based on the net asset value of the last business day. Total returns for periods less than one year are not annualized. |
See Notes to Financial Statements.
Report of Independent Registered Public Accounting Firm
The Board of Directors and Shareholders,
American Century Mutual Funds, Inc.:
We have audited the accompanying statement of assets and liabilities, including the schedule of investments, of Ultra Fund, one of the funds constituting American Century Mutual Funds, Inc. (the “Corporation”), as of October 31, 2010, and the related statement of operations for the year then ended, the statements of changes in net assets for each of the two years in the period then ended, and the financial highlights for each of the five years in the period then ended. These financial statements and financial highlights are the responsibility of the Corporation’s management. Our responsibility is to express an opinion on these financial statements and financial highlights based on our audits.
We conducted our audits in accordance with the standards of the Public Company Accounting Oversight Board (United States). Those standards require that we plan and perform the audit to obtain reasonable assurance about whether the financial statements and financial highlights are free of material misstatement. The Corporation is not required to have, nor were we engaged to perform, an audit of its internal control over financial reporting. Our audits included consideration of internal control over financial reporting as a basis for designing audit procedures that are appropriate in the circumstances, but not for the purpose of expressing an opinion on the effectiveness of the Corporation’s internal control over financial reporting . Accordingly, we express no such opinion. An audit also includes examining, on a test basis, evidence supporting the amounts and disclosures in the financial statements, assessing the accounting principles used and significant estimates made by management, as well as evaluating the overall financial statement presentation. Our procedures included confirmation of securities owned as of October 31, 2010, by correspondence with the custodian and brokers; where replies were not received from brokers, we performed other auditing procedures. We believe that our audits provide a reasonable basis for our opinion.
In our opinion, the financial statements and financial highlights referred to above present fairly, in all material respects, the financial position of Ultra Fund of American Century Mutual Funds, Inc., as of October 31, 2010, the results of its operations for the year then ended, the changes in its net assets for each of the two years in the period then ended, and the financial highlights for each of the five years in the period then ended, in conformity with accounting principles generally accepted in the United States of America.
Deloitte & Touche LLP
Kansas City, Missouri
December 20, 2010
A special meeting of shareholders was held on June 16, 2010, to vote on the following proposals. Each proposal received the required number of votes and was adopted. A summary of voting results is listed below each proposal.
Proposal 1:
To elect one Director to the Board of Directors of American Century Mutual Funds, Inc. (the proposal was voted on by all shareholders of funds issued by American Century Mutual Funds, Inc.):
| | | | | |
| | John R. Whitten | For: | 13,907,426,552 | |
| | | Withhold: | 629,801,798 | |
| | | Abstain: | 0 | |
| | | Broker Non-Vote: | 0 | |
The other directors whose term of office continued after the meeting include Jonathan S. Thomas, Thomas A. Brown, Andrea C. Hall, James A. Olson, Donald H. Pratt, and M. Jeannine Strandjord.
Proposal 2:
To approve a management agreement between the fund and American Century Investment Management, Inc.:
| | | | | |
| | Investor, Advisor, A, B, C and R Classes | For: | 3,346,538,552 | |
| | | Against: | 85,994,173 | |
| | | Abstain: | 98,360,876 | |
| | | Broker Non-Vote: | 257,414,927 | |
| | | | | |
| | Institutional Class | For: | 34,607,908 | |
| | | Against: | 454,270 | |
| | | Abstain: | 813,689 | |
| | | Broker Non-Vote: | 193,005 | |
Proposal 3
To approve an amendment to the Articles of Incorporation to limit certain director liability to the extent permitted by Maryland law (the proposal was voted on by all shareholders of funds issued by American Century Mutual Funds, Inc.):
| | | | | |
| | | For: | 12,112,932,038 | |
| | | Against: | 769,504,652 | |
| | | Abstain: | 420,034,445 | |
| | | Broker Non-Vote: | 1,234,757,216 | |
The Board of Directors
The individuals listed below serve as directors of the fund. Each director will continue to serve in this capacity until death, retirement, resignation or removal from office. The mandatory retirement age for directors who are not “interested persons,” as that term is defined in the Investment Company Act (independent directors), is 72. However, the mandatory retirement age for an individual director may be extended with the approval of the remaining independent directors.
Mr. Thomas is the only director who is an “interested person” because he currently serves as President and Chief Executive Officer of American Century Companies, Inc. (ACC), the parent company of American Century Investment Management, Inc. (ACIM or the advisor).
The other directors (more than three-fourths of the total number) are independent; that is, they have never been employees, directors or officers of, and have no financial interest in, ACC or any of its wholly owned, direct or indirect, subsidiaries, including ACIM, American Century Investment Services, Inc. (ACIS) and American Century Services, LLC (ACS). The directors serve in this capacity for seven (in the case of Mr. Thomas, 15) registered investment companies in the American Century Investments family of funds.
The following presents additional information about the directors. The mailing address for each director is 4500 Main Street, Kansas City, Missouri 64111.
Independent Directors
Thomas A. Brown
Year of Birth: 1940
Position(s) with the Fund: Director
Length of Time Served: Since 1980
Principal Occupation(s) During the Past Five Years: Managing Member, Associated Investments, LLC (real estate investment company); Brown Cascade Properties, LLC (real estate investment company) (2001 to 2009)
Number of Funds in Fund Complex Overseen by Director: 61
Other Directorships Held by Director During the Past Five Years: None
Education/Other Professional Experience: BS in Mechanical Engineering, University of Kansas; formerly, Chief Executive Officer, Associated Bearings Company; formerly, Area Vice President, Applied Industrial Technologies (bearings and power transmission company)
Andrea C. Hall
Year of Birth: 1945
Position(s) with the Fund: Director
Length of Time Served: Since 1997
Principal Occupation(s) During the Past Five Years: Retired as advisor to the President, Midwest Research Institute (not-for-profit research organization) (June 2006)
Number of Funds in Fund Complex Overseen by Director: 61
Other Directorships Held by Director During the Past Five Years: None
Education/Other Professional Experience: BS in Biology, Florida State University; PhD in Biology, Georgetown University; formerly, Senior Vice President and Director of Research Operations, Midwest Research Institute
James A. Olson
Year of Birth: 1942
Position(s) with the Fund: Director
Length of Time Served: Since 2007
Principal Occupation(s) During the Past Five Years: Member, Plaza Belmont LLC (private equity fund manager); Chief Financial Officer, Plaza Belmont LLC (September 1999 to September 2006)
Number of Funds in Fund Complex Overseen by Director: 61
Other Directorships Held by Director During the Past Five Years: Saia, Inc. and Entertainment Properties Trust
Education/Other Professional Experience: BS in Business Administration and MBA, St. Louis University; CPA; 21 years of experience as a partner in the accounting firm of Ernst & Young LLP
Donald H. Pratt
Year of Birth: 1937
Position(s) with the Fund: Director, Chairman of the Board
Length of Time Served: Since 1995 (Chairman since 2005)
Principal Occupation(s) During the Past Five Years: Chairman and Chief Executive Officer, Western Investments, Inc. (real estate company)
Number of Funds in Fund Complex Overseen by Director: 61
Other Directorships Held by Director During the Past Five Years: None
Education/Other Professional Experience: BS in Industrial Engineering, Wichita State University; MBA, Harvard Business School; serves on the Board of Governors of the Independent Directors Council and Investment Company Institute; formerly, Chairman of the Board, Butler Manufacturing Company (metal buildings producer)
M. Jeannine Strandjord
Year of Birth: 1945
Position(s) with the Fund: Director
Length of Time Served: Since 1994
Principal Occupation(s) During the Past Five Years: Retired, formerly, Senior Vice President, Process Excellence, Sprint Corporation (telecommunications company) (January 2005 to September 2005)
Number of Funds in Fund Complex Overseen by Director: 61
Other Directorships Held by Director During the Past Five Years: DST Systems Inc., Euronet Worldwide Inc., Charming Shoppes, Inc.
Education/Other Professional Experience: BS in Business Administration and Accounting, University of Kansas; CPA; formerly, Senior Vice President of Financial Services and Treasurer and Chief Financial Officer, Global Markets Group; Sprint Corporation; formerly, with the accounting firm of Ernst and Whinney
John R. Whitten
Year of Birth: 1946
Position(s) with the Fund: Director
Length of Time Served: Since 2008
Principal Occupation(s) During the Past Five Years: Project Consultant, Celanese Corp. (industrial chemical company)
Number of Funds in Fund Complex Overseen by Director: 61
Other Directorships Held by Director During the Past Five Years: Rudolph Technologies, Inc.
Professional Education/Experience: BS in Business Administration, Cleveland State University; CPA; formerly, Chief Financial Officer and Treasurer, Applied Industrial Technologies, Inc.; thirteen years of experience with accounting firm Deloitte & Touche LLP
Interested Director
Jonathan S. Thomas
Year of Birth: 1963
Position(s) with the Fund: Director and President
Length of Time Served: Since 2007
Principal Occupation(s) During the Past Five Years: President and Chief Executive Officer, ACC (March 2007 to present); Chief Administrative Officer, ACC (February 2006 to February 2007); Executive Vice President, ACC (November 2005 to February 2007). Also serves as: Chief Executive Officer and Manager, ACS; Executive Vice President, ACIM; Director, ACC, ACIM and other ACC subsidiaries
Number of Funds in Fund Complex Overseen by Director: 101
Other Directorships Held by Director During the Past Five Years: None
Education/Other Professional Experience: BA in Economics, University of Massachusetts; MBA, Boston College; formerly held senior leadership roles with Fidelity Investments, Boston Financial Services, Bank of America and Morgan Stanley; serves on the Board of Governors of the Investment Company Institute
Officers
The following table presents certain information about the executive officers of the fund. Each officer serves as an officer for each of the 15 investment companies in the American Century family of funds, unless otherwise noted. No officer is compensated for his or her service as an officer of the fund. The listed officers are interested persons of the fund and are appointed or re-appointed on an annual basis. The mailing address for each of the officers listed below is 4500 Main Street, Kansas City, Missouri 64111.
| | | | |
| | Name (Year of Birth) | Offices with the Fund | Principal Occupation(s) During the Past Five Years |
| | Jonathan S. Thomas (1963) | Director and President since 2007 | President and Chief Executive Officer, ACC (March 2007 to present); Chief Administrative Officer, ACC (February 2006 to February 2007); Executive Vice President, ACC (November 2005 to February 2007). Also serves as: Chief Executive Officer and Manager, ACS; Executive Vice President, ACIM; Director, ACC, ACIM and other ACC subsidiaries |
| | Barry Fink (1955) | Executive Vice President since 2007 | Chief Operating Officer and Executive Vice President, ACC (September 2007 to present); President, ACS (October 2007 to present); Managing Director, Morgan Stanley (2000 to 2007); Global General Counsel, Morgan Stanley (2000 to 2006). Also serves as: Manager, ACS and Director, ACC and certain ACC subsidiaries |
| | Maryanne L. Roepke (1956) | Chief Compliance Officer since 2006 and Senior Vice President since 2000 | Chief Compliance Officer, American Century funds, ACIM and ACS (August 2006 to present); Assistant Treasurer, ACC (January 1995 to August 2006); and Treasurer and Chief Financial Officer, various American Century funds (July 2000 to August 2006). Also serves as: Senior Vice President, ACS |
| | Charles A. Etherington (1957) | General Counsel since 2007 and Senior Vice President since 2006 | Attorney, ACC (February 1994 to present); Vice President, ACC (November 2005 to present), General Counsel, ACC (March 2007 to present); Also serves as General Counsel, ACIM, ACS, ACIS and other ACC subsidiaries; and Senior Vice President, ACIM and ACS |
| | Robert J. Leach (1966) | Vice President, Treasurer and Chief Financial Officer since 2006 | Vice President, ACS (February 2000 to present); and Controller, various American Century funds (1997 to September 2006) |
| | David H. Reinmiller (1963) | Vice President since 2000 | Attorney, ACC (January 1994 to present); Associate General Counsel, ACC (January 2001 to present); Chief Compliance Officer, American Century funds and ACIM (January 2001 to February 2005). Also serves as Vice President, ACIM and ACS |
| | Ward D. Stauffer (1960) | Secretary since 2005 | Attorney, ACC (June 2003 to present) |
| | | | |
| | The Statement of Additional Information has additional information about the fund’s directors and is available without charge, upon request, by calling 1-800-345-2021. |
Retirement Account Information
As required by law, distributions you receive from certain IRAs, or 403(b), 457 and qualified plans are subject to federal income tax withholding, unless you elect not to have withholding apply. Tax will be withheld on the total amount withdrawn even though you may be receiving amounts that are not subject to withholding, such as nondeductible contributions. In such case, excess amounts of withholding could occur. You may adjust your withholding election so that a greater or lesser amount will be withheld.
If you don’t want us to withhold on this amount, you must notify us to not withhold the federal income tax. You may notify us in writing or in certain situations by telephone or through other electronic means. You have the right to revoke your withholding election at any time and any election you make may remain in effect until revoked by filing a new election.
Remember, even if you elect not to have income tax withheld, you are liable for paying income tax on the taxable portion of your withdrawal. If you elect not to have income tax withheld or you don’t have enough income tax withheld, you may be responsible for payment of estimated tax. You may incur penalties under the estimated tax rules if your withholding and estimated tax payments are not sufficient. You can reduce or defer the income tax on a distribution by directly or indirectly rolling such distribution over to another IRA or eligible plan. You should consult your tax advisor for additional information.
State tax will be withheld if, at the time of your distribution, your address is within one of the mandatory withholding states and you have federal income tax withheld. State taxes will be withheld from your distribution in accordance with the respective state rules.
Proxy Voting Guidelines
American Century Investment Management, Inc., the fund’s investment advisor, is responsible for exercising the voting rights associated with the securities purchased and/or held by the fund. A description of the policies and procedures the advisor uses in fulfilling this responsibility is available without charge, upon request, by calling 1-800-345-2021. It is also available on American Century Investments’ website at americancentury.com and on the Securities and Exchange Commission’s website at sec.gov. Information regarding how the investment advisor voted proxies relating to portfolio securities during the most recent 12-month period ended June 30 is available on the “About Us” page at americancentury.com. It is also available at sec.gov.
Quarterly Portfolio Disclosure
The fund files its complete schedule of portfolio holdings with the Securities and Exchange Commission (SEC) for the first and third quarters of each fiscal year on Form N-Q. The fund’s Forms N-Q are available on the SEC’s website at sec.gov, and may be reviewed and copied at the SEC’s Public Reference Room in Washington, DC. Information on the operation of the Public Reference Room may be obtained by calling 1-800-SEC-0330. The fund also makes its complete schedule of portfolio holdings for the most recent quarter of its fiscal year available on its website at americancentury.com and, upon request, by calling 1-800-345-2021.
The following indices are used to illustrate investment market, sector, or style performance or to serve as fund performance comparisons. They are not investment products available for purchase.
The Russell 1000® Index is a market-capitalization weighted, large-cap index created by Frank Russell Company to measure the performance of the 1,000 largest publicly traded U.S. companies, based on total market capitalization.
The Russell 1000® Growth Index measures the performance of those Russell 1000 Index companies (the 1,000 largest publicly traded U.S. companies, based on total market capitalization) with higher price-to-book ratios and higher forecasted growth values.
The Russell 1000® Value Index measures the performance of those Russell 1000 Index companies (the 1,000 largest publicly traded U.S. companies, based on total market capitalization) with lower price-to-book ratios and lower forecasted growth values.
The Russell 2000® Index is a market-capitalization weighted index created by Frank Russell Company to measure the performance of the 2,000 smallest of the 3,000 largest publicly traded U.S. companies, based on total market capitalization.
The Russell 2000® Growth Index measures the performance of those Russell 2000 Index companies (the 2,000 smallest of the 3,000 largest publicly traded U.S. companies, based on total market capitalization) with higher price-to-book ratios and higher forecasted growth values.
The Russell 2000® Value Index measures the performance of those Russell 2000 Index companies (the 2,000 smallest of the 3,000 largest publicly traded U.S. companies, based on total market capitalization) with lower price-to-book ratios and lower forecasted growth values.
The Russell Midcap® Index measures the performance of the 800 smallest of the 1,000 largest publicly traded U.S. companies, based on total market capitalization.
The Russell Midcap® Growth Index measures the performance of those Russell Midcap Index companies (the 800 smallest of the 1,000 largest publicly traded U.S. companies, based on total market capitalization) with higher price-to-book ratios and higher forecasted growth values.
The Russell Midcap® Value Index measures the performance of those Russell Midcap Index companies (the 800 smallest of the 1,000 largest publicly traded U.S. companies, based on total market capitalization) with lower price-to-book ratios and lower forecasted growth values.
The S&P 500 Index is a market value-weighted index of the stocks of 500 publicly traded U.S. companies chosen for market size, liquidity, and industry group representation that are considered to be leading firms in dominant industries. Each stock’s weight in the index is proportionate to its market value. Created by Standard & Poor’s, it is considered to be a broad measure of U.S. stock market performance.
Notes
Notes
|
| | |
| Contact Us | |
| | |
| americancentury.com | |
| | |
| Automated Information Line | 1-800-345-8765 |
| | |
| Investor Services Representative | 1-800-345-2021 or 816-531-5575 |
| | |
| Investors Using Advisors | 1-800-378-9878 |
| | |
| Business, Not-For-Profit, Employer-Sponsored Retirement Plans | 1-800-345-3533 |
| | |
| Banks and Trust Companies, Broker-Dealers, Financial Professionals, Insurance Companies | 1-800-345-6488 |
| | |
| Telecommunications Device for the Deaf | 1-800-634-4113 |
| | |
| American Century Mutual Funds, Inc. |
| |
Investment Advisor: American Century Investment Management, Inc. Kansas City, Missouri |
| |
| This report and the statements it contains are submitted for the general information of our shareholders. The report is not authorized for distribution to prospective investors unless preceded or accompanied by an effective prospectus. |
American Century Investment Services, Inc., Distributor
©2010 American Century Proprietary Holdings, Inc. All rights reserved.
| Annual Report |
| October 31, 2010 |
American Century Investments®
| | President’s Letter | 2 |
| | Independent Chairman’s Letter | 3 |
| | Market Perspective | 4 |
| | U.S. Stock Index Returns | 4 |
| | | |
| Vista |
| |
| | Performance | 5 |
| | Portfolio Commentary | 7 |
| | Top Ten Holdings | 9 |
| | Top Five Industries | 9 |
| | Types of Investments in Portfolio | 9 |
| | | |
| | Shareholder Fee Example | 10 |
| | | |
| Financial Statements |
| |
| | Schedule of Investments | 12 |
| | Statement of Assets and Liabilities | 15 |
| | Statement of Operations | 16 |
| | Statement of Changes in Net Assets | 17 |
| | Notes to Financial Statements | 18 |
| | Financial Highlights | 25 |
| | Report of Independent Registered Public Accounting Firm | 30 |
| | | |
| Other Information |
| |
| | Proxy Voting Results | 31 |
| | Management | 32 |
| | Additional Information | 36 |
| | Index Definitions | 37 |
Any opinions expressed in this report reflect those of the author as of the date of the report, and do not necessarily represent the opinions of American Century Investments or any other person in the American Century Investments organization. Any such opinions are subject to change at any time based upon market or other conditions and American Century Investments disclaims any responsibility to update such opinions. These opinions may not be relied upon as investment advice and, because investment decisions made by American Century Investments funds are based on numerous factors, may not be relied upon as an indication of trading intent on behalf of any American Century Investments fund. Security examples are used for representational purposes only and are not intended as recommendations to purchase or sell securities. Performance information for comparative indices and securities is provided to American Century Investments by third party vendors. To the best of American Century Investments’ knowledge, such information is accurate at the time of printing.
Jonathan Thomas
Dear Investor:
To learn more about the capital markets, your investment, and the portfolio management strategies American Century Investments provides, we encourage you to review this shareholder report for the financial reporting period ended October 31, 2010.
On the following pages, you will find investment performance and portfolio information, presented with the expert perspective and commentary of our portfolio management team. This report remains one of our most important vehicles for conveying the information you need about your investment performance, and about the market factors and strategies that affect fund returns. For additional information on the markets, we encourage you to visit the “Insights & News” tab at our Web site, americancentury.com, for updates and further expert commentary.
The top of our Web site’s home page also provides a link to “Our Story,” which, first and foremost, outlines our commitment—since 1958—to helping clients reach their financial goals. We believe strongly that we will only be successful when our clients are successful. That’s who we are.
Another important, unique facet of our story and who we are is “Profits with a Purpose,” which describes our bond with the Stowers Institute for Medical Research (SIMR). SIMR is a world-class biomedical organization—founded by our company founder James E. Stowers, Jr. and his wife Virginia—that is dedicated to researching the causes, treatment, and prevention of gene-based diseases, including cancer. Through American Century Investments’ private ownership structure, more than 40% of our profits support SIMR.
Mr. Stowers’ example of achieving financial success and using that platform to help humanity motivates our entire American Century Investments team. His story inspires us to help each of our clients achieve success. Thank you for sharing your financial journey with us.
Sincerely,
Jonathan Thomas
President and Chief Executive Officer
American Century Investments
Independent Chairman’s Letter
Don Pratt
Dear Fellow Shareholders,
As regulators and the markets continue to sort out the events of the credit crisis, a consistent theme has been that financial services firms should re-examine their risk management practices. Risk management has been a regular part of American Century Investments’ activities for many years. However, recently American Century and your mutual fund board have been spending additional time focusing on our risk oversight processes.
The board’s efforts are now organized around three categories of risk: investment risk, operational risk, and enterprise risk. This approach has facilitated a realignment of many risk oversight tasks that the board has historically conducted. Investment risk tasks include a review of portfolio risk, monitoring the use of derivatives, and performance assessment. Operational risk focuses on compliance, valuation, shareholder services, and trading activities. Enterprise risk addresses the financial condition of the advisor, human resource development, and reputational risks. Risk oversight tasks are addressed in every quarterly board meeting, and a review of the advisor’s entire risk management program is undertaken annually. We acknowledge and support the approach that American Century Investments takes to its risk management responsibilities. While the board has refocused its efforts in this important oversight area, we recognize that risk oversight is a journey and we expect to continue to improve our processes.
Our September quarterly board meeting was held in the New York offices of American Century Investments. This gave the directors an opportunity to meet with the portfolio management teams for each of the global and international funds overseen by the board. Each team uses sophisticated investment tools and daily risk analysis in managing client assets. We also were impressed with the “bench strength” that has been developed under the leadership of the Global and Non-U.S. Equity CIO Mark Kopinski. These face-to-face meetings provide an opportunity for the directors – working on behalf of shareholders – to validate the advisor’s efforts and the investment management approach being followed.
I thank you for your continued confidence in American Century during this turbulent time in the economy and investment markets. If you have thoughts or questions you would like to share with the board send them to me at dhpratt@fundboardchair.com.
Best regards,
Don Pratt
By David Hollond, Chief Investment Officer, U.S. Growth Equity—Mid & Small Cap
Stocks Rallied Amid Growing Volatility
U.S. stocks advanced for the 12 months ended October 31, 2010, as the broad equity indices posted double-digit gains. Virtually all of the market’s gains occurred in the first six months of the period, when stocks continued to climb after reaching a multi-year low in March 2009. The key factors behind the rally included favorable economic data, which provided evidence of a burgeoning recovery, and better-than-expected corporate earnings, which resulted largely from cost-cutting measures by many businesses to widen profit margins.
Market conditions changed abruptly in late April as evidence of a pullback in economic activity led to concerns about a relapse into recession. These concerns were amplified by a sovereign debt crisis in Greece that began to spread across Europe. In response, the equity market declined sharply throughout May and June as market volatility increased substantially.
The equity market remained volatile in the third quarter, gaining ground in July and falling back in August amid a tug-of-war between positive corporate earnings reports and an increasingly sluggish economic environment. However, stocks staged a resurgence during the final two months of the period as investors expressed confidence in the Federal Reserve’s plan to revive the economic recovery via another round of quantitative easing.
Small- and Mid-Cap Growth Stocks Outperformed
While stocks advanced across the board, the 12-month period was especially favorable for mid- and small-cap growth stocks. The small- and mid-cap segments of the market led the overall advance, returning more than 25% (see the table below). Smaller companies suffered the largest losses during the downturn in late 2008 and early 2009 and thus far have enjoyed the highest returns during the market’s recovery.
In addition, growth-oriented issues outpaced value shares across all market capitalizations. The best-performing sectors in the market were those traditionally associated with growth, such as information technology and consumer discretionary. In addition, the financials sector—a major component in value indices—underperformed during the period.
| U.S. Stock Index Returns |
| For the 12 months ended October 31, 2010 |
| Russell 1000 Index (Large-Cap) | 17.67% | | Russell 2000 Index (Small-Cap) | 26.58% |
| Russell 1000 Growth Index | 19.65% | | Russell 2000 Growth Index | 28.67% |
| Russell 1000 Value Index | 15.71% | | Russell 2000 Value Index | 24.43% |
| Russell Midcap Index | 27.71% | | | |
| Russell Midcap Growth Index | 28.03% | | | |
| Russell Midcap Value Index | 27.49% | | | |
Vista
| Total Returns as of October 31, 2010 |
| | | | Average Annual Returns | |
| | Ticker Symbol | 1 year | 5 years | 10 years | Since Inception | Inception Date |
| Investor Class | TWCVX | 25.72% | 2.43% | -0.05% | 8.99% | 11/25/83 |
Russell Midcap Growth Index | — | 28.03% | 4.28% | 0.20% | N/A(1) | — |
| Institutional Class | TWVIX | 25.86% | 2.63% | 0.16% | 4.79% | 11/14/96 |
A Class(2) No sales charge* With sales charge* | TWVAX | 25.40% 18.17% | 2.17% 0.97% | -0.31% -0.90% | 3.78% 3.35% | 10/2/96 |
C Class No sales charge* With sales charge* | AVNCX | — — | — — | — — | 10.34%(3) 9.34%(3) | 3/1/10 |
| R Class | AVTRX | 25.02% | 1.93% | — | 1.39% | 7/29/05 |
*Sales charges include initial sales charges and contingent deferred sales charges (CDSCs), as applicable. A Class shares have a 5.75% maximum initial sales charge for equity funds and may be subject to a maximum CDSC of 1.00%. C Class shares redeemed within 12 months of purchase are subject to a maximum CDSC of 1.00%. The SEC requires that mutual funds provide performance information net of maximum sales charges in all cases where charges could be applied.
| (1) | Index data not available prior to 12/31/85. |
| (2) | Prior to March 1, 2010, the A Class was referred to as the Advisor Class and did not have a front-end sales charge. Performance prior to that date has been adjusted to reflect this charge. |
| (3) | Total returns for periods less than one year are not annualized. |
Data presented reflect past performance. Past performance is no guarantee of future results. Current performance may be higher or lower than the performance shown. Investment return and principal value will fluctuate, and redemption value may be more or less than original cost. To obtain performance data current to the most recent month end, please call 1-800-345-2021 or visit americancentury.com. International investing involves special risks, such as political instability and currency fluctuations.
Unless otherwise indicated, performance reflects Investor Class shares; performance for other share classes will vary due to differences in fee structure. For information about other share classes available, please consult the prospectus. Data assumes reinvestment of dividends and capital gains, and none of the charts reflect the deduction of taxes that a shareholder would pay on fund distributions or the redemption of fund shares. Returns for the index are provided for comparison. The fund’s total returns include operating expenses (such as transaction costs and management fees) that reduce returns, while the total returns of the index do not.
Vista
| Growth of $10,000 Over 10 Years |
| $10,000 investment made October 31, 2000 |
| Total Annual Fund Operating Expenses |
| Investor Class | Institutional Class | A Class | C Class | R Class |
| 1.01% | 0.81% | 1.26% | 2.01% | 1.51% |
The total annual fund operating expenses shown is as stated in the fund’s prospectus current as of the date of this report. The prospectus may vary from the expense ratio shown elsewhere in this report because it is based on a different time period, includes acquired fund fees and expenses, and, if applicable, does not include fee waivers or expense reimbursements.
Data presented reflect past performance. Past performance is no guarantee of future results. Current performance may be higher or lower than the performance shown. Investment return and principal value will fluctuate, and redemption value may be more or less than original cost. To obtain performance data current to the most recent month end, please call 1-800-345-2021 or visit americancentury.com. International investing involves special risks, such as political instability and currency fluctuations.
Unless otherwise indicated, performance reflects Investor Class shares; performance for other share classes will vary due to differences in fee structure. For information about other share classes available, please consult the prospectus. Data assumes reinvestment of dividends and capital gains, and none of the charts reflect the deduction of taxes that a shareholder would pay on fund distributions or the redemption of fund shares. Returns for the index are provided for comparison. The fund’s total returns include operating expenses (such as transaction costs and management fees) that reduce returns, while the total returns of the index do not.
Vista
Portfolio Managers: Brad Eixmann and Bryan Unterhalter
Performance Summary
Vista returned 25.72%* for the 12 months ended October 31, 2010, lagging the 28.03% return of its benchmark, the Russell Midcap Growth Index.
As discussed in the Market Perspective on page 4, equity indices generally gained during the reporting period, as investors faced mixed economic and market data. Price momentum and acceleration, two factors that the Vista team looks for in portfolio holdings, were not rewarded consistently during the reporting period, although their margin of underperformance narrowed. Instead, lower quality stocks continued to drive market strength.
Within the portfolio, security selection in the financials, health care, and materials sectors accounted for the majority of underperformance relative to the benchmark. Effective stock choices in the information technology, energy, and consumer discretionary sectors partially offset those relative losses.
Financials Lagged Benchmark
The financials sector was Vista’s largest source of underperformance relative to its benchmark. Within the sector, a detrimental overweight stake in the capital markets industry included Jefferies Group, Inc. The company underperformed during the period due to a slowdown in its fixed income trading and investment banking operations. An overweight position in Lazard Ltd. also weighed on relative performance. Although the company’s earnings reflected improvement, unexpectedly higher compensation costs and a trust share sale overhang caused underperformance.
Health Care, Materials Gained, but Lagged Benchmark
The health care sector was a source of underperformance relative to the benchmark, although it contributed positively to absolute returns. Within the sector, Vista did not own some of the stronger performers within the pharmaceutical and life science tools and services industries that contributed to benchmark returns for the sector. Within the health care provider industry group, Vista held a detrimental overweight position in Medco Health Solutions, Inc. The company experienced a share price decline in the period as concerns over industry contract pricing and competition surfaced.
Similarly, Vista’s holdings in the materials sector contributed to absolute gains, but collectively lagged the performance of the materials sector in the benchmark. Within the sector, Vista held a position in fertilizer company Mosaic Co. While volume growth of its products accelerated significantly, pricing was not as strong as some analysts had predicted and increases in key input costs weighed on margins.
*All fund returns referenced in this commentary are for Investor Class shares.
Vista
Although an overweight allocation to the metals and mining industry helped absolute and relative returns, overweight stakes in mining company Freeport-McMoRan Copper & Gold, Inc., among others, detracted from relative performance. Benefiting from continued reports of global economic improvement and positive earnings releases, the company logged sound share price gains during the reporting period. However, its share price gain while it was held in the portfolio was more moderate.
Information Technology Helped
The information technology sector was a source of outperformance relative to the benchmark. In the communications equipment industry group, Vista held an overweight stake in networking company F5 Networks, which was the largest single contributor to relative gains. The company, whose products help optimize the performance of applications over IT networks, benefited from market share gains amid increasing complexity of data networks and strong mobile data growth. During the reporting period, F5 delivered earnings that were in excess of analysts’ expectations and increased guidance for future earnings. Elsewhere in the sector, effective stock selection in the IT services industry group also helped relative returns.
Energy, Consumer Discretionary Contributed
The energy sector contributed to absolute and relative portfolio gains. An overweight stake in onshore oil driller Whiting Petroleum, in particular, added significantly to gains, benefiting from a rotation to onshore drillers in the wake of the oil spill in the Gulf of Mexico.
Within the consumer discretionary sector, Vista held beneficial overweight positions in a number of companies in the hotels, restaurants, and leisure industry group, including Starwood Hotels & Resorts. The hotel chain experienced an upswing in revenues and earnings amid an industry-wide improvement in travel trends.
Outlook
Our investment process focuses on medium-sized and smaller companies with accelerating earnings growth rates and share-price momentum. We believe that active investing in such companies will generate outperformance over time compared with the Russell Midcap Growth Index.
This process, which has historically added value, has faced unprecedented headwinds during the market rally that began in March 2009. Based on historical trends, we believe we will move past this environment of extreme underperformance for stocks exhibiting price momentum and acceleration and into a period where fundamentals, and specifically fundamental improvement, is recognized and rewarded by the market. We are possibly witnessing the early stages of this positive shift in favor of our process as evidenced by improved recent performance.
Vista
| Top Ten Holdings |
| | % of net assets as of 10/31/10 |
| SBA Communications Corp., Class A | 2.5% |
| Dollar Tree, Inc. | 2.5% |
| F5 Networks, Inc. | 2.4% |
| O’Reilly Automotive, Inc. | 2.4% |
| priceline.com, Inc. | 2.1% |
| BE Aerospace, Inc. | 2.1% |
| Netflix, Inc. | 1.9% |
| Cummins, Inc. | 1.8% |
| salesforce.com, inc. | 1.6% |
| Royal Caribbean Cruises Ltd. | 1.5% |
| |
| Top Five Industries |
| | % of net assets as of 10/31/10 |
| Hotels, Restaurants & Leisure | 6.4% |
| Specialty Retail | 5.8% |
| Software | 5.6% |
| Machinery | 4.7% |
| Wireless Telecommunication Services | 4.6% |
| |
| Types of Investments in Portfolio |
| | % of net assets as of 10/31/10 |
| Domestic Common Stocks | 89.4% |
| Foreign Common Stocks* | 9.3% |
| Total Common Stocks | 98.7% |
| Temporary Cash Investments | 1.6% |
| Other Assets and Liabilities | (0.3)% |
*Includes depositary shares, dual listed securities and foreign ordinary shares.
Shareholder Fee Example (Unaudited)
Fund shareholders may incur two types of costs: (1) transaction costs, including sales charges (loads) on purchase payments and redemption/exchange fees; and (2) ongoing costs, including management fees; distribution and service (12b-1) fees; and other fund expenses. This example is intended to help you understand your ongoing costs (in dollars) of investing in your fund and to compare these costs with the ongoing cost
of investing in other mutual funds.
The example is based on an investment of $1,000 made at the beginning of the period and held for the entire period from May 1, 2010 to October 31, 2010.
Actual Expenses
The table provides information about actual account values and actual expenses for each class. You may use the information, together with the amount you invested, to estimate the expenses that you paid over the period. First, identify the share class you own. Then simply divide your account value by $1,000 (for example, an $8,600 account value divided by $1,000 = 8.6), then multiply the result by the number under the heading “Expenses Paid During Period” to estimate the expenses you paid on your account during this period.
If you hold Investor Class shares of any American Century Investments fund, or Institutional Class shares of the American Century Diversified Bond Fund, in an American Century Investments account (i.e., not a financial intermediary or retirement plan account), American Century Investments may charge you a $12.50 semiannual account maintenance fee if the value of those shares is less than $10,000. We will redeem shares automatically in one of your accounts to pay the $12.50 fee. In determining your total eligible investment amount, we will include your investments in all personal accounts (including American Century Investments Brokerage accounts) registered under your Social Security number. Personal accounts include individual accounts, joint accounts, UGMA/UTMA accounts, personal trusts, Coverdell Education Savings Accounts and IRAs (including traditional, Roth, Rollover, SEP-, SARSEP- and SIMPLE-IRAs), and certain other retirement accounts. If you have only business, business retirement, employer-sponsored or American Century Investments Brokerage accounts, you are currently not subject to this fee. We will not charge the fee as long as you choose to manage your accounts exclusively online. If you are subject to the Account Maintenance Fee, your account value could be reduced by the fee amount.
Hypothetical Example for Comparison Purposes
The table also provides information about hypothetical account values and hypothetical expenses based on the actual expense ratio of each class of your fund and an assumed rate of return of 5% per year before expenses, which is not the actual return of a fund’s share class. The hypothetical account values and expenses may not be used to estimate the actual ending account balance or expenses you paid for the period. You may use this information to compare the ongoing costs of investing in your fund and other funds. To do so, compare this 5% hypothetical example with the 5% hypothetical examples that appear in the shareholder reports of the other funds.
Please note that the expenses shown in the table are meant to highlight your ongoing costs only and do not reflect any transactional costs, such as sales charges (loads) or redemption/exchange fees. Therefore, the table is useful in comparing ongoing costs only, and will not help you determine the relative total costs of owning different funds. In addition, if these transactional costs were included, your costs would have been higher.
| | | | | |
| | Beginning Account Value 5/1/10 | Ending Account Value 10/31/10 | Expenses Paid During Period* 5/1/10 – 10/31/10 | Annualized Expense Ratio* |
| Actual |
| Investor Class | $1,000 | $1,037.40 | $5.19 | 1.01% |
| Institutional Class | $1,000 | $1,038.40 | $4.16 | 0.81% |
| A Class | $1,000 | $1,036.50 | $6.47 | 1.26% |
| C Class | $1,000 | $1,032.00 | $10.29 | 2.01% |
| R Class | $1,000 | $1,034.90 | $7.74 | 1.51% |
| Hypothetical |
| Investor Class | $1,000 | $1,020.11 | $5.14 | 1.01% |
| Institutional Class | $1,000 | $1,021.12 | $4.13 | 0.81% |
| A Class | $1,000 | $1,018.85 | $6.41 | 1.26% |
| C Class | $1,000 | $1,015.07 | $10.21 | 2.01% |
| R Class | $1,000 | $1,017.59 | $7.68 | 1.51% |
*Expenses are equal to the class’s annualized expense ratio listed in the table above, multiplied by the average account value over the period, multiplied by 184, the number of days in the most recent fiscal half-year, divided by 365, to reflect the one-half year period.
| | | |
| | Shares | Value |
| Common Stocks — 98.7% |
| AEROSPACE & DEFENSE — 3.7% |
BE Aerospace, Inc.(1) | 1,194,209 | $ 43,899,123 |
| Goodrich Corp. | 154,000 | 12,638,780 |
TransDigm Group, Inc.(1) | 337,000 | 22,332,990 |
| | | 78,870,893 |
| AIR FREIGHT & LOGISTICS — 2.3% |
| C.H. Robinson Worldwide, Inc. | 405,000 | 28,544,400 |
| Expeditors International of Washington, Inc. | 409,000 | 20,188,240 |
| | | 48,732,640 |
| AIRLINES — 1.3% |
Alaska Air Group, Inc.(1) | 218,000 | 11,510,400 |
United Continental Holdings, Inc.(1) | 530,000 | 15,391,200 |
| | | 26,901,600 |
| AUTO COMPONENTS — 0.5% |
BorgWarner, Inc.(1) | 193,000 | 10,829,230 |
| AUTOMOBILES — 0.2% |
Brilliance China Automotive Holdings Ltd.(1) | 6,226,000 | 5,461,932 |
| BIOTECHNOLOGY — 1.0% |
Alexion Pharmaceuticals, Inc.(1) | 310,000 | 21,173,000 |
| CHEMICALS — 4.3% |
| Albemarle Corp. | 601,000 | 30,128,130 |
| CF Industries Holdings, Inc. | 241,000 | 29,529,730 |
| Cytec Industries, Inc. | 195,000 | 9,656,400 |
| Ecolab, Inc. | 201,000 | 9,913,320 |
| International Flavors & Fragrances, Inc. | 227,000 | 11,386,320 |
| | | 90,613,900 |
| COMMERCIAL SERVICES & SUPPLIES — 1.6% |
Stericycle, Inc.(1) | 291,000 | 20,876,340 |
| Waste Connections, Inc. | 329,000 | 13,403,460 |
| | | 34,279,800 |
| COMMUNICATIONS EQUIPMENT — 2.4% |
F5 Networks, Inc.(1) | 439,000 | 51,670,300 |
| COMPUTERS & PERIPHERALS — 1.8% |
Lexmark International, Inc., Class A(1) | 361,000 | 13,728,830 |
NetApp, Inc.(1) | 447,000 | 23,802,750 |
| | | 37,531,580 |
| CONSUMER FINANCE — 0.5% |
| Discover Financial Services | 605,000 | 10,678,250 |
| ELECTRICAL EQUIPMENT — 0.8% |
| Rockwell Automation, Inc. | 257,000 | 16,029,090 |
| ELECTRONIC EQUIPMENT, INSTRUMENTS & COMPONENTS — 1.6% |
Agilent Technologies, Inc.(1) | 304,000 | 10,579,200 |
Dolby Laboratories, Inc., Class A(1) | 378,000 | 23,315,040 |
| | | 33,894,240 |
| ENERGY EQUIPMENT & SERVICES — 2.9% |
Complete Production Services, Inc.(1) | 428,509 | 10,039,966 |
| Core Laboratories NV | 259,000 | 20,142,430 |
Dril-Quip, Inc.(1) | 154,000 | 10,641,400 |
FMC Technologies, Inc.(1) | 276,000 | 19,899,600 |
| | | 60,723,396 |
| FOOD & STAPLES RETAILING — 1.2% |
Whole Foods Market, Inc.(1) | 652,000 | 25,917,000 |
| FOOD PRODUCTS — 2.0% |
| H.J. Heinz Co. | 212,000 | 10,411,320 |
| Mead Johnson Nutrition Co. | 542,000 | 31,880,440 |
| | | 42,291,760 |
| HEALTH CARE EQUIPMENT & SUPPLIES — 2.0% |
| C.R. Bard, Inc. | 253,000 | 21,029,360 |
Varian Medical Systems, Inc.(1) | 347,000 | 21,937,340 |
| | | 42,966,700 |
| HEALTH CARE PROVIDERS & SERVICES — 2.6% |
| AmerisourceBergen Corp. | 534,000 | 17,525,880 |
Express Scripts, Inc.(1) | 552,000 | 26,783,040 |
Medco Health Solutions, Inc.(1) | 211,000 | 11,083,830 |
| | | 55,392,750 |
| HEALTH CARE TECHNOLOGY — 1.2% |
SXC Health Solutions Corp.(1) | 662,000 | 25,791,520 |
| HOTELS, RESTAURANTS & LEISURE — 6.4% |
Chipotle Mexican Grill, Inc.(1) | 99,000 | 20,810,790 |
Ctrip.com International Ltd. ADR(1) | 424,000 | 22,077,680 |
Home Inns & Hotels Management, Inc. ADR(1) | 198,000 | 10,129,680 |
Las Vegas Sands Corp.(1) | 519,000 | 23,811,720 |
Royal Caribbean Cruises Ltd.(1) | 811,000 | 32,066,940 |
| Starwood Hotels & Resorts Worldwide, Inc. | 510,000 | 27,611,400 |
| | | 136,508,210 |
| HOUSEHOLD PRODUCTS — 0.7% |
| Church & Dwight Co., Inc. | 239,000 | 15,738,150 |
| INTERNET & CATALOG RETAIL — 4.0% |
Netflix, Inc.(1) | 234,000 | $ 40,599,000 |
priceline.com, Inc.(1) | 121,000 | 45,594,010 |
| | | 86,193,010 |
| INTERNET SOFTWARE & SERVICES — 4.5% |
Akamai Technologies, Inc.(1) | 215,000 | 11,109,050 |
Baidu, Inc. ADR(1) | 269,000 | 29,592,690 |
MercadoLibre, Inc.(1) | 167,000 | 11,043,710 |
VeriSign, Inc.(1) | 752,000 | 26,132,000 |
WebMD Health Corp.(1) | 349,000 | 18,245,720 |
| | | 96,123,170 |
| IT SERVICES — 1.4% |
Cognizant Technology Solutions Corp., Class A(1) | 468,000 | 30,508,920 |
| LIFE SCIENCES TOOLS & SERVICES — 2.4% |
Illumina, Inc.(1) | 449,000 | 24,385,190 |
Life Technologies Corp.(1) | 218,000 | 10,939,240 |
Waters Corp.(1) | 218,000 | 16,160,340 |
| | | 51,484,770 |
| MACHINERY — 4.7% |
AGCO Corp.(1) | 381,000 | 16,181,070 |
ArvinMeritor, Inc.(1) | 910,000 | 15,087,800 |
| Cummins, Inc. | 446,000 | 39,292,600 |
| Dover Corp. | 299,000 | 15,876,900 |
| Timken Co. | 335,000 | 13,875,700 |
| | | 100,314,070 |
| MEDIA — 2.2% |
| CBS Corp., Class B | 595,000 | 10,073,350 |
Discovery Communications, Inc., Class A(1) | 307,000 | 13,695,270 |
Discovery Communications, Inc., Class C(1) | 222,745 | 8,655,871 |
Imax Corp.(1) | 656,000 | 14,202,400 |
| | | 46,626,891 |
| METALS & MINING — 1.9% |
| Cliffs Natural Resources, Inc. | 374,000 | 24,384,800 |
| Walter Energy, Inc. | 176,000 | 15,480,960 |
| | | 39,865,760 |
| MULTILINE RETAIL — 3.2% |
Dollar Tree, Inc.(1) | 1,034,000 | 53,054,540 |
| Family Dollar Stores, Inc. | 335,000 | 15,466,950 |
| | | 68,521,490 |
| OIL, GAS & CONSUMABLE FUELS — 3.3% |
Brigham Exploration Co.(1) | 490,000 | 10,334,100 |
Concho Resources, Inc.(1) | 425,000 | 29,184,750 |
| Pioneer Natural Resources Co. | 156,000 | 10,888,800 |
Whiting Petroleum Corp.(1) | 199,000 | 19,987,560 |
| | | 70,395,210 |
| PHARMACEUTICALS — 1.3% |
Salix Pharmaceuticals Ltd.(1) | 313,000 | 11,840,790 |
| Shire plc | 669,000 | 15,768,710 |
| | | 27,609,500 |
| REAL ESTATE INVESTMENT TRUSTS (REITs) — 2.0% |
| AvalonBay Communities, Inc. | 150,000 | 15,946,500 |
| Digital Realty Trust, Inc. | 257,000 | 15,350,610 |
| DuPont Fabros Technology, Inc. | 410,000 | 10,291,000 |
| | | 41,588,110 |
| REAL ESTATE MANAGEMENT & DEVELOPMENT — 1.7% |
CB Richard Ellis Group, Inc., Class A(1) | 995,000 | 18,258,250 |
| Jones Lang LaSalle, Inc. | 233,000 | 18,187,980 |
| | | 36,446,230 |
| ROAD & RAIL — 1.3% |
| J.B. Hunt Transport Services, Inc. | 284,000 | 10,212,640 |
Kansas City Southern(1) | 395,000 | 17,308,900 |
| | | 27,521,540 |
| SEMICONDUCTORS & SEMICONDUCTOR EQUIPMENT — 4.2% |
| Altera Corp. | 542,000 | 16,915,820 |
| ARM Holdings plc | 3,668,000 | 21,352,666 |
Cavium Networks, Inc.(1) | 570,000 | 18,165,900 |
Skyworks Solutions, Inc.(1) | 929,000 | 21,283,390 |
Veeco Instruments, Inc.(1) | 281,000 | 11,759,850 |
| | | 89,477,626 |
| SOFTWARE — 5.6% |
Citrix Systems, Inc.(1) | 465,000 | 29,792,550 |
Intuit, Inc.(1) | 330,000 | 15,840,000 |
Rovi Corp.(1) | 537,000 | 27,199,050 |
salesforce.com, inc.(1) | 291,000 | 33,776,370 |
VanceInfo Technologies, Inc. ADR(1) | 330,000 | 12,002,100 |
| | | 118,610,070 |
| SPECIALTY RETAIL — 5.8% |
AutoZone, Inc.(1) | 62,000 | 14,733,060 |
O’Reilly Automotive, Inc.(1) | 861,000 | 50,368,500 |
| PetSmart, Inc. | 712,000 | 26,650,160 |
| Williams-Sonoma, Inc. | 947,000 | 30,654,390 |
| | | 122,406,110 |
| TEXTILES, APPAREL & LUXURY GOODS — 2.1% |
Fossil, Inc.(1) | 319,000 | $ 18,817,810 |
Lululemon Athletica, Inc.(1) | 245,000 | 10,858,400 |
| Phillips-Van Heusen Corp. | 239,000 | 14,660,260 |
| | | 44,336,470 |
| TRADING COMPANIES & DISTRIBUTORS — 1.5% |
| Fastenal Co. | 398,000 | 20,489,040 |
| W.W. Grainger, Inc. | 87,000 | 10,790,610 |
| | | 31,279,650 |
| WIRELESS TELECOMMUNICATION SERVICES — 4.6% |
American Tower Corp., Class A(1) | 412,000 | 21,263,320 |
NII Holdings, Inc.(1) | 585,000 | 24,458,850 |
SBA Communications Corp., Class A(1) | 1,355,000 | 53,197,300 |
| | | 98,919,470 |
TOTAL COMMON STOCKS (Cost $1,630,890,325) | 2,100,224,008 |
| Temporary Cash Investments — 1.6% |
| JPMorgan U.S. Treasury Plus Money Market Fund Agency Shares | 1,559 | $ 1,559 |
Repurchase Agreement, Credit Suisse First Boston, Inc., (collateralized by various U.S. Treasury obligations, 1.00%, 3/31/12, valued at $33,557,917), in a joint trading account at 0.16%, dated 10/29/10, due 11/1/10 (Delivery value $32,900,439) | 32,900,000 |
TOTAL TEMPORARY CASH INVESTMENTS (Cost $32,901,559) | 32,901,559 |
TOTAL INVESTMENT SECURITIES — 100.3% (Cost $1,663,791,884) | 2,133,125,567 |
| OTHER ASSETS AND LIABILITIES — (0.3)% | (5,449,854) |
| TOTAL NET ASSETS — 100.0% | $2,127,675,713 |
| Forward Foreign Currency Exchange Contracts |
| Contracts to Sell | Counterparty | Settlement Date | Value | Unrealized Gain (Loss) |
| 15,175,131 | GBP for USD | Bank of America | 11/30/10 | $24,311,623 | $(365,266) |
(Value on Settlement Date $23,946,357)
Notes to Schedule of Investments
ADR = American Depositary Receipt
GBP = British Pound
USD = United States Dollar
See Notes to Financial Statements.
Statement of Assets and Liabilities
| OCTOBER 31, 2010 |
| Assets |
| Investment securities, at value (cost of $1,663,791,884) | $2,133,125,567 |
| Receivable for investments sold | 26,872,475 |
| Receivable for capital shares sold | 402,861 |
| Dividends and interest receivable | 545,729 |
| | 2,160,946,632 |
| | |
| Liabilities |
| Payable for investments purchased | 28,184,885 |
| Payable for capital shares redeemed | 2,919,506 |
| Unrealized loss on forward foreign currency exchange contracts | 365,266 |
| Accrued management fees | 1,750,489 |
| Distribution and service fees payable | 50,773 |
| | 33,270,919 |
| | |
| Net Assets | $2,127,675,713 |
| | |
| Net Assets Consist of: |
| Capital (par value and paid-in surplus) | $2,180,706,204 |
| Undistributed net investment income | 346,850 |
| Accumulated net realized loss | (522,373,581) |
| Net unrealized appreciation | 468,996,240 |
| | $2,127,675,713 |
| | | | |
| | Net assets | Shares outstanding | Net asset value per share |
| Investor Class, $0.01 Par Value | $1,761,318,553 | | 115,515,136 | | $15.25 | |
| Institutional Class, $0.01 Par Value | $153,112,486 | | 9,768,121 | | $15.67 | |
| A Class, $0.01 Par Value | $186,528,837 | | 12,637,939 | | $14.76* | |
| C Class, $0.01 Par Value | $30,133 | | 1,989 | | $15.15 | |
| R Class, $0.01 Par Value | $26,685,704 | | 1,798,100 | | $14.84 | |
*Maximum offering price $15.66 (net asset value divided by 0.9425)
See Notes to Financial Statements.
| YEAR ENDED OCTOBER 31, 2010 |
| Investment Income (Loss) |
| Income: | |
| Dividends (net of foreign taxes withheld of $64,589) | $ 12,091,673 |
| Interest | 38,903 |
| | 12,130,576 |
| | |
| Expenses: | |
| Management fees | 21,260,389 |
| Distribution and service fees: | |
| A Class | 543,216 |
| C Class | 179 |
| R Class | 127,021 |
| Directors’ fees and expenses | 73,489 |
| Other expenses | 76,811 |
| | 22,081,105 |
| | |
| Net investment income (loss) | (9,950,529) |
| | |
| Realized and Unrealized Gain (Loss) |
| Net realized gain (loss) on: | |
| Investment transactions | 354,154,920 |
| Foreign currency transactions | (331,172) |
| Futures contract transactions | 1,142,239 |
| | 354,965,987 |
| | |
| Change in net unrealized appreciation (depreciation) on: | |
| Investments | 156,366,583 |
| Translation of assets and liabilities in foreign currencies | (357,532) |
| | 156,009,051 |
| | |
| Net realized and unrealized gain (loss) | 510,975,038 |
| | |
| Net Increase (Decrease) in Net Assets Resulting from Operations | $501,024,509 |
See Notes to Financial Statements.
Statement of Changes in Net Assets
| YEARS ENDED OCTOBER 31, 2010 AND OCTOBER 31, 2009 |
| Increase (Decrease) in Net Assets | 2010 | 2009 |
| Operations |
| Net investment income (loss) | $ (9,950,529) | $ (10,384,759) |
| Net realized gain (loss) | 354,965,987 | (573,042,002) |
| Change in net unrealized appreciation (depreciation) | 156,009,051 | 530,420,133 |
| Net increase (decrease) in net assets resulting from operations | 501,024,509 | (53,006,628) |
| | | |
| Capital Share Transactions |
| Net increase (decrease) in net assets from capital share transactions | (553,319,017) | (75,018,272) |
| | | |
| Net increase (decrease) in net assets | (52,294,508) | (128,024,900) |
| | | |
| Net Assets |
| Beginning of period | 2,179,970,221 | 2,307,995,121 |
| End of period | $2,127,675,713 | $2,179,970,221 |
| | | |
| Undistributed net investment income | $346,850 | — |
See Notes to Financial Statements.
Notes to Financial Statements
OCTOBER 31, 2010
1. Organization
American Century Mutual Funds, Inc. (the corporation) is registered under the Investment Company Act of 1940 (the 1940 Act) as an open-end management investment company and is organized as a Maryland corporation. Vista Fund (the fund) is one fund in a series issued by the corporation. The fund is diversified as defined under the 1940 Act. The fund’s investment objective is to seek long-term capital growth. The fund pursues its objective by investing primarily in equity securities of companies that are medium-sized and smaller at the time of purchase that management believes will increase in value. The fund is authorized to issue the Investor Class, the Institutional Class, the A Class (formerly Advisor Class), the C Class and the R Class. The A Class may incur an initial sales charge. The A Class and C Class may be subject to a contingent deferred sales charge. The share classes differ principally in their respective sales charges and distribution and shareholder servicing expenses and arrangements. The Institutional Class is made available to institutional shareholders or through financial intermediaries whose clients do not require the same level of shareholder and administrative services as shareholders of other classes. As a result, the Institutional Class is charged a lower unified management fee. Sale of the C Class commenced on March 1, 2010.
2. Significant Accounting Policies
The following is a summary of significant accounting policies consistently followed by the fund in preparation of its financial statements. The financial statements are prepared in conformity with accounting principles generally accepted in the United States of America, which may require management to make certain estimates and assumptions at the date of the financial statements. Actual results could differ from these estimates.
Investment Valuations — The fund determines the fair value of its investments and computes its net asset value per share as of the close of regular trading (usually 4 p.m. Eastern time) on the New York Stock Exchange (NYSE) on each day the NYSE is open.
Equity securities that are listed or traded on a domestic securities exchange are valued at the last reported sales price or at the official closing price as provided by the exchange. Equity securities traded on foreign securities exchanges are typically valued at the closing price on the exchange where primarily traded or as of the close of the NYSE, if that is earlier. If no last sales price is reported, or if local convention or regulation so provides, the mean of the latest bid and asked prices is used. Depending on local convention or regulation, securities traded over-the-counter are valued at the mean of the latest bid and asked prices, the last sales price, or the official closing price. In its determination of fair value, the fund may review several factors including: market information specific to a security; news developments in U.S. and foreign markets; the performance of particular U.S. and foreign securities, indices, comparable securities, American Depositary Receipts, Exchange Traded Funds, and other relevant market indicators.
Debt securities maturing within 60 days at the time of purchase may be valued at cost, plus or minus any amortized discount or premium or at the evaluated mean as provided by an independent pricing service. Evaluated mean prices are commonly derived through utilization of market models, which may consider, among other factors, trade data, quotations from dealers and active market makers, relevant yield curve and spread data, related sector levels, creditworthiness, and other relevant market information on the same or comparable securities.
Investments in open-end management investment companies are valued at the reported net asset value per share. Repurchase agreements are valued at cost. Exchange-traded futures contracts are valued at the settlement price as provided by the appropriate clearing corporation. Forward foreign currency exchange contracts are valued at the mean of the latest bid and asked prices of the forward currency rates as provided by an independent pricing service.
The value of investments initially expressed in foreign currencies is translated into U.S. dollars at prevailing exchange rates.
If the fund determines that the market price for a portfolio security is not readily available or the valuation methods mentioned above do not reflect a security’s fair value, such security is valued as determined in good faith by the Board of Directors or its designee, in accordance with procedures adopted by the Board of Directors. Circumstances that may cause the fund to use these procedures to value a security include, but are not limited to: a security has been declared in default; trading in a security has been halted during the trading day; there is a foreign market holiday and no trading occurred; or an event occurred between the close of a foreign exchange and the NYSE that may affect the value of a security.
Security Transactions — Security transactions are accounted for as of the trade date. Net realized gains and losses are determined on the identified cost basis, which is also used
for federal income tax purposes.
Investment Income — Dividend income less foreign taxes withheld, if any, is recorded as of the ex-dividend date. Interest income is recorded on the accrual basis and includes accretion of discounts and amortization of premiums.
Foreign Currency Translations — All assets and liabilities initially expressed in foreign currencies are translated into U.S. dollars at prevailing exchange rates at period end. The fund may enter into spot foreign currency exchange contracts to facilitate transactions denominated in a foreign currency. Purchases and sales of investment securities, dividend and interest income, spot foreign currency exchange contracts, and expenses are translated at the rates of exchange prevailing on the respective dates of such transactions. Net realized and unrealized foreign currency exchange gains or losses related to investment securities are a component of net realized gain (loss) on investment transactions and net unrealized appreciation (depreciation) on investments, respectively.
Repurchase Agreements — The fund may enter into repurchase agreements with institutions that American Century Investment Management, Inc. (ACIM) (the investment advisor) has determined are creditworthy pursuant to criteria adopted by the Board of Directors. The fund requires that the collateral, represented by securities, received in a repurchase transaction be transferred to the custodian in a manner sufficient to enable the fund to obtain those securities in the event of a default under the repurchase agreement. ACIM monitors, on a daily basis, the securities transferred to ensure the value, including accrued interest, of the securities under each repurchase agreement is equal to or greater than amounts owed to the fund under each repurchase agreement.
Joint Trading Account — Pursuant to an Exemptive Order issued by the Securities and Exchange Commission, the fund, along with certain other funds in the American Century Investments family of funds, may transfer uninvested cash balances into a joint trading account. These balances are invested in one or more repurchase agreements that are collateralized by U.S. Treasury or Agency obligations.
Income Tax Status — It is the fund’s policy to distribute substantially all net investment income and net realized gains to shareholders and to otherwise qualify as a regulated investment company under provisions of the Internal Revenue Code. The fund is no longer subject to examination by tax authorities for years prior to 2007. At this time, management believes there are no uncertain tax positions which, based on their technical merit, would not be sustained upon examination and for which it is reasonably possible that the total amounts of unrecognized tax benefits will significantly change in the next twelve months. Accordingly, no provision has been made for federal or state income taxes.
Multiple Class — All shares of the fund represent an equal pro rata interest in the net assets of the class to which such shares belong, and have identical voting, dividend, liquidation and other rights and the same terms and conditions, except for class specific expenses and exclusive rights to vote on matters affecting only individual classes. Income, non-class specific expenses, and realized and unrealized capital gains and losses of the fund are allocated to each class of shares based on their relative net assets.
Distributions to Shareholders — Distributions to shareholders are recorded on the ex-dividend date. Distributions from net investment income and net realized gains, if any, are generally declared and paid annually.
Indemnifications — Under the corporation’s organizational documents, its officers and directors are indemnified against certain liabilities arising out of the performance of their duties to the fund. In addition, in the normal course of business, the fund enters into contracts that provide general indemnifications. The maximum exposure under these arrangements is unknown as this would involve future claims that may be made against a fund. The risk of material loss from such claims is considered by management to be remote.
3. Fees and Transactions with Related Parties
Management Fees — The corporation has entered into a management agreement with ACIM, under which ACIM provides the fund with investment advisory and management services in exchange for a single, unified management fee (the fee) per class. The agreement provides that all expenses of managing and operating the fund, except distribution and service fees, brokerage expenses, taxes, interest, fees and expenses of the independent directors (including legal counsel fees), and extraordinary expenses, will be paid by ACIM. The fee is computed and accrued daily based on each class’s daily net assets and paid monthly in arrears. The annual management fee for each class is 1.000% for the Investor Class, A Class, C Class and R Class and 0.800% for the Institutional Class.
Distribution and Service Fees — The Board of Directors has adopted a separate Master Distribution and Individual Shareholder Services Plan for each of the A Class, C Class and R Class (collectively the plans), pursuant to Rule 12b-1 of the 1940 Act. The plans provide that the A Class will pay American Century Investment Services, Inc. (ACIS) an annual distribution and service fee of 0.25%. The plans provide that the C Class will pay ACIS an annual distribution and service fee of 1.00%, of which 0.25% is paid for individual shareholder services and 0.75% is paid for distribution services. The plans provide that the R Class will pay ACIS an annual distribution and service fee of 0.50%. The fees are computed and accrued daily based on each class’s daily net assets and paid monthly in arrears. The fees are used to pay financial intermediaries for distribution and individual shareholder services. Fees incurred under the plans during the year ended October 31, 2010, are detailed in the Statement of Operations.
Related Parties — Certain officers and directors of the corporation are also officers and/or directors of American Century Companies, Inc. (ACC), the parent of the corporation’s investment advisor, ACIM, the distributor of the corporation, ACIS, and the corporation’s transfer agent, American Century Services, LLC.
The fund is eligible to invest in a money market fund for temporary purposes, which is managed by J.P. Morgan Investment Management, Inc. (JPMIM). The fund has a mutual funds services agreement with J.P. Morgan Investor Services Co. (JPMIS). JPMorgan Chase Bank (JPMCB) is a custodian of the fund. JPMIM, JPMIS and JPMCB are wholly owned subsidiaries of JPMorgan Chase & Co. (JPM). JPM is an equity investor in ACC.
4. Investment Transactions
Purchases and sales of investment securities, excluding short-term investments, for the year ended October 31, 2010, were $2,780,515,506 and $3,317,447,851, respectively.
5. Capital Share Transactions
Transactions in shares of the fund were as follows:
| | | |
| | Year ended October 31, 2010(1) | Year ended October 31, 2009 |
| | Shares | Amount | Shares | Amount |
| Investor Class/Shares Authorized | 750,000,000 | | 800,000,000 | |
| Sold | 8,630,658 | $ 117,497,322 | 22,067,745 | $ 246,859,389 |
| Redeemed | (32,468,753) | (444,901,904) | (27,625,843) | (311,354,023) |
| | (23,838,095) | (327,404,582) | (5,558,098) | (64,494,634) |
| Institutional Class/Shares Authorized | 80,000,000 | | 80,000,000 | |
| Sold | 4,712,353 | 65,500,385 | 8,008,528 | 91,570,629 |
| Redeemed | (11,923,548) | (169,469,691) | (9,788,881) | (116,857,411) |
| | (7,211,195) | (103,969,306) | (1,780,353) | (25,286,782) |
| A Class/Shares Authorized | 310,000,000 | | 310,000,000 | |
| Sold | 2,682,180 | 35,631,591 | 7,660,713 | 83,311,592 |
| Redeemed | (11,741,693) | (156,158,675) | (7,227,808) | (79,354,013) |
| | (9,059,513) | (120,527,084) | 432,905 | 3,957,579 |
| C Class/Shares Authorized | 50,000,000 | | N/A | |
| Sold | 1,989 | 27,200 | | |
| R Class/Shares Authorized | 10,000,000 | | 10,000,000 | |
| Sold | 506,557 | 6,818,706 | 1,297,310 | 14,468,375 |
| Redeemed | (614,404) | (8,263,951) | (326,357) | (3,662,810) |
| | (107,847) | (1,445,245) | 970,953 | 10,805,565 |
| Net increase (decrease) | (40,214,661) | $(553,319,017) | (5,934,593) | $ (75,018,272) |
| (1) | March 1, 2010 (commencement of sale) through October 31, 2010 for the C Class. |
6. Fair Value Measurements
The fund’s securities valuation process is based on several considerations and may use multiple inputs to determine the fair value of the positions held by the fund. In conformity with accounting principles generally accepted in the United States of America, the inputs used to determine a valuation are classified into three broad levels as follows:
| • | Level 1 valuation inputs consist of unadjusted quoted prices in an active market for identical securities; |
| • | Level 2 valuation inputs consist of direct or indirect observable market data (including quoted prices for similar securities, evaluations of subsequent market events, interest rates, prepayment speeds, credit risk, etc.); or |
| • | Level 3 valuation inputs consist of unobservable data (including a fund’s own assumptions). |
The level classification is based on the lowest level input that is significant to the fair valuation measurement. The valuation inputs are not necessarily an indication of the risks associated with investing in these securities or other financial instruments.
The following is a summary of the level classifications as of period end. The Schedule of Investments provides additional information on the fund’s portfolio holdings.
| | | | |
| | Level 1 | Level 2 | Level 3 |
| Investment Securities |
| Domestic Common Stocks | $1,901,800,090 | — | — |
| Foreign Common Stocks | 155,840,610 | $42,583,308 | — |
| Temporary Cash Investments | 1,559 | 32,900,000 | — |
| Total Value of Investment Securities | $2,057,642,259 | $75,483,308 | — |
| |
| Other Financial Instruments |
Total Unrealized Gain (Loss) on Forward Foreign Currency Exchange Contracts | — | $(365,266) | — |
7. Derivative Instruments
Equity Price Risk — The fund is subject to equity price risk in the normal course of pursuing its investment objectives. A fund may enter into futures contracts based on an equity index in order to manage its exposure to changes in market conditions. A fund may purchase futures contracts to gain exposure to increases in market value or sell futures contracts to protect against a decline in market value. Upon entering into a futures contract, a fund is required to deposit either cash or securities in an amount equal to a certain percentage of the contract value (initial margin). Subsequent payments (variation margin) are made or received daily, in cash, by a fund. The variation margin is equal to the daily change in the contract value and is recorded as unrealized gains and losses. A fund recognizes a realized gain or loss when the contract is closed or expires. Net realized and unrealized gains or losses occurring during the holding period of futures contracts are a component of net realized gain (loss) on futures contract transactions and change in net unrealized appreciation (depreciation) on futures contracts, respectively. One of the risks of entering into futures contracts is the possibility that the change in value of the contract may not correlate with the changes in value of the underlying securities. The fund held no equity price risk derivative instruments at period end. During the period, the fund infrequently purchased equity price risk derivative instruments for temporary investment purposes.
Foreign Currency Risk — The fund is subject to foreign currency exchange rate risk in the normal course of pursuing its investment objectives. The value of foreign investments held by a fund may be significantly affected by changes in foreign currency exchange rates. The dollar value of a foreign security generally decreases when the value of the dollar rises against the foreign currency in which the security is denominated and tends to increase when the value of the dollar declines against such foreign currency. A fund may enter into forward foreign currency exchange contracts to reduce a fund’s exposure to foreign currency exchange rate fluctuations. The net U.S. dollar value of foreign currency underlying all contractual commitments held by a fund and the resulting unrealized appreciation or depreciation are determined daily using prevailing exchange rates. Realized gain or loss is recorded upon the termination of the contract. Net realized and unrealized gains or losses occurring during the holding period of forward foreign currency exchange contracts are a component of net realized gain (loss) on foreign currency transactions and change in net unrealized appreciation (depreciation) on translation of assets and liabilities in foreign currencies, respectively. A fund bears the risk of an unfavorable change in the foreign currency exchange rate underlying the forward contract. Additionally, losses, up to the fair value, may arise if the counterparties do not perform under the contract terms. The risk of loss from non-performance by the counterparty may be reduced by the use of master netting agreements. The foreign currency risk derivative instruments held at period end as disclosed on the Schedule of Investments are indicative of the fund’s typical volume during the period.
Value of Derivative Instruments as of October 31, 2010 |
| | Asset Derivatives | | Liability Derivatives |
Type of Risk Exposure | Location on Statement of Assets and Liabilities | Value | | Location on Statement of Assets and Liabilities | Value |
| Foreign Currency Risk | Unrealized gain on forward foreign currency exchange contracts | — | | Unrealized loss on forward foreign currency exchange contracts | $365,266 |
| |
Effect of Derivative Instruments on the Statement of Operations for the Year Ended October 31, 2010 |
| | Net Realized Gain (Loss) | | Change in Net Unrealized Appreciation (Depreciation) |
Type of Risk Exposure | Location on Statement of Operations | Value | | Location on Statement of Operations | Value |
| Equity Price Risk | Net realized gain (loss) on futures contract transactions | $1,142,239 | | Change in net unrealized appreciation (depreciation) on futures contracts | — |
| Foreign Currency Risk | Net realized gain (loss) on foreign currency transactions | (354,140) | | Change in net unrealized appreciation (depreciation) on translation of assets and liabilities in foreign currencies | $(365,266) |
| | | $ 788,099 | | | $(365,266) |
8. Risk Factors
There are certain risks involved in investing in foreign securities. These risks include those resulting from future adverse political, social, and economic developments, fluctuations in currency exchange rates, the possible imposition of exchange controls, and other foreign laws or restrictions.
9. Federal Tax Information
The book-basis character of distributions made during the year from net investment income or net realized gains may differ from their ultimate characterization for federal income tax purposes. These differences reflect the differing character of certain income items and net realized gains and losses for financial statement and tax purposes, and may result in reclassification among certain capital accounts on the financial statements. There were no distributions paid by the fund during the years ended October 31, 2010 and October 31, 2009.
As of October 31, 2010, the federal tax cost of investments and the components of distributable earnings on a tax-basis were as follows:
| | |
| Federal tax cost of investments | $1,666,391,594 |
| Gross tax appreciation of investments | $472,193,962 |
| Gross tax depreciation of investments | (5,459,989) |
| Net tax appreciation (depreciation) of investments | $466,733,973 |
Net tax appreciation (depreciation) on derivatives and translation of assets and liabilities in foreign currencies | $9,407 |
| Net tax appreciation (depreciation) | $466,743,380 |
| Undistributed ordinary income | — |
| Accumulated capital losses | $(519,773,871) |
The difference between book-basis and tax-basis cost and unrealized appreciation (depreciation) is attributable primarily to the tax deferral of losses on wash sales and the realization for tax purposes of unrealized gains (losses) on certain forward foreign currency exchange contracts.
The accumulated capital losses represent net capital loss carryovers that may be used to offset future realized capital gains for federal income tax purposes. Future capital loss carryover utilization in any given year may be subject to Internal Revenue Code limitations. Capital loss carryovers expire in 2017.
10. Corporate Event
As part of a long-standing estate and business succession plan established by James E. Stowers, Jr., the founder of American Century Investments, ACC Chairman Richard W. Brown succeeded Mr. Stowers as trustee of a trust that holds a greater-than-25% voting interest in ACC, the parent corporation of the fund’s advisor. Under the 1940 Act, this is presumed to represent control of ACC even though it is less than a majority interest. The change of trustee was considered a change of control of ACC and therefore also a change of control of the fund’s advisor even though there has been no change to its management and none is anticipated. The change of control resulted in the assignment of the fund’s investment advisory agreement. As required by the 1940 Act, the assignment automatically terminated such agreem ent, making the approval of a new agreement necessary.
On February 18, 2010, the Board of Directors approved an interim investment advisory agreement under which the fund was managed until a new agreement was approved. The new agreement for the fund was approved by the Board of Directors on March 29, 2010, and by shareholders at a Special Meeting of Shareholders on June 16, 2010. It went into effect on July 16, 2010. The new agreement, which is substantially identical to the terminated agreement (with the exception of different effective and termination dates), did not result in changes in the management of American Century Investments, the fund, its investment objectives, fees or services provided. Management agreements for new share classes that were launched after February 18, 2010 did no t terminate, were not replaced by interim agreements, and did not require approval of new agreements.
Vista
| Investor Class |
| For a Share Outstanding Throughout the Years Ended October 31 |
| | 2010 | 2009 | 2008 | 2007 | 2006 |
| Per-Share Data |
| Net Asset Value, Beginning of Period | $12.13 | $12.43 | $24.24 | $16.35 | $14.99 |
| Income From Investment Operations | | | | | |
Net Investment Income (Loss)(1) | (0.06) | (0.05) | (0.11) | (0.12) | (0.04) |
| Net Realized and Unrealized Gain (Loss) | 3.18 | (0.25) | (9.61) | 8.14 | 1.40 |
| Total From Investment Operations | 3.12 | (0.30) | (9.72) | 8.02 | 1.36 |
| Distributions | | | | | |
| From Net Realized Gains | — | — | (2.09) | (0.13) | — |
| Net Asset Value, End of Period | $15.25 | $12.13 | $12.43 | $24.24 | $16.35 |
| | | | | | |
Total Return(2) | 25.72% | (2.41)% | (43.58)% | 49.39% | 9.07% |
| | | | | | |
| Ratios/Supplemental Data |
Ratio of Operating Expenses to Average Net Assets | 1.01% | 1.00% | 1.00% | 1.00% | 1.00% |
Ratio of Net Investment Income (Loss) to Average Net Assets | (0.45)% | (0.48)% | (0.56)% | (0.60)% | (0.23)% |
| Portfolio Turnover Rate | 132% | 183% | 167% | 121% | 234% |
| Net Assets, End of Period (in millions) | $1,761 | $1,691 | $1,801 | $2,921 | $1,965 |
| (1) | Computed using average shares outstanding throughout the period. |
| (2) | Total returns are calculated based on the net asset value of the last business day. Total returns for periods less than one year are not annualized. |
See Notes to Financial Statements.
Vista
| Institutional Class |
| For a Share Outstanding Throughout the Years Ended October 31 |
| | 2010 | 2009 | 2008 | 2007 | 2006 |
| Per-Share Data |
| Net Asset Value, Beginning of Period | $12.45 | $12.73 | $24.72 | $16.64 | $15.22 |
| Income From Investment Operations | | | | | |
Net Investment Income (Loss)(1) | (0.03) | (0.03) | (0.07) | (0.08) | (0.01) |
| Net Realized and Unrealized Gain (Loss) | 3.25 | (0.25) | (9.83) | 8.29 | 1.43 |
| Total From Investment Operations | 3.22 | (0.28) | (9.90) | 8.21 | 1.42 |
| Distributions | | | | | |
| From Net Realized Gains | — | — | (2.09) | (0.13) | — |
| Net Asset Value, End of Period | $15.67 | $12.45 | $12.73 | $24.72 | $16.64 |
| | | | | | |
Total Return(2) | 25.86% | (2.12)% | (43.50)% | 49.68% | 9.33% |
| | | | | | |
| Ratios/Supplemental Data |
Ratio of Operating Expenses to Average Net Assets | 0.81% | 0.80% | 0.80% | 0.80% | 0.80% |
Ratio of Net Investment Income (Loss) to Average Net Assets | (0.25)% | (0.28)% | (0.36)% | (0.40)% | (0.03)% |
| Portfolio Turnover Rate | 132% | 183% | 167% | 121% | 234% |
| Net Assets, End of Period (in thousands) | $153,112 | $211,357 | $238,727 | $254,528 | $132,325 |
| (1) | Computed using average shares outstanding throughout the period. |
| (2) | Total returns are calculated based on the net asset value of the last business day. Total returns for periods less than one year are not annualized. |
See Notes to Financial Statements.
Vista
A Class(1) |
| For a Share Outstanding Throughout the Years Ended October 31 |
| | 2010 | 2009 | 2008 | 2007 | 2006 |
| Per-Share Data |
| Net Asset Value, Beginning of Period | $11.77 | $12.09 | $23.69 | $16.03 | $14.73 |
| Income From Investment Operations | | | | | |
Net Investment Income (Loss)(2) | (0.09) | (0.08) | (0.15) | (0.16) | (0.08) |
| Net Realized and Unrealized Gain (Loss) | 3.08 | (0.24) | (9.36) | 7.95 | 1.38 |
| Total From Investment Operations | 2.99 | (0.32) | (9.51) | 7.79 | 1.30 |
| Distributions | | | | | |
| From Net Realized Gains | — | — | (2.09) | (0.13) | — |
| Net Asset Value, End of Period | $14.76 | $11.77 | $12.09 | $23.69 | $16.03 |
| | | | | | |
Total Return(3) | 25.40% | (2.65)% | (43.72)% | 48.94% | 8.83% |
| | | | | | |
| Ratios/Supplemental Data |
Ratio of Operating Expenses to Average Net Assets | 1.26% | 1.25% | 1.25% | 1.25% | 1.25% |
Ratio of Net Investment Income (Loss) to Average Net Assets | (0.70)% | (0.73)% | (0.81)% | (0.85)% | (0.48)% |
| Portfolio Turnover Rate | 132% | 183% | 167% | 121% | 234% |
| Net Assets, End of Period (in thousands) | $186,529 | $255,419 | $257,057 | $380,555 | $210,576 |
| (1) | Prior to March 1, 2010, the A Class was referred to as the Advisor Class. |
| (2) | Computed using average shares outstanding throughout the period. |
| (3) | Total returns are calculated based on the net asset value of the last business day and do not reflect applicable sales charges. Total returns for periods less than one year are not annualized. |
See Notes to Financial Statements.
Vista
| C Class |
| For a Share Outstanding Throughout the Years Ended October 31 (except as noted) |
| | 2010(1) |
| Per-Share Data |
| Net Asset Value, Beginning of Period | $13.73 |
| Income From Investment Operations | |
Net Investment Income (Loss)(2) | (0.14) |
| Net Realized and Unrealized Gain (Loss) | 1.56 |
| Total From Investment Operations | 1.42 |
| Net Asset Value, End of Period | $15.15 |
| | |
Total Return(3) | 10.34% |
| | |
| Ratios/Supplemental Data |
| Ratio of Operating Expenses to Average Net Assets | 2.01%(4) |
| Ratio of Net Investment Income (Loss) to Average Net Assets | (1.51)%(4) |
| Portfolio Turnover Rate | 132%(5) |
| Net Assets, End of Period (in thousands) | $30 |
| (1) | March 1, 2010 (commencement of sale) through October 31, 2010. |
| (2) | Computed using average shares outstanding throughout the period. |
| (3) | Total returns are calculated based on the net asset value of the last business day and do not reflect applicable sales charges. Total returns for periods less than one year are not annualized. |
| (5) | Portfolio turnover is calculated at the fund level. Percentage indicated was calculated for the year ended October 31, 2010. |
See Notes to Financial Statements.
Vista
| R Class |
| For a Share Outstanding Throughout the Years Ended October 31 |
| | 2010 | 2009 | 2008 | 2007 | 2006 |
| Per-Share Data |
| Net Asset Value, Beginning of Period | $11.87 | $12.22 | $23.98 | $16.25 | $14.97 |
| Income From Investment Operations | | | | | |
Net Investment Income (Loss)(1) | (0.13) | (0.12) | (0.18) | (0.21) | (0.16) |
| Net Realized and Unrealized Gain (Loss) | 3.10 | (0.23) | (9.49) | 8.07 | 1.44 |
| Total From Investment Operations | 2.97 | (0.35) | (9.67) | 7.86 | 1.28 |
| Distributions | | | | | |
| From Net Realized Gains | — | — | (2.09) | (0.13) | — |
| Net Asset Value, End of Period | $14.84 | $11.87 | $12.22 | $23.98 | $16.25 |
| | | | | | |
Total Return(2) | 25.02% | (2.86)% | (43.87)% | 48.71% | 8.55% |
| | | | | | |
| Ratios/Supplemental Data |
Ratio of Operating Expenses to Average Net Assets | 1.51% | 1.50% | 1.50% | 1.50% | 1.50% |
Ratio of Net Investment Income (Loss) to Average Net Assets | (0.95)% | (0.98)% | (1.06)% | (1.10)% | (0.73)% |
| Portfolio Turnover Rate | 132% | 183% | 167% | 121% | 234% |
| Net Assets, End of Period (in thousands) | $26,686 | $22,618 | $11,423 | $2,398 | $337 |
| (1) | Computed using average shares outstanding throughout the period. |
| (2) | Total returns are calculated based on the net asset value of the last business day. Total returns for periods less than one year are not annualized. |
See Notes to Financial Statements.
Report of Independent Registered Public Accounting Firm
The Board of Directors and Shareholders,
American Century Mutual Funds, Inc.:
We have audited the accompanying statement of assets and liabilities, including the schedule of investments, of Vista Fund, one of the funds constituting American Century Mutual Funds, Inc. (the “Corporation”), as of October 31, 2010, and the related statement of operations for the year then ended, the statements of changes in net assets for each of the two years in the period then ended, and the financial highlights for each of the periods presented. These financial statements and financial highlights are the responsibility of the Corporation’s management. Our responsibility is to express an opinion on these financial statements and financial highlights based on our audits.
We conducted our audits in accordance with the standards of the Public Company Accounting Oversight Board (United States). Those standards require that we plan and perform the audit to obtain reasonable assurance about whether the financial statements and financial highlights are free of material misstatement. The Corporation is not required to have, nor were we engaged to perform, an audit of its internal control over financial reporting. Our audits included consideration of internal control over financial reporting as a basis for designing audit procedures that are appropriate in the circumstances, but not for the purpose of expressing an opinion on the effectiveness of the Corporation’s internal control over financial reporting. Accordingly, we express no such opinion. An audit also includes examining, on a te st basis, evidence supporting the amounts and disclosures in the financial statements, assessing the accounting principles used and significant estimates made by management, as well as evaluating the overall financial statement presentation. Our procedures included confirmation of securities owned as of October 31, 2010, by correspondence with the custodian and brokers; where replies were not received from brokers, we performed other auditing procedures. We believe that our audits provide a reasonable basis for our opinion.
In our opinion, the financial statements and financial highlights referred to above present fairly, in all material respects, the financial position of Vista Fund of American Century Mutual Funds, Inc., as of October 31, 2010, the results of its operations for the year then ended, the changes in its net assets for each of the two years in the period then ended, and the financial highlights for each of the periods presented, in conformity with accounting principles generally accepted in the United States of America.
Deloitte & Touche LLP
Kansas City, Missouri
December 20, 2010
A special meeting of shareholders was held on June 16, 2010, to vote on the following proposals. Each proposal received the required number of votes and was adopted. A summary of voting results is listed below each proposal.
Proposal 1:
To elect one Director to the Board of Directors of American Century Mutual Funds, Inc. (the proposal was voted on by all shareholders of funds issued by American Century Mutual Funds, Inc.):
| | | | | |
| | John R. Whitten | For: | 13,907,426,552 | |
| | | Withhold: | 629,801,798 | |
| | | Abstain: | 0 | |
| | | Broker Non-Vote: | 0 | |
The other directors whose term of office continued after the meeting include Jonathan S. Thomas, Thomas A. Brown, Andrea C. Hall, James A. Olson, Donald H. Pratt, and M. Jeannine Strandjord.
Proposal 2:
To approve a management agreement between the fund and American Century Investment Management, Inc.:
| | | | | |
| | Investor, A and R Classes | For: | 1,453,644,036 | |
| | | Against: | 23,873,694 | |
| | | Abstain: | 34,615,246 | |
| | | Broker Non-Vote: | 67,216,511 | |
| | | |
| | Institutional Class | For: | 106,154,590 | |
| | | Against: | 1,337,165 | |
| | | Abstain: | 1,930,383 | |
| | | Broker Non-Vote: | 4,969,942 | |
Proposal 3:
To approve an amendment to the Articles of Incorporation to limit certain director liability to the extent permitted by Maryland law (the proposal was voted on by all shareholders of funds issued by American Century Mutual Funds, Inc.):
| | | | | |
| | | For: | 12,112,932,038 | |
| | | Against: | 769,504,652 | |
| | | Abstain: | 420,034,445 | |
| | | Broker Non-Vote: | 1,234,757,216 | |
The Board of Directors
The individuals listed below serve as directors of the fund. Each director will continue to serve in this capacity until death, retirement, resignation or removal from office. The mandatory retirement age for directors who are not “interested persons,” as that term is defined in the Investment Company Act (independent directors), is 72. However, the mandatory retirement age for an individual director may be extended with the approval of the remaining independent directors.
Mr. Thomas is the only director who is an “interested person” because he currently serves as President and Chief Executive Officer of American Century Companies, Inc. (ACC), the parent company of American Century Investment Management, Inc. (ACIM or the advisor).
The other directors (more than three-fourths of the total number) are independent; that is, they have never been employees, directors or officers of, and have no financial interest in, ACC or any of its wholly owned, direct or indirect, subsidiaries, including ACIM, American Century Investment Services, Inc. (ACIS) and American Century Services, LLC (ACS). The directors serve in this capacity for seven (in the case of Mr. Thomas, 15) registered investment companies in the American Century Investments family of funds.
The following presents additional information about the directors. The mailing address for each director is 4500 Main Street, Kansas City, Missouri 64111.
Independent Directors
Thomas A. Brown
Year of Birth: 1940
Position(s) with the Fund: Director
Length of Time Served: Since 1980
Principal Occupation(s) During the Past Five Years: Managing Member, Associated Investments, LLC (real estate investment company); Brown Cascade Properties, LLC (real estate investment company) (2001 to 2009)
Number of Funds in Fund Complex Overseen by Director: 61
Other Directorships Held by Director During the Past Five Years: None
Education/Other Professional Experience: BS in Mechanical Engineering, University of Kansas; formerly, Chief Executive Officer, Associated Bearings Company; formerly, Area Vice President, Applied Industrial Technologies (bearings and power transmission company)
Andrea C. Hall
Year of Birth: 1945
Position(s) with the Fund: Director
Length of Time Served: Since 1997
Principal Occupation(s) During the Past Five Years: Retired as advisor to the President, Midwest Research Institute (not-for-profit research organization) (June 2006)
Number of Funds in Fund Complex Overseen by Director: 61
Other Directorships Held by Director During the Past Five Years: None
Education/Other Professional Experience: BS in Biology, Florida State University; PhD in Biology, Georgetown University; formerly, Senior Vice President and Director of Research Operations, Midwest Research Institute
James A. Olson
Year of Birth: 1942
Position(s) with the Fund: Director
Length of Time Served: Since 2007
Principal Occupation(s) During the Past Five Years: Member, Plaza Belmont LLC (private equity fund manager); Chief Financial Officer, Plaza Belmont LLC (September 1999 to September 2006)
Number of Funds in Fund Complex Overseen by Director: 61
Other Directorships Held by Director During the Past Five Years: Saia, Inc. and Entertainment Properties Trust
Education/Other Professional Experience: BS in Business Administration and MBA, St. Louis University; CPA; 21 years of experience as a partner in the accounting firm of Ernst & Young LLP
Donald H. Pratt
Year of Birth: 1937
Position(s) with the Fund: Director, Chairman of the Board
Length of Time Served: Since 1995 (Chairman since 2005)
Principal Occupation(s) During the Past Five Years: Chairman and Chief Executive Officer, Western Investments, Inc. (real estate company)
Number of Funds in Fund Complex Overseen by Director: 61
Other Directorships Held by Director During the Past Five Years: None
Education/Other Professional Experience: BS in Industrial Engineering, Wichita State University; MBA, Harvard Business School; serves on the Board of Governors of the Independent Directors Council and Investment Company Institute; formerly, Chairman of the Board, Butler Manufacturing Company (metal buildings producer)
M. Jeannine Strandjord
Year of Birth: 1945
Position(s) with the Fund: Director
Length of Time Served: Since 1994
Principal Occupation(s) During the Past Five Years: Retired, formerly, Senior Vice President, Process Excellence, Sprint Corporation (telecommunications company) (January 2005 to September 2005)
Number of Funds in Fund Complex Overseen by Director: 61
Other Directorships Held by Director During the Past Five Years: DST Systems Inc., Euronet Worldwide Inc., Charming Shoppes, Inc.
Education/Other Professional Experience: BS in Business Administration and Accounting, University of Kansas; CPA; formerly, Senior Vice President of Financial Services and Treasurer and Chief Financial Officer, Global Markets Group; Sprint Corporation; formerly, with the accounting firm of Ernst and Whinney
John R. Whitten
Year of Birth: 1946
Position(s) with the Fund: Director
Length of Time Served: Since 2008
Principal Occupation(s) During the Past Five Years: Project Consultant, Celanese Corp. (industrial chemical company)
Number of Funds in Fund Complex Overseen by Director: 61
Other Directorships Held by Director During the Past Five Years: Rudolph Technologies, Inc.
Professional Education/Experience: BS in Business Administration, Cleveland State University; CPA; formerly, Chief Financial Officer and Treasurer, Applied Industrial Technologies, Inc.; thirteen years of experience with accounting firm Deloitte & Touche LLP
Interested Director
Jonathan S. Thomas
Year of Birth: 1963
Position(s) with the Fund: Director and President
Length of Time Served: Since 2007
Principal Occupation(s) During the Past Five Years: President and Chief Executive Officer, ACC (March 2007 to present); Chief Administrative Officer, ACC (February 2006 to February 2007); Executive Vice President, ACC (November 2005 to February 2007). Also serves as: Chief Executive Officer and Manager, ACS; Executive Vice President, ACIM; Director, ACC, ACIM and other ACC subsidiaries
Number of Funds in Fund Complex Overseen by Director: 101
Other Directorships Held by Director During the Past Five Years: None
Education/Other Professional Experience: BA in Economics, University of Massachusetts; MBA, Boston College; formerly held senior leadership roles with Fidelity Investments, Boston Financial Services, Bank of America and Morgan Stanley; serves on the Board of Governors of the Investment Company Institute
Officers
The following table presents certain information about the executive officers of the fund. Each officer serves as an officer for each of the 15 investment companies in the American Century family of funds, unless otherwise noted. No officer is compensated for his or her service as an officer of the fund. The listed officers are interested persons of the fund and are appointed or re-appointed on an annual basis. The mailing address for each of the officers listed below is 4500 Main Street, Kansas City, Missouri 64111.
| | | | |
| | Name (Year of Birth) | Offices with the Fund | Principal Occupation(s) During the Past Five Years |
| | Jonathan S. Thomas (1963) | Director and President since 2007 | President and Chief Executive Officer, ACC (March 2007 to present); Chief Administrative Officer, ACC (February 2006 to February 2007); Executive Vice President, ACC (November 2005 to February 2007). Also serves as: Chief Executive Officer and Manager, ACS; Executive Vice President, ACIM; Director, ACC, ACIM and other ACC subsidiaries |
| | Barry Fink (1955) | Executive Vice President since 2007 | Chief Operating Officer and Executive Vice President, ACC (September 2007 to present); President, ACS (October 2007 to present); Managing Director, Morgan Stanley (2000 to 2007); Global General Counsel, Morgan Stanley (2000 to 2006). Also serves as: Manager, ACS and Director, ACC and certain ACC subsidiaries |
| | Maryanne L. Roepke (1956) | Chief Compliance Officer since 2006 and Senior Vice President since 2000 | Chief Compliance Officer, American Century funds, ACIM and ACS (August 2006 to present); Assistant Treasurer, ACC (January 1995 to August 2006); and Treasurer and Chief Financial Officer, various American Century funds (July 2000 to August 2006). Also serves as: Senior Vice President, ACS |
| | Charles A. Etherington (1957) | General Counsel since 2007 and Senior Vice President since 2006 | Attorney, ACC (February 1994 to present); Vice President, ACC (November 2005 to present), General Counsel, ACC (March 2007 to present); Also serves as General Counsel, ACIM, ACS, ACIS and other ACC subsidiaries; and Senior Vice President, ACIM and ACS |
| | Robert J. Leach (1966) | Vice President, Treasurer and Chief Financial Officer since 2006 | Vice President, ACS (February 2000 to present); and Controller, various American Century funds (1997 to September 2006) |
| | David H. Reinmiller (1963) | Vice President since 2000 | Attorney, ACC (January 1994 to present); Associate General Counsel, ACC (January 2001 to present); Chief Compliance Officer, American Century funds and ACIM (January 2001 to February 2005). Also serves as Vice President, ACIM and ACS |
| | Ward D. Stauffer (1960) | Secretary since 2005 | Attorney, ACC (June 2003 to present) |
| | | | |
| | The Statement of Additional Information has additional information about the fund’s directors and is available without charge, upon request, by calling 1-800-345-2021. |
Retirement Account Information
As required by law, distributions you receive from certain IRAs, or 403(b), 457 and qualified plans are subject to federal income tax withholding, unless you elect not to have withholding apply. Tax will be withheld on the total amount withdrawn even though you may be receiving amounts that are not subject to withholding, such as nondeductible contributions. In such case, excess amounts of withholding could occur. You may adjust your withholding election so that a greater or lesser amount will be withheld.
If you don’t want us to withhold on this amount, you must notify us to not withhold the federal income tax. You may notify us in writing or in certain situations by telephone or through other electronic means. You have the right to revoke your withholding election at any time and any election you make may remain in effect until revoked by filing a new election.
Remember, even if you elect not to have income tax withheld, you are liable for paying income tax on the taxable portion of your withdrawal. If you elect not to have income tax withheld or you don’t have enough income tax withheld, you may be responsible for payment of estimated tax. You may incur penalties under the estimated tax rules if your withholding and estimated tax payments are not sufficient. You can reduce or defer the income tax on a distribution by directly or indirectly rolling such distribution over to another IRA or eligible plan. You should consult your tax advisor for additional information.
State tax will be withheld if, at the time of your distribution, your address is within one of the mandatory withholding states and you have federal income tax withheld. State taxes will be withheld from your distribution in accordance with the respective state rules.
Proxy Voting Guidelines
American Century Investment Management, Inc., the fund’s investment advisor, is responsible for exercising the voting rights associated with the securities purchased and/or held by the fund. A description of the policies and procedures the advisor uses in fulfilling this responsibility is available without charge, upon request, by calling 1-800-345-2021. It is also available on American Century Investments’ website at americancentury.com and on the Securities and Exchange Commission’s website at sec.gov. Information regarding how the investment advisor voted proxies relating to portfolio securities during the most recent 12-month period ended June 30 is available on the “About Us” page at americancentury.com. It is also available at sec.gov.
Quarterly Portfolio Disclosure
The fund files its complete schedule of portfolio holdings with the Securities and Exchange Commission (SEC) for the first and third quarters of each fiscal year on Form N-Q. The fund’s Forms N-Q are available on the SEC’s website at sec.gov, and may be reviewed and copied at the SEC’s Public Reference Room in Washington, DC. Information on the operation of the Public Reference Room may be obtained by calling 1-800-SEC-0330. The fund also makes its complete schedule of portfolio holdings for the most recent quarter of its fiscal year available on its website at americancentury.com and, upon request, by calling 1-800-345-2021.
The following indices are used to illustrate investment market, sector, or style performance or to serve as fund performance comparisons. They are not investment products available for purchase.
The Russell 1000® Index is a market-capitalization weighted, large-cap index created by Frank Russell Company to measure the performance of the 1,000 largest publicly traded U.S. companies, based on total market capitalization.
The Russell 1000® Growth Index measures the performance of those Russell 1000 Index companies (the 1,000 largest publicly traded U.S. companies, based on total market capitalization) with higher price-to-book ratios and higher forecasted growth values.
The Russell 1000® Value Index measures the performance of those Russell 1000 Index companies (the 1,000 largest publicly traded U.S. companies, based on total market capitalization) with lower price-to-book ratios and lower forecasted growth values.
The Russell 2000® Index is a market-capitalization weighted index created by Frank Russell Company to measure the performance of the 2,000 smallest of the 3,000 largest publicly traded U.S. companies, based on total market capitalization.
The Russell 2000® Growth Index measures the performance of those Russell 2000 Index companies (the 2,000 smallest of the 3,000 largest publicly traded U.S. companies, based on total market capitalization) with higher price-to-book ratios and higher forecasted growth values.
The Russell 2000® Value Index measures the performance of those Russell 2000 Index companies (the 2,000 smallest of the 3,000 largest publicly traded U.S. companies, based on total market capitalization) with lower price-to-book ratios and lower forecasted growth values.
The Russell Midcap® Index measures the performance of the 800 smallest of the 1,000 largest publicly traded U.S. companies, based on total market capitalization.
The Russell Midcap® Growth Index measures the performance of those Russell Midcap Index companies (the 800 smallest of the 1,000 largest publicly traded U.S. companies, based on total market capitalization) with higher price-to-book ratios and higher forecasted growth values.
The Russell Midcap® Value Index measures the performance of those Russell Midcap Index companies (the 800 smallest of the 1,000 largest publicly traded U.S. companies, based on total market capitalization) with lower price-to-book ratios and lower forecasted growth values.
Notes
Notes
Notes
| |
| | |
| Contact Us | |
| | |
| americancentury.com | |
| | |
| Automated Information Line | 1-800-345-8765 |
| | |
| Investor Services Representative | 1-800-345-2021 or 816-531-5575 |
| | |
| Investors Using Advisors | 1-800-378-9878 |
| | |
| Business, Not-For-Profit, Employer-Sponsored Retirement Plans | 1-800-345-3533 |
| | |
| Banks and Trust Companies, Broker-DealersFinancial Professionals, Insurance Companies | 1-800-345-6488 |
| | |
| Telecommunications Device for the Deaf | 1-800-634-4113 |
| | |
| American Century Mutual Funds, Inc. |
| |
Investment Advisor: American Century Investment Management, Inc. Kansas City, Missouri |
| |
| This report and the statements it contains are submitted for the general information of our shareholders. The report is not authorized for distribution to prospective investors unless preceded or accompanied by an effective prospectus. |
American Century Investment Services, Inc., Distributor
©2010 American Century Proprietary Holdings, Inc. All rights reserved.
| Annual Report |
| October 31, 2010 |
American Century Investments®
| | President’s Letter | 2 |
| | Independent Chairman’s Letter | 3 |
| | Market Perspective | 4 |
| | U.S. Stock Index Returns | 4 |
| | | |
| Veedot |
| |
| | Performance | 5 |
| | Portfolio Commentary | 6 |
| | Top Ten Holdings | 8 |
| | Top Five Industries | 8 |
| | Types of Investments in Portfolio | 8 |
| | | |
| | Shareholder Fee Example | 9 |
| | | |
| Financial Statements |
| |
| | Schedule of Investments | 11 |
| | Statement of Assets and Liabilities | 14 |
| | Statement of Operations | 15 |
| | Statement of Changes in Net Assets | 16 |
| | Notes to Financial Statements | 17 |
| | Financial Highlights | 22 |
| | Report of Independent Registered Public Accounting Firm | 24 |
| | | |
| Other Information |
| |
| | Proxy Voting Results | 25 |
| | Management | 26 |
| | Additional Information | 30 |
| | Index Definitions | 31 |
Any opinions expressed in this report reflect those of the author as of the date of the report, and do not necessarily represent the opinions of American Century Investments or any other person in the American Century Investments organization. Any such opinions are subject to change at any time based upon market or other conditions and American Century Investments disclaims any responsibility to update such opinions. These opinions may not be relied upon as investment advice and, because investment decisions made by American Century Investments funds are based on numerous factors, may not be relied upon as an indication of trading intent on behalf of any American Century Investments fund. Security examples are used for representational purposes only and are not intended as recommendations to purchase or sell securities. Performance information for comparative indices and securities is provided to American Century Investments by third party vendors. To the best of American Century Investments’ knowledge, such information is accurate at the time of printing.
Jonathan Thomas
Dear Investor:
To learn more about the capital markets, your investment, and the portfolio management strategies American Century Investments provides, we encourage you to review this shareholder report for the financial reporting period ended October 31, 2010.
On the following pages, you will find investment performance and portfolio information, presented with the expert perspective and commentary of our portfolio management team. This report remains one of our most important vehicles for conveying the information you need about your investment performance, and about the market factors and strategies that affect fund returns. For additional information on the markets, we encourage you to visit the “Insights & News” tab at our Web site, americancentury.com, for updates and further expert commentary.
The top of our Web site’s home page also provides a link to “Our Story,” which, first and foremost, outlines our commitment—since 1958—to helping clients reach their financial goals. We believe strongly that we will only be successful when our clients are successful. That’s who we are.
Another important, unique facet of our story and who we are is “Profits with a Purpose,” which describes our bond with the Stowers Institute for Medical Research (SIMR). SIMR is a world-class biomedical organization—founded by our company founder James E. Stowers, Jr. and his wife Virginia—that is dedicated to researching the causes, treatment, and prevention of gene-based diseases, including cancer. Through American Century Investments’ private ownership structure, more than 40% of our profits support SIMR.
Mr. Stowers’ example of achieving financial success and using that platform to help humanity motivates our entire American Century Investments team. His story inspires us to help each of our clients achieve success. Thank you for sharing your financial journey with us.
Sincerely,
Jonathan Thomas
President and Chief Executive Officer
American Century Investments
Independent Chairman’s Letter
Don Pratt
Dear Fellow Shareholders,
As regulators and the markets continue to sort out the events of the credit crisis, a consistent theme has been that financial services firms should re-examine their risk management practices. Risk management has been a regular part of American Century Investments’ activities for many years. However, recently American Century and your mutual fund board have been spending additional time focusing on our risk oversight processes.
The board’s efforts are now organized around three categories of risk: investment risk, operational risk, and enterprise risk. This approach has facilitated a realignment of many risk oversight tasks that the board has historically conducted. Investment risk tasks include a review of portfolio risk, monitoring the use of derivatives, and performance assessment. Operational risk focuses on compliance, valuation, shareholder services, and trading activities. Enterprise risk addresses the financial condition of the advisor, human resource development, and reputational risks. Risk oversight tasks are addressed in every quarterly board meeting, and a review of the advisor’s entire risk management program is undertaken annually. We acknowledge and support the approach that American Century Investments takes to its risk management responsibilities. While the board has refocused its efforts in this important oversight area, we recognize that risk oversight is a journey and we expect to continue to improve our processes.
Our September quarterly board meeting was held in the New York offices of American Century Investments. This gave the directors an opportunity to meet with the portfolio management teams for each of the global and international funds overseen by the board. Each team uses sophisticated investment tools and daily risk analysis in managing client assets. We also were impressed with the “bench strength” that has been developed under the leadership of the Global and Non-U.S. Equity CIO Mark Kopinski. These face-to-face meetings provide an opportunity for the directors—working on behalf of shareholders—to validate the advisor’s efforts and the investment management approach being followed.
I thank you for your continued confidence in American Century during this turbulent time in the economy and investment markets. If you have thoughts or questions you would like to share with the board send them to me at dhpratt@fundboardchair.com.
Best regards,
Don Pratt
By David Hollond, Chief Investment Officer,
U.S. Growth Equity—Mid & Small Cap
Stocks Rallied Amid Growing Volatility
U.S. stocks advanced for the 12 months ended October 31, 2010, as the broad equity indices posted double-digit gains. Virtually all of the market’s gains occurred in the first six months of the period, when stocks continued to climb after reaching a multi-year low in March 2009. The key factors behind the rally included favorable economic data, which provided evidence of a burgeoning recovery, and better-than-expected corporate earnings, which resulted largely from cost-cutting measures by many businesses to widen profit margins.
Market conditions changed abruptly in late April as evidence of a pullback in economic activity led to concerns about a relapse into recession. These concerns were amplified by a sovereign debt crisis in Greece that began to spread across Europe. In response, the equity market declined sharply throughout May and June as market volatility increased substantially.
The equity market remained volatile in the third quarter, gaining ground in July and falling back in August amid a tug-of-war between positive corporate earnings reports and an increasingly sluggish economic environment. However, stocks staged a resurgence during the final two months of the period as investors expressed confidence in the Federal Reserve’s plan to revive the economic recovery via another round of quantitative easing.
Small- and Mid-Cap Growth Stocks Outperformed
While stocks advanced across the board, the 12-month period was especially favorable for mid- and small-cap growth stocks. The small- and mid-cap segments of the market led the overall advance, returning more than 25% (see the table below). Smaller companies suffered the largest losses during the downturn in late 2008 and early 2009 and thus far have enjoyed the highest returns during the market’s recovery.
In addition, growth-oriented issues outpaced value shares across all market capitalizations. The best-performing sectors in the market were those traditionally associated with growth, such as information technology and consumer discretionary. In addition, the financials sector—a major component in value indices—underperformed during the period.
| U.S. Stock Index Returns |
| For the 12 months ended October 31, 2010 |
| Russell 1000 Index (Large-Cap) | 17.67% | | Russell 2000 Index (Small-Cap) | 26.58% |
| Russell 1000 Growth Index | 19.65% | | Russell 2000 Growth Index | 28.67% |
| Russell 1000 Value Index | 15.71% | | Russell 2000 Value Index | 24.43% |
| Russell Midcap Index | 27.71% | | |
| Russell Midcap Growth Index | 28.03% | | | |
| Russell Midcap Value Index | 27.49% | | | |
Veedot
| Total Returns as of October 31, 2010 |
| | | | Average Annual Returns | |
| | Ticker Symbol | 1 year | 5 years | 10 years | Since Inception | Inception Date |
| Investor Class | AMVIX | 20.66% | 0.40% | -0.41% | 1.18% | 11/30/99 |
| Russell 3000 Index | — | 18.34% | 2.08% | 0.62% | 1.17% | — |
| Institutional Class | AVDIX | 20.97% | 0.58% | -0.21% | -0.53% | 8/1/00 |
| Growth of $10,000 Over 10 Years |
| $10,000 investment made October 31, 2000 |
| Total Annual Fund Operating Expenses |
| Investor Class | Institutional Class |
| 1.25% | 1.05% |
The total annual fund operating expenses shown is as stated in the fund’s prospectus current as of the date of this report. The prospectus may vary from the expense ratio shown elsewhere in this report because it is based on a different time period, includes acquired fund fees and expenses, and, if applicable, does not include fee waivers or expense reimbursements.
Data presented reflect past performance. Past performance is no guarantee of future results. Current performance may be higher or lower than the performance shown. Investment return and principal value will fluctuate, and redemption value may be more or less than original cost. To obtain performance data current to the most recent month end, please call 1-800-345-2021 or visit americancentury.com. The fund’s investment process may involve high portfolio turnover, high commission costs and high capital gains distributions. In addition, its investment approach may involve higher volatility and risk. International investing involves special risks, such as political instability and currency fluctuations. Investing in emerging markets m ay accentuate these risks.
Unless otherwise indicated, performance reflects Investor Class shares; performance for other share classes will vary due to differences in fee structure. For information about other share classes available, please consult the prospectus. Data assumes reinvestment of dividends and capital gains, and none of the charts reflect the deduction of taxes that a shareholder would pay on fund distributions or the redemption of fund shares. Returns for the index are provided for comparison. The fund’s total returns include operating expenses (such as transaction costs and management fees) that reduce returns, while the total returns of the index do not.
Veedot
Portfolio Managers: John Small, Jr. and Stephen Pool
Performance Summary
Veedot returned 20.66%* for the 12 months ended October 31, 2010, outperforming its benchmark, the Russell 3000 Index, which returned 18.34% for the period.
As discussed in the Market Perspective on page 4, U.S. stock indices gained during the reporting period amid signs of stabilizing economic conditions and improving corporate earnings. Price momentum, a factor that the Veedot team looks for in portfolio holdings, began to demonstrate favorable performance during the reporting period. In this environment, Veedot’s highly systematic investment process delivered portfolio returns that surpassed those of its benchmark.
Within the portfolio, stock selection in the information technology, materials, and health care sectors accounted for the bulk of outperformance relative to Veedot’s benchmark. Those gains were partially offset by relative losses in the industrials and consumer discretionary sectors.
Information Technology Led Gains
Veedot derived the vast majority of its relative gains from the information technology sector. Within the semiconductor industry group, an overweight position in Entropic Communications, Inc. contributed significantly to absolute and relative returns. The maker of home networking chipsets benefited from increased demand for home networking and direct broadcast satellite solutions. Veedot also derived substantial gains from an overweight stake in internet security software and technology company VirnetX Holding. The company received a $200 million settlement in a licensing dispute with Microsoft Corp.
In the computers and peripherals industry, Veedot held a meaningful overweight position in Isilon Systems, which designs and markets clustered storage systems for storing and managing file-based data. The company’s share price gained as it delivered earnings that were nearly double analysts’ expectations, amid a growing customer base.
In the electronic equipment industry, Veedot held a stake in Keithley Instruments, which is not a benchmark member. The maker of electronic instruments and systems entered into an agreement to be acquired by Danaher Corporation during the reporting period, benefiting its share price substantially. Elsewhere in the information technology sector, holdings in the communications equipment industry group added to returns.
Materials, Health Care Contributed
The materials sector was a source of absolute and relative portfolio gains. Here, an overweight stake in the metals and mining group drove relative outperformance in the sector. Within this industry group, Veedot held overweight positions in several companies that benefited from improved pricing as global economies improved. Stock decisions in the paper and forest products industry also added to absolute and relative returns.
*All fund returns referenced in this commentary are for Investor Class shares.
The health care sector also contributed to relative outperformance for Veedot. In the sector, the portfolio held an overweight stake in hospice care provider Odyssey HealthCare, which was acquired by Gentiva Health Services during the reporting period. Managed care provider Healthspring also helped absolute and relative performance. The company delivered earnings that exceeded analysts’ forecasts, and raised guidance for future earnings, as membership grew. Also in the health care sector, stock decisions in the biotechnology industry benefited absolute and relative gains.
Industrials, Consumer Discretionary Detracted, but Some Holdings Helped
Holdings in the industrials sector weighed on relative returns. In the commercial services and supplies industry, Rino International, which operates as an environmental protection and remediation company in the People’s Republic of China, experienced a share price decline. Stock choices in the aerospace and defense industry and the machinery industry also curbed relative gains.
The consumer discretionary sector as a whole also detracted from relative performance, although the sector contributed solidly to absolute returns and some holdings within the sector added meaningfully to gains. In the specialty retail industry, Veedot held an overweight position in clothing retailer Aeropostale. This position detracted from absolute and relative performance, as the company experienced a slump in same-store sales during the reporting period. Within the auto components industry, though, an overweight stake in automotive supplier TRW Automotive Holdings Corp. helped absolute and relative returns. The company reported a sound profit, reversing a loss in the previous year largely through cost cutting.
Outlook
Using a systematic and technically driven process, Veedot focuses on finding companies whose fundamental characteristics meet strict requirements for accelerating earnings and revenue growth. Such companies must also have historical stock price performance that suggests impending share price appreciation.
During the reporting period, the environment for momentum-oriented investment styles remained difficult, but showed signs of improvement. Despite these headwinds, the Veedot portfolio delivered solid results and outperformed its benchmark. Looking ahead, we remain confident that our systematic process of identifying companies with accelerating growth and price momentum will continue to successfully identify opportunities across industry sectors.
Veedot
| Top Ten Holdings |
| | % of net assets as of 10/31/10 |
| TRW Automotive Holdings Corp. | 2.5% |
| VirnetX Holding Corp. | 2.1% |
| Isilon Systems, Inc. | 1.9% |
| Healthspring, Inc. | 1.9% |
| Aruba Networks, Inc. | 1.8% |
| Fossil, Inc. | 1.8% |
| Clearwater Paper Corp. | 1.6% |
| MIPS Technologies, Inc. | 1.6% |
| Riverbed Technology, Inc. | 1.4% |
| AXT, Inc. | 1.3% |
| | |
| Top Five Industries |
| | % of net assets as of 10/31/10 |
| Oil, Gas & Consumable Fuels | 6.7% |
| Semiconductors & Semiconductor Equipment | 6.1% |
| Insurance | 6.1% |
| Health Care Providers & Services | 5.2% |
| Machinery | 5.2% |
| | |
| Types of Investments in Portfolio |
| | % of net assets as of 10/31/10 |
| Domestic Common Stocks | 84.1% |
| Foreign Common Stocks* | 11.5% |
| Total Common Stocks | 95.6% |
| Temporary Cash Investments | 2.8% |
| Other Assets and Liabilities | 1.6% |
* Includes depositary shares, dual listed securities and foreign ordinary shares.
Shareholder Fee Example (Unaudited)
Fund shareholders may incur two types of costs: (1) transaction costs, including sales charges (loads) on purchase payments and redemption/exchange fees; and (2) ongoing costs, including management fees; distribution and service (12b-1) fees; and other fund expenses. This example is intended to help you understand your ongoing costs (in dollars) of investing in your fund and to compare these costs with the ongoing cost of investing in other mutual funds.
The example is based on an investment of $1,000 made at the beginning of the period and held for the entire period from May 1, 2010 to October 31, 2010.
Actual Expenses
The table provides information about actual account values and actual expenses for each class. You may use the information, together with the amount you invested, to estimate the expenses that you paid over the period. First, identify the share class you own. Then simply divide your account value by $1,000 (for example, an $8,600 account value divided by $1,000 = 8.6), then multiply the result by the number under the heading “Expenses Paid During Period” to estimate the expenses you paid on your account during this period.
If you hold Investor Class shares of any American Century Investments fund, or Institutional Class shares of the American Century Diversified Bond Fund, in an American Century Investments account (i.e., not a financial intermediary or retirement plan account), American Century Investments may charge you a $12.50 semiannual account maintenance fee if the value of those shares is less than $10,000. We will redeem shares automatically in one of your accounts to pay the $12.50 fee. In determining your total eligible investment amount, we will include your investments in all personal accounts (including American Century Investments Brokerage accounts) regis tered under your Social Security number. Personal accounts include individual accounts, joint accounts, UGMA/UTMA accounts, personal trusts, Coverdell Education Savings Accounts and IRAs (including traditional, Roth, Rollover, SEP-, SARSEP- and SIMPLE-IRAs), and certain other retirement accounts. If you have only business, business retirement, employer-sponsored or American Century Investments Brokerage accounts, you are currently not subject to this fee. We will not charge the fee as long as you choose to manage your accounts exclusively online. If you are subject to the Account Maintenance Fee, your account value could be reduced by the fee amount.
Hypothetical Example for Comparison Purposes
The table also provides information about hypothetical account values and hypothetical expenses based on the actual expense ratio of each class of your fund and an assumed rate of return of 5% per year before expenses, which is not the actual return of a fund’s share class. The hypothetical account values and expenses may not be used to estimate the actual ending account balance or expenses you paid for the period. You may use this information to compare the ongoing costs of investing in your fund and other funds. To do so, compare this 5% hypothetical example with the 5% hypothetical examples that appear in the shareholder reports of the other funds.
Please note that the expenses shown in the table are meant to highlight your ongoing costs only and do not reflect any transactional costs, such as sales charges (loads) or redemption/exchange fees. Therefore, the table is useful in comparing ongoing costs only, and will not help you determine the relative total costs of owning different funds. In addition, if these transactional costs were included, your costs would have been higher.
| | | | | |
| | Beginning Account Value 5/1/10 | Ending Account Value 10/31/10 | Expenses Paid During Period* 5/1/10 – 10/31/10 | Annualized Expense Ratio* |
| Actual |
| Investor Class | $1,000 | $986.10 | $6.31 | 1.26% |
| Institutional Class | $1,000 | $986.30 | $5.31 | 1.06% |
| Hypothetical |
| Investor Class | $1,000 | $1,018.85 | $6.41 | 1.26% |
| Institutional Class | $1,000 | $1,019.86 | $5.40 | 1.06% |
*Expenses are equal to the class’s annualized expense ratio listed in the table above, multiplied by the average account value over the period, multiplied by 184, the number of days in the most recent fiscal half-year, divided by 365, to reflect the one-half year period.
Schedule of Investments
Veedot
| | | |
| | Shares | Value |
| Common Stocks — 95.6% |
| AEROSPACE & DEFENSE — 1.0% |
Esterline Technologies Corp.(1) | 14,000 | $ 846,160 |
| AIR FREIGHT & LOGISTICS — 0.9% |
| United Parcel Service, Inc., Class B | 11,000 | 740,740 |
| AIRLINES — 2.2% |
Hawaiian Holdings, Inc.(1) | 109,500 | 801,540 |
Republic Airways Holdings, Inc.(1) | 104,500 | 970,805 |
| | | 1,772,345 |
| AUTO COMPONENTS — 3.5% |
BorgWarner, Inc.(1) | 15,500 | 869,705 |
TRW Automotive Holdings Corp.(1) | 44,000 | 2,010,360 |
| | | 2,880,065 |
| BEVERAGES — 2.0% |
Boston Beer Co., Inc., Class A(1) | 11,000 | 787,490 |
Hansen Natural Corp.(1) | 15,500 | 793,755 |
| | | 1,581,245 |
| BIOTECHNOLOGY — 1.2% |
Incyte Corp. Ltd.(1) | 58,500 | 974,610 |
| CAPITAL MARKETS — 2.0% |
| Ameriprise Financial, Inc. | 15,500 | 801,195 |
| TICC Capital Corp. | 78,500 | 811,690 |
| | | 1,612,885 |
| CHEMICALS — 2.3% |
Braskem SA Preference Shares ADR(1) | 44,500 | 927,825 |
PolyOne Corp.(1) | 73,000 | 943,160 |
| | | 1,870,985 |
| COMMUNICATIONS EQUIPMENT — 4.4% |
Aruba Networks, Inc.(1) | 67,500 | 1,478,925 |
F5 Networks, Inc.(1) | 8,000 | 941,600 |
Riverbed Technology, Inc.(1) | 19,500 | 1,122,030 |
| | | 3,542,555 |
| COMPUTERS & PERIPHERALS — 1.9% |
Isilon Systems, Inc.(1) | 55,000 | 1,565,850 |
| CONSUMER FINANCE — 3.0% |
Credit Acceptance Corp.(1) | 12,500 | 735,125 |
First Cash Financial Services, Inc.(1) | 30,500 | 886,635 |
| Nelnet, Inc., Class A | 35,000 | 786,450 |
| | | 2,408,210 |
| DISTRIBUTORS — 1.0% |
| Genuine Parts Co. | 16,500 | 789,690 |
| DIVERSIFIED TELECOMMUNICATION SERVICES — 3.1% |
| AT&T, Inc. | 29,000 | 826,500 |
| Qwest Communications International, Inc. | 136,500 | 900,900 |
| Telecomunicacoes de Sao Paulo SA ADR | 33,000 | 808,500 |
| | | 2,535,900 |
| ELECTRIC UTILITIES — 1.0% |
| IDACORP, Inc. | 22,000 | 809,600 |
| ENERGY EQUIPMENT & SERVICES — 1.2% |
Complete Production Services, Inc.(1) | 40,500 | 948,915 |
| FOOD & STAPLES RETAILING — 3.1% |
| PriceSmart, Inc. | 32,000 | 938,560 |
| Ruddick Corp. | 23,000 | 802,700 |
| Walgreen Co. | 24,000 | 813,120 |
| | | 2,554,380 |
| HEALTH CARE PROVIDERS & SERVICES — 5.2% |
Healthspring, Inc.(1) | 53,000 | 1,547,070 |
Humana, Inc.(1) | 17,000 | 990,930 |
MWI Veterinary Supply, Inc.(1) | 14,500 | 829,400 |
| Universal American Corp. | 55,000 | 884,400 |
| | | 4,251,800 |
| HOTELS, RESTAURANTS & LEISURE — 2.9% |
Domino’s Pizza, Inc.(1) | 54,500 | 808,780 |
Panera Bread Co., Class A(1) | 9,500 | 850,345 |
| PF Chang’s China Bistro, Inc. | 16,000 | 734,720 |
| | | 2,393,845 |
| HOUSEHOLD DURABLES — 1.0% |
Tempur-Pedic International, Inc.(1) | 23,000 | 793,500 |
| HOUSEHOLD PRODUCTS — 1.1% |
Energizer Holdings, Inc.(1) | 12,000 | 897,360 |
| INDUSTRIAL CONGLOMERATES — 1.1% |
| Seaboard Corp. | 500 | 927,025 |
| INSURANCE — 6.1% |
| Aflac, Inc. | 14,500 | 810,405 |
| Allied World Assurance Co. Holdings Ltd. | 14,500 | 829,545 |
| American Financial Group, Inc. | 25,500 | 779,790 |
CNA Financial Corp.(1) | 30,000 | 831,600 |
| Infinity Property & Casualty Corp. | 16,000 | 828,000 |
| Torchmark Corp. | 15,000 | 859,200 |
| | | 4,938,540 |
| INTERNET SOFTWARE & SERVICES — 1.0% |
IAC/InterActiveCorp(1) | 28,500 | 795,150 |
| MACHINERY — 5.2% |
| Actuant Corp., Class A | 39,000 | $ 876,330 |
ArvinMeritor, Inc.(1) | 52,500 | 870,450 |
| Cummins, Inc. | 9,000 | 792,900 |
| Deere & Co. | 11,000 | 844,800 |
| Dover Corp. | 15,500 | 823,050 |
| | | 4,207,530 |
| MEDIA — 2.2% |
Focus Media Holding Ltd. ADR(1) | 37,500 | 928,125 |
Sinclair Broadcast Group, Inc., Class A(1) | 111,500 | 890,885 |
| | | 1,819,010 |
| METALS & MINING — 1.9% |
| Newmont Mining Corp. | 12,000 | 730,440 |
| Rio Tinto plc ADR | 13,000 | 846,560 |
| | | 1,577,000 |
| MULTILINE RETAIL — 1.0% |
Dollar Tree, Inc.(1) | 16,500 | 846,615 |
| MULTI-UTILITIES — 2.8% |
| Alliant Energy Corp. | 22,000 | 803,660 |
| Ameren Corp. | 27,500 | 796,950 |
| Dominion Resources, Inc. | 16,000 | 695,360 |
| | | 2,295,970 |
| OIL, GAS & CONSUMABLE FUELS — 6.7% |
| Alliance Resource Partners, LP | 17,000 | 1,000,280 |
| BP Prudhoe Bay Royalty Trust | 7,500 | 771,075 |
| Genesis Energy, LP | 40,000 | 1,015,600 |
| Penn Virginia GP Holdings, LP | 34,000 | 853,740 |
| Pioneer Southwest Energy Partners, LP | 30,000 | 868,800 |
| Ultrapar Participacoes SA ADR | 15,500 | 961,775 |
| | | 5,471,270 |
| PAPER & FOREST PRODUCTS — 2.9% |
Clearwater Paper Corp.(1) | 16,500 | 1,332,375 |
| Domtar Corp. | 12,500 | 992,000 |
| | | 2,324,375 |
| PERSONAL PRODUCTS — 1.0% |
| Herbalife Ltd. | 12,500 | 798,250 |
| PHARMACEUTICALS — 1.5% |
| AstraZeneca plc ADR | 13,500 | 681,210 |
| Warner Chilcott plc, Class A | 22,500 | 540,900 |
| | | 1,222,110 |
| PROFESSIONAL SERVICES — 1.1% |
IHS, Inc., Class A(1) | 12,500 | 903,000 |
| REAL ESTATE INVESTMENT TRUSTS (REITs) — 1.0% |
| Apartment Investment & Management Co., Class A | 35,500 | 827,505 |
| SEMICONDUCTORS & SEMICONDUCTOR EQUIPMENT — 6.1% |
Amkor Technology, Inc.(1) | 118,000 | 850,780 |
AXT, Inc.(1) | 131,500 | 1,084,875 |
GT Solar International, Inc.(1) | 86,000 | 707,780 |
MIPS Technologies, Inc.(1) | 86,500 | 1,271,550 |
Spreadtrum Communication, Inc. ADR(1) | 73,000 | 1,040,250 |
| | | 4,955,235 |
| SOFTWARE — 4.2% |
Informatica Corp.(1) | 21,500 | 874,835 |
MICROS Systems, Inc.(1) | 19,000 | 862,410 |
| VirnetX Holding Corp. | 91,500 | 1,697,325 |
| | | 3,434,570 |
| SPECIALTY RETAIL — 2.2% |
| PetSmart, Inc. | 22,000 | 823,460 |
| Tractor Supply Co. | 24,000 | 950,400 |
| | | 1,773,860 |
| TEXTILES, APPAREL & LUXURY GOODS — 3.6% |
Crocs, Inc.(1) | 55,500 | 773,115 |
Fossil, Inc.(1) | 24,500 | 1,445,255 |
Maidenform Brands, Inc.(1) | 26,500 | 709,140 |
| | | 2,927,510 |
TOTAL COMMON STOCKS (Cost $64,233,501) | 77,815,165 |
| Temporary Cash Investments — 2.8% |
| JPMorgan U.S. Treasury Plus Money Market Fund Agency Shares | 99,242 | 99,242 |
Repurchase Agreement, Credit Suisse First Boston, Inc., (collateralized by various U.S. Treasury obligations, 1.00%, 3/31/12, valued at $2,243,994), in a joint trading account at 0.16%, dated 10/29/10, due 11/1/10 (Delivery value $2,200,029) | 2,200,000 |
TOTAL TEMPORARY CASH INVESTMENTS (Cost $2,299,242) | 2,299,242 |
TOTAL INVESTMENT SECURITIES — 98.4% (Cost $66,532,743) | 80,114,407 |
| OTHER ASSETS AND LIABILITIES — 1.6% | 1,307,655 |
| TOTAL NET ASSETS — 100.0% | $81,422,062 |
| Geographic Diversification |
| (as a % of net assets) |
| United States | 84.1% |
| Brazil | 3.3% |
| People’s Republic of China | 2.4% |
| United Kingdom | 1.9% |
| Canada | 1.2% |
| Bermuda | 1.0% |
| Cayman Islands | 1.0% |
| Ireland | 0.7% |
| Cash and Equivalents* | 4.4% |
*Includes temporary cash investments and other assets and liabilities.
Notes to Schedule of Investments
ADR = American Depositary Receipt
See Notes to Financial Statements.
Statement of Assets and Liabilities
| OCTOBER 31, 2010 |
| Assets |
| Investment securities, at value (cost of $66,532,743) | $80,114,407 |
| Receivable for investments sold | 1,429,976 |
| Receivable for capital shares sold | 4,717 |
| Dividends and interest receivable | 45,562 |
| | 81,594,662 |
| | |
| Liabilities | |
| Payable for capital shares redeemed | 87,698 |
| Accrued management fees | 84,902 |
| | 172,600 |
| | |
| Net Assets | $81,422,062 |
| | |
| Net Assets Consist of: | |
| Capital (par value and paid-in surplus) | $118,443,219 |
| Accumulated net realized loss | (50,602,821) |
| Net unrealized appreciation | 13,581,664 |
| | $ 81,422,062 |
| | | | |
| | Net assets | Shares outstanding | Net asset value per share |
| Investor Class, $0.01 Par Value | $78,441,049 | 13,815,219 | $5.68 |
| Institutional Class, $0.01 Par Value | $2,981,013 | 515,520 | $5.78 |
See Notes to Financial Statements.
| YEAR ENDED OCTOBER 31, 2010 |
| Investment Income (Loss) |
| Income: | |
| Dividends | $ 977,004 |
| Interest | 1,942 |
| | 978,946 |
| Expenses: | |
| Management fees | 1,012,749 |
| Directors’ fees and expenses | 2,478 |
| Other expenses | 2,793 |
| | 1,018,020 |
| | |
| Net investment income (loss) | (39,074) |
| | |
| Realized and Unrealized Gain (Loss) | |
| Net realized gain (loss) on investment transactions | 8,472,692 |
| Change in net unrealized appreciation (depreciation) on investments | 6,795,479 |
| Net realized and unrealized gain (loss) | 15,268,171 |
| | |
| Net Increase (Decrease) in Net Assets Resulting from Operations | $15,229,097 |
See Notes to Financial Statements.
Statement of Changes in Net Assets
| YEARS ENDED OCTOBER 31, 2010 AND OCTOBER 31, 2009 |
| Increase (Decrease) in Net Assets | 2010 | 2009 |
| Operations |
| Net investment income (loss) | $ (39,074) | $ (21,889) |
| Net realized gain (loss) | 8,472,692 | (22,607,756) |
| Change in net unrealized appreciation (depreciation) | 6,795,479 | 9,998,811 |
| Net increase (decrease) in net assets resulting from operations | 15,229,097 | (12,630,834) |
| | | |
| Distributions to Shareholders | | |
| From net investment income: | | |
| Investor Class | (48,886) | — |
| Institutional Class | (8,309) | — |
| Decrease in net assets from distributions | (57,195) | — |
| | | |
| Capital Share Transactions | | |
| Net increase (decrease) in net assets from capital share transactions | (12,443,945) | (12,542,096) |
| | | |
| Redemption Fees | | |
| Increase in net assets from redemption fees | 2,579 | 9,356 |
| | | |
| Net increase (decrease) in net assets | 2,730,536 | (25,163,574) |
| | | |
| Net Assets | | |
| Beginning of period | 78,691,526 | 103,855,100 |
| End of period | $ 81,422,062 | $ 78,691,526 |
| | | |
| Undistributed net investment income | — | $55,118 |
See Notes to Financial Statements.
Notes to Financial Statements
OCTOBER 31, 2010
1. Organization
American Century Mutual Funds, Inc. (the corporation) is registered under the Investment Company Act of 1940 (the 1940 Act) as an open-end management investment company and is organized as a Maryland corporation. Veedot Fund (the fund) is one fund in a series issued by the corporation. The fund is nondiversified as defined under the 1940 Act. The fund’s investment objective is to seek long-term capital growth. The fund pursues its objective by investing primarily in common stocks that management believes to have better than average prospects for appreciation. The fund uses an approach to common stock investing developed by American Century Investments. This approach relies heavily on quantitative tools to identify attractive investment opportunities, regardless of company size, industry type or geographic location , on a disciplined, consistent basis. The fund is authorized to issue the Investor Class and the Institutional Class. The share classes differ principally in their respective distribution and shareholder servicing expenses and arrangements. The Institutional Class is made available to institutional shareholders or through financial intermediaries whose clients do not require the same level of shareholder and administrative services as shareholders of other classes. As a result, the Institutional Class is charged a lower unified management fee.
2. Significant Accounting Policies
The following is a summary of significant accounting policies consistently followed by the fund in preparation of its financial statements. The financial statements are prepared in conformity with accounting principles generally accepted in the United States of America, which may require management to make certain estimates and assumptions at the date of the financial statements. Actual results could differ from these estimates.
Investment Valuations — The fund determines the fair value of its investments and computes its net asset value per share as of the close of regular trading (usually 4 p.m. Eastern time) on the New York Stock Exchange (NYSE) on each day the NYSE is open.
Equity securities that are listed or traded on a domestic securities exchange are valued at the last reported sales price or at the official closing price as provided by the exchange. Equity securities traded on foreign securities exchanges are typically valued at the closing price on the exchange where primarily traded or as of the close of the NYSE, if that is earlier. If no last sales price is reported, or if local convention or regulation so provides, the mean of the latest bid and asked prices is used. Depending on local convention or regulation, securities traded over-the-counter are valued at the mean of the latest bid and asked prices, the last sales price, or the official closing price. In its determination of fair value, the fund may review several factors including: market information specific to a security; news developments in U.S. and foreign markets; the performance of particular U.S. and foreign securities, indices, comparable securities, American Depositary Receipts, Exchange Traded Funds, and other relevant market indicators.
Debt securities maturing within 60 days at the time of purchase may be valued at cost, plus or minus any amortized discount or premium or at the evaluated mean as provided by an independent pricing service. Evaluated mean prices are commonly derived through utilization of market models, which may consider, among other factors, trade data, quotations from dealers and active market makers, relevant yield curve and spread data, related sector levels, creditworthiness, and other relevant market information on the same or comparable securities.
Investments in open-end management investment companies are valued at the reported net asset value per share. Repurchase agreements are valued at cost.
The value of investments initially expressed in foreign currencies is translated into U.S. dollars at prevailing exchange rates.
If the fund determines that the market price for a portfolio security is not readily available or the valuation methods mentioned above do not reflect a security’s fair value, such security is valued as determined in good faith by the Board of Directors or its designee, in accordance with procedures adopted by the Board of Directors. Circumstances that may cause the fund to use these procedures to value a security include, but are not limited to: a security has been declared in default; trading in a security has been halted during the trading day; there is a foreign market holiday and no trading occurred; or an event occurred between the close of a foreign exchange and the NYSE that may affect the value of a security.
Security Transactions — Security transactions are accounted for as of the trade date. Net realized gains and losses are determined on the identified cost basis, which is also used
for federal income tax purposes.
Investment Income — Dividend income less foreign taxes withheld, if any, is recorded as of the ex-dividend date. Interest income is recorded on the accrual basis and includes accretion of discounts and amortization of premiums.
Repurchase Agreements — The fund may enter into repurchase agreements with institutions that American Century Investment Management, Inc. (ACIM) (the investment advisor) has determined are creditworthy pursuant to criteria adopted by the Board of Directors. The fund requires that the collateral, represented by securities, received in a repurchase transaction be transferred to the custodian in a manner sufficient to enable the fund to obtain those securities in the event of a default under the repurchase agreement. ACIM monitors, on a daily basis, the securities transferred to ensure the value, including accrued interest, of the securities under each repurchase agreement is equal to or greater than amounts owed to the fund under each repurchase agreement.
Joint Trading Account — Pursuant to an Exemptive Order issued by the Securities and Exchange Commission, the fund, along with certain other funds in the American Century Investments family of funds, may transfer uninvested cash balances into a joint trading account. These balances are invested in one or more repurchase agreements that are collateralized by U.S. Treasury or Agency obligations.
Income Tax Status — It is the fund’s policy to distribute substantially all net investment income and net realized gains to shareholders and to otherwise qualify as a regulated investment company under provisions of the Internal Revenue Code. The fund is no longer subject to examination by tax authorities for years prior to 2007. At this time, management believes there are no uncertain tax positions which, based on their technical merit, would not be sustained upon examination and for which it is reasonably possible that the total amounts of unrecognized tax benefits will significantly change in the next twelve months. Accordingly, no provision has been made for federal or state income taxes.
Multiple Class — All shares of the fund represent an equal pro rata interest in the net assets of the class to which such shares belong, and have identical voting, dividend, liquidation and other rights and the same terms and conditions, except for class specific expenses and exclusive rights to vote on matters affecting only individual classes. Income, non-class specific expenses, and realized and unrealized capital gains and losses of the fund are allocated to each class of shares based on their relative net assets.
Distributions to Shareholders — Distributions to shareholders are recorded on the ex-dividend date. Distributions from net investment income and net realized gains, if any, are generally declared and paid annually.
Redemption — The fund may impose a 2.00% redemption fee on shares held less than 180 days. The fee may not be applicable to all classes. The redemption fee is retained by the fund and helps cover transaction costs that long-term investors may bear when the fund sells securities to meet investor redemptions.
Indemnifications — Under the corporation’s organizational documents, its officers and directors are indemnified against certain liabilities arising out of the performance of their duties to the fund. In addition, in the normal course of business, the fund enters into contracts that provide general indemnifications. The maximum exposure under these arrangements is unknown as this would involve future claims that may be made against a fund. The risk of material loss from such claims is considered by management to be remote.
3. Fees and Transactions with Related Parties
Management Fees — The corporation has entered into a management agreement with ACIM, under which ACIM provides the fund with investment advisory and management services in exchange for a single, unified management fee (the fee) per class. The agreement provides that all expenses of managing and operating the fund, except distribution and service fees, brokerage expenses, taxes, interest, fees and expenses of the independent directors (including legal counsel fees), and extraordinary expenses, will be paid by ACIM. The fee is computed and accrued daily based on each class’s daily net assets and paid monthly in arrears. The rate of the fee is determined by applying a fee rate calculation formula. This formula takes into account the fund’s assets as well as certain a ssets, if any, of other clients of the investment advisor outside the American Century Investments family of funds (such as subadvised funds and separate accounts) that have very similar investment teams and investment strategies (strategy assets). The annual management fee schedule ranges from 1.000% to 1.250% for the Investor Class. The Institutional Class is 0.200% less at each point within the range. The effective annual management fee for each class for the year ended October 31, 2010 was 1.25% and 1.05% for the Investor Class and Institutional Class, respectively.
Related Parties — Certain officers and directors of the corporation are also officers and/or directors of American Century Companies, Inc. (ACC), the parent of the corporation’s investment advisor, ACIM, the distributor of the corporation, American Century Investment Services, Inc., and the corporation’s transfer agent, American Century Services, LLC.
The fund is eligible to invest in a money market fund for temporary purposes, which is managed by J.P. Morgan Investment Management, Inc. (JPMIM). The fund has a mutual funds services agreement with J.P. Morgan Investor Services Co. (JPMIS). JPMorgan Chase Bank (JPMCB) is a custodian of the fund. JPMIM, JPMIS and JPMCB are wholly owned subsidiaries of JPMorgan Chase & Co. (JPM). JPM is an equity investor in ACC.
4. Investment Transactions
Purchases and sales of investment securities, excluding short-term investments, for the year ended October 31, 2010, were $201,344,854 and $211,774,376, respectively.
5. Capital Share Transactions
Transactions in shares of the fund were as follows:
| | | |
| | Year ended October 31, 2010 | Year ended October 31, 2009 |
| | Shares | Amount | Shares | Amount |
| Investor Class/Shares Authorized | 200,000,000 | | 200,000,000 | |
| Sold | 394,054 | $ 2,119,491 | 588,168 | $ 2,708,394 |
| Issued in reinvestment of distributions | 8,820 | 47,717 | — | — |
| Redeemed | (2,645,725) | (13,942,170) | (3,060,477) | (14,058,883) |
| | (2,242,851) | (11,774,962) | (2,472,309) | (11,350,489) |
| Institutional Class/Shares Authorized | 100,000,000 | | 100,000,000 | |
| Sold | 24,836 | 134,114 | 59,551 | 280,976 |
| Issued in reinvestment of distributions | 1,511 | 8,309 | — | — |
| Redeemed | (155,132) | (811,406) | (311,173) | (1,472,583) |
| | (128,785) | (668,983) | (251,622) | (1,191,607) |
| Net increase (decrease) | (2,371,636) | $(12,443,945) | (2,723,931) | $(12,542,096) |
6. Fair Value Measurements
The fund’s securities valuation process is based on several considerations and may use multiple inputs to determine the fair value of the positions held by the fund. In conformity with accounting principles generally accepted in the United States of America, the inputs used to determine a valuation are classified into three broad levels as follows:
| • | Level 1 valuation inputs consist of unadjusted quoted prices in an active market for identical securities; |
| • | Level 2 valuation inputs consist of direct or indirect observable market data (including quoted prices for similar securities, evaluations of subsequent market events, interest rates, prepayment speeds, credit risk, etc.); or |
| • | Level 3 valuation inputs consist of unobservable data (including a fund’s own assumptions). |
The level classification is based on the lowest level input that is significant to the fair valuation measurement. The valuation inputs are not necessarily an indication of the risks associated with investing in these securities or other financial instruments.
The following is a summary of the level classifications as of period end. The Schedule of Investments provides additional information on the fund’s portfolio holdings.
| | | | |
| | Level 1 | Level 2 | Level 3 |
| Investment Securities | | | |
| Domestic Common Stocks | $68,460,225 | — | — |
| Foreign Common Stocks | 9,354,940 | — | — |
| Temporary Cash Investments | 99,242 | $2,200,000 | — |
| Total Value of Investment Securities | $77,914,407 | $2,200,000 | — |
7. Risk Factors
The fund’s investment process may involve high portfolio turnover, high commission costs and high capital gains distributions. In addition, its investment approach may involve higher volatility and risk.
There are certain risks involved in investing in foreign securities. These risks include those resulting from future adverse political, social, and economic developments, fluctuations in currency exchange rates, the possible imposition of exchange controls, and other foreign laws or restrictions. Investing in emerging markets may accentuate these risks.
8. Federal Tax Information
On December 14, 2010, the fund declared and paid the following per-share distributions from net investment income to shareholders of record on December 13, 2010:
| | |
| Investor | Institutional |
| $0.0071 | $0.0193 |
The tax character of distributions paid during the years ended October 31, 2010 and October 31, 2009 were as follows:
| | | |
| | 2010 | 2009 |
| Distributions Paid From | | |
| Ordinary income | $57,195 | — |
| Long-term capital gains | — | — |
The book-basis character of distributions made during the year from net investment income or net realized gains may differ from their ultimate characterization for federal income tax purposes. These differences reflect the differing character of certain income items and net realized gains and losses for financial statement and tax purposes, and may result in reclassification among certain capital accounts on the financial statements.
As of October 31, 2010, the federal tax cost of investments and the components of distributable earnings on a tax-basis were as follows:
| | |
| Federal tax cost of investments | $66,474,352 |
| Gross tax appreciation of investments | $13,849,274 |
| Gross tax depreciation of investments | (209,219) |
| Net tax appreciation (depreciation) of investments | $13,640,055 |
| Accumulated capital losses | $(50,661,212) |
The difference between book-basis and tax-basis cost and unrealized appreciation (depreciation) is attributable primarily to nontaxable dividends received and the tax deferral of losses on wash sales.
The accumulated capital losses represent net capital loss carryovers that may be used to offset future realized capital gains for federal income tax purposes. Future capital loss carryover utilization in any given year may be subject to Internal Revenue Code limitations. Capital loss carryovers of $(27,976,449) and $(22,684,763) expire in 2016 and 2017, respectively.
9. Corporate Event
As part of a long-standing estate and business succession plan established by James E. Stowers, Jr., the founder of American Century Investments, ACC Chairman Richard W. Brown succeeded Mr. Stowers as trustee of a trust that holds a greater-than-25% voting interest in ACC, the parent corporation of the fund’s advisor. Under the 1940 Act, this is presumed to represent control of ACC even though it is less than a majority interest. The change of trustee was considered a change of control of ACC and therefore also a change of control of the fund’s advisor even though there has been no change to its management and none is anticipated. The change of control resulted in the assignment of the fund’s investment advisory agreement. As required by the 1940 Act, the assignment automatically terminated such agreem ent, making the approval of a new agreement necessary.
On February 18, 2010, the Board of Directors approved an interim investment advisory agreement under which the fund was managed until a new agreement was approved. The new agreement for the fund was approved by the Board of Directors on March 29, 2010, and by shareholders at a Special Meeting of Shareholders on June 16, 2010. It went into effect on July 16, 2010. The new agreement, which is substantially identical to the terminated agreement (with the exception of different effective and termination dates), did not result in changes in the management of American Century Investments, the fund, its investment objectives, fees or services provided.
10. Other Tax Information (Unaudited)
The following information is provided pursuant to provisions of the Internal Revenue Code.
The fund hereby designates up to the maximum amount allowable as qualified dividend income for the fiscal year ended October 31, 2010.
For corporate taxpayers, the fund hereby designates $57,195, or up to the maximum amount allowable, of ordinary income distributions paid during the fiscal year ended October 31, 2010 as qualified for the corporate dividends received deduction.
Veedot
| Investor Class |
| For a Share Outstanding Throughout the Years Ended October 31 |
| | 2010 | 2009 | 2008 | 2007 | 2006 |
| Per-Share Data |
| Net Asset Value, Beginning of Period | $4.71 | $5.34 | $9.25 | $6.17 | $5.57 |
| Income From Investment Operations | | | | | |
Net Investment Income (Loss)(1) | —(2) | —(2) | (0.02) | (0.01) | (0.02) |
| Net Realized and Unrealized Gain (Loss) | 0.97 | (0.63) | (3.89) | 3.09 | 0.62 |
| Total From Investment Operations | 0.97 | (0.63) | (3.91) | 3.08 | 0.60 |
| Distributions | | | | | |
| From Net Investment Income | —(2) | — | — | — | — |
| Net Asset Value, End of Period | $5.68 | $4.71 | $5.34 | $9.25 | $6.17 |
| | | | | | |
Total Return(3) | 20.66% | (11.80)% | (42.27)% | 49.92% | 10.77% |
| | | | | | |
| Ratios/Supplemental Data |
Ratio of Operating Expenses to Average Net Assets | 1.26% | 1.25% | 1.25% | 1.25% | 1.45% |
Ratio of Net Investment Income (Loss) to Average Net Assets | (0.06)% | (0.03)% | (0.27)% | (0.18)% | (0.39)% |
| Portfolio Turnover Rate | 260% | 320% | 257% | 207% | 330% |
| Net Assets, End of Period (in thousands) | $78,441 | $75,603 | $98,991 | $195,105 | $154,374 |
| (1) | Computed using average shares outstanding throughout the period. |
| (2) | Per-share amount was less than $0.005. |
| (3) | Total returns are calculated based on the net asset value of the last business day. Total returns for periods less than one year are not annualized. |
See Notes to Financial Statements.
Veedot
| Institutional Class |
| For a Share Outstanding Throughout the Years Ended October 31 |
| | 2010 | 2009 | 2008 | 2007 | 2006 |
| Per-Share Data |
| Net Asset Value, Beginning of Period | $4.79 | $5.43 | $9.38 | $6.25 | $5.63 |
| Income From Investment Operations | | | | | |
Net Investment Income (Loss)(1) | 0.01 | 0.01 | (0.01) | —(2) | (0.01) |
| Net Realized and Unrealized Gain (Loss) | 0.99 | (0.65) | (3.94) | 3.13 | 0.63 |
| Total From Investment Operations | 1.00 | (0.64) | (3.95) | 3.13 | 0.62 |
| Distributions | | | | | |
| From Net Investment Income | (0.01) | — | — | — | — |
| Net Asset Value, End of Period | $5.78 | $4.79 | $5.43 | $9.38 | $6.25 |
| | | | | | |
Total Return(3) | 20.97% | (11.79)% | (42.11)% | 50.08% | 11.01% |
| | | | | | |
| Ratios/Supplemental Data |
Ratio of Operating Expenses to Average Net Assets | 1.06% | 1.05% | 1.05% | 1.05% | 1.25% |
Ratio of Net Investment Income (Loss) to Average Net Assets | 0.14% | 0.17% | (0.07)% | 0.02% | (0.19)% |
| Portfolio Turnover Rate | 260% | 320% | 257% | 207% | 330% |
| Net Assets, End of Period (in thousands) | $2,981 | $3,089 | $4,864 | $9,188 | $11,237 |
| (1) | Computed using average shares outstanding throughout the period. |
| (2) | Per-share amount was less than $0.005. |
| (3) | Total returns are calculated based on the net asset value of the last business day. Total returns for periods less than one year are not annualized. |
See Notes to Financial Statements.
Report of Independent Registered Public Accounting Firm
The Board of Directors and Shareholders,
American Century Mutual Funds, Inc.:
We have audited the accompanying statement of assets and liabilities, including the schedule of investments, of Veedot Fund, one of the funds constituting American Century Mutual Funds, Inc. (the “Corporation”), as of October 31, 2010, and the related statement of operations for the year then ended, the statements of changes in net assets for each of the two years in the period then ended, and the financial highlights for each of the five years in the period then ended. These financial statements and financial highlights are the responsibility of the Corporation’s management. Our responsibility is to express an opinion on these financial statements and financial highlights based on our audits.
We conducted our audits in accordance with the standards of the Public Company Accounting Oversight Board (United States). Those standards require that we plan and perform the audit to obtain reasonable assurance about whether the financial statements and financial highlights are free of material misstatement. The Corporation is not required to have, nor were we engaged to perform, an audit of its internal control over financial reporting. Our audits included consideration of internal control over financial reporting as a basis for designing audit procedures that are appropriate in the circumstances, but not for the purpose of expressing an opinion on the effectiveness of the Corporation’s internal control over financial reporting . Accordingly, we express no such opinion. An audit also includes examining, on a test basis, evidence supporting the amounts and disclosures in the financial statements, assessing the accounting principles used and significant estimates made by management, as well as evaluating the overall financial statement presentation. Our procedures included confirmation of securities owned as of October 31, 2010, by correspondence with the custodian and brokers; where replies were not received from brokers, we performed other auditing procedures. We believe that our audits provide a reasonable basis for our opinion.
In our opinion, the financial statements and financial highlights referred to above present fairly, in all material respects, the financial position of Veedot Fund of American Century Mutual Funds, Inc., as of October 31, 2010, the results of its operations for the year then ended, the changes in its net assets for each of the two years in the period then ended, and the financial highlights for each of the five years in the period then ended, in conformity with accounting principles generally accepted in the United States of America.
Deloitte & Touche LLP
Kansas City, Missouri
December 20, 2010
A special meeting of shareholders was held on June 16, 2010, to vote on the following proposals. Each proposal received the required number of votes and was adopted. A summary of voting results is listed below each proposal.
Proposal 1:
To elect one Director to the Board of Directors of American Century Mutual Funds, Inc. (the proposal was voted on by all shareholders of funds issued by American Century Mutual Funds, Inc.):
| | | | | |
| | John R. Whitten | For: | 13,907,426,552 | |
| | | Withhold: | 629,801,798 | |
| | | Abstain: | 0 | |
| | | Broker Non-Vote: | 0 | |
The other directors whose term of office continued after the meeting include Jonathan S. Thomas, Thomas A. Brown, Andrea C. Hall, James A. Olson, Donald H. Pratt, and M. Jeannine Strandjord.
Proposal 2:
To approve a management agreement between the fund and American Century Investment Management, Inc.:
| | | | | |
| | Investor Class | For: | 62,026,457 | |
| | | Against: | 873,508 | |
| | | Abstain: | 1,489,315 | |
| | | Broker Non-Vote: | 1,250,750 | |
| | | | | |
| | Institutional Class | For: | 3,265,942 | |
| | | Against: | 0 | |
| | | Abstain: | 0 | |
| | | Broker Non-Vote: | 0 | |
Proposal 3:
To approve an amendment to the Articles of Incorporation to limit certain director liability to the extent permitted by Maryland law (the proposal was voted on by all shareholders of funds issued by American Century Mutual Funds, Inc.):
| | | | | |
| | | For: | 12,112,932,038 | |
| | | Against: | 769,504,652 | |
| | | Abstain: | 420,034,445 | |
| | | Broker Non-Vote: | 1,234,757,216 | |
The Board of Directors
The individuals listed below serve as directors of the fund. Each director will continue to serve in this capacity until death, retirement, resignation or removal from office. The mandatory retirement age for directors who are not “interested persons,” as that term is defined in the Investment Company Act (independent directors), is 72. However, the mandatory retirement age for an individual director may be extended with the approval of the remaining independent directors.
Mr. Thomas is the only director who is an “interested person” because he currently serves as President and Chief Executive Officer of American Century Companies, Inc. (ACC), the parent company of American Century Investment Management, Inc. (ACIM or the advisor).
The other directors (more than three-fourths of the total number) are independent; that is, they have never been employees, directors or officers of, and have no financial interest in, ACC or any of its wholly owned, direct or indirect, subsidiaries, including ACIM, American Century Investment Services, Inc. (ACIS) and American Century Services, LLC (ACS). The directors serve in this capacity for seven (in the case of Mr. Thomas, 15) registered investment companies in the American Century Investments family of funds.
The following presents additional information about the directors. The mailing address for each director is 4500 Main Street, Kansas City, Missouri 64111.
Independent Directors
Thomas A. Brown
Year of Birth: 1940
Position(s) with the Fund: Director
Length of Time Served: Since 1980
Principal Occupation(s) During the Past Five Years: Managing Member, Associated Investments, LLC (real estate investment company); Brown Cascade Properties, LLC (real estate investment company) (2001 to 2009)
Number of Funds in Fund Complex Overseen by Director: 61
Other Directorships Held by Director During the Past Five Years: None
Education/Other Professional Experience: BS in Mechanical Engineering, University of Kansas; formerly, Chief Executive Officer, Associated Bearings Company; formerly, Area Vice President, Applied Industrial Technologies (bearings and power transmission company)
Andrea C. Hall
Year of Birth: 1945
Position(s) with the Fund: Director
Length of Time Served: Since 1997
Principal Occupation(s) During the Past Five Years: Retired as advisor to the President, Midwest Research Institute (not-for-profit research organization) (June 2006)
Number of Funds in Fund Complex Overseen by Director: 61
Other Directorships Held by Director During the Past Five Years: None
Education/Other Professional Experience: BS in Biology, Florida State University; PhD in Biology, Georgetown University; formerly, Senior Vice President and Director of Research Operations, Midwest Research Institute
James A. Olson
Year of Birth: 1942
Position(s) with the Fund: Director
Length of Time Served: Since 2007
Principal Occupation(s) During the Past Five Years: Member, Plaza Belmont LLC (private equity fund manager); Chief Financial Officer, Plaza Belmont LLC (September 1999 to September 2006)
Number of Funds in Fund Complex Overseen by Director: 61
Other Directorships Held by Director During the Past Five Years: Saia, Inc. and Entertainment Properties Trust
Education/Other Professional Experience: BS in Business Administration and MBA, St. Louis University; CPA; 21 years of experience as a partner in the accounting firm of Ernst & Young LLP
Donald H. Pratt
Year of Birth: 1937
Position(s) with the Fund: Director, Chairman of the Board
Length of Time Served: Since 1995 (Chairman since 2005)
Principal Occupation(s) During the Past Five Years: Chairman and Chief Executive Officer, Western Investments, Inc. (real estate company)
Number of Funds in Fund Complex Overseen by Director: 61
Other Directorships Held by Director During the Past Five Years: None
Education/Other Professional Experience: BS in Industrial Engineering, Wichita State University; MBA, Harvard Business School; serves on the Board of Governors of the Independent Directors Council and Investment Company Institute; formerly, Chairman of the Board, Butler Manufacturing Company (metal buildings producer)
M. Jeannine Strandjord
Year of Birth: 1945
Position(s) with the Fund: Director
Length of Time Served: Since 1994
Principal Occupation(s) During the Past Five Years: Retired, formerly, Senior Vice President, Process Excellence, Sprint Corporation (telecommunications company) (January 2005 to September 2005)
Number of Funds in Fund Complex Overseen by Director: 61
Other Directorships Held by Director During the Past Five Years: DST Systems Inc., Euronet Worldwide Inc., Charming Shoppes, Inc.
Education/Other Professional Experience: BS in Business Administration and Accounting, University of Kansas; CPA; formerly, Senior Vice President of Financial Services and Treasurer and Chief Financial Officer, Global Markets Group; Sprint Corporation; formerly, with the accounting firm of Ernst and Whinney
John R. Whitten
Year of Birth: 1946
Position(s) with the Fund: Director
Length of Time Served: Since 2008
Principal Occupation(s) During the Past Five Years: Project Consultant, Celanese Corp. (industrial chemical company)
Number of Funds in Fund Complex Overseen by Director: 61
Other Directorships Held by Director During the Past Five Years: Rudolph Technologies, Inc.
Professional Education/Experience: BS in Business Administration, Cleveland State University; CPA; formerly, Chief Financial Officer and Treasurer, Applied Industrial Technologies, Inc.; thirteen years of experience with accounting firm Deloitte & Touche LLP
Interested Director
Jonathan S. Thomas
Year of Birth: 1963
Position(s) with the Fund: Director and President
Length of Time Served: Since 2007
Principal Occupation(s) During the Past Five Years: President and Chief Executive Officer, ACC (March 2007 to present); Chief Administrative Officer, ACC (February 2006 to February 2007); Executive Vice President, ACC (November 2005 to February 2007). Also serves as: Chief Executive Officer and Manager, ACS; Executive Vice President, ACIM; Director, ACC, ACIM and other ACC subsidiaries
Number of Funds in Fund Complex Overseen by Director: 101
Other Directorships Held by Director During the Past Five Years: None
Education/Other Professional Experience: BA in Economics, University of Massachusetts; MBA, Boston College; formerly held senior leadership roles with Fidelity Investments, Boston Financial Services, Bank of America and Morgan Stanley; serves on the Board of Governors of the Investment Company Institute
Officers
The following table presents certain information about the executive officers of the fund. Each officer serves as an officer for each of the 15 investment companies in the American Century family of funds, unless otherwise noted. No officer is compensated for his or her service as an officer of the fund. The listed officers are interested persons of the fund and are appointed or re-appointed on an annual basis. The mailing address for each of the officers listed below is 4500 Main Street, Kansas City, Missouri 64111.
| | | | |
| | Name (Year of Birth) | Offices with the Fund | Principal Occupation(s) During the Past Five Years |
| | Jonathan S. Thomas (1963) | Director and President since 2007 | President and Chief Executive Officer, ACC (March 2007 to present); Chief Administrative Officer, ACC (February 2006 to February 2007); Executive Vice President, ACC (November 2005 to February 2007). Also serves as: Chief Executive Officer and Manager, ACS; Executive Vice President, ACIM; Director, ACC, ACIM and other ACC subsidiaries |
| | Barry Fink (1955) | Executive Vice President since 2007 | Chief Operating Officer and Executive Vice President, ACC (September 2007 to present); President, ACS (October 2007 to present); Managing Director, Morgan Stanley (2000 to 2007); Global General Counsel, Morgan Stanley (2000 to 2006). Also serves as: Manager, ACS and Director, ACC and certain ACC subsidiaries |
| | Maryanne L. Roepke (1956) | Chief Compliance Officer since 2006 and Senior Vice President since 2000 | Chief Compliance Officer, American Century funds, ACIM and ACS (August 2006 to present); Assistant Treasurer, ACC (January 1995 to August 2006); and Treasurer and Chief Financial Officer, various American Century funds (July 2000 to August 2006). Also serves as: Senior Vice President, ACS |
| | Charles A. Etherington (1957) | General Counsel since 2007 and Senior Vice President since 2006 | Attorney, ACC (February 1994 to present); Vice President, ACC (November 2005 to present), General Counsel, ACC (March 2007 to present); Also serves as General Counsel, ACIM, ACS, ACIS and other ACC subsidiaries; and Senior Vice President, ACIM and ACS |
| | Robert J. Leach (1966) | Vice President, Treasurer and Chief Financial Officer since 2006 | Vice President, ACS (February 2000 to present); and Controller, various American Century funds (1997 to September 2006) |
| | David H. Reinmiller (1963) | Vice President since 2000 | Attorney, ACC (January 1994 to present); Associate General Counsel, ACC (January 2001 to present); Chief Compliance Officer, American Century funds and ACIM (January 2001 to February 2005). Also serves as Vice President, ACIM and ACS |
| | Ward D. Stauffer (1960) | Secretary since 2005 | Attorney, ACC (June 2003 to present) |
The Statement of Additional Information has additional information about the fund’s directors and is available without charge, upon request, by calling 1-800-345-2021.
Retirement Account Information
As required by law, distributions you receive from certain IRAs, or 403(b), 457 and qualified plans are subject to federal income tax withholding, unless you elect not to have withholding apply. Tax will be withheld on the total amount withdrawn even though you may be receiving amounts that are not subject to withholding, such as nondeductible contributions. In such case, excess amounts of withholding could occur. You may adjust your withholding election so that a greater or lesser amount will be withheld.
If you don’t want us to withhold on this amount, you must notify us to not withhold the federal income tax. You may notify us in writing or in certain situations by telephone or through other electronic means. You have the right to revoke your withholding election at any time and any election you make may remain in effect until revoked by filing a new election.
Remember, even if you elect not to have income tax withheld, you are liable for paying income tax on the taxable portion of your withdrawal. If you elect not to have income tax withheld or you don’t have enough income tax withheld, you may be responsible for payment of estimated tax. You may incur penalties under the estimated tax rules if your withholding and estimated tax payments are not sufficient. You can reduce or defer the income tax on a distribution by directly or indirectly rolling such distribution over to another IRA or eligible plan. You should consult your tax advisor for additional information.
State tax will be withheld if, at the time of your distribution, your address is within one of the mandatory withholding states and you have federal income tax withheld. State taxes will be withheld from your distribution in accordance with the respective state rules.
Proxy Voting Guidelines
American Century Investment Management, Inc., the fund’s investment advisor, is responsible for exercising the voting rights associated with the securities purchased and/or held by the fund. A description of the policies and procedures the advisor uses in fulfilling this responsibility is available without charge, upon request, by calling 1-800-345-2021. It is also available on American Century Investments’ website at americancentury.com and on the Securities and Exchange Commission’s website at sec.gov. Information regarding how the investment advisor voted proxies relating to portfolio securities during the most recent 12-month period ended June 30 is available on the “About Us” page at americancentury.com. It is also available at sec.gov.
Quarterly Portfolio Disclosure
The fund files its complete schedule of portfolio holdings with the Securities and Exchange Commission (SEC) for the first and third quarters of each fiscal year on Form N-Q. The fund’s Forms N-Q are available on the SEC’s website at sec.gov, and may be reviewed and copied at the SEC’s Public Reference Room in Washington, DC. Information on the operation of the Public Reference Room may be obtained by calling 1-800-SEC-0330. The fund also makes its complete schedule of portfolio holdings for the most recent quarter of its fiscal year available on its website at americancentury.com and, upon request, by calling 1-800-345-2021.
The following indices are used to illustrate investment market, sector, or style performance or to serve as fund performance comparisons. They are not investment products available for purchase.
The Russell 1000® Index is a market-capitalization weighted, large-cap index created by Frank Russell Company to measure the performance of the 1,000 largest publicly traded U.S. companies, based on total market capitalization.
The Russell 1000® Growth Index measures the performance of those Russell 1000 Index companies (the 1,000 largest publicly traded U.S. companies, based on total market capitalization) with higher price-to-book ratios and higher forecasted growth values.
The Russell 1000® Value Index measures the performance of those Russell 1000 Index companies (the 1,000 largest publicly traded U.S. companies, based on total market capitalization) with lower price-to-book ratios and lower forecasted growth values.
The Russell 2000® Index is a market-capitalization weighted index created by Frank Russell Company to measure the performance of the 2,000 smallest of the 3,000 largest publicly traded U.S. companies, based on total market capitalization.
The Russell 2000® Growth Index measures the performance of those Russell 2000 Index companies (the 2,000 smallest of the 3,000 largest publicly traded U.S. companies, based on total market capitalization) with higher price-to-book ratios and higher forecasted growth values.
The Russell 2000® Value Index measures the performance of those Russell 2000 Index companies (the 2,000 smallest of the 3,000 largest publicly traded U.S. companies, based on total market capitalization) with lower price-to-book ratios and lower forecasted growth values.
The Russell 3000® Index measures the performance of the largest 3,000 U.S. companies representing approximately 98% of the investable U.S. equity market.
The Russell Midcap® Index measures the performance of the 800 smallest of the 1,000 largest publicly traded U.S. companies, based on total market capitalization.
The Russell Midcap® Growth Index measures the performance of those Russell Midcap Index companies (the 800 smallest of the 1,000 largest publicly traded U.S. companies, based on total market capitalization) with higher price-to-book ratios and higher forecasted growth values.
The Russell Midcap® Value Index measures the performance of those Russell Midcap Index companies (the 800 smallest of the 1,000 largest publicly traded U.S. companies, based on total market capitalization) with lower price-to-book ratios and lower forecasted growth values.
Notes
| |
| | |
| Contact Us | |
| | |
| americancentury.com | |
| | |
| Automated Information Line | 1-800-345-8765 |
| | |
| Investor Services Representative | 1-800-345-2021 or 816-531-5575 |
| | |
| Investors Using Advisors | 1-800-378-9878 |
| | |
| Business, Not-For-Profit, Employer-Sponsored Retirement Plans | 1-800-345-3533 |
| | |
| Banks and Trust Companies, Broker-Dealers, Financial Professionals, Insurance Companies | 1-800-345-6488 |
| | |
| Telecommunications Device for the Deaf | 1-800-634-4113 |
| | |
| American Century Mutual Funds, Inc. |
| |
Investment Advisor: American Century Investment Management, Inc. Kansas City, Missouri |
| |
| This report and the statements it contains are submitted for the general information of our shareholders. The report is not authorized for distribution to prospective investors unless preceded or accompanied by an effective prospectus. |