UNITED STATES
SECURITIES AND EXCHANGE COMMISSION
Washington, D.C. 20549
FORM N-CSR
CERTIFIED SHAREHOLDER REPORT OF REGISTERED
MANAGEMENT INVESTMENT COMPANIES
|
| | | | | | |
| Investment Company Act file number | 811-00816 |
| | |
| AMERICAN CENTURY MUTUAL FUNDS, INC. |
| (Exact name of registrant as specified in charter) |
| | |
| 4500 MAIN STREET, KANSAS CITY, MISSOURI | 64111 |
| (Address of principal executive offices) | (Zip Code) |
| | |
CHARLES A. ETHERINGTON 4500 MAIN STREET, KANSAS CITY, MISSOURI 64111 |
| (Name and address of agent for service) |
| | |
| Registrant’s telephone number, including area code: | 816-531-5575 |
| | |
| Date of fiscal year end: | 10-31 |
| | |
| Date of reporting period: | 10-31-2019 |
ITEM 1. REPORTS TO STOCKHOLDERS.
|
| |
| | |
| | Annual Report |
| | |
| | October 31, 2019 |
| | |
| | Adaptive Equity Fund |
| | Investor Class (AMVIX) |
| | I Class (AVDIX) |
| | A Class (AVDAX) |
| | R Class (AVDRX) |
| | R6 Class (AVDMX) |
Beginning on January 1, 2021, as permitted by regulations adopted by the Securities and Exchange Commission, paper copies of the fund’s shareholder reports like this one will no longer be sent by mail, unless you specifically request paper copies of the reports from the fund or from your financial intermediary, such as a broker-dealer or bank. Instead, the reports will be made available on a website, and you will be notified by mail each time a report is posted and provided with a website link to access the report.
If you already elected to receive shareholder reports electronically, you will not be affected by this change and you need not take any action. You may elect to receive shareholder reports and other communications from the fund or your financial intermediary electronically by calling or sending an email request to your appropriate contacts as listed on the back cover of this report.
You may elect to receive all future reports in paper free of charge. You can inform the fund or your financial intermediary that you wish to continue receiving paper copies of your shareholder reports by calling or sending an email request to your appropriate contacts as listed on the back cover of this report. Your election to receive reports in paper will apply to all funds held with the fund complex/your financial intermediary.
|
| | |
| President’s Letter | 2 |
|
| Performance | 3 |
|
| Portfolio Commentary | |
|
| Fund Characteristics | |
|
| Shareholder Fee Example | |
|
| Schedule of Investments | |
|
| Statement of Assets and Liabilities | |
|
| Statement of Operations | |
|
| Statement of Changes in Net Assets | |
|
| Notes to Financial Statements | |
|
| Financial Highlights | |
|
| Report of Independent Registered Public Accounting Firm | |
|
| Management | |
|
| Approval of Management Agreement | |
|
| Additional Information | |
|
Any opinions expressed in this report reflect those of the author as of the date of the report, and do not necessarily represent the opinions of American Century Investments® or any other person in the American Century Investments organization. Any such opinions are subject to change at any time based upon market or other conditions and American Century Investments disclaims any responsibility to update such opinions. These opinions may not be relied upon as investment advice and, because investment decisions made by American Century Investments funds are based on numerous factors, may not be relied upon as an indication of trading intent on behalf of any American Century Investments fund. Security examples are used for representational purposes only and are not intended as recommendations to purchase or sell securities. Performance information for comparative indices and securities is provided to American Century Investments by third party vendors. To the best of American Century Investments’ knowledge, such information is accurate at the time of printing.
 Jonathan Thomas
Dear Investor:
Thank you for reviewing this annual report for the 12 months ended October 31, 2019. Annual reports help convey important information about fund returns, including market factors that affected performance. For additional investment and market insights, please visit americancentury.com.
Stocks, Bonds Delivered Solid Gains
U.S. and global stocks, bonds and real estate investments generally delivered strong gains for the 12-month period. Stocks and other riskier assets rebounded from a late-2018 sell-off to post robust returns for the 12 months overall. Global bonds benefited from safe-haven buying early in the period and a declining interest rate environment overall.
Fed’s Policy Pivot Improved Investor Sentiment
In the final months of 2018, mounting concerns about slowing global economic and earnings growth, tariffs and Federal Reserve (Fed) policy soured investor sentiment, driving global stocks lower. After raising rates in September 2018, the Fed hiked again in December and delivered a surprisingly bullish 2019 rate-hike outlook, which intensified the sell-off among stocks and other riskier assets. Meanwhile, the risk-off climate sparked a flight to quality, which drove U.S. and other government bond yields lower and benefited global bond returns.
A key policy pivot from the Fed helped improve equity investor sentiment beginning in early 2019. The central bank abruptly ended its rate-hike campaign and adopted a dovish tone amid weaker global growth and inflation. Additionally, investors’ worst-case fears about trade and corporate earnings generally eased, which also aided stocks and other riskier assets. At the same time, government bond yields continued to fall on moderating global growth data, muted inflation and accommodative central bank policy in the U.S., Europe and Japan. By July, concerns about global economic risks prompted the Fed to cut short-term interest rates for the first time in 10 years. The Fed followed up with additional rate cuts in September and October. This backdrop supported continued gains for fixed-income and other interest rate-sensitive assets.
Looking ahead, we expect volatility to remain a formidable factor as investors react to global growth and trade trends, central bank policy and geopolitical developments. We believe this scenario underscores the importance of using professionally managed portfolios in pursuit of investment goals. We appreciate your continued trust and confidence in us.
Sincerely,
Jonathan Thomas
President and Chief Executive Officer
American Century Investments
|
| | | | | | |
| Total Returns as of October 31, 2019 |
| | | | Average Annual Returns | |
| | Ticker Symbol | 1 year | 5 years | 10 years | Since Inception | Inception Date |
| Investor Class | AMVIX | 3.03% | 8.32% | 12.89% | — | 11/30/99 |
| Russell 1000 Index | — | 14.15% | 10.54% | 13.71% | — | — |
| I Class | AVDIX | 3.19% | 8.54% | 13.13% | — | 8/1/00 |
| A Class | AVDAX | | | | | 12/1/16 |
| No sales charge | | 2.79% | — | — | 9.60% | |
| With sales charge | | (3.10)% | — | — | 7.41% | |
| R Class | AVDRX | 2.59% | — | — | 9.33% | 12/1/16 |
| R6 Class | AVDMX | 3.42% | — | — | 10.26% | 12/1/16 |
Average annual returns since inception are presented when ten years of performance history is not available.
Fund returns would have been lower if a portion of the fees had not been waived.
Sales charges include initial sales charges and contingent deferred sales charges (CDSCs), as applicable. A Class shares have a 5.75% maximum initial sales charge and may be subject to a maximum CDSC of 1.00%. The SEC requires that mutual funds provide performance information net of maximum sales charges in all cases where charges could be applied.
Data presented reflect past performance. Past performance is no guarantee of future results. Current performance may be higher or lower than the performance shown. Total returns for periods less than one year are not annualized. Investment return and principal value will fluctuate, and redemption value may be more or less than original cost. Data assumes reinvestment of dividends and capital gains, and none of the charts reflect the deduction of taxes that a shareholder would pay on fund distributions or the redemption of fund shares. To obtain performance data current to the most recent month end, please call 1-800-345-2021 or visit americancentury.com. For additional information about the fund, please consult the prospectus.
|
|
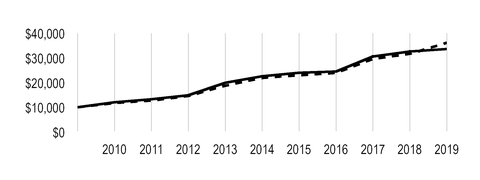
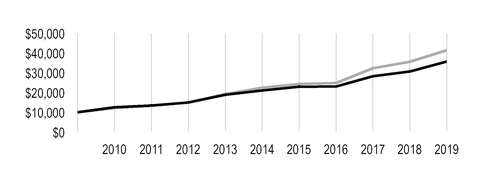
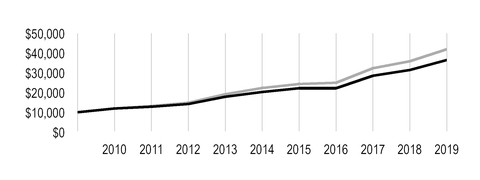
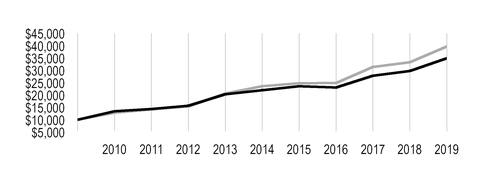
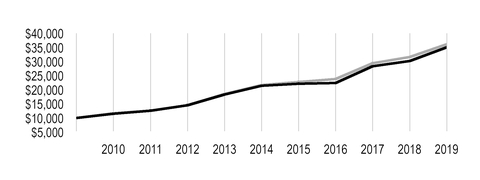
| Growth of $10,000 Over 10 Years |
| $10,000 investment made October 31, 2009 |
| Performance for other share classes will vary due to differences in fee structure. |
|
| |
| Value on October 31, 2019 |
| | Investor Class — $33,652 |
| |
| | Russell 1000 Index — $36,174 |
| |
Ending value of Investor Class would have been lower if a portion of the fees had not been waived.
|
| | | | |
| Total Annual Fund Operating Expenses |
| Investor Class | I Class | A Class | R Class | R6 Class |
| 1.15% | 0.95% | 1.40% | 1.65% | 0.80% |
The total annual fund operating expenses shown is as stated in the fund’s prospectus current as of the date of this report. The prospectus may vary from the expense ratio shown elsewhere in this report because it is based on a different time period, includes acquired fund fees and expenses, and, if applicable, does not include fee waivers or expense reimbursements.
Data presented reflect past performance. Past performance is no guarantee of future results. Current performance may be higher or lower than the performance shown. Total returns for periods less than one year are not annualized. Investment return and principal value will fluctuate, and redemption value may be more or less than original cost. Data assumes reinvestment of dividends and capital gains, and none of the charts reflect the deduction of taxes that a shareholder would pay on fund distributions or the redemption of fund shares. To obtain performance data current to the most recent month end, please call 1-800-345-2021 or visit americancentury.com. For additional information about the fund, please consult the prospectus.
Portfolio Manager: Joe Reiland
Portfolio manager Stephen Pool left American Century Investments in September 2019.
The Board of Directors approved a plan of liquidation for the Adaptive Equity Fund. Under the plan, the liquidation was effective on December 12, 2019. The fund closed to all new investments, except reinvested distributions, as of the close of the New York Stock Exchange on December 2, 2019.
Performance Summary
Adaptive Equity returned 3.03%* for the 12 months ended October 31, 2019, lagging the 14.15% return of the portfolio’s benchmark, the Russell 1000 Index.
U.S. stocks posted solid returns during the reporting period. Growth stocks outperformed value stocks by a wide margin across the capitalization spectrum. Within the Russell 1000 Index, most sectors posted double-digit gains. Energy was the only sector that declined.
In this environment, Adaptive Equity’s highly systematic investment process delivered positive portfolio returns but trailed its benchmark, the Russell 1000 Index. The fund received the best absolute contributions from information technology and industrials stocks, while only our consumer staples and energy holdings generated modest negative contributions. Relative to the Russell benchmark, stock selection in the information technology and consumer staples sectors helped drive underperformance. Positive contributions came from a range of individual holdings.
Information Technology Stocks Detracted
Stock decisions in the software industry were key relative detractors in the information technology sector. VMware and Citrix Systems were significant detractors in the industry, and both holdings were eliminated from the portfolio. Underweighting Microsoft relative to the benchmark hampered performance. The software company continued to execute at a high level. Azure, Microsoft’s cloud offering, grew at a greater-than-expected pace, and the company’s Office 365 subscription service and Windows platform performed well. Our lighter exposure to Apple also detracted. The stock outperformed as the company reported better-than-expected results and introduced new products, which have been greeted with good demand.
Stock selection in the personal products industry hurt performance in the consumer staples sector. We eliminated Herbalife Nutrition, which was a key detractor in the industry. Overweighting tobacco stocks and not owning beverage stocks also hampered relative performance in the sector.
Individual Holdings Benefited Performance
Several top relative contributors came from the information technology sector. From the semiconductors and semiconductor equipment industry, Intel outperformed. IT services stocks The Western Union Co., Booz Allen Hamilton Holding and International Business Machines were solid contributors.
Other significant contributors included consumer finance company OneMain Holdings, industrials firm The Toro Co., media company Charter Communications and health care company IDEXX Laboratories.
*All fund returns referenced in this commentary are for Investor Class shares. Performance for other share classes will vary due to differences in fee structure; when Investor Class performance exceeds that of the fund’s benchmark, other share classes may not. See page 3 for returns for all share classes.
|
| |
| OCTOBER 31, 2019 | |
| Top Ten Holdings | % of net assets |
| Bristol-Myers Squibb Co. | 4.0% |
| Charter Communications, Inc., Class A | 3.7% |
| Toro Co. (The) | 3.6% |
| Intel Corp. | 3.5% |
| IDEXX Laboratories, Inc. | 3.3% |
| OneMain Holdings, Inc. | 3.3% |
| Amazon.com, Inc. | 3.2% |
| ServiceNow, Inc. | 3.2% |
| SPDR S&P 500 ETF Trust | 3.1% |
| Broadcom, Inc. | 3.0% |
| | |
| Top Five Industries | % of net assets |
| Software | 9.0% |
| Pharmaceuticals | 6.6% |
| Semiconductors and Semiconductor Equipment | 6.5% |
| Interactive Media and Services | 5.3% |
| Banks | 4.6% |
| | |
| Types of Investments in Portfolio | % of net assets |
| Common Stocks | 93.9% |
| Exchange-Traded Funds | 3.1% |
| Total Equity Exposure | 97.0% |
| Temporary Cash Investments | 2.8% |
| Other Assets and Liabilities | 0.2% |
Fund shareholders may incur two types of costs: (1) transaction costs, including sales charges (loads) on purchase payments and redemption/exchange fees; and (2) ongoing costs, including management fees; distribution and service (12b-1) fees; and other fund expenses. This example is intended to help you understand your ongoing costs (in dollars) of investing in your fund and to compare these costs with the ongoing cost of investing in other mutual funds.
The example is based on an investment of $1,000 made at the beginning of the period and held for the entire period from May 1, 2019 to October 31, 2019.
Actual Expenses
The table provides information about actual account values and actual expenses for each class. You may use the information, together with the amount you invested, to estimate the expenses that you paid over the period. First, identify the share class you own. Then simply divide your account value by $1,000 (for example, an $8,600 account value divided by $1,000 = 8.6), then multiply the result by the number under the heading “Expenses Paid During Period” to estimate the expenses you paid on your account during this period.
If you hold Investor Class shares of any American Century Investments fund, or I Class shares of the American Century Diversified Bond Fund, in an American Century Investments account (i.e., not a financial intermediary or retirement plan account), American Century Investments may charge you a $12.50 semiannual account maintenance fee if the value of those shares is less than $10,000. We will redeem shares automatically in one of your accounts to pay the $12.50 fee. In determining your total eligible investment amount, we will include your investments in all personal accounts (including American Century Investments Brokerage accounts) registered under your Social Security number. Personal accounts include individual accounts, joint accounts, UGMA/UTMA accounts, personal trusts, Coverdell Education Savings Accounts and IRAs (including traditional, Roth, Rollover, SEP-, SARSEP- and SIMPLE-IRAs), and certain other retirement accounts. If you have only business, business retirement, employer-sponsored or American Century Investments Brokerage accounts, you are currently not subject to this fee. If you are subject to the Account Maintenance Fee, your account value could be reduced by the fee amount.
Hypothetical Example for Comparison Purposes
The table also provides information about hypothetical account values and hypothetical expenses based on the actual expense ratio of each class of your fund and an assumed rate of return of 5% per year before expenses, which is not the actual return of a fund’s share class. The hypothetical account values and expenses may not be used to estimate the actual ending account balance or expenses you paid for the period. You may use this information to compare the ongoing costs of investing in your fund and other funds. To do so, compare this 5% hypothetical example with the 5% hypothetical examples that appear in the shareholder reports of the other funds.
Please note that the expenses shown in the table are meant to highlight your ongoing costs only and do not reflect any transactional costs, such as sales charges (loads) or redemption/exchange fees. Therefore, the table is useful in comparing ongoing costs only, and will not help you determine the relative total costs of owning different funds. In addition, if these transactional costs were included, your costs would have been higher.
|
| | | | |
| Beginning
Account Value
5/1/19 | Ending
Account Value
10/31/19 | Expenses Paid
During Period(1)
5/1/19 - 10/31/19 | Annualized
Expense Ratio(1) |
| Actual | | | | |
| Investor Class | $1,000 | $972.20 | $5.77 | 1.16% |
| I Class | $1,000 | $973.10 | $4.77 | 0.96% |
| A Class | $1,000 | $971.60 | $7.01 | 1.41% |
| R Class | $1,000 | $970.50 | $8.24 | 1.66% |
| R6 Class | $1,000 | $974.40 | $4.03 | 0.81% |
| Hypothetical | | | | |
| Investor Class | $1,000 | $1,019.36 | $5.90 | 1.16% |
| I Class | $1,000 | $1,020.37 | $4.89 | 0.96% |
| A Class | $1,000 | $1,018.10 | $7.17 | 1.41% |
| R Class | $1,000 | $1,016.84 | $8.44 | 1.66% |
| R6 Class | $1,000 | $1,021.12 | $4.13 | 0.81% |
| |
| (1) | Expenses are equal to the class's annualized expense ratio listed in the table above, multiplied by the average account value over the period, multiplied by 184, the number of days in the most recent fiscal half-year, divided by 365, to reflect the one-half year period. Annualized expense ratio reflects actual expenses, including any applicable fee waivers or expense reimbursements and excluding any acquired fund fees and expenses. |
OCTOBER 31, 2019
|
| | | | |
| | Shares | Value |
| COMMON STOCKS — 93.9% | | |
| Aerospace and Defense — 0.9% | | |
| Boeing Co. (The) | 2,169 | $ | 737,265 |
|
Teledyne Technologies, Inc.(1) | 189 | 62,294 |
|
| | | 799,559 |
|
| Banks — 4.6% | | |
| Bank of America Corp. | 24,980 | 781,125 |
|
| First Hawaiian, Inc. | 82,563 | 2,256,447 |
|
| Wells Fargo & Co. | 17,096 | 882,666 |
|
| | | 3,920,238 |
|
| Biotechnology — 2.5% | | |
| AbbVie, Inc. | 25,002 | 1,988,909 |
|
Incyte Corp.(1) | 1,629 | 136,706 |
|
| | | 2,125,615 |
|
| Capital Markets — 2.7% | | |
| Morningstar, Inc. | 13,912 | 2,251,518 |
|
| Chemicals — 1.3% | | |
| Dow, Inc. | 19,398 | 979,405 |
|
| Ecolab, Inc. | 641 | 123,117 |
|
| | | 1,102,522 |
|
| Commercial Services and Supplies — 2.7% | | |
Copart, Inc.(1) | 2,272 | 187,758 |
|
| Rollins, Inc. | 56,225 | 2,142,735 |
|
| | | 2,330,493 |
|
| Consumer Finance — 3.3% | | |
| OneMain Holdings, Inc. | 69,752 | 2,790,080 |
|
| Containers and Packaging — 0.2% | | |
| AptarGroup, Inc. | 1,139 | 134,573 |
|
| Distributors — 2.1% | | |
| Pool Corp. | 8,788 | 1,822,631 |
|
| Diversified Telecommunication Services — 1.5% | | |
| AT&T, Inc. | 26,584 | 1,023,218 |
|
| Verizon Communications, Inc. | 4,222 | 255,305 |
|
| | | 1,278,523 |
|
| Electric Utilities — 1.0% | | |
| Exelon Corp. | 13,951 | 634,631 |
|
| Southern Co. (The) | 3,102 | 194,371 |
|
| | | 829,002 |
|
| Electronic Equipment, Instruments and Components — 0.8% | | |
| CDW Corp. | 1,745 | 223,203 |
|
| Jabil, Inc. | 12,326 | 453,843 |
|
| | | 677,046 |
|
| Equity Real Estate Investment Trusts (REITs) — 2.2% | | |
| SBA Communications Corp. | 2,102 | 505,847 |
|
|
| | | | |
| | Shares | Value |
| Simon Property Group, Inc. | 8,025 | $ | 1,209,207 |
|
| Welltower, Inc. | 1,909 | 173,127 |
|
| | | 1,888,181 |
|
| Food and Staples Retailing — 0.8% | | |
| Costco Wholesale Corp. | 2,195 | 652,156 |
|
| Health Care Equipment and Supplies — 3.6% | | |
DexCom, Inc.(1) | 1,686 | 260,049 |
|
IDEXX Laboratories, Inc.(1) | 9,935 | 2,831,574 |
|
| | | 3,091,623 |
|
| Hotels, Restaurants and Leisure — 2.7% | | |
| Domino's Pizza, Inc. | 8,355 | 2,269,385 |
|
| Household Durables — 2.5% | | |
NVR, Inc.(1) | 594 | 2,160,134 |
|
| Household Products — 2.0% | | |
| Procter & Gamble Co. (The) | 13,772 | 1,714,752 |
|
| Independent Power and Renewable Electricity Producers — 1.2% | |
| AES Corp. | 33,012 | 562,855 |
|
| NRG Energy, Inc. | 10,518 | 421,982 |
|
| | | 984,837 |
|
| Interactive Media and Services — 5.3% | | |
IAC/InterActiveCorp(1) | 10,670 | 2,424,758 |
|
Twitter, Inc.(1) | 68,097 | 2,040,867 |
|
| | | 4,465,625 |
|
| Internet and Direct Marketing Retail — 3.2% | | |
Amazon.com, Inc.(1) | 1,528 | 2,714,736 |
|
| IT Services — 4.3% | | |
| Booz Allen Hamilton Holding Corp. | 3,605 | 253,684 |
|
| International Business Machines Corp. | 1,886 | 252,215 |
|
| MasterCard, Inc., Class A | 745 | 206,223 |
|
PayPal Holdings, Inc.(1) | 7,941 | 826,658 |
|
VeriSign, Inc.(1) | 8,535 | 1,621,821 |
|
| Western Union Co. (The) | 20,974 | 525,608 |
|
| | | 3,686,209 |
|
| Life Sciences Tools and Services — 2.5% | | |
| Agilent Technologies, Inc. | 27,799 | 2,105,774 |
|
| Machinery — 3.6% | | |
| Toro Co. (The) | 39,166 | 3,020,874 |
|
| Media — 4.3% | | |
Charter Communications, Inc., Class A(1) | 6,694 | 3,131,855 |
|
| Comcast Corp., Class A | 12,007 | 538,154 |
|
| | | 3,670,009 |
|
| Oil, Gas and Consumable Fuels — 2.8% | | |
| Exxon Mobil Corp. | 18,419 | 1,244,572 |
|
| ONEOK, Inc. | 12,142 | 847,876 |
|
| Phillips 66 | 2,324 | 271,489 |
|
| | | 2,363,937 |
|
| Pharmaceuticals — 6.6% | | |
| Bristol-Myers Squibb Co. | 59,723 | 3,426,309 |
|
|
| | | | |
| | Shares | Value |
| Merck & Co., Inc. | 24,555 | $ | 2,127,936 |
|
| | | 5,554,245 |
|
| Professional Services — 1.7% | | |
CoStar Group, Inc.(1) | 2,580 | 1,417,762 |
|
| Road and Rail — 0.6% | | |
| Norfolk Southern Corp. | 2,635 | 479,570 |
|
| Semiconductors and Semiconductor Equipment — 6.5% | | |
| Broadcom, Inc. | 8,669 | 2,538,716 |
|
| Intel Corp. | 52,141 | 2,947,531 |
|
| | | 5,486,247 |
|
| Software — 9.0% | | |
Atlassian Corp. plc, Class A(1) | 2,880 | 347,875 |
|
Cadence Design Systems, Inc.(1) | 12,401 | 810,406 |
|
Manhattan Associates, Inc.(1) | 3,494 | 261,875 |
|
| Microsoft Corp. | 16,411 | 2,352,845 |
|
Paylocity Holding Corp.(1) | 11,097 | 1,138,552 |
|
ServiceNow, Inc.(1) | 10,815 | 2,674,117 |
|
| | | 7,585,670 |
|
| Specialty Retail — 1.2% | | |
| Foot Locker, Inc. | 23,536 | 1,024,051 |
|
| Technology Hardware, Storage and Peripherals — 0.9% | | |
| Apple, Inc. | 3,035 | 754,987 |
|
| Tobacco — 2.2% | | |
| Philip Morris International, Inc. | 23,304 | 1,897,878 |
|
| Trading Companies and Distributors — 0.6% | | |
| Air Lease Corp. | 11,933 | 524,813 |
|
TOTAL COMMON STOCKS
(Cost $73,138,335) | | 79,575,255 |
|
| EXCHANGE-TRADED FUNDS — 3.1% | | |
SPDR S&P 500 ETF Trust
(Cost $2,571,616) | 8,601 | 2,608,941 |
|
| TEMPORARY CASH INVESTMENTS — 2.8% | | |
| Repurchase Agreement, BMO Capital Markets Corp., (collateralized by various U.S. Treasury obligations, 1.625% - 2.25%, 3/31/21 - 5/15/26, valued at $1,789,291), in a joint trading account at 1.50%, dated 10/31/19, due 11/1/19 (Delivery value $1,752,093) | | 1,752,020 |
|
| Repurchase Agreement, Fixed Income Clearing Corp., (collateralized by various U.S. Treasury obligations, 1.625%, 9/30/26, valued at $597,277), at 0.65%, dated 10/31/19, due 11/1/19 (Delivery value $584,011) | | 584,000 |
|
| State Street Institutional U.S. Government Money Market Fund, Premier Class | 1,540 | 1,540 |
|
TOTAL TEMPORARY CASH INVESTMENTS
(Cost $2,337,560) | | 2,337,560 |
|
TOTAL INVESTMENT SECURITIES — 99.8%
(Cost $78,047,511) | | 84,521,756 |
|
| OTHER ASSETS AND LIABILITIES — 0.2% | | 205,742 |
|
| TOTAL NET ASSETS — 100.0% | | $ | 84,727,498 |
|
|
| | |
| NOTES TO SCHEDULE OF INVESTMENTS |
See Notes to Financial Statements.
|
|
| Statement of Assets and Liabilities |
|
| | | |
| OCTOBER 31, 2019 | |
| Assets | |
| Investment securities, at value (cost of $78,047,511) | $ | 84,521,756 |
|
| Receivable for investments sold | 209,731 |
|
| Receivable for capital shares sold | 15,896 |
|
| Dividends and interest receivable | 109,226 |
|
| | 84,856,609 |
|
| | |
| Liabilities | |
| Payable for capital shares redeemed | 44,685 |
|
| Accrued management fees | 84,312 |
|
| Distribution and service fees payable | 114 |
|
| | 129,111 |
|
| | |
| Net Assets | $ | 84,727,498 |
|
| | |
| Net Assets Consist of: | |
| Capital (par value and paid-in surplus) | $ | 77,477,278 |
|
| Distributable earnings | 7,250,220 |
|
| | $ | 84,727,498 |
|
|
| | | | |
| | Net Assets | Shares Outstanding | Net Asset Value Per Share |
| Investor Class, $0.01 Par Value | $83,403,279 | 8,500,096 |
| $9.81 |
| I Class, $0.01 Par Value | $809,640 | 79,974 |
| $10.12 |
| A Class, $0.01 Par Value | $32,657 | 3,296 |
| $9.91* |
| R Class, $0.01 Par Value | $256,737 | 26,021 |
| $9.87 |
| R6 Class, $0.01 Par Value | $225,185 | 21,906 |
| $10.28 |
*Maximum offering price $10.51 (net asset value divided by 0.9425).
See Notes to Financial Statements.
|
| | | |
| YEAR ENDED OCTOBER 31, 2019 | |
| Investment Income (Loss) | |
| Income: | |
| Dividends | $ | 2,844,082 |
|
| Interest | 12,288 |
|
| Securities lending, net | 366 |
|
| | 2,856,736 |
|
| | |
| Expenses: | |
| Management fees | 1,141,040 |
|
| Distribution and service fees: | |
| A Class | 80 |
|
| R Class | 1,067 |
|
| Directors' fees and expenses | 3,102 |
|
| Other expenses | 1,542 |
|
| | 1,146,831 |
|
| | |
| Net investment income (loss) | 1,709,905 |
|
| | |
| Realized and Unrealized Gain (Loss) | |
| Net realized gain (loss) on investment transactions | (9,194 | ) |
| Change in net unrealized appreciation (depreciation) on investments | 1,227,658 |
|
| | |
| Net realized and unrealized gain (loss) | 1,218,464 |
|
| | |
| Net Increase (Decrease) in Net Assets Resulting from Operations | $ | 2,928,369 |
|
See Notes to Financial Statements.
|
|
| Statement of Changes in Net Assets |
|
| | | | | | |
| YEARS ENDED OCTOBER 31, 2019 AND OCTOBER 31, 2018 |
| Increase (Decrease) in Net Assets | October 31, 2019 | October 31, 2018 |
| Operations | | |
| Net investment income (loss) | $ | 1,709,905 |
| $ | 1,063,304 |
|
| Net realized gain (loss) | (9,194 | ) | 20,758,677 |
|
| Change in net unrealized appreciation (depreciation) | 1,227,658 |
| (15,098,472 | ) |
| Net increase (decrease) in net assets resulting from operations | 2,928,369 |
| 6,723,509 |
|
| | | |
| Distributions to Shareholders | | |
| From earnings: | | |
| Investor Class | (19,540,217 | ) | (6,939,187 | ) |
| I Class | (1,277,143 | ) | (320,889 | ) |
| A Class | (6,213 | ) | (2,023 | ) |
| R Class | (35,135 | ) | (4,512 | ) |
| R6 Class | (44,855 | ) | (13,157 | ) |
| Decrease in net assets from distributions | (20,903,563 | ) | (7,279,768 | ) |
| | | |
| Capital Share Transactions | | |
| Net increase (decrease) in net assets from capital share transactions (Note 5) | (2,785,921 | ) | 2,600,591 |
|
| | | |
| Net increase (decrease) in net assets | (20,761,115 | ) | 2,044,332 |
|
| | | |
| Net Assets | | |
| Beginning of period | 105,488,613 |
| 103,444,281 |
|
| End of period | $ | 84,727,498 |
| $ | 105,488,613 |
|
See Notes to Financial Statements.
|
|
| Notes to Financial Statements |
OCTOBER 31, 2019
1. Organization
American Century Mutual Funds, Inc. (the corporation) is registered under the Investment Company Act of 1940, as amended (the 1940 Act), as an open-end management investment company and is organized as a Maryland corporation. Adaptive Equity Fund (the fund) is one fund in a series issued by the corporation. The fund's investment objective is to seek long-term capital growth.
The fund offers the Investor Class, I Class, A Class, R Class and R6 Class. The A Class may incur an initial sales charge and may be subject to a contingent deferred sales charge.
2. Significant Accounting Policies
The following is a summary of significant accounting policies consistently followed by the fund in preparation of its financial statements. The fund is an investment company and follows accounting and reporting guidance in accordance with accounting principles generally accepted in the United States of America. This may require management to make certain estimates and assumptions at the date of the financial statements. Actual results could differ from these estimates. Management evaluated the impact of events or transactions occurring through the date the financial statements were issued that would merit recognition or disclosure.
Investment Valuations — The fund determines the fair value of its investments and computes its net asset value per share at the close of regular trading (usually 4 p.m. Eastern time) on the New York Stock Exchange (NYSE) on each day the NYSE is open. The Board of Directors has adopted valuation policies and procedures to guide the investment advisor in the fund’s investment valuation process and to provide methodologies for the oversight of the fund’s pricing function.
Equity securities that are listed or traded on a domestic securities exchange are valued at the last reported sales price or at the official closing price as provided by the exchange. Equity securities traded on foreign securities exchanges are generally valued at the closing price of such securities on the exchange where primarily traded or at the close of the NYSE, if that is earlier. If no last sales price is reported, or if local convention or regulation so provides, the mean of the latest bid and asked prices may be used. Securities traded over-the-counter are valued at the mean of the latest bid and asked prices, the last sales price, or the official closing price.
Open-end management investment companies are valued at the reported net asset value per share. Repurchase agreements are valued at cost, which approximates fair value.
If the fund determines that the market price for an investment is not readily available or the valuation methods mentioned above do not reflect an investment’s fair value, such investment is valued as determined in good faith by the Board of Directors or its delegate, in accordance with policies and procedures adopted by the Board of Directors. In its determination of fair value, the fund may review several factors including, but not limited to, market information regarding the specific investment or comparable investments and correlation with other investment types, futures indices or general market indicators. Circumstances that may cause the fund to use these procedures to value an investment include, but are not limited to: an investment has been declared in default or is distressed; trading in a security has been suspended during the trading day or a security is not actively trading on its principal exchange; prices received from a regular pricing source are deemed unreliable; or there is a foreign market holiday and no trading occurred.
The fund monitors for significant events occurring after the close of an investment’s primary exchange but before the fund’s net asset value per share is determined. Significant events may include, but are not limited to: corporate announcements and transactions; governmental action and political unrest that could impact a specific investment or an investment sector; or armed conflicts, natural disasters and similar events that could affect investments in a specific country or region. The fund also monitors for significant fluctuations between domestic and foreign markets, as evidenced by the U.S. market or such other indicators that the Board of Directors, or its delegate, deems appropriate. The fund may apply a model-derived factor to the closing price of equity securities traded on foreign securities exchanges. The factor is based on observable market data as provided by an independent pricing service.
Security Transactions — Security transactions are accounted for as of the trade date. Net realized gains and losses are determined on the identified cost basis, which is also used for federal income tax purposes.
Investment Income — Dividend income less foreign taxes withheld, if any, is recorded as of the ex-dividend date. Distributions received on securities that represent a return of capital or long-term capital gain are recorded as a reduction of cost of investments and/or as a realized gain. The fund may estimate the components of distributions received that may be considered nontaxable distributions or long-term capital gain distributions for income tax purposes. Interest income is recorded on the accrual basis and includes accretion of discounts and amortization of premiums. Securities lending income is net of fees and rebates earned by the lending agent for its services.
Repurchase Agreements — The fund may enter into repurchase agreements with institutions that American Century Investment Management, Inc. (ACIM) (the investment advisor) has determined are creditworthy pursuant to criteria adopted by the Board of Directors. The fund requires that the collateral, represented by securities, received in a repurchase transaction be transferred to the custodian in a manner sufficient to enable the fund to obtain those securities in the event of a default under the repurchase agreement. ACIM monitors, on a daily basis, the securities transferred to ensure the value, including accrued interest, of the securities under each repurchase agreement is equal to or greater than amounts owed to the fund under each repurchase agreement.
Joint Trading Account — Pursuant to an Exemptive Order issued by the Securities and Exchange Commission, the fund, along with certain other funds in the American Century Investments family of funds, may transfer uninvested cash balances into a joint trading account. These balances are invested in one or more repurchase agreements that are collateralized by U.S. Treasury or Agency obligations.
Segregated Assets — In accordance with the 1940 Act, the fund segregates assets on its books and records to cover certain types of investment securities and other financial instruments. ACIM monitors, on a daily basis, the securities segregated to ensure the fund designates a sufficient amount of liquid assets, marked-to-market daily. The fund may also receive assets or be required to pledge assets at the custodian bank or with a broker for collateral requirements.
Income Tax Status — It is the fund’s policy to distribute substantially all net investment income and net realized gains to shareholders and to otherwise qualify as a regulated investment company under provisions of the Internal Revenue Code. Accordingly, no provision has been made for income taxes. The fund files U.S. federal, state, local and non-U.S. tax returns as applicable. The fund's tax returns are subject to examination by the relevant taxing authority until expiration of the applicable statute of limitations, which is generally three years from the date of filing but can be longer in certain jurisdictions. At this time, management believes there are no uncertain tax positions which, based on their technical merit, would not be sustained upon examination and for which it is reasonably possible that the total amounts of unrecognized tax benefits will significantly change in the next twelve months.
Multiple Class — All shares of the fund represent an equal pro rata interest in the net assets of the class to which such shares belong, and have identical voting, dividend, liquidation and other rights and the same terms and conditions, except for class specific expenses and exclusive rights to vote on matters affecting only individual classes. Income, non-class specific expenses, and realized and unrealized capital gains and losses of the fund are allocated to each class of shares based on their relative net assets.
Distributions to Shareholders — Distributions from net investment income and net realized gains, if any, are generally declared and paid annually. The fund may elect to treat a portion of its payment to a redeeming shareholder, which represents the pro rata share of undistributed net investment income and net realized gains, as a distribution for federal income tax purposes (tax equalization).
Indemnifications — Under the corporation’s organizational documents, its officers and directors are indemnified against certain liabilities arising out of the performance of their duties to the fund. In addition, in the normal course of business, the fund enters into contracts that provide general indemnifications. The maximum exposure under these arrangements is unknown as this would involve future claims that may be made against a fund. The risk of material loss from such claims is considered by management to be remote.
Securities Lending — Securities are lent to qualified financial institutions and brokers. State Street Bank & Trust Co. serves as securities lending agent to the fund pursuant to a Securities Lending Agreement. The lending of securities exposes the fund to risks such as: the borrowers may fail to return the loaned securities, the borrowers may not be able to provide additional collateral, the fund may experience delays in recovery of the loaned securities or delays in access to collateral, or the fund may experience losses related to the investment collateral. To minimize certain risks, loan counterparties pledge collateral in the form of cash and/or securities. The lending agent has agreed to indemnify the fund in the case of default of any securities borrowed. Cash collateral received is invested in the State Street Navigator Securities Lending Government Money Market Portfolio, a money market mutual fund registered under the 1940 Act. The loans may also be secured by U.S. government securities in an amount at least equal to the market value of the securities loaned, plus accrued interest and dividends, determined on a daily basis and adjusted accordingly. By lending securities, the fund seeks to increase its net investment income through the receipt of interest and fees. Such income is reflected separately within the Statement of Operations. The value of loaned securities and related collateral outstanding at period end, if any, are shown on a gross basis within the Schedule of Investments and Statement of Assets and Liabilities.
3. Fees and Transactions with Related Parties
Certain officers and directors of the corporation are also officers and/or directors of American Century Companies, Inc. (ACC). The corporation’s investment advisor, ACIM, the corporation's distributor, American Century Investment Services, Inc. (ACIS), and the corporation’s transfer agent, American Century Services, LLC, are wholly owned, directly or indirectly, by ACC.
Management Fees — The corporation has entered into a management agreement with ACIM, under which ACIM provides the fund with investment advisory and management services in exchange for a single, unified management fee (the fee) per class. The agreement provides that all expenses of managing and operating the fund, except distribution and service fees, brokerage expenses, taxes, interest, fees and expenses of the independent directors (including legal counsel fees), and extraordinary expenses, will be paid by ACIM. The fee is computed and accrued daily based on each class's daily net assets and paid monthly in arrears. The difference in the fee among the classes is a result of their separate arrangements for non-Rule 12b-1 shareholder services. It is not the result of any difference in advisory or custodial fees or other expenses related to the management of the fund’s assets, which do not vary by class. The rate of the fee is determined by applying a fee rate calculation formula. This formula takes into account the fund’s assets as well as certain assets, if any, of other clients of the investment advisor outside the American Century Investments family of funds (such as subadvised funds and separate accounts) that use very similar investment teams and strategies (strategy assets).
The management fee schedule range and the effective annual management fee for each class for the period ended October 31, 2019 are as follows:
|
| | |
| | Management Fee Schedule Range | Effective Annual Management Fee |
| Investor Class | 1.000% to 1.150% | 1.15% |
| I Class | 0.800% to 0.950% | 0.95% |
| A Class | 1.000% to 1.150% | 1.15% |
| R Class | 1.000% to 1.150% | 1.15% |
| R6 Class | 0.650% to 0.800% | 0.80% |
Distribution and Service Fees — The Board of Directors has adopted a separate Master Distribution and Individual Shareholder Services Plan for each of the A Class and R Class (collectively the plans), pursuant to Rule 12b-1 of the 1940 Act. The plans provide that the A Class will pay ACIS an annual distribution and service fee of 0.25%. The plans provide that the R Class will pay ACIS an annual distribution and service fee of 0.50%. The fees are computed and accrued daily based on each class’s daily net assets and paid monthly in arrears. The fees are used to pay financial intermediaries for distribution and individual shareholder services. Fees incurred under the plans during the period ended October 31, 2019 are detailed in the Statement of Operations.
Directors' Fees and Expenses — The Board of Directors is responsible for overseeing the investment advisor’s management and operations of the fund. The directors receive detailed information about the fund and its investment advisor regularly throughout the year, and meet at least quarterly with management of the investment advisor to review reports about fund operations. The fund’s officers do not receive compensation from the fund.
Interfund Transactions — The fund may enter into security transactions with other American Century Investments funds and other client accounts of the investment advisor, in accordance with the 1940 Act rules and procedures adopted by the Board of Directors. The rules and procedures require, among other things, that these transactions be effected at the independent current market price of the security. During the period, the interfund purchases and sales were $1,047,376 and $1,668,464, respectively. The effect of interfund transactions on the Statement of Operations was $(93,046) in net realized gain (loss) on investment transactions.
4. Investment Transactions
Purchases and sales of investment securities, excluding short-term investments, for the period ended October 31, 2019 were $145,827,440 and $169,276,729, respectively.
5. Capital Share Transactions
Transactions in shares of the fund were as follows:
|
| | | | | | | | | | |
| | Year ended
October 31, 2019 | Year ended
October 31, 2018 |
| | Shares | Amount | Shares | Amount |
| Investor Class/Shares Authorized | 100,000,000 |
| | 140,000,000 |
| |
| Sold | 465,674 |
| $ | 4,767,626 |
| 447,446 |
| $ | 5,521,944 |
|
| Issued in reinvestment of distributions | 2,097,363 |
| 18,855,296 |
| 569,321 |
| 6,717,983 |
|
| Redeemed | (2,199,154 | ) | (21,570,052 | ) | (993,886 | ) | (12,209,568 | ) |
| | 363,883 |
| 2,052,870 |
| 22,881 |
| 30,359 |
|
| I Class/Shares Authorized | 40,000,000 |
| | 70,000,000 |
| |
| Sold | 164,823 |
| 1,645,975 |
| 258,025 |
| 3,333,659 |
|
| Issued in reinvestment of distributions | 137,920 |
| 1,277,143 |
| 5,458 |
| 65,937 |
|
| Redeemed | (775,425 | ) | (7,922,276 | ) | (78,074 | ) | (970,395 | ) |
| | (472,682 | ) | (4,999,158 | ) | 185,409 |
| 2,429,201 |
|
| A Class/Shares Authorized | 20,000,000 |
| | 40,000,000 |
| |
| Issued in reinvestment of distributions | 683 |
| 6,213 |
| 170 |
| 2,023 |
|
| R Class/Shares Authorized | 20,000,000 |
| | 40,000,000 |
| |
| Sold | 9,643 |
| 96,646 |
| 11,577 |
| 142,832 |
|
| Issued in reinvestment of distributions | 3,863 |
| 35,079 |
| 379 |
| 4,512 |
|
| Redeemed | (1,249 | ) | (12,221 | ) | (3,184 | ) | (38,921 | ) |
| | 12,257 |
| 119,504 |
| 8,772 |
| 108,423 |
|
| R6 Class/Shares Authorized | 20,000,000 |
| | 40,000,000 |
| |
| Sold | 442 |
| 4,717 |
| 8,459 |
| 105,313 |
|
| Issued in reinvestment of distributions | 4,777 |
| 44,855 |
| 1,078 |
| 13,157 |
|
| Redeemed | (1,493 | ) | (14,922 | ) | (7,297 | ) | (87,885 | ) |
| | 3,726 |
| 34,650 |
| 2,240 |
| 30,585 |
|
| Net increase (decrease) | (92,133 | ) | $ | (2,785,921 | ) | 219,472 |
| $ | 2,600,591 |
|
6. Fair Value Measurements
The fund’s investments valuation process is based on several considerations and may use multiple inputs to determine the fair value of the investments held by the fund. In conformity with accounting principles generally accepted in the United States of America, the inputs used to determine a valuation are classified into three broad levels.
| |
| • | Level 1 valuation inputs consist of unadjusted quoted prices in an active market for identical investments. |
| |
| • | Level 2 valuation inputs consist of direct or indirect observable market data (including quoted prices for comparable investments, evaluations of subsequent market events, interest rates, prepayment speeds, credit risk, etc.). These inputs also consist of quoted prices for identical investments initially expressed in local currencies that are adjusted through translation into U.S. dollars. |
| |
| • | Level 3 valuation inputs consist of unobservable data (including a fund’s own assumptions). |
The level classification is based on the lowest level input that is significant to the fair valuation measurement. The valuation inputs are not necessarily an indication of the risks associated with investing in these securities or other financial instruments.
The following is a summary of the level classifications as of period end. The Schedule of Investments provides additional information on the fund’s portfolio holdings.
|
| | | | | | | | |
| | Level 1 | Level 2 | Level 3 |
| Assets | | | |
| Investment Securities | | | |
| Common Stocks | $ | 79,575,255 |
| — |
| — |
|
| Exchange-Traded Funds | 2,608,941 |
| — |
| — |
|
| Temporary Cash Investments | 1,540 |
| $ | 2,336,020 |
| — |
|
| | $ | 82,185,736 |
| $ | 2,336,020 |
| — |
|
7. Risk Factors
The fund’s investment process may result in high portfolio turnover, which could mean high transaction costs, affecting both performance and capital gains tax liabilities to investors.
8. Federal Tax Information
On November 26, 2019, the fund declared and paid the following per-share distributions from net investment income to shareholders of record on November 25, 2019:
|
| | | | |
| Investor Class | I Class | A Class | R Class | R6 Class |
| $0.1050 | $0.1251 | $0.0798 | $0.0547 | $0.1401 |
The tax character of distributions paid during the years ended October 31, 2019 and October 31, 2018 were as follows:
|
| | | | | | |
| | 2019 | 2018 |
| Distributions Paid From | | |
| Ordinary income | $ | 4,795,001 |
| $ | 3,072,329 |
|
| Long-term capital gains | $ | 16,108,562 |
| $ | 4,207,439 |
|
The book-basis character of distributions made during the year from net investment income or net realized gains may differ from their ultimate characterization for federal income tax purposes. These differences reflect the differing character of certain income items and net realized gains and losses for financial statement and tax purposes, and may result in reclassification among certain capital accounts on the financial statements.
As of period end, the federal tax cost of investments and the components of distributable earnings on a tax-basis were as follows:
|
| | | |
| Federal tax cost of investments | $ | 78,144,944 |
|
| Gross tax appreciation of investments | $ | 7,741,848 |
|
| Gross tax depreciation of investments | (1,365,036 | ) |
| Net tax appreciation (depreciation) of investments | $ | 6,376,812 |
|
| Undistributed ordinary income | $ | 873,408 |
|
The difference between book-basis and tax-basis unrealized appreciation (depreciation) is attributable primarily to the tax deferral of losses on wash sales.
9. Subsequent Event
On September 11, 2019, the Board of Directors approved a plan of liquidation for the fund. The liquidation was effective December 12, 2019.
|
| | | | | | | | | | | | | | | | | |
| For a Share Outstanding Throughout the Years Ended October 31 (except as noted) | | | | | |
| Per-Share Data | | | | | | | | | Ratios and Supplemental Data |
| | | Income From Investment Operations: | Distributions From: | | | Ratio to Average Net Assets of: | | |
| | Net Asset
Value,
Beginning
of Period | Net
Investment
Income
(Loss)(1) | Net
Realized
and
Unrealized
Gain (Loss) | Total From
Investment
Operations | Net
Investment
Income | Net
Realized
Gains | Total
Distributions | Net Asset
Value,
End
of Period | Total
Return(2) | Operating
Expenses | Operating
Expenses
(before
expense
waiver) | Net
Investment
Income
(Loss) | Net
Investment
Income
(Loss)
(before
expense
waiver) | Portfolio
Turnover
Rate | Net
Assets,
End of
Period
(in thousands) |
| Investor Class | | | | | | | | | | | | | | |
| 2019 | $12.07 | 0.17 | (0.03) | 0.14 | (0.12) | (2.28) | (2.40) | $9.81 | 3.03% | 1.15% | 1.15% | 1.70% | 1.70% | 147% |
| $83,403 |
|
| 2018 | $12.15 | 0.12 | 0.66 | 0.78 | (0.04) | (0.82) | (0.86) | $12.07 | 6.58% | 1.15% | 1.22% | 0.99% | 0.92% | 112% |
| $98,221 |
|
| 2017 | $9.82 | 0.07 | 2.36 | 2.43 | (0.10) | — | (0.10) | $12.15 | 24.92% | 1.16% | 1.26% | 0.58% | 0.48% | 85% |
| $98,585 |
|
| 2016 | $10.74 | 0.10 | 0.08 | 0.18 | (0.12) | (0.98) | (1.10) | $9.82 | 2.20% | 1.23% | 1.25% | 1.04% | 1.02% | 116% |
| $87,888 |
|
| 2015 | $10.15 | 0.06 | 0.59 | 0.65 | (0.06) | — | (0.06) | $10.74 | 6.40% | 1.26% | 1.26% | 0.54% | 0.54% | 185% |
| $99,141 |
|
| I Class | | | | | | | | | | | | | | |
| 2019 | $12.38 | 0.21 | (0.04) | 0.17 | (0.15) | (2.28) | (2.43) | $10.12 | 3.19% | 0.95% | 0.95% | 1.90% | 1.90% | 147% |
| $810 |
|
| 2018 | $12.44 | 0.15 | 0.68 | 0.83 | (0.07) | (0.82) | (0.89) | $12.38 | 6.81% | 0.95% | 1.02% | 1.19% | 1.12% | 112% |
| $6,841 |
|
| 2017 | $10.05 | 0.09 | 2.42 | 2.51 | (0.12) | — | (0.12) | $12.44 | 25.19% | 0.96% | 1.06% | 0.78% | 0.68% | 85% |
| $4,568 |
|
| 2016 | $10.96 | 0.12 | 0.09 | 0.21 | (0.14) | (0.98) | (1.12) | $10.05 | 2.47% | 1.03% | 1.05% | 1.24% | 1.22% | 116% |
| $2,729 |
|
| 2015 | $10.36 | 0.08 | 0.60 | 0.68 | (0.08) | — | (0.08) | $10.96 | 6.58% | 1.06% | 1.06% | 0.74% | 0.74% | 185% |
| $2,665 |
|
| A Class | | | | | | | | | | | | | | |
| 2019 | $12.16 | 0.14 | (0.02) | 0.12 | (0.09) | (2.28) | (2.37) | $9.91 | 2.79% | 1.40% | 1.40% | 1.45% | 1.45% | 147% |
| $33 |
|
| 2018 | $12.23 | 0.09 | 0.67 | 0.76 | (0.01) | (0.82) | (0.83) | $12.16 | 6.34% | 1.40% | 1.47% | 0.74% | 0.67% | 112% |
| $32 |
|
2017(3) | $10.24 | 0.03 | 1.97 | 2.00 | (0.01) | — | (0.01) | $12.23 | 19.50% | 1.41%(4) | 1.51%(4) | 0.26%(4) | 0.16%(4) | 85%(5) |
| $30 |
|
|
| | | | | | | | | | | | | | | | | |
| For a Share Outstanding Throughout the Years Ended October 31 (except as noted) | | | | | |
| Per-Share Data | | | | | | | | | Ratios and Supplemental Data |
| | | Income From Investment Operations: | Distributions From: | | | Ratio to Average Net Assets of: | | |
| | Net Asset
Value,
Beginning
of Period | Net
Investment
Income
(Loss)(1) | Net
Realized
and
Unrealized
Gain (Loss) | Total From
Investment
Operations | Net
Investment
Income | Net
Realized
Gains | Total
Distributions | Net Asset
Value,
End
of Period | Total
Return(2) | Operating
Expenses | Operating
Expenses
(before
expense
waiver) | Net
Investment
Income
(Loss) | Net
Investment
Income
(Loss)
(before
expense
waiver) | Portfolio
Turnover
Rate | Net
Assets,
End of
Period
(in thousands) |
| R Class | | | | | | | | | | | | | | |
| 2019 | $12.11 | 0.11 | —(6) | 0.11 | (0.07) | (2.28) | (2.35) | $9.87 | 2.59% | 1.65% | 1.65% | 1.20% | 1.20% | 147% |
| $257 |
|
| 2018 | $12.21 | 0.07 | 0.65 | 0.72 | — | (0.82) | (0.82) | $12.11 | 5.99% | 1.65% | 1.72% | 0.49% | 0.42% | 112% |
| $167 |
|
2017(3) | $10.24 | —(6) | 1.97 | 1.97 | —(6) | — | —(6) | $12.21 | 19.28% | 1.66%(4) | 1.76%(4) | (0.01)%(4) | (0.11)%(4) | 85%(5) |
| $61 |
|
| R6 Class | | | | | | | | | | | | | | |
| 2019 | $12.53 | 0.21 | (0.02) | 0.19 | (0.16) | (2.28) | (2.44) | $10.28 | 3.42% | 0.80% | 0.80% | 2.05% | 2.05% | 147% |
| $225 |
|
| 2018 | $12.58 | 0.17 | 0.69 | 0.86 | (0.09) | (0.82) | (0.91) | $12.53 | 6.98% | 0.80% | 0.87% | 1.34% | 1.27% | 112% |
| $228 |
|
2017(3) | $10.48 | 0.09 | 2.02 | 2.11 | (0.01) | — | (0.01) | $12.58 | 20.17% | 0.81%(4) | 0.91%(4) | 0.82%(4) | 0.72%(4) | 85%(5) |
| $201 |
|
|
|
| Notes to Financial Highlights |
| |
| (1) | Computed using average shares outstanding throughout the period. |
| |
| (2) | Total returns are calculated based on the net asset value of the last business day and do not reflect applicable sales charges, if any. Total returns for periods less than one year are not annualized. |
| |
| (3) | December 1, 2016 (commencement of sale) through October 31, 2017. |
| |
| (5) | Portfolio turnover is calculated at the fund level. Percentage indicated was calculated for the year ended October 31, 2017. |
| |
| (6) | Per-share amount was less than $0.005. |
See Notes to Financial Statements.
|
|
| Report of Independent Registered Public Accounting Firm |
To the Shareholders and the Board of Directors of American Century Mutual Funds, Inc.:
Opinion on the Financial Statements and Financial Highlights
We have audited the accompanying statement of assets and liabilities, including the schedule of investments, of Adaptive Equity Fund, one of the funds constituting the American Century Mutual Funds, Inc. (the "Fund"), as of October 31, 2019, the related statement of operations for the year then ended, the statements of changes in net assets for each of the two years in the period then ended, the financial highlights for each of the five years in the period then ended, and the related notes. In our opinion, the financial statements and financial highlights present fairly, in all material respects, the financial position of Adaptive Equity Fund of the American Century Mutual Funds, Inc. as of October 31, 2019, the results of its operations for the year then ended, the changes in its net assets for each of the two years in the period then ended, and the financial highlights for each of the five years in the period then ended, in conformity with accounting principles generally accepted in the United States of America.
Basis for Opinion
These financial statements and financial highlights are the responsibility of the Fund's management. Our responsibility is to express an opinion on the Fund’s financial statements and financial highlights based on our audits. We are a public accounting firm registered with the Public Company Accounting Oversight Board (United States) (PCAOB) and are required to be independent with respect to the Fund in accordance with the U.S. federal securities laws and the applicable rules and regulations of the Securities and Exchange Commission and the PCAOB.
We conducted our audits in accordance with the standards of the PCAOB. Those standards require that we plan and perform the audit to obtain reasonable assurance about whether the financial statements and financial highlights are free of material misstatement, whether due to error or fraud. The Fund is not required to have, nor were we engaged to perform, an audit of its internal control over financial reporting. As part of our audits we are required to obtain an understanding of internal control over financial reporting but not for the purpose of expressing an opinion on the effectiveness of the Fund’s internal control over financial reporting. Accordingly, we express no such opinion.
Our audits included performing procedures to assess the risks of material misstatement of the financial statements and financial highlights, whether due to error or fraud, and performing procedures that respond to those risks. Such procedures included examining, on a test basis, evidence regarding the amounts and disclosures in the financial statements and financial highlights. Our audits also included evaluating the accounting principles used and significant estimates made by management, as well as evaluating the overall presentation of the financial statements and financial highlights. Our procedures included confirmation of securities owned as of October 31, 2019, by correspondence with the custodian and brokers. We believe that our audits provide a reasonable basis for our opinion.
DELOITTE & TOUCHE LLP
Kansas City, Missouri
December 16, 2019
We have served as the auditor of one or more American Century investment companies since 1997.
The Board of Directors
The individuals listed below serve as directors of the funds. Each director will continue to serve in this capacity until death, retirement, resignation or removal from office. The board has adopted a mandatory retirement age for directors who are not “interested persons,” as that term is defined in the Investment Company Act (independent directors). Independent directors shall retire by December 31 of the year in which they reach their 75th birthday.
Mr. Thomas is an “interested person” because he currently serves as President and Chief Executive Officer of American Century Companies, Inc. (ACC), the parent company of American Century Investment Management, Inc. (ACIM or the advisor). The other directors (more than three-fourths of the total number) are independent. They are not employees, directors or officers of, and have no financial interest in, ACC or any of its wholly owned, direct or indirect, subsidiaries, including ACIM, American Century Investment Services, Inc. (ACIS) and American Century Services, LLC (ACS), and they do not have any other affiliations, positions or relationships that would cause them to be considered “interested persons” under the Investment Company Act. The directors serve in this capacity for seven (in the case of Jonathan S. Thomas, 16; and Stephen E. Yates, 8) registered investment companies in the American Century Investments family of funds.
The following table presents additional information about the directors. The mailing address for each director is 4500 Main Street, Kansas City, Missouri 64111.
|
| | | | | |
Name
(Year of Birth) | Position(s) Held with Funds | Length of Time Served | Principal Occupation(s) During Past 5 Years | Number of American Century Portfolios Overseen by Director | Other Directorships Held During Past 5 Years |
| Independent Directors |
|
|
| Thomas W. Bunn (1953) | Director | Since 2017 | Retired | 66 | SquareTwo Financial; Barings (formerly Babson Capital Funds Trust) (2013 to 2016) |
Chris H. Cheesman
(1962)
| Director | Since 2019
| Retired. Senior Vice President & Chief Audit Executive, AllianceBernstein (1999 to 2018)
| 66 | None |
Barry Fink
(1955) | Director | Since 2012 (independent since 2016) | Retired | 66 | None |
Rajesh K. Gupta
(1960)
| Director | Since 2019
| Partner Emeritus, SeaCrest Investment Management and SeaCrest Wealth Management (2019 to Present); Chief Executive Officer and Chief Investment Officer, SeaCrest Investment Management (2006 to 2019); Chief Executive Officer and Chief Investment Officer, SeaCrest Wealth Management (2008 to 2019)
| 66 | None |
|
| | | | | |
Name
(Year of Birth) | Position(s) Held with Funds | Length of Time Served | Principal Occupation(s) During Past 5 Years | Number of American Century Portfolios Overseen by Director | Other Directorships Held During Past 5 Years |
| Independent Directors |
|
|
Lynn Jenkins
(1963)
| Director | Since 2019
| United States Representative, U.S. House of Representatives (2009 to 2018) | 66 | MGP Ingredients, Inc. |
Jan M. Lewis
(1957) | Director | Since 2011 | Retired | 66 | None |
John R. Whitten
(1946) | Director | Since 2008 | Retired | 66 | Onto Innovation Inc.; Rudolph Technologies, Inc. (2006 to 2019) |
Stephen E. Yates
(1948) | Director and Chairman of the Board | Since 2012 (Chairman since 2018) | Retired | 81 | None |
| Interested Director |
|
Jonathan S. Thomas
(1963) | Director | Since 2007 | President and Chief Executive Officer, ACC (2007 to present). Also serves as Chief Executive Officer, ACS; Executive Vice President, ACIM; Director, ACC, ACIM and other ACC subsidiaries | 125 | BioMed Valley Discoveries, Inc. |
The Statement of Additional Information has additional information about the fund's directors and is available without charge, upon request, by calling 1-800-345-2021.
Officers
The following table presents certain information about the executive officers of the funds. Each officer serves as an officer for each of the 16 (in the case of Robert J. Leach, 15) investment companies in the American Century family of funds. No officer is compensated for his or her service as an officer of the funds. The listed officers are interested persons of the funds and are appointed or re-appointed on an annual basis. The mailing address for each officer listed below is 4500 Main Street, Kansas City, Missouri 64111.
|
| | |
Name
(Year of Birth) | Offices with the Funds | Principal Occupation(s) During the Past Five Years |
Patrick Bannigan
(1965) | President since 2019 | Executive Vice President and Director, ACC (2012 to present); Chief Financial Officer, Chief Accounting Officer and Treasurer, ACC (2015 to present); Chief Operating Officer, ACC (2012-2015). Also serves as President, ACS; Vice President, ACIM; Chief Financial Officer, Chief Accounting Officer and/or Director, ACIM, ACS and other ACC subsidiaries |
R. Wes Campbell
(1974) | Chief Financial Officer and Treasurer since 2018 | Investment Operations and Investment Accounting, ACS (2000 to present) |
Amy D. Shelton
(1964) | Chief Compliance Officer and Vice President since 2014 | Chief Compliance Officer, American Century funds, (2014 to present); Chief Compliance Officer, ACIM (2014 to present); Chief Compliance Officer, ACIS (2009 to present). Also serves as Vice President, ACIS |
Charles A. Etherington
(1957) | General Counsel since 2007 and Senior Vice President since 2006 | Attorney, ACC (1994 to present); Vice President, ACC (2005 to present); General Counsel, ACC (2007 to present). Also serves as General Counsel, ACIM, ACS, ACIS and other ACC subsidiaries; and Senior Vice President, ACIM and ACS |
C. Jean Wade
(1964) | Vice President since 2012 | Senior Vice President, ACS (2017 to present); Vice President, ACS (2000 to 2017)
|
Robert J. Leach
(1966) | Vice President since 2006 | Vice President, ACS (2000 to present) |
David H. Reinmiller
(1963) | Vice President since 2000 | Attorney, ACC (1994 to present). Also serves as Vice President, ACIM and ACS |
Ward D. Stauffer
(1960) | Secretary since 2005 | Attorney, ACC (2003 to present) |
|
|
| Approval of Management Agreement |
At a meeting held on June 26, 2019, the Fund’s Board of Directors (the "Board") unanimously approved the renewal of the management agreement pursuant to which American Century Investment Management, Inc. (the “Advisor”) acts as the investment advisor for the Fund. Under Section 15(c) of the Investment Company Act, contracts for investment advisory services are required to be reviewed, evaluated, and approved by a majority of a fund’s directors (the “Directors”), including a majority of the independent Directors, each year.
Prior to its consideration of the renewal of the management agreement, the Directors requested and reviewed extensive data and information compiled by the Advisor and certain independent providers of evaluation data concerning the Fund and the services provided to the Fund by the Advisor. This review was in addition to the oversight and evaluation undertaken by the Board and its committees on a continual basis and the information received was supplemental to the extensive information that the Board and its committees receive and consider throughout the year.
In connection with its consideration of the renewal of the management agreement, the Board’s review and evaluation of the services provided by the Advisor included, but was not limited to, the following:
| |
| • | the nature, extent, and quality of investment management, shareholder services, and other services provided and to be provided to the Fund; |
| |
| • | the wide range of other programs and services provided and to be provided to the Fund and its shareholders on a routine and non-routine basis; |
| |
| • | the investment performance of the Fund, including data comparing the Fund's performance to appropriate benchmarks and/or a peer group of other mutual funds with similar investment objectives and strategies; |
| |
| • | the cost of owning the Fund compared to the cost of owning similar funds; |
| |
| • | the compliance policies, procedures, and regulatory experience of the Advisor and the Fund's service providers; |
| |
| • | financial data showing the cost of services provided to the Fund, the profitability of the Fund to the Advisor, and the overall profitability of the Advisor; |
| |
| • | strategic plans of the Advisor; |
| |
| • | any economies of scale associated with the Advisor’s management of the Fund and other accounts; |
| |
| • | services provided and charges to the Advisor's other investment management clients; |
| |
| • | acquired fund fees and expenses; |
| |
| • | payments and practices in connection with financial intermediaries holding shares of the Fund and the services provided by intermediaries in connection therewith; and |
| |
| • | any collateral benefits derived by the Advisor from the management of the Fund. |
The Directors held three in-person meetings and one telephonic meeting to review and discuss the information provided. The independent Directors also reviewed responses to supplemental information requests provided by the Directors to the Advisor and held active discussions with the Advisor regarding the renewal of the management agreement. The independent Directors had the benefit of the advice of their independent counsel throughout the process.
Factors Considered
The Directors considered all of the information provided by the Advisor, the independent data providers, and independent counsel in connection with the approval. They determined that the information was sufficient for them to evaluate the management agreement for the Fund. In connection with their review, the Directors did not identify any single factor as being all-important or
controlling, and each Director may have attributed different levels of importance to different factors. In deciding to renew the management agreement, the Board based its decision on a number of factors, including without limitation the following:
Nature, Extent and Quality of Services — Generally. Under the management agreement, the Advisor is responsible for providing or arranging for all services necessary for the operation of the Fund. The Board noted that the Advisor provides or arranges at its own expense a wide variety of services including without limitation the following:
| |
| • | portfolio research and security selection |
| |
| • | daily valuation of the Fund’s portfolio |
| |
| • | shareholder servicing and transfer agency, including shareholder confirmations, recordkeeping, and communications |
| |
| • | legal services (except the independent Directors’ counsel) |
| |
| • | regulatory and portfolio compliance |
| |
| • | marketing and distribution (except amounts paid by the Fund under Rule 12b-1 plans) |
The Board noted that many of these services have expanded over time in terms of both quantity and complexity in response to shareholder demands, competition in the industry, changing distribution channels, and the changing regulatory environment.
Investment Management Services. The nature of the investment management services provided to the Fund is quite complex and allows Fund shareholders access to professional money management, instant diversification of their investments within an asset class, the opportunity to easily diversify among asset classes by investing in or exchanging among various American Century Investments funds, and liquidity. In evaluating investment performance, the Board expects the Advisor to manage the Fund in accordance with its investment objectives and approved strategies. Further, the Directors recognize that the Advisor has an obligation to monitor trading activities, and in particular to seek the best execution of fund trades, and to evaluate the use of and payment for research. In providing these services, the Advisor utilizes teams of investment professionals (portfolio managers, analysts, research assistants, and securities traders) who require extensive information technology, research, training, compliance, and other systems to conduct their business. The Board, directly and through its Fund Performance Review Committee, provides oversight of the investment performance process. It regularly reviews investment performance information for the Fund, together with comparative information for appropriate benchmarks and/or peer groups of similarly-managed funds, over different time horizons. The Directors also review investment performance information during the management agreement renewal process. If performance concerns are identified, the Fund receives special reviews until performance improves, during which the Board discusses with the Advisor the reasons for such results (e.g., market conditions, security selection) and any efforts being undertaken to improve performance. The Fund’s performance was above its benchmark for the one-, three-, and five-year periods and below its benchmark for the 10-year period reviewed by the Board. The Board found the investment management services provided by the Advisor to the Fund to be satisfactory and consistent with the management agreement.
Shareholder and Other Services. Under the management agreement, the Advisor provides the Fund with a comprehensive package of transfer agency, shareholder, and other services. The Board, directly and through various committees of the Board, regularly reviews reports and evaluations of such services at its regular meetings. These reports include, but are not limited to, information regarding the operational efficiency and accuracy of the shareholder and transfer agency services provided, staffing levels, shareholder satisfaction, technology support (including cyber security), new products and services offered to Fund shareholders, securities trading
activities, portfolio valuation services, auditing services, and legal and operational compliance activities. The Board found the services provided by the Advisor to the Fund under the management agreement to be competitive and of high quality.
Costs of Services and Profitability. The Advisor provides detailed information concerning its cost of providing various services to the Fund, its profitability in managing the Fund (pre- and post-distribution), its overall profitability, and its financial condition. The Directors have reviewed with the Advisor the methodology used to prepare this financial information. This information is considered in evaluating the Advisor’s financial condition, its ability to continue to provide services under the management agreement, and the reasonableness of the current management fee. The Board concluded that the Advisor’s profits were reasonable in light of the services provided to the Fund.
Ethics. The Board generally considers the Advisor’s commitment to providing quality services to shareholders and to conducting its business ethically. They noted that the Advisor’s practices generally meet or exceed industry best practices.
Economies of Scale. The Board also reviewed information provided by the Advisor regarding the possible existence of economies of scale in connection with the management of the Fund. The Board concluded that economies of scale are difficult to measure and predict with precision, especially on a fund-by-fund basis. The Board concluded that the Advisor is appropriately sharing economies of scale through its competitive fee structure, offering competitive fees from fund inception, and through reinvestment in its business to provide shareholders additional content and services. The Board also noted that economies of scale are shared with the Fund and its shareholders through management fee breakpoints that serve to reduce the effective management fee as the assets of the Fund grow.
Comparison to Other Funds’ Fees. The management agreement provides that the Fund pays the Advisor a single, all-inclusive (or unified) management fee for providing all services necessary for the management and operation of the Fund, other than brokerage expenses, expenses attributable to short sales, taxes, interest, extraordinary expenses, fees and expenses of the Fund’s independent Directors (including their independent legal counsel), and expenses incurred in connection with the provision of shareholder services and distribution services under a plan adopted pursuant to Rule 12b-1 under the Investment Company Act. Under the unified fee structure, the Advisor is responsible for providing all investment advisory, custody, audit, administrative, compliance, recordkeeping, marketing and shareholder services, or arranging and supervising third parties to provide such services. By contrast, most other funds are charged a variety of fees, including an investment advisory fee, a transfer agency fee, an administrative fee, distribution charges, and other expenses. Other than their investment advisory fees and any applicable Rule 12b-1 distribution fees, all other components of the total fees charged by these other funds may be increased without shareholder approval. The Board believes the unified fee structure is a benefit to Fund shareholders because it clearly discloses to shareholders the cost of owning Fund shares, and, since the unified fee cannot be increased without a vote of Fund shareholders, it shifts to the Advisor the risk of increased costs of operating the Fund and provides a direct incentive to minimize administrative inefficiencies. Part of the Board’s analysis of fee levels involves reviewing certain evaluative data compiled by an independent provider comparing the Fund’s unified fee to the total expense ratios of its peers. The unified fee charged to shareholders of the Fund was above the median of the total expense ratios of the Fund’s peer expense universe and was within the range of its peer expense group. The Board concluded that the management fee paid by the Fund to the Advisor under the management agreement is reasonable in light of the services provided to the Fund.
Comparison to Fees and Services Provided to Other Clients of the Advisor. The Directors also requested and received information from the Advisor concerning the nature of the services, fees, costs, and profitability of its advisory services to advisory clients other than the Fund. They observed that these varying types of client accounts require different services and involve different regulatory and entrepreneurial risks than the management of the Fund. The Board analyzed this
information and concluded that the fees charged and services provided to the Fund were reasonable by comparison.
Payments to Intermediaries. The Directors also requested and received a description of payments made to intermediaries by the Fund and the Advisor and services provided in response thereto. These payments include various payments made by the Fund or the Advisor to different types of intermediaries and recordkeepers for distribution and service activities provided for the Fund. The Board reviewed such information and received representations from the Advisor that all such payments by the Fund were made pursuant to the Fund's Rule 12b-1 Plan and that all such payments by the Advisor were made from the Advisor’s resources and reasonable profits. The Board found such payments to be reasonable in scope and purpose.
Collateral or “Fall-Out” Benefits Derived by the Advisor. The Board considered the existence of collateral benefits the Advisor may receive as a result of its relationship with the Fund. They concluded that the Advisor’s primary business is managing mutual funds and it generally does not use fund or shareholder information to generate profits in other lines of business, and therefore does not derive any significant collateral benefits from them. The Board noted that additional assets from other clients may offer the Advisor some benefit from increased leverage with service providers and counterparties. Additionally, the Advisor may receive proprietary research from broker-dealers that execute fund portfolio transactions, which the Board concluded is likely to benefit other clients of the Advisor, as well as Fund shareholders. The Board also determined that the Advisor is able to provide investment management services to certain clients other than the Fund, at least in part, due to its existing infrastructure built to serve the fund complex. The Board concluded that appropriate allocation methodologies had been employed to assign resources and the cost of those resources to these other clients and, where expressly provided, these other client assets may be included with the assets of the Fund to determine breakpoints in the management fee schedule.
Existing Relationship. The Board also considered whether there was any reason for not continuing the existing arrangement with the Advisor. In this regard, the Board was mindful of the potential disruptions of the Fund’s operations and various risks, uncertainties, and other effects that could occur as a result of a decision not to continue such relationship. In particular, the Board recognized that most shareholders have invested in the Fund on the strength of the Advisor’s industry standing and reputation and in the expectation that the Advisor will have a continuing role in providing advisory services to the Fund.
Conclusion of the Directors. As a result of this process, the Board, including all of the independent Directors, taking into account all of the factors discussed above and the information provided by the Advisor and others in connection with its review and throughout the year, determined that the management fee is fair and reasonable in light of the services provided and that the investment management agreement between the Fund and the Advisor should be renewed.
Retirement Account Information
As required by law, distributions you receive from certain retirement accounts are subject to federal income tax withholding, unless you elect not to have withholding apply*. Tax will be withheld on the total amount withdrawn even though you may be receiving amounts that are not subject to withholding, such as nondeductible contributions. In such case, excess amounts of withholding could occur. You may adjust your withholding election so that a greater or lesser amount will be withheld.
If you don’t want us to withhold on this amount, you must notify us to not withhold the federal income tax. You may notify us in writing or in certain situations by telephone or through other electronic means. For systematic withdrawals, your withholding election will remain in effect until revoked or changed by filing a new election. You have the right to revoke your election at any time and change your withholding percentage for future distributions.
Remember, even if you elect not to have income tax withheld, you are liable for paying income tax on the taxable portion of your withdrawal. If you elect not to have income tax withheld or you don’t have enough income tax withheld, you may be responsible for payment of estimated tax. You may incur penalties under the estimated tax rules if your withholding and estimated tax payments are not sufficient. You can reduce or defer the income tax on a distribution by directly or indirectly rolling such distribution over to another IRA or eligible plan. You should consult your tax advisor for additional information.
State tax will be withheld if, at the time of your distribution, your address is within one of the mandatory withholding states and you have federal income tax withheld (or as otherwise required by state law). State taxes will be withheld from your distribution in accordance with the respective state rules.
*Some 403(b), 457 and qualified retirement plan distributions may be subject to 20% mandatory withholding, as they are subject to special tax and withholding rules. Your plan administrator or plan sponsor is required to provide you with a special tax notice explaining those rules at the time you request a distribution. If applicable, federal and/or state taxes may be withheld from your distribution amount.
Proxy Voting Policies
A description of the policies that the fund's investment advisor uses in exercising the voting rights associated with the securities purchased and/or held by the fund is available without charge, upon request, by calling 1-800-345-2021. It is also available on American Century Investments’ website at americancentury.com/proxy and on the Securities and Exchange Commission’s website at sec.gov. Information regarding how the investment advisor voted proxies relating to portfolio securities during the most recent 12-month period ended June 30 is available on americancentury.com/proxy. It is also available at sec.gov.
Quarterly Portfolio Disclosure
The fund files its complete schedule of portfolio holdings with the Securities and Exchange Commission (SEC) for the first and third quarters of each fiscal year on Form N-Q or as an exhibit to its reports on Form N-PORT. The fund’s Forms N-Q and Form N-PORT reports are available on the SEC’s website at sec.gov. The fund also makes its complete schedule of portfolio holdings for the most recent quarter of its fiscal year available on its website at americancentury.com and, upon request, by calling 1-800-345-2021.
Other Tax Information
The following information is provided pursuant to provisions of the Internal Revenue Code.
The fund hereby designates up to the maximum amount allowable as qualified dividend income for the fiscal year ended October 31, 2019.
For corporate taxpayers, the fund hereby designates $2,163,071, or up to the maximum amount allowable, of ordinary income distributions paid during the fiscal year ended October 31, 2019 as qualified for the corporate dividends received deduction.
The fund hereby designates $16,138,887, or up to the maximum amount allowable, as long-term capital gain distributions (20% rate gain distributions) for the fiscal year ended October 31, 2019.
The fund hereby designates $3,720,343 as qualified short-term capital gain distributions for purposes of Internal Revenue Code Section 871 for the fiscal year ended October 31, 2019.
The fund utilized earnings and profits of $565,194 distributed to shareholders on redemption of shares as part of the dividends paid reduction (tax equalization).
|
| | |
| |
| | | |
| Contact Us | americancentury.com | |
| Automated Information Line | 1-800-345-8765 | |
| Investor Services Representative | 1-800-345-2021 or 816-531-5575 | |
| Investors Using Advisors | 1-800-378-9878 | |
| Business, Not-For-Profit, Employer-Sponsored Retirement Plans | 1-800-345-3533 | |
| Banks and Trust Companies, Broker-Dealers, Financial Professionals, Insurance Companies | 1-800-345-6488 | |
| Telecommunications Relay Service for the Deaf | 711 | |
| | | |
| American Century Mutual Funds, Inc. | |
| | | |
Investment Advisor: American Century Investment Management, Inc. Kansas City, Missouri | |
| | | |
| This report and the statements it contains are submitted for the general information of our shareholders. The report is not authorized for distribution to prospective investors unless preceded or accompanied by an effective prospectus. | |
| | | |
©2019 American Century Proprietary Holdings, Inc. All rights reserved.
CL-ANN-90976 1912 | |
|
| |
| | |
| | Annual Report |
| | |
| | October 31, 2019 |
| | |
| | All Cap Growth Fund |
| | Investor Class (TWGTX) |
| | I Class (ACAJX) |
| | A Class (ACAQX) |
| | C Class (ACAHX) |
| | R Class (ACAWX) |
Beginning on January 1, 2021, as permitted by regulations adopted by the Securities and Exchange Commission, paper copies of the fund’s shareholder reports like this one will no longer be sent by mail, unless you specifically request paper copies of the reports from the fund or from your financial intermediary, such as a broker-dealer or bank. Instead, the reports will be made available on a website, and you will be notified by mail each time a report is posted and provided with a website link to access the report.
If you already elected to receive shareholder reports electronically, you will not be affected by this change and you need not take any action. You may elect to receive shareholder reports and other communications from the fund or your financial intermediary electronically by calling or sending an email request to your appropriate contacts as listed on the back cover of this report.
You may elect to receive all future reports in paper free of charge. You can inform the fund or your financial intermediary that you wish to continue receiving paper copies of your shareholder reports by calling or sending an email request to your appropriate contacts as listed on the back cover of this report. Your election to receive reports in paper will apply to all funds held with the fund complex/your financial intermediary.
|
| | |
| President’s Letter | 2 |
|
| Performance | 3 |
|
| Portfolio Commentary | |
|
| Fund Characteristics | |
|
| Shareholder Fee Example | |
|
| Schedule of Investments | |
|
| Statement of Assets and Liabilities | |
|
| Statement of Operations | |
|
| Statement of Changes in Net Assets | |
|
| Notes to Financial Statements | |
|
| Financial Highlights | |
|
| Report of Independent Registered Public Accounting Firm | |
|
| Management | |
|
| Approval of Management Agreement | |
|
| Additional Information | |
|
Any opinions expressed in this report reflect those of the author as of the date of the report, and do not necessarily represent the opinions of American Century Investments® or any other person in the American Century Investments organization. Any such opinions are subject to change at any time based upon market or other conditions and American Century Investments disclaims any responsibility to update such opinions. These opinions may not be relied upon as investment advice and, because investment decisions made by American Century Investments funds are based on numerous factors, may not be relied upon as an indication of trading intent on behalf of any American Century Investments fund. Security examples are used for representational purposes only and are not intended as recommendations to purchase or sell securities. Performance information for comparative indices and securities is provided to American Century Investments by third party vendors. To the best of American Century Investments’ knowledge, such information is accurate at the time of printing.
Jonathan Thomas
Dear Investor:
Thank you for reviewing this annual report for the 12 months ended October 31, 2019. Annual reports help convey important information about fund returns, including market factors that affected performance. For additional investment and market insights, please visit americancentury.com.
Stocks, Bonds Delivered Solid Gains
U.S. and global stocks, bonds and real estate investments generally delivered strong gains for the 12-month period. Stocks and other riskier assets rebounded from a late-2018 sell-off to post robust returns for the 12 months overall. Global bonds benefited from safe-haven buying early in the period and a declining interest rate environment overall.
Fed’s Policy Pivot Improved Investor Sentiment
In the final months of 2018, mounting concerns about slowing global economic and earnings growth, tariffs and Federal Reserve (Fed) policy soured investor sentiment, driving global stocks lower. After raising rates in September 2018, the Fed hiked again in December and delivered a surprisingly bullish 2019 rate-hike outlook, which intensified the sell-off among stocks and other riskier assets. Meanwhile, the risk-off climate sparked a flight to quality, which drove U.S. and other government bond yields lower and benefited global bond returns.
A key policy pivot from the Fed helped improve equity investor sentiment beginning in early 2019. The central bank abruptly ended its rate-hike campaign and adopted a dovish tone amid weaker global growth and inflation. Additionally, investors’ worst-case fears about trade and corporate earnings generally eased, which also aided stocks and other riskier assets. At the same time, government bond yields continued to fall on moderating global growth data, muted inflation and accommodative central bank policy in the U.S., Europe and Japan. By July, concerns about global economic risks prompted the Fed to cut short-term interest rates for the first time in 10 years. The Fed followed up with additional rate cuts in September and October. This backdrop supported continued gains for fixed-income and other interest rate-sensitive assets.
Looking ahead, we expect volatility to remain a formidable factor as investors react to global growth and trade trends, central bank policy and geopolitical developments. We believe this scenario underscores the importance of using professionally managed portfolios in pursuit of investment goals. We appreciate your continued trust and confidence in us.
Sincerely,
Jonathan Thomas
President and Chief Executive Officer
American Century Investments
|
| | | | | | |
| Total Returns as of October 31, 2019 |
| | | | Average Annual Returns | |
| | Ticker Symbol | 1 year | 5 years | 10 years | Since Inception | Inception Date |
| Investor Class | TWGTX | 16.52% | 11.22% | 13.58% | — | 11/25/83 |
| Russell 3000 Growth Index | — | 16.34% | 13.05% | 15.25% | — | — |
| I Class | ACAJX | 16.77% | 11.44% | — | 14.51% | 9/30/11 |
| A Class | ACAQX | | | | | 9/30/11 |
| No sales charge | | 16.23% | 10.94% | — | 14.00% | |
| With sales charge | | 9.53% | 9.64% | — | 13.18% | |
| C Class | ACAHX | 15.38% | 10.12% | — | 13.15% | 9/30/11 |
| R Class | ACAWX | 15.95% | 10.67% | — | 13.72% | 9/30/11 |
Sales charges include initial sales charges and contingent deferred sales charges (CDSCs), as applicable. A Class shares have a 5.75% maximum initial sales charge and may be subject to a maximum CDSC of 1.00%. C Class shares redeemed within 12 months of purchase are subject to a maximum CDSC of 1.00%. The SEC requires that mutual funds provide performance information net of maximum sales charges in all cases where charges could be applied.
Data presented reflect past performance. Past performance is no guarantee of future results. Current performance may be higher or lower than the performance shown. Total returns for periods less than one year are not annualized. Investment return and principal value will fluctuate, and redemption value may be more or less than original cost. Data assumes reinvestment of dividends and capital gains, and none of the charts reflect the deduction of taxes that a shareholder would pay on fund distributions or the redemption of fund shares. To obtain performance data current to the most recent month end, please call 1-800-345-2021 or visit americancentury.com. For additional information about the fund, please consult the prospectus.
|
|
| Growth of $10,000 Over 10 Years |
| $10,000 investment made October 31, 2009 |
| Performance for other share classes will vary due to differences in fee structure. |
|
| |
| Value on October 31, 2019 |
| | Investor Class — $35,762 |
| |
| | Russell 3000 Growth Index — $41,393 |
| |
|
| | | | |
| Total Annual Fund Operating Expenses |
| Investor Class | I Class | A Class | C Class | R Class |
| 1.00% | 0.80% | 1.25% | 2.00% | 1.50% |
The total annual fund operating expenses shown is as stated in the fund’s prospectus current as of the date of this report. The prospectus may vary from the expense ratio shown elsewhere in this report because it is based on a different time period, includes acquired fund fees and expenses, and, if applicable, does not include fee waivers or expense reimbursements.
Data presented reflect past performance. Past performance is no guarantee of future results. Current performance may be higher or lower than the performance shown. Total returns for periods less than one year are not annualized. Investment return and principal value will fluctuate, and redemption value may be more or less than original cost. Data assumes reinvestment of dividends and capital gains, and none of the charts reflect the deduction of taxes that a shareholder would pay on fund distributions or the redemption of fund shares. To obtain performance data current to the most recent month end, please call 1-800-345-2021 or visit americancentury.com. For additional information about the fund, please consult the prospectus.
Portfolio Managers: Gregory Woodhams and Joe Reiland
On February 21, 2020, the All Cap Growth Fund will merge into the Growth Fund. After the close of business on February 18, 2020, the All Cap Growth Fund will close to all new investments.
Performance Summary
All Cap Growth returned 16.52%* for the 12 months ended October 31, 2019, outpacing the 16.34% return of the portfolio’s benchmark, the Russell 3000 Growth Index.
U.S. stocks posted solid returns during the reporting period. Growth stocks outperformed value stocks by a wide margin across all capitalization ranges. Within the Russell 3000 Growth Index, all sectors posted gains except for energy, which fell sharply along with the declining price of oil.
Stock selection in the information technology, consumer staples and health care sectors helped drive outperformance relative to the Russell 3000 Growth Index. Stock choices in the financials, energy and consumer discretionary sectors detracted from relative performance.
Information Technology Stocks Were Top Contributors
Stock choices in the semiconductors and semiconductor equipment industries benefited relative performance in the information technology sector. Semiconductor equipment company ASML Holding outperformed on strong new orders as it expands its market opportunity set into memory chip manufacturers. ASML’s technology allows producing smaller and more efficient semiconductors. Semiconductor equipment company Applied Materials also outperformed after reporting solid quarterly results. Chipmaker Broadcom was a top contributor. The company raised guidance for 2019. Broadcom’s acquisition of CA Technologies was viewed as driving sales going forward. In the IT services industry, MasterCard outperformed. The payment services company was a significant contributor as its stock price increased after reporting earnings that beat expectations. The market also had a positive response to an acquisition that helps its customers’ bill-payment processes.
Household products stocks aided performance in the consumer staples sector. The stock price of The Procter & Gamble Company outperformed as the consumer products company posted its best organic growth quarter in more than a decade. It also benefited from a more defensive market posture as interest rates declined.
Financials and Energy Stocks Hampered Performance
Stock selection among capital markets firms detracted from relative performance, led by our holding of The Charles Schwab Corp. Stock decisions in energy and an overweight allocation to the sector relative to the benchmark hampered performance. Concho Resources was a significant detractor. We eliminated this oil and gas production company after it reported disappointing quarterly production.
Other significant detractors included Tapestry. We eliminated the stock of this luxury goods holding company, which reported disappointing quarterly results and provided weak guidance for next year. Tapestry’s acquisition of Kate Spade has not worked out as management had anticipated. XPO Logistics was a key detractor. We eliminated the stock of this freight and logistics company on concerns about its leveraged share buyback program. We thought it was late in the economic cycle to add debt to the balance sheet. We were also worried about increasing competition in XPO’s
*All fund returns referenced in this commentary are for Investor Class shares. Performance for other share classes will vary due to differences in fee structure; when Investor Class performance exceeds that of the fund’s benchmark, other share classes may not. See page 3 for returns for all share classes.
freight brokerage and last-mile delivery businesses. Health insurer Humana was caught up in concerns about proposed Medicare for All legislation. Humana’s Medicare Advantage is a key program for the company. We eliminated the holding.
Outlook
Our investment process focuses on companies of all capitalization sizes with improving business fundamentals. The fund’s positioning remains largely stock specific. As of October 31, 2019, the largest overweight allocations relative to the benchmark were in the communication services and consumer discretionary sectors. The portfolio was underweight industrials and health care.
|
| |
| OCTOBER 31, 2019 | |
| Top Ten Holdings | % of net assets |
| Microsoft Corp. | 8.3% |
| Alphabet, Inc., Class A | 8.0% |
| Amazon.com, Inc. | 7.2% |
| Apple, Inc. | 5.7% |
| MasterCard, Inc., Class A | 4.3% |
| Facebook, Inc., Class A | 3.9% |
| Visa, Inc., Class A | 2.7% |
| UnitedHealth Group, Inc. | 2.5% |
| Union Pacific Corp. | 2.4% |
| Walt Disney Co. (The) | 2.4% |
| | |
| Top Five Industries | % of net assets |
| Software | 12.5% |
| Interactive Media and Services | 12.3% |
| IT Services | 9.7% |
| Internet and Direct Marketing Retail | 7.2% |
| Technology Hardware, Storage and Peripherals | 5.7% |
| | |
| Types of Investments in Portfolio | % of net assets |
| Common Stocks | 99.6% |
| Temporary Cash Investments | 0.3% |
| Temporary Cash Investments - Securities Lending Collateral | 0.5% |
| Other Assets and Liabilities | (0.4)% |
Fund shareholders may incur two types of costs: (1) transaction costs, including sales charges (loads) on purchase payments and redemption/exchange fees; and (2) ongoing costs, including management fees; distribution and service (12b-1) fees; and other fund expenses. This example is intended to help you understand your ongoing costs (in dollars) of investing in your fund and to compare these costs with the ongoing cost of investing in other mutual funds.
The example is based on an investment of $1,000 made at the beginning of the period and held for the entire period from May 1, 2019 to October 31, 2019.
Actual Expenses
The table provides information about actual account values and actual expenses for each class. You may use the information, together with the amount you invested, to estimate the expenses that you paid over the period. First, identify the share class you own. Then simply divide your account value by $1,000 (for example, an $8,600 account value divided by $1,000 = 8.6), then multiply the result by the number under the heading “Expenses Paid During Period” to estimate the expenses you paid on your account during this period.
If you hold Investor Class shares of any American Century Investments fund, or I Class shares of the American Century Diversified Bond Fund, in an American Century Investments account (i.e., not a financial intermediary or retirement plan account), American Century Investments may charge you a $12.50 semiannual account maintenance fee if the value of those shares is less than $10,000. We will redeem shares automatically in one of your accounts to pay the $12.50 fee. In determining your total eligible investment amount, we will include your investments in all personal accounts (including American Century Investments Brokerage accounts) registered under your Social Security number. Personal accounts include individual accounts, joint accounts, UGMA/UTMA accounts, personal trusts, Coverdell Education Savings Accounts and IRAs (including traditional, Roth, Rollover, SEP-, SARSEP- and SIMPLE-IRAs), and certain other retirement accounts. If you have only business, business retirement, employer-sponsored or American Century Investments Brokerage accounts, you are currently not subject to this fee. If you are subject to the Account Maintenance Fee, your account value could be reduced by the fee amount.
Hypothetical Example for Comparison Purposes
The table also provides information about hypothetical account values and hypothetical expenses based on the actual expense ratio of each class of your fund and an assumed rate of return of 5% per year before expenses, which is not the actual return of a fund’s share class. The hypothetical account values and expenses may not be used to estimate the actual ending account balance or expenses you paid for the period. You may use this information to compare the ongoing costs of investing in your fund and other funds. To do so, compare this 5% hypothetical example with the 5% hypothetical examples that appear in the shareholder reports of the other funds.
Please note that the expenses shown in the table are meant to highlight your ongoing costs only and do not reflect any transactional costs, such as sales charges (loads) or redemption/exchange fees. Therefore, the table is useful in comparing ongoing costs only, and will not help you determine the relative total costs of owning different funds. In addition, if these transactional costs were included, your costs would have been higher.
|
| | | | |
| Beginning
Account Value
5/1/19 | Ending
Account Value
10/31/19 | Expenses Paid
During Period(1)
5/1/19 - 10/31/19 |
Annualized
Expense Ratio(1) |
| Actual | | | | |
| Investor Class | $1,000 | $1,031.30 | $5.12 | 1.00% |
| I Class | $1,000 | $1,032.30 | $4.10 | 0.80% |
| A Class | $1,000 | $1,030.10 | $6.40 | 1.25% |
| C Class | $1,000 | $1,026.20 | $10.21 | 2.00% |
| R Class | $1,000 | $1,028.80 | $7.67 | 1.50% |
| Hypothetical | | | | |
| Investor Class | $1,000 | $1,020.16 | $5.09 | 1.00% |
| I Class | $1,000 | $1,021.17 | $4.08 | 0.80% |
| A Class | $1,000 | $1,018.90 | $6.36 | 1.25% |
| C Class | $1,000 | $1,015.12 | $10.16 | 2.00% |
| R Class | $1,000 | $1,017.64 | $7.63 | 1.50% |
| |
| (1) | Expenses are equal to the class's annualized expense ratio listed in the table above, multiplied by the average account value over the period, multiplied by 184, the number of days in the most recent fiscal half-year, divided by 365, to reflect the one-half year period. Annualized expense ratio reflects actual expenses, including any applicable fee waivers or expense reimbursements and excluding any acquired fund fees and expenses. |
OCTOBER 31, 2019
|
| | | | |
| | Shares | Value |
| COMMON STOCKS — 99.6% | | |
| Aerospace and Defense — 2.7% | | |
| Boeing Co. (The) | 22,638 | $ | 7,694,882 |
|
| Lockheed Martin Corp. | 64,294 | 24,218,264 |
|
| | | 31,913,146 |
|
| Airlines — 0.6% | | |
| Delta Air Lines, Inc. | 131,566 | 7,246,655 |
|
| Auto Components — 0.1% | | |
| Aptiv plc | 19,712 | 1,765,210 |
|
| Biotechnology — 1.6% | | |
Biogen, Inc.(1) | 24,222 | 7,235,353 |
|
Vertex Pharmaceuticals, Inc.(1) | 62,639 | 12,244,672 |
|
| | | 19,480,025 |
|
| Capital Markets — 1.1% | | |
| Charles Schwab Corp. (The) | 318,646 | 12,972,079 |
|
| Chemicals — 1.3% | | |
| Dow, Inc. | 309,467 | 15,624,989 |
|
| Communications Equipment — 1.0% | | |
Arista Networks, Inc.(1) | 49,154 | 12,021,594 |
|
| Consumer Finance — 0.6% | | |
| American Express Co. | 58,098 | 6,813,733 |
|
| Electronic Equipment, Instruments and Components — 1.1% | | |
| CDW Corp. | 99,001 | 12,663,218 |
|
| Entertainment — 3.3% | | |
Liberty Media Corp-Liberty Formula One, Class C(1) | 76,282 | 3,241,985 |
|
Take-Two Interactive Software, Inc.(1) | 66,991 | 8,062,367 |
|
| Walt Disney Co. (The) | 218,662 | 28,408,567 |
|
| | | 39,712,919 |
|
| Equity Real Estate Investment Trusts (REITs) — 3.1% | | |
| Equity Residential | 131,517 | 11,660,297 |
|
| SBA Communications Corp. | 105,616 | 25,416,491 |
|
| | | 37,076,788 |
|
| Food and Staples Retailing — 0.9% | | |
| Walmart, Inc. | 88,129 | 10,334,006 |
|
| Food Products — 0.7% | | |
Beyond Meat, Inc.(1)(2) | 24,096 | 2,034,907 |
|
| Mondelez International, Inc., Class A | 118,537 | 6,217,266 |
|
| | | 8,252,173 |
|
| Health Care Equipment and Supplies — 4.1% | | |
| Baxter International, Inc. | 242,809 | 18,623,450 |
|
Boston Scientific Corp.(1) | 275,975 | 11,508,158 |
|
Edwards Lifesciences Corp.(1) | 34,378 | 8,195,028 |
|
IDEXX Laboratories, Inc.(1) | 6,347 | 1,808,958 |
|
|
| | | | |
| | Shares | Value |
Intuitive Surgical, Inc.(1) | 15,663 | $ | 8,660,856 |
|
| | | 48,796,450 |
|
| Health Care Providers and Services — 2.7% | | |
| Quest Diagnostics, Inc. | 33,721 | 3,414,251 |
|
| UnitedHealth Group, Inc. | 116,015 | 29,316,991 |
|
| | | 32,731,242 |
|
| Hotels, Restaurants and Leisure — 4.6% | | |
Chipotle Mexican Grill, Inc.(1) | 7,676 | 5,973,156 |
|
| Darden Restaurants, Inc. | 95,289 | 10,698,096 |
|
| Domino's Pizza, Inc. | 43,354 | 11,775,814 |
|
| Las Vegas Sands Corp. | 117,246 | 7,250,493 |
|
| Royal Caribbean Cruises Ltd. | 178,969 | 19,477,196 |
|
| | | 55,174,755 |
|
| Household Products — 1.7% | | |
| Church & Dwight Co., Inc. | 105,620 | 7,387,063 |
|
| Procter & Gamble Co. (The) | 100,907 | 12,563,930 |
|
| | | 19,950,993 |
|
| Insurance — 0.6% | | |
| Progressive Corp. (The) | 102,023 | 7,111,003 |
|
| Interactive Media and Services — 12.3% | | |
Alphabet, Inc., Class A(1) | 75,495 | 95,033,106 |
|
Facebook, Inc., Class A(1) | 242,735 | 46,520,163 |
|
Twitter, Inc.(1) | 174,342 | 5,225,029 |
|
| | | 146,778,298 |
|
| Internet and Direct Marketing Retail — 7.2% | | |
Amazon.com, Inc.(1) | 48,573 | 86,297,706 |
|
| IT Services — 9.7% | | |
Fastly, Inc., Class A(1)(2) | 142,168 | 2,846,203 |
|
| MasterCard, Inc., Class A | 185,536 | 51,358,220 |
|
PayPal Holdings, Inc.(1) | 228,768 | 23,814,749 |
|
VeriSign, Inc.(1) | 23,484 | 4,462,430 |
|
| Visa, Inc., Class A | 182,931 | 32,719,039 |
|
| | | 115,200,641 |
|
| Life Sciences Tools and Services — 0.8% | | |
| Agilent Technologies, Inc. | 33,478 | 2,535,958 |
|
Illumina, Inc.(1) | 22,636 | 6,689,391 |
|
| | | 9,225,349 |
|
| Machinery — 1.5% | | |
| Cummins, Inc. | 106,150 | 18,308,752 |
|
| Multiline Retail — 0.5% | | |
| Target Corp. | 57,165 | 6,111,510 |
|
| Personal Products — 0.6% | | |
| Estee Lauder Cos., Inc. (The), Class A | 39,711 | 7,396,968 |
|
| Pharmaceuticals — 3.7% | | |
| Merck & Co., Inc. | 284,795 | 24,680,335 |
|
| Novo Nordisk A/S, B Shares | 262,694 | 14,463,464 |
|
| Zoetis, Inc. | 39,818 | 5,093,518 |
|
| | | 44,237,317 |
|
|
| | | | |
| | Shares | Value |
| Road and Rail — 2.7% | | |
Lyft, Inc., Class A(1) | 93,253 | $ | 3,864,405 |
|
| Union Pacific Corp. | 172,568 | 28,553,101 |
|
| | | 32,417,506 |
|
| Semiconductors and Semiconductor Equipment — 5.5% | | |
| Analog Devices, Inc. | 99,756 | 10,636,982 |
|
| Applied Materials, Inc. | 208,006 | 11,286,406 |
|
| ASML Holding NV | 66,114 | 17,344,951 |
|
| Broadcom, Inc. | 90,352 | 26,459,583 |
|
| | | 65,727,922 |
|
| Software — 12.5% | | |
Adobe, Inc.(1) | 58,943 | 16,382,028 |
|
Datadog, Inc., Class A(1)(2) | 57,187 | 1,920,911 |
|
| Microsoft Corp. | 687,341 | 98,544,079 |
|
PagerDuty, Inc.(1) | 174,985 | 4,022,905 |
|
Palo Alto Networks, Inc.(1) | 36,397 | 8,276,314 |
|
salesforce.com, Inc.(1) | 112,951 | 17,675,702 |
|
Zendesk, Inc.(1) | 17,288 | 1,221,397 |
|
Zoom Video Communications, Inc., Class A(1)(2) | 12,756 | 891,517 |
|
| | | 148,934,853 |
|
| Specialty Retail — 3.1% | | |
| Home Depot, Inc. (The) | 68,388 | 16,042,457 |
|
| TJX Cos., Inc. (The) | 353,209 | 20,362,499 |
|
| | | 36,404,956 |
|
| Technology Hardware, Storage and Peripherals — 5.7% | | |
| Apple, Inc. | 274,786 | 68,355,765 |
|
| Textiles, Apparel and Luxury Goods — 2.0% | | |
| NIKE, Inc., Class B | 264,823 | 23,714,900 |
|
TOTAL COMMON STOCKS
(Cost $722,461,403) | | 1,188,753,421 |
|
| TEMPORARY CASH INVESTMENTS — 0.3% | | |
| Repurchase Agreement, BMO Capital Markets Corp., (collateralized by various U.S. Treasury obligations, 1.625% - 2.25%, 3/31/21 - 5/15/26, valued at $3,155,121), in a joint trading account at 1.50%, dated 10/31/19, due 11/1/19 (Delivery value $3,089,529) | | 3,089,401 |
|
| Repurchase Agreement, Fixed Income Clearing Corp., (collateralized by various U.S. Treasury obligations, 1.625%, 9/30/26, valued at $1,055,190), at 0.65%, dated 10/31/19, due 11/1/19 (Delivery value $1,031,019) | | 1,031,000 |
|
| State Street Institutional U.S. Government Money Market Fund, Premier Class | 1,515 | 1,515 |
|
TOTAL TEMPORARY CASH INVESTMENTS
(Cost $4,121,916) | | 4,121,916 |
|
TEMPORARY CASH INVESTMENTS - SECURITIES LENDING COLLATERAL(3) — 0.5% |
State Street Navigator Securities Lending Government Money Market Portfolio
(Cost $5,413,498) | 5,413,498 | 5,413,498 |
|
TOTAL INVESTMENT SECURITIES — 100.4%
(Cost $731,996,817) | | 1,198,288,835 |
|
| OTHER ASSETS AND LIABILITIES — (0.4)% | | (5,112,890 | ) |
| TOTAL NET ASSETS — 100.0% | | $ | 1,193,175,945 |
|
|
| | | | | | | | | | |
| FORWARD FOREIGN CURRENCY EXCHANGE CONTRACTS |
| Currency Purchased | Currency Sold | Counterparty | Settlement Date | Unrealized Appreciation
(Depreciation) |
| EUR | 677,036 |
| USD | 744,942 |
| Credit Suisse AG | 12/31/19 | $ | 13,247 |
|
| EUR | 1,026,426 |
| USD | 1,133,763 |
| Credit Suisse AG | 12/31/19 | 15,694 |
|
| EUR | 792,834 |
| USD | 875,233 |
| Credit Suisse AG | 12/31/19 | 12,633 |
|
| EUR | 124,931 |
| USD | 138,474 |
| Credit Suisse AG | 12/31/19 | 1,432 |
|
| EUR | 654,529 |
| USD | 731,573 |
| Credit Suisse AG | 12/31/19 | 1,410 |
|
| EUR | 13,816,504 |
| USD | 15,482,180 |
| Credit Suisse AG | 12/31/19 | (9,575 | ) |
| USD | 17,918,474 |
| EUR | 16,079,610 |
| Credit Suisse AG | 12/31/19 | (88,502 | ) |
| USD | 512,996 |
| EUR | 466,182 |
| Credit Suisse AG | 12/31/19 | (9,065 | ) |
| USD | 150,826 |
| EUR | 135,900 |
| Credit Suisse AG | 12/31/19 | (1,364 | ) |
| USD | 456,864 |
| EUR | 410,568 |
| Credit Suisse AG | 12/31/19 | (2,917 | ) |
| USD | 15,181,017 |
| EUR | 13,566,593 |
| Credit Suisse AG | 12/31/19 | (11,721 | ) |
| USD | 615,602 |
| EUR | 553,374 |
| Goldman Sachs & Co. | 12/31/19 | (4,102 | ) |
| | | | | | | $ | (82,830 | ) |
|
| | |
| NOTES TO SCHEDULE OF INVESTMENTS |
| EUR | - | Euro |
| USD | - | United States Dollar |
| |
| (2) | Security, or a portion thereof, is on loan. At the period end, the aggregate value of securities on loan was $7,212,512. The amount of securities on loan indicated may not correspond with the securities on loan identified because securities with pending sales are in the process of recall from the brokers. |
| |
| (3) | Investment of cash collateral from securities on loan. At the period end, the aggregate market value of the collateral held by the fund was $7,386,450, which includes securities collateral of $1,972,952. |
See Notes to Financial Statements.
|
|
| Statement of Assets and Liabilities |
|
| | | |
| OCTOBER 31, 2019 | |
| Assets | |
| Investment securities, at value (cost of $726,583,319) — including $7,212,512 of securities on loan | $ | 1,192,875,337 |
|
Investment made with cash collateral received for securities on loan, at value
(cost of $5,413,498) | 5,413,498 |
|
| Total investment securities, at value (cost of $731,996,817) | 1,198,288,835 |
|
| Receivable for investments sold | 10,646,842 |
|
| Receivable for capital shares sold | 60,311 |
|
| Unrealized appreciation on forward foreign currency exchange contracts | 44,416 |
|
| Dividends and interest receivable | 311,896 |
|
| Securities lending receivable | 231,515 |
|
| | 1,209,583,815 |
|
| | |
| Liabilities | |
| Payable for collateral received for securities on loan | 5,413,498 |
|
| Payable for investments purchased | 9,668,499 |
|
| Payable for capital shares redeemed | 190,923 |
|
| Unrealized depreciation on forward foreign currency exchange contracts | 127,246 |
|
| Accrued management fees | 994,814 |
|
| Distribution and service fees payable | 12,890 |
|
| | 16,407,870 |
|
| | |
| Net Assets | $ | 1,193,175,945 |
|
| | |
| Net Assets Consist of: | |
| Capital (par value and paid-in surplus) | $ | 649,854,272 |
|
| Distributable earnings | 543,321,673 |
|
| | $ | 1,193,175,945 |
|
|
| | | | | | |
| | Net Assets | Shares Outstanding | Net Asset Value Per Share |
| Investor Class, $0.01 Par Value |
| $1,152,249,077 |
| 32,354,718 |
| $35.61 |
| I Class, $0.01 Par Value |
| $7,796,243 |
| 214,086 |
| $36.42 |
| A Class, $0.01 Par Value |
| $13,143,177 |
| 379,793 |
| $34.61* |
| C Class, $0.01 Par Value |
| $4,267,980 |
| 134,648 |
| $31.70 |
| R Class, $0.01 Par Value |
| $15,719,468 |
| 467,655 |
| $33.61 |
*Maximum offering price $36.72 (net asset value divided by 0.9425).
See Notes to Financial Statements.
|
| | | |
| YEAR ENDED OCTOBER 31, 2019 | |
| Investment Income (Loss) | |
| Income: | |
| Dividends (net of foreign taxes withheld of $72,367) | $ | 12,815,163 |
|
| Securities lending, net | 564,548 |
|
| Interest | 168,161 |
|
| | 13,547,872 |
|
| | |
| Expenses: | |
| Management fees | 11,420,947 |
|
| Distribution and service fees: | |
| A Class | 31,058 |
|
| C Class | 45,429 |
|
| R Class | 76,809 |
|
| Directors' fees and expenses | 35,336 |
|
| Other expenses | 1,799 |
|
| | 11,611,378 |
|
| | |
| Net investment income (loss) | 1,936,494 |
|
| | |
| Realized and Unrealized Gain (Loss) | |
| Net realized gain (loss) on: | |
| Investment transactions | 78,410,219 |
|
| Forward foreign currency exchange contract transactions | 1,357,920 |
|
| Foreign currency translation transactions | 2,204 |
|
| | 79,770,343 |
|
| | |
| Change in net unrealized appreciation (depreciation) on: | |
| Investments | 93,447,821 |
|
| Forward foreign currency exchange contracts | (627,855 | ) |
| Translation of assets and liabilities in foreign currencies | (240 | ) |
| | 92,819,726 |
|
| | |
| Net realized and unrealized gain (loss) | 172,590,069 |
|
| | |
| Net Increase (Decrease) in Net Assets Resulting from Operations | $ | 174,526,563 |
|
See Notes to Financial Statements.
|
|
| Statement of Changes in Net Assets |
|
| | | | | | |
| YEARS ENDED OCTOBER 31, 2019 AND OCTOBER 31, 2018 |
| Increase (Decrease) in Net Assets | October 31, 2019 | October 31, 2018 |
| Operations | | |
| Net investment income (loss) | $ | 1,936,494 |
| $ | (856,024 | ) |
| Net realized gain (loss) | 79,770,343 |
| 122,878,958 |
|
| Change in net unrealized appreciation (depreciation) | 92,819,726 |
| (23,167,035 | ) |
| Net increase (decrease) in net assets resulting from operations | 174,526,563 |
| 98,855,899 |
|
| | | |
| Distributions to Shareholders | | |
| From earnings: | | |
| Investor Class | (118,545,212 | ) | (86,141,596 | ) |
| I Class | (288,902 | ) | (157,527 | ) |
| A Class | (1,367,358 | ) | (841,233 | ) |
| C Class | (578,641 | ) | (384,114 | ) |
| R Class | (1,764,994 | ) | (1,261,456 | ) |
| Decrease in net assets from distributions | (122,545,107 | ) | (88,785,926 | ) |
| | | |
| Capital Share Transactions | | |
| Net increase (decrease) in net assets from capital share transactions (Note 5) | 26,164,959 |
| (8,606,955 | ) |
| | | |
| Net increase (decrease) in net assets | 78,146,415 |
| 1,463,018 |
|
| | | |
| Net Assets | | |
| Beginning of period | 1,115,029,530 |
| 1,113,566,512 |
|
| End of period | $ | 1,193,175,945 |
| $ | 1,115,029,530 |
|
See Notes to Financial Statements.
|
|
| Notes to Financial Statements |
OCTOBER 31, 2019
1. Organization
American Century Mutual Funds, Inc. (the corporation) is registered under the Investment Company Act of 1940, as amended (the 1940 Act), as an open-end management investment company and is organized as a Maryland corporation. All Cap Growth Fund (the fund) is one fund in a series issued by the corporation. The fund's investment objective is to seek long-term capital growth.
The fund offers the Investor Class, I Class, A Class, C Class and R Class. The A Class may incur an initial sales charge. The A Class and C Class may be subject to a contingent deferred sales charge.
2. Significant Accounting Policies
The following is a summary of significant accounting policies consistently followed by the fund in preparation of its financial statements. The fund is an investment company and follows accounting and reporting guidance in accordance with accounting principles generally accepted in the United States of America. This may require management to make certain estimates and assumptions at the date of the financial statements. Actual results could differ from these estimates. Management evaluated the impact of events or transactions occurring through the date the financial statements were issued that would merit recognition or disclosure.
Investment Valuations — The fund determines the fair value of its investments and computes its net asset value per share at the close of regular trading (usually 4 p.m. Eastern time) on the New York Stock Exchange (NYSE) on each day the NYSE is open. The Board of Directors has adopted valuation policies and procedures to guide the investment advisor in the fund’s investment valuation process and to provide methodologies for the oversight of the fund’s pricing function.
Equity securities that are listed or traded on a domestic securities exchange are valued at the last reported sales price or at the official closing price as provided by the exchange. Equity securities traded on foreign securities exchanges are generally valued at the closing price of such securities on the exchange where primarily traded or at the close of the NYSE, if that is earlier. If no last sales price is reported, or if local convention or regulation so provides, the mean of the latest bid and asked prices may be used. Securities traded over-the-counter are valued at the mean of the latest bid and asked prices, the last sales price, or the official closing price. Equity securities initially expressed in local currencies are translated into U.S. dollars at the mean of the appropriate currency exchange rate at the close of the NYSE as provided by an independent pricing service.
Open-end management investment companies are valued at the reported net asset value per share. Repurchase agreements are valued at cost, which approximates fair value. Forward foreign currency exchange contracts are valued at the mean of the appropriate forward exchange rate at the close of the NYSE as provided by an independent pricing service.
If the fund determines that the market price for an investment is not readily available or the valuation methods mentioned above do not reflect an investment’s fair value, such investment is valued as determined in good faith by the Board of Directors or its delegate, in accordance with policies and procedures adopted by the Board of Directors. In its determination of fair value, the fund may review several factors including, but not limited to, market information regarding the specific investment or comparable investments and correlation with other investment types, futures indices or general market indicators. Circumstances that may cause the fund to use these procedures to value an investment include, but are not limited to: an investment has been declared in default or is distressed; trading in a security has been suspended during the trading day or a security is not actively trading on its principal exchange; prices received from a regular pricing source are deemed unreliable; or there is a foreign market holiday and no trading occurred.
The fund monitors for significant events occurring after the close of an investment’s primary exchange but before the fund’s net asset value per share is determined. Significant events may include, but are not limited to: corporate announcements and transactions; governmental action and political unrest that could impact a specific investment or an investment sector; or armed conflicts, natural disasters and similar events that could affect investments in a specific country or region. The fund also monitors for significant fluctuations between domestic and foreign markets, as evidenced by the U.S. market or such other indicators that the Board of Directors, or its delegate, deems appropriate. The fund may apply a model-derived factor to the closing price of equity securities traded on foreign securities exchanges. The factor is based on observable market data as provided by an independent pricing service.
Security Transactions — Security transactions are accounted for as of the trade date. Net realized gains and losses are determined on the identified cost basis, which is also used for federal income tax purposes.
Investment Income — Dividend income less foreign taxes withheld, if any, is recorded as of the ex-dividend date. Distributions received on securities that represent a return of capital or long-term capital gain are recorded as a reduction of cost of investments and/or as a realized gain. The fund may estimate the components of distributions received that may be considered nontaxable distributions or long-term capital gain distributions for income tax purposes. Interest income is recorded on the accrual basis and includes accretion of discounts and amortization of premiums. Securities lending income is net of fees and rebates earned by the lending agent for its services.
Foreign Currency Translations — All assets and liabilities initially expressed in foreign currencies are translated into U.S. dollars at prevailing exchange rates at period end. The fund may enter into spot foreign currency exchange contracts to facilitate transactions denominated in a foreign currency. Purchases and sales of investment securities, dividend and interest income, spot foreign currency exchange contracts, and expenses are translated at the rates of exchange prevailing on the respective dates of such transactions. Net realized and unrealized foreign currency exchange gains or losses related to investment securities are a component of net realized gain (loss) on investment transactions and change in net unrealized appreciation (depreciation) on investments, respectively.
Repurchase Agreements — The fund may enter into repurchase agreements with institutions that American Century Investment Management, Inc. (ACIM) (the investment advisor) has determined are creditworthy pursuant to criteria adopted by the Board of Directors. The fund requires that the collateral, represented by securities, received in a repurchase transaction be transferred to the custodian in a manner sufficient to enable the fund to obtain those securities in the event of a default under the repurchase agreement. ACIM monitors, on a daily basis, the securities transferred to ensure the value, including accrued interest, of the securities under each repurchase agreement is equal to or greater than amounts owed to the fund under each repurchase agreement.
Joint Trading Account — Pursuant to an Exemptive Order issued by the Securities and Exchange Commission, the fund, along with certain other funds in the American Century Investments family of funds, may transfer uninvested cash balances into a joint trading account. These balances are invested in one or more repurchase agreements that are collateralized by U.S. Treasury or Agency obligations.
Segregated Assets — In accordance with the 1940 Act, the fund segregates assets on its books and records to cover certain types of investment securities and other financial instruments. ACIM monitors, on a daily basis, the securities segregated to ensure the fund designates a sufficient amount of liquid assets, marked-to-market daily. The fund may also receive assets or be required to pledge assets at the custodian bank or with a broker for collateral requirements.
Income Tax Status — It is the fund’s policy to distribute substantially all net investment income and net realized gains to shareholders and to otherwise qualify as a regulated investment company under provisions of the Internal Revenue Code. Accordingly, no provision has been made for income taxes. The fund files U.S. federal, state, local and non-U.S. tax returns as applicable. The fund's tax returns are subject to examination by the relevant taxing authority until expiration of the applicable statute of limitations, which is generally three years from the date of filing but can be longer in certain jurisdictions. At this time, management believes there are no uncertain tax positions which, based on their technical merit, would not be sustained upon examination and for which it is reasonably possible that the total amounts of unrecognized tax benefits will significantly change in the next twelve months.
Multiple Class — All shares of the fund represent an equal pro rata interest in the net assets of the class to which such shares belong, and have identical voting, dividend, liquidation and other rights and the same terms and conditions, except for class specific expenses and exclusive rights to vote on matters affecting only individual classes. Income, non-class specific expenses, and realized and unrealized capital gains and losses of the fund are allocated to each class of shares based on their relative net assets.
Distributions to Shareholders — Distributions from net investment income and net realized gains, if any, are generally declared and paid annually. The fund may elect to treat a portion of its payment to a redeeming shareholder, which represents the pro rata share of undistributed net investment income and net realized gains, as a distribution for federal income tax purposes (tax equalization).
Indemnifications — Under the corporation’s organizational documents, its officers and directors are indemnified against certain liabilities arising out of the performance of their duties to the fund. In addition, in the normal course of business, the fund enters into contracts that provide general indemnifications. The maximum exposure under these arrangements is unknown as this would involve future claims that may be made against a fund. The risk of material loss from such claims is considered by management to be remote.
Securities Lending — Securities are lent to qualified financial institutions and brokers. State Street Bank & Trust Co. serves as securities lending agent to the fund pursuant to a Securities Lending Agreement. The lending of securities exposes the fund to risks such as: the borrowers may fail to return the loaned securities, the borrowers may not be able to provide additional collateral, the fund may experience delays in recovery of the loaned securities or delays in access to collateral, or the fund may experience losses related to the investment collateral. To minimize certain risks, loan counterparties pledge collateral in the form of cash and/or securities. The lending agent has agreed to indemnify the fund in the case of default of any securities borrowed. Cash collateral received is invested in the State Street Navigator Securities Lending Government Money Market Portfolio, a money market mutual fund registered under the 1940 Act. The loans may also be secured by U.S. government securities in an amount at least equal to the market value of the securities loaned, plus accrued interest and dividends, determined on a daily basis and adjusted accordingly. By lending securities, the fund seeks to increase its net investment income through the receipt of interest and fees. Such income is reflected separately within the Statement of Operations. The value of loaned securities and related collateral outstanding at period end, if any, are shown on a gross basis within the Schedule of Investments and Statement of Assets and Liabilities.
The following table reflects a breakdown of transactions accounted for as secured borrowings, the gross obligation by the type of collateral pledged, and the remaining contractual maturity of those transactions as of October 31, 2019.
|
| | | | | | | | | | | | |
| Remaining Contractual Maturity of Agreements |
| | Overnight and
Continuous | <30 days | Between
30 & 90 days | >90 days | Total |
Securities Lending Transactions(1) | | | | |
| Common Stocks | $ | 5,413,498 |
| — |
| — |
| — |
| $ | 5,413,498 |
|
| Gross amount of recognized liabilities for securities lending transactions | $ | 5,413,498 |
|
| |
| (1) | Amount represents the payable for cash collateral received for securities on loan. This will generally be in the Overnight and Continuous column as the securities are typically callable on demand. |
3. Fees and Transactions with Related Parties
Certain officers and directors of the corporation are also officers and/or directors of American Century Companies, Inc. (ACC). The corporation’s investment advisor, ACIM, the corporation's distributor, American Century Investment Services, Inc. (ACIS), and the corporation’s transfer agent, American Century Services, LLC, are wholly owned, directly or indirectly, by ACC.
Management Fees — The corporation has entered into a management agreement with ACIM, under which ACIM provides the fund with investment advisory and management services in exchange for a single, unified management fee (the fee) per class. The agreement provides that all expenses of managing and operating the fund, except distribution and service fees, brokerage expenses, taxes, interest, fees and expenses of the independent directors (including legal counsel fees), and extraordinary expenses, will be paid by ACIM. The fee is computed and accrued daily based on each class's daily net assets and paid monthly in arrears. The difference in the fee among the classes is a result of their separate arrangements for non-Rule 12b-1 shareholder services. It is not the result of any difference in advisory or custodial fees or other expenses related to the management of the fund’s assets, which do not vary by class.
The annual management fee for each class is as follows:
|
| | | | |
| Investor Class | I Class | A Class | C Class | R Class |
| 1.000% | 0.800% | 1.000% | 1.000% | 1.000% |
Distribution and Service Fees — The Board of Directors has adopted a separate Master Distribution and Individual Shareholder Services Plan for each of the A Class, C Class and R Class (collectively the plans), pursuant to Rule 12b-1 of the 1940 Act. The plans provide that the A Class will pay ACIS an annual distribution and service fee of 0.25%. The plans provide that the C Class will pay ACIS an annual distribution and service fee of 1.00%, of which 0.25% is paid for individual shareholder services and 0.75% is paid for distribution services. The plans provide that the R Class will pay ACIS an annual distribution and service fee of 0.50%. The fees are computed and accrued daily based on each class’s daily net assets and paid monthly in arrears. The fees are used to pay financial intermediaries for distribution and individual shareholder services. Fees incurred under the plans during the period ended October 31, 2019 are detailed in the Statement of Operations.
Directors' Fees and Expenses — The Board of Directors is responsible for overseeing the investment advisor’s management and operations of the fund. The directors receive detailed information about the fund and its investment advisor regularly throughout the year, and meet at least quarterly with management of the investment advisor to review reports about fund operations. The fund’s officers do not receive compensation from the fund.
Interfund Transactions — The fund may enter into security transactions with other American Century Investments funds and other client accounts of the investment advisor, in accordance with the 1940 Act rules and procedures adopted by the Board of Directors. The rules and procedures require, among other things, that these transactions be effected at the independent current market price of the security. During the period, the interfund purchases and sales were $6,633,958 and $1,547,935, respectively. The effect of interfund transactions on the Statement of Operations was $(405,502) in net realized gain (loss) on investment transactions.
4. Investment Transactions
Purchases and sales of investment securities, excluding short-term investments, for the period ended October 31, 2019 were $383,919,826 and $472,437,486, respectively.
5. Capital Share Transactions
Transactions in shares of the fund were as follows:
|
| | | | | | | | | | |
| | Year ended
October 31, 2019 | Year ended
October 31, 2018 |
| | Shares | Amount | Shares | Amount |
| Investor Class/Shares Authorized | 400,000,000 |
| | 275,000,000 |
| |
| Sold | 801,708 |
| $ | 26,580,164 |
| 928,819 |
| $ | 32,780,365 |
|
| Issued in reinvestment of distributions | 4,051,387 |
| 116,193,788 |
| 2,543,226 |
| 84,155,360 |
|
| Redeemed | (3,671,990 | ) | (121,267,873 | ) | (3,645,506 | ) | (128,563,749 | ) |
| | 1,181,105 |
| 21,506,079 |
| (173,461 | ) | (11,628,024 | ) |
| I Class/Shares Authorized | 40,000,000 |
| | 20,000,000 |
| |
| Sold | 179,056 |
| 6,183,442 |
| 34,439 |
| 1,233,710 |
|
| Issued in reinvestment of distributions | 9,605 |
| 281,144 |
| 4,684 |
| 157,527 |
|
| Redeemed | (46,587 | ) | (1,613,282 | ) | (23,193 | ) | (822,320 | ) |
| | 142,074 |
| 4,851,304 |
| 15,930 |
| 568,917 |
|
| A Class/Shares Authorized | 30,000,000 |
| | 20,000,000 |
| |
| Sold | 93,930 |
| 3,061,559 |
| 88,125 |
| 3,055,362 |
|
| Issued in reinvestment of distributions | 48,506 |
| 1,354,292 |
| 25,613 |
| 830,104 |
|
| Redeemed | (121,051 | ) | (3,845,778 | ) | (56,116 | ) | (1,943,945 | ) |
| | 21,385 |
| 570,073 |
| 57,622 |
| 1,941,521 |
|
| C Class/Shares Authorized | 30,000,000 |
| | 20,000,000 |
| |
| Sold | 19,350 |
| 597,346 |
| 22,672 |
| 739,682 |
|
| Issued in reinvestment of distributions | 22,480 |
| 578,641 |
| 12,631 |
| 384,114 |
|
| Redeemed | (57,716 | ) | (1,718,327 | ) | (24,312 | ) | (780,905 | ) |
| | (15,886 | ) | (542,340 | ) | 10,991 |
| 342,891 |
|
| R Class/Shares Authorized | 30,000,000 |
| | 20,000,000 |
| |
| Sold | 85,853 |
| 2,728,115 |
| 122,415 |
| 4,142,899 |
|
| Issued in reinvestment of distributions | 64,937 |
| 1,764,994 |
| 39,756 |
| 1,261,456 |
|
| Redeemed | (151,019 | ) | (4,713,266 | ) | (153,994 | ) | (5,236,615 | ) |
| | (229 | ) | (220,157 | ) | 8,177 |
| 167,740 |
|
| Net increase (decrease) | 1,328,449 |
| $ | 26,164,959 |
| (80,741 | ) | $ | (8,606,955 | ) |
6. Fair Value Measurements
The fund’s investments valuation process is based on several considerations and may use multiple inputs to determine the fair value of the investments held by the fund. In conformity with accounting principles generally accepted in the United States of America, the inputs used to determine a valuation are classified into three broad levels.
| |
| • | Level 1 valuation inputs consist of unadjusted quoted prices in an active market for identical investments. |
| |
| • | Level 2 valuation inputs consist of direct or indirect observable market data (including quoted prices for comparable investments, evaluations of subsequent market events, interest rates, prepayment speeds, credit risk, etc.). These inputs also consist of quoted prices for identical investments initially expressed in local currencies that are adjusted through translation into U.S. dollars. |
| |
| • | Level 3 valuation inputs consist of unobservable data (including a fund’s own assumptions). |
The level classification is based on the lowest level input that is significant to the fair valuation measurement. The valuation inputs are not necessarily an indication of the risks associated with investing in these securities or other financial instruments.
The following is a summary of the level classifications as of period end. The Schedule of Investments provides additional information on the fund’s portfolio holdings.
|
| | | | | | | | |
| | Level 1 | Level 2 | Level 3 |
| Assets | | | |
| Investment Securities | | | |
| Common Stocks | $ | 1,156,945,006 |
| $ | 31,808,415 |
| — |
|
| Temporary Cash Investments | 1,515 |
| 4,120,401 |
| — |
|
| Temporary Cash Investments - Securities Lending Collateral | 5,413,498 |
| — |
| — |
|
| | $ | 1,162,360,019 |
| $ | 35,928,816 |
| — |
|
| Other Financial Instruments | | | |
| Forward Foreign Currency Exchange Contracts | — |
| $ | 44,416 |
| — |
|
| | | | |
| Liabilities | | | |
| Other Financial Instruments | | | |
| Forward Foreign Currency Exchange Contracts | — |
| $ | 127,246 |
| — |
|
7. Derivative Instruments
Foreign Currency Risk — The fund is subject to foreign currency exchange rate risk in the normal course of pursuing its investment objectives. The value of foreign investments held by a fund may be significantly affected by changes in foreign currency exchange rates. The dollar value of a foreign security generally decreases when the value of the dollar rises against the foreign currency in which the security is denominated and tends to increase when the value of the dollar declines against such foreign currency. A fund may enter into forward foreign currency exchange contracts to reduce a fund's exposure to foreign currency exchange rate fluctuations. The net U.S. dollar value of foreign currency underlying all contractual commitments held by a fund and the resulting unrealized appreciation or depreciation are determined daily. Realized gain or loss is recorded upon the termination of the contract. Net realized and unrealized gains or losses occurring during the holding period of forward foreign currency exchange contracts are a component of net realized gain (loss) on forward foreign currency exchange contract transactions and change in net unrealized appreciation (depreciation) on forward foreign currency exchange contracts, respectively. A fund bears the risk of an unfavorable change in the foreign currency exchange rate underlying the forward contract. Additionally, losses, up to the fair value, may arise if the counterparties do not perform under the contract terms. The fund's average U.S. dollar exposure to foreign currency risk derivative instruments held during the period was $22,882,441.
The value of foreign currency risk derivative instruments as of October 31, 2019, is disclosed on the Statement of Assets and Liabilities as an asset of $44,416 in unrealized appreciation on forward foreign currency exchange contracts and a liability of $127,246 in unrealized depreciation on forward foreign currency exchange contracts. For the year ended October 31, 2019, the effect of foreign currency risk derivative instruments on the Statement of Operations was $1,357,920 in net realized gain (loss) on forward foreign currency exchange contract transactions and $(627,855) in change in net unrealized appreciation (depreciation) on forward foreign currency exchange contracts.
8. Federal Tax Information
The tax character of distributions paid during the years ended October 31, 2019 and October 31, 2018 were as follows:
|
| | | | | | |
| | 2019 | 2018 |
| Distributions Paid From | | |
| Ordinary income | — |
| — |
|
| Long-term capital gains | $ | 122,545,107 |
| $ | 88,785,926 |
|
The book-basis character of distributions made during the year from net investment income or net realized gains may differ from their ultimate characterization for federal income tax purposes. These differences reflect the differing character of certain income items and net realized gains and losses for financial statement and tax purposes, and may result in reclassification among certain capital accounts on the financial statements.
As of period end, the federal tax cost of investments and the components of distributable earnings on a tax-basis were as follows:
|
| | | |
| Federal tax cost of investments | $ | 732,436,785 |
|
| Gross tax appreciation of investments | $ | 475,980,413 |
|
| Gross tax depreciation of investments | (10,128,363 | ) |
| Net tax appreciation (depreciation) of investments | 465,852,050 |
|
| Net tax appreciation (depreciation) on derivatives and translation of assets and liabilities in foreign currencies | (240 | ) |
Net tax appreciation (depreciation)
| $ | 465,851,810 |
|
| Undistributed ordinary income | $ | 1,314,358 |
|
| Accumulated long-term gains | $ | 76,155,505 |
|
The difference between book-basis and tax-basis unrealized appreciation (depreciation) is attributable primarily to the tax deferral of losses on wash sales.
9. Corporate Event
On September 11, 2019, the Board of Directors approved an agreement and plan of reorganization (the reorganization), whereby the net assets of the fund will be transferred to Growth Fund, one fund in a series issued by the corporation, in exchange for shares of Growth Fund. The financial statements and performance history of Growth Fund will survive after the reorganization. The reorganization is expected to be effective as of the close of the NYSE on February 21, 2020.
|
| | | | | | | | | | | | | |
| For a Share Outstanding Throughout the Years Ended October 31 (except as noted) |
| Per-Share Data | | | | | | Ratios and Supplemental Data | |
| | | Income From Investment Operations: | | | | Ratio to Average Net Assets of: | | |
| | Net Asset
Value,
Beginning
of Period | Net
Investment
Income
(Loss)(1) | Net
Realized
and
Unrealized
Gain (Loss) | Total From
Investment
Operations | Distributions From Net
Realized Gains | Net Asset
Value,
End
of Period | Total
Return(2) | Operating
Expenses | Net
Investment
Income
(Loss) | Portfolio
Turnover
Rate | Net
Assets,
End of
Period
(in thousands) |
| Investor Class | | | | | | | | | | |
| 2019 | $34.65 | 0.06 | 4.74 | 4.80 | (3.84) | $35.61 | 16.52% | 1.00% | 0.19% | 34% |
| $1,152,249 |
|
| 2018 | $34.51 | (0.02) | 2.94 | 2.92 | (2.78) | $34.65 | 8.83% | 1.00% | (0.06)% | 49% |
| $1,080,124 |
|
| 2017 | $30.56 | (0.01) | 6.41 | 6.40 | (2.45) | $34.51 | 22.43% | 1.01% | (0.03)% | 44% |
| $1,081,686 |
|
| 2016 | $32.53 | (0.03) | 0.08 | 0.05 | (2.02) | $30.56 | 0.24% | 1.00% | (0.09)% | 49% |
| $971,588 |
|
| 2015 | $34.71 | (0.05) | 2.71 | 2.66 | (4.84) | $32.53 | 9.40% | 1.00% | (0.15)% | 43% |
| $1,082,419 |
|
| I Class | | | | | | | | | | |
| 2019 | $35.27 | 0.13 | 4.86 | 4.99 | (3.84) | $36.42 | 16.77% | 0.80% | 0.39% | 34% |
| $7,796 |
|
| 2018 | $35.01 | 0.05 | 2.99 | 3.04 | (2.78) | $35.27 | 9.06% | 0.80% | 0.14% | 49% |
| $2,540 |
|
| 2017 | $30.92 | 0.02 | 6.52 | 6.54 | (2.45) | $35.01 | 22.64% | 0.81% | 0.17% | 44% |
| $1,964 |
|
| 2016 | $32.83 | 0.03 | 0.08 | 0.11 | (2.02) | $30.92 | 0.46% | 0.80% | 0.11% | 49% |
| $318 |
|
| 2015 | $34.92 | 0.01 | 2.74 | 2.75 | (4.84) | $32.83 | 9.60% | 0.80% | 0.05% | 43% |
| $280 |
|
| A Class | | | | | | | | | | |
| 2019 | $33.86 | (0.02) | 4.61 | 4.59 | (3.84) | $34.61 | 16.23% | 1.25% | (0.06)% | 34% |
| $13,143 |
|
| 2018 | $33.86 | (0.11) | 2.89 | 2.78 | (2.78) | $33.86 | 8.56% | 1.25% | (0.31)% | 49% |
| $12,136 |
|
| 2017 | $30.10 | (0.09) | 6.30 | 6.21 | (2.45) | $33.86 | 22.12% | 1.26% | (0.28)% | 44% |
| $10,185 |
|
| 2016 | $32.15 | (0.10) | 0.07 | (0.03) | (2.02) | $30.10 | (0.02)% | 1.25% | (0.34)% | 49% |
| $10,743 |
|
| 2015 | $34.44 | (0.13) | 2.68 | 2.55 | (4.84) | $32.15 | 9.12% | 1.25% | (0.40)% | 43% |
| $10,657 |
|
|
| | | | | | | | | | | | | |
| For a Share Outstanding Throughout the Years Ended October 31 (except as noted) |
| Per-Share Data | | | | | | Ratios and Supplemental Data | |
| | | Income From Investment Operations: | | | | Ratio to Average Net Assets of: | | |
| | Net Asset
Value,
Beginning
of Period | Net
Investment
Income
(Loss)(1) | Net
Realized
and
Unrealized
Gain (Loss) | Total From
Investment
Operations | Distributions From Net
Realized Gains | Net Asset
Value,
End
of Period | Total
Return(2) | Operating
Expenses | Net
Investment
Income
(Loss) | Portfolio
Turnover
Rate | Net
Assets,
End of
Period
(in thousands) |
| C Class | | | | | | | | | | |
| 2019 | $31.57 | (0.24) | 4.21 | 3.97 | (3.84) | $31.70 | 15.38% | 2.00% | (0.81)% | 34% |
| $4,268 |
|
| 2018 | $31.97 | (0.35) | 2.73 | 2.38 | (2.78) | $31.57 | 7.76% | 2.00% | (1.06)% | 49% |
| $4,752 |
|
| 2017 | $28.75 | (0.30) | 5.97 | 5.67 | (2.45) | $31.97 | 21.21% | 2.01% | (1.03)% | 44% |
| $4,461 |
|
| 2016 | $31.02 | (0.31) | 0.06 | (0.25) | (2.02) | $28.75 | (0.77)% | 2.00% | (1.09)% | 49% |
| $4,324 |
|
| 2015 | $33.62 | (0.35) | 2.59 | 2.24 | (4.84) | $31.02 | 8.32% | 2.00% | (1.15)% | 43% |
| $4,656 |
|
| R Class | | | | | | | | | | |
| 2019 | $33.08 | (0.10) | 4.47 | 4.37 | (3.84) | $33.61 | 15.95% | 1.50% | (0.31)% | 34% |
| $15,719 |
|
| 2018 | $33.22 | (0.19) | 2.83 | 2.64 | (2.78) | $33.08 | 8.29% | 1.50% | (0.56)% | 49% |
| $15,478 |
|
| 2017 | $29.65 | (0.16) | 6.18 | 6.02 | (2.45) | $33.22 | 21.79% | 1.51% | (0.53)% | 44% |
| $15,271 |
|
| 2016 | $31.77 | (0.18) | 0.08 | (0.10) | (2.02) | $29.65 | (0.25)% | 1.50% | (0.59)% | 49% |
| $13,809 |
|
| 2015 | $34.16 | (0.20) | 2.65 | 2.45 | (4.84) | $31.77 | 8.87% | 1.50% | (0.65)% | 43% |
| $13,544 |
|
|
|
| Notes to Financial Highlights |
| |
| (1) | Computed using average shares outstanding throughout the period. |
| |
| (2) | Total returns are calculated based on the net asset value of the last business day and do not reflect applicable sales charges, if any. Total returns for periods less than one year are not annualized. |
See Notes to Financial Statements.
|
|
| Report of Independent Registered Public Accounting Firm |
To the Shareholders and the Board of Directors of American Century Mutual Funds, Inc.:
Opinion on the Financial Statements and Financial Highlights
We have audited the accompanying statement of assets and liabilities, including the schedule of investments, of All Cap Growth Fund, one of the funds constituting the American Century Mutual Funds, Inc. (the "Fund"), as of October 31, 2019, the related statement of operations for the year then ended, the statements of changes in net assets for each of the two years in the period then ended, the financial highlights for each of the five years in the period then ended, and the related notes. In our opinion, the financial statements and financial highlights present fairly, in all material respects, the financial position of All Cap Growth Fund of the American Century Mutual Funds, Inc. as of October 31, 2019, the results of its operations for the year then ended, the changes in its net assets for each of the two years in the period then ended, and the financial highlights for each of the five years in the period then ended, in conformity with accounting principles generally accepted in the United States of America.
Basis for Opinion
These financial statements and financial highlights are the responsibility of the Fund's management. Our responsibility is to express an opinion on the Fund’s financial statements and financial highlights based on our audits. We are a public accounting firm registered with the Public Company Accounting Oversight Board (United States) (PCAOB) and are required to be independent with respect to the Fund in accordance with the U.S. federal securities laws and the applicable rules and regulations of the Securities and Exchange Commission and the PCAOB.
We conducted our audits in accordance with the standards of the PCAOB. Those standards require that we plan and perform the audit to obtain reasonable assurance about whether the financial statements and financial highlights are free of material misstatement, whether due to error or fraud. The Fund is not required to have, nor were we engaged to perform, an audit of its internal control over financial reporting. As part of our audits we are required to obtain an understanding of internal control over financial reporting but not for the purpose of expressing an opinion on the effectiveness of the Fund’s internal control over financial reporting. Accordingly, we express no such opinion.
Our audits included performing procedures to assess the risks of material misstatement of the financial statements and financial highlights, whether due to error or fraud, and performing procedures that respond to those risks. Such procedures included examining, on a test basis, evidence regarding the amounts and disclosures in the financial statements and financial highlights. Our audits also included evaluating the accounting principles used and significant estimates made by management, as well as evaluating the overall presentation of the financial statements and financial highlights. Our procedures included confirmation of securities owned as of October 31, 2019, by correspondence with the custodian and brokers; when replies were not received from brokers, we performed other auditing procedures. We believe that our audits provide a reasonable basis for our opinion.
DELOITTE & TOUCHE LLP
Kansas City, Missouri
December 16, 2019
We have served as the auditor of one or more American Century investment companies since 1997.
The Board of Directors
The individuals listed below serve as directors of the funds. Each director will continue to serve in this capacity until death, retirement, resignation or removal from office. The board has adopted a mandatory retirement age for directors who are not “interested persons,” as that term is defined in the Investment Company Act (independent directors). Independent directors shall retire by December 31 of the year in which they reach their 75th birthday.
Mr. Thomas is an “interested person” because he currently serves as President and Chief Executive Officer of American Century Companies, Inc. (ACC), the parent company of American Century Investment Management, Inc. (ACIM or the advisor). The other directors (more than three-fourths of the total number) are independent. They are not employees, directors or officers of, and have no financial interest in, ACC or any of its wholly owned, direct or indirect, subsidiaries, including ACIM, American Century Investment Services, Inc. (ACIS) and American Century Services, LLC (ACS), and they do not have any other affiliations, positions or relationships that would cause them to be considered “interested persons” under the Investment Company Act. The directors serve in this capacity for seven (in the case of Jonathan S. Thomas, 16; and Stephen E. Yates, 8) registered investment companies in the American Century Investments family of funds.
The following table presents additional information about the directors. The mailing address for each director is 4500 Main Street, Kansas City, Missouri 64111.
|
| | | | | |
Name
(Year of Birth) | Position(s) Held with Funds | Length of Time Served | Principal Occupation(s) During Past 5 Years | Number of American Century Portfolios Overseen by Director | Other Directorships Held During Past 5 Years |
| Independent Directors |
|
|
| Thomas W. Bunn (1953) | Director | Since 2017 | Retired | 66 | SquareTwo Financial; Barings (formerly Babson Capital Funds Trust) (2013 to 2016) |
Chris H. Cheesman
(1962)
| Director | Since 2019
| Retired. Senior Vice President & Chief Audit Executive, AllianceBernstein (1999 to 2018)
| 66 | None |
Barry Fink
(1955) | Director | Since 2012 (independent since 2016) | Retired | 66 | None |
Rajesh K. Gupta
(1960)
| Director | Since 2019
| Partner Emeritus, SeaCrest Investment Management and SeaCrest Wealth Management (2019 to Present); Chief Executive Officer and Chief Investment Officer, SeaCrest Investment Management (2006 to 2019); Chief Executive Officer and Chief Investment Officer, SeaCrest Wealth Management (2008 to 2019)
| 66 | None |
|
| | | | | |
Name
(Year of Birth) | Position(s) Held with Funds | Length of Time Served | Principal Occupation(s) During Past 5 Years | Number of American Century Portfolios Overseen by Director | Other Directorships Held During Past 5 Years |
| Independent Directors |
|
|
Lynn Jenkins
(1963)
| Director | Since 2019
| United States Representative, U.S. House of Representatives (2009 to 2018) | 66 | MGP Ingredients, Inc. |
Jan M. Lewis
(1957) | Director | Since 2011 | Retired | 66 | None |
John R. Whitten
(1946) | Director | Since 2008 | Retired | 66 | Onto Innovation Inc.; Rudolph Technologies, Inc. (2006 to 2019) |
Stephen E. Yates
(1948) | Director and Chairman of the Board | Since 2012 (Chairman since 2018) | Retired | 81 | None |
| Interested Director |
|
Jonathan S. Thomas
(1963) | Director | Since 2007 | President and Chief Executive Officer, ACC (2007 to present). Also serves as Chief Executive Officer, ACS; Executive Vice President, ACIM; Director, ACC, ACIM and other ACC subsidiaries | 125 | BioMed Valley Discoveries, Inc. |
The Statement of Additional Information has additional information about the fund's directors and is available without charge, upon request, by calling 1-800-345-2021.
Officers
The following table presents certain information about the executive officers of the funds. Each officer serves as an officer for each of the 16 (in the case of Robert J. Leach, 15) investment companies in the American Century family of funds. No officer is compensated for his or her service as an officer of the funds. The listed officers are interested persons of the funds and are appointed or re-appointed on an annual basis. The mailing address for each officer listed below is 4500 Main Street, Kansas City, Missouri 64111.
|
| | |
Name
(Year of Birth) | Offices with the Funds | Principal Occupation(s) During the Past Five Years |
Patrick Bannigan
(1965) | President since 2019 | Executive Vice President and Director, ACC (2012 to present); Chief Financial Officer, Chief Accounting Officer and Treasurer, ACC (2015 to present); Chief Operating Officer, ACC (2012-2015). Also serves as President, ACS; Vice President, ACIM; Chief Financial Officer, Chief Accounting Officer and/or Director, ACIM, ACS and other ACC subsidiaries |
R. Wes Campbell
(1974) | Chief Financial Officer and Treasurer since 2018 | Investment Operations and Investment Accounting, ACS (2000 to present) |
Amy D. Shelton
(1964) | Chief Compliance Officer and Vice President since 2014 | Chief Compliance Officer, American Century funds, (2014 to present); Chief Compliance Officer, ACIM (2014 to present); Chief Compliance Officer, ACIS (2009 to present). Also serves as Vice President, ACIS |
Charles A. Etherington
(1957) | General Counsel since 2007 and Senior Vice President since 2006 | Attorney, ACC (1994 to present); Vice President, ACC (2005 to present); General Counsel, ACC (2007 to present). Also serves as General Counsel, ACIM, ACS, ACIS and other ACC subsidiaries; and Senior Vice President, ACIM and ACS |
C. Jean Wade
(1964) | Vice President since 2012 | Senior Vice President, ACS (2017 to present); Vice President, ACS (2000 to 2017)
|
Robert J. Leach
(1966) | Vice President since 2006 | Vice President, ACS (2000 to present) |
David H. Reinmiller
(1963) | Vice President since 2000 | Attorney, ACC (1994 to present). Also serves as Vice President, ACIM and ACS |
Ward D. Stauffer
(1960) | Secretary since 2005 | Attorney, ACC (2003 to present) |
|
|
| Approval of Management Agreement |
At a meeting held on June 26, 2019, the Fund’s Board of Directors (the "Board") unanimously approved the renewal of the management agreement pursuant to which American Century Investment Management, Inc. (the “Advisor”) acts as the investment advisor for the Fund. Under Section 15(c) of the Investment Company Act, contracts for investment advisory services are required to be reviewed, evaluated, and approved by a majority of a fund’s directors (the “Directors”), including a majority of the independent Directors, each year.
Prior to its consideration of the renewal of the management agreement, the Directors requested and reviewed extensive data and information compiled by the Advisor and certain independent providers of evaluation data concerning the Fund and the services provided to the Fund by the Advisor. This review was in addition to the oversight and evaluation undertaken by the Board and its committees on a continual basis and the information received was supplemental to the extensive information that the Board and its committees receive and consider throughout the year.
In connection with its consideration of the renewal of the management agreement, the Board’s review and evaluation of the services provided by the Advisor included, but was not limited to, the following:
| |
| • | the nature, extent, and quality of investment management, shareholder services, and other services provided and to be provided to the Fund; |
| |
| • | the wide range of other programs and services provided and to be provided to the Fund and its shareholders on a routine and non-routine basis; |
| |
| • | the investment performance of the Fund, including data comparing the Fund's performance to appropriate benchmarks and/or a peer group of other mutual funds with similar investment objectives and strategies; |
| |
| • | the cost of owning the Fund compared to the cost of owning similar funds; |
| |
| • | the compliance policies, procedures, and regulatory experience of the Advisor and the Fund's service providers; |
| |
| • | financial data showing the cost of services provided to the Fund, the profitability of the Fund to the Advisor, and the overall profitability of the Advisor; |
| |
| • | strategic plans of the Advisor; |
| |
| • | any economies of scale associated with the Advisor’s management of the Fund and other accounts; |
| |
| • | services provided and charges to the Advisor's other investment management clients; |
| |
| • | acquired fund fees and expenses; |
| |
| • | payments and practices in connection with financial intermediaries holding shares of the Fund and the services provided by intermediaries in connection therewith; and |
| |
| • | any collateral benefits derived by the Advisor from the management of the Fund. |
The Directors held three in-person meetings and one telephonic meeting to review and discuss the information provided. The independent Directors also reviewed responses to supplemental information requests provided by the Directors to the Advisor and held active discussions with the Advisor regarding the renewal of the management agreement. The independent Directors had the benefit of the advice of their independent counsel throughout the process.
Factors Considered
The Directors considered all of the information provided by the Advisor, the independent data providers, and independent counsel in connection with the approval. They determined that the information was sufficient for them to evaluate the management agreement for the Fund. In connection with their review, the Directors did not identify any single factor as being all-important or
controlling, and each Director may have attributed different levels of importance to different factors. In deciding to renew the management agreement, the Board based its decision on a number of factors, including without limitation the following:
Nature, Extent and Quality of Services — Generally. Under the management agreement, the Advisor is responsible for providing or arranging for all services necessary for the operation of the Fund. The Board noted that the Advisor provides or arranges at its own expense a wide variety of services including without limitation the following:
| |
| • | portfolio research and security selection |
| |
| • | daily valuation of the Fund’s portfolio |
| |
| • | shareholder servicing and transfer agency, including shareholder confirmations, recordkeeping, and communications |
| |
| • | legal services (except the independent Directors’ counsel) |
| |
| • | regulatory and portfolio compliance |
| |
| • | marketing and distribution (except amounts paid by the Fund under Rule 12b-1 plans) |
The Board noted that many of these services have expanded over time in terms of both quantity and complexity in response to shareholder demands, competition in the industry, changing distribution channels, and the changing regulatory environment.
Investment Management Services. The nature of the investment management services provided to the Fund is quite complex and allows Fund shareholders access to professional money management, instant diversification of their investments within an asset class, the opportunity to easily diversify among asset classes by investing in or exchanging among various American Century Investments funds, and liquidity. In evaluating investment performance, the Board expects the Advisor to manage the Fund in accordance with its investment objectives and approved strategies. Further, the Directors recognize that the Advisor has an obligation to monitor trading activities, and in particular to seek the best execution of fund trades, and to evaluate the use of and payment for research. In providing these services, the Advisor utilizes teams of investment professionals (portfolio managers, analysts, research assistants, and securities traders) who require extensive information technology, research, training, compliance, and other systems to conduct their business. The Board, directly and through its Fund Performance Review Committee, provides oversight of the investment performance process. It regularly reviews investment performance information for the Fund, together with comparative information for appropriate benchmarks and/or peer groups of similarly-managed funds, over different time horizons. The Directors also review investment performance information during the management agreement renewal process. If performance concerns are identified, the Fund receives special reviews until performance improves, during which the Board discusses with the Advisor the reasons for such results (e.g., market conditions, security selection) and any efforts being undertaken to improve performance. The Fund’s performance was at its benchmark for the one-year period and below its benchmark for the three-, five-, and ten-year periods reviewed by the Board. The Board discussed the Fund's performance with the Advisor and was satisfied with the efforts being undertaken by the Advisor. The Board found the investment management services provided by the Advisor to the Fund to be satisfactory and consistent with the management agreement.
Shareholder and Other Services. Under the management agreement, the Advisor provides the Fund with a comprehensive package of transfer agency, shareholder, and other services. The Board, directly and through various committees of the Board, regularly reviews reports and evaluations of such services at its regular meetings. These reports include, but are not limited to, information regarding the operational efficiency and accuracy of the shareholder and transfer agency services provided, staffing levels, shareholder satisfaction, technology support (including
cyber security), new products and services offered to Fund shareholders, securities trading activities, portfolio valuation services, auditing services, and legal and operational compliance activities. The Board found the services provided by the Advisor to the Fund under the management agreement to be competitive and of high quality.
Costs of Services and Profitability. The Advisor provides detailed information concerning its cost of providing various services to the Fund, its profitability in managing the Fund (pre- and post-distribution), its overall profitability, and its financial condition. The Directors have reviewed with the Advisor the methodology used to prepare this financial information. This information is considered in evaluating the Advisor’s financial condition, its ability to continue to provide services under the management agreement, and the reasonableness of the current management fee. The Board concluded that the Advisor’s profits were reasonable in light of the services provided to the Fund.
Ethics. The Board generally considers the Advisor’s commitment to providing quality services to shareholders and to conducting its business ethically. They noted that the Advisor’s practices generally meet or exceed industry best practices.
Economies of Scale. The Board also reviewed information provided by the Advisor regarding the possible existence of economies of scale in connection with the management of the Fund. The Board concluded that economies of scale are difficult to measure and predict with precision, especially on a fund-by-fund basis. The Board concluded that the Advisor is appropriately sharing economies of scale through its competitive fee structure, offering competitive fees from fund inception, and through reinvestment in its business to provide shareholders additional content and services.
Comparison to Other Funds’ Fees. The management agreement provides that the Fund pays the Advisor a single, all-inclusive (or unified) management fee for providing all services necessary for the management and operation of the Fund, other than brokerage expenses, expenses attributable to short sales, taxes, interest, extraordinary expenses, fees and expenses of the Fund’s independent Directors (including their independent legal counsel), and expenses incurred in connection with the provision of shareholder services and distribution services under a plan adopted pursuant to Rule 12b-1 under the Investment Company Act. Under the unified fee structure, the Advisor is responsible for providing all investment advisory, custody, audit, administrative, compliance, recordkeeping, marketing and shareholder services, or arranging and supervising third parties to provide such services. By contrast, most other funds are charged a variety of fees, including an investment advisory fee, a transfer agency fee, an administrative fee, distribution charges, and other expenses. Other than their investment advisory fees and any applicable Rule 12b-1 distribution fees, all other components of the total fees charged by these other funds may be increased without shareholder approval. The Board believes the unified fee structure is a benefit to Fund shareholders because it clearly discloses to shareholders the cost of owning Fund shares, and, since the unified fee cannot be increased without a vote of Fund shareholders, it shifts to the Advisor the risk of increased costs of operating the Fund and provides a direct incentive to minimize administrative inefficiencies. Part of the Board’s analysis of fee levels involves reviewing certain evaluative data compiled by an independent provider comparing the Fund’s unified fee to the total expense ratios of its peers. The unified fee charged to shareholders of the Fund was below the median of the total expense ratios of the Fund’s peer expense universe. The Board concluded that the management fee paid by the Fund to the Advisor under the management agreement is reasonable in light of the services provided to the Fund.
Comparison to Fees and Services Provided to Other Clients of the Advisor. The Directors also requested and received information from the Advisor concerning the nature of the services, fees, costs, and profitability of its advisory services to advisory clients other than the Fund. They observed that these varying types of client accounts require different services and involve different regulatory and entrepreneurial risks than the management of the Fund. The Board analyzed this information and concluded that the fees charged and services provided to the Fund were reasonable by comparison.
Payments to Intermediaries. The Directors also requested and received a description of payments made to intermediaries by the Fund and the Advisor and services provided in response thereto. These payments include various payments made by the Fund or the Advisor to different types of intermediaries and recordkeepers for distribution and service activities provided for the Fund. The Board reviewed such information and received representations from the Advisor that all such payments by the Fund were made pursuant to the Fund's Rule 12b-1 Plan and that all such payments by the Advisor were made from the Advisor’s resources and reasonable profits. The Board found such payments to be reasonable in scope and purpose.
Collateral or “Fall-Out” Benefits Derived by the Advisor. The Board considered the existence of collateral benefits the Advisor may receive as a result of its relationship with the Fund. They concluded that the Advisor’s primary business is managing mutual funds and it generally does not use fund or shareholder information to generate profits in other lines of business, and therefore does not derive any significant collateral benefits from them. The Board noted that additional assets from other clients may offer the Advisor some benefit from increased leverage with service providers and counterparties. Additionally, the Advisor may receive proprietary research from broker-dealers that execute fund portfolio transactions, which the Board concluded is likely to benefit other clients of the Advisor, as well as Fund shareholders. The Board also determined that the Advisor is able to provide investment management services to certain clients other than the Fund, at least in part, due to its existing infrastructure built to serve the fund complex. The Board concluded that appropriate allocation methodologies had been employed to assign resources and the cost of those resources to these other clients and, where expressly provided, these other client assets may be included with the assets of the Fund to determine breakpoints in the management fee schedule.
Existing Relationship. The Board also considered whether there was any reason for not continuing the existing arrangement with the Advisor. In this regard, the Board was mindful of the potential disruptions of the Fund’s operations and various risks, uncertainties, and other effects that could occur as a result of a decision not to continue such relationship. In particular, the Board recognized that most shareholders have invested in the Fund on the strength of the Advisor’s industry standing and reputation and in the expectation that the Advisor will have a continuing role in providing advisory services to the Fund.
Conclusion of the Directors. As a result of this process, the Board, including all of the independent Directors, taking into account all of the factors discussed above and the information provided by the Advisor and others in connection with its review and throughout the year, determined that the management fee is fair and reasonable in light of the services provided and that the investment management agreement between the Fund and the Advisor should be renewed.
Retirement Account Information
As required by law, distributions you receive from certain retirement accounts are subject to federal income tax withholding, unless you elect not to have withholding apply*. Tax will be withheld on the total amount withdrawn even though you may be receiving amounts that are not subject to withholding, such as nondeductible contributions. In such case, excess amounts of withholding could occur. You may adjust your withholding election so that a greater or lesser amount will be withheld.
If you don’t want us to withhold on this amount, you must notify us to not withhold the federal income tax. You may notify us in writing or in certain situations by telephone or through other electronic means. For systematic withdrawals, your withholding election will remain in effect until revoked or changed by filing a new election. You have the right to revoke your election at any time and change your withholding percentage for future distributions.
Remember, even if you elect not to have income tax withheld, you are liable for paying income tax on the taxable portion of your withdrawal. If you elect not to have income tax withheld or you don’t have enough income tax withheld, you may be responsible for payment of estimated tax. You may incur penalties under the estimated tax rules if your withholding and estimated tax payments are not sufficient. You can reduce or defer the income tax on a distribution by directly or indirectly rolling such distribution over to another IRA or eligible plan. You should consult your tax advisor for additional information.
State tax will be withheld if, at the time of your distribution, your address is within one of the mandatory withholding states and you have federal income tax withheld (or as otherwise required by state law). State taxes will be withheld from your distribution in accordance with the respective state rules.
*Some 403(b), 457 and qualified retirement plan distributions may be subject to 20% mandatory withholding, as they are subject to special tax and withholding rules. Your plan administrator or plan sponsor is required to provide you with a special tax notice explaining those rules at the time you request a distribution. If applicable, federal and/or state taxes may be withheld from your distribution amount.
Proxy Voting Policies
A description of the policies that the fund's investment advisor uses in exercising the voting rights associated with the securities purchased and/or held by the fund is available without charge, upon request, by calling 1-800-345-2021. It is also available on American Century Investments’ website at americancentury.com/proxy and on the Securities and Exchange Commission’s website at sec.gov. Information regarding how the investment advisor voted proxies relating to portfolio securities during the most recent 12-month period ended June 30 is available on americancentury.com/proxy. It is also available at sec.gov.
Quarterly Portfolio Disclosure
The fund files its complete schedule of portfolio holdings with the Securities and Exchange Commission (SEC) for the first and third quarters of each fiscal year on Form N-Q or as an exhibit to its reports on Form N-PORT. The fund’s Forms N-Q and Form N-PORT reports are available on the SEC’s website at sec.gov. The fund also makes its complete schedule of portfolio holdings for the most recent quarter of its fiscal year available on its website at americancentury.com and, upon request, by calling 1-800-345-2021.
Other Tax Information
The following information is provided pursuant to provisions of the Internal Revenue Code.
The fund hereby designates $124,833,954, or up to the maximum amount allowable, as long-term capital gain distributions (20% rate gain distributions) for the fiscal year ended October 31, 2019.
The fund utilized earnings and profits of $2,328,349 distributed to shareholders on redemption of shares as part of the dividends paid deduction (tax equalization).
|
| | |
| |
| | | |
| Contact Us | americancentury.com | |
| Automated Information Line | 1-800-345-8765 | |
| Investor Services Representative | 1-800-345-2021 or 816-531-5575 | |
| Investors Using Advisors | 1-800-378-9878 | |
| Business, Not-For-Profit, Employer-Sponsored Retirement Plans | 1-800-345-3533 | |
| Banks and Trust Companies, Broker-Dealers, Financial Professionals, Insurance Companies | 1-800-345-6488 | |
| Telecommunications Relay Service for the Deaf | 711 | |
| | | |
| American Century Mutual Funds, Inc. | |
| | | |
Investment Advisor: American Century Investment Management, Inc. Kansas City, Missouri | |
| | | |
| This report and the statements it contains are submitted for the general information of our shareholders. The report is not authorized for distribution to prospective investors unless preceded or accompanied by an effective prospectus. | |
| | | |
©2019 American Century Proprietary Holdings, Inc. All rights reserved.
CL-ANN-90973 1912 | |
|
| |
| | |
| | Annual Report |
| | |
| | October 31, 2019 |
| | |
| | Balanced Fund |
| | Investor Class (TWBIX) |
| | I Class (ABINX) |
| | R5 Class (ABGNX) |
Beginning on January 1, 2021, as permitted by regulations adopted by the Securities and Exchange Commission, paper copies of the fund’s shareholder reports like this one will no longer be sent by mail, unless you specifically request paper copies of the reports from the fund or from your financial intermediary, such as a broker-dealer or bank. Instead, the reports will be made available on a website, and you will be notified by mail each time a report is posted and provided with a website link to access the report.
If you already elected to receive shareholder reports electronically, you will not be affected by this change and you need not take any action. You may elect to receive shareholder reports and other communications from the fund or your financial intermediary electronically by calling or sending an email request to your appropriate contacts as listed on the back cover of this report.
You may elect to receive all future reports in paper free of charge. You can inform the fund or your financial intermediary that you wish to continue receiving paper copies of your shareholder reports by calling or sending an email request to your appropriate contacts as listed on the back cover of this report. Your election to receive reports in paper will apply to all funds held with the fund complex/your financial intermediary.
|
| |
| President’s Letter | |
| Performance | |
| Portfolio Commentary | |
| Fund Characteristics | |
| Shareholder Fee Example | |
| Schedule of Investments | |
| Statement of Assets and Liabilities | |
| Statement of Operations | |
| Statement of Changes in Net Assets | |
| Notes to Financial Statements | |
| Financial Highlights | |
| Report of Independent Registered Public Accounting Firm | |
| Management | |
| Approval of Management Agreement | |
| Additional Information | |
Any opinions expressed in this report reflect those of the author as of the date of the report, and do not necessarily represent the opinions of American Century Investments® or any other person in the American Century Investments organization. Any such opinions are subject to change at any time based upon market or other conditions and American Century Investments disclaims any responsibility to update such opinions. These opinions may not be relied upon as investment advice and, because investment decisions made by American Century Investments funds are based on numerous factors, may not be relied upon as an indication of trading intent on behalf of any American Century Investments fund. Security examples are used for representational purposes only and are not intended as recommendations to purchase or sell securities. Performance information for comparative indices and securities is provided to American Century Investments by third party vendors. To the best of American Century Investments’ knowledge, such information is accurate at the time of printing.
Jonathan Thomas
Dear Investor:
Thank you for reviewing this annual report for the 12 months ended October 31, 2019. Annual reports help convey important information about fund returns, including market factors that affected performance. For additional investment and market insights, please visit americancentury.com.
Stocks, Bonds Delivered Solid Gains
U.S. and global stocks, bonds and real estate investments generally delivered strong gains for the 12-month period. Stocks and other riskier assets rebounded from a late-2018 sell-off to post robust returns for the 12 months overall. Global bonds benefited from safe-haven buying early in the period and a declining interest rate environment overall.
Fed’s Policy Pivot Improved Investor Sentiment
In the final months of 2018, mounting concerns about slowing global economic and earnings growth, tariffs and Federal Reserve (Fed) policy soured investor sentiment, driving global stocks lower. After raising rates in September 2018, the Fed hiked again in December and delivered a surprisingly bullish 2019 rate-hike outlook, which intensified the sell-off among stocks and other riskier assets. Meanwhile, the risk-off climate sparked a flight to quality, which drove U.S. and other government bond yields lower and benefited global bond returns.
A key policy pivot from the Fed helped improve equity investor sentiment beginning in early 2019. The central bank abruptly ended its rate-hike campaign and adopted a dovish tone amid weaker global growth and inflation. Additionally, investors’ worst-case fears about trade and corporate earnings generally eased, which also aided stocks and other riskier assets. At the same time, government bond yields continued to fall on moderating global growth data, muted inflation and accommodative central bank policy in the U.S., Europe and Japan. By July, concerns about global economic risks prompted the Fed to cut short-term interest rates for the first time in 10 years. The Fed followed up with additional rate cuts in September and October. This backdrop supported continued gains for fixed-income and other interest rate-sensitive assets.
Looking ahead, we expect volatility to remain a formidable factor as investors react to global growth and trade trends, central bank policy and geopolitical developments. We believe this scenario underscores the importance of using professionally managed portfolios in pursuit of investment goals. We appreciate your continued trust and confidence in us.
Sincerely,
Jonathan Thomas
President and Chief Executive Officer
American Century Investments
|
| | | | | | |
| Total Returns as of October 31, 2019 | | |
| | | | Average Annual Returns | |
| | Ticker Symbol | 1 year | 5 years | 10 years | Since Inception | Inception Date |
| Investor Class | TWBIX | 11.82% | 6.15% | 8.83% | — | 10/20/88 |
| Blended Index | — | 13.64% | 7.91% | 9.84% | — | — |
| S&P 500 Index | — | 14.33% | 10.77% | 13.69% | — | — |
| Bloomberg Barclays U.S. Aggregate Bond Index | — | 11.51% | 3.24% | 3.73% | — | — |
| I Class | ABINX | 12.04% | 6.36% | 9.04% | — | 5/1/00 |
| R5 Class | ABGNX | 12.04% | — | — | 8.23% | 4/10/17 |
Average annual returns since inception are presented when ten years of performance history is not available.
The blended index combines monthly returns of two widely known indices in proportion to the asset mix of the fund. The S&P 500 Index represents 60% of the index and the remaining 40% is represented by the Bloomberg Barclays U.S. Aggregate Bond Index.
Data presented reflect past performance. Past performance is no guarantee of future results. Current performance may be higher or lower than the performance shown. Total returns for periods less than one year are not annualized. Investment return and principal value will fluctuate, and redemption value may be more or less than original cost. Data assumes reinvestment of dividends and capital gains, and none of the charts reflect the deduction of taxes that a shareholder would pay on fund distributions or the redemption of fund shares. To obtain performance data current to the most recent month end, please call 1-800-345-2021 or visit americancentury.com. For additional information about the fund, please consult the prospectus.
|
|
| Growth of $10,000 Over 10 Years |
| $10,000 investment made October 31, 2009 |
| Performance for other share classes will vary due to differences in fee structure. |
|
| |
| Value on October 31, 2019 |
| | Investor Class — $23,319 |
| |
| | Blended Index — $25,567 |
| |
| | S&P 500 Index — $36,096 |
| |
| | Bloomberg Barclays U.S. Aggregate Bond Index — $14,420 |
| |
|
| | |
| Total Annual Fund Operating Expenses |
| Investor Class | I Class | R5 Class |
| 0.91% | 0.71% | 0.71% |
The total annual fund operating expenses shown is as stated in the fund’s prospectus current as of the date of this report. The prospectus may vary from the expense ratio shown elsewhere in this report because it is based on a different time period, includes acquired fund fees and expenses, and, if applicable, does not include fee waivers or expense reimbursements.
Data presented reflect past performance. Past performance is no guarantee of future results. Current performance may be higher or lower than the performance shown. Total returns for periods less than one year are not annualized. Investment return and principal value will fluctuate, and redemption value may be more or less than original cost. Data assumes reinvestment of dividends and capital gains, and none of the charts reflect the deduction of taxes that a shareholder would pay on fund distributions or the redemption of fund shares. To obtain performance data current to the most recent month end, please call 1-800-345-2021 or visit americancentury.com. For additional information about the fund, please consult the prospectus.
Equity Portfolio Managers: Claudia Musat and Steven Rossi
Fixed-Income Portfolio Managers: Bob Gahagan, Brian Howell and Charles Tan
Performance Summary
Balanced returned 11.82%* for the 12 months ended October 31, 2019. By comparison, the fund’s benchmark (a blended index consisting of 60% S&P 500 Index and 40% Bloomberg Barclays U.S. Aggregate Bond Index) returned 13.64%. Balanced seeks long-term capital growth and current income by investing approximately 60% of its assets in equity securities and the remainder in bonds and other fixed-income securities. The purpose of the broad bond market exposure is to reduce the volatility of the equity portfolio, providing a more attractive overall risk/return profile for investors. The total fund’s drivers of both absolute and relative returns, however, are typically a function of the equity allocation. Therefore, the performance attribution discussion focuses primarily on the equity segment.
Materials and Real Estate Largest Equity Detractors
The largest detractors from relative performance were the materials and real estate sectors. Consumer discretionary also detracted. In materials, stock selection among metals and mining companies was weak. Among these companies was Steel Dynamics, which was among the top detracting individual positions during the period. Demand for steel was hurt when trade tensions escalated, weighing on the industry group. Positioning within paper and forest products was also negative, and a position in Domtar was among the top individual detractors from relative performance. We have since exited the position. Security selection within chemicals companies also weighed on results.
In real estate, stock selection within equity real estate investment trusts (REITs) weighed on returns. Most notably, an underweight position in American Tower was among the leading detractors from relative performance. The company has seen significant demand for its cellular tower spaces given the transition to 5G technology but maintains a low score for valuation. As a result, we had some exposure to the stock, but less than the benchmark. A position in The GEO Group also reduced returns.
Selection within consumer discretionary also hurt returns. Textiles, apparel and luxury goods companies Tapestry and Capri Holdings were among the top individual detractors, as was multiline retail company Kohl’s. All three of these positions have since been closed.
Information Technology and Energy Led Equity Gains
Positioning in the information technology sector contributed to performance, particularly in the electronic equipment, instruments and components, technology hardware, storage and peripherals and software industries. Successful stock choices within electronic equipment, instruments and components included a position in Keysight Technologies, which was among the top individual contributors to performance. The stock maintains high scores for quality, growth and sentiment. In technology hardware, storage and peripherals, an overweight to Apple was beneficial to returns, as was a position in software company VMware. Both of these companies were among the top-performing positions for the 12 months. We have since closed our position in VMware.
*All fund returns referenced in this commentary are for Investor Class shares. Performance for other share classes will vary due to differences in fee structure; when Investor Class performance exceeds that of the fund’s benchmark, other share classes may not. See page 3 for returns for all share classes.
Stock choices in the oil, gas and consumable fuels industry within the energy sector also boosted relative results. An underweight to Exxon Mobil was a top contributor. The company maintains poor scores across all four factors of our model. Avoidance of several energy equipment and services companies, which are present in the index, also helped relative results.
Other top contributors for the 12-month period included an overweight to AutoZone, a company that saw its stock price rise due to strong earnings supported by demand for its automotive products. An overweight to Waste Management also benefited results during the period, although we have since closed the position.
Bond Performance Positive
Bond market performance was strong during the year. In late 2018, hawkish comments made by Chairman Jerome Powell caused concern that the Federal Reserve (the Fed) may continue to raise rates in the face of unsupportive data. This led to market volatility and yield spread widening across many asset classes. When yield spreads widen, higher-yielding corporate and mortgage-backed securities typically underperform higher-quality U.S. Treasury securities. Indeed, Treasury yields fell as investors looked for safe-haven assets.
However, a shift occurred in January of 2019. The Fed pivoted and asserted a patient stance on the pace of future rate increases. This helped to stoke a recovery across fixed-income markets. Spreads narrowed and rates temporarily rose. Generally solid corporate earnings helped corporate debt to outperform for much of the latter part of the period. Despite many positive economic data points present in the U.S. economy, investors feared a potential recession, and the Fed cut the target overnight lending rate by 25 basis points in July. This led to falling interest rates across much of the Treasury curve, particularly at the long end. The Fed cut the overnight rate by another 25 basis points in August, and then again in October, further stoking a bond market rally. During the 12 months, long-dated Treasuries outperformed much of the broader market. Corporate debt generally outperformed like-duration Treasuries over the period. Treasury inflation-protected securities produced positive performance but trailed many other fixed-income instruments due to a lack of inflation.
Outlook
The U.S. continues to enjoy economic growth and a strong job market, despite concerns over moderating global growth and continued supportive measures by central banks. With the continued existence of such variables as trade disputes, Brexit difficulties and other geopolitical uncertainty, it is reasonable to expect that markets may continue to experience periodic bouts of volatility. However, volatility adjusts valuations and can provide buying opportunities. We will continue to monitor the situation and invest appropriately. We believe that the continuing uncertainty on many fronts highlights the benefits of a balanced approach involving exposure to both stocks and bonds, which is intended to reduce overall price fluctuations and improve risk-adjusted performance.
|
| |
| OCTOBER 31, 2019 | |
| Key Fixed-Income Portfolio Statistics | |
| Weighted Average Life to Maturity | 7.8 years |
| Average Duration (effective) | 5.7 years |
| | |
| Top Ten Common Stocks | % of net assets |
| Microsoft Corp. | 3.0% |
| Apple, Inc. | 2.9% |
| Alphabet, Inc., Class A | 2.2% |
| Amazon.com, Inc. | 2.2% |
| JPMorgan Chase & Co. | 1.5% |
| Facebook, Inc., Class A | 1.4% |
| Visa, Inc., Class A | 1.2% |
| Bank of America Corp. | 1.1% |
| Verizon Communications, Inc. | 1.1% |
| Merck & Co., Inc. | 1.0% |
| | |
| Top Five Common Stocks Industries | % of net assets |
| Software | 5.0% |
| Banks | 3.7% |
| Interactive Media and Services | 3.6% |
| Technology Hardware, Storage and Peripherals | 2.9% |
| IT Services | 2.8% |
| | |
| Types of Investments in Portfolio | % of net assets |
| Common Stocks | 58.3% |
| U.S. Treasury Securities | 12.4% |
| Corporate Bonds | 11.1% |
| U.S. Government Agency Mortgage-Backed Securities | 8.5% |
| Asset-Backed Securities | 2.1% |
| Collateralized Mortgage Obligations | 1.6% |
| Commercial Mortgage-Backed Securities | 1.5% |
| Collateralized Loan Obligations | 1.1% |
| Municipal Securities | 0.6% |
| Sovereign Governments and Agencies | 0.3% |
| U.S. Government Agency Securities | 0.1% |
| Bank Loan Obligations | —* |
| Temporary Cash Investments | 3.7% |
| Other Assets and Liabilities | (1.3)% |
| *Category is less than 0.05% of total net assets. | |
Fund shareholders may incur two types of costs: (1) transaction costs, including sales charges (loads) on purchase payments and redemption/exchange fees; and (2) ongoing costs, including management fees; distribution and service (12b-1) fees; and other fund expenses. This example is intended to help you understand your ongoing costs (in dollars) of investing in your fund and to compare these costs with the ongoing cost of investing in other mutual funds.
The example is based on an investment of $1,000 made at the beginning of the period and held for the entire period from May 1, 2019 to October 31, 2019.
Actual Expenses
The table provides information about actual account values and actual expenses for each class. You may use the information, together with the amount you invested, to estimate the expenses that you paid over the period. First, identify the share class you own. Then simply divide your account value by $1,000 (for example, an $8,600 account value divided by $1,000 = 8.6), then multiply the result by the number under the heading “Expenses Paid During Period” to estimate the expenses you paid on your account during this period.
If you hold Investor Class shares of any American Century Investments fund, or I Class shares of the American Century Diversified Bond Fund, in an American Century Investments account (i.e., not a financial intermediary or retirement plan account), American Century Investments may charge you a $12.50 semiannual account maintenance fee if the value of those shares is less than $10,000. We will redeem shares automatically in one of your accounts to pay the $12.50 fee. In determining your total eligible investment amount, we will include your investments in all personal accounts (including American Century Investments Brokerage accounts) registered under your Social Security number. Personal accounts include individual accounts, joint accounts, UGMA/UTMA accounts, personal trusts, Coverdell Education Savings Accounts and IRAs (including traditional, Roth, Rollover, SEP-, SARSEP- and SIMPLE-IRAs), and certain other retirement accounts. If you have only business, business retirement, employer-sponsored or American Century Investments Brokerage accounts, you are currently not subject to this fee. If you are subject to the Account Maintenance Fee, your account value could be reduced by the fee amount.
Hypothetical Example for Comparison Purposes
The table also provides information about hypothetical account values and hypothetical expenses based on the actual expense ratio of each class of your fund and an assumed rate of return of 5% per year before expenses, which is not the actual return of a fund’s share class. The hypothetical account values and expenses may not be used to estimate the actual ending account balance or expenses you paid for the period. You may use this information to compare the ongoing costs of investing in your fund and other funds. To do so, compare this 5% hypothetical example with the 5% hypothetical examples that appear in the shareholder reports of the other funds.
Please note that the expenses shown in the table are meant to highlight your ongoing costs only and do not reflect any transactional costs, such as sales charges (loads) or redemption/exchange fees. Therefore, the table is useful in comparing ongoing costs only, and will not help you determine the relative total costs of owning different funds. In addition, if these transactional costs were included, your costs would have been higher.
|
| | | | |
| Beginning
Account Value
5/1/19 | Ending
Account Value
10/31/19 | Expenses Paid
During Period(1)
5/1/19 - 10/31/19 |
Annualized
Expense Ratio(1) |
| Actual | | | | |
| Investor Class | $1,000 | $1,036.60 | $4.62 | 0.90% |
| I Class | $1,000 | $1,037.60 | $3.60 | 0.70% |
| R5 Class | $1,000 | $1,037.60 | $3.60 | 0.70% |
| Hypothetical | | | | |
| Investor Class | $1,000 | $1,020.67 | $4.58 | 0.90% |
| I Class | $1,000 | $1,021.68 | $3.57 | 0.70% |
| R5 Class | $1,000 | $1,021.68 | $3.57 | 0.70% |
| |
| (1) | Expenses are equal to the class's annualized expense ratio listed in the table above, multiplied by the average account value over the period, multiplied by 184, the number of days in the most recent fiscal half-year, divided by 365, to reflect the one-half year period. Annualized expense ratio reflects actual expenses, including any applicable fee waivers or expense reimbursements and excluding any acquired fund fees and expenses. |
OCTOBER 31, 2019
|
| | | | | | |
| | Shares/
Principal Amount | Value |
| COMMON STOCKS — 58.3% | | |
| Aerospace and Defense — 0.8% | | |
| HEICO Corp. | 33,212 |
| $ | 4,096,368 |
|
| Hexcel Corp. | 30,632 |
| 2,285,760 |
|
Mercury Systems, Inc.(1) | 3,118 |
| 229,672 |
|
| Northrop Grumman Corp. | 2,525 |
| 890,012 |
|
| | | 7,501,812 |
|
| Air Freight and Logistics — 0.1% | | |
| CH Robinson Worldwide, Inc. | 18,206 |
| 1,377,102 |
|
| Airlines — 0.1% | | |
| Delta Air Lines, Inc. | 12,291 |
| 676,988 |
|
| Auto Components — 0.5% | | |
| Gentex Corp. | 151,504 |
| 4,249,687 |
|
| Banks — 3.7% | | |
| Bank of America Corp. | 329,953 |
| 10,317,630 |
|
| Comerica, Inc. | 61,306 |
| 4,010,639 |
|
| JPMorgan Chase & Co. | 105,833 |
| 13,220,658 |
|
SVB Financial Group(1) | 4,600 |
| 1,018,808 |
|
| Wells Fargo & Co. | 104,838 |
| 5,412,786 |
|
| | | 33,980,521 |
|
| Beverages — 1.4% | | |
| Coca-Cola Co. (The) | 81,979 |
| 4,462,117 |
|
| PepsiCo, Inc. | 57,963 |
| 7,950,785 |
|
| | | 12,412,902 |
|
| Biotechnology — 2.3% | | |
Alexion Pharmaceuticals, Inc.(1) | 17,467 |
| 1,841,022 |
|
| Amgen, Inc. | 33,614 |
| 7,168,186 |
|
Biogen, Inc.(1) | 21,375 |
| 6,384,926 |
|
Celgene Corp.(1) | 31,834 |
| 3,439,027 |
|
| Gilead Sciences, Inc. | 10,313 |
| 657,041 |
|
Incyte Corp.(1) | 17,814 |
| 1,494,951 |
|
| | | 20,985,153 |
|
| Building Products — 1.0% | | |
Builders FirstSource, Inc.(1) | 68,369 |
| 1,545,823 |
|
| Johnson Controls International plc | 133,916 |
| 5,802,581 |
|
| Masco Corp. | 31,777 |
| 1,469,686 |
|
| | | 8,818,090 |
|
| Capital Markets — 0.8% | | |
| Artisan Partners Asset Management, Inc., Class A | 35,697 |
| 976,313 |
|
| MSCI, Inc. | 8,815 |
| 2,067,646 |
|
| TD Ameritrade Holding Corp. | 104,358 |
| 4,005,260 |
|
| | | 7,049,219 |
|
|
| | | | | | |
| | Shares/
Principal Amount | Value |
| Chemicals — 1.2% | | |
| CF Industries Holdings, Inc. | 8,578 |
| $ | 389,012 |
|
| Ecolab, Inc. | 25,699 |
| 4,936,007 |
|
| NewMarket Corp. | 8,271 |
| 4,015,488 |
|
| Valvoline, Inc. | 54,031 |
| 1,153,022 |
|
| | | 10,493,529 |
|
| Commercial Services and Supplies — 0.8% | | |
| Republic Services, Inc. | 55,678 |
| 4,872,382 |
|
| Tetra Tech, Inc. | 18,314 |
| 1,601,925 |
|
| UniFirst Corp. | 3,575 |
| 718,003 |
|
| | | 7,192,310 |
|
| Communications Equipment — 1.6% | | |
| Cisco Systems, Inc. | 182,012 |
| 8,647,390 |
|
| Juniper Networks, Inc. | 49,464 |
| 1,227,697 |
|
| Motorola Solutions, Inc. | 28,010 |
| 4,658,623 |
|
| | | 14,533,710 |
|
| Construction and Engineering — 0.4% | | |
MasTec, Inc.(1) | 60,196 |
| 3,788,736 |
|
| Consumer Finance — 1.6% | | |
| American Express Co. | 44,446 |
| 5,212,627 |
|
| Discover Financial Services | 53,927 |
| 4,328,181 |
|
| Synchrony Financial | 135,592 |
| 4,795,889 |
|
| | | 14,336,697 |
|
| Diversified Financial Services — 0.5% | | |
Berkshire Hathaway, Inc., Class B(1) | 21,811 |
| 4,636,582 |
|
| Diversified Telecommunication Services — 1.2% | | |
| AT&T, Inc. | 32,449 |
| 1,248,962 |
|
| Verizon Communications, Inc. | 162,333 |
| 9,816,277 |
|
| | | 11,065,239 |
|
| Electric Utilities — 0.8% | | |
| IDACORP, Inc. | 28,924 |
| 3,112,801 |
|
| NextEra Energy, Inc. | 16,151 |
| 3,849,429 |
|
| | | 6,962,230 |
|
| Electrical Equipment — 0.3% | | |
| Acuity Brands, Inc. | 21,620 |
| 2,697,960 |
|
| Electronic Equipment, Instruments and Components — 0.8% | | |
| CDW Corp. | 15,355 |
| 1,964,058 |
|
Keysight Technologies, Inc.(1) | 54,383 |
| 5,487,789 |
|
| | | 7,451,847 |
|
| Entertainment — 1.8% | | |
| Activision Blizzard, Inc. | 92,748 |
| 5,196,670 |
|
Electronic Arts, Inc.(1) | 54,999 |
| 5,301,904 |
|
Take-Two Interactive Software, Inc.(1) | 40,334 |
| 4,854,197 |
|
| Walt Disney Co. (The) | 5,870 |
| 762,630 |
|
| | | 16,115,401 |
|
| Equity Real Estate Investment Trusts (REITs) — 1.7% | | |
| Alexander & Baldwin, Inc. | 12,336 |
| 290,019 |
|
|
| | | | | | |
| | Shares/
Principal Amount | Value |
| American Tower Corp. | 29,033 |
| $ | 6,331,517 |
|
| GEO Group, Inc. (The) | 20,361 |
| 309,894 |
|
| Life Storage, Inc. | 39,679 |
| 4,321,837 |
|
| PS Business Parks, Inc. | 6,780 |
| 1,224,129 |
|
| SBA Communications Corp. | 5,710 |
| 1,374,112 |
|
| Weingarten Realty Investors | 43,785 |
| 1,389,298 |
|
| | | 15,240,806 |
|
| Food and Staples Retailing — 0.1% | | |
| Casey's General Stores, Inc. | 7,209 |
| 1,231,369 |
|
| Food Products — 1.6% | | |
| Campbell Soup Co. | 111,854 |
| 5,179,958 |
|
| General Mills, Inc. | 96,616 |
| 4,913,890 |
|
| Hershey Co. (The) | 30,725 |
| 4,512,581 |
|
| | | 14,606,429 |
|
| Health Care Equipment and Supplies — 2.0% | | |
| Danaher Corp. | 10,812 |
| 1,490,110 |
|
Edwards Lifesciences Corp.(1) | 24,534 |
| 5,848,415 |
|
Hologic, Inc.(1) | 90,575 |
| 4,375,678 |
|
Integer Holdings Corp.(1) | 9,182 |
| 711,054 |
|
| Stryker Corp. | 28,876 |
| 6,245,013 |
|
| | | 18,670,270 |
|
| Health Care Providers and Services — 0.3% | | |
Amedisys, Inc.(1) | 13,672 |
| 1,757,125 |
|
| Chemed Corp. | 1,667 |
| 656,648 |
|
| UnitedHealth Group, Inc. | 3,051 |
| 770,988 |
|
| | | 3,184,761 |
|
| Health Care Technology — 0.5% | | |
Veeva Systems, Inc., Class A(1) | 29,442 |
| 4,175,759 |
|
| Hotels, Restaurants and Leisure — 0.8% | | |
| Starbucks Corp. | 82,529 |
| 6,978,652 |
|
| Household Products — 1.5% | | |
| Colgate-Palmolive Co. | 76,291 |
| 5,233,563 |
|
| Procter & Gamble Co. (The) | 67,277 |
| 8,376,659 |
|
| | | 13,610,222 |
|
| Insurance — 1.5% | | |
Arch Capital Group Ltd.(1) | 95,376 |
| 3,982,902 |
|
| Mercury General Corp. | 37,796 |
| 1,816,476 |
|
| Progressive Corp. (The) | 70,128 |
| 4,887,921 |
|
| RenaissanceRe Holdings Ltd. | 15,337 |
| 2,870,780 |
|
| | | 13,558,079 |
|
| Interactive Media and Services — 3.6% | | |
Alphabet, Inc., Class A(1) | 16,123 |
| 20,295,632 |
|
Facebook, Inc., Class A(1) | 64,983 |
| 12,453,992 |
|
| | | 32,749,624 |
|
| Internet and Direct Marketing Retail — 2.7% | | |
Amazon.com, Inc.(1) | 11,152 |
| 19,813,312 |
|
|
| | | | | | |
| | Shares/
Principal Amount | Value |
| eBay, Inc. | 122,947 |
| $ | 4,333,882 |
|
| | | 24,147,194 |
|
| IT Services — 2.8% | | |
| Amdocs Ltd. | 18,844 |
| 1,228,629 |
|
| EVERTEC, Inc. | 22,082 |
| 675,488 |
|
| MasterCard, Inc., Class A | 23,139 |
| 6,405,106 |
|
PayPal Holdings, Inc.(1) | 65,209 |
| 6,788,257 |
|
| Visa, Inc., Class A | 59,630 |
| 10,665,422 |
|
| | | 25,762,902 |
|
| Life Sciences Tools and Services — 1.2% | | |
| Agilent Technologies, Inc. | 62,182 |
| 4,710,286 |
|
Bio-Rad Laboratories, Inc., Class A(1) | 12,618 |
| 4,184,381 |
|
| Thermo Fisher Scientific, Inc. | 6,859 |
| 2,071,281 |
|
| | | 10,965,948 |
|
| Machinery — 0.4% | | |
| Allison Transmission Holdings, Inc. | 93,882 |
| 4,094,194 |
|
| Metals and Mining — 0.4% | | |
| Royal Gold, Inc. | 22,648 |
| 2,614,485 |
|
| Steel Dynamics, Inc. | 26,885 |
| 816,229 |
|
| | | 3,430,714 |
|
| Oil, Gas and Consumable Fuels — 1.2% | | |
| Chevron Corp. | 7,928 |
| 920,758 |
|
| CVR Energy, Inc. | 77,575 |
| 3,678,606 |
|
| Exxon Mobil Corp. | 32,301 |
| 2,182,579 |
|
| HollyFrontier Corp. | 80,602 |
| 4,428,274 |
|
| | | 11,210,217 |
|
| Pharmaceuticals — 2.2% | | |
Jazz Pharmaceuticals plc(1) | 10,043 |
| 1,261,702 |
|
| Johnson & Johnson | 27,377 |
| 3,614,859 |
|
| Merck & Co., Inc. | 106,579 |
| 9,236,136 |
|
| Pfizer, Inc. | 12,082 |
| 463,586 |
|
| Zoetis, Inc. | 45,207 |
| 5,782,880 |
|
| | | 20,359,163 |
|
| Professional Services — 0.5% | | |
IHS Markit Ltd.(1) | 14,352 |
| 1,004,927 |
|
| Verisk Analytics, Inc. | 23,646 |
| 3,421,576 |
|
| | | 4,426,503 |
|
| Semiconductors and Semiconductor Equipment — 1.6% | | |
| Applied Materials, Inc. | 74,088 |
| 4,020,015 |
|
| Broadcom, Inc. | 25,876 |
| 7,577,787 |
|
| Intel Corp. | 48,080 |
| 2,717,962 |
|
| | | 14,315,764 |
|
| Software — 5.0% | | |
Adobe, Inc.(1) | 20,105 |
| 5,587,783 |
|
Cadence Design Systems, Inc.(1) | 41,087 |
| 2,685,035 |
|
| Intuit, Inc. | 20,867 |
| 5,373,252 |
|
| Microsoft Corp. | 190,537 |
| 27,317,290 |
|
|
| | | | | | |
| | Shares/
Principal Amount | Value |
| Oracle Corp. (New York) | 86,850 |
| $ | 4,732,457 |
|
| | | 45,695,817 |
|
| Specialty Retail — 1.6% | | |
AutoZone, Inc.(1) | 4,703 |
| 5,382,019 |
|
| Home Depot, Inc. (The) | 16,053 |
| 3,765,713 |
|
Murphy USA, Inc.(1) | 33,906 |
| 3,998,535 |
|
O'Reilly Automotive, Inc.(1) | 4,355 |
| 1,896,646 |
|
| | | 15,042,913 |
|
| Technology Hardware, Storage and Peripherals — 2.9% | | |
| Apple, Inc. | 107,699 |
| 26,791,203 |
|
| Textiles, Apparel and Luxury Goods — 0.3% | | |
| NIKE, Inc., Class B | 29,286 |
| 2,622,561 |
|
| Thrifts and Mortgage Finance — 0.2% | | |
| Essent Group Ltd. | 36,708 |
| 1,912,120 |
|
TOTAL COMMON STOCKS
(Cost $400,339,567) | | 531,108,899 |
|
| U.S. TREASURY SECURITIES — 12.4% | | |
| U.S. Treasury Bonds, 5.00%, 5/15/37 | $ | 200,000 |
| 292,750 |
|
| U.S. Treasury Bonds, 3.50%, 2/15/39 | 140,000 |
| 173,756 |
|
| U.S. Treasury Bonds, 4.625%, 2/15/40 | 1,300,000 |
| 1,861,742 |
|
| U.S. Treasury Bonds, 4.375%, 5/15/41 | 1,400,000 |
| 1,955,898 |
|
| U.S. Treasury Bonds, 3.125%, 11/15/41 | 2,300,000 |
| 2,707,846 |
|
| U.S. Treasury Bonds, 3.00%, 5/15/42 | 3,300,000 |
| 3,810,147 |
|
| U.S. Treasury Bonds, 2.75%, 11/15/42 | 2,180,000 |
| 2,416,522 |
|
| U.S. Treasury Bonds, 2.875%, 5/15/43 | 1,300,000 |
| 1,471,666 |
|
| U.S. Treasury Bonds, 3.125%, 8/15/44 | 500,000 |
| 592,031 |
|
| U.S. Treasury Bonds, 3.00%, 11/15/44 | 600,000 |
| 696,281 |
|
| U.S. Treasury Bonds, 2.50%, 2/15/45 | 6,000,000 |
| 6,376,406 |
|
| U.S. Treasury Bonds, 3.00%, 5/15/45 | 600,000 |
| 697,828 |
|
| U.S. Treasury Bonds, 3.00%, 11/15/45 | 700,000 |
| 815,623 |
|
| U.S. Treasury Bonds, 3.375%, 11/15/48 | 1,900,000 |
| 2,391,365 |
|
| U.S. Treasury Bonds, 2.25%, 8/15/49 | 5,500,000 |
| 5,581,641 |
|
| U.S. Treasury Inflation Indexed Notes, 0.25%, 7/15/29 | 1,805,382 |
| 1,823,297 |
|
U.S. Treasury Notes, 2.50%, 5/31/20(2) | 1,200,000 |
| 1,206,211 |
|
| U.S. Treasury Notes, 2.00%, 10/31/21 | 800,000 |
| 807,156 |
|
| U.S. Treasury Notes, 2.625%, 12/15/21 | 5,500,000 |
| 5,627,402 |
|
U.S. Treasury Notes, 1.875%, 1/31/22(2) | 1,000,000 |
| 1,007,520 |
|
| U.S. Treasury Notes, 2.375%, 3/15/22 | 4,300,000 |
| 4,387,344 |
|
| U.S. Treasury Notes, 1.875%, 4/30/22 | 1,800,000 |
| 1,815,645 |
|
| U.S. Treasury Notes, 1.75%, 6/15/22 | 2,400,000 |
| 2,415,375 |
|
| U.S. Treasury Notes, 1.875%, 9/30/22 | 300,000 |
| 303,199 |
|
| U.S. Treasury Notes, 2.00%, 11/30/22 | 15,200,000 |
| 15,420,281 |
|
| U.S. Treasury Notes, 2.875%, 11/30/23 | 6,600,000 |
| 6,951,141 |
|
| U.S. Treasury Notes, 2.375%, 2/29/24 | 1,500,000 |
| 1,553,496 |
|
| U.S. Treasury Notes, 1.25%, 8/31/24 | 9,000,000 |
| 8,891,016 |
|
| U.S. Treasury Notes, 2.625%, 12/31/25 | 3,300,000 |
| 3,500,385 |
|
| U.S. Treasury Notes, 1.375%, 8/31/26 | 700,000 |
| 689,773 |
|
|
| | | | | | |
| | Shares/
Principal Amount | Value |
| U.S. Treasury Notes, 1.625%, 9/30/26 | $ | 2,800,000 |
| $ | 2,803,773 |
|
| U.S. Treasury Notes, 1.625%, 10/31/26 | 8,200,000 |
| 8,210,730 |
|
| U.S. Treasury Notes, 3.125%, 11/15/28 | 7,200,000 |
| 8,075,813 |
|
| U.S. Treasury Notes, 2.375%, 5/15/29 | 1,000,000 |
| 1,060,527 |
|
| U.S. Treasury Notes, 1.625%, 8/15/29 | 4,100,000 |
| 4,076,057 |
|
TOTAL U.S. TREASURY SECURITIES
(Cost $107,335,695) | | 112,467,643 |
|
| CORPORATE BONDS — 11.1% | | |
| Aerospace and Defense — 0.1% | | |
| Lockheed Martin Corp., 3.80%, 3/1/45 | 80,000 |
| 88,601 |
|
| United Technologies Corp., 6.05%, 6/1/36 | 250,000 |
| 336,467 |
|
| | | 425,068 |
|
Air Freight and Logistics† | | |
| United Parcel Service, Inc., 2.80%, 11/15/24 | 300,000 |
| 310,904 |
|
| Automobiles — 0.3% | | |
| Ford Motor Credit Co. LLC, 2.68%, 1/9/20 | 275,000 |
| 275,116 |
|
| Ford Motor Credit Co. LLC, 8.125%, 1/15/20 | 150,000 |
| 151,614 |
|
| Ford Motor Credit Co. LLC, 5.875%, 8/2/21 | 440,000 |
| 461,632 |
|
| Ford Motor Credit Co. LLC, 2.98%, 8/3/22 | 400,000 |
| 398,275 |
|
| Ford Motor Credit Co. LLC, 3.35%, 11/1/22 | 310,000 |
| 311,167 |
|
| General Motors Co., 5.15%, 4/1/38 | 260,000 |
| 263,770 |
|
| General Motors Financial Co., Inc., 3.20%, 7/6/21 | 620,000 |
| 627,680 |
|
| General Motors Financial Co., Inc., 5.25%, 3/1/26 | 290,000 |
| 314,854 |
|
| | | 2,804,108 |
|
| Banks — 2.7% | | |
| Banco Santander SA, 3.50%, 4/11/22 | 400,000 |
| 411,975 |
|
| Bank of America Corp., 4.10%, 7/24/23 | 370,000 |
| 395,524 |
|
| Bank of America Corp., MTN, 4.20%, 8/26/24 | 610,000 |
| 657,710 |
|
| Bank of America Corp., MTN, 4.00%, 1/22/25 | 1,475,000 |
| 1,575,775 |
|
| Bank of America Corp., MTN, 5.00%, 1/21/44 | 110,000 |
| 140,098 |
|
| Bank of America Corp., MTN, VRN, 3.19%, 7/23/30 | 577,000 |
| 595,578 |
|
| Bank of America Corp., MTN, VRN, 4.44%, 1/20/48 | 140,000 |
| 167,820 |
|
| Bank of America Corp., VRN, 3.00%, 12/20/23 | 911,000 |
| 932,322 |
|
| Barclays Bank plc, 5.14%, 10/14/20 | 200,000 |
| 205,143 |
|
BNP Paribas SA, 4.375%, 9/28/25(3) | 200,000 |
| 215,221 |
|
BPCE SA, 3.00%, 5/22/22(3) | 250,000 |
| 254,420 |
|
BPCE SA, 5.15%, 7/21/24(3) | 200,000 |
| 220,095 |
|
| Citibank N.A., 3.65%, 1/23/24 | 350,000 |
| 371,640 |
|
| Citigroup, Inc., 2.90%, 12/8/21 | 650,000 |
| 661,573 |
|
| Citigroup, Inc., 2.75%, 4/25/22 | 325,000 |
| 330,054 |
|
| Citigroup, Inc., 4.05%, 7/30/22 | 70,000 |
| 73,400 |
|
| Citigroup, Inc., 3.20%, 10/21/26 | 1,005,000 |
| 1,045,016 |
|
| Citigroup, Inc., 4.45%, 9/29/27 | 800,000 |
| 881,528 |
|
| Citigroup, Inc., VRN, 3.52%, 10/27/28 | 390,000 |
| 411,304 |
|
| Cooperatieve Rabobank UA, 3.95%, 11/9/22 | 450,000 |
| 470,086 |
|
| Discover Bank, 3.35%, 2/6/23 | 250,000 |
| 258,183 |
|
| Discover Bank, 3.45%, 7/27/26 | 500,000 |
| 519,309 |
|
|
| | | | | | |
| | Shares/
Principal Amount | Value |
| Fifth Third BanCorp., 4.30%, 1/16/24 | $ | 110,000 |
| $ | 118,972 |
|
| Fifth Third BanCorp., 2.375%, 1/28/25 | 600,000 |
| 602,641 |
|
| Fifth Third Bank, 2.875%, 10/1/21 | 250,000 |
| 254,374 |
|
HSBC Bank plc, 4.125%, 8/12/20(3) | 300,000 |
| 305,139 |
|
| HSBC Holdings plc, 2.95%, 5/25/21 | 800,000 |
| 811,172 |
|
| HSBC Holdings plc, 4.30%, 3/8/26 | 400,000 |
| 436,461 |
|
| HSBC Holdings plc, 4.375%, 11/23/26 | 420,000 |
| 454,141 |
|
| HSBC Holdings plc, VRN, 3.26%, 3/13/23 | 220,000 |
| 224,983 |
|
HSBC Holdings plc, VRN, 2.63%, 11/7/25(4) | 370,000 |
| 370,000 |
|
| Huntington Bancshares, Inc., 2.30%, 1/14/22 | 260,000 |
| 261,562 |
|
| JPMorgan Chase & Co., 2.55%, 3/1/21 | 420,000 |
| 423,590 |
|
| JPMorgan Chase & Co., 4.625%, 5/10/21 | 460,000 |
| 478,879 |
|
| JPMorgan Chase & Co., 3.875%, 9/10/24 | 560,000 |
| 598,850 |
|
| JPMorgan Chase & Co., 3.125%, 1/23/25 | 1,070,000 |
| 1,112,741 |
|
| JPMorgan Chase & Co., VRN, 4.02%, 12/5/24 | 220,000 |
| 235,031 |
|
| JPMorgan Chase & Co., VRN, 3.54%, 5/1/28 | 320,000 |
| 339,506 |
|
| JPMorgan Chase & Co., VRN, 3.70%, 5/6/30 | 180,000 |
| 193,788 |
|
| JPMorgan Chase & Co., VRN, 3.88%, 7/24/38 | 200,000 |
| 219,851 |
|
| JPMorgan Chase & Co., VRN, 3.96%, 11/15/48 | 100,000 |
| 112,718 |
|
| JPMorgan Chase & Co., VRN, 3.90%, 1/23/49 | 100,000 |
| 111,314 |
|
| PNC Bank N.A., 3.80%, 7/25/23 | 750,000 |
| 792,612 |
|
| PNC Bank N.A., 2.70%, 10/22/29 | 480,000 |
| 481,816 |
|
| PNC Financial Services Group, Inc. (The), 4.375%, 8/11/20 | 200,000 |
| 203,866 |
|
| Regions Financial Corp., 2.75%, 8/14/22 | 280,000 |
| 285,332 |
|
| Regions Financial Corp., 3.80%, 8/14/23 | 250,000 |
| 264,537 |
|
| Royal Bank of Canada, 2.15%, 10/26/20 | 850,000 |
| 852,765 |
|
Royal Bank of Scotland Group plc, VRN, 3.75%, 11/1/29(4) | 210,000 |
| 212,083 |
|
| SunTrust Bank, 3.30%, 5/15/26 | 200,000 |
| 209,454 |
|
| Synchrony Bank, 3.00%, 6/15/22 | 250,000 |
| 253,835 |
|
| U.S. Bancorp, MTN, 3.60%, 9/11/24 | 330,000 |
| 351,227 |
|
| Wells Fargo & Co., 3.07%, 1/24/23 | 210,000 |
| 214,128 |
|
| Wells Fargo & Co., 4.125%, 8/15/23 | 200,000 |
| 212,590 |
|
| Wells Fargo & Co., 3.00%, 4/22/26 | 590,000 |
| 606,001 |
|
| Wells Fargo & Co., 5.61%, 1/15/44 | 380,000 |
| 495,284 |
|
| Wells Fargo & Co., MTN, 3.55%, 9/29/25 | 160,000 |
| 169,650 |
|
| Wells Fargo & Co., MTN, 4.65%, 11/4/44 | 200,000 |
| 234,325 |
|
| Wells Fargo & Co., MTN, VRN, 3.58%, 5/22/28 | 250,000 |
| 264,942 |
|
| | | 24,563,934 |
|
| Beverages — 0.2% | | |
| Anheuser-Busch Cos. LLC / Anheuser-Busch InBev Worldwide, Inc., 4.90%, 2/1/46 | 500,000 |
| 597,867 |
|
| Anheuser-Busch InBev Worldwide, Inc., 4.75%, 1/23/29 | 630,000 |
| 732,576 |
|
| | | 1,330,443 |
|
| Biotechnology — 0.6% | | |
| AbbVie, Inc., 2.50%, 5/14/20 | 450,000 |
| 451,347 |
|
| AbbVie, Inc., 2.90%, 11/6/22 | 620,000 |
| 632,443 |
|
| AbbVie, Inc., 3.60%, 5/14/25 | 120,000 |
| 125,785 |
|
|
| | | | | | |
| | Shares/
Principal Amount | Value |
| AbbVie, Inc., 4.40%, 11/6/42 | $ | 240,000 |
| $ | 248,990 |
|
| Amgen, Inc., 2.65%, 5/11/22 | 390,000 |
| 396,680 |
|
| Amgen, Inc., 4.66%, 6/15/51 | 289,000 |
| 335,059 |
|
| Biogen, Inc., 3.625%, 9/15/22 | 520,000 |
| 543,638 |
|
| Celgene Corp., 3.25%, 8/15/22 | 190,000 |
| 196,075 |
|
| Celgene Corp., 3.625%, 5/15/24 | 300,000 |
| 317,596 |
|
| Celgene Corp., 3.875%, 8/15/25 | 500,000 |
| 541,532 |
|
| Gilead Sciences, Inc., 4.40%, 12/1/21 | 310,000 |
| 323,795 |
|
| Gilead Sciences, Inc., 3.65%, 3/1/26 | 840,000 |
| 903,158 |
|
| | | 5,016,098 |
|
| Capital Markets — 0.8% | | |
Credit Suisse Group AG, VRN, 2.59%, 9/11/25(3) | 280,000 |
| 279,364 |
|
| Goldman Sachs Group, Inc. (The), 2.30%, 12/13/19 | 860,000 |
| 860,063 |
|
| Goldman Sachs Group, Inc. (The), 3.50%, 1/23/25 | 460,000 |
| 481,157 |
|
| Goldman Sachs Group, Inc. (The), 3.50%, 11/16/26 | 930,000 |
| 970,469 |
|
| Goldman Sachs Group, Inc. (The), 5.15%, 5/22/45 | 100,000 |
| 120,222 |
|
| Goldman Sachs Group, Inc. (The), MTN, 5.375%, 3/15/20 | 610,000 |
| 617,638 |
|
| Goldman Sachs Group, Inc. (The), VRN, 3.81%, 4/23/29 | 170,000 |
| 180,731 |
|
| Morgan Stanley, 2.75%, 5/19/22 | 200,000 |
| 203,100 |
|
| Morgan Stanley, 5.00%, 11/24/25 | 450,000 |
| 505,735 |
|
| Morgan Stanley, 4.375%, 1/22/47 | 90,000 |
| 107,005 |
|
| Morgan Stanley, MTN, 3.70%, 10/23/24 | 760,000 |
| 808,627 |
|
| Morgan Stanley, MTN, 4.00%, 7/23/25 | 760,000 |
| 823,857 |
|
| Morgan Stanley, MTN, VRN, 3.77%, 1/24/29 | 250,000 |
| 267,744 |
|
UBS Group AG, 3.49%, 5/23/23(3) | 300,000 |
| 309,350 |
|
UBS Group AG, 4.125%, 9/24/25(3) | 200,000 |
| 218,140 |
|
| | | 6,753,202 |
|
| Commercial Services and Supplies — 0.1% | | |
| Republic Services, Inc., 3.55%, 6/1/22 | 220,000 |
| 228,706 |
|
| Waste Connections, Inc., 3.50%, 5/1/29 | 290,000 |
| 310,914 |
|
| Waste Management, Inc., 4.15%, 7/15/49 | 220,000 |
| 254,150 |
|
| | | 793,770 |
|
Communications Equipment† | | |
| Cisco Systems, Inc., 5.90%, 2/15/39 | 130,000 |
| 183,878 |
|
| Consumer Finance — 0.3% | | |
| AerCap Ireland Capital DAC / AerCap Global Aviation Trust, 5.00%, 10/1/21 | 300,000 |
| 315,152 |
|
| Ally Financial, Inc., 3.875%, 5/21/24 | 240,000 |
| 251,590 |
|
| American Express Co., 3.00%, 10/30/24 | 140,000 |
| 145,388 |
|
| American Express Credit Corp., MTN, 2.20%, 3/3/20 | 450,000 |
| 450,398 |
|
| American Express Credit Corp., MTN, 2.25%, 5/5/21 | 450,000 |
| 452,520 |
|
| Capital One Bank USA N.A., 3.375%, 2/15/23 | 250,000 |
| 257,765 |
|
| Capital One Financial Corp., 3.80%, 1/31/28 | 450,000 |
| 478,972 |
|
| Synchrony Financial, 2.85%, 7/25/22 | 310,000 |
| 313,721 |
|
| | | 2,665,506 |
|
Diversified Consumer Services† | | |
| George Washington University (The), 3.55%, 9/15/46 | 115,000 |
| 123,527 |
|
|
| | | | | | |
| | Shares/
Principal Amount | Value |
| Diversified Financial Services — 0.2% | | |
| Berkshire Hathaway, Inc., 2.75%, 3/15/23 | $ | 270,000 |
| $ | 278,310 |
|
| Credit Suisse Group Funding Guernsey Ltd., 3.125%, 12/10/20 | 600,000 |
| 606,526 |
|
| Credit Suisse Group Funding Guernsey Ltd., 3.45%, 4/16/21 | 280,000 |
| 285,191 |
|
| GE Capital International Funding Co. Unlimited Co., 2.34%, 11/15/20 | 694,000 |
| 693,731 |
|
| Voya Financial, Inc., 5.70%, 7/15/43 | 160,000 |
| 203,117 |
|
| | | 2,066,875 |
|
| Diversified Telecommunication Services — 0.5% | | |
| AT&T, Inc., 3.875%, 8/15/21 | 500,000 |
| 516,342 |
|
| AT&T, Inc., 3.40%, 5/15/25 | 450,000 |
| 471,995 |
|
| AT&T, Inc., 2.95%, 7/15/26 | 370,000 |
| 376,992 |
|
| AT&T, Inc., 3.80%, 2/15/27 | 150,000 |
| 160,756 |
|
| AT&T, Inc., 4.10%, 2/15/28 | 150,000 |
| 162,590 |
|
| AT&T, Inc., 5.15%, 11/15/46 | 568,000 |
| 661,217 |
|
Deutsche Telekom International Finance BV, 2.23%, 1/17/20(3) | 600,000 |
| 600,030 |
|
Deutsche Telekom International Finance BV, 3.60%, 1/19/27(3) | 140,000 |
| 147,892 |
|
| Orange SA, 4.125%, 9/14/21 | 210,000 |
| 218,617 |
|
| Telefonica Emisiones SA, 5.46%, 2/16/21 | 100,000 |
| 104,356 |
|
| Verizon Communications, Inc., 2.625%, 8/15/26 | 610,000 |
| 623,658 |
|
| Verizon Communications, Inc., 4.75%, 11/1/41 | 260,000 |
| 313,305 |
|
| Verizon Communications, Inc., 5.01%, 8/21/54 | 250,000 |
| 325,337 |
|
| | | 4,683,087 |
|
| Electric Utilities — 0.5% | | |
| AEP Transmission Co. LLC, 3.75%, 12/1/47 | 100,000 |
| 110,122 |
|
| American Electric Power Co., Inc., 3.20%, 11/13/27 | 110,000 |
| 115,885 |
|
| Berkshire Hathaway Energy Co., 3.50%, 2/1/25 | 160,000 |
| 170,213 |
|
| Berkshire Hathaway Energy Co., 3.80%, 7/15/48 | 150,000 |
| 163,778 |
|
| Duke Energy Corp., 3.55%, 9/15/21 | 90,000 |
| 92,336 |
|
| Duke Energy Florida LLC, 6.35%, 9/15/37 | 110,000 |
| 157,036 |
|
| Duke Energy Florida LLC, 3.85%, 11/15/42 | 220,000 |
| 242,411 |
|
| Duke Energy Progress LLC, 4.15%, 12/1/44 | 130,000 |
| 148,979 |
|
| Exelon Corp., 5.15%, 12/1/20 | 220,000 |
| 225,637 |
|
| Exelon Corp., 4.45%, 4/15/46 | 150,000 |
| 170,373 |
|
| Exelon Generation Co. LLC, 4.25%, 6/15/22 | 120,000 |
| 125,801 |
|
| Exelon Generation Co. LLC, 5.60%, 6/15/42 | 70,000 |
| 81,994 |
|
| FirstEnergy Corp., 4.25%, 3/15/23 | 180,000 |
| 190,876 |
|
| FirstEnergy Corp., 4.85%, 7/15/47 | 90,000 |
| 107,429 |
|
FirstEnergy Transmission LLC, 4.55%, 4/1/49(3) | 170,000 |
| 199,869 |
|
| Florida Power & Light Co., 4.125%, 2/1/42 | 140,000 |
| 163,702 |
|
| Florida Power & Light Co., 3.95%, 3/1/48 | 130,000 |
| 151,265 |
|
| Florida Power & Light Co., 3.15%, 10/1/49 | 170,000 |
| 173,927 |
|
| Georgia Power Co., 4.30%, 3/15/42 | 70,000 |
| 76,952 |
|
| MidAmerican Energy Co., 4.40%, 10/15/44 | 250,000 |
| 302,975 |
|
| NextEra Energy Capital Holdings, Inc., 3.55%, 5/1/27 | 290,000 |
| 309,201 |
|
NextEra Energy Operating Partners LP, 4.50%, 9/15/27(3) | 120,000 |
| 122,850 |
|
Oncor Electric Delivery Co. LLC, 3.10%, 9/15/49(3) | 170,000 |
| 171,726 |
|
|
| | | | | | |
| | Shares/
Principal Amount | Value |
| Potomac Electric Power Co., 3.60%, 3/15/24 | $ | 120,000 |
| $ | 127,557 |
|
| Progress Energy, Inc., 3.15%, 4/1/22 | 90,000 |
| 91,968 |
|
| Southern Co. Gas Capital Corp., 3.95%, 10/1/46 | 90,000 |
| 95,037 |
|
| Southwestern Public Service Co., 3.70%, 8/15/47 | 100,000 |
| 108,859 |
|
| Virginia Electric & Power Co., 3.45%, 2/15/24 | 160,000 |
| 168,658 |
|
| Xcel Energy, Inc., 3.35%, 12/1/26 | 100,000 |
| 105,564 |
|
| | | 4,472,980 |
|
Energy Equipment and Services† | | |
| Halliburton Co., 4.85%, 11/15/35 | 150,000 |
| 166,783 |
|
| Entertainment — 0.1% | | |
| Viacom, Inc., 3.125%, 6/15/22 | 190,000 |
| 192,276 |
|
| Viacom, Inc., 4.25%, 9/1/23 | 160,000 |
| 170,119 |
|
| Viacom, Inc., 4.375%, 3/15/43 | 240,000 |
| 247,844 |
|
| | | 610,239 |
|
| Equity Real Estate Investment Trusts (REITs) — 0.3% | | |
| American Tower Corp., 3.375%, 10/15/26 | 110,000 |
| 114,550 |
|
| AvalonBay Communities, Inc., MTN, 3.20%, 1/15/28 | 120,000 |
| 126,557 |
|
| Boston Properties LP, 3.65%, 2/1/26 | 280,000 |
| 298,031 |
|
| Crown Castle International Corp., 5.25%, 1/15/23 | 180,000 |
| 196,747 |
|
| Essex Portfolio LP, 3.625%, 8/15/22 | 150,000 |
| 155,450 |
|
| Essex Portfolio LP, 3.25%, 5/1/23 | 50,000 |
| 51,474 |
|
| Essex Portfolio LP, 3.00%, 1/15/30 | 160,000 |
| 163,482 |
|
| GLP Capital LP / GLP Financing II, Inc., 5.75%, 6/1/28 | 130,000 |
| 147,644 |
|
| Kilroy Realty LP, 3.80%, 1/15/23 | 130,000 |
| 135,911 |
|
| Kimco Realty Corp., 2.80%, 10/1/26 | 240,000 |
| 242,480 |
|
| Public Storage, 3.39%, 5/1/29 | 230,000 |
| 248,719 |
|
| Service Properties Trust, 4.65%, 3/15/24 | 290,000 |
| 300,601 |
|
| Simon Property Group LP, 2.45%, 9/13/29 | 270,000 |
| 267,281 |
|
| Ventas Realty LP, 4.125%, 1/15/26 | 100,000 |
| 109,105 |
|
| VEREIT Operating Partnership LP, 4.125%, 6/1/21 | 230,000 |
| 236,319 |
|
| | | 2,794,351 |
|
| Food and Staples Retailing — 0.1% | | |
| Kroger Co. (The), 3.30%, 1/15/21 | 330,000 |
| 335,082 |
|
| Kroger Co. (The), 3.875%, 10/15/46 | 150,000 |
| 142,702 |
|
| Walmart, Inc., 4.05%, 6/29/48 | 210,000 |
| 250,835 |
|
| | | 728,619 |
|
| Health Care Equipment and Supplies — 0.1% | | |
| Becton Dickinson and Co., 3.73%, 12/15/24 | 440,000 |
| 470,484 |
|
| Becton Dickinson and Co., 3.70%, 6/6/27 | 79,000 |
| 85,008 |
|
DH Europe Finance II Sarl, 3.40%, 11/15/49(4) | 210,000 |
| 216,677 |
|
| Medtronic, Inc., 3.50%, 3/15/25 | 192,000 |
| 206,527 |
|
| Medtronic, Inc., 4.375%, 3/15/35 | 144,000 |
| 172,047 |
|
| | | 1,150,743 |
|
| Health Care Providers and Services — 0.5% | | |
| Aetna, Inc., 2.75%, 11/15/22 | 130,000 |
| 131,950 |
|
| Anthem, Inc., 3.65%, 12/1/27 | 140,000 |
| 148,220 |
|
| Anthem, Inc., 4.65%, 1/15/43 | 130,000 |
| 144,380 |
|
|
| | | | | | |
| | Shares/
Principal Amount | Value |
| CommonSpirit Health, 2.95%, 11/1/22 | $ | 110,000 |
| $ | 112,211 |
|
| CVS Health Corp., 3.50%, 7/20/22 | 420,000 |
| 434,782 |
|
| CVS Health Corp., 2.75%, 12/1/22 | 170,000 |
| 173,033 |
|
| CVS Health Corp., 4.30%, 3/25/28 | 620,000 |
| 673,581 |
|
| CVS Health Corp., 4.78%, 3/25/38 | 160,000 |
| 177,946 |
|
| CVS Health Corp., 5.05%, 3/25/48 | 150,000 |
| 172,098 |
|
| Duke University Health System, Inc., 3.92%, 6/1/47 | 160,000 |
| 181,735 |
|
| HCA, Inc., 4.125%, 6/15/29 | 660,000 |
| 700,924 |
|
| Johns Hopkins Health System Corp. (The), 3.84%, 5/15/46 | 100,000 |
| 112,560 |
|
| Northwell Healthcare, Inc., 4.26%, 11/1/47 | 120,000 |
| 132,870 |
|
| Stanford Health Care, 3.80%, 11/15/48 | 95,000 |
| 107,602 |
|
| UnitedHealth Group, Inc., 2.875%, 12/15/21 | 230,000 |
| 234,869 |
|
| UnitedHealth Group, Inc., 2.875%, 3/15/22 | 310,000 |
| 316,743 |
|
| UnitedHealth Group, Inc., 3.75%, 7/15/25 | 210,000 |
| 227,940 |
|
| UnitedHealth Group, Inc., 4.75%, 7/15/45 | 140,000 |
| 171,115 |
|
Universal Health Services, Inc., 4.75%, 8/1/22(3) | 130,000 |
| 131,625 |
|
| | | 4,486,184 |
|
| Hotels, Restaurants and Leisure — 0.1% | | |
| McDonald's Corp., MTN, 3.25%, 6/10/24 | 100,000 |
| 105,446 |
|
| McDonald's Corp., MTN, 3.375%, 5/26/25 | 80,000 |
| 84,984 |
|
| McDonald's Corp., MTN, 4.45%, 3/1/47 | 330,000 |
| 381,336 |
|
| McDonald's Corp., MTN, 3.625%, 9/1/49 | 170,000 |
| 173,493 |
|
| Royal Caribbean Cruises Ltd., 5.25%, 11/15/22 | 130,000 |
| 141,220 |
|
| | | 886,479 |
|
| Household Durables — 0.1% | | |
| D.R Horton, Inc., 5.75%, 8/15/23 | 110,000 |
| 122,183 |
|
| D.R Horton, Inc., 2.50%, 10/15/24 | 310,000 |
| 311,184 |
|
| Lennar Corp., 4.75%, 4/1/21 | 352,000 |
| 361,257 |
|
| Toll Brothers Finance Corp., 4.35%, 2/15/28 | 350,000 |
| 365,641 |
|
| | | 1,160,265 |
|
| Insurance — 0.4% | | |
| American International Group, Inc., 4.125%, 2/15/24 | 925,000 |
| 994,368 |
|
| American International Group, Inc., 4.50%, 7/16/44 | 50,000 |
| 55,868 |
|
| Berkshire Hathaway Finance Corp., 3.00%, 5/15/22 | 230,000 |
| 237,822 |
|
| Berkshire Hathaway Finance Corp., 4.20%, 8/15/48 | 190,000 |
| 223,200 |
|
| Chubb INA Holdings, Inc., 3.15%, 3/15/25 | 280,000 |
| 296,390 |
|
| Chubb INA Holdings, Inc., 3.35%, 5/3/26 | 110,000 |
| 118,359 |
|
| Hartford Financial Services Group, Inc. (The), 5.95%, 10/15/36 | 220,000 |
| 288,627 |
|
Liberty Mutual Group, Inc., 4.50%, 6/15/49(3) | 120,000 |
| 134,891 |
|
| Markel Corp., 4.90%, 7/1/22 | 190,000 |
| 203,022 |
|
| MetLife, Inc., 4.125%, 8/13/42 | 110,000 |
| 126,143 |
|
| MetLife, Inc., 4.875%, 11/13/43 | 110,000 |
| 137,164 |
|
Metropolitan Life Global Funding I, 3.00%, 1/10/23(3) | 200,000 |
| 205,969 |
|
| Prudential Financial, Inc., 3.94%, 12/7/49 | 477,000 |
| 521,765 |
|
| WR Berkley Corp., 4.625%, 3/15/22 | 130,000 |
| 137,768 |
|
| | | 3,681,356 |
|
|
| | | | | | |
| | Shares/
Principal Amount | Value |
Internet and Direct Marketing Retail† | | |
| eBay, Inc., 2.15%, 6/5/20 | $ | 170,000 |
| $ | 170,244 |
|
| IT Services — 0.1% | | |
| Fidelity National Information Services, Inc., 3.00%, 8/15/26 | 450,000 |
| 465,803 |
|
| Fiserv, Inc., 3.50%, 7/1/29 | 172,000 |
| 181,678 |
|
| Global Payments, Inc., 3.20%, 8/15/29 | 340,000 |
| 348,118 |
|
| Mastercard, Inc., 3.65%, 6/1/49 | 170,000 |
| 192,767 |
|
| | | 1,188,366 |
|
Life Sciences Tools and Services† | | |
| Thermo Fisher Scientific, Inc., 2.95%, 9/19/26 | 130,000 |
| 135,238 |
|
| Media — 0.4% | | |
| CBS Corp., 4.85%, 7/1/42 | 60,000 |
| 66,677 |
|
| Charter Communications Operating LLC / Charter Communications Operating Capital, 4.91%, 7/23/25 | 1,140,000 |
| 1,258,563 |
|
| Charter Communications Operating LLC / Charter Communications Operating Capital, 4.20%, 3/15/28 | 70,000 |
| 74,385 |
|
| Charter Communications Operating LLC / Charter Communications Operating Capital, 6.48%, 10/23/45 | 420,000 |
| 516,855 |
|
Comcast Corp., 2.65%, 2/1/30(4) | 330,000 |
| 334,907 |
|
| Comcast Corp., 6.40%, 5/15/38 | 310,000 |
| 438,892 |
|
| Comcast Corp., 4.60%, 10/15/38 | 290,000 |
| 346,004 |
|
| Comcast Corp., 4.75%, 3/1/44 | 470,000 |
| 572,070 |
|
| Interpublic Group of Cos., Inc. (The), 4.00%, 3/15/22 | 130,000 |
| 135,150 |
|
| TEGNA, Inc., 5.125%, 7/15/20 | 171,000 |
| 171,599 |
|
| | | 3,915,102 |
|
| Multi-Utilities — 0.2% | | |
| Black Hills Corp., 3.875%, 10/15/49 | 230,000 |
| 235,513 |
|
| CenterPoint Energy, Inc., 4.25%, 11/1/28 | 270,000 |
| 298,438 |
|
| Consolidated Edison Co. of New York, Inc., 3.95%, 3/1/43 | 150,000 |
| 164,955 |
|
| Consumers Energy Co., 3.10%, 8/15/50 | 170,000 |
| 172,036 |
|
| Dominion Energy, Inc., 2.75%, 9/15/22 | 210,000 |
| 213,683 |
|
| Dominion Energy, Inc., 4.90%, 8/1/41 | 200,000 |
| 236,792 |
|
| NiSource, Inc., 5.65%, 2/1/45 | 140,000 |
| 181,411 |
|
| Sempra Energy, 2.875%, 10/1/22 | 200,000 |
| 204,104 |
|
| Sempra Energy, 3.25%, 6/15/27 | 180,000 |
| 183,587 |
|
| Sempra Energy, 3.80%, 2/1/38 | 90,000 |
| 91,626 |
|
| Sempra Energy, 4.00%, 2/1/48 | 100,000 |
| 104,803 |
|
| | | 2,086,948 |
|
| Oil, Gas and Consumable Fuels — 1.2% | | |
| BP Capital Markets America, Inc., 4.50%, 10/1/20 | 100,000 |
| 102,366 |
|
| Cimarex Energy Co., 4.375%, 6/1/24 | 220,000 |
| 230,715 |
|
| CNOOC Nexen Finance 2014 ULC, 4.25%, 4/30/24 | 140,000 |
| 149,669 |
|
| Concho Resources, Inc., 4.375%, 1/15/25 | 270,000 |
| 279,192 |
|
| Continental Resources, Inc., 4.375%, 1/15/28 | 300,000 |
| 309,648 |
|
| Ecopetrol SA, 5.875%, 5/28/45 | 90,000 |
| 104,260 |
|
| Enbridge, Inc., 4.00%, 10/1/23 | 140,000 |
| 148,644 |
|
| Encana Corp., 6.50%, 2/1/38 | 210,000 |
| 245,530 |
|
| Energy Transfer Operating LP, 4.15%, 10/1/20 | 200,000 |
| 202,899 |
|
|
| | | | | | |
| | Shares/
Principal Amount | Value |
| Energy Transfer Operating LP, 7.50%, 10/15/20 | $ | 150,000 |
| $ | 157,423 |
|
| Energy Transfer Operating LP, 3.60%, 2/1/23 | 160,000 |
| 164,638 |
|
| Energy Transfer Operating LP, 4.25%, 3/15/23 | 370,000 |
| 388,163 |
|
| Energy Transfer Operating LP, 5.25%, 4/15/29 | 420,000 |
| 471,388 |
|
| Energy Transfer Operating LP, 4.90%, 3/15/35 | 70,000 |
| 73,122 |
|
| Energy Transfer Operating LP, 6.50%, 2/1/42 | 180,000 |
| 215,837 |
|
| Energy Transfer Operating LP, 6.00%, 6/15/48 | 220,000 |
| 254,903 |
|
| EnLink Midstream LLC, 5.375%, 6/1/29 | 245,000 |
| 218,050 |
|
| Enterprise Products Operating LLC, 5.20%, 9/1/20 | 450,000 |
| 461,786 |
|
| Enterprise Products Operating LLC, 4.85%, 3/15/44 | 460,000 |
| 525,575 |
|
| EOG Resources, Inc., 4.10%, 2/1/21 | 130,000 |
| 133,578 |
|
| Exxon Mobil Corp., 3.04%, 3/1/26 | 100,000 |
| 105,719 |
|
| Hess Corp., 6.00%, 1/15/40 | 130,000 |
| 148,193 |
|
| Kinder Morgan Energy Partners LP, 5.30%, 9/15/20 | 170,000 |
| 174,643 |
|
| Kinder Morgan Energy Partners LP, 6.50%, 9/1/39 | 210,000 |
| 259,831 |
|
| Marathon Oil Corp., 3.85%, 6/1/25 | 280,000 |
| 294,368 |
|
MPLX LP, 5.25%, 1/15/25(3) | 200,000 |
| 210,275 |
|
| MPLX LP, 4.875%, 6/1/25 | 410,000 |
| 449,913 |
|
| MPLX LP, 4.50%, 4/15/38 | 120,000 |
| 122,389 |
|
| MPLX LP, 5.20%, 3/1/47 | 90,000 |
| 96,568 |
|
| Newfield Exploration Co., 5.75%, 1/30/22 | 170,000 |
| 181,674 |
|
| Newfield Exploration Co., 5.375%, 1/1/26 | 140,000 |
| 151,633 |
|
| Occidental Petroleum Corp., 3.50%, 8/15/29 | 170,000 |
| 172,345 |
|
| ONEOK, Inc., 3.40%, 9/1/29 | 270,000 |
| 269,584 |
|
| Petroleos Mexicanos, 6.00%, 3/5/20 | 77,000 |
| 77,985 |
|
| Petroleos Mexicanos, 4.875%, 1/24/22 | 240,000 |
| 249,840 |
|
| Petroleos Mexicanos, 3.50%, 1/30/23 | 60,000 |
| 60,660 |
|
| Petroleos Mexicanos, 6.625%, 6/15/35 | 50,000 |
| 51,178 |
|
| Petroleos Mexicanos, 5.50%, 6/27/44 | 230,000 |
| 206,712 |
|
| Phillips 66, 4.30%, 4/1/22 | 250,000 |
| 264,238 |
|
| Plains All American Pipeline LP / PAA Finance Corp., 3.65%, 6/1/22 | 310,000 |
| 318,242 |
|
| Sabine Pass Liquefaction LLC, 5.625%, 3/1/25 | 590,000 |
| 660,442 |
|
| Shell International Finance BV, 2.375%, 8/21/22 | 130,000 |
| 132,024 |
|
| Shell International Finance BV, 3.25%, 5/11/25 | 200,000 |
| 212,469 |
|
| Sunoco Logistics Partners Operations LP, 3.45%, 1/15/23 | 330,000 |
| 337,343 |
|
| Sunoco Logistics Partners Operations LP, 4.00%, 10/1/27 | 200,000 |
| 206,355 |
|
| Targa Resources Partners LP / Targa Resources Partners Finance Corp., 5.00%, 1/15/28 | 40,000 |
| 39,800 |
|
| Total Capital Canada Ltd., 2.75%, 7/15/23 | 120,000 |
| 123,662 |
|
| Williams Cos., Inc. (The), 4.125%, 11/15/20 | 300,000 |
| 304,666 |
|
| Williams Cos., Inc. (The), 4.55%, 6/24/24 | 270,000 |
| 291,488 |
|
| Williams Cos., Inc. (The), 5.10%, 9/15/45 | 200,000 |
| 219,553 |
|
| | | 11,231,178 |
|
| Paper and Forest Products — 0.1% | | |
Georgia-Pacific LLC, 5.40%, 11/1/20(3) | 350,000 |
| 361,773 |
|
| Pharmaceuticals — 0.2% | | |
| Allergan Finance LLC, 3.25%, 10/1/22 | 400,000 |
| 409,409 |
|
|
| | | | | | |
| | Shares/
Principal Amount | Value |
| Allergan Funding SCS, 3.85%, 6/15/24 | $ | 440,000 |
| $ | 463,754 |
|
| Allergan Funding SCS, 4.55%, 3/15/35 | 110,000 |
| 118,044 |
|
Bristol-Myers Squibb Co., 4.25%, 10/26/49(3) | 120,000 |
| 140,771 |
|
| Shire Acquisitions Investments Ireland DAC, 2.40%, 9/23/21 | 660,000 |
| 663,991 |
|
| | �� | 1,795,969 |
|
| Road and Rail — 0.3% | | |
Ashtead Capital, Inc., 4.125%, 8/15/25(3) | 400,000 |
| 410,000 |
|
| Burlington Northern Santa Fe LLC, 3.60%, 9/1/20 | 176,000 |
| 178,010 |
|
| Burlington Northern Santa Fe LLC, 4.95%, 9/15/41 | 50,000 |
| 62,174 |
|
| Burlington Northern Santa Fe LLC, 4.45%, 3/15/43 | 220,000 |
| 259,456 |
|
| Burlington Northern Santa Fe LLC, 4.15%, 4/1/45 | 310,000 |
| 356,306 |
|
| CSX Corp., 3.40%, 8/1/24 | 180,000 |
| 190,686 |
|
| CSX Corp., 3.25%, 6/1/27 | 380,000 |
| 401,052 |
|
| Union Pacific Corp., 3.60%, 9/15/37 | 200,000 |
| 209,298 |
|
| Union Pacific Corp., 4.75%, 9/15/41 | 150,000 |
| 180,857 |
|
| Union Pacific Corp., MTN, 3.55%, 8/15/39 | 140,000 |
| 147,508 |
|
| | | 2,395,347 |
|
Semiconductors and Semiconductor Equipment† | | |
NXP BV / NXP Funding LLC, 3.875%, 9/1/22(3) | 200,000 |
| 206,968 |
|
| Software — 0.2% | | |
| Microsoft Corp., 2.70%, 2/12/25 | 570,000 |
| 593,609 |
|
| Microsoft Corp., 3.45%, 8/8/36 | 220,000 |
| 240,978 |
|
| Microsoft Corp., 4.25%, 2/6/47 | 340,000 |
| 421,382 |
|
| Oracle Corp., 2.50%, 10/15/22 | 260,000 |
| 264,869 |
|
| Oracle Corp., 3.625%, 7/15/23 | 280,000 |
| 296,675 |
|
| Oracle Corp., 2.65%, 7/15/26 | 100,000 |
| 102,703 |
|
| | | 1,920,216 |
|
| Specialty Retail — 0.1% | | |
| Home Depot, Inc. (The), 3.75%, 2/15/24 | 150,000 |
| 161,379 |
|
| Home Depot, Inc. (The), 5.95%, 4/1/41 | 360,000 |
| 511,113 |
|
| Home Depot, Inc. (The), 3.90%, 6/15/47 | 50,000 |
| 57,708 |
|
| | | 730,200 |
|
| Technology Hardware, Storage and Peripherals — 0.3% | | |
| Apple, Inc., 2.75%, 1/13/25 | 130,000 |
| 134,935 |
|
| Apple, Inc., 2.50%, 2/9/25 | 540,000 |
| 555,000 |
|
| Apple, Inc., 2.45%, 8/4/26 | 210,000 |
| 214,523 |
|
| Apple, Inc., 3.20%, 5/11/27 | 250,000 |
| 266,410 |
|
| Apple, Inc., 2.90%, 9/12/27 | 320,000 |
| 335,197 |
|
Dell International LLC / EMC Corp., 6.02%, 6/15/26(3) | 820,000 |
| 936,511 |
|
| Hewlett Packard Enterprise Co., 3.60%, 10/15/20 | 280,000 |
| 283,796 |
|
| | | 2,726,372 |
|
Trading Companies and Distributors† | | |
| International Lease Finance Corp., 5.875%, 8/15/22 | 100,000 |
| 109,683 |
|
Wireless Telecommunication Services† | | |
| America Movil SAB de CV, 3.125%, 7/16/22 | 155,000 |
| 159,108 |
|
Rogers Communications, Inc., 3.70%, 11/15/49(4) | 170,000 |
| 174,299 |
|
| | | 333,407 |
|
TOTAL CORPORATE BONDS
(Cost $95,483,192) | | 101,165,410 |
|
|
| | | | | | |
| | Shares/
Principal Amount | Value |
| U.S. GOVERNMENT AGENCY MORTGAGE-BACKED SECURITIES — 8.5% |
| Adjustable-Rate U.S. Government Agency Mortgage-Backed Securities — 0.5% |
| FHLMC, VRN, 4.71%, (1-year H15T1Y plus 2.25%), 9/1/35 | $ | 142,200 |
| $ | 150,600 |
|
| FHLMC, VRN, 4.60%, (12-month LIBOR plus 1.86%), 7/1/36 | 33,915 |
| 35,738 |
|
| FHLMC, VRN, 4.23%, (1-year H15T1Y plus 2.14%), 10/1/36 | 130,718 |
| 138,588 |
|
| FHLMC, VRN, 4.79%, (1-year H15T1Y plus 2.25%), 4/1/37 | 133,643 |
| 141,323 |
|
| FHLMC, VRN, 4.73%, (12-month LIBOR plus 1.81%), 2/1/38 | 47,380 |
| 50,036 |
|
| FHLMC, VRN, 4.89%, (12-month LIBOR plus 1.84%), 6/1/38 | 42,808 |
| 45,203 |
|
| FHLMC, VRN, 4.08%, (12-month LIBOR plus 1.78%), 9/1/40 | 44,102 |
| 46,170 |
|
| FHLMC, VRN, 4.77%, (12-month LIBOR plus 1.88%), 5/1/41 | 16,121 |
| 16,922 |
|
| FHLMC, VRN, 3.69%, (12-month LIBOR plus 1.89%), 7/1/41 | 71,199 |
| 73,313 |
|
| FHLMC, VRN, 4.05%, (12-month LIBOR plus 1.87%), 7/1/41 | 146,644 |
| 154,325 |
|
| FHLMC, VRN, 4.73%, (12-month LIBOR plus 1.64%), 2/1/43 | 29,202 |
| 30,156 |
|
| FHLMC, VRN, 4.43%, (12-month LIBOR plus 1.65%), 6/1/43 | 18,670 |
| 19,323 |
|
| FHLMC, VRN, 4.50%, (12-month LIBOR plus 1.62%), 6/1/43 | 676 |
| 698 |
|
| FHLMC, VRN, 2.85%, (12-month LIBOR plus 1.63%), 1/1/44 | 208,160 |
| 212,070 |
|
| FHLMC, VRN, 4.11%, (12-month LIBOR plus 1.59%), 10/1/44 | 149,275 |
| 153,596 |
|
| FHLMC, VRN, 2.57%, (12-month LIBOR plus 1.60%), 6/1/45 | 172,182 |
| 174,093 |
|
| FHLMC, VRN, 2.35%, (12-month LIBOR plus 1.63%), 8/1/46 | 428,971 |
| 433,852 |
|
| FHLMC, VRN, 3.07%, (12-month LIBOR plus 1.64%), 9/1/47 | 744,530 |
| 758,111 |
|
| FNMA, VRN, 4.19%, (6-month LIBOR plus 1.57%), 6/1/35 | 84,100 |
| 87,202 |
|
| FNMA, VRN, 4.19%, (6-month LIBOR plus 1.57%), 6/1/35 | 93,618 |
| 97,055 |
|
| FNMA, VRN, 4.42%, (1-year H15T1Y plus 2.16%), 3/1/38 | 118,039 |
| 124,627 |
|
| FNMA, VRN, 4.82%, (12-month LIBOR plus 1.69%), 1/1/40 | 13,407 |
| 14,195 |
|
| FNMA, VRN, 4.68%, (12-month LIBOR plus 1.81%), 3/1/40 | 29,064 |
| 30,731 |
|
| FNMA, VRN, 3.87%, (12-month LIBOR plus 1.77%), 10/1/40 | 82,793 |
| 86,689 |
|
| FNMA, VRN, 4.55%, (12-month LIBOR plus 1.55%), 3/1/43 | 145,043 |
| 150,189 |
|
| FNMA, VRN, 3.18%, (12-month LIBOR plus 1.61%), 3/1/47 | 565,325 |
| 577,899 |
|
| FNMA, VRN, 3.17%, (12-month LIBOR plus 1.61%), 4/1/47 | 355,819 |
| 363,982 |
|
| FNMA, VRN, 3.25%, (12-month LIBOR plus 1.62%), 5/1/47 | 454,555 |
| 464,259 |
|
| | | 4,630,945 |
|
| Fixed-Rate U.S. Government Agency Mortgage-Backed Securities — 8.0% |
| FHLMC, 6.50%, 1/1/28 | 9,316 |
| 10,388 |
|
| FHLMC, 5.50%, 12/1/33 | 80,101 |
| 89,139 |
|
| FHLMC, 5.00%, 7/1/35 | 684,532 |
| 756,821 |
|
| FHLMC, 5.50%, 1/1/38 | 61,797 |
| 68,516 |
|
| FHLMC, 6.00%, 8/1/38 | 33,504 |
| 37,531 |
|
| FHLMC, 3.00%, 2/1/43 | 723,121 |
| 746,607 |
|
| FHLMC, 3.50%, 12/1/47 | 517,040 |
| 536,418 |
|
| FNMA, 5.00%, 9/1/20 | 19,866 |
| 20,478 |
|
| FNMA, 6.50%, 1/1/29 | 14,782 |
| 16,637 |
|
| FNMA, 7.50%, 7/1/29 | 19,387 |
| 19,959 |
|
| FNMA, 7.50%, 9/1/30 | 8,199 |
| 9,670 |
|
| FNMA, 5.00%, 7/1/31 | 361,963 |
| 387,313 |
|
| FNMA, 6.50%, 9/1/31 | 12,531 |
| 13,966 |
|
| FNMA, 7.00%, 9/1/31 | 3,726 |
| 3,922 |
|
| FNMA, 6.50%, 1/1/32 | 13,211 |
| 14,726 |
|
|
| | | | | | |
| | Shares/
Principal Amount | Value |
| FNMA, 6.50%, 8/1/32 | $ | 14,954 |
| $ | 17,083 |
|
| FNMA, 5.50%, 6/1/33 | 48,670 |
| 54,379 |
|
| FNMA, 5.50%, 7/1/33 | 73,777 |
| 82,284 |
|
| FNMA, 5.50%, 8/1/33 | 135,384 |
| 152,488 |
|
| FNMA, 5.50%, 9/1/33 | 96,206 |
| 108,399 |
|
| FNMA, 5.00%, 11/1/33 | 252,868 |
| 279,368 |
|
| FNMA, 3.50%, 3/1/34 | 431,267 |
| 450,292 |
|
| FNMA, 5.00%, 4/1/35 | 337,820 |
| 373,012 |
|
| FNMA, 4.50%, 9/1/35 | 150,031 |
| 162,375 |
|
| FNMA, 5.00%, 2/1/36 | 213,504 |
| 235,798 |
|
| FNMA, 5.50%, 4/1/36 | 77,990 |
| 87,916 |
|
| FNMA, 5.50%, 5/1/36 | 151,770 |
| 171,099 |
|
| FNMA, 5.00%, 11/1/36 | 561,362 |
| 620,243 |
|
| FNMA, 5.50%, 2/1/37 | 38,572 |
| 43,348 |
|
| FNMA, 6.00%, 7/1/37 | 303,769 |
| 348,077 |
|
| FNMA, 6.50%, 8/1/37 | 21,964 |
| 24,423 |
|
| FNMA, 5.50%, 7/1/39 | 262,649 |
| 296,102 |
|
| FNMA, 5.00%, 4/1/40 | 642,599 |
| 710,707 |
|
| FNMA, 5.00%, 6/1/40 | 522,482 |
| 577,861 |
|
| FNMA, 4.50%, 8/1/40 | 794,688 |
| 861,692 |
|
| FNMA, 4.50%, 9/1/40 | 1,593,468 |
| 1,727,364 |
|
| FNMA, 3.50%, 1/1/41 | 989,253 |
| 1,038,414 |
|
| FNMA, 4.00%, 1/1/41 | 758,808 |
| 814,131 |
|
| FNMA, 4.00%, 5/1/41 | 876,860 |
| 938,643 |
|
| FNMA, 4.50%, 7/1/41 | 298,660 |
| 323,908 |
|
| FNMA, 4.50%, 9/1/41 | 329,382 |
| 357,210 |
|
| FNMA, 4.50%, 9/1/41 | 1,314,447 |
| 1,425,616 |
|
| FNMA, 4.00%, 12/1/41 | 793,249 |
| 849,253 |
|
| FNMA, 4.00%, 1/1/42 | 644,084 |
| 689,352 |
|
| FNMA, 3.50%, 5/1/42 | 1,348,099 |
| 1,415,394 |
|
| FNMA, 3.50%, 6/1/42 | 448,901 |
| 471,863 |
|
| FNMA, 3.00%, 11/1/42 | 1,091,477 |
| 1,126,289 |
|
| FNMA, 3.50%, 5/1/45 | 1,163,999 |
| 1,216,767 |
|
| FNMA, 3.00%, 11/1/46 | 2,491,769 |
| 2,558,746 |
|
| FNMA, 3.50%, 2/1/47 | 7,623,418 |
| 7,968,182 |
|
| FNMA, 6.50%, 8/1/47 | 7,820 |
| 8,410 |
|
| FNMA, 6.50%, 9/1/47 | 15,834 |
| 16,977 |
|
| FNMA, 6.50%, 9/1/47 | 761 |
| 817 |
|
| FNMA, 6.50%, 9/1/47 | 8,324 |
| 8,925 |
|
| FNMA, 3.50%, 10/1/47 | 5,913,808 |
| 6,133,746 |
|
| FNMA, 3.50%, 3/1/48 | 1,760,380 |
| 1,823,696 |
|
| FNMA, 3.00%, 4/1/48 | 2,251,912 |
| 2,313,998 |
|
| FNMA, 4.00%, 6/1/48 | 6,108,115 |
| 6,384,558 |
|
| FNMA, 4.50%, 7/1/48 | 1,574,850 |
| 1,667,356 |
|
| FNMA, 4.00%, 8/1/48 | 4,354,645 |
| 4,531,222 |
|
| FNMA, 3.50%, 4/1/49 | 1,455,898 |
| 1,500,663 |
|
| FNMA, 3.50%, 4/1/49 | 1,471,792 |
| 1,514,548 |
|
|
| | | | | | |
| | Shares/
Principal Amount | Value |
| GNMA, 2.50%, TBA | $ | 3,600,000 |
| $ | 3,647,672 |
|
| GNMA, 3.50%, TBA | 3,300,000 |
| 3,424,523 |
|
| GNMA, 4.00%, TBA | 2,000,000 |
| 2,079,244 |
|
| GNMA, 7.00%, 4/20/26 | 25,068 |
| 27,957 |
|
| GNMA, 7.50%, 8/15/26 | 14,906 |
| 16,597 |
|
| GNMA, 7.00%, 2/15/28 | 5,529 |
| 5,538 |
|
| GNMA, 7.50%, 2/15/28 | 5,749 |
| 5,760 |
|
| GNMA, 7.00%, 12/15/28 | 6,975 |
| 6,987 |
|
| GNMA, 7.00%, 5/15/31 | 33,016 |
| 38,168 |
|
| GNMA, 5.50%, 11/15/32 | 98,712 |
| 109,844 |
|
| GNMA, 4.50%, 5/20/41 | 312,742 |
| 338,315 |
|
| GNMA, 4.50%, 6/15/41 | 349,903 |
| 381,233 |
|
| GNMA, 3.50%, 6/20/42 | 680,317 |
| 722,915 |
|
| GNMA, 3.50%, 7/20/42 | 333,344 |
| 354,217 |
|
| GNMA, 4.50%, 11/20/43 | 414,921 |
| 445,758 |
|
| GNMA, 3.50%, 3/15/46 | 3,097,536 |
| 3,243,420 |
|
| GNMA, 2.50%, 7/20/46 | 716,817 |
| 726,382 |
|
| | | 72,789,615 |
|
TOTAL U.S. GOVERNMENT AGENCY MORTGAGE-BACKED SECURITIES
(Cost $75,754,250) | 77,420,560 |
|
| ASSET-BACKED SECURITIES — 2.1% | | |
BRE Grand Islander Timeshare Issuer LLC, Series 2017-1A, Class A SEQ, 2.94%, 5/25/29(3) | 593,895 |
| 596,804 |
|
Goodgreen, Series 2018-1A, Class A, VRN, 3.93%, 10/15/53(3) | 669,823 |
| 708,483 |
|
Hilton Grand Vacations Trust, Series 2014-AA, Class A SEQ, 1.77%, 11/25/26(3) | 202,715 |
| 202,197 |
|
Hilton Grand Vacations Trust, Series 2017-AA, Class A SEQ, 2.66%, 12/26/28(3) | 260,448 |
| 261,633 |
|
Hilton Grand Vacations Trust, Series 2018-AA, Class B, 3.70%, 2/25/32(3) | 1,427,459 |
| 1,470,846 |
|
Invitation Homes Trust, Series 2018-SFR1, Class A, VRN, 2.59%, (1-month LIBOR plus 0.70%), 3/17/37(3) | 1,485,302 |
| 1,474,642 |
|
Invitation Homes Trust, Series 2018-SFR2, Class B, VRN, 2.99%, (1-month LIBOR plus 1.08%), 6/17/37(3) | 1,225,000 |
| 1,219,179 |
|
Invitation Homes Trust, Series 2018-SFR3, Class A, VRN, 2.89%, (1-month LIBOR plus 1.00%), 7/17/37(3) | 1,817,633 |
| 1,822,508 |
|
MVW Owner Trust, Series 2014-1A, Class A SEQ, 2.25%,9/22/31(3) | 139,547 |
| 139,540 |
|
MVW Owner Trust, Series 2015-1A, Class A SEQ, 2.52%, 12/20/32(3) | 144,010 |
| 144,179 |
|
MVW Owner Trust, Series 2016-1A, Class A SEQ, 2.25%, 12/20/33(3) | 218,704 |
| 217,811 |
|
MVW Owner Trust, Series 2017-1A, Class A SEQ, 2.42%, 12/20/34(3) | 511,737 |
| 513,607 |
|
MVW Owner Trust, Series 2018-1A, Class A SEQ, 3.45%, 1/21/36(3) | 727,408 |
| 750,845 |
|
Progress Residential Trust, Series 2018-SFR3, Class A SEQ, 3.88%, 10/17/35(3) | 999,372 |
| 1,027,351 |
|
Progress Residential Trust, Series 2018-SFR3, Class B, 4.08%, 10/17/35(3) | 2,550,000 |
| 2,616,390 |
|
Progress Residential Trust, Series 2019-SFR3, Class A SEQ, 2.27%, 9/17/36(3) | 1,150,000 |
| 1,140,904 |
|
|
| | | | | | |
| | Shares/
Principal Amount | Value |
Sierra Timeshare Conduit Receivables Funding LLC, Series 2017-1A, Class A SEQ, 2.91%, 3/20/34(3) | $ | 128,435 |
| $ | 129,933 |
|
Sierra Timeshare Receivables Funding LLC, Series 2015-1A, Class A SEQ, 2.40%, 3/22/32(3) | 78,262 |
| 78,241 |
|
Sierra Timeshare Receivables Funding LLC, Series 2018-2A, Class A SEQ, 3.50%, 6/20/35(3) | 514,872 |
| 527,495 |
|
Sierra Timeshare Receivables Funding LLC, Series 2019-2A, Class A SEQ, 2.59%, 5/20/36(3) | 876,137 |
| 882,299 |
|
Towd Point Mortgage Trust, Series 2016-1, Class A1, VRN, 3.50%, 2/25/55(3) | 174,915 |
| 177,984 |
|
Towd Point Mortgage Trust, Series 2017-2, Class A1, VRN, 2.75%, 4/25/57(3) | 328,351 |
| 331,805 |
|
Towd Point Mortgage Trust, Series 2017-6, Class A1, VRN, 2.75%, 10/25/57(3) | 434,674 |
| 438,645 |
|
Towd Point Mortgage Trust, Series 2018-1, Class A1 SEQ, VRN, 3.00%, 1/25/58(3) | 363,131 |
| 369,607 |
|
Towd Point Mortgage Trust, Series 2018-4, Class A1, VRN, 3.00%, 6/25/58(3) | 307,869 |
| 318,132 |
|
| US Airways Pass-Through Trust, Series 2013-1, Class A, 3.95%, 5/15/27 | 116,840 |
| 123,273 |
|
VSE VOI Mortgage LLC, Series 2016-A, Class A SEQ, 2.54%, 7/20/33(3) | 326,947 |
| 326,944 |
|
VSE VOI Mortgage LLC, Series 2018-A, Class B, 3.72%, 2/20/36(3) | 630,621 |
| 649,286 |
|
TOTAL ASSET-BACKED SECURITIES
(Cost $18,394,809) | | 18,660,563 |
|
| COLLATERALIZED MORTGAGE OBLIGATIONS — 1.6% | | |
| Private Sponsor Collateralized Mortgage Obligations — 1.3% | | |
| ABN Amro Mortgage Corp., Series 2003-4, Class A4, 5.50%, 3/25/33 | 12,265 |
| 12,988 |
|
| Adjustable Rate Mortgage Trust, Series 2004-4, Class 4A1, VRN, 4.30%, 3/25/35 | 167,716 |
| 174,838 |
|
Agate Bay Mortgage Loan Trust, Series 2016-3, Class A3, VRN, 3.50%, 8/25/46(3) | 319,336 |
| 324,887 |
|
| Banc of America Mortgage Trust, Series 2004-E, Class 2A6 SEQ, VRN, 4.79%, 6/25/34 | 121,157 |
| 123,013 |
|
| Citigroup Mortgage Loan Trust, Inc., Series 2004-UST1, Class A4, VRN, 4.22%, 8/25/34 | 147,336 |
| 143,918 |
|
| Citigroup Mortgage Loan Trust, Inc., Series 2004-UST1, Class A5, VRN, 4.09%, 8/25/34 | 314,276 |
| 319,782 |
|
| Citigroup Mortgage Loan Trust, Inc., Series 2005-4, Class A, VRN, 4.63%, 8/25/35 | 49,302 |
| 51,118 |
|
| Citigroup Mortgage Loan Trust, Inc., Series 2005-6, Class A2, VRN, 4.55%, (1-year H15T1Y plus 2.15%), 9/25/35 | 89,219 |
| 92,094 |
|
| Countrywide Home Loan Mortgage Pass-Through Trust, Series 2005-17, Class 1A11, 5.50%, 9/25/35 | 3,415 |
| 3,383 |
|
Credit Suisse Mortgage Trust, Series 2017-HL2, Class A3 SEQ, VRN, 3.50%, 10/25/47(3) | 553,924 |
| 566,294 |
|
| First Horizon Alternative Mortgage Securities Trust, Series 2004-AA4, Class A1, VRN, 3.97%, 10/25/34 | 187,165 |
| 189,224 |
|
| First Horizon Mortgage Pass-Through Trust, Series 2005-AR3, Class 4A1, VRN, 4.99%, 8/25/35 | 40,568 |
| 42,724 |
|
| GSR Mortgage Loan Trust, Series 2004-7, Class 3A1, VRN, 4.06%, 6/25/34 | 58,313 |
| 58,576 |
|
| GSR Mortgage Loan Trust, Series 2004-AR5, Class 3A3, VRN, 4.69%, 5/25/34 | 89,771 |
| 93,020 |
|
|
| | | | | | |
| | Shares/
Principal Amount | Value |
| GSR Mortgage Loan Trust, Series 2005-AR1, Class 3A1, VRN, 3.78%, 1/25/35 | $ | 109,831 |
| $ | 111,707 |
|
| GSR Mortgage Loan Trust, Series 2005-AR6, Class 2A1, VRN, 4.44%, 9/25/35 | 111,874 |
| 115,788 |
|
| GSR Mortgage Loan Trust, Series 2005-AR6, Class 4A5, VRN, 4.55%, 9/25/35 | 157,036 |
| 162,142 |
|
| JPMorgan Mortgage Trust, Series 2005-A4, Class 1A1, VRN, 4.41%, 7/25/35 | 33,948 |
| 34,548 |
|
| JPMorgan Mortgage Trust, Series 2005-A4, Class 2A1, VRN, 4.29%, 7/25/35 | 22,293 |
| 22,545 |
|
| JPMorgan Mortgage Trust, Series 2006-A3, Class 7A1, VRN, 4.67%, 4/25/35 | 109,799 |
| 113,334 |
|
JPMorgan Mortgage Trust, Series 2013-1, Class 2A2 SEQ, VRN, 2.50%, 3/25/43(3) | 54,155 |
| 54,337 |
|
JPMorgan Mortgage Trust, Series 2017-1, Class A2, VRN, 3.50%, 1/25/47(3) | 664,297 |
| 677,914 |
|
JPMorgan Mortgage Trust, Series 2018-6, Class 1A4 SEQ, VRN, 3.50%, 12/25/48(3) | 689,563 |
| 697,456 |
|
| MASTR Adjustable Rate Mortgages Trust, Series 2004-13, Class 3A7, VRN, 4.71%, 11/21/34 | 154,560 |
| 159,916 |
|
| Merrill Lynch Mortgage Investors Trust, Series 2005-3, Class 2A, VRN, 4.29%, 11/25/35 | 97,780 |
| 99,682 |
|
| Merrill Lynch Mortgage Investors Trust, Series 2005-A2, Class A1, VRN, 4.43%, 2/25/35 | 138,583 |
| 141,720 |
|
New Residential Mortgage Loan Trust, Series 2017-1A, Class A1, VRN, 4.00%, 2/25/57(3) | 1,089,853 |
| 1,152,189 |
|
New Residential Mortgage Loan Trust, Series 2017-2A, Class A3, VRN, 4.00%, 3/25/57(3) | 661,729 |
| 700,441 |
|
New Residential Mortgage Loan Trust, Series 2017-5A, Class A1, VRN, 3.32%, (1-month LIBOR plus 1.50%), 6/25/57(3) | 380,081 |
| 387,435 |
|
Sequoia Mortgage Trust, Series 2017-CH1, Class A1, VRN, 4.00%, 8/25/47(3) | 589,658 |
| 605,832 |
|
Sequoia Mortgage Trust, Series 2017-CH2, Class A10 SEQ, VRN, 4.00%, 12/25/47(3) | 442,203 |
| 446,919 |
|
Sequoia Mortgage Trust, Series 2018-7, Class A4 SEQ, VRN, 4.00%, 9/25/48(3) | 1,002,123 |
| 1,014,563 |
|
Sequoia Mortgage Trust, Series 2018-CH2, Class A12 SEQ, VRN, 4.00%, 6/25/48(3) | 930,809 |
| 942,900 |
|
Sofi Mortgage Trust, Series 2016-1A, Class 1A4 SEQ, VRN, 3.00%, 11/25/46(3) | 255,753 |
| 255,453 |
|
| Structured Adjustable Rate Mortgage Loan Trust, Series 2004-8, Class 2A1, VRN, 4.38%, 7/25/34 | 69,195 |
| 70,715 |
|
| Thornburg Mortgage Securities Trust, Series 2004-3, Class A, VRN, 2.56%, (1-month LIBOR plus 0.74%), 9/25/44 | 465,348 |
| 470,571 |
|
| WaMu Mortgage Pass-Through Certificates, Series 2005-AR3, Class A1, VRN, 4.43%, 3/25/35 | 258,643 |
| 258,626 |
|
| Wells Fargo Mortgage-Backed Securities Trust, Series 2004-4, Class A9, 5.50%, 5/25/34 | 33,905 |
| 35,319 |
|
| Wells Fargo Mortgage-Backed Securities Trust, Series 2004-S, Class A1, VRN, 4.89%, 9/25/34 | 53,513 |
| 55,965 |
|
| Wells Fargo Mortgage-Backed Securities Trust, Series 2005-17, Class 1A1, 5.50%, 1/25/36 | 37,480 |
| 37,560 |
|
| Wells Fargo Mortgage-Backed Securities Trust, Series 2005-AR10, Class 1A1, VRN, 4.94%, 6/25/35 | 239,767 |
| 244,044 |
|
| Wells Fargo Mortgage-Backed Securities Trust, Series 2005-AR10, Class 2A15, VRN, 4.93%, 6/25/35 | 21,301 |
| 22,433 |
|
|
| | | | | | |
| | Shares/
Principal Amount | Value |
| Wells Fargo Mortgage-Backed Securities Trust, Series 2005-AR16, Class 3A2, VRN, 4.90%, 3/25/35 | $ | 113,784 |
| $ | 117,952 |
|
| Wells Fargo Mortgage-Backed Securities Trust, Series 2005-AR7, Class 1A1, VRN, 5.09%, 5/25/35 | 98,749 |
| 103,300 |
|
| Wells Fargo Mortgage-Backed Securities Trust, Series 2006-10, Class A4 SEQ, 6.00%, 8/25/36 | 57,105 |
| 57,615 |
|
| Wells Fargo Mortgage-Backed Securities Trust, Series 2007-16, Class 1A1, 6.00%, 12/28/37 | 16,361 |
| 16,438 |
|
| Wells Fargo Mortgage-Backed Securities Trust, Series 2007-AR10, Class 1A1, VRN, 4.83%, 1/25/38 | 48,453 |
| 47,666 |
|
| Wells Fargo Mortgage-Backed Securities Trust, Series 2008-1, Class 4A1, 5.75%, 2/25/38 | 89,569 |
| 95,579 |
|
| | | 11,726,463 |
|
| U.S. Government Agency Collateralized Mortgage Obligations — 0.3% |
| FHLMC, Series 2016-DNA4, Class M2, VRN, 3.12%, (1-month LIBOR plus 1.30%), 3/25/29 | 22,332 |
| 22,394 |
|
| FHLMC, Series 2018-DNA1, Class M1, VRN, 2.27%, (1-month LIBOR plus 0.45%), 7/25/30 | 341,320 |
| 341,085 |
|
| FNMA, Series 2014-C02, Class 1M2, VRN, 4.42%, (1-month LIBOR plus 2.60%), 5/25/24 | 118,444 |
| 123,229 |
|
| FNMA, Series 2014-C02, Class 2M2, VRN, 4.42%, (1-month LIBOR plus 2.60%), 5/25/24 | 460,928 |
| 476,895 |
|
| FNMA, Series 2016-C04, Class 1M1, VRN, 3.27%, (1-month LIBOR plus 1.45%), 1/25/29 | 52,559 |
| 52,622 |
|
| FNMA, Series 2017-C01, Class 1M1, VRN, 3.12%, (1-month LIBOR plus 1.30%), 7/25/29 | 75,330 |
| 75,469 |
|
| FNMA, Series 2018-C01, Class 1M1, VRN, 2.42%, (1-month LIBOR plus 0.60%), 7/25/30 | 1,342,321 |
| 1,342,851 |
|
| FNMA, Series 2018-C02, Class 2M1, VRN, 2.47%, (1-month LIBOR plus 0.65%), 8/25/30 | 401,614 |
| 401,625 |
|
| | | 2,836,170 |
|
TOTAL COLLATERALIZED MORTGAGE OBLIGATIONS
(Cost $14,341,611) | | 14,562,633 |
|
| COMMERCIAL MORTGAGE-BACKED SECURITIES — 1.5% | | |
BB-UBS Trust, Series 2012-SHOW, Class A SEQ, 3.43%, 11/5/36(3) | 1,000,000 |
| 1,053,415 |
|
| Benchmark Mortgage Trust, Series 2018-B6, Class AS, 4.44%, 10/10/51 | 1,500,000 |
| 1,708,095 |
|
BX Trust, Series 2018-MCSF, Class A, VRN, 2.49%, (1-month LIBOR plus 0.58%), 4/15/35(3) | 700,000 |
| 699,489 |
|
| Commercial Mortgage Pass-Through Certificates, Series 2014-CR15, Class AM, VRN, 4.43%, 2/10/47 | 675,000 |
| 732,297 |
|
| Commercial Mortgage Pass-Through Certificates, Series 2014-LC17, Class AM, VRN, 4.19%, 10/10/47 | 775,000 |
| 837,304 |
|
| Commercial Mortgage Pass-Through Certificates, Series 2014-UBS5, Class AM, VRN, 4.19%, 9/10/47 | 900,000 |
| 961,932 |
|
| Commercial Mortgage Trust, Series 2016-CD1, Class AM, 2.93%, 8/10/49 | 400,000 |
| 409,177 |
|
Commercial Mortgage Trust, Series 2017-PANW, Class A SEQ, 3.24%, 10/10/29(3) | 1,000,000 |
| 1,044,070 |
|
DBCG Mortgage Trust, Series 2017-BBG, Class A, VRN, 2.61%, (1-month LIBOR plus 0.70%), 6/15/34(3) | 1,250,000 |
| 1,249,099 |
|
| GS Mortgage Securities Trust, Series 2016-GS2, Class B, VRN, 3.76%, 5/10/49 | 1,000,000 |
| 1,057,830 |
|
Hudson Yards Mortgage Trust, Series 2016-10HY, Class B, VRN, 2.98%, 8/10/38(3) | 1,275,000 |
| 1,322,022 |
|
|
| | | | | | |
| | Shares/
Principal Amount | Value |
| JPMBB Commercial Mortgage Securities Trust, Series 2014-C21, Class B, VRN, 4.34%, 8/15/47 | $ | 475,000 |
| $ | 503,051 |
|
| JPMorgan Chase Commercial Mortgage Securities Trust, Series 2013-C16, Class A4 SEQ, 4.17%, 12/15/46 | 275,000 |
| 296,181 |
|
| JPMorgan Chase Commercial Mortgage Securities Trust, Series 2016-JP2, Class A4 SEQ, 2.82%, 8/15/49 | 600,000 |
| 619,527 |
|
Morgan Stanley Capital I Trust, Series 2014-CPT, Class C, VRN, 3.45%, 7/13/29(3) | 725,000 |
| 734,984 |
|
TOTAL COMMERCIAL MORTGAGE-BACKED SECURITIES
(Cost $12,751,833) | | 13,228,473 |
|
| COLLATERALIZED LOAN OBLIGATIONS — 1.1% | | |
Bean Creek CLO Ltd., Series 2015-1A, Class AR, VRN, 2.99%, (3-month LIBOR plus 1.02%), 4/20/31(3) | 750,000 |
| 740,076 |
|
Carlyle Global Market Strategies CLO Ltd., Series 2014-5A, Class A1RR, VRN, 3.14%, (3-month LIBOR plus 1.14%), 7/15/31(3) | 350,000 |
| 348,544 |
|
CBAM Ltd., Series 2019-9A, Class A, VRN, 3.28%, (3-month LIBOR plus 1.28%), 2/12/30(3) | 650,000 |
| 648,981 |
|
CIFC Funding Ltd., Series 2013-3RA, Class A1, VRN, 2.92%, (3-month LIBOR plus 0.98%), 4/24/31(3) | 450,000 |
| 444,449 |
|
CIFC Funding Ltd., Series 2015-1A, Class ARR, VRN, 3.06%, (3-month LIBOR plus 1.11%), 1/22/31(3) | 325,000 |
| 322,909 |
|
Dryden 64 CLO Ltd., Series 2018-64A, Class A, VRN, 2.97%, (3-month LIBOR plus 0.97%), 4/18/31(3) | 550,000 |
| 543,396 |
|
Goldentree Loan Opportunities X Ltd., Series 2015-10A, Class AR, VRN, 3.09%, (3-month LIBOR plus 1.12%), 7/20/31(3) | 750,000 |
| 744,861 |
|
KKR CLO Ltd., Series 2022A, Class A, VRN, 3.12%, (3-month LIBOR plus 1.15%), 7/20/31(3) | 650,000 |
| 646,147 |
|
LCM XIV LP, Series 2014A, Class AR, VRN, 3.01%, (3-month LIBOR plus 1.04%), 7/20/31(3) | 300,000 |
| 296,312 |
|
Magnetite VIII Ltd., Series 2014-8A, Class AR2, VRN, 2.98%, (3-month LIBOR plus 0.98%), 4/15/31(3) | 750,000 |
| 753,957 |
|
Octagon Investment Partners 45 Ltd., Series 2019-1A, Class A, VRN, 3.16%, (3-month LIBOR plus 1.33%), 10/15/32(3)(4) | 1,650,000 |
| 1,650,000 |
|
Sounds Point CLO IV-R Ltd., Series 2013-3RA, Class A, VRN, 3.15%, (3-month LIBOR plus 1.15%), 4/18/31(3) | 885,000 |
| 875,681 |
|
Treman Park CLO Ltd., Series 2015-1A, Class ARR, VRN, 3.04%, (3-month LIBOR plus 1.07%), 10/20/28(3) | 750,000 |
| 747,306 |
|
Voya CLO Ltd., Series 2013-2A, Class A1R, VRN, 2.91%, (3-month LIBOR plus 0.97%), 4/25/31(3) | 900,000 |
| 887,052 |
|
Voya CLO Ltd., Series 2013-3A, Class A1RR, VRN, 3.15%, (3-month LIBOR plus 1.15%), 10/18/31(3) | 375,000 |
| 372,013 |
|
TOTAL COLLATERALIZED LOAN OBLIGATIONS
(Cost $10,073,428) | | 10,021,684 |
|
| MUNICIPAL SECURITIES — 0.6% | | |
| Bay Area Toll Authority Rev., 6.92%, 4/1/40 | 295,000 |
| 444,881 |
|
| Houston GO, 3.96%, 3/1/47 | 120,000 |
| 137,944 |
|
| Los Angeles Community College District GO, 6.68%, 8/1/36 | 100,000 |
| 147,198 |
|
| Metropolitan Transportation Authority Rev., 6.69%, 11/15/40 | 105,000 |
| 149,637 |
|
| Metropolitan Transportation Authority Rev., 6.81%, 11/15/40 | 60,000 |
| 85,994 |
|
| Metropolitan Water Reclamation District of Greater Chicago GO, 5.72%, 12/1/38 | 650,000 |
| 871,429 |
|
| Missouri Highway & Transportation Commission Rev., 5.45%, 5/1/33 | 130,000 |
| 162,102 |
|
| New Jersey Turnpike Authority Rev., 7.41%, 1/1/40 | 200,000 |
| 320,652 |
|
| New Jersey Turnpike Authority Rev., 7.10%, 1/1/41 | 95,000 |
| 148,084 |
|
|
| | | | | | |
| | Shares/
Principal Amount | Value |
| New York City GO, 6.27%, 12/1/37 | $ | 95,000 |
| $ | 134,934 |
|
| Ohio Water Development Authority Water Pollution Control Loan Fund Rev., 4.88%, 12/1/34 | 110,000 |
| 130,547 |
|
| Port Authority of New York & New Jersey Rev., 4.93%, 10/1/51 | 50,000 |
| 67,012 |
|
| Port Authority of New York & New Jersey Rev., 4.46%, 10/1/62 | 245,000 |
| 309,714 |
|
| Rutgers The State University of New Jersey Rev., 5.67%, 5/1/40 | 300,000 |
| 393,822 |
|
| Sacramento Municipal Utility District Rev., 6.16%, 5/15/36 | 210,000 |
| 290,331 |
|
| Salt River Project Agricultural Improvement & Power District Rev., 4.84%, 1/1/41 | 95,000 |
| 121,538 |
|
| San Francisco Public Utilities Commission Water Rev., 6.00%, 11/1/40 | 105,000 |
| 141,876 |
|
| San Francisco Public Utilities Commission Water Rev., 6.95%, 11/1/50 | 65,000 |
| 105,037 |
|
| Santa Clara Valley Transportation Authority Rev., 5.88%, 4/1/32 | 120,000 |
| 149,875 |
|
| State of California GO, 4.60%, 4/1/38 | 355,000 |
| 394,117 |
|
| State of California GO, 7.55%, 4/1/39 | 100,000 |
| 164,217 |
|
| State of California GO, 7.30%, 10/1/39 | 160,000 |
| 247,798 |
|
| State of California GO, 7.60%, 11/1/40 | 80,000 |
| 135,158 |
|
| State of Illinois GO, 5.10%, 6/1/33 | 345,000 |
| 373,300 |
|
| State of Oregon Department of Transportation Rev., 5.83%, 11/15/34 | 70,000 |
| 96,037 |
|
| State of Texas GO, 5.52%, 4/1/39 | 50,000 |
| 68,405 |
|
| State of Washington GO, 5.14%, 8/1/40 | 20,000 |
| 26,527 |
|
TOTAL MUNICIPAL SECURITIES
(Cost $4,683,742) | | 5,818,166 |
|
| SOVEREIGN GOVERNMENTS AND AGENCIES — 0.3% | | |
Chile† | | |
| Chile Government International Bond, 3.25%, 9/14/21 | 100,000 |
| 102,251 |
|
| Chile Government International Bond, 3.625%, 10/30/42 | 100,000 |
| 110,001 |
|
| | | 212,252 |
|
| Colombia — 0.1% | | |
| Colombia Government International Bond, 4.375%, 7/12/21 | 310,000 |
| 320,927 |
|
| Mexico — 0.1% | | |
| Mexico Government International Bond, 4.15%, 3/28/27 | 600,000 |
| 643,806 |
|
Peru† | | |
| Peruvian Government International Bond, 5.625%, 11/18/50 | 170,000 |
| 249,477 |
|
| Philippines — 0.1% | | |
| Philippine Government International Bond, 4.00%, 1/15/21 | 300,000 |
| 306,450 |
|
| Philippine Government International Bond, 6.375%, 10/23/34 | 150,000 |
| 212,207 |
|
| | | 518,657 |
|
Poland† | | |
| Republic of Poland Government International Bond, 5.125%, 4/21/21 | 140,000 |
| 146,412 |
|
| Republic of Poland Government International Bond, 3.00%, 3/17/23 | 140,000 |
| 144,601 |
|
| | | 291,013 |
|
South Africa† | | |
| Republic of South Africa Government International Bond, 4.67%, 1/17/24 | 110,000 |
| 114,913 |
|
|
| | | | | | |
| | Shares/
Principal Amount | Value |
Uruguay† | | |
| Uruguay Government International Bond, 4.125%, 11/20/45 | $ | 120,000 |
| $ | 128,551 |
|
TOTAL SOVEREIGN GOVERNMENTS AND AGENCIES
(Cost $2,275,165) | | 2,479,596 |
|
| U.S. GOVERNMENT AGENCY SECURITIES — 0.1% | | |
| FNMA, 2.125%, 4/24/26 | 270,000 |
| 278,018 |
|
| FNMA, 6.625%, 11/15/30 | 600,000 |
| 877,129 |
|
TOTAL U.S. GOVERNMENT AGENCY SECURITIES
(Cost $1,009,233) | | 1,155,147 |
|
BANK LOAN OBLIGATIONS(5)† | | |
Diversified Telecommunication Services† | | |
Zayo Group, LLC, 2017 Incremental Term Loan, 4.04%, (1-month LIBOR plus 2.25%), 1/19/24
(Cost $351,459) | 350,000 |
| 350,943 |
|
| TEMPORARY CASH INVESTMENTS — 3.7% | | |
State Street Institutional U.S. Government Money Market Fund, Premier Class
(Cost $33,947,742) | 33,947,742 |
| 33,947,742 |
|
TOTAL INVESTMENT SECURITIES — 101.3%
(Cost $776,741,726) | | 922,387,459 |
|
| OTHER ASSETS AND LIABILITIES — (1.3)% | | (12,136,507 | ) |
| TOTAL NET ASSETS — 100.0% | | $ | 910,250,952 |
|
|
| | | | | | | | | | | |
| FUTURES CONTRACTS PURCHASED |
| Reference Entity | Contracts | Expiration
Date | Notional
Amount | Underlying
Contract
Value | Unrealized
Appreciation
(Depreciation) |
| S&P 500 E-Mini | 75 | December 2019 | $ | 3,750 |
| $ | 11,384,250 |
| $ | 77,723 |
|
| U.S. Treasury 2-Year Notes | 127 | December 2019 | $ | 25,400,000 |
| 27,381,399 |
| (69,247 | ) |
| U.S. Treasury 5-Year Notes | 2 | December 2019 | $ | 200,000 |
| 238,406 |
| (1,754 | ) |
| U.S. Treasury 10-Year Notes | 6 | December 2019 | $ | 600,000 |
| 781,781 |
| 2,799 |
|
| | | | | $ | 39,785,836 |
| $ | 9,521 |
|
|
| | | | | | | | | | | | | | | |
| CENTRALLY CLEARED TOTAL RETURN SWAP AGREEMENTS |
| Floating Rate Index | Pay/Receive Floating Rate Index at Termination | Fixed Rate | Termination
Date | Notional
Amount | Premiums Paid (Received) | Unrealized
Appreciation
(Depreciation) | Value |
| CPURNSA | Receive | 1.78% | 8/5/24 | $ | 3,500,000 |
| $ | (503 | ) | $ | (32,728 | ) | $ | (33,231 | ) |
|
| | |
| NOTES TO SCHEDULE OF INVESTMENTS |
| FHLMC | - | Federal Home Loan Mortgage Corporation |
| FNMA | - | Federal National Mortgage Association |
| GNMA | - | Government National Mortgage Association |
| GO | - | General Obligation |
| H15T1Y | - | Constant Maturity U.S. Treasury Note Yield Curve Rate Index |
| LIBOR | - | London Interbank Offered Rate |
| MTN | - | Medium Term Note |
| SEQ | - | Sequential Payer |
| TBA | - | To-Be-Announced. Security was purchased on a forward commitment basis with an approximate principal amount and maturity date. Actual principal amount and maturity date will be determined upon settlement. |
| VRN | - | Variable Rate Note. The rate adjusts periodically based upon the terms set forth in the security’s offering documents. The rate shown is effective at the period end and the reference rate and spread, if any, is indicated. |
| |
| † | Category is less than 0.05% of total net assets. |
| |
| (2) | Security, or a portion thereof, has been pledged at the custodian bank or with a broker for collateral requirements on forward commitments, futures contracts and/or swap agreements. At the period end, the aggregate value of securities pledged was $205,499. |
| |
| (3) | Security was purchased pursuant to Rule 144A under the Securities Act of 1933 and may be sold in transactions exempt from registration, normally to qualified institutional investors. The aggregate value of these securities at the period end was $48,271,552, which represented 5.3% of total net assets. |
| |
| (4) | When-issued security. The issue price and yield are fixed on the date of the commitment, but payment and delivery are scheduled for a future date. |
| |
| (5) | The interest rate on a bank loan obligation adjusts periodically based on a predetermined schedule. Rate shown is effective at period end. The maturity date on a bank loan obligation may be less than indicated as a result of contractual or optional prepayments. These prepayments cannot be predicted with certainty. |
See Notes to Financial Statements.
|
|
| Statement of Assets and Liabilities |
|
| | | |
| OCTOBER 31, 2019 | |
| Assets | |
| Investment securities, at value (cost of $776,741,726) | $ | 922,387,459 |
|
| Cash | 1,294 |
|
| Deposits with broker for futures contracts | 472,500 |
|
| Receivable for investments sold | 2,338,196 |
|
| Receivable for capital shares sold | 369,533 |
|
| Receivable for variation margin on futures contracts | 51,625 |
|
| Interest and dividends receivable | 2,609,708 |
|
| | 928,230,315 |
|
| | |
| Liabilities | |
| Payable for investments purchased | 16,721,192 |
|
| Payable for capital shares redeemed | 530,657 |
|
| Payable for variation margin on futures contracts | 45,000 |
|
| Payable for variation margin on swap agreements | 6,348 |
|
| Accrued management fees | 676,166 |
|
| | 17,979,363 |
|
| | |
| Net Assets | $ | 910,250,952 |
|
| | |
| Net Assets Consist of: | |
| Capital (par value and paid-in surplus) | $ | 733,109,718 |
|
| Distributable earnings | 177,141,234 |
|
| | $ | 910,250,952 |
|
|
| | | | |
| | Net Assets | Shares Outstanding | Net Asset Value Per Share |
| Investor Class, $0.01 Par Value | $838,308,767 | 43,549,536 |
| $19.25 |
| I Class, $0.01 Par Value | $68,889,489 | 3,576,180 |
| $19.26 |
| R5 Class, $0.01 Par Value | $3,052,696 | 158,496 |
| $19.26 |
See Notes to Financial Statements.
|
| | | |
| YEAR ENDED OCTOBER 31, 2019 | |
| Investment Income (Loss) | |
| Income: | |
| Interest | $ | 11,790,179 |
|
| Dividends | 10,046,912 |
|
| | 21,837,091 |
|
| | |
| Expenses: | |
| Management fees | 7,784,372 |
|
| Directors' fees and expenses | 27,170 |
|
| Other expenses | 4,721 |
|
| | 7,816,263 |
|
| | |
| Net investment income (loss) | 14,020,828 |
|
| | |
| Realized and Unrealized Gain (Loss) | |
| Net realized gain (loss) on: | |
| Investment transactions | 30,436,674 |
|
| Forward foreign currency exchange contract transactions | 19,804 |
|
| Futures contract transactions | 1,568,256 |
|
| Swap agreement transactions | 64,060 |
|
| Foreign currency translation transactions | (636 | ) |
| | 32,088,158 |
|
| | |
| Change in net unrealized appreciation (depreciation) on: | |
| Investments | 52,098,003 |
|
| Forward foreign currency exchange contracts | (10,966 | ) |
| Futures contracts | 177,464 |
|
| Swap agreements | (32,728 | ) |
| Translation of assets and liabilities in foreign currencies | 645 |
|
| | 52,232,418 |
|
| | |
| Net realized and unrealized gain (loss) | 84,320,576 |
|
| | |
| Net Increase (Decrease) in Net Assets Resulting from Operations | $ | 98,341,404 |
|
See Notes to Financial Statements.
|
|
| Statement of Changes in Net Assets |
|
| | | | | | |
| YEARS ENDED OCTOBER 31, 2019 AND OCTOBER 31, 2018 |
| Increase (Decrease) in Net Assets | October 31, 2019 | October 31, 2018 |
| Operations | | |
| Net investment income (loss) | $ | 14,020,828 |
| $ | 11,994,840 |
|
| Net realized gain (loss) | 32,088,158 |
| 48,171,350 |
|
| Change in net unrealized appreciation (depreciation) | 52,232,418 |
| (44,288,047 | ) |
| Net increase (decrease) in net assets resulting from operations | 98,341,404 |
| 15,878,143 |
|
| | | |
| Distributions to Shareholders | | |
| From earnings: | | |
| Investor Class | (56,693,821 | ) | (46,718,422 | ) |
| I Class | (4,432,562 | ) | (4,323,186 | ) |
| R5 Class | (189,961 | ) | (21,216 | ) |
| Decrease in net assets from distributions | (61,316,344 | ) | (51,062,824 | ) |
| | | |
| Capital Share Transactions | | |
| Net increase (decrease) in net assets from capital share transactions (Note 5) | 10,455,267 |
| 9,996,470 |
|
| | | |
| Net increase (decrease) in net assets | 47,480,327 |
| (25,188,211 | ) |
| | | |
| Net Assets | | |
| Beginning of period | 862,770,625 |
| 887,958,836 |
|
| End of period | $ | 910,250,952 |
| $ | 862,770,625 |
|
See Notes to Financial Statements.
|
|
| Notes to Financial Statements |
OCTOBER 31, 2019
1. Organization
American Century Mutual Funds, Inc. (the corporation) is registered under the Investment Company Act of 1940, as amended (the 1940 Act), as an open-end management investment company and is organized as a Maryland corporation. Balanced Fund (the fund) is one fund in a series issued by the corporation. The fund’s investment objective is to seek long-term capital growth and current income by investing approximately 60% of its assets in equity securities and the remainder in bonds and other fixed-income securities. The fund offers the Investor Class, I Class and R5 Class.
2. Significant Accounting Policies
The following is a summary of significant accounting policies consistently followed by the fund in preparation of its financial statements. The fund is an investment company and follows accounting and reporting guidance in accordance with accounting principles generally accepted in the United States of America. This may require management to make certain estimates and assumptions at the date of the financial statements. Actual results could differ from these estimates. Management evaluated the impact of events or transactions occurring through the date the financial statements were issued that would merit recognition or disclosure.
Investment Valuations — The fund determines the fair value of its investments and computes its net asset value per share at the close of regular trading (usually 4 p.m. Eastern time) on the New York Stock Exchange (NYSE) on each day the NYSE is open. The Board of Directors has adopted valuation policies and procedures to guide the investment advisor in the fund’s investment valuation process and to provide methodologies for the oversight of the fund’s pricing function.
Equity securities that are listed or traded on a domestic securities exchange are valued at the last reported sales price or at the official closing price as provided by the exchange. Equity securities traded on foreign securities exchanges are generally valued at the closing price of such securities on the exchange where primarily traded or at the close of the NYSE, if that is earlier. If no last sales price is reported, or if local convention or regulation so provides, the mean of the latest bid and asked prices may be used. Securities traded over-the-counter are valued at the mean of the latest bid and asked prices, the last sales price, or the official closing price. Equity securities initially expressed in local currencies are translated into U.S. dollars at the mean of the appropriate currency exchange rate at the close of the NYSE as provided by an independent pricing service.
Fixed income securities are valued at the evaluated mean as provided by independent pricing services or at the mean of the most recent bid and asked prices as provided by investment dealers. Corporate bonds, U.S. Treasury and Government Agency securities, convertible bonds, bank loan obligations, municipal securities, and sovereign governments and agencies are valued using market models that consider trade data, quotations from dealers and active market makers, relevant yield curve and spread data, creditworthiness, trade data or market information on comparable securities, and other relevant security specific information. Mortgage-related and asset-backed securities are valued based on models that consider trade data, prepayment and default projections, benchmark yield and spread data and estimated cash flows of each tranche of the issuer. Collateralized loan obligations are valued based on discounted cash flow models that consider trade and economic data, prepayment assumptions and default projections. Fixed income securities initially expressed in local currencies are translated into U.S. dollars at the mean of the appropriate currency exchange rate at the close of the NYSE as provided by an independent pricing service.
Open-end management investment companies are valued at the reported net asset value per share. Exchange-traded futures contracts are valued at the settlement price as provided by the appropriate exchange. Swap agreements are valued at an evaluated mean as provided by independent pricing services or independent brokers. Forward foreign currency exchange contracts are valued at the mean of the appropriate forward exchange rate at the close of the NYSE as provided by an independent pricing service.
If the fund determines that the market price for an investment is not readily available or the valuation methods mentioned above do not reflect an investment’s fair value, such investment is valued as determined in good faith by the Board of Directors or its delegate, in accordance with policies and procedures adopted by the Board of Directors. In its determination of fair value, the fund may review several factors including, but not limited to, market information regarding the specific investment or comparable investments and correlation with other investment types, futures indices or general market indicators. Circumstances that may cause the fund to use these procedures to value an investment include, but are not limited to: an investment has been declared in default or is distressed; trading in a security has been suspended during the trading day or a security is not actively trading on its principal exchange; prices received from a regular pricing source are deemed unreliable; or there is a foreign market holiday and no trading occurred.
The fund monitors for significant events occurring after the close of an investment’s primary exchange but before the fund’s net asset value per share is determined. Significant events may include, but are not limited to: corporate announcements and transactions; governmental action and political unrest that could impact a specific investment or an investment sector; or armed conflicts, natural disasters and similar events that could affect investments in a specific country or region. The fund also monitors for significant fluctuations between domestic and foreign markets, as evidenced by the U.S. market or such other indicators that the Board of Directors, or its delegate, deems appropriate. The fund may apply a model-derived factor to the closing price of equity securities traded on foreign securities exchanges. The factor is based on observable market data as provided by an independent pricing service.
Security Transactions — Security transactions are accounted for as of the trade date. Net realized gains and losses are determined on the identified cost basis, which is also used for federal income tax purposes.
Investment Income — Dividend income less foreign taxes withheld, if any, is recorded as of the ex-dividend date. Distributions received on securities that represent a return of capital or long-term capital gain are recorded as a reduction of cost of investments and/or as a realized gain. The fund may estimate the components of distributions received that may be considered nontaxable distributions or long-term capital gain distributions for income tax purposes. Interest income is recorded on the accrual basis and includes paydown gain (loss) and accretion of discounts and amortization of premiums. Inflation adjustments related to inflation-linked debt securities are reflected as interest income.
Foreign Currency Translations — All assets and liabilities initially expressed in foreign currencies are translated into U.S. dollars at prevailing exchange rates at period end. The fund may enter into spot foreign currency exchange contracts to facilitate transactions denominated in a foreign currency. Purchases and sales of investment securities, dividend and interest income, spot foreign currency exchange contracts, and expenses are translated at the rates of exchange prevailing on the respective dates of such transactions. Net realized and unrealized foreign currency exchange gains or losses related to investment securities are a component of net realized gain (loss) on investment transactions and change in net unrealized appreciation (depreciation) on investments, respectively.
Forward Commitments — The fund may engage in securities transactions on a forward commitment basis. In these transactions, the securities’ prices and yields are fixed on the date of the commitment. The fund may sell a to-be-announced (TBA) security and at the same time make a commitment to purchase the same security at a future date at a specified price. Conversely, the fund may purchase a TBA security and at the same time make a commitment to sell the same security at a future date at a specified price. These types of transactions are known as “TBA roll” transactions and are accounted for as purchases and sales. The fund will segregate cash, cash equivalents or other appropriate liquid securities on its records in amounts sufficient to meet the purchase price.
Segregated Assets — In accordance with the 1940 Act, the fund segregates assets on its books and records to cover certain types of investment securities and other financial instruments. American Century Investment Management, Inc. (ACIM) (the investment advisor) monitors, on a daily basis, the securities segregated to ensure the fund designates a sufficient amount of liquid assets, marked-to-market daily. The fund may also receive assets or be required to pledge assets at the custodian bank or with a broker for collateral requirements.
Income Tax Status — It is the fund’s policy to distribute substantially all net investment income and net realized gains to shareholders and to otherwise qualify as a regulated investment company under provisions of the Internal Revenue Code. Accordingly, no provision has been made for income taxes. The fund files U.S. federal, state, local and non-U.S. tax returns as applicable. The fund's tax returns are subject to examination by the relevant taxing authority until expiration of the applicable statute of limitations, which is generally three years from the date of filing but can be longer in certain jurisdictions. At this time, management believes there are no uncertain tax positions which, based on their technical merit, would not be sustained upon examination and for which it is reasonably possible that the total amounts of unrecognized tax benefits will significantly change in the next twelve months.
Multiple Class — All shares of the fund represent an equal pro rata interest in the net assets of the class to which such shares belong, and have identical voting, dividend, liquidation and other rights and the same terms and conditions, except for class specific expenses and exclusive rights to vote on matters affecting only individual classes. Income, non-class specific expenses, and realized and unrealized capital gains and losses of the fund are allocated to each class of shares based on their relative net assets.
Distributions to Shareholders — Distributions from net investment income, if any, are generally declared and paid quarterly. Distributions from net realized gains, if any, are generally declared and paid annually.
Indemnifications — Under the corporation’s organizational documents, its officers and directors are indemnified against certain liabilities arising out of the performance of their duties to the fund. In addition, in the normal course of business, the fund enters into contracts that provide general indemnifications. The maximum exposure under these arrangements is unknown as this would involve future claims that may be made against a fund. The risk of material loss from such claims is considered by management to be remote.
3. Fees and Transactions with Related Parties
Certain officers and directors of the corporation are also officers and/or directors of American Century Companies, Inc. (ACC). The corporation’s investment advisor, ACIM, the corporation's distributor, American Century Investment Services, Inc., and the corporation’s transfer agent, American Century Services, LLC, are wholly owned, directly or indirectly, by ACC.
Management Fees — The corporation has entered into a management agreement with ACIM, under which ACIM provides the fund with investment advisory and management services in exchange for a single, unified management fee (the fee) per class. The agreement provides that all expenses of managing and operating the fund, except distribution and service fees, brokerage expenses, taxes, interest, fees and expenses of the independent directors (including legal counsel fees), and extraordinary expenses, will be paid by ACIM. The fee is computed and accrued daily based on each class's daily net assets and paid monthly in arrears. The difference in the fee among the classes is a result of their separate arrangements for non-Rule 12b-1 shareholder services. It is not the result of any difference in advisory or custodial fees or other expenses related to the management of the fund’s assets, which do not vary by class. The rate of the fee is determined by applying a fee rate calculation formula. This formula takes into account the fund’s assets as well as certain assets, if any, of other clients of the investment advisor outside the American Century Investments family of funds (such as subadvised funds and separate accounts) that use very similar investment teams and strategies (strategy assets).
The management fee schedule range and the effective annual management fee for each class for the period ended October 31, 2019 are as follows:
|
| | |
| | Management Fee Schedule Range | Effective Annual Management Fee |
| Investor Class | 0.800% to 0.900% | 0.90% |
| I Class | 0.600% to 0.700% | 0.70% |
| R5 Class | 0.600% to 0.700% | 0.70% |
Directors' Fees and Expenses — The Board of Directors is responsible for overseeing the investment advisor’s management and operations of the fund. The directors receive detailed information about the fund and its investment advisor regularly throughout the year, and meet at least quarterly with management of the investment advisor to review reports about fund operations. The fund’s officers do not receive compensation from the fund.
Interfund Transactions — The fund may enter into security transactions with other American Century Investments funds and other client accounts of the investment advisor, in accordance with the 1940 Act rules and procedures adopted by the Board of Directors. The rules and procedures require, among other things, that these transactions be effected at the independent current market price of the security. During the period, the interfund purchases and sales were $24,982,714 and $8,168,872, respectively. The effect of interfund transactions on the Statement of Operations was $203,319 in net realized gain (loss) on investment transactions.
4. Investment Transactions
Purchases of investment securities, excluding short-term investments, for the period ended October 31, 2019 totaled $878,901,611, of which $344,930,913 represented U.S. Treasury and Government Agency obligations.
Sales of investment securities, excluding short-term investments, for the period ended October 31, 2019 totaled $945,487,758, of which $332,225,498 represented U.S. Treasury and Government Agency obligations.
5. Capital Share Transactions
Transactions in shares of the fund were as follows:
|
| | | | | | | | | | |
| | Year ended
October 31, 2019 | Year ended
October 31, 2018 |
| | Shares | Amount | Shares | Amount |
| Investor Class/Shares Authorized | 530,000,000 |
| | 360,000,000 |
| |
| Sold | 3,650,691 |
| $ | 67,082,586 |
| 3,868,835 |
| $ | 74,382,638 |
|
| Issued in reinvestment of distributions | 3,226,922 |
| 55,463,226 |
| 2,405,295 |
| 45,635,273 |
|
| Redeemed | (6,358,619 | ) | (116,495,515 | ) | (5,429,365 | ) | (104,029,188 | ) |
| | 518,994 |
| 6,050,297 |
| 844,765 |
| 15,988,723 |
|
| I Class/Shares Authorized | 50,000,000 |
| | 40,000,000 |
| |
| Sold | 852,801 |
| 15,760,666 |
| 692,390 |
| 13,353,992 |
|
| Issued in reinvestment of distributions | 257,104 |
| 4,432,356 |
| 226,647 |
| 4,304,435 |
|
| Redeemed | (878,313 | ) | (16,141,605 | ) | (1,372,689 | ) | (26,321,224 | ) |
| | 231,592 |
| 4,051,417 |
| (453,652 | ) | (8,662,797 | ) |
| R5 Class/Shares Authorized | 30,000,000 |
| | 50,000,000 |
| |
| Sold | 12,932 |
| 239,892 |
| 137,666 |
| 2,655,767 |
|
| Issued in reinvestment of distributions | 11,020 |
| 189,961 |
| 1,095 |
| 21,216 |
|
| Redeemed | (4,163 | ) | (76,300 | ) | (331 | ) | (6,439 | ) |
| | 19,789 |
| 353,553 |
| 138,430 |
| 2,670,544 |
|
| Net increase (decrease) | 770,375 |
| $ | 10,455,267 |
| 529,543 |
| $ | 9,996,470 |
|
6. Fair Value Measurements
The fund’s investments valuation process is based on several considerations and may use multiple inputs to determine the fair value of the investments held by the fund. In conformity with accounting principles generally accepted in the United States of America, the inputs used to determine a valuation are classified into three broad levels.
| |
| • | Level 1 valuation inputs consist of unadjusted quoted prices in an active market for identical investments. |
| |
| • | Level 2 valuation inputs consist of direct or indirect observable market data (including quoted prices for comparable investments, evaluations of subsequent market events, interest rates, prepayment speeds, credit risk, etc.). These inputs also consist of quoted prices for identical investments initially expressed in local currencies that are adjusted through translation into U.S. dollars. |
| |
| • | Level 3 valuation inputs consist of unobservable data (including a fund’s own assumptions). |
The level classification is based on the lowest level input that is significant to the fair valuation measurement. The valuation inputs are not necessarily an indication of the risks associated with investing in these securities or other financial instruments.
The following is a summary of the level classifications as of period end. The Schedule of Investments provides additional information on the fund’s portfolio holdings.
|
| | | | | | | | |
| | Level 1 | Level 2 | Level 3 |
| Assets | | | |
| Investment Securities | | | |
| Common Stocks | $ | 531,108,899 |
| — |
| — |
|
| U.S. Treasury Securities | — |
| $ | 112,467,643 |
| — |
|
| Corporate Bonds | — |
| 101,165,410 |
| — |
|
| U.S. Government Agency Mortgage-Backed Securities | — |
| 77,420,560 |
| — |
|
| Asset-Backed Securities | — |
| 18,660,563 |
| — |
|
| Collateralized Mortgage Obligations | — |
| 14,562,633 |
| — |
|
| Commercial Mortgage-Backed Securities | — |
| 13,228,473 |
| — |
|
| Collateralized Loan Obligations | — |
| 10,021,684 |
| — |
|
| Municipal Securities | — |
| 5,818,166 |
| — |
|
| Sovereign Governments and Agencies | — |
| 2,479,596 |
| — |
|
| U.S. Government Agency Securities | — |
| 1,155,147 |
| — |
|
| Bank Loan Obligations | — |
| 350,943 |
| — |
|
| Temporary Cash Investments | 33,947,742 |
| — |
| — |
|
| | $ | 565,056,641 |
| $ | 357,330,818 |
| — |
|
| Other Financial Instruments | | | |
| Futures Contracts | $ | 80,522 |
| — |
| — |
|
| | | | |
| Liabilities | | | |
| Other Financial Instruments | | | |
| Futures Contracts | $ | 71,001 |
| — |
| — |
|
| Swap Agreements | — |
| $ | 33,231 |
| — |
|
| | $ | 71,001 |
| $ | 33,231 |
| — |
|
7. Derivative Instruments
Credit Risk — The fund is subject to credit risk in the normal course of pursuing its investment objectives. The value of a bond generally declines as the credit quality of its issuer declines. Credit default swap agreements enable a fund to buy/sell protection against a credit event of a specific issuer or index. A fund may attempt to enhance returns by selling protection or attempt to mitigate credit risk by buying protection. The buyer/seller of credit protection against a security or basket of securities may pay/receive an up-front or periodic payment to compensate for/against potential default events. Changes in value, including the periodic amounts of interest to be paid or received on swap agreements, are recorded as unrealized appreciation (depreciation) on swap agreements. Upon entering into a centrally cleared swap, a fund is required to deposit cash or securities (initial margin) with a financial intermediary in an amount equal to a certain percentage of the notional amount. Subsequent payments (variation margin) are made or received daily, in cash, by a fund. The variation margin is equal to the daily change in the value and is a component of unrealized gains and losses. Realized gain or loss is recorded upon receipt or payment of a periodic settlement or termination of swap agreements. Net realized and unrealized gains or losses occurring during the holding period of swap agreements are a component of net realized gain (loss) on swap agreement transactions and change in net unrealized appreciation (depreciation) on swap agreements, respectively. The risks of entering into swap agreements include the possible lack of liquidity, failure of the counterparty to meet its obligations, and that there may be unfavorable changes in the underlying investments or instruments. The fund's average notional amount held during the period was $8,900,000.
Equity Price Risk — The fund is subject to equity price risk in the normal course of pursuing its investment objectives. A fund may enter into futures contracts based on an equity index in order to manage its exposure to changes in market conditions. A fund may purchase futures contracts to gain exposure to increases in market value or sell futures contracts to protect against a decline in market value. Upon entering into a futures contract, a fund is required to deposit either cash or securities in an amount equal to a certain percentage of the contract value (initial margin). Subsequent payments (variation margin) are made or received daily, in cash, by a fund. The variation margin is equal to the daily change in the contract value and is recorded as unrealized gains and losses. A fund recognizes a realized gain or loss when the contract is closed or expires. Net realized and unrealized gains or losses occurring during the holding period of futures contracts are a component of net realized gain (loss) on futures contract transactions and change in net unrealized appreciation (depreciation) on futures contracts, respectively. One of the risks of entering into futures contracts is the possibility that the change in value of the contract may not correlate with the changes in value of the underlying securities. The fund's average notional exposure to equity price risk derivative instruments held during the period was $3,438 futures contracts purchased.
Foreign Currency Risk — The fund is subject to foreign currency exchange rate risk in the normal course of pursuing its investment objectives. The value of foreign investments held by a fund may be significantly affected by changes in foreign currency exchange rates. The dollar value of a foreign security generally decreases when the value of the dollar rises against the foreign currency in which the security is denominated and tends to increase when the value of the dollar declines against such foreign currency. A fund may enter into forward foreign currency exchange contracts to reduce a fund's exposure to foreign currency exchange rate fluctuations. The net U.S. dollar value of foreign currency underlying all contractual commitments held by a fund and the resulting unrealized appreciation or depreciation are determined daily. Realized gain or loss is recorded upon the termination of the contract. Net realized and unrealized gains or losses occurring during the holding period of forward foreign currency exchange contracts are a component of net realized gain (loss) on forward foreign currency exchange contract transactions and change in net unrealized appreciation (depreciation) on forward foreign currency exchange contracts, respectively. A fund bears the risk of an unfavorable change in the foreign currency exchange rate underlying the forward contract. Additionally, losses, up to the fair value, may arise if the counterparties do not perform under the contract terms. The fund's average U.S. dollar exposure to foreign currency risk derivative instruments held during the period was $440,510.
Interest Rate Risk — The fund is subject to interest rate risk in the normal course of pursuing its investment objectives. The value of bonds generally declines as interest rates rise. A fund may enter into futures contracts based on a bond index or a specific underlying security. A fund may purchase futures contracts to gain exposure to increases in market value or sell futures contracts to protect against a decline in market value. Upon entering into a futures contract, a fund will segregate cash, cash equivalents or other appropriate liquid securities on its records in amounts sufficient to meet requirements. Subsequent payments (variation margin) are made or received daily, in cash, by a fund. The variation margin is equal to the daily change in the contract value and is recorded as unrealized gains and losses. A fund recognizes a realized gain or loss when the futures contract is closed or expires. Net realized and unrealized gains or losses occurring during the holding period of futures contracts are a component of net realized gain (loss) on futures contract transactions and change in net unrealized appreciation (depreciation) on futures contracts, respectively. One of the risks of entering into futures contracts is the possibility that the change in value of the contract may not correlate with the changes in value of the underlying securities. The fund's average notional exposure to interest rate risk derivative instruments held during the period was $40,458,333 futures contracts purchased and $3,700,000 futures contracts sold.
Other Contracts — A fund may enter into total return swap agreements in order to attempt to obtain or preserve a particular return or spread at a lower cost than obtaining a return or spread through purchases and/or sales of instruments in other markets or gain exposure to certain markets in the most economical way possible. A fund will segregate cash, cash equivalents or other appropriate liquid securities on its records in amounts sufficient to meet requirements. Changes in value, including the periodic amounts of interest to be paid or received on swap agreements, are recorded as unrealized appreciation (depreciation) on swap agreements. Upon entering into a centrally cleared swap, a fund is required to deposit cash or securities (initial margin) with a financial intermediary in an amount equal to a certain percentage of the notional amount. Subsequent payments (variation margin) are made or received daily, in cash, by a fund. The variation margin is equal to the daily change in the value and is a component of unrealized gains and losses. Realized gain or loss is recorded upon receipt or payment of a periodic settlement or termination of swap agreements. Net realized and unrealized gains or losses occurring during the holding period of swap agreements are a component of net realized gain (loss) on swap agreement transactions and change in net unrealized appreciation (depreciation) on swap agreements, respectively. The risks of entering into swap agreements include the possible lack of liquidity, failure of the counterparty to meet its obligations, and that there may be unfavorable changes in the underlying investments or instruments, including inflationary risk. The fund's average notional amount held during the period was $3,500,000.
Value of Derivative Instruments as of October 31, 2019
|
| | | | | | | | |
| | Asset Derivatives | Liability Derivatives |
| Type of Risk Exposure | Location on Statement of Assets and Liabilities | Value | Location on Statement of Assets and Liabilities | Value |
| Equity Price Risk | Receivable for variation margin on futures contracts* | — |
| Payable for variation margin on futures contracts* | $ | 45,000 |
|
| Interest Rate Risk | Receivable for variation margin on futures contracts* | $ | 51,625 |
| Payable for variation margin on futures contracts* | — |
|
| Other Contracts | Receivable for variation margin on swap agreements* | — |
| Payable for variation margin on swap agreements* | 6,348 |
|
| | | $ | 51,625 |
| | $ | 51,348 |
|
* Included in the unrealized appreciation (depreciation) on centrally cleared swap agreements or futures contracts, as applicable, as reported in the Schedule of Investments.
Effect of Derivative Instruments on the Statement of Operations for the Year Ended October 31, 2019
|
| | | | | | | | |
| | Net Realized Gain (Loss) | Change in Net Unrealized Appreciation (Depreciation) |
| Type of Risk Exposure | Location on Statement of Operations | Value | Location on Statement of Operations | Value |
| Credit Risk | Net realized gain (loss) on swap agreement transactions | $ | 64,060 |
| Change in net unrealized appreciation (depreciation) on swap agreements | — |
|
| Equity Price Risk | Net realized gain (loss) on futures contract transactions | 84,532 |
| Change in net unrealized appreciation (depreciation) on futures contracts | $ | 77,723 |
|
| Foreign Currency Risk | Net realized gain (loss) on forward foreign currency exchange contract transactions | 19,804 |
| Change in net unrealized appreciation (depreciation) on forward foreign currency exchange contracts | (10,966 | ) |
| Interest Rate Risk | Net realized gain (loss) on futures contract transactions | 1,483,724 |
| Change in net unrealized appreciation (depreciation) on futures contracts | 99,741 |
|
| Other Contracts | Net realized gain (loss) on swap agreement transactions | — |
| Change in net unrealized appreciation (depreciation) on swap agreements | (32,728 | ) |
| | | $ | 1,652,120 |
| | $ | 133,770 |
|
8. Risk Factors
The fund’s investment process may result in high portfolio turnover, which could mean high transaction costs, affecting both performance and capital gains tax liabilities to investors.
9. Federal Tax Information
The tax character of distributions paid during the years ended October 31, 2019 and October 31, 2018 were as follows:
|
| | | | | | |
| | 2019 | 2018 |
| Distributions Paid From | | |
| Ordinary income | $ | 23,646,494 |
| $ | 24,785,618 |
|
| Long-term capital gains | $ | 37,669,850 |
| $ | 26,277,206 |
|
The book-basis character of distributions made during the year from net investment income or net realized gains may differ from their ultimate characterization for federal income tax purposes. These differences reflect the differing character of certain income items and net realized gains and losses for financial statement and tax purposes, and may result in reclassification among certain capital accounts on the financial statements.
As of period end, the federal tax cost of investments and the components of distributable earnings on a tax-basis were as follows:
|
| | | |
| Federal tax cost of investments | $ | 778,645,840 |
|
| Gross tax appreciation of investments | $ | 149,315,129 |
|
| Gross tax depreciation of investments | (5,573,510 | ) |
| Net tax appreciation (depreciation) of investments | 143,741,619 |
|
| Net tax appreciation (depreciation) on derivatives and translation of assets and liabilities in foreign currencies | (32,728 | ) |
Net tax appreciation (depreciation)
| $ | 143,708,891 |
|
| Other book-to-tax adjustments | $ | (88,069 | ) |
| Undistributed ordinary income | $ | 2,735,813 |
|
| Accumulated long-term gains | $ | 30,784,599 |
|
The difference between book-basis and tax-basis unrealized appreciation (depreciation) is attributable primarily to the tax deferral of losses on wash sales. Other book-to-tax adjustments are attributable primarily to the tax deferral of losses on straddle positions.
10. Recently Issued Accounting Standards
In March 2017, the Financial Accounting Standards Board (FASB) issued Accounting Standards Update No. 2017-08, “Receivables - Nonrefundable Fees and Other Costs (Subtopic 310-20), Premium Amortization on Purchased Callable Debt Securities” (ASU 2017-08). ASU 2017-08 amends the amortization period for certain purchased callable debt securities held at a premium, shortening such period to the earliest call date. The amendments are effective for fiscal years, and interim periods within those fiscal years, beginning after December 15, 2018. The adoption of ASU 2017-08 did not materially impact the financial statements.
|
| | | | | | | | | | | | | | | |
| For a Share Outstanding Throughout the Years Ended October 31 (except as noted) | | | | | | | |
| Per-Share Data | | | | | | | | | Ratios and Supplemental Data |
| | | Income From Investment Operations: | Distributions From: | | | Ratio to Average Net Assets of: | | |
| | Net Asset
Value,
Beginning
of Period | Net
Investment
Income
(Loss)(1) | Net
Realized
and
Unrealized
Gain (Loss) | Total From
Investment
Operations | Net
Investment
Income | Net
Realized
Gains | Total
Distributions | Net Asset
Value, End
of Period | Total
Return(2) | Operating
Expenses | Net
Investment
Income
(Loss) | Portfolio
Turnover
Rate | Net
Assets,
End of
Period
(in thousands) |
| Investor Class | | | | | | | | | | | | |
| 2019 | $18.55 | 0.29 | 1.73 | 2.02 | (0.29) | (1.03) | (1.32) | $19.25 | 11.82% | 0.90% | 1.58% | 101% |
| $838,309 |
|
| 2018 | $19.31 | 0.25 | 0.09 | 0.34 | (0.25) | (0.85) | (1.10) | $18.55 | 1.72% | 0.90% | 1.32% | 115% |
| $798,120 |
|
| 2017 | $17.39 | 0.26 | 2.10 | 2.36 | (0.28) | (0.16) | (0.44) | $19.31 | 13.78% | 0.91% | 1.44% | 112% |
| $814,569 |
|
| 2016 | $17.91 | 0.25 | 0.26 | 0.51 | (0.26) | (0.77) | (1.03) | $17.39 | 3.14% | 0.90% | 1.44% | 104% |
| $754,957 |
|
| 2015 | $19.38 | 0.26 | (0.08) | 0.18 | (0.28) | (1.37) | (1.65) | $17.91 | 0.98% | 0.90% | 1.43% | 94% |
| $789,209 |
|
| I Class | | | | | | | | | | | | |
| 2019 | $18.56 | 0.33 | 1.72 | 2.05 | (0.32) | (1.03) | (1.35) | $19.26 | 12.04% | 0.70% | 1.78% | 101% |
| $68,889 |
|
| 2018 | $19.32 | 0.29 | 0.09 | 0.38 | (0.29) | (0.85) | (1.14) | $18.56 | 1.92% | 0.70% | 1.52% | 115% |
| $62,077 |
|
| 2017 | $17.40 | 0.30 | 2.09 | 2.39 | (0.31) | (0.16) | (0.47) | $19.32 | 13.99% | 0.71% | 1.64% | 112% |
| $73,385 |
|
| 2016 | $17.92 | 0.28 | 0.27 | 0.55 | (0.30) | (0.77) | (1.07) | $17.40 | 3.35% | 0.70% | 1.64% | 104% |
| $58,915 |
|
| 2015 | $19.39 | 0.30 | (0.09) | 0.21 | (0.31) | (1.37) | (1.68) | $17.92 | 1.19% | 0.70% | 1.63% | 94% |
| $54,230 |
|
| R5 Class | | | | | | | | | | | | |
| 2019 | $18.56 | 0.33 | 1.72 | 2.05 | (0.32) | (1.03) | (1.35) | $19.26 | 12.04% | 0.70% | 1.78% | 101% |
| $3,053 |
|
| 2018 | $19.32 | 0.30 | 0.08 | 0.38 | (0.29) | (0.85) | (1.14) | $18.56 | 1.93% | 0.70% | 1.52% | 115% |
| $2,574 |
|
2017(3) | $18.18 | 0.17 | 1.14 | 1.31 | (0.17) | — | (0.17) | $19.32 | 7.21% | 0.71%(4) | 1.66%(4) | 112%(5) |
| $5 |
|
|
| | | | |
| Notes to Financial Highlights | | |
| |
| (1) | Computed using average shares outstanding throughout the period. |
| |
| (2) | Total returns are calculated based on the net asset value of the last business day. Total returns for periods less than one year are not annualized. |
| |
| (3) | April 10, 2017 (commencement of sale) through October 31, 2017. |
| |
| (5) | Portfolio turnover is calculated at the fund level. Percentage indicated was calculated for the year ended October 31, 2017. |
See Notes to Financial Statements.
|
|
| Report of Independent Registered Public Accounting Firm |
To the Shareholders and the Board of Directors of American Century Mutual Funds, Inc.:
Opinion on the Financial Statements and Financial Highlights
We have audited the accompanying statement of assets and liabilities, including the schedule of investments, of Balanced Fund, one of the funds constituting the American Century Mutual Funds, Inc. (the "Fund"), as of October 31, 2019, the related statement of operations for the year then ended, the statements of changes in net assets for each of the two years in the period then ended, the financial highlights for each of the five years in the period then ended, and the related notes. In our opinion, the financial statements and financial highlights present fairly, in all material respects, the financial position of Balanced Fund of the American Century Mutual Funds, Inc. as of October 31, 2019, the results of its operations for the year then ended, the changes in its net assets for each of the two years in the period then ended, and the financial highlights for each of the five years in the period then ended, in conformity with accounting principles generally accepted in the United States of America.
Basis for Opinion
These financial statements and financial highlights are the responsibility of the Fund's management. Our responsibility is to express an opinion on the Fund’s financial statements and financial highlights based on our audits. We are a public accounting firm registered with the Public Company Accounting Oversight Board (United States) (PCAOB) and are required to be independent with respect to the Fund in accordance with the U.S. federal securities laws and the applicable rules and regulations of the Securities and Exchange Commission and the PCAOB.
We conducted our audits in accordance with the standards of the PCAOB. Those standards require that we plan and perform the audit to obtain reasonable assurance about whether the financial statements and financial highlights are free of material misstatement, whether due to error or fraud. The Fund is not required to have, nor were we engaged to perform, an audit of its internal control over financial reporting. As part of our audits we are required to obtain an understanding of internal control over financial reporting but not for the purpose of expressing an opinion on the effectiveness of the Fund’s internal control over financial reporting. Accordingly, we express no such opinion.
Our audits included performing procedures to assess the risks of material misstatement of the financial statements and financial highlights, whether due to error or fraud, and performing procedures that respond to those risks. Such procedures included examining, on a test basis, evidence regarding the amounts and disclosures in the financial statements and financial highlights. Our audits also included evaluating the accounting principles used and significant estimates made by management, as well as evaluating the overall presentation of the financial statements and financial highlights. Our procedures included confirmation of securities owned as of October 31, 2019, by correspondence with the custodian, brokers, and agent banks; when replies were not received from brokers, we performed other auditing procedures. We believe that our audits provide a reasonable basis for our opinion.
DELOITTE & TOUCHE LLP
Kansas City, Missouri
December 16, 2019
We have served as the auditor of one or more American Century investment companies since 1997.
The Board of Directors
The individuals listed below serve as directors of the funds. Each director will continue to serve in this capacity until death, retirement, resignation or removal from office. The board has adopted a mandatory retirement age for directors who are not “interested persons,” as that term is defined in the Investment Company Act (independent directors). Independent directors shall retire by December 31 of the year in which they reach their 75th birthday.
Mr. Thomas is an “interested person” because he currently serves as President and Chief Executive Officer of American Century Companies, Inc. (ACC), the parent company of American Century Investment Management, Inc. (ACIM or the advisor). The other directors (more than three-fourths of the total number) are independent. They are not employees, directors or officers of, and have no financial interest in, ACC or any of its wholly owned, direct or indirect, subsidiaries, including ACIM, American Century Investment Services, Inc. (ACIS) and American Century Services, LLC (ACS), and they do not have any other affiliations, positions or relationships that would cause them to be considered “interested persons” under the Investment Company Act. The directors serve in this capacity for seven (in the case of Jonathan S. Thomas, 16; and Stephen E. Yates, 8) registered investment companies in the American Century Investments family of funds.
The following table presents additional information about the directors. The mailing address for each director is 4500 Main Street, Kansas City, Missouri 64111.
|
| | | | | |
Name
(Year of Birth) | Position(s) Held with Funds | Length of Time Served | Principal Occupation(s) During Past 5 Years | Number of American Century Portfolios Overseen by Director | Other Directorships Held During Past 5 Years |
| Independent Directors |
|
|
| Thomas W. Bunn (1953) | Director | Since 2017 | Retired | 66 | SquareTwo Financial; Barings (formerly Babson Capital Funds Trust) (2013 to 2016) |
Chris H. Cheesman
(1962)
| Director | Since 2019
| Retired. Senior Vice President & Chief Audit Executive, AllianceBernstein (1999 to 2018)
| 66 | None |
Barry Fink
(1955) | Director | Since 2012 (independent since 2016) | Retired | 66 | None |
Rajesh K. Gupta
(1960)
| Director | Since 2019
| Partner Emeritus, SeaCrest Investment Management and SeaCrest Wealth Management (2019 to Present); Chief Executive Officer and Chief Investment Officer, SeaCrest Investment Management (2006 to 2019); Chief Executive Officer and Chief Investment Officer, SeaCrest Wealth Management (2008 to 2019)
| 66 | None |
|
| | | | | |
Name
(Year of Birth) | Position(s) Held with Funds | Length of Time Served | Principal Occupation(s) During Past 5 Years | Number of American Century Portfolios Overseen by Director | Other Directorships Held During Past 5 Years |
| Independent Directors |
|
|
Lynn Jenkins
(1963)
| Director | Since 2019
| United States Representative, U.S. House of Representatives (2009 to 2018) | 66 | MGP Ingredients, Inc. |
Jan M. Lewis
(1957) | Director | Since 2011 | Retired | 66 | None |
John R. Whitten
(1946) | Director | Since 2008 | Retired | 66 | Onto Innovation Inc.; Rudolph Technologies, Inc. (2006 to 2019) |
Stephen E. Yates
(1948) | Director and Chairman of the Board | Since 2012 (Chairman since 2018) | Retired | 81 | None |
| Interested Director |
|
Jonathan S. Thomas
(1963) | Director | Since 2007 | President and Chief Executive Officer, ACC (2007 to present). Also serves as Chief Executive Officer, ACS; Executive Vice President, ACIM; Director, ACC, ACIM and other ACC subsidiaries | 125 | BioMed Valley Discoveries, Inc. |
The Statement of Additional Information has additional information about the fund's directors and is available without charge, upon request, by calling 1-800-345-2021.
Officers
The following table presents certain information about the executive officers of the funds. Each officer serves as an officer for each of the 16 (in the case of Robert J. Leach, 15) investment companies in the American Century family of funds. No officer is compensated for his or her service as an officer of the funds. The listed officers are interested persons of the funds and are appointed or re-appointed on an annual basis. The mailing address for each officer listed below is 4500 Main Street, Kansas City, Missouri 64111.
|
| | |
Name
(Year of Birth) | Offices with the Funds | Principal Occupation(s) During the Past Five Years |
Patrick Bannigan
(1965) | President since 2019 | Executive Vice President and Director, ACC (2012 to present); Chief Financial Officer, Chief Accounting Officer and Treasurer, ACC (2015 to present); Chief Operating Officer, ACC (2012-2015). Also serves as President, ACS; Vice President, ACIM; Chief Financial Officer, Chief Accounting Officer and/or Director, ACIM, ACS and other ACC subsidiaries |
R. Wes Campbell
(1974) | Chief Financial Officer and Treasurer since 2018 | Investment Operations and Investment Accounting, ACS (2000 to present) |
Amy D. Shelton
(1964) | Chief Compliance Officer and Vice President since 2014 | Chief Compliance Officer, American Century funds, (2014 to present); Chief Compliance Officer, ACIM (2014 to present); Chief Compliance Officer, ACIS (2009 to present). Also serves as Vice President, ACIS |
Charles A. Etherington
(1957) | General Counsel since 2007 and Senior Vice President since 2006 | Attorney, ACC (1994 to present); Vice President, ACC (2005 to present); General Counsel, ACC (2007 to present). Also serves as General Counsel, ACIM, ACS, ACIS and other ACC subsidiaries; and Senior Vice President, ACIM and ACS |
C. Jean Wade
(1964) | Vice President since 2012 | Senior Vice President, ACS (2017 to present); Vice President, ACS (2000 to 2017)
|
Robert J. Leach
(1966) | Vice President since 2006 | Vice President, ACS (2000 to present) |
David H. Reinmiller
(1963) | Vice President since 2000 | Attorney, ACC (1994 to present). Also serves as Vice President, ACIM and ACS |
Ward D. Stauffer
(1960) | Secretary since 2005 | Attorney, ACC (2003 to present) |
|
|
| Approval of Management Agreement |
At a meeting held on June 26, 2019, the Fund’s Board of Directors (the "Board") unanimously approved the renewal of the management agreement pursuant to which American Century Investment Management, Inc. (the “Advisor”) acts as the investment advisor for the Fund. Under Section 15(c) of the Investment Company Act, contracts for investment advisory services are required to be reviewed, evaluated, and approved by a majority of a fund’s directors (the “Directors”), including a majority of the independent Directors, each year.
Prior to its consideration of the renewal of the management agreement, the Directors requested and reviewed extensive data and information compiled by the Advisor and certain independent providers of evaluation data concerning the Fund and the services provided to the Fund by the Advisor. This review was in addition to the oversight and evaluation undertaken by the Board and its committees on a continual basis and the information received was supplemental to the extensive information that the Board and its committees receive and consider throughout the year.
In connection with its consideration of the renewal of the management agreement, the Board’s review and evaluation of the services provided by the Advisor included, but was not limited to, the following:
| |
| • | the nature, extent, and quality of investment management, shareholder services, and other services provided and to be provided to the Fund; |
| |
| • | the wide range of other programs and services provided and to be provided to the Fund and its shareholders on a routine and non-routine basis; |
| |
| • | the investment performance of the Fund, including data comparing the Fund's performance to appropriate benchmarks and/or a peer group of other mutual funds with similar investment objectives and strategies; |
| |
| • | the cost of owning the Fund compared to the cost of owning similar funds; |
| |
| • | the compliance policies, procedures, and regulatory experience of the Advisor and the Fund's service providers; |
| |
| • | financial data showing the cost of services provided to the Fund, the profitability of the Fund to the Advisor, and the overall profitability of the Advisor; |
| |
| • | strategic plans of the Advisor; |
| |
| • | any economies of scale associated with the Advisor’s management of the Fund and other accounts; |
| |
| • | services provided and charges to the Advisor's other investment management clients; |
| |
| • | acquired fund fees and expenses; |
| |
| • | payments and practices in connection with financial intermediaries holding shares of the Fund and the services provided by intermediaries in connection therewith; and |
| |
| • | any collateral benefits derived by the Advisor from the management of the Fund. |
The Directors held three in-person meetings and one telephonic meeting to review and discuss the information provided. The independent Directors also reviewed responses to supplemental information requests provided by the Directors to the Advisor and held active discussions with the Advisor regarding the renewal of the management agreement. The independent Directors had the benefit of the advice of their independent counsel throughout the process.
Factors Considered
The Directors considered all of the information provided by the Advisor, the independent data providers, and independent counsel in connection with the approval. They determined that the information was sufficient for them to evaluate the management agreement for the Fund. In connection with their review, the Directors did not identify any single factor as being all-important or
controlling, and each Director may have attributed different levels of importance to different factors. In deciding to renew the management agreement, the Board based its decision on a number of factors, including without limitation the following:
Nature, Extent and Quality of Services — Generally. Under the management agreement, the Advisor is responsible for providing or arranging for all services necessary for the operation of the Fund. The Board noted that the Advisor provides or arranges at its own expense a wide variety of services including without limitation the following:
| |
| • | portfolio research and security selection |
| |
| • | daily valuation of the Fund’s portfolio |
| |
| • | shareholder servicing and transfer agency, including shareholder confirmations, recordkeeping, and communications |
| |
| • | legal services (except the independent Directors’ counsel) |
| |
| • | regulatory and portfolio compliance |
| |
| • | marketing and distribution (except amounts paid by the Fund under Rule 12b-1 plans) |
The Board noted that many of these services have expanded over time in terms of both quantity and complexity in response to shareholder demands, competition in the industry, changing distribution channels, and the changing regulatory environment.
Investment Management Services. The nature of the investment management services provided to the Fund is quite complex and allows Fund shareholders access to professional money management, instant diversification of their investments within an asset class, the opportunity to easily diversify among asset classes by investing in or exchanging among various American Century Investments funds, and liquidity. In evaluating investment performance, the Board expects the Advisor to manage the Fund in accordance with its investment objectives and approved strategies. Further, the Directors recognize that the Advisor has an obligation to monitor trading activities, and in particular to seek the best execution of fund trades, and to evaluate the use of and payment for research. In providing these services, the Advisor utilizes teams of investment professionals (portfolio managers, analysts, research assistants, and securities traders) who require extensive information technology, research, training, compliance, and other systems to conduct their business. The Board, directly and through its Fund Performance Review Committee, provides oversight of the investment performance process. It regularly reviews investment performance information for the Fund, together with comparative information for appropriate benchmarks and/or peer groups of similarly-managed funds, over different time horizons. The Directors also review investment performance information during the management agreement renewal process. If performance concerns are identified, the Fund receives special reviews until performance improves, during which the Board discusses with the Advisor the reasons for such results (e.g., market conditions, security selection) and any efforts being undertaken to improve performance. The Fund’s performance was above its benchmark for the ten-year period and below its benchmark for the one-, three-, and five-year periods reviewed by the Board. The Board found the investment management services provided by the Advisor to the Fund to be satisfactory and consistent with the management agreement.
Shareholder and Other Services. Under the management agreement, the Advisor provides the Fund with a comprehensive package of transfer agency, shareholder, and other services. The Board, directly and through various committees of the Board, regularly reviews reports and evaluations of such services at its regular meetings. These reports include, but are not limited to, information regarding the operational efficiency and accuracy of the shareholder and transfer agency services provided, staffing levels, shareholder satisfaction, technology support (including cyber security), new products and services offered to Fund shareholders, securities trading
activities, portfolio valuation services, auditing services, and legal and operational compliance activities. The Board found the services provided by the Advisor to the Fund under the management agreement to be competitive and of high quality.
Costs of Services and Profitability. The Advisor provides detailed information concerning its cost of providing various services to the Fund, its profitability in managing the Fund (pre- and post-distribution), its overall profitability, and its financial condition. The Directors have reviewed with the Advisor the methodology used to prepare this financial information. This information is considered in evaluating the Advisor’s financial condition, its ability to continue to provide services under the management agreement, and the reasonableness of the current management fee. The Board concluded that the Advisor’s profits were reasonable in light of the services provided to the Fund.
Ethics. The Board generally considers the Advisor’s commitment to providing quality services to shareholders and to conducting its business ethically. They noted that the Advisor’s practices generally meet or exceed industry best practices.
Economies of Scale. The Board also reviewed information provided by the Advisor regarding the possible existence of economies of scale in connection with the management of the Fund. The Board concluded that economies of scale are difficult to measure and predict with precision, especially on a fund-by-fund basis. The Board concluded that the Advisor is appropriately sharing economies of scale through its competitive fee structure, offering competitive fees from fund inception, and through reinvestment in its business to provide shareholders additional content and services. The Board also noted that economies of scale are shared with the Fund and its shareholders through management fee breakpoints that serve to reduce the effective management fee as the assets of the Fund grow.
Comparison to Other Funds’ Fees. The management agreement provides that the Fund pays the Advisor a single, all-inclusive (or unified) management fee for providing all services necessary for the management and operation of the Fund, other than brokerage expenses, expenses attributable to short sales, taxes, interest, extraordinary expenses, fees and expenses of the Fund’s independent Directors (including their independent legal counsel), and expenses incurred in connection with the provision of shareholder services and distribution services under a plan adopted pursuant to Rule 12b-1 under the Investment Company Act. Under the unified fee structure, the Advisor is responsible for providing all investment advisory, custody, audit, administrative, compliance, recordkeeping, marketing and shareholder services, or arranging and supervising third parties to provide such services. By contrast, most other funds are charged a variety of fees, including an investment advisory fee, a transfer agency fee, an administrative fee, distribution charges, and other expenses. Other than their investment advisory fees and any applicable Rule 12b-1 distribution fees, all other components of the total fees charged by these other funds may be increased without shareholder approval. The Board believes the unified fee structure is a benefit to Fund shareholders because it clearly discloses to shareholders the cost of owning Fund shares, and, since the unified fee cannot be increased without a vote of Fund shareholders, it shifts to the Advisor the risk of increased costs of operating the Fund and provides a direct incentive to minimize administrative inefficiencies. Part of the Board’s analysis of fee levels involves reviewing certain evaluative data compiled by an independent provider comparing the Fund’s unified fee to the total expense ratios of its peers. The unified fee charged to shareholders of the Fund was below the median of the total expense ratios of the Fund’s peer expense universe. The Board concluded that the management fee paid by the Fund to the Advisor under the management agreement is reasonable in light of the services provided to the Fund.
Comparison to Fees and Services Provided to Other Clients of the Advisor. The Directors also requested and received information from the Advisor concerning the nature of the services, fees, costs, and profitability of its advisory services to advisory clients other than the Fund. They observed that these varying types of client accounts require different services and involve different regulatory and entrepreneurial risks than the management of the Fund. The Board analyzed this information and concluded that the fees charged and services provided to the Fund were
reasonable by comparison.
Payments to Intermediaries. The Directors also requested and received a description of payments made to intermediaries by the Fund and the Advisor and services provided in response thereto. These payments include various payments made by the Fund or the Advisor to different types of intermediaries and recordkeepers for distribution and service activities provided for the Fund. The Board reviewed such information and received representations from the Advisor that all such payments by the Fund were made pursuant to the Fund's Rule 12b-1 Plan and that all such payments by the Advisor were made from the Advisor’s resources and reasonable profits. The Board found such payments to be reasonable in scope and purpose.
Collateral or “Fall-Out” Benefits Derived by the Advisor. The Board considered the existence of collateral benefits the Advisor may receive as a result of its relationship with the Fund. They concluded that the Advisor’s primary business is managing mutual funds and it generally does not use fund or shareholder information to generate profits in other lines of business, and therefore does not derive any significant collateral benefits from them. The Board noted that additional assets from other clients may offer the Advisor some benefit from increased leverage with service providers and counterparties. Additionally, the Advisor may receive proprietary research from broker-dealers that execute fund portfolio transactions, which the Board concluded is likely to benefit other clients of the Advisor, as well as Fund shareholders. The Board also determined that the Advisor is able to provide investment management services to certain clients other than the Fund, at least in part, due to its existing infrastructure built to serve the fund complex. The Board concluded that appropriate allocation methodologies had been employed to assign resources and the cost of those resources to these other clients and, where expressly provided, these other client assets may be included with the assets of the Fund to determine breakpoints in the management fee schedule.
Existing Relationship. The Board also considered whether there was any reason for not continuing the existing arrangement with the Advisor. In this regard, the Board was mindful of the potential disruptions of the Fund’s operations and various risks, uncertainties, and other effects that could occur as a result of a decision not to continue such relationship. In particular, the Board recognized that most shareholders have invested in the Fund on the strength of the Advisor’s industry standing and reputation and in the expectation that the Advisor will have a continuing role in providing advisory services to the Fund.
Conclusion of the Directors. As a result of this process, the Board, including all of the independent Directors, taking into account all of the factors discussed above and the information provided by the Advisor and others in connection with its review and throughout the year, determined that the management fee is fair and reasonable in light of the services provided and that the investment management agreement between the Fund and the Advisor should be renewed.
Retirement Account Information
As required by law, distributions you receive from certain retirement accounts are subject to federal income tax withholding, unless you elect not to have withholding apply*. Tax will be withheld on the total amount withdrawn even though you may be receiving amounts that are not subject to withholding, such as nondeductible contributions. In such case, excess amounts of withholding could occur. You may adjust your withholding election so that a greater or lesser amount will be withheld.
If you don’t want us to withhold on this amount, you must notify us to not withhold the federal income tax. You may notify us in writing or in certain situations by telephone or through other electronic means. For systematic withdrawals, your withholding election will remain in effect until revoked or changed by filing a new election. You have the right to revoke your election at any time and change your withholding percentage for future distributions.
Remember, even if you elect not to have income tax withheld, you are liable for paying income tax on the taxable portion of your withdrawal. If you elect not to have income tax withheld or you don’t have enough income tax withheld, you may be responsible for payment of estimated tax. You may incur penalties under the estimated tax rules if your withholding and estimated tax payments are not sufficient. You can reduce or defer the income tax on a distribution by directly or indirectly rolling such distribution over to another IRA or eligible plan. You should consult your tax advisor for additional information.
State tax will be withheld if, at the time of your distribution, your address is within one of the mandatory withholding states and you have federal income tax withheld (or as otherwise required by state law). State taxes will be withheld from your distribution in accordance with the respective state rules.
*Some 403(b), 457 and qualified retirement plan distributions may be subject to 20% mandatory withholding, as they are subject to special tax and withholding rules. Your plan administrator or plan sponsor is required to provide you with a special tax notice explaining those rules at the time you request a distribution. If applicable, federal and/or state taxes may be withheld from your distribution amount.
Proxy Voting Policies
A description of the policies that the fund's investment advisor uses in exercising the voting rights associated with the securities purchased and/or held by the fund is available without charge, upon request, by calling 1-800-345-2021. It is also available on American Century Investments’ website at americancentury.com/proxy and on the Securities and Exchange Commission’s website at sec.gov. Information regarding how the investment advisor voted proxies relating to portfolio securities during the most recent 12-month period ended June 30 is available on americancentury.com/proxy. It is also available at sec.gov.
Quarterly Portfolio Disclosure
The fund files its complete schedule of portfolio holdings with the Securities and Exchange Commission (SEC) for the first and third quarters of each fiscal year on Form N-Q or as an exhibit to its reports on Form N-PORT. The fund’s Forms N-Q and Form N-PORT reports are available on the SEC’s website at sec.gov. The fund also makes its complete schedule of portfolio holdings for the most recent quarter of its fiscal year available on its website at americancentury.com and, upon request, by calling 1-800-345-2021.
Other Tax Information
The following information is provided pursuant to provisions of the Internal Revenue Code.
The fund hereby designates up to the maximum amount allowable as qualified dividend income for the fiscal year ended October 31, 2019.
For corporate taxpayers, the fund hereby designates $9,040,111, or up to the maximum amount allowable, of ordinary income distributions paid during the fiscal year ended October 31, 2019 as qualified for the corporate dividends received deduction.
The fund hereby designates $37,669,850, or up to the maximum amount allowable, as long-term capital gain distributions (20% rate gain distributions) for the fiscal year ended October 31, 2019.
The fund hereby designates $9,738,856, as qualified short-term capital gain distributions for purposes of Internal Revenue Code Section 871 for the fiscal year ended October 31, 2019.
|
| | |
| |
| | | |
| Contact Us | americancentury.com | |
| Automated Information Line | 1-800-345-8765 | |
| Investor Services Representative | 1-800-345-2021 or 816-531-5575 | |
| Investors Using Advisors | 1-800-378-9878 | |
| Business, Not-For-Profit, Employer-Sponsored Retirement Plans | 1-800-345-3533 | |
| Banks and Trust Companies, Broker-Dealers, Financial Professionals, Insurance Companies | 1-800-345-6488 | |
| Telecommunications Relay Service for the Deaf | 711 | |
| | | |
| American Century Mutual Funds, Inc. | |
| | | |
Investment Advisor: American Century Investment Management, Inc. Kansas City, Missouri | |
| | | |
| This report and the statements it contains are submitted for the general information of our shareholders. The report is not authorized for distribution to prospective investors unless preceded or accompanied by an effective prospectus. | |
| | | |
©2019 American Century Proprietary Holdings, Inc. All rights reserved.
CL-ANN-90968 1912 | |

|
| |
| | |
| | Annual Report |
| | |
| | October 31, 2019 |
| | |
| | Growth Fund |
| | Investor Class (TWCGX) |
| | I Class (TWGIX) |
| | Y Class (AGYWX) |
| | A Class (TCRAX) |
| | C Class (TWRCX) |
| | R Class (AGWRX) |
| | R5 Class (AGWUX) |
| | R6 Class (AGRDX) |
Beginning on January 1, 2021, as permitted by regulations adopted by the Securities and Exchange Commission, paper copies of the fund’s shareholder reports like this one will no longer be sent by mail, unless you specifically request paper copies of the reports from the fund or from your financial intermediary, such as a broker-dealer or bank. Instead, the reports will be made available on a website, and you will be notified by mail each time a report is posted and provided with a website link to access the report.
If you already elected to receive shareholder reports electronically, you will not be affected by this change and you need not take any action. You may elect to receive shareholder reports and other communications from the fund or your financial intermediary electronically by calling or sending an email request to your appropriate contacts as listed on the back cover of this report.
You may elect to receive all future reports in paper free of charge. You can inform the fund or your financial intermediary that you wish to continue receiving paper copies of your shareholder reports by calling or sending an email request to your appropriate contacts as listed on the back cover of this report. Your election to receive reports in paper will apply to all funds held with the fund complex/your financial intermediary.
|
| |
| President’s Letter | |
| Performance | |
| Portfolio Commentary | |
| Fund Characteristics | |
| Shareholder Fee Example | |
| Schedule of Investments | |
| Statement of Assets and Liabilities | |
| Statement of Operations | |
| Statement of Changes in Net Assets | |
| Notes to Financial Statements | |
| Financial Highlights | |
| Report of Independent Registered Public Accounting Firm | |
| Management | |
| Approval of Management Agreement | |
| Additional Information | |
Any opinions expressed in this report reflect those of the author as of the date of the report, and do not necessarily represent the opinions of American Century Investments® or any other person in the American Century Investments organization. Any such opinions are subject to change at any time based upon market or other conditions and American Century Investments disclaims any responsibility to update such opinions. These opinions may not be relied upon as investment advice and, because investment decisions made by American Century Investments funds are based on numerous factors, may not be relied upon as an indication of trading intent on behalf of any American Century Investments fund. Security examples are used for representational purposes only and are not intended as recommendations to purchase or sell securities. Performance information for comparative indices and securities is provided to American Century Investments by third party vendors. To the best of American Century Investments’ knowledge, such information is accurate at the time of printing.
Jonathan Thomas
Dear Investor:
Thank you for reviewing this annual report for the 12 months ended October 31, 2019. Annual reports help convey important information about fund returns, including market factors that affected performance. For additional investment and market insights, please visit americancentury.com.
Stocks, Bonds Delivered Solid Gains
U.S. and global stocks, bonds and real estate investments generally delivered strong gains for the 12-month period. Stocks and other riskier assets rebounded from a late-2018 sell-off to post robust returns for the 12 months overall. Global bonds benefited from safe-haven buying early in the period and a declining interest rate environment overall.
Fed’s Policy Pivot Improved Investor Sentiment
In the final months of 2018, mounting concerns about slowing global economic and earnings growth, tariffs and Federal Reserve (Fed) policy soured investor sentiment, driving global stocks lower. After raising rates in September 2018, the Fed hiked again in December and delivered a surprisingly bullish 2019 rate-hike outlook, which intensified the sell-off among stocks and other riskier assets. Meanwhile, the risk-off climate sparked a flight to quality, which drove U.S. and other government bond yields lower and benefited global bond returns.
A key policy pivot from the Fed helped improve equity investor sentiment beginning in early 2019. The central bank abruptly ended its rate-hike campaign and adopted a dovish tone amid weaker global growth and inflation. Additionally, investors’ worst-case fears about trade and corporate earnings generally eased, which also aided stocks and other riskier assets. At the same time, government bond yields continued to fall on moderating global growth data, muted inflation and accommodative central bank policy in the U.S., Europe and Japan. By July, concerns about global economic risks prompted the Fed to cut short-term interest rates for the first time in 10 years. The Fed followed up with additional rate cuts in September and October. This backdrop supported continued gains for fixed-income and other interest rate-sensitive assets.
Looking ahead, we expect volatility to remain a formidable factor as investors react to global growth and trade trends, central bank policy and geopolitical developments. We believe this scenario underscores the importance of using professionally managed portfolios in pursuit of investment goals. We appreciate your continued trust and confidence in us.
Sincerely,
Jonathan Thomas
President and Chief Executive Officer
American Century Investments
|
| | | | | | |
| Total Returns as of October 31, 2019 |
| | | | Average Annual Returns | |
| | Ticker Symbol | 1 year | 5 years | 10 years | Since Inception | Inception Date |
| Investor Class | TWCGX | 16.35% | 12.48% | 13.83% | — | 6/30/71 |
| Russell 1000 Growth Index | — | 17.10% | 13.42% | 15.41% | — | — |
| I Class | TWGIX | 16.62% | 12.72% | 14.06% | — | 6/16/97 |
| Y Class | AGYWX | 16.78% | — | — | 16.69% | 4/10/17 |
| A Class | TCRAX | | | | | 6/4/97 |
| No sales charge | | 16.06% | 12.21% | 13.54% | — | |
| With sales charge | | 9.40% | 10.89% | 12.87% | — | |
| C Class | TWRCX | 15.23% | 11.37% | — | 12.17% | 3/1/10 |
| R Class | AGWRX | 15.78% | 11.92% | 13.26% | — | 8/29/03 |
| R5 Class | AGWUX | 16.61% | — | — | 16.51% | 4/10/17 |
| R6 Class | AGRDX | 16.81% | 12.89% | — | 13.79% | 7/26/13 |
Average annual returns since inception are presented when ten years of performance history is not available. Although the fund’s actual inception date was October 31, 1958, the Investor Class inception date corresponds with the investment advisor’s implementation of its current investment philosophy and practices. Prior to March 1, 2010, the A Class was referred to as the Advisor Class and did not have a front-end sales charge. Performance prior to that date has been adjusted to reflect this charge.
Sales charges include initial sales charges and contingent deferred sales charges (CDSCs), as applicable. A Class shares have a 5.75% maximum initial sales charge and may be subject to a maximum CDSC of 1.00%. C Class shares redeemed within 12 months of purchase are subject to a maximum CDSC of 1.00%. The SEC requires that mutual funds provide performance information net of maximum sales charges in all cases where charges could be applied.
Data presented reflect past performance. Past performance is no guarantee of future results. Current performance may be higher or lower than the performance shown. Total returns for periods less than one year are not annualized. Investment return and principal value will fluctuate, and redemption value may be more or less than original cost. Data assumes reinvestment of dividends and capital gains, and none of the charts reflect the deduction of taxes that a shareholder would pay on fund distributions or the redemption of fund shares. To obtain performance data current to the most recent month end, please call 1-800-345-2021 or visit americancentury.com. For additional information about the fund, please consult the prospectus.
|
|
| Growth of $10,000 Over 10 Years |
| $10,000 investment made October 31, 2009 |
| Performance for other share classes will vary due to differences in fee structure. |
|
| |
| Value on October 31, 2019 |
| | Investor Class — $36,535 |
| |
| | Russell 1000 Growth Index — $41,938 |
| |
|
| | | | | | | |
| Total Annual Fund Operating Expenses |
| Investor Class | I Class | Y Class | A Class | C Class | R Class | R5 Class | R6 Class |
| 0.97% | 0.77% | 0.62% | 1.22% | 1.97% | 1.47% | 0.77% | 0.62% |
The total annual fund operating expenses shown is as stated in the fund’s prospectus current as of the date of this report. The prospectus may vary from the expense ratio shown elsewhere in this report because it is based on a different time period, includes acquired fund fees and expenses, and, if applicable, does not include fee waivers or expense reimbursements.
Data presented reflect past performance. Past performance is no guarantee of future results. Current performance may be higher or lower than the performance shown. Total returns for periods less than one year are not annualized. Investment return and principal value will fluctuate, and redemption value may be more or less than original cost. Data assumes reinvestment of dividends and capital gains, and none of the charts reflect the deduction of taxes that a shareholder would pay on fund distributions or the redemption of fund shares. To obtain performance data current to the most recent month end, please call 1-800-345-2021 or visit americancentury.com. For additional information about the fund, please consult the prospectus.
Portfolio Managers: Gregory Woodhams and Justin Brown
Performance Summary
Growth returned 16.35%* for the 12 months ended October 31, 2019, lagging the 17.10% return of the portfolio’s benchmark, the Russell 1000 Growth Index.
U.S. stocks posted solid returns during the reporting period. Growth stocks outperformed value stocks by a wide margin. Within the Russell 1000 Growth Index, all sectors posted gains except for energy, which struggled with the declining price of oil. The small real estate segment—a sector that rarely offers the kind of growth characteristics we seek—reported the top total return, but index gains were largely driven by the strong performance of information technology and consumer discretionary stocks.
Stock selection in the consumer discretionary, energy and financials sectors detracted from fund performance relative to the benchmark. Stock decisions in the information technology and consumer staples sectors benefited relative performance.
Consumer Discretionary Stocks Led Detractors
Stock choices among textiles, apparel and luxury goods stocks weighed on relative performance in the consumer discretionary sector. We eliminated our position in Tapestry, a luxury goods holding company that reported disappointing results and provided weak guidance. Tapestry’s acquisition of Kate Spade has not worked out as management had anticipated.
Stock selection in the oil, gas and consumable fuels industry detracted. Concho Resources was a significant detractor, and we eliminated this oil and gas production company after it reported disappointing production.
Other significant detractors included XPO Logistics. We eliminated the stock of this freight and logistics company on concerns about its leveraged share buyback program. We think it’s late in the economic cycle to add debt to the balance sheet. We were also worried about increasing competition in XPO’s freight brokerage and last-mile delivery businesses. Biogen’s stock declined after the company halted trials of its Alzheimer’s drug, aducanumab, in March 2019. However, the company announced in October that a subsequent review of the data from more patients showed significant improvements in those who received high doses in one trial. As a result, the company said it would submit the drug for Food and Drug Administration approval. Biogen also has the leading multiple sclerosis franchise, which has generated significant cash flow that can be invested in other clinical development programs. Health insurer UnitedHealth Group underperformed as the presidential campaign kept regulatory and pricing risk elevated. We believe the company’s use of data analytics and technology makes it well positioned to drive efficiency gains across the sector, reducing costs and improving patient outcomes.
Information Technology Holdings Aided Performance
Stock choices in the semiconductors and semiconductor equipment industries benefited relative performance in the information technology sector. Semiconductor equipment company ASML Holding outperformed on strong new orders as it expands its market opportunity set into memory chip manufacturers. The Netherlands-based company’s technology allows for production of smaller and more efficient semiconductors. Semiconductor equipment company Applied Materials also
*All fund returns referenced in this commentary are for Investor Class shares. Performance for other share classes will vary due to differences in fee structure; when Investor Class performance exceeds that of the fund’s benchmark, other share classes may not. See page 3 for returns for all share classes.
outperformed after reporting solid results. Chipmaker Broadcom was a top contributor. Broadcom’s acquisition of CA Technologies is viewed as driving sales going forward. In IT services, Visa aided performance as the credit card company reported earnings that beat analysts’ estimates.
Household products stocks aided performance in the consumer staples sector. The stock price of The Procter & Gamble Co. outperformed as the consumer products company posted its best organic growth in more than a decade. It also benefited from a more defensive market posture as interest rates declined.
Outlook
We believe stock selection—rather than sector allocation or market timing via the use of cash—is the most efficient means of generating superior risk-adjusted returns. As a result of this approach, the portfolio’s sector and industry selection, as well as capitalization range allocations, are primarily due to identifying what we believe to be superior individual securities.
At period-end, our largest sector allocation relative to the benchmark was communication services. Our weighting in the sector is dominated by a few large positions, including Alphabet, Facebook and The Walt Disney Co. The portfolio is modestly overweight in the consumer discretionary sector. We believe that structurally better business models and brands will have better long-term fundamental results and stock performance. We think companies with strong competitive positions and that are investing behind their businesses and have strong management teams will continue to separate themselves from the pack.
We ended the period significantly underweight in the information technology sector. The sector remains the portfolio’s largest absolute weighting, and we see upside in semiconductor capital equipment providers, given favorable secular growth and attractive valuations.
|
| |
| OCTOBER 31, 2019 | |
| Top Ten Holdings | % of net assets |
| Microsoft Corp. | 9.8% |
| Alphabet, Inc., Class A | 8.5% |
| Amazon.com, Inc. | 6.4% |
| Apple, Inc. | 5.7% |
| Visa, Inc., Class A | 5.5% |
| Facebook, Inc., Class A | 3.9% |
| PayPal Holdings, Inc. | 2.7% |
| Lockheed Martin Corp. | 2.5% |
| UnitedHealth Group, Inc. | 2.4% |
| Walt Disney Co. (The) | 2.4% |
| | |
| Top Five Industries | % of net assets |
| Interactive Media and Services | 12.8% |
| Software | 12.6% |
| IT Services | 8.8% |
| Internet and Direct Marketing Retail | 6.4% |
| Technology Hardware, Storage and Peripherals | 5.7% |
| | |
| Types of Investments in Portfolio | % of net assets |
| Common Stocks | 98.3% |
| Temporary Cash Investments | 1.6% |
| Temporary Cash Investments - Securities Lending Collateral | 0.5% |
| Other Assets and Liabilities | (0.4)% |
Fund shareholders may incur two types of costs: (1) transaction costs, including sales charges (loads) on purchase payments and redemption/exchange fees; and (2) ongoing costs, including management fees; distribution and service (12b-1) fees; and other fund expenses. This example is intended to help you understand your ongoing costs (in dollars) of investing in your fund and to compare these costs with the ongoing cost of investing in other mutual funds.
The example is based on an investment of $1,000 made at the beginning of the period and held for the entire period from May 1, 2019 to October 31, 2019.
Actual Expenses
The table provides information about actual account values and actual expenses for each class. You may use the information, together with the amount you invested, to estimate the expenses that you paid over the period. First, identify the share class you own. Then simply divide your account value by $1,000 (for example, an $8,600 account value divided by $1,000 = 8.6), then multiply the result by the number under the heading “Expenses Paid During Period” to estimate the expenses you paid on your account during this period.
If you hold Investor Class shares of any American Century Investments fund, or I Class shares of the American Century Diversified Bond Fund, in an American Century Investments account (i.e., not a financial intermediary or retirement plan account), American Century Investments may charge you a $12.50 semiannual account maintenance fee if the value of those shares is less than $10,000. We will redeem shares automatically in one of your accounts to pay the $12.50 fee. In determining your total eligible investment amount, we will include your investments in all personal accounts (including American Century Investments Brokerage accounts) registered under your Social Security number. Personal accounts include individual accounts, joint accounts, UGMA/UTMA accounts, personal trusts, Coverdell Education Savings Accounts and IRAs (including traditional, Roth, Rollover, SEP-, SARSEP- and SIMPLE-IRAs), and certain other retirement accounts. If you have only business, business retirement, employer-sponsored or American Century Investments Brokerage accounts, you are currently not subject to this fee. If you are subject to the Account Maintenance Fee, your account value could be reduced by the fee amount.
Hypothetical Example for Comparison Purposes
The table also provides information about hypothetical account values and hypothetical expenses based on the actual expense ratio of each class of your fund and an assumed rate of return of 5% per year before expenses, which is not the actual return of a fund’s share class. The hypothetical account values and expenses may not be used to estimate the actual ending account balance or expenses you paid for the period. You may use this information to compare the ongoing costs of investing in your fund and other funds. To do so, compare this 5% hypothetical example with the 5% hypothetical examples that appear in the shareholder reports of the other funds.
Please note that the expenses shown in the table are meant to highlight your ongoing costs only and do not reflect any transactional costs, such as sales charges (loads) or redemption/exchange fees. Therefore, the table is useful in comparing ongoing costs only, and will not help you determine the relative total costs of owning different funds. In addition, if these transactional costs were included, your costs would have been higher.
|
| | | | |
| Beginning
Account Value
5/1/19 | Ending
Account Value
10/31/19 | Expenses Paid
During Period(1)
5/1/19 - 10/31/19 | Annualized
Expense Ratio(1) |
| Actual | | | | |
| Investor Class | $1,000 | $1,034.40 | $5.03 | 0.98% |
| I Class | $1,000 | $1,035.70 | $4.00 | 0.78% |
| Y Class | $1,000 | $1,036.50 | $3.23 | 0.63% |
| A Class | $1,000 | $1,033.20 | $6.30 | 1.23% |
| C Class | $1,000 | $1,029.30 | $10.13 | 1.98% |
| R Class | $1,000 | $1,031.70 | $7.58 | 1.48% |
| R5 Class | $1,000 | $1,035.70 | $4.00 | 0.78% |
| R6 Class | $1,000 | $1,036.60 | $3.23 | 0.63% |
| Hypothetical | | | | |
| Investor Class | $1,000 | $1,020.27 | $4.99 | 0.98% |
| I Class | $1,000 | $1,021.27 | $3.97 | 0.78% |
| Y Class | $1,000 | $1,022.03 | $3.21 | 0.63% |
| A Class | $1,000 | $1,019.01 | $6.26 | 1.23% |
| C Class | $1,000 | $1,015.22 | $10.06 | 1.98% |
| R Class | $1,000 | $1,017.75 | $7.53 | 1.48% |
| R5 Class | $1,000 | $1,021.27 | $3.97 | 0.78% |
| R6 Class | $1,000 | $1,022.03 | $3.21 | 0.63% |
| |
| (1) | Expenses are equal to the class's annualized expense ratio listed in the table above, multiplied by the average account value over the period, multiplied by 184, the number of days in the most recent fiscal half-year, divided by 365, to reflect the one-half year period. Annualized expense ratio reflects actual expenses, including any applicable fee waivers or expense reimbursements and excluding any acquired fund fees and expenses. |
OCTOBER 31, 2019
|
| | | | |
| | Shares | Value |
| COMMON STOCKS — 98.3% | | |
| Aerospace and Defense — 3.1% | | |
| Boeing Co. (The) | 151,017 | $ | 51,332,189 |
|
| Lockheed Martin Corp. | 529,062 | 199,287,074 |
|
| | | 250,619,263 |
|
| Airlines — 0.6% | | |
| Delta Air Lines, Inc. | 886,855 | 48,847,973 |
|
| Auto Components — 0.1% | | |
| Aptiv plc | 133,017 | 11,911,672 |
|
| Biotechnology — 1.7% | | |
Biogen, Inc.(1) | 166,534 | 49,745,371 |
|
Vertex Pharmaceuticals, Inc.(1) | 429,046 | 83,869,912 |
|
| | | 133,615,283 |
|
| Capital Markets — 1.1% | | |
| Charles Schwab Corp. (The) | 2,215,747 | 90,203,060 |
|
| Chemicals — 1.3% | | |
| Dow, Inc. | 2,112,091 | 106,639,475 |
|
| Communications Equipment — 1.0% | | |
Arista Networks, Inc.(1) | 330,318 | 80,785,873 |
|
| Consumer Finance — 0.6% | | |
| American Express Co. | 393,011 | 46,092,330 |
|
| Electronic Equipment, Instruments and Components — 1.1% | | |
| CDW Corp. | 663,033 | 84,808,551 |
|
| Entertainment — 3.4% | | |
Liberty Media Corp-Liberty Formula One, Class C(1) | 593,366 | 25,218,055 |
|
Take-Two Interactive Software, Inc.(1) | 453,743 | 54,607,970 |
|
| Walt Disney Co. (The) | 1,505,023 | 195,532,588 |
|
| | | 275,358,613 |
|
| Equity Real Estate Investment Trusts (REITs) — 3.2% | | |
| Equity Residential | 936,030 | 82,988,420 |
|
| SBA Communications Corp. | 721,359 | 173,595,043 |
|
| | | 256,583,463 |
|
| Food and Staples Retailing — 0.9% | | |
| Walmart, Inc. | 603,699 | 70,789,745 |
|
| Food Products — 0.7% | | |
Beyond Meat, Inc.(1)(2) | 162,790 | 13,747,616 |
|
| Mondelez International, Inc., Class A | 785,143 | 41,180,750 |
|
| | | 54,928,366 |
|
| Health Care Equipment and Supplies — 4.4% | | |
| Baxter International, Inc. | 1,673,978 | 128,394,112 |
|
Boston Scientific Corp.(1) | 2,343,784 | 97,735,793 |
|
Edwards Lifesciences Corp.(1) | 229,660 | 54,746,351 |
|
IDEXX Laboratories, Inc.(1) | 42,090 | 11,996,071 |
|
|
| | | | |
| | Shares | Value |
Intuitive Surgical, Inc.(1) | 105,800 | $ | 58,502,110 |
|
| | | 351,374,437 |
|
| Health Care Providers and Services — 2.7% | | |
| Quest Diagnostics, Inc. | 220,505 | 22,326,131 |
|
| UnitedHealth Group, Inc. | 773,974 | 195,583,230 |
|
| | | 217,909,361 |
|
| Hotels, Restaurants and Leisure — 4.6% | | |
Chipotle Mexican Grill, Inc.(1) | 57,591 | 44,815,013 |
|
| Darden Restaurants, Inc. | 641,267 | 71,995,046 |
|
| Domino's Pizza, Inc. | 289,184 | 78,548,158 |
|
| Las Vegas Sands Corp. | 780,905 | 48,291,165 |
|
| Royal Caribbean Cruises Ltd. | 1,194,024 | 129,945,632 |
|
| | | 373,595,014 |
|
| Household Products — 1.7% | | |
| Church & Dwight Co., Inc. | 714,849 | 49,996,539 |
|
| Procter & Gamble Co. (The) | 679,336 | 84,584,126 |
|
| | | 134,580,665 |
|
| Insurance — 0.6% | | |
| Progressive Corp. (The) | 686,524 | 47,850,723 |
|
| Interactive Media and Services — 12.8% | | |
Alphabet, Inc., Class A(1) | 539,359 | 678,945,109 |
|
Facebook, Inc., Class A(1) | 1,636,697 | 313,672,980 |
|
Twitter, Inc.(1) | 1,172,052 | 35,126,399 |
|
| | | 1,027,744,488 |
|
| Internet and Direct Marketing Retail — 6.4% | | |
Amazon.com, Inc.(1) | 290,452 | 516,034,450 |
|
| IT Services — 8.8% | | |
Fastly, Inc., Class A(1)(2) | 741,966 | 14,854,160 |
|
PayPal Holdings, Inc.(1) | 2,064,182 | 214,881,346 |
|
VeriSign, Inc.(1) | 192,946 | 36,663,599 |
|
| Visa, Inc., Class A | 2,484,284 | 444,339,036 |
|
| | | 710,738,141 |
|
| Life Sciences Tools and Services — 0.8% | | |
| Agilent Technologies, Inc. | 231,040 | 17,501,280 |
|
Illumina, Inc.(1) | 151,462 | 44,760,050 |
|
| | | 62,261,330 |
|
| Machinery — 1.6% | | |
| Cummins, Inc. | 726,007 | 125,221,687 |
|
| Multiline Retail — 0.5% | | |
| Target Corp. | 389,568 | 41,648,715 |
|
| Personal Products — 0.6% | | |
| Estee Lauder Cos., Inc. (The), Class A | 265,579 | 49,469,400 |
|
| Pharmaceuticals — 3.8% | | |
| Merck & Co., Inc. | 1,958,146 | 169,692,932 |
|
| Novo Nordisk A/S, B Shares | 1,829,724 | 100,741,344 |
|
| Zoetis, Inc. | 271,723 | 34,758,806 |
|
| | | 305,193,082 |
|
|
| | | | | | |
| | Shares/Principal Amount | Value |
| Road and Rail — 2.7% | | |
Lyft, Inc., Class A(1) | 634,992 |
| $ | 26,314,069 |
|
| Union Pacific Corp. | 1,155,242 |
| 191,146,341 |
|
| | | 217,460,410 |
|
| Semiconductors and Semiconductor Equipment — 5.5% | | |
| Analog Devices, Inc. | 667,853 |
| 71,213,166 |
|
| Applied Materials, Inc. | 1,374,973 |
| 74,606,035 |
|
| ASML Holding NV | 446,538 |
| 117,148,857 |
|
| Broadcom, Inc. | 621,285 |
| 181,943,312 |
|
| | | 444,911,370 |
|
| Software — 12.6% | | |
Datadog, Inc., Class A(1)(2) | 386,137 |
| 12,970,342 |
|
| Microsoft Corp. | 5,487,327 |
| 786,718,072 |
|
PagerDuty, Inc.(1) | 1,179,576 |
| 27,118,452 |
|
Palo Alto Networks, Inc.(1) | 244,466 |
| 55,589,124 |
|
salesforce.com, Inc.(1) | 746,588 |
| 116,833,556 |
|
Zendesk, Inc.(1) | 116,275 |
| 8,214,829 |
|
Zoom Video Communications, Inc., Class A(1)(2) | 85,100 |
| 5,947,639 |
|
| | | 1,013,392,014 |
|
| Specialty Retail — 1.7% | | |
| TJX Cos., Inc. (The) | 2,382,858 |
| 137,371,764 |
|
| Technology Hardware, Storage and Peripherals — 5.7% | | |
| Apple, Inc. | 1,851,983 |
| 460,699,291 |
|
| Textiles, Apparel and Luxury Goods — 2.0% | | |
| NIKE, Inc., Class B | 1,813,775 |
| 162,423,551 |
|
TOTAL COMMON STOCKS
(Cost $4,777,636,429) | | 7,911,063,560 |
|
| TEMPORARY CASH INVESTMENTS — 1.6% | | |
Federal Home Loan Bank Discount Notes, 1.43%, 11/1/19(3) | $ | 100,000,000 |
| 100,000,000 |
|
| Repurchase Agreement, BMO Capital Markets Corp., (collateralized by various U.S. Treasury obligations, 1.625% - 2.25%, 3/31/21 - 5/15/26, valued at $18,900,718), in a joint trading account at 1.50%, dated 10/31/19, due 11/1/19 (Delivery value $18,507,792) | | 18,507,021 |
|
| Repurchase Agreement, Fixed Income Clearing Corp., (collateralized by various U.S. Treasury obligations, 0.625%, 1/15/26, valued at $6,304,521), at 0.65%, dated 10/31/19, due 11/1/19 (Delivery value $6,177,112) | | 6,177,000 |
|
| State Street Institutional U.S. Government Money Market Fund, Premier Class | 8,159 |
| 8,159 |
|
TOTAL TEMPORARY CASH INVESTMENTS
(Cost $124,692,180) | | 124,692,180 |
|
TEMPORARY CASH INVESTMENTS - SECURITIES LENDING COLLATERAL(4) — 0.5% |
State Street Navigator Securities Lending Government Money Market Portfolio
(Cost $40,980,691) | 40,980,691 |
| 40,980,691 |
|
TOTAL INVESTMENT SECURITIES — 100.4%
(Cost $4,943,309,300) | | 8,076,736,431 |
|
| OTHER ASSETS AND LIABILITIES — (0.4)% | | (33,731,527 | ) |
| TOTAL NET ASSETS — 100.0% | | $ | 8,043,004,904 |
|
|
| | | | | | | | | | |
| FORWARD FOREIGN CURRENCY EXCHANGE CONTRACTS |
| Currency Purchased | Currency Sold | Counterparty | Settlement Date | Unrealized Appreciation
(Depreciation) |
| EUR | 4,307,835 |
| USD | 4,739,902 |
| Credit Suisse AG | 12/31/19 | $ | 84,287 |
|
| EUR | 6,542,826 |
| USD | 7,227,036 |
| Credit Suisse AG | 12/31/19 | 100,040 |
|
| EUR | 5,049,543 |
| USD | 5,574,342 |
| Credit Suisse AG | 12/31/19 | 80,459 |
|
| EUR | 788,021 |
| USD | 873,446 |
| Credit Suisse AG | 12/31/19 | 9,030 |
|
| EUR | 4,175,130 |
| USD | 4,666,585 |
| Credit Suisse AG | 12/31/19 | 8,993 |
|
| USD | 114,255,546 |
| EUR | 102,530,194 |
| Credit Suisse AG | 12/31/19 | (564,325 | ) |
| USD | 3,271,480 |
| EUR | 2,972,938 |
| Credit Suisse AG | 12/31/19 | (57,806 | ) |
| USD | 970,528 |
| EUR | 874,484 |
| Credit Suisse AG | 12/31/19 | (8,774 | ) |
| USD | 2,914,258 |
| EUR | 2,618,945 |
| Credit Suisse AG | 12/31/19 | (18,605 | ) |
| USD | 2,389,079 |
| EUR | 2,144,499 |
| Credit Suisse AG | 12/31/19 | (12,468 | ) |
| | | | | | | $ | (379,169 | ) |
|
| | | | | | | | | | | |
| FUTURES CONTRACTS PURCHASED |
| Reference Entity | Contracts | Expiration Date | Notional
Amount | Underlying
Contract
Value | Unrealized Appreciation
(Depreciation) |
| NASDAQ 100 E-Mini | 329 | December 2019 | $ | 6,580 |
| $ | 53,233,845 |
| $ | 880,458 |
|
| S&P 500 E-Mini | 350 | December 2019 | $ | 17,500 |
| 53,126,500 |
| 551,763 |
|
| | | | | $ | 106,360,345 |
| $ | 1,432,221 |
|
|
| | |
| NOTES TO SCHEDULE OF INVESTMENTS |
| EUR | - | Euro |
| USD | - | United States Dollar |
| |
| (2) | Security, or a portion thereof, is on loan. At the period end, the aggregate value of securities on loan was $40,864,200. The amount of securities on loan indicated may not correspond with the securities on loan identified because securities with pending sales are in the process of recall from the brokers. |
| |
| (3) | The rate indicated is the yield to maturity at purchase. |
| |
| (4) | Investment of cash collateral from securities on loan. At the period end, the aggregate market value of the collateral held by the fund was $41,859,889, which includes securities collateral of $879,198. |
See Notes to Financial Statements.
|
|
| Statement of Assets and Liabilities |
|
| | | |
| OCTOBER 31, 2019 | |
| Assets | |
| Investment securities, at value (cost of $4,902,328,609) — including $40,864,200 of securities on loan | $ | 8,035,755,740 |
|
Investment made with cash collateral received for securities on loan, at value
(cost of $40,980,691) | 40,980,691 |
|
| Total investment securities, at value (cost of $4,943,309,300) | 8,076,736,431 |
|
| Deposits with broker for futures contracts | 4,705,400 |
|
| Receivable for investments sold | 47,650,340 |
|
| Receivable for capital shares sold | 1,270,580 |
|
| Unrealized appreciation on forward foreign currency exchange contracts | 282,809 |
|
| Dividends and interest receivable | 1,720,296 |
|
| Securities lending receivable | 1,347,287 |
|
| | 8,133,713,143 |
|
| | |
| Liabilities | |
| Payable for collateral received for securities on loan | 40,980,691 |
|
| Payable for investments purchased | 40,177,877 |
|
| Payable for capital shares redeemed | 2,321,664 |
|
| Payable for variation margin on futures contracts | 348,180 |
|
| Unrealized depreciation on forward foreign currency exchange contracts | 661,978 |
|
| Accrued management fees | 6,154,665 |
|
| Distribution and service fees payable | 63,184 |
|
| | 90,708,239 |
|
| | |
| Net Assets | $ | 8,043,004,904 |
|
| | |
| Net Assets Consist of: | |
| Capital (par value and paid-in surplus) | $ | 4,467,881,494 |
|
| Distributable earnings | 3,575,123,410 |
|
| | $ | 8,043,004,904 |
|
|
| | | | | | |
| | Net Assets | Shares Outstanding | Net Asset Value Per Share |
| Investor Class, $0.01 Par Value |
| $5,937,959,439 |
| 165,842,839 |
| $35.80 |
| I Class, $0.01 Par Value |
| $1,382,617,665 |
| 37,821,141 |
| $36.56 |
| Y Class, $0.01 Par Value |
| $53,640,780 |
| 1,465,294 |
| $36.61 |
| A Class, $0.01 Par Value |
| $93,422,062 |
| 2,706,660 |
| $34.52* |
| C Class, $0.01 Par Value |
| $8,407,558 |
| 259,739 |
| $32.37 |
| R Class, $0.01 Par Value |
| $87,301,793 |
| 2,605,712 |
| $33.50 |
| R5 Class, $0.01 Par Value |
| $533,084 |
| 14,569 |
| $36.59 |
| R6 Class, $0.01 Par Value |
| $479,122,523 |
| 13,106,336 |
| $36.56 |
*Maximum offering price $36.63 (net asset value divided by 0.9425).
See Notes to Financial Statements.
|
| | | |
| YEAR ENDED OCTOBER 31, 2019 | |
| Investment Income (Loss) | |
| Income: | |
| Dividends (net of foreign taxes withheld of $526,250) | $ | 88,187,493 |
|
| Securities lending, net | 3,500,521 |
|
| Interest | 2,326,767 |
|
| | 94,014,781 |
|
| | |
| Expenses: | |
| Management fees | 70,844,362 |
|
| Distribution and service fees: | |
| A Class | 243,307 |
|
| C Class | 95,873 |
|
| R Class | 454,821 |
|
| Directors' fees and expenses | 239,094 |
|
| Other expenses | 12,754 |
|
| | 71,890,211 |
|
| | |
| Net investment income (loss) | 22,124,570 |
|
| | |
| Realized and Unrealized Gain (Loss) | |
| Net realized gain (loss) on: | |
| Investment transactions | 461,222,562 |
|
| Forward foreign currency exchange contract transactions | 8,296,365 |
|
| Futures contract transactions | (11,852,235 | ) |
| Foreign currency translation transactions | (6,634 | ) |
| | 457,660,058 |
|
| | |
| Change in net unrealized appreciation (depreciation) on: | |
| Investments | 664,061,650 |
|
| Forward foreign currency exchange contracts | (3,924,421 | ) |
| Futures contracts | 1,432,221 |
|
| Translation of assets and liabilities in foreign currencies | (1,934 | ) |
| | 661,567,516 |
|
| | |
| Net realized and unrealized gain (loss) | 1,119,227,574 |
|
| | |
| Net Increase (Decrease) in Net Assets Resulting from Operations | $ | 1,141,352,144 |
|
See Notes to Financial Statements.
|
|
| Statement of Changes in Net Assets |
|
| | | | | | |
| YEARS ENDED OCTOBER 31, 2019 AND OCTOBER 31, 2018 |
| Increase (Decrease) in Net Assets | October 31, 2019 | October 31, 2018 |
| Operations | | |
| Net investment income (loss) | $ | 22,124,570 |
| $ | 15,786,789 |
|
| Net realized gain (loss) | 457,660,058 |
| 886,300,896 |
|
| Change in net unrealized appreciation (depreciation) | 661,567,516 |
| (64,349,253 | ) |
| Net increase (decrease) in net assets resulting from operations | 1,141,352,144 |
| 837,738,432 |
|
| | | |
| Distributions to Shareholders | | |
| From earnings: | | |
| Investor Class | (620,549,413 | ) | (539,577,340 | ) |
| I Class | (135,799,946 | ) | (111,540,568 | ) |
| Y Class | (5,869,002 | ) | (5,319,857 | ) |
| A Class | (11,268,612 | ) | (10,572,457 | ) |
| C Class | (1,173,312 | ) | (989,243 | ) |
| R Class | (11,498,287 | ) | (10,340,531 | ) |
| R5 Class | (45,748 | ) | (554 | ) |
| R6 Class | (48,975,743 | ) | (95,667,597 | ) |
| Decrease in net assets from distributions | (835,180,063 | ) | (774,008,147 | ) |
| | | |
| Capital Share Transactions | | |
| Net increase (decrease) in net assets from capital share transactions (Note 5) | (221,312,359 | ) | (273,310,818 | ) |
| | | |
| Net increase (decrease) in net assets | 84,859,722 |
| (209,580,533 | ) |
| | | |
| Net Assets | | |
| Beginning of period | 7,958,145,182 |
| 8,167,725,715 |
|
| End of period | $ | 8,043,004,904 |
| $ | 7,958,145,182 |
|
See Notes to Financial Statements.
|
|
| Notes to Financial Statements |
OCTOBER 31, 2019
1. Organization
American Century Mutual Funds, Inc. (the corporation) is registered under the Investment Company Act of 1940, as amended (the 1940 Act), as an open-end management investment company and is organized as a Maryland corporation. Growth Fund (the fund) is one fund in a series issued by the corporation. The fund's investment objective is to seek long-term capital growth.
The fund offers the Investor Class, I Class, Y Class, A Class, C Class, R Class, R5 Class and R6 Class. The A Class may incur an initial sales charge. The A Class and C Class may be subject to a contingent deferred sales charge.
2. Significant Accounting Policies
The following is a summary of significant accounting policies consistently followed by the fund in preparation of its financial statements. The fund is an investment company and follows accounting and reporting guidance in accordance with accounting principles generally accepted in the United States of America. This may require management to make certain estimates and assumptions at the date of the financial statements. Actual results could differ from these estimates. Management evaluated the impact of events or transactions occurring through the date the financial statements were issued that would merit recognition or disclosure.
Investment Valuations — The fund determines the fair value of its investments and computes its net asset value per share at the close of regular trading (usually 4 p.m. Eastern time) on the New York Stock Exchange (NYSE) on each day the NYSE is open. The Board of Directors has adopted valuation policies and procedures to guide the investment advisor in the fund’s investment valuation process and to provide methodologies for the oversight of the fund’s pricing function.
Equity securities that are listed or traded on a domestic securities exchange are valued at the last reported sales price or at the official closing price as provided by the exchange. Equity securities traded on foreign securities exchanges are generally valued at the closing price of such securities on the exchange where primarily traded or at the close of the NYSE, if that is earlier. If no last sales price is reported, or if local convention or regulation so provides, the mean of the latest bid and asked prices may be used. Securities traded over-the-counter are valued at the mean of the latest bid and asked prices, the last sales price, or the official closing price. Equity securities initially expressed in local currencies are translated into U.S. dollars at the mean of the appropriate currency exchange rate at the close of the NYSE as provided by an independent pricing service.
Fixed income securities are valued at the evaluated mean as provided by independent pricing services or at the mean of the most recent bid and asked prices as provided by investment dealers. U.S. Treasury and Government Agency securities are valued using market models that consider trade data, quotations from dealers and active market makers, relevant yield curve and spread data, creditworthiness, trade data or market information on comparable securities, and other relevant security specific information.
Open-end management investment companies are valued at the reported net asset value per share. Repurchase agreements are valued at cost, which approximates fair value. Exchange-traded futures contracts are valued at the settlement price as provided by the appropriate exchange. Forward foreign currency exchange contracts are valued at the mean of the appropriate forward exchange rate at the close of the NYSE as provided by an independent pricing service.
If the fund determines that the market price for an investment is not readily available or the valuation methods mentioned above do not reflect an investment’s fair value, such investment is valued as determined in good faith by the Board of Directors or its delegate, in accordance with policies and procedures adopted by the Board of Directors. In its determination of fair value, the fund may review several factors including, but not limited to, market information regarding the specific investment or comparable investments and correlation with other investment types, futures indices or general market indicators. Circumstances that may cause the fund to use these procedures to value an investment include, but are not limited to: an investment has been declared in default or is distressed; trading in a security has been suspended during the trading day or a security is not actively trading on its principal exchange; prices received from a regular pricing source are deemed unreliable; or there is a foreign market holiday and no trading occurred.
The fund monitors for significant events occurring after the close of an investment’s primary exchange but before the fund’s net asset value per share is determined. Significant events may include, but are not limited to: corporate announcements and transactions; governmental action and political unrest that could impact a specific investment or an investment sector; or armed conflicts, natural disasters and similar events that could affect investments in a specific country or region. The fund also monitors for significant fluctuations between domestic and foreign markets, as evidenced by the U.S. market or such other indicators that the Board of Directors, or its delegate, deems appropriate. The fund may apply a model-derived factor to the closing price of equity securities traded on foreign securities exchanges. The factor is based on observable market data as provided by an independent pricing service.
Security Transactions — Security transactions are accounted for as of the trade date. Net realized gains and losses are determined on the identified cost basis, which is also used for federal income tax purposes.
Investment Income — Dividend income less foreign taxes withheld, if any, is recorded as of the ex-dividend date. Distributions received on securities that represent a return of capital or long-term capital gain are recorded as a reduction of cost of investments and/or as a realized gain. The fund may estimate the components of distributions received that may be considered nontaxable distributions or long-term capital gain distributions for income tax purposes. Interest income is recorded on the accrual basis and includes accretion of discounts and amortization of premiums. Securities lending income is net of fees and rebates earned by the lending agent for its services.
Foreign Currency Translations — All assets and liabilities initially expressed in foreign currencies are translated into U.S. dollars at prevailing exchange rates at period end. The fund may enter into spot foreign currency exchange contracts to facilitate transactions denominated in a foreign currency. Purchases and sales of investment securities, dividend and interest income, spot foreign currency exchange contracts, and expenses are translated at the rates of exchange prevailing on the respective dates of such transactions. Net realized and unrealized foreign currency exchange gains or losses related to investment securities are a component of net realized gain (loss) on investment transactions and change in net unrealized appreciation (depreciation) on investments, respectively.
Repurchase Agreements — The fund may enter into repurchase agreements with institutions that American Century Investment Management, Inc. (ACIM) (the investment advisor) has determined are creditworthy pursuant to criteria adopted by the Board of Directors. The fund requires that the collateral, represented by securities, received in a repurchase transaction be transferred to the custodian in a manner sufficient to enable the fund to obtain those securities in the event of a default under the repurchase agreement. ACIM monitors, on a daily basis, the securities transferred to ensure the value, including accrued interest, of the securities under each repurchase agreement is equal to or greater than amounts owed to the fund under each repurchase agreement.
Joint Trading Account — Pursuant to an Exemptive Order issued by the Securities and Exchange Commission, the fund, along with certain other funds in the American Century Investments family of funds, may transfer uninvested cash balances into a joint trading account. These balances are invested in one or more repurchase agreements that are collateralized by U.S. Treasury or Agency obligations.
Segregated Assets — In accordance with the 1940 Act, the fund segregates assets on its books and records to cover certain types of investment securities and other financial instruments. ACIM monitors, on a daily basis, the securities segregated to ensure the fund designates a sufficient amount of liquid assets, marked-to-market daily. The fund may also receive assets or be required to pledge assets at the custodian bank or with a broker for collateral requirements.
Income Tax Status — It is the fund’s policy to distribute substantially all net investment income and net realized gains to shareholders and to otherwise qualify as a regulated investment company under provisions of the Internal Revenue Code. Accordingly, no provision has been made for income taxes. The fund files U.S. federal, state, local and non-U.S. tax returns as applicable. The fund's tax returns are subject to examination by the relevant taxing authority until expiration of the applicable statute of limitations, which is generally three years from the date of filing but can be longer in certain jurisdictions. At this time, management believes there are no uncertain tax positions which, based on their technical merit, would not be sustained upon examination and for which it is reasonably possible that the total amounts of unrecognized tax benefits will significantly change in the next twelve months.
Multiple Class — All shares of the fund represent an equal pro rata interest in the net assets of the class to which such shares belong, and have identical voting, dividend, liquidation and other rights and the same terms and conditions, except for class specific expenses and exclusive rights to vote on matters affecting only individual classes. Income, non-class specific expenses, and realized and unrealized capital gains and losses of the fund are allocated to each class of shares based on their relative net assets.
Distributions to Shareholders — Distributions from net investment income and net realized gains, if any, are generally declared and paid annually. The fund may elect to treat a portion of its payment to a redeeming shareholder, which represents the pro rata share of undistributed net investment income and net realized gains, as a distribution for federal income tax purposes (tax equalization).
Indemnifications — Under the corporation’s organizational documents, its officers and directors are indemnified against certain liabilities arising out of the performance of their duties to the fund. In addition, in the normal course of business, the fund enters into contracts that provide general indemnifications. The maximum exposure under these arrangements is unknown as this would involve future claims that may be made against a fund. The risk of material loss from such claims is considered by management to be remote.
Securities Lending — Securities are lent to qualified financial institutions and brokers. State Street Bank & Trust Co. serves as securities lending agent to the fund pursuant to a Securities Lending Agreement. The lending of securities exposes the fund to risks such as: the borrowers may fail to return the loaned securities, the borrowers may not be able to provide additional collateral, the fund may experience delays in recovery of the loaned securities or delays in access to collateral, or the fund may experience losses related to the investment collateral. To minimize certain risks, loan counterparties pledge collateral in the form of cash and/or securities. The lending agent has agreed to indemnify the fund in the case of default of any securities borrowed. Cash collateral received is invested in the State Street Navigator Securities Lending Government Money Market Portfolio, a money market mutual fund registered under the 1940 Act. The loans may also be secured by U.S. government securities in an amount at least equal to the market value of the securities loaned, plus accrued interest and dividends, determined on a daily basis and adjusted accordingly. By lending securities, the fund seeks to increase its net investment income through the receipt of interest and fees. Such income is reflected separately within the Statement of Operations. The value of loaned securities and related collateral outstanding at period end, if any, are shown on a gross basis within the Schedule of Investments and Statement of Assets and Liabilities.
The following table reflects a breakdown of transactions accounted for as secured borrowings, the gross obligation by the type of collateral pledged, and the remaining contractual maturity of those transactions as of October 31, 2019.
|
| | | | | | | | | | | | |
| Remaining Contractual Maturity of Agreements |
| | Overnight and
Continuous | <30 days | Between
30 & 90 days | >90 days | Total |
Securities Lending Transactions(1) |
| Common Stocks | $ | 40,980,691 |
| — |
| — |
| — |
| $ | 40,980,691 |
|
| Gross amount of recognized liabilities for securities lending transactions | $ | 40,980,691 |
|
| |
| (1) | Amount represents the payable for cash collateral received for securities on loan. This will generally be in the Overnight and Continuous column as the securities are typically callable on demand. |
3. Fees and Transactions with Related Parties
Certain officers and directors of the corporation are also officers and/or directors of American Century Companies, Inc. (ACC). The corporation’s investment advisor, ACIM, the corporation's distributor, American Century Investment Services, Inc. (ACIS), and the corporation’s transfer agent, American Century Services, LLC, are wholly owned, directly or indirectly, by ACC.
Management Fees — The corporation has entered into a management agreement with ACIM, under which ACIM provides the fund with investment advisory and management services in exchange for a single, unified management fee (the fee) per class. The agreement provides that all expenses of managing and operating the fund, except distribution and service fees, brokerage expenses, taxes, interest, fees and expenses of the independent directors (including legal counsel fees), and extraordinary expenses, will be paid by ACIM. The fee is computed and accrued daily based on each class's daily net assets and paid monthly in arrears. The difference in the fee among the classes is a result of their separate arrangements for non-Rule 12b-1 shareholder services. It is not the result of any difference in advisory or custodial fees or other expenses related to the management of the fund’s assets, which do not vary by class. The rate of the fee is determined by applying a fee rate calculation formula. This formula takes into account the fund’s assets as well as certain assets, if any, of other clients of the investment advisor outside the American Century Investments family of funds (such as subadvised funds and separate accounts) that use very similar investment teams and strategies (strategy assets). The strategy assets of the fund also include the assets of NT Growth Fund, one fund in a series issued by the corporation.
The management fee schedule range and the effective annual management fee for each class for the period ended October 31, 2019 are as follows:
|
| | |
| | Management Fee Schedule Range | Effective Annual Management Fee |
| Investor Class | 0.800% to 0.990% | 0.98% |
| I Class | 0.600% to 0.790% | 0.78% |
| Y Class | 0.450% to 0.640% | 0.63% |
| A Class | 0.800% to 0.990% | 0.98% |
| C Class | 0.800% to 0.990% | 0.98% |
| R Class | 0.800% to 0.990% | 0.98% |
| R5 Class | 0.600% to 0.790% | 0.78% |
| R6 Class | 0.450% to 0.640% | 0.63% |
Distribution and Service Fees — The Board of Directors has adopted a separate Master Distribution and Individual Shareholder Services Plan for each of the A Class, C Class and R Class (collectively the plans), pursuant to Rule 12b-1 of the 1940 Act. The plans provide that the A Class will pay ACIS an annual distribution and service fee of 0.25%. The plans provide that the C Class will pay ACIS an annual distribution and service fee of 1.00%, of which 0.25% is paid for individual shareholder services and 0.75% is paid for distribution services. The plans provide that the R Class will pay ACIS an annual distribution and service fee of 0.50%. The fees are computed and accrued daily based on each class’s daily net assets and paid monthly in arrears. The fees are used to pay financial intermediaries for distribution and individual shareholder services. Fees incurred under the plans during the period ended October 31, 2019 are detailed in the Statement of Operations.
Directors' Fees and Expenses — The Board of Directors is responsible for overseeing the investment advisor’s management and operations of the fund. The directors receive detailed information about the fund and its investment advisor regularly throughout the year, and meet at least quarterly with management of the investment advisor to review reports about fund operations. The fund’s officers do not receive compensation from the fund.
Interfund Transactions — The fund may enter into security transactions with other American Century Investments funds and other client accounts of the investment advisor, in accordance with the 1940 Act rules and procedures adopted by the Board of Directors. The rules and procedures require, among other things, that these transactions be effected at the independent current market price of the security. During the period, the interfund purchases and sales were $44,936,753 and $27,747,494, respectively. The effect of interfund transactions on the Statement of Operations was $(1,653,968) in net realized gain (loss) on investment transactions.
4. Investment Transactions
Purchases and sales of investment securities, excluding short-term investments, for the period ended October 31, 2019 were $2,312,260,051 and $3,410,230,878, respectively.
5. Capital Share Transactions
Transactions in shares of the fund were as follows:
|
| | | | | | | | | | |
| | Year ended
October 31, 2019 | Year ended
October 31, 2018 |
| | Shares | Amount | Shares | Amount |
| Investor Class/Shares Authorized | 2,100,000,000 |
| | 1,500,000,000 |
| |
| Sold | 6,174,389 |
| $ | 204,624,318 |
| 7,149,005 |
| $ | 251,093,984 |
|
| Issued in reinvestment of distributions | 20,752,173 |
| 599,737,810 |
| 15,758,217 |
| 521,754,577 |
|
| Redeemed | (22,142,478 | ) | (738,868,587 | ) | (23,572,021 | ) | (840,580,951 | ) |
| | 4,784,084 |
| 65,493,541 |
| (664,799 | ) | (67,732,390 | ) |
| I Class/Shares Authorized | 460,000,000 |
| | 400,000,000 |
| |
| Sold | 8,201,339 |
| 284,251,396 |
| 8,689,683 |
| 319,033,553 |
|
| Issued in reinvestment of distributions | 4,549,653 |
| 134,032,787 |
| 3,275,221 |
| 110,276,696 |
|
| Redeemed | (9,493,140 | ) | (319,770,751 | ) | (13,203,233 | ) | (475,301,714 | ) |
| | 3,257,852 |
| 98,513,432 |
| (1,238,329 | ) | (45,991,465 | ) |
| Y Class/Shares Authorized | 40,000,000 |
| | 50,000,000 |
| |
| Sold | 193,293 |
| 6,309,777 |
| 175,148 |
| 6,384,121 |
|
| Issued in reinvestment of distributions | 197,540 |
| 5,819,520 |
| 158,000 |
| 5,319,857 |
|
| Redeemed | (401,561 | ) | (13,473,502 | ) | (439,040 | ) | (15,970,415 | ) |
| | (10,728 | ) | (1,344,205 | ) | (105,892 | ) | (4,266,437 | ) |
| A Class/Shares Authorized | 40,000,000 |
| | 120,000,000 |
| |
| Sold | 583,026 |
| 18,601,566 |
| 774,352 |
| 26,596,791 |
|
| Issued in reinvestment of distributions | 335,059 |
| 9,354,848 |
| 265,742 |
| 8,535,632 |
|
| Redeemed | (1,260,515 | ) | (40,816,895 | ) | (1,331,043 | ) | (45,936,465 | ) |
| | (342,430 | ) | (12,860,481 | ) | (290,949 | ) | (10,804,042 | ) |
| C Class/Shares Authorized | 30,000,000 |
| | 20,000,000 |
| |
| Sold | 63,391 |
| 1,766,765 |
| 53,487 |
| 1,746,172 |
|
| Issued in reinvestment of distributions | 39,522 |
| 1,041,792 |
| 27,606 |
| 849,166 |
|
| Redeemed | (149,895 | ) | (4,554,998 | ) | (79,275 | ) | (2,613,979 | ) |
| | (46,982 | ) | (1,746,441 | ) | 1,818 |
| (18,641 | ) |
| R Class/Shares Authorized | 40,000,000 |
| | 30,000,000 |
| |
| Sold | 339,606 |
| 10,447,195 |
| 362,281 |
| 12,163,236 |
|
| Issued in reinvestment of distributions | 417,329 |
| 11,334,663 |
| 324,563 |
| 10,201,029 |
|
| Redeemed | (1,207,308 | ) | (36,468,093 | ) | (766,150 | ) | (25,880,852 | ) |
| | (450,373 | ) | (14,686,235 | ) | (79,306 | ) | (3,516,587 | ) |
| R5 Class/Shares Authorized | 30,000,000 |
| | 50,000,000 |
| |
| Sold | 2,974 |
| 101,028 |
| 14,877 |
| 524,263 |
|
| Issued in reinvestment of distributions | 1,552 |
| 45,748 |
| 16 |
| 554 |
|
| Redeemed | (1,305 | ) | (44,020 | ) | (3,707 | ) | (136,747 | ) |
| | 3,221 |
| 102,756 |
| 11,186 |
| 388,070 |
|
| R6 Class/Shares Authorized | 200,000,000 |
| | 300,000,000 |
| |
| Sold | 3,277,264 |
| 109,281,671 |
| 3,111,009 |
| 111,232,000 |
|
| Issued in reinvestment of distributions | 1,664,709 |
| 48,975,743 |
| 2,844,710 |
| 95,667,597 |
|
| Redeemed | (15,267,638 | ) | (513,042,140 | ) | (9,628,316 | ) | (348,268,923 | ) |
| | (10,325,665 | ) | (354,784,726 | ) | (3,672,597 | ) | (141,369,326 | ) |
| Net increase (decrease) | (3,131,021 | ) | $ | (221,312,359 | ) | (6,038,868 | ) | $ | (273,310,818 | ) |
6. Fair Value Measurements
The fund’s investments valuation process is based on several considerations and may use multiple inputs to determine the fair value of the investments held by the fund. In conformity with accounting principles generally accepted in the United States of America, the inputs used to determine a valuation are classified into three broad levels.
| |
| • | Level 1 valuation inputs consist of unadjusted quoted prices in an active market for identical investments. |
| |
| • | Level 2 valuation inputs consist of direct or indirect observable market data (including quoted prices for comparable investments, evaluations of subsequent market events, interest rates, prepayment speeds, credit risk, etc.). These inputs also consist of quoted prices for identical investments initially expressed in local currencies that are adjusted through translation into U.S. dollars. |
| |
| • | Level 3 valuation inputs consist of unobservable data (including a fund’s own assumptions). |
The level classification is based on the lowest level input that is significant to the fair valuation measurement. The valuation inputs are not necessarily an indication of the risks associated with investing in these securities or other financial instruments.
The following is a summary of the level classifications as of period end. The Schedule of Investments provides additional information on the fund’s portfolio holdings.
|
| | | | | | | | |
| | Level 1 | Level 2 | Level 3 |
| Assets | | | |
| Investment Securities | | | |
| Common Stocks | $ | 7,693,173,359 |
| $ | 217,890,201 |
| — |
|
| Temporary Cash Investments | 8,159 |
| 124,684,021 |
| — |
|
| Temporary Cash Investments - Securities Lending Collateral | 40,980,691 |
| — |
| — |
|
| | $ | 7,734,162,209 |
| $ | 342,574,222 |
| — |
|
| Other Financial Instruments | | | |
| Futures Contracts | $ | 1,432,221 |
| — |
| — |
|
| Forward Foreign Currency Exchange Contracts | — |
| $ | 282,809 |
| — |
|
| | $ | 1,432,221 |
| $ | 282,809 |
| — |
|
| | | | |
| Liabilities | | | |
| Other Financial Instruments | | | |
| Forward Foreign Currency Exchange Contracts | — |
| $ | 661,978 |
| — |
|
7. Derivative Instruments
Equity Price Risk — The fund is subject to equity price risk in the normal course of pursuing its investment objectives. A fund may enter into futures contracts based on an equity index in order to manage its exposure to changes in market conditions. A fund may purchase futures contracts to gain exposure to increases in market value or sell futures contracts to protect against a decline in market value. Upon entering into a futures contract, a fund is required to deposit either cash or securities in an amount equal to a certain percentage of the contract value (initial margin). Subsequent payments (variation margin) are made or received daily, in cash, by a fund. The variation margin is equal to the daily change in the contract value and is recorded as unrealized gains and losses. A fund recognizes a realized gain or loss when the contract is closed or expires. Net realized and unrealized gains or losses occurring during the holding period of futures contracts are a component of net realized gain (loss) on futures contract transactions and change in net unrealized appreciation (depreciation) on futures contracts, respectively. One of the risks of entering into futures contracts is the possibility that the change in value of the contract may not correlate with the changes in value of the underlying securities. During the period, the fund participated in equity price risk derivative instruments for temporary investment purposes.
Foreign Currency Risk — The fund is subject to foreign currency exchange rate risk in the normal course of pursuing its investment objectives. The value of foreign investments held by a fund may be significantly affected by changes in foreign currency exchange rates. The dollar value of a foreign security generally decreases when the value of the dollar rises against the foreign currency in which the security is denominated and tends to increase when the value of the dollar declines against such foreign currency. A fund may enter into forward foreign currency exchange contracts to reduce a fund's exposure to foreign currency exchange rate fluctuations. The net U.S. dollar value of foreign currency underlying all contractual commitments held by a fund and the resulting unrealized appreciation or depreciation are determined daily. Realized gain or loss is recorded upon the termination of the contract. Net realized and unrealized gains or losses occurring during the holding period of forward foreign currency exchange contracts are a component of net realized gain (loss) on forward foreign currency exchange contract transactions and change in net unrealized appreciation (depreciation) on forward foreign currency exchange contracts, respectively. A fund bears the risk of an unfavorable change in the foreign currency exchange rate underlying the forward contract. Additionally, losses, up to the fair value, may arise if the counterparties do not perform under the contract terms. The fund's average U.S. dollar exposure to foreign currency risk derivative instruments held during the period was $113,738,850.
Value of Derivative Instruments as of October 31, 2019
|
| | | | | | | | |
| | Asset Derivatives | Liability Derivatives |
| Type of Risk Exposure | Location on Statement of Assets and Liabilities | Value | Location on Statement of Assets and Liabilities | Value |
| Equity Price Risk | Receivable for variation margin on futures contracts* | — |
| Payable for variation margin on futures contracts* | $ | 348,180 |
|
| Foreign Currency Risk | Unrealized appreciation on forward foreign currency exchange contracts | $ | 282,809 |
| Unrealized depreciation on forward foreign currency exchange contracts | 661,978 |
|
| | | $ | 282,809 |
| | $ | 1,010,158 |
|
| |
| * | Included in the unrealized appreciation (depreciation) on futures contracts as reported in the Schedule of Investments. |
Effect of Derivative Instruments on the Statement of Operations for the Year Ended October 31, 2019
|
| | | | | | | | |
| | Net Realized Gain (Loss) | Change in Net Unrealized Appreciation (Depreciation) |
| Type of Risk Exposure | Location on Statement of Operations | Value | Location on Statement of Operations | Value |
| Equity Price Risk | Net realized gain (loss) on futures contract transactions | $ | (11,852,235 | ) | Change in net unrealized appreciation (depreciation) on futures contracts | $ | 1,432,221 |
|
| Foreign Currency Risk | Net realized gain (loss) on forward foreign currency exchange contract transactions | 8,296,365 |
| Change in net unrealized appreciation (depreciation) on forward foreign currency exchange contracts | (3,924,421 | ) |
| | | $ | (3,555,870 | ) | | $ | (2,492,200 | ) |
8. Federal Tax Information
The tax character of distributions paid during the years ended October 31, 2019 and October 31, 2018 were as follows:
|
| | | | | | |
| | 2019 | 2018 |
| Distributions Paid From | | |
| Ordinary income | $ | 83,919,008 |
| $ | 166,784,392 |
|
| Long-term capital gains | $ | 751,261,055 |
| $ | 607,223,755 |
|
The book-basis character of distributions made during the year from net investment income or net realized gains may differ from their ultimate characterization for federal income tax purposes. These differences reflect the differing character of certain income items and net realized gains and losses for financial statement and tax purposes, and may result in reclassification among certain capital accounts on the financial statements.
As of period end, the federal tax cost of investments and the components of distributable earnings on a tax-basis were as follows:
|
| | | |
| Federal tax cost of investments | $ | 4,950,528,149 |
|
| Gross tax appreciation of investments | $ | 3,192,060,528 |
|
| Gross tax depreciation of investments | (65,852,246 | ) |
| Net tax appreciation (depreciation) of investments | 3,126,208,282 |
|
| Net tax appreciation (depreciation) on derivatives and translation of assets and liabilities in foreign currencies | (2,091 | ) |
| Net tax appreciation (depreciation) | $ | 3,126,206,191 |
|
| Undistributed ordinary income | $ | 24,642,374 |
|
| Accumulated long-term gains | $ | 424,274,845 |
|
The difference between book-basis and tax-basis unrealized appreciation (depreciation) is attributable primarily to the tax deferral of losses on wash sales.
|
| | | | | | | | | | | | | | | |
| For a Share Outstanding Throughout the Years Ended October 31 (except as noted) | |
| Per-Share Data | | | | | | | | | Ratios and Supplemental Data |
| | | Income From Investment Operations: | Distributions From: | | | Ratio to Average Net Assets of: | |
| | Net Asset
Value,
Beginning
of Period | Net
Investment
Income
(Loss)(1) | Net
Realized
and
Unrealized
Gain (Loss) | Total From
Investment
Operations | Net
Investment
Income | Net
Realized
Gains | Total
Distributions | Net Asset
Value,
End
of Period | Total
Return(2) | Operating
Expenses | Net
Investment
Income
(Loss) | Portfolio
Turnover
Rate | Net
Assets,
End of
Period
(in thousands) |
| Investor Class | | | | | | | | | | | | |
| 2019 | $34.94 | 0.08 | 4.70 | 4.78 | (0.08) | (3.84) | (3.92) | $35.80 | 16.35% | 0.98% | 0.24% | 30% |
| $5,937,959 |
|
| 2018 | $34.93 | 0.04 | 3.35 | 3.39 | (0.06) | (3.32) | (3.38) | $34.94 | 10.22% | 0.97% | 0.13% | 38% |
| $5,627,171 |
|
| 2017 | $28.64 | 0.08 | 7.67 | 7.75 | (0.17) | (1.29) | (1.46) | $34.93 | 28.26% | 0.98% | 0.26% | 48% |
| $5,648,965 |
|
| 2016 | $30.57 | 0.16 | (0.08) | 0.08 | (0.10) | (1.91) | (2.01) | $28.64 | 0.40% | 0.98% | 0.57% | 36% |
| $5,122,550 |
|
| 2015 | $35.39 | 0.10 | 2.34 | 2.44 | (0.10) | (7.16) | (7.26) | $30.57 | 9.07% | 0.97% | 0.35% | 49% |
| $5,952,798 |
|
| I Class | | | | | | | | | | | | |
| 2019 | $35.59 | 0.15 | 4.81 | 4.96 | (0.15) | (3.84) | (3.99) | $36.56 | 16.62% | 0.78% | 0.44% | 30% |
| $1,382,618 |
|
| 2018 | $35.52 | 0.12 | 3.40 | 3.52 | (0.13) | (3.32) | (3.45) | $35.59 | 10.46% | 0.77% | 0.33% | 38% |
| $1,230,065 |
|
| 2017 | $29.11 | 0.15 | 7.78 | 7.93 | (0.23) | (1.29) | (1.52) | $35.52 | 28.48% | 0.78% | 0.46% | 48% |
| $1,271,821 |
|
| 2016 | $31.03 | 0.23 | (0.08) | 0.15 | (0.16) | (1.91) | (2.07) | $29.11 | 0.64% | 0.78% | 0.77% | 36% |
| $1,297,685 |
|
| 2015 | $35.83 | 0.17 | 2.36 | 2.53 | (0.17) | (7.16) | (7.33) | $31.03 | 9.30% | 0.77% | 0.55% | 49% |
| $1,723,219 |
|
| Y Class | | | | | | | | | | | | |
| 2019 | $35.64 | 0.20 | 4.81 | 5.01 | (0.20) | (3.84) | (4.04) | $36.61 | 16.78% | 0.63% | 0.59% | 30% |
| $53,641 |
|
| 2018 | $35.54 | 0.17 | 3.40 | 3.57 | (0.15) | (3.32) | (3.47) | $35.64 | 10.61% | 0.62% | 0.48% | 38% |
| $52,601 |
|
2017(3) | $30.93 | 0.08 | 4.53 | 4.61 | — | — | — | $35.54 | 14.90% | 0.63%(4) | 0.43%(4) | 48%(5) |
| $56,218 |
|
|
| | | | | | | | | | | | | | | |
| For a Share Outstanding Throughout the Years Ended October 31 (except as noted) | |
| Per-Share Data | | | | | | | | | Ratios and Supplemental Data |
| | | Income From Investment Operations: | Distributions From: | | | Ratio to Average Net Assets of: | |
| | Net Asset
Value,
Beginning
of Period | Net
Investment
Income
(Loss)(1) | Net
Realized
and
Unrealized
Gain (Loss) | Total From
Investment
Operations | Net
Investment
Income | Net
Realized
Gains | Total
Distributions | Net Asset
Value,
End
of Period | Total
Return(2) | Operating
Expenses | Net
Investment
Income
(Loss) | Portfolio
Turnover
Rate | Net
Assets,
End of
Period
(in thousands) |
| A Class | | | | | | | | | | | | | |
| 2019 | $33.82 | —(6) | 4.54 | 4.54 | — | (3.84) | (3.84) | $34.52 | 16.06% | 1.23% | (0.01)% | 30% |
| $93,422 |
|
| 2018 | $33.94 | (0.04) | 3.24 | 3.20 | — | (3.32) | (3.32) | $33.82 | 9.94% | 1.22% | (0.12)% | 38% |
| $103,115 |
|
| 2017 | $27.86 | 0.01 | 7.46 | 7.47 | (0.10) | (1.29) | (1.39) | $33.94 | 27.95% | 1.23% | 0.01% | 48% |
| $113,348 |
|
| 2016 | $29.78 | 0.10 | (0.08) | 0.02 | (0.03) | (1.91) | (1.94) | $27.86 | 0.18% | 1.23% | 0.32% | 36% |
| $147,133 |
|
| 2015 | $34.65 | 0.04 | 2.26 | 2.30 | (0.01) | (7.16) | (7.17) | $29.78 | 8.78% | 1.22% | 0.10% | 49% |
| $290,077 |
|
| C Class | | | | | | | | | | | | | |
| 2019 | $32.18 | (0.23) | 4.26 | 4.03 | — | (3.84) | (3.84) | $32.37 | 15.23% | 1.98% | (0.76)% | 30% |
| $8,408 |
|
| 2018 | $32.67 | (0.29) | 3.12 | 2.83 | — | (3.32) | (3.32) | $32.18 | 9.12% | 1.97% | (0.87)% | 38% |
| $9,871 |
|
| 2017 | $26.97 | (0.21) | 7.20 | 6.99 | — | (1.29) | (1.29) | $32.67 | 26.99% | 1.98% | (0.74)% | 48% |
| $9,962 |
|
| 2016 | $29.08 | (0.11) | (0.09) | (0.20) | — | (1.91) | (1.91) | $26.97 | (0.58)% | 1.98% | (0.43)% | 36% |
| $9,379 |
|
| 2015 | $34.20 | (0.19) | 2.23 | 2.04 | — | (7.16) | (7.16) | $29.08 | 7.95% | 1.97% | (0.65)% | 49% |
| $11,713 |
|
| R Class | | | | | | | | | | | | | |
| 2019 | $33.02 | (0.08) | 4.40 | 4.32 | — | (3.84) | (3.84) | $33.50 | 15.78% | 1.48% | (0.26)% | 30% |
| $87,302 |
|
| 2018 | $33.29 | (0.13) | 3.18 | 3.05 | — | (3.32) | (3.32) | $33.02 | 9.66% | 1.47% | (0.37)% | 38% |
| $100,915 |
|
| 2017 | $27.35 | (0.07) | 7.32 | 7.25 | (0.02) | (1.29) | (1.31) | $33.29 | 27.62% | 1.48% | (0.24)% | 48% |
| $104,368 |
|
| 2016 | $29.31 | 0.02 | (0.07) | (0.05) | — | (1.91) | (1.91) | $27.35 | (0.06)% | 1.48% | 0.07% | 36% |
| $96,415 |
|
| 2015 | $34.28 | (0.04) | 2.23 | 2.19 | — | (7.16) | (7.16) | $29.31 | 8.50% | 1.47% | (0.15)% | 49% |
| $114,672 |
|
|
| | | | | | | | | | | | | | | |
| For a Share Outstanding Throughout the Years Ended October 31 (except as noted) | |
| Per-Share Data | | | | | | | | | Ratios and Supplemental Data |
| | | Income From Investment Operations: | Distributions From: | | | Ratio to Average Net Assets of: | |
| | Net Asset
Value,
Beginning
of Period | Net
Investment
Income
(Loss)(1) | Net
Realized
and
Unrealized
Gain (Loss) | Total From
Investment
Operations | Net
Investment
Income | Net
Realized
Gains | Total
Distributions | Net Asset
Value,
End
of Period | Total
Return(2) | Operating
Expenses | Net
Investment
Income
(Loss) | Portfolio
Turnover
Rate | Net
Assets,
End of
Period
(in thousands) |
| R5 Class | | | | | | | | | | | | | |
| 2019 | $35.62 | 0.15 | 4.81 | 4.96 | (0.15) | (3.84) | (3.99) | $36.59 | 16.61% | 0.78% | 0.44% | 30% |
| $533 |
|
| 2018 | $35.53 | 0.12 | 3.40 | 3.52 | (0.11) | (3.32) | (3.43) | $35.62 | 10.45% | 0.77% | 0.33% | 38% |
| $404 |
|
2017(3) | $30.95 | 0.05 | 4.53 | 4.58 | — | — | — | $35.53 | 14.80% | 0.78%(4) | 0.27%(4) | 48%(5) |
| $6 |
|
| R6 Class | | | | | | | | | | | | | |
| 2019 | $35.59 | 0.21 | 4.80 | 5.01 | (0.20) | (3.84) | (4.04) | $36.56 | 16.81% | 0.63% | 0.59% | 30% |
| $479,123 |
|
| 2018 | $35.53 | 0.17 | 3.40 | 3.57 | (0.19) | (3.32) | (3.51) | $35.59 | 10.60% | 0.62% | 0.48% | 38% |
| $834,003 |
|
| 2017 | $29.11 | 0.18 | 7.80 | 7.98 | (0.27) | (1.29) | (1.56) | $35.53 | 28.71% | 0.63% | 0.61% | 48% |
| $963,039 |
|
| 2016 | $31.04 | 0.26 | (0.07) | 0.19 | (0.21) | (1.91) | (2.12) | $29.11 | 0.76% | 0.63% | 0.92% | 36% |
| $390,201 |
|
| 2015 | $35.84 | 0.23 | 2.35 | 2.58 | (0.22) | (7.16) | (7.38) | $31.04 | 9.46% | 0.62% | 0.70% | 49% |
| $333,333 |
|
|
| | | | |
| Notes to Financial Highlights | | |
| |
| (1) | Computed using average shares outstanding throughout the period. |
| |
| (2) | Total returns are calculated based on the net asset value of the last business day and do not reflect applicable sales charges, if any. Total returns for periods less than one year are not annualized. |
| |
| (3) | April 10, 2017 (commencement of sale) through October 31, 2017. |
| |
| (5) | Portfolio turnover is calculated at the fund level. Percentage indicated was calculated for the year ended October 31, 2017. |
| |
| (6) | Per-share amount was less than $0.005. |
See Notes to Financial Statements.
|
|
| Report of Independent Registered Public Accounting Firm |
To the Shareholders and the Board of Directors of American Century Mutual Funds, Inc.:
Opinion on the Financial Statements and Financial Highlights
We have audited the accompanying statement of assets and liabilities, including the schedule of investments, of Growth Fund, one of the funds constituting the American Century Mutual Funds, Inc. (the "Fund"), as of October 31, 2019, the related statement of operations for the year then ended, the statements of changes in net assets for each of the two years in the period then ended, the financial highlights for each of the five years in the period then ended, and the related notes. In our opinion, the financial statements and financial highlights present fairly, in all material respects, the financial position of Growth Fund of the American Century Mutual Funds, Inc. as of October 31, 2019, the results of its operations for the year then ended, the changes in its net assets for each of the two years in the period then ended, and the financial highlights for each of the five years in the period then ended, in conformity with accounting principles generally accepted in the United States of America.
Basis for Opinion
These financial statements and financial highlights are the responsibility of the Fund's management. Our responsibility is to express an opinion on the Fund’s financial statements and financial highlights based on our audits. We are a public accounting firm registered with the Public Company Accounting Oversight Board (United States) (PCAOB) and are required to be independent with respect to the Fund in accordance with the U.S. federal securities laws and the applicable rules and regulations of the Securities and Exchange Commission and the PCAOB.
We conducted our audits in accordance with the standards of the PCAOB. Those standards require that we plan and perform the audit to obtain reasonable assurance about whether the financial statements and financial highlights are free of material misstatement, whether due to error or fraud. The Fund is not required to have, nor were we engaged to perform, an audit of its internal control over financial reporting. As part of our audits we are required to obtain an understanding of internal control over financial reporting but not for the purpose of expressing an opinion on the effectiveness of the Fund’s internal control over financial reporting. Accordingly, we express no such opinion.
Our audits included performing procedures to assess the risks of material misstatement of the financial statements and financial highlights, whether due to error or fraud, and performing procedures that respond to those risks. Such procedures included examining, on a test basis, evidence regarding the amounts and disclosures in the financial statements and financial highlights. Our audits also included evaluating the accounting principles used and significant estimates made by management, as well as evaluating the overall presentation of the financial statements and financial highlights. Our procedures included confirmation of securities owned as of October 31, 2019, by correspondence with the custodian and brokers; when replies were not received from brokers, we performed other auditing procedures. We believe that our audits provide a reasonable basis for our opinion.
DELOITTE & TOUCHE LLP
Kansas City, Missouri
December 16, 2019
We have served as the auditor of one or more American Century investment companies since 1997.
The Board of Directors
The individuals listed below serve as directors of the funds. Each director will continue to serve in this capacity until death, retirement, resignation or removal from office. The board has adopted a mandatory retirement age for directors who are not “interested persons,” as that term is defined in the Investment Company Act (independent directors). Independent directors shall retire by December 31 of the year in which they reach their 75th birthday.
Mr. Thomas is an “interested person” because he currently serves as President and Chief Executive Officer of American Century Companies, Inc. (ACC), the parent company of American Century Investment Management, Inc. (ACIM or the advisor). The other directors (more than three-fourths of the total number) are independent. They are not employees, directors or officers of, and have no financial interest in, ACC or any of its wholly owned, direct or indirect, subsidiaries, including ACIM, American Century Investment Services, Inc. (ACIS) and American Century Services, LLC (ACS), and they do not have any other affiliations, positions or relationships that would cause them to be considered “interested persons” under the Investment Company Act. The directors serve in this capacity for seven (in the case of Jonathan S. Thomas, 16; and Stephen E. Yates, 8) registered investment companies in the American Century Investments family of funds.
The following table presents additional information about the directors. The mailing address for each director is 4500 Main Street, Kansas City, Missouri 64111.
|
| | | | | |
Name
(Year of Birth) | Position(s) Held with Funds | Length of Time Served | Principal Occupation(s) During Past 5 Years | Number of American Century Portfolios Overseen by Director | Other Directorships Held During Past 5 Years |
| Independent Directors |
|
|
| Thomas W. Bunn (1953) | Director | Since 2017 | Retired | 66 | SquareTwo Financial; Barings (formerly Babson Capital Funds Trust) (2013 to 2016) |
Chris H. Cheesman
(1962)
| Director | Since 2019
| Retired. Senior Vice President & Chief Audit Executive, AllianceBernstein (1999 to 2018)
| 66 | None |
Barry Fink
(1955) | Director | Since 2012 (independent since 2016) | Retired | 66 | None |
Rajesh K. Gupta
(1960)
| Director | Since 2019
| Partner Emeritus, SeaCrest Investment Management and SeaCrest Wealth Management (2019 to Present); Chief Executive Officer and Chief Investment Officer, SeaCrest Investment Management (2006 to 2019); Chief Executive Officer and Chief Investment Officer, SeaCrest Wealth Management (2008 to 2019)
| 66 | None |
|
| | | | | |
Name
(Year of Birth) | Position(s) Held with Funds | Length of Time Served | Principal Occupation(s) During Past 5 Years | Number of American Century Portfolios Overseen by Director | Other Directorships Held During Past 5 Years |
| Independent Directors |
|
|
Lynn Jenkins
(1963)
| Director | Since 2019
| United States Representative, U.S. House of Representatives (2009 to 2018) | 66 | MGP Ingredients, Inc. |
Jan M. Lewis
(1957) | Director | Since 2011 | Retired | 66 | None |
John R. Whitten
(1946) | Director | Since 2008 | Retired | 66 | Onto Innovation Inc.; Rudolph Technologies, Inc. (2006 to 2019) |
Stephen E. Yates
(1948) | Director and Chairman of the Board | Since 2012 (Chairman since 2018) | Retired | 81 | None |
| Interested Director |
|
Jonathan S. Thomas
(1963) | Director | Since 2007 | President and Chief Executive Officer, ACC (2007 to present). Also serves as Chief Executive Officer, ACS; Executive Vice President, ACIM; Director, ACC, ACIM and other ACC subsidiaries | 125 | BioMed Valley Discoveries, Inc. |
The Statement of Additional Information has additional information about the fund's directors and is available without charge, upon request, by calling 1-800-345-2021.
Officers
The following table presents certain information about the executive officers of the funds. Each officer serves as an officer for each of the 16 (in the case of Robert J. Leach, 15) investment companies in the American Century family of funds. No officer is compensated for his or her service as an officer of the funds. The listed officers are interested persons of the funds and are appointed or re-appointed on an annual basis. The mailing address for each officer listed below is 4500 Main Street, Kansas City, Missouri 64111.
|
| | |
Name
(Year of Birth) | Offices with the Funds | Principal Occupation(s) During the Past Five Years |
Patrick Bannigan
(1965) | President since 2019 | Executive Vice President and Director, ACC (2012 to present); Chief Financial Officer, Chief Accounting Officer and Treasurer, ACC (2015 to present); Chief Operating Officer, ACC (2012-2015). Also serves as President, ACS; Vice President, ACIM; Chief Financial Officer, Chief Accounting Officer and/or Director, ACIM, ACS and other ACC subsidiaries |
R. Wes Campbell
(1974) | Chief Financial Officer and Treasurer since 2018 | Investment Operations and Investment Accounting, ACS (2000 to present) |
Amy D. Shelton
(1964) | Chief Compliance Officer and Vice President since 2014 | Chief Compliance Officer, American Century funds, (2014 to present); Chief Compliance Officer, ACIM (2014 to present); Chief Compliance Officer, ACIS (2009 to present). Also serves as Vice President, ACIS |
Charles A. Etherington
(1957) | General Counsel since 2007 and Senior Vice President since 2006 | Attorney, ACC (1994 to present); Vice President, ACC (2005 to present); General Counsel, ACC (2007 to present). Also serves as General Counsel, ACIM, ACS, ACIS and other ACC subsidiaries; and Senior Vice President, ACIM and ACS |
C. Jean Wade
(1964) | Vice President since 2012 | Senior Vice President, ACS (2017 to present); Vice President, ACS (2000 to 2017)
|
Robert J. Leach
(1966) | Vice President since 2006 | Vice President, ACS (2000 to present) |
David H. Reinmiller
(1963) | Vice President since 2000 | Attorney, ACC (1994 to present). Also serves as Vice President, ACIM and ACS |
Ward D. Stauffer
(1960) | Secretary since 2005 | Attorney, ACC (2003 to present) |
|
|
| Approval of Management Agreement |
At a meeting held on June 26, 2019, the Fund’s Board of Directors (the "Board") unanimously approved the renewal of the management agreement pursuant to which American Century Investment Management, Inc. (the “Advisor”) acts as the investment advisor for the Fund. Under Section 15(c) of the Investment Company Act, contracts for investment advisory services are required to be reviewed, evaluated, and approved by a majority of a fund’s directors (the “Directors”), including a majority of the independent Directors, each year.
Prior to its consideration of the renewal of the management agreement, the Directors requested and reviewed extensive data and information compiled by the Advisor and certain independent providers of evaluation data concerning the Fund and the services provided to the Fund by the Advisor. This review was in addition to the oversight and evaluation undertaken by the Board and its committees on a continual basis and the information received was supplemental to the extensive information that the Board and its committees receive and consider throughout the year.
In connection with its consideration of the renewal of the management agreement, the Board’s review and evaluation of the services provided by the Advisor included, but was not limited to, the following:
| |
| • | the nature, extent, and quality of investment management, shareholder services, and other services provided and to be provided to the Fund; |
| |
| • | the wide range of other programs and services provided and to be provided to the Fund and its shareholders on a routine and non-routine basis; |
| |
| • | the investment performance of the Fund, including data comparing the Fund's performance to appropriate benchmarks and/or a peer group of other mutual funds with similar investment objectives and strategies; |
| |
| • | the cost of owning the Fund compared to the cost of owning similar funds; |
| |
| • | the compliance policies, procedures, and regulatory experience of the Advisor and the Fund's service providers; |
| |
| • | financial data showing the cost of services provided to the Fund, the profitability of the Fund to the Advisor, and the overall profitability of the Advisor; |
| |
| • | strategic plans of the Advisor; |
| |
| • | any economies of scale associated with the Advisor’s management of the Fund and other accounts; |
| |
| • | services provided and charges to the Advisor's other investment management clients; |
| |
| • | acquired fund fees and expenses; |
| |
| • | payments and practices in connection with financial intermediaries holding shares of the Fund and the services provided by intermediaries in connection therewith; and |
| |
| • | any collateral benefits derived by the Advisor from the management of the Fund. |
The Directors held three in-person meetings and one telephonic meeting to review and discuss the information provided. The independent Directors also reviewed responses to supplemental information requests provided by the Directors to the Advisor and held active discussions with the Advisor regarding the renewal of the management agreement. The independent Directors had the benefit of the advice of their independent counsel throughout the process.
Factors Considered
The Directors considered all of the information provided by the Advisor, the independent data providers, and independent counsel in connection with the approval. They determined that the information was sufficient for them to evaluate the management agreement for the Fund. In connection with their review, the Directors did not identify any single factor as being all-important or controlling, and each Director may have attributed different levels of importance to different factors.
In deciding to renew the management agreement, the Board based its decision on a number of factors, including without limitation the following:
Nature, Extent and Quality of Services — Generally. Under the management agreement, the Advisor is responsible for providing or arranging for all services necessary for the operation of the Fund. The Board noted that the Advisor provides or arranges at its own expense a wide variety of services including without limitation the following:
| |
| • | portfolio research and security selection |
| |
| • | daily valuation of the Fund’s portfolio |
| |
| • | shareholder servicing and transfer agency, including shareholder confirmations, recordkeeping, and communications |
| |
| • | legal services (except the independent Directors’ counsel) |
| |
| • | regulatory and portfolio compliance |
| |
| • | marketing and distribution (except amounts paid by the Fund under Rule 12b-1 plans) |
The Board noted that many of these services have expanded over time in terms of both quantity and complexity in response to shareholder demands, competition in the industry, changing distribution channels, and the changing regulatory environment.
Investment Management Services. The nature of the investment management services provided to the Fund is quite complex and allows Fund shareholders access to professional money management, instant diversification of their investments within an asset class, the opportunity to easily diversify among asset classes by investing in or exchanging among various American Century Investments funds, and liquidity. In evaluating investment performance, the Board expects the Advisor to manage the Fund in accordance with its investment objectives and approved strategies. Further, the Directors recognize that the Advisor has an obligation to monitor trading activities, and in particular to seek the best execution of fund trades, and to evaluate the use of and payment for research. In providing these services, the Advisor utilizes teams of investment professionals (portfolio managers, analysts, research assistants, and securities traders) who require extensive information technology, research, training, compliance, and other systems to conduct their business. The Board, directly and through its Fund Performance Review Committee, provides oversight of the investment performance process. It regularly reviews investment performance information for the Fund, together with comparative information for appropriate benchmarks and/or peer groups of similarly-managed funds, over different time horizons. The Directors also review investment performance information during the management agreement renewal process. If performance concerns are identified, the Fund receives special reviews until performance improves, during which the Board discusses with the Advisor the reasons for such results (e.g., market conditions, security selection) and any efforts being undertaken to improve performance. The Fund’s performance was above its benchmark for the one-year period and below its benchmark for the three-, five-, and ten-year periods reviewed by the Board. The Board found the investment management services provided by the Advisor to the Fund to be satisfactory and consistent with the management agreement.
Shareholder and Other Services. Under the management agreement, the Advisor provides the Fund with a comprehensive package of transfer agency, shareholder, and other services. The Board, directly and through various committees of the Board, regularly reviews reports and evaluations of such services at its regular meetings. These reports include, but are not limited to, information regarding the operational efficiency and accuracy of the shareholder and transfer agency services provided, staffing levels, shareholder satisfaction, technology support (including cyber security), new products and services offered to Fund shareholders, securities trading activities, portfolio valuation services, auditing services, and legal and operational compliance
activities. The Board found the services provided by the Advisor to the Fund under the management agreement to be competitive and of high quality.
Costs of Services and Profitability. The Advisor provides detailed information concerning its cost of providing various services to the Fund, its profitability in managing the Fund (pre- and post-distribution), its overall profitability, and its financial condition. The Directors have reviewed with the Advisor the methodology used to prepare this financial information. This information is considered in evaluating the Advisor’s financial condition, its ability to continue to provide services under the management agreement, and the reasonableness of the current management fee. The Board concluded that the Advisor’s profits were reasonable in light of the services provided to the Fund.
Ethics. The Board generally considers the Advisor’s commitment to providing quality services to shareholders and to conducting its business ethically. They noted that the Advisor’s practices generally meet or exceed industry best practices.
Economies of Scale. The Board also reviewed information provided by the Advisor regarding the possible existence of economies of scale in connection with the management of the Fund. The Board concluded that economies of scale are difficult to measure and predict with precision, especially on a fund-by-fund basis. The Board concluded that the Advisor is appropriately sharing economies of scale through its competitive fee structure, offering competitive fees from fund inception, and through reinvestment in its business to provide shareholders additional content and services. The Board also noted that economies of scale are shared with the Fund and its shareholders through management fee breakpoints that serve to reduce the effective management fee as the assets of the Fund grow.
Comparison to Other Funds’ Fees. The management agreement provides that the Fund pays the Advisor a single, all-inclusive (or unified) management fee for providing all services necessary for the management and operation of the Fund, other than brokerage expenses, expenses attributable to short sales, taxes, interest, extraordinary expenses, fees and expenses of the Fund’s independent Directors (including their independent legal counsel), and expenses incurred in connection with the provision of shareholder services and distribution services under a plan adopted pursuant to Rule 12b-1 under the Investment Company Act. Under the unified fee structure, the Advisor is responsible for providing all investment advisory, custody, audit, administrative, compliance, recordkeeping, marketing and shareholder services, or arranging and supervising third parties to provide such services. By contrast, most other funds are charged a variety of fees, including an investment advisory fee, a transfer agency fee, an administrative fee, distribution charges, and other expenses. Other than their investment advisory fees and any applicable Rule 12b-1 distribution fees, all other components of the total fees charged by these other funds may be increased without shareholder approval. The Board believes the unified fee structure is a benefit to Fund shareholders because it clearly discloses to shareholders the cost of owning Fund shares, and, since the unified fee cannot be increased without a vote of Fund shareholders, it shifts to the Advisor the risk of increased costs of operating the Fund and provides a direct incentive to minimize administrative inefficiencies. Part of the Board’s analysis of fee levels involves reviewing certain evaluative data compiled by an independent provider comparing the Fund’s unified fee to the total expense ratios of its peers. The unified fee charged to shareholders of the Fund was below the median of the total expense ratios of the Fund’s peer expense universe. The Board concluded that the management fee paid by the Fund to the Advisor under the management agreement is reasonable in light of the services provided to the Fund.
Comparison to Fees and Services Provided to Other Clients of the Advisor. The Directors also requested and received information from the Advisor concerning the nature of the services, fees, costs, and profitability of its advisory services to advisory clients other than the Fund. They observed that these varying types of client accounts require different services and involve different regulatory and entrepreneurial risks than the management of the Fund. The Board analyzed this information and concluded that the fees charged and services provided to the Fund were reasonable by comparison.
Payments to Intermediaries. The Directors also requested and received a description of payments made to intermediaries by the Fund and the Advisor and services provided in response thereto. These payments include various payments made by the Fund or the Advisor to different types of intermediaries and recordkeepers for distribution and service activities provided for the Fund. The Board reviewed such information and received representations from the Advisor that all such payments by the Fund were made pursuant to the Fund's Rule 12b-1 Plan and that all such payments by the Advisor were made from the Advisor’s resources and reasonable profits. The Board found such payments to be reasonable in scope and purpose.
Collateral or “Fall-Out” Benefits Derived by the Advisor. The Board considered the existence of collateral benefits the Advisor may receive as a result of its relationship with the Fund. They concluded that the Advisor’s primary business is managing mutual funds and it generally does not use fund or shareholder information to generate profits in other lines of business, and therefore does not derive any significant collateral benefits from them. The Board noted that additional assets from other clients may offer the Advisor some benefit from increased leverage with service providers and counterparties. Additionally, the Advisor may receive proprietary research from broker-dealers that execute fund portfolio transactions, which the Board concluded is likely to benefit other clients of the Advisor, as well as Fund shareholders. The Board also determined that the Advisor is able to provide investment management services to certain clients other than the Fund, at least in part, due to its existing infrastructure built to serve the fund complex. The Board concluded that appropriate allocation methodologies had been employed to assign resources and the cost of those resources to these other clients and, where expressly provided, these other client assets may be included with the assets of the Fund to determine breakpoints in the management fee schedule.
Existing Relationship. The Board also considered whether there was any reason for not continuing the existing arrangement with the Advisor. In this regard, the Board was mindful of the potential disruptions of the Fund’s operations and various risks, uncertainties, and other effects that could occur as a result of a decision not to continue such relationship. In particular, the Board recognized that most shareholders have invested in the Fund on the strength of the Advisor’s industry standing and reputation and in the expectation that the Advisor will have a continuing role in providing advisory services to the Fund.
Conclusion of the Directors. As a result of this process, the Board, including all of the independent Directors, taking into account all of the factors discussed above and the information provided by the Advisor and others in connection with its review and throughout the year, determined that the management fee is fair and reasonable in light of the services provided and that the investment management agreement between the Fund and the Advisor should be renewed.
Retirement Account Information
As required by law, distributions you receive from certain retirement accounts are subject to federal income tax withholding, unless you elect not to have withholding apply*. Tax will be withheld on the total amount withdrawn even though you may be receiving amounts that are not subject to withholding, such as nondeductible contributions. In such case, excess amounts of withholding could occur. You may adjust your withholding election so that a greater or lesser amount will be withheld.
If you don’t want us to withhold on this amount, you must notify us to not withhold the federal income tax. You may notify us in writing or in certain situations by telephone or through other electronic means. For systematic withdrawals, your withholding election will remain in effect until revoked or changed by filing a new election. You have the right to revoke your election at any time and change your withholding percentage for future distributions.
Remember, even if you elect not to have income tax withheld, you are liable for paying income tax on the taxable portion of your withdrawal. If you elect not to have income tax withheld or you don’t have enough income tax withheld, you may be responsible for payment of estimated tax. You may incur penalties under the estimated tax rules if your withholding and estimated tax payments are not sufficient. You can reduce or defer the income tax on a distribution by directly or indirectly rolling such distribution over to another IRA or eligible plan. You should consult your tax advisor for additional information.
State tax will be withheld if, at the time of your distribution, your address is within one of the mandatory withholding states and you have federal income tax withheld (or as otherwise required by state law). State taxes will be withheld from your distribution in accordance with the respective state rules.
*Some 403(b), 457 and qualified retirement plan distributions may be subject to 20% mandatory withholding, as they are subject to special tax and withholding rules. Your plan administrator or plan sponsor is required to provide you with a special tax notice explaining those rules at the time you request a distribution. If applicable, federal and/or state taxes may be withheld from your distribution amount.
Proxy Voting Policies
A description of the policies that the fund's investment advisor uses in exercising the voting rights associated with the securities purchased and/or held by the fund is available without charge, upon request, by calling 1-800-345-2021. It is also available on American Century Investments’ website at americancentury.com/proxy and on the Securities and Exchange Commission’s website at sec.gov. Information regarding how the investment advisor voted proxies relating to portfolio securities during the most recent 12-month period ended June 30 is available on americancentury.com/proxy. It is also available at sec.gov.
Quarterly Portfolio Disclosure
The fund files its complete schedule of portfolio holdings with the Securities and Exchange Commission (SEC) for the first and third quarters of each fiscal year on Form N-Q or as an exhibit to its reports on Form N-PORT. The fund’s Forms N-Q and Form N-PORT reports are available on the SEC’s website at sec.gov. The fund also makes its complete schedule of portfolio holdings for the most recent quarter of its fiscal year available on its website at americancentury.com and, upon request, by calling 1-800-345-2021.
Other Tax Information
The following information is provided pursuant to provisions of the Internal Revenue Code.
The fund hereby designates up to the maximum amount allowable as qualified dividend income for the fiscal year ended October 31, 2019.
For corporate taxpayers, the fund hereby designates $83,919,008, or up to the maximum amount allowable, of ordinary income distributions paid during the fiscal year ended October 31, 2019 as qualified for the corporate dividends received deduction.
The fund hereby designates $779,001,776, or up to the maximum amount allowable, as long-term capital gain distributions (20% rate gain distributions) for the fiscal year ended October 31, 2019.
The fund hereby designates $63,243,788 as qualified short-term capital gain distributions for purposes of Internal Revenue Code Section 871 for the fiscal year ended October 31, 2019.
The fund utilized earnings and profits of $29,352,223 distributed to shareholders on redemption of shares as part of the dividends paid deduction (tax equalization).
|
| | |
| |
| | | |
| Contact Us | americancentury.com | |
| Automated Information Line | 1-800-345-8765 | |
| Investor Services Representative | 1-800-345-2021 or 816-531-5575 | |
| Investors Using Advisors | 1-800-378-9878 | |
| Business, Not-For-Profit, Employer-Sponsored Retirement Plans | 1-800-345-3533 | |
| Banks and Trust Companies, Broker-Dealers, Financial Professionals, Insurance Companies | 1-800-345-6488 | |
| Telecommunications Relay Service for the Deaf | 711 | |
| | | |
| American Century Mutual Funds, Inc. | |
| | | |
Investment Advisor: American Century Investment Management, Inc. Kansas City, Missouri | |
| | | |
| This report and the statements it contains are submitted for the general information of our shareholders. The report is not authorized for distribution to prospective investors unless preceded or accompanied by an effective prospectus. | |
| | | |
©2019 American Century Proprietary Holdings, Inc. All rights reserved.
CL-ANN-90970 1912 | |
|
| |
| | |
| | Annual Report |
| | |
| | October 31, 2019 |
| | |
| | Heritage Fund |
| | Investor Class (TWHIX) |
| | I Class (ATHIX) |
| | Y Class (ATHYX) |
| | A Class (ATHAX) |
| | C Class (AHGCX) |
| | R Class (ATHWX) |
| | R5 Class (ATHGX) |
| | R6 Class (ATHDX) |
Beginning on January 1, 2021, as permitted by regulations adopted by the Securities and Exchange Commission, paper copies of the fund’s shareholder reports like this one will no longer be sent by mail, unless you specifically request paper copies of the reports from the fund or from your financial intermediary, such as a broker-dealer or bank. Instead, the reports will be made available on a website, and you will be notified by mail each time a report is posted and provided with a website link to access the report.
If you already elected to receive shareholder reports electronically, you will not be affected by this change and you need not take any action. You may elect to receive shareholder reports and other communications from the fund or your financial intermediary electronically by calling or sending an email request to your appropriate contacts as listed on the back cover of this report.
You may elect to receive all future reports in paper free of charge. You can inform the fund or your financial intermediary that you wish to continue receiving paper copies of your shareholder reports by calling or sending an email request to your appropriate contacts as listed on the back cover of this report. Your election to receive reports in paper will apply to all funds held with the fund complex/your financial intermediary.
|
| | |
| President’s Letter | 2 |
|
| Performance | 3 |
|
| Portfolio Commentary | |
|
| Fund Characteristics | |
|
| Shareholder Fee Example | |
|
| Schedule of Investments | |
|
| Statement of Assets and Liabilities | |
|
| Statement of Operations | |
|
| Statement of Changes in Net Assets | |
|
| Notes to Financial Statements | |
|
| Financial Highlights | |
|
| Report of Independent Registered Public Accounting Firm | |
|
| Management | |
|
| Approval of Management Agreement | |
|
| Additional Information | |
|
Any opinions expressed in this report reflect those of the author as of the date of the report, and do not necessarily represent the opinions of American Century Investments® or any other person in the American Century Investments organization. Any such opinions are subject to change at any time based upon market or other conditions and American Century Investments disclaims any responsibility to update such opinions. These opinions may not be relied upon as investment advice and, because investment decisions made by American Century Investments funds are based on numerous factors, may not be relied upon as an indication of trading intent on behalf of any American Century Investments fund. Security examples are used for representational purposes only and are not intended as recommendations to purchase or sell securities. Performance information for comparative indices and securities is provided to American Century Investments by third party vendors. To the best of American Century Investments’ knowledge, such information is accurate at the time of printing.
Jonathan Thomas
Dear Investor:
Thank you for reviewing this annual report for the 12 months ended October 31, 2019. Annual reports help convey important information about fund returns, including market factors that affected performance. For additional investment and market insights, please visit americancentury.com.
Stocks, Bonds Delivered Solid Gains
U.S. and global stocks, bonds and real estate investments generally delivered strong gains for the 12-month period. Stocks and other riskier assets rebounded from a late-2018 sell-off to post robust returns for the 12 months overall. Global bonds benefited from safe-haven buying early in the period and a declining interest rate environment overall.
Fed’s Policy Pivot Improved Investor Sentiment
In the final months of 2018, mounting concerns about slowing global economic and earnings growth, tariffs and Federal Reserve (Fed) policy soured investor sentiment, driving global stocks lower. After raising rates in September 2018, the Fed hiked again in December and delivered a surprisingly bullish 2019 rate-hike outlook, which intensified the sell-off among stocks and other riskier assets. Meanwhile, the risk-off climate sparked a flight to quality, which drove U.S. and other government bond yields lower and benefited global bond returns.
A key policy pivot from the Fed helped improve equity investor sentiment beginning in early 2019. The central bank abruptly ended its rate-hike campaign and adopted a dovish tone amid weaker global growth and inflation. Additionally, investors’ worst-case fears about trade and corporate earnings generally eased, which also aided stocks and other riskier assets. At the same time, government bond yields continued to fall on moderating global growth data, muted inflation and accommodative central bank policy in the U.S., Europe and Japan. By July, concerns about global economic risks prompted the Fed to cut short-term interest rates for the first time in 10 years. The Fed followed up with additional rate cuts in September and October. This backdrop supported continued gains for fixed-income and other interest rate-sensitive assets.
Looking ahead, we expect volatility to remain a formidable factor as investors react to global growth and trade trends, central bank policy and geopolitical developments. We believe this scenario underscores the importance of using professionally managed portfolios in pursuit of investment goals. We appreciate your continued trust and confidence in us.
Sincerely,
Jonathan Thomas
President and Chief Executive Officer
American Century Investments
|
| | | | | | |
| Total Returns as of October 31, 2019 |
| | | | Average Annual Returns | |
| | Ticker Symbol | 1 year | 5 years | 10 years | Since Inception | Inception Date |
| Investor Class | TWHIX | 17.22% | 9.69% | 13.30% | — | 11/10/87 |
| Russell Midcap Growth Index | — | 18.93% | 10.91% | 14.75% | — | — |
| I Class | ATHIX | 17.50% | 9.91% | 13.54% | — | 6/16/97 |
| Y Class | ATHYX | 17.68% | — | — | 13.90% | 4/10/17 |
| A Class | ATHAX | | | | | 7/11/97 |
| No sales charge | | 16.91% | 9.41% | 13.02% | — | |
| With sales charge | | 10.17% | 8.13% | 12.36% | — | |
| C Class | AHGCX | 16.06% | 8.60% | 12.18% | — | 6/26/01 |
| R Class | ATHWX | 16.66% | 9.15% | 12.74% | — | 9/28/07 |
| R5 Class | ATHGX | 17.50% | — | — | 13.73% | 4/10/17 |
| R6 Class | ATHDX | 17.68% | 10.08% | — | 10.68% | 7/26/13 |
Average annual returns since inception are presented when ten years of performance history is not available.
Sales charges include initial sales charges and contingent deferred sales charges (CDSCs), as applicable. A Class shares have a 5.75% maximum initial sales charge and may be subject to a maximum CDSC of 1.00%. C Class shares redeemed within 12 months of purchase are subject to a maximum CDSC of 1.00%. The SEC requires that mutual funds provide performance information net of maximum sales charges in all cases where charges could be applied.
Data presented reflect past performance. Past performance is no guarantee of future results. Current performance may be higher or lower than the performance shown. Total returns for periods less than one year are not annualized. Investment return and principal value will fluctuate, and redemption value may be more or less than original cost. Data assumes reinvestment of dividends and capital gains, and none of the charts reflect the deduction of taxes that a shareholder would pay on fund distributions or the redemption of fund shares. To obtain performance data current to the most recent month end, please call 1-800-345-2021 or visit americancentury.com. For additional information about the fund, please consult the prospectus.
|
|
| Growth of $10,000 Over 10 Years |
| $10,000 investment made October 31, 2009 |
| Performance for other share classes will vary due to differences in fee structure. |
|
| |
| Value on October 31, 2019 |
| | Investor Class — $34,894 |
| |
| | Russell Midcap Growth Index — $39,619 |
| |
|
| | | | | | | |
| Total Annual Fund Operating Expenses |
| Investor Class | I Class | Y Class | A Class | C Class | R Class | R5 Class | R6 Class |
| 1.01% | 0.81% | 0.66% | 1.26% | 2.01% | 1.51% | 0.81% | 0.66% |
The total annual fund operating expenses shown is as stated in the fund’s prospectus current as of the date of this report. The prospectus may vary from the expense ratio shown elsewhere in this report because it is based on a different time period, includes acquired fund fees and expenses, and, if applicable, does not include fee waivers or expense reimbursements.
Data presented reflect past performance. Past performance is no guarantee of future results. Current performance may be higher or lower than the performance shown. Total returns for periods less than one year are not annualized. Investment return and principal value will fluctuate, and redemption value may be more or less than original cost. Data assumes reinvestment of dividends and capital gains, and none of the charts reflect the deduction of taxes that a shareholder would pay on fund distributions or the redemption of fund shares. To obtain performance data current to the most recent month end, please call 1-800-345-2021 or visit americancentury.com. For additional information about the fund, please consult the prospectus.
Portfolio Managers: Rob Brookby and Nalin Yogasundram
Performance Summary
Heritage returned 17.22%* for the 12 months ended October 31, 2019, lagging the 18.93% return of the portfolio’s benchmark, the Russell Midcap Growth Index.
U.S. stocks delivered strong returns during the reporting period. Growth stocks outperformed value stocks by a wide margin across the capitalization spectrum. Within the Russell Midcap Growth Index, most sectors posted double-digit returns, led by real estate and information technology. Energy posted a significant loss as oversupply and declining oil prices weighed on the sector.
Stock selection in the health care sector detracted from the fund’s performance relative to the benchmark. Stock choices in the consumer discretionary sector also weighed on performance. Stock selection in the information technology and financials sectors benefited relative performance.
Health Care Stocks Weighed on Performance
In the health care sector, stock decisions among health care providers and services companies detracted. The stock of veterinary care company Covetrus fell sharply after it reported disappointing quarterly results. The company failed to execute well on its spin-off from Henry Schein and its merger with Vets First Choice. We eliminated the holding. WellCare Health Plans, a managed health care provider that sells insurance in Medicare and Medicaid markets, declined on profit-taking early in 2019 after the industry had performed well in 2018. We sold our holding in the second quarter of 2019 following the announcement that it would be acquired by Centene. We added Centene to the portfolio at that time.
Other significant detractors included Concho Resources. The oil and natural gas company reported poor earnings amid lower oil prices. Concho was eliminated. Twitter was a key underperformer after it reported disappointing quarterly results late in the period and provided weaker-than-expected guidance for the next quarter.
Video game company Take-Two Interactive Software reported strong quarterly results on the launch of "Red Dead Redemption 2," but guidance disappointed. PTC, a software provider to industrial companies, was a significant detractor. Our thesis was that its software gave the company increasing exposure to the internet of things for industrials. However, PTC’s core business has been slowing because the management team lost sight of core cash flow. We eliminated our holding to invest in more attractive software companies.
Information Technology Stocks Were Top Contributors
Stock selection among IT services companies led performance in the information technology sector. FleetCor Technologies was a top contributor in the industry. FleetCor, a payments firm chiefly known as a provider of prepaid fuel cards to businesses, has benefited from key acquisitions. Booz Allen Hamilton Holding was a top contributor. The company provides IT services such as cybersecurity and cloud storage for the defense industry. Booz Allen continued to execute well and enjoyed a strong tailwind in defense spending. We think it’s a high-quality company with good cash flow. Xilinx was a top contributor. It makes semiconductor chips that help increase the speed of data centers, including cellphone signals. The company is gaining market share relative
*All fund returns referenced in this commentary are for Investor Class shares. Performance for other share classes will vary due to differences in fee structure; when Investor Class performance exceeds that of the fund’s benchmark, other share classes may not. See page 3 for returns for all share classes.
to its major competitor, Intel. Xilinx is seeing renewed demand as telecommunication operators spend on 5G, the next generation of communication standards.
Other significant contributors included Array BioPharma, a commercial-stage biotechnology company focused on developing targeted therapies to treat cancer. The company reported positive phase 3 results for a form of colorectal cancer and subsequently agreed to be acquired by Pfizer. The stock was eliminated from the portfolio as a result of the transaction. Tower company SBA Communications was a top contributor as it is benefiting from the rollout of 5G cellular. Beverage packaging company Ball outperformed on strong global demand along with cost-cutting measures. Its aerospace subsidiary also performed well.
Outlook
Our process uses a combined top-down, bottom-up fundamental framework aimed at identifying mid-cap companies producing attractive, sustainable growth. We seek to reduce unintended, nonfundamental risks and align the portfolio with fundamental, company-specific risks that we believe will be rewarded over time. As a result of this approach, our sector and industry allocations reflect where we are finding opportunities at a given time.
At the end of the period, the portfolio’s largest overweight relative to the benchmark was in the information technology sector. We have a favorable outlook for the sector. We believe that the tailwinds are numerous, are sizable and have duration, and we have investments in companies whose business model can sustainably take advantage of these themes.
Consumer discretionary was modestly overweight. We are cautious on the economic cycle and recognize the long list of concerns. However, we enjoy the benefit of a long-term investment horizon and continue to focus on our favorite thematic growth ideas, seeking to find those companies best positioned to take market share during the age of e-commerce.
The portfolio’s industrials exposure was underweight. We think that the U.S. economy is likely to slow, putting pressure on industrial companies’ earnings.
|
| |
| OCTOBER 31, 2019 | |
| Top Ten Holdings | % of net assets |
| Fiserv, Inc. | 5.4% |
| SBA Communications Corp. | 3.0% |
| FleetCor Technologies, Inc. | 2.6% |
| Encompass Health Corp. | 2.4% |
| AMETEK, Inc. | 2.4% |
| Ingersoll-Rand plc | 2.3% |
| Keysight Technologies, Inc. | 2.2% |
| Twitter, Inc. | 2.1% |
| Applied Materials, Inc. | 2.1% |
| Advanced Micro Devices, Inc. | 2.0% |
| | |
| Top Five Industries | % of net assets |
| IT Services | 11.0% |
| Software | 10.1% |
| Semiconductors and Semiconductor Equipment | 6.7% |
| Health Care Equipment and Supplies | 6.7% |
| Specialty Retail | 6.6% |
| | |
| Types of Investments in Portfolio | % of net assets |
| Common Stocks | 97.9% |
| Exchange-Traded Funds | 0.5% |
| Total Equity Exposure | 98.4% |
| Temporary Cash Investments | 1.8% |
| Temporary Cash Investments - Securities Lending Collateral | 1.2% |
| Other Assets and Liabilities | (1.4)% |
Fund shareholders may incur two types of costs: (1) transaction costs, including sales charges (loads) on purchase payments and redemption/exchange fees; and (2) ongoing costs, including management fees; distribution and service (12b-1) fees; and other fund expenses. This example is intended to help you understand your ongoing costs (in dollars) of investing in your fund and to compare these costs with the ongoing cost of investing in other mutual funds.
The example is based on an investment of $1,000 made at the beginning of the period and held for the entire period from May 1, 2019 to October 31, 2019.
Actual Expenses
The table provides information about actual account values and actual expenses for each class. You may use the information, together with the amount you invested, to estimate the expenses that you paid over the period. First, identify the share class you own. Then simply divide your account value by $1,000 (for example, an $8,600 account value divided by $1,000 = 8.6), then multiply the result by the number under the heading “Expenses Paid During Period” to estimate the expenses you paid on your account during this period.
If you hold Investor Class shares of any American Century Investments fund, or I Class shares of the American Century Diversified Bond Fund, in an American Century Investments account (i.e., not a financial intermediary or retirement plan account), American Century Investments may charge you a $12.50 semiannual account maintenance fee if the value of those shares is less than $10,000. We will redeem shares automatically in one of your accounts to pay the $12.50 fee. In determining your total eligible investment amount, we will include your investments in all personal accounts (including American Century Investments Brokerage accounts) registered under your Social Security number. Personal accounts include individual accounts, joint accounts, UGMA/UTMA accounts, personal trusts, Coverdell Education Savings Accounts and IRAs (including traditional, Roth, Rollover, SEP-, SARSEP- and SIMPLE-IRAs), and certain other retirement accounts. If you have only business, business retirement, employer-sponsored or American Century Investments Brokerage accounts, you are currently not subject to this fee. If you are subject to the Account Maintenance Fee, your account value could be reduced by the fee amount.
Hypothetical Example for Comparison Purposes
The table also provides information about hypothetical account values and hypothetical expenses based on the actual expense ratio of each class of your fund and an assumed rate of return of 5% per year before expenses, which is not the actual return of a fund’s share class. The hypothetical account values and expenses may not be used to estimate the actual ending account balance or expenses you paid for the period. You may use this information to compare the ongoing costs of investing in your fund and other funds. To do so, compare this 5% hypothetical example with the 5% hypothetical examples that appear in the shareholder reports of the other funds.
Please note that the expenses shown in the table are meant to highlight your ongoing costs only and do not reflect any transactional costs, such as sales charges (loads) or redemption/exchange fees. Therefore, the table is useful in comparing ongoing costs only, and will not help you determine the relative total costs of owning different funds. In addition, if these transactional costs were included, your costs would have been higher.
|
| | | | |
| Beginning
Account Value
5/1/19 | Ending
Account Value
10/31/19 | Expenses Paid
During Period(1)
5/1/19 - 10/31/19 |
Annualized
Expense Ratio(1) |
| Actual | | | | |
| Investor Class | $1,000 | $1,014.50 | $5.08 | 1.00% |
| I Class | $1,000 | $1,015.50 | $4.06 | 0.80% |
| Y Class | $1,000 | $1,016.20 | $3.30 | 0.65% |
| A Class | $1,000 | $1,012.90 | $6.34 | 1.25% |
| C Class | $1,000 | $1,009.00 | $10.13 | 2.00% |
| R Class | $1,000 | $1,011.90 | $7.61 | 1.50% |
| R5 Class | $1,000 | $1,015.50 | $4.06 | 0.80% |
| R6 Class | $1,000 | $1,016.20 | $3.30 | 0.65% |
| Hypothetical | | | | |
| Investor Class | $1,000 | $1,020.16 | $5.09 | 1.00% |
| I Class | $1,000 | $1,021.17 | $4.08 | 0.80% |
| Y Class | $1,000 | $1,021.93 | $3.31 | 0.65% |
| A Class | $1,000 | $1,018.90 | $6.36 | 1.25% |
| C Class | $1,000 | $1,015.12 | $10.16 | 2.00% |
| R Class | $1,000 | $1,017.64 | $7.63 | 1.50% |
| R5 Class | $1,000 | $1,021.17 | $4.08 | 0.80% |
| R6 Class | $1,000 | $1,021.93 | $3.31 | 0.65% |
| |
| (1) | Expenses are equal to the class's annualized expense ratio listed in the table above, multiplied by the average account value over the period, multiplied by 184, the number of days in the most recent fiscal half-year, divided by 365, to reflect the one-half year period. Annualized expense ratio reflects actual expenses, including any applicable fee waivers or expense reimbursements and excluding any acquired fund fees and expenses. |
OCTOBER 31, 2019
|
| | | | |
| | Shares | Value |
| COMMON STOCKS — 97.9% | | |
| Aerospace and Defense — 1.8% | | |
| L3Harris Technologies, Inc. | 391,472 | $ | 80,764,588 |
|
| Auto Components — 1.3% | | |
| Aptiv plc | 678,824 | 60,788,689 |
|
| Beverages — 2.0% | | |
| Brown-Forman Corp., Class B | 425,163 | 27,856,680 |
|
| Constellation Brands, Inc., Class A | 321,059 | 61,107,159 |
|
| | | 88,963,839 |
|
| Biotechnology — 2.3% | | |
Exact Sciences Corp.(1) | 505,800 | 44,004,600 |
|
Immunomedics, Inc.(1)(2) | 2,007,234 | 32,115,744 |
|
Sage Therapeutics, Inc.(1) | 140,112 | 19,006,193 |
|
Turning Point Therapeutice, Inc.(1) | 280,352 | 10,754,302 |
|
| | | 105,880,839 |
|
| Capital Markets — 5.1% | | |
| LPL Financial Holdings, Inc. | 1,144,341 | 92,508,526 |
|
| MSCI, Inc. | 265,477 | 62,270,285 |
|
| S&P Global, Inc. | 300,754 | 77,591,525 |
|
| | | 232,370,336 |
|
| Commercial Services and Supplies — 1.0% | | |
| Waste Management, Inc. | 401,504 | 45,052,764 |
|
| Communications Equipment — 1.5% | | |
Arista Networks, Inc.(1) | 278,988 | 68,232,095 |
|
| Construction and Engineering — 1.0% | | |
| Jacobs Engineering Group, Inc. | 486,334 | 45,511,136 |
|
| Construction Materials — 1.5% | | |
| Vulcan Materials Co. | 487,641 | 69,669,270 |
|
| Containers and Packaging — 1.3% | | |
| Ball Corp. | 873,382 | 61,110,538 |
|
| Distributors — 1.5% | | |
LKQ Corp.(1) | 1,953,242 | 66,390,696 |
|
| Diversified Consumer Services — 1.0% | | |
Bright Horizons Family Solutions, Inc.(1) | 295,388 | 43,871,026 |
|
| Electrical Equipment — 2.6% | | |
| AMETEK, Inc. | 1,170,259 | 107,254,238 |
|
Sensata Technologies Holding plc(1) | 220,575 | 11,291,234 |
|
| | | 118,545,472 |
|
| Electronic Equipment, Instruments and Components — 4.2% | | |
| CDW Corp. | 694,584 | 88,844,240 |
|
Keysight Technologies, Inc.(1) | 990,730 | 99,974,564 |
|
| | | 188,818,804 |
|
| Entertainment — 2.3% | | |
Live Nation Entertainment, Inc.(1) | 541,644 | 38,185,902 |
|
|
| | | | |
| | Shares | Value |
Take-Two Interactive Software, Inc.(1) | 554,220 | $ | 66,700,377 |
|
| | | 104,886,279 |
|
| Equity Real Estate Investment Trusts (REITs) — 3.0% | | |
| SBA Communications Corp. | 568,222 | 136,742,624 |
|
| Health Care Equipment and Supplies — 6.7% | | |
DexCom, Inc.(1) | 138,210 | 21,317,511 |
|
Haemonetics Corp.(1) | 560,889 | 67,716,129 |
|
Masimo Corp.(1) | 365,994 | 53,358,265 |
|
| ResMed, Inc. | 413,250 | 61,127,940 |
|
SmileDirectClub, Inc.(1) | 1,312,774 | 15,352,892 |
|
| Teleflex, Inc. | 246,520 | 85,643,513 |
|
| | | 304,516,250 |
|
| Health Care Providers and Services — 3.7% | | |
Centene Corp.(1) | 1,145,459 | 60,800,964 |
|
| Encompass Health Corp. | 1,709,742 | 109,457,683 |
|
| | | 170,258,647 |
|
| Hotels, Restaurants and Leisure — 3.2% | | |
Chipotle Mexican Grill, Inc.(1) | 74,158 | 57,706,789 |
|
| Domino's Pizza, Inc. | 67,246 | 18,265,358 |
|
Planet Fitness, Inc., Class A(1) | 1,053,760 | 67,082,362 |
|
| | | 143,054,509 |
|
| Industrial Conglomerates — 0.4% | | |
| Roper Technologies, Inc. | 53,079 | 17,885,500 |
|
| Interactive Media and Services — 2.6% | | |
Pinterest, Inc., Class A(1) | 925,250 | 23,260,785 |
|
Twitter, Inc.(1) | 3,221,510 | 96,548,655 |
|
| | | 119,809,440 |
|
| Internet and Direct Marketing Retail — 1.3% | | |
| Expedia Group, Inc. | 431,430 | 58,959,224 |
|
| IT Services — 11.0% | | |
| Booz Allen Hamilton Holding Corp. | 810,608 | 57,042,485 |
|
Fiserv, Inc.(1) | 2,327,572 | 247,048,492 |
|
FleetCor Technologies, Inc.(1) | 399,910 | 117,661,520 |
|
Square, Inc., Class A(1) | 1,288,273 | 79,138,611 |
|
| | | 500,891,108 |
|
| Life Sciences Tools and Services — 1.3% | | |
| Bruker Corp. | 1,282,491 | 57,070,849 |
|
| Machinery — 3.7% | | |
| Ingersoll-Rand plc | 807,330 | 102,442,104 |
|
| Parker-Hannifin Corp. | 355,839 | 65,292,898 |
|
| | | 167,735,002 |
|
| Personal Products — 0.8% | | |
| Shiseido Co. Ltd. | 428,800 | 35,515,854 |
|
| Pharmaceuticals — 0.7% | | |
Catalent, Inc.(1) | 654,412 | 31,837,144 |
|
| Professional Services — 3.1% | | |
IHS Markit Ltd.(1) | 893,907 | 62,591,368 |
|
|
| | | | | | |
| | Shares/Principal Amount | Value |
| Verisk Analytics, Inc. | 544,982 |
| $ | 78,858,895 |
|
| | | 141,450,263 |
|
| Road and Rail — 1.4% | | |
| J.B. Hunt Transport Services, Inc. | 554,717 |
| 65,212,530 |
|
| Semiconductors and Semiconductor Equipment — 6.7% | | |
Advanced Micro Devices, Inc.(1) | 2,729,588 |
| 92,614,921 |
|
| Applied Materials, Inc. | 1,726,304 |
| 93,669,255 |
|
| Marvell Technology Group Ltd. | 2,419,263 |
| 59,005,824 |
|
Micron Technology, Inc.(1) | 895,872 |
| 42,598,714 |
|
| Xilinx, Inc. | 198,666 |
| 18,026,953 |
|
| | | 305,915,667 |
|
| Software — 10.1% | | |
Atlassian Corp. plc, Class A(1) | 587,828 |
| 71,003,744 |
|
Cadence Design Systems, Inc.(1) | 1,137,537 |
| 74,338,043 |
|
Coupa Software, Inc.(1) | 397,776 |
| 54,690,222 |
|
Palo Alto Networks, Inc.(1) | 181,933 |
| 41,369,745 |
|
Paycom Software, Inc.(1) | 206,383 |
| 43,656,196 |
|
Proofpoint, Inc.(1) | 463,585 |
| 53,483,802 |
|
RingCentral, Inc., Class A(1) | 395,616 |
| 63,899,896 |
|
Splunk, Inc.(1) | 467,592 |
| 56,092,336 |
|
| | | 458,533,984 |
|
| Specialty Retail — 6.6% | | |
| Advance Auto Parts, Inc. | 193,843 |
| 31,495,611 |
|
Burlington Stores, Inc.(1) | 446,794 |
| 85,860,403 |
|
Five Below, Inc.(1) | 434,829 |
| 54,401,456 |
|
Floor & Decor Holdings, Inc., Class A(1) | 817,547 |
| 37,468,179 |
|
O'Reilly Automotive, Inc.(1) | 102,948 |
| 44,834,884 |
|
| Tractor Supply Co. | 468,365 |
| 44,504,042 |
|
| | | 298,564,575 |
|
| Textiles, Apparel and Luxury Goods — 1.2% | | |
Lululemon Athletica, Inc.(1) | 260,293 |
| 53,170,051 |
|
TOTAL COMMON STOCKS
(Cost $3,610,892,756) | | 4,447,979,592 |
|
| EXCHANGE-TRADED FUNDS — 0.5% | | |
SPDR S&P Oil & Gas Exploration & Production ETF(2)
(Cost $34,786,834) | 1,097,063 |
| 23,169,971 |
|
| TEMPORARY CASH INVESTMENTS — 1.8% | | |
Federal Home Loan Bank Discount Notes, 1.43%, 11/1/19(3) | $ | 60,000,000 |
| 60,000,000 |
|
| Repurchase Agreement, BMO Capital Markets Corp., (collateralized by various U.S. Treasury obligations, 1.625% - 2.25%, 3/31/21 - 5/15/26, valued at $16,007,153), in a joint trading account at 1.50%, dated 10/31/19, due 11/1/19 (Delivery value $15,674,381) | | 15,673,728 |
|
| Repurchase Agreement, Fixed Income Clearing Corp., (collateralized by various U.S. Treasury obligations, 0.625%, 1/15/26, valued at $5,337,570), at 0.65%, dated 10/31/19, due 11/1/19 (Delivery value $5,231,094) | | 5,231,000 |
|
|
| | | | |
| | Shares | Value |
| State Street Institutional U.S. Government Money Market Fund, Premier Class | 17,334 | $ | 17,334 |
|
TOTAL TEMPORARY CASH INVESTMENTS
(Cost $80,922,062) | | 80,922,062 |
|
TEMPORARY CASH INVESTMENTS - SECURITIES LENDING COLLATERAL(4) — 1.2% |
State Street Navigator Securities Lending Government Money Market Portfolio
(Cost $54,980,029) | 54,980,029 | 54,980,029 |
|
TOTAL INVESTMENT SECURITIES — 101.4%
(Cost $3,781,581,681) | | 4,607,051,654 |
|
| OTHER ASSETS AND LIABILITIES — (1.4)% | | (63,648,482 | ) |
| TOTAL NET ASSETS — 100.0% | | $ | 4,543,403,172 |
|
|
| | | | | | | | | | |
| FORWARD FOREIGN CURRENCY EXCHANGE CONTRACTS | | |
| Currency Purchased | Currency Sold | Counterparty | Settlement Date | Unrealized Appreciation
(Depreciation) |
| JPY | 96,480,000 |
| USD | 906,093 |
| Bank of America N.A. | 12/30/19 | $ | (9,245 | ) |
| USD | 31,473,192 |
| JPY | 3,374,870,400 |
| Bank of America N.A. | 12/30/19 | 101,438 |
|
| USD | 747,829 |
| JPY | 79,885,440 |
| Bank of America N.A. | 12/30/19 | 5,238 |
|
| USD | 863,262 |
| JPY | 93,006,720 |
| Bank of America N.A. | 12/30/19 | (1,300 | ) |
| | | | | | | $ | 96,131 |
|
|
| | |
| NOTES TO SCHEDULE OF INVESTMENTS |
| JPY | - | Japanese Yen |
| USD | - | United States Dollar |
| |
| (2) | Security, or a portion thereof, is on loan. At the period end, the aggregate value of securities on loan was $53,345,880. The amount of securities on loan indicated may not correspond with the securities on loan identified because securities with pending sales are in the process of recall from the brokers. |
| |
| (3) | The rate indicated is the yield to maturity at purchase. |
| |
| (4) | Investment of cash collateral from securities on loan. At the period end, the aggregate market value of the collateral held by the fund was $54,980,029. |
See Notes to Financial Statements.
|
|
| Statement of Assets and Liabilities |
|
| | | |
| OCTOBER 31, 2019 | |
| Assets | |
| Investment securities, at value (cost of $3,726,601,652) — including $53,345,880 of securities on loan | $ | 4,552,071,625 |
|
Investment made with cash collateral received for securities on loan, at value
(cost of $54,980,029) | 54,980,029 |
|
| Total investment securities, at value (cost of $3,781,581,681) | 4,607,051,654 |
|
| Receivable for investments sold | 42,664,193 |
|
| Receivable for capital shares sold | 533,927 |
|
| Unrealized appreciation on forward foreign currency exchange contracts | 106,676 |
|
| Dividends and interest receivable | 83,443 |
|
| Securities lending receivable | 8,816 |
|
| | 4,650,448,709 |
|
| | |
| Liabilities | |
| Payable for collateral received for securities on loan | 54,980,029 |
|
| Payable for investments purchased | 45,076,904 |
|
| Payable for capital shares redeemed | 3,141,563 |
|
| Unrealized depreciation on forward foreign currency exchange contracts | 10,545 |
|
| Accrued management fees | 3,732,935 |
|
| Distribution and service fees payable | 103,561 |
|
| | 107,045,537 |
|
| | |
| Net Assets | $ | 4,543,403,172 |
|
| | |
| Net Assets Consist of: | |
| Capital (par value and paid-in surplus) | $ | 3,256,837,197 |
|
| Distributable earnings | 1,286,565,975 |
|
| | $ | 4,543,403,172 |
|
|
| | | | | | |
| | Net Assets | Shares Outstanding | Net Asset Value Per Share |
| Investor Class, $0.01 Par Value |
| $3,702,698,712 |
| 170,293,413 |
| $21.74 |
| I Class, $0.01 Par Value |
| $336,242,121 |
| 14,297,386 |
| $23.52 |
| Y Class, $0.01 Par Value |
| $29,802,706 |
| 1,250,143 |
| $23.84 |
| A Class, $0.01 Par Value |
| $263,577,785 |
| 13,438,198 |
| $19.61* |
| C Class, $0.01 Par Value |
| $39,793,703 |
| 2,737,082 |
| $14.54 |
| R Class, $0.01 Par Value |
| $32,802,536 |
| 1,675,314 |
| $19.58 |
| R5 Class, $0.01 Par Value |
| $3,663,317 |
| 155,774 |
| $23.52 |
| R6 Class, $0.01 Par Value |
| $134,822,292 |
| 5,655,917 |
| $23.84 |
*Maximum offering price $20.81 (net asset value divided by 0.9425).
See Notes to Financial Statements.
|
| | | |
| YEAR ENDED OCTOBER 31, 2019 | |
| Investment Income (Loss) | |
| Income: | |
| Dividends | $ | 25,485,980 |
|
| Securities lending, net | 1,355,073 |
|
| Interest | 1,314,692 |
|
| | 28,155,745 |
|
| | |
| Expenses: | |
| Management fees | 44,026,329 |
|
| Distribution and service fees: | |
| A Class | 666,166 |
|
| C Class | 483,445 |
|
| R Class | 163,291 |
|
| Directors' fees and expenses | 139,999 |
|
| Other expenses | 6,922 |
|
| | 45,486,152 |
|
| | |
| Net investment income (loss) | (17,330,407 | ) |
| | |
| Realized and Unrealized Gain (Loss) | |
| Net realized gain (loss) on: | |
| Investment transactions | 516,479,028 |
|
| Forward foreign currency exchange contract transactions | 2,491,005 |
|
| Foreign currency translation transactions | 31,911 |
|
| | 519,001,944 |
|
| | |
| Change in net unrealized appreciation (depreciation) on: | |
| Investments | 197,275,178 |
|
| Forward foreign currency exchange contracts | (956,039 | ) |
| Translation of assets and liabilities in foreign currencies | 2,669 |
|
| | 196,321,808 |
|
| | |
| Net realized and unrealized gain (loss) | 715,323,752 |
|
| | |
| Net Increase (Decrease) in Net Assets Resulting from Operations | $ | 697,993,345 |
|
See Notes to Financial Statements.
|
|
| Statement of Changes in Net Assets |
|
| | | | | | |
| YEARS ENDED OCTOBER 31, 2019 AND OCTOBER 31, 2018 |
| Increase (Decrease) in Net Assets | October 31, 2019 | October 31, 2018 |
| Operations | | |
| Net investment income (loss) | $ | (17,330,407 | ) | $ | (15,626,848 | ) |
| Net realized gain (loss) | 519,001,944 |
| 912,258,063 |
|
| Change in net unrealized appreciation (depreciation) | 196,321,808 |
| (529,917,893 | ) |
| Net increase (decrease) in net assets resulting from operations | 697,993,345 |
| 366,713,322 |
|
| | | |
| Distributions to Shareholders | | |
| From earnings: | | |
| Investor Class | (679,904,197 | ) | (357,413,528 | ) |
| I Class | (41,064,427 | ) | (21,818,452 | ) |
| Y Class | (1,986,316 | ) | (462 | ) |
| A Class | (53,942,496 | ) | (32,633,569 | ) |
| C Class | (13,662,155 | ) | (9,874,176 | ) |
| R Class | (6,464,936 | ) | (3,686,185 | ) |
| R5 Class | (529,611 | ) | (10,800 | ) |
| R6 Class | (22,767,081 | ) | (15,306,317 | ) |
| Decrease in net assets from distributions | (820,321,219 | ) | (440,743,489 | ) |
| | | |
| Capital Share Transactions | | |
| Net increase (decrease) in net assets from capital share transactions (Note 5) | 119,035,175 |
| (392,193,297 | ) |
| | | |
| Net increase (decrease) in net assets | (3,292,699 | ) | (466,223,464 | ) |
| | | |
| Net Assets | | |
| Beginning of period | 4,546,695,871 |
| 5,012,919,335 |
|
| End of period | $ | 4,543,403,172 |
| $ | 4,546,695,871 |
|
See Notes to Financial Statements.
|
|
| Notes to Financial Statements |
OCTOBER 31, 2019
1. Organization
American Century Mutual Funds, Inc. (the corporation) is registered under the Investment Company Act of 1940, as amended (the 1940 Act), as an open-end management investment company and is organized as a Maryland corporation. Heritage Fund (the fund) is one fund in a series issued by the corporation. The fund's investment objective is to seek long-term capital growth.
The fund offers the Investor Class, I Class, Y Class, A Class, C Class, R Class, R5 Class and R6 Class. The A Class may incur an initial sales charge. The A Class and C Class may be subject to a contingent deferred sales charge.
2. Significant Accounting Policies
The following is a summary of significant accounting policies consistently followed by the fund in preparation of its financial statements. The fund is an investment company and follows accounting and reporting guidance in accordance with accounting principles generally accepted in the United States of America. This may require management to make certain estimates and assumptions at the date of the financial statements. Actual results could differ from these estimates. Management evaluated the impact of events or transactions occurring through the date the financial statements were issued that would merit recognition or disclosure.
Investment Valuations — The fund determines the fair value of its investments and computes its net asset value per share at the close of regular trading (usually 4 p.m. Eastern time) on the New York Stock Exchange (NYSE) on each day the NYSE is open. The Board of Directors has adopted valuation policies and procedures to guide the investment advisor in the fund’s investment valuation process and to provide methodologies for the oversight of the fund’s pricing function.
Equity securities that are listed or traded on a domestic securities exchange are valued at the last reported sales price or at the official closing price as provided by the exchange. Equity securities traded on foreign securities exchanges are generally valued at the closing price of such securities on the exchange where primarily traded or at the close of the NYSE, if that is earlier. If no last sales price is reported, or if local convention or regulation so provides, the mean of the latest bid and asked prices may be used. Securities traded over-the-counter are valued at the mean of the latest bid and asked prices, the last sales price, or the official closing price. Equity securities initially expressed in local currencies are translated into U.S. dollars at the mean of the appropriate currency exchange rate at the close of the NYSE as provided by an independent pricing service.
Fixed income securities are valued at the evaluated mean as provided by independent pricing services or at the mean of the most recent bid and asked prices as provided by investment dealers. U.S. Treasury and Government Agency securities are valued using market models that consider trade data, quotations from dealers and active market makers, relevant yield curve and spread data, creditworthiness, trade data or market information on comparable securities, and other relevant security specific information.
Open-end management investment companies are valued at the reported net asset value per share. Repurchase agreements are valued at cost, which approximates fair value. Forward foreign currency exchange contracts are valued at the mean of the appropriate forward exchange rate at the close of the NYSE as provided by an independent pricing service.
If the fund determines that the market price for an investment is not readily available or the valuation methods mentioned above do not reflect an investment’s fair value, such investment is valued as determined in good faith by the Board of Directors or its delegate, in accordance with policies and procedures adopted by the Board of Directors. In its determination of fair value, the fund may review several factors including, but not limited to, market information regarding the specific investment or comparable investments and correlation with other investment types, futures indices or general market indicators. Circumstances that may cause the fund to use these procedures to value an investment include, but are not limited to: an investment has been declared in default or is distressed; trading in a security has been suspended during the trading day or a security is not actively trading on its principal exchange; prices received from a regular pricing source are deemed unreliable; or there is a foreign market holiday and no trading occurred.
The fund monitors for significant events occurring after the close of an investment’s primary exchange but before the fund’s net asset value per share is determined. Significant events may include, but are not limited to: corporate announcements and transactions; governmental action and political unrest that could impact a specific investment or an investment sector; or armed conflicts, natural disasters and similar events that could affect investments in a specific country or region. The fund also monitors for significant fluctuations between domestic and foreign markets, as evidenced by the U.S. market or such other indicators that the Board of Directors, or its delegate, deems appropriate. The fund may apply a model-derived factor to the closing price of equity securities traded on foreign securities exchanges. The factor is based on observable market data as provided by an independent pricing service.
Security Transactions — Security transactions are accounted for as of the trade date. Net realized gains and losses are determined on the identified cost basis, which is also used for federal income tax purposes.
Investment Income — Dividend income less foreign taxes withheld, if any, is recorded as of the ex-dividend date. Distributions received on securities that represent a return of capital or long-term capital gain are recorded as a reduction of cost of investments and/or as a realized gain. The fund may estimate the components of distributions received that may be considered nontaxable distributions or long-term capital gain distributions for income tax purposes. Interest income is recorded on the accrual basis and includes accretion of discounts and amortization of premiums. Securities lending income is net of fees and rebates earned by the lending agent for its services.
Foreign Currency Translations — All assets and liabilities initially expressed in foreign currencies are translated into U.S. dollars at prevailing exchange rates at period end. The fund may enter into spot foreign currency exchange contracts to facilitate transactions denominated in a foreign currency. Purchases and sales of investment securities, dividend and interest income, spot foreign currency exchange contracts, and expenses are translated at the rates of exchange prevailing on the respective dates of such transactions. Net realized and unrealized foreign currency exchange gains or losses related to investment securities are a component of net realized gain (loss) on investment transactions and change in net unrealized appreciation (depreciation) on investments, respectively.
Repurchase Agreements — The fund may enter into repurchase agreements with institutions that American Century Investment Management, Inc. (ACIM) (the investment advisor) has determined are creditworthy pursuant to criteria adopted by the Board of Directors. The fund requires that the collateral, represented by securities, received in a repurchase transaction be transferred to the custodian in a manner sufficient to enable the fund to obtain those securities in the event of a default under the repurchase agreement. ACIM monitors, on a daily basis, the securities transferred to ensure the value, including accrued interest, of the securities under each repurchase agreement is equal to or greater than amounts owed to the fund under each repurchase agreement.
Joint Trading Account — Pursuant to an Exemptive Order issued by the Securities and Exchange Commission, the fund, along with certain other funds in the American Century Investments family of funds, may transfer uninvested cash balances into a joint trading account. These balances are invested in one or more repurchase agreements that are collateralized by U.S. Treasury or Agency obligations.
Segregated Assets — In accordance with the 1940 Act, the fund segregates assets on its books and records to cover certain types of investment securities and other financial instruments. ACIM monitors, on a daily basis, the securities segregated to ensure the fund designates a sufficient amount of liquid assets, marked-to-market daily. The fund may also receive assets or be required to pledge assets at the custodian bank or with a broker for collateral requirements.
Income Tax Status — It is the fund’s policy to distribute substantially all net investment income and net realized gains to shareholders and to otherwise qualify as a regulated investment company under provisions of the Internal Revenue Code. Accordingly, no provision has been made for income taxes. The fund files U.S. federal, state, local and non-U.S. tax returns as applicable. The fund's tax returns are subject to examination by the relevant taxing authority until expiration of the applicable statute of limitations, which is generally three years from the date of filing but can be longer in certain jurisdictions. At this time, management believes there are no uncertain tax positions which, based on their technical merit, would not be sustained upon examination and for which it is reasonably possible that the total amounts of unrecognized tax benefits will significantly change in the next twelve months.
Multiple Class — All shares of the fund represent an equal pro rata interest in the net assets of the class to which such shares belong, and have identical voting, dividend, liquidation and other rights and the same terms and conditions, except for class specific expenses and exclusive rights to vote on matters affecting only individual classes. Income, non-class specific expenses, and realized and unrealized capital gains and losses of the fund are allocated to each class of shares based on their relative net assets.
Distributions to Shareholders — Distributions from net investment income and net realized gains, if any, are generally declared and paid annually. The fund may elect to treat a portion of its payment to a redeeming shareholder, which represents the pro rata share of undistributed net investment income and net realized gains, as a distribution for federal income tax purposes (tax equalization).
Indemnifications — Under the corporation’s organizational documents, its officers and directors are indemnified against certain liabilities arising out of the performance of their duties to the fund. In addition, in the normal course of business, the fund enters into contracts that provide general indemnifications. The maximum exposure under these arrangements is unknown as this would involve future claims that may be made against a fund. The risk of material loss from such claims is considered by management to be remote.
Securities Lending — Securities are lent to qualified financial institutions and brokers. State Street Bank & Trust Co. serves as securities lending agent to the fund pursuant to a Securities Lending Agreement. The lending of securities exposes the fund to risks such as: the borrowers may fail to return the loaned securities, the borrowers may not be able to provide additional collateral, the fund may experience delays in recovery of the loaned securities or delays in access to collateral, or the fund may experience losses related to the investment collateral. To minimize certain risks, loan counterparties pledge collateral in the form of cash and/or securities. The lending agent has agreed to indemnify the fund in the case of default of any securities borrowed. Cash collateral received is invested in the State Street Navigator Securities Lending Government Money Market Portfolio, a money market mutual fund registered under the 1940 Act. The loans may also be secured by U.S. government securities in an amount at least equal to the market value of the securities loaned, plus accrued interest and dividends, determined on a daily basis and adjusted accordingly. By lending securities, the fund seeks to increase its net investment income through the receipt of interest and fees. Such income is reflected separately within the Statement of Operations. The value of loaned securities and related collateral outstanding at period end, if any, are shown on a gross basis within the Schedule of Investments and Statement of Assets and Liabilities.
The following table reflects a breakdown of transactions accounted for as secured borrowings, the gross obligation by the type of collateral pledged, and the remaining contractual maturity of those transactions as of October 31, 2019.
|
| | | | | | | | | | | | |
| Remaining Contractual Maturity of Agreements |
| | Overnight and
Continuous | <30 days | Between
30 & 90 days | >90 days | Total |
Securities Lending Transactions(1) | | | | |
| Common Stocks | $ | 31,101,423 |
| — |
| — |
| — |
| $ | 31,101,423 |
|
| Exchange-Traded Funds | 23,878,606 |
| — |
| — |
| — |
| 23,878,606 |
|
| Total Borrowings | $ | 54,980,029 |
| — |
| — |
| — |
| $ | 54,980,029 |
|
| Gross amount of recognized liabilities for securities lending transactions | $ | 54,980,029 |
|
| |
| (1) | Amount represents the payable for cash collateral received for securities on loan. This will generally be in the Overnight and Continuous column as the securities are typically callable on demand. |
3. Fees and Transactions with Related Parties
Certain officers and directors of the corporation are also officers and/or directors of American Century Companies, Inc. (ACC). The corporation’s investment advisor, ACIM, the corporation's distributor, American Century Investment Services, Inc. (ACIS), and the corporation’s transfer agent, American Century Services, LLC, are wholly owned, directly or indirectly, by ACC.
Management Fees — The corporation has entered into a management agreement with ACIM, under which ACIM provides the fund with investment advisory and management services in exchange for a single, unified management fee (the fee) per class. The agreement provides that all expenses of managing and operating the fund, except distribution and service fees, brokerage expenses, taxes, interest, fees and expenses of the independent directors (including legal counsel fees), and extraordinary expenses, will be paid by ACIM. The fee is computed and accrued daily based on each class's daily net assets and paid monthly in arrears. The difference in the fee among the classes is a result of their separate arrangements for non-Rule 12b-1 shareholder services. It is not the result of any difference in advisory or custodial fees or other expenses related to the management of the fund’s assets, which do not vary by class.
The annual management fee for each class is as follows:
|
| | | | | | | |
| Investor Class | I Class | Y Class | A Class | C Class | R Class | R5 Class | R6 Class |
| 1.000% | 0.800% | 0.650% | 1.000% | 1.000% | 1.000% | 0.800% | 0.650% |
Distribution and Service Fees — The Board of Directors has adopted a separate Master Distribution and Individual Shareholder Services Plan for each of the A Class, C Class and R Class (collectively the plans), pursuant to Rule 12b-1 of the 1940 Act. The plans provide that the A Class will pay ACIS an annual distribution and service fee of 0.25%. The plans provide that the C Class will pay ACIS an annual distribution and service fee of 1.00%, of which 0.25% is paid for individual shareholder services and 0.75% is paid for distribution services. The plans provide that the R Class will pay ACIS an annual distribution and service fee of 0.50%. The fees are computed and accrued daily based on each class’s daily net assets and paid monthly in arrears. The fees are used to pay financial intermediaries for distribution and individual shareholder services. Fees incurred under the plans during the period ended October 31, 2019 are detailed in the Statement of Operations.
Directors' Fees and Expenses — The Board of Directors is responsible for overseeing the investment advisor’s management and operations of the fund. The directors receive detailed information about the fund and its investment advisor regularly throughout the year, and meet at least quarterly with management of the investment advisor to review reports about fund operations. The fund’s officers do not receive compensation from the fund.
Interfund Transactions — The fund may enter into security transactions with other American Century Investments funds and other client accounts of the investment advisor, in accordance with the 1940 Act rules and procedures adopted by the Board of Directors. The rules and procedures require, among other things, that these transactions be effected at the independent current market price of the security. During the period, the interfund purchases and sales were $27,548,530 and $30,362,083, respectively. The effect of interfund transactions on the Statement of Operations was $(685,446) in net realized gain (loss) on investment transactions.
4. Investment Transactions
Purchases and sales of investment securities, excluding short-term investments, for the period ended October 31, 2019 were $3,653,864,895 and $4,337,114,396, respectively.
5. Capital Share Transactions
Transactions in shares of the fund were as follows:
|
| | | | | | | | | | |
| | Year ended
October 31, 2019 | Year ended October 31, 2018 |
| | Shares | Amount | Shares | Amount |
| Investor Class/Shares Authorized | 2,100,000,000 |
| | 1,500,000,000 |
| |
| Sold | 8,881,792 |
| $ | 183,562,881 |
| 6,961,929 |
| $ | 165,062,440 |
|
| Issued in reinvestment of distributions | 38,287,328 |
| 660,456,399 |
| 15,480,388 |
| 347,999,118 |
|
| Redeemed | (40,207,691 | ) | (832,873,931 | ) | (31,632,101 | ) | (752,714,711 | ) |
| | 6,961,429 |
| 11,145,349 |
| (9,189,784 | ) | (239,653,153 | ) |
| I Class/Shares Authorized | 175,000,000 |
| | 130,000,000 |
| |
| Sold | 8,282,472 |
| 187,142,858 |
| 3,664,494 |
| 93,875,668 |
|
| Issued in reinvestment of distributions | 2,030,579 |
| 37,809,381 |
| 825,707 |
| 19,709,623 |
|
| Redeemed | (6,042,339 | ) | (132,802,177 | ) | (4,947,833 | ) | (123,445,888 | ) |
| | 4,270,712 |
| 92,150,062 |
| (457,632 | ) | (9,860,597 | ) |
| Y Class/Shares Authorized | 30,000,000 |
| | 50,000,000 |
| |
| Sold | 879,608 |
| 20,066,401 |
| 394,524 |
| 10,250,853 |
|
| Issued in reinvestment of distributions | 88,190 |
| 1,662,380 |
| 19 |
| 462 |
|
| Redeemed | (106,938 | ) | (2,450,380 | ) | (5,479 | ) | (141,123 | ) |
| | 860,860 |
| 19,278,401 |
| 389,064 |
| 10,110,192 |
|
| A Class/Shares Authorized | 170,000,000 |
| | 340,000,000 |
| |
| Sold | 2,764,436 |
| 52,092,399 |
| 2,337,036 |
| 51,615,538 |
|
| Issued in reinvestment of distributions | 3,291,370 |
| 51,312,456 |
| 1,504,888 |
| 31,316,728 |
|
| Redeemed | (5,543,255 | ) | (103,070,801 | ) | (6,914,306 | ) | (151,442,065 | ) |
| | 512,551 |
| 334,054 |
| (3,072,382 | ) | (68,509,799 | ) |
| C Class/Shares Authorized | 70,000,000 |
| | 80,000,000 |
| |
| Sold | 219,280 |
| 2,780,542 |
| 199,537 |
| 3,490,376 |
|
| Issued in reinvestment of distributions | 1,097,917 |
| 12,768,775 |
| 551,229 |
| 9,260,642 |
|
| Redeemed | (1,930,896 | ) | (27,011,815 | ) | (2,263,296 | ) | (40,380,116 | ) |
| | (613,699 | ) | (11,462,498 | ) | (1,512,530 | ) | (27,629,098 | ) |
| R Class/Shares Authorized | 40,000,000 |
| | 40,000,000 |
| |
| Sold | 346,118 |
| 6,576,154 |
| 208,117 |
| 4,579,989 |
|
| Issued in reinvestment of distributions | 408,317 |
| 6,369,746 |
| 174,182 |
| 3,635,173 |
|
| Redeemed | (594,071 | ) | (11,067,893 | ) | (631,067 | ) | (13,783,530 | ) |
| | 160,364 |
| 1,878,007 |
| (248,768 | ) | (5,568,368 | ) |
| R5 Class/Shares Authorized | 30,000,000 |
| | 50,000,000 |
| |
| Sold | 21,011 |
| 467,950 |
| 125,913 |
| 3,201,352 |
|
| Issued in reinvestment of distributions | 28,443 |
| 529,611 |
| 452 |
| 10,800 |
|
| Redeemed | (17,479 | ) | (385,887 | ) | (7,126 | ) | (184,264 | ) |
| | 31,975 |
| 611,674 |
| 119,239 |
| 3,027,888 |
|
| R6 Class/Shares Authorized | 70,000,000 |
| | 60,000,000 |
| |
| Sold | 1,574,058 |
| 35,568,182 |
| 1,554,670 |
| 39,101,892 |
|
| Issued in reinvestment of distributions | 1,207,802 |
| 22,767,071 |
| 635,908 |
| 15,306,317 |
|
| Redeemed | (2,453,088 | ) | (53,235,127 | ) | (4,261,297 | ) | (108,518,571 | ) |
| | 328,772 |
| 5,100,126 |
| (2,070,719 | ) | (54,110,362 | ) |
| Net increase (decrease) | 12,512,964 |
| $ | 119,035,175 |
| (16,043,512 | ) | $ | (392,193,297 | ) |
6. Fair Value Measurements
The fund’s investments valuation process is based on several considerations and may use multiple inputs to determine the fair value of the investments held by the fund. In conformity with accounting principles generally accepted in the United States of America, the inputs used to determine a valuation are classified into three broad levels.
| |
| • | Level 1 valuation inputs consist of unadjusted quoted prices in an active market for identical investments. |
| |
| • | Level 2 valuation inputs consist of direct or indirect observable market data (including quoted prices for comparable investments, evaluations of subsequent market events, interest rates, prepayment speeds, credit risk, etc.). These inputs also consist of quoted prices for identical investments initially expressed in local currencies that are adjusted through translation into U.S. dollars. |
| |
| • | Level 3 valuation inputs consist of unobservable data (including a fund’s own assumptions). |
The level classification is based on the lowest level input that is significant to the fair valuation measurement. The valuation inputs are not necessarily an indication of the risks associated with investing in these securities or other financial instruments.
The following is a summary of the level classifications as of period end. The Schedule of Investments provides additional information on the fund’s portfolio holdings.
|
| | | | | | | | |
| | Level 1 | Level 2 | Level 3 |
| Assets | | | |
| Investment Securities | | | |
| Common Stocks | $ | 4,412,463,738 |
| $ | 35,515,854 |
| — |
|
| Exchange-Traded Funds | 23,169,971 |
| — |
| — |
|
| Temporary Cash Investments | 17,334 |
| 80,904,728 |
| — |
|
| Temporary Cash Investments - Securities Lending Collateral | 54,980,029 |
| — |
| — |
|
| | $ | 4,490,631,072 |
| $ | 116,420,582 |
| — |
|
| Other Financial Instruments | | | |
| Forward Foreign Currency Exchange Contracts | — |
| $ | 106,676 |
| — |
|
| | | | |
| Liabilities | | | |
| Other Financial Instruments | | | |
| Forward Foreign Currency Exchange Contracts | — |
| $ | 10,545 |
| — |
|
7. Derivative Instruments
Foreign Currency Risk — The fund is subject to foreign currency exchange rate risk in the normal course of pursuing its investment objectives. The value of foreign investments held by a fund may be significantly affected by changes in foreign currency exchange rates. The dollar value of a foreign security generally decreases when the value of the dollar rises against the foreign currency in which the security is denominated and tends to increase when the value of the dollar declines against such foreign currency. A fund may enter into forward foreign currency exchange contracts to reduce a fund's exposure to foreign currency exchange rate fluctuations. The net U.S. dollar value of foreign currency underlying all contractual commitments held by a fund and the resulting unrealized appreciation or depreciation are determined daily. Realized gain or loss is recorded upon the termination of the contract. Net realized and unrealized gains or losses occurring during the holding period of forward foreign currency exchange contracts are a component of net realized gain (loss) on forward foreign currency exchange contract transactions and change in net unrealized appreciation (depreciation) on forward foreign currency exchange contracts, respectively. A fund bears the risk of an unfavorable change in the foreign currency exchange rate underlying the forward contract. Additionally, losses, up to the fair value, may arise if the counterparties do not perform under the contract terms. The fund's average U.S. dollar exposure to foreign currency risk derivative instruments held during the period was $25,456,696.
The value of foreign currency risk derivative instruments as of October 31, 2019, is disclosed on the Statement of Assets and Liabilities as an asset of $106,676 in unrealized appreciation on forward foreign currency exchange contracts and a liability of $10,545 in unrealized depreciation on forward foreign currency exchange contracts. For the year ended October 31, 2019, the effect of foreign currency risk derivative instruments on the Statement of Operations was $2,491,005 in net realized gain (loss) on forward foreign currency exchange contract transactions and $(956,039) in change in net unrealized appreciation (depreciation) on forward foreign currency exchange contracts.
8. Risk Factors
The fund invests in common stocks of small companies. Because of this, the fund may be subject to greater risk and market fluctuations than a fund investing in larger, more established companies.
9. Federal Tax Information
The tax character of distributions paid during the years ended October 31, 2019 and October 31, 2018 were as follows:
|
| | | | | | |
| | 2019 | 2018 |
| Distributions Paid From | | |
| Ordinary income | $ | 83,304,333 |
| — |
|
| Long-term capital gains | $ | 737,016,886 |
| $ | 440,743,489 |
|
The book-basis character of distributions made during the year from net investment income or net realized gains may differ from their ultimate characterization for federal income tax purposes. These differences reflect the differing character of certain income items and net realized gains and losses for financial statement and tax purposes, and may result in reclassification among certain capital accounts on the financial statements.
As of period end, the federal tax cost of investments and the components of distributable earnings on a tax-basis were as follows:
|
| | | |
| Federal tax cost of investments | $ | 3,789,054,900 |
|
| Gross tax appreciation of investments | $ | 932,439,861 |
|
| Gross tax depreciation of investments | (114,443,107 | ) |
| Net tax appreciation (depreciation) of investments | $ | 817,996,754 |
|
| Undistributed ordinary income | — |
|
| Accumulated long-term gains | $ | 483,859,741 |
|
| Late-year ordinary loss deferral | $ | (15,290,520 | ) |
The difference between book-basis and tax-basis unrealized appreciation (depreciation) is attributable primarily to the tax deferral of losses on wash sales.
Loss deferrals represent certain qualified losses that the fund has elected to treat as having been incurred in the following fiscal year for federal income tax purposes.
|
| | | | | | | | | | | | | |
| For a Share Outstanding Throughout the Years Ended October 31 (except as noted) | | | | | |
| Per-Share Data | | | | | | Ratios and Supplemental Data | | |
| | | Income From Investment Operations: | | | | Ratio to Average Net Assets of: | | |
| | Net Asset
Value,
Beginning
of Period | Net
Investment
Income
(Loss)(1) | Net
Realized
and
Unrealized
Gain (Loss) | Total From
Investment
Operations | Distributions From Net
Realized
Gains | Net Asset
Value,
End
of Period | Total
Return(2) | Operating
Expenses | Net
Investment
Income
(Loss) | Portfolio
Turnover
Rate | Net
Assets,
End of
Period
(in thousands) |
| Investor Class | | | | | | | | | | |
| 2019 | $23.19 | (0.08) | 2.95 | 2.87 | (4.32) | $21.74 | 17.22% | 1.00% | (0.38)% | 82% |
| $3,702,699 |
|
| 2018 | $23.67 | (0.07) | 1.70 | 1.63 | (2.11) | $23.19 | 7.16% | 1.00% | (0.30)% | 85% |
| $3,787,202 |
|
| 2017 | $21.28 | (0.03) | 4.18 | 4.15 | (1.76) | $23.67 | 20.77% | 1.01% | (0.15)% | 56% |
| $4,083,669 |
|
| 2016 | $24.59 | (0.05) | (0.53) | (0.58) | (2.73) | $21.28 | (2.26)% | 1.00% | (0.21)% | 62% |
| $3,823,112 |
|
| 2015 | $26.89 | (0.11) | 1.66 | 1.55 | (3.85) | $24.59 | 7.11% | 1.00% | (0.42)% | 62% |
| $4,349,601 |
|
| I Class | | | | | | | | | | |
| 2019 | $24.66 | (0.04) | 3.22 | 3.18 | (4.32) | $23.52 | 17.50% | 0.80% | (0.18)% | 82% |
| $336,242 |
|
| 2018 | $25.00 | (0.03) | 1.80 | 1.77 | (2.11) | $24.66 | 7.35% | 0.80% | (0.10)% | 85% |
| $247,267 |
|
| 2017 | $22.34 | —(3) | 4.42 | 4.42 | (1.76) | $25.00 | 21.01% | 0.81% | 0.05% | 56% |
| $262,095 |
|
| 2016 | $25.62 | —(3) | (0.55) | (0.55) | (2.73) | $22.34 | (2.07)% | 0.80% | (0.01)% | 62% |
| $155,695 |
|
| 2015 | $27.81 | (0.06) | 1.72 | 1.66 | (3.85) | $25.62 | 7.33% | 0.80% | (0.22)% | 62% |
| $163,670 |
|
| Y Class | | | | | | | | | | |
| 2019 | $24.90 | (0.01) | 3.27 | 3.26 | (4.32) | $23.84 | 17.68% | 0.65% | (0.03)% | 82% |
| $29,803 |
|
| 2018 | $25.19 | —(3) | 1.82 | 1.82 | (2.11) | $24.90 | 7.51% | 0.65% | 0.05% | 85% |
| $9,694 |
|
2017(4) | $22.84 | 0.02 | 2.33 | 2.35 | — | $25.19 | 10.29% | 0.66%(5) | 0.12%(5) | 56%(6) |
| $6 |
|
|
| | | | | | | | | | | | | |
| For a Share Outstanding Throughout the Years Ended October 31 (except as noted) | | | | | |
| Per-Share Data | | | | | | Ratios and Supplemental Data | | |
| | | Income From Investment Operations: | | | | Ratio to Average Net Assets of: | | |
| | Net Asset
Value,
Beginning
of Period | Net
Investment
Income
(Loss)(1) | Net
Realized
and
Unrealized
Gain (Loss) | Total From
Investment
Operations | Distributions From Net
Realized
Gains | Net Asset
Value,
End
of Period | Total
Return(2) | Operating
Expenses | Net
Investment
Income
(Loss) | Portfolio
Turnover
Rate | Net
Assets,
End of
Period
(in thousands) |
| A Class | | | | | | | | | | |
| 2019 | $21.42 | (0.12) | 2.63 | 2.51 | (4.32) | $19.61 | 16.91% | 1.25% | (0.63)% | 82% |
| $263,578 |
|
| 2018 | $22.07 | (0.12) | 1.58 | 1.46 | (2.11) | $21.42 | 6.89% | 1.25% | (0.55)% | 85% |
| $276,813 |
|
| 2017 | $20.00 | (0.08) | 3.91 | 3.83 | (1.76) | $22.07 | 20.48% | 1.26% | (0.40)% | 56% |
| $353,039 |
|
| 2016 | $23.33 | (0.09) | (0.51) | (0.60) | (2.73) | $20.00 | (2.53)% | 1.25% | (0.46)% | 62% |
| $570,298 |
|
| 2015 | $25.78 | (0.16) | 1.56 | 1.40 | (3.85) | $23.33 | 6.88% | 1.25% | (0.67)% | 62% |
| $798,879 |
|
| C Class | | | | | | | | | | |
| 2019 | $17.18 | (0.19) | 1.87 | 1.68 | (4.32) | $14.54 | 16.06% | 2.00% | (1.38)% | 82% |
| $39,794 |
|
| 2018 | $18.22 | (0.23) | 1.30 | 1.07 | (2.11) | $17.18 | 6.13% | 2.00% | (1.30)% | 85% |
| $57,552 |
|
| 2017 | $16.92 | (0.19) | 3.25 | 3.06 | (1.76) | $18.22 | 19.58% | 2.01% | (1.15)% | 56% |
| $88,629 |
|
| 2016 | $20.31 | (0.21) | (0.45) | (0.66) | (2.73) | $16.92 | (3.29)% | 2.00% | (1.21)% | 62% |
| $103,292 |
|
| 2015 | $23.10 | (0.30) | 1.36 | 1.06 | (3.85) | $20.31 | 6.09% | 2.00% | (1.42)% | 62% |
| $134,096 |
|
| R Class | | | | | | | | | | |
| 2019 | $21.43 | (0.17) | 2.64 | 2.47 | (4.32) | $19.58 | 16.66% | 1.50% | (0.88)% | 82% |
| $32,803 |
|
| 2018 | $22.13 | (0.18) | 1.59 | 1.41 | (2.11) | $21.43 | 6.62% | 1.50% | (0.80)% | 85% |
| $32,464 |
|
| 2017 | $20.10 | (0.13) | 3.92 | 3.79 | (1.76) | $22.13 | 20.16% | 1.51% | (0.65)% | 56% |
| $39,033 |
|
| 2016 | $23.48 | (0.15) | (0.50) | (0.65) | (2.73) | $20.10 | (2.75)% | 1.50% | (0.71)% | 62% |
| $43,875 |
|
| 2015 | $25.97 | (0.22) | 1.58 | 1.36 | (3.85) | $23.48 | 6.60% | 1.50% | (0.92)% | 62% |
| $53,731 |
|
|
| | | | | | | | | | | | | |
| For a Share Outstanding Throughout the Years Ended October 31 (except as noted) | | | | | |
| Per-Share Data | | | | | | Ratios and Supplemental Data | | |
| | | Income From Investment Operations: | | | | Ratio to Average Net Assets of: | | |
| | Net Asset
Value,
Beginning
of Period | Net
Investment
Income
(Loss)(1) | Net
Realized
and
Unrealized
Gain (Loss) | Total From
Investment
Operations | Distributions From Net
Realized
Gains | Net Asset
Value,
End
of Period | Total
Return(2) | Operating
Expenses | Net
Investment
Income
(Loss) | Portfolio
Turnover
Rate | Net
Assets,
End of
Period
(in thousands) |
| R5 Class | | | | | | | | | | |
| 2019 | $24.66 | (0.04) | 3.22 | 3.18 | (4.32) | $23.52 | 17.50% | 0.80% | (0.18)% | 82% |
| $3,663 |
|
| 2018 | $25.00 | (0.04) | 1.81 | 1.77 | (2.11) | $24.66 | 7.35% | 0.80% | (0.10)% | 85% |
| $3,053 |
|
2017(4) | $22.69 | —(3) | 2.31 | 2.31 | — | $25.00 | 10.18% | 0.81%(5) | (0.03)%(5) | 56%(6) |
| $114 |
|
| R6 Class | | | | | | | | | | |
| 2019 | $24.90 | (0.01) | 3.27 | 3.26 | (4.32) | $23.84 | 17.68% | 0.65% | (0.03)% | 82% |
| $134,822 |
|
| 2018 | $25.19 | 0.02 | 1.80 | 1.82 | (2.11) | $24.90 | 7.51% | 0.65% | 0.05% | 85% |
| $132,651 |
|
| 2017 | $22.46 | 0.04 | 4.45 | 4.49 | (1.76) | $25.19 | 21.22% | 0.66% | 0.20% | 56% |
| $186,335 |
|
| 2016 | $25.72 | 0.03 | (0.56) | (0.53) | (2.73) | $22.46 | (1.93)% | 0.65% | 0.14% | 62% |
| $123,681 |
|
| 2015 | $27.86 | (0.02) | 1.73 | 1.71 | (3.85) | $25.72 | 7.48% | 0.65% | (0.07)% | 62% |
| $103,017 |
|
|
| | | | |
| Notes to Financial Highlights | | |
| |
| (1) | Computed using average shares outstanding throughout the period. |
| |
| (2) | Total returns are calculated based on the net asset value of the last business day and do not reflect applicable sales charges, if any. Total returns for periods less than one year are not annualized. |
| |
| (3) | Per-share amount was less than $0.005. |
| |
| (4) | April 10, 2017 (commencement of sale) through October 31, 2017. |
| |
| (6) | Portfolio turnover is calculated at the fund level. Percentage indicated was calculated for the year ended October 31, 2017. |
See Notes to Financial Statements.
|
|
| Report of Independent Registered Public Accounting Firm |
To the Shareholders and the Board of Directors of American Century Mutual Funds, Inc.:
Opinion on the Financial Statements and Financial Highlights
We have audited the accompanying statement of assets and liabilities, including the schedule of investments, of Heritage Fund, one of the funds constituting the American Century Mutual Funds, Inc. (the "Fund"), as of October 31, 2019, the related statement of operations for the year then ended, the statements of changes in net assets for each of the two years in the period then ended, the financial highlights for each of the five years in the period then ended, and the related notes. In our opinion, the financial statements and financial highlights present fairly, in all material respects, the financial position of Heritage Fund of the American Century Mutual Funds, Inc. as of October 31, 2019, the results of its operations for the year then ended, the changes in its net assets for each of the two years in the period then ended, and the financial highlights for each of the five years in the period then ended, in conformity with accounting principles generally accepted in the United States of America.
Basis for Opinion
These financial statements and financial highlights are the responsibility of the Fund's management. Our responsibility is to express an opinion on the Fund’s financial statements and financial highlights based on our audits. We are a public accounting firm registered with the Public Company Accounting Oversight Board (United States) (PCAOB) and are required to be independent with respect to the Fund in accordance with the U.S. federal securities laws and the applicable rules and regulations of the Securities and Exchange Commission and the PCAOB.
We conducted our audits in accordance with the standards of the PCAOB. Those standards require that we plan and perform the audit to obtain reasonable assurance about whether the financial statements and financial highlights are free of material misstatement, whether due to error or fraud. The Fund is not required to have, nor were we engaged to perform, an audit of its internal control over financial reporting. As part of our audits we are required to obtain an understanding of internal control over financial reporting but not for the purpose of expressing an opinion on the effectiveness of the Fund’s internal control over financial reporting. Accordingly, we express no such opinion.
Our audits included performing procedures to assess the risks of material misstatement of the financial statements and financial highlights, whether due to error or fraud, and performing procedures that respond to those risks. Such procedures included examining, on a test basis, evidence regarding the amounts and disclosures in the financial statements and financial highlights. Our audits also included evaluating the accounting principles used and significant estimates made by management, as well as evaluating the overall presentation of the financial statements and financial highlights. Our procedures included confirmation of securities owned as of October 31, 2019, by correspondence with the custodian and brokers; when replies were not received from brokers, we performed other auditing procedures. We believe that our audits provide a reasonable basis for our opinion.
DELOITTE & TOUCHE LLP
Kansas City, Missouri
December 16, 2019
We have served as the auditor of one or more American Century investment companies since 1997.
The Board of Directors
The individuals listed below serve as directors of the funds. Each director will continue to serve in this capacity until death, retirement, resignation or removal from office. The board has adopted a mandatory retirement age for directors who are not “interested persons,” as that term is defined in the Investment Company Act (independent directors). Independent directors shall retire by December 31 of the year in which they reach their 75th birthday.
Mr. Thomas is an “interested person” because he currently serves as President and Chief Executive Officer of American Century Companies, Inc. (ACC), the parent company of American Century Investment Management, Inc. (ACIM or the advisor). The other directors (more than three-fourths of the total number) are independent. They are not employees, directors or officers of, and have no financial interest in, ACC or any of its wholly owned, direct or indirect, subsidiaries, including ACIM, American Century Investment Services, Inc. (ACIS) and American Century Services, LLC (ACS), and they do not have any other affiliations, positions or relationships that would cause them to be considered “interested persons” under the Investment Company Act. The directors serve in this capacity for seven (in the case of Jonathan S. Thomas, 16; and Stephen E. Yates, 8) registered investment companies in the American Century Investments family of funds.
The following table presents additional information about the directors. The mailing address for each director is 4500 Main Street, Kansas City, Missouri 64111.
|
| | | | | |
Name
(Year of Birth) | Position(s) Held with Funds | Length of Time Served | Principal Occupation(s) During Past 5 Years | Number of American Century Portfolios Overseen by Director | Other Directorships Held During Past 5 Years |
| Independent Directors |
|
|
| Thomas W. Bunn (1953) | Director | Since 2017 | Retired | 66 | SquareTwo Financial; Barings (formerly Babson Capital Funds Trust) (2013 to 2016) |
Chris H. Cheesman
(1962)
| Director | Since 2019
| Retired. Senior Vice President & Chief Audit Executive, AllianceBernstein (1999 to 2018)
| 66 | None |
Barry Fink
(1955) | Director | Since 2012 (independent since 2016) | Retired | 66 | None |
Rajesh K. Gupta
(1960)
| Director | Since 2019
| Partner Emeritus, SeaCrest Investment Management and SeaCrest Wealth Management (2019 to Present); Chief Executive Officer and Chief Investment Officer, SeaCrest Investment Management (2006 to 2019); Chief Executive Officer and Chief Investment Officer, SeaCrest Wealth Management (2008 to 2019)
| 66 | None |
|
| | | | | |
Name
(Year of Birth) | Position(s) Held with Funds | Length of Time Served | Principal Occupation(s) During Past 5 Years | Number of American Century Portfolios Overseen by Director | Other Directorships Held During Past 5 Years |
| Independent Directors |
|
|
Lynn Jenkins
(1963)
| Director | Since 2019
| United States Representative, U.S. House of Representatives (2009 to 2018) | 66 | MGP Ingredients, Inc. |
Jan M. Lewis
(1957) | Director | Since 2011 | Retired | 66 | None |
John R. Whitten
(1946) | Director | Since 2008 | Retired | 66 | Onto Innovation Inc.; Rudolph Technologies, Inc. (2006 to 2019) |
Stephen E. Yates
(1948) | Director and Chairman of the Board | Since 2012 (Chairman since 2018) | Retired | 81 | None |
| Interested Director |
|
Jonathan S. Thomas
(1963) | Director | Since 2007 | President and Chief Executive Officer, ACC (2007 to present). Also serves as Chief Executive Officer, ACS; Executive Vice President, ACIM; Director, ACC, ACIM and other ACC subsidiaries | 125 | BioMed Valley Discoveries, Inc. |
The Statement of Additional Information has additional information about the fund's directors and is available without charge, upon request, by calling 1-800-345-2021.
Officers
The following table presents certain information about the executive officers of the funds. Each officer serves as an officer for each of the 16 (in the case of Robert J. Leach, 15) investment companies in the American Century family of funds. No officer is compensated for his or her service as an officer of the funds. The listed officers are interested persons of the funds and are appointed or re-appointed on an annual basis. The mailing address for each officer listed below is 4500 Main Street, Kansas City, Missouri 64111.
|
| | |
Name
(Year of Birth) | Offices with the Funds | Principal Occupation(s) During the Past Five Years |
Patrick Bannigan
(1965) | President since 2019 | Executive Vice President and Director, ACC (2012 to present); Chief Financial Officer, Chief Accounting Officer and Treasurer, ACC (2015 to present); Chief Operating Officer, ACC (2012-2015). Also serves as President, ACS; Vice President, ACIM; Chief Financial Officer, Chief Accounting Officer and/or Director, ACIM, ACS and other ACC subsidiaries |
R. Wes Campbell
(1974) | Chief Financial Officer and Treasurer since 2018 | Investment Operations and Investment Accounting, ACS (2000 to present) |
Amy D. Shelton
(1964) | Chief Compliance Officer and Vice President since 2014 | Chief Compliance Officer, American Century funds, (2014 to present); Chief Compliance Officer, ACIM (2014 to present); Chief Compliance Officer, ACIS (2009 to present). Also serves as Vice President, ACIS |
Charles A. Etherington
(1957) | General Counsel since 2007 and Senior Vice President since 2006 | Attorney, ACC (1994 to present); Vice President, ACC (2005 to present); General Counsel, ACC (2007 to present). Also serves as General Counsel, ACIM, ACS, ACIS and other ACC subsidiaries; and Senior Vice President, ACIM and ACS |
C. Jean Wade
(1964) | Vice President since 2012 | Senior Vice President, ACS (2017 to present); Vice President, ACS (2000 to 2017)
|
Robert J. Leach
(1966) | Vice President since 2006 | Vice President, ACS (2000 to present) |
David H. Reinmiller
(1963) | Vice President since 2000 | Attorney, ACC (1994 to present). Also serves as Vice President, ACIM and ACS |
Ward D. Stauffer
(1960) | Secretary since 2005 | Attorney, ACC (2003 to present) |
|
|
| Approval of Management Agreement |
At a meeting held on June 26, 2019, the Fund’s Board of Directors (the "Board") unanimously approved the renewal of the management agreement pursuant to which American Century Investment Management, Inc. (the “Advisor”) acts as the investment advisor for the Fund. Under Section 15(c) of the Investment Company Act, contracts for investment advisory services are required to be reviewed, evaluated, and approved by a majority of a fund’s directors (the “Directors”), including a majority of the independent Directors, each year.
Prior to its consideration of the renewal of the management agreement, the Directors requested and reviewed extensive data and information compiled by the Advisor and certain independent providers of evaluation data concerning the Fund and the services provided to the Fund by the Advisor. This review was in addition to the oversight and evaluation undertaken by the Board and its committees on a continual basis and the information received was supplemental to the extensive information that the Board and its committees receive and consider throughout the year.
In connection with its consideration of the renewal of the management agreement, the Board’s review and evaluation of the services provided by the Advisor included, but was not limited to, the following:
| |
| • | the nature, extent, and quality of investment management, shareholder services, and other services provided and to be provided to the Fund; |
| |
| • | the wide range of other programs and services provided and to be provided to the Fund and its shareholders on a routine and non-routine basis; |
| |
| • | the investment performance of the Fund, including data comparing the Fund's performance to appropriate benchmarks and/or a peer group of other mutual funds with similar investment objectives and strategies; |
| |
| • | the cost of owning the Fund compared to the cost of owning similar funds; |
| |
| • | the compliance policies, procedures, and regulatory experience of the Advisor and the Fund's service providers; |
| |
| • | financial data showing the cost of services provided to the Fund, the profitability of the Fund to the Advisor, and the overall profitability of the Advisor; |
| |
| • | strategic plans of the Advisor; |
| |
| • | any economies of scale associated with the Advisor’s management of the Fund and other accounts; |
| |
| • | services provided and charges to the Advisor's other investment management clients; |
| |
| • | acquired fund fees and expenses; |
| |
| • | payments and practices in connection with financial intermediaries holding shares of the Fund and the services provided by intermediaries in connection therewith; and |
| |
| • | any collateral benefits derived by the Advisor from the management of the Fund. |
The Directors held three in-person meetings and one telephonic meeting to review and discuss the information provided. The independent Directors also reviewed responses to supplemental information requests provided by the Directors to the Advisor and held active discussions with the Advisor regarding the renewal of the management agreement. The independent Directors had the benefit of the advice of their independent counsel throughout the process.
Factors Considered
The Directors considered all of the information provided by the Advisor, the independent data providers, and independent counsel in connection with the approval. They determined that the information was sufficient for them to evaluate the management agreement for the Fund. In connection with their review, the Directors did not identify any single factor as being all-important or
controlling, and each Director may have attributed different levels of importance to different factors. In deciding to renew the management agreement, the Board based its decision on a number of factors, including without limitation the following:
Nature, Extent and Quality of Services — Generally. Under the management agreement, the Advisor is responsible for providing or arranging for all services necessary for the operation of the Fund. The Board noted that the Advisor provides or arranges at its own expense a wide variety of services including without limitation the following:
| |
| • | portfolio research and security selection |
| |
| • | daily valuation of the Fund’s portfolio |
| |
| • | shareholder servicing and transfer agency, including shareholder confirmations, recordkeeping, and communications |
| |
| • | legal services (except the independent Directors’ counsel) |
| |
| • | regulatory and portfolio compliance |
| |
| • | marketing and distribution (except amounts paid by the Fund under Rule 12b-1 plans) |
The Board noted that many of these services have expanded over time in terms of both quantity and complexity in response to shareholder demands, competition in the industry, changing distribution channels, and the changing regulatory environment.
Investment Management Services. The nature of the investment management services provided to the Fund is quite complex and allows Fund shareholders access to professional money management, instant diversification of their investments within an asset class, the opportunity to easily diversify among asset classes by investing in or exchanging among various American Century Investments funds, and liquidity. In evaluating investment performance, the Board expects the Advisor to manage the Fund in accordance with its investment objectives and approved strategies. Further, the Directors recognize that the Advisor has an obligation to monitor trading activities, and in particular to seek the best execution of fund trades, and to evaluate the use of and payment for research. In providing these services, the Advisor utilizes teams of investment professionals (portfolio managers, analysts, research assistants, and securities traders) who require extensive information technology, research, training, compliance, and other systems to conduct their business. The Board, directly and through its Fund Performance Review Committee, provides oversight of the investment performance process. It regularly reviews investment performance information for the Fund, together with comparative information for appropriate benchmarks and/or peer groups of similarly-managed funds, over different time horizons. The Directors also review investment performance information during the management agreement renewal process. If performance concerns are identified, the Fund receives special reviews until performance improves, during which the Board discusses with the Advisor the reasons for such results (e.g., market conditions, security selection) and any efforts being undertaken to improve performance. The Fund’s performance was above its benchmark for the one-year period and below its benchmark for the three-, five-, and ten-year periods reviewed by the Board. The Board discussed the Fund's performance with the Advisor and was satisfied with the efforts being undertaken by the Advisor. The Board found the investment management services provided by the Advisor to the Fund to be satisfactory and consistent with the management agreement.
Shareholder and Other Services. Under the management agreement, the Advisor provides the Fund with a comprehensive package of transfer agency, shareholder, and other services. The Board, directly and through various committees of the Board, regularly reviews reports and evaluations of such services at its regular meetings. These reports include, but are not limited to, information regarding the operational efficiency and accuracy of the shareholder and transfer agency services provided, staffing levels, shareholder satisfaction, technology support (including
cyber security), new products and services offered to Fund shareholders, securities trading activities, portfolio valuation services, auditing services, and legal and operational compliance activities. The Board found the services provided by the Advisor to the Fund under the management agreement to be competitive and of high quality.
Costs of Services and Profitability. The Advisor provides detailed information concerning its cost of providing various services to the Fund, its profitability in managing the Fund (pre- and post-distribution), its overall profitability, and its financial condition. The Directors have reviewed with the Advisor the methodology used to prepare this financial information. This information is considered in evaluating the Advisor’s financial condition, its ability to continue to provide services under the management agreement, and the reasonableness of the current management fee. The Board concluded that the Advisor’s profits were reasonable in light of the services provided to the Fund.
Ethics. The Board generally considers the Advisor’s commitment to providing quality services to shareholders and to conducting its business ethically. They noted that the Advisor’s practices generally meet or exceed industry best practices.
Economies of Scale. The Board also reviewed information provided by the Advisor regarding the possible existence of economies of scale in connection with the management of the Fund. The Board concluded that economies of scale are difficult to measure and predict with precision, especially on a fund-by-fund basis. The Board concluded that the Advisor is appropriately sharing economies of scale through its competitive fee structure, offering competitive fees from fund inception, and through reinvestment in its business to provide shareholders additional content and services.
Comparison to Other Funds’ Fees. The management agreement provides that the Fund pays the Advisor a single, all-inclusive (or unified) management fee for providing all services necessary for the management and operation of the Fund, other than brokerage expenses, expenses attributable to short sales, taxes, interest, extraordinary expenses, fees and expenses of the Fund’s independent Directors (including their independent legal counsel), and expenses incurred in connection with the provision of shareholder services and distribution services under a plan adopted pursuant to Rule 12b-1 under the Investment Company Act. Under the unified fee structure, the Advisor is responsible for providing all investment advisory, custody, audit, administrative, compliance, recordkeeping, marketing and shareholder services, or arranging and supervising third parties to provide such services. By contrast, most other funds are charged a variety of fees, including an investment advisory fee, a transfer agency fee, an administrative fee, distribution charges, and other expenses. Other than their investment advisory fees and any applicable Rule 12b-1 distribution fees, all other components of the total fees charged by these other funds may be increased without shareholder approval. The Board believes the unified fee structure is a benefit to Fund shareholders because it clearly discloses to shareholders the cost of owning Fund shares, and, since the unified fee cannot be increased without a vote of Fund shareholders, it shifts to the Advisor the risk of increased costs of operating the Fund and provides a direct incentive to minimize administrative inefficiencies. Part of the Board’s analysis of fee levels involves reviewing certain evaluative data compiled by an independent provider comparing the Fund’s unified fee to the total expense ratios of its peers. The unified fee charged to shareholders of the Fund was below the median of the total expense ratios of the Fund’s peer expense universe. The Board concluded that the management fee paid by the Fund to the Advisor under the management agreement is reasonable in light of the services provided to the Fund.
Comparison to Fees and Services Provided to Other Clients of the Advisor. The Directors also requested and received information from the Advisor concerning the nature of the services, fees, costs, and profitability of its advisory services to advisory clients other than the Fund. They observed that these varying types of client accounts require different services and involve different regulatory and entrepreneurial risks than the management of the Fund. The Board analyzed this information and concluded that the fees charged and services provided to the Fund were reasonable by comparison.
Payments to Intermediaries. The Directors also requested and received a description of payments made to intermediaries by the Fund and the Advisor and services provided in response thereto. These payments include various payments made by the Fund or the Advisor to different types of intermediaries and recordkeepers for distribution and service activities provided for the Fund. The Board reviewed such information and received representations from the Advisor that all such payments by the Fund were made pursuant to the Fund's Rule 12b-1 Plan and that all such payments by the Advisor were made from the Advisor’s resources and reasonable profits. The Board found such payments to be reasonable in scope and purpose.
Collateral or “Fall-Out” Benefits Derived by the Advisor. The Board considered the existence of collateral benefits the Advisor may receive as a result of its relationship with the Fund. They concluded that the Advisor’s primary business is managing mutual funds and it generally does not use fund or shareholder information to generate profits in other lines of business, and therefore does not derive any significant collateral benefits from them. The Board noted that additional assets from other clients may offer the Advisor some benefit from increased leverage with service providers and counterparties. Additionally, the Advisor may receive proprietary research from broker-dealers that execute fund portfolio transactions, which the Board concluded is likely to benefit other clients of the Advisor, as well as Fund shareholders. The Board also determined that the Advisor is able to provide investment management services to certain clients other than the Fund, at least in part, due to its existing infrastructure built to serve the fund complex. The Board concluded that appropriate allocation methodologies had been employed to assign resources and the cost of those resources to these other clients and, where expressly provided, these other client assets may be included with the assets of the Fund to determine breakpoints in the management fee schedule.
Existing Relationship. The Board also considered whether there was any reason for not continuing the existing arrangement with the Advisor. In this regard, the Board was mindful of the potential disruptions of the Fund’s operations and various risks, uncertainties, and other effects that could occur as a result of a decision not to continue such relationship. In particular, the Board recognized that most shareholders have invested in the Fund on the strength of the Advisor’s industry standing and reputation and in the expectation that the Advisor will have a continuing role in providing advisory services to the Fund.
Conclusion of the Directors. As a result of this process, the Board, including all of the independent Directors, taking into account all of the factors discussed above and the information provided by the Advisor and others in connection with its review and throughout the year, determined that the management fee is fair and reasonable in light of the services provided and that the investment management agreement between the Fund and the Advisor should be renewed.
Retirement Account Information
As required by law, distributions you receive from certain retirement accounts are subject to federal income tax withholding, unless you elect not to have withholding apply*. Tax will be withheld on the total amount withdrawn even though you may be receiving amounts that are not subject to withholding, such as nondeductible contributions. In such case, excess amounts of withholding could occur. You may adjust your withholding election so that a greater or lesser amount will be withheld.
If you don’t want us to withhold on this amount, you must notify us to not withhold the federal income tax. You may notify us in writing or in certain situations by telephone or through other electronic means. For systematic withdrawals, your withholding election will remain in effect until revoked or changed by filing a new election. You have the right to revoke your election at any time and change your withholding percentage for future distributions.
Remember, even if you elect not to have income tax withheld, you are liable for paying income tax on the taxable portion of your withdrawal. If you elect not to have income tax withheld or you don’t have enough income tax withheld, you may be responsible for payment of estimated tax. You may incur penalties under the estimated tax rules if your withholding and estimated tax payments are not sufficient. You can reduce or defer the income tax on a distribution by directly or indirectly rolling such distribution over to another IRA or eligible plan. You should consult your tax advisor for additional information.
State tax will be withheld if, at the time of your distribution, your address is within one of the mandatory withholding states and you have federal income tax withheld (or as otherwise required by state law). State taxes will be withheld from your distribution in accordance with the respective state rules.
*Some 403(b), 457 and qualified retirement plan distributions may be subject to 20% mandatory withholding, as they are subject to special tax and withholding rules. Your plan administrator or plan sponsor is required to provide you with a special tax notice explaining those rules at the time you request a distribution. If applicable, federal and/or state taxes may be withheld from your distribution amount.
Proxy Voting Policies
A description of the policies that the fund's investment advisor uses in exercising the voting rights associated with the securities purchased and/or held by the fund is available without charge, upon request, by calling 1-800-345-2021. It is also available on American Century Investments’ website at americancentury.com/proxy and on the Securities and Exchange Commission’s website at sec.gov. Information regarding how the investment advisor voted proxies relating to portfolio securities during the most recent 12-month period ended June 30 is available on americancentury.com/proxy. It is also available at sec.gov.
Quarterly Portfolio Disclosure
The fund files its complete schedule of portfolio holdings with the Securities and Exchange Commission (SEC) for the first and third quarters of each fiscal year on Form N-Q or as an exhibit to its reports on Form N-PORT. The fund’s Forms N-Q and Form N-PORT reports are available on the SEC’s website at sec.gov. The fund also makes its complete schedule of portfolio holdings for the most recent quarter of its fiscal year available on its website at americancentury.com and, upon request, by calling 1-800-345-2021.
Other Tax Information
The following information is provided pursuant to provisions of the Internal Revenue Code.
The fund hereby designates up to the maximum amount allowable as qualified dividend income for the fiscal year ended October 31, 2019.
For corporate taxpayers, the fund hereby designates $30,691,055, or up to the maximum amount allowable, of ordinary income distributions paid during the fiscal year ended October 31, 2019 as qualified for the corporate dividends received deduction.
The fund hereby designates $774,465,885, or up to the maximum amount allowable, as long-term capital gain distributions (20% rate gain distributions) for the fiscal year ended October 31, 2019.
The fund hereby designates $83,304,333 as qualified short-term capital gain distributions for purposes of Internal Revenue Code Section 871 for the fiscal year ended October 31, 2019.
The fund utilized earnings and profits of $37,448,999 distributed to shareholders on redemption of shares as part of the dividends paid deduction (tax equalization).
|
| | |
| |
| | | |
| Contact Us | americancentury.com | |
| Automated Information Line | 1-800-345-8765 | |
| Investor Services Representative | 1-800-345-2021 or 816-531-5575 | |
| Investors Using Advisors | 1-800-378-9878 | |
| Business, Not-For-Profit, Employer-Sponsored Retirement Plans | 1-800-345-3533 | |
| Banks and Trust Companies, Broker-Dealers, Financial Professionals, Insurance Companies | 1-800-345-6488 | |
| Telecommunications Relay Service for the Deaf | 711 | |
| | | |
| American Century Mutual Funds, Inc. | |
| | | |
Investment Advisor: American Century Investment Management, Inc. Kansas City, Missouri | |
| | | |
| This report and the statements it contains are submitted for the general information of our shareholders. The report is not authorized for distribution to prospective investors unless preceded or accompanied by an effective prospectus. | |
| | | |
©2019 American Century Proprietary Holdings, Inc. All rights reserved.
CL-ANN-90977 1912 | |
|
| |
| | |
| | Annual Report |
| | |
| | October 31, 2019 |
| | |
| | NT Growth Fund |
| | G Class (ACLTX) |
Beginning on January 1, 2021, as permitted by regulations adopted by the Securities and Exchange Commission, paper copies of the fund’s shareholder reports like this one will no longer be sent by mail, unless you specifically request paper copies of the reports from the fund or from your financial intermediary, such as a broker-dealer or bank. Instead, the reports will be made available on a website, and you will be notified by mail each time a report is posted and provided with a website link to access the report.
If you already elected to receive shareholder reports electronically, you will not be affected by this change and you need not take any action. You may elect to receive shareholder reports and other communications from the fund or your financial intermediary electronically by calling or sending an email request to your appropriate contacts as listed on the back cover of this report.
You may elect to receive all future reports in paper free of charge. You can inform the fund or your financial intermediary that you wish to continue receiving paper copies of your shareholder reports by calling or sending an email request to your appropriate contacts as listed on the back cover of this report. Your election to receive reports in paper will apply to all funds held with the fund complex/your financial intermediary.
|
| |
| Performance | |
| Portfolio Commentary | |
| Fund Characteristics | |
| Shareholder Fee Example | |
| Schedule of Investments | |
| Statement of Assets and Liabilities | |
| Statement of Operations | |
| Statement of Changes in Net Assets | |
| Notes to Financial Statements | |
| Financial Highlights | |
| Report of Independent Registered Public Accounting Firm | |
| Management | |
| Approval of Management Agreement | |
| Additional Information | |
Any opinions expressed in this report reflect those of the author as of the date of the report, and do not necessarily represent the opinions of American Century Investments® or any other person in the American Century Investments organization. Any such opinions are subject to change at any time based upon market or other conditions and American Century Investments disclaims any responsibility to update such opinions. These opinions may not be relied upon as investment advice and, because investment decisions made by American Century Investments funds are based on numerous factors, may not be relied upon as an indication of trading intent on behalf of any American Century Investments fund. Security examples are used for representational purposes only and are not intended as recommendations to purchase or sell securities. Performance information for comparative indices and securities is provided to American Century Investments by third party vendors. To the best of American Century Investments’ knowledge, such information is accurate at the time of printing.
|
| | | | | |
| Total Returns as of October 31, 2019 | |
| | | | Average Annual Returns | |
| | Ticker Symbol | 1 year | 5 years | 10 years | Inception Date |
| G Class | ACLTX | 18.16% | 13.16% | 14.28% | 5/12/06 |
| Russell 1000 Growth Index | — | 17.10% | 13.42% | 15.41% | — |
Fund returns would have been lower if a portion of the fees had not been waived.
|
|
| Growth of $10,000 Over 10 Years |
| $10,000 investment made October 31, 2009 |
|
| |
| Value on October 31, 2019 |
| | G Class — $38,019 |
| |
| | Russell 1000 Growth Index — $41,938 |
| |
Ending value of G Class would have been lower if a portion of the fees had not been waived.
|
| |
| Total Annual Fund Operating Expenses |
| G Class | 0.62% |
The total annual fund operating expenses shown is as stated in the fund’s prospectus current as of the date of this report. The prospectus may vary from the expense ratio shown elsewhere in this report because it is based on a different time period, includes acquired fund fees and expenses, and, if applicable, does not include fee waivers or expense reimbursements.
Data presented reflect past performance. Past performance is no guarantee of future results. Current performance may be higher or lower than the performance shown. Total returns for periods less than one year are not annualized. Investment return and principal value will fluctuate, and redemption value may be more or less than original cost. Data assumes reinvestment of dividends and capital gains, and none of the charts reflect the deduction of taxes that a shareholder would pay on fund distributions or the redemption of fund shares. To obtain performance data current to the most recent month end, please call 1-800-345-2021 or visit americancentury.com. For additional information about the fund, please consult the prospectus.
Portfolio Managers: Gregory Woodhams and Justin Brown
Performance Summary
NT Growth returned 18.16%* for the 12 months ended October 31, 2019, outpacing the 17.10% return of the portfolio’s benchmark, the Russell 1000 Growth Index.
U.S. stocks posted solid returns during the reporting period. Growth stocks outperformed value stocks by a wide margin. Within the Russell 1000 Growth Index, all sectors posted gains except for energy, which struggled with the declining price of oil. The small real estate segment—a sector that rarely offers the kind of growth characteristics we seek—reported the top total return, but index gains were largely driven by the strong performance of information technology and consumer discretionary stocks.
Stock decisions in the information technology and consumer staples sectors benefited relative performance. Stock selection in the consumer discretionary, energy and financials sectors detracted from fund performance relative to the benchmark.
Information Technology Holdings Aided Performance
Stock choices in the semiconductors and semiconductor equipment industries benefited relative performance in the information technology sector. Semiconductor equipment company Applied Materials outperformed after reporting solid results. Semiconductor equipment company ASML Holding outperformed on strong new orders as it expands its market opportunity set into memory chip manufacturers. The Netherlands-based company’s technology allows for production of smaller and more efficient semiconductors. Chipmaker Broadcom was a top contributor. Broadcom’s acquisition of CA Technologies is viewed as driving sales going forward. In IT services, Visa aided performance as the credit card company reported earnings that beat analysts’ estimates.
Household products stocks aided performance in the consumer staples sector. The stock price of The Procter & Gamble Co. outperformed as the consumer products company posted its best organic growth in more than a decade. It also benefited from a more defensive market posture as interest rates declined.
Consumer Discretionary Stocks Led Detractors
Stock choices among textiles, apparel and luxury goods stocks weighed on relative performance in the consumer discretionary sector. We eliminated our position in Tapestry, a luxury goods holding company that reported disappointing results and provided weak guidance. Tapestry’s acquisition of Kate Spade has not worked out as management had anticipated.
Stock selection in the oil, gas and consumable fuels industry detracted. Concho Resources was a significant detractor, and we eliminated this oil and gas production company after it reported disappointing production.
Other significant detractors included XPO Logistics. We eliminated the stock of this freight and logistics company on concerns about its leveraged share buyback program. We think it’s late in the economic cycle to add debt to the balance sheet. We were also worried about increasing competition in XPO’s freight brokerage and last-mile delivery businesses. Biogen’s stock declined after the company halted trials of its Alzheimer’s drug, aducanumab, in March 2019. However, the company announced in October that a subsequent review of the data from more patients showed significant improvements in those who received high doses in one trial. As a result, the company
*Fund returns would have been lower if a portion of the fees had not been waived.
said it would submit the drug for Food and Drug Administration approval. Biogen also has the leading multiple sclerosis franchise, which has generated significant cash flow that can be invested in other clinical development programs. Health insurer UnitedHealth Group underperformed as the presidential campaign kept regulatory and pricing risk elevated. We believe the company’s use of data analytics and technology makes it well positioned to drive efficiency gains across the sector, reducing costs and improving patient outcomes.
Outlook
We believe stock selection—rather than sector allocation or market timing via the use of cash—is the most efficient means of generating superior risk-adjusted returns. As a result of this approach, the portfolio’s sector and industry selection, as well as capitalization range allocations, are primarily due to identifying what we believe to be superior individual securities.
At period-end, our largest sector allocation relative to the benchmark was communication services. Our weighting in the sector is dominated by a few large positions, including Alphabet, Facebook and The Walt Disney Co. The portfolio is modestly overweight in the consumer discretionary sector. We believe that structurally better business models and brands will have better long-term fundamental results and stock performance. We think companies with strong competitive positions and that are investing behind their businesses and have strong management teams will continue to separate themselves from the pack.
We ended the period significantly underweight in the information technology sector. The sector remains the portfolio’s largest absolute weighting, and we see upside in semiconductor capital equipment providers, given favorable secular growth and attractive valuations.
|
| |
| OCTOBER 31, 2019 | |
| Top Ten Holdings | % of net assets |
| Microsoft Corp. | 9.4% |
| Alphabet, Inc., Class A | 8.1% |
| Amazon.com, Inc. | 6.2% |
| Apple, Inc. | 5.6% |
| Visa, Inc., Class A | 5.3% |
| Facebook, Inc., Class A | 3.8% |
| PayPal Holdings, Inc. | 2.6% |
| Lockheed Martin Corp. | 2.4% |
| UnitedHealth Group, Inc. | 2.4% |
| Walt Disney Co. (The) | 2.3% |
| | |
| Top Five Industries | % of net assets |
| Interactive Media and Services | 12.3% |
| Software | 12.1% |
| IT Services | 8.6% |
| Internet and Direct Marketing Retail | 6.2% |
| Technology Hardware, Storage and Peripherals | 5.6% |
| | |
| Types of Investments in Portfolio | % of net assets |
| Common Stocks | 96.2% |
| Exchange-Traded Funds | 0.8% |
| Total Equity Exposure | 97.0% |
| Temporary Cash Investments | 0.7% |
| Temporary Cash Investments - Securities Lending Collateral | 0.4% |
| Other Assets and Liabilities | 1.9% |
Fund shareholders may incur two types of costs: (1) transaction costs, including sales charges (loads) on purchase payments and redemption/exchange fees; and (2) ongoing costs, including management fees; distribution and service (12b-1) fees; and other fund expenses. This example is intended to help you understand your ongoing costs (in dollars) of investing in your fund and to compare these costs with the ongoing cost of investing in other mutual funds.
The example is based on an investment of $1,000 made at the beginning of the period and held for the entire period from May 1, 2019 to October 31, 2019.
Actual Expenses
The table provides information about actual account values and actual expenses for each class. You may use the information, together with the amount you invested, to estimate the expenses that you paid over the period. First, identify the share class you own. Then simply divide your account value by $1,000 (for example, an $8,600 account value divided by $1,000 = 8.6), then multiply the result by the number under the heading “Expenses Paid During Period” to estimate the expenses you paid on your account during this period.
Hypothetical Example for Comparison Purposes
The table also provides information about hypothetical account values and hypothetical expenses based on the actual expense ratio of each class of your fund and an assumed rate of return of 5% per year before expenses, which is not the actual return of a fund’s share class. The hypothetical account values and expenses may not be used to estimate the actual ending account balance or expenses you paid for the period. You may use this information to compare the ongoing costs of investing in your fund and other funds. To do so, compare this 5% hypothetical example with the 5% hypothetical examples that appear in the shareholder reports of the other funds.
Please note that the expenses shown in the table are meant to highlight your ongoing costs only and do not reflect any transactional costs, such as sales charges (loads) or redemption/exchange fees. Therefore, the table is useful in comparing ongoing costs only, and will not help you determine the relative total costs of owning different funds. In addition, if these transactional costs were included, your costs would have been higher.
|
| | | | |
| Beginning
Account Value
5/1/19 | Ending
Account Value
10/31/19 | Expenses Paid
During Period(1)
5/1/19 - 10/31/19 |
Annualized
Expense Ratio(1) |
| Actual | | | | |
| G Class | $1,000 | $1,039.50 | $0.05 | 0.01% |
| Hypothetical | | | | |
| G Class | $1,000 | $1,025.16 | $0.05 | 0.01% |
| |
| (1) | Expenses are equal to the class's annualized expense ratio listed in the table above, multiplied by the average account value over the period, multiplied by 184, the number of days in the most recent fiscal half-year, divided by 365, to reflect the one-half year period. Annualized expense ratio reflects actual expenses, including any applicable fee waivers or expense reimbursements and excluding any acquired fund fees and expenses. |
OCTOBER 31, 2019
|
| | | | |
| | Shares | Value |
| COMMON STOCKS — 96.2% | | |
| Aerospace and Defense — 3.0% | | |
| Boeing Co. (The) | 20,017 | $ | 6,803,979 |
|
| Lockheed Martin Corp. | 69,081 | 26,021,431 |
|
| | | 32,825,410 |
|
| Airlines — 0.6% | | |
| Delta Air Lines, Inc. | 121,280 | 6,680,102 |
|
| Auto Components — 0.1% | | |
| Aptiv plc | 18,028 | 1,614,407 |
|
| Biotechnology — 1.7% | | |
Biogen, Inc.(1) | 22,735 | 6,791,172 |
|
Vertex Pharmaceuticals, Inc.(1) | 58,537 | 11,442,813 |
|
| | | 18,233,985 |
|
| Capital Markets — 1.1% | | |
| Charles Schwab Corp. (The) | 302,826 | 12,328,046 |
|
| Chemicals — 1.3% | | |
| Dow, Inc. | 277,521 | 14,012,035 |
|
| Communications Equipment — 0.9% | | |
Arista Networks, Inc.(1) | 42,074 | 10,290,038 |
|
| Consumer Finance — 0.6% | | |
| American Express Co. | 54,751 | 6,421,197 |
|
| Electronic Equipment, Instruments and Components — 1.1% | | |
| CDW Corp. | 89,518 | 11,450,247 |
|
| Entertainment — 3.4% | | |
Liberty Media Corp-Liberty Formula One, Class C(1) | 84,973 | 3,611,353 |
|
Take-Two Interactive Software, Inc.(1) | 61,155 | 7,360,004 |
|
| Walt Disney Co. (The) | 194,310 | 25,244,755 |
|
| | | 36,216,112 |
|
| Equity Real Estate Investment Trusts (REITs) — 3.1% | | |
| Equity Residential | 125,430 | 11,120,624 |
|
| SBA Communications Corp. | 94,108 | 22,647,090 |
|
| | | 33,767,714 |
|
| Food and Staples Retailing — 0.9% | | |
| Walmart, Inc. | 82,557 | 9,680,634 |
|
| Food Products — 0.7% | | |
Beyond Meat, Inc.(1)(2) | 22,221 | 1,876,563 |
|
| Mondelez International, Inc., Class A | 106,939 | 5,608,951 |
|
| | | 7,485,514 |
|
| Health Care Equipment and Supplies — 4.3% | | |
| Baxter International, Inc. | 215,533 | 16,531,381 |
|
Boston Scientific Corp.(1) | 320,358 | 13,358,929 |
|
Edwards Lifesciences Corp.(1) | 29,919 | 7,132,091 |
|
IDEXX Laboratories, Inc.(1) | 5,694 | 1,622,847 |
|
|
| | | | |
| | Shares | Value |
Intuitive Surgical, Inc.(1) | 14,288 | $ | 7,900,550 |
|
| | | 46,545,798 |
|
| Health Care Providers and Services — 2.7% | | |
| Quest Diagnostics, Inc. | 31,782 | 3,217,927 |
|
| UnitedHealth Group, Inc. | 101,341 | 25,608,871 |
|
| | | 28,826,798 |
|
| Hotels, Restaurants and Leisure — 4.6% | | |
Chipotle Mexican Grill, Inc.(1) | 7,487 | 5,826,084 |
|
| Darden Restaurants, Inc. | 87,394 | 9,811,724 |
|
| Domino's Pizza, Inc. | 39,411 | 10,704,816 |
|
| Las Vegas Sands Corp. | 101,563 | 6,280,656 |
|
| Royal Caribbean Cruises Ltd. | 154,917 | 16,859,617 |
|
| | | 49,482,897 |
|
| Household Products — 1.7% | | |
| Church & Dwight Co., Inc. | 97,045 | 6,787,328 |
|
| Procter & Gamble Co. (The) | 91,975 | 11,451,807 |
|
| | | 18,239,135 |
|
| Insurance — 0.6% | | |
| Progressive Corp. (The) | 93,613 | 6,524,826 |
|
| Interactive Media and Services — 12.3% | | |
Alphabet, Inc., Class A(1) | 69,335 | 87,278,898 |
|
Facebook, Inc., Class A(1) | 212,351 | 40,697,069 |
|
Twitter, Inc.(1) | 159,919 | 4,792,773 |
|
| | | 132,768,740 |
|
| Internet and Direct Marketing Retail — 6.2% | | |
Amazon.com, Inc.(1) | 37,333 | 66,328,048 |
|
| IT Services — 8.6% | | |
Fastly, Inc., Class A(1)(2) | 100,790 | 2,017,816 |
|
PayPal Holdings, Inc.(1) | 265,807 | 27,670,509 |
|
VeriSign, Inc.(1) | 27,237 | 5,175,575 |
|
| Visa, Inc., Class A | 321,817 | 57,560,188 |
|
| | | 92,424,088 |
|
| Life Sciences Tools and Services — 0.8% | | |
| Agilent Technologies, Inc. | 31,342 | 2,374,156 |
|
Illumina, Inc.(1) | 20,473 | 6,050,181 |
|
| | | 8,424,337 |
|
| Machinery — 1.5% | | |
| Cummins, Inc. | 94,643 | 16,324,025 |
|
| Multiline Retail — 0.5% | | |
| Target Corp. | 52,617 | 5,625,284 |
|
| Personal Products — 0.6% | | |
| Estee Lauder Cos., Inc. (The), Class A | 33,042 | 6,154,733 |
|
| Pharmaceuticals — 3.7% | | |
| Merck & Co., Inc. | 251,723 | 21,814,315 |
|
| Novo Nordisk A/S, B Shares | 248,735 | 13,694,906 |
|
| Zoetis, Inc. | 36,408 | 4,657,312 |
|
| | | 40,166,533 |
|
|
| | | | |
| | Shares | Value |
| Road and Rail — 2.7% | | |
Lyft, Inc., Class A(1)(2) | 86,837 | $ | 3,598,525 |
|
| Union Pacific Corp. | 151,159 | 25,010,768 |
|
| | | 28,609,293 |
|
| Semiconductors and Semiconductor Equipment — 5.5% | | |
| Analog Devices, Inc. | 91,131 | 9,717,299 |
|
| Applied Materials, Inc. | 184,721 | 10,022,961 |
|
| ASML Holding NV | 60,192 | 15,791,319 |
|
| Broadcom, Inc. | 79,964 | 23,417,457 |
|
| | | 58,949,036 |
|
| Software — 12.1% | | |
Datadog, Inc., Class A(1)(2) | 52,680 | 1,769,521 |
|
| Microsoft Corp. | 705,405 | 101,133,915 |
|
PagerDuty, Inc.(1)(2) | 160,929 | 3,699,758 |
|
Palo Alto Networks, Inc.(1) | 33,068 | 7,519,333 |
|
salesforce.com, Inc.(1) | 94,835 | 14,840,729 |
|
Zendesk, Inc.(1) | 15,699 | 1,109,134 |
|
Zoom Video Communications, Inc., Class A(1)(2) | 12,391 | 866,007 |
|
| | | 130,938,397 |
|
| Specialty Retail — 1.7% | | |
| TJX Cos., Inc. (The) | 313,146 | 18,052,867 |
|
| Technology Hardware, Storage and Peripherals — 5.6% | | |
| Apple, Inc. | 240,596 | 59,850,661 |
|
| Textiles, Apparel and Luxury Goods — 2.0% | | |
| NIKE, Inc., Class B | 237,624 | 21,279,229 |
|
TOTAL COMMON STOCKS
(Cost $605,324,499) | | 1,036,520,166 |
|
| EXCHANGE-TRADED FUNDS — 0.8% | | |
iShares Russell 1000 Growth ETF
(Cost $7,929,220) | 50,931 | 8,359,814 |
|
| TEMPORARY CASH INVESTMENTS — 0.7% | | |
| Repurchase Agreement, BMO Capital Markets Corp., (collateralized by various U.S. Treasury obligations, 1.625% - 2.25%, 3/31/21 - 5/15/26, valued at $5,077,390), in a joint trading account at 1.50%, dated 10/31/19, due 11/1/19 (Delivery value $4,971,837) | | 4,971,630 |
|
| Repurchase Agreement, Fixed Income Clearing Corp., (collateralized by various U.S. Treasury obligations, 1.625%, 9/30/26, valued at $1,692,285), at 0.65%, dated 10/31/19, due 11/1/19 (Delivery value $1,659,030) | | 1,659,000 |
|
| State Street Institutional U.S. Government Money Market Fund, Premier Class | 311,000 | 311,000 |
|
TOTAL TEMPORARY CASH INVESTMENTS
(Cost $6,941,630) | | 6,941,630 |
|
TEMPORARY CASH INVESTMENTS - SECURITIES LENDING COLLATERAL(3) — 0.4% |
State Street Navigator Securities Lending Government Money Market Portfolio
(Cost $4,748,699) | 4,748,699 | 4,748,699 |
|
TOTAL INVESTMENT SECURITIES — 98.1%
(Cost $624,944,048) | | 1,056,570,309 |
|
| OTHER ASSETS AND LIABILITIES — 1.9% | | 20,665,048 |
|
| TOTAL NET ASSETS — 100.0% | | $ | 1,077,235,357 |
|
|
| | | | | | | | | | |
| FORWARD FOREIGN CURRENCY EXCHANGE CONTRACTS | | |
| Currency Purchased | Currency Sold | Counterparty | Settlement Date | Unrealized Appreciation
(Depreciation) |
| EUR | 380,906 |
| USD | 420,104 |
| Credit Suisse AG | 12/31/19 | $ | 6,459 |
|
| EUR | 756,610 |
| USD | 835,732 |
| Credit Suisse AG | 12/31/19 | 11,568 |
|
| EUR | 547,018 |
| USD | 607,097 |
| Credit Suisse AG | 12/31/19 | 5,489 |
|
| EUR | 589,480 |
| USD | 658,868 |
| Credit Suisse AG | 12/31/19 | 1,270 |
|
| EUR | 594,907 |
| USD | 665,285 |
| Credit Suisse AG | 12/31/19 | 930 |
|
| USD | 15,193,477 |
| EUR | 13,634,263 |
| Credit Suisse AG | 12/31/19 | (75,043 | ) |
| USD | 445,932 |
| EUR | 405,238 |
| Credit Suisse AG | 12/31/19 | (7,879 | ) |
| USD | 341,541 |
| EUR | 308,137 |
| Credit Suisse AG | 12/31/19 | (3,531 | ) |
| USD | 411,459 |
| EUR | 369,765 |
| Credit Suisse AG | 12/31/19 | (2,627 | ) |
| USD | 337,310 |
| EUR | 302,778 |
| Credit Suisse AG | 12/31/19 | (1,760 | ) |
| | | | | | | $ | (65,124 | ) |
|
| | | | | | | | | | | |
| FUTURES CONTRACTS PURCHASED |
| Reference Entity | Contracts | Expiration Date | Notional
Amount | Underlying
Contract
Value | Unrealized Appreciation
(Depreciation) |
| NASDAQ 100 E-Mini | 114 | December 2019 | $ | 2,280 |
| $ | 18,445,770 |
| $ | 103,070 |
|
| S&P 500 E-Mini | 121 | December 2019 | $ | 6,050 |
| 18,366,590 |
| 88,774 |
|
| | | | | $ | 36,812,360 |
| $ | 191,844 |
|
|
| | |
| NOTES TO SCHEDULE OF INVESTMENTS |
| EUR | - | Euro |
| USD | - | United States Dollar |
| |
| (2) | Security, or a portion thereof, is on loan. At the period end, the aggregate value of securities on loan was $9,792,340. The amount of securities on loan indicated may not correspond with the securities on loan identified because securities with pending sales are in the process of recall from the brokers. |
| |
| (3) | Investment of cash collateral from securities on loan. At the period end, the aggregate market value of the collateral held by the fund was $10,032,842, which includes securities collateral of $5,284,143. |
See Notes to Financial Statements.
|
|
| Statement of Assets and Liabilities |
|
| | | |
| OCTOBER 31, 2019 | |
| Assets | |
| Investment securities, at value (cost of $620,195,349) — including $9,792,340 of securities on loan | $ | 1,051,821,610 |
|
Investment made with cash collateral received for securities on loan, at value
(cost of $4,748,699) | 4,748,699 |
|
| Total investment securities, at value (cost of $624,944,048) | 1,056,570,309 |
|
| Deposits with broker for futures contracts | 1,628,700 |
|
| Receivable for investments sold | 39,082,915 |
|
| Unrealized appreciation on forward foreign currency exchange contracts | 25,716 |
|
| Dividends and interest receivable | 237,313 |
|
| Securities lending receivable | 193,619 |
|
| | 1,097,738,572 |
|
| | |
| Liabilities | |
| Payable for collateral received for securities on loan | 4,748,699 |
|
| Payable for investments purchased | 4,802,956 |
|
| Payable for capital shares redeemed | 9,611,445 |
|
| Payable for variation margin on futures contracts | 1,249,275 |
|
| Unrealized depreciation on forward foreign currency exchange contracts | 90,840 |
|
| | 20,503,215 |
|
| | |
| Net Assets | $ | 1,077,235,357 |
|
| | |
| G Class Capital Shares, $0.01 Par Value | |
| Shares authorized | 780,000,000 |
|
| Shares outstanding | 59,328,977 |
|
| | |
| Net Asset Value Per Share | $ | 18.16 |
|
| | |
| Net Assets Consist of: | |
| Capital (par value and paid-in surplus) | $ | 531,267,242 |
|
| Distributable earnings | 545,968,115 |
|
| | $ | 1,077,235,357 |
|
See Notes to Financial Statements.
|
| | | |
| YEAR ENDED OCTOBER 31, 2019 |
| Investment Income (Loss) |
| Income: | |
| Dividends (net of foreign taxes withheld of $76,191) | $ | 12,641,384 |
|
| Securities lending, net | 476,431 |
|
| Interest | 212,545 |
|
| | 13,330,360 |
|
| | |
| Expenses: | |
| Management fees | 6,898,306 |
|
| Directors' fees and expenses | 34,157 |
|
| Other expenses | 37,827 |
|
| | 6,970,290 |
|
| Fees waived | (6,898,306 | ) |
| | 71,984 |
|
| | |
| Net investment income (loss) | 13,258,376 |
|
| | |
| Realized and Unrealized Gain (Loss) | |
| Net realized gain (loss) on: | |
| Investment transactions | 116,288,888 |
|
| Forward foreign currency exchange contract transactions | 1,197,563 |
|
| Futures contract transactions | 87,777 |
|
| Foreign currency translation transactions | 4,375 |
|
| | 117,578,603 |
|
| | |
| Change in net unrealized appreciation (depreciation) on: | |
| Investments | 56,674,521 |
|
| Forward foreign currency exchange contracts | (579,753 | ) |
| Futures contracts | 191,844 |
|
| Translation of assets and liabilities in foreign currencies | (1,070 | ) |
| | 56,285,542 |
|
| | |
| Net realized and unrealized gain (loss) | 173,864,145 |
|
| | |
| Net Increase (Decrease) in Net Assets Resulting from Operations | $ | 187,122,521 |
|
See Notes to Financial Statements.
|
|
| Statement of Changes in Net Assets |
|
| | | | | | |
| YEARS ENDED OCTOBER 31, 2019 AND OCTOBER 31, 2018 |
| Increase (Decrease) in Net Assets | October 31, 2019 | October 31, 2018 |
| Operations | | |
| Net investment income (loss) | $ | 13,258,376 |
| $ | 14,162,108 |
|
| Net realized gain (loss) | 117,578,603 |
| 190,986,275 |
|
| Change in net unrealized appreciation (depreciation) | 56,285,542 |
| (48,737,131 | ) |
| Net increase (decrease) in net assets resulting from operations | 187,122,521 |
| 156,411,252 |
|
| | | |
| Distributions to Shareholders | | |
| From earnings | (183,752,693 | ) | (126,468,050 | ) |
| | | |
| Capital Share Transactions | | |
| Proceeds from shares sold | 131,041,452 |
| 58,272,536 |
|
| Proceeds from reinvestment of distributions | 183,752,693 |
| 126,468,050 |
|
| Payments for shares redeemed | (400,315,276 | ) | (420,037,756 | ) |
| Net increase (decrease) in net assets from capital share transactions | (85,521,131 | ) | (235,297,170 | ) |
| | | |
| Net increase (decrease) in net assets | (82,151,303 | ) | (205,353,968 | ) |
| | | |
| Net Assets | | |
| Beginning of period | 1,159,386,660 |
| 1,364,740,628 |
|
| End of period | $ | 1,077,235,357 |
| $ | 1,159,386,660 |
|
| | | |
| Transactions in Shares of the Fund | | |
| Sold | 7,637,963 |
| 3,180,674 |
|
| Issued in reinvestment of distributions | 12,655,144 |
| 7,255,769 |
|
| Redeemed | (23,336,412 | ) | (22,314,863 | ) |
| Net increase (decrease) in shares of the fund | (3,043,305 | ) | (11,878,420 | ) |
See Notes to Financial Statements.
|
|
| Notes to Financial Statements |
OCTOBER 31, 2019
1. Organization
American Century Mutual Funds, Inc. (the corporation) is registered under the Investment Company Act of 1940, as amended (the 1940 Act), as an open-end management investment company and is organized as a Maryland corporation. NT Growth Fund (the fund) is one fund in a series issued by the corporation. The fund's investment objective is to seek long-term capital growth. The fund is not permitted to invest in securities issued by companies assigned the Global Industry Classification Standard or the Bloomberg Industry Classification Standard for the tobacco industry. The fund offers the G Class.
2. Significant Accounting Policies
The following is a summary of significant accounting policies consistently followed by the fund in preparation of its financial statements. The fund is an investment company and follows accounting and reporting guidance in accordance with accounting principles generally accepted in the United States of America. This may require management to make certain estimates and assumptions at the date of the financial statements. Actual results could differ from these estimates. Management evaluated the impact of events or transactions occurring through the date the financial statements were issued that would merit recognition or disclosure.
Investment Valuations — The fund determines the fair value of its investments and computes its net asset value per share at the close of regular trading (usually 4 p.m. Eastern time) on the New York Stock Exchange (NYSE) on each day the NYSE is open. The Board of Directors has adopted valuation policies and procedures to guide the investment advisor in the fund’s investment valuation process and to provide methodologies for the oversight of the fund’s pricing function.
Equity securities that are listed or traded on a domestic securities exchange are valued at the last reported sales price or at the official closing price as provided by the exchange. Equity securities traded on foreign securities exchanges are generally valued at the closing price of such securities on the exchange where primarily traded or at the close of the NYSE, if that is earlier. If no last sales price is reported, or if local convention or regulation so provides, the mean of the latest bid and asked prices may be used. Securities traded over-the-counter are valued at the mean of the latest bid and asked prices, the last sales price, or the official closing price. Equity securities initially expressed in local currencies are translated into U.S. dollars at the mean of the appropriate currency exchange rate at the close of the NYSE as provided by an independent pricing service.
Open-end management investment companies are valued at the reported net asset value per share. Repurchase agreements are valued at cost, which approximates fair value. Exchange-traded futures contracts are valued at the settlement price as provided by the appropriate exchange. Forward foreign currency exchange contracts are valued at the mean of the appropriate forward exchange rate at the close of the NYSE as provided by an independent pricing service.
If the fund determines that the market price for an investment is not readily available or the valuation methods mentioned above do not reflect an investment’s fair value, such investment is valued as determined in good faith by the Board of Directors or its delegate, in accordance with policies and procedures adopted by the Board of Directors. In its determination of fair value, the fund may review several factors including, but not limited to, market information regarding the specific investment or comparable investments and correlation with other investment types, futures indices or general market indicators. Circumstances that may cause the fund to use these procedures to value an investment include, but are not limited to: an investment has been declared in default or is distressed; trading in a security has been suspended during the trading day or a security is not actively trading on its principal exchange; prices received from a regular pricing source are deemed unreliable; or there is a foreign market holiday and no trading occurred.
The fund monitors for significant events occurring after the close of an investment’s primary exchange but before the fund’s net asset value per share is determined. Significant events may include, but are not limited to: corporate announcements and transactions; governmental action and political unrest that could impact a specific investment or an investment sector; or armed conflicts, natural disasters and similar events that could affect investments in a specific country or region. The fund also monitors for significant fluctuations between domestic and foreign markets, as evidenced by the U.S. market or such other indicators that the Board of Directors, or its delegate, deems appropriate. The fund may apply a model-derived factor to the closing price of equity securities traded on foreign securities exchanges. The factor is based on observable market data as provided by an independent pricing service.
Security Transactions — Security transactions are accounted for as of the trade date. Net realized gains and losses are determined on the identified cost basis, which is also used for federal income tax purposes.
Investment Income — Dividend income less foreign taxes withheld, if any, is recorded as of the ex-dividend date. Distributions received on securities that represent a return of capital or long-term capital gain are recorded as a reduction of cost of investments and/or as a realized gain. The fund may estimate the components of distributions received that may be considered nontaxable distributions or long-term capital gain distributions for income tax purposes. Interest income is recorded on the accrual basis and includes accretion of discounts and amortization of premiums. Securities lending income is net of fees and rebates earned by the lending agent for its services.
Foreign Currency Translations — All assets and liabilities initially expressed in foreign currencies are translated into U.S. dollars at prevailing exchange rates at period end. The fund may enter into spot foreign currency exchange contracts to facilitate transactions denominated in a foreign currency. Purchases and sales of investment securities, dividend and interest income, spot foreign currency exchange contracts, and expenses are translated at the rates of exchange prevailing on the respective dates of such transactions. Net realized and unrealized foreign currency exchange gains or losses related to investment securities are a component of net realized gain (loss) on investment transactions and change in net unrealized appreciation (depreciation) on investments, respectively.
Repurchase Agreements — The fund may enter into repurchase agreements with institutions that American Century Investment Management, Inc. (ACIM) (the investment advisor) has determined are creditworthy pursuant to criteria adopted by the Board of Directors. The fund requires that the collateral, represented by securities, received in a repurchase transaction be transferred to the custodian in a manner sufficient to enable the fund to obtain those securities in the event of a default under the repurchase agreement. ACIM monitors, on a daily basis, the securities transferred to ensure the value, including accrued interest, of the securities under each repurchase agreement is equal to or greater than amounts owed to the fund under each repurchase agreement.
Joint Trading Account — Pursuant to an Exemptive Order issued by the Securities and Exchange Commission, the fund, along with certain other funds in the American Century Investments family of funds, may transfer uninvested cash balances into a joint trading account. These balances are invested in one or more repurchase agreements that are collateralized by U.S. Treasury or Agency obligations.
Segregated Assets — In accordance with the 1940 Act, the fund segregates assets on its books and records to cover certain types of investment securities and other financial instruments. ACIM monitors, on a daily basis, the securities segregated to ensure the fund designates a sufficient amount of liquid assets, marked-to-market daily. The fund may also receive assets or be required to pledge assets at the custodian bank or with a broker for collateral requirements.
Income Tax Status — It is the fund’s policy to distribute substantially all net investment income and net realized gains to shareholders and to otherwise qualify as a regulated investment company under provisions of the Internal Revenue Code. Accordingly, no provision has been made for income taxes. The fund files U.S. federal, state, local and non-U.S. tax returns as applicable. The fund's tax returns are subject to examination by the relevant taxing authority until expiration of the applicable statute of limitations, which is generally three years from the date of filing but can be longer in certain jurisdictions. At this time, management believes there are no uncertain tax positions which, based on their technical merit, would not be sustained upon examination and for which it is reasonably possible that the total amounts of unrecognized tax benefits will significantly change in the next twelve months.
Distributions to Shareholders — Distributions from net investment income and net realized gains, if any, are generally declared and paid annually. The fund may elect to treat a portion of its payment to a redeeming shareholder, which represents the pro rata share of undistributed net investment income and net realized gains, as a distribution for federal income tax purposes (tax equalization).
Indemnifications — Under the corporation’s organizational documents, its officers and directors are indemnified against certain liabilities arising out of the performance of their duties to the fund. In addition, in the normal course of business, the fund enters into contracts that provide general indemnifications. The maximum exposure under these arrangements is unknown as this would involve future claims that may be made against a fund. The risk of material loss from such claims is considered by management to be remote.
Securities Lending — Securities are lent to qualified financial institutions and brokers. State Street Bank & Trust Co. serves as securities lending agent to the fund pursuant to a Securities Lending Agreement. The lending of securities exposes the fund to risks such as: the borrowers may fail to return the loaned securities, the borrowers may not be able to provide additional collateral, the fund may experience delays in recovery of the loaned securities or delays in access to collateral, or the fund may experience losses related to the investment collateral. To minimize certain risks, loan counterparties pledge collateral in the form of cash and/or securities. The lending agent has agreed to indemnify the fund in the case of default of any securities borrowed. Cash collateral received is invested in the State Street Navigator Securities Lending Government Money Market Portfolio, a money market mutual fund registered under the 1940 Act. The loans may also be secured by U.S. government securities in an amount at least equal to the market value of the securities loaned, plus accrued interest and dividends, determined on a daily basis and adjusted accordingly. By lending securities, the fund seeks to increase its net investment income through the receipt of interest and fees. Such income is reflected separately within the Statement of Operations. The value of loaned securities and related collateral outstanding at period end, if any, are shown on a gross basis within the Schedule of Investments and Statement of Assets and Liabilities.
The following table reflects a breakdown of transactions accounted for as secured borrowings, the gross obligation by the type of collateral pledged, and the remaining contractual maturity of those transactions as of October 31, 2019.
|
| | | | | | | | | | | | |
| Remaining Contractual Maturity of Agreements |
| | Overnight and
Continuous | <30 days | Between
30 & 90 days | >90 days | Total |
Securities Lending Transactions(1) |
| Common Stocks | $ | 4,748,699 |
| — |
| — |
| — |
| $ | 4,748,699 |
|
| Gross amount of recognized liabilities for securities lending transactions | $ | 4,748,699 |
|
| |
| (1) | Amount represents the payable for cash collateral received for securities on loan. This will generally be in the Overnight and Continuous column as the securities are typically callable on demand. |
3. Fees and Transactions with Related Parties
Certain officers and directors of the corporation are also officers and/or directors of American Century Companies, Inc. (ACC). The corporation’s investment advisor, ACIM, the corporation's distributor, American Century Investment Services, Inc., and the corporation’s transfer agent, American Century Services, LLC, are wholly owned, directly or indirectly, by ACC. Various funds issued by American Century Asset Allocation Portfolios, Inc. own, in aggregate, 100% of the shares of the fund. Related parties do not invest in the fund for the purpose of exercising management or control.
Management Fees — The corporation has entered into a management agreement with ACIM, under which ACIM provides the fund with investment advisory and management services in exchange for a single, unified management fee (the fee). The agreement provides that all expenses of managing and operating the fund, except brokerage expenses, taxes, interest, fees and expenses of the independent directors (including legal counsel fees), and extraordinary expenses, will be paid by ACIM. The fee is computed and accrued daily based on the daily net assets of the fund and paid monthly in arrears. The rate of the fee is determined by applying a fee rate calculation formula. This formula takes into account the fund’s assets as well as certain assets, if any, of other clients of the investment advisor outside the American Century Investments family of funds (such as subadvised funds and separate accounts) that use very similar investment teams and strategies (strategy assets). The strategy assets of the fund also include the assets of Growth Fund, one fund in a series issued by the corporation. The management fee schedule ranges from 0.450% to 0.640%. The investment advisor agreed to waive the fund's management fee in its entirety. The investment advisor expects this waiver to remain in effect permanently and cannot terminate it without the approval of the Board of Directors. The effective annual management fee for the period ended October 31, 2019 was 0.63% before waiver and 0.00% after waiver.
Directors' Fees and Expenses — The Board of Directors is responsible for overseeing the investment advisor’s management and operations of the fund. The directors receive detailed information about the fund and its investment advisor regularly throughout the year, and meet at least quarterly with management of the investment advisor to review reports about fund operations. The fund’s officers do not receive compensation from the fund.
Interfund Transactions — The fund may enter into security transactions with other American Century Investments funds and other client accounts of the investment advisor, in accordance with the 1940 Act rules and procedures adopted by the Board of Directors. The rules and procedures require, among other things, that these transactions be effected at the independent current market price of the security. During the period, the interfund purchases and sales were $13,943,695 and $16,249,042, respectively. The effect of interfund transactions on the Statement of Operations was $946,394 in net realized gain (loss) on investment transactions.
4. Investment Transactions
Purchases and sales of investment securities, excluding short-term investments, for the period ended October 31, 2019 were $475,119,943 and $749,646,076, respectively.
5. Fair Value Measurements
The fund’s investments valuation process is based on several considerations and may use multiple inputs to determine the fair value of the investments held by the fund. In conformity with accounting principles generally accepted in the United States of America, the inputs used to determine a valuation are classified into three broad levels.
| |
| • | Level 1 valuation inputs consist of unadjusted quoted prices in an active market for identical investments. |
| |
| • | Level 2 valuation inputs consist of direct or indirect observable market data (including quoted prices for comparable investments, evaluations of subsequent market events, interest rates, prepayment speeds, credit risk, etc.). These inputs also consist of quoted prices for identical investments initially expressed in local currencies that are adjusted through translation into U.S. dollars. |
| |
| • | Level 3 valuation inputs consist of unobservable data (including a fund’s own assumptions). |
The level classification is based on the lowest level input that is significant to the fair valuation measurement. The valuation inputs are not necessarily an indication of the risks associated with investing in these securities or other financial instruments.
The following is a summary of the level classifications as of period end. The Schedule of Investments provides additional information on the fund’s portfolio holdings.
|
| | | | | | | | |
| | Level 1 | Level 2 | Level 3 |
| Assets | | | |
| Investment Securities | | | |
| Common Stocks | $ | 1,007,033,941 |
| $ | 29,486,225 |
| — |
|
| Exchange-Traded Funds | 8,359,814 |
| — |
| — |
|
| Temporary Cash Investments | 311,000 |
| 6,630,630 |
| — |
|
| Temporary Cash Investments - Securities Lending Collateral | 4,748,699 |
| — |
| — |
|
| | $ | 1,020,453,454 |
| $ | 36,116,855 |
| — |
|
| Other Financial Instruments | | | |
| Futures Contracts | $ | 191,844 |
| — |
| — |
|
| Forward Foreign Currency Exchange Contracts | — |
| $ | 25,716 |
| — |
|
| | $ | 191,844 |
| $ | 25,716 |
| — |
|
| | | | |
| Liabilities | | | |
| Other Financial Instruments | | | |
| Forward Foreign Currency Exchange Contracts | — |
| $ | 90,840 |
| — |
|
6. Derivative Instruments
Equity Price Risk — The fund is subject to equity price risk in the normal course of pursuing its investment objectives. A fund may enter into futures contracts based on an equity index in order to manage its exposure to changes in market conditions. A fund may purchase futures contracts to gain exposure to increases in market value or sell futures contracts to protect against a decline in market value. Upon entering into a futures contract, a fund is required to deposit either cash or securities in an amount equal to a certain percentage of the contract value (initial margin). Subsequent payments (variation margin) are made or received daily, in cash, by a fund. The variation margin is equal to the daily change in the contract value and is recorded as unrealized gains and losses. A fund recognizes a realized gain or loss when the contract is closed or expires. Net realized and unrealized gains or losses occurring during the holding period of futures contracts are a component of net realized gain (loss) on futures contract transactions and change in net unrealized appreciation (depreciation) on futures contracts, respectively. One of the risks of entering into futures contracts is the possibility that the change in value of the contract may not correlate with the changes in value of the underlying securities. During the period, the fund participated in equity price risk derivative instruments for temporary investment purposes.
Foreign Currency Risk — The fund is subject to foreign currency exchange rate risk in the normal course of pursuing its investment objectives. The value of foreign investments held by a fund may be significantly affected by changes in foreign currency exchange rates. The dollar value of a foreign security generally decreases when the value of the dollar rises against the foreign currency in which the security is denominated and tends to increase when the value of the dollar declines against such foreign currency. A fund may enter into forward foreign currency exchange contracts to reduce a fund's exposure to foreign currency exchange rate fluctuations. The net U.S. dollar value of foreign currency underlying all contractual commitments held by a fund and the resulting unrealized appreciation or depreciation are determined daily. Realized gain or loss is recorded upon the termination of the contract. Net realized and unrealized gains or losses occurring during the holding period of forward foreign currency exchange contracts are a component of net realized gain (loss) on forward foreign currency exchange contract transactions and change in net unrealized appreciation (depreciation) on forward foreign currency exchange contracts, respectively. A fund bears the risk of an unfavorable change in the foreign currency exchange rate underlying the forward contract. Additionally, losses, up to the fair value, may arise if the counterparties do not perform under the contract terms. The fund's average U.S. dollar exposure to foreign currency risk derivative instruments held during the period was $16,279,623.
Value of Derivative Instruments as of October 31, 2019
|
| | | | | | | | |
| | Asset Derivatives | Liability Derivatives |
| Type of Risk Exposure | Location on Statement of Assets and Liabilities | Value | Location on Statement of Assets and Liabilities | Value |
| Equity Price Risk | Receivable for variation margin on futures contracts* | — |
| Payable for variation margin on futures contracts* | $ | 1,249,275 |
|
| Foreign Currency Risk | Unrealized appreciation on forward foreign currency exchange contracts | $ | 25,716 |
| Unrealized depreciation on forward foreign currency exchange contracts | 90,840 |
|
| | | $ | 25,716 |
| | $ | 1,340,115 |
|
| |
| * | Included in the unrealized appreciation (depreciation) on futures contracts as reported in the Schedule of Investments. |
Effect of Derivative Instruments on the Statement of Operations for the Year Ended October 31, 2019
|
| | | | | | | | |
| | Net Realized Gain (Loss) | Change in Net Unrealized Appreciation (Depreciation) |
| Type of Risk Exposure | Location on Statement of Operations | Value | Location on Statement of Operations | Value |
| Equity Price Risk | Net realized gain (loss) on futures contract transactions | $ | 87,777 |
| Change in net unrealized appreciation (depreciation) on futures contracts | $ | 191,844 |
|
| Foreign Currency Risk | Net realized gain (loss) on forward foreign currency exchange contract transactions | 1,197,563 |
| Change in net unrealized appreciation (depreciation) on forward foreign currency exchange contracts | (579,753 | ) |
| | | $ | 1,285,340 |
| | $ | (387,909 | ) |
7. Risk Factors
The fund is owned by a relatively small number of shareholders, and in the event such shareholders redeem, the ongoing operations of the fund may be at risk.
8. Federal Tax Information
The tax character of distributions paid during the years ended October 31, 2019 and October 31, 2018 were as follows:
|
| | | | | | |
| | 2019 | 2018 |
| Distributions Paid From | | |
| Ordinary income | $ | 30,194,756 |
| $ | 37,951,040 |
|
| Long-term capital gains | $ | 153,557,937 |
| $ | 88,517,010 |
|
The book-basis character of distributions made during the year from net investment income or net realized gains may differ from their ultimate characterization for federal income tax purposes. These differences reflect the differing character of certain income items and net realized gains and losses for financial statement and tax purposes, and may result in reclassification among certain capital accounts on the financial statements.
As of period end, the federal tax cost of investments and the components of distributable earnings on a tax-basis were as follows:
|
| | | |
| Federal tax cost of investments | $ | 629,752,058 |
|
| Gross tax appreciation of investments | $ | 435,135,855 |
|
| Gross tax depreciation of investments | (8,317,604 | ) |
| Net tax appreciation (depreciation) of investments | 426,818,251 |
|
| Net tax appreciation (depreciation) on derivatives and translation of assets and liabilities in foreign currencies | (1,070 | ) |
| Net tax appreciation (depreciation) | $ | 426,817,181 |
|
| Undistributed ordinary income | $ | 14,260,063 |
|
| Accumulated long-term gains | $ | 104,890,871 |
|
The difference between book-basis and tax-basis unrealized appreciation (depreciation) is attributable primarily to the tax deferral of losses on wash sales.
|
| | | | | | | | | | | | | | | | | |
| For a Share Outstanding Throughout the Years Ended October 31 (except as noted) | |
| Per-Share Data | | | | | | | | | Ratios and Supplemental Data |
| | | Income From Investment Operations: | Distributions From: | | | Ratio to Average Net Assets of: | |
| | Net Asset Value, Beginning of Period | Net Investment Income (Loss)(1) | Net Realized and Unrealized Gain (Loss) | Total From Investment Operations | Net Investment Income | Net Realized Gains | Total Distributions | Net Asset Value, End of Period | Total Return(2) | Operating Expenses | Operating
Expenses
(before
expense
waiver) | Net
Investment
Income
(Loss) | Net
Investment
Income
(Loss)
(before
expense
waiver) | Portfolio Turnover Rate | Net Assets, End of Period (in thousands) |
| G Class | | | | | | | | | | | | | | |
| 2019 | $18.59 | 0.20 | 2.41 | 2.61 | (0.22) | (2.82) | (3.04) | $18.16 | 18.16% | 0.00%(3) | 0.63% | 1.20% | 0.57% | 43% |
| $1,077,235 |
|
| 2018 | $18.38 | 0.20 | 1.80 | 2.00 | (0.13) | (1.66) | (1.79) | $18.59 | 11.50% | 0.00%(3) | 0.62% | 1.09% | 0.47% | 53% |
| $1,159,387 |
|
| 2017 | $14.62 | 0.11 | 4.00 | 4.11 | (0.12) | (0.23) | (0.35) | $18.38 | 28.64% | 0.56% | 0.74% | 0.67% | 0.49% | 64% |
| $1,364,741 |
|
| 2016 | $15.57 | 0.11 | (0.06) | 0.05 | (0.07) | (0.93) | (1.00) | $14.62 | 0.49% | 0.78% | 0.78% | 0.74% | 0.74% | 60% |
| $1,104,817 |
|
| 2015 | $16.82 | 0.08 | 1.17 | 1.25 | (0.08) | (2.42) | (2.50) | $15.57 | 8.97% | 0.77% | 0.77% | 0.52% | 0.52% | 82% |
| $1,051,077 |
|
|
|
| Notes to Financial Highlights |
| |
| (1) | Computed using average shares outstanding throughout the period. |
| |
| (2) | Total returns are calculated based on the net asset value of the last business day. Total returns for periods less than one year are not annualized. |
| |
| (3) | Ratio was less than 0.005%. |
See Notes to Financial Statements.
|
|
| Report of Independent Registered Public Accounting Firm |
To the Shareholders and the Board of Directors of American Century Mutual Funds, Inc.:
Opinion on the Financial Statements and Financial Highlights
We have audited the accompanying statement of assets and liabilities, including the schedule of investments, of NT Growth Fund, one of the funds constituting the American Century Mutual Funds, Inc. (the "Fund"), as of October 31, 2019, the related statement of operations for the year then ended, the statements of changes in net assets for each of the two years in the period then ended, the financial highlights for each of the five years in the period then ended, and the related notes. In our opinion, the financial statements and financial highlights present fairly, in all material respects, the financial position of NT Growth Fund of the American Century Mutual Funds, Inc. as of October 31, 2019, the results of its operations for the year then ended, the changes in its net assets for each of the two years in the period then ended, and the financial highlights for each of the five years in the period then ended, in conformity with accounting principles generally accepted in the United States of America.
Basis for Opinion
These financial statements and financial highlights are the responsibility of the Fund's management. Our responsibility is to express an opinion on the Fund’s financial statements and financial highlights based on our audits. We are a public accounting firm registered with the Public Company Accounting Oversight Board (United States) (PCAOB) and are required to be independent with respect to the Fund in accordance with the U.S. federal securities laws and the applicable rules and regulations of the Securities and Exchange Commission and the PCAOB.
We conducted our audits in accordance with the standards of the PCAOB. Those standards require that we plan and perform the audit to obtain reasonable assurance about whether the financial statements and financial highlights are free of material misstatement, whether due to error or fraud. The Fund is not required to have, nor were we engaged to perform, an audit of its internal control over financial reporting. As part of our audits we are required to obtain an understanding of internal control over financial reporting but not for the purpose of expressing an opinion on the effectiveness of the Fund’s internal control over financial reporting. Accordingly, we express no such opinion.
Our audits included performing procedures to assess the risks of material misstatement of the financial statements and financial highlights, whether due to error or fraud, and performing procedures that respond to those risks. Such procedures included examining, on a test basis, evidence regarding the amounts and disclosures in the financial statements and financial highlights. Our audits also included evaluating the accounting principles used and significant estimates made by management, as well as evaluating the overall presentation of the financial statements and financial highlights. Our procedures included confirmation of securities owned as of October 31, 2019, by correspondence with the custodian and brokers. We believe that our audits provide a reasonable basis for our opinion.
DELOITTE & TOUCHE LLP
Kansas City, Missouri
December 16, 2019
We have served as the auditor of one or more American Century investment companies since 1997.
The Board of Directors
The individuals listed below serve as directors of the funds. Each director will continue to serve in this capacity until death, retirement, resignation or removal from office. The board has adopted a mandatory retirement age for directors who are not “interested persons,” as that term is defined in the Investment Company Act (independent directors). Independent directors shall retire by December 31 of the year in which they reach their 75th birthday.
Mr. Thomas is an “interested person” because he currently serves as President and Chief Executive Officer of American Century Companies, Inc. (ACC), the parent company of American Century Investment Management, Inc. (ACIM or the advisor). The other directors (more than three-fourths of the total number) are independent. They are not employees, directors or officers of, and have no financial interest in, ACC or any of its wholly owned, direct or indirect, subsidiaries, including ACIM, American Century Investment Services, Inc. (ACIS) and American Century Services, LLC (ACS), and they do not have any other affiliations, positions or relationships that would cause them to be considered “interested persons” under the Investment Company Act. The directors serve in this capacity for seven (in the case of Jonathan S. Thomas, 16; and Stephen E. Yates, 8) registered investment companies in the American Century Investments family of funds.
The following table presents additional information about the directors. The mailing address for each director is 4500 Main Street, Kansas City, Missouri 64111.
|
| | | | | |
Name
(Year of Birth) | Position(s) Held with Funds | Length of Time Served | Principal Occupation(s) During Past 5 Years | Number of American Century Portfolios Overseen by Director | Other Directorships Held During Past 5 Years |
| Independent Directors |
|
|
| Thomas W. Bunn (1953) | Director | Since 2017 | Retired | 66 | SquareTwo Financial; Barings (formerly Babson Capital Funds Trust) (2013 to 2016) |
Chris H. Cheesman
(1962)
| Director | Since 2019
| Retired. Senior Vice President & Chief Audit Executive, AllianceBernstein (1999 to 2018)
| 66 | None |
Barry Fink
(1955) | Director | Since 2012 (independent since 2016) | Retired | 66 | None |
Rajesh K. Gupta
(1960)
| Director | Since 2019
| Partner Emeritus, SeaCrest Investment Management and SeaCrest Wealth Management (2019 to Present); Chief Executive Officer and Chief Investment Officer, SeaCrest Investment Management (2006 to 2019); Chief Executive Officer and Chief Investment Officer, SeaCrest Wealth Management (2008 to 2019)
| 66 | None |
|
| | | | | |
Name
(Year of Birth) | Position(s) Held with Funds | Length of Time Served | Principal Occupation(s) During Past 5 Years | Number of American Century Portfolios Overseen by Director | Other Directorships Held During Past 5 Years |
| Independent Directors |
|
|
Lynn Jenkins
(1963)
| Director | Since 2019
| United States Representative, U.S. House of Representatives (2009 to 2018) | 66 | MGP Ingredients, Inc. |
Jan M. Lewis
(1957) | Director | Since 2011 | Retired | 66 | None |
John R. Whitten
(1946) | Director | Since 2008 | Retired | 66 | Onto Innovation Inc.; Rudolph Technologies, Inc. (2006 to 2019) |
Stephen E. Yates
(1948) | Director and Chairman of the Board | Since 2012 (Chairman since 2018) | Retired | 81 | None |
| Interested Director |
|
Jonathan S. Thomas
(1963) | Director | Since 2007 | President and Chief Executive Officer, ACC (2007 to present). Also serves as Chief Executive Officer, ACS; Executive Vice President, ACIM; Director, ACC, ACIM and other ACC subsidiaries | 125 | BioMed Valley Discoveries, Inc. |
The Statement of Additional Information has additional information about the fund's directors and is available without charge, upon request, by calling 1-800-345-2021.
Officers
The following table presents certain information about the executive officers of the funds. Each officer serves as an officer for each of the 16 (in the case of Robert J. Leach, 15) investment companies in the American Century family of funds. No officer is compensated for his or her service as an officer of the funds. The listed officers are interested persons of the funds and are appointed or re-appointed on an annual basis. The mailing address for each officer listed below is 4500 Main Street, Kansas City, Missouri 64111.
|
| | |
Name
(Year of Birth) | Offices with the Funds | Principal Occupation(s) During the Past Five Years |
Patrick Bannigan
(1965) | President since 2019 | Executive Vice President and Director, ACC (2012 to present); Chief Financial Officer, Chief Accounting Officer and Treasurer, ACC (2015 to present); Chief Operating Officer, ACC (2012-2015). Also serves as President, ACS; Vice President, ACIM; Chief Financial Officer, Chief Accounting Officer and/or Director, ACIM, ACS and other ACC subsidiaries |
R. Wes Campbell
(1974) | Chief Financial Officer and Treasurer since 2018 | Investment Operations and Investment Accounting, ACS (2000 to present) |
Amy D. Shelton
(1964) | Chief Compliance Officer and Vice President since 2014 | Chief Compliance Officer, American Century funds, (2014 to present); Chief Compliance Officer, ACIM (2014 to present); Chief Compliance Officer, ACIS (2009 to present). Also serves as Vice President, ACIS |
Charles A. Etherington
(1957) | General Counsel since 2007 and Senior Vice President since 2006 | Attorney, ACC (1994 to present); Vice President, ACC (2005 to present); General Counsel, ACC (2007 to present). Also serves as General Counsel, ACIM, ACS, ACIS and other ACC subsidiaries; and Senior Vice President, ACIM and ACS |
C. Jean Wade
(1964) | Vice President since 2012 | Senior Vice President, ACS (2017 to present); Vice President, ACS (2000 to 2017)
|
Robert J. Leach
(1966) | Vice President since 2006 | Vice President, ACS (2000 to present) |
David H. Reinmiller
(1963) | Vice President since 2000 | Attorney, ACC (1994 to present). Also serves as Vice President, ACIM and ACS |
Ward D. Stauffer
(1960) | Secretary since 2005 | Attorney, ACC (2003 to present) |
|
|
| Approval of Management Agreement |
At a meeting held on June 26, 2019, the Fund’s Board of Directors (the "Board") unanimously approved the renewal of the management agreement pursuant to which American Century Investment Management, Inc. (the “Advisor”) acts as the investment advisor for the Fund. Under Section 15(c) of the Investment Company Act, contracts for investment advisory services are required to be reviewed, evaluated, and approved by a majority of a fund’s directors (the “Directors”), including a majority of the independent Directors, each year.
Prior to its consideration of the renewal of the management agreement, the Directors requested and reviewed extensive data and information compiled by the Advisor and certain independent providers of evaluation data concerning the Fund and the services provided to the Fund by the Advisor. This review was in addition to the oversight and evaluation undertaken by the Board and its committees on a continual basis and the information received was supplemental to the extensive information that the Board and its committees receive and consider throughout the year.
In connection with its consideration of the renewal of the management agreement, the Board’s review and evaluation of the services provided by the Advisor included, but was not limited to, the following:
| |
| • | the nature, extent, and quality of investment management, shareholder services, and other services provided and to be provided to the Fund; |
| |
| • | the wide range of other programs and services provided and to be provided to the Fund and its shareholders on a routine and non-routine basis; |
| |
| • | the investment performance of the Fund, including data comparing the Fund's performance to appropriate benchmarks and/or a peer group of other mutual funds with similar investment objectives and strategies; |
| |
| • | the cost of owning the Fund compared to the cost of owning similar funds; |
| |
| • | the compliance policies, procedures, and regulatory experience of the Advisor and the Fund's service providers; |
| |
| • | financial data showing the cost of services provided to the Fund, the profitability of the Fund to the Advisor, and the overall profitability of the Advisor; |
| |
| • | strategic plans of the Advisor; |
| |
| • | any economies of scale associated with the Advisor’s management of the Fund and other accounts; |
| |
| • | services provided and charges to the Advisor's other investment management clients; |
| |
| • | acquired fund fees and expenses; |
| |
| • | payments and practices in connection with financial intermediaries holding shares of the Fund and the services provided by intermediaries in connection therewith; and |
| |
| • | any collateral benefits derived by the Advisor from the management of the Fund. |
The Directors held three in-person meetings and one telephonic meeting to review and discuss the information provided. The independent Directors also reviewed responses to supplemental information requests provided by the Directors to the Advisor and held active discussions with the Advisor regarding the renewal of the management agreement. The independent Directors had the benefit of the advice of their independent counsel throughout the process.
Factors Considered
The Directors considered all of the information provided by the Advisor, the independent data providers, and independent counsel in connection with the approval. They determined that the information was sufficient for them to evaluate the management agreement for the Fund. In connection with their review, the Directors did not identify any single factor as being all-important or controlling, and each Director may have attributed different levels of importance to different factors.
In deciding to renew the management agreement, the Board based its decision on a number of factors, including without limitation the following:
Nature, Extent and Quality of Services — Generally. Under the management agreement, the Advisor is responsible for providing or arranging for all services necessary for the operation of the Fund. The Board noted that the Advisor provides or arranges at its own expense a wide variety of services including without limitation the following:
| |
| • | portfolio research and security selection |
| |
| • | daily valuation of the Fund’s portfolio |
| |
| • | shareholder servicing and transfer agency, including shareholder confirmations, recordkeeping, and communications |
| |
| • | legal services (except the independent Directors’ counsel) |
| |
| • | regulatory and portfolio compliance |
| |
| • | marketing and distribution (except amounts paid by the Fund under Rule 12b-1 plans) |
The Board noted that many of these services have expanded over time in terms of both quantity and complexity in response to shareholder demands, competition in the industry, changing distribution channels, and the changing regulatory environment.
Investment Management Services. The nature of the investment management services provided to the Fund is quite complex and allows Fund shareholders access to professional money management, instant diversification of their investments within an asset class, the opportunity to easily diversify among asset classes by investing in or exchanging among various American Century Investments funds, and liquidity. In evaluating investment performance, the Board expects the Advisor to manage the Fund in accordance with its investment objectives and approved strategies. Further, the Directors recognize that the Advisor has an obligation to monitor trading activities, and in particular to seek the best execution of fund trades, and to evaluate the use of and payment for research. In providing these services, the Advisor utilizes teams of investment professionals (portfolio managers, analysts, research assistants, and securities traders) who require extensive information technology, research, training, compliance, and other systems to conduct their business. The Board, directly and through its Fund Performance Review Committee, provides oversight of the investment performance process. It regularly reviews investment performance information for the Fund, together with comparative information for appropriate benchmarks and/or peer groups of similarly-managed funds, over different time horizons. The Directors also review investment performance information during the management agreement renewal process. If performance concerns are identified, the Fund receives special reviews until performance improves, during which the Board discusses with the Advisor the reasons for such results (e.g., market conditions, security selection) and any efforts being undertaken to improve performance. The Fund’s performance was above its benchmark for the one- and three-year periods and below its benchmark for the five- and ten-year periods reviewed by the Board. The Board found the investment management services provided by the Advisor to the Fund to be satisfactory and consistent with the management agreement.
Shareholder and Other Services. Under the management agreement, the Advisor provides the Fund with a comprehensive package of transfer agency, shareholder, and other services. The Board, directly and through various committees of the Board, regularly reviews reports and evaluations of such services at its regular meetings. These reports include, but are not limited to, information regarding the operational efficiency and accuracy of the shareholder and transfer agency services provided, staffing levels, shareholder satisfaction, technology support (including cyber security), new products and services offered to Fund shareholders, securities trading activities, portfolio valuation services, auditing services, and legal and operational compliance
activities. The Board found the services provided by the Advisor to the Fund under the management agreement to be competitive and of high quality.
Costs of Services and Profitability. The Advisor provides detailed information concerning its cost of providing various services to the Fund, its profitability in managing the Fund (pre- and post-distribution), its overall profitability, and its financial condition. The Directors have reviewed with the Advisor the methodology used to prepare this financial information. This information is considered in evaluating the Advisor’s financial condition, its ability to continue to provide services under the management agreement, and the reasonableness of the current management fee. The Board concluded that the Advisor’s profits were reasonable in light of the services provided to the Fund.
Ethics. The Board generally considers the Advisor’s commitment to providing quality services to shareholders and to conducting its business ethically. They noted that the Advisor’s practices generally meet or exceed industry best practices.
Economies of Scale. The Board also reviewed information provided by the Advisor regarding the possible existence of economies of scale in connection with the management of the Fund. The Board concluded that economies of scale are difficult to measure and predict with precision, especially on a fund-by-fund basis. The Board concluded that the Advisor is appropriately sharing economies of scale through its competitive fee structure, offering competitive fees from fund inception, and through reinvestment in its business to provide shareholders additional content and services. The Board also noted that economies of scale are shared with the Fund and its shareholders through management fee breakpoints that serve to reduce the effective management fee as the assets of the Fund grow.
Comparison to Other Funds’ Fees. The management agreement provides that the Fund pays the Advisor a single, all-inclusive (or unified) management fee for providing all services necessary for the management and operation of the Fund, other than brokerage expenses, expenses attributable to short sales, taxes, interest, extraordinary expenses, fees and expenses of the Fund’s independent Directors (including their independent legal counsel), and expenses incurred in connection with the provision of shareholder services and distribution services under a plan adopted pursuant to Rule 12b-1 under the Investment Company Act. Under the unified fee structure, the Advisor is responsible for providing all investment advisory, custody, audit, administrative, compliance, recordkeeping, marketing and shareholder services, or arranging and supervising third parties to provide such services. By contrast, most other funds are charged a variety of fees, including an investment advisory fee, a transfer agency fee, an administrative fee, distribution charges, and other expenses. Other than their investment advisory fees and any applicable Rule 12b-1 distribution fees, all other components of the total fees charged by these other funds may be increased without shareholder approval. The Board believes the unified fee structure is a benefit to Fund shareholders because it clearly discloses to shareholders the cost of owning Fund shares, and, since the unified fee cannot be increased without a vote of Fund shareholders, it shifts to the Advisor the risk of increased costs of operating the Fund and provides a direct incentive to minimize administrative inefficiencies. Part of the Board’s analysis of fee levels involves reviewing certain evaluative data compiled by an independent provider comparing the Fund’s unified fee to the total expense ratios of its peers. The unified fee charged to shareholders of the Fund was below the median of the total expense ratios of the Fund’s peer expense universe. The Board concluded that the management fee paid by the Fund to the Advisor under the management agreement is reasonable in light of the services provided to the Fund.
Comparison to Fees and Services Provided to Other Clients of the Advisor. The Directors also requested and received information from the Advisor concerning the nature of the services, fees, costs, and profitability of its advisory services to advisory clients other than the Fund. They observed that these varying types of client accounts require different services and involve different regulatory and entrepreneurial risks than the management of the Fund. The Board analyzed this information and concluded that the fees charged and services provided to the Fund were reasonable by comparison.
Payments to Intermediaries. The Directors also requested and received a description of payments made to intermediaries by the Fund and the Advisor and services provided in response thereto. These payments include various payments made by the Fund or the Advisor to different types of intermediaries and recordkeepers for distribution and service activities provided for the Fund. The Board reviewed such information and received representations from the Advisor that all such payments by the Fund were made pursuant to the Fund's Rule 12b-1 Plan and that all such payments by the Advisor were made from the Advisor’s resources and reasonable profits. The Board found such payments to be reasonable in scope and purpose.
Collateral or “Fall-Out” Benefits Derived by the Advisor. The Board considered the existence of collateral benefits the Advisor may receive as a result of its relationship with the Fund. They concluded that the Advisor’s primary business is managing mutual funds and it generally does not use fund or shareholder information to generate profits in other lines of business, and therefore does not derive any significant collateral benefits from them. The Board noted that additional assets from other clients may offer the Advisor some benefit from increased leverage with service providers and counterparties. Additionally, the Advisor may receive proprietary research from broker-dealers that execute fund portfolio transactions, which the Board concluded is likely to benefit other clients of the Advisor, as well as Fund shareholders. The Board also determined that the Advisor is able to provide investment management services to certain clients other than the Fund, at least in part, due to its existing infrastructure built to serve the fund complex. The Board concluded that appropriate allocation methodologies had been employed to assign resources and the cost of those resources to these other clients and, where expressly provided, these other client assets may be included with the assets of the Fund to determine breakpoints in the management fee schedule.
Existing Relationship. The Board also considered whether there was any reason for not continuing the existing arrangement with the Advisor. In this regard, the Board was mindful of the potential disruptions of the Fund’s operations and various risks, uncertainties, and other effects that could occur as a result of a decision not to continue such relationship. In particular, the Board recognized that most shareholders have invested in the Fund on the strength of the Advisor’s industry standing and reputation and in the expectation that the Advisor will have a continuing role in providing advisory services to the Fund.
Conclusion of the Directors. As a result of this process, the Board, including all of the independent Directors, taking into account all of the factors discussed above and the information provided by the Advisor and others in connection with its review and throughout the year, determined that the management fee is fair and reasonable in light of the services provided and that the investment management agreement between the Fund and the Advisor should be renewed.
Retirement Account Information
As required by law, distributions you receive from certain retirement accounts are subject to federal income tax withholding, unless you elect not to have withholding apply*. Tax will be withheld on the total amount withdrawn even though you may be receiving amounts that are not subject to withholding, such as nondeductible contributions. In such case, excess amounts of withholding could occur. You may adjust your withholding election so that a greater or lesser amount will be withheld.
If you don’t want us to withhold on this amount, you must notify us to not withhold the federal income tax. You may notify us in writing or in certain situations by telephone or through other electronic means. For systematic withdrawals, your withholding election will remain in effect until revoked or changed by filing a new election. You have the right to revoke your election at any time and change your withholding percentage for future distributions.
Remember, even if you elect not to have income tax withheld, you are liable for paying income tax on the taxable portion of your withdrawal. If you elect not to have income tax withheld or you don’t have enough income tax withheld, you may be responsible for payment of estimated tax. You may incur penalties under the estimated tax rules if your withholding and estimated tax payments are not sufficient. You can reduce or defer the income tax on a distribution by directly or indirectly rolling such distribution over to another IRA or eligible plan. You should consult your tax advisor for additional information.
State tax will be withheld if, at the time of your distribution, your address is within one of the mandatory withholding states and you have federal income tax withheld (or as otherwise required by state law). State taxes will be withheld from your distribution in accordance with the respective state rules.
*Some 403(b), 457 and qualified retirement plan distributions may be subject to 20% mandatory withholding, as they are subject to special tax and withholding rules. Your plan administrator or plan sponsor is required to provide you with a special tax notice explaining those rules at the time you request a distribution. If applicable, federal and/or state taxes may be withheld from your distribution amount.
Proxy Voting Policies
A description of the policies that the fund's investment advisor uses in exercising the voting rights associated with the securities purchased and/or held by the fund is available without charge, upon request, by calling 1-800-345-2021. It is also available on American Century Investments’ website at americancentury.com/proxy and on the Securities and Exchange Commission’s website at sec.gov. Information regarding how the investment advisor voted proxies relating to portfolio securities during the most recent 12-month period ended June 30 is available on americancentury.com/proxy. It is also available at sec.gov.
Quarterly Portfolio Disclosure
The fund files its complete schedule of portfolio holdings with the Securities and Exchange Commission (SEC) for the first and third quarters of each fiscal year on Form N-Q or as an exhibit to its reports on Form N-PORT. The fund’s Forms N-Q and Form N-PORT reports are available on the SEC’s website at sec.gov. The fund also makes its complete schedule of portfolio holdings for the most recent quarter of its fiscal year available on its website at americancentury.com and, upon request, by calling 1-800-345-2021.
Other Tax Information
The following information is provided pursuant to provisions of the Internal Revenue Code.
The fund hereby designates up to the maximum amount allowable as qualified dividend income for the fiscal year ended October 31, 2019.
For corporate taxpayers, the fund hereby designates $11,858,335, or up to the maximum amount allowable, of ordinary income distributions paid during the fiscal year ended October 31, 2019 as qualified for the corporate dividends received deduction.
The fund hereby designates $161,518,515, or up to the maximum amount allowable, as long-term capital gain distributions (20% rate gain distributions) for the fiscal year ended October 31, 2019.
The fund hereby designates $17,248,916 as qualified short-term capital gain distributions for purposes of Internal Revenue Code Section 871 for the fiscal year ended October 31, 2019.
The fund utilized earnings and profits of $9,256,347 distributed to shareholders on redemption of shares as part of the dividends paid deduction (tax equalization).
|
| | |
| |
| | | |
| Contact Us | americancentury.com | |
| Automated Information Line | 1-800-345-8765 | |
| Investor Services Representative | 1-800-345-2021 or 816-531-5575 | |
| Investors Using Advisors | 1-800-378-9878 | |
| Business, Not-For-Profit, Employer-Sponsored Retirement Plans | 1-800-345-3533 | |
| Banks and Trust Companies, Broker-Dealers, Financial Professionals, Insurance Companies | 1-800-345-6488 | |
| Telecommunications Relay Service for the Deaf | 711 | |
| | | |
| American Century Mutual Funds, Inc. | |
| | | |
Investment Advisor: American Century Investment Management, Inc. Kansas City, Missouri | |
| | | |
| This report and the statements it contains are submitted for the general information of our shareholders. The report is not authorized for distribution to prospective investors unless preceded or accompanied by an effective prospectus. | |
| | | |
©2019 American Century Proprietary Holdings, Inc. All rights reserved.
CL-ANN-90986 1912 | |
|
| |
| | |
| | Annual Report |
| | |
| | October 31, 2019 |
| | |
| | NT Heritage Fund |
| | G Class (ACLWX) |
Beginning on January 1, 2021, as permitted by regulations adopted by the Securities and Exchange Commission, paper copies of the fund’s shareholder reports like this one will no longer be sent by mail, unless you specifically request paper copies of the reports from the fund or from your financial intermediary, such as a broker-dealer or bank. Instead, the reports will be made available on a website, and you will be notified by mail each time a report is posted and provided with a website link to access the report.
If you already elected to receive shareholder reports electronically, you will not be affected by this change and you need not take any action. You may elect to receive shareholder reports and other communications from the fund or your financial intermediary electronically by calling or sending an email request to your appropriate contacts as listed on the back cover of this report.
You may elect to receive all future reports in paper free of charge. You can inform the fund or your financial intermediary that you wish to continue receiving paper copies of your shareholder reports by calling or sending an email request to your appropriate contacts as listed on the back cover of this report. Your election to receive reports in paper will apply to all funds held with the fund complex/your financial intermediary.
|
| |
| Performance | |
| Portfolio Commentary | |
| Fund Characteristics | |
| Shareholder Fee Example | |
| Schedule of Investments | |
| Statement of Assets and Liabilities | |
| Statement of Operations | |
| Statement of Changes in Net Assets | |
| Notes to Financial Statements | |
| Financial Highlights | |
| Report of Independent Registered Public Accounting Firm | |
| Management | |
| Approval of Management Agreement | |
| Additional Information | |
Any opinions expressed in this report reflect those of the author as of the date of the report, and do not necessarily represent the opinions of American Century Investments® or any other person in the American Century Investments organization. Any such opinions are subject to change at any time based upon market or other conditions and American Century Investments disclaims any responsibility to update such opinions. These opinions may not be relied upon as investment advice and, because investment decisions made by American Century Investments funds are based on numerous factors, may not be relied upon as an indication of trading intent on behalf of any American Century Investments fund. Security examples are used for representational purposes only and are not intended as recommendations to purchase or sell securities. Performance information for comparative indices and securities is provided to American Century Investments by third party vendors. To the best of American Century Investments’ knowledge, such information is accurate at the time of printing.
|
| | | | | |
| Total Returns as of October 31, 2019 |
| | | | Average Annual Returns | |
| | Ticker Symbol | 1 year | 5 years | 10 years | Inception Date |
| G Class | ACLWX | 18.18% | 10.24% | 12.74% | 5/12/06 |
| Russell Midcap Growth Index | — | 18.93% | 10.91% | 14.75% | — |
Fund returns would have been lower if a portion of the fees had not been waived.
|
|
| Growth of $10,000 Over 10 Years |
| $10,000 investment made October 31, 2009 |
|
| |
| Value on October 31, 2019 |
| | G Class — $33,209 |
| |
| | Russell Midcap Growth Index — $39,619 |
| |
Ending value of G Class would have been lower if a portion of the fees had not been waived.
|
| |
| Total Annual Fund Operating Expenses |
| G Class | 0.66% |
The total annual fund operating expenses shown is as stated in the fund’s prospectus current as of the date of this report. The prospectus may vary from the expense ratio shown elsewhere in this report because it is based on a different time period, includes acquired fund fees and expenses, and, if applicable, does not include fee waivers or expense reimbursements.
Data presented reflect past performance. Past performance is no guarantee of future results. Current performance may be higher or lower than the performance shown. Total returns for periods less than one year are not annualized. Investment return and principal value will fluctuate, and redemption value may be more or less than original cost. Data assumes reinvestment of dividends and capital gains, and none of the charts reflect the deduction of taxes that a shareholder would pay on fund distributions or the redemption of fund shares. To obtain performance data current to the most recent month end, please call 1-800-345-2021 or visit americancentury.com. For additional information about the fund, please consult the prospectus.
Portfolio Managers: Rob Brookby and Nalin Yogasundram
Performance Summary
NT Heritage returned 18.18%* for the 12 months ended October 31, 2019, lagging the 18.93% return of the portfolio’s benchmark, the Russell Midcap Growth Index.
U.S. stocks delivered strong returns during the reporting period. Growth stocks outperformed value stocks by a wide margin across the capitalization spectrum. Within the Russell Midcap Growth Index, most sectors posted double-digit returns, led by real estate and information technology. Energy posted a significant loss as oversupply and declining oil prices weighed on the sector.
Stock selection in the consumer discretionary sector detracted from the fund’s performance relative to the benchmark. Stock choices in the health care sector also weighed on performance. Stock selection in the information technology and financials sectors benefited relative performance.
Consumer Discretionary Stocks Weighed on Performance
In the consumer discretionary sector, stock choices among hotels, restaurants and leisure companies helped drive underperformance relative to the benchmark. Avoiding household durable stocks also detracted.
Stock decisions among health care providers and services companies detracted in the health care sector. The stock of veterinary care company Covetrus fell sharply after it reported disappointing quarterly results. The company failed to execute well on its spin-off from Henry Schein and its merger with Vets First Choice. We eliminated the holding. WellCare Health Plans, a managed health care provider that sells insurance in Medicare and Medicaid markets, declined on profit-taking early in 2019 after the industry had performed well in 2018. We sold our holding in the second quarter of 2019 following the announcement that it would be acquired by Centene. We added Centene to the portfolio at that time.
Other significant detractors included Concho Resources. The oil and natural gas company reported poor earnings amid lower oil prices. Concho was eliminated. Twitter was a key underperformer after it reported disappointing quarterly results late in the period and provided weaker-than-expected guidance for the next quarter.
Video game company Take-Two Interactive Software reported strong quarterly results on the launch of "Red Dead Redemption 2," but guidance disappointed. PTC, a software provider to industrial companies, was a significant detractor. Our thesis was that its software gave the company increasing exposure to the internet of things for industrials. However, PTC’s core business has been slowing because the management team lost sight of core cash flow. We eliminated our holding to invest in more attractive software companies.
Information Technology Stocks Were Top Contributors
Stock selection among IT services companies led performance in the information technology sector. FleetCor Technologies was a top contributor in the industry. FleetCor, a payments firm chiefly known as a provider of prepaid fuel cards to businesses, has benefited from key acquisitions. Booz Allen Hamilton Holding was a top contributor. The company provides IT services such as cybersecurity and cloud storage for the defense industry. Booz Allen continued to execute
*Fund returns would have been lower if a portion of the fees had not been waived.
well and enjoyed a strong tailwind in defense spending. We think it’s a high-quality company with good cash flow. Xilinx was a top contributor. It makes semiconductor chips that help increase the speed of data centers, including cellphone signals. The company is gaining market share relative to its major competitor, Intel. Xilinx is seeing renewed demand as telecommunication operators spend on 5G, the next generation of communication standards.
Other significant contributors included Array BioPharma, a commercial-stage biotechnology company focused on developing targeted therapies to treat cancer. The company reported positive phase 3 results for a form of colorectal cancer and subsequently agreed to be acquired by Pfizer. The stock was eliminated from the portfolio as a result of the transaction. Tower company SBA Communications was a top contributor as it is benefiting from the rollout of 5G cellular. Beverage packaging company Ball outperformed on strong global demand along with cost-cutting measures. Its aerospace subsidiary also performed well.
Outlook
Our process uses a combined top-down, bottom-up fundamental framework aimed at identifying mid-cap companies producing attractive, sustainable growth. We seek to reduce unintended, nonfundamental risks and align the portfolio with fundamental, company-specific risks that we believe will be rewarded over time. As a result of this approach, our sector and industry allocations reflect where we are finding opportunities at a given time.
At the end of the period, the portfolio’s largest overweight relative to the benchmark was in the information technology sector. We have a favorable outlook for the sector. We believe that the tailwinds are numerous, are sizable and have duration, and we have investments in companies whose business model can sustainably take advantage of these themes.
Consumer discretionary was modestly overweight. We are cautious on the economic cycle and recognize the long list of concerns. However, we enjoy the benefit of a long-term investment horizon and continue to focus on our favorite thematic growth ideas, seeking to find those companies best positioned to take market share during the age of e-commerce.
The portfolio’s industrials exposure was underweight. We think that the U.S. economy is likely to slow, putting pressure on industrial companies’ earnings.
|
| |
| OCTOBER 31, 2019 | |
| Top Ten Holdings | % of net assets |
| Fiserv, Inc. | 5.3% |
| SBA Communications Corp. | 3.0% |
| FleetCor Technologies, Inc. | 2.6% |
| Encompass Health Corp. | 2.4% |
| AMETEK, Inc. | 2.4% |
| Ingersoll-Rand plc | 2.2% |
| Keysight Technologies, Inc. | 2.2% |
| Twitter, Inc. | 2.2% |
| LPL Financial Holdings, Inc. | 2.1% |
| Applied Materials, Inc. | 2.1% |
| | |
| Top Five Industries | % of net assets |
| IT Services | 10.8% |
| Software | 10.1% |
| Semiconductors and Semiconductor Equipment | 6.8% |
| Health Care Equipment and Supplies | 6.6% |
| Specialty Retail | 6.5% |
| | |
| Types of Investments in Portfolio | % of net assets |
| Common Stocks | 97.6% |
| Exchange-Traded Funds | 0.5% |
| Total Equity Exposure | 98.1% |
| Temporary Cash Investments | 2.0% |
| Temporary Cash Investments - Securities Lending Collateral | 0.5% |
| Other Assets and Liabilities | (0.6)% |
Fund shareholders may incur two types of costs: (1) transaction costs, including sales charges (loads) on purchase payments and redemption/exchange fees; and (2) ongoing costs, including management fees; distribution and service (12b-1) fees; and other fund expenses. This example is intended to help you understand your ongoing costs (in dollars) of investing in your fund and to compare these costs with the ongoing cost of investing in other mutual funds.
The example is based on an investment of $1,000 made at the beginning of the period and held for the entire period from May 1, 2019 to October 31, 2019.
Actual Expenses
The table provides information about actual account values and actual expenses for each class. You may use the information, together with the amount you invested, to estimate the expenses that you paid over the period. First, identify the share class you own. Then simply divide your account value by $1,000 (for example, an $8,600 account value divided by $1,000 = 8.6), then multiply the result by the number under the heading “Expenses Paid During Period” to estimate the expenses you paid on your account during this period.
Hypothetical Example for Comparison Purposes
The table also provides information about hypothetical account values and hypothetical expenses based on the actual expense ratio of each class of your fund and an assumed rate of return of 5% per year before expenses, which is not the actual return of a fund’s share class. The hypothetical account values and expenses may not be used to estimate the actual ending account balance or expenses you paid for the period. You may use this information to compare the ongoing costs of investing in your fund and other funds. To do so, compare this 5% hypothetical example with the 5% hypothetical examples that appear in the shareholder reports of the other funds.
Please note that the expenses shown in the table are meant to highlight your ongoing costs only and do not reflect any transactional costs, such as sales charges (loads) or redemption/exchange fees. Therefore, the table is useful in comparing ongoing costs only, and will not help you determine the relative total costs of owning different funds. In addition, if these transactional costs were included, your costs would have been higher.
|
| | | | |
| Beginning
Account Value
5/1/19 | Ending
Account Value
10/31/19 | Expenses Paid
During Period(1)
5/1/19 - 10/31/19 |
Annualized
Expense Ratio(1) |
| Actual | | | | |
| G Class | $1,000 | $1,019.70 | $0.10 | 0.02% |
| Hypothetical | | | | |
| G Class | $1,000 | $1,025.11 | $0.10 | 0.02% |
| |
| (1) | Expenses are equal to the class's annualized expense ratio listed in the table above, multiplied by the average account value over the period, multiplied by 184, the number of days in the most recent fiscal half-year, divided by 365, to reflect the one-half year period. Annualized expense ratio reflects actual expenses, including any applicable fee waivers or expense reimbursements and excluding any acquired fund fees and expenses. |
OCTOBER 31, 2019
|
| | | | |
| | Shares | Value |
| COMMON STOCKS — 97.6% | | |
| Aerospace and Defense — 1.8% | | |
| L3Harris Technologies, Inc. | 51,104 | $ | 10,543,266 |
|
| Auto Components — 1.4% | | |
| Aptiv plc | 91,033 | 8,152,005 |
|
| Beverages — 1.9% | | |
| Brown-Forman Corp., Class B | 54,778 | 3,589,054 |
|
| Constellation Brands, Inc., Class A | 42,227 | 8,037,065 |
|
| | | 11,626,119 |
|
| Biotechnology — 2.3% | | |
Exact Sciences Corp.(1) | 66,029 | 5,744,523 |
|
Immunomedics, Inc.(1) | 258,534 | 4,136,544 |
|
Sage Therapeutics, Inc.(1) | 18,065 | 2,450,517 |
|
Turning Point Therapeutice, Inc.(1)(2) | 36,193 | 1,388,364 |
|
| | | 13,719,948 |
|
| Capital Markets — 5.2% | | |
| LPL Financial Holdings, Inc. | 153,129 | 12,378,948 |
|
| MSCI, Inc. | 35,688 | 8,370,977 |
|
| S&P Global, Inc. | 39,755 | 10,256,393 |
|
| | | 31,006,318 |
|
| Commercial Services and Supplies — 1.0% | | |
| Waste Management, Inc. | 54,604 | 6,127,115 |
|
| Communications Equipment — 1.5% | | |
Arista Networks, Inc.(1) | 36,898 | 9,024,144 |
|
| Construction and Engineering — 1.0% | | |
| Jacobs Engineering Group, Inc. | 65,758 | 6,153,634 |
|
| Construction Materials — 1.5% | | |
| Vulcan Materials Co. | 64,758 | 9,251,975 |
|
| Containers and Packaging — 1.3% | | |
| Ball Corp. | 115,811 | 8,103,296 |
|
| Distributors — 1.5% | | |
LKQ Corp.(1) | 262,125 | 8,909,629 |
|
| Diversified Consumer Services — 0.9% | | |
Bright Horizons Family Solutions, Inc.(1) | 38,311 | 5,689,950 |
|
| Electrical Equipment — 2.6% | | |
| AMETEK, Inc. | 154,648 | 14,173,489 |
|
Sensata Technologies Holding plc(1) | 29,173 | 1,493,366 |
|
| | | 15,666,855 |
|
| Electronic Equipment, Instruments and Components — 4.1% | | |
| CDW Corp. | 91,251 | 11,671,916 |
|
Keysight Technologies, Inc.(1) | 130,519 | 13,170,672 |
|
| | | 24,842,588 |
|
| Entertainment — 2.3% | | |
Live Nation Entertainment, Inc.(1) | 71,077 | 5,010,929 |
|
|
| | | | |
| | Shares | Value |
Take-Two Interactive Software, Inc.(1) | 72,869 | $ | 8,769,784 |
|
| | | 13,780,713 |
|
| Equity Real Estate Investment Trusts (REITs) — 3.0% | | |
| SBA Communications Corp. | 74,697 | 17,975,833 |
|
| Health Care Equipment and Supplies — 6.6% | | |
DexCom, Inc.(1) | 18,242 | 2,813,646 |
|
Haemonetics Corp.(1) | 74,032 | 8,937,883 |
|
Masimo Corp.(1) | 47,319 | 6,898,637 |
|
| ResMed, Inc. | 54,545 | 8,068,296 |
|
SmileDirectClub, Inc.(1) | 169,457 | 1,981,800 |
|
| Teleflex, Inc. | 32,538 | 11,304,027 |
|
| | | 40,004,289 |
|
| Health Care Providers and Services — 3.7% | | |
Centene Corp.(1) | 151,495 | 8,041,354 |
|
| Encompass Health Corp. | 225,742 | 14,452,003 |
|
| | | 22,493,357 |
|
| Hotels, Restaurants and Leisure — 3.2% | | |
Chipotle Mexican Grill, Inc.(1) | 9,808 | 7,632,193 |
|
| Domino's Pizza, Inc. | 8,595 | 2,334,574 |
|
Planet Fitness, Inc., Class A(1) | 141,557 | 9,011,519 |
|
| | | 18,978,286 |
|
| Industrial Conglomerates — 0.4% | | |
| Roper Technologies, Inc. | 7,019 | 2,365,122 |
|
| Interactive Media and Services — 2.7% | | |
Pinterest, Inc., Class A(1) | 121,283 | 3,049,055 |
|
Twitter, Inc.(1) | 433,698 | 12,997,929 |
|
| | | 16,046,984 |
|
| Internet and Direct Marketing Retail — 1.3% | | |
| Expedia Group, Inc. | 57,593 | 7,870,659 |
|
| IT Services — 10.8% | | |
| Booz Allen Hamilton Holding Corp. | 107,193 | 7,543,171 |
|
Fiserv, Inc.(1) | 299,669 | 31,806,868 |
|
FleetCor Technologies, Inc.(1) | 52,513 | 15,450,375 |
|
Square, Inc., Class A(1) | 168,732 | 10,365,207 |
|
| | | 65,165,621 |
|
| Life Sciences Tools and Services — 1.3% | | |
| Bruker Corp. | 169,901 | 7,560,594 |
|
| Machinery — 3.7% | | |
| Ingersoll-Rand plc | 106,284 | 13,486,377 |
|
| Parker-Hannifin Corp. | 47,031 | 8,629,718 |
|
| | | 22,116,095 |
|
| Personal Products — 0.8% | | |
| Shiseido Co. Ltd. | 55,200 | 4,572,004 |
|
| Pharmaceuticals — 0.7% | | |
Catalent, Inc.(1) | 84,233 | 4,097,935 |
|
| Professional Services — 3.1% | | |
IHS Markit Ltd.(1) | 118,384 | 8,289,248 |
|
|
| | | | |
| | Shares | Value |
| Verisk Analytics, Inc. | 71,287 | $ | 10,315,229 |
|
| | | 18,604,477 |
|
| Road and Rail — 1.4% | | |
| J.B. Hunt Transport Services, Inc. | 72,804 | 8,558,838 |
|
| Semiconductors and Semiconductor Equipment — 6.8% | | |
Advanced Micro Devices, Inc.(1) | 363,439 | 12,331,485 |
|
| Applied Materials, Inc. | 227,991 | 12,370,792 |
|
| Marvell Technology Group Ltd. | 323,213 | 7,883,165 |
|
Micron Technology, Inc.(1) | 122,005 | 5,801,338 |
|
| Xilinx, Inc. | 26,316 | 2,387,914 |
|
| | | 40,774,694 |
|
| Software — 10.1% | | |
Atlassian Corp. plc, Class A(1) | 78,338 | 9,462,447 |
|
Cadence Design Systems, Inc.(1) | 151,085 | 9,873,405 |
|
Coupa Software, Inc.(1) | 53,670 | 7,379,088 |
|
Palo Alto Networks, Inc.(1) | 23,522 | 5,348,668 |
|
Paycom Software, Inc.(1) | 27,712 | 5,861,919 |
|
Proofpoint, Inc.(1) | 60,945 | 7,031,225 |
|
RingCentral, Inc., Class A(1) | 52,899 | 8,544,246 |
|
Splunk, Inc.(1) | 62,967 | 7,553,521 |
|
| | | 61,054,519 |
|
| Specialty Retail — 6.5% | | |
| Advance Auto Parts, Inc. | 25,637 | 4,165,500 |
|
Burlington Stores, Inc.(1) | 59,192 | 11,374,927 |
|
Five Below, Inc.(1) | 57,782 | 7,229,106 |
|
Floor & Decor Holdings, Inc., Class A(1) | 106,034 | 4,859,538 |
|
O'Reilly Automotive, Inc.(1) | 13,352 | 5,814,929 |
|
| Tractor Supply Co. | 60,499 | 5,748,615 |
|
| | | 39,192,615 |
|
| Textiles, Apparel and Luxury Goods — 1.2% | | |
Lululemon Athletica, Inc.(1) | 34,931 | 7,135,355 |
|
| | | |
TOTAL COMMON STOCKS
(Cost $470,753,182) | | 587,164,832 |
|
| EXCHANGE-TRADED FUNDS — 0.5% | | |
SPDR S&P Oil & Gas Exploration & Production ETF(2)
(Cost $4,792,291) | 151,138 | 3,192,035 |
|
| TEMPORARY CASH INVESTMENTS — 2.0% | | |
| Repurchase Agreement, BMO Capital Markets Corp., (collateralized by various U.S. Treasury obligations, 1.625% - 2.25%, 3/31/21 - 5/15/26, valued at $8,900,406), in a joint trading account at 1.50%, dated 10/31/19, due 11/1/19 (Delivery value $8,715,376) | | 8,715,013 |
|
| Repurchase Agreement, Fixed Income Clearing Corp., (collateralized by various U.S. Treasury obligations, 1.625%, 9/30/26, valued at $2,966,477), at 0.65%, dated 10/31/19, due 11/1/19 (Delivery value $2,908,053) | | 2,908,000 |
|
| State Street Institutional U.S. Government Money Market Fund, Premier Class | 4,629 | 4,629 |
|
TOTAL TEMPORARY CASH INVESTMENTS
(Cost $11,627,642) | | 11,627,642 |
|
|
| | | | |
| | Shares | Value |
TEMPORARY CASH INVESTMENTS - SECURITIES LENDING COLLATERAL(3) — 0.5% |
State Street Navigator Securities Lending Government Money Market Portfolio
(Cost $3,287,252) | 3,287,252 | $ | 3,287,252 |
|
TOTAL INVESTMENT SECURITIES — 100.6%
(Cost $490,460,367) | | 605,271,761 |
|
| OTHER ASSETS AND LIABILITIES — (0.6)% | | (3,447,685 | ) |
| TOTAL NET ASSETS — 100.0% | | $ | 601,824,076 |
|
|
| | | | | | | | | | |
| FORWARD FOREIGN CURRENCY EXCHANGE CONTRACTS | | |
| Currency Purchased | Currency Sold | Counterparty | Settlement Date | Unrealized Appreciation
(Depreciation) |
| JPY | 10,830,240 |
| USD | 101,712 |
| Bank of America N.A. | 12/30/19 | $ | (1,038 | ) |
| USD | 4,036,761 |
| JPY | 432,861,840 |
| Bank of America N.A. | 12/30/19 | 13,011 |
|
| USD | 96,269 |
| JPY | 10,283,760 |
| Bank of America N.A. | 12/30/19 | 674 |
|
| USD | 111,129 |
| JPY | 11,972,880 |
| Bank of America N.A. | 12/30/19 | (167 | ) |
| | | | | | | $ | 12,480 |
|
|
| | |
| NOTES TO SCHEDULE OF INVESTMENTS |
| JPY | - | Japanese Yen |
| USD | - | United States Dollar |
| |
| (2) | Security, or a portion thereof, is on loan. At the period end, the aggregate value of securities on loan was $4,580,398. The amount of securities on loan indicated may not correspond with the securities on loan identified because securities with pending sales are in the process of recall from the brokers. |
| |
| (3) | Investment of cash collateral from securities on loan. At the period end, the aggregate market value of the collateral held by the fund was $4,707,827, which includes securities collateral of $1,420,575. |
See Notes to Financial Statements.
|
|
| Statement of Assets and Liabilities |
|
| | | |
| OCTOBER 31, 2019 | |
| Assets | |
| Investment securities, at value (cost of $487,173,115) — including $4,580,398 of securities on loan | $ | 601,984,509 |
|
Investment made with cash collateral received for securities on loan, at value
(cost of $3,287,252) | 3,287,252 |
|
| Total investment securities, at value (cost of $490,460,367) | 605,271,761 |
|
| Receivable for investments sold | 5,753,820 |
|
| Unrealized appreciation on forward foreign currency exchange contracts | 13,685 |
|
| Dividends and interest receivable | 11,062 |
|
| Securities lending receivable | 1,495 |
|
| | 611,051,823 |
|
| | |
| Liabilities | |
| Payable for collateral received for securities on loan | 3,287,252 |
|
| Payable for investments purchased | 5,691,662 |
|
| Payable for capital shares redeemed | 247,628 |
|
| Unrealized depreciation on forward foreign currency exchange contracts | 1,205 |
|
| | 9,227,747 |
|
| | |
| Net Assets | $ | 601,824,076 |
|
| | |
| G Class Capital Shares, $0.01 Par Value | |
| Shares authorized | 600,000,000 |
|
| Shares outstanding | 46,439,618 |
|
| | |
| Net Asset Value Per Share | $ | 12.96 |
|
| | |
| | |
| Net Assets Consist of: | |
| Capital (par value and paid-in surplus) | $ | 411,057,705 |
|
| Distributable earnings | 190,766,371 |
|
| | $ | 601,824,076 |
|
See Notes to Financial Statements.
|
| | | |
| YEAR ENDED OCTOBER 31, 2019 |
| Investment Income (Loss) |
| Income: | |
| Dividends | $ | 3,520,486 |
|
| Securities lending, net | 216,566 |
|
| Interest | 178,217 |
|
| | 3,915,269 |
|
| | |
| Expenses: | |
| Management fees | 4,027,856 |
|
| Directors' fees and expenses | 19,287 |
|
| Other expenses | 43,732 |
|
| | 4,090,875 |
|
| Fees waived | (4,027,856 | ) |
| | 63,019 |
|
| | |
| Net investment income (loss) | 3,852,250 |
|
| | |
| Realized and Unrealized Gain (Loss) | |
| Net realized gain (loss) on: | |
| Investment transactions | 80,053,802 |
|
| Forward foreign currency exchange contract transactions | 365,770 |
|
| Foreign currency translation transactions | 4,303 |
|
| | 80,423,875 |
|
| | |
| Change in net unrealized appreciation (depreciation) on: | |
| Investments | 20,318,853 |
|
| Forward foreign currency exchange contracts | (145,753 | ) |
| | 20,173,100 |
|
| | |
| Net realized and unrealized gain (loss) | 100,596,975 |
|
| | |
| Net Increase (Decrease) in Net Assets Resulting from Operations | $ | 104,449,225 |
|
See Notes to Financial Statements.
|
|
| Statement of Changes in Net Assets |
|
| | | | | | |
| YEARS ENDED OCTOBER 31, 2019 AND OCTOBER 31, 2018 |
| Increase (Decrease) in Net Assets | October 31, 2019 | October 31, 2018 |
| Operations | | |
| Net investment income (loss) | $ | 3,852,250 |
| $ | 5,488,181 |
|
| Net realized gain (loss) | 80,423,875 |
| 150,820,303 |
|
| Change in net unrealized appreciation (depreciation) | 20,173,100 |
| (86,710,960 | ) |
| Net increase (decrease) in net assets resulting from operations | 104,449,225 |
| 69,597,524 |
|
| | | |
| Distributions to Shareholders | | |
| From earnings | (142,583,485 | ) | (55,729,292 | ) |
| | | |
| Capital Share Transactions | | |
| Proceeds from shares sold | 49,849,275 |
| 20,837,098 |
|
| Proceeds from reinvestment of distributions | 142,583,485 |
| 55,729,292 |
|
| Payments for shares redeemed | (244,279,493 | ) | (221,539,845 | ) |
| Net increase (decrease) in net assets from capital share transactions | (51,846,733 | ) | (144,973,455 | ) |
| | | |
| Net increase (decrease) in net assets | (89,980,993 | ) | (131,105,223 | ) |
| | | |
| Net Assets | | |
| Beginning of period | 691,805,069 |
| 822,910,292 |
|
| End of period | $ | 601,824,076 |
| $ | 691,805,069 |
|
| | | |
| | | |
| Transactions in Shares of the Fund | | |
| Sold | 4,017,174 |
| 1,434,857 |
|
| Issued in reinvestment of distributions | 13,992,491 |
| 3,989,212 |
|
| Redeemed | (19,173,722 | ) | (14,907,717 | ) |
| Net increase (decrease) in shares of the fund | (1,164,057 | ) | (9,483,648 | ) |
See Notes to Financial Statements.
|
|
| Notes to Financial Statements |
OCTOBER 31, 2019
1. Organization
American Century Mutual Funds, Inc. (the corporation) is registered under the Investment Company Act of 1940, as amended (the 1940 Act), as an open-end management investment company and is organized as a Maryland corporation. NT Heritage Fund (the fund) is one fund in a series issued by the corporation. The fund's investment objective is to seek long-term capital growth. The fund is not permitted to invest in securities issued by companies assigned the Global Industry Classification Standard or the Bloomberg Industry Classification Standard for the tobacco industry. The fund offers the G Class.
2. Significant Accounting Policies
The following is a summary of significant accounting policies consistently followed by the fund in preparation of its financial statements. The fund is an investment company and follows accounting and reporting guidance in accordance with accounting principles generally accepted in the United States of America. This may require management to make certain estimates and assumptions at the date of the financial statements. Actual results could differ from these estimates. Management evaluated the impact of events or transactions occurring through the date the financial statements were issued that would merit recognition or disclosure.
Investment Valuations — The fund determines the fair value of its investments and computes its net asset value per share at the close of regular trading (usually 4 p.m. Eastern time) on the New York Stock Exchange (NYSE) on each day the NYSE is open. The Board of Directors has adopted valuation policies and procedures to guide the investment advisor in the fund’s investment valuation process and to provide methodologies for the oversight of the fund’s pricing function.
Equity securities that are listed or traded on a domestic securities exchange are valued at the last reported sales price or at the official closing price as provided by the exchange. Equity securities traded on foreign securities exchanges are generally valued at the closing price of such securities on the exchange where primarily traded or at the close of the NYSE, if that is earlier. If no last sales price is reported, or if local convention or regulation so provides, the mean of the latest bid and asked prices may be used. Securities traded over-the-counter are valued at the mean of the latest bid and asked prices, the last sales price, or the official closing price. Equity securities initially expressed in local currencies are translated into U.S. dollars at the mean of the appropriate currency exchange rate at the close of the NYSE as provided by an independent pricing service.
Open-end management investment companies are valued at the reported net asset value per share. Repurchase agreements are valued at cost, which approximates fair value. Forward foreign currency exchange contracts are valued at the mean of the appropriate forward exchange rate at the close of the NYSE as provided by an independent pricing service.
If the fund determines that the market price for an investment is not readily available or the valuation methods mentioned above do not reflect an investment’s fair value, such investment is valued as determined in good faith by the Board of Directors or its delegate, in accordance with policies and procedures adopted by the Board of Directors. In its determination of fair value, the fund may review several factors including, but not limited to, market information regarding the specific investment or comparable investments and correlation with other investment types, futures indices or general market indicators. Circumstances that may cause the fund to use these procedures to value an investment include, but are not limited to: an investment has been declared in default or is distressed; trading in a security has been suspended during the trading day or a security is not actively trading on its principal exchange; prices received from a regular pricing source are deemed unreliable; or there is a foreign market holiday and no trading occurred.
The fund monitors for significant events occurring after the close of an investment’s primary exchange but before the fund’s net asset value per share is determined. Significant events may include, but are not limited to: corporate announcements and transactions; governmental action and political unrest that could impact a specific investment or an investment sector; or armed conflicts, natural disasters and similar events that could affect investments in a specific country or region. The fund also monitors for significant fluctuations between domestic and foreign markets, as evidenced by the U.S. market or such other indicators that the Board of Directors, or its delegate, deems appropriate. The fund may apply a model-derived factor to the closing price
of equity securities traded on foreign securities exchanges. The factor is based on observable market data as provided by an independent pricing service.
Security Transactions — Security transactions are accounted for as of the trade date. Net realized gains and losses are determined on the identified cost basis, which is also used for federal income tax purposes.
Investment Income — Dividend income less foreign taxes withheld, if any, is recorded as of the ex-dividend date. Distributions received on securities that represent a return of capital or long-term capital gain are recorded as a reduction of cost of investments and/or as a realized gain. The fund may estimate the components of distributions received that may be considered nontaxable distributions or long-term capital gain distributions for income tax purposes. Interest income is recorded on the accrual basis and includes accretion of discounts and amortization of premiums. Securities lending income is net of fees and rebates earned by the lending agent for its services.
Foreign Currency Translations — All assets and liabilities initially expressed in foreign currencies are translated into U.S. dollars at prevailing exchange rates at period end. The fund may enter into spot foreign currency exchange contracts to facilitate transactions denominated in a foreign currency. Purchases and sales of investment securities, dividend and interest income, spot foreign currency exchange contracts, and expenses are translated at the rates of exchange prevailing on the respective dates of such transactions. Net realized and unrealized foreign currency exchange gains or losses related to investment securities are a component of net realized gain (loss) on investment transactions and change in net unrealized appreciation (depreciation) on investments, respectively.
Repurchase Agreements — The fund may enter into repurchase agreements with institutions that American Century Investment Management, Inc. (ACIM) (the investment advisor) has determined are creditworthy pursuant to criteria adopted by the Board of Directors. The fund requires that the collateral, represented by securities, received in a repurchase transaction be transferred to the custodian in a manner sufficient to enable the fund to obtain those securities in the event of a default under the repurchase agreement. ACIM monitors, on a daily basis, the securities transferred to ensure the value, including accrued interest, of the securities under each repurchase agreement is equal to or greater than amounts owed to the fund under each repurchase agreement.
Joint Trading Account — Pursuant to an Exemptive Order issued by the Securities and Exchange Commission, the fund, along with certain other funds in the American Century Investments family of funds, may transfer uninvested cash balances into a joint trading account. These balances are invested in one or more repurchase agreements that are collateralized by U.S. Treasury or Agency obligations.
Segregated Assets — In accordance with the 1940 Act, the fund segregates assets on its books and records to cover certain types of investment securities and other financial instruments. ACIM monitors, on a daily basis, the securities segregated to ensure the fund designates a sufficient amount of liquid assets, marked-to-market daily. The fund may also receive assets or be required to pledge assets at the custodian bank or with a broker for collateral requirements.
Income Tax Status — It is the fund’s policy to distribute substantially all net investment income and net realized gains to shareholders and to otherwise qualify as a regulated investment company under provisions of the Internal Revenue Code. Accordingly, no provision has been made for income taxes. The fund files U.S. federal, state, local and non-U.S. tax returns as applicable. The fund's tax returns are subject to examination by the relevant taxing authority until expiration of the applicable statute of limitations, which is generally three years from the date of filing but can be longer in certain jurisdictions. At this time, management believes there are no uncertain tax positions which, based on their technical merit, would not be sustained upon examination and for which it is reasonably possible that the total amounts of unrecognized tax benefits will significantly change in the next twelve months.
Distributions to Shareholders — Distributions from net investment income and net realized gains, if any, are generally declared and paid annually. The fund may elect to treat a portion of its payment to a redeeming shareholder, which represents the pro rata share of undistributed net investment income and net realized gains, as a distribution for federal income tax purposes (tax equalization).
Indemnifications — Under the corporation’s organizational documents, its officers and directors are indemnified against certain liabilities arising out of the performance of their duties to the fund. In addition, in the normal course of business, the fund enters into contracts that provide general indemnifications. The maximum exposure under these arrangements is unknown as this would involve future claims that may be made against a fund. The risk of material loss from such claims is considered by management to be remote.
Securities Lending — Securities are lent to qualified financial institutions and brokers. State Street Bank & Trust Co. serves as securities lending agent to the fund pursuant to a Securities Lending Agreement. The lending of securities exposes the fund to risks such as: the borrowers may fail to return the loaned securities, the borrowers may not be able to provide additional collateral, the fund may experience delays in recovery of the loaned securities or delays in access to collateral, or the fund may experience losses related to the investment collateral. To minimize certain risks, loan counterparties pledge collateral in the form of cash and/or securities. The lending agent has agreed to indemnify the fund in the case of default of any securities borrowed. Cash collateral received is invested in the State Street Navigator Securities Lending Government Money Market Portfolio, a money market mutual fund registered under the 1940 Act. The loans may also be secured by U.S. government securities in an amount at least equal to the market value of the securities loaned, plus accrued interest and dividends, determined on a daily basis and adjusted accordingly. By lending securities, the fund seeks to increase its net investment income through the receipt of interest and fees. Such income is reflected separately within the Statement of Operations. The value of loaned securities and related collateral outstanding at period end, if any, are shown on a gross basis within the Schedule of Investments and Statement of Assets and Liabilities.
The following table reflects a breakdown of transactions accounted for as secured borrowings, the gross obligation by the type of collateral pledged, and the remaining contractual maturity of those transactions as of October 31, 2019.
|
| | | | | | | | | | | | |
| Remaining Contractual Maturity of Agreements |
| | Overnight and
Continuous | <30 days | Between
30 & 90 days | >90 days | Total |
Securities Lending Transactions(1) | | | | |
| Exchange-Traded Funds | $ | 3,287,252 |
| — |
| — |
| — |
| $ | 3,287,252 |
|
| Gross amount of recognized liabilities for securities lending transactions | $ | 3,287,252 |
|
| |
| (1) | Amount represents the payable for cash collateral received for securities on loan. This will generally be in the Overnight and Continuous column as the securities are typically callable on demand. |
3. Fees and Transactions with Related Parties
Certain officers and directors of the corporation are also officers and/or directors of American Century Companies, Inc. (ACC). The corporation’s investment advisor, ACIM, the corporation's distributor, American Century Investment Services, Inc., and the corporation’s transfer agent, American Century Services, LLC, are wholly owned, directly or indirectly, by ACC. Various funds issued by American Century Asset Allocation Portfolios, Inc. own, in aggregate, 100% of the shares of the fund. Related parties do not invest in the fund for the purpose of exercising management or control.
Management Fees —The corporation has entered into a management agreement with ACIM, under which ACIM provides the fund with investment advisory and management services in exchange for a single, unified management fee (the fee). The agreement provides that all expenses of managing and operating the fund, except brokerage expenses, taxes, interest, fees and expenses of the independent directors (including legal counsel fees), and extraordinary expenses, will be paid by ACIM. The fee is computed and accrued daily based on the daily net assets of the fund and paid monthly in arrears. The annual management fee is 0.65%. The investment advisor agreed to waive the management fee in its entirety. The investment advisor expects this waiver to remain in effect permanently and cannot terminate it without the approval of the Board of Directors. The effective annual management fee for the period ended October 31, 2019 was 0.00% after waiver.
Directors' Fees and Expenses — The Board of Directors is responsible for overseeing the investment advisor’s management and operations of the fund. The directors receive detailed information about the fund and its investment advisor regularly throughout the year, and meet at least quarterly with management of the investment advisor to review reports about fund operations. The fund’s officers do not receive compensation from the fund.
Interfund Transactions — The fund may enter into security transactions with other American Century Investments funds and other client accounts of the investment advisor, in accordance with the 1940 Act rules and procedures adopted by the Board of Directors. The rules and procedures require, among other things, that these transactions be effected at the independent current market price of the security. During the period,
the interfund purchases and sales were $5,886,749 and $8,522,962, respectively. The effect of interfund transactions on the Statement of Operations was $325,198 in net realized gain (loss) on investment transactions.
4. Investment Transactions
Purchases and sales of investment securities, excluding short-term investments, for the period ended October 31, 2019 were $567,605,069 and $746,905,482, respectively.
5. Fair Value Measurements
The fund’s investments valuation process is based on several considerations and may use multiple inputs to determine the fair value of the investments held by the fund. In conformity with accounting principles generally accepted in the United States of America, the inputs used to determine a valuation are classified into three broad levels.
| |
| • | Level 1 valuation inputs consist of unadjusted quoted prices in an active market for identical investments. |
| |
| • | Level 2 valuation inputs consist of direct or indirect observable market data (including quoted prices for comparable investments, evaluations of subsequent market events, interest rates, prepayment speeds, credit risk, etc.). These inputs also consist of quoted prices for identical investments initially expressed in local currencies that are adjusted through translation into U.S. dollars. |
| |
| • | Level 3 valuation inputs consist of unobservable data (including a fund’s own assumptions). |
The level classification is based on the lowest level input that is significant to the fair valuation measurement. The valuation inputs are not necessarily an indication of the risks associated with investing in these securities or other financial instruments.
The following is a summary of the level classifications as of period end. The Schedule of Investments provides additional information on the fund’s portfolio holdings.
|
| | | | | | | | |
| | Level 1 | Level 2 | Level 3 |
| Assets | | | |
| Investment Securities | | | |
| Common Stocks | $ | 582,592,828 |
| $ | 4,572,004 |
| — |
|
| Exchange-Traded Funds | 3,192,035 |
| — |
| — |
|
| Temporary Cash Investments | 4,629 |
| 11,623,013 |
| — |
|
| Temporary Cash Investments - Securities Lending Collateral | 3,287,252 |
| — |
| — |
|
| | $ | 589,076,744 |
| $ | 16,195,017 |
| — |
|
| Other Financial Instruments | | | |
| Forward Foreign Currency Exchange Contracts | — |
| $ | 13,685 |
| — |
|
| | | | |
| Liabilities | | | |
| Other Financial Instruments | | | |
| Forward Foreign Currency Exchange Contracts | — |
| $ | 1,205 |
| — |
|
6. Derivative Instruments
Foreign Currency Risk — The fund is subject to foreign currency exchange rate risk in the normal course of pursuing its investment objectives. The value of foreign investments held by a fund may be significantly affected by changes in foreign currency exchange rates. The dollar value of a foreign security generally decreases when the value of the dollar rises against the foreign currency in which the security is denominated and tends to increase when the value of the dollar declines against such foreign currency. A fund may enter into forward foreign currency exchange contracts to reduce a fund's exposure to foreign currency exchange rate fluctuations. The net U.S. dollar value of foreign currency underlying all contractual commitments held by a fund and the resulting unrealized appreciation or depreciation are determined daily. Realized gain or loss is recorded upon the termination of the contract. Net realized and unrealized gains or losses occurring during the
holding period of forward foreign currency exchange contracts are a component of net realized gain (loss) on forward foreign currency exchange contract transactions and change in net unrealized appreciation (depreciation) on forward foreign currency exchange contracts, respectively. A fund bears the risk of an unfavorable change in the foreign currency exchange rate underlying the forward contract. Additionally, losses, up to the fair value, may arise if the counterparties do not perform under the contract terms. The fund's average U.S. dollar exposure to foreign currency risk derivative instruments held during the period was $3,650,942.
The value of foreign currency risk derivative instruments as of October 31, 2019, is disclosed on the Statement of Assets and Liabilities as an asset of $13,685 in unrealized appreciation on forward foreign currency exchange contracts and a liability of $1,205 in unrealized depreciation on forward foreign currency exchange contracts. For the year ended October 31, 2019, the effect of foreign currency risk derivative instruments on the Statement of Operations was $365,770 in net realized gain (loss) on forward foreign currency exchange contract transactions and $(145,753) in change in net unrealized appreciation (depreciation) on forward foreign currency exchange contracts.
7. Risk Factors
The fund is owned by a relatively small number of shareholders, and in the event such shareholders redeem, the ongoing operations of the fund may be at risk.
The fund invests in common stocks of small companies. Because of this, the fund may be subject to greater risk and market fluctuations than a fund investing in larger, more established companies.
8. Federal Tax Information
The tax character of distributions paid during the years ended October 31, 2019 and October 31, 2018 were as follows:
|
| | | | | | |
| | 2019 | 2018 |
| Distributions Paid From | | |
| Ordinary income | $ | 23,908,173 |
| $ | 4,294,367 |
|
| Long-term capital gains | $ | 118,675,312 |
| $ | 51,434,925 |
|
The book-basis character of distributions made during the year from net investment income or net realized gains may differ from their ultimate characterization for federal income tax purposes. These differences reflect the differing character of certain income items and net realized gains and losses for financial statement and tax purposes, and may result in reclassification among certain capital accounts on the financial statements.
As of period end, the federal tax cost of investments and the components of distributable earnings on a tax-basis were as follows:
|
| | | |
| Federal tax cost of investments | $ | 496,287,862 |
|
| Gross tax appreciation of investments | $ | 122,867,683 |
|
| Gross tax depreciation of investments | (13,883,784 | ) |
| Net tax appreciation (depreciation) of investments | $ | 108,983,899 |
|
| Undistributed ordinary income | $ | 2,984,902 |
|
| Accumulated long-term gains | $ | 78,797,570 |
|
The difference between book-basis and tax-basis unrealized appreciation (depreciation) is attributable primarily to the tax deferral of losses on wash sales.
|
| | | | | | | | | | | | | | | | | |
| For a Share Outstanding Throughout the Years Ended October 31 (except as noted) | | | | | | | | |
| Per-Share Data | | | | | | | | | Ratios and Supplemental Data | |
| | | Income From Investment Operations: | Distributions From: | | | Ratio to Average Net Assets of: | | |
| | Net Asset
Value,
Beginning
of Period | Net
Investment
Income
(Loss)(1) | Net
Realized
and
Unrealized
Gain (Loss) | Total From
Investment
Operations | Net
Investment
Income | Net
Realized
Gains | Total
Distributions | Net Asset
Value,
End
of Period | Total
Return(2) | Operating
Expenses | Operating
Expenses
(before
expense
waiver) | Net
Investment
Income
(Loss) | Net
Investment
Income
(Loss)
(before
expense
waiver) | Portfolio
Turnover
Rate | Net
Assets,
End of
Period
(in thousands) |
| G Class | | | | | | | | | | | | | | |
| 2019 | $14.53 | 0.08 | 1.66 | 1.74 | (0.12) | (3.19) | (3.31) | $12.96 | 18.18% | 0.01% | 0.66% | 0.62% | (0.03)% | 92% |
| $601,824 |
|
| 2018 | $14.41 | 0.10 | 1.05 | 1.15 | (0.05) | (0.98) | (1.03) | $14.53 | 8.19% | 0.00%(3) | 0.65% | 0.71% | 0.06% | 90% |
| $691,805 |
|
| 2017 | $12.31 | 0.04 | 2.50 | 2.54 | — | (0.44) | (0.44) | $14.41 | 21.29% | 0.58% | 0.76% | 0.27% | 0.09% | 67% |
| $822,910 |
|
| 2016 | $13.65 | —(4) | (0.28) | (0.28) | — | (1.06) | (1.06) | $12.31 | (2.01)% | 0.80% | 0.80% | (0.02)% | (0.02)% | 73% |
| $649,951 |
|
| 2015 | $13.37 | (0.03) | 0.93 | 0.90 | — | (0.62) | (0.62) | $13.65 | 7.20% | 0.80% | 0.80% | (0.22)% | (0.22)% | 83% |
| $609,841 |
|
|
|
| Notes to Financial Highlights |
| |
| (1) | Computed using average shares outstanding throughout the period. |
| |
| (2) | Total returns are calculated based on the net asset value of the last business day. Total returns for periods less than one year are not annualized. |
| |
| (3) | Ratio was less than 0.005%. |
| |
| (4) | Per-share amount was less than $0.005. |
See Notes to Financial Statements.
|
|
| Report of Independent Registered Public Accounting Firm |
To the Shareholders and the Board of Directors of American Century Mutual Funds, Inc.:
Opinion on the Financial Statements and Financial Highlights
We have audited the accompanying statement of assets and liabilities, including the schedule of investments, of NT Heritage Fund, one of the funds constituting the American Century Mutual Funds, Inc. (the "Fund"), as of October 31, 2019, the related statement of operations for the year then ended, the statements of changes in net assets for each of the two years in the period then ended, the financial highlights for each of the five years in the period then ended, and the related notes. In our opinion, the financial statements and financial highlights present fairly, in all material respects, the financial position of NT Heritage Fund of the American Century Mutual Funds, Inc. as of October 31, 2019, the results of its operations for the year then ended, the changes in its net assets for each of the two years in the period then ended, and the financial highlights for each of the five years in the period then ended, in conformity with accounting principles generally accepted in the United States of America.
Basis for Opinion
These financial statements and financial highlights are the responsibility of the Fund's management. Our responsibility is to express an opinion on the Fund’s financial statements and financial highlights based on our audits. We are a public accounting firm registered with the Public Company Accounting Oversight Board (United States) (PCAOB) and are required to be independent with respect to the Fund in accordance with the U.S. federal securities laws and the applicable rules and regulations of the Securities and Exchange Commission and the PCAOB.
We conducted our audits in accordance with the standards of the PCAOB. Those standards require that we plan and perform the audit to obtain reasonable assurance about whether the financial statements and financial highlights are free of material misstatement, whether due to error or fraud. The Fund is not required to have, nor were we engaged to perform, an audit of its internal control over financial reporting. As part of our audits we are required to obtain an understanding of internal control over financial reporting but not for the purpose of expressing an opinion on the effectiveness of the Fund’s internal control over financial reporting. Accordingly, we express no such opinion.
Our audits included performing procedures to assess the risks of material misstatement of the financial statements and financial highlights, whether due to error or fraud, and performing procedures that respond to those risks. Such procedures included examining, on a test basis, evidence regarding the amounts and disclosures in the financial statements and financial highlights. Our audits also included evaluating the accounting principles used and significant estimates made by management, as well as evaluating the overall presentation of the financial statements and financial highlights. Our procedures included confirmation of securities owned as of October 31, 2019, by correspondence with the custodian and brokers; when replies were not received from brokers, we performed other auditing procedures. We believe that our audits provide a reasonable basis for our opinion.
DELOITTE & TOUCHE LLP
Kansas City, Missouri
December 16, 2019
We have served as the auditor of one or more American Century investment companies since 1997.
The Board of Directors
The individuals listed below serve as directors of the funds. Each director will continue to serve in this capacity until death, retirement, resignation or removal from office. The board has adopted a mandatory retirement age for directors who are not “interested persons,” as that term is defined in the Investment Company Act (independent directors). Independent directors shall retire by December 31 of the year in which they reach their 75th birthday.
Mr. Thomas is an “interested person” because he currently serves as President and Chief Executive Officer of American Century Companies, Inc. (ACC), the parent company of American Century Investment Management, Inc. (ACIM or the advisor). The other directors (more than three-fourths of the total number) are independent. They are not employees, directors or officers of, and have no financial interest in, ACC or any of its wholly owned, direct or indirect, subsidiaries, including ACIM, American Century Investment Services, Inc. (ACIS) and American Century Services, LLC (ACS), and they do not have any other affiliations, positions or relationships that would cause them to be considered “interested persons” under the Investment Company Act. The directors serve in this capacity for seven (in the case of Jonathan S. Thomas, 16; and Stephen E. Yates, 8) registered investment companies in the American Century Investments family of funds.
The following table presents additional information about the directors. The mailing address for each director is 4500 Main Street, Kansas City, Missouri 64111.
|
| | | | | |
Name
(Year of Birth) | Position(s) Held with Funds | Length of Time Served | Principal Occupation(s) During Past 5 Years | Number of American Century Portfolios Overseen by Director | Other Directorships Held During Past 5 Years |
| Independent Directors |
|
|
| Thomas W. Bunn (1953) | Director | Since 2017 | Retired | 66 | SquareTwo Financial; Barings (formerly Babson Capital Funds Trust) (2013 to 2016) |
Chris H. Cheesman
(1962)
| Director | Since 2019
| Retired. Senior Vice President & Chief Audit Executive, AllianceBernstein (1999 to 2018)
| 66 | None |
Barry Fink
(1955) | Director | Since 2012 (independent since 2016) | Retired | 66 | None |
Rajesh K. Gupta
(1960)
| Director | Since 2019
| Partner Emeritus, SeaCrest Investment Management and SeaCrest Wealth Management (2019 to Present); Chief Executive Officer and Chief Investment Officer, SeaCrest Investment Management (2006 to 2019); Chief Executive Officer and Chief Investment Officer, SeaCrest Wealth Management (2008 to 2019)
| 66 | None |
|
| | | | | |
Name
(Year of Birth) | Position(s) Held with Funds | Length of Time Served | Principal Occupation(s) During Past 5 Years | Number of American Century Portfolios Overseen by Director | Other Directorships Held During Past 5 Years |
| Independent Directors |
|
|
Lynn Jenkins
(1963)
| Director | Since 2019
| United States Representative, U.S. House of Representatives (2009 to 2018) | 66 | MGP Ingredients, Inc. |
Jan M. Lewis
(1957) | Director | Since 2011 | Retired | 66 | None |
John R. Whitten
(1946) | Director | Since 2008 | Retired | 66 | Onto Innovation Inc.; Rudolph Technologies, Inc. (2006 to 2019) |
Stephen E. Yates
(1948) | Director and Chairman of the Board | Since 2012 (Chairman since 2018) | Retired | 81 | None |
| Interested Director |
|
Jonathan S. Thomas
(1963) | Director | Since 2007 | President and Chief Executive Officer, ACC (2007 to present). Also serves as Chief Executive Officer, ACS; Executive Vice President, ACIM; Director, ACC, ACIM and other ACC subsidiaries | 125 | BioMed Valley Discoveries, Inc. |
The Statement of Additional Information has additional information about the fund's directors and is available without charge, upon request, by calling 1-800-345-2021.
Officers
The following table presents certain information about the executive officers of the funds. Each officer serves as an officer for each of the 16 (in the case of Robert J. Leach, 15) investment companies in the American Century family of funds. No officer is compensated for his or her service as an officer of the funds. The listed officers are interested persons of the funds and are appointed or re-appointed on an annual basis. The mailing address for each officer listed below is 4500 Main Street, Kansas City, Missouri 64111.
|
| | |
Name
(Year of Birth) | Offices with the Funds | Principal Occupation(s) During the Past Five Years |
Patrick Bannigan
(1965) | President since 2019 | Executive Vice President and Director, ACC (2012 to present); Chief Financial Officer, Chief Accounting Officer and Treasurer, ACC (2015 to present); Chief Operating Officer, ACC (2012-2015). Also serves as President, ACS; Vice President, ACIM; Chief Financial Officer, Chief Accounting Officer and/or Director, ACIM, ACS and other ACC subsidiaries |
R. Wes Campbell
(1974) | Chief Financial Officer and Treasurer since 2018 | Investment Operations and Investment Accounting, ACS (2000 to present) |
Amy D. Shelton
(1964) | Chief Compliance Officer and Vice President since 2014 | Chief Compliance Officer, American Century funds, (2014 to present); Chief Compliance Officer, ACIM (2014 to present); Chief Compliance Officer, ACIS (2009 to present). Also serves as Vice President, ACIS |
Charles A. Etherington
(1957) | General Counsel since 2007 and Senior Vice President since 2006 | Attorney, ACC (1994 to present); Vice President, ACC (2005 to present); General Counsel, ACC (2007 to present). Also serves as General Counsel, ACIM, ACS, ACIS and other ACC subsidiaries; and Senior Vice President, ACIM and ACS |
C. Jean Wade
(1964) | Vice President since 2012 | Senior Vice President, ACS (2017 to present); Vice President, ACS (2000 to 2017)
|
Robert J. Leach
(1966) | Vice President since 2006 | Vice President, ACS (2000 to present) |
David H. Reinmiller
(1963) | Vice President since 2000 | Attorney, ACC (1994 to present). Also serves as Vice President, ACIM and ACS |
Ward D. Stauffer
(1960) | Secretary since 2005 | Attorney, ACC (2003 to present) |
|
|
| Approval of Management Agreement |
At a meeting held on June 26, 2019, the Fund’s Board of Directors (the "Board") unanimously approved the renewal of the management agreement pursuant to which American Century Investment Management, Inc. (the “Advisor”) acts as the investment advisor for the Fund. Under Section 15(c) of the Investment Company Act, contracts for investment advisory services are required to be reviewed, evaluated, and approved by a majority of a fund’s directors (the “Directors”), including a majority of the independent Directors, each year.
Prior to its consideration of the renewal of the management agreement, the Directors requested and reviewed extensive data and information compiled by the Advisor and certain independent providers of evaluation data concerning the Fund and the services provided to the Fund by the Advisor. This review was in addition to the oversight and evaluation undertaken by the Board and its committees on a continual basis and the information received was supplemental to the extensive information that the Board and its committees receive and consider throughout the year.
In connection with its consideration of the renewal of the management agreement, the Board’s review and evaluation of the services provided by the Advisor included, but was not limited to, the following:
| |
| • | the nature, extent, and quality of investment management, shareholder services, and other services provided and to be provided to the Fund; |
| |
| • | the wide range of other programs and services provided and to be provided to the Fund and its shareholders on a routine and non-routine basis; |
| |
| • | the investment performance of the Fund, including data comparing the Fund's performance to appropriate benchmarks and/or a peer group of other mutual funds with similar investment objectives and strategies; |
| |
| • | the cost of owning the Fund compared to the cost of owning similar funds; |
| |
| • | the compliance policies, procedures, and regulatory experience of the Advisor and the Fund's service providers; |
| |
| • | financial data showing the cost of services provided to the Fund, the profitability of the Fund to the Advisor, and the overall profitability of the Advisor; |
| |
| • | strategic plans of the Advisor; |
| |
| • | any economies of scale associated with the Advisor’s management of the Fund and other accounts; |
| |
| • | services provided and charges to the Advisor's other investment management clients; |
| |
| • | acquired fund fees and expenses; |
| |
| • | payments and practices in connection with financial intermediaries holding shares of the Fund and the services provided by intermediaries in connection therewith; and |
| |
| • | any collateral benefits derived by the Advisor from the management of the Fund. |
The Directors held three in-person meetings and one telephonic meeting to review and discuss the information provided. The independent Directors also reviewed responses to supplemental information requests provided by the Directors to the Advisor and held active discussions with the Advisor regarding the renewal of the management agreement. The independent Directors had the benefit of the advice of their independent counsel throughout the process.
Factors Considered
The Directors considered all of the information provided by the Advisor, the independent data providers, and independent counsel in connection with the approval. They determined that the information was sufficient for them to evaluate the management agreement for the Fund. In connection with their review, the Directors did not identify any single factor as being all-important or
controlling, and each Director may have attributed different levels of importance to different factors. In deciding to renew the management agreement, the Board based its decision on a number of factors, including without limitation the following:
Nature, Extent and Quality of Services — Generally. Under the management agreement, the Advisor is responsible for providing or arranging for all services necessary for the operation of the Fund. The Board noted that the Advisor provides or arranges at its own expense a wide variety of services including without limitation the following:
| |
| • | portfolio research and security selection |
| |
| • | daily valuation of the Fund’s portfolio |
| |
| • | shareholder servicing and transfer agency, including shareholder confirmations, recordkeeping, and communications |
| |
| • | legal services (except the independent Directors’ counsel) |
| |
| • | regulatory and portfolio compliance |
| |
| • | marketing and distribution (except amounts paid by the Fund under Rule 12b-1 plans) |
The Board noted that many of these services have expanded over time in terms of both quantity and complexity in response to shareholder demands, competition in the industry, changing distribution channels, and the changing regulatory environment.
Investment Management Services. The nature of the investment management services provided to the Fund is quite complex and allows Fund shareholders access to professional money management, instant diversification of their investments within an asset class, the opportunity to easily diversify among asset classes by investing in or exchanging among various American Century Investments funds, and liquidity. In evaluating investment performance, the Board expects the Advisor to manage the Fund in accordance with its investment objectives and approved strategies. Further, the Directors recognize that the Advisor has an obligation to monitor trading activities, and in particular to seek the best execution of fund trades, and to evaluate the use of and payment for research. In providing these services, the Advisor utilizes teams of investment professionals (portfolio managers, analysts, research assistants, and securities traders) who require extensive information technology, research, training, compliance, and other systems to conduct their business. The Board, directly and through its Fund Performance Review Committee, provides oversight of the investment performance process. It regularly reviews investment performance information for the Fund, together with comparative information for appropriate benchmarks and/or peer groups of similarly-managed funds, over different time horizons. The Directors also review investment performance information during the management agreement renewal process. If performance concerns are identified, the Fund receives special reviews until performance improves, during which the Board discusses with the Advisor the reasons for such results (e.g., market conditions, security selection) and any efforts being undertaken to improve performance. The Fund’s performance was above its benchmark for the one-year period and below its benchmark for the three-, five-, and ten-year periods reviewed by the Board. The Board discussed the Fund's performance with the Advisor and was satisfied with the efforts being undertaken by the Advisor. The Board found the investment management services provided by the Advisor to the Fund to be satisfactory and consistent with the management agreement.
Shareholder and Other Services. Under the management agreement, the Advisor provides the Fund with a comprehensive package of transfer agency, shareholder, and other services. The Board, directly and through various committees of the Board, regularly reviews reports and evaluations of such services at its regular meetings. These reports include, but are not limited to, information regarding the operational efficiency and accuracy of the shareholder and transfer agency services provided, staffing levels, shareholder satisfaction, technology support (including
cyber security), new products and services offered to Fund shareholders, securities trading activities, portfolio valuation services, auditing services, and legal and operational compliance activities. The Board found the services provided by the Advisor to the Fund under the management agreement to be competitive and of high quality.
Costs of Services and Profitability. The Advisor provides detailed information concerning its cost of providing various services to the Fund, its profitability in managing the Fund (pre- and post-distribution), its overall profitability, and its financial condition. The Directors have reviewed with the Advisor the methodology used to prepare this financial information. This information is considered in evaluating the Advisor’s financial condition, its ability to continue to provide services under the management agreement, and the reasonableness of the current management fee. The Board concluded that the Advisor’s profits were reasonable in light of the services provided to the Fund.
Ethics. The Board generally considers the Advisor’s commitment to providing quality services to shareholders and to conducting its business ethically. They noted that the Advisor’s practices generally meet or exceed industry best practices.
Economies of Scale. The Board also reviewed information provided by the Advisor regarding the possible existence of economies of scale in connection with the management of the Fund. The Board concluded that economies of scale are difficult to measure and predict with precision, especially on a fund-by-fund basis. The Board concluded that the Advisor is appropriately sharing economies of scale through its competitive fee structure, offering competitive fees from fund inception, and through reinvestment in its business to provide shareholders additional content and services.
Comparison to Other Funds’ Fees. The management agreement provides that the Fund pays the Advisor a single, all-inclusive (or unified) management fee for providing all services necessary for the management and operation of the Fund, other than brokerage expenses, expenses attributable to short sales, taxes, interest, extraordinary expenses, fees and expenses of the Fund’s independent Directors (including their independent legal counsel), and expenses incurred in connection with the provision of shareholder services and distribution services under a plan adopted pursuant to Rule 12b-1 under the Investment Company Act. Under the unified fee structure, the Advisor is responsible for providing all investment advisory, custody, audit, administrative, compliance, recordkeeping, marketing and shareholder services, or arranging and supervising third parties to provide such services. By contrast, most other funds are charged a variety of fees, including an investment advisory fee, a transfer agency fee, an administrative fee, distribution charges, and other expenses. Other than their investment advisory fees and any applicable Rule 12b-1 distribution fees, all other components of the total fees charged by these other funds may be increased without shareholder approval. The Board believes the unified fee structure is a benefit to Fund shareholders because it clearly discloses to shareholders the cost of owning Fund shares, and, since the unified fee cannot be increased without a vote of Fund shareholders, it shifts to the Advisor the risk of increased costs of operating the Fund and provides a direct incentive to minimize administrative inefficiencies. Part of the Board’s analysis of fee levels involves reviewing certain evaluative data compiled by an independent provider comparing the Fund’s unified fee to the total expense ratios of its peers. The unified fee charged to shareholders of the Fund was below the median of the total expense ratios of the Fund’s peer expense universe. The Board concluded that the management fee paid by the Fund to the Advisor under the management agreement is reasonable in light of the services provided to the Fund.
Comparison to Fees and Services Provided to Other Clients of the Advisor. The Directors also requested and received information from the Advisor concerning the nature of the services, fees, costs, and profitability of its advisory services to advisory clients other than the Fund. They observed that these varying types of client accounts require different services and involve different regulatory and entrepreneurial risks than the management of the Fund. The Board analyzed this information and concluded that the fees charged and services provided to the Fund were reasonable by comparison.
Payments to Intermediaries. The Directors also requested and received a description of payments made to intermediaries by the Fund and the Advisor and services provided in response thereto. These payments include various payments made by the Fund or the Advisor to different types of intermediaries and recordkeepers for distribution and service activities provided for the Fund. The Board reviewed such information and received representations from the Advisor that all such payments by the Fund were made pursuant to the Fund's Rule 12b-1 Plan and that all such payments by the Advisor were made from the Advisor’s resources and reasonable profits. The Board found such payments to be reasonable in scope and purpose.
Collateral or “Fall-Out” Benefits Derived by the Advisor. The Board considered the existence of collateral benefits the Advisor may receive as a result of its relationship with the Fund. They concluded that the Advisor’s primary business is managing mutual funds and it generally does not use fund or shareholder information to generate profits in other lines of business, and therefore does not derive any significant collateral benefits from them. The Board noted that additional assets from other clients may offer the Advisor some benefit from increased leverage with service providers and counterparties. Additionally, the Advisor may receive proprietary research from broker-dealers that execute fund portfolio transactions, which the Board concluded is likely to benefit other clients of the Advisor, as well as Fund shareholders. The Board also determined that the Advisor is able to provide investment management services to certain clients other than the Fund, at least in part, due to its existing infrastructure built to serve the fund complex. The Board concluded that appropriate allocation methodologies had been employed to assign resources and the cost of those resources to these other clients and, where expressly provided, these other client assets may be included with the assets of the Fund to determine breakpoints in the management fee schedule.
Existing Relationship. The Board also considered whether there was any reason for not continuing the existing arrangement with the Advisor. In this regard, the Board was mindful of the potential disruptions of the Fund’s operations and various risks, uncertainties, and other effects that could occur as a result of a decision not to continue such relationship. In particular, the Board recognized that most shareholders have invested in the Fund on the strength of the Advisor’s industry standing and reputation and in the expectation that the Advisor will have a continuing role in providing advisory services to the Fund.
Conclusion of the Directors. As a result of this process, the Board, including all of the independent Directors, taking into account all of the factors discussed above and the information provided by the Advisor and others in connection with its review and throughout the year, determined that the management fee is fair and reasonable in light of the services provided and that the investment management agreement between the Fund and the Advisor should be renewed.
Retirement Account Information
As required by law, distributions you receive from certain retirement accounts are subject to federal income tax withholding, unless you elect not to have withholding apply*. Tax will be withheld on the total amount withdrawn even though you may be receiving amounts that are not subject to withholding, such as nondeductible contributions. In such case, excess amounts of withholding could occur. You may adjust your withholding election so that a greater or lesser amount will be withheld.
If you don’t want us to withhold on this amount, you must notify us to not withhold the federal income tax. You may notify us in writing or in certain situations by telephone or through other electronic means. For systematic withdrawals, your withholding election will remain in effect until revoked or changed by filing a new election. You have the right to revoke your election at any time and change your withholding percentage for future distributions.
Remember, even if you elect not to have income tax withheld, you are liable for paying income tax on the taxable portion of your withdrawal. If you elect not to have income tax withheld or you don’t have enough income tax withheld, you may be responsible for payment of estimated tax. You may incur penalties under the estimated tax rules if your withholding and estimated tax payments are not sufficient. You can reduce or defer the income tax on a distribution by directly or indirectly rolling such distribution over to another IRA or eligible plan. You should consult your tax advisor for additional information.
State tax will be withheld if, at the time of your distribution, your address is within one of the mandatory withholding states and you have federal income tax withheld (or as otherwise required by state law). State taxes will be withheld from your distribution in accordance with the respective state rules.
*Some 403(b), 457 and qualified retirement plan distributions may be subject to 20% mandatory withholding, as they are subject to special tax and withholding rules. Your plan administrator or plan sponsor is required to provide you with a special tax notice explaining those rules at the time you request a distribution. If applicable, federal and/or state taxes may be withheld from your distribution amount.
Proxy Voting Policies
A description of the policies that the fund's investment advisor uses in exercising the voting rights associated with the securities purchased and/or held by the fund is available without charge, upon request, by calling 1-800-345-2021. It is also available on American Century Investments’ website at americancentury.com/proxy and on the Securities and Exchange Commission’s website at sec.gov. Information regarding how the investment advisor voted proxies relating to portfolio securities during the most recent 12-month period ended June 30 is available on americancentury.com/proxy. It is also available at sec.gov.
Quarterly Portfolio Disclosure
The fund files its complete schedule of portfolio holdings with the Securities and Exchange Commission (SEC) for the first and third quarters of each fiscal year on Form N-Q or as an exhibit to its reports on Form N-PORT. The fund’s Forms N-Q and Form N-PORT reports are available on the SEC’s website at sec.gov. The fund also makes its complete schedule of portfolio holdings for the most recent quarter of its fiscal year available on its website at americancentury.com and, upon request, by calling 1-800-345-2021.
Other Tax Information
The following information is provided pursuant to provisions of the Internal Revenue Code.
The fund hereby designates up to the maximum amount allowable as qualified dividend income for the fiscal year ended October 31, 2019.
For corporate taxpayers, the fund hereby designates $4,443,287, or up to the maximum amount allowable, of ordinary income distributions paid during the fiscal year ended October 31, 2019 as qualified for the corporate dividends received deduction.
The fund hereby designates $18,806,431 as qualified short-term capital gain distributions for purposes of Internal Revenue Code Section 871 for the fiscal year ended October 31, 2019.
The fund hereby designates $123,574,283, or up to the maximum amount allowable, as long-term capital gain distributions (20% rate gain distributions) for the fiscal year ended October 31, 2019.
The fund utilized earnings and profits of $5,137,130 distributed to shareholders on redemption of shares as part of the dividends paid deduction (tax equalization).
|
| | |
| |
| | | |
| Contact Us | americancentury.com | |
| Automated Information Line | 1-800-345-8765 | |
| Investor Services Representative | 1-800-345-2021 or 816-531-5575 | |
| Investors Using Advisors | 1-800-378-9878 | |
| Business, Not-For-Profit, Employer-Sponsored Retirement Plans | 1-800-345-3533 | |
| Banks and Trust Companies, Broker-Dealers, Financial Professionals, Insurance Companies | 1-800-345-6488 | |
| Telecommunications Relay Service for the Deaf | 711 | |
| | | |
| American Century Mutual Funds, Inc. | |
| | | |
Investment Advisor: American Century Investment Management, Inc. Kansas City, Missouri | |
| | | |
| This report and the statements it contains are submitted for the general information of our shareholders. The report is not authorized for distribution to prospective investors unless preceded or accompanied by an effective prospectus. | |
| | | |
©2019 American Century Proprietary Holdings, Inc. All rights reserved.
CL-ANN-90987 1912 | |
|
| |
| | |
| | Annual Report |
| | |
| | October 31, 2019 |
| | |
| | Select Fund |
| | Investor Class (TWCIX) |
| | I Class (TWSIX) |
| | Y Class (ASLWX) |
| | A Class (TWCAX) |
| | C Class (ACSLX) |
| | R Class (ASERX) |
| | R5 Class (ASLGX) |
| | R6 Class (ASDEX) |
Beginning on January 1, 2021, as permitted by regulations adopted by the Securities and Exchange Commission, paper copies of the fund’s shareholder reports like this one will no longer be sent by mail, unless you specifically request paper copies of the reports from the fund or from your financial intermediary, such as a broker-dealer or bank. Instead, the reports will be made available on a website, and you will be notified by mail each time a report is posted and provided with a website link to access the report.
If you already elected to receive shareholder reports electronically, you will not be affected by this change and you need not take any action. You may elect to receive shareholder reports and other communications from the fund or your financial intermediary electronically by calling or sending an email request to your appropriate contacts as listed on the back cover of this report.
You may elect to receive all future reports in paper free of charge. You can inform the fund or your financial intermediary that you wish to continue receiving paper copies of your shareholder reports by calling or sending an email request to your appropriate contacts as listed on the back cover of this report. Your election to receive reports in paper will apply to all funds held with the fund complex/your financial intermediary.
|
| | |
| President’s Letter | 2 |
|
| Performance | 3 |
|
| Portfolio Commentary | |
|
| Fund Characteristics | |
|
| Shareholder Fee Example | |
|
| Schedule of Investments | |
|
| Statement of Assets and Liabilities | |
|
| Statement of Operations | |
|
| Statement of Changes in Net Assets | |
|
| Notes to Financial Statements | |
|
| Financial Highlights | |
|
| Report of Independent Registered Public Accounting Firm | |
|
| Management | |
|
| Approval of Management Agreement | |
|
| Additional Information | |
|
Any opinions expressed in this report reflect those of the author as of the date of the report, and do not necessarily represent the opinions of American Century Investments® or any other person in the American Century Investments organization. Any such opinions are subject to change at any time based upon market or other conditions and American Century Investments disclaims any responsibility to update such opinions. These opinions may not be relied upon as investment advice and, because investment decisions made by American Century Investments funds are based on numerous factors, may not be relied upon as an indication of trading intent on behalf of any American Century Investments fund. Security examples are used for representational purposes only and are not intended as recommendations to purchase or sell securities. Performance information for comparative indices and securities is provided to American Century Investments by third party vendors. To the best of American Century Investments’ knowledge, such information is accurate at the time of printing.
Jonathan Thomas
Dear Investor:
Thank you for reviewing this annual report for the 12 months ended October 31, 2019. Annual reports help convey important information about fund returns, including market factors that affected performance. For additional investment and market insights, please visit americancentury.com.
Stocks, Bonds Delivered Solid Gains
U.S. and global stocks, bonds and real estate investments generally delivered strong gains for the 12-month period. Stocks and other riskier assets rebounded from a late-2018 sell-off to post robust returns for the 12 months overall. Global bonds benefited from safe-haven buying early in the period and a declining interest rate environment overall.
Fed’s Policy Pivot Improved Investor Sentiment
In the final months of 2018, mounting concerns about slowing global economic and earnings growth, tariffs and Federal Reserve (Fed) policy soured investor sentiment, driving global stocks lower. After raising rates in September 2018, the Fed hiked again in December and delivered a surprisingly bullish 2019 rate-hike outlook, which intensified the sell-off among stocks and other riskier assets. Meanwhile, the risk-off climate sparked a flight to quality, which drove U.S. and other government bond yields lower and benefited global bond returns.
A key policy pivot from the Fed helped improve equity investor sentiment beginning in early 2019. The central bank abruptly ended its rate-hike campaign and adopted a dovish tone amid weaker global growth and inflation. Additionally, investors’ worst-case fears about trade and corporate earnings generally eased, which also aided stocks and other riskier assets. At the same time, government bond yields continued to fall on moderating global growth data, muted inflation and accommodative central bank policy in the U.S., Europe and Japan. By July, concerns about global economic risks prompted the Fed to cut short-term interest rates for the first time in 10 years. The Fed followed up with additional rate cuts in September and October. This backdrop supported continued gains for fixed-income and other interest rate-sensitive assets.
Looking ahead, we expect volatility to remain a formidable factor as investors react to global growth and trade trends, central bank policy and geopolitical developments. We believe this scenario underscores the importance of using professionally managed portfolios in pursuit of investment goals. We appreciate your continued trust and confidence in us.
Sincerely,
Jonathan Thomas
President and Chief Executive Officer
American Century Investments
|
| | | | | | |
| Total Returns as of October 31, 2019 |
| | | | Average Annual Returns | |
| | Ticker Symbol | 1 year | 5 years | 10 years | Since Inception | Inception Date |
| Investor Class | TWCIX | 15.98% | 12.60% | 14.05% | — | 6/30/71 |
| Russell 1000 Growth Index | — | 17.10% | 13.42% | 15.41% | — | — |
| I Class | TWSIX | 16.22% | 12.83% | 14.29% | — | 3/13/97 |
| Y Class | ASLWX | 16.38% | — | — | 15.89% | 4/10/17 |
| A Class | TWCAX | | | | | 8/8/97 |
| No sales charge | | 15.69% | 12.33% | 13.77% | — | |
| With sales charge | | 9.04% | 11.00% | 13.10% | — | |
| C Class | ACSLX | 14.82% | 11.48% | 12.92% | — | 1/31/03 |
| R Class | ASERX | 15.40% | 12.05% | 13.49% | — | 7/29/05 |
| R5 Class | ASLGX | 16.20% | — | — | 15.70% | 4/10/17 |
| R6 Class | ASDEX | 16.39% | 13.00% | — | 14.38% | 7/26/13 |
Average annual returns since inception are presented when ten years of performance history is not available.
Although the fund’s actual inception date was October 31, 1958, the Investor Class inception date corresponds with the investment advisor’s implementation of its current investment philosophy and practices.
Fund returns would have been lower if a portion of the fees had not been waived.
Sales charges include initial sales charges and contingent deferred sales charges (CDSCs), as applicable. A Class shares have a 5.75% maximum initial sales charge and may be subject to a maximum CDSC of 1.00%. C Class shares redeemed within 12 months of purchase are subject to a maximum CDSC of 1.00%. The SEC requires that mutual funds provide performance information net of maximum sales charges in all cases where charges could be applied.
Data presented reflect past performance. Past performance is no guarantee of future results. Current performance may be higher or lower than the performance shown. Total returns for periods less than one year are not annualized. Investment return and principal value will fluctuate, and redemption value may be more or less than original cost. Data assumes reinvestment of dividends and capital gains, and none of the charts reflect the deduction of taxes that a shareholder would pay on fund distributions or the redemption of fund shares. To obtain performance data current to the most recent month end, please call 1-800-345-2021 or visit americancentury.com. For additional information about the fund, please consult the prospectus.
|
|
| Growth of $10,000 Over 10 Years |
| $10,000 investment made October 31, 2009 |
| Performance for other share classes will vary due to differences in fee structure. |
|
| |
| Value on October 31, 2019 |
| | Investor Class — $37,273 |
| |
| | Russell 1000 Growth Index — $41,938 |
| |
Ending value of Investor Class would have been lower if a portion of the fees had not been waived.
|
| | | | | | | |
| Total Annual Fund Operating Expenses |
| Investor Class | I Class | Y Class | A Class | C Class | R Class | R5 Class | R6 Class |
| 0.99% | 0.79% | 0.64% | 1.24% | 1.99% | 1.49% | 0.79% | 0.64% |
The total annual fund operating expenses shown is as stated in the fund’s prospectus current as of the date of this report. The prospectus may vary from the expense ratio shown elsewhere in this report because it is based on a different time period, includes acquired fund fees and expenses, and, if applicable, does not include fee waivers or expense reimbursements.
Data presented reflect past performance. Past performance is no guarantee of future results. Current performance may be higher or lower than the performance shown. Total returns for periods less than one year are not annualized. Investment return and principal value will fluctuate, and redemption value may be more or less than original cost. Data assumes reinvestment of dividends and capital gains, and none of the charts reflect the deduction of taxes that a shareholder would pay on fund distributions or the redemption of fund shares. To obtain performance data current to the most recent month end, please call 1-800-345-2021 or visit americancentury.com. For additional information about the fund, please consult the prospectus.
Portfolio Managers: Keith Lee, Michael Li and Chris Krantz
Performance Summary
Select returned 15.98%* for the 12 months ended October 31, 2019, lagging the 17.10% return of the portfolio’s benchmark, the Russell 1000 Growth Index.
U.S. stocks posted solid returns during the reporting period. Growth stocks outperformed value stocks by a wide margin. Within the Russell 1000 Growth Index, all sectors posted gains except for energy, which struggled with the declining price of oil. The small real estate segment—a sector that rarely offers the kind of growth characteristics we seek—reported the top total return, but index gains were largely driven by the strong performance of information technology and consumer discretionary stocks.
An overweight allocation and stock selection in the energy sector detracted from performance relative to the benchmark. Stock decisions in the health care sector also hampered performance. Stock decisions in the industrials, consumer discretionary and consumer staples sectors benefited relative performance.
Energy Stocks Led Detractors
Within the energy sector, oil, gas and consumable fuels stocks hampered performance relative to the benchmark. The stock price of oil and gas exploration and production company EOG Resources fell as the price of crude oil declined. We continue to believe EOG is a high-quality company benefiting from a durable competitive advantage as a result of its experienced management team and innovative use of technology.
An overweight allocation to biotechnology stocks hurt relative performance in the health care sector. Biogen’s stock declined after the company halted trials of its Alzheimer’s drug, aducanumab, in March 2019. However, the company announced in October that a subsequent review of the data from more patients showed significant improvements in those who received high doses in one trial. As a result, the company said it would submit the drug for Food and Drug Administration approval. Biogen also has the leading multiple sclerosis franchise, which has generated significant cash flow that can be invested in other clinical development programs. Regeneron Pharmaceuticals was another detractor in the industry. The stock suffered from political concerns affecting drug company stocks generally. Regeneron uses its genetic database, one of the world’s most comprehensive, to develop therapies in areas such as liver diseases. Health insurer UnitedHealth Group detracted as the presidential campaign kept regulatory and pricing risk elevated. We believe the company’s use of data analytics and technology makes it well positioned to drive efficiency gains across the sector, reducing costs and improving patient outcomes.
Elsewhere, underweighting Microsoft relative to the benchmark hampered results. The company executed at a high level. Azure, Microsoft’s cloud offering, grew at a greater-than-expected pace, and the company’s Office 365 subscription service and Windows platform performed well.
Industrials Stocks Aided Performance
Professional services stocks led contributors in the industrials sector. IHS Markit was a key contributor in the industry. The London-based industrial business services firm consistently
*All fund returns referenced in this commentary are for Investor Class shares. Fund returns would have been lower if a portion of the fees had not been waived. Performance for other share classes will vary due to differences in fee structure; when Investor Class performance exceeds that of the fund’s benchmark, other share classes may not. See page 3 for returns for all share classes.
produces attractive earnings growth and margin improvement with a solid outlook. We believe the company is well positioned to capitalize on enduring, secular trends in which governments and companies across a broad swath of the global economy use the firm’s data analytics and decision tools to promote efficiency and profitability.
Not owning tobacco stocks benefited performance in the consumer staples sector. Overweighting personal products stocks also helped relative performance in the sector. The Estee Lauder Cos. was a top contributor. The cosmetics retailer outperformed due to strong earnings driven by sales in China, travel-related sales and its skin care products.
Other top contributors included payment services company MasterCard. Its stock price increased after reporting consistently strong earnings growth that exceeded expectations. Electronic payment company PayPal Holdings reported better-than-expected revenues and earnings and benefited from strong growth in usage of its peer-to-peer payment app. The Home Depot was a key contributor. We believe the company features a strong management team and attractive cash-flow generation, and it returns cash to shareholders.
Outlook
We remain confident in our belief that high-quality companies with a capability for sustained long-term growth will outperform in the long term. Our portfolio positioning reflects where we are seeing opportunities as a result of the application of that philosophy and process.
At the end of the reporting period, our largest sector overweight relative to the benchmark was communication services. The sector encompasses entertainment and communication stocks, including large portfolio holdings Facebook and Google parent Alphabet. Information technology ended the period as the largest underweight sector. However, information technology remains the largest sector allocation on an absolute basis, reflecting an abundance of high-quality, well-run companies benefiting from powerful secular changes taking place. IT services is a significant overweight, headed by a large position in payment company MasterCard.
|
| |
| OCTOBER 31, 2019 | |
| Top Ten Holdings | % of net assets |
| Apple, Inc. | 9.0% |
| Alphabet, Inc.* | 8.9% |
| MasterCard, Inc., Class A | 6.6% |
| Amazon.com, Inc. | 5.8% |
| Microsoft Corp. | 5.2% |
| UnitedHealth Group, Inc. | 3.9% |
| Facebook, Inc., Class A | 3.8% |
| PayPal Holdings, Inc. | 2.9% |
| Home Depot, Inc. (The) | 2.6% |
| TJX Cos., Inc. (The) | 2.6% |
| *Includes all classes of the issuer held by the fund. | |
| | |
| Top Five Industries | % of net assets |
| Interactive Media and Services | 12.7% |
| IT Services | 11.6% |
| Technology Hardware, Storage and Peripherals | 9.0% |
| Software | 7.9% |
| Internet and Direct Marketing Retail | 5.8% |
| | |
| Types of Investments in Portfolio | % of net assets |
| Common Stocks | 99.8% |
| Temporary Cash Investments | 0.6% |
| Other Assets and Liabilities | (0.4)% |
Fund shareholders may incur two types of costs: (1) transaction costs, including sales charges (loads) on purchase payments and redemption/exchange fees; and (2) ongoing costs, including management fees; distribution and service (12b-1) fees; and other fund expenses. This example is intended to help you understand your ongoing costs (in dollars) of investing in your fund and to compare these costs with the ongoing cost of investing in other mutual funds.
The example is based on an investment of $1,000 made at the beginning of the period and held for the entire period from May 1, 2019 to October 31, 2019.
Actual Expenses
The table provides information about actual account values and actual expenses for each class. You may use the information, together with the amount you invested, to estimate the expenses that you paid over the period. First, identify the share class you own. Then simply divide your account value by $1,000 (for example, an $8,600 account value divided by $1,000 = 8.6), then multiply the result by the number under the heading “Expenses Paid During Period” to estimate the expenses you paid on your account during this period.
If you hold Investor Class shares of any American Century Investments fund, or I Class shares of the American Century Diversified Bond Fund, in an American Century Investments account (i.e., not a financial intermediary or retirement plan account), American Century Investments may charge you a $12.50 semiannual account maintenance fee if the value of those shares is less than $10,000. We will redeem shares automatically in one of your accounts to pay the $12.50 fee. In determining your total eligible investment amount, we will include your investments in all personal accounts (including American Century Investments Brokerage accounts) registered under your Social Security number. Personal accounts include individual accounts, joint accounts, UGMA/UTMA accounts, personal trusts, Coverdell Education Savings Accounts and IRAs (including traditional, Roth, Rollover, SEP-, SARSEP- and SIMPLE-IRAs), and certain other retirement accounts. If you have only business, business retirement, employer-sponsored or American Century Investments Brokerage accounts, you are currently not subject to this fee. If you are subject to the Account Maintenance Fee, your account value could be reduced by the fee amount.
Hypothetical Example for Comparison Purposes
The table also provides information about hypothetical account values and hypothetical expenses based on the actual expense ratio of each class of your fund and an assumed rate of return of 5% per year before expenses, which is not the actual return of a fund’s share class. The hypothetical account values and expenses may not be used to estimate the actual ending account balance or expenses you paid for the period. You may use this information to compare the ongoing costs of investing in your fund and other funds. To do so, compare this 5% hypothetical example with the 5% hypothetical examples that appear in the shareholder reports of the other funds.
Please note that the expenses shown in the table are meant to highlight your ongoing costs only and do not reflect any transactional costs, such as sales charges (loads) or redemption/exchange fees. Therefore, the table is useful in comparing ongoing costs only, and will not help you determine the relative total costs of owning different funds. In addition, if these transactional costs were included, your costs would have been higher.
|
| | | | |
| Beginning
Account Value
5/1/19 | Ending
Account Value
10/31/19 | Expenses Paid
During Period(1)
5/1/19 - 10/31/19 | Annualized
Expense Ratio(1) |
| Actual | | | | |
| Investor Class | $1,000 | $1,041.90 | $4.99 | 0.97% |
| I Class | $1,000 | $1,043.00 | $3.97 | 0.77% |
| Y Class | $1,000 | $1,043.70 | $3.19 | 0.62% |
| A Class | $1,000 | $1,040.60 | $6.27 | 1.22% |
| C Class | $1,000 | $1,036.70 | $10.11 | 1.97% |
| R Class | $1,000 | $1,039.30 | $7.56 | 1.47% |
| R5 Class | $1,000 | $1,042.80 | $3.96 | 0.77% |
| R6 Class | $1,000 | $1,043.80 | $3.19 | 0.62% |
| Hypothetical | | | | |
| Investor Class | $1,000 | $1,020.32 | $4.94 | 0.97% |
| I Class | $1,000 | $1,021.32 | $3.92 | 0.77% |
| Y Class | $1,000 | $1,022.08 | $3.16 | 0.62% |
| A Class | $1,000 | $1,019.06 | $6.21 | 1.22% |
| C Class | $1,000 | $1,015.28 | $10.01 | 1.97% |
| R Class | $1,000 | $1,017.80 | $7.48 | 1.47% |
| R5 Class | $1,000 | $1,021.32 | $3.92 | 0.77% |
| R6 Class | $1,000 | $1,022.08 | $3.16 | 0.62% |
| |
| (1) | Expenses are equal to the class's annualized expense ratio listed in the table above, multiplied by the average account value over the period, multiplied by 184, the number of days in the most recent fiscal half-year, divided by 365, to reflect the one-half year period. Annualized expense ratio reflects actual expenses, including any applicable fee waivers or expense reimbursements and excluding any acquired fund fees and expenses. |
OCTOBER 31, 2019
|
| | | | |
| | Shares | Value |
| COMMON STOCKS — 99.8% | | |
| Aerospace and Defense — 0.8% | | |
| Boeing Co. (The) | 80,700 | $ | 27,430,737 |
|
| Auto Components — 1.0% | | |
| Aptiv plc | 355,600 | 31,843,980 |
|
| Banks — 0.8% | | |
| JPMorgan Chase & Co. | 216,700 | 27,070,164 |
|
| Beverages — 2.1% | | |
| Constellation Brands, Inc., Class A | 173,800 | 33,079,354 |
|
| Diageo plc | 832,000 | 34,061,973 |
|
| | | 67,141,327 |
|
| Biotechnology — 5.1% | | |
Biogen, Inc.(1) | 170,700 | 50,989,797 |
|
Celgene Corp.(1) | 390,800 | 42,218,124 |
|
Regeneron Pharmaceuticals, Inc.(1) | 137,300 | 42,052,244 |
|
Vertex Pharmaceuticals, Inc.(1) | 157,400 | 30,768,552 |
|
| | | 166,028,717 |
|
| Building Products — 1.1% | | |
| Allegion plc | 307,900 | 35,728,716 |
|
| Capital Markets — 1.6% | | |
| Cboe Global Markets, Inc. | 278,600 | 32,080,790 |
|
| MSCI, Inc. | 92,000 | 21,579,520 |
|
| | | 53,660,310 |
|
| Chemicals — 1.5% | | |
| Sherwin-Williams Co. (The) | 87,700 | 50,192,464 |
|
| Communications Equipment — 0.5% | | |
Arista Networks, Inc.(1) | 61,100 | 14,943,227 |
|
| Containers and Packaging — 0.2% | | |
| Ball Corp. | 88,600 | 6,199,342 |
|
| Entertainment — 3.2% | | |
Electronic Arts, Inc.(1) | 310,400 | 29,922,560 |
|
| Walt Disney Co. (The) | 575,300 | 74,742,976 |
|
| | | 104,665,536 |
|
| Equity Real Estate Investment Trusts (REITs) — 2.4% | | |
| American Tower Corp. | 174,500 | 38,054,960 |
|
| Equinix, Inc. | 69,100 | 39,164,498 |
|
| | | 77,219,458 |
|
| Food and Staples Retailing — 1.2% | | |
| Costco Wholesale Corp. | 130,200 | 38,683,722 |
|
| Health Care Equipment and Supplies — 3.0% | | |
Boston Scientific Corp.(1) | 580,300 | 24,198,510 |
|
| Danaher Corp. | 231,000 | 31,836,420 |
|
| Stryker Corp. | 197,800 | 42,778,206 |
|
| | | 98,813,136 |
|
|
| | | | |
| | Shares | Value |
| Health Care Providers and Services — 3.9% | | |
| UnitedHealth Group, Inc. | 497,600 | $ | 125,743,520 |
|
| Hotels, Restaurants and Leisure — 1.1% | | |
| Starbucks Corp. | 418,500 | 35,388,360 |
|
| Industrial Conglomerates — 0.9% | | |
| Roper Technologies, Inc. | 90,900 | 30,629,664 |
|
| Interactive Media and Services — 12.7% | | |
Alphabet, Inc., Class A(1) | 90,600 | 114,047,280 |
|
Alphabet, Inc., Class C(1) | 138,600 | 174,651,246 |
|
Facebook, Inc., Class A(1) | 647,600 | 124,112,540 |
|
| | | 412,811,066 |
|
| Internet and Direct Marketing Retail — 5.8% | | |
Amazon.com, Inc.(1) | 106,300 | 188,858,958 |
|
| IT Services — 11.6% | | |
| MasterCard, Inc., Class A | 773,000 | 213,974,130 |
|
PayPal Holdings, Inc.(1) | 926,300 | 96,427,830 |
|
| Visa, Inc., Class A | 380,900 | 68,127,774 |
|
| | | 378,529,734 |
|
| Machinery — 2.3% | | |
| FANUC Corp. | 146,700 | 28,959,354 |
|
| Graco, Inc. | 1,045,900 | 47,274,680 |
|
| | | 76,234,034 |
|
| Multiline Retail — 1.0% | | |
| Target Corp. | 295,600 | 31,602,596 |
|
| Oil, Gas and Consumable Fuels — 0.8% | | |
| EOG Resources, Inc. | 380,700 | 26,386,317 |
|
| Personal Products — 1.7% | | |
| Estee Lauder Cos., Inc. (The), Class A | 291,300 | 54,260,451 |
|
| Professional Services — 3.9% | | |
IHS Markit Ltd.(1) | 895,400 | 62,695,908 |
|
| Verisk Analytics, Inc. | 455,200 | 65,867,440 |
|
| | | 128,563,348 |
|
| Road and Rail — 1.0% | | |
| Canadian Pacific Railway Ltd. | 135,900 | 30,903,811 |
|
| Semiconductors and Semiconductor Equipment — 4.4% | | |
| Analog Devices, Inc. | 478,900 | 51,065,107 |
|
| Maxim Integrated Products, Inc. | 912,300 | 53,515,518 |
|
| Texas Instruments, Inc. | 315,900 | 37,273,041 |
|
| | | 141,853,666 |
|
| Software — 7.9% | | |
| Microsoft Corp. | 1,181,100 | 169,334,307 |
|
Proofpoint, Inc.(1) | 146,600 | 16,913,242 |
|
salesforce.com, Inc.(1) | 463,800 | 72,580,062 |
|
| | | 258,827,611 |
|
| Specialty Retail — 5.2% | | |
| Home Depot, Inc. (The) | 364,800 | 85,574,784 |
|
| TJX Cos., Inc. (The) | 1,474,200 | 84,987,630 |
|
| | | 170,562,414 |
|
|
| | | | |
| | Shares | Value |
| Technology Hardware, Storage and Peripherals — 9.0% | | |
| Apple, Inc. | 1,182,600 | $ | 294,183,576 |
|
| Textiles, Apparel and Luxury Goods — 2.1% | | |
| NIKE, Inc., Class B | 755,700 | 67,672,935 |
|
TOTAL COMMON STOCKS
(Cost $1,403,166,795) | | 3,252,632,897 |
|
| TEMPORARY CASH INVESTMENTS — 0.6% | | |
| Repurchase Agreement, BMO Capital Markets Corp., (collateralized by various U.S. Treasury obligations, 1.625% - 2.25%, 3/31/21 - 5/15/26, valued at $15,036,906), in a joint trading account at 1.50%, dated 10/31/19, due 11/1/19 (Delivery value $14,724,304) | | 14,723,691 |
|
| Repurchase Agreement, Fixed Income Clearing Corp., (collateralized by various U.S. Treasury obligations, 0.625%, 1/15/26, valued at $5,017,095), at 0.65%, dated 10/31/19, due 11/1/19 (Delivery value $4,914,089) | | 4,914,000 |
|
| State Street Institutional U.S. Government Money Market Fund, Premier Class | 21,864 | 21,864 |
|
TOTAL TEMPORARY CASH INVESTMENTS
(Cost $19,659,555) | | 19,659,555 |
|
TOTAL INVESTMENT SECURITIES — 100.4%
(Cost $1,422,826,350) | | 3,272,292,452 |
|
| OTHER ASSETS AND LIABILITIES — (0.4)% | | (13,836,487 | ) |
| TOTAL NET ASSETS — 100.0% | | $ | 3,258,455,965 |
|
|
| | | | | | | | | | | | | | | | |
| WRITTEN OPTIONS CONTRACTS |
| Reference Entity | Contracts | Type | Exercise
Price | Expiration
Date | Underlying
Notional
Amount | Premiums
Received | Value |
| NIKE, Inc. | 500 |
| Call | $ | 93.50 |
| 11/15/19 | $ | 4,477,500 |
| $ | (30,070 | ) | $ | (9,250 | ) |
|
| | | | | | | | | | |
| FORWARD FOREIGN CURRENCY EXCHANGE CONTRACTS |
| Currency Purchased | Currency Sold | Counterparty | Settlement Date | Unrealized Appreciation
(Depreciation) |
| CAD | 853,316 |
| USD | 640,273 |
| Morgan Stanley | 12/31/19 | $ | 7,844 |
|
| CAD | 1,381,288 |
| USD | 1,044,010 |
| Morgan Stanley | 12/31/19 | 5,115 |
|
| USD | 1,024,677 |
| CAD | 1,337,528 |
| Morgan Stanley | 12/31/19 | 8,788 |
|
| USD | 22,053,835 |
| CAD | 29,170,663 |
| Morgan Stanley | 12/31/19 | (102,079 | ) |
| JPY | 273,921,000 |
| USD | 2,550,192 |
| Bank of America N.A. | 12/30/19 | (3,907 | ) |
| JPY | 170,787,000 |
| USD | 1,597,218 |
| Bank of America N.A. | 12/30/19 | (9,635 | ) |
| JPY | 167,152,500 |
| USD | 1,565,299 |
| Bank of America N.A. | 12/30/19 | (11,501 | ) |
| USD | 5,696,813 |
| JPY | 611,860,500 |
| Bank of America N.A. | 12/30/19 | 9,147 |
|
| | | | | | | $ | (96,228 | ) |
|
| | |
| NOTES TO SCHEDULE OF INVESTMENTS |
| CAD | - | Canadian Dollar |
| JPY | - | Japanese Yen |
| USD | - | United States Dollar |
See Notes to Financial Statements.
|
|
| Statement of Assets and Liabilities |
|
| | | |
| OCTOBER 31, 2019 | |
| Assets | |
| Investment securities, at value (cost of $1,422,826,350) | $ | 3,272,292,452 |
|
| Receivable for capital shares sold | 291,354 |
|
| Unrealized appreciation on forward foreign currency exchange contracts | 30,894 |
|
| Dividends and interest receivable | 960,611 |
|
| | 3,273,575,311 |
|
| | |
| Liabilities | |
| Written options, at value (premiums received $30,070) | 9,250 |
|
| Payable for investments purchased | 11,164,147 |
|
| Payable for capital shares redeemed | 1,204,177 |
|
| Unrealized depreciation on forward foreign currency exchange contracts | 127,122 |
|
| Accrued management fees | 2,599,945 |
|
| Distribution and service fees payable | 14,705 |
|
| | 15,119,346 |
|
| | |
| Net Assets | $ | 3,258,455,965 |
|
| | |
| Net Assets Consist of: | |
| Capital (par value and paid-in surplus) | $ | 1,229,847,184 |
|
| Distributable earnings | 2,028,608,781 |
|
| | $ | 3,258,455,965 |
|
|
| | | | | | |
| | Net Assets | Shares Outstanding | Net Asset Value Per Share |
| Investor Class, $0.01 Par Value |
| $3,054,006,734 |
| 38,864,395 |
| $78.58 |
| I Class, $0.01 Par Value |
| $105,309,772 |
| 1,315,413 |
| $80.06 |
| Y Class, $0.01 Par Value |
| $46,033,529 |
| 574,178 |
| $80.17 |
| A Class, $0.01 Par Value |
| $42,012,813 |
| 548,601 |
| $76.58* |
| C Class, $0.01 Par Value |
| $5,522,516 |
| 81,749 |
| $67.55 |
| R Class, $0.01 Par Value |
| $3,019,406 |
| 39,882 |
| $75.71 |
| R5 Class, $0.01 Par Value |
| $7,286 |
| 91 |
| $80.07 |
| R6 Class, $0.01 Par Value |
| $2,543,909 |
| 31,768 |
| $80.08 |
*Maximum offering price $81.25 (net asset value divided by 0.9425).
See Notes to Financial Statements.
|
| | | |
| YEAR ENDED OCTOBER 31, 2019 | |
| Investment Income (Loss) | |
| Income: | |
| Dividends (net of foreign taxes withheld of $124,516) | $ | 29,235,272 |
|
| Interest | 322,074 |
|
| | 29,557,346 |
|
| | |
| Expenses: | |
| Management fees | 29,880,260 |
|
| Distribution and service fees: | |
| A Class | 100,032 |
|
| C Class | 57,137 |
|
| R Class | 12,861 |
|
| Directors' fees and expenses | 94,060 |
|
| Other expenses | 2,186 |
|
| | 30,146,536 |
|
Fees waived(1) | (609,335 | ) |
| | 29,537,201 |
|
| | |
| Net investment income (loss) | 20,145 |
|
| | |
| Realized and Unrealized Gain (Loss) | |
| Net realized gain (loss) on: | |
| Investment transactions | 178,658,817 |
|
| Forward foreign currency exchange contract transactions | 556,414 |
|
| Written options contract transactions | 681,058 |
|
| Foreign currency translation transactions | 8,283 |
|
| | 179,904,572 |
|
| | |
| Change in net unrealized appreciation (depreciation) on: | |
| Investments | 274,625,266 |
|
| Forward foreign currency exchange contracts | (553,408 | ) |
| Written options contracts | 20,820 |
|
| Translation of assets and liabilities in foreign currencies | 879 |
|
| | 274,093,557 |
|
| | |
| Net realized and unrealized gain (loss) | 453,998,129 |
|
| | |
| Net Increase (Decrease) in Net Assets Resulting from Operations | $ | 454,018,274 |
|
| |
| (1) | Amount consists of $578,435, $15,521, $5,280, $8,003, $1,143, $514 and $439 for Investor Class, I Class, Y Class, A Class, C Class, R Class and R6 Class, respectively. The waiver amount for R5 Class was less than $0.05. |
See Notes to Financial Statements.
|
|
| Statement of Changes in Net Assets |
|
| | | | | | |
| YEARS ENDED OCTOBER 31, 2019 AND OCTOBER 31, 2018 |
| Increase (Decrease) in Net Assets | October 31, 2019 | October 31, 2018 |
| Operations | | |
| Net investment income (loss) | $ | 20,145 |
| $ | 1,738,869 |
|
| Net realized gain (loss) | 179,904,572 |
| 222,214,384 |
|
| Change in net unrealized appreciation (depreciation) | 274,093,557 |
| 31,450,983 |
|
| Net increase (decrease) in net assets resulting from operations | 454,018,274 |
| 255,404,236 |
|
| | | |
| Distributions to Shareholders | | |
| From earnings: | | |
| Investor Class | (213,120,945 | ) | (167,885,063 | ) |
| I Class | (5,385,005 | ) | (3,896,927 | ) |
| Y Class | (1,027,005 | ) | (361 | ) |
| A Class | (3,006,841 | ) | (2,434,131 | ) |
| C Class | (473,987 | ) | (366,947 | ) |
| R Class | (180,464 | ) | (214,888 | ) |
| R5 Class | (476 | ) | (355 | ) |
| R6 Class | (145,270 | ) | (87,056 | ) |
| Decrease in net assets from distributions | (223,339,993 | ) | (174,885,728 | ) |
| | | |
| Capital Share Transactions | | |
| Net increase (decrease) in net assets from capital share transactions (Note 5) | 57,161,383 |
| 24,411,779 |
|
| | | |
| Net increase (decrease) in net assets | 287,839,664 |
| 104,930,287 |
|
| | | |
| Net Assets | | |
| Beginning of period | 2,970,616,301 |
| 2,865,686,014 |
|
| End of period | $ | 3,258,455,965 |
| $ | 2,970,616,301 |
|
See Notes to Financial Statements.
|
|
| Notes to Financial Statements |
OCTOBER 31, 2019
1. Organization
American Century Mutual Funds, Inc. (the corporation) is registered under the Investment Company Act of 1940, as amended (the 1940 Act), as an open-end management investment company and is organized as a Maryland corporation. Select Fund (the fund) is one fund in a series issued by the corporation. The fund’s investment objective is to seek long-term capital growth.
The fund offers the Investor Class, I Class, Y Class, A Class, C Class, R Class, R5 Class and R6 Class. The A Class may incur an initial sales charge. The A Class and C Class may be subject to a contingent deferred sales charge.
2. Significant Accounting Policies
The following is a summary of significant accounting policies consistently followed by the fund in preparation of its financial statements. The fund is an investment company and follows accounting and reporting guidance in accordance with accounting principles generally accepted in the United States of America. This may require management to make certain estimates and assumptions at the date of the financial statements. Actual results could differ from these estimates. Management evaluated the impact of events or transactions occurring through the date the financial statements were issued that would merit recognition or disclosure.
Investment Valuations — The fund determines the fair value of its investments and computes its net asset value per share at the close of regular trading (usually 4 p.m. Eastern time) on the New York Stock Exchange (NYSE) on each day the NYSE is open. The Board of Directors has adopted valuation policies and procedures to guide the investment advisor in the fund’s investment valuation process and to provide methodologies for the oversight of the fund’s pricing function.
Equity securities that are listed or traded on a domestic securities exchange are valued at the last reported sales price or at the official closing price as provided by the exchange. Equity securities traded on foreign securities exchanges are generally valued at the closing price of such securities on the exchange where primarily traded or at the close of the NYSE, if that is earlier. If no last sales price is reported, or if local convention or regulation so provides, the mean of the latest bid and asked prices may be used. Securities traded over-the-counter are valued at the mean of the latest bid and asked prices, the last sales price, or the official closing price. Equity securities initially expressed in local currencies are translated into U.S. dollars at the mean of the appropriate currency exchange rate at the close of the NYSE as provided by an independent pricing service.
Open-end management investment companies are valued at the reported net asset value per share. Exchange-traded options contracts are valued at a mean as provided by independent pricing services. Repurchase agreements are valued at cost, which approximates fair value. Forward foreign currency exchange contracts are valued at the mean of the appropriate forward exchange rate at the close of the NYSE as provided by an independent pricing service.
If the fund determines that the market price for an investment is not readily available or the valuation methods mentioned above do not reflect an investment’s fair value, such investment is valued as determined in good faith by the Board of Directors or its delegate, in accordance with policies and procedures adopted by the Board of Directors. In its determination of fair value, the fund may review several factors including, but not limited to, market information regarding the specific investment or comparable investments and correlation with other investment types, futures indices or general market indicators. Circumstances that may cause the fund to use these procedures to value an investment include, but are not limited to: an investment has been declared in default or is distressed; trading in a security has been suspended during the trading day or a security is not actively trading on its principal exchange; prices received from a regular pricing source are deemed unreliable; or there is a foreign market holiday and no trading occurred.
The fund monitors for significant events occurring after the close of an investment’s primary exchange but before the fund’s net asset value per share is determined. Significant events may include, but are not limited to: corporate announcements and transactions; governmental action and political unrest that could impact a specific investment or an investment sector; or armed conflicts, natural disasters and similar events that could affect investments in a specific country or region. The fund also monitors for significant fluctuations between domestic and foreign markets, as evidenced by the U.S. market or such other indicators that the Board of Directors, or its delegate, deems appropriate. The fund may apply a model-derived factor to the closing price of equity securities traded on foreign securities exchanges. The factor is based on observable market data as provided by an independent pricing service.
Security Transactions — Security transactions are accounted for as of the trade date. Net realized gains and losses are determined on the identified cost basis, which is also used for federal income tax purposes.
Investment Income — Dividend income less foreign taxes withheld, if any, is recorded as of the ex-dividend date. Distributions received on securities that represent a return of capital or long-term capital gain are recorded as a reduction of cost of investments and/or as a realized gain. The fund may estimate the components of distributions received that may be considered nontaxable distributions or long-term capital gain distributions for income tax purposes. Interest income is recorded on the accrual basis and includes accretion of discounts and amortization of premiums.
Foreign Currency Translations — All assets and liabilities initially expressed in foreign currencies are translated into U.S. dollars at prevailing exchange rates at period end. The fund may enter into spot foreign currency exchange contracts to facilitate transactions denominated in a foreign currency. Purchases and sales of investment securities, dividend and interest income, spot foreign currency exchange contracts, and expenses are translated at the rates of exchange prevailing on the respective dates of such transactions. Net realized and unrealized foreign currency exchange gains or losses related to investment securities are a component of net realized gain (loss) on investment transactions and change in net unrealized appreciation (depreciation) on investments, respectively.
Repurchase Agreements — The fund may enter into repurchase agreements with institutions that American Century Investment Management, Inc. (ACIM) (the investment advisor) has determined are creditworthy pursuant to criteria adopted by the Board of Directors. The fund requires that the collateral, represented by securities, received in a repurchase transaction be transferred to the custodian in a manner sufficient to enable the fund to obtain those securities in the event of a default under the repurchase agreement. ACIM monitors, on a daily basis, the securities transferred to ensure the value, including accrued interest, of the securities under each repurchase agreement is equal to or greater than amounts owed to the fund under each repurchase agreement.
Joint Trading Account — Pursuant to an Exemptive Order issued by the Securities and Exchange Commission, the fund, along with certain other funds in the American Century Investments family of funds, may transfer uninvested cash balances into a joint trading account. These balances are invested in one or more repurchase agreements that are collateralized by U.S. Treasury or Agency obligations.
Segregated Assets — In accordance with the 1940 Act, the fund segregates assets on its books and records to cover certain types of investment securities and other financial instruments. ACIM monitors, on a daily basis, the securities segregated to ensure the fund designates a sufficient amount of liquid assets, marked-to-market daily. The fund may also receive assets or be required to pledge assets at the custodian bank or with a broker for collateral requirements.
Income Tax Status — It is the fund’s policy to distribute substantially all net investment income and net realized gains to shareholders and to otherwise qualify as a regulated investment company under provisions of the Internal Revenue Code. Accordingly, no provision has been made for income taxes. The fund files U.S. federal, state, local and non-U.S. tax returns as applicable. The fund's tax returns are subject to examination by the relevant taxing authority until expiration of the applicable statute of limitations, which is generally three years from the date of filing but can be longer in certain jurisdictions. At this time, management believes there are no uncertain tax positions which, based on their technical merit, would not be sustained upon examination and for which it is reasonably possible that the total amounts of unrecognized tax benefits will significantly change in the next twelve months.
Multiple Class — All shares of the fund represent an equal pro rata interest in the net assets of the class to which such shares belong, and have identical voting, dividend, liquidation and other rights and the same terms and conditions, except for class specific expenses and exclusive rights to vote on matters affecting only individual classes. Income, non-class specific expenses, and realized and unrealized capital gains and losses of the fund are allocated to each class of shares based on their relative net assets.
Distributions to Shareholders — Distributions from net investment income and net realized gains, if any, are generally declared and paid annually.
Indemnifications — Under the corporation’s organizational documents, its officers and directors are indemnified against certain liabilities arising out of the performance of their duties to the fund. In addition, in the normal course of business, the fund enters into contracts that provide general indemnifications. The maximum exposure under these arrangements is unknown as this would involve future claims that may be made against a fund. The risk of material loss from such claims is considered by management to be remote.
3. Fees and Transactions with Related Parties
Certain officers and directors of the corporation are also officers and/or directors of American Century Companies, Inc. (ACC). The corporation’s investment advisor, ACIM, the corporation's distributor, American Century Investment Services, Inc. (ACIS), and the corporation’s transfer agent, American Century Services, LLC, are wholly owned, directly or indirectly, by ACC.
Management Fees — The corporation has entered into a management agreement with ACIM, under which ACIM provides the fund with investment advisory and management services in exchange for a single, unified management fee (the fee) per class. The agreement provides that all expenses of managing and operating the fund, except distribution and service fees, brokerage expenses, taxes, interest, fees and expenses of the independent directors (including legal counsel fees), and extraordinary expenses, will be paid by ACIM. The fee is computed and accrued daily based on each class's daily net assets and paid monthly in arrears. The difference in the fee among the classes is a result of their separate arrangements for non-Rule 12b-1 shareholder services. It is not the result of any difference in advisory or custodial fees or other expenses related to the management of the fund’s assets, which do not vary by class. The rate of the fee is determined by applying a fee rate calculation formula. This formula takes into account the fund’s assets as well as certain assets, if any, of other clients of the investment advisor outside the American Century Investments family of funds (such as subadvised funds and separate accounts) that use very similar investment teams and strategies (strategy assets). During the period ended October 31, 2019, the investment advisor agreed to waive 0.02% of the fund's management fee. The investment advisor expects this waiver to continue until July 31, 2020 and cannot terminate it prior to such date without the approval of the Board of Directors.
The management fee schedule range and the effective annual management fee before and after waiver for each class for the period ended October 31, 2019 are as follows:
|
| | | |
| | Management Fee | Effective Annual Management Fee |
| | Schedule Range | Before Waiver | After Waiver |
| Investor Class | 0.800% to 0.990% | 0.99% | 0.97% |
| I Class | 0.600% to 0.790% | 0.79% | 0.77% |
| Y Class | 0.450% to 0.640% | 0.64% | 0.62% |
| A Class | 0.800% to 0.990% | 0.99% | 0.97% |
| C Class | 0.800% to 0.990% | 0.99% | 0.97% |
| R Class | 0.800% to 0.990% | 0.99% | 0.97% |
| R5 Class | 0.600% to 0.790% | 0.79% | 0.77% |
| R6 Class | 0.450% to 0.640% | 0.64% | 0.62% |
Distribution and Service Fees — The Board of Directors has adopted a separate Master Distribution and Individual Shareholder Services Plan for each of the A Class, C Class and R Class (collectively the plans), pursuant to Rule 12b-1 of the 1940 Act. The plans provide that the A Class will pay ACIS an annual distribution and service fee of 0.25%. The plans provide that the C Class will pay ACIS an annual distribution and service fee of 1.00%, of which 0.25% is paid for individual shareholder services and 0.75% is paid for distribution services. The plans provide that the R Class will pay ACIS an annual distribution and service fee of 0.50%. The fees are computed and accrued daily based on each class’s daily net assets and paid monthly in arrears. The fees are used to pay financial intermediaries for distribution and individual shareholder services. Fees incurred under the plans during the period ended October 31, 2019 are detailed in the Statement of Operations.
Directors' Fees and Expenses — The Board of Directors is responsible for overseeing the investment advisor’s management and operations of the fund. The directors receive detailed information about the fund and its investment advisor regularly throughout the year, and meet at least quarterly with management of the investment advisor to review reports about fund operations. The fund’s officers do not receive compensation from the fund.
Interfund Transactions — The fund may enter into security transactions with other American Century Investments funds and other client accounts of the investment advisor, in accordance with the 1940 Act rules and procedures adopted by the Board of Directors. The rules and procedures require, among other things, that these transactions be effected at the independent current market price of the security. During the period, the interfund purchases and sales were $6,414,385 and $637,271, respectively. The effect of interfund transactions on the Statement of Operations was $(5,697) in net realized gain (loss) on investment transactions.
4. Investment Transactions
Purchases and sales of investment securities, excluding short-term investments, for the period ended October 31, 2019 were $509,887,659 and $667,968,392, respectively.
5. Capital Share Transactions
Transactions in shares of the fund were as follows:
|
| | | | | | | | | | |
| | Year ended
October 31, 2019 | Year ended October 31, 2018 |
| | Shares | Amount | Shares | Amount |
| Investor Class/Shares Authorized | 475,000,000 |
| | 350,000,000 |
| |
| Sold | 800,738 |
| $ | 57,669,376 |
| 1,118,907 |
| $ | 83,197,129 |
|
| Issued in reinvestment of distributions | 3,227,630 |
| 203,857,091 |
| 2,272,657 |
| 160,563,210 |
|
| Redeemed | (3,621,970 | ) | (261,065,622 | ) | (3,219,750 | ) | (239,485,104 | ) |
| | 406,398 |
| 460,845 |
| 171,814 |
| 4,275,235 |
|
| I Class/Shares Authorized | 40,000,000 |
| | 35,000,000 |
| |
| Sold | 647,839 |
| 49,485,276 |
| 396,353 |
| 30,682,340 |
|
| Issued in reinvestment of distributions | 78,144 |
| 5,019,942 |
| 50,080 |
| 3,593,215 |
|
| Redeemed | (356,766 | ) | (26,327,849 | ) | (333,201 | ) | (26,075,775 | ) |
| | 369,217 |
| 28,177,369 |
| 113,232 |
| 8,199,780 |
|
| Y Class/Shares Authorized | 30,000,000 |
| | 50,000,000 |
| |
| Sold | 431,529 |
| 32,202,180 |
| 197,116 |
| 15,403,115 |
|
| Issued in reinvestment of distributions | 15,293 |
| 982,580 |
| 5 |
| 361 |
|
| Redeemed | (66,043 | ) | (4,978,500 | ) | (3,800 | ) | (299,030 | ) |
| | 380,779 |
| 28,206,260 |
| 193,321 |
| 15,104,446 |
|
| A Class/Shares Authorized | 40,000,000 |
| | 50,000,000 |
| |
| Sold | 60,310 |
| 4,251,171 |
| 76,515 |
| 5,571,453 |
|
| Issued in reinvestment of distributions | 48,212 |
| 2,974,205 |
| 34,556 |
| 2,393,697 |
|
| Redeemed | (106,841 | ) | (7,576,575 | ) | (136,844 | ) | (9,978,951 | ) |
| | 1,681 |
| (351,199 | ) | (25,773 | ) | (2,013,801 | ) |
| C Class/Shares Authorized | 30,000,000 |
| | 20,000,000 |
| |
| Sold | 9,195 |
| 550,593 |
| 13,535 |
| 896,225 |
|
| Issued in reinvestment of distributions | 8,020 |
| 439,266 |
| 5,350 |
| 334,996 |
|
| Redeemed | (23,445 | ) | (1,502,183 | ) | (19,314 | ) | (1,277,444 | ) |
| | (6,230 | ) | (512,324 | ) | (429 | ) | (46,223 | ) |
| R Class/Shares Authorized | 30,000,000 |
| | 30,000,000 |
| |
| Sold | 11,175 |
| 787,619 |
| 11,087 |
| 800,013 |
|
| Issued in reinvestment of distributions | 2,952 |
| 180,464 |
| 3,121 |
| 214,888 |
|
| Redeemed | (5,809 | ) | (414,285 | ) | (32,866 | ) | (2,287,575 | ) |
| | 8,318 |
| 553,798 |
| (18,658 | ) | (1,272,674 | ) |
| R5 Class/Shares Authorized | 30,000,000 |
| | 50,000,000 |
| |
| Issued in reinvestment of distributions | 8 |
| 476 |
| 5 |
| 355 |
|
| R6 Class/Shares Authorized | 40,000,000 |
| | 50,000,000 |
| |
| Sold | 12,413 |
| 902,406 |
| 8,063 |
| 626,743 |
|
| Issued in reinvestment of distributions | 2,252 |
| 144,508 |
| 1,215 |
| 87,056 |
|
| Redeemed | (5,652 | ) | (420,756 | ) | (7,295 | ) | (549,138 | ) |
| | 9,013 |
| 626,158 |
| 1,983 |
| 164,661 |
|
| Net increase (decrease) | 1,169,184 |
| $ | 57,161,383 |
| 435,495 |
| $ | 24,411,779 |
|
6. Fair Value Measurements
The fund’s investments valuation process is based on several considerations and may use multiple inputs to determine the fair value of the investments held by the fund. In conformity with accounting principles generally accepted in the United States of America, the inputs used to determine a valuation are classified into three broad levels.
| |
| • | Level 1 valuation inputs consist of unadjusted quoted prices in an active market for identical investments. |
| |
| • | Level 2 valuation inputs consist of direct or indirect observable market data (including quoted prices for comparable investments, evaluations of subsequent market events, interest rates, prepayment speeds, credit risk, etc.). These inputs also consist of quoted prices for identical investments initially expressed in local currencies that are adjusted through translation into U.S. dollars. |
| |
| • | Level 3 valuation inputs consist of unobservable data (including a fund’s own assumptions). |
The level classification is based on the lowest level input that is significant to the fair valuation measurement. The valuation inputs are not necessarily an indication of the risks associated with investing in these securities or other financial instruments.
The following is a summary of the level classifications as of period end. The Schedule of Investments provides additional information on the fund’s portfolio holdings.
|
| | | | | | | | |
| | Level 1 | Level 2 | Level 3 |
| Assets | | | |
| Investment Securities | | | |
| Common Stocks | $ | 3,158,707,759 |
| $ | 93,925,138 |
| — |
|
| Temporary Cash Investments | 21,864 |
| 19,637,691 |
| — |
|
| | $ | 3,158,729,623 |
| $ | 113,562,829 |
| — |
|
| Other Financial Instruments | | | |
| Forward Foreign Currency Exchange Contracts | — |
| $ | 30,894 |
| — |
|
| | | | |
| Liabilities | | | |
| Other Financial Instruments | | | |
| Forward Foreign Currency Exchange Contracts | — |
| $ | 127,122 |
| — |
|
| Written Options Contracts | $ | 9,250 |
| — |
| — |
|
| | $ | 9,250 |
| $ | 127,122 |
| — |
|
7. Derivative Instruments
Equity Price Risk — The fund is subject to equity price risk in the normal course of pursuing its investment objectives. A fund may enter into options contracts based on an equity index or specific security in order to manage its exposure to changes in market conditions. The risks of entering into equity price risk derivative instruments include the possible lack of liquidity, failure of the counterparty to meet its obligations, and that there may be unfavorable changes in the underlying investments or instruments. A fund may purchase or write an option contract to protect against declines in market value on the underlying index or security. A purchased option contract provides the fund a right, but not an obligation, to buy (call) or sell (put) an equity-related asset at a specified exercise price within a certain period or on a specific date. A written option contract holds the corresponding obligation to sell (call writing) or buy (put writing) the underlying equity-related asset if the purchaser exercises the option contract. The buyer pays the seller an initial purchase price (premium) for this right. Option contracts purchased by a fund are accounted for in the same manner as marketable portfolio securities. The premium received by a fund for option contracts written is recorded as a liability and valued daily. The proceeds from securities sold through the exercise of option contracts are decreased by the premium paid to purchase the option contracts. A fund may recognize a realized gain or loss when the option contract is closed, exercised or expires. Net realized and unrealized gains or losses occurring during the holding period of purchased options contracts are a component of net realized gain (loss) on investment transactions and change in net unrealized appreciation (depreciation) on investments, respectively. Net realized and unrealized gains or losses occurring during the holding period of written options contracts are a component of net realized gain (loss) on written options contract transactions and change in net unrealized
appreciation (depreciation) on written options contracts, respectively. The fund’s average exposure to equity price risk derivative instruments held during the period was 421 written options contracts.
Foreign Currency Risk — The fund is subject to foreign currency exchange rate risk in the normal course of pursuing its investment objectives. The value of foreign investments held by a fund may be significantly affected by changes in foreign currency exchange rates. The dollar value of a foreign security generally decreases when the value of the dollar rises against the foreign currency in which the security is denominated and tends to increase when the value of the dollar declines against such foreign currency. A fund may enter into forward foreign currency exchange contracts to reduce a fund's exposure to foreign currency exchange rate fluctuations. The net U.S. dollar value of foreign currency underlying all contractual commitments held by a fund and the resulting unrealized appreciation or depreciation are determined daily. Realized gain or loss is recorded upon the termination of the contract. Net realized and unrealized gains or losses occurring during the holding period of forward foreign currency exchange contracts are a component of net realized gain (loss) on forward foreign currency exchange contract transactions and change in net unrealized appreciation (depreciation) on forward foreign currency exchange contracts, respectively. A fund bears the risk of an unfavorable change in the foreign currency exchange rate underlying the forward contract. Additionally, losses, up to the fair value, may arise if the counterparties do not perform under the contract terms. The fund's average U.S. dollar exposure to foreign currency risk derivative instruments held during the period was $37,349,183.
Value of Derivative Instruments as of October 31, 2019
|
| | | | | | | | |
| | Asset Derivatives | Liability Derivatives |
| Type of Risk Exposure | Location on Statement of Assets and Liabilities | Value | Location on Statement of Assets and Liabilities | Value |
| Equity Price Risk | Written Options | — |
| Written Options | $ | 9,250 |
|
| Foreign Currency Risk | Unrealized appreciation on forward foreign currency exchange contracts | $ | 30,894 |
| Unrealized depreciation on forward foreign currency exchange contracts | 127,122 |
|
| | | $ | 30,894 |
| | $ | 136,372 |
|
Effect of Derivative Instruments on the Statement of Operations for the Year Ended October 31, 2019
|
| | | | | | | | |
| | Net Realized Gain (Loss) | Change in Net Unrealized Appreciation (Depreciation) |
| Type of Risk Exposure | Location on Statement of Operations | Value | Location on Statement of Operations | Value |
| Equity Price Risk | Net realized gain (loss) on written options contract transactions | $ | 681,058 |
| Change in net unrealized appreciation (depreciation) on written options contracts | $ | 20,820 |
|
| Foreign Currency Risk | Net realized gain (loss) on forward foreign currency exchange contract transactions | 556,414 |
| Change in net unrealized appreciation (depreciation) on forward foreign currency exchange contracts | (553,408 | ) |
| | | $ | 1,237,472 |
| | $ | (532,588 | ) |
8. Federal Tax Information
The tax character of distributions paid during the years ended October 31, 2019 and October 31, 2018 were as follows:
|
| | | | | | |
| | 2019 | 2018 |
| Distributions Paid From | | |
| Ordinary income | $ | 1,537,114 |
| $ | 8,116,985 |
|
| Long-term capital gains | $ | 221,802,879 |
| $ | 166,768,743 |
|
The book-basis character of distributions made during the year from net investment income or net realized gains may differ from their ultimate characterization for federal income tax purposes. These differences reflect the differing character of certain income items and net realized gains and losses for financial statement and tax purposes, and may result in reclassification among certain capital accounts on the financial statements.
As of period end, the federal tax cost of investments and the components of distributable earnings on a tax-basis were as follows:
|
| | | |
| Federal tax cost of investments | $ | 1,423,030,066 |
|
| Gross tax appreciation of investments | $ | 1,870,822,822 |
|
| Gross tax depreciation of investments | (21,560,436 | ) |
| Net tax appreciation (depreciation) of investments | 1,849,262,386 |
|
| Net tax appreciation (depreciation) on derivatives and translation of assets and liabilities in foreign currencies | 20,762 |
|
| Net tax appreciation (depreciation) | $ | 1,849,283,148 |
|
| Undistributed ordinary income | $ | 28,200 |
|
| Accumulated long-term gains | $ | 179,297,433 |
|
The difference between book-basis and tax-basis unrealized appreciation (depreciation) is attributable primarily to the tax deferral of losses on wash sales and the realization for tax purposes of unrealized gains (losses) on certain foreign currency exchange contracts.
|
| | | | | | | | | | | | | | | | | |
| For a Share Outstanding Throughout the Years Ended October 31 (except as noted) | | | | |
| Per-Share Data | | | | | | | | | Ratios and Supplemental Data |
| | | Income From Investment Operations: | Distributions From: | | | Ratio to Average Net Assets of: | | |
| | Net Asset
Value,
Beginning
of Period | Net
Investment
Income
(Loss)(1) | Net
Realized
and
Unrealized
Gain (Loss) | Total From
Investment
Operations | Net
Investment
Income | Net
Realized
Gains | Total
Distributions | Net Asset
Value,
End
of Period | Total
Return(2) | Operating
Expenses | Operating
Expenses
(before
expense
waiver) | Net
Investment
Income
(Loss) | Net
Investment
Income
(Loss)
(before
expense
waiver) | Portfolio
Turnover
Rate | Net
Assets,
End of
Period
(in thousands) |
| Investor Class | | | | | | | | | | | | | | |
| 2019 | $73.74 | —(3) | 10.42 | 10.42 | (0.03) | (5.55) | (5.58) | $78.58 | 15.98% | 0.97% | 0.99% | 0.00%(4) | (0.02)% | 17% |
| $3,054,007 |
|
| 2018 | $71.92 | 0.04 | 6.20 | 6.24 | (0.21) | (4.21) | (4.42) | $73.74 | 8.94% | 0.97% | 0.99% | 0.06% | 0.04% | 22% |
| $2,835,970 |
|
| 2017 | $58.32 | 0.21 | 15.59 | 15.80 | (0.22) | (1.98) | (2.20) | $71.92 | 27.93% | 0.99% | 1.00% | 0.33% | 0.32% | 19% |
| $2,753,729 |
|
| 2016 | $61.57 | 0.20 | 0.30 | 0.50 | (0.25) | (3.50) | (3.75) | $58.32 | 0.98% | 0.99% | 0.99% | 0.36% | 0.36% | 16% |
| $2,287,797 |
|
| 2015 | $61.31 | 0.21 | 5.71 | 5.92 | (0.24) | (5.42) | (5.66) | $61.57 | 10.93% | 0.99% | 0.99% | 0.35% | 0.35% | 24% |
| $2,440,319 |
|
| I Class | | | | | | | | | | | | | |
| 2019 | $75.02 | 0.13 | 10.63 | 10.76 | (0.17) | (5.55) | (5.72) | $80.06 | 16.22% | 0.77% | 0.79% | 0.20% | 0.18% | 17% |
| $105,310 |
|
| 2018 | $73.11 | 0.19 | 6.29 | 6.48 | (0.36) | (4.21) | (4.57) | $75.02 | 9.15% | 0.77% | 0.79% | 0.26% | 0.24% | 22% |
| $70,986 |
|
| 2017 | $59.25 | 0.31 | 15.87 | 16.18 | (0.34) | (1.98) | (2.32) | $73.11 | 28.20% | 0.79% | 0.80% | 0.53% | 0.52% | 19% |
| $60,895 |
|
| 2016 | $62.49 | 0.32 | 0.31 | 0.63 | (0.37) | (3.50) | (3.87) | $59.25 | 1.19% | 0.79% | 0.79% | 0.56% | 0.56% | 16% |
| $28,061 |
|
| 2015 | $62.15 | 0.34 | 5.78 | 6.12 | (0.36) | (5.42) | (5.78) | $62.49 | 11.16% | 0.79% | 0.79% | 0.55% | 0.55% | 24% |
| $33,075 |
|
| Y Class | | | | | | | | | | | | | |
| 2019 | $75.13 | 0.22 | 10.64 | 10.86 | (0.27) | (5.55) | (5.82) | $80.17 | 16.38% | 0.62% | 0.64% | 0.35% | 0.33% | 17% |
| $46,034 |
|
| 2018 | $73.13 | 0.28 | 6.33 | 6.61 | (0.40) | (4.21) | (4.61) | $75.13 | 9.34% | 0.62% | 0.64% | 0.41% | 0.39% | 22% |
| $14,529 |
|
2017(5) | $63.80 | 0.22 | 9.11 | 9.33 | — | — | — | $73.13 | 14.62% | 0.64%(6) | 0.65%(6) | 0.59%(6) | 0.58%(6) | 19%(7) |
| $6 |
|
|
| | | | | | | | | | | | | | | | | |
| For a Share Outstanding Throughout the Years Ended October 31 (except as noted) | | | | |
| Per-Share Data | | | | | | | | | Ratios and Supplemental Data |
| | | Income From Investment Operations: | Distributions From: | | | Ratio to Average Net Assets of: | | |
| | Net Asset
Value,
Beginning
of Period | Net
Investment
Income
(Loss)(1) | Net
Realized
and
Unrealized
Gain (Loss) | Total From
Investment
Operations | Net
Investment
Income | Net
Realized
Gains | Total
Distributions | Net Asset
Value,
End
of Period | Total
Return(2) | Operating
Expenses | Operating
Expenses
(before
expense
waiver) | Net
Investment
Income
(Loss) | Net
Investment
Income
(Loss)
(before
expense
waiver) | Portfolio
Turnover
Rate | Net
Assets,
End of
Period
(in thousands) |
| A Class | | | | | | | | | | | | | | |
| 2019 | $72.15 | (0.18) | 10.16 | 9.98 | — | (5.55) | (5.55) | $76.58 | 15.69% | 1.22% | 1.24% | (0.25)% | (0.27)% | 17% |
| $42,013 |
|
| 2018 | $70.45 | (0.14) | 6.07 | 5.93 | (0.02) | (4.21) | (4.23) | $72.15 | 8.67% | 1.22% | 1.24% | (0.19)% | (0.21)% | 22% |
| $39,459 |
|
| 2017 | $57.16 | 0.05 | 15.29 | 15.34 | (0.07) | (1.98) | (2.05) | $70.45 | 27.63% | 1.24% | 1.25% | 0.08% | 0.07% | 19% |
| $40,345 |
|
| 2016 | $60.41 | 0.06 | 0.29 | 0.35 | (0.10) | (3.50) | (3.60) | $57.16 | 0.73% | 1.24% | 1.24% | 0.11% | 0.11% | 16% |
| $36,723 |
|
| 2015 | $60.25 | 0.06 | 5.61 | 5.67 | (0.09) | (5.42) | (5.51) | $60.41 | 10.67% | 1.24% | 1.24% | 0.10% | 0.10% | 24% |
| $41,737 |
|
| C Class | | | | | | | | |
| 2019 | $64.79 | (0.63) | 8.94 | 8.31 | — | (5.55) | (5.55) | $67.55 | 14.82% | 1.97% | 1.99% | (1.00)% | (1.02)% | 17% |
| $5,523 |
|
| 2018 | $64.11 | (0.62) | 5.51 | 4.89 | — | (4.21) | (4.21) | $64.79 | 7.86% | 1.97% | 1.99% | (0.94)% | (0.96)% | 22% |
| $5,700 |
|
| 2017 | $52.51 | (0.39) | 13.97 | 13.58 | — | (1.98) | (1.98) | $64.11 | 26.66% | 1.99% | 2.00% | (0.67)% | (0.68)% | 19% |
| $5,668 |
|
| 2016 | $56.09 | (0.33) | 0.25 | (0.08) | — | (3.50) | (3.50) | $52.51 | (0.02)% | 1.99% | 1.99% | (0.64)% | (0.64)% | 16% |
| $4,570 |
|
| 2015 | $56.64 | (0.36) | 5.23 | 4.87 | — | (5.42) | (5.42) | $56.09 | 9.83% | 1.99% | 1.99% | (0.65)% | (0.65)% | 24% |
| $5,932 |
|
| R Class | | | | | | | | |
| 2019 | $71.56 | (0.36) | 10.06 | 9.70 | — | (5.55) | (5.55) | $75.71 | 15.40% | 1.47% | 1.49% | (0.50)% | (0.52)% | 17% |
| $3,019 |
|
| 2018 | $70.05 | (0.30) | 6.02 | 5.72 | — | (4.21) | (4.21) | $71.56 | 8.41% | 1.47% | 1.49% | (0.44)% | (0.46)% | 22% |
| $2,259 |
|
| 2017 | $56.92 | (0.11) | 15.22 | 15.11 | — | (1.98) | (1.98) | $70.05 | 27.30% | 1.49% | 1.50% | (0.17)% | (0.18)% | 19% |
| $3,518 |
|
| 2016 | $60.21 | (0.08) | 0.29 | 0.21 | — | (3.50) | (3.50) | $56.92 | 0.49% | 1.49% | 1.49% | (0.14)% | (0.14)% | 16% |
| $2,814 |
|
| 2015 | $60.12 | (0.09) | 5.60 | 5.51 | — | (5.42) | (5.42) | $60.21 | 10.38% | 1.49% | 1.49% | (0.15)% | (0.15)% | 24% |
| $3,295 |
|
|
| | | | | | | | | | | | | | | | | |
| For a Share Outstanding Throughout the Years Ended October 31 (except as noted) | | | | |
| Per-Share Data | | | | | | | | | Ratios and Supplemental Data |
| | | Income From Investment Operations: | Distributions From: | | | Ratio to Average Net Assets of: | | |
| | Net Asset
Value,
Beginning
of Period | Net
Investment
Income
(Loss)(1) | Net
Realized
and
Unrealized
Gain (Loss) | Total From
Investment
Operations | Net
Investment
Income | Net
Realized
Gains | Total
Distributions | Net Asset
Value,
End
of Period | Total
Return(2) | Operating
Expenses | Operating
Expenses
(before
expense
waiver) | Net
Investment
Income
(Loss) | Net
Investment
Income
(Loss)
(before
expense
waiver) | Portfolio
Turnover
Rate | Net
Assets,
End of
Period
(in thousands) |
| R5 Class | | | | | | | | |
| 2019 | $75.04 | 0.13 | 10.62 | 10.75 | (0.17) | (5.55) | (5.72) | $80.07 | 16.20% | 0.77% | 0.79% | 0.20% | 0.18% | 17% |
| $7 |
|
| 2018 | $73.10 | 0.18 | 6.28 | 6.46 | (0.31) | (4.21) | (4.52) | $75.04 | 9.13% | 0.77% | 0.79% | 0.26% | 0.24% | 22% |
| $6 |
|
2017(5) | $63.83 | 0.17 | 9.10 | 9.27 | — | — | — | $73.10 | 14.52% | 0.79%(6) | 0.80%(6) | 0.44%(6) | 0.43%(6) | 19%(7) |
| $6 |
|
| R6 Class | | | | | | | | |
| 2019 | $75.05 | 0.25 | 10.60 | 10.85 | (0.27) | (5.55) | (5.82) | $80.08 | 16.39% | 0.62% | 0.64% | 0.35% | 0.33% | 17% |
| $2,544 |
|
| 2018 | $73.13 | 0.31 | 6.29 | 6.60 | (0.47) | (4.21) | (4.68) | $75.05 | 9.33% | 0.62% | 0.64% | 0.41% | 0.39% | 22% |
| $1,708 |
|
| 2017 | $59.27 | 0.51 | 15.76 | 16.27 | (0.43) | (1.98) | (2.41) | $73.13 | 28.38% | 0.64% | 0.65% | 0.68% | 0.67% | 19% |
| $1,519 |
|
| 2016 | $62.51 | 0.41 | 0.31 | 0.72 | (0.46) | (3.50) | (3.96) | $59.27 | 1.35% | 0.64% | 0.64% | 0.71% | 0.71% | 16% |
| $7,959 |
|
| 2015 | $62.18 | 0.41 | 5.79 | 6.20 | (0.45) | (5.42) | (5.87) | $62.51 | 11.31% | 0.64% | 0.64% | 0.70% | 0.70% | 24% |
| $9,841 |
|
|
| | | | |
| Notes to Financial Highlights | | |
| |
| (1) | Computed using average shares outstanding throughout the period. |
| |
| (2) | Total returns are calculated based on the net asset value of the last business day and do not reflect applicable sales charges, if any. Total returns for periods less than one year are not annualized. |
| |
| (3) | Amount is less than $0.005. |
| |
| (4) | Ratio was less than 0.005%. |
| |
| (5) | April 10, 2017 (commencement of sale) through October 31, 2017. |
| |
| (7) | Portfolio turnover is calculated at the fund level. Percentage indicated was calculated for the year ended October 31, 2017. |
See Notes to Financial Statements.
|
|
| Report of Independent Registered Public Accounting Firm |
To the Shareholders and the Board of Directors of American Century Mutual Funds, Inc.:
Opinion on the Financial Statements and Financial Highlights
We have audited the accompanying statement of assets and liabilities, including the schedule of investments, of Select Fund, one of the funds constituting the American Century Mutual Funds, Inc. (the "Fund"), as of October 31, 2019, the related statement of operations for the year then ended, the statements of changes in net assets for each of the two years in the period then ended, the financial highlights for each of the five years in the period then ended, and the related notes. In our opinion, the financial statements and financial highlights present fairly, in all material respects, the financial position of Select Fund of the American Century Mutual Funds, Inc. as of October 31, 2019, the results of its operations for the year then ended, the changes in its net assets for each of the two years in the period then ended, and the financial highlights for each of the five years in the period then ended, in conformity with accounting principles generally accepted in the United States of America.
Basis for Opinion
These financial statements and financial highlights are the responsibility of the Fund's management. Our responsibility is to express an opinion on the Fund’s financial statements and financial highlights based on our audits. We are a public accounting firm registered with the Public Company Accounting Oversight Board (United States) (PCAOB) and are required to be independent with respect to the Fund in accordance with the U.S. federal securities laws and the applicable rules and regulations of the Securities and Exchange Commission and the PCAOB.
We conducted our audits in accordance with the standards of the PCAOB. Those standards require that we plan and perform the audit to obtain reasonable assurance about whether the financial statements and financial highlights are free of material misstatement, whether due to error or fraud. The Fund is not required to have, nor were we engaged to perform, an audit of its internal control over financial reporting. As part of our audits we are required to obtain an understanding of internal control over financial reporting but not for the purpose of expressing an opinion on the effectiveness of the Fund’s internal control over financial reporting. Accordingly, we express no such opinion.
Our audits included performing procedures to assess the risks of material misstatement of the financial statements and financial highlights, whether due to error or fraud, and performing procedures that respond to those risks. Such procedures included examining, on a test basis, evidence regarding the amounts and disclosures in the financial statements and financial highlights. Our audits also included evaluating the accounting principles used and significant estimates made by management, as well as evaluating the overall presentation of the financial statements and financial highlights. Our procedures included confirmation of securities owned as of October 31, 2019, by correspondence with the custodian and brokers; when replies were not received from brokers, we performed other auditing procedures. We believe that our audits provide a reasonable basis for our opinion.
DELOITTE & TOUCHE LLP
Kansas City, Missouri
December 16, 2019
We have served as the auditor of one or more American Century investment companies since 1997.
The Board of Directors
The individuals listed below serve as directors of the funds. Each director will continue to serve in this capacity until death, retirement, resignation or removal from office. The board has adopted a mandatory retirement age for directors who are not “interested persons,” as that term is defined in the Investment Company Act (independent directors). Independent directors shall retire by December 31 of the year in which they reach their 75th birthday.
Mr. Thomas is an “interested person” because he currently serves as President and Chief Executive Officer of American Century Companies, Inc. (ACC), the parent company of American Century Investment Management, Inc. (ACIM or the advisor). The other directors (more than three-fourths of the total number) are independent. They are not employees, directors or officers of, and have no financial interest in, ACC or any of its wholly owned, direct or indirect, subsidiaries, including ACIM, American Century Investment Services, Inc. (ACIS) and American Century Services, LLC (ACS), and they do not have any other affiliations, positions or relationships that would cause them to be considered “interested persons” under the Investment Company Act. The directors serve in this capacity for seven (in the case of Jonathan S. Thomas, 16; and Stephen E. Yates, 8) registered investment companies in the American Century Investments family of funds.
The following table presents additional information about the directors. The mailing address for each director is 4500 Main Street, Kansas City, Missouri 64111.
|
| | | | | |
Name
(Year of Birth) | Position(s) Held with Funds | Length of Time Served | Principal Occupation(s) During Past 5 Years | Number of American Century Portfolios Overseen by Director | Other Directorships Held During Past 5 Years |
| Independent Directors |
|
|
| Thomas W. Bunn (1953) | Director | Since 2017 | Retired | 66 | SquareTwo Financial; Barings (formerly Babson Capital Funds Trust) (2013 to 2016) |
Chris H. Cheesman
(1962)
| Director | Since 2019
| Retired. Senior Vice President & Chief Audit Executive, AllianceBernstein (1999 to 2018)
| 66 | None |
Barry Fink
(1955) | Director | Since 2012 (independent since 2016) | Retired | 66 | None |
Rajesh K. Gupta
(1960)
| Director | Since 2019
| Partner Emeritus, SeaCrest Investment Management and SeaCrest Wealth Management (2019 to Present); Chief Executive Officer and Chief Investment Officer, SeaCrest Investment Management (2006 to 2019); Chief Executive Officer and Chief Investment Officer, SeaCrest Wealth Management (2008 to 2019)
| 66 | None |
|
| | | | | |
Name
(Year of Birth) | Position(s) Held with Funds | Length of Time Served | Principal Occupation(s) During Past 5 Years | Number of American Century Portfolios Overseen by Director | Other Directorships Held During Past 5 Years |
| Independent Directors |
|
|
Lynn Jenkins
(1963)
| Director | Since 2019
| United States Representative, U.S. House of Representatives (2009 to 2018) | 66 | MGP Ingredients, Inc. |
Jan M. Lewis
(1957) | Director | Since 2011 | Retired | 66 | None |
John R. Whitten
(1946) | Director | Since 2008 | Retired | 66 | Onto Innovation Inc.; Rudolph Technologies, Inc. (2006 to 2019) |
Stephen E. Yates
(1948) | Director and Chairman of the Board | Since 2012 (Chairman since 2018) | Retired | 81 | None |
| Interested Director |
|
Jonathan S. Thomas
(1963) | Director | Since 2007 | President and Chief Executive Officer, ACC (2007 to present). Also serves as Chief Executive Officer, ACS; Executive Vice President, ACIM; Director, ACC, ACIM and other ACC subsidiaries | 125 | BioMed Valley Discoveries, Inc. |
The Statement of Additional Information has additional information about the fund's directors and is available without charge, upon request, by calling 1-800-345-2021.
Officers
The following table presents certain information about the executive officers of the funds. Each officer serves as an officer for each of the 16 (in the case of Robert J. Leach, 15) investment companies in the American Century family of funds. No officer is compensated for his or her service as an officer of the funds. The listed officers are interested persons of the funds and are appointed or re-appointed on an annual basis. The mailing address for each officer listed below is 4500 Main Street, Kansas City, Missouri 64111.
|
| | |
Name
(Year of Birth) | Offices with the Funds | Principal Occupation(s) During the Past Five Years |
Patrick Bannigan
(1965) | President since 2019 | Executive Vice President and Director, ACC (2012 to present); Chief Financial Officer, Chief Accounting Officer and Treasurer, ACC (2015 to present); Chief Operating Officer, ACC (2012-2015). Also serves as President, ACS; Vice President, ACIM; Chief Financial Officer, Chief Accounting Officer and/or Director, ACIM, ACS and other ACC subsidiaries |
R. Wes Campbell
(1974) | Chief Financial Officer and Treasurer since 2018 | Investment Operations and Investment Accounting, ACS (2000 to present) |
Amy D. Shelton
(1964) | Chief Compliance Officer and Vice President since 2014 | Chief Compliance Officer, American Century funds, (2014 to present); Chief Compliance Officer, ACIM (2014 to present); Chief Compliance Officer, ACIS (2009 to present). Also serves as Vice President, ACIS |
Charles A. Etherington
(1957) | General Counsel since 2007 and Senior Vice President since 2006 | Attorney, ACC (1994 to present); Vice President, ACC (2005 to present); General Counsel, ACC (2007 to present). Also serves as General Counsel, ACIM, ACS, ACIS and other ACC subsidiaries; and Senior Vice President, ACIM and ACS |
C. Jean Wade
(1964) | Vice President since 2012 | Senior Vice President, ACS (2017 to present); Vice President, ACS (2000 to 2017)
|
Robert J. Leach
(1966) | Vice President since 2006 | Vice President, ACS (2000 to present) |
David H. Reinmiller
(1963) | Vice President since 2000 | Attorney, ACC (1994 to present). Also serves as Vice President, ACIM and ACS |
Ward D. Stauffer
(1960) | Secretary since 2005 | Attorney, ACC (2003 to present) |
|
|
| Approval of Management Agreement |
At a meeting held on June 26, 2019, the Fund’s Board of Directors (the "Board") unanimously approved the renewal of the management agreement pursuant to which American Century Investment Management, Inc. (the “Advisor”) acts as the investment advisor for the Fund. Under Section 15(c) of the Investment Company Act, contracts for investment advisory services are required to be reviewed, evaluated, and approved by a majority of a fund’s directors (the “Directors”), including a majority of the independent Directors, each year.
Prior to its consideration of the renewal of the management agreement, the Directors requested and reviewed extensive data and information compiled by the Advisor and certain independent providers of evaluation data concerning the Fund and the services provided to the Fund by the Advisor. This review was in addition to the oversight and evaluation undertaken by the Board and its committees on a continual basis and the information received was supplemental to the extensive information that the Board and its committees receive and consider throughout the year.
In connection with its consideration of the renewal of the management agreement, the Board’s review and evaluation of the services provided by the Advisor included, but was not limited to, the following:
| |
| • | the nature, extent, and quality of investment management, shareholder services, and other services provided and to be provided to the Fund; |
| |
| • | the wide range of other programs and services provided and to be provided to the Fund and its shareholders on a routine and non-routine basis; |
| |
| • | the investment performance of the Fund, including data comparing the Fund's performance to appropriate benchmarks and/or a peer group of other mutual funds with similar investment objectives and strategies; |
| |
| • | the cost of owning the Fund compared to the cost of owning similar funds; |
| |
| • | the compliance policies, procedures, and regulatory experience of the Advisor and the Fund's service providers; |
| |
| • | financial data showing the cost of services provided to the Fund, the profitability of the Fund to the Advisor, and the overall profitability of the Advisor; |
| |
| • | strategic plans of the Advisor; |
| |
| • | any economies of scale associated with the Advisor’s management of the Fund and other accounts; |
| |
| • | services provided and charges to the Advisor's other investment management clients; |
| |
| • | acquired fund fees and expenses; |
| |
| • | payments and practices in connection with financial intermediaries holding shares of the Fund and the services provided by intermediaries in connection therewith; and |
| |
| • | any collateral benefits derived by the Advisor from the management of the Fund. |
The Directors held three in-person meetings and one telephonic meeting to review and discuss the information provided. The independent Directors also reviewed responses to supplemental information requests provided by the Directors to the Advisor and held active discussions with the Advisor regarding the renewal of the management agreement. The independent Directors had the benefit of the advice of their independent counsel throughout the process.
Factors Considered
The Directors considered all of the information provided by the Advisor, the independent data providers, and independent counsel in connection with the approval. They determined that the information was sufficient for them to evaluate the management agreement for the Fund. In connection with their review, the Directors did not identify any single factor as being all-important or
controlling, and each Director may have attributed different levels of importance to different factors. In deciding to renew the management agreement, the Board based its decision on a number of factors, including without limitation the following:
Nature, Extent and Quality of Services — Generally. Under the management agreement, the Advisor is responsible for providing or arranging for all services necessary for the operation of the Fund. The Board noted that the Advisor provides or arranges at its own expense a wide variety of services including without limitation the following:
| |
| • | portfolio research and security selection |
| |
| • | daily valuation of the Fund’s portfolio |
| |
| • | shareholder servicing and transfer agency, including shareholder confirmations, recordkeeping, and communications |
| |
| • | legal services (except the independent Directors’ counsel) |
| |
| • | regulatory and portfolio compliance |
| |
| • | marketing and distribution (except amounts paid by the Fund under Rule 12b-1 plans) |
The Board noted that many of these services have expanded over time in terms of both quantity and complexity in response to shareholder demands, competition in the industry, changing distribution channels, and the changing regulatory environment.
Investment Management Services. The nature of the investment management services provided to the Fund is quite complex and allows Fund shareholders access to professional money management, instant diversification of their investments within an asset class, the opportunity to easily diversify among asset classes by investing in or exchanging among various American Century Investments funds, and liquidity. In evaluating investment performance, the Board expects the Advisor to manage the Fund in accordance with its investment objectives and approved strategies. Further, the Directors recognize that the Advisor has an obligation to monitor trading activities, and in particular to seek the best execution of fund trades, and to evaluate the use of and payment for research. In providing these services, the Advisor utilizes teams of investment professionals (portfolio managers, analysts, research assistants, and securities traders) who require extensive information technology, research, training, compliance, and other systems to conduct their business. The Board, directly and through its Fund Performance Review Committee, provides oversight of the investment performance process. It regularly reviews investment performance information for the Fund, together with comparative information for appropriate benchmarks and/or peer groups of similarly-managed funds, over different time horizons. The Directors also review investment performance information during the management agreement renewal process. If performance concerns are identified, the Fund receives special reviews until performance improves, during which the Board discusses with the Advisor the reasons for such results (e.g., market conditions, security selection) and any efforts being undertaken to improve performance. The Fund’s performance was below its benchmark for the one-, three-, five-, and ten-year periods reviewed by the Board. The Board found the investment management services provided by the Advisor to the Fund to be satisfactory and consistent with the management agreement.
Shareholder and Other Services. Under the management agreement, the Advisor provides the Fund with a comprehensive package of transfer agency, shareholder, and other services. The Board, directly and through various committees of the Board, regularly reviews reports and evaluations of such services at its regular meetings. These reports include, but are not limited to, information regarding the operational efficiency and accuracy of the shareholder and transfer agency services provided, staffing levels, shareholder satisfaction, technology support (including cyber security), new products and services offered to Fund shareholders, securities trading
activities, portfolio valuation services, auditing services, and legal and operational compliance activities. The Board found the services provided by the Advisor to the Fund under the management agreement to be competitive and of high quality.
Costs of Services and Profitability. The Advisor provides detailed information concerning its cost of providing various services to the Fund, its profitability in managing the Fund (pre- and post-distribution), its overall profitability, and its financial condition. The Directors have reviewed with the Advisor the methodology used to prepare this financial information. This information is considered in evaluating the Advisor’s financial condition, its ability to continue to provide services under the management agreement, and the reasonableness of the current management fee. The Board concluded that the Advisor’s profits were reasonable in light of the services provided to the Fund.
Ethics. The Board generally considers the Advisor’s commitment to providing quality services to shareholders and to conducting its business ethically. They noted that the Advisor’s practices generally meet or exceed industry best practices.
Economies of Scale. The Board also reviewed information provided by the Advisor regarding the possible existence of economies of scale in connection with the management of the Fund. The Board concluded that economies of scale are difficult to measure and predict with precision, especially on a fund-by-fund basis. The Board concluded that the Advisor is appropriately sharing economies of scale through its competitive fee structure, offering competitive fees from fund inception, and through reinvestment in its business to provide shareholders additional content and services. The Board also noted that economies of scale are shared with the Fund and its shareholders through management fee breakpoints that serve to reduce the effective management fee as the assets of the Fund grow.
Comparison to Other Funds’ Fees. The management agreement provides that the Fund pays the Advisor a single, all-inclusive (or unified) management fee for providing all services necessary for the management and operation of the Fund, other than brokerage expenses, expenses attributable to short sales, taxes, interest, extraordinary expenses, fees and expenses of the Fund’s independent Directors (including their independent legal counsel), and expenses incurred in connection with the provision of shareholder services and distribution services under a plan adopted pursuant to Rule 12b-1 under the Investment Company Act. Under the unified fee structure, the Advisor is responsible for providing all investment advisory, custody, audit, administrative, compliance, recordkeeping, marketing and shareholder services, or arranging and supervising third parties to provide such services. By contrast, most other funds are charged a variety of fees, including an investment advisory fee, a transfer agency fee, an administrative fee, distribution charges, and other expenses. Other than their investment advisory fees and any applicable Rule 12b-1 distribution fees, all other components of the total fees charged by these other funds may be increased without shareholder approval. The Board believes the unified fee structure is a benefit to Fund shareholders because it clearly discloses to shareholders the cost of owning Fund shares, and, since the unified fee cannot be increased without a vote of Fund shareholders, it shifts to the Advisor the risk of increased costs of operating the Fund and provides a direct incentive to minimize administrative inefficiencies. Part of the Board’s analysis of fee levels involves reviewing certain evaluative data compiled by an independent provider comparing the Fund’s unified fee to the total expense ratios of its peers. The unified fee charged to shareholders of the Fund was above the median of the total expense ratios of the Fund’s peer expense universe and was within the range of its peer expense group. The Board and the Advisor agreed to a temporary reduction of the Fund's annual unified management fee of 0.02% (e.g., the Investor Class unified fee will be reduced from 0.99% to 0.97%) for at least one year, beginning August 1, 2019. The Board concluded that the management fee paid by the Fund to the Advisor under the management agreement is reasonable in light of the services provided to the Fund.
Comparison to Fees and Services Provided to Other Clients of the Advisor. The Directors also requested and received information from the Advisor concerning the nature of the services, fees, costs, and profitability of its advisory services to advisory clients other than the Fund. They
observed that these varying types of client accounts require different services and involve different regulatory and entrepreneurial risks than the management of the Fund. The Board analyzed this information and concluded that the fees charged and services provided to the Fund were reasonable by comparison.
Payments to Intermediaries. The Directors also requested and received a description of payments made to intermediaries by the Fund and the Advisor and services provided in response thereto. These payments include various payments made by the Fund or the Advisor to different types of intermediaries and recordkeepers for distribution and service activities provided for the Fund. The Board reviewed such information and received representations from the Advisor that all such payments by the Fund were made pursuant to the Fund's Rule 12b-1 Plan and that all such payments by the Advisor were made from the Advisor’s resources and reasonable profits. The Board found such payments to be reasonable in scope and purpose.
Collateral or “Fall-Out” Benefits Derived by the Advisor. The Board considered the existence of collateral benefits the Advisor may receive as a result of its relationship with the Fund. They concluded that the Advisor’s primary business is managing mutual funds and it generally does not use fund or shareholder information to generate profits in other lines of business, and therefore does not derive any significant collateral benefits from them. The Board noted that additional assets from other clients may offer the Advisor some benefit from increased leverage with service providers and counterparties. Additionally, the Advisor may receive proprietary research from broker-dealers that execute fund portfolio transactions, which the Board concluded is likely to benefit other clients of the Advisor, as well as Fund shareholders. The Board also determined that the Advisor is able to provide investment management services to certain clients other than the Fund, at least in part, due to its existing infrastructure built to serve the fund complex. The Board concluded that appropriate allocation methodologies had been employed to assign resources and the cost of those resources to these other clients and, where expressly provided, these other client assets may be included with the assets of the Fund to determine breakpoints in the management fee schedule.
Existing Relationship. The Board also considered whether there was any reason for not continuing the existing arrangement with the Advisor. In this regard, the Board was mindful of the potential disruptions of the Fund’s operations and various risks, uncertainties, and other effects that could occur as a result of a decision not to continue such relationship. In particular, the Board recognized that most shareholders have invested in the Fund on the strength of the Advisor’s industry standing and reputation and in the expectation that the Advisor will have a continuing role in providing advisory services to the Fund.
Conclusion of the Directors. As a result of this process, the Board, including all of the independent Directors, taking into account all of the factors discussed above and the information provided by the Advisor and others in connection with its review and throughout the year, determined that the management fee is fair and reasonable in light of the services provided and that the investment management agreement between the Fund and the Advisor should be renewed.
Retirement Account Information
As required by law, distributions you receive from certain retirement accounts are subject to federal income tax withholding, unless you elect not to have withholding apply*. Tax will be withheld on the total amount withdrawn even though you may be receiving amounts that are not subject to withholding, such as nondeductible contributions. In such case, excess amounts of withholding could occur. You may adjust your withholding election so that a greater or lesser amount will be withheld.
If you don’t want us to withhold on this amount, you must notify us to not withhold the federal income tax. You may notify us in writing or in certain situations by telephone or through other electronic means. For systematic withdrawals, your withholding election will remain in effect until revoked or changed by filing a new election. You have the right to revoke your election at any time and change your withholding percentage for future distributions.
Remember, even if you elect not to have income tax withheld, you are liable for paying income tax on the taxable portion of your withdrawal. If you elect not to have income tax withheld or you don’t have enough income tax withheld, you may be responsible for payment of estimated tax. You may incur penalties under the estimated tax rules if your withholding and estimated tax payments are not sufficient. You can reduce or defer the income tax on a distribution by directly or indirectly rolling such distribution over to another IRA or eligible plan. You should consult your tax advisor for additional information.
State tax will be withheld if, at the time of your distribution, your address is within one of the mandatory withholding states and you have federal income tax withheld (or as otherwise required by state law). State taxes will be withheld from your distribution in accordance with the respective state rules.
*Some 403(b), 457 and qualified retirement plan distributions may be subject to 20% mandatory withholding, as they are subject to special tax and withholding rules. Your plan administrator or plan sponsor is required to provide you with a special tax notice explaining those rules at the time you request a distribution. If applicable, federal and/or state taxes may be withheld from your distribution amount.
Proxy Voting Policies
A description of the policies that the fund's investment advisor uses in exercising the voting rights associated with the securities purchased and/or held by the fund is available without charge, upon request, by calling 1-800-345-2021. It is also available on American Century Investments’ website at americancentury.com/proxy and on the Securities and Exchange Commission’s website at sec.gov. Information regarding how the investment advisor voted proxies relating to portfolio securities during the most recent 12-month period ended June 30 is available on americancentury.com/proxy. It is also available at sec.gov.
Quarterly Portfolio Disclosure
The fund files its complete schedule of portfolio holdings with the Securities and Exchange Commission (SEC) for the first and third quarters of each fiscal year on Form N-Q or as an exhibit to its reports on Form N-PORT. The fund’s Forms N-Q and Form N-PORT reports are available on the SEC’s website at sec.gov. The fund also makes its complete schedule of portfolio holdings for the most recent quarter of its fiscal year available on its website at americancentury.com and, upon request, by calling 1-800-345-2021.
Other Tax Information
The following information is provided pursuant to provisions of the Internal Revenue Code.
The fund hereby designates up to the maximum amount allowable as qualified dividend income for the fiscal year ended October 31, 2019.
For corporate taxpayers, the fund hereby designates $1,537,114, or up to the maximum amount allowable, of ordinary income distributions paid during the fiscal year ended October 31, 2019 as qualified for the corporate dividends received deduction.
The fund hereby designates $221,802,879, or up to the maximum amount allowable, as long-term capital gain distributions (20% rate gain distributions) for the fiscal year ended October 31, 2019.
|
| | |
| |
| | | |
| Contact Us | americancentury.com | |
| Automated Information Line | 1-800-345-8765 | |
| Investor Services Representative | 1-800-345-2021 or 816-531-5575 | |
| Investors Using Advisors | 1-800-378-9878 | |
| Business, Not-For-Profit, Employer-Sponsored Retirement Plans | 1-800-345-3533 | |
| Banks and Trust Companies, Broker-Dealers, Financial Professionals, Insurance Companies | 1-800-345-6488 | |
| Telecommunications Relay Service for the Deaf | 711 | |
| | | |
| American Century Mutual Funds, Inc. | |
| | | |
Investment Advisor: American Century Investment Management, Inc. Kansas City, Missouri | |
| | | |
| This report and the statements it contains are submitted for the general information of our shareholders. The report is not authorized for distribution to prospective investors unless preceded or accompanied by an effective prospectus. | |
| | | |
©2019 American Century Proprietary Holdings, Inc. All rights reserved.
CL-ANN-90969 1912 | |
|
| |
| | |
| | Annual Report |
| | |
| | October 31, 2019 |
| | |
| | Small Cap Growth Fund |
| | Investor Class (ANOIX) |
| | I Class (ANONX) |
| | Y Class (ANOYX) |
| | A Class (ANOAX) |
| | C Class (ANOCX) |
| | R Class (ANORX) |
| | R5 Class (ANOGX) |
| | R6 Class (ANODX) |
| | G Class (ANOHX) |
Beginning on January 1, 2021, as permitted by regulations adopted by the Securities and Exchange Commission, paper copies of the fund’s shareholder reports like this one will no longer be sent by mail, unless you specifically request paper copies of the reports from the fund or from your financial intermediary, such as a broker-dealer or bank. Instead, the reports will be made available on a website, and you will be notified by mail each time a report is posted and provided with a website link to access the report.
If you already elected to receive shareholder reports electronically, you will not be affected by this change and you need not take any action. You may elect to receive shareholder reports and other communications from the fund or your financial intermediary electronically by calling or sending an email request to your appropriate contacts as listed on the back cover of this report.
You may elect to receive all future reports in paper free of charge. You can inform the fund or your financial intermediary that you wish to continue receiving paper copies of your shareholder reports by calling or sending an email request to your appropriate contacts as listed on the back cover of this report. Your election to receive reports in paper will apply to all funds held with the fund complex/your financial intermediary.
|
| | |
| President’s Letter | 2 |
|
| Performance | 3 |
|
| Portfolio Commentary | |
|
| Fund Characteristics | |
|
| Shareholder Fee Example | |
|
| Schedule of Investments | |
|
| Statement of Assets and Liabilities | |
|
| Statement of Operations | |
|
| Statement of Changes in Net Assets | |
|
| Notes to Financial Statements | |
|
| Financial Highlights | |
|
| Report of Independent Registered Public Accounting Firm | |
|
| Management | |
|
| Approval of Management Agreement | |
|
| Additional Information | |
|
Any opinions expressed in this report reflect those of the author as of the date of the report, and do not necessarily represent the opinions of American Century Investments® or any other person in the American Century Investments organization. Any such opinions are subject to change at any time based upon market or other conditions and American Century Investments disclaims any responsibility to update such opinions. These opinions may not be relied upon as investment advice and, because investment decisions made by American Century Investments funds are based on numerous factors, may not be relied upon as an indication of trading intent on behalf of any American Century Investments fund. Security examples are used for representational purposes only and are not intended as recommendations to purchase or sell securities. Performance information for comparative indices and securities is provided to American Century Investments by third party vendors. To the best of American Century Investments’ knowledge, such information is accurate at the time of printing.
Jonathan Thomas
Dear Investor:
Thank you for reviewing this annual report for the 12 months ended October 31, 2019. Annual reports help convey important information about fund returns, including market factors that affected performance. For additional investment and market insights, please visit americancentury.com.
Stocks, Bonds Delivered Solid Gains
U.S. and global stocks, bonds and real estate investments generally delivered strong gains for the 12-month period. Stocks and other riskier assets rebounded from a late-2018 sell-off to post robust returns for the 12 months overall. Global bonds benefited from safe-haven buying early in the period and a declining interest rate environment overall.
Fed’s Policy Pivot Improved Investor Sentiment
In the final months of 2018, mounting concerns about slowing global economic and earnings growth, tariffs and Federal Reserve (Fed) policy soured investor sentiment, driving global stocks lower. After raising rates in September 2018, the Fed hiked again in December and delivered a surprisingly bullish 2019 rate-hike outlook, which intensified the sell-off among stocks and other riskier assets. Meanwhile, the risk-off climate sparked a flight to quality, which drove U.S. and other government bond yields lower and benefited global bond returns.
A key policy pivot from the Fed helped improve equity investor sentiment beginning in early 2019. The central bank abruptly ended its rate-hike campaign and adopted a dovish tone amid weaker global growth and inflation. Additionally, investors’ worst-case fears about trade and corporate earnings generally eased, which also aided stocks and other riskier assets. At the same time, government bond yields continued to fall on moderating global growth data, muted inflation and accommodative central bank policy in the U.S., Europe and Japan. By July, concerns about global economic risks prompted the Fed to cut short-term interest rates for the first time in 10 years. The Fed followed up with additional rate cuts in September and October. This backdrop supported continued gains for fixed-income and other interest rate-sensitive assets.
Looking ahead, we expect volatility to remain a formidable factor as investors react to global growth and trade trends, central bank policy and geopolitical developments. We believe this scenario underscores the importance of using professionally managed portfolios in pursuit of investment goals. We appreciate your continued trust and confidence in us.
Sincerely,
Jonathan Thomas
President and Chief Executive Officer
American Century Investments
|
| | | | | | |
| Total Returns as of October 31, 2019 |
| | | | Average Annual Returns | |
| | Ticker Symbol | 1 year | 5 years | 10 years | Since Inception | Inception Date |
| Investor Class | ANOIX | 13.00% | 10.65% | 14.56% | — | 6/1/01 |
| Russell 2000 Growth Index | — | 6.40% | 8.37% | 13.37% | — | — |
| I Class | ANONX | 13.16% | 10.84% | 14.79% | — | 5/18/07 |
| Y Class | ANOYX | 13.34% | — | — | 15.09% | 4/10/17 |
| A Class | ANOAX | | | | | 1/31/03 |
| No sales charge | | 12.72% | 10.36% | 14.28% | — | |
| With sales charge | | 6.22% | 9.05% | 13.60% | — | |
| C Class | ANOCX | 11.84% | 9.53% | 13.43% | — | 1/31/03 |
| R Class | ANORX | 12.39% | 10.08% | 13.99% | — | 9/28/07 |
| R5 Class | ANOGX | 13.21% | — | — | 14.92% | 4/10/17 |
| R6 Class | ANODX | 13.40% | 11.02% | — | 11.15% | 7/26/13 |
| G Class | ANOHX | — | — | — | 5.22% | 4/1/19 |
Average annual returns since inception are presented when ten years of performance history is not available. G Class returns would have been lower if a portion of the fees had not been waived.
Sales charges include initial sales charges and contingent deferred sales charges (CDSCs), as applicable. A Class shares have a 5.75% maximum initial sales charge and may be subject to a maximum CDSC of 1.00%. C Class shares redeemed within 12 months of purchase are subject to a maximum CDSC of 1.00%. The SEC requires that mutual funds provide performance information net of maximum sales charges in all cases where charges could be applied.
Data presented reflect past performance. Past performance is no guarantee of future results. Current performance may be higher or lower than the performance shown. Total returns for periods less than one year are not annualized. Investment return and principal value will fluctuate, and redemption value may be more or less than original cost. Data assumes reinvestment of dividends and capital gains, and none of the charts reflect the deduction of taxes that a shareholder would pay on fund distributions or the redemption of fund shares. To obtain performance data current to the most recent month end, please call 1-800-345-2021 or visit americancentury.com. For additional information about the fund, please consult the prospectus.
|
|
| Growth of $10,000 Over 10 Years |
| $10,000 investment made October 31, 2009 |
| Performance for other share classes will vary due to differences in fee structure. |
|
| |
| Value on October 31, 2019 |
| | Investor Class — $38,957 |
| |
| | Russell 2000 Growth Index — $35,095 |
| |
|
| | | | | | | | |
| Total Annual Fund Operating Expenses | |
| Investor Class | I Class | Y Class | A Class | C Class | R Class | R5 Class | R6 Class | G Class |
| 1.27% | 1.07% | 0.92% | 1.52% | 2.27% | 1.77% | 1.07% | 0.92% | 0.92% |
The total annual fund operating expenses shown is as stated in the fund’s prospectus current as of the date of this report. The prospectus may vary from the expense ratio shown elsewhere in this report because it is based on a different time period, includes acquired fund fees and expenses, and, if applicable, does not include fee waivers or expense reimbursements.
Data presented reflect past performance. Past performance is no guarantee of future results. Current performance may be higher or lower than the performance shown. Total returns for periods less than one year are not annualized. Investment return and principal value will fluctuate, and redemption value may be more or less than original cost. Data assumes reinvestment of dividends and capital gains, and none of the charts reflect the deduction of taxes that a shareholder would pay on fund distributions or the redemption of fund shares. To obtain performance data current to the most recent month end, please call 1-800-345-2021 or visit americancentury.com. For additional information about the fund, please consult the prospectus.
Portfolio Managers: Jackie Wagner and Jeff Hoernemann
Performance Summary
Small Cap Growth returned 13.00%* for the 12 months ended October 31, 2019, outpacing the 6.40% return of the portfolio’s benchmark, the Russell 2000 Growth Index.
U.S. stocks delivered strong returns during the reporting period. Growth stocks outperformed value stocks by a wide margin across the capitalization spectrum. Within the Russell 2000 Growth Index, utilities, information technology and real estate were the top-performing sectors on a total-return basis. Energy stocks posted significant losses as the price of oil declined. The communication services and health care sectors also fell.
Stock choices within the health care and information technology sectors helped drive outperformance relative to the benchmark. Stock selection in the consumer staples and industrials sectors detracted.
Health Care Stocks Benefited Performance
Stock selection across health care industries was helpful, led by pharmaceuticals and life sciences tools and services. In the information technology sector, choices among software stocks benefited relative performance. Paylocity Holding was a top contributor in the industry. Paylocity provides subscription software for payroll and human capital management. Quarterly results over the last year continued to beat analysts’ expectations, and management boosted guidance. Growth has been driven by strong net new customer adds, retention and higher revenue per customer.
Other top contributors included TopBuild, an installer and distributor of insulation and building accessories. Stock price strength was driven by optimism in the housing market on the heels of lower mortgage rates and a pickup in permit activity. Palomar Holdings, an insurance company mostly exposed to earthquake insurance, was a solid contributor. Management reported strong results due to better-than-expected underwriting revenue. The pace of new business activity for the company’s most popular residential earthquake product showed strong growth.
Kinsale Capital Group, a provider of excess and surplus insurance, reported better-than-expected results for premium growth and earnings. Growth in policies continued to be driven by widespread improvement across geographies, product lines and new business formation. Expenses remained in check as well as providing operating leverage and earnings growth. Americold Realty Trust, a provider of cold storage real estate services, outperformed. Pricing and margin trends were positive and helped drive strong same-store net operating income growth. The shift to online grocery shopping is nearing a tipping point in the adoption curve, which should benefit Americold in the long run.
Consumer Staples Weighed on Performance
Stock selection among personal products companies and an overweight allocation to the industry led underperformance in the consumer staples sector relative to the benchmark. Meal replacement company Medifast underperformed despite reporting better-than-expected quarterly results. Investors worried about guidance that implied additional investments for expansion into non-U.S. markets. Stock choices in the construction and engineering and machinery industries hampered performance in the industrials sector.
*All fund returns referenced in this commentary are for Investor Class shares. Performance for other share classes will vary due to differences in fee structure; when Investor Class performance exceeds that of the fund’s benchmark, other share classes may not. See page 3 for returns for all share classes.
Other key detractors included PlayAGS, a manufacturer and designer of a variety of gaming products for casinos. Quarterly results have been mixed and performance was further hampered by weakness due to a key customer, decreased gaming operations revenue in the interactive segment and softness from certain corporate customers. We eliminated our holding. Callon Petroleum detracted. This producer of crude oil and natural gas fell as oil sold off sharply and the market reacted negatively to the company’s proposed merger with a peer.
At Home Group was a significant detractor. The retailer of home goods and decorations announced disappointing revenue and earnings results as weaker-than-expected same-store sales growth combined with weak margins led to management significantly reducing full-year earnings expectations. We eliminated the holding. The stock of veterinary care company Covetrus fell sharply after it reported disappointing results. The company failed to execute well on its spin-off from Henry Schein early in 2019 and its merger with Vets First Choice. Covetrus was eliminated from the portfolio.
Outlook
Small Cap Growth’s investment process focuses on smaller companies with accelerating growth rates and share-price momentum. We believe that active investments in such companies will generate outperformance over time compared with the Russell 2000 Growth Index.
The portfolio positioning remains largely stock specific, with few thematic trends. As of October 31, 2019, financials was the largest overweight sector relative to the benchmark. Communication services and materials were the largest underweights.
|
| |
| OCTOBER 31, 2019 | |
| Top Ten Holdings | % of net assets |
| Churchill Downs, Inc. | 1.7% |
| Teladoc Health, Inc. | 1.5% |
| TopBuild Corp. | 1.5% |
| Brink's Co. (The) | 1.4% |
| Medifast, Inc. | 1.4% |
| Catalent, Inc. | 1.4% |
| Chegg, Inc. | 1.3% |
| R1 RCM, Inc. | 1.3% |
| Genpact Ltd. | 1.3% |
| Kinsale Capital Group, Inc. | 1.3% |
| | |
| Top Five Industries | % of net assets |
| Biotechnology | 11.1% |
| Software | 7.8% |
| Commercial Services and Supplies | 5.8% |
| Health Care Providers and Services | 5.1% |
| Insurance | 4.6% |
| | |
| Types of Investments in Portfolio | % of net assets |
| Common Stocks | 97.0% |
| Exchange-Traded Funds | 1.0% |
| Total Equity Exposure | 98.0% |
| Temporary Cash Investments | 1.9% |
| Temporary Cash Investments - Securities Lending Collateral | 4.8% |
| Other Assets and Liabilities | (4.7)% |
Fund shareholders may incur two types of costs: (1) transaction costs, including sales charges (loads) on purchase payments and redemption/exchange fees; and (2) ongoing costs, including management fees; distribution and service (12b-1) fees; and other fund expenses. This example is intended to help you understand your ongoing costs (in dollars) of investing in your fund and to compare these costs with the ongoing cost of investing in other mutual funds.
The example is based on an investment of $1,000 made at the beginning of the period and held for the entire period from May 1, 2019 to October 31, 2019.
Actual Expenses
The table provides information about actual account values and actual expenses for each class. You may use the information, together with the amount you invested, to estimate the expenses that you paid over the period. First, identify the share class you own. Then simply divide your account value by $1,000 (for example, an $8,600 account value divided by $1,000 = 8.6), then multiply the result by the number under the heading “Expenses Paid During Period” to estimate the expenses you paid on your account during this period.
If you hold Investor Class shares of any American Century Investments fund, or I Class shares of the American Century Diversified Bond Fund, in an American Century Investments account (i.e., not a financial intermediary or retirement plan account), American Century Investments may charge you a $12.50 semiannual account maintenance fee if the value of those shares is less than $10,000. We will redeem shares automatically in one of your accounts to pay the $12.50 fee. In determining your total eligible investment amount, we will include your investments in all personal accounts (including American Century Investments Brokerage accounts) registered under your Social Security number. Personal accounts include individual accounts, joint accounts, UGMA/UTMA accounts, personal trusts, Coverdell Education Savings Accounts and IRAs (including traditional, Roth, Rollover, SEP-, SARSEP- and SIMPLE-IRAs), and certain other retirement accounts. If you have only business, business retirement, employer-sponsored or American Century Investments Brokerage accounts, you are currently not subject to this fee. If you are subject to the Account Maintenance Fee, your account value could be reduced by the fee amount.
Hypothetical Example for Comparison Purposes
The table also provides information about hypothetical account values and hypothetical expenses based on the actual expense ratio of each class of your fund and an assumed rate of return of 5% per year before expenses, which is not the actual return of a fund’s share class. The hypothetical account values and expenses may not be used to estimate the actual ending account balance or expenses you paid for the period. You may use this information to compare the ongoing costs of investing in your fund and other funds. To do so, compare this 5% hypothetical example with the 5% hypothetical examples that appear in the shareholder reports of the other funds.
Please note that the expenses shown in the table are meant to highlight your ongoing costs only and do not reflect any transactional costs, such as sales charges (loads) or redemption/exchange fees. Therefore, the table is useful in comparing ongoing costs only, and will not help you determine the relative total costs of owning different funds. In addition, if these transactional costs were included, your costs would have been higher.
|
| | | | |
| Beginning
Account Value
5/1/19 | Ending
Account Value
10/31/19 | Expenses Paid
During Period(1)
5/1/19 - 10/31/19 |
Annualized
Expense Ratio(1) |
| Actual | | | | |
| Investor Class | $1,000 | $1,013.30 | $6.50 | 1.28% |
| I Class | $1,000 | $1,013.50 | $5.48 | 1.08% |
| Y Class | $1,000 | $1,014.50 | $4.72 | 0.93% |
| A Class | $1,000 | $1,011.40 | $7.76 | 1.53% |
| C Class | $1,000 | $1,007.40 | $11.54 | 2.28% |
| R Class | $1,000 | $1,010.50 | $9.02 | 1.78% |
| R5 Class | $1,000 | $1,014.00 | $5.48 | 1.08% |
| R6 Class | $1,000 | $1,015.00 | $4.72 | 0.93% |
| G Class | $1,000 | $1,019.50 | $0.00 | 0.00%(2) |
| Hypothetical | | | | |
| Investor Class | $1,000 | $1,018.75 | $6.51 | 1.28% |
| I Class | $1,000 | $1,019.76 | $5.50 | 1.08% |
| Y Class | $1,000 | $1,020.52 | $4.74 | 0.93% |
| A Class | $1,000 | $1,017.49 | $7.78 | 1.53% |
| C Class | $1,000 | $1,013.71 | $11.57 | 2.28% |
| R Class | $1,000 | $1,016.23 | $9.05 | 1.78% |
| R5 Class | $1,000 | $1,019.76 | $5.50 | 1.08% |
| R6 Class | $1,000 | $1,020.52 | $4.74 | 0.93% |
| G Class | $1,000 | $1,025.21 | $0.00 | 0.00%(2) |
| |
| (1) | Expenses are equal to the class's annualized expense ratio listed in the table above, multiplied by the average account value over the period, multiplied by 184, the number of days in the most recent fiscal half-year, divided by 365, to reflect the one-half year period. Annualized expense ratio reflects actual expenses, including any applicable fee waivers or expense reimbursements and excluding any acquired fund fees and expenses. |
| |
| (2) | Other expenses, which include directors' fees and expenses, did not exceed 0.005%. |
OCTOBER 31, 2019
|
| | | | |
| | Shares | Value |
| COMMON STOCKS — 97.0% | | |
| Aerospace and Defense — 2.6% | | |
Aerojet Rocketdyne Holdings, Inc.(1) | 196,200 | $ | 8,481,726 |
|
Kratos Defense & Security Solutions, Inc.(1) | 424,546 | 8,015,428 |
|
Mercury Systems, Inc.(1) | 77,568 | 5,713,659 |
|
| | | 22,210,813 |
|
| Banks — 1.4% | | |
| First BanCorp | 690,512 | 7,264,186 |
|
| Veritex Holdings, Inc. | 204,521 | 5,035,307 |
|
| | | 12,299,493 |
|
| Beverages — 0.5% | | |
MGP Ingredients, Inc.(2) | 107,803 | 4,623,671 |
|
| Biotechnology — 11.1% | | |
ACADIA Pharmaceuticals, Inc.(1) | 149,148 | 6,325,367 |
|
Acceleron Pharma, Inc.(1) | 129,362 | 5,804,473 |
|
Aimmune Therapeutics, Inc.(1)(2) | 121,639 | 3,383,997 |
|
Amarin Corp. plc ADR(1)(2) | 279,380 | 4,587,420 |
|
Amicus Therapeutics, Inc.(1) | 413,170 | 3,483,023 |
|
Arena Pharmaceuticals, Inc.(1) | 136,632 | 6,656,028 |
|
ArQule, Inc.(1) | 284,521 | 2,876,507 |
|
Blueprint Medicines Corp.(1) | 62,142 | 4,277,855 |
|
FibroGen, Inc.(1) | 90,043 | 3,525,183 |
|
Flexion Therapeutics, Inc.(1)(2) | 206,371 | 3,543,390 |
|
Global Blood Therapeutics, Inc.(1) | 59,804 | 2,867,602 |
|
Halozyme Therapeutics, Inc.(1) | 230,870 | 3,536,928 |
|
Heron Therapeutics, Inc.(1) | 149,842 | 3,184,143 |
|
Immunomedics, Inc.(1)(2) | 247,951 | 3,967,216 |
|
Insmed, Inc.(1) | 269,867 | 5,016,828 |
|
Iovance Biotherapeutics, Inc.(1) | 178,234 | 3,766,084 |
|
Mirati Therapeutics, Inc.(1) | 22,750 | 2,142,595 |
|
Natera, Inc.(1) | 178,050 | 6,858,486 |
|
Portola Pharmaceuticals, Inc.(1)(2) | 126,454 | 3,655,785 |
|
Principia Biopharma, Inc.(1) | 58,112 | 2,051,935 |
|
PTC Therapeutics, Inc.(1) | 117,550 | 4,806,620 |
|
REGENXBIO, Inc.(1) | 57,034 | 2,035,543 |
|
Stoke Therapeutics, Inc.(1)(2) | 81,222 | 2,301,831 |
|
Ultragenyx Pharmaceutical, Inc.(1) | 57,866 | 2,322,741 |
|
Viking Therapeutics, Inc.(1)(2) | 286,885 | 1,856,146 |
|
| | | 94,833,726 |
|
| Building Products — 2.7% | | |
| Fortune Brands Home & Security, Inc. | 80,219 | 4,817,151 |
|
PGT Innovations, Inc.(1) | 445,462 | 7,866,859 |
|
Trex Co., Inc.(1) | 121,656 | 10,692,346 |
|
| | | 23,376,356 |
|
|
| | | | |
| | Shares | Value |
| Capital Markets — 2.2% | | |
| Ares Management Corp., Class A | 312,579 | $ | 9,242,961 |
|
Assetmark Financial Holdings, Inc.(1) | 138,413 | 3,798,053 |
|
| Hamilton Lane, Inc., Class A | 101,293 | 6,039,088 |
|
| | | 19,080,102 |
|
| Chemicals — 1.0% | | |
Ferro Corp.(1) | 573,856 | 6,387,017 |
|
| Olin Corp. | 108,168 | 1,983,801 |
|
| | | 8,370,818 |
|
| Commercial Services and Supplies — 5.8% | | |
| ABM Industries, Inc. | 123,868 | 4,516,227 |
|
| Brink's Co. (The) | 144,763 | 12,299,065 |
|
Casella Waste Systems, Inc., Class A(1) | 132,616 | 5,780,731 |
|
Clean Harbors, Inc.(1) | 122,280 | 10,083,209 |
|
IAA, Inc.(1) | 187,571 | 7,155,834 |
|
| US Ecology, Inc. | 152,214 | 9,472,277 |
|
| | | 49,307,343 |
|
| Communications Equipment — 1.2% | | |
| AudioCodes Ltd. | 253,360 | 5,356,030 |
|
Lumentum Holdings, Inc.(1) | 76,483 | 4,792,425 |
|
| | | 10,148,455 |
|
| Construction and Engineering — 0.7% | | |
Badger Daylighting Ltd.(2) | 214,156 | 6,344,520 |
|
| Containers and Packaging — 0.6% | | |
Berry Global Group, Inc.(1) | 115,170 | 4,780,707 |
|
| Distributors — 0.4% | | |
| Pool Corp. | 18,589 | 3,855,359 |
|
| Diversified Consumer Services — 2.7% | | |
Chegg, Inc.(1) | 373,466 | 11,450,468 |
|
frontdoor, Inc.(1) | 98,886 | 4,769,272 |
|
Grand Canyon Education, Inc.(1) | 75,042 | 6,900,862 |
|
| | | 23,120,602 |
|
| Electronic Equipment, Instruments and Components — 1.5% | | |
Rogers Corp.(1) | 27,393 | 3,711,204 |
|
| SYNNEX Corp. | 78,106 | 9,196,200 |
|
| | | 12,907,404 |
|
| Entertainment — 1.1% | | |
World Wrestling Entertainment, Inc., Class A(2) | 83,686 | 4,689,763 |
|
Zynga, Inc., Class A(1) | 694,017 | 4,282,085 |
|
| | | 8,971,848 |
|
| Equity Real Estate Investment Trusts (REITs) — 3.7% | | |
| Americold Realty Trust | 263,700 | 10,571,733 |
|
| CareTrust REIT, Inc. | 262,733 | 6,368,648 |
|
| CoreSite Realty Corp. | 62,017 | 7,286,997 |
|
| Essential Properties Realty Trust, Inc. | 279,580 | 7,174,023 |
|
| | | 31,401,401 |
|
|
| | | | |
| | Shares | Value |
| Food and Staples Retailing — 0.4% | | |
Grocery Outlet Holding Corp.(1) | 97,757 | $ | 3,118,448 |
|
| Gas Utilities — 0.6% | | |
| Chesapeake Utilities Corp. | 50,530 | 4,790,244 |
|
| Health Care Equipment and Supplies — 2.4% | | |
ICU Medical, Inc.(1) | 14,407 | 2,328,315 |
|
Insulet Corp.(1) | 32,420 | 4,711,274 |
|
Merit Medical Systems, Inc.(1) | 109,865 | 2,269,262 |
|
OrthoPediatrics Corp.(1)(2) | 105,338 | 4,074,474 |
|
Silk Road Medical, Inc.(1)(2) | 211,912 | 7,018,526 |
|
| | | 20,401,851 |
|
| Health Care Providers and Services — 5.1% | | |
Acadia Healthcare Co., Inc.(1) | 168,521 | 5,053,945 |
|
| Encompass Health Corp. | 93,461 | 5,983,373 |
|
| Ensign Group, Inc. (The) | 195,033 | 8,240,144 |
|
HealthEquity, Inc.(1) | 75,739 | 4,301,218 |
|
Pennant Group, Inc. (The)(1) | 149,052 | 2,681,445 |
|
Progyny, Inc.(1) | 343,085 | 5,636,887 |
|
R1 RCM, Inc.(1) | 1,068,302 | 11,356,050 |
|
| | | 43,253,062 |
|
| Health Care Technology — 2.4% | | |
Health Catalyst, Inc.(1)(2) | 105,668 | 3,398,283 |
|
Inspire Medical Systems, Inc.(1) | 60,690 | 3,700,876 |
|
Teladoc Health, Inc.(1)(2) | 170,478 | 13,058,615 |
|
| | | 20,157,774 |
|
| Hotels, Restaurants and Leisure — 2.6% | | |
| Churchill Downs, Inc. | 109,234 | 14,199,328 |
|
Planet Fitness, Inc., Class A(1) | 127,813 | 8,136,575 |
|
| | | 22,335,903 |
|
| Household Durables — 3.1% | | |
Skyline Champion Corp.(1) | 315,374 | 8,903,008 |
|
Tempur Sealy International, Inc.(1) | 55,806 | 5,075,556 |
|
TopBuild Corp.(1) | 123,496 | 12,834,939 |
|
| | | 26,813,503 |
|
| Insurance — 4.6% | | |
BRP Group, Inc., Class A(1) | 457,393 | 7,409,767 |
|
eHealth, Inc.(1) | 105,463 | 7,281,165 |
|
Goosehead Insurance, Inc., Class A(2) | 69,074 | 3,535,207 |
|
| Kinsale Capital Group, Inc. | 103,995 | 10,994,351 |
|
Palomar Holdings, Inc.(1) | 228,517 | 10,317,543 |
|
| | | 39,538,033 |
|
| Internet and Direct Marketing Retail — 0.3% | | |
Etsy, Inc.(1) | 55,269 | 2,458,918 |
|
| IT Services — 2.8% | | |
CACI International, Inc., Class A(1) | 35,509 | 7,945,139 |
|
Evo Payments, Inc., Class A(1) | 158,309 | 4,500,725 |
|
| Genpact Ltd. | 286,096 | 11,206,380 |
|
| | | 23,652,244 |
|
|
| | | | |
| | Shares | Value |
| Life Sciences Tools and Services — 2.1% | | |
10X Genomics, Inc., Class A(1) | 68,677 | $ | 3,983,266 |
|
NeoGenomics, Inc.(1) | 331,127 | 7,592,742 |
|
PRA Health Sciences, Inc.(1) | 64,750 | 6,326,723 |
|
| | | 17,902,731 |
|
| Machinery — 3.4% | | |
Chart Industries, Inc.(1) | 167,035 | 9,793,262 |
|
| Kennametal, Inc. | 223,742 | 6,924,815 |
|
Navistar International Corp.(1) | 120,785 | 3,778,155 |
|
RBC Bearings, Inc.(1) | 51,250 | 8,222,550 |
|
| | | 28,718,782 |
|
| Oil, Gas and Consumable Fuels — 0.7% | | |
Callon Petroleum Co.(1)(2) | 1,542,822 | 5,862,724 |
|
| Paper and Forest Products — 0.7% | | |
| Boise Cascade Co. | 159,211 | 5,694,978 |
|
| Personal Products — 1.9% | | |
| Inter Parfums, Inc. | 50,906 | 3,941,651 |
|
| Medifast, Inc. | 107,871 | 11,967,209 |
|
| | | 15,908,860 |
|
| Pharmaceuticals — 3.6% | | |
Aerie Pharmaceuticals, Inc.(1)(2) | 105,818 | 2,348,101 |
|
Catalent, Inc.(1) | 236,698 | 11,515,358 |
|
Horizon Therapeutics plc(1) | 214,328 | 6,196,222 |
|
MyoKardia, Inc.(1) | 82,996 | 4,758,161 |
|
Optinose, Inc.(1)(2) | 295,108 | 2,307,745 |
|
Reata Pharmaceuticals, Inc., Class A(1) | 18,757 | 3,865,442 |
|
| | | 30,991,029 |
|
| Professional Services — 1.7% | | |
ASGN, Inc.(1) | 137,269 | 8,728,936 |
|
TriNet Group, Inc.(1) | 110,750 | 5,868,642 |
|
| | | 14,597,578 |
|
| Real Estate Management and Development — 1.3% | | |
Altus Group Ltd.(2) | 150,069 | 4,158,772 |
|
| FirstService Corp. | 82,635 | 7,212,603 |
|
| | | 11,371,375 |
|
| Road and Rail — 0.6% | | |
| ArcBest Corp. | 170,019 | 4,911,849 |
|
| Semiconductors and Semiconductor Equipment — 4.2% | | |
| Entegris, Inc. | 121,575 | 5,835,600 |
|
Inphi Corp.(1) | 92,242 | 6,630,355 |
|
Lattice Semiconductor Corp.(1) | 459,200 | 8,995,728 |
|
| MKS Instruments, Inc. | 31,730 | 3,433,821 |
|
| Monolithic Power Systems, Inc. | 35,176 | 5,273,586 |
|
Silicon Laboratories, Inc.(1) | 56,198 | 5,970,475 |
|
| | | 36,139,565 |
|
| Software — 7.8% | | |
Avalara, Inc.(1) | 90,747 | 6,443,037 |
|
|
| | | | |
| | Shares | Value |
Blackline, Inc.(1) | 85,378 | $ | 3,990,568 |
|
Bottomline Technologies de, Inc.(1) | 93,152 | 3,814,574 |
|
Coupa Software, Inc.(1) | 64,470 | 8,863,980 |
|
Elastic NV(1) | 31,546 | 2,271,628 |
|
Fair Isaac Corp.(1) | 13,053 | 3,968,634 |
|
Five9, Inc.(1) | 172,115 | 9,554,104 |
|
Globant SA(1) | 60,790 | 5,669,275 |
|
Paylocity Holding Corp.(1) | 106,244 | 10,900,634 |
|
Rapid7, Inc.(1) | 212,930 | 10,665,664 |
|
| | | 66,142,098 |
|
| Specialty Retail — 1.5% | | |
Boot Barn Holdings, Inc.(1) | 217,711 | 7,630,770 |
|
National Vision Holdings, Inc.(1) | 205,637 | 4,894,161 |
|
| | | 12,524,931 |
|
| Textiles, Apparel and Luxury Goods — 1.3% | | |
Canada Goose Holdings, Inc.(1)(2) | 122,768 | 5,135,386 |
|
Crocs, Inc.(1) | 175,279 | 6,133,012 |
|
| | | 11,268,398 |
|
| Thrifts and Mortgage Finance — 0.6% | | |
LendingTree, Inc.(1)(2) | 13,194 | 4,747,861 |
|
| Trading Companies and Distributors — 1.6% | | |
NOW, Inc.(1) | 315,355 | 3,323,842 |
|
SiteOne Landscape Supply, Inc.(1)(2) | 120,766 | 10,634,654 |
|
| | | 13,958,496 |
|
| Water Utilities — 0.5% | | |
| SJW Group | 61,926 | 4,480,346 |
|
TOTAL COMMON STOCKS
(Cost $701,027,849) | | 827,374,199 |
|
| EXCHANGE-TRADED FUNDS — 1.0% | | |
iShares Russell 2000 Growth ETF
(Cost $8,458,921) | 42,327 | 8,402,333 |
|
| TEMPORARY CASH INVESTMENTS — 1.9% | | |
| Repurchase Agreement, BMO Capital Markets Corp., (collateralized by various U.S. Treasury obligations, 1.625% - 2.25%, 3/31/21 - 5/15/26, valued at $12,225,718), in a joint trading account at 1.50%, dated 10/31/19, due 11/1/19 (Delivery value $11,971,558) | | 11,971,059 |
|
| Repurchase Agreement, Fixed Income Clearing Corp., (collateralized by various U.S. Treasury obligations, 0.625%, 1/15/26, valued at $4,077,771), at 0.65%, dated 10/31/19, due 11/1/19 (Delivery value $3,995,072) | | 3,995,000 |
|
| State Street Institutional U.S. Government Money Market Fund, Premier Class | 6,046 | 6,046 |
|
TOTAL TEMPORARY CASH INVESTMENTS
(Cost $15,972,105) | | 15,972,105 |
|
TEMPORARY CASH INVESTMENTS - SECURITIES LENDING COLLATERAL(3) — 4.8% |
State Street Navigator Securities Lending Government Money Market Portfolio
(Cost $41,181,804) | 41,181,804 | 41,181,804 |
|
TOTAL INVESTMENT SECURITIES — 104.7%
(Cost $766,640,679) | | 892,930,441 |
|
| OTHER ASSETS AND LIABILITIES — (4.7)% | | (40,221,551 | ) |
| TOTAL NET ASSETS — 100.0% | | $ | 852,708,890 |
|
|
| | | | | | | | | | |
| FORWARD FOREIGN CURRENCY EXCHANGE CONTRACTS | | |
| Currency Purchased | Currency Sold | Counterparty | Settlement Date | Unrealized Appreciation
(Depreciation) |
| CAD | 945,306 |
| USD | 709,296 |
| Morgan Stanley | 12/31/19 | $ | 8,689 |
|
| CAD | 5,899,220 |
| USD | 4,432,471 |
| Morgan Stanley | 12/31/19 | 48,148 |
|
| CAD | 624,364 |
| USD | 470,246 |
| Morgan Stanley | 12/31/19 | 3,976 |
|
| CAD | 1,871,782 |
| USD | 1,431,851 |
| Morgan Stanley | 12/31/19 | (10,182 | ) |
| USD | 25,309,208 |
| CAD | 33,471,863 |
| Morgan Stanley | 12/31/19 | (113,585 | ) |
| USD | 808,581 |
| CAD | 1,066,721 |
| Morgan Stanley | 12/31/19 | (1,623 | ) |
| USD | 1,105,061 |
| CAD | 1,457,331 |
| Morgan Stanley | 12/31/19 | (1,822 | ) |
| | | | | | | $ | (66,399 | ) |
|
| | |
| NOTES TO SCHEDULE OF INVESTMENTS |
| ADR | - | American Depositary Receipt |
| CAD | - | Canadian Dollar |
| USD | - | United States Dollar |
| |
| (2) | Security, or a portion thereof, is on loan. At the period end, the aggregate value of securities on loan was $65,592,757. The amount of securities on loan indicated may not correspond with the securities on loan identified because securities with pending sales are in the process of recall from the brokers. |
| |
| (3) | Investment of cash collateral from securities on loan. At the period end, the aggregate market value of the collateral held by the fund was $67,454,482, which includes securities collateral of $26,272,678. |
See Notes to Financial Statements.
|
|
| Statement of Assets and Liabilities |
|
| | | |
| OCTOBER 31, 2019 | |
| Assets | |
| Investment securities, at value (cost of $725,458,875) — including $65,592,757 of securities on loan | $ | 851,748,637 |
|
Investment made with cash collateral received for securities on loan, at value
(cost of $41,181,804) | 41,181,804 |
|
| Total investment securities, at value (cost of $766,640,679) | 892,930,441 |
|
| Receivable for investments sold | 7,733,250 |
|
| Receivable for capital shares sold | 659,641 |
|
| Unrealized appreciation on forward foreign currency exchange contracts | 60,813 |
|
| Dividends and interest receivable | 137,050 |
|
| Securities lending receivable | 20,446 |
|
| | 901,541,641 |
|
| | |
| Liabilities | |
| Payable for collateral received for securities on loan | 41,181,804 |
|
| Payable for investments purchased | 6,307,085 |
|
| Payable for capital shares redeemed | 372,452 |
|
| Unrealized depreciation on forward foreign currency exchange contracts | 127,212 |
|
| Accrued management fees | 820,861 |
|
| Distribution and service fees payable | 23,337 |
|
| | 48,832,751 |
|
| | |
| Net Assets | $ | 852,708,890 |
|
| | |
| Net Assets Consist of: | |
| Capital (par value and paid-in surplus) | $ | 677,651,316 |
|
| Distributable earnings | 175,057,574 |
|
| | $ | 852,708,890 |
|
|
| | | | |
| | Net Assets | Shares Outstanding | Net Asset Value Per Share |
| Investor Class, $0.01 Par Value | $392,956,097 | 22,408,606 |
| $17.54 |
| I Class, $0.01 Par Value | $305,249,200 | 16,916,914 |
| $18.04 |
| Y Class, $0.01 Par Value | $6,391,743 | 350,408 |
| $18.24 |
| A Class, $0.01 Par Value | $80,126,633 | 4,763,392 |
| $16.82* |
| C Class, $0.01 Par Value | $4,790,139 | 320,599 |
| $14.94 |
| R Class, $0.01 Par Value | $6,098,925 | 373,498 |
| $16.33 |
| R5 Class, $0.01 Par Value | $7,131 | 395 |
| $18.05 |
| R6 Class, $0.01 Par Value | $48,763,003 | 2,673,941 |
| $18.24 |
| G Class, $0.01 Par Value | $8,326,019 | 453,908 |
| $18.34 |
*Maximum offering price $17.85 (net asset value divided by 0.9425).
See Notes to Financial Statements.
|
| | | |
| YEAR ENDED OCTOBER 31, 2019 | |
| Investment Income (Loss) | |
| Income: | |
| Dividends (net of foreign taxes withheld of $40,830) | $ | 4,199,978 |
|
| Interest | 364,223 |
|
| Securities lending, net | 257,326 |
|
| | 4,821,527 |
|
| | |
| Expenses: | |
| Management fees | 9,879,660 |
|
| Distribution and service fees: | |
| A Class | 201,224 |
|
| C Class | 53,693 |
|
| R Class | 29,576 |
|
| Directors' fees and expenses | 25,876 |
|
| Other expenses | 6,566 |
|
| | 10,196,595 |
|
| Fees waived - G Class | (1,647 | ) |
| | 10,194,948 |
|
| | |
| Net investment income (loss) | (5,373,421 | ) |
| | |
| Realized and Unrealized Gain (Loss) | |
| Net realized gain (loss) on: | |
| Investment transactions | 58,943,342 |
|
| Forward foreign currency exchange contract transactions | 524,367 |
|
| Foreign currency translation transactions | 5,273 |
|
| | 59,472,982 |
|
| | |
| Change in net unrealized appreciation (depreciation) on: | |
| Investments | 41,049,854 |
|
| Forward foreign currency exchange contracts | (399,317 | ) |
| Translation of assets and liabilities in foreign currencies | 4 |
|
| | 40,650,541 |
|
| | |
| Net realized and unrealized gain (loss) | 100,123,523 |
|
| | |
| Net Increase (Decrease) in Net Assets Resulting from Operations | $ | 94,750,102 |
|
See Notes to Financial Statements.
|
|
| Statement of Changes in Net Assets |
|
| | | | | | |
| YEARS ENDED OCTOBER 31, 2019 AND OCTOBER 31, 2018 |
| Increase (Decrease) in Net Assets | October 31, 2019 | October 31, 2018 |
| Operations | | |
| Net investment income (loss) | $ | (5,373,421 | ) | $ | (7,679,198 | ) |
| Net realized gain (loss) | 59,472,982 |
| 119,667,855 |
|
| Change in net unrealized appreciation (depreciation) | 40,650,541 |
| (47,337,576 | ) |
| Net increase (decrease) in net assets resulting from operations | 94,750,102 |
| 64,651,081 |
|
| | | |
| Distributions to Shareholders | | |
| From earnings: | | |
| Investor Class | (48,639,063 | ) | (2,095,439 | ) |
| I Class | (45,335,165 | ) | (1,258,916 | ) |
| Y Class | (276,649 | ) | (33 | ) |
| A Class | (10,279,016 | ) | (482,378 | ) |
| C Class | (867,837 | ) | (64,244 | ) |
| R Class | (773,910 | ) | (24,888 | ) |
| R5 Class | (905 | ) | (41 | ) |
| R6 Class | (4,560,472 | ) | (162,130 | ) |
| Decrease in net assets from distributions | (110,733,017 | ) | (4,088,069 | ) |
| | | |
| Capital Share Transactions | | |
| Net increase (decrease) in net assets from capital share transactions (Note 5) | (19,942,776 | ) | 124,699,558 |
|
| | | |
| Net increase (decrease) in net assets | (35,925,691 | ) | 185,262,570 |
|
| | | |
| Net Assets | | |
| Beginning of period | 888,634,581 |
| 703,372,011 |
|
| End of period | $ | 852,708,890 |
| $ | 888,634,581 |
|
See Notes to Financial Statements.
|
|
| Notes to Financial Statements |
OCTOBER 31, 2019
1. Organization
American Century Mutual Funds, Inc. (the corporation) is registered under the Investment Company Act of 1940, as amended (the 1940 Act), as an open-end management investment company and is organized as a Maryland corporation. Small Cap Growth Fund (the fund) is one fund in a series issued by the corporation. The fund’s investment objective is to seek long-term capital growth.
The fund offers the Investor Class, I Class, Y Class, A Class, C Class, R Class, R5 Class, R6 Class and G Class. The A Class may incur an initial sales charge. The A Class and C Class may be subject to a contingent deferred sales charge. Sale of the G Class commenced on April 1, 2019.
2. Significant Accounting Policies
The following is a summary of significant accounting policies consistently followed by the fund in preparation of its financial statements. The fund is an investment company and follows accounting and reporting guidance in accordance with accounting principles generally accepted in the United States of America. This may require management to make certain estimates and assumptions at the date of the financial statements. Actual results could differ from these estimates. Management evaluated the impact of events or transactions occurring through the date the financial statements were issued that would merit recognition or disclosure.
Investment Valuations — The fund determines the fair value of its investments and computes its net asset value per share at the close of regular trading (usually 4 p.m. Eastern time) on the New York Stock Exchange (NYSE) on each day the NYSE is open. The Board of Directors has adopted valuation policies and procedures to guide the investment advisor in the fund’s investment valuation process and to provide methodologies for the oversight of the fund’s pricing function.
Equity securities that are listed or traded on a domestic securities exchange are valued at the last reported sales price or at the official closing price as provided by the exchange. Equity securities traded on foreign securities exchanges are generally valued at the closing price of such securities on the exchange where primarily traded or at the close of the NYSE, if that is earlier. If no last sales price is reported, or if local convention or regulation so provides, the mean of the latest bid and asked prices may be used. Securities traded over-the-counter are valued at the mean of the latest bid and asked prices, the last sales price, or the official closing price. Equity securities initially expressed in local currencies are translated into U.S. dollars at the mean of the appropriate currency exchange rate at the close of the NYSE as provided by an independent pricing service.
Open-end management investment companies are valued at the reported net asset value per share. Repurchase agreements are valued at cost, which approximates fair value. Forward foreign currency exchange contracts are valued at the mean of the appropriate forward exchange rate at the close of the NYSE as provided by an independent pricing service.
If the fund determines that the market price for an investment is not readily available or the valuation methods mentioned above do not reflect an investment’s fair value, such investment is valued as determined in good faith by the Board of Directors or its delegate, in accordance with policies and procedures adopted by the Board of Directors. In its determination of fair value, the fund may review several factors including, but not limited to, market information regarding the specific investment or comparable investments and correlation with other investment types, futures indices or general market indicators. Circumstances that may cause the fund to use these procedures to value an investment include, but are not limited to: an investment has been declared in default or is distressed; trading in a security has been suspended during the trading day or a security is not actively trading on its principal exchange; prices received from a regular pricing source are deemed unreliable; or there is a foreign market holiday and no trading occurred.
The fund monitors for significant events occurring after the close of an investment’s primary exchange but before the fund’s net asset value per share is determined. Significant events may include, but are not limited to: corporate announcements and transactions; governmental action and political unrest that could impact a specific investment or an investment sector; or armed conflicts, natural disasters and similar events that could affect investments in a specific country or region. The fund also monitors for significant fluctuations between domestic and foreign markets, as evidenced by the U.S. market or such other indicators that the Board of Directors, or its delegate, deems appropriate. The fund may apply a model-derived factor to the closing price of equity securities traded on foreign securities exchanges. The factor is based on observable market data as provided by an independent pricing service.
Security Transactions — Security transactions are accounted for as of the trade date. Net realized gains and losses are determined on the identified cost basis, which is also used for federal income tax purposes.
Investment Income — Dividend income less foreign taxes withheld, if any, is recorded as of the ex-dividend date. Distributions received on securities that represent a return of capital or long-term capital gain are recorded as a reduction of cost of investments and/or as a realized gain. The fund may estimate the components of distributions received that may be considered nontaxable distributions or long-term capital gain distributions for income tax purposes. Interest income is recorded on the accrual basis and includes accretion of discounts and amortization of premiums. Securities lending income is net of fees and rebates earned by the lending agent for its services.
Foreign Currency Translations — All assets and liabilities initially expressed in foreign currencies are translated into U.S. dollars at prevailing exchange rates at period end. The fund may enter into spot foreign currency exchange contracts to facilitate transactions denominated in a foreign currency. Purchases and sales of investment securities, dividend and interest income, spot foreign currency exchange contracts, and expenses are translated at the rates of exchange prevailing on the respective dates of such transactions. Net realized and unrealized foreign currency exchange gains or losses related to investment securities are a component of net realized gain (loss) on investment transactions and change in net unrealized appreciation (depreciation) on investments, respectively.
Repurchase Agreements — The fund may enter into repurchase agreements with institutions that American Century Investment Management, Inc. (ACIM) (the investment advisor) has determined are creditworthy pursuant to criteria adopted by the Board of Directors. The fund requires that the collateral, represented by securities, received in a repurchase transaction be transferred to the custodian in a manner sufficient to enable the fund to obtain those securities in the event of a default under the repurchase agreement. ACIM monitors, on a daily basis, the securities transferred to ensure the value, including accrued interest, of the securities under each repurchase agreement is equal to or greater than amounts owed to the fund under each repurchase agreement.
Joint Trading Account — Pursuant to an Exemptive Order issued by the Securities and Exchange Commission, the fund, along with certain other funds in the American Century Investments family of funds, may transfer uninvested cash balances into a joint trading account. These balances are invested in one or more repurchase agreements that are collateralized by U.S. Treasury or Agency obligations.
Segregated Assets — In accordance with the 1940 Act, the fund segregates assets on its books and records to cover certain types of investment securities and other financial instruments. ACIM monitors, on a daily basis, the securities segregated to ensure the fund designates a sufficient amount of liquid assets, marked-to-market daily. The fund may also receive assets or be required to pledge assets at the custodian bank or with a broker for collateral requirements.
Income Tax Status — It is the fund’s policy to distribute substantially all net investment income and net realized gains to shareholders and to otherwise qualify as a regulated investment company under provisions of the Internal Revenue Code. Accordingly, no provision has been made for income taxes. The fund files U.S. federal, state, local and non-U.S. tax returns as applicable. The fund's tax returns are subject to examination by the relevant taxing authority until expiration of the applicable statute of limitations, which is generally three years from the date of filing but can be longer in certain jurisdictions. At this time, management believes there are no uncertain tax positions which, based on their technical merit, would not be sustained upon examination and for which it is reasonably possible that the total amounts of unrecognized tax benefits will significantly change in the next twelve months.
Multiple Class — All shares of the fund represent an equal pro rata interest in the net assets of the class to which such shares belong, and have identical voting, dividend, liquidation and other rights and the same terms and conditions, except for class specific expenses and exclusive rights to vote on matters affecting only individual classes. Income, non-class specific expenses, and realized and unrealized capital gains and losses of the fund are allocated to each class of shares based on their relative net assets.
Distributions to Shareholders — Distributions from net investment income and net realized gains, if any, are generally declared and paid annually. The fund may elect to treat a portion of its payment to a redeeming shareholder, which represents the pro rata share of undistributed net investment income and net realized gains, as a distribution for federal income tax purposes (tax equalization).
Indemnifications — Under the corporation’s organizational documents, its officers and directors are indemnified against certain liabilities arising out of the performance of their duties to the fund. In addition, in the normal course of business, the fund enters into contracts that provide general indemnifications. The maximum exposure under these arrangements is unknown as this would involve future claims that may be made against a fund. The risk of material loss from such claims is considered by management to be remote.
Securities Lending — Securities are lent to qualified financial institutions and brokers. State Street Bank & Trust Co. serves as securities lending agent to the fund pursuant to a Securities Lending Agreement. The lending of securities exposes the fund to risks such as: the borrowers may fail to return the loaned securities, the borrowers may not be able to provide additional collateral, the fund may experience delays in recovery of the loaned securities or delays in access to collateral, or the fund may experience losses related to the investment collateral. To minimize certain risks, loan counterparties pledge collateral in the form of cash and/or securities. The lending agent has agreed to indemnify the fund in the case of default of any securities borrowed. Cash collateral received is invested in the State Street Navigator Securities Lending Government Money Market Portfolio, a money market mutual fund registered under the 1940 Act. The loans may also be secured by U.S. government securities in an amount at least equal to the market value of the securities loaned, plus accrued interest and dividends, determined on a daily basis and adjusted accordingly. By lending securities, the fund seeks to increase its net investment income through the receipt of interest and fees. Such income is reflected separately within the Statement of Operations. The value of loaned securities and related collateral outstanding at period end, if any, are shown on a gross basis within the Schedule of Investments and Statement of Assets and Liabilities.
The following table reflects a breakdown of transactions accounted for as secured borrowings, the gross obligation by the type of collateral pledged, and the remaining contractual maturity of those transactions as of October 31, 2019.
|
| | | | | | | | | | | | |
| Remaining Contractual Maturity of Agreements |
| | Overnight and
Continuous | <30 days | Between
30 & 90 days | >90 days | Total |
Securities Lending Transactions(1) |
| Common Stocks | $ | 41,181,804 |
| — |
| — |
| — |
| $ | 41,181,804 |
|
| Gross amount of recognized liabilities for securities lending transactions | $ | 41,181,804 |
|
| |
| (1) | Amount represents the payable for cash collateral received for securities on loan. This will generally be in the Overnight and Continuous column as the securities are typically callable on demand. |
3. Fees and Transactions with Related Parties
Certain officers and directors of the corporation are also officers and/or directors of American Century Companies, Inc. (ACC). The corporation’s investment advisor, ACIM, the corporation's distributor, American Century Investment Services, Inc. (ACIS), and the corporation’s transfer agent, American Century Services, LLC, are wholly owned, directly or indirectly, by ACC.
Management Fees — The corporation has entered into a management agreement with ACIM, under which ACIM provides the fund with investment advisory and management services in exchange for a single, unified management fee (the fee) per class. The agreement provides that all expenses of managing and operating the fund, except distribution and service fees, brokerage expenses, taxes, interest, fees and expenses of the independent directors (including legal counsel fees), and extraordinary expenses, will be paid by ACIM. The fee is computed and accrued daily based on each class's daily net assets and paid monthly in arrears. The difference in the fee among the classes is a result of their separate arrangements for non-Rule 12b-1 shareholder services. It is not the result of any difference in advisory or custodial fees or other expenses related to the management of the fund’s assets, which do not vary by class. The rate of the fee is determined by applying a fee rate calculation formula. This formula takes into account the fund’s assets as well as certain assets, if any, of other clients of the investment advisor outside the American Century Investments family of funds (such as subadvised funds and separate accounts) that use very similar investment teams and strategies (strategy assets). Effective April 1, 2019, the investment advisor agreed to waive the G Class's management fee in its entirety. The investment advisor expects this waiver to remain in effect permanently and cannot terminate it prior to such date without the approval of the Board of Directors.
The management fee schedule range and the effective annual management fee for each class for the period ended October 31, 2019 are as follows:
|
| | |
| | Management Fee Schedule Range | Effective Annual Management Fee |
| Investor Class | 1.100% to 1.500% | 1.28% |
| I Class | 0.900% to 1.300% | 1.08% |
| Y Class | 0.750% to 1.150% | 0.93% |
| A Class | 1.100% to 1.500% | 1.28% |
| C Class | 1.100% to 1.500% | 1.28% |
| R Class | 1.100% to 1.500% | 1.28% |
| R5 Class | 0.900% to 1.300% | 1.08% |
| R6 Class | 0.750% to 1.150% | 0.93% |
| G Class | 0.750% to 1.150% | 0.00%(1) |
| |
| (1) | Effective annual management fee before waiver was 0.93%. |
Distribution and Service Fees — The Board of Directors has adopted a separate Master Distribution and Individual Shareholder Services Plan for each of the A Class, C Class and R Class (collectively the plans), pursuant to Rule 12b-1 of the 1940 Act. The plans provide that the A Class will pay ACIS an annual distribution and service fee of 0.25%. The plans provide that the C Class will pay ACIS an annual distribution and service fee of 1.00%, of which 0.25% is paid for individual shareholder services and 0.75% is paid for distribution services. The plans provide that the R Class will pay ACIS an annual distribution and service fee of 0.50%. The fees are computed and accrued daily based on each class’s daily net assets and paid monthly in arrears. The fees are used to pay financial intermediaries for distribution and individual shareholder services. Fees incurred under the plans during the period ended October 31, 2019 are detailed in the Statement of Operations.
Directors' Fees and Expenses — The Board of Directors is responsible for overseeing the investment advisor’s management and operations of the fund. The directors receive detailed information about the fund and its investment advisor regularly throughout the year, and meet at least quarterly with management of the investment advisor to review reports about fund operations. The fund’s officers do not receive compensation from the fund.
Interfund Transactions — The fund may enter into security transactions with other American Century Investments funds and other client accounts of the investment advisor, in accordance with the 1940 Act rules and procedures adopted by the Board of Directors. The rules and procedures require, among other things, that these transactions be effected at the independent current market price of the security. During the period, the interfund purchases and sales were $833,115 and $6,720,385, respectively. The effect of interfund transactions on the Statement of Operations was $971,688 in net realized gain (loss) on investment transactions.
4. Investment Transactions
Purchases and sales of investment securities, excluding short-term investments, for the period ended October 31, 2019 were $756,972,829 and $885,287,201, respectively.
5. Capital Share Transactions
Transactions in shares of the fund were as follows:
|
| | | | | | | | | | |
| | Year ended
October 31, 2019(1) | Year ended
October 31, 2018 |
| | Shares | Amount | Shares | Amount |
| Investor Class/Shares Authorized | 335,000,000 |
| | 140,000,000 |
| |
| Sold | 2,845,255 |
| $ | 48,155,202 |
| 3,837,143 |
| $ | 73,007,550 |
|
| Issued in reinvestment of distributions | 3,224,826 |
| 45,566,788 |
| 114,703 |
| 1,959,131 |
|
| Redeemed | (5,030,701 | ) | (84,023,120 | ) | (4,206,688 | ) | (77,427,067 | ) |
| | 1,039,380 |
| 9,698,870 |
| (254,842 | ) | (2,460,386 | ) |
| I Class/Shares Authorized | 210,000,000 |
| | 200,000,000 |
| |
| Sold | 2,861,828 |
| 48,997,525 |
| 11,225,816 |
| 207,756,004 |
|
| Issued in reinvestment of distributions | 322,168 |
| 4,674,658 |
| 11,148 |
| 194,417 |
|
| Redeemed | (6,320,416 | ) | (107,127,487 | ) | (4,084,074 | ) | (79,828,895 | ) |
| | (3,136,420 | ) | (53,455,304 | ) | 7,152,890 |
| 128,121,526 |
|
| Y Class/Shares Authorized | 30,000,000 |
| | 50,000,000 |
| |
| Sold | 250,309 |
| 4,433,763 |
| 96,585 |
| 1,939,986 |
|
| Issued in reinvestment of distributions | 18,884 |
| 276,649 |
| 2 |
| 33 |
|
| Redeemed | (14,128 | ) | (249,802 | ) | (1,581 | ) | (31,377 | ) |
| | 255,065 |
| 4,460,610 |
| 95,006 |
| 1,908,642 |
|
| A Class/Shares Authorized | 70,000,000 |
| | 130,000,000 |
| |
| Sold | 732,140 |
| 11,663,863 |
| 935,413 |
| 17,151,238 |
|
| Issued in reinvestment of distributions | 722,004 |
| 9,804,810 |
| 27,926 |
| 462,175 |
|
| Redeemed | (1,137,418 | ) | (18,386,791 | ) | (1,499,001 | ) | (26,644,773 | ) |
| | 316,726 |
| 3,081,882 |
| (535,662 | ) | (9,031,360 | ) |
| C Class/Shares Authorized | 30,000,000 |
| | 20,000,000 |
| |
| Sold | 48,287 |
| 670,563 |
| 105,230 |
| 1,738,900 |
|
| Issued in reinvestment of distributions | 61,607 |
| 747,908 |
| 3,614 |
| 54,825 |
|
| Redeemed | (180,322 | ) | (2,539,818 | ) | (387,925 | ) | (6,553,664 | ) |
| | (70,428 | ) | (1,121,347 | ) | (279,081 | ) | (4,759,939 | ) |
| R Class/Shares Authorized | 30,000,000 |
| | 20,000,000 |
| |
| Sold | 151,546 |
| 2,348,495 |
| 221,772 |
| 3,855,488 |
|
| Issued in reinvestment of distributions | 57,798 |
| 763,516 |
| 1,481 |
| 24,003 |
|
| Redeemed | (168,574 | ) | (2,650,675 | ) | (127,612 | ) | (2,219,990 | ) |
| | 40,770 |
| 461,336 |
| 95,641 |
| 1,659,501 |
|
| R5 Class/Shares Authorized | 30,000,000 |
| | 50,000,000 |
| |
| Sold | 1,498 |
| 25,253 |
| 80 |
| 1,393 |
|
| Issued in reinvestment of distributions | 62 |
| 905 |
| 2 |
| 41 |
|
| Redeemed | (1,553 | ) | (26,878 | ) | (33 | ) | (601 | ) |
| | 7 |
| (720 | ) | 49 |
| 833 |
|
| R6 Class/Shares Authorized | 50,000,000 |
| | 50,000,000 |
| |
| Sold | 1,013,445 |
| 17,944,892 |
| 1,173,576 |
| 22,855,500 |
|
| Issued in reinvestment of distributions | 311,295 |
| 4,560,472 |
| 9,233 |
| 162,130 |
|
| Redeemed | (779,079 | ) | (13,919,920 | ) | (691,385 | ) | (13,756,889 | ) |
| | 545,661 |
| 8,585,444 |
| 491,424 |
| 9,260,741 |
|
| G Class/Shares Authorized | 140,000,000 |
| | N/A |
| |
| Sold | 458,459 |
| 8,429,061 |
| | |
| Redeemed | (4,551 | ) | (82,608 | ) | | |
| | 453,908 |
| 8,346,453 |
| | |
| Net increase (decrease) | (555,331 | ) | $ | (19,942,776 | ) | 6,765,425 |
| $ | 124,699,558 |
|
| |
| (1) | April 1, 2019 (commencement of sale) through October 31, 2019 for the G Class. |
6. Fair Value Measurements
The fund’s investments valuation process is based on several considerations and may use multiple inputs to determine the fair value of the investments held by the fund. In conformity with accounting principles generally accepted in the United States of America, the inputs used to determine a valuation are classified into three broad levels.
| |
| • | Level 1 valuation inputs consist of unadjusted quoted prices in an active market for identical investments. |
| |
| • | Level 2 valuation inputs consist of direct or indirect observable market data (including quoted prices for comparable investments, evaluations of subsequent market events, interest rates, prepayment speeds, credit risk, etc.). These inputs also consist of quoted prices for identical investments initially expressed in local currencies that are adjusted through translation into U.S. dollars. |
| |
| • | Level 3 valuation inputs consist of unobservable data (including a fund’s own assumptions). |
The level classification is based on the lowest level input that is significant to the fair valuation measurement. The valuation inputs are not necessarily an indication of the risks associated with investing in these securities or other financial instruments.
The following is a summary of the level classifications as of period end. The Schedule of Investments provides additional information on the fund’s portfolio holdings.
|
| | | | | | | | |
| | Level 1 | Level 2 | Level 3 |
| Assets | | | |
| Investment Securities | | | |
| Common Stocks | $ | 809,658,304 |
| $ | 17,715,895 |
| — |
|
| Exchange-Traded Funds | 8,402,333 |
| — |
| — |
|
| Temporary Cash Investments | 6,046 |
| 15,966,059 |
| — |
|
| Temporary Cash Investments - Securities Lending Collateral | 41,181,804 |
| — |
| — |
|
| | $ | 859,248,487 |
| $ | 33,681,954 |
| — |
|
| Other Financial Instruments | | | |
| Forward Foreign Currency Exchange Contracts | — |
| $ | 60,813 |
| — |
|
| | | | |
| Liabilities | | | |
| Other Financial Instruments | | | |
| Forward Foreign Currency Exchange Contracts | — |
| $ | 127,212 |
| — |
|
7. Derivative Instruments
Foreign Currency Risk — The fund is subject to foreign currency exchange rate risk in the normal course of pursuing its investment objectives. The value of foreign investments held by a fund may be significantly affected by changes in foreign currency exchange rates. The dollar value of a foreign security generally decreases when the value of the dollar rises against the foreign currency in which the security is denominated and tends to increase when the value of the dollar declines against such foreign currency. A fund may enter into forward foreign currency exchange contracts to reduce a fund's exposure to foreign currency exchange rate fluctuations. The net U.S. dollar value of foreign currency underlying all contractual commitments held by a fund and the resulting unrealized appreciation or depreciation are determined daily. Realized gain or loss is recorded upon the termination of the contract. Net realized and unrealized gains or losses occurring during the holding period of forward foreign currency exchange contracts are a component of net realized gain (loss) on forward foreign currency exchange contract transactions and change in net unrealized appreciation (depreciation) on forward foreign currency exchange contracts, respectively. A fund bears the risk of an unfavorable change in the foreign currency exchange rate underlying the forward contract. Additionally, losses, up to the fair value, may arise if the counterparties do not perform under the contract terms. The fund's average U.S. dollar exposure to foreign currency risk derivative instruments held during the period was $25,796,248.
The value of foreign currency risk derivative instruments as of October 31, 2019, is disclosed on the Statement of Assets and Liabilities as an asset of $60,813 in unrealized appreciation on forward foreign currency exchange contracts and a liability of $127,212 in unrealized depreciation on forward foreign currency exchange contracts. For the year ended October 31, 2019, the effect of foreign currency risk derivative instruments on the Statement of Operations was $524,367 in net realized gain (loss) on forward foreign currency exchange contract transactions and $(399,317) in change in net unrealized appreciation (depreciation) on forward foreign currency exchange contracts.
8. Risk Factors
The fund invests in common stocks of small companies. Because of this, the fund may be subject to greater risk and market fluctuations than a fund investing in larger, more established companies.
9. Federal Tax Information
The tax character of distributions paid during the years ended October 31, 2019 and October 31, 2018 were as follows:
|
| | | | | | |
| | 2019 | 2018 |
| Distributions Paid From | | |
| Ordinary income | $ | 21,323,960 |
| — |
|
| Long-term capital gains | $ | 89,409,057 |
| $ | 4,088,069 |
|
The book-basis character of distributions made during the year from net investment income or net realized gains may differ from their ultimate characterization for federal income tax purposes. These differences reflect the differing character of certain income items and net realized gains and losses for financial statement and tax purposes, and may result in reclassification among certain capital accounts on the financial statements.
As of period end, the federal tax cost of investments and the components of distributable earnings on a tax-basis were as follows:
|
| | | |
| Federal tax cost of investments | $ | 771,045,092 |
|
| Gross tax appreciation of investments | $ | 170,496,289 |
|
| Gross tax depreciation of investments | (48,610,940 | ) |
| Net tax appreciation (depreciation) | $ | 121,885,349 |
|
| Undistributed ordinary income | — |
|
Accumulated long-term gains
| $ | 57,964,519 |
|
| Late-year ordinary loss deferral | $ | (4,792,294 | ) |
The difference between book-basis and tax-basis unrealized appreciation (depreciation) is attributable primarily to the tax deferral of losses on wash sales.
Loss deferrals represent certain qualified losses that the fund has elected to treat as having been incurred in the following fiscal year for federal income tax purposes.
|
| | | | | | | | | | | | | |
| For a Share Outstanding Throughout the Years Ended October 31 (except as noted) | | | |
| Per-Share Data | | | | | | | Ratios and Supplemental Data |
| | | Income From Investment Operations: | | | | Ratio to Average Net Assets of: | | |
| | Net Asset
Value,
Beginning
of Period | Net
Investment
Income
(Loss)(1) | Net
Realized
and
Unrealized
Gain (Loss) | Total From
Investment
Operations | Distributions From Net Realized Gains | Net Asset
Value,
End
of Period | Total
Return(2) | Operating
Expenses | Net
Investment
Income
(Loss) | Portfolio
Turnover
Rate | Net
Assets,
End of
Period
(in thousands) |
| Investor Class | | | | | | | | | | |
| 2019 | $18.08 | (0.12) | 1.91 | 1.79 | (2.33) | $17.54 | 13.00% | 1.28% | (0.70)% | 92% |
| $392,956 |
|
| 2018 | $16.70 | (0.17) | 1.65 | 1.48 | (0.10) | $18.08 | 8.89% | 1.27% | (0.93)% | 116% |
| $386,455 |
|
| 2017 | $12.96 | (0.13) | 4.45 | 4.32 | (0.58) | $16.70 | 33.36% | 1.36% | (0.83)% | 70% |
| $361,029 |
|
| 2016 | $13.06 | (0.10) | —(3) | (0.10) | — | $12.96 | (0.77)% | 1.36% | (0.83)% | 130% |
| $133,140 |
|
| 2015 | $12.82 | (0.13) | 0.37 | 0.24 | — | $13.06 | 1.87% | 1.39% | (0.92)% | 100% |
| $171,490 |
|
| I Class | | | | | | | | | | |
| 2019 | $18.50 | (0.09) | 1.96 | 1.87 | (2.33) | $18.04 | 13.16% | 1.08% | (0.50)% | 92% |
| $305,249 |
|
| 2018 | $17.04 | (0.14) | 1.70 | 1.56 | (0.10) | $18.50 | 9.18% | 1.07% | (0.73)% | 116% |
| $371,030 |
|
| 2017 | $13.20 | (0.09) | 4.51 | 4.42 | (0.58) | $17.04 | 33.51% | 1.16% | (0.63)% | 70% |
| $219,881 |
|
| 2016 | $13.27 | (0.08) | 0.01 | (0.07) | — | $13.20 | (0.53)% | 1.16% | (0.63)% | 130% |
| $269,094 |
|
| 2015 | $13.01 | (0.10) | 0.36 | 0.26 | — | $13.27 | 2.00% | 1.17% | (0.70)% | 100% |
| $256,001 |
|
| Y Class | | | | | | | | | | |
| 2019 | $18.65 | (0.06) | 1.98 | 1.92 | (2.33) | $18.24 | 13.34% | 0.93% | (0.35)% | 92% |
| $6,392 |
|
| 2018 | $17.16 | (0.07) | 1.66 | 1.59 | (0.10) | $18.65 | 9.29% | 0.92% | (0.58)% | 116% |
| $1,778 |
|
2017(4) | $15.34 | (0.06) | 2.46 | 2.40 | (0.58) | $17.16 | 15.67% | 1.01%(5) | (0.61)%(5) | 70%(6) |
| $6 |
|
|
| | | | | | | | | | | | | |
| For a Share Outstanding Throughout the Years Ended October 31 (except as noted) | | | |
| Per-Share Data | | | | | | | Ratios and Supplemental Data |
| | | Income From Investment Operations: | | | | Ratio to Average Net Assets of: | | |
| | Net Asset
Value,
Beginning
of Period | Net
Investment
Income
(Loss)(1) | Net
Realized
and
Unrealized
Gain (Loss) | Total From
Investment
Operations | Distributions From Net Realized Gains | Net Asset
Value,
End
of Period | Total
Return(2) | Operating
Expenses | Net
Investment
Income
(Loss) | Portfolio
Turnover
Rate | Net
Assets,
End of
Period
(in thousands) |
| A Class | | | | | | | | | | |
| 2019 | $17.49 | (0.16) | 1.82 | 1.66 | (2.33) | $16.82 | 12.72% | 1.53% | (0.95)% | 92% |
| $80,127 |
|
| 2018 | $16.19 | (0.21) | 1.61 | 1.40 | (0.10) | $17.49 | 8.61% | 1.52% | (1.18)% | 116% |
| $77,764 |
|
| 2017 | $12.61 | (0.16) | 4.32 | 4.16 | (0.58) | $16.19 | 33.02% | 1.61% | (1.08)% | 70% |
| $80,654 |
|
| 2016 | $12.74 | (0.13) | —(3) | (0.13) | — | $12.61 | (1.02)% | 1.61% | (1.08)% | 130% |
| $86,651 |
|
| 2015 | $12.54 | (0.16) | 0.36 | 0.20 | — | $12.74 | 1.59% | 1.64% | (1.17)% | 100% |
| $103,713 |
|
| C Class | | | | | | | | | | |
| 2019 | $15.92 | (0.25) | 1.60 | 1.35 | (2.33) | $14.94 | 11.84% | 2.28% | (1.70)% | 92% |
| $4,790 |
|
| 2018 | $14.86 | (0.32) | 1.48 | 1.16 | (0.10) | $15.92 | 7.83% | 2.27% | (1.93)% | 116% |
| $6,227 |
|
| 2017 | $11.70 | (0.25) | 3.99 | 3.74 | (0.58) | $14.86 | 31.99% | 2.36% | (1.83)% | 70% |
| $9,958 |
|
| 2016 | $11.91 | (0.21) | —(3) | (0.21) | — | $11.70 | (1.68)% | 2.36% | (1.83)% | 130% |
| $9,146 |
|
| 2015 | $11.81 | (0.24) | 0.34 | 0.10 | — | $11.91 | 0.76% | 2.39% | (1.92)% | 100% |
| $11,458 |
|
| R Class | | | | | | | | | | |
| 2019 | $17.09 | (0.19) | 1.76 | 1.57 | (2.33) | $16.33 | 12.39% | 1.78% | (1.20)% | 92% |
| $6,099 |
|
| 2018 | $15.86 | (0.25) | 1.58 | 1.33 | (0.10) | $17.09 | 8.41% | 1.77% | (1.43)% | 116% |
| $5,687 |
|
| 2017 | $12.40 | (0.19) | 4.23 | 4.04 | (0.58) | $15.86 | 32.61% | 1.86% | (1.33)% | 70% |
| $3,761 |
|
| 2016 | $12.55 | (0.16) | 0.01 | (0.15) | — | $12.40 | (1.20)% | 1.86% | (1.33)% | 130% |
| $2,672 |
|
| 2015 | $12.39 | (0.19) | 0.35 | 0.16 | — | $12.55 | 1.29% | 1.89% | (1.42)% | 100% |
| $2,135 |
|
|
| | | | | | | | | | | | | |
| For a Share Outstanding Throughout the Years Ended October 31 (except as noted) | | | |
| Per-Share Data | | | | | | | Ratios and Supplemental Data |
| | | Income From Investment Operations: | | | | Ratio to Average Net Assets of: | | |
| | Net Asset
Value,
Beginning
of Period | Net
Investment
Income
(Loss)(1) | Net
Realized
and
Unrealized
Gain (Loss) | Total From
Investment
Operations | Distributions From Net Realized Gains | Net Asset
Value,
End
of Period | Total
Return(2) | Operating
Expenses | Net
Investment
Income
(Loss) | Portfolio
Turnover
Rate | Net
Assets,
End of
Period
(in thousands) |
| R5 Class | | | | | | | | | | |
| 2019 | $18.51 | (0.08) | 1.95 | 1.87 | (2.33) | $18.05 | 13.21% | 1.08% | (0.50)% | 92% |
| $7 |
|
| 2018 | $17.05 | (0.14) | 1.70 | 1.56 | (0.10) | $18.51 | 9.12% | 1.07% | (0.73)% | 116% |
| $7 |
|
2017(4) | $15.26 | (0.07) | 2.44 | 2.37 | (0.58) | $17.05 | 15.56% | 1.16%(5) | (0.76)%(5) | 70%(6) |
| $6 |
|
| R6 Class | | | | | | | | | | |
| 2019 | $18.65 | (0.06) | 1.98 | 1.92 | (2.33) | $18.24 | 13.40% | 0.93% | (0.35)% | 92% |
| $48,763 |
|
| 2018 | $17.15 | (0.11) | 1.71 | 1.60 | (0.10) | $18.65 | 9.30% | 0.92% | (0.58)% | 116% |
| $39,687 |
|
| 2017 | $13.26 | (0.08) | 4.55 | 4.47 | (0.58) | $17.15 | 33.74% | 1.01% | (0.48)% | 70% |
| $28,077 |
|
| 2016 | $13.31 | (0.06) | 0.01 | (0.05) | — | $13.26 | (0.38)% | 1.01% | (0.48)% | 130% |
| $25,992 |
|
| 2015 | $13.03 | (0.08) | 0.36 | 0.28 | — | $13.31 | 2.15% | 1.04% | (0.57)% | 100% |
| $22,235 |
|
| G Class | | | | | | | | | | |
2019(7) | $17.43 | 0.05 | 0.86 | 0.91 | — | $18.34 | 5.22% | 0.00%(5)(8)(9) | 0.52%(5)(9) | 92%(10) |
| $8,326 |
|
|
| | | | |
| Notes to Financial Highlights | | |
| |
| (1) | Computed using average shares outstanding throughout the period. |
| |
| (2) | Total returns are calculated based on the net asset value of the last business day and do not reflect applicable sales charges, if any. Total returns for periods less than one year are not annualized. |
| |
| (3) | Amount is less than $0.005. |
| |
| (4) | April 10, 2017 (commencement of sale) through October 31, 2017. |
| |
| (6) | Portfolio turnover is calculated at the fund level. Percentage indicated was calculated for the year ended October 31, 2017. |
| |
| (7) | April 1, 2019 (commencement of sale) through October 31, 2019. |
| |
| (8) | Ratio was less than 0.005%. |
| |
| (9) | The annualized ratio of operating expenses to average net assets before expense waiver and the annualized ratio of net investment income (loss) to average net assets before expense waiver was 0.93% and (0.41)%, respectively. |
| |
| (10) | Portfolio turnover is calculated at the fund level. Percentage indicated was calculated for the year ended October 31, 2019. |
See Notes to Financial Statements.
|
|
| Report of Independent Registered Public Accounting Firm |
To the Shareholders and the Board of Directors of American Century Mutual Funds, Inc.:
Opinion on the Financial Statements and Financial Highlights
We have audited the accompanying statement of assets and liabilities, including the schedule of investments, of Small Cap Growth Fund, one of the funds constituting the American Century Mutual Funds, Inc. (the "Fund"), as of October 31, 2019, the related statement of operations for the year then ended, the statements of changes in net assets for each of the two years in the period then ended, the financial highlights for each of the five years in the period then ended, and the related notes. In our opinion, the financial statements and financial highlights present fairly, in all material respects, the financial position of Small Cap Growth Fund of the American Century Mutual Funds, Inc. as of October 31, 2019, the results of its operations for the year then ended, the changes in its net assets for each of the two years in the period then ended, and the financial highlights for each of the five years in the period then ended, in conformity with accounting principles generally accepted in the United States of America.
Basis for Opinion
These financial statements and financial highlights are the responsibility of the Fund's management. Our responsibility is to express an opinion on the Fund’s financial statements and financial highlights based on our audits. We are a public accounting firm registered with the Public Company Accounting Oversight Board (United States) (PCAOB) and are required to be independent with respect to the Fund in accordance with the U.S. federal securities laws and the applicable rules and regulations of the Securities and Exchange Commission and the PCAOB.
We conducted our audits in accordance with the standards of the PCAOB. Those standards require that we plan and perform the audit to obtain reasonable assurance about whether the financial statements and financial highlights are free of material misstatement, whether due to error or fraud. The Fund is not required to have, nor were we engaged to perform, an audit of its internal control over financial reporting. As part of our audits we are required to obtain an understanding of internal control over financial reporting but not for the purpose of expressing an opinion on the effectiveness of the Fund’s internal control over financial reporting. Accordingly, we express no such opinion.
Our audits included performing procedures to assess the risks of material misstatement of the financial statements and financial highlights, whether due to error or fraud, and performing procedures that respond to those risks. Such procedures included examining, on a test basis, evidence regarding the amounts and disclosures in the financial statements and financial highlights. Our audits also included evaluating the accounting principles used and significant estimates made by management, as well as evaluating the overall presentation of the financial statements and financial highlights. Our procedures included confirmation of securities owned as of October 31, 2019, by correspondence with the custodian and brokers; when replies were not received from brokers, we performed other auditing procedures. We believe that our audits provide a reasonable basis for our opinion.
DELOITTE & TOUCHE LLP
Kansas City, Missouri
December 16, 2019
We have served as the auditor of one or more American Century investment companies since 1997.
The Board of Directors
The individuals listed below serve as directors of the funds. Each director will continue to serve in this capacity until death, retirement, resignation or removal from office. The board has adopted a mandatory retirement age for directors who are not “interested persons,” as that term is defined in the Investment Company Act (independent directors). Independent directors shall retire by December 31 of the year in which they reach their 75th birthday.
Mr. Thomas is an “interested person” because he currently serves as President and Chief Executive Officer of American Century Companies, Inc. (ACC), the parent company of American Century Investment Management, Inc. (ACIM or the advisor). The other directors (more than three-fourths of the total number) are independent. They are not employees, directors or officers of, and have no financial interest in, ACC or any of its wholly owned, direct or indirect, subsidiaries, including ACIM, American Century Investment Services, Inc. (ACIS) and American Century Services, LLC (ACS), and they do not have any other affiliations, positions or relationships that would cause them to be considered “interested persons” under the Investment Company Act. The directors serve in this capacity for seven (in the case of Jonathan S. Thomas, 16; and Stephen E. Yates, 8) registered investment companies in the American Century Investments family of funds.
The following table presents additional information about the directors. The mailing address for each director is 4500 Main Street, Kansas City, Missouri 64111.
|
| | | | | |
Name
(Year of Birth) | Position(s) Held with Funds | Length of Time Served | Principal Occupation(s) During Past 5 Years | Number of American Century Portfolios Overseen by Director | Other Directorships Held During Past 5 Years |
| Independent Directors |
|
|
| Thomas W. Bunn (1953) | Director | Since 2017 | Retired | 66 | SquareTwo Financial; Barings (formerly Babson Capital Funds Trust) (2013 to 2016) |
Chris H. Cheesman
(1962)
| Director | Since 2019
| Retired. Senior Vice President & Chief Audit Executive, AllianceBernstein (1999 to 2018)
| 66 | None |
Barry Fink
(1955) | Director | Since 2012 (independent since 2016) | Retired | 66 | None |
Rajesh K. Gupta
(1960)
| Director | Since 2019
| Partner Emeritus, SeaCrest Investment Management and SeaCrest Wealth Management (2019 to Present); Chief Executive Officer and Chief Investment Officer, SeaCrest Investment Management (2006 to 2019); Chief Executive Officer and Chief Investment Officer, SeaCrest Wealth Management (2008 to 2019)
| 66 | None |
|
| | | | | |
Name
(Year of Birth) | Position(s) Held with Funds | Length of Time Served | Principal Occupation(s) During Past 5 Years | Number of American Century Portfolios Overseen by Director | Other Directorships Held During Past 5 Years |
| Independent Directors |
|
|
Lynn Jenkins
(1963)
| Director | Since 2019
| United States Representative, U.S. House of Representatives (2009 to 2018) | 66 | MGP Ingredients, Inc. |
Jan M. Lewis
(1957) | Director | Since 2011 | Retired | 66 | None |
John R. Whitten
(1946) | Director | Since 2008 | Retired | 66 | Onto Innovation Inc.; Rudolph Technologies, Inc. (2006 to 2019) |
Stephen E. Yates
(1948) | Director and Chairman of the Board | Since 2012 (Chairman since 2018) | Retired | 81 | None |
| Interested Director |
|
Jonathan S. Thomas
(1963) | Director | Since 2007 | President and Chief Executive Officer, ACC (2007 to present). Also serves as Chief Executive Officer, ACS; Executive Vice President, ACIM; Director, ACC, ACIM and other ACC subsidiaries | 125 | BioMed Valley Discoveries, Inc. |
The Statement of Additional Information has additional information about the fund's directors and is available without charge, upon request, by calling 1-800-345-2021.
Officers
The following table presents certain information about the executive officers of the funds. Each officer serves as an officer for each of the 16 (in the case of Robert J. Leach, 15) investment companies in the American Century family of funds. No officer is compensated for his or her service as an officer of the funds. The listed officers are interested persons of the funds and are appointed or re-appointed on an annual basis. The mailing address for each officer listed below is 4500 Main Street, Kansas City, Missouri 64111.
|
| | |
Name
(Year of Birth) | Offices with the Funds | Principal Occupation(s) During the Past Five Years |
Patrick Bannigan
(1965) | President since 2019 | Executive Vice President and Director, ACC (2012 to present); Chief Financial Officer, Chief Accounting Officer and Treasurer, ACC (2015 to present); Chief Operating Officer, ACC (2012-2015). Also serves as President, ACS; Vice President, ACIM; Chief Financial Officer, Chief Accounting Officer and/or Director, ACIM, ACS and other ACC subsidiaries |
R. Wes Campbell
(1974) | Chief Financial Officer and Treasurer since 2018 | Investment Operations and Investment Accounting, ACS (2000 to present) |
Amy D. Shelton
(1964) | Chief Compliance Officer and Vice President since 2014 | Chief Compliance Officer, American Century funds, (2014 to present); Chief Compliance Officer, ACIM (2014 to present); Chief Compliance Officer, ACIS (2009 to present). Also serves as Vice President, ACIS |
Charles A. Etherington
(1957) | General Counsel since 2007 and Senior Vice President since 2006 | Attorney, ACC (1994 to present); Vice President, ACC (2005 to present); General Counsel, ACC (2007 to present). Also serves as General Counsel, ACIM, ACS, ACIS and other ACC subsidiaries; and Senior Vice President, ACIM and ACS |
C. Jean Wade
(1964) | Vice President since 2012 | Senior Vice President, ACS (2017 to present); Vice President, ACS (2000 to 2017)
|
Robert J. Leach
(1966) | Vice President since 2006 | Vice President, ACS (2000 to present) |
David H. Reinmiller
(1963) | Vice President since 2000 | Attorney, ACC (1994 to present). Also serves as Vice President, ACIM and ACS |
Ward D. Stauffer
(1960) | Secretary since 2005 | Attorney, ACC (2003 to present) |
|
|
| Approval of Management Agreement |
At a meeting held on June 26, 2019, the Fund’s Board of Directors (the "Board") unanimously approved the renewal of the management agreement pursuant to which American Century Investment Management, Inc. (the “Advisor”) acts as the investment advisor for the Fund. Under Section 15(c) of the Investment Company Act, contracts for investment advisory services are required to be reviewed, evaluated, and approved by a majority of a fund’s directors (the “Directors”), including a majority of the independent Directors, each year.
Prior to its consideration of the renewal of the management agreement, the Directors requested and reviewed extensive data and information compiled by the Advisor and certain independent providers of evaluation data concerning the Fund and the services provided to the Fund by the Advisor. This review was in addition to the oversight and evaluation undertaken by the Board and its committees on a continual basis and the information received was supplemental to the extensive information that the Board and its committees receive and consider throughout the year.
In connection with its consideration of the renewal of the management agreement, the Board’s review and evaluation of the services provided by the Advisor included, but was not limited to, the following:
| |
| • | the nature, extent, and quality of investment management, shareholder services, and other services provided and to be provided to the Fund; |
| |
| • | the wide range of other programs and services provided and to be provided to the Fund and its shareholders on a routine and non-routine basis; |
| |
| • | the investment performance of the Fund, including data comparing the Fund's performance to appropriate benchmarks and/or a peer group of other mutual funds with similar investment objectives and strategies; |
| |
| • | the cost of owning the Fund compared to the cost of owning similar funds; |
| |
| • | the compliance policies, procedures, and regulatory experience of the Advisor and the Fund's service providers; |
| |
| • | financial data showing the cost of services provided to the Fund, the profitability of the Fund to the Advisor, and the overall profitability of the Advisor; |
| |
| • | strategic plans of the Advisor; |
| |
| • | any economies of scale associated with the Advisor’s management of the Fund and other accounts; |
| |
| • | services provided and charges to the Advisor's other investment management clients; |
| |
| • | acquired fund fees and expenses; |
| |
| • | payments and practices in connection with financial intermediaries holding shares of the Fund and the services provided by intermediaries in connection therewith; and |
| |
| • | any collateral benefits derived by the Advisor from the management of the Fund. |
The Directors held three in-person meetings and one telephonic meeting to review and discuss the information provided. The independent Directors also reviewed responses to supplemental information requests provided by the Directors to the Advisor and held active discussions with the Advisor regarding the renewal of the management agreement. The independent Directors had the benefit of the advice of their independent counsel throughout the process.
Factors Considered
The Directors considered all of the information provided by the Advisor, the independent data providers, and independent counsel in connection with the approval. They determined that the information was sufficient for them to evaluate the management agreement for the Fund. In connection with their review, the Directors did not identify any single factor as being all-important or
controlling, and each Director may have attributed different levels of importance to different factors. In deciding to renew the management agreement, the Board based its decision on a number of factors, including without limitation the following:
Nature, Extent and Quality of Services — Generally. Under the management agreement, the Advisor is responsible for providing or arranging for all services necessary for the operation of the Fund. The Board noted that the Advisor provides or arranges at its own expense a wide variety of services including without limitation the following:
| |
| • | portfolio research and security selection |
| |
| • | daily valuation of the Fund’s portfolio |
| |
| • | shareholder servicing and transfer agency, including shareholder confirmations, recordkeeping, and communications |
| |
| • | legal services (except the independent Directors’ counsel) |
| |
| • | regulatory and portfolio compliance |
| |
| • | marketing and distribution (except amounts paid by the Fund under Rule 12b-1 plans) |
The Board noted that many of these services have expanded over time in terms of both quantity and complexity in response to shareholder demands, competition in the industry, changing distribution channels, and the changing regulatory environment.
Investment Management Services. The nature of the investment management services provided to the Fund is quite complex and allows Fund shareholders access to professional money management, instant diversification of their investments within an asset class, the opportunity to easily diversify among asset classes by investing in or exchanging among various American Century Investments funds, and liquidity. In evaluating investment performance, the Board expects the Advisor to manage the Fund in accordance with its investment objectives and approved strategies. Further, the Directors recognize that the Advisor has an obligation to monitor trading activities, and in particular to seek the best execution of fund trades, and to evaluate the use of and payment for research. In providing these services, the Advisor utilizes teams of investment professionals (portfolio managers, analysts, research assistants, and securities traders) who require extensive information technology, research, training, compliance, and other systems to conduct their business. The Board, directly and through its Fund Performance Review Committee, provides oversight of the investment performance process. It regularly reviews investment performance information for the Fund, together with comparative information for appropriate benchmarks and/or peer groups of similarly-managed funds, over different time horizons. The Directors also review investment performance information during the management agreement renewal process. If performance concerns are identified, the Fund receives special reviews until performance improves, during which the Board discusses with the Advisor the reasons for such results (e.g., market conditions, security selection) and any efforts being undertaken to improve performance. The Fund’s performance was above its benchmark for the one-, three-, five-, and ten-year periods reviewed by the Board. The Board found the investment management services provided by the Advisor to the Fund to be satisfactory and consistent with the management agreement.
Shareholder and Other Services. Under the management agreement, the Advisor provides the Fund with a comprehensive package of transfer agency, shareholder, and other services. The Board, directly and through various committees of the Board, regularly reviews reports and evaluations of such services at its regular meetings. These reports include, but are not limited to, information regarding the operational efficiency and accuracy of the shareholder and transfer agency services provided, staffing levels, shareholder satisfaction, technology support (including cyber security), new products and services offered to Fund shareholders, securities trading
activities, portfolio valuation services, auditing services, and legal and operational compliance activities. The Board found the services provided by the Advisor to the Fund under the management agreement to be competitive and of high quality.
Costs of Services and Profitability. The Advisor provides detailed information concerning its cost of providing various services to the Fund, its profitability in managing the Fund (pre- and post-distribution), its overall profitability, and its financial condition. The Directors have reviewed with the Advisor the methodology used to prepare this financial information. This information is considered in evaluating the Advisor’s financial condition, its ability to continue to provide services under the management agreement, and the reasonableness of the current management fee. The Board concluded that the Advisor’s profits were reasonable in light of the services provided to the Fund.
Ethics. The Board generally considers the Advisor’s commitment to providing quality services to shareholders and to conducting its business ethically. They noted that the Advisor’s practices generally meet or exceed industry best practices.
Economies of Scale. The Board also reviewed information provided by the Advisor regarding the possible existence of economies of scale in connection with the management of the Fund. The Board concluded that economies of scale are difficult to measure and predict with precision, especially on a fund-by-fund basis. The Board concluded that the Advisor is appropriately sharing economies of scale through its competitive fee structure, offering competitive fees from fund inception, and through reinvestment in its business to provide shareholders additional content and services. The Board also noted that economies of scale are shared with the Fund and its shareholders through management fee breakpoints that serve to reduce the effective management fee as the assets of the Fund grow.
Comparison to Other Funds’ Fees. The management agreement provides that the Fund pays the Advisor a single, all-inclusive (or unified) management fee for providing all services necessary for the management and operation of the Fund, other than brokerage expenses, expenses attributable to short sales, taxes, interest, extraordinary expenses, fees and expenses of the Fund’s independent Directors (including their independent legal counsel), and expenses incurred in connection with the provision of shareholder services and distribution services under a plan adopted pursuant to Rule 12b-1 under the Investment Company Act. Under the unified fee structure, the Advisor is responsible for providing all investment advisory, custody, audit, administrative, compliance, recordkeeping, marketing and shareholder services, or arranging and supervising third parties to provide such services. By contrast, most other funds are charged a variety of fees, including an investment advisory fee, a transfer agency fee, an administrative fee, distribution charges, and other expenses. Other than their investment advisory fees and any applicable Rule 12b-1 distribution fees, all other components of the total fees charged by these other funds may be increased without shareholder approval. The Board believes the unified fee structure is a benefit to Fund shareholders because it clearly discloses to shareholders the cost of owning Fund shares, and, since the unified fee cannot be increased without a vote of Fund shareholders, it shifts to the Advisor the risk of increased costs of operating the Fund and provides a direct incentive to minimize administrative inefficiencies. Part of the Board’s analysis of fee levels involves reviewing certain evaluative data compiled by an independent provider comparing the Fund’s unified fee to the total expense ratios of its peers. The unified fee charged to shareholders of the Fund was above the median of the total expense ratios of the Fund’s peer expense universe and was within the range of its peer expense group. The Board concluded that the management fee paid by the Fund to the Advisor under the management agreement is reasonable in light of the services provided to the Fund.
Comparison to Fees and Services Provided to Other Clients of the Advisor. The Directors also requested and received information from the Advisor concerning the nature of the services, fees, costs, and profitability of its advisory services to advisory clients other than the Fund. They observed that these varying types of client accounts require different services and involve different regulatory and entrepreneurial risks than the management of the Fund. The Board analyzed this
information and concluded that the fees charged and services provided to the Fund were reasonable by comparison.
Payments to Intermediaries. The Directors also requested and received a description of payments made to intermediaries by the Fund and the Advisor and services provided in response thereto. These payments include various payments made by the Fund or the Advisor to different types of intermediaries and recordkeepers for distribution and service activities provided for the Fund. The Board reviewed such information and received representations from the Advisor that all such payments by the Fund were made pursuant to the Fund's Rule 12b-1 Plan and that all such payments by the Advisor were made from the Advisor’s resources and reasonable profits. The Board found such payments to be reasonable in scope and purpose.
Collateral or “Fall-Out” Benefits Derived by the Advisor. The Board considered the existence of collateral benefits the Advisor may receive as a result of its relationship with the Fund. They concluded that the Advisor’s primary business is managing mutual funds and it generally does not use fund or shareholder information to generate profits in other lines of business, and therefore does not derive any significant collateral benefits from them. The Board noted that additional assets from other clients may offer the Advisor some benefit from increased leverage with service providers and counterparties. Additionally, the Advisor may receive proprietary research from broker-dealers that execute fund portfolio transactions, which the Board concluded is likely to benefit other clients of the Advisor, as well as Fund shareholders. The Board also determined that the Advisor is able to provide investment management services to certain clients other than the Fund, at least in part, due to its existing infrastructure built to serve the fund complex. The Board concluded that appropriate allocation methodologies had been employed to assign resources and the cost of those resources to these other clients and, where expressly provided, these other client assets may be included with the assets of the Fund to determine breakpoints in the management fee schedule.
Existing Relationship. The Board also considered whether there was any reason for not continuing the existing arrangement with the Advisor. In this regard, the Board was mindful of the potential disruptions of the Fund’s operations and various risks, uncertainties, and other effects that could occur as a result of a decision not to continue such relationship. In particular, the Board recognized that most shareholders have invested in the Fund on the strength of the Advisor’s industry standing and reputation and in the expectation that the Advisor will have a continuing role in providing advisory services to the Fund.
Conclusion of the Directors. As a result of this process, the Board, including all of the independent Directors, taking into account all of the factors discussed above and the information provided by the Advisor and others in connection with its review and throughout the year, determined that the management fee is fair and reasonable in light of the services provided and that the investment management agreement between the Fund and the Advisor should be renewed.
Retirement Account Information
As required by law, distributions you receive from certain retirement accounts are subject to federal income tax withholding, unless you elect not to have withholding apply*. Tax will be withheld on the total amount withdrawn even though you may be receiving amounts that are not subject to withholding, such as nondeductible contributions. In such case, excess amounts of withholding could occur. You may adjust your withholding election so that a greater or lesser amount will be withheld.
If you don’t want us to withhold on this amount, you must notify us to not withhold the federal income tax. You may notify us in writing or in certain situations by telephone or through other electronic means. For systematic withdrawals, your withholding election will remain in effect until revoked or changed by filing a new election. You have the right to revoke your election at any time and change your withholding percentage for future distributions.
Remember, even if you elect not to have income tax withheld, you are liable for paying income tax on the taxable portion of your withdrawal. If you elect not to have income tax withheld or you don’t have enough income tax withheld, you may be responsible for payment of estimated tax. You may incur penalties under the estimated tax rules if your withholding and estimated tax payments are not sufficient. You can reduce or defer the income tax on a distribution by directly or indirectly rolling such distribution over to another IRA or eligible plan. You should consult your tax advisor for additional information.
State tax will be withheld if, at the time of your distribution, your address is within one of the mandatory withholding states and you have federal income tax withheld (or as otherwise required by state law). State taxes will be withheld from your distribution in accordance with the respective state rules.
*Some 403(b), 457 and qualified retirement plan distributions may be subject to 20% mandatory withholding, as they are subject to special tax and withholding rules. Your plan administrator or plan sponsor is required to provide you with a special tax notice explaining those rules at the time you request a distribution. If applicable, federal and/or state taxes may be withheld from your distribution amount.
Proxy Voting Policies
A description of the policies that the fund's investment advisor uses in exercising the voting rights associated with the securities purchased and/or held by the fund is available without charge, upon request, by calling 1-800-345-2021. It is also available on American Century Investments’ website at americancentury.com/proxy and on the Securities and Exchange Commission’s website at sec.gov. Information regarding how the investment advisor voted proxies relating to portfolio securities during the most recent 12-month period ended June 30 is available on americancentury.com/proxy. It is also available at sec.gov.
Quarterly Portfolio Disclosure
The fund files its complete schedule of portfolio holdings with the Securities and Exchange Commission (SEC) for the first and third quarters of each fiscal year on Form N-Q or as an exhibit to its reports on Form N-PORT. The fund’s Forms N-Q and Form N-PORT reports are available on the SEC’s website at sec.gov. The fund also makes its complete schedule of portfolio holdings for the most recent quarter of its fiscal year available on its website at americancentury.com and, upon request, by calling 1-800-345-2021.
Other Tax Information
The following information is provided pursuant to provisions of the Internal Revenue Code.
The fund hereby designates up to the maximum amount allowable as qualified dividend income for the fiscal year ended October 31, 2019.
For corporate taxpayers, the fund hereby designates $2,298,146, or up to the maximum amount allowable, of ordinary income distributions paid during the fiscal year ended October 31, 2019 as qualified for the corporate dividends received deduction.
The fund hereby designates $91,314,434, or up to the maximum amount allowable, as long-term capital gain distributions (20% rate gain distributions) for the fiscal year ended October 31, 2019.
The fund hereby designates $21,323,960 as qualified short-term capital gain distributions for purposes of Internal Revenue Code Section 871 for the fiscal year ended October 31, 2019.
The fund utilized earnings and profits of $1,905,377 distributed to shareholders on redemption of shares as part of the dividends paid deduction (tax equalization).
|
| | |
| |
| | | |
| Contact Us | americancentury.com | |
| Automated Information Line | 1-800-345-8765 | |
| Investor Services Representative | 1-800-345-2021 or 816-531-5575 | |
| Investors Using Advisors | 1-800-378-9878 | |
| Business, Not-For-Profit, Employer-Sponsored Retirement Plans | 1-800-345-3533 | |
| Banks and Trust Companies, Broker-Dealers, Financial Professionals, Insurance Companies | 1-800-345-6488 | |
| Telecommunications Relay Service for the Deaf | 711 | |
| | | |
| American Century Mutual Funds, Inc. | |
| | | |
Investment Advisor: American Century Investment Management, Inc. Kansas City, Missouri | |
| | | |
| This report and the statements it contains are submitted for the general information of our shareholders. The report is not authorized for distribution to prospective investors unless preceded or accompanied by an effective prospectus. | |
| | | |
©2019 American Century Proprietary Holdings, Inc. All rights reserved.
CL-ANN-90978 1912 | |
|
| |
| | |
| | Annual Report |
| | |
| | October 31, 2019 |
| | |
| | Sustainable Equity Fund |
| | Investor Class (AFDIX) |
| | I Class (AFEIX) |
| | Y Class (AFYDX) |
| | A Class (AFDAX) |
| | C Class (AFDCX) |
| | R Class (AFDRX) |
| | R5 Class (AFDGX) |
| | R6 Class (AFEDX) |
| | G Class (AFEGX) |
Beginning on January 1, 2021, as permitted by regulations adopted by the Securities and Exchange Commission, paper copies of the fund’s shareholder reports like this one will no longer be sent by mail, unless you specifically request paper copies of the reports from the fund or from your financial intermediary, such as a broker-dealer or bank. Instead, the reports will be made available on a website, and you will be notified by mail each time a report is posted and provided with a website link to access the report.
If you already elected to receive shareholder reports electronically, you will not be affected by this change and you need not take any action. You may elect to receive shareholder reports and other communications from the fund or your financial intermediary electronically by calling or sending an email request to your appropriate contacts as listed on the back cover of this report.
You may elect to receive all future reports in paper free of charge. You can inform the fund or your financial intermediary that you wish to continue receiving paper copies of your shareholder reports by calling or sending an email request to your appropriate contacts as listed on the back cover of this report. Your election to receive reports in paper will apply to all funds held with the fund complex/your financial intermediary.
|
| |
| President's Letter | |
| Performance | |
| Portfolio Commentary | |
| Fund Characteristics | |
| Shareholder Fee Example | |
| Schedule of Investments | |
| Statement of Assets and Liabilities | |
| Statement of Operations | |
| Statement of Changes in Net Assets | |
| Notes to Financial Statements | |
| Financial Highlights | |
| Report of Independent Registered Public Accounting Firm | |
| Management | |
| Approval of Management Agreement | |
| Additional Information | |
Any opinions expressed in this report reflect those of the author as of the date of the report, and do not necessarily represent the opinions of American Century Investments® or any other person in the American Century Investments organization. Any such opinions are subject to change at any time based upon market or other conditions and American Century Investments disclaims any responsibility to update such opinions. These opinions may not be relied upon as investment advice and, because investment decisions made by American Century Investments funds are based on numerous factors, may not be relied upon as an indication of trading intent on behalf of any American Century Investments fund. Security examples are used for representational purposes only and are not intended as recommendations to purchase or sell securities. Performance information for comparative indices and securities is provided to American Century Investments by third party vendors. To the best of American Century Investments’ knowledge, such information is accurate at the time of printing.
Jonathan Thomas
Dear Investor:
Thank you for reviewing this annual report for the 12 months ended October 31, 2019. Annual reports help convey important information about fund returns, including market factors that affected performance. For additional investment and market insights, please visit americancentury.com.
Stocks, Bonds Delivered Solid Gains
U.S. and global stocks, bonds and real estate investments generally delivered strong gains for the 12-month period. Stocks and other riskier assets rebounded from a late-2018 sell-off to post robust returns for the 12 months overall. Global bonds benefited from safe-haven buying early in the period and a declining interest rate environment overall.
Fed’s Policy Pivot Improved Investor Sentiment
In the final months of 2018, mounting concerns about slowing global economic and earnings growth, tariffs and Federal Reserve (Fed) policy soured investor sentiment, driving global stocks lower. After raising rates in September 2018, the Fed hiked again in December and delivered a surprisingly bullish 2019 rate-hike outlook, which intensified the sell-off among stocks and other riskier assets. Meanwhile, the risk-off climate sparked a flight to quality, which drove U.S. and other government bond yields lower and benefited global bond returns.
A key policy pivot from the Fed helped improve equity investor sentiment beginning in early 2019. The central bank abruptly ended its rate-hike campaign and adopted a dovish tone amid weaker global growth and inflation. Additionally, investors’ worst-case fears about trade and corporate earnings generally eased, which also aided stocks and other riskier assets. At the same time, government bond yields continued to fall on moderating global growth data, muted inflation and accommodative central bank policy in the U.S., Europe and Japan. By July, concerns about global economic risks prompted the Fed to cut short-term interest rates for the first time in 10 years. The Fed followed up with additional rate cuts in September and October. This backdrop supported continued gains for fixed-income and other interest rate-sensitive assets.
Looking ahead, we expect volatility to remain a formidable factor as investors react to global growth and trade trends, central bank policy and geopolitical developments. We believe this scenario underscores the importance of using professionally managed portfolios in pursuit of investment goals. We appreciate your continued trust and confidence in us.
Sincerely,
Jonathan Thomas
President and Chief Executive Officer
American Century Investments
|
| | | | | | |
| Total Returns as of October 31, 2019 |
| | | | Average Annual Returns | |
| | Ticker Symbol | 1 year | 5 years | 10 years | Since Inception | Inception Date |
| Investor Class | AFDIX | 16.10% | 10.37% | 13.35% | — | 7/29/05 |
| S&P 500 Index | — | 14.33% | 10.77% | 13.69% | — | — |
| I Class | AFEIX | 16.37% | 10.58% | 13.58% | — | 7/29/05 |
| Y Class | AFYDX | 16.56% | — | — | 14.87% | 4/10/17 |
| A Class | AFDAX | | | | | 11/30/04 |
| No sales charge | | 15.81% | 10.09% | 13.06% | — | |
| With sales charge | | 9.16% | 8.79% | 12.40% | — | |
| C Class | AFDCX | 14.98% | 9.27% | 12.22% | — | 11/30/04 |
| R Class | AFDRX | 15.56% | 9.82% | 12.79% | — | 7/29/05 |
| R5 Class | AFDGX | 16.36% | — | — | 14.70% | 4/10/17 |
| R6 Class | AFEDX | — | — | — | 8.95% | 4/1/19 |
| G Class | AFEGX | — | — | — | 9.23% | 4/1/19 |
Average annual returns since inception are presented when ten years of performance history is not available. Fund returns would have been lower if a portion of the fees had not been waived.
Sales charges include initial sales charges and contingent deferred sales charges (CDSCs), as applicable. A Class shares have a 5.75% maximum initial sales charge and may be subject to a maximum CDSC of 1.00%. C Class shares redeemed within 12 months of purchase are subject to a maximum CDSC of 1.00%. The SEC requires that mutual funds provide performance information net of maximum sales charges in all cases where charges could be applied.
Data presented reflect past performance. Past performance is no guarantee of future results. Current performance may be higher or lower than the performance shown. Total returns for periods less than one year are not annualized. Investment return and principal value will fluctuate, and redemption value may be more or less than original cost. Data assumes reinvestment of dividends and capital gains, and none of the charts reflect the deduction of taxes that a shareholder would pay on fund distributions or the redemption of fund shares. To obtain performance data current to the most recent month end, please call 1-800-345-2021 or visit americancentury.com. For additional information about the fund, please consult the prospectus.
|
|
| Growth of $10,000 Over 10 Years |
| $10,000 investment made October 31, 2009 |
| Performance for other share classes will vary due to differences in fee structure. |
|
| |
| Value on October 31, 2019 |
| | Investor Class — $35,045 |
| |
| | S&P 500 Index — $36,096 |
| |
The investment advisor is presenting performance for the Investor Class, which is a change from the
prior annual report. Of the classes with 10 or more years of annual returns, Investor Class is the largest.
Ending value of Investor Class would have been lower if a portion of the fees had not been waived.
|
| | | | | | | | |
| Total Annual Fund Operating Expenses | | | |
| Investor Class | I Class | Y Class | A Class | C Class | R Class | R5 Class | R6 Class | G Class |
| 0.84% | 0.64% | 0.49% | 1.09% | 1.84% | 1.34% | 0.64% | 0.49% | 0.49% |
The total annual fund operating expenses shown is as stated in the fund’s prospectus current as of the date of this report. The prospectus may vary from the expense ratio shown elsewhere in this report because it is based on a different time period, includes acquired fund fees and expenses, and, if applicable, does not include fee waivers or expense reimbursements.
Data presented reflect past performance. Past performance is no guarantee of future results. Current performance may be higher or lower than the performance shown. Total returns for periods less than one year are not annualized. Investment return and principal value will fluctuate, and redemption value may be more or less than original cost. Data assumes reinvestment of dividends and capital gains, and none of the charts reflect the deduction of taxes that a shareholder would pay on fund distributions or the redemption of fund shares. To obtain performance data current to the most recent month end, please call 1-800-345-2021 or visit americancentury.com. For additional information about the fund, please consult the prospectus.
Portfolio Managers: Greg Woodhams, Justin Brown, Joe Reiland and Rob Bove
Performance Summary
Sustainable Equity returned 16.10%* for the 12 months ended October 31, 2019, outpacing the 14.33% return of the portfolio’s benchmark, the S&P 500 Index.
U.S. stocks delivered solid returns during the reporting period, and growth stocks outperformed value stocks across the capitalization spectrum. Within the S&P 500 Index, most sectors posted double-digit gains. Energy was the only sector to decline.
Stock selection in the health care and consumer staples sectors helped drive outperformance relative to the benchmark. Stock choices in the information technology sector detracted, although an overweight allocation to the sector mitigated much of those losses. Financials modestly weighed on relative performance due to stock selection and an underweight allocation.
Health Care Led Performance
Stock selection in the pharmaceuticals and health care equipment and supplies industries benefited relative performance in the health care sector. Zoetis, a maker of medicines for pets and livestock, reported better-than-expected earnings and revenue. Trends in animal health continued to be positive, and animal health has been less sensitive to political headline risk than other parts of health care. Edwards Lifesciences is a global medical devices company focused on innovations to address heart disease and critical care monitoring. The company reported better-than-expected revenue and earnings driven in part by its transcatheter aortic valve replacement product.
Stock choices among household products companies and an overweight allocation to the industry boosted relative performance in the consumer staples sector. The stock price of The Procter & Gamble Co. outperformed as the consumer products company posted its best organic growth in more than a decade. It also benefited from a more defensive market posture as interest rates declined. Avoiding tobacco stocks also helped sector performance.
Other top contributors included Prologis, an equity real estate investment trust that owns primarily logistics and distribution center properties. It reported solid earnings and revenue and also benefited from increased demand as long-term rates fell. Semiconductor equipment company ASML Holding outperformed on strong new orders as it expands its market opportunity set into memory chip manufacturers. The Netherlands-based company’s technology allows producing smaller and more efficient semiconductors.
Information Technology Stocks Detracted
Stock selection in the IT services industry weighed on relative performance in the information technology sector. We initiated a position in global credit card and payments company MasterCard during the third quarter of 2019. We were underweight the position relative to the benchmark for most of the period, however, and the positioning detracted for the year. MasterCard has been a strong free cash-flow grower levered to electronic payments and has what we believe are ample margin-expansion opportunities. MasterCard recently reported better-than-anticipated revenue and earnings on increased transactions.
*All fund returns referenced in this commentary are for Investor Class shares. Fund returns would have been lower if a portion of the fees had not been waived. Performance for other share classes will vary due to differences in fee structure; when Investor Class performance exceeds that of the fund’s benchmark, other share classes may not. See page 3 for returns for all share classes.
In the financials sector, stock choices among insurers detracted from relative performance. Insurance company Prudential Financial’s stock sold off sharply after it reported weaker-than-expected results. Management also offered lower forward guidance, driven by higher expenses and lower interest rates, which reduce returns on its investments.
Other significant detractors included ConocoPhillips. The oil and gas exploration and production company fell along with most energy stocks as higher U.S. oil inventories pressured crude oil prices. Declining expectations of global demand also weighed on crude oil pricing. Pharmacy operator Walgreens Boots Alliance reported weaker-than-expected results and lowered guidance as the company is working to restructure its business and adapt to changing consumer preferences. Health insurer Humana posted earnings that beat expectations but was caught up in concerns about proposed Medicare for All legislation. Humana’s Medicare Advantage is a key program for the company.
Outlook
The portfolio invests in a blend of large value and large growth stocks, while seeking to outperform the S&P 500 Index with a comparable dividend yield without taking on significant additional risk. We believe that companies exhibiting both improving business fundamentals and sustainable corporate behaviors will outperform over time. We use a quantitative model that combines fundamental measures of a stock’s value and growth potential. We then integrate our view of the company’s financial improvement with multiple sources of environmental, social and governance (ESG) data.
As of October 31, 2019, the portfolio’s largest overweight position relative to the benchmark was in the information technology sector. We continued to find strong growth opportunities in companies with attractive ESG profiles through bottom-up analysis. Our exposure to attractive opportunities in the communications equipment industry leads our technology overweight. Health care ended the period as our largest underweight. Our positioning in the sector is driven by an underweight in the health care equipment and supplies industry, where we do not have exposure to many of the large benchmark holdings because of concerns about valuation and middling ESG characteristics.
A strategy or emphasis on environmental, social and governance factors (ESG) may limit the investment opportunities available to a portfolio. Therefore, the portfolio may underperform or perform differently than other portfolios that do not have an ESG investment focus. A portfolio's ESG investment focus may also result in the portfolio investing in securities or industry sectors that perform differently or maintain a different risk profile than the market generally or compared to underlying holdings that are not screened for ESG standards.
|
| |
| OCTOBER 31, 2019 | |
| Top Ten Holdings | % of net assets |
| Microsoft Corp. | 5.4% |
| Apple, Inc. | 4.1% |
| Alphabet, Inc., Class A | 3.3% |
| Amazon.com, Inc. | 3.2% |
| Bank of America Corp. | 3.2% |
| NextEra Energy, Inc. | 3.0% |
| Procter & Gamble Co. (The) | 2.7% |
| Prologis, Inc. | 2.7% |
| Home Depot, Inc. (The) | 2.4% |
| Visa, Inc., Class A | 2.1% |
| | |
| Top Five Industries | % of net assets |
| Software | 6.7% |
| Banks | 6.4% |
| IT Services | 6.0% |
| Interactive Media and Services | 5.1% |
| Semiconductors and Semiconductor Equipment | 4.4% |
| | |
| Types of Investments in Portfolio | % of net assets |
| Common Stocks | 99.5% |
| Temporary Cash Investments | 5.6% |
| Temporary Cash Investments - Securities Lending Collateral | —* |
| Other Assets and Liabilities | (5.1)%** |
| *Category is less than 0.05% of total net assets. |
| **Amount relates primarily to payable for investments purchased, but not settled, at period end. |
Fund shareholders may incur two types of costs: (1) transaction costs, including sales charges (loads) on purchase payments and redemption/exchange fees; and (2) ongoing costs, including management fees; distribution and service (12b-1) fees; and other fund expenses. This example is intended to help you understand your ongoing costs (in dollars) of investing in your fund and to compare these costs with the ongoing cost of investing in other mutual funds.
The example is based on an investment of $1,000 made at the beginning of the period and held for the entire period from May 1, 2019 to October 31, 2019.
Actual Expenses
The table provides information about actual account values and actual expenses for each class. You may use the information, together with the amount you invested, to estimate the expenses that you paid over the period. First, identify the share class you own. Then simply divide your account value by $1,000 (for example, an $8,600 account value divided by $1,000 = 8.6), then multiply the result by the number under the heading “Expenses Paid During Period” to estimate the expenses you paid on your account during this period.
If you hold Investor Class shares of any American Century Investments fund, or I Class shares of the American Century Diversified Bond Fund, in an American Century Investments account (i.e., not a financial intermediary or retirement plan account), American Century Investments may charge you a $12.50 semiannual account maintenance fee if the value of those shares is less than $10,000. We will redeem shares automatically in one of your accounts to pay the $12.50 fee. In determining your total eligible investment amount, we will include your investments in all personal accounts (including American Century Investments Brokerage accounts) registered under your Social Security number. Personal accounts include individual accounts, joint accounts, UGMA/UTMA accounts, personal trusts, Coverdell Education Savings Accounts and IRAs (including traditional, Roth, Rollover, SEP-, SARSEP- and SIMPLE-IRAs), and certain other retirement accounts. If you have only business, business retirement, employer-sponsored or American Century Investments Brokerage accounts, you are currently not subject to this fee. If you are subject to the Account Maintenance Fee, your account value could be reduced by the fee amount.
Hypothetical Example for Comparison Purposes
The table also provides information about hypothetical account values and hypothetical expenses based on the actual expense ratio of each class of your fund and an assumed rate of return of 5% per year before expenses, which is not the actual return of a fund’s share class. The hypothetical account values and expenses may not be used to estimate the actual ending account balance or expenses you paid for the period. You may use this information to compare the ongoing costs of investing in your fund and other funds. To do so, compare this 5% hypothetical example with the 5% hypothetical examples that appear in the shareholder reports of the other funds.
Please note that the expenses shown in the table are meant to highlight your ongoing costs only and do not reflect any transactional costs, such as sales charges (loads) or redemption/exchange fees. Therefore, the table is useful in comparing ongoing costs only, and will not help you determine the relative total costs of owning different funds. In addition, if these transactional costs were included, your costs would have been higher.
|
| | | | |
| Beginning
Account Value
5/1/19 | Ending
Account Value
10/31/19 | Expenses Paid
During Period(1)
5/1/19 - 10/31/19 |
Annualized
Expense Ratio(1) |
| Actual | | | | |
| Investor Class | $1,000 | $1,050.80 | $4.08 | 0.79% |
| I Class | $1,000 | $1,052.10 | $3.05 | 0.59% |
| Y Class | $1,000 | $1,053.10 | $2.28 | 0.44% |
| A Class | $1,000 | $1,049.50 | $5.37 | 1.04% |
| C Class | $1,000 | $1,045.60 | $9.23 | 1.79% |
| R Class | $1,000 | $1,048.40 | $6.66 | 1.29% |
| R5 Class | $1,000 | $1,052.10 | $3.05 | 0.59% |
| R6 Class | $1,000 | $1,053.10 | $2.28 | 0.44% |
| G Class | $1,000 | $1,055.10 | $0.00 | 0.00%(2) |
| Hypothetical | | | | |
| Investor Class | $1,000 | $1,021.22 | $4.02 | 0.79% |
| I Class | $1,000 | $1,022.23 | $3.01 | 0.59% |
| Y Class | $1,000 | $1,022.99 | $2.24 | 0.44% |
| A Class | $1,000 | $1,019.96 | $5.30 | 1.04% |
| C Class | $1,000 | $1,016.18 | $9.10 | 1.79% |
| R Class | $1,000 | $1,018.70 | $6.56 | 1.29% |
| R5 Class | $1,000 | $1,022.23 | $3.01 | 0.59% |
| R6 Class | $1,000 | $1,022.99 | $2.24 | 0.44% |
| G Class | $1,000 | $1,025.21 | $0.00 | 0.00%(2) |
| |
| (1) | Expenses are equal to the class's annualized expense ratio listed in the table above, multiplied by the average account value over the period, multiplied by 184, the number of days in the most recent fiscal half-year, divided by 365, to reflect the one-half year period. Annualized expense ratio reflects actual expenses, including any applicable fee waivers or expense reimbursements and excluding any acquired fund fees and expenses. |
| |
| (2) | Other expenses, which include directors' fees and expenses, did not exceed 0.005%. |
OCTOBER 31, 2019
|
| | | | |
| | Shares | Value |
| COMMON STOCKS — 99.5% | | |
| Aerospace and Defense — 1.5% | | |
| Boeing Co. (The) | 8,975 | $ | 3,050,692 |
|
| Lockheed Martin Corp. | 24,797 | 9,340,534 |
|
| | | 12,391,226 |
|
| Air Freight and Logistics — 0.4% | | |
| Expeditors International of Washington, Inc. | 43,715 | 3,188,572 |
|
| Airlines — 0.9% | | |
| Delta Air Lines, Inc. | 131,866 | 7,263,179 |
|
| Banks — 6.4% | | |
| Bank of America Corp. | 875,550 | 27,378,449 |
|
| Citigroup, Inc. | 90,431 | 6,498,372 |
|
| JPMorgan Chase & Co. | 134,962 | 16,859,453 |
|
SVB Financial Group(1) | 14,255 | 3,157,197 |
|
| | | 53,893,471 |
|
| Beverages — 1.8% | | |
| PepsiCo, Inc. | 112,700 | 15,459,059 |
|
| Biotechnology — 2.9% | | |
| AbbVie, Inc. | 70,887 | 5,639,061 |
|
| Amgen, Inc. | 39,017 | 8,320,375 |
|
Biogen, Inc.(1) | 22,019 | 6,577,295 |
|
Vertex Pharmaceuticals, Inc.(1) | 19,743 | 3,859,362 |
|
| | | 24,396,093 |
|
| Building Products — 0.9% | | |
| Johnson Controls International plc | 173,243 | 7,506,619 |
|
| Capital Markets — 1.9% | | |
| Ameriprise Financial, Inc. | 24,760 | 3,736,036 |
|
| BlackRock, Inc. | 7,261 | 3,352,404 |
|
| Morgan Stanley | 198,160 | 9,125,268 |
|
| | | 16,213,708 |
|
| Chemicals — 1.8% | | |
| Dow, Inc. | 91,476 | 4,618,623 |
|
| Ecolab, Inc. | 15,937 | 3,061,020 |
|
| Sherwin-Williams Co. (The) | 13,714 | 7,848,796 |
|
| | | 15,528,439 |
|
| Communications Equipment — 2.6% | | |
| Cisco Systems, Inc. | 334,814 | 15,907,013 |
|
| Motorola Solutions, Inc. | 34,579 | 5,751,179 |
|
| | | 21,658,192 |
|
| Consumer Finance — 0.7% | | |
| American Express Co. | 50,473 | 5,919,473 |
|
| Diversified Telecommunication Services — 1.7% | | |
| Verizon Communications, Inc. | 242,912 | 14,688,889 |
|
|
| | | | |
| | Shares | Value |
| Electric Utilities — 3.0% | | |
| NextEra Energy, Inc. | 105,790 | $ | 25,213,989 |
|
| Electrical Equipment — 0.6% | | |
| Eaton Corp. plc | 62,133 | 5,412,406 |
|
| Electronic Equipment, Instruments and Components — 0.5% | | |
| CDW Corp. | 34,232 | 4,378,615 |
|
| Entertainment — 1.4% | | |
| Walt Disney Co. (The) | 88,720 | 11,526,502 |
|
| Equity Real Estate Investment Trusts (REITs) — 3.5% | | |
| Prologis, Inc. | 262,658 | 23,050,866 |
|
| SBA Communications Corp. | 27,962 | 6,729,055 |
|
| | | 29,779,921 |
|
| Food and Staples Retailing — 1.1% | | |
| Costco Wholesale Corp. | 10,643 | 3,162,142 |
|
| Sysco Corp. | 18,488 | 1,476,636 |
|
| Walgreens Boots Alliance, Inc. | 81,181 | 4,447,095 |
|
| | | 9,085,873 |
|
| Food Products — 0.6% | | |
Beyond Meat, Inc.(1)(2) | 4,501 | 380,109 |
|
| Mondelez International, Inc., Class A | 97,457 | 5,111,620 |
|
| | | 5,491,729 |
|
| Health Care Equipment and Supplies — 2.2% | | |
| Baxter International, Inc. | 75,452 | 5,787,169 |
|
Edwards Lifesciences Corp.(1) | 45,585 | 10,866,552 |
|
| ResMed, Inc. | 12,826 | 1,897,222 |
|
| | | 18,550,943 |
|
| Health Care Providers and Services — 3.0% | | |
| CVS Health Corp. | 90,190 | 5,987,714 |
|
| Humana, Inc. | 14,862 | 4,372,400 |
|
| Quest Diagnostics, Inc. | 46,174 | 4,675,118 |
|
| UnitedHealth Group, Inc. | 41,155 | 10,399,869 |
|
| | | 25,435,101 |
|
| Hotels, Restaurants and Leisure — 1.7% | | |
| Royal Caribbean Cruises Ltd. | 69,311 | 7,543,116 |
|
| Starbucks Corp. | 85,280 | 7,211,277 |
|
| | | 14,754,393 |
|
| Household Products — 2.7% | | |
| Procter & Gamble Co. (The) | 185,314 | 23,073,446 |
|
| Industrial Conglomerates — 0.8% | | |
| Honeywell International, Inc. | 41,211 | 7,118,376 |
|
| Insurance — 3.3% | | |
| Aflac, Inc. | 91,736 | 4,876,686 |
|
| Progressive Corp. (The) | 93,671 | 6,528,869 |
|
| Prudential Financial, Inc. | 88,885 | 8,100,979 |
|
| Travelers Cos., Inc. (The) | 61,887 | 8,110,910 |
|
| | | 27,617,444 |
|
| Interactive Media and Services — 5.1% | | |
Alphabet, Inc., Class A(1) | 22,445 | 28,253,766 |
|
|
| | | | |
| | Shares | Value |
Facebook, Inc., Class A(1) | 78,713 | $ | 15,085,346 |
|
| | | 43,339,112 |
|
| Internet and Direct Marketing Retail — 3.2% | | |
Amazon.com, Inc.(1) | 15,463 | 27,472,494 |
|
| IT Services — 6.0% | | |
| Accenture plc, Class A | 62,685 | 11,623,053 |
|
| International Business Machines Corp. | 44,772 | 5,987,360 |
|
| MasterCard, Inc., Class A | 33,582 | 9,295,833 |
|
PayPal Holdings, Inc.(1) | 60,591 | 6,307,523 |
|
| Visa, Inc., Class A | 98,334 | 17,588,019 |
|
| | | 50,801,788 |
|
| Life Sciences Tools and Services — 0.9% | | |
| Agilent Technologies, Inc. | 100,027 | 7,577,045 |
|
| Machinery — 2.9% | | |
| Caterpillar, Inc. | 40,631 | 5,598,952 |
|
| Cummins, Inc. | 45,891 | 7,915,280 |
|
| Ingersoll-Rand plc | 43,508 | 5,520,730 |
|
| Parker-Hannifin Corp. | 29,321 | 5,380,110 |
|
| | | 24,415,072 |
|
| Media — 1.5% | | |
| Comcast Corp., Class A | 274,657 | 12,310,127 |
|
| Multiline Retail — 0.7% | | |
| Target Corp. | 54,689 | 5,846,801 |
|
| Oil, Gas and Consumable Fuels — 4.1% | | |
| ConocoPhillips | 266,377 | 14,704,010 |
|
| Devon Energy Corp. | 122,410 | 2,482,475 |
|
| ONEOK, Inc. | 103,422 | 7,221,958 |
|
| Phillips 66 | 50,703 | 5,923,125 |
|
| Valero Energy Corp. | 44,749 | 4,339,758 |
|
| | | 34,671,326 |
|
| Personal Products — 0.3% | | |
| Estee Lauder Cos., Inc. (The), Class A | 14,985 | 2,791,256 |
|
| Pharmaceuticals — 4.0% | | |
| Bristol-Myers Squibb Co. | 129,379 | 7,422,473 |
|
| Merck & Co., Inc. | 168,597 | 14,610,616 |
|
| Novo Nordisk A/S, B Shares | 118,625 | 6,531,281 |
|
| Zoetis, Inc. | 43,772 | 5,599,315 |
|
| | | 34,163,685 |
|
| Professional Services — 1.1% | | |
IHS Markit Ltd.(1) | 105,628 | 7,396,073 |
|
| Robert Half International, Inc. | 32,231 | 1,845,869 |
|
| | | 9,241,942 |
|
| Road and Rail — 1.4% | | |
| Norfolk Southern Corp. | 40,525 | 7,375,550 |
|
| Union Pacific Corp. | 28,603 | 4,732,652 |
|
| | | 12,108,202 |
|
| Semiconductors and Semiconductor Equipment — 4.4% | | |
| Applied Materials, Inc. | 115,878 | 6,287,540 |
|
|
| | | | |
| | Shares | Value |
| ASML Holding NV | 27,292 | $ | 7,160,033 |
|
| Broadcom, Inc. | 26,869 | 7,868,587 |
|
| Intel Corp. | 147,218 | 8,322,234 |
|
| NVIDIA Corp. | 20,462 | 4,113,271 |
|
| Texas Instruments, Inc. | 29,950 | 3,533,800 |
|
| | | 37,285,465 |
|
| Software — 6.7% | | |
Adobe, Inc.(1) | 17,032 | 4,733,704 |
|
| Microsoft Corp. | 321,794 | 46,135,606 |
|
salesforce.com, Inc.(1) | 36,205 | 5,665,720 |
|
| | | 56,535,030 |
|
| Specialty Retail — 3.7% | | |
| Best Buy Co., Inc. | 27,390 | 1,967,424 |
|
| Home Depot, Inc. (The) | 86,042 | 20,183,732 |
|
| TJX Cos., Inc. (The) | 161,584 | 9,315,318 |
|
| | | 31,466,474 |
|
| Technology Hardware, Storage and Peripherals — 4.1% | | |
| Apple, Inc. | 139,014 | 34,581,123 |
|
| Textiles, Apparel and Luxury Goods — 1.5% | | |
| NIKE, Inc., Class B | 101,576 | 9,096,131 |
|
| VF Corp. | 45,836 | 3,771,844 |
|
| | | 12,867,975 |
|
TOTAL COMMON STOCKS
(Cost $753,398,266) | | 843,020,575 |
|
| TEMPORARY CASH INVESTMENTS — 5.6% | | |
| Repurchase Agreement, BMO Capital Markets Corp., (collateralized by various U.S. Treasury obligations, 1.625% - 2.25%, 3/31/21 - 5/15/26, valued at $36,081,665), in a joint trading account at 1.50%, dated 10/31/19, due 11/1/19 (Delivery value $35,331,566) | | 35,330,094 |
|
| Repurchase Agreement, Fixed Income Clearing Corp., (collateralized by various U.S. Treasury obligations, 0.625%, 1/15/26, valued at $12,028,872), at 0.65%, dated 10/31/19, due 11/1/19 (Delivery value $11,792,213) | | 11,792,000 |
|
| State Street Institutional U.S. Government Money Market Fund, Premier Class | 15,608 | 15,608 |
|
TOTAL TEMPORARY CASH INVESTMENTS
(Cost $47,137,702) | | 47,137,702 |
|
TEMPORARY CASH INVESTMENTS - SECURITIES LENDING COLLATERAL(3)† |
State Street Navigator Securities Lending Government Money Market Portfolio
(Cost $388,211) | 388,211 | 388,211 |
|
TOTAL INVESTMENT SECURITIES — 105.1%
(Cost $800,924,179) | | 890,546,488 |
|
OTHER ASSETS AND LIABILITIES(4) — (5.1)% | | (43,183,317 | ) |
| TOTAL NET ASSETS — 100.0% | | $ | 847,363,171 |
|
|
| | | | | | | | | | |
| FORWARD FOREIGN CURRENCY EXCHANGE CONTRACTS | | |
| Currency Purchased | Currency Sold | Counterparty | Settlement Date | Unrealized Appreciation
(Depreciation) |
| EUR | 619,467 |
| USD | 684,247 |
| Credit Suisse AG | 12/31/19 | $ | 9,472 |
|
| EUR | 102,570 |
| USD | 114,643 |
| Credit Suisse AG | 12/31/19 | 221 |
|
| USD | 2,965,386 |
| EUR | 2,661,066 |
| Credit Suisse AG | 12/31/19 | (14,647 | ) |
| USD | 72,852 |
| EUR | 66,204 |
| Credit Suisse AG | 12/31/19 | (1,287 | ) |
| USD | 105,937 |
| EUR | 95,576 |
| Credit Suisse AG | 12/31/19 | (1,095 | ) |
| USD | 71,594 |
| EUR | 64,339 |
| Credit Suisse AG | 12/31/19 | (457 | ) |
| USD | 3,491,201 |
| EUR | 3,133,792 |
| Credit Suisse AG | 12/31/19 | (18,220 | ) |
| USD | 287,621 |
| EUR | 258,188 |
| Credit Suisse AG | 12/31/19 | (1,514 | ) |
| | | | | | | $ | (27,527 | ) |
|
| | |
| NOTES TO SCHEDULE OF INVESTMENTS |
| EUR | - | Euro |
| USD | - | United States Dollar |
† Category is less than 0.05% of total net assets.
| |
| (2) | Security, or a portion thereof, is on loan. At the period end, the aggregate value of securities on loan was $380,109. The amount of securities on loan indicated may not correspond with the securities on loan identified because securities with pending sales are in the process of recall from the brokers. |
| |
| (3) | Investment of cash collateral from securities on loan. At the period end, the aggregate market value of the collateral held by the fund was $388,211. |
| |
| (4) | Amount relates primarily to payable for investments purchased, but not settled, at period end. |
See Notes to Financial Statements.
|
|
| Statement of Assets and Liabilities |
|
| | | |
| OCTOBER 31, 2019 | |
| Assets | |
Investment securities, at value (cost of $800,535,968) — including $380,109 of securities on loan | $ | 890,158,277 |
|
Investment made with cash collateral received for securities on loan, at value
(cost of $388,211) | 388,211 |
|
| Total investment securities, at value (cost of $800,924,179) | 890,546,488 |
|
| Receivable for capital shares sold | 369,333 |
|
| Unrealized appreciation on forward foreign currency exchange contracts | 9,693 |
|
| Dividends and interest receivable | 473,584 |
|
| Securities lending receivable | 12,462 |
|
| | 891,411,560 |
|
| | |
| Liabilities | |
| Payable for collateral received for securities on loan | 388,211 |
|
| Payable for investments purchased | 42,837,968 |
|
| Payable for capital shares redeemed | 577,805 |
|
| Unrealized depreciation on forward foreign currency exchange contracts | 37,220 |
|
| Accrued management fees | 185,531 |
|
| Distribution and service fees payable | 21,654 |
|
| | 44,048,389 |
|
| | |
| Net Assets | $ | 847,363,171 |
|
| | |
| Net Assets Consist of: | |
| Capital (par value and paid-in surplus) | $ | 744,268,400 |
|
| Distributable earnings | 103,094,771 |
|
| | $ | 847,363,171 |
|
|
| | | | |
| | Net Assets | Shares Outstanding | Net Asset Value Per Share |
| Investor Class, $0.01 Par Value | $118,225,037 | 3,888,628 |
| $30.40 |
| I Class, $0.01 Par Value | $106,268,328 | 3,484,210 |
| $30.50 |
| Y Class, $0.01 Par Value | $51,037,398 | 1,670,285 |
| $30.56 |
| A Class, $0.01 Par Value | $54,289,913 | 1,792,086 |
| $30.29* |
| C Class, $0.01 Par Value | $10,148,956 | 343,344 |
| $29.56 |
| R Class, $0.01 Par Value | $4,465,926 | 148,287 |
| $30.12 |
| R5 Class, $0.01 Par Value | $1,314,124 | 43,060 |
| $30.52 |
| R6 Class, $0.01 Par Value | $3,978,563 | 130,191 |
| $30.56 |
| G Class, $0.01 Par Value | $497,634,926 | 16,243,357 |
| $30.64 |
*Maximum offering price $32.14 (net asset value divided by 0.9425).
See Notes to Financial Statements.
|
| | | |
| YEAR ENDED OCTOBER 31, 2019 |
| Investment Income (Loss) | |
| Income: | |
| Dividends (net of foreign taxes withheld of $11,303) | $ | 5,591,363 |
|
| Interest | 46,098 |
|
| Securities lending, net | 42,683 |
|
| | 5,680,144 |
|
| | |
| Expenses: | |
| Management fees | 2,186,793 |
|
| Distribution and service fees: | |
| A Class | 129,030 |
|
| C Class | 101,521 |
|
| R Class | 18,993 |
|
| Directors' fees and expenses | 8,877 |
|
| Other expenses | 751 |
|
| | 2,445,965 |
|
Fees waived(1) | (159,712 | ) |
| | 2,286,253 |
|
| | |
| Net investment income (loss) | 3,393,891 |
|
| | |
| Realized and Unrealized Gain (Loss) | |
| Net realized gain (loss) on: | |
| Investment transactions | 14,426,565 |
|
| Forward foreign currency exchange contract transactions | 156,017 |
|
| Foreign currency translation transactions | (264 | ) |
| | 14,582,318 |
|
| | |
| Change in net unrealized appreciation (depreciation) on: | |
| Investments | 26,878,280 |
|
| Forward foreign currency exchange contracts | (47,355 | ) |
| Translation of assets and liabilities in foreign currencies | 1,665 |
|
| | 26,832,590 |
|
| | |
| Net realized and unrealized gain (loss) | 41,414,908 |
|
| | |
| Net Increase (Decrease) in Net Assets Resulting from Operations | $ | 44,808,799 |
|
| |
| (1) | Amount consists of $53,320, $33,575, $15,229, $23,719, $4,623, $1,764, $592, $116 and $26,774 for Investor Class, I Class, Y Class, A Class, C Class, R Class, R5 Class, R6 Class and G Class, respectively. |
See Notes to Financial Statements.
|
|
| Statement of Changes in Net Assets |
|
| | | | | | |
| YEARS ENDED OCTOBER 31, 2019 AND OCTOBER 31, 2018 |
| Increase (Decrease) in Net Assets | October 31, 2019 | October 31, 2018 |
| Operations | | |
| Net investment income (loss) | $ | 3,393,891 |
| $ | 2,057,860 |
|
| Net realized gain (loss) | 14,582,318 |
| 17,602,302 |
|
| Change in net unrealized appreciation (depreciation) | 26,832,590 |
| (5,457,784 | ) |
| Net increase (decrease) in net assets resulting from operations | 44,808,799 |
| 14,202,378 |
|
| | | |
| Distributions to Shareholders | | |
| From earnings: | | |
| Investor Class | (9,479,446 | ) | (4,138,891 | ) |
| I Class | (2,679,164 | ) | (627,088 | ) |
| Y Class | (1,208,845 | ) | (28,973 | ) |
| A Class | (3,252,169 | ) | (1,361,649 | ) |
| C Class | (629,682 | ) | (397,922 | ) |
| R Class | (210,019 | ) | (96,581 | ) |
| R5 Class | (93,131 | ) | (570 | ) |
| Decrease in net assets from distributions | (17,552,456 | ) | (6,651,674 | ) |
| | | |
| Capital Share Transactions | | |
| Net increase (decrease) in net assets from capital share transactions (Note 5) | 558,177,061 |
| 25,688,488 |
|
| | | |
| Net increase (decrease) in net assets | 585,433,404 |
| 33,239,192 |
|
| | | |
| Net Assets | | |
| Beginning of period | 261,929,767 |
| 228,690,575 |
|
| End of period | $ | 847,363,171 |
| $ | 261,929,767 |
|
See Notes to Financial Statements.
|
|
Notes to Financial Statements |
OCTOBER 31, 2019
1. Organization
American Century Mutual Funds, Inc. (the corporation) is registered under the Investment Company Act of 1940, as amended (the 1940 Act), as an open-end management investment company and is organized as a Maryland corporation. Sustainable Equity Fund (the fund) is one fund in a series issued by the corporation. The fund’s investment objective is to seek long-term capital growth. Income is a secondary objective.
The fund offers the Investor Class, I Class, Y Class, A Class, C Class, R Class, R5 Class, R6 Class and G Class. The A Class may incur an initial sales charge. The A Class and C Class may be subject to a contingent deferred sales charge. Sale of the R6 Class and G Class commenced on April 1, 2019.
2. Significant Accounting Policies
The following is a summary of significant accounting policies consistently followed by the fund in preparation of its financial statements. The fund is an investment company and follows accounting and reporting guidance in accordance with accounting principles generally accepted in the United States of America. This may require management to make certain estimates and assumptions at the date of the financial statements. Actual results could differ from these estimates. Management evaluated the impact of events or transactions occurring through the date the financial statements were issued that would merit recognition or disclosure.
Investment Valuations — The fund determines the fair value of its investments and computes its net asset value per share at the close of regular trading (usually 4 p.m. Eastern time) on the New York Stock Exchange (NYSE) on each day the NYSE is open. The Board of Directors has adopted valuation policies and procedures to guide the investment advisor in the fund’s investment valuation process and to provide methodologies for the oversight of the fund’s pricing function.
Equity securities that are listed or traded on a domestic securities exchange are valued at the last reported sales price or at the official closing price as provided by the exchange. Equity securities traded on foreign securities exchanges are generally valued at the closing price of such securities on the exchange where primarily traded or at the close of the NYSE, if that is earlier. If no last sales price is reported, or if local convention or regulation so provides, the mean of the latest bid and asked prices may be used. Securities traded over-the-counter are valued at the mean of the latest bid and asked prices, the last sales price, or the official closing price. Equity securities initially expressed in local currencies are translated into U.S. dollars at the mean of the appropriate currency exchange rate at the close of the NYSE as provided by an independent pricing service.
Open-end management investment companies are valued at the reported net asset value per share. Repurchase agreements are valued at cost, which approximates fair value. Forward foreign currency exchange contracts are valued at the mean of the appropriate forward exchange rate at the close of the NYSE as provided by an independent pricing service.
If the fund determines that the market price for an investment is not readily available or the valuation methods mentioned above do not reflect an investment’s fair value, such investment is valued as determined in good faith by the Board of Directors or its delegate, in accordance with policies and procedures adopted by the Board of Directors. In its determination of fair value, the fund may review several factors including, but not limited to, market information regarding the specific investment or comparable investments and correlation with other investment types, futures indices or general market indicators. Circumstances that may cause the fund to use these procedures to value an investment include, but are not limited to: an investment has been declared in default or is distressed; trading in a security has been suspended during the trading day or a security is not actively trading on its principal exchange; prices received from a regular pricing source are deemed unreliable; or there is a foreign market holiday and no trading occurred.
The fund monitors for significant events occurring after the close of an investment’s primary exchange but before the fund’s net asset value per share is determined. Significant events may include, but are not limited to: corporate announcements and transactions; governmental action and political unrest that could impact a specific investment or an investment sector; or armed conflicts, natural disasters and similar events that could affect investments in a specific country or region. The fund also monitors for significant fluctuations between
domestic and foreign markets, as evidenced by the U.S. market or such other indicators that the Board of Directors, or its delegate, deems appropriate. The fund may apply a model-derived factor to the closing price of equity securities traded on foreign securities exchanges. The factor is based on observable market data as provided by an independent pricing service.
Security Transactions — Security transactions are accounted for as of the trade date. Net realized gains and losses are determined on the identified cost basis, which is also used for federal income tax purposes.
Investment Income — Dividend income less foreign taxes withheld, if any, is recorded as of the ex-dividend date. Distributions received on securities that represent a return of capital or long-term capital gain are recorded as a reduction of cost of investments and/or as a realized gain. The fund may estimate the components of distributions received that may be considered nontaxable distributions or long-term capital gain distributions for income tax purposes. Interest income is recorded on the accrual basis and includes accretion of discounts and amortization of premiums. Securities lending income is net of fees and rebates earned by the lending agent for its services.
Foreign Currency Translations — All assets and liabilities initially expressed in foreign currencies are translated into U.S. dollars at prevailing exchange rates at period end. The fund may enter into spot foreign currency exchange contracts to facilitate transactions denominated in a foreign currency. Purchases and sales of investment securities, dividend and interest income, spot foreign currency exchange contracts, and expenses are translated at the rates of exchange prevailing on the respective dates of such transactions. Net realized and unrealized foreign currency exchange gains or losses related to investment securities are a component of net realized gain (loss) on investment transactions and change in net unrealized appreciation (depreciation) on investments, respectively.
Repurchase Agreements — The fund may enter into repurchase agreements with institutions that American Century Investment Management, Inc. (ACIM) (the investment advisor) has determined are creditworthy pursuant to criteria adopted by the Board of Directors. The fund requires that the collateral, represented by securities, received in a repurchase transaction be transferred to the custodian in a manner sufficient to enable the fund to obtain those securities in the event of a default under the repurchase agreement. ACIM monitors, on a daily basis, the securities transferred to ensure the value, including accrued interest, of the securities under each repurchase agreement is equal to or greater than amounts owed to the fund under each repurchase agreement.
Joint Trading Account — Pursuant to an Exemptive Order issued by the Securities and Exchange Commission, the fund, along with certain other funds in the American Century Investments family of funds, may transfer uninvested cash balances into a joint trading account. These balances are invested in one or more repurchase agreements that are collateralized by U.S. Treasury or Agency obligations.
Segregated Assets — In accordance with the 1940 Act, the fund segregates assets on its books and records to cover certain types of investment securities and other financial instruments. ACIM monitors, on a daily basis, the securities segregated to ensure the fund designates a sufficient amount of liquid assets, marked-to-market daily. The fund may also receive assets or be required to pledge assets at the custodian bank or with a broker for collateral requirements.
Income Tax Status — It is the fund’s policy to distribute substantially all net investment income and net realized gains to shareholders and to otherwise qualify as a regulated investment company under provisions of the Internal Revenue Code. Accordingly, no provision has been made for income taxes. The fund files U.S. federal, state, local and non-U.S. tax returns as applicable. The fund's tax returns are subject to examination by the relevant taxing authority until expiration of the applicable statute of limitations, which is generally three years from the date of filing but can be longer in certain jurisdictions. At this time, management believes there are no uncertain tax positions which, based on their technical merit, would not be sustained upon examination and for which it is reasonably possible that the total amounts of unrecognized tax benefits will significantly change in the next twelve months.
Multiple Class — All shares of the fund represent an equal pro rata interest in the net assets of the class to which such shares belong, and have identical voting, dividend, liquidation and other rights and the same terms and conditions, except for class specific expenses and exclusive rights to vote on matters affecting only individual classes. Income, non-class specific expenses, and realized and unrealized capital gains and losses of the fund are allocated to each class of shares based on their relative net assets.
Distributions to Shareholders — Distributions from net investment income and net realized gains, if any, are generally declared and paid annually. The fund may elect to treat a portion of its payment to a redeeming shareholder, which represents the pro rata share of undistributed net investment income and net realized gains, as a distribution for federal income tax purposes (tax equalization).
Indemnifications — Under the corporation’s organizational documents, its officers and directors are indemnified against certain liabilities arising out of the performance of their duties to the fund. In addition, in the normal course of business, the fund enters into contracts that provide general indemnifications. The maximum exposure under these arrangements is unknown as this would involve future claims that may be made against a fund. The risk of material loss from such claims is considered by management to be remote.
Securities Lending — Securities are lent to qualified financial institutions and brokers. State Street Bank & Trust Co. serves as securities lending agent to the fund pursuant to a Securities Lending Agreement. The lending of securities exposes the fund to risks such as: the borrowers may fail to return the loaned securities, the borrowers may not be able to provide additional collateral, the fund may experience delays in recovery of the loaned securities or delays in access to collateral, or the fund may experience losses related to the investment collateral. To minimize certain risks, loan counterparties pledge collateral in the form of cash and/or securities. The lending agent has agreed to indemnify the fund in the case of default of any securities borrowed. Cash collateral received is invested in the State Street Navigator Securities Lending Government Money Market Portfolio, a money market mutual fund registered under the 1940 Act. The loans may also be secured by U.S. government securities in an amount at least equal to the market value of the securities loaned, plus accrued interest and dividends, determined on a daily basis and adjusted accordingly. By lending securities, the fund seeks to increase its net investment income through the receipt of interest and fees. Such income is reflected separately within the Statement of Operations. The value of loaned securities and related collateral outstanding at period end, if any, are shown on a gross basis within the Schedule of Investments and Statement of Assets and Liabilities.
The following table reflects a breakdown of transactions accounted for as secured borrowings, the gross obligation by the type of collateral pledged, and the remaining contractual maturity of those transactions as of October 31, 2019.
|
| | | | | | | | | | | | |
| Remaining Contractual Maturity of Agreements |
| | Overnight and
Continuous | <30 days | Between
30 & 90 days | >90 days | Total |
Securities Lending Transactions(1) | | | | |
| Common Stocks | $ | 388,211 |
| — |
| — |
| — |
| $ | 388,211 |
|
| Gross amount of recognized liabilities for securities lending transactions | $ | 388,211 |
|
| |
| (1) | Amount represents the payable for cash collateral received for securities on loan. This will generally be in the Overnight and Continuous column as the securities are typically callable on demand. |
3. Fees and Transactions with Related Parties
Certain officers and directors of the corporation are also officers and/or directors of American Century Companies, Inc. (ACC). The corporation’s investment advisor, ACIM, the corporation's distributor, American Century Investment Services, Inc. (ACIS), and the corporation’s transfer agent, American Century Services, LLC, are wholly owned, directly or indirectly, by ACC. Various funds issued by American Century Asset Allocation Portfolios, Inc. own, in aggregate, 60% of the shares of the fund. Related parties do not invest in the fund for the purpose of exercising management or control.
Management Fees — The corporation has entered into a management agreement with ACIM, under which ACIM provides the fund with investment advisory and management services in exchange for a single, unified management fee (the fee) per class. The agreement provides that all expenses of managing and operating the fund, except distribution and service fees, brokerage expenses, taxes, interest, fees and expenses of the independent directors (including legal counsel fees), and extraordinary expenses, will be paid by ACIM. The fee is computed and accrued daily based on each class's daily net assets and paid monthly in arrears. The difference in the fee among the classes is a result of their separate arrangements for non-Rule 12b-1 shareholder services. It is not the result of any difference in advisory or custodial fees or other expenses related to the management of the fund’s assets, which do not vary by class. The rate of the fee is determined by applying a fee rate calculation formula. This formula takes into account the fund’s assets as well as certain assets, if any, of other clients of the investment advisor outside the American Century Investments family of
funds (such as subadvised funds and separate accounts) that use very similar investment teams and strategies (strategy assets). Effective December 1, 2018, the investment advisor agreed to waive 0.05% of the fund's management fee. The investment advisor expects this waiver to continue until July 31, 2020 and cannot terminate it prior to such date without the approval of the Board of Directors. Effective April 1, 2019, the investment advisor agreed to waive the G Class's management fee in its entirety. The investment advisor expects this waiver to remain in effect permanently and cannot terminate it without the approval of the Board of Directors.
The management fee schedule range and the effective annual management fee before and after waiver for each class for the period ended October 31, 2019 are as follows:
|
| | | |
| | | Effective Annual Management Fee |
| | Management Fee Schedule Range | Before Waiver | After Waiver |
| Investor Class | 0.800% to 0.840% | 0.84% | 0.80% |
| I Class | 0.600% to 0.640% | 0.64% | 0.60% |
| Y Class | 0.450% to 0.490% | 0.49% | 0.45% |
| A Class | 0.800% to 0.840% | 0.84% | 0.80% |
| C Class | 0.800% to 0.840% | 0.84% | 0.80% |
| R Class | 0.800% to 0.840% | 0.84% | 0.80% |
| R5 Class | 0.600% to 0.640% | 0.64% | 0.60% |
| R6 Class | 0.450% to 0.490% | 0.49% | 0.44% |
| G Class | 0.450% to 0.490% | 0.49% | 0.00% |
Distribution and Service Fees — The Board of Directors has adopted a separate Master Distribution and Individual Shareholder Services Plan for each of the A Class, C Class and R Class (collectively the plans), pursuant to Rule 12b-1 of the 1940 Act. The plans provide that the A Class will pay ACIS an annual distribution and service fee of 0.25%. The plans provide that the C Class will pay ACIS an annual distribution and service fee of 1.00%, of which 0.25% is paid for individual shareholder services and 0.75% is paid for distribution services. The plans provide that the R Class will pay ACIS an annual distribution and service fee of 0.50%. The fees are computed and accrued daily based on each class’s daily net assets and paid monthly in arrears. The fees are used to pay financial intermediaries for distribution and individual shareholder services. Fees incurred under the plans during the period ended October 31, 2019 are detailed in the Statement of Operations.
Directors' Fees and Expenses — The Board of Directors is responsible for overseeing the investment advisor’s management and operations of the fund. The directors receive detailed information about the fund and its investment advisor regularly throughout the year, and meet at least quarterly with management of the investment advisor to review reports about fund operations. The fund’s officers do not receive compensation from the fund.
Interfund Transactions — The fund may enter into security transactions with other American Century Investments funds and other client accounts of the investment advisor, in accordance with the 1940 Act rules and procedures adopted by the Board of Directors. The rules and procedures require, among other things, that these transactions be effected at the independent current market price of the security. During the period, the interfund purchases and sales were $2,843,798 and $125,552, respectively. The effect of interfund transactions on the Statement of Operations was $(49,060) in net realized gain (loss) on investment transactions.
4. Investment Transactions
Purchases and sales of investment securities, excluding short-term investments and in kind transactions, for the period ended October 31, 2019 were $186,430,180 and $107,779,620, respectively.
On October 25,2019, the fund incurred a purchase in kind of equity securities valued at $463,933,307. A purchase in kind occurs when a fund receives securities into its portfolio in lieu of cash as payment from a purchasing shareholder.
5. Capital Share Transactions
Transactions in shares of the fund were as follows:
|
| | | | | | | | | | |
| | Year ended
October 31, 2019(1) | Year ended
October 31, 2018 |
| | Shares | Amount | Shares | Amount |
| Investor Class/Shares Authorized | 230,000,000 |
| | 120,000,000 |
| |
| Sold | 1,478,661 |
| $ | 42,448,717 |
| 1,839,519 |
| $ | 52,400,317 |
|
| Issued in reinvestment of distributions | 373,564 |
| 9,230,761 |
| 145,487 |
| 4,040,187 |
|
| Redeemed | (3,033,709 | ) | (85,434,146 | ) | (1,885,394 | ) | (53,831,697 | ) |
| | (1,181,484 | ) | (33,754,668 | ) | 99,612 |
| 2,608,807 |
|
| I Class/Shares Authorized | 50,000,000 |
| | 20,000,000 |
| |
| Sold | 2,840,717 |
| 80,856,818 |
| 938,951 |
| 27,234,141 |
|
| Issued in reinvestment of distributions | 88,125 |
| 2,181,089 |
| 14,999 |
| 416,960 |
|
| Redeemed | (795,266 | ) | (22,113,079 | ) | (327,636 | ) | (9,499,178 | ) |
| | 2,133,576 |
| 60,924,828 |
| 626,314 |
| 18,151,923 |
|
| Y Class/Shares Authorized | 30,000,000 |
| | 50,000,000 |
| |
| Sold | 1,298,628 |
| 36,812,959 |
| 511,054 |
| 14,904,015 |
|
| Issued in reinvestment of distributions | 48,822 |
| 1,208,845 |
| 1,041 |
| 28,973 |
|
| Redeemed | (188,570 | ) | (5,485,398 | ) | (14,718 | ) | (430,894 | ) |
| | 1,158,880 |
| 32,536,406 |
| 497,377 |
| 14,502,094 |
|
| A Class/Shares Authorized | 50,000,000 |
| | 120,000,000 |
| |
| Sold | 279,004 |
| 7,723,840 |
| 412,006 |
| 11,852,292 |
|
| Issued in reinvestment of distributions | 113,811 |
| 2,808,849 |
| 43,386 |
| 1,203,083 |
|
| Redeemed | (398,221 | ) | (11,099,073 | ) | (552,597 | ) | (15,648,311 | ) |
| | (5,406 | ) | (566,384 | ) | (97,205 | ) | (2,592,936 | ) |
| C Class/Shares Authorized | 30,000,000 |
| | 40,000,000 |
| |
| Sold | 71,758 |
| 1,908,443 |
| 48,877 |
| 1,380,898 |
|
| Issued in reinvestment of distributions | 22,210 |
| 538,156 |
| 12,705 |
| 346,977 |
|
| Redeemed | (160,965 | ) | (4,368,416 | ) | (323,643 | ) | (9,172,601 | ) |
| | (66,997 | ) | (1,921,817 | ) | (262,061 | ) | (7,444,726 | ) |
| R Class/Shares Authorized | 30,000,000 |
| | 20,000,000 |
| |
| Sold | 65,244 |
| 1,825,976 |
| 43,553 |
| 1,246,911 |
|
| Issued in reinvestment of distributions | 8,544 |
| 210,019 |
| 3,496 |
| 96,581 |
|
| Redeemed | (40,894 | ) | (1,140,492 | ) | (76,607 | ) | (2,216,651 | ) |
| | 32,894 |
| 895,503 |
| (29,558 | ) | (873,159 | ) |
| R5 Class/Shares Authorized | 30,000,000 |
| | 50,000,000 |
| |
| Sold | 3,133 |
| 89,963 |
| 48,846 |
| 1,380,860 |
|
| Issued in reinvestment of distributions | 3,761 |
| 93,131 |
| 20 |
| 570 |
|
| Redeemed | (11,350 | ) | (311,587 | ) | (1,559 | ) | (44,945 | ) |
| | (4,456 | ) | (128,493 | ) | 47,307 |
| 1,336,485 |
|
| R6 Class/Shares Authorized | 50,000,000 |
| | N/A |
| |
| Sold | 154,326 |
| 4,599,937 |
| | |
| Redeemed | (24,135 | ) | (733,659 | ) | | |
| | 130,191 |
| 3,866,278 |
| | |
| G Class/Shares Authorized | 525,000,000 |
| | N/A |
| |
| Sold | 16,265,238 |
| 496,972,039 |
| | |
| Redeemed | (21,881 | ) | (646,631 | ) | | |
| | 16,243,357 |
| 496,325,408 |
| | |
| Net increase (decrease) | 18,440,555 |
| $ | 558,177,061 |
| 881,786 |
| $ | 25,688,488 |
|
| |
| (1) | April 1, 2019 (commencement of sale) through October 31, 2019 for the R6 Class and G Class. |
6. Fair Value Measurements
The fund’s investments valuation process is based on several considerations and may use multiple inputs to determine the fair value of the investments held by the fund. In conformity with accounting principles generally accepted in the United States of America, the inputs used to determine a valuation are classified into three broad levels.
| |
| • | Level 1 valuation inputs consist of unadjusted quoted prices in an active market for identical investments. |
| |
| • | Level 2 valuation inputs consist of direct or indirect observable market data (including quoted prices for comparable investments, evaluations of subsequent market events, interest rates, prepayment speeds, credit risk, etc.). These inputs also consist of quoted prices for identical investments initially expressed in local currencies that are adjusted through translation into U.S. dollars. |
| |
| • | Level 3 valuation inputs consist of unobservable data (including a fund’s own assumptions). |
The level classification is based on the lowest level input that is significant to the fair valuation measurement. The valuation inputs are not necessarily an indication of the risks associated with investing in these securities or other financial instruments.
The following is a summary of the level classifications as of period end. The Schedule of Investments provides additional information on the fund’s portfolio holdings.
|
| | | | | | | | |
| | Level 1 | Level 2 | Level 3 |
| Assets | | | |
| Investment Securities | | | |
| Common Stocks | $ | 829,329,261 |
| $ | 13,691,314 |
| — |
|
| Temporary Cash Investments | 15,608 |
| 47,122,094 |
| — |
|
| Temporary Cash Investments - Securities Lending Collateral | 388,211 |
| — |
| — |
|
| | $ | 829,733,080 |
| $ | 60,813,408 |
| — |
|
| Other Financial Instruments | | | |
| Forward Foreign Currency Exchange Contracts | — |
| $ | 9,693 |
| — |
|
| | | | |
| Liabilities | | | |
| Other Financial Instruments | | | |
| Forward Foreign Currency Exchange Contracts | — |
| $ | 37,220 |
| — |
|
7. Derivative Instruments
Foreign Currency Risk — The fund is subject to foreign currency exchange rate risk in the normal course of pursuing its investment objectives. The value of foreign investments held by a fund may be significantly affected by changes in foreign currency exchange rates. The dollar value of a foreign security generally decreases when the value of the dollar rises against the foreign currency in which the security is denominated and tends to increase when the value of the dollar declines against such foreign currency. A fund may enter into forward foreign currency exchange contracts to reduce a fund's exposure to foreign currency exchange rate fluctuations. The net U.S. dollar value of foreign currency underlying all contractual commitments held by a fund and the resulting unrealized appreciation or depreciation are determined daily. Realized gain or loss is recorded upon the termination of the contract. Net realized and unrealized gains or losses occurring during the holding period of forward foreign currency exchange contracts are a component of net realized gain (loss) on forward foreign currency exchange contract transactions and change in net unrealized appreciation (depreciation) on forward foreign currency exchange contracts, respectively. A fund bears the risk of an unfavorable change in the foreign currency exchange rate underlying the forward contract. Additionally, losses, up to the fair value, may arise if the counterparties do not perform under the contract terms. The fund's average U.S. dollar exposure to foreign currency risk derivative instruments held during the period was $3,222,644.
The value of foreign currency risk derivative instruments as of October 31, 2019, is disclosed on the Statement of Assets and Liabilities as an asset of $9,693 in unrealized appreciation on forward foreign currency exchange contracts and a liability of $37,220 in unrealized depreciation on forward foreign currency exchange contracts. For the year ended October 31, 2019, the effect of foreign currency risk derivative instruments on the Statement of Operations was $156,017 in net realized gain (loss) on forward foreign currency exchange contract transactions and $(47,355) in change in net unrealized appreciation (depreciation) on forward foreign currency exchange contracts.
8. Federal Tax Information
The tax character of distributions paid during the years ended October 31, 2019 and October 31, 2018 were as follows:
|
| | | | | | |
| | 2019 | 2018 |
| Distributions Paid From | | |
| Ordinary income | $ | 2,630,877 |
| $ | 1,472,981 |
|
| Long-term capital gains | $ | 14,921,579 |
| $ | 5,178,693 |
|
The book-basis character of distributions made during the year from net investment income or net realized gains may differ from their ultimate characterization for federal income tax purposes. These differences reflect the differing character of certain income items and net realized gains and losses for financial statement and tax purposes, and may result in reclassification among certain capital accounts on the financial statements.
As of period end, the federal tax cost of investments and the components of distributable earnings on a tax-basis were as follows:
|
| | | |
| Federal tax cost of investments | $ | 802,186,969 |
|
| Gross tax appreciation of investments | $ | 92,306,910 |
|
| Gross tax depreciation of investments | (3,947,391 | ) |
| Net tax appreciation (depreciation) of investments | 88,359,519 |
|
Net tax appreciation (depreciation) on derivatives and translation of assets and liabilities in foreign currencies | 1,665 |
|
| Net tax appreciation (depreciation) | $ | 88,361,184 |
|
| Undistributed ordinary income | $ | 2,482,035 |
|
| Accumulated long-term gains | $ | 12,251,552 |
|
The difference between book-basis and tax-basis unrealized appreciation (depreciation) is attributable primarily to the tax deferral of losses on wash sales.
|
| | | | | | | | | | | | | | | | | |
| For a Share Outstanding Throughout the Years Ended October 31 (except as noted) | | | | |
| Per-Share Data | | | | | | | | | Ratios and Supplemental Data |
| | | Income From Investment Operations: | Distributions From: | | | Ratio to Average Net Assets of: | | |
| | Net Asset
Value,
Beginning
of Period | Net
Investment
Income
(Loss)(1) | Net
Realized
and
Unrealized
Gain (Loss) | Total From
Investment
Operations | Net
Investment
Income | Net
Realized
Gains | Total
Distributions | Net Asset
Value,
End
of Period | Total
Return(2) | Operating
Expenses | Operating
Expenses
(before
expense
waiver) | Net
Investment
Income
(Loss) | Net
Investment
Income
(Loss)
(before
expense
waiver) | Portfolio
Turnover
Rate | Net
Assets,
End of
Period
(in thousands) |
| Investor Class | | | | | | | | | | | | | | |
| 2019 | $28.19 | 0.33 | 3.77 | 4.10 | (0.22) | (1.67) | (1.89) | $30.40 | 16.10% | 0.80% | 0.84% | 1.14% | 1.10% | 33% |
| $118,225 |
|
| 2018 | $27.22 | 0.26 | 1.52 | 1.78 | (0.20) | (0.61) | (0.81) | $28.19 | 6.60% | 0.95% | 0.95% | 0.91% | 0.91% | 41% |
| $142,923 |
|
| 2017 | $21.75 | 0.23 | 5.51 | 5.74 | (0.27) | — | (0.27) | $27.22 | 26.61% | 1.00% | 1.00% | 0.95% | 0.95% | 18% |
| $135,315 |
|
| 2016 | $21.77 | 0.25 | (0.04) | 0.21 | (0.23) | — | (0.23) | $21.75 | 0.99% | 0.99% | 0.99% | 1.18% | 1.18% | 71% |
| $87,865 |
|
| 2015 | $21.31 | 0.26 | 0.46 | 0.72 | (0.26) | — | (0.26) | $21.77 | 3.51% | 0.99% | 0.99% | 1.23% | 1.23% | 33% |
| $95,072 |
|
| I Class | | | | | | | | | | | | | |
| 2019 | $28.27 | 0.37 | 3.81 | 4.18 | (0.28) | (1.67) | (1.95) | $30.50 | 16.37% | 0.60% | 0.64% | 1.34% | 1.30% | 33% |
| $106,268 |
|
| 2018 | $27.30 | 0.33 | 1.51 | 1.84 | (0.26) | (0.61) | (0.87) | $28.27 | 6.80% | 0.75% | 0.75% | 1.11% | 1.11% | 41% |
| $38,188 |
|
| 2017 | $21.81 | 0.27 | 5.53 | 5.80 | (0.31) | — | (0.31) | $27.30 | 26.88% | 0.80% | 0.80% | 1.15% | 1.15% | 18% |
| $19,776 |
|
| 2016 | $21.84 | 0.29 | (0.05) | 0.24 | (0.27) | — | (0.27) | $21.81 | 1.19% | 0.79% | 0.79% | 1.38% | 1.38% | 71% |
| $5,637 |
|
| 2015 | $21.37 | 0.31 | 0.47 | 0.78 | (0.31) | — | (0.31) | $21.84 | 3.66% | 0.79% | 0.79% | 1.43% | 1.43% | 33% |
| $14,077 |
|
| Y Class | | | | | | | | | | | | | |
| 2019 | $28.32 | 0.41 | 3.82 | 4.23 | (0.32) | (1.67) | (1.99) | $30.56 | 16.56% | 0.45% | 0.49% | 1.49% | 1.45% | 33% |
| $51,037 |
|
| 2018 | $27.33 | 0.36 | 1.52 | 1.88 | (0.28) | (0.61) | (0.89) | $28.32 | 6.93% | 0.60% | 0.60% | 1.26% | 1.26% | 41% |
| $14,485 |
|
2017(3) | $23.89 | 0.16 | 3.28 | 3.44 | — | — | — | $27.33 | 14.40% | 0.65%(4) | 0.65%(4) | 1.10%(4) | 1.10%(4) | 18%(5) |
| $383 |
|
|
| | | | | | | | | | | | | | | | | |
| For a Share Outstanding Throughout the Years Ended October 31 (except as noted) | | | | |
| Per-Share Data | | | | | | | | | Ratios and Supplemental Data |
| | | Income From Investment Operations: | Distributions From: | | | Ratio to Average Net Assets of: | | |
| | Net Asset
Value,
Beginning
of Period | Net
Investment
Income
(Loss)(1) | Net
Realized
and
Unrealized
Gain (Loss) | Total From
Investment
Operations | Net
Investment
Income | Net
Realized
Gains | Total
Distributions | Net Asset
Value,
End
of Period | Total
Return(2) | Operating
Expenses | Operating
Expenses
(before
expense
waiver) | Net
Investment
Income
(Loss) | Net
Investment
Income
(Loss)
(before
expense
waiver) | Portfolio
Turnover
Rate | Net
Assets,
End of
Period
(in thousands) |
| A Class | | | | | | | | | | | | | | |
| 2019 | $28.09 | 0.25 | 3.78 | 4.03 | (0.16) | (1.67) | (1.83) | $30.29 | 15.81% | 1.05% | 1.09% | 0.89% | 0.85% | 33% |
| $54,290 |
|
| 2018 | $27.13 | 0.19 | 1.51 | 1.70 | (0.13) | (0.61) | (0.74) | $28.09 | 6.31% | 1.20% | 1.20% | 0.66% | 0.66% | 41% |
| $50,489 |
|
| 2017 | $21.67 | 0.17 | 5.50 | 5.67 | (0.21) | — | (0.21) | $27.13 | 26.34% | 1.25% | 1.25% | 0.70% | 0.70% | 18% |
| $51,396 |
|
| 2016 | $21.69 | 0.20 | (0.05) | 0.15 | (0.17) | — | (0.17) | $21.67 | 0.74% | 1.24% | 1.24% | 0.93% | 0.93% | 71% |
| $97,012 |
|
| 2015 | $21.23 | 0.21 | 0.46 | 0.67 | (0.21) | — | (0.21) | $21.69 | 3.21% | 1.24% | 1.24% | 0.98% | 0.98% | 33% |
| $122,492 |
|
| C Class | | | | | | | | |
| 2019 | $27.48 | 0.04 | 3.71 | 3.75 | — | (1.67) | (1.67) | $29.56 | 14.98% | 1.80% | 1.84% | 0.14% | 0.10% | 33% |
| $10,149 |
|
| 2018 | $26.63 | (0.03) | 1.49 | 1.46 | — | (0.61) | (0.61) | $27.48 | 5.51% | 1.95% | 1.95% | (0.09)% | (0.09)% | 41% |
| $11,277 |
|
| 2017 | $21.27 | (0.01) | 5.41 | 5.40 | (0.04) | — | (0.04) | $26.63 | 25.40% | 2.00% | 2.00% | (0.05)% | (0.05)% | 18% |
| $17,904 |
|
| 2016 | $21.29 | 0.04 | (0.04) | —(6) | (0.02) | — | (0.02) | $21.27 | (0.02)% | 1.99% | 1.99% | 0.18% | 0.18% | 71% |
| $18,640 |
|
| 2015 | $20.84 | 0.05 | 0.45 | 0.50 | (0.05) | — | (0.05) | $21.29 | 2.42% | 1.99% | 1.99% | 0.23% | 0.23% | 33% |
| $21,036 |
|
| R Class | | | | | | | | |
| 2019 | $27.93 | 0.18 | 3.77 | 3.95 | (0.09) | (1.67) | (1.76) | $30.12 | 15.56% | 1.30% | 1.34% | 0.64% | 0.60% | 33% |
| $4,466 |
|
| 2018 | $26.98 | 0.11 | 1.51 | 1.62 | (0.06) | (0.61) | (0.67) | $27.93 | 6.04% | 1.45% | 1.45% | 0.41% | 0.41% | 41% |
| $3,223 |
|
| 2017 | $21.55 | 0.11 | 5.47 | 5.58 | (0.15) | — | (0.15) | $26.98 | 26.03% | 1.50% | 1.50% | 0.45% | 0.45% | 18% |
| $3,910 |
|
| 2016 | $21.58 | 0.14 | (0.05) | 0.09 | (0.12) | — | (0.12) | $21.55 | 0.44% | 1.49% | 1.49% | 0.68% | 0.68% | 71% |
| $4,090 |
|
| 2015 | $21.11 | 0.16 | 0.47 | 0.63 | (0.16) | — | (0.16) | $21.58 | 3.01% | 1.49% | 1.49% | 0.73% | 0.73% | 33% |
| $5,680 |
|
|
| | | | | | | | | | | | | | | | | |
| For a Share Outstanding Throughout the Years Ended October 31 (except as noted) | | | | |
| Per-Share Data | | | | | | | | | Ratios and Supplemental Data |
| | | Income From Investment Operations: | Distributions From: | | | Ratio to Average Net Assets of: | | |
| | Net Asset
Value,
Beginning
of Period | Net
Investment
Income
(Loss)(1) | Net
Realized
and
Unrealized
Gain (Loss) | Total From
Investment
Operations | Net
Investment
Income | Net
Realized
Gains | Total
Distributions | Net Asset
Value,
End
of Period | Total
Return(2) | Operating
Expenses | Operating
Expenses
(before
expense
waiver) | Net
Investment
Income
(Loss) | Net
Investment
Income
(Loss)
(before
expense
waiver) | Portfolio
Turnover
Rate | Net
Assets,
End of
Period
(in thousands) |
| R5 Class | | | | | | | | |
| 2019 | $28.29 | 0.38 | 3.80 | 4.18 | (0.28) | (1.67) | (1.95) | $30.52 | 16.36% | 0.60% | 0.64% | 1.34% | 1.30% | 33% |
| $1,314 |
|
| 2018 | $27.30 | 0.32 | 1.52 | 1.84 | (0.24) | (0.61) | (0.85) | $28.29 | 6.82% | 0.75% | 0.75% | 1.11% | 1.11% | 41% |
| $1,344 |
|
2017(3) | $23.89 | 0.15 | 3.26 | 3.41 | — | — | — | $27.30 | 14.27% | 0.80%(4) | 0.80%(4) | 1.07%(4) | 1.07%(4) | 18%(5) |
| $6 |
|
| R6 Class | | | | | | | | |
2019(7) | $28.05 | 0.21 | 2.30 | 2.51 | — | — | — | $30.56 | 8.95% | 0.44%(4) | 0.49%(4) | 1.18%(4) | 1.13%(4) | 33%(8) |
| $3,979 |
|
| G Class | | | | | | | | |
2019(7) | $28.05 | 0.37 | 2.22 | 2.59 | — | — | — | $30.64 | 9.23% | 0.00%(4)(9) | 0.49%(4) | 2.04%(4) | 1.55%(4) | 33%(8) |
| $497,635 |
|
|
|
| Notes to Financial Highlights |
| |
| (1) | Computed using average shares outstanding throughout the period. |
| |
| (2) | Total returns are calculated based on the net asset value of the last business day and do not reflect applicable sales charges, if any. Total returns for periods less than one year are not annualized. |
| |
| (3) | April 10, 2017 (commencement of sale) through October 31, 2017. |
| |
| (5) | Portfolio turnover is calculated at the fund level. Percentage indicated was calculated for the year ended October 31, 2017. |
| |
| (6) | Per-share amount was less than $0.005. |
| |
| (7) | April 1, 2019 (commencement of sale) through October 31, 2019. |
| |
| (8) | Portfolio turnover is calculated at the fund level. Percentage indicated was calculated for the year ended October 31, 2019. |
| |
| (9) | Ratio was less than 0.005%. |
See Notes to Financial Statements.
|
|
| Report of Independent Registered Public Accounting Firm |
To the Shareholders and the Board of Directors of American Century Mutual Funds, Inc.:
Opinion on the Financial Statements and Financial Highlights
We have audited the accompanying statement of assets and liabilities, including the schedule of investments, of Sustainable Equity Fund, one of the funds constituting the American Century Mutual Funds, Inc. (the "Fund"), as of October 31, 2019, the related statement of operations for the year then ended, the statements of changes in net assets for each of the two years in the period then ended, the financial highlights for each of the five years in the period then ended, and the related notes. In our opinion, the financial statements and financial highlights present fairly, in all material respects, the financial position of Sustainable Equity Fund of the American Century Mutual Funds, Inc. as of October 31, 2019, the results of its operations for the year then ended, the changes in its net assets for each of the two years in the period then ended, and the financial highlights for each of the five years in the period then ended, in conformity with accounting principles generally accepted in the United States of America.
Basis for Opinion
These financial statements and financial highlights are the responsibility of the Fund's management. Our responsibility is to express an opinion on the Fund’s financial statements and financial highlights based on our audits. We are a public accounting firm registered with the Public Company Accounting Oversight Board (United States) (PCAOB) and are required to be independent with respect to the Fund in accordance with the U.S. federal securities laws and the applicable rules and regulations of the Securities and Exchange Commission and the PCAOB.
We conducted our audits in accordance with the standards of the PCAOB. Those standards require that we plan and perform the audit to obtain reasonable assurance about whether the financial statements and financial highlights are free of material misstatement, whether due to error or fraud. The Fund is not required to have, nor were we engaged to perform, an audit of its internal control over financial reporting. As part of our audits we are required to obtain an understanding of internal control over financial reporting but not for the purpose of expressing an opinion on the effectiveness of the Fund’s internal control over financial reporting. Accordingly, we express no such opinion.
Our audits included performing procedures to assess the risks of material misstatement of the financial statements and financial highlights, whether due to error or fraud, and performing procedures that respond to those risks. Such procedures included examining, on a test basis, evidence regarding the amounts and disclosures in the financial statements and financial highlights. Our audits also included evaluating the accounting principles used and significant estimates made by management, as well as evaluating the overall presentation of the financial statements and financial highlights. Our procedures included confirmation of securities owned as of October 31, 2019, by correspondence with the custodian and brokers; when replies were not received from brokers, we performed other auditing procedures. We believe that our audits provide a reasonable basis for our opinion.
DELOITTE & TOUCHE LLP
Kansas City, Missouri
December 16, 2019
We have served as the auditor of one or more American Century investment companies since 1997.
The Board of Directors
The individuals listed below serve as directors of the funds. Each director will continue to serve in this capacity until death, retirement, resignation or removal from office. The board has adopted a mandatory retirement age for directors who are not “interested persons,” as that term is defined in the Investment Company Act (independent directors). Independent directors shall retire by December 31 of the year in which they reach their 75th birthday.
Mr. Thomas is an “interested person” because he currently serves as President and Chief Executive Officer of American Century Companies, Inc. (ACC), the parent company of American Century Investment Management, Inc. (ACIM or the advisor). The other directors (more than three-fourths of the total number) are independent. They are not employees, directors or officers of, and have no financial interest in, ACC or any of its wholly owned, direct or indirect, subsidiaries, including ACIM, American Century Investment Services, Inc. (ACIS) and American Century Services, LLC (ACS), and they do not have any other affiliations, positions or relationships that would cause them to be considered “interested persons” under the Investment Company Act. The directors serve in this capacity for seven (in the case of Jonathan S. Thomas, 16; and Stephen E. Yates, 8) registered investment companies in the American Century Investments family of funds.
The following table presents additional information about the directors. The mailing address for each director is 4500 Main Street, Kansas City, Missouri 64111.
|
| | | | | |
Name
(Year of Birth) | Position(s) Held with Funds | Length of Time Served | Principal Occupation(s) During Past 5 Years | Number of American Century Portfolios Overseen by Director | Other Directorships Held During Past 5 Years |
| Independent Directors |
|
|
| Thomas W. Bunn (1953) | Director | Since 2017 | Retired | 66 | SquareTwo Financial; Barings (formerly Babson Capital Funds Trust) (2013 to 2016) |
Chris H. Cheesman
(1962)
| Director | Since 2019
| Retired. Senior Vice President & Chief Audit Executive, AllianceBernstein (1999 to 2018)
| 66 | None |
Barry Fink
(1955) | Director | Since 2012 (independent since 2016) | Retired | 66 | None |
Rajesh K. Gupta
(1960)
| Director | Since 2019
| Partner Emeritus, SeaCrest Investment Management and SeaCrest Wealth Management (2019 to Present); Chief Executive Officer and Chief Investment Officer, SeaCrest Investment Management (2006 to 2019); Chief Executive Officer and Chief Investment Officer, SeaCrest Wealth Management (2008 to 2019)
| 66 | None |
|
| | | | | |
Name
(Year of Birth) | Position(s) Held with Funds | Length of Time Served | Principal Occupation(s) During Past 5 Years | Number of American Century Portfolios Overseen by Director | Other Directorships Held During Past 5 Years |
| Independent Directors |
|
|
Lynn Jenkins
(1963)
| Director | Since 2019
| United States Representative, U.S. House of Representatives (2009 to 2018) | 66 | MGP Ingredients, Inc. |
Jan M. Lewis
(1957) | Director | Since 2011 | Retired | 66 | None |
John R. Whitten
(1946) | Director | Since 2008 | Retired | 66 | Onto Innovation Inc.; Rudolph Technologies, Inc. (2006 to 2019) |
Stephen E. Yates
(1948) | Director and Chairman of the Board | Since 2012 (Chairman since 2018) | Retired | 81 | None |
| Interested Director |
|
Jonathan S. Thomas
(1963) | Director | Since 2007 | President and Chief Executive Officer, ACC (2007 to present). Also serves as Chief Executive Officer, ACS; Executive Vice President, ACIM; Director, ACC, ACIM and other ACC subsidiaries | 125 | BioMed Valley Discoveries, Inc. |
The Statement of Additional Information has additional information about the fund's directors and is available without charge, upon request, by calling 1-800-345-2021.
Officers
The following table presents certain information about the executive officers of the funds. Each officer serves as an officer for each of the 16 (in the case of Robert J. Leach, 15) investment companies in the American Century family of funds. No officer is compensated for his or her service as an officer of the funds. The listed officers are interested persons of the funds and are appointed or re-appointed on an annual basis. The mailing address for each officer listed below is 4500 Main Street, Kansas City, Missouri 64111.
|
| | |
Name
(Year of Birth) | Offices with the Funds | Principal Occupation(s) During the Past Five Years |
Patrick Bannigan
(1965) | President since 2019 | Executive Vice President and Director, ACC (2012 to present); Chief Financial Officer, Chief Accounting Officer and Treasurer, ACC (2015 to present); Chief Operating Officer, ACC (2012-2015). Also serves as President, ACS; Vice President, ACIM; Chief Financial Officer, Chief Accounting Officer and/or Director, ACIM, ACS and other ACC subsidiaries |
R. Wes Campbell
(1974) | Chief Financial Officer and Treasurer since 2018 | Investment Operations and Investment Accounting, ACS (2000 to present) |
Amy D. Shelton
(1964) | Chief Compliance Officer and Vice President since 2014 | Chief Compliance Officer, American Century funds, (2014 to present); Chief Compliance Officer, ACIM (2014 to present); Chief Compliance Officer, ACIS (2009 to present). Also serves as Vice President, ACIS |
Charles A. Etherington
(1957) | General Counsel since 2007 and Senior Vice President since 2006 | Attorney, ACC (1994 to present); Vice President, ACC (2005 to present); General Counsel, ACC (2007 to present). Also serves as General Counsel, ACIM, ACS, ACIS and other ACC subsidiaries; and Senior Vice President, ACIM and ACS |
C. Jean Wade
(1964) | Vice President since 2012 | Senior Vice President, ACS (2017 to present); Vice President, ACS (2000 to 2017)
|
Robert J. Leach
(1966) | Vice President since 2006 | Vice President, ACS (2000 to present) |
David H. Reinmiller
(1963) | Vice President since 2000 | Attorney, ACC (1994 to present). Also serves as Vice President, ACIM and ACS |
Ward D. Stauffer
(1960) | Secretary since 2005 | Attorney, ACC (2003 to present) |
|
|
| Approval of Management Agreement |
At a meeting held on June 26, 2019, the Fund’s Board of Directors (the "Board") unanimously approved the renewal of the management agreement pursuant to which American Century Investment Management, Inc. (the “Advisor”) acts as the investment advisor for the Fund. Under Section 15(c) of the Investment Company Act, contracts for investment advisory services are required to be reviewed, evaluated, and approved by a majority of a fund’s directors (the “Directors”), including a majority of the independent Directors, each year.
Prior to its consideration of the renewal of the management agreement, the Directors requested and reviewed extensive data and information compiled by the Advisor and certain independent providers of evaluation data concerning the Fund and the services provided to the Fund by the Advisor. This review was in addition to the oversight and evaluation undertaken by the Board and its committees on a continual basis and the information received was supplemental to the extensive information that the Board and its committees receive and consider throughout the year.
In connection with its consideration of the renewal of the management agreement, the Board’s review and evaluation of the services provided by the Advisor included, but was not limited to, the following:
| |
| • | the nature, extent, and quality of investment management, shareholder services, and other services provided and to be provided to the Fund; |
| |
| • | the wide range of other programs and services provided and to be provided to the Fund and its shareholders on a routine and non-routine basis; |
| |
| • | the investment performance of the Fund, including data comparing the Fund's performance to appropriate benchmarks and/or a peer group of other mutual funds with similar investment objectives and strategies; |
| |
| • | the cost of owning the Fund compared to the cost of owning similar funds; |
| |
| • | the compliance policies, procedures, and regulatory experience of the Advisor and the Fund's service providers; |
| |
| • | financial data showing the cost of services provided to the Fund, the profitability of the Fund to the Advisor, and the overall profitability of the Advisor; |
| |
| • | strategic plans of the Advisor; |
| |
| • | any economies of scale associated with the Advisor’s management of the Fund and other accounts; |
| |
| • | services provided and charges to the Advisor's other investment management clients; |
| |
| • | acquired fund fees and expenses; |
| |
| • | payments and practices in connection with financial intermediaries holding shares of the Fund and the services provided by intermediaries in connection therewith; and |
| |
| • | any collateral benefits derived by the Advisor from the management of the Fund. |
The Directors held three in-person meetings and one telephonic meeting to review and discuss the information provided. The independent Directors also reviewed responses to supplemental information requests provided by the Directors to the Advisor and held active discussions with the Advisor regarding the renewal of the management agreement. The independent Directors had the benefit of the advice of their independent counsel throughout the process.
Factors Considered
The Directors considered all of the information provided by the Advisor, the independent data providers, and independent counsel in connection with the approval. They determined that the information was sufficient for them to evaluate the management agreement for the Fund. In connection with their review, the Directors did not identify any single factor as being all-important or
controlling, and each Director may have attributed different levels of importance to different factors. In deciding to renew the management agreement, the Board based its decision on a number of factors, including without limitation the following:
Nature, Extent and Quality of Services — Generally. Under the management agreement, the Advisor is responsible for providing or arranging for all services necessary for the operation of the Fund. The Board noted that the Advisor provides or arranges at its own expense a wide variety of services including without limitation the following:
| |
| • | portfolio research and security selection |
| |
| • | daily valuation of the Fund’s portfolio |
| |
| • | shareholder servicing and transfer agency, including shareholder confirmations, recordkeeping, and communications |
| |
| • | legal services (except the independent Directors’ counsel) |
| |
| • | regulatory and portfolio compliance |
| |
| • | marketing and distribution (except amounts paid by the Fund under Rule 12b-1 plans) |
The Board noted that many of these services have expanded over time in terms of both quantity and complexity in response to shareholder demands, competition in the industry, changing distribution channels, and the changing regulatory environment.
Investment Management Services. The nature of the investment management services provided to the Fund is quite complex and allows Fund shareholders access to professional money management, instant diversification of their investments within an asset class, the opportunity to easily diversify among asset classes by investing in or exchanging among various American Century Investments funds, and liquidity. In evaluating investment performance, the Board expects the Advisor to manage the Fund in accordance with its investment objectives and approved strategies. Further, the Directors recognize that the Advisor has an obligation to monitor trading activities, and in particular to seek the best execution of fund trades, and to evaluate the use of and payment for research. In providing these services, the Advisor utilizes teams of investment professionals (portfolio managers, analysts, research assistants, and securities traders) who require extensive information technology, research, training, compliance, and other systems to conduct their business. The Board, directly and through its Fund Performance Review Committee, provides oversight of the investment performance process. It regularly reviews investment performance information for the Fund, together with comparative information for appropriate benchmarks and/or peer groups of similarly-managed funds, over different time horizons. The Directors also review investment performance information during the management agreement renewal process. If performance concerns are identified, the Fund receives special reviews until performance improves, during which the Board discusses with the Advisor the reasons for such results (e.g., market conditions, security selection) and any efforts being undertaken to improve performance. The Fund’s performance was above its benchmark for the three-, five-, and ten-year periods and below its benchmark for the one-year period reviewed by the Board. The Board found the investment management services provided by the Advisor to the Fund to be satisfactory and consistent with the management agreement.
Shareholder and Other Services. Under the management agreement, the Advisor provides the Fund with a comprehensive package of transfer agency, shareholder, and other services. The Board, directly and through various committees of the Board, regularly reviews reports and evaluations of such services at its regular meetings. These reports include, but are not limited to, information regarding the operational efficiency and accuracy of the shareholder and transfer agency services provided, staffing levels, shareholder satisfaction, technology support (including cyber security), new products and services offered to Fund shareholders, securities trading
activities, portfolio valuation services, auditing services, and legal and operational compliance activities. The Board found the services provided by the Advisor to the Fund under the management agreement to be competitive and of high quality.
Costs of Services and Profitability. The Advisor provides detailed information concerning its cost of providing various services to the Fund, its profitability in managing the Fund (pre- and post-distribution), its overall profitability, and its financial condition. The Directors have reviewed with the Advisor the methodology used to prepare this financial information. This information is considered in evaluating the Advisor’s financial condition, its ability to continue to provide services under the management agreement, and the reasonableness of the current management fee. The Board concluded that the Advisor’s profits were reasonable in light of the services provided to the Fund.
Ethics. The Board generally considers the Advisor’s commitment to providing quality services to shareholders and to conducting its business ethically. They noted that the Advisor’s practices generally meet or exceed industry best practices.
Economies of Scale. The Board also reviewed information provided by the Advisor regarding the possible existence of economies of scale in connection with the management of the Fund. The Board concluded that economies of scale are difficult to measure and predict with precision, especially on a fund-by-fund basis. The Board concluded that the Advisor is appropriately sharing economies of scale through its competitive fee structure, offering competitive fees from fund inception, and through reinvestment in its business to provide shareholders additional content and services. The Board also noted that economies of scale are shared with the Fund and its shareholders through management fee breakpoints that serve to reduce the effective management fee as the assets of the Fund grow.
Comparison to Other Funds’ Fees. The management agreement provides that the Fund pays the Advisor a single, all-inclusive (or unified) management fee for providing all services necessary for the management and operation of the Fund, other than brokerage expenses, expenses attributable to short sales, taxes, interest, extraordinary expenses, fees and expenses of the Fund’s independent Directors (including their independent legal counsel), and expenses incurred in connection with the provision of shareholder services and distribution services under a plan adopted pursuant to Rule 12b-1 under the Investment Company Act. Under the unified fee structure, the Advisor is responsible for providing all investment advisory, custody, audit, administrative, compliance, recordkeeping, marketing and shareholder services, or arranging and supervising third parties to provide such services. By contrast, most other funds are charged a variety of fees, including an investment advisory fee, a transfer agency fee, an administrative fee, distribution charges, and other expenses. Other than their investment advisory fees and any applicable Rule 12b-1 distribution fees, all other components of the total fees charged by these other funds may be increased without shareholder approval. The Board believes the unified fee structure is a benefit to Fund shareholders because it clearly discloses to shareholders the cost of owning Fund shares, and, since the unified fee cannot be increased without a vote of Fund shareholders, it shifts to the Advisor the risk of increased costs of operating the Fund and provides a direct incentive to minimize administrative inefficiencies. Part of the Board’s analysis of fee levels involves reviewing certain evaluative data compiled by an independent provider comparing the Fund’s unified fee to the total expense ratios of its peers. The unified fee charged to shareholders of the Fund was above the median of the total expense ratios of the Fund’s peer expense universe and was within the range of its peer expense group. The Board and the Advisor agreed to a temporary reduction of the Fund's annual unified management fee of 0.05% (e.g., the Investor Class unified fee will be reduced from 0.84% to 0.79%) for at least one year, beginning August 1, 2019. The Board concluded that the management fee paid by the Fund to the Advisor under the management agreement is reasonable in light of the services provided to the Fund.
Comparison to Fees and Services Provided to Other Clients of the Advisor. The Directors also requested and received information from the Advisor concerning the nature of the services, fees, costs, and profitability of its advisory services to advisory clients other than the Fund. They
observed that these varying types of client accounts require different services and involve different regulatory and entrepreneurial risks than the management of the Fund. The Board analyzed this information and concluded that the fees charged and services provided to the Fund were reasonable by comparison.
Payments to Intermediaries. The Directors also requested and received a description of payments made to intermediaries by the Fund and the Advisor and services provided in response thereto. These payments include various payments made by the Fund or the Advisor to different types of intermediaries and recordkeepers for distribution and service activities provided for the Fund. The Board reviewed such information and received representations from the Advisor that all such payments by the Fund were made pursuant to the Fund's Rule 12b-1 Plan and that all such payments by the Advisor were made from the Advisor’s resources and reasonable profits. The Board found such payments to be reasonable in scope and purpose.
Collateral or “Fall-Out” Benefits Derived by the Advisor. The Board considered the existence of collateral benefits the Advisor may receive as a result of its relationship with the Fund. They concluded that the Advisor’s primary business is managing mutual funds and it generally does not use fund or shareholder information to generate profits in other lines of business, and therefore does not derive any significant collateral benefits from them. The Board noted that additional assets from other clients may offer the Advisor some benefit from increased leverage with service providers and counterparties. Additionally, the Advisor may receive proprietary research from broker-dealers that execute fund portfolio transactions, which the Board concluded is likely to benefit other clients of the Advisor, as well as Fund shareholders. The Board also determined that the Advisor is able to provide investment management services to certain clients other than the Fund, at least in part, due to its existing infrastructure built to serve the fund complex. The Board concluded that appropriate allocation methodologies had been employed to assign resources and the cost of those resources to these other clients and, where expressly provided, these other client assets may be included with the assets of the Fund to determine breakpoints in the management fee schedule.
Existing Relationship. The Board also considered whether there was any reason for not continuing the existing arrangement with the Advisor. In this regard, the Board was mindful of the potential disruptions of the Fund’s operations and various risks, uncertainties, and other effects that could occur as a result of a decision not to continue such relationship. In particular, the Board recognized that most shareholders have invested in the Fund on the strength of the Advisor’s industry standing and reputation and in the expectation that the Advisor will have a continuing role in providing advisory services to the Fund.
Conclusion of the Directors. As a result of this process, the Board, including all of the independent Directors, taking into account all of the factors discussed above and the information provided by the Advisor and others in connection with its review and throughout the year, determined that the management fee is fair and reasonable in light of the services provided and that the investment management agreement between the Fund and the Advisor should be renewed.
Retirement Account Information
As required by law, distributions you receive from certain retirement accounts are subject to federal income tax withholding, unless you elect not to have withholding apply*. Tax will be withheld on the total amount withdrawn even though you may be receiving amounts that are not subject to withholding, such as nondeductible contributions. In such case, excess amounts of withholding could occur. You may adjust your withholding election so that a greater or lesser amount will be withheld.
If you don’t want us to withhold on this amount, you must notify us to not withhold the federal income tax. You may notify us in writing or in certain situations by telephone or through other electronic means. For systematic withdrawals, your withholding election will remain in effect until revoked or changed by filing a new election. You have the right to revoke your election at any time and change your withholding percentage for future distributions.
Remember, even if you elect not to have income tax withheld, you are liable for paying income tax on the taxable portion of your withdrawal. If you elect not to have income tax withheld or you don’t have enough income tax withheld, you may be responsible for payment of estimated tax. You may incur penalties under the estimated tax rules if your withholding and estimated tax payments are not sufficient. You can reduce or defer the income tax on a distribution by directly or indirectly rolling such distribution over to another IRA or eligible plan. You should consult your tax advisor for additional information.
State tax will be withheld if, at the time of your distribution, your address is within one of the mandatory withholding states and you have federal income tax withheld (or as otherwise required by state law). State taxes will be withheld from your distribution in accordance with the respective state rules.
*Some 403(b), 457 and qualified retirement plan distributions may be subject to 20% mandatory withholding, as they are subject to special tax and withholding rules. Your plan administrator or plan sponsor is required to provide you with a special tax notice explaining those rules at the time you request a distribution. If applicable, federal and/or state taxes may be withheld from your distribution amount.
Proxy Voting Policies
A description of the policies that the fund's investment advisor uses in exercising the voting rights associated with the securities purchased and/or held by the fund is available without charge, upon request, by calling 1-800-345-2021. It is also available on American Century Investments’ website at americancentury.com/proxy and on the Securities and Exchange Commission’s website at sec.gov. Information regarding how the investment advisor voted proxies relating to portfolio securities during the most recent 12-month period ended June 30 is available on americancentury.com/proxy. It is also available at sec.gov.
Quarterly Portfolio Disclosure
The fund files its complete schedule of portfolio holdings with the Securities and Exchange Commission (SEC) for the first and third quarters of each fiscal year on Form N-Q or as an exhibit to its reports on Form N-PORT. The fund’s Forms N-Q and Form N-PORT reports are available on the SEC’s website at sec.gov. The fund also makes its complete schedule of portfolio holdings for the most recent quarter of its fiscal year available on its website at americancentury.com and, upon request, by calling 1-800-345-2021.
Other Tax Information
The following information is provided pursuant to provisions of the Internal Revenue Code.
The fund hereby designates up to the maximum amount allowable as qualified dividend income for the fiscal year ended October 31, 2019.
For corporate taxpayers, the fund hereby designates $2,630,877, or up to the maximum amount allowable, of ordinary income distributions paid during the fiscal year ended October 31, 2019 as qualified for the corporate dividends received deduction.
The fund hereby designates $639,212 as qualified short-term capital gain distributions for purposes of Internal Revenue Code Section 871 for the fiscal year ended October 31, 2019.
The fund hereby designates $17,337,996, or up to the maximum amount allowable, as long-term capital gain distributions (20% rate gain distributions) for the fiscal year ended October 31, 2019.
The fund utilized earnings and profits of $2,756,263 distributed to shareholders on redemption of shares as part of the dividends paid deduction (tax equalization).
|
| | |
| |
| | | |
| Contact Us | americancentury.com | |
| Automated Information Line | 1-800-345-8765 | |
| Investor Services Representative | 1-800-345-2021 or 816-531-5575 | |
| Investors Using Advisors | 1-800-378-9878 | |
| Business, Not-For-Profit, Employer-Sponsored Retirement Plans | 1-800-345-3533 | |
| Banks and Trust Companies, Broker-Dealers, Financial Professionals, Insurance Companies | 1-800-345-6488 | |
| Telecommunications Relay Service for the Deaf | 711 | |
| | | |
| American Century Mutual Funds, Inc. | |
| | | |
Investment Advisor: American Century Investment Management, Inc. Kansas City, Missouri | |
| | | |
| This report and the statements it contains are submitted for the general information of our shareholders. The report is not authorized for distribution to prospective investors unless preceded or accompanied by an effective prospectus. | |
| | | |
©2019 American Century Proprietary Holdings, Inc. All rights reserved.
CL-ANN-90971 1912 | |
|
| |
| | |
| | Annual Report |
| | |
| | October 31, 2019 |
| | |
| | Ultra® Fund |
| | Investor Class (TWCUX) |
| | I Class (TWUIX) |
| | Y Class (AULYX) |
| | A Class (TWUAX) |
| | C Class (TWCCX) |
| | R Class (AULRX) |
| | R5 Class (AULGX) |
| | R6 Class (AULDX) |
| | G Class (AULNX) |
Beginning on January 1, 2021, as permitted by regulations adopted by the Securities and Exchange Commission, paper copies of the fund’s shareholder reports like this one will no longer be sent by mail, unless you specifically request paper copies of the reports from the fund or from your financial intermediary, such as a broker-dealer or bank. Instead, the reports will be made available on a website, and you will be notified by mail each time a report is posted and provided with a website link to access the report.
If you already elected to receive shareholder reports electronically, you will not be affected by this change and you need not take any action. You may elect to receive shareholder reports and other communications from the fund or your financial intermediary electronically by calling or sending an email request to your appropriate contacts as listed on the back cover of this report.
You may elect to receive all future reports in paper free of charge. You can inform the fund or your financial intermediary that you wish to continue receiving paper copies of your shareholder reports by calling or sending an email request to your appropriate contacts as listed on the back cover of this report. Your election to receive reports in paper will apply to all funds held with the fund complex/your financial intermediary.
|
| | |
| President’s Letter | 2 |
|
| Performance | 3 |
|
| Portfolio Commentary | |
|
| Fund Characteristics | |
|
| Shareholder Fee Example | |
|
| Schedule of Investments | |
|
| Statement of Assets and Liabilities | |
|
| Statement of Operations | |
|
| Statement of Changes in Net Assets | |
|
| Notes to Financial Statements | |
|
| Financial Highlights | |
|
| Report of Independent Registered Public Accounting Firm | |
|
| Management | |
|
| Approval of Management Agreement | |
|
| Additional Information | |
|
Any opinions expressed in this report reflect those of the author as of the date of the report, and do not necessarily represent the opinions of American Century Investments® or any other person in the American Century Investments organization. Any such opinions are subject to change at any time based upon market or other conditions and American Century Investments disclaims any responsibility to update such opinions. These opinions may not be relied upon as investment advice and, because investment decisions made by American Century Investments funds are based on numerous factors, may not be relied upon as an indication of trading intent on behalf of any American Century Investments fund. Security examples are used for representational purposes only and are not intended as recommendations to purchase or sell securities. Performance information for comparative indices and securities is provided to American Century Investments by third party vendors. To the best of American Century Investments’ knowledge, such information is accurate at the time of printing.
Jonathan Thomas
Dear Investor:
Thank you for reviewing this annual report for the 12 months ended October 31, 2019. Annual reports help convey important information about fund returns, including market factors that affected performance. For additional investment and market insights, please visit americancentury.com.
Stocks, Bonds Delivered Solid Gains
U.S. and global stocks, bonds and real estate investments generally delivered strong gains for the 12-month period. Stocks and other riskier assets rebounded from a late-2018 sell-off to post robust returns for the 12 months overall. Global bonds benefited from safe-haven buying early in the period and a declining interest rate environment overall.
Fed’s Policy Pivot Improved Investor Sentiment
In the final months of 2018, mounting concerns about slowing global economic and earnings growth, tariffs and Federal Reserve (Fed) policy soured investor sentiment, driving global stocks lower. After raising rates in September 2018, the Fed hiked again in December and delivered a surprisingly bullish 2019 rate-hike outlook, which intensified the sell-off among stocks and other riskier assets. Meanwhile, the risk-off climate sparked a flight to quality, which drove U.S. and other government bond yields lower and benefited global bond returns.
A key policy pivot from the Fed helped improve equity investor sentiment beginning in early 2019. The central bank abruptly ended its rate-hike campaign and adopted a dovish tone amid weaker global growth and inflation. Additionally, investors’ worst-case fears about trade and corporate earnings generally eased, which also aided stocks and other riskier assets. At the same time, government bond yields continued to fall on moderating global growth data, muted inflation and accommodative central bank policy in the U.S., Europe and Japan. By July, concerns about global economic risks prompted the Fed to cut short-term interest rates for the first time in 10 years. The Fed followed up with additional rate cuts in September and October. This backdrop supported continued gains for fixed-income and other interest rate-sensitive assets.
Looking ahead, we expect volatility to remain a formidable factor as investors react to global growth and trade trends, central bank policy and geopolitical developments. We believe this scenario underscores the importance of using professionally managed portfolios in pursuit of investment goals. We appreciate your continued trust and confidence in us.
Sincerely,
Jonathan Thomas
President and Chief Executive Officer
American Century Investments
|
| | | | | | |
| Total Returns as of October 31, 2019 |
| | | | Average Annual Returns | |
| | Ticker Symbol | 1 year | 5 years | 10 years | Since Inception | Inception Date |
| Investor Class | TWCUX | 13.83% | 13.05% | 15.06% | — | 11/2/81 |
| Russell 1000 Growth Index | — | 17.10% | 13.42% | 15.41% | — | — |
| S&P 500 Index | — | 14.33% | 10.77% | 13.69% | — | — |
| I Class | TWUIX | 14.05% | 13.27% | 15.29% | — | 11/14/96 |
| Y Class | AULYX | 14.22% | — | — | 17.80% | 4/10/17 |
| A Class | TWUAX | | | | | 10/2/96 |
| No sales charge | | 13.54% | 12.76% | 14.77% | — | |
| With sales charge | | 7.01% | 11.44% | 14.09% | — | |
| C Class | TWCCX | 12.69% | 11.92% | 13.92% | — | 10/29/01 |
| R Class | AULRX | 13.26% | 12.48% | 14.48% | — | 8/29/03 |
| R5 Class | AULGX | 14.04% | — | — | 17.62% | 4/10/17 |
| R6 Class | AULDX | 14.22% | 13.44 | — | 14.84% | 7/26/13 |
| G Class | AULNX | — | — | — | 2.26% | 8/1/19 |
Average annual returns since inception are presented when ten years of performance history is not available.
Fund returns would have been lower if a portion of the fees had not been waived.
Sales charges include initial sales charges and contingent deferred sales charges (CDSCs), as applicable. A Class shares have a 5.75% maximum initial sales charge and may be subject to a maximum CDSC of 1.00%. C Class shares redeemed within 12 months of purchase are subject to a maximum CDSC of 1.00%. The SEC requires that mutual funds provide performance information net of maximum sales charges in all cases where charges could be applied.
Data presented reflect past performance. Past performance is no guarantee of future results. Current performance may be higher or lower than the performance shown. Total returns for periods less than one year are not annualized. Investment return and principal value will fluctuate, and redemption value may be more or less than original cost. Data assumes reinvestment of dividends and capital gains, and none of the charts reflect the deduction of taxes that a shareholder would pay on fund distributions or the redemption of fund shares. To obtain performance data current to the most recent month end, please call 1-800-345-2021 or visit americancentury.com. For additional information about the fund, please consult the prospectus.
|
|
| Growth of $10,000 Over 10 Years |
| $10,000 investment made October 31, 2009 |
| Performance for other share classes will vary due to differences in fee structure. |
|
| |
| Value on October 31, 2019 |
| | Investor Class — $40,692 |
| |
| | Russell 1000 Growth Index — $41,938 |
| |
| | S&P 500 Index — $36,096 |
| |
|
| | | | | | | | |
| Total Annual Fund Operating Expenses | |
| Investor Class | I Class | Y Class | A Class | C Class | R Class | R5 Class | R6 Class | G Class |
| 0.97% | 0.77% | 0.62% | 1.22% | 1.97% | 1.47% | 0.77% | 0.62% | 0.62% |
The total annual fund operating expenses shown is as stated in the fund’s prospectus current as of the date of this report. The prospectus may vary from the expense ratio shown elsewhere in this report because it is based on a different time period, includes acquired fund fees and expenses, and, if applicable, does not include fee waivers or expense reimbursements.
Data presented reflect past performance. Past performance is no guarantee of future results. Current performance may be higher or lower than the performance shown. Total returns for periods less than one year are not annualized. Investment return and principal value will fluctuate, and redemption value may be more or less than original cost. Data assumes reinvestment of dividends and capital gains, and none of the charts reflect the deduction of taxes that a shareholder would pay on fund distributions or the redemption of fund shares. To obtain performance data current to the most recent month end, please call 1-800-345-2021 or visit americancentury.com. For additional information about the fund, please consult the prospectus.
Portfolio Managers: Keith Lee, Michael Li and Jeff Bourke
Performance Summary
Ultra returned 13.83%* for the 12 months ended October 31, 2019, lagging the 17.10% return of the portfolio’s benchmark, the Russell 1000 Growth Index.
U.S. stocks posted solid returns during the reporting period. Growth stocks outperformed value stocks by a wide margin. Within the Russell 1000 Growth Index, all sectors posted gains except for energy, which struggled with the declining price of oil. The small real estate segment—a sector that rarely offers the kind of growth characteristics we seek—reported the top total return, but index gains were largely driven by the strong performance of information technology and consumer discretionary stocks.
Stock selection and an overweight allocation to the energy sector detracted from performance relative to the benchmark. Stock selection among industrials also hampered performance. Stock selection in the information technology and consumer staples sectors benefited performance.
Energy Stocks Were Key Detractors
Within the energy sector, oil, gas and consumable fuels stocks hampered performance relative to the benchmark. Oil and gas exploration and production company EOG Resources fell as the price of crude oil declined. We continue to believe EOG is a high-quality company benefiting from a durable competitive advantage as a result of its experienced management team and innovative use of technology. Oil and gas production company Concho Resources fell after it reported disappointing quarterly production. The energy environment is facing headwinds due to oversupply and weakening demand as the global economy slows. We eliminated our holding of Concho.
In the industrials sector, stock selection detracted. Wabtec underperformed as the provider of technology products and services for the railroad industry declined on worries about softening global growth.
Elsewhere, underweighting Microsoft relative to the benchmark hampered results. The company’s Office 365 subscription service and Azure, its enterprise cloud service, continued to perform well. UnitedHealth Group was a significant detractor. The health insurer underperformed as the Democratic presidential debates kept regulatory and pricing risk elevated. Baidu, the China-based search engine and digital advertising company, posted worse-than-expected revenue and earnings and offered disappointing guidance. We eliminated the holding.
Information Technology Stocks Were Top Contributors
IT services stocks led performance in the information technology sector. Payment services company MasterCard was a significant contributor as its stock price increased after reporting consistently strong earnings growth that exceeded expectations. MasterCard’s competitor Visa also aided performance as the credit card company reported earnings that beat analysts’ estimates.
Stock selection in the consumer staples sector was beneficial. The Estee Lauder Cos. was a top contributor. The cosmetics firm outperformed due to strong quarterly earnings reports driven by sales in China, travel related sales and its skin care products.
*All fund returns referenced in this commentary are for Investor Class shares. Performance for other share classes will vary due to differences in fee structure; when Investor Class performance exceeds that of the fund’s benchmark, other share classes may not. See page 3 for returns for all share classes.
Other top contributors included Chipotle Mexican Grill. The restaurant chain’s new management team has improved operations and enthusiasm for the brand. Through enhanced marketing programs, a digital ordering program and a recently launched loyalty program, the company has experienced increased guest frequency and sales trends. The stock of data visualization software maker Tableau Software soared following the announcement that it would be acquired by salesforce.com. We eliminated the holding as a result of the transaction. DocuSign outperformed after the company reported revenue that beat expectations and offered strong guidance for the fiscal year. The company is a licensing and subscription-based software-as-a-service company focused on simplifying and speeding up the process of signing and preparing legal documents.
Outlook
We remain confident in our belief that high-quality companies with a capability for sustained long-term growth will outperform in the long term. Our portfolio positioning reflects where we are seeing opportunities as a result of the application of that philosophy and process.
As of October 31, 2019, this process pointed the portfolio toward overweight positions relative to the Russell 1000 Growth Index in the communication services and consumer discretionary sectors. Communication services includes portfolio holdings Facebook and Google parent Alphabet, which are large positions in the fund. The consumer discretionary overweight reflects our belief that our portfolio companies offer enduring growth, particularly those with dominant global brands and those leveraging technology to drive expansion.
The industrials and health care sectors represented the largest underweights. The industrials sector underweight reflects a lack of exposure to the air freight and logistics and trading companies and distributors industries, where we have found no companies at present offering the attractive, sustainable, long-term growth potential that we seek. While we continue to believe that many segments of the health care industry are primed for a golden age of innovation and positive social impact, we remain cautious on some segments due to ongoing political and headline risk.
|
| |
| OCTOBER 31, 2019 | |
| Top Ten Holdings | % of net assets |
| Apple, Inc. | 9.3% |
| Alphabet, Inc.* | 6.6% |
| Amazon.com, Inc. | 6.3% |
| MasterCard, Inc., Class A | 5.4% |
| Microsoft Corp. | 5.3% |
| Visa, Inc., Class A | 5.2% |
| Facebook, Inc., Class A | 4.1% |
| UnitedHealth Group, Inc. | 3.5% |
| salesforce.com, Inc. | 3.3% |
| Intuitive Surgical, Inc. | 2.6% |
| *Includes all classes of the issuer held by the fund. | |
| | |
| Top Five Industries | % of net assets |
| IT Services | 13.7% |
| Interactive Media and Services | 11.5% |
| Software | 10.5% |
| Technology Hardware, Storage and Peripherals | 9.3% |
| Internet and Direct Marketing Retail | 6.3% |
| | |
| Types of Investments in Portfolio | % of net assets |
| Common Stocks | 98.9% |
| Temporary Cash Investments | 1.2% |
| Other Assets and Liabilities | (0.1)% |
Fund shareholders may incur two types of costs: (1) transaction costs, including sales charges (loads) on purchase payments and redemption/exchange fees; and (2) ongoing costs, including management fees; distribution and service (12b-1) fees; and other fund expenses. This example is intended to help you understand your ongoing costs (in dollars) of investing in your fund and to compare these costs with the ongoing cost of investing in other mutual funds.
The example is based on an investment of $1,000 made at the beginning of the period and held for the entire period from May 1, 2019 to October 31, 2019 (except as noted).
Actual Expenses
The table provides information about actual account values and actual expenses for each class. You may use the information, together with the amount you invested, to estimate the expenses that you paid over the period. First, identify the share class you own. Then simply divide your account value by $1,000 (for example, an $8,600 account value divided by $1,000 = 8.6), then multiply the result by the number under the heading “Expenses Paid During Period” to estimate the expenses you paid on your account during this period.
If you hold Investor Class shares of any American Century Investments fund, or I Class shares of the American Century Diversified Bond Fund, in an American Century Investments account (i.e., not a financial intermediary or retirement plan account), American Century Investments may charge you a $12.50 semiannual account maintenance fee if the value of those shares is less than $10,000. We will redeem shares automatically in one of your accounts to pay the $12.50 fee. In determining your total eligible investment amount, we will include your investments in all personal accounts (including American Century Investments Brokerage accounts) registered under your Social Security number. Personal accounts include individual accounts, joint accounts, UGMA/UTMA accounts, personal trusts, Coverdell Education Savings Accounts and IRAs (including traditional, Roth, Rollover, SEP-, SARSEP- and SIMPLE-IRAs), and certain other retirement accounts. If you have only business, business retirement, employer-sponsored or American Century Investments Brokerage accounts, you are currently not subject to this fee. If you are subject to the Account Maintenance Fee, your account value could be reduced by the fee amount.
Hypothetical Example for Comparison Purposes
The table also provides information about hypothetical account values and hypothetical expenses based on the actual expense ratio of each class of your fund and an assumed rate of return of 5% per year before expenses, which is not the actual return of a fund’s share class. The hypothetical account values and expenses may not be used to estimate the actual ending account balance or expenses you paid for the period. You may use this information to compare the ongoing costs of investing in your fund and other funds. To do so, compare this 5% hypothetical example with the 5% hypothetical examples that appear in the shareholder reports of the other funds.
Please note that the expenses shown in the table are meant to highlight your ongoing costs only and do not reflect any transactional costs, such as sales charges (loads) or redemption/exchange fees. Therefore, the table is useful in comparing ongoing costs only, and will not help you determine the relative total costs of owning different funds. In addition, if these transactional costs were included, your costs would have been higher.
|
| | | | |
| Beginning
Account Value
5/1/19 | Ending
Account Value
10/31/19 | Expenses Paid
During Period(1)
5/1/19 - 10/31/19 |
Annualized
Expense Ratio(1) |
| Actual | | | | |
| Investor Class | $1,000 | $1,022.20 | $4.94 | 0.97% |
| I Class | $1,000 | $1,023.30 | $3.93 | 0.77% |
| Y Class | $1,000 | $1,024.00 | $3.16 | 0.62% |
| A Class | $1,000 | $1,020.70 | $6.21 | 1.22% |
| C Class | $1,000 | $1,016.90 | $10.01 | 1.97% |
| R Class | $1,000 | $1,019.40 | $7.48 | 1.47% |
| R5 Class | $1,000 | $1,023.10 | $3.93 | 0.77% |
| R6 Class | $1,000 | $1,023.90 | $3.16 | 0.62% |
| G Class | $1,000 | $1,022.60(2) | $0.00(3) | 0.00%(4) |
| Hypothetical | | | | |
| Investor Class | $1,000 | $1,020.32 | $4.94 | 0.97% |
| I Class | $1,000 | $1,021.32 | $3.92 | 0.77% |
| Y Class | $1,000 | $1,022.08 | $3.16 | 0.62% |
| A Class | $1,000 | $1,019.06 | $6.21 | 1.22% |
| C Class | $1,000 | $1,015.28 | $10.01 | 1.97% |
| R Class | $1,000 | $1,017.80 | $7.48 | 1.47% |
| R5 Class | $1,000 | $1,021.32 | $3.92 | 0.77% |
| R6 Class | $1,000 | $1,022.08 | $3.16 | 0.62% |
| G Class | $1,000 | $1,025.21(5) | $0.00(5) | 0.00%(4) |
| |
| (1) | Expenses are equal to the class's annualized expense ratio listed in the table above, multiplied by the average account value over the period, multiplied by 184, the number of days in the most recent fiscal half-year, divided by 365, to reflect the one-half year period. Annualized expense ratio reflects actual expenses, including any applicable fee waivers or expense reimbursements and excluding any acquired fund fees and expenses. |
| |
| (2) | Ending account value based on actual return from August 1, 2019 (commencement of sale) through October 31, 2019. |
| |
| (3) | Expenses are equal to the class's annualized expense ratio listed in the table above, multiplied by the average account value over the period, multiplied by 92, the number of days in the period from August 1, 2019 (commencement of sale) through October 31, 2019, divided by 365, to reflect the period. Had the class been available for the full period, the expenses paid during the period would have been higher. |
| |
| (4) | Other expenses, which include directors' fees and expenses, did not exceed 0.005%. |
| |
| (5) | Ending account value and expenses paid during the period assumes the class had been available throughout the entire period and are calculated using the class’s annualized expense ratio listed in the table above. |
OCTOBER 31, 2019
|
| | | | |
| | Shares | Value |
| COMMON STOCKS — 98.9% | | |
| Aerospace and Defense — 1.7% | | |
| Boeing Co. (The) | 595,000 | $ | 202,246,449 |
|
| Automobiles — 1.6% | | |
Tesla, Inc.(1) | 633,000 | 199,344,360 |
|
| Banks — 2.1% | | |
| JPMorgan Chase & Co. | 1,035,000 | 129,292,200 |
|
| U.S. Bancorp | 2,195,755 | 125,201,950 |
|
| | | 254,494,150 |
|
| Beverages — 1.5% | | |
| Constellation Brands, Inc., Class A | 939,000 | 178,719,870 |
|
| Biotechnology — 3.0% | | |
Biogen, Inc.(1) | 379,258 | 113,288,157 |
|
Bluebird Bio, Inc.(1) | 245,000 | 19,845,000 |
|
Ionis Pharmaceuticals, Inc.(1) | 732,904 | 40,837,411 |
|
Regeneron Pharmaceuticals, Inc.(1) | 493,000 | 150,996,040 |
|
Sage Therapeutics, Inc.(1) | 338,000 | 45,849,700 |
|
| | | 370,816,308 |
|
| Capital Markets — 0.9% | | |
| MSCI, Inc. | 493,000 | 115,638,080 |
|
| Chemicals — 1.2% | | |
| Ecolab, Inc. | 755,000 | 145,012,850 |
|
| Electrical Equipment — 1.1% | | |
| Acuity Brands, Inc. | 1,106,000 | 138,017,740 |
|
| Electronic Equipment, Instruments and Components — 1.3% | | |
| Cognex Corp. | 762,456 | 39,258,859 |
|
| Keyence Corp. | 64,100 | 40,473,215 |
|
| Yaskawa Electric Corp. | 1,956,700 | 74,393,736 |
|
| | | 154,125,810 |
|
| Entertainment — 3.7% | | |
Netflix, Inc.(1) | 538,000 | 154,626,580 |
|
| Walt Disney Co. (The) | 2,345,000 | 304,662,400 |
|
| | | 459,288,980 |
|
| Food and Staples Retailing — 2.0% | | |
| Costco Wholesale Corp. | 804,815 | 239,118,585 |
|
| Health Care Equipment and Supplies — 4.8% | | |
ABIOMED, Inc.(1) | 177,000 | 36,741,660 |
|
Edwards Lifesciences Corp.(1) | 534,000 | 127,294,920 |
|
IDEXX Laboratories, Inc.(1) | 295,000 | 84,077,950 |
|
Intuitive Surgical, Inc.(1) | 574,687 | 317,773,177 |
|
Tandem Diabetes Care, Inc.(1) | 341,000 | 20,998,780 |
|
| | | 586,886,487 |
|
|
| | | | |
| | Shares | Value |
| Health Care Providers and Services — 3.5% | | |
| UnitedHealth Group, Inc. | 1,706,168 | $ | 431,148,654 |
|
| Hotels, Restaurants and Leisure — 3.1% | | |
Chipotle Mexican Grill, Inc.(1) | 251,000 | 195,318,160 |
|
| Starbucks Corp. | 2,156,000 | 182,311,360 |
|
| | | 377,629,520 |
|
| Household Products — 0.8% | | |
| Colgate-Palmolive Co. | 1,509,000 | 103,517,400 |
|
| Interactive Media and Services — 11.5% | | |
Alphabet, Inc., Class A(1) | 289,673 | 364,640,372 |
|
Alphabet, Inc., Class C(1) | 352,661 | 444,391,653 |
|
Facebook, Inc., Class A(1) | 2,652,835 | 508,415,828 |
|
| Tencent Holdings Ltd. | 2,248,900 | 91,704,745 |
|
| | | 1,409,152,598 |
|
| Internet and Direct Marketing Retail — 6.3% | | |
Amazon.com, Inc.(1) | 437,378 | 777,071,998 |
|
| IT Services — 13.7% | | |
| MasterCard, Inc., Class A | 2,398,646 | 663,969,199 |
|
PayPal Holdings, Inc.(1) | 2,535,000 | 263,893,500 |
|
Square, Inc., Class A(1) | 1,747,000 | 107,318,210 |
|
| Visa, Inc., Class A | 3,601,472 | 644,159,282 |
|
| | | 1,679,340,191 |
|
| Machinery — 2.4% | | |
| Cummins, Inc. | 653,000 | 112,629,440 |
|
| Donaldson Co., Inc. | 706,307 | 37,250,631 |
|
| Nordson Corp. | 323,000 | 50,649,630 |
|
| Wabtec Corp. | 1,369,000 | 94,967,530 |
|
| | | 295,497,231 |
|
| Oil, Gas and Consumable Fuels — 0.6% | | |
| EOG Resources, Inc. | 1,111,000 | 77,003,410 |
|
| Personal Products — 1.7% | | |
| Estee Lauder Cos., Inc. (The), Class A | 1,109,000 | 206,573,430 |
|
| Pharmaceuticals — 0.4% | | |
Elanco Animal Health, Inc.(1) | 1,781,000 | 48,122,620 |
|
| Road and Rail — 1.2% | | |
| J.B. Hunt Transport Services, Inc. | 1,277,000 | 150,124,120 |
|
| Semiconductors and Semiconductor Equipment — 2.8% | | |
| Analog Devices, Inc. | 1,181,000 | 125,930,030 |
|
| Applied Materials, Inc. | 1,526,000 | 82,800,760 |
|
| Maxim Integrated Products, Inc. | 925,000 | 54,260,500 |
|
| Xilinx, Inc. | 933,000 | 84,660,420 |
|
| | | 347,651,710 |
|
| Software — 10.5% | | |
DocuSign, Inc.(1) | 2,043,000 | 135,226,170 |
|
| Microsoft Corp. | 4,532,000 | 649,752,840 |
|
Paycom Software, Inc.(1) | 231,512 | 48,971,733 |
|
salesforce.com, Inc.(1) | 2,627,790 | 411,222,857 |
|
|
| | | | | | |
| | Shares/ Principal Amount | Value |
Splunk, Inc.(1) | 407,826 |
| $ | 48,922,807 |
|
| | | 1,294,096,407 |
|
| Specialty Retail — 3.8% | | |
| Ross Stores, Inc. | 1,434,284 |
| 157,297,926 |
|
| TJX Cos., Inc. (The) | 5,452,000 |
| 314,307,800 |
|
| | | 471,605,726 |
|
| Technology Hardware, Storage and Peripherals — 9.3% | | |
| Apple, Inc. | 4,603,100 |
| 1,145,067,156 |
|
| Textiles, Apparel and Luxury Goods — 2.4% | | |
| NIKE, Inc., Class B | 2,377,000 |
| 212,860,350 |
|
Under Armour, Inc., Class C(1) | 4,661,000 |
| 86,228,500 |
|
| | | 299,088,850 |
|
TOTAL COMMON STOCKS
(Cost $4,628,052,296) | | 12,156,400,690 |
|
| TEMPORARY CASH INVESTMENTS — 1.2% | | |
Federal Home Loan Bank Discount Notes, 1.53%, 11/1/19(2) | $ | 125,000,000 |
| 125,000,000 |
|
| Repurchase Agreement, BMO Capital Markets Corp., (collateralized by various U.S. Treasury obligations, 1.625% - 2.25%, 3/31/21 - 5/15/26, valued at $11,359,019), in a joint trading account at 1.50%, dated 10/31/19, due 11/1/19 (Delivery value $11,122,877) | | 11,122,414 |
|
| Repurchase Agreement, Fixed Income Clearing Corp., (collateralized by various U.S. Treasury obligations, 0.625%, 1/15/26, valued at $3,790,448), at 0.65%, dated 10/31/19, due 11/1/19 (Delivery value $3,712,067) | | 3,712,000 |
|
| State Street Institutional U.S. Government Money Market Fund, Premier Class | 5,290 |
| 5,290 |
|
TOTAL TEMPORARY CASH INVESTMENTS
(Cost $139,839,704) | | 139,839,704 |
|
TOTAL INVESTMENT SECURITIES — 100.1%
(Cost $4,767,892,000) | | 12,296,240,394 |
|
| OTHER ASSETS AND LIABILITIES — (0.1)% | | (9,177,607 | ) |
| TOTAL NET ASSETS — 100.0% | | $ | 12,287,062,787 |
|
|
| | | | | | | | | | |
| FORWARD FOREIGN CURRENCY EXCHANGE CONTRACTS | | |
| Currency Purchased | Currency Sold | Counterparty | Settlement Date | Unrealized Appreciation
(Depreciation) |
| USD | 2,602,472 |
| JPY | 282,451,750 |
| Bank of America N.A. | 12/30/19 | $ | (23,112 | ) |
| USD | 39,154,652 |
| JPY | 4,205,366,200 |
| Bank of America N.A. | 12/30/19 | 62,864 |
|
| | | | | | | $ | 39,752 |
|
|
| | |
| NOTES TO SCHEDULE OF INVESTMENTS |
| JPY | - | Japanese Yen |
| USD | - | United States Dollar |
| |
| (2) | The rate indicated is the yield to maturity at purchase. |
See Notes to Financial Statements.
|
|
| Statement of Assets and Liabilities |
|
| | | |
| OCTOBER 31, 2019 | |
| Assets | |
| Investment securities, at value (cost of $4,767,892,000) | $ | 12,296,240,394 |
|
| Receivable for capital shares sold | 1,342,360 |
|
| Unrealized appreciation on forward foreign currency exchange contracts | 62,864 |
|
| Dividends and interest receivable | 2,585,328 |
|
| | 12,300,230,946 |
|
| | |
| Liabilities | |
| Payable for capital shares redeemed | 3,425,910 |
|
| Unrealized depreciation on forward foreign currency exchange contracts | 23,112 |
|
| Accrued management fees | 9,673,627 |
|
| Distribution and service fees payable | 45,510 |
|
| | 13,168,159 |
|
| | |
| Net Assets | $ | 12,287,062,787 |
|
| | |
| Net Assets Consist of: | |
| Capital (par value and paid-in surplus) | $ | 4,252,664,685 |
|
| Distributable earnings | 8,034,398,102 |
|
| | $ | 12,287,062,787 |
|
|
| | | | |
| | Net Assets | Shares Outstanding | Net Asset Value Per Share |
| Investor Class, $0.01 Par Value | $11,308,500,399 | 224,974,200 |
| $50.27 |
| I Class, $0.01 Par Value | $365,036,064 | 6,986,855 |
| $52.25 |
| Y Class, $0.01 Par Value | $1,258,935 | 24,018 |
| $52.42 |
| A Class, $0.01 Par Value | $116,630,029 | 2,440,452 |
| $47.79* |
| C Class, $0.01 Par Value | $16,675,690 | 420,592 |
| $39.65 |
| R Class, $0.01 Par Value | $17,239,538 | 372,259 |
| $46.31 |
| R5 Class, $0.01 Par Value | $94,472 | 1,807 |
| $52.28 |
| R6 Class, $0.01 Par Value | $461,622,521 | 8,816,371 |
| $52.36 |
| G Class, $0.01 Par Value | $5,139 | 98 |
| $52.44 |
*Maximum offering price $50.71 (net asset value divided by 0.9425).
See Notes to Financial Statements.
|
| | | |
| YEAR ENDED OCTOBER 31, 2019 | |
| Investment Income (Loss) | |
| Income: | |
| Dividends (net of foreign taxes withheld of $82,888) | $ | 95,125,457 |
|
| Interest | 3,154,885 |
|
| | 98,280,342 |
|
| | |
| Expenses: | |
| Management fees | 111,556,527 |
|
| Distribution and service fees: | |
| A Class | 275,928 |
|
| C Class | 146,112 |
|
| R Class | 83,938 |
|
| Directors' fees and expenses | 362,822 |
|
| Other expenses | 6,705 |
|
| | 112,432,032 |
|
| Fees waived - G Class | (8 | ) |
| | 112,432,024 |
|
| | |
| Net investment income (loss) | (14,151,682 | ) |
| | |
| Realized and Unrealized Gain (Loss) | |
| Net realized gain (loss) on: | |
| Investment transactions (Note 4) | 652,314,641 |
|
| Forward foreign currency exchange contract transactions | 358,192 |
|
| Foreign currency translation transactions | (9,379 | ) |
| | 652,663,454 |
|
| | |
| Change in net unrealized appreciation (depreciation) on: | |
| Investments | 900,141,057 |
|
| Forward foreign currency exchange contracts | (745,286 | ) |
| Translation of assets and liabilities in foreign currencies | (1,912 | ) |
| | 899,393,859 |
|
| | |
| Net realized and unrealized gain (loss) | 1,552,057,313 |
|
| | |
| Net Increase (Decrease) in Net Assets Resulting from Operations | $ | 1,537,905,631 |
|
See Notes to Financial Statements.
|
|
| Statement of Changes in Net Assets |
|
| | | | | | |
| YEARS ENDED OCTOBER 31, 2019 AND OCTOBER 31, 2018 |
| Increase (Decrease) in Net Assets | October 31, 2019 | October 31, 2018 |
| Operations | | |
| Net investment income (loss) | $ | (14,151,682 | ) | $ | (12,316,425 | ) |
| Net realized gain (loss) | 652,663,454 |
| 804,751,819 |
|
| Change in net unrealized appreciation (depreciation) | 899,393,859 |
| 581,387,399 |
|
| Net increase (decrease) in net assets resulting from operations | 1,537,905,631 |
| 1,373,822,793 |
|
| | | |
| Distributions to Shareholders | | |
| From earnings: | | |
| Investor Class | (730,083,401 | ) | (559,150,978 | ) |
| I Class | (28,348,100 | ) | (19,100,754 | ) |
| Y Class | (76,346 | ) | (346 | ) |
| A Class | (7,623,683 | ) | (4,976,796 | ) |
| C Class | (947,855 | ) | (413,008 | ) |
| R Class | (1,360,937 | ) | (690,819 | ) |
| R5 Class | (448 | ) | (340 | ) |
| R6 Class | (25,190,411 | ) | (14,666,196 | ) |
| Decrease in net assets from distributions | (793,631,181 | ) | (598,999,237 | ) |
| | | |
| Capital Share Transactions | | |
| Net increase (decrease) in net assets from capital share transactions (Note 5) | 116,179,202 |
| 403,469,864 |
|
| | | |
| Net increase (decrease) in net assets | 860,453,652 |
| 1,178,293,420 |
|
| | | |
| Net Assets | | |
| Beginning of period | 11,426,609,135 |
| 10,248,315,715 |
|
| End of period | $ | 12,287,062,787 |
| $ | 11,426,609,135 |
|
See Notes to Financial Statements.
|
|
| Notes to Financial Statements |
OCTOBER 31, 2019
1. Organization
American Century Mutual Funds, Inc. (the corporation) is registered under the Investment Company Act of 1940, as amended (the 1940 Act), as an open-end management investment company and is organized as a Maryland corporation. Ultra Fund (the fund) is one fund in a series issued by the corporation. The fund's investment objective is to seek long-term capital growth.
The fund offers the Investor Class, I Class, Y Class, A Class, C Class, R Class, R5 Class, R6 Class and G Class. The A Class may incur an initial sales charge. The A Class and C Class may be subject to a contingent deferred sales charge. Sale of the G Class commenced on August 1, 2019.
2. Significant Accounting Policies
The following is a summary of significant accounting policies consistently followed by the fund in preparation of its financial statements. The fund is an investment company and follows accounting and reporting guidance in accordance with accounting principles generally accepted in the United States of America. This may require management to make certain estimates and assumptions at the date of the financial statements. Actual results could differ from these estimates. Management evaluated the impact of events or transactions occurring through the date the financial statements were issued that would merit recognition or disclosure.
Investment Valuations — The fund determines the fair value of its investments and computes its net asset value per share at the close of regular trading (usually 4 p.m. Eastern time) on the New York Stock Exchange (NYSE) on each day the NYSE is open. The Board of Directors has adopted valuation policies and procedures to guide the investment advisor in the fund’s investment valuation process and to provide methodologies for the oversight of the fund’s pricing function.
Equity securities that are listed or traded on a domestic securities exchange are valued at the last reported sales price or at the official closing price as provided by the exchange. Equity securities traded on foreign securities exchanges are generally valued at the closing price of such securities on the exchange where primarily traded or at the close of the NYSE, if that is earlier. If no last sales price is reported, or if local convention or regulation so provides, the mean of the latest bid and asked prices may be used. Securities traded over-the-counter are valued at the mean of the latest bid and asked prices, the last sales price, or the official closing price. Equity securities initially expressed in local currencies are translated into U.S. dollars at the mean of the appropriate currency exchange rate at the close of the NYSE as provided by an independent pricing service.
Fixed income securities are valued at the evaluated mean as provided by independent pricing services or at the mean of the most recent bid and asked prices as provided by investment dealers. U.S. Treasury and Government Agency securities are valued using market models that consider trade data, quotations from dealers and active market makers, relevant yield curve and spread data, creditworthiness, trade data or market information on comparable securities, and other relevant security specific information.
Open-end management investment companies are valued at the reported net asset value per share. Repurchase agreements are valued at cost, which approximates fair value. Forward foreign currency exchange contracts are valued at the mean of the appropriate forward exchange rate at the close of the NYSE as provided by an independent pricing service.
If the fund determines that the market price for an investment is not readily available or the valuation methods mentioned above do not reflect an investment’s fair value, such investment is valued as determined in good faith by the Board of Directors or its delegate, in accordance with policies and procedures adopted by the Board of Directors. In its determination of fair value, the fund may review several factors including, but not limited to, market information regarding the specific investment or comparable investments and correlation with other investment types, futures indices or general market indicators. Circumstances that may cause the fund to use these procedures to value an investment include, but are not limited to: an investment has been
declared in default or is distressed; trading in a security has been suspended during the trading day or a security is not actively trading on its principal exchange; prices received from a regular pricing source are deemed unreliable; or there is a foreign market holiday and no trading occurred.
The fund monitors for significant events occurring after the close of an investment’s primary exchange but before the fund’s net asset value per share is determined. Significant events may include, but are not limited to: corporate announcements and transactions; governmental action and political unrest that could impact a specific investment or an investment sector; or armed conflicts, natural disasters and similar events that could affect investments in a specific country or region. The fund also monitors for significant fluctuations between domestic and foreign markets, as evidenced by the U.S. market or such other indicators that the Board of Directors, or its delegate, deems appropriate. The fund may apply a model-derived factor to the closing price of equity securities traded on foreign securities exchanges. The factor is based on observable market data as provided by an independent pricing service.
Security Transactions — Security transactions are accounted for as of the trade date. Net realized gains and losses are determined on the identified cost basis, which is also used for federal income tax purposes.
Investment Income — Dividend income less foreign taxes withheld, if any, is recorded as of the ex-dividend date. Distributions received on securities that represent a return of capital or long-term capital gain are recorded as a reduction of cost of investments and/or as a realized gain. The fund may estimate the components of distributions received that may be considered nontaxable distributions or long-term capital gain distributions for income tax purposes. Interest income is recorded on the accrual basis and includes accretion of discounts and amortization of premiums.
Foreign Currency Translations — All assets and liabilities initially expressed in foreign currencies are translated into U.S. dollars at prevailing exchange rates at period end. The fund may enter into spot foreign currency exchange contracts to facilitate transactions denominated in a foreign currency. Purchases and sales of investment securities, dividend and interest income, spot foreign currency exchange contracts, and expenses are translated at the rates of exchange prevailing on the respective dates of such transactions. Net realized and unrealized foreign currency exchange gains or losses related to investment securities are a component of net realized gain (loss) on investment transactions and change in net unrealized appreciation (depreciation) on investments, respectively.
Repurchase Agreements — The fund may enter into repurchase agreements with institutions that American Century Investment Management, Inc. (ACIM) (the investment advisor) has determined are creditworthy pursuant to criteria adopted by the Board of Directors. The fund requires that the collateral, represented by securities, received in a repurchase transaction be transferred to the custodian in a manner sufficient to enable the fund to obtain those securities in the event of a default under the repurchase agreement. ACIM monitors, on a daily basis, the securities transferred to ensure the value, including accrued interest, of the securities under each repurchase agreement is equal to or greater than amounts owed to the fund under each repurchase agreement.
Joint Trading Account — Pursuant to an Exemptive Order issued by the Securities and Exchange Commission, the fund, along with certain other funds in the American Century Investments family of funds, may transfer uninvested cash balances into a joint trading account. These balances are invested in one or more repurchase agreements that are collateralized by U.S. Treasury or Agency obligations.
Income Tax Status — It is the fund’s policy to distribute substantially all net investment income and net realized gains to shareholders and to otherwise qualify as a regulated investment company under provisions of the Internal Revenue Code. Accordingly, no provision has been made for income taxes. The fund files U.S. federal, state, local and non-U.S. tax returns as applicable. The fund's tax returns are subject to examination by the relevant taxing authority until expiration of the applicable statute of limitations, which is generally three years from the date of filing but can be longer in certain jurisdictions. At this time, management believes there are no uncertain tax positions which, based on their technical merit, would not be sustained upon examination and for which it is reasonably possible that the total amounts of unrecognized tax benefits will significantly change in the next twelve months.
Multiple Class — All shares of the fund represent an equal pro rata interest in the net assets of the class to which such shares belong, and have identical voting, dividend, liquidation and other rights and the same terms and conditions, except for class specific expenses and exclusive rights to vote on matters affecting only individual classes. Income, non-class specific expenses, and realized and unrealized capital gains and losses of the fund are allocated to each class of shares based on their relative net assets.
Distributions to Shareholders — Distributions from net investment income and net realized gains, if any, are generally declared and paid annually.
Indemnifications — Under the corporation’s organizational documents, its officers and directors are indemnified against certain liabilities arising out of the performance of their duties to the fund. In addition, in the normal course of business, the fund enters into contracts that provide general indemnifications. The maximum exposure under these arrangements is unknown as this would involve future claims that may be made against a fund. The risk of material loss from such claims is considered by management to be remote.
3. Fees and Transactions with Related Parties
Certain officers and directors of the corporation are also officers and/or directors of American Century Companies, Inc. (ACC). The corporation’s investment advisor, ACIM, the corporation's distributor, American Century Investment Services, Inc. (ACIS), and the corporation’s transfer agent, American Century Services, LLC, are wholly owned, directly or indirectly, by ACC.
Management Fees — The corporation has entered into a management agreement with ACIM, under which ACIM provides the fund with investment advisory and management services in exchange for a single, unified management fee (the fee) per class. The agreement provides that all expenses of managing and operating the fund, except distribution and service fees, brokerage expenses, taxes, interest, fees and expenses of the independent directors (including legal counsel fees), and extraordinary expenses, will be paid by ACIM. The fee is computed and accrued daily based on each class's daily net assets and paid monthly in arrears. The difference in the fee among the classes is a result of their separate arrangements for non-Rule 12b-1 shareholder services. It is not the result of any difference in advisory or custodial fees or other expenses related to the management of the fund’s assets, which do not vary by class. The rate of the fee is determined by applying a fee rate calculation formula. This formula takes into account the fund’s assets as well as certain assets, if any, of other clients of the investment advisor outside the American Century Investments family of funds (such as subadvised funds and separate accounts) that use very similar investment teams and strategies (strategy assets). Effective August 1, 2019, the investment advisor agreed to waive the G Class's management fee in its entirety. The investment advisor expects this waiver to remain in effect permanently and cannot terminate it without the approval of the Board of Directors.
The management fee schedule range and the effective annual management fee for each class for the period ended October 31, 2019 are as follows:
|
| | |
| | Management Fee Schedule Range | Effective Annual Management Fee |
| Investor Class | 0.800% to 0.990% | 0.97% |
| I Class | 0.600% to 0.790% | 0.77% |
| Y Class | 0.450% to 0.640% | 0.62% |
| A Class | 0.800% to 0.990% | 0.97% |
| C Class | 0.800% to 0.990% | 0.97% |
| R Class | 0.800% to 0.990% | 0.97% |
| R5 Class | 0.600% to 0.790% | 0.77% |
| R6 Class | 0.450% to 0.640% | 0.62% |
| G Class | 0.450% to 0.640% | 0.00%(1) |
| |
| (1) | Effective annual management fee before waiver was 0.62%. |
Distribution and Service Fees — The Board of Directors has adopted a separate Master Distribution and Individual Shareholder Services Plan for each of the A Class, C Class and R Class (collectively the plans), pursuant to Rule 12b-1 of the 1940 Act. The plans provide that the A Class will pay ACIS an annual distribution and service fee of 0.25%. The plans provide that the C Class will pay ACIS an annual distribution and service fee of 1.00%, of which 0.25% is paid for individual shareholder services and 0.75% is paid for distribution services. The plans provide that the R Class will pay ACIS an annual distribution and service fee of 0.50%. The fees are computed and accrued daily based on each class’s daily net assets and paid monthly in arrears. The fees are used to pay financial intermediaries for distribution and individual shareholder services. Fees incurred under the plans during the period ended October 31, 2019 are detailed in the Statement of Operations.
Directors' Fees and Expenses — The Board of Directors is responsible for overseeing the investment advisor’s management and operations of the fund. The directors receive detailed information about the fund and its investment advisor regularly throughout the year, and meet at least quarterly with management of the investment advisor to review reports about fund operations. The fund’s officers do not receive compensation from the fund.
Interfund Transactions — The fund may enter into security transactions with other American Century Investments funds and other client accounts of the investment advisor, in accordance with the 1940 Act rules and procedures adopted by the Board of Directors. The rules and procedures require, among other things, that these transactions be effected at the independent current market price of the security. During the period, the interfund purchases and sales were $1,902,404 and $17,413,791, respectively. The effect of interfund transactions on the Statement of Operations was $499,821 in net realized gain (loss) on investment transactions.
4. Investment Transactions
Purchases and sales of investment securities, excluding short-term investments, for the period ended October 31, 2019 were $1,536,515,747 and $2,118,844,924, respectively.
For the period ended October 31, 2019, the fund incurred net realized gains of $112,852,647 from redemptions in kind. A redemption in kind occurs when a fund delivers securities from its portfolio in lieu of cash as payment to a redeeming shareholder.
5. Capital Share Transactions
Transactions in shares of the fund were as follows:
|
| | | | | | | | | | |
| | Year ended
October 31, 2019(1) | Year ended
October 31, 2018 |
| | Shares | Amount | Shares | Amount |
| Investor Class/Shares Authorized | 3,000,000,000 |
| | 3,350,000,000 |
| |
| Sold | 7,271,579 |
| $ | 338,362,927 |
| 10,632,542 |
| $ | 506,249,511 |
|
| Issued in reinvestment of distributions | 17,133,838 |
| 704,543,764 |
| 12,316,233 |
| 540,066,800 |
|
| Redeemed | (19,883,790 | ) | (933,688,053 | ) | (17,651,912 | ) | (834,762,685 | ) |
| | 4,521,627 |
| 109,218,638 |
| 5,296,863 |
| 211,553,626 |
|
| I Class/Shares Authorized | 120,000,000 |
| | 130,000,000 |
| |
| Sold | 3,624,881 |
| 178,398,381 |
| 2,118,340 |
| 105,334,186 |
|
| Issued in reinvestment of distributions | 611,707 |
| 26,101,541 |
| 395,008 |
| 17,885,944 |
|
| Redeemed | (5,408,439 | ) | (271,836,094 | ) | (1,350,062 | ) | (66,260,455 | ) |
| | (1,171,851 | ) | (67,336,172 | ) | 1,163,286 |
| 56,959,675 |
|
| Y Class/Shares Authorized | 30,000,000 |
| | 50,000,000 |
| |
| Sold | 5,158 |
| 249,374 |
| 19,926 |
| 1,039,561 |
|
| Issued in reinvestment of distributions | 918 |
| 39,247 |
| 8 |
| 346 |
|
| Redeemed | (1,132 | ) | (51,484 | ) | (987 | ) | (51,992 | ) |
| | 4,944 |
| 237,137 |
| 18,947 |
| 987,915 |
|
| A Class/Shares Authorized | 60,000,000 |
| | 70,000,000 |
| |
| Sold | 639,406 |
| 28,146,102 |
| 714,476 |
| 32,776,478 |
|
| Issued in reinvestment of distributions | 182,881 |
| 7,165,291 |
| 111,166 |
| 4,673,419 |
|
| Redeemed | (632,688 | ) | (28,166,501 | ) | (517,254 | ) | (23,601,206 | ) |
| | 189,599 |
| 7,144,892 |
| 308,388 |
| 13,848,691 |
|
| C Class/Shares Authorized | 30,000,000 |
| | 20,000,000 |
| |
| Sold | 211,178 |
| 7,569,450 |
| 171,628 |
| 6,767,809 |
|
| Issued in reinvestment of distributions | 26,806 |
| 877,102 |
| 10,834 |
| 389,063 |
|
| Redeemed | (93,382 | ) | (3,442,472 | ) | (51,478 | ) | (2,004,274 | ) |
| | 144,602 |
| 5,004,080 |
| 130,984 |
| 5,152,598 |
|
| R Class/Shares Authorized | 30,000,000 |
| | 40,000,000 |
| |
| Sold | 197,063 |
| 8,482,452 |
| 166,360 |
| 7,536,648 |
|
| Issued in reinvestment of distributions | 34,308 |
| 1,305,420 |
| 15,447 |
| 633,645 |
|
| Redeemed | (199,457 | ) | (8,334,487 | ) | (112,648 | ) | (4,988,572 | ) |
| | 31,914 |
| 1,453,385 |
| 69,159 |
| 3,181,721 |
|
| R5 Class/Shares Authorized | 30,000,000 |
| | 50,000,000 |
| |
| Sold | 2,002 |
| 94,159 |
| — |
| — |
|
| Issued in reinvestment of distributions | 10 |
| 448 |
| 7 |
| 340 |
|
| Redeemed | (339 | ) | (16,599 | ) | — |
| — |
|
| | 1,673 |
| 78,008 |
| 7 |
| 340 |
|
| R6 Class/Shares Authorized | 110,000,000 |
| | 50,000,000 |
| |
| Sold | 2,436,356 |
| 117,344,335 |
| 3,451,148 |
| 166,159,096 |
|
| Issued in reinvestment of distributions | 587,616 |
| 25,097,065 |
| 324,115 |
| 14,666,196 |
|
| Redeemed | (1,676,518 | ) | (82,067,166 | ) | (1,370,862 | ) | (69,039,994 | ) |
| | 1,347,454 |
| 60,374,234 |
| 2,404,401 |
| 111,785,298 |
|
| G Class/Shares Authorized | 80,000,000 |
| | N/A |
| |
| Sold | 98 |
| 5,000 |
| | |
| Net increase (decrease) | 5,070,060 |
| $ | 116,179,202 |
| 9,392,035 |
| $ | 403,469,864 |
|
| |
| (1) | August 1, 2019 (commencement of sale) through October 31, 2019 for the G Class. |
6. Fair Value Measurements
The fund’s investments valuation process is based on several considerations and may use multiple inputs to determine the fair value of the investments held by the fund. In conformity with accounting principles generally accepted in the United States of America, the inputs used to determine a valuation are classified into three broad levels.
| |
| • | Level 1 valuation inputs consist of unadjusted quoted prices in an active market for identical investments. |
| |
| • | Level 2 valuation inputs consist of direct or indirect observable market data (including quoted prices for comparable investments, evaluations of subsequent market events, interest rates, prepayment speeds, credit risk, etc.). These inputs also consist of quoted prices for identical investments initially expressed in local currencies that are adjusted through translation into U.S. dollars. |
| |
| • | Level 3 valuation inputs consist of unobservable data (including a fund’s own assumptions). |
The level classification is based on the lowest level input that is significant to the fair valuation measurement. The valuation inputs are not necessarily an indication of the risks associated with investing in these securities or other financial instruments.
The following is a summary of the level classifications as of period end. The Schedule of Investments provides additional information on the fund’s portfolio holdings.
|
| | | | | | | | |
| | Level 1 | Level 2 | Level 3 |
| Assets | | | |
| Investment Securities | | | |
| Common Stocks | $ | 11,949,828,994 |
| $ | 206,571,696 |
| — |
|
| Temporary Cash Investments | 5,290 |
| 139,834,414 |
| — |
|
| | $ | 11,949,834,284 |
| $ | 346,406,110 |
| — |
|
| Other Financial Instruments | | | |
| Forward Foreign Currency Exchange Contracts | — |
| $ | 62,864 |
| — |
|
| | | | |
| Liabilities | | | |
| Other Financial Instruments | | | |
| Forward Foreign Currency Exchange Contracts | — |
| $ | 23,112 |
| — |
|
7. Derivative Instruments
Foreign Currency Risk — The fund is subject to foreign currency exchange rate risk in the normal course of pursuing its investment objectives. The value of foreign investments held by a fund may be significantly affected by changes in foreign currency exchange rates. The dollar value of a foreign security generally decreases when the value of the dollar rises against the foreign currency in which the security is denominated and tends to increase when the value of the dollar declines against such foreign currency. A fund may enter into forward foreign currency exchange contracts to reduce a fund's exposure to foreign currency exchange rate fluctuations. The net U.S. dollar value of foreign currency underlying all contractual commitments held by a fund and the resulting unrealized appreciation or depreciation are determined daily. Realized gain or loss is recorded upon the termination of the contract. Net realized and unrealized gains or losses occurring during the holding period of forward foreign currency exchange contracts are a component of net realized gain (loss) on forward foreign currency exchange contract transactions and change in net unrealized appreciation (depreciation) on forward foreign currency exchange contracts, respectively. A fund bears the risk of an unfavorable change in the foreign currency exchange rate underlying the forward contract. Additionally, losses, up to the fair value, may arise if the counterparties do not perform under the contract terms. The fund's average U.S. dollar exposure to foreign currency risk derivative instruments held during the period was $51,112,770.
The value of foreign currency risk derivative instruments as of October 31, 2019, is disclosed on the Statement of Assets and Liabilities as an asset of $62,864 in unrealized appreciation on forward foreign currency exchange contracts and a liability of $23,112 in unrealized depreciation on forward foreign currency exchange contracts. For the year ended October 31, 2019, the effect of foreign currency risk derivative instruments on the Statement of Operations was $358,192 in net realized gain (loss) on forward foreign currency exchange contract transactions and $(745,286) in change in net unrealized appreciation (depreciation) on forward foreign currency exchange contracts.
8. Federal Tax Information
The tax character of distributions paid during the years ended October 31, 2019 and October 31, 2018 were as follows:
|
| | | | | | |
| | 2019 | 2018 |
| Distributions Paid From | | |
| Ordinary income | $ | 1,545,620 |
| $ | 17,716,470 |
|
| Long-term capital gains | $ | 792,085,561 |
| $ | 581,282,767 |
|
The book-basis character of distributions made during the year from net investment income or net realized gains may differ from their ultimate characterization for federal income tax purposes. These differences reflect the differing character of certain income items and net realized gains and losses for financial statement and tax purposes, and may result in reclassification among certain capital accounts on the financial statements.
As of period end, the federal tax cost of investments and the components of distributable earnings on a tax-basis were as follows:
|
| | | |
| Federal tax cost of investments | $ | 4,784,652,660 |
|
| Gross tax appreciation of investments | $ | 7,566,448,123 |
|
| Gross tax depreciation of investments | (54,860,389 | ) |
| Net tax appreciation (depreciation) of investments | 7,511,587,734 |
|
| Net tax appreciation (depreciation) on derivatives and translation of assets and liabilities in foreign currencies | (5,930 | ) |
Net tax appreciation (depreciation)
| $ | 7,511,581,804 |
|
| Undistributed ordinary income | — |
|
| Accumulated long-term gains | $ | 537,364,453 |
|
| Late-year ordinary loss deferral | $ | (14,548,155 | ) |
The difference between book-basis and tax-basis unrealized appreciation (depreciation) is attributable primarily to the tax deferral of losses on wash sales.
Loss deferrals represent certain qualified losses that the fund has elected to treat as having been incurred in the following fiscal year for federal income tax purposes.
|
| | | | | | | | | | | | | | | |
| For a Share Outstanding Throughout the Years Ended October 31 (except as noted) | | | |
| Per-Share Data | | | | | | | | | Ratios and Supplemental Data | |
| | | Income From Investment Operations: | Distributions From: | | | Ratio to Average Net Assets of: | | |
| | Net Asset
Value,
Beginning
of Period | Net
Investment
Income
(Loss)(1) | Net
Realized
and
Unrealized
Gain (Loss) | Total From
Investment
Operations | Net
Investment
Income | Net
Realized
Gains | Total
Distributions | Net Asset
Value,
End
of Period | Total
Return(2) | Operating
Expenses | Net
Investment
Income
(Loss) | Portfolio
Turnover
Rate | Net
Assets,
End of
Period
(in thousands) |
| Investor Class | | | | | | | | | | | | |
| 2019 | $47.74 | (0.06) | 5.92 | 5.86 | — | (3.33) | (3.33) | $50.27 | 13.83% | 0.97% | (0.13)% | 13% |
| $11,308,500 |
|
| 2018 | $44.59 | (0.06) | 5.82 | 5.76 | (0.07) | (2.54) | (2.61) | $47.74 | 13.44% | 0.97% | (0.12)% | 17% |
| $10,524,969 |
|
| 2017 | $35.83 | 0.07 | 10.39 | 10.46 | (0.10) | (1.60) | (1.70) | $44.59 | 30.42% | 0.98% | 0.17% | 16% |
| $9,593,102 |
|
| 2016 | $37.81 | 0.06 | (0.14) | (0.08) | (0.08) | (1.82) | (1.90) | $35.83 | (0.06)% | 0.98% | 0.19% | 18% |
| $7,790,085 |
|
| 2015 | $37.20 | 0.08 | 3.18 | 3.26 | (0.12) | (2.53) | (2.65) | $37.81 | 9.72% | 0.98% | 0.22% | 16% |
| $8,273,589 |
|
| I Class | | | | | | | | | | | |
| 2019 | $49.39 | 0.03 | 6.16 | 6.19 | — | (3.33) | (3.33) | $52.25 | 14.05% | 0.77% | 0.07% | 13% |
| $365,036 |
|
| 2018 | $46.04 | 0.03 | 6.02 | 6.05 | (0.16) | (2.54) | (2.70) | $49.39 | 13.68% | 0.77% | 0.08% | 17% |
| $402,938 |
|
| 2017 | $36.95 | 0.14 | 10.73 | 10.87 | (0.18) | (1.60) | (1.78) | $46.04 | 30.66% | 0.78% | 0.37% | 16% |
| $322,059 |
|
| 2016 | $38.93 | 0.14 | (0.14) | — | (0.16) | (1.82) | (1.98) | $36.95 | 0.14% | 0.78% | 0.39% | 18% |
| $198,930 |
|
| 2015 | $38.22 | 0.16 | 3.27 | 3.43 | (0.19) | (2.53) | (2.72) | $38.93 | 9.96% | 0.78% | 0.42% | 16% |
| $205,574 |
|
| Y Class | | | | | | | | | | | |
| 2019 | $49.47 | 0.10 | 6.18 | 6.28 | — | (3.33) | (3.33) | $52.42 | 14.22% | 0.62% | 0.22% | 13% |
| $1,259 |
|
| 2018 | $46.07 | 0.11 | 6.02 | 6.13 | (0.19) | (2.54) | (2.73) | $49.47 | 13.85% | 0.62% | 0.23% | 17% |
| $944 |
|
2017(3) | $39.40 | 0.10 | 6.57 | 6.67 | — | — | — | $46.07 | 16.93% | 0.63%(4) | 0.43%(4) | 16%(5) |
| $6 |
|
|
| | | | | | | | | | | | | | | |
| For a Share Outstanding Throughout the Years Ended October 31 (except as noted) | | | |
| Per-Share Data | | | | | | | | | Ratios and Supplemental Data | |
| | | Income From Investment Operations: | Distributions From: | | | Ratio to Average Net Assets of: | | |
| | Net Asset
Value,
Beginning
of Period | Net
Investment
Income
(Loss)(1) | Net
Realized
and
Unrealized
Gain (Loss) | Total From
Investment
Operations | Net
Investment
Income | Net
Realized
Gains | Total
Distributions | Net Asset
Value,
End
of Period | Total
Return(2) | Operating
Expenses | Net
Investment
Income
(Loss) | Portfolio
Turnover
Rate | Net
Assets,
End of
Period
(in thousands) |
| A Class | | | | | | | | | | | | |
| 2019 | $45.67 | (0.17) | 5.62 | 5.45 | — | (3.33) | (3.33) | $47.79 | 13.54% | 1.22% | (0.38)% | 13% |
| $116,630 |
|
| 2018 | $42.80 | (0.17) | 5.58 | 5.41 | — | (2.54) | (2.54) | $45.67 | 13.15% | 1.22% | (0.37)% | 17% |
| $102,806 |
|
| 2017 | $34.45 | (0.04) | 10.00 | 9.96 | (0.01) | (1.60) | (1.61) | $42.80 | 30.10% | 1.23% | (0.08)% | 16% |
| $83,130 |
|
| 2016 | $36.43 | (0.02) | (0.14) | (0.16) | — | (1.82) | (1.82) | $34.45 | (0.31)% | 1.23% | (0.06)% | 18% |
| $58,829 |
|
| 2015 | $35.94 | (0.01) | 3.06 | 3.05 | (0.03) | (2.53) | (2.56) | $36.43 | 9.46% | 1.23% | (0.03)% | 16% |
| $72,004 |
|
| C Class | | | | | | | | |
| 2019 | $38.77 | (0.43) | 4.64 | 4.21 | — | (3.33) | (3.33) | $39.65 | 12.69% | 1.97% | (1.13)% | 13% |
| $16,676 |
|
| 2018 | $36.96 | (0.45) | 4.80 | 4.35 | — | (2.54) | (2.54) | $38.77 | 12.32% | 1.97% | (1.12)% | 17% |
| $10,700 |
|
| 2017 | $30.17 | (0.28) | 8.67 | 8.39 | — | (1.60) | (1.60) | $36.96 | 29.12% | 1.98% | (0.83)% | 16% |
| $5,359 |
|
| 2016 | $32.36 | (0.25) | (0.12) | (0.37) | — | (1.82) | (1.82) | $30.17 | (1.03)% | 1.98% | (0.81)% | 18% |
| $3,306 |
|
| 2015 | $32.41 | (0.25) | 2.73 | 2.48 | — | (2.53) | (2.53) | $32.36 | 8.63% | 1.98% | (0.78)% | 16% |
| $2,968 |
|
| R Class | | | | | | | | |
| 2019 | $44.47 | (0.28) | 5.45 | 5.17 | — | (3.33) | (3.33) | $46.31 | 13.26% | 1.47% | (0.63)% | 13% |
| $17,240 |
|
| 2018 | $41.84 | (0.28) | 5.45 | 5.17 | — | (2.54) | (2.54) | $44.47 | 12.87% | 1.47% | (0.62)% | 17% |
| $15,137 |
|
| 2017 | $33.79 | (0.12) | 9.77 | 9.65 | — | (1.60) | (1.60) | $41.84 | 29.75% | 1.48% | (0.33)% | 16% |
| $11,345 |
|
| 2016 | $35.85 | (0.10) | (0.14) | (0.24) | — | (1.82) | (1.82) | $33.79 | (0.55)% | 1.48% | (0.31)% | 18% |
| $9,066 |
|
| 2015 | $35.46 | (0.10) | 3.02 | 2.92 | — | (2.53) | (2.53) | $35.85 | 9.19% | 1.48% | (0.28)% | 16% |
| $9,637 |
|
|
| | | | | | | | | | | | | | | |
| For a Share Outstanding Throughout the Years Ended October 31 (except as noted) | | | |
| Per-Share Data | | | | | | | | | Ratios and Supplemental Data | |
| | | Income From Investment Operations: | Distributions From: | | | Ratio to Average Net Assets of: | | |
| | Net Asset
Value,
Beginning
of Period | Net
Investment
Income
(Loss)(1) | Net
Realized
and
Unrealized
Gain (Loss) | Total From
Investment
Operations | Net
Investment
Income | Net
Realized
Gains | Total
Distributions | Net Asset
Value,
End
of Period | Total
Return(2) | Operating
Expenses | Net
Investment
Income
(Loss) | Portfolio
Turnover
Rate | Net
Assets,
End of
Period
(in thousands) |
| R5 Class | | | | | | | | |
| 2019 | $49.42 | 0.01 | 6.18 | 6.19 | — | (3.33) | (3.33) | $52.28 | 14.04% | 0.77% | 0.07% | 13% |
| $94 |
|
| 2018 | $46.04 | 0.04 | 6.02 | 6.06 | (0.14) | (2.54) | (2.68) | $49.42 | 13.69% | 0.77% | 0.08% | 17% |
| $7 |
|
2017(3) | $39.41 | 0.07 | 6.56 | 6.63 | — | — | — | $46.04 | 16.82% | 0.78%(4) | 0.28%(4) | 16%(5) |
| $6 |
|
| R6 Class | | | | | | | | |
| 2019 | $49.42 | 0.10 | 6.17 | 6.27 | — | (3.33) | (3.33) | $52.36 | 14.22% | 0.62% | 0.22% | 13% |
| $461,623 |
|
| 2018 | $46.07 | 0.10 | 6.02 | 6.12 | (0.23) | (2.54) | (2.77) | $49.42 | 13.85% | 0.62% | 0.23% | 17% |
| $369,109 |
|
| 2017 | $36.97 | 0.18 | 10.75 | 10.93 | (0.23) | (1.60) | (1.83) | $46.07 | 30.86% | 0.63% | 0.52% | 16% |
| $233,309 |
|
| 2016 | $38.95 | 0.17 | (0.12) | 0.05 | (0.21) | (1.82) | (2.03) | $36.97 | 0.29% | 0.63% | 0.54% | 18% |
| $83,367 |
|
| 2015 | $38.25 | 0.20 | 3.28 | 3.48 | (0.25) | (2.53) | (2.78) | $38.95 | 10.12% | 0.63% | 0.57% | 16% |
| $36,951 |
|
| G Class | | | | | | | | |
2019(6) | $51.28 | 0.10 | 1.06 | 1.16 | — | — | — | $52.44 | 2.26% | 0.00%(4)(7)(8) | 0.78%(4)(7) | 13%(9) |
| $5 |
|
|
| | | | |
| Notes to Financial Highlights | | |
| |
| (1) | Computed using average shares outstanding throughout the period. |
| |
| (2) | Total returns are calculated based on the net asset value of the last business day and do not reflect applicable sales charges, if any. Total returns for periods less than one year are not annualized. |
| |
| (3) | April 10, 2017 (commencement of sale) through October 31, 2017. |
| |
| (5) | Portfolio turnover is calculated at the fund level. Percentage indicated was calculated for the year ended October 31, 2017. |
| |
| (6) | August 1, 2019 (commencement of sale) through October 31, 2019. |
| |
| (7) | The annualized ratio of operating expenses to average net assets before expense waiver and the annualized ratio of net investment income (loss) to average net assets before expense waiver was 0.62% and 0.16%, respectively. |
| |
| (8) | Ratio was less than 0.005%. |
| |
| (9) | Portfolio turnover is calculated at the fund level. Percentage indicated was calculated for the year ended October 31, 2019. |
See Notes to Financial Statements.
|
|
| Report of Independent Registered Public Accounting Firm |
To the Shareholders and the Board of Directors of American Century Mutual Funds, Inc.:
Opinion on the Financial Statements and Financial Highlights
We have audited the accompanying statement of assets and liabilities, including the schedule of investments, of Ultra® Fund, one of the funds constituting the American Century Mutual Funds, Inc. (the "Fund"), as of October 31, 2019, the related statement of operations for the year then ended, the statements of changes in net assets for each of the two years in the period then ended, the financial highlights for each of the five years in the period then ended, and the related notes. In our opinion, the financial statements and financial highlights present fairly, in all material respects, the financial position of Ultra® Fund of the American Century Mutual Funds, Inc. as of October 31, 2019, the results of its operations for the year then ended, the changes in its net assets for each of the two years in the period then ended, and the financial highlights for each of the five years in the period then ended, in conformity with accounting principles generally accepted in the United States of America.
Basis for Opinion
These financial statements and financial highlights are the responsibility of the Fund's management. Our responsibility is to express an opinion on the Fund’s financial statements and financial highlights based on our audits. We are a public accounting firm registered with the Public Company Accounting Oversight Board (United States) (PCAOB) and are required to be independent with respect to the Fund in accordance with the U.S. federal securities laws and the applicable rules and regulations of the Securities and Exchange Commission and the PCAOB.
We conducted our audits in accordance with the standards of the PCAOB. Those standards require that we plan and perform the audit to obtain reasonable assurance about whether the financial statements and financial highlights are free of material misstatement, whether due to error or fraud. The Fund is not required to have, nor were we engaged to perform, an audit of its internal control over financial reporting. As part of our audits we are required to obtain an understanding of internal control over financial reporting but not for the purpose of expressing an opinion on the effectiveness of the Fund’s internal control over financial reporting. Accordingly, we express no such opinion.
Our audits included performing procedures to assess the risks of material misstatement of the financial statements and financial highlights, whether due to error or fraud, and performing procedures that respond to those risks. Such procedures included examining, on a test basis, evidence regarding the amounts and disclosures in the financial statements and financial highlights. Our audits also included evaluating the accounting principles used and significant estimates made by management, as well as evaluating the overall presentation of the financial statements and financial highlights. Our procedures included confirmation of securities owned as of October 31, 2019, by correspondence with the custodian and brokers. We believe that our audits provide a reasonable basis for our opinion.
DELOITTE & TOUCHE LLP
Kansas City, Missouri
December 16, 2019
We have served as the auditor of one or more American Century investment companies since 1997.
The Board of Directors
The individuals listed below serve as directors of the funds. Each director will continue to serve in this capacity until death, retirement, resignation or removal from office. The board has adopted a mandatory retirement age for directors who are not “interested persons,” as that term is defined in the Investment Company Act (independent directors). Independent directors shall retire by December 31 of the year in which they reach their 75th birthday.
Mr. Thomas is an “interested person” because he currently serves as President and Chief Executive Officer of American Century Companies, Inc. (ACC), the parent company of American Century Investment Management, Inc. (ACIM or the advisor). The other directors (more than three-fourths of the total number) are independent. They are not employees, directors or officers of, and have no financial interest in, ACC or any of its wholly owned, direct or indirect, subsidiaries, including ACIM, American Century Investment Services, Inc. (ACIS) and American Century Services, LLC (ACS), and they do not have any other affiliations, positions or relationships that would cause them to be considered “interested persons” under the Investment Company Act. The directors serve in this capacity for seven (in the case of Jonathan S. Thomas, 16; and Stephen E. Yates, 8) registered investment companies in the American Century Investments family of funds.
The following table presents additional information about the directors. The mailing address for each director is 4500 Main Street, Kansas City, Missouri 64111.
|
| | | | | |
Name
(Year of Birth) | Position(s) Held with Funds | Length of Time Served | Principal Occupation(s) During Past 5 Years | Number of American Century Portfolios Overseen by Director | Other Directorships Held During Past 5 Years |
| Independent Directors |
|
|
| Thomas W. Bunn (1953) | Director | Since 2017 | Retired | 66 | SquareTwo Financial; Barings (formerly Babson Capital Funds Trust) (2013 to 2016) |
Chris H. Cheesman
(1962)
| Director | Since 2019
| Retired. Senior Vice President & Chief Audit Executive, AllianceBernstein (1999 to 2018)
| 66 | None |
Barry Fink
(1955) | Director | Since 2012 (independent since 2016) | Retired | 66 | None |
Rajesh K. Gupta
(1960)
| Director | Since 2019
| Partner Emeritus, SeaCrest Investment Management and SeaCrest Wealth Management (2019 to Present); Chief Executive Officer and Chief Investment Officer, SeaCrest Investment Management (2006 to 2019); Chief Executive Officer and Chief Investment Officer, SeaCrest Wealth Management (2008 to 2019)
| 66 | None |
|
| | | | | |
Name
(Year of Birth) | Position(s) Held with Funds | Length of Time Served | Principal Occupation(s) During Past 5 Years | Number of American Century Portfolios Overseen by Director | Other Directorships Held During Past 5 Years |
| Independent Directors |
|
|
Lynn Jenkins
(1963)
| Director | Since 2019
| United States Representative, U.S. House of Representatives (2009 to 2018) | 66 | MGP Ingredients, Inc. |
Jan M. Lewis
(1957) | Director | Since 2011 | Retired | 66 | None |
John R. Whitten
(1946) | Director | Since 2008 | Retired | 66 | Onto Innovation Inc.; Rudolph Technologies, Inc. (2006 to 2019) |
Stephen E. Yates
(1948) | Director and Chairman of the Board | Since 2012 (Chairman since 2018) | Retired | 81 | None |
| Interested Director |
|
Jonathan S. Thomas
(1963) | Director | Since 2007 | President and Chief Executive Officer, ACC (2007 to present). Also serves as Chief Executive Officer, ACS; Executive Vice President, ACIM; Director, ACC, ACIM and other ACC subsidiaries | 125 | BioMed Valley Discoveries, Inc. |
The Statement of Additional Information has additional information about the fund's directors and is available without charge, upon request, by calling 1-800-345-2021.
Officers
The following table presents certain information about the executive officers of the funds. Each officer serves as an officer for each of the 16 (in the case of Robert J. Leach, 15) investment companies in the American Century family of funds. No officer is compensated for his or her service as an officer of the funds. The listed officers are interested persons of the funds and are appointed or re-appointed on an annual basis. The mailing address for each officer listed below is 4500 Main Street, Kansas City, Missouri 64111.
|
| | |
Name
(Year of Birth) | Offices with the Funds | Principal Occupation(s) During the Past Five Years |
Patrick Bannigan
(1965) | President since 2019 | Executive Vice President and Director, ACC (2012 to present); Chief Financial Officer, Chief Accounting Officer and Treasurer, ACC (2015 to present); Chief Operating Officer, ACC (2012-2015). Also serves as President, ACS; Vice President, ACIM; Chief Financial Officer, Chief Accounting Officer and/or Director, ACIM, ACS and other ACC subsidiaries |
R. Wes Campbell
(1974) | Chief Financial Officer and Treasurer since 2018 | Investment Operations and Investment Accounting, ACS (2000 to present) |
Amy D. Shelton
(1964) | Chief Compliance Officer and Vice President since 2014 | Chief Compliance Officer, American Century funds, (2014 to present); Chief Compliance Officer, ACIM (2014 to present); Chief Compliance Officer, ACIS (2009 to present). Also serves as Vice President, ACIS |
Charles A. Etherington
(1957) | General Counsel since 2007 and Senior Vice President since 2006 | Attorney, ACC (1994 to present); Vice President, ACC (2005 to present); General Counsel, ACC (2007 to present). Also serves as General Counsel, ACIM, ACS, ACIS and other ACC subsidiaries; and Senior Vice President, ACIM and ACS |
C. Jean Wade
(1964) | Vice President since 2012 | Senior Vice President, ACS (2017 to present); Vice President, ACS (2000 to 2017)
|
Robert J. Leach
(1966) | Vice President since 2006 | Vice President, ACS (2000 to present) |
David H. Reinmiller
(1963) | Vice President since 2000 | Attorney, ACC (1994 to present). Also serves as Vice President, ACIM and ACS |
Ward D. Stauffer
(1960) | Secretary since 2005 | Attorney, ACC (2003 to present) |
|
|
| Approval of Management Agreement |
At a meeting held on June 26, 2019, the Fund’s Board of Directors (the "Board") unanimously approved the renewal of the management agreement pursuant to which American Century Investment Management, Inc. (the “Advisor”) acts as the investment advisor for the Fund. Under Section 15(c) of the Investment Company Act, contracts for investment advisory services are required to be reviewed, evaluated, and approved by a majority of a fund’s directors (the “Directors”), including a majority of the independent Directors, each year.
Prior to its consideration of the renewal of the management agreement, the Directors requested and reviewed extensive data and information compiled by the Advisor and certain independent providers of evaluation data concerning the Fund and the services provided to the Fund by the Advisor. This review was in addition to the oversight and evaluation undertaken by the Board and its committees on a continual basis and the information received was supplemental to the extensive information that the Board and its committees receive and consider throughout the year.
In connection with its consideration of the renewal of the management agreement, the Board’s review and evaluation of the services provided by the Advisor included, but was not limited to, the following:
| |
| • | the nature, extent, and quality of investment management, shareholder services, and other services provided and to be provided to the Fund; |
| |
| • | the wide range of other programs and services provided and to be provided to the Fund and its shareholders on a routine and non-routine basis; |
| |
| • | the investment performance of the Fund, including data comparing the Fund's performance to appropriate benchmarks and/or a peer group of other mutual funds with similar investment objectives and strategies; |
| |
| • | the cost of owning the Fund compared to the cost of owning similar funds; |
| |
| • | the compliance policies, procedures, and regulatory experience of the Advisor and the Fund's service providers; |
| |
| • | financial data showing the cost of services provided to the Fund, the profitability of the Fund to the Advisor, and the overall profitability of the Advisor; |
| |
| • | strategic plans of the Advisor; |
| |
| • | any economies of scale associated with the Advisor’s management of the Fund and other accounts; |
| |
| • | services provided and charges to the Advisor's other investment management clients; |
| |
| • | acquired fund fees and expenses; |
| |
| • | payments and practices in connection with financial intermediaries holding shares of the Fund and the services provided by intermediaries in connection therewith; and |
| |
| • | any collateral benefits derived by the Advisor from the management of the Fund. |
The Directors held three in-person meetings and one telephonic meeting to review and discuss the information provided. The independent Directors also reviewed responses to supplemental information requests provided by the Directors to the Advisor and held active discussions with the Advisor regarding the renewal of the management agreement. The independent Directors had the benefit of the advice of their independent counsel throughout the process.
Factors Considered
The Directors considered all of the information provided by the Advisor, the independent data providers, and independent counsel in connection with the approval. They determined that the information was sufficient for them to evaluate the management agreement for the Fund. In connection with their review, the Directors did not identify any single factor as being all-important or controlling, and each Director may have attributed different levels of importance to different factors.
In deciding to renew the management agreement, the Board based its decision on a number of factors, including without limitation the following:
Nature, Extent and Quality of Services — Generally. Under the management agreement, the Advisor is responsible for providing or arranging for all services necessary for the operation of the Fund. The Board noted that the Advisor provides or arranges at its own expense a wide variety of services including without limitation the following:
| |
| • | portfolio research and security selection |
| |
| • | daily valuation of the Fund’s portfolio |
| |
| • | shareholder servicing and transfer agency, including shareholder confirmations, recordkeeping, and communications |
| |
| • | legal services (except the independent Directors’ counsel) |
| |
| • | regulatory and portfolio compliance |
| |
| • | marketing and distribution (except amounts paid by the Fund under Rule 12b-1 plans) |
The Board noted that many of these services have expanded over time in terms of both quantity and complexity in response to shareholder demands, competition in the industry, changing distribution channels, and the changing regulatory environment.
Investment Management Services. The nature of the investment management services provided to the Fund is quite complex and allows Fund shareholders access to professional money management, instant diversification of their investments within an asset class, the opportunity to easily diversify among asset classes by investing in or exchanging among various American Century Investments funds, and liquidity. In evaluating investment performance, the Board expects the Advisor to manage the Fund in accordance with its investment objectives and approved strategies. Further, the Directors recognize that the Advisor has an obligation to monitor trading activities, and in particular to seek the best execution of fund trades, and to evaluate the use of and payment for research. In providing these services, the Advisor utilizes teams of investment professionals (portfolio managers, analysts, research assistants, and securities traders) who require extensive information technology, research, training, compliance, and other systems to conduct their business. The Board, directly and through its Fund Performance Review Committee, provides oversight of the investment performance process. It regularly reviews investment performance information for the Fund, together with comparative information for appropriate benchmarks and/or peer groups of similarly-managed funds, over different time horizons. The Directors also review investment performance information during the management agreement renewal process. If performance concerns are identified, the Fund receives special reviews until performance improves, during which the Board discusses with the Advisor the reasons for such results (e.g., market conditions, security selection) and any efforts being undertaken to improve performance. The Fund’s performance was above its benchmark for the one-, three-, five-, and ten-year periods reviewed by the Board. The Board found the investment management services provided by the Advisor to the Fund to be satisfactory and consistent with the management agreement.
Shareholder and Other Services. Under the management agreement, the Advisor provides the Fund with a comprehensive package of transfer agency, shareholder, and other services. The Board, directly and through various committees of the Board, regularly reviews reports and evaluations of such services at its regular meetings. These reports include, but are not limited to, information regarding the operational efficiency and accuracy of the shareholder and transfer agency services provided, staffing levels, shareholder satisfaction, technology support (including cyber security), new products and services offered to Fund shareholders, securities trading activities, portfolio valuation services, auditing services, and legal and operational compliance
activities. The Board found the services provided by the Advisor to the Fund under the management agreement to be competitive and of high quality.
Costs of Services and Profitability. The Advisor provides detailed information concerning its cost of providing various services to the Fund, its profitability in managing the Fund (pre- and post-distribution), its overall profitability, and its financial condition. The Directors have reviewed with the Advisor the methodology used to prepare this financial information. This information is considered in evaluating the Advisor’s financial condition, its ability to continue to provide services under the management agreement, and the reasonableness of the current management fee. The Board concluded that the Advisor’s profits were reasonable in light of the services provided to the Fund.
Ethics. The Board generally considers the Advisor’s commitment to providing quality services to shareholders and to conducting its business ethically. They noted that the Advisor’s practices generally meet or exceed industry best practices.
Economies of Scale. The Board also reviewed information provided by the Advisor regarding the possible existence of economies of scale in connection with the management of the Fund. The Board concluded that economies of scale are difficult to measure and predict with precision, especially on a fund-by-fund basis. The Board concluded that the Advisor is appropriately sharing economies of scale through its competitive fee structure, offering competitive fees from fund inception, and through reinvestment in its business to provide shareholders additional content and services. The Board also noted that economies of scale are shared with the Fund and its shareholders through management fee breakpoints that serve to reduce the effective management fee as the assets of the Fund grow.
Comparison to Other Funds’ Fees. The management agreement provides that the Fund pays the Advisor a single, all-inclusive (or unified) management fee for providing all services necessary for the management and operation of the Fund, other than brokerage expenses, expenses attributable to short sales, taxes, interest, extraordinary expenses, fees and expenses of the Fund’s independent Directors (including their independent legal counsel), and expenses incurred in connection with the provision of shareholder services and distribution services under a plan adopted pursuant to Rule 12b-1 under the Investment Company Act. Under the unified fee structure, the Advisor is responsible for providing all investment advisory, custody, audit, administrative, compliance, recordkeeping, marketing and shareholder services, or arranging and supervising third parties to provide such services. By contrast, most other funds are charged a variety of fees, including an investment advisory fee, a transfer agency fee, an administrative fee, distribution charges, and other expenses. Other than their investment advisory fees and any applicable Rule 12b-1 distribution fees, all other components of the total fees charged by these other funds may be increased without shareholder approval. The Board believes the unified fee structure is a benefit to Fund shareholders because it clearly discloses to shareholders the cost of owning Fund shares, and, since the unified fee cannot be increased without a vote of Fund shareholders, it shifts to the Advisor the risk of increased costs of operating the Fund and provides a direct incentive to minimize administrative inefficiencies. Part of the Board’s analysis of fee levels involves reviewing certain evaluative data compiled by an independent provider comparing the Fund’s unified fee to the total expense ratios of its peers. The unified fee charged to shareholders of the Fund was below the median of the total expense ratios of the Fund’s peer expense universe. The Board concluded that the management fee paid by the Fund to the Advisor under the management agreement is reasonable in light of the services provided to the Fund.
Comparison to Fees and Services Provided to Other Clients of the Advisor. The Directors also requested and received information from the Advisor concerning the nature of the services, fees, costs, and profitability of its advisory services to advisory clients other than the Fund. They observed that these varying types of client accounts require different services and involve different regulatory and entrepreneurial risks than the management of the Fund. The Board analyzed this information and concluded that the fees charged and services provided to the Fund were reasonable by comparison.
Payments to Intermediaries. The Directors also requested and received a description of payments made to intermediaries by the Fund and the Advisor and services provided in response thereto. These payments include various payments made by the Fund or the Advisor to different types of intermediaries and recordkeepers for distribution and service activities provided for the Fund. The Board reviewed such information and received representations from the Advisor that all such payments by the Fund were made pursuant to the Fund's Rule 12b-1 Plan and that all such payments by the Advisor were made from the Advisor’s resources and reasonable profits. The Board found such payments to be reasonable in scope and purpose.
Collateral or “Fall-Out” Benefits Derived by the Advisor. The Board considered the existence of collateral benefits the Advisor may receive as a result of its relationship with the Fund. They concluded that the Advisor’s primary business is managing mutual funds and it generally does not use fund or shareholder information to generate profits in other lines of business, and therefore does not derive any significant collateral benefits from them. The Board noted that additional assets from other clients may offer the Advisor some benefit from increased leverage with service providers and counterparties. Additionally, the Advisor may receive proprietary research from broker-dealers that execute fund portfolio transactions, which the Board concluded is likely to benefit other clients of the Advisor, as well as Fund shareholders. The Board also determined that the Advisor is able to provide investment management services to certain clients other than the Fund, at least in part, due to its existing infrastructure built to serve the fund complex. The Board concluded that appropriate allocation methodologies had been employed to assign resources and the cost of those resources to these other clients and, where expressly provided, these other client assets may be included with the assets of the Fund to determine breakpoints in the management fee schedule.
Existing Relationship. The Board also considered whether there was any reason for not continuing the existing arrangement with the Advisor. In this regard, the Board was mindful of the potential disruptions of the Fund’s operations and various risks, uncertainties, and other effects that could occur as a result of a decision not to continue such relationship. In particular, the Board recognized that most shareholders have invested in the Fund on the strength of the Advisor’s industry standing and reputation and in the expectation that the Advisor will have a continuing role in providing advisory services to the Fund.
Conclusion of the Directors. As a result of this process, the Board, including all of the independent Directors, taking into account all of the factors discussed above and the information provided by the Advisor and others in connection with its review and throughout the year, determined that the management fee is fair and reasonable in light of the services provided and that the investment management agreement between the Fund and the Advisor should be renewed.
Retirement Account Information
As required by law, distributions you receive from certain retirement accounts are subject to federal income tax withholding, unless you elect not to have withholding apply*. Tax will be withheld on the total amount withdrawn even though you may be receiving amounts that are not subject to withholding, such as nondeductible contributions. In such case, excess amounts of withholding could occur. You may adjust your withholding election so that a greater or lesser amount will be withheld.
If you don’t want us to withhold on this amount, you must notify us to not withhold the federal income tax. You may notify us in writing or in certain situations by telephone or through other electronic means. For systematic withdrawals, your withholding election will remain in effect until revoked or changed by filing a new election. You have the right to revoke your election at any time and change your withholding percentage for future distributions.
Remember, even if you elect not to have income tax withheld, you are liable for paying income tax on the taxable portion of your withdrawal. If you elect not to have income tax withheld or you don’t have enough income tax withheld, you may be responsible for payment of estimated tax. You may incur penalties under the estimated tax rules if your withholding and estimated tax payments are not sufficient. You can reduce or defer the income tax on a distribution by directly or indirectly rolling such distribution over to another IRA or eligible plan. You should consult your tax advisor for additional information.
State tax will be withheld if, at the time of your distribution, your address is within one of the mandatory withholding states and you have federal income tax withheld (or as otherwise required by state law). State taxes will be withheld from your distribution in accordance with the respective state rules.
*Some 403(b), 457 and qualified retirement plan distributions may be subject to 20% mandatory withholding, as they are subject to special tax and withholding rules. Your plan administrator or plan sponsor is required to provide you with a special tax notice explaining those rules at the time you request a distribution. If applicable, federal and/or state taxes may be withheld from your distribution amount.
Proxy Voting Policies
A description of the policies that the fund's investment advisor uses in exercising the voting rights associated with the securities purchased and/or held by the fund is available without charge, upon request, by calling 1-800-345-2021. It is also available on American Century Investments’ website at americancentury.com/proxy and on the Securities and Exchange Commission’s website at sec.gov. Information regarding how the investment advisor voted proxies relating to portfolio securities during the most recent 12-month period ended June 30 is available on americancentury.com/proxy. It is also available at sec.gov.
Quarterly Portfolio Disclosure
The fund files its complete schedule of portfolio holdings with the Securities and Exchange Commission (SEC) for the first and third quarters of each fiscal year on Form N-Q or as an exhibit to its reports on Form N-PORT. The fund’s Forms N-Q and Form N-PORT reports are available on the SEC’s website at sec.gov. The fund also makes its complete schedule of portfolio holdings for the most recent quarter of its fiscal year available on its website at americancentury.com and, upon request, by calling 1-800-345-2021.
Other Tax Information
The following information is provided pursuant to provisions of the Internal Revenue Code.
The fund hereby designates up to the maximum amount allowable as qualified dividend income for the fiscal year ended October 31, 2019.
For corporate taxpayers, the fund hereby designates $1,545,620, or up to the maximum amount allowable, of ordinary income distributions paid during the fiscal year ended October 31, 2019 as qualified for the corporate dividends received deduction.
The fund hereby designates $792,085,561, or up to the maximum amount allowable, as long-term capital gain distributions (20% rate gain distributions) for the fiscal year ended October 31, 2019.
The fund hereby designates $1,545,620, as qualified short-term capital gain distributions for purposes of Internal Revenue Code Section 871 for the fiscal year ended October 31, 2019.
|
| | |
| |
| | | |
| Contact Us | americancentury.com | |
| Automated Information Line | 1-800-345-8765 | |
| Investor Services Representative | 1-800-345-2021 or 816-531-5575 | |
| Investors Using Advisors | 1-800-378-9878 | |
| Business, Not-For-Profit, Employer-Sponsored Retirement Plans | 1-800-345-3533 | |
| Banks and Trust Companies, Broker-Dealers, Financial Professionals, Insurance Companies | 1-800-345-6488 | |
| Telecommunications Relay Service for the Deaf | 711 | |
| | | |
| American Century Mutual Funds, Inc. | |
| | | |
Investment Advisor: American Century Investment Management, Inc. Kansas City, Missouri | |
| | | |
| This report and the statements it contains are submitted for the general information of our shareholders. The report is not authorized for distribution to prospective investors unless preceded or accompanied by an effective prospectus. | |
| | | |
©2019 American Century Proprietary Holdings, Inc. All rights reserved.
CL-ANN-90975 1912 | |
ITEM 2. CODE OF ETHICS.
| |
| (a) | The registrant has adopted a Code of Ethics for Senior Financial Officers that applies to the registrant’s principal executive officer, principal financial officer, principal accounting officer, and persons performing similar functions. |
| |
| (f) | The registrant’s Code of Ethics for Senior Financial Officers was filed as Exhibit 12 (a)(1) to American Century Asset Allocation Portfolios, Inc.’s Annual Certified Shareholder Report on Form N-CSR, File No. 811-21591, on September 29, 2005, and is incorporated herein by reference. |
ITEM 3. AUDIT COMMITTEE FINANCIAL EXPERT.
| |
| (a)(1) | The registrant’s board has determined that the registrant has at least one audit committee financial expert serving on its audit committee. |
| |
| (a)(2) | John R. Whitten, Jan M. Lewis, Chris H. Cheesman and Lynn M. Jenkins are the registrant’s designated audit committee financial experts. They are “independent” as defined in Item 3 of Form N-CSR. |
ITEM 4. PRINCIPAL ACCOUNTANT FEES AND SERVICES.
The aggregate fees billed for each of the last two fiscal years for professional services rendered by the principal accountant for the audit of the registrant’s annual financial statements or services that are normally provided by the accountant in connection with statutory and regulatory filings or engagements for those fiscal years were as follows:
FY 2018: $269,430
FY 2019: $261,180
The aggregate fees billed in each of the last two fiscal years for assurance and related services by the principal accountant that are reasonably related to the performance of the audit of the registrant’s financial statements and are not reported under paragraph (a) of this Item were as follows:
For services rendered to the registrant:
FY 2018: $0
FY 2019: $0
Fees required to be approved pursuant to paragraph (c)(7)(ii) of Rule 2-01 of Regulation S-X (relating to certain engagements for non-audit services with the registrant’s investment adviser and its affiliates):
FY 2018: $0
FY 2019: $0
The aggregate fees billed in each of the last two fiscal years for professional services rendered by the principal accountant for tax compliance, tax advice, and tax planning were as follows:
For services rendered to the registrant:
FY 2018: $0
FY 2019: $0
Fees required to be approved pursuant to paragraph (c)(7)(ii) of Rule 2-01 of Regulation S-X (relating to certain engagements for non-audit services with the registrant’s investment adviser and its affiliates):
FY 2018: $0
FY 2019: $0
The aggregate fees billed in each of the last two fiscal years for products and services provided by the principal accountant, other than the services reported in paragraphs (a) through (c) of this Item were as follows:
For services rendered to the registrant:
FY 2018: $0
FY 2019: $0
Fees required to be approved pursuant to paragraph (c)(7)(ii) of Rule 2-01 of Regulation S-X (relating to certain engagements for non-audit services with the registrant’s investment adviser and its affiliates):
FY 2018: $0
FY 2019: $0
| |
| (e)(1) | In accordance with paragraph (c)(7)(i)(A) of Rule 2-01 of Regulation S-X, before the accountant is engaged by the registrant to render audit or non-audit services, the engagement is approved by the registrant’s audit committee. Pursuant to paragraph (c)(7)(ii) of Rule 2-01 of Regulation S-X, the registrant’s audit committee also pre-approves its accountant’s engagements for non-audit services with the registrant’s investment adviser, its parent company, and any entity controlled by, or under common control with the investment adviser that provides ongoing services to the registrant, if the engagement relates directly to the operations and financial reporting of the registrant. |
| |
| (e)(2) | All services described in each of paragraphs (b) through (d) of this Item were pre-approved before the engagement by the registrant’s audit committee pursuant to paragraph (c)(7)(i)(A) of Rule 2-01 of Regulation S-X. Consequently, none of such services were required to be approved by the audit committee pursuant to paragraph (c)(7)(i)(C). |
| |
| (f) | The percentage of hours expended on the principal accountant’s engagement to audit the registrant’s financial statements for the most recent fiscal year that were attributed to work performed by persons other than the principal accountant’s full-time, permanent employees was less than 50%. |
| |
| (g) | The aggregate non-audit fees billed by the registrant’s accountant for services rendered to the registrant, and rendered to the registrant’s investment adviser (not including any sub-adviser whose role is primarily portfolio management and is subcontracted with or overseen by another investment adviser), and any entity controlling, controlled by, or under common control with the adviser that provides ongoing services to the registrant for each of the last two fiscal years of the registrant were as follows: |
FY 2018: $115,750
FY 2019: $119,500
| |
| (h) | The registrant’s investment adviser and accountant have notified the registrant’s audit committee of all non-audit services that were rendered by the registrant’s accountant to the registrant’s investment adviser, its parent company, and any entity controlled by, or under common control with the investment adviser that provides services to the registrant, which services were not required to be pre-approved pursuant to paragraph (c)(7)(ii) of Rule 2-01 of Regulation S-X. The notification provided to the registrant’s audit committee included sufficient details regarding such services to allow the registrant’s audit committee to consider the continuing independence of its principal accountant. |
ITEM 5. AUDIT COMMITTEE OF LISTED REGISTRANTS.
Not applicable.
ITEM 6. INVESTMENTS.
| |
| (a) | The schedule of investments is included as part of the report to stockholders filed under Item 1 of this Form. |
ITEM 7. DISCLOSURE OF PROXY VOTING POLICIES AND PROCEDURES FOR CLOSED-END MANAGEMENT INVESTMENT COMPANIES.
Not applicable.
ITEM 8. PORTFOLIO MANAGERS OF CLOSED-END MANAGEMENT INVESTMENT COMPANIES.
Not applicable.
ITEM 9. PURCHASES OF EQUITY SECURITIES BY CLOSED-END MANAGEMENT INVESTMENT COMPANY AND AFFILIATED PURCHASERS.
Not applicable.
ITEM 10. SUBMISSION OF MATTERS TO A VOTE OF SECURITY HOLDERS.
During the reporting period, there were no material changes to the procedures by which shareholders may recommend nominees to the registrant’s board.
ITEM 11. CONTROLS AND PROCEDURES.
| |
| (a) | The registrant's principal executive officer and principal financial officer have concluded that the registrant's disclosure controls and procedures (as defined in Rule 30a-3(c) under the Investment Company Act of 1940) are effective based on their evaluation of these controls and procedures as of a date within 90 days of the filing date of this report. |
| |
| (b) | There were no changes in the registrant's internal control over financial reporting (as defined in Rule 30a-3(d) under the Investment Company Act of 1940) that occurred during the period covered by this report that have materially affected, or are reasonably likely to materially affect, the registrant's internal control over financial reporting. |
ITEM 12. DISCLOSURE OF SECURITIES LENDING ACTIVITIES FOR CLOSED-END MANAGEMENT INVESTMENT COMPANIES.
Not applicable.
ITEM 13. EXHIBITS.
| |
| (a)(1) | Registrant’s Code of Ethics for Senior Financial Officers, which is the subject of the disclosure required by Item 2 of Form N-CSR, was filed as Exhibit 12(a)(1) to American Century Asset Allocation Portfolios, Inc.’s Certified Shareholder Report on Form N-CSR, File No. 811-21591, on September 29, 2005. |
| |
| (a)(2) | Separate certifications by the registrant’s principal executive officer and principal financial officer, pursuant to Section 302 of the Sarbanes-Oxley Act of 2002 and Rule 30a-2(a) under the Investment Company Act of 1940, are filed and attached hereto as EX-99.CERT. |
(b) A certification by the registrant’s chief executive officer and chief financial officer, pursuant to Section 906 of the Sarbanes-Oxley Act of 2002, is furnished and attached hereto as EX-99.906CERT.
SIGNATURES
Pursuant to the requirements of the Securities Exchange Act of 1934 and the Investment Company Act of 1940, the registrant has duly caused this report to be signed on its behalf by the undersigned, thereunto duly authorized.
|
| | | |
| Registrant: | American Century Mutual Funds, Inc. |
| | | |
| By: | /s/ Patrick Bannigan |
| | Name: | Patrick Bannigan |
| | Title: | President |
| | | |
| Date: | December 30, 2019 |
Pursuant to the requirements of the Securities Exchange Act of 1934 and the Investment Company Act of 1940, this report has been signed below by the following persons on behalf of the registrant and in the capacities and on the dates indicated.
|
| | |
| By: | /s/ Patrick Bannigan |
| | Name: | Patrick Bannigan |
| | Title: | President |
| | | (principal executive officer) |
| | | |
| Date: | December 30, 2019 |
|
| | |
| By: | /s/ R. Wes Campbell |
| | Name: | R. Wes Campbell |
| | Title: | Treasurer and |
| | | Chief Financial Officer |
| | | (principal financial officer) |
| | | |
| Date: | December 30, 2019 |