QuickLinks -- Click here to rapidly navigate through this document
SECURITIES AND EXCHANGE COMMISSION
Washington, D.C. 20549
FORM 6-K
Report of foreign issuer pursuant to rule 13a-16 or 15d-16 of
the Securities Exchange Act of 1934
| For | THE THIRD QUARTER 2002 FINANCIAL RESULTS | |
QUEBECOR WORLD INC. (Formerly known as Quebecor Printing Inc.) | ||
| (Translation of Registrant's Name into English) | ||
612 Saint-Jacques Street, Montreal, Quebec H3C 4M8 | ||
| (Address of Principal Executive Office) | ||
(Indicate by check mark whether the registrant files or will file annual reports under cover of Form 20-F or Form 40-F)
| Form 20-F | o | Form 40-F | ý |
(Indicate by check mark whether the registrant by furnishing the information contained in this form is also thereby furnishing the information to the Commission pursuant to Rule 12g3-2(b) under the Securities Exchange Act of 1934.)
| Yes | o | No | ý |
QUEBECOR WORLD INC.
(Formerly known as Quebecor Printing Inc.)
Filed in this Form 6-K
Documents index
- 1.
- Press Release dated October 28, 2002 (#19/02); Financial Highlights
- 2.
- Supplemental Disclosure for the third quarter and nine months ended September 30, 2002
- 3.
- Management's Discussion and Analysis of Financial Condition and Results of Operations
- 4.
- Consolidated Financial Statements
- 5.
- Certifications pursuant to 18 U.S.C. Section 1350, as adopted pursuant to Section 906 of the Sarbanes-Oxley Act of 2002

Quebecor World
| October 28, 2002 | 19/02 | |
For immediate release | Page 1 of 5 |
THIRD QUARTER 2002
QUEBECOR WORLD GROWS EARNINGS PER SHARE 12%
INCREASES DIVIDEND RATES BY 8% TO $0.52 YEARLY
Montréal, Canada — Quebecor World Inc. today announced earnings per share for the third quarter 2002 of $0.64, which represents a 12% growth on a comparable basis to the same quarter last year. Net income for the quarter rose to $99 million and despite a continuing challenging global economic environment the Company generated $97 million of free cash flow in the quarter. The Company also announces an increase of $0.01 in the quarterly dividende rate, representing a yearly dividend rate of $0.52 compared with $0.48 currently.
"Our third quarter results demonstrate the strength of our Company, its management and its strategy going forward. We have been able to grow earnings and generate significant free cash flow despite one of the toughest economic climates in recent years," said Charles G. Cavell, President and CEO Quebecor World Inc.
Consolidated revenues for the third quarter were steady at $1.62 billion compared to $1.63 billion during the same period in 2001. In our largest market, North America, the operating margin was 11.9%, equal to the same period last year.
"Quebecor World's early focus on cost containment which was started last year, is allowing the Company to maintain industry leading margins despite reduced revenues in a competitive pricing environment," said Mr. Cavell. "With fewer but more specialized plants we are able to provide more effective service to our customers and greater benefits to our shareholders. With 10 facilities closed, our restructuring initiatives in North America are essentially completed and Quebecor World is uniquely positioned to produce even greater returns when the economy recovers."
| For immediate release | Page 2 of 5 |
In Europe revenues increased 17% to $248 million in the third quarter and operating margins also increased. Much of this was due to the Company's acquisition of the printing assets of Hachette Filipacchi and an improvement in our business outside France. The Company is still being impacted negatively by the underperformance of its French operations and expects to announce additional measures in the fourth quarter to reduce costs that will materially improve French results going forward.
In Latin America our business continues to grow. In the third quarter revenues increased 12% to $45 million, operating income tripled to $5.2 million and margins increased to 11.6%. During the quarter our facility in Mexico City completed delivery of the Mexico City telephone directories that are among the largest in the world. In all, the 3.6 million directories contain more than five billion pages. Our Latin American team is winning market share and continuing to leverage the Company's relationships with North American and European retailers and publishers demonstrating they can use our Latin American platform to improve delivery and reduce costs while ensuring consistent world level quality.
Free cash flow from operations was $97 million for the third quarter of 2002 and $443 million for the trailing 12 months ended September 30, 2002. For the period ending September 30, 2002, long-term debt was reduced by $268 million compared to the same period last year. On a year-to-date basis, financial expenses were $127.5 million, a 20% improvement compared with the same period last year due to reduced bank borrowings and lower rates of interest on long-term debt and securitization. This improvement reflects management's efforts to strengthen the Company's financial condition through tight management of working capital and capital spending requirements. This strategy has resulted in lower financial expense that has contributed to earnings per share. The Company intends to continue this strategy in the short term.
In recognition of the Company's strong earnings performance and strong financial position the Board of Directors is increasing its quarterly dividend $0.01 cent per share to $0.13 per share or $0.52 per share on an annualized basis on Multiple Voting Shares and Subordinate Voting Shares. The Board also declared a dividend of CDN$0.3125 per share on Series 2 Preferred Shares, CDN$0.4219 per share on Series 4 Preferred Shares and CDN$0.43125 on Series 5 Preferred Shares. The dividends are payable on December 1, 2002 to shareholders of record at the close of business November 15, 2002.
Quebecor World Inc. also announced today that it has filed its quarterly report for the quarter ended September 30, 2002 with the Securities and Exchange Commission. The report contains certifications from Charles G. Cavell, President and Chief Executive Officer and Christian M. Paupe, Executive Vice President, Chief Administrative Officer and Chief Financial
| For immediate release | Page 3 of 5 |
Officer, that the periodic report fully complies with the Securities Exchange Act of 1934 and that the information contained in the report fairly presents, in all material respects, the financial condition and results of operations of the company. These certifications are in accordance with the requirements of the Sarbanes-Oxley Act.
Financial statements are available on the Company's website and through the SEDAR and SEC filings.
Sedar web address: www.sedar.com
SEC web address: www.sec.gov
Quebecor World To Webcast Investor Conference Call on October 29, 2002
Quebecor World Inc. will broadcast its Third Quarter conference call live over the Internet on October 29, 2002 at 8:30 AM.
The conference call, which will last approximately one hour, will be webcast live and can be accessed on the Quebecor World web site:
http://www.quebecorworld.com/htmen/webcasts/Q302
Prior to the call please ensure that you have the appropriate software. The Quebecor World web address listed above has instructions and a direct link to download the necessary software, free of charge.
Anyone unable to attend this conference call may listen to the replay tape by phoning (416) 695-5800 or (800) 408-3053 passcode 1292132, available from October 29, 2002 to November 12, 2002.
Except for historical information contained herein, the statements in this release are forward-looking and made pursuant to the safe harbor provisions of the Private Securities Litigation Reform Act of 1995. Forward-looking statements involve known and unknown risks and uncertainties that may cause the Company's actual results in future periods to differ materially from forecasted results.
Those risks include, among others, changes in customers' demand for the Company's products, changes in raw material and equipment costs and availability, seasonal changes in customer orders, pricing actions by the Company's competitors, and general changes in economic conditions.
| For immediate release | Page 4 of 5 |
Quebecor World Inc. (NYSE; TSX: IQW) is the largest commercial printer in the world. It is a market leader in most of its major product categories which include magazines, inserts and circulars, books, catalogs, specialty printing and direct mail, directories, digital pre-media, logistics, mail list technologies and other value added services. Quebecor World Inc. has approximately 40,000 employees working in more than 160 printing and related facilities in the United States, Canada, Brazil, France, the United Kingdom, Belgium, Spain, Austria, Sweden, Switzerland, Finland, Chile, Argentina, Peru, Colombia, Mexico and India.
Web address:www.quebecorworld.com
-30 - -
For further information, please contact:
Jeremy Roberts
Vice-President,
Corporate Finance and
Investor Relations
Quebecor World Inc.
(514) 877-5118
(800) 567-7070
Tony Ross
Director, Communications
Quebecor World Inc.
(514) 877-5317
(800) 567-7070
| For immediate release | Page 5 of 5 |
QUEBECOR WORLD INC.
FINANCIAL HIGHLIGHTS
Periods ended September 30
(In millions of US dollars, except per share amounts)
(Unaudited)
| | Three months | | Nine months | | ||||||||||||||
|---|---|---|---|---|---|---|---|---|---|---|---|---|---|---|---|---|---|---|
| | 2002 | 2001 | Change | 2002 | 2001 | Change | ||||||||||||
| Consolidated Results | ||||||||||||||||||
| Revenues | $ | 1,617.9 | $ | 1,625.2 | — | % | $ | 4,548.6 | $ | 4,704.2 | (3 | )% | ||||||
| Operating income before amortization | 251.3 | 258.5 | (3 | )% | 652.2 | 720.7 | (10 | )% | ||||||||||
| Operating income | 167.9 | 172.7 | (3 | )% | 402.5 | 468.1 | (14 | )% | ||||||||||
| Net income* | 98.5 | 70.8 | 39 | % | 208.7 | 176.5 | 18 | % | ||||||||||
| Cash provided from operating activities | 130.2 | 12.1 | 212.6 | 135.8 | ||||||||||||||
| Free cash flow from operations** | 97.4 | (58.2 | ) | 57.4 | (97.9 | ) | ||||||||||||
| Operating margin before amortization | 15.5 | % | 15.9 | % | 14.3 | % | 15.3 | % | ||||||||||
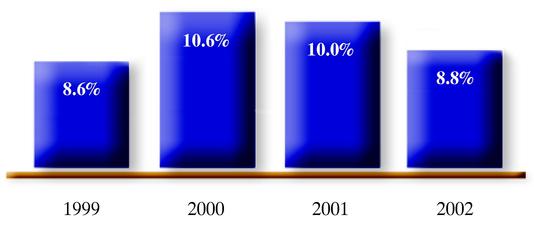
| Operating margin | 10.4 | % | 10.6 | % | 8.8 | % | 10.0 | % | ||||||||||
| Segmented Information | ||||||||||||||||||
| Revenues | ||||||||||||||||||
| North America | $ | 1,324.2 | $ | 1,373.4 | (4 | )% | $ | 3,714.8 | $ | 3,941.5 | (6 | )% | ||||||
| Europe | 248.5 | 211.5 | 17 | % | 699.3 | 651.9 | 7 | % | ||||||||||
| Latin America | 45.2 | 40.5 | 12 | % | 135.2 | 111.3 | 21 | % | ||||||||||
Operating income | ||||||||||||||||||
| North America | $ | 157.8 | $ | 163.0 | (3 | )% | $ | 389.1 | $ | 427.0 | (9 | )% | ||||||
| Europe | 13.3 | 9.7 | 37 | % | 27.0 | 38.8 | (30 | )% | ||||||||||
| Latin America | 5.2 | 1.2 | 333 | % | 10.2 | 5.5 | 85 | % | ||||||||||
Operating margins | ||||||||||||||||||
| North America | 11.9 | % | 11.9 | % | 10.5 | % | 10.8 | % | ||||||||||
| Europe | 5.3 | % | 4.6 | % | 3.9 | % | 6.0 | % | ||||||||||
| Latin America | 11.6 | % | 2.9 | % | 7.5 | % | 4.9 | % | ||||||||||
| Financial Position | ||||||||||||||||||
| Working capital | $ | (39.0 | ) | $ | 198.5 | |||||||||||||
| Total assets | 6,308.6 | 6,603.6 | ||||||||||||||||
| Long-term debt (including convertible notes) | 2,094.7 | 2,409.1 | ||||||||||||||||
| Shareholders' equity | 2,617.3 | 2,651.3 | ||||||||||||||||
| Debt-to-capitalization | 44:56 | 47:53 | ||||||||||||||||
| Per Share Data | ||||||||||||||||||
| Earnings* | ||||||||||||||||||
| Basic | $ | 0.65 | $ | 0.46 | 41 | % | $ | 1.33 | $ | 1.14 | 17 | % | ||||||
| Diluted | $ | 0.64 | $ | 0.46 | 39 | % | $ | 1.31 | $ | 1.13 | 16 | % | ||||||
| Dividends on equity shares | $ | 0.12 | $ | 0.12 | — | % | $ | 0.36 | $ | 0.34 | 6 | % | ||||||
| Book value | $ | 15.33 | $ | 15.66 | (2 | )% | ||||||||||||
- *
- Effective January 1, 2002, net income and earnings per share reflect the new accounting policy adopted by the Company under which goodwill is no longer amortized.
- **
- Cash provided from operating activities, less capital expenditures net of proceeds from disposals, and preferred share dividends.
Quebecor World Inc.
Supplemental Disclosure
As furnished to the Securities and Exchange Commission on October 28th, 2002
For the Third Quarter
Ended September 30th, 2002
For Public Release on October 28th, 2002
http://www.quebecorworld.com/htmen/20_0/Pdf/Q303-Supp_Disclosure.pdf
QUEBECOR WORLD
THIRD QUARTER ENDED SEPTEMBER 30, 2002
| | Page | |
|---|---|---|
| 1. Highlights | 1 | |
| 2. Recent Developments | 4 | |
| 3. 2001 Restructuring | 5 | |
| 4. Leadership Appointments | 6 | |
| 5. Segmented Results of Operations | 7 | |
| 6. Breakdown of Revenues by Product Group | 8 | |
| 7. Financial Condition | 9 | |
| 8. Discussion of Consensus Earnings | 10 |
Except for historical information contained herein, the statements in this document are forward-looking and made pursuant to the safe harbor provisions of the Private Securities Litigation Reform Act of 1995. Forward-looking statements involve known and unknown risks and uncertainties, which may cause our actual results in future periods to differ materially from forecasted results. Those risks include, among others, changes in customer demand for our products, changes in raw material and equipment costs and availability, seasonal changes in customer orders, pricing actions by our competitors and general changes in economic conditions.
Consolidated Results(1)
Three Months Ended September 30, 2002
Revenues: For the third quarter ended September 30, 2002, revenues were $1,618 million, similar to 2001.
Earnings per Share: Earnings per share for the third quarter ended September 30, 2002 increased 39% to $0.64 from $0.46 for the same period last year, or 12% higher than earnings per share before goodwill amortization in 2001 of $0.57.
Net Income: Net income for the third quarter ended September 30, 2002 increased 39% to $99 million from $71 million last year, or 13.5% higher than net income before goodwill amortization in 2001 of $87 million.
Operating Income: Operating income decreased 3% to $168 million, compared with $173 million for the corresponding period last year. The operating income margin for the quarter was 10.4% compared to 10.6% in 2001.
Free Cash Flow: For the third quarter ended September 30, 2002, free cash flow was $97 million, compared to an outflow of $58 million for the third quarter of 2001.
Nine Months Ended September 30, 2002
Revenues: For the nine months ended September 30, 2002, revenues were $4,549 million, down 3% on 2001.
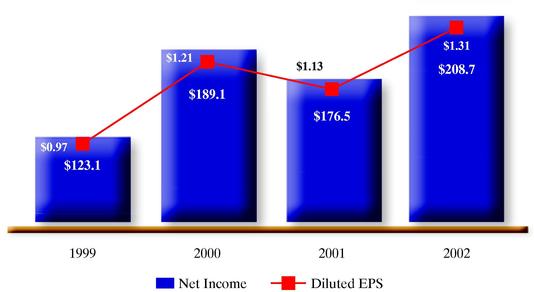
Earnings per Share: For the nine months ended September 30, 2002, earnings per share were $1.31 versus $1.13 last year ($1.45 before goodwill amortization).
Net Income: For the nine months ended September 30, 2002, net income amounted to $209 million, versus $176 million last year or $224 million before goodwill amortization.
Operating Income: Operating income decreased 14% to reach $403 million, compared with $468 million for the corresponding period last year. The operating income margin decreased from 10% in 2001 to 8.8% in 2002.
Free Cash Flow: For the nine months ended September 30, 2002, free cash flow was $57 million compared to an outflow of $98 million in 2001.
- (1)
- Adoption of CICA Section 3062: Goodwill and Other Intangible Assets
Effective January 1, 2002, Quebecor World adopted the accounting standards prescribed by Section 3062 of the CICA Handbook. Under Section 3062, goodwill is no longer amortized to the income statement.
1
Reducing Cost Structure
Quebecor World continued to focus during the third quarter 2002 on reducing its cost structure, generating free cash flow and repaying debt. The 2001 Restructuring Plan was substantially completed by the end of September 2002 with 10 plant closures effected. The North American operating margin of 11.9% in Q3 2001 was matched in 2002 despite a 4% decrease in revenues. Continuing to win new customers is helping to offset the revenue and pricing pressures, and helping to keep operating margins at industry-leading levels.
Solid European Operations
In Europe, outside of France, the third quarter operating margin increased from 7.2% to 10.6% and is now accretive to the Company's consolidated margin. This improvement comes from a solid focus on managing costs.
Strengthening Balance Sheet
Excluding acquisitions, total debt has been reduced by 17% since September 30th, 2001, as working capital decreased by approximately $238 million over the same period. Financial expenses decreased by 25% largely as a result of management focus on strengthening the Company's financial condition, as well as the benefits of reduced bank borrowings and lower rates of interest on long-term debt and securitization.
Consolidated Results
| | For the Three Months Ended September 30 | For the Nine Months Ended September 30 | ||||||||||||||
|---|---|---|---|---|---|---|---|---|---|---|---|---|---|---|---|---|
| | 2002 | Change | 2001 | 2002 | Change | 2001 | ||||||||||
| | (in $ millions except margins and per share data) | |||||||||||||||
| Revenues | $ | 1,618 | — | $ | 1,625 | $ | 4,549 | (3% | ) | $ | 4,704 | |||||
| EBITDA | 251 | (3% | ) | 259 | 652 | (10% | ) | 721 | ||||||||
| Operating income | 168 | (3% | ) | 173 | 403 | (14% | ) | 468 | ||||||||
| Net income(1) | 99 | +39% | 71 | 209 | +18% | 176 | ||||||||||
| Diluted Earnings per share(1) | $ | 0.64 | +39% | $ | 0.46 | $ | 1.31 | +16% | $ | 1.13 | ||||||
| EBITDA margin | 15.5% | 15.9% | 14.3% | 15.3% | ||||||||||||
| Operating margin | 10.4% | 10.6% | 8.8% | 10.0% | ||||||||||||
- (1)
- Effective January 1, 2002, as per adoption of FAS 142 and CICA 3062, goodwill is no longer amortized to the income statement.
Reconciliation of Reported and Cash Earnings
| | For the Three Months Ended September 30 | For the Nine Months Ended September 30 | |||||||||||
|---|---|---|---|---|---|---|---|---|---|---|---|---|---|
| | 2002 | 2001 | 2002 | 2001 | |||||||||
| | (in $ millions except per share data) | ||||||||||||
| Reported net income | $ | 99 | $ | 71 | $ | 209 | $ | 176 | |||||
| Goodwill amortization, net of income taxes | — | $ | 16 | — | $ | 47 | |||||||
| Adjusted net income | $ | 99 | $ | 87 | $ | 209 | $ | 224 | |||||
| Adjusted earnings per share | |||||||||||||
| Basic | $ | 0.65 | $ | 0.58 | $ | 1.33 | $ | 1.47 | |||||
| Diluted | $ | 0.64 | $ | 0.57 | $ | 1.31 | $ | 1.45 | |||||
2
In August 2001, the Accounting Standards Board of the Canadian Institute of Chartered Accountants ("CICA") issued Handbook Section 3062, Goodwill and Other Intangible Assets. Under Section 3062, goodwill is not amortized and is tested for impairment annually or, more frequently, if events or changes in circumstances indicate that the asset might be impaired.
Quebecor World tested for impairment as at January 1, 2002. As of the date of adoption, Quebecor World had unamortized goodwill of approximately $2.5 billion.
Quebecor World has determined that there is no impairment of goodwill.
Impacts of Currency Translation and Other Factors
| IMPACT ON: | | Third Quarter | Year to Date | ||||||
|---|---|---|---|---|---|---|---|---|---|
| | | (in $ millions of US dollars, except per share data) | |||||||
| Revenues | Weaker foreign currencies | 8.3 | (13.3 | ) | |||||
| Business Acquisitions | 41.4 | 141.0 | |||||||
| TOTAL | $ | 49.7 | $ | 127.7 | |||||
| Operating Income | Weaker foreign currencies | (0.2 | ) | (1.2 | ) | ||||
| Business Acquisitions | 5.4 | 17.1 | |||||||
| TOTAL | $ | 5.2 | $ | 15.9 | |||||
| Earnings Per Share (pre-tax) | Weaker foreign currencies | (0.00 | ) | (0.01 | ) | ||||
| Business Acquisitions | 0.04 | 0.12 | |||||||
| TOTAL | $ | 0.04 | $ | 0.11 | |||||
| (1) | Non-operating expenses for the three months ended September 30, 2002 were $5.2 million compared with $3.2 million for the same period in 2001. |
| Non-operating expenses for the nine months ended September 30, 2002 were $4.9 million compared with $6.0 million for the same period in 2001. |
3
Quebecor World Dominates at 15th Annual Gold Ink Awards
Quebecor World won 55 awards at the 15th Annual Gold Ink Awards Competition, more than twice the number won by any of its major competitors. The Gold Ink Awards are widely recognized as North America's most prestigious print competition.
Quebecor World Produces Award-winning Annual Report
Quebecor World's 2001 Annual Report was judged best in its category in a competition sponsored by the League of American Communications Professionals. Quebecor World placed first in the category of media and advertising companies with revenues of more than $1 billion and more than 10,000 employees. Overall 600 companies from across North America participated in the competition. Quebecor World financial reporting received a perfect 10 out of 10.
Quebecor World awarded multi-year contract from L.L.Bean
Quebecor World was awarded a multi-year contract by L.L.Bean to print one hundred percent of its catalog progam. The total sales under the duration of the new contract are expected to exceed $100 million. This represents a significant change by L.L.Bean in giving one printer responsibility for its entire catalog production. Under the new contract, Quebecor World will also provide L.L.Bean with mail list services, as well as order form production.
Quebecor World Series 2 Preferred Shares conversion
Effective December 1, 2002, holders of Quebecor World Series 2 Preferred Shares have the right to convert their shares on a one-for-one basis into Series 3 Preferred Shares. After that date, the Series 2 Preferred Shares will pay a monthly floating dividend based on the Canadian Prime Rate. The Series 3 Preferred Shares will pay a fixed quarterly dividend which will be equal to 145% of the yield on 5 year Government of Canada bonds to be established on November 12, 2002, for the 5 year period ending December 1, 2007. The Company sent a Notice of Conversion to holders on October 17, 2002 explaining their rights, and they have until November 18, 2002 to remit their shares for conversion.
4
Progress Report and Cash Restructuring Costs
The restructuring initiatives announced in 2001 were largely completed at September 30, 2002, with nearly 3,000 employee positions eliminated as a result. Ten facilities have been closed and more than 20 pieces of equipment have been successfully relocated. Cash restructuring costs incurred during the quarter were $18 million. Total cash costs to date under the 2001 Restructuring Plan were $83 million as at the end of September. This level of costs does not reflect the progress of the restructuring due to trailing severance payments, future lease payments and other delayed exit costs.
Progress Report
| Key Projects | Status | Completion Date | ||
|---|---|---|---|---|
| Metairie | closed | completed | ||
| Oklahoma City | closed | completed | ||
| Eagle | closed | completed | ||
| Chicago Wessel | closed | completed | ||
| Sayers | closed | completed | ||
| Oakwood | closed | completed | ||
| Orlando Litho | closed | completed | ||
| Arlington Heights | closed | completed | ||
| Hawkins | closed | completed | ||
| Buenos Aires | closed | completed | ||
| Other Projects | under review |
Cash Restructuring Costs
| Total cash costs incurred for restructuring and other special charges are as follows: | ||
|---|---|---|
| Q4 2001 | $ 24 million | |
| Q1 2002 | $ 19 million | |
| Q2 2002 | $ 22 million | |
| Q3 2002 | $ 18 million | |
| Total cash costs to date | $ 83 million | |
| Total expected cash costs | $130 million | |
5
North American Operations
On September 25th, 2002 Quebecor World announced the appointments ofDavid BolesandJohn Paloianto the positions of co-Chief Operating Officers, Quebecor World North America. Currently President of the Magazine/Catalog Product Group, John Paloian has now assumed additional leadership responsibility for the Commercial/Direct Product Group, as well as the Logistics/Distribution Group. David Boles, currently President of the Retail Product Group, has now assumed additional leadership responsibility for the Company's Que-Net pre-media division, the Directory Group and the Book Group. Both John and David report to Charles Cavell, President and CEO of the Company, and will assist him in setting strategic direction as members of the Office of the CEO. Together, John and David bring 34 years of industry experience to the Quebecor World leadership team.
6
5. SEGMENTED RESULTS OF OPERATIONS
North America
| | For the Three Months Ended September 30 | For the Nine Months Ended September 30 | ||||||||||||||
|---|---|---|---|---|---|---|---|---|---|---|---|---|---|---|---|---|
| | 2002 | Change | 2001 | 2002 | Change | 2001 | ||||||||||
| | (in $ millions except margins) | |||||||||||||||
| Revenues | $ | 1,324 | (4% | ) | $ | 1,373 | $ | 3,715 | (6% | ) | $ | 3,941 | ||||
| EBITDA(1) | $ | 225 | (4% | ) | $ | 234 | $ | 589 | (7% | ) | $ | 635 | ||||
| Operating income(1) | $ | 158 | (3% | ) | $ | 163 | $ | 389 | (9% | ) | $ | 427 | ||||
| EBITDA margin | 17.0% | 17.0% | 15.9% | 16.1% | ||||||||||||
| Operating margin | 11.9% | 11.9% | 10.5% | 10.8% | ||||||||||||
| (1) | Non-operating expenses for the three months ended September 30, 2002 were $5.9 million compared with $0.5 million for the same period in 2001. |
| Non-operating expenses for the nine months ended September 30, 2002 were $6.2 million compared with $2.7 million for the same period in 2001. |
Europe
| | For the Three Months Ended September 30 | For the Nine Months Ended September 30 | ||||||||||||||
|---|---|---|---|---|---|---|---|---|---|---|---|---|---|---|---|---|
| | 2002 | Change | 2001 | 2002 | Change | 2001 | ||||||||||
| | (in $ millions except margins) | |||||||||||||||
| Revenues | $ | 248 | +17% | $ | 212 | $ | 699 | +7% | $ | 652 | ||||||
| EBITDA(1) | $ | 29 | +27% | $ | 23 | $ | 70 | (9% | ) | $ | 77 | |||||
| Operating income(1) | $ | 13 | +36% | $ | 10 | $ | 27 | (31% | ) | $ | 39 | |||||
| EBITDA margin | 11.6% | 10.7% | 10.0% | 11.9% | ||||||||||||
| Operating margin | 5.3% | 4.6% | 3.9% | 6.0% | ||||||||||||
| (1) | Non-operating expenses for the three months ended September 30, 2002 were $0.0 million compared with $1.0 million for the same period in 2001. |
| Non-operating revenues for the nine months ended September 30, 2002 were $0.3 million compared with non-operating expenses of $1.5 million for the same period in 2001. |
Latin America
| | For the Three Months Ended September 30 | For the Nine Months Ended September 30 | ||||||||||||||
|---|---|---|---|---|---|---|---|---|---|---|---|---|---|---|---|---|
| | 2002 | Change | 2001 | 2002 | Change | 2001 | ||||||||||
| | (in $ millions except margins) | |||||||||||||||
| Revenues | $ | 45 | +12% | $ | 40 | $ | 135 | +21% | $ | 111 | ||||||
| EBITDA(1) | $ | 6.0 | +100% | $ | 3.0 | $ | 16.4 | +51% | $ | 10.9 | ||||||
| Operating income(1) | $ | 5.2 | +333% | $ | 1.2 | $ | 10.2 | +85% | $ | 5.5 | ||||||
| EBITDA margin | 13.3% | 7.4% | 12.1% | 9.8% | ||||||||||||
| Operating margin | 11.6% | 2.9% | 7.5% | 4.9% | ||||||||||||
| (1) | Non-operating expenses for the three months ended September 30, 2002 were $1.6 million compared with $1.6 million for the same period in 2001. |
| Non-operating expenses for the nine months ended September 30, 2002 were $2.1 million compared with $1.6 million for the same period in 2001. |
7
6. BREAKDOWN OF REVENUES BY PRODUCT GROUP
| | For the Three Months Ended September 30 | For the Nine Months Ended September 30 | |||||||||||||||
|---|---|---|---|---|---|---|---|---|---|---|---|---|---|---|---|---|---|
| | 2002 | Change | 2001 | 2002 | Change | 2001 | |||||||||||
| | (in $ millions) | ||||||||||||||||
| North America | |||||||||||||||||
| Retail | $ | 307 | +6% | $ | 290 | $ | 838 | +10% | $ | 764 | |||||||
| Magazines & Catalog | $ | 441 | (5% | ) | $ | 464 | $ | 1,228 | (9% | ) | $ | 1,350 | |||||
| Book | $ | 143 | (2% | ) | $ | 147 | $ | 386 | (3% | ) | $ | 399 | |||||
| Directory | $ | 116 | (10% | ) | $ | 129 | $ | 347 | (7% | ) | $ | 374 | |||||
| Commercial & Direct | $ | 167 | (19% | ) | $ | 206 | $ | 514 | (20% | ) | $ | 645 | |||||
| Other Domestic Revenues | $ | 149 | +9% | $ | 138 | $ | 400 | (2% | ) | $ | 410 | ||||||
| North America | $ | 1,324 | (4% | ) | $ | 1,373 | $ | 3,715 | (6% | ) | $ | 3,941 | |||||
| Europe | 248 | +17% | 212 | 699 | +7% | $ | 652 | ||||||||||
| Latin America | 45 | +12% | 40 | 135 | +21% | $ | 111 | ||||||||||
| Quebecor World Inc. | $ | 1,618 | — | $ | 1,625 | $ | 4,549 | (3% | ) | $ | 4,704 | ||||||
8
Summarized Consolidated Balance Sheets
| | September 30, 2002 | Change | September 30, 2001 | |||
|---|---|---|---|---|---|---|
| | (in $ millions except financial ratios) | |||||
| Non-cash working capital(1) | 57 | (82% | ) | 314 | ||
| (in % of 12-month trailing revenues) | 0.9% | 4.9% | ||||
| Net fixed assets | 2,635 | (3% | ) | 2,726 | ||
| Total assets | 6,309 | (4% | ) | 6,604 | ||
| Shareholders' equity | 2,617 | (1% | ) | 2,651 | ||
| Long-Term Debt (including the current portion) | 1,980 | (12% | ) | 2,248 | ||
| Convertible Debentures (including the current portion) | 115 | (29% | ) | 161 | ||
| Debt: Capitalization | 44:56 | 47:53 | ||||
| EBITDA Coverage Ratio(2) | 5.0 | 4.7 | ||||
| EBIT Coverage Ratio(2) | 3.1 | 3.2 | ||||
(1) Before restructuring liabilities.
(2) 12-month trailing average before restructuring and other charges.
| | September 30, 2002 | Change | September 30, 2001 | |||||||
|---|---|---|---|---|---|---|---|---|---|---|
| | (in $ millions of US dollars) | |||||||||
| Bank Indebtedness | $ | 0 | $ | 1 | ||||||
| Current Portion of Long-Term Debt and Convertible Notes | 43 | (54% | ) | 94 | ||||||
| Long-Term Debt | 1,937 | (12% | ) | 2,202 | ||||||
| Convertible Notes | 115 | +2% | 113 | |||||||
| Total Debt | 2,095 | (13% | ) | 2,410 | ||||||
| less: Retail Printing Corp. | 128 | 128 | ||||||||
| less: Hachette Filipacchi | 71 | |||||||||
| Total Debt related to Acquisitions | 198 | 128 | ||||||||
| Total Debt Excluding Acquisitions | $ | 1,896 | (17% | ) | $ | 2,282 | ||||
| Free Cash Flow — 2002 Year to Date | $ | 57 | $ | (98 | ) | |||||
| Free Cash Flow — 12 Months Trailing | $ | 443 | ||||||||
9
8. DISCUSSION OF CONSENSUS EARNINGS
DILUTED EARNINGS PER SHARE(1)
| | First Quarter | Second Quarter | Third Quarter | Fourth Quarter | Full Year | |||||||||||||||||||||||
|---|---|---|---|---|---|---|---|---|---|---|---|---|---|---|---|---|---|---|---|---|---|---|---|---|---|---|---|---|
| | EPS | % | EPS | % | EPS | | % | EPS | | % | EPS | | % | |||||||||||||||
| 1999 | $ | 0.18 | +13% | $ | 0.36 | +16% | $ | 0.43 | +13% | $ | 0.58 | +32% | $ | 1.55 | +20% | |||||||||||||
| 2000 | $ | 0.24 | +33% | $ | 0.40 | +11% | $ | 0.58 | +35% | $ | 0.69 | +19% | $ | 1.90 | +23% | |||||||||||||
| 2001 | $ | 0.27 | +13% | $ | 0.41 | +2% | $ | 0.46 | -21% | $ | 0.45 | -35% | $ | 1.58 | -17% | |||||||||||||
| IQW 2002 Guidance — July 30, 2002 | $1.90-2.00 | |||||||||||||||||||||||||||
| 2002 | $ | 0.28 | +4% | $ | 0.40 | -2% | $ | 0.62 | (2) | +34% | $ | 0.67 | (2) | +49% | $ | 1.96 | (3) | +24% | ||||||||||
SUMMARY OF EARNINGS ESTIMATES 2002(1)
| | Third Quarter(2) | Fourth Quarter(2) | Full Year(3) | ||||||
|---|---|---|---|---|---|---|---|---|---|
| Average | $ | 0.62 | $ | 0.67 | $ | 1.96 | |||
| High | $ | 0.64 | $ | 0.72 | $ | 2.05 | |||
| Low | $ | 0.59 | $ | 0.64 | $ | 1.89 | |||
| Number of Analysts | 10 | 10 | 13 | ||||||
SUMMARY OF EARNINGS ESTIMATES 2003(1)
| | Full Year(3) | ||
|---|---|---|---|
| Average | $ | 2.31 | |
| High | $ | 2.64 | |
| Low | $ | 2.15 | |
| Number of Analysts | 13 | ||
| (1) | Before restructuring & other special charges. |
(2) | Based on management's survey of 10 sell-side analysts as at October 18, 2002. |
(3) | Based on management's survey of 13 sell-side analysts as at October 18, 2002. |
10
MANAGEMENT'S DISCUSSION AND ANALYSIS OF
FINANCIAL CONDITION AND RESULTS OF OPERATIONS
Quebecor World is the largest commercial print media services company in the world. We are the market leader in most of our product categories and geographies. This market leading position has been built through a combination of successfully integrated acquisitions, investments in key strategic technologies and a commitment to building long-term partnerships with the world's leading print media customers.
We have facilities in the United States, Canada, France, the United Kingdom, Spain, Switzerland, Sweden, Finland, Austria, Belgium, Brazil, Chile, Argentina, Peru, Colombia, Mexico and India.
Review of Third Quarter and Year-to-Date
Despite the difficult global economic environment, Quebecor World was able to grow diluted earnings per share in the third quarter by 12% on a comparable basis to the same quarter last year. Diluted earnings per share for the quarter was $0.64 compared to $0.57, before goodwill amortization, for the same quarter last year.
Quebecor World continues to focus on cost reduction, generating free cash flow and paying down debt. In the third quarter, we made significant progress on all three fronts to the benefit of our business and our shareholders. By the end of September 2002, most of our key projects from the restructuring program announced in October 2001 had been largely completed. This combined with strict cost containment resulted in double digit operating margins for the quarter, despite lower revenues due to continuing difficult market conditions. The consolidated operating margin for the third quarter stood at 10.4% in 2002 compared to 10.6% in 2001. In the third quarter, we generated free cash flow of $97 million to reach a free cash flow year to date of $57 million compared to an outflow of $98 million for the nine-month period ended September 30, 2001. With most of this free cash flow used to reduce our debt, we ended September 2002 with a debt to capitalization ratio of 44:56 compared to 46:54 at the end of June 2002.
Revenues for the quarter were $1,618 million, $7 million lower than the same period in 2001. On a year-to-date basis, consolidated revenues decreased from $4,704 million in 2001 to $4,549 million in 2002.
Our North American operations continued to face challenging market conditions. Revenues for the third quarter were $1,324 million, down 4% compared to $1,373 million in 2001. However, as can be seen from Figure 1, there were some encouraging signs at the end of the quarter. Magazine advertising pages, as measured by the Publishers Information Bureau, increased by 2.7% in September 2002. This is only the second monthly year-over-year increase since November 2000. Also, we are clearly incurring benefits from our restructuring initiatives as we were able to match our 2001 operating margin of 11.9% on reduced revenues in a competitive pricing environment.
11
U.S. Magazine Advertising Pages 2000-2002 (Monthly)
Percentage Year-Over-Year Change

| Figure 1 | Source: Publishers Information Bureau (PIB) |
Our European operations, excluding France, improved revenues, operating income and operating margins compared to last year, for both the three-month and nine-month periods ended September 30. However, our European results were negatively impacted by the underperformance of our French operations, which represent approximately half of our European platform. During the fourth quarter, the Company is expected to announce additional measures to improve the performance of its French platform.
| | European Financial Highlights ($ millions) | |||||||||||||||||||
|---|---|---|---|---|---|---|---|---|---|---|---|---|---|---|---|---|---|---|---|---|
| | Three Months | Nine Months | ||||||||||||||||||
| | 2002 | 2001 | 2000 | 2002 | 2001 | 2000 | ||||||||||||||
| Europe excluding France | ||||||||||||||||||||
| Revenues | $ | 137.9 | $ | 113.3 | $ | 109.0 | $ | 382.3 | $ | 343.9 | $ | 337.5 | ||||||||
| Operating income | $ | 14.6 | $ | 8.2 | $ | 10.5 | $ | 34.6 | $ | 28.7 | $ | 31.0 | ||||||||
| Operating margin | 10.6 | % | 7.2 | % | 9.6 | % | 9.1 | % | 8.3 | % | 9.2 | % | ||||||||
| France | ||||||||||||||||||||
| Revenues | $ | 110.6 | $ | 98.2 | $ | 99.9 | $ | 317.0 | $ | 308.0 | $ | 316.6 | ||||||||
| Operating income | $ | (1.3 | ) | $ | 1.5 | $ | 3.4 | $ | (7.6 | ) | $ | 10.1 | $ | 11.2 | ||||||
| Operating margin | (1.2 | )% | 1.5 | % | 3.4 | % | (2.4 | )% | 3.3 | % | 3.5 | % | ||||||||
| Europe | ||||||||||||||||||||
| Revenues | $ | 248.5 | $ | 211.5 | $ | 208.9 | $ | 699.3 | $ | 651.9 | $ | 654.1 | ||||||||
| Operating income | $ | 13.3 | $ | 9.7 | $ | 13.9 | $ | 27.0 | $ | 38.8 | $ | 42.2 | ||||||||
| Operating margin | 5.3 | % | 4.6 | % | 6.7 | % | 3.9 | % | 6.0 | % | 6.5 | % | ||||||||
Figure 2
In Latin America, revenues, operating income and operating margin increased in the third quarter and the nine-month period of 2002 compared to last year. Third quarter activities have focused on leveraging the Company's relationship with key customer accounts in North America and Europe in order to enhance client service and to build sales volume even during periods of economic change. The Latin American region is also working with the QW International Sales Team to demonstrate to global book clients such as McGraw Hill how they can use our Latin American platform to improve time to market while ensuring consistent world level quality.
12
Concerning its pension plans, management has reviewed funding exposure, actuarial and accounting assumptions, including discount rates, expected return on plan assets and the rate of compensation increases. The assumed return on assets for the Company's plans was reduced for its appropriateness in the current environment. This resulted in an increase of the pension expense that is reflected in our operating income.
Weighted average assumptions used in the
measurement of the Company's pension benefits
| | 2002 (estimated) | 2001 | ||
|---|---|---|---|---|
| Discount rate | 7.0% | 7.0% | ||
| Expected return on plan assets | 8.2% | 9.7% | ||
| Rate of compensation increase | 3.4% | 3.4% | ||
Figure 3
Financial expenses decreased by $13.2 million to $39.8 million in the third quarter of 2002, a 25% improvement. On a year-to-date basis, financial expenses were $127.5 million, a 20% improvement when compared to $159.2 million for the same period in 2001. This reduction was a result of lower interest rates on long-term debt and the securitization program as well as management's commitment to reduce debt and strengthen the Company's balance sheet.
The effective tax rate for the quarter and year-to-date ended September 30, 2002 was 22.7% and 23.5% respectively, compared with 26.7% for the three-month and nine-month periods of 2001. The improvement, this quarter, was mostly due to lower taxable income in jurisdictions with higher tax rates. The effective tax rate, before restructuring and other special charges, was 23.4% for the full year 2001.
Net income for the third quarter was $98.5 million, $27.7 million or 39% higher than 2001. Diluted earnings per share for the third quarter was $0.64, compared to $0.46 last year. For the nine-month period, net income was $208.7 million, an increase of $32.2 million or 18% compared to the same period in 2001. Diluted earnings per share was $1.31 compared to $1.13 for the same period last year.
The restructuring initiatives announced in 2001 were largely completed, in North America, as at September 30, 2002. Nearly 3,000 employee positions have been eliminated as a result of restructuring initiatives implemented to date. Ten facilities have been closed and more than twenty pieces of equipment have been successfully relocated.
At the end of the quarter, the Company entered into a detailed review of the remaining projects to be completed as per the original restructuring plan with respect to current global market conditions. This review will be completed in the 4th quarter and decisions will be taken based on the need for the available capacity to meet customer demands. In addition, this review will take into account our French platform and will likely include a further reduction of employee positions including the streamlining of our European corporate services.
Cash costs as presented in figure 4 do not reflect the progress of the restructuring due to trailing severance payments, future lease payments and other delayed exit costs. The cash costs incurred as at September 30, 2002 were as follows:
Restructuring Initiatives — Cash Costs ($ millions)
| | Restructuring Charges | Other Special Charges | Total | |||||||
|---|---|---|---|---|---|---|---|---|---|---|
| Balance as at Dec. 31, 2001 | $ | 98.5 | $ | 9.0 | $ | 107.5 | ||||
| Utilized | (55.6 | ) | (3.3 | ) | (58.9 | ) | ||||
| Balance as at September 30, 2002 | $ | 42.9 | $ | 5.7 | $ | 48.6 | ||||
Figure 4
13
Liquidity, Capital Resources and Financial Position
Free cash flow for the third quarter of 2002 amounted to $97 million, a $155 million increase compared to an outflow of $58 million for the same quarter last year. On a year-to-date basis, free cash flow was $57 million, compared to an outflow of $98 million for the nine-month period ended September 30, 2001. Working Capital was $(39) million as at September 30, 2002, compared to $199 million as at September 30, 2001. This decrease of $238 million was largely due to the Company's continued focus on collecting accounts receivable and to reduced inventory.
In March 2002, we acquired European Graphic Group S.A. ("E2G"), a subsidiary of Hachette Filipacchi Medias in Europe. E2G owns printing and bindery facilities in France and Belgium and a 50% ownership of Bayard Hachette Routage in France. This investment complements our European Gravure platform, and comes with a $400 million (exclusive of paper) long-term printing contract for Hachette's magazines in Europe. The purchase price consideration for this acquisition amounted to $70.7 million.
As at December 31, 2001, we had committed to repurchase, under the Normal Course Issuer Bid announced on April 6, 2001, a total of 148,500 Subordinate Voting Shares. The settlement of this commitment took place in January 2002, for a net cash consideration of Cdn$5.2 million ($3.5 million), at an average cost per share of Cdn$35.28 ($23.89). A total of 3,692,200 Subordinate Voting Shares, at an average cost per share of Cdn$40.36 ($27.54), were repurchased under the program which expired on April 5, 2002.
As at September 30, 2002, our debt level was at $2,095 million, a $315 million decrease compared to the end of September 2001. Including accounts receivable securitization, total debt would be $2,678 million, $340 million lower than last year (see figure 5). The debt to capitalization ratio also improved to 44:56 compared to 47:53 in 2001.
Total Debt and Accounts Receivable Securitization ($ millions)
| | September 30, 2002 | September 30, 2001 | ||||
|---|---|---|---|---|---|---|
| Bank indebtedness | $ | 0.1 | $ | 0.8 | ||
| Current portion of long-term debt and convertible notes | 43.2 | 94.1 | ||||
| Long-term debt | 1,937.0 | 2,202.2 | ||||
| Convertible notes | 114.5 | 112.8 | ||||
| Total debt | $ | 2,094.8 | $ | 2,409.9 | ||
| Accounts receivable securitization | 582.9 | 608.1 | ||||
| Total debt and accounts receivable securitization | $ | 2,677.7 | $ | 3,018.0 | ||
Figure 5
The average annual cash obligations over the next three years represent approximately 10% of the 2001 EBITDA before restructuring and other charges (see figure 6).
Contractual Cash Obligations ($ millions)
| | Remaining of 2002 | 2003 | 2004 | 2005 | 2006 | 2007 and thereafter | ||||||
|---|---|---|---|---|---|---|---|---|---|---|---|---|
| Long-term debt and convertible notes | — | 4 | 29 | — | 250 | 1,701 | ||||||
| Capital leases | 17 | 35 | 15 | 11 | 10 | 23 | ||||||
| Operating leases | 21 | 79 | 64 | 67 | 49 | 115 | ||||||
| Total contractual cash obligations | 38 | 118 | 108 | 78 | 309 | 1,839 | ||||||
Figure 6
We invested $29 million in ongoing capital projects during the third quarter of 2002 compared to $69 million for the same period last year. On a year-to-date basis, $141 million has been invested in capital projects in 2002 compared to $227 million in 2001. These capital expenditures were focused on implementing
14
the various restructuring initiatives together with customer-driven projects that will improve service and our cost position. Key expenditures included; expansion and improvements of our North American Retail platform, a new offset press at our Franklin, Kentucky facility, the expansion of our Mexico City facility and a new 48-page commercial press to increase capacity in our Spanish platform as well as several North American projects related to our restructuring activities.
We believe that our liquidity, capital resources and cash flow from operations are sufficient to fund planned capital expenditures, working capital requirements, interest and principal payments for the foreseeable future.
In the normal course of business, we are exposed to changes in interest rates and foreign exchange rates. However, we manage the interest rate exposure by having a balanced schedule of debt maturities as well as a combination of fixed and variable rate obligations. In addition, we have entered into interest rate swap agreements to manage this exposure.
We have also entered into foreign exchange forward contracts and cross-currency interest rate swaps to hedge the settlement of raw materials and equipment purchases, to set the exchange rate for cross-border sales and to manage our foreign exchange exposure on certain liabilities.
While the counterparties of these agreements expose us to credit loss in the event of non-performance, we believe that the possibility of incurring such a loss is remote due to the creditworthiness of the counterparties. We do not hold or issue any derivative financial instruments for trading purposes.
Concentrations of credit risk with respect to trade receivables are limited due to our diverse operations and large customer base. As at September 30, 2002, we had no significant concentrations of credit risk.
The Consolidated Financial Statements have been prepared using the same accounting policies described in the Company's latest Annual Report with the exception of the following items.
In August 2001, the Canadian Institute of Chartered Accountants ("CICA") issued Handbook Section 3062,Goodwill and Other Intangible Assets. Under Section 3062, goodwill is not amortized and is tested for impairment annually, or more frequently if events or changes in circumstances indicate that the asset might be impaired. The impairment test is carried out in two steps as explained in note 2(a) of the quarterly consolidated financial statements.
We have adopted Section 3062 effective January 1, 2002. As of the date of adoption, we had unamortized goodwill of approximately $2.5 billion. In accordance with the requirements of Section 3062, this change in accounting policy is not applied retroactively and the amounts presented for prior periods have not been restated for this change. The Company conducted the first step of the transitional goodwill impairment test as of the date of adoption and, based on this test, determined that there is no impairment. The impact of that change is presented in note 2(a) of the quarterly consolidated financial statements.
In November 2001, the CICA approved the modification of Section 1650 of the CICA handbook,Foreign Currency Translation, to eliminate the deferral and amortization of foreign currency translation gains and losses on long-lived monetary items. In the first quarter of 2002, we adopted the new recommendations retroactively. The effect of adopting the new recommendations did not have a significant impact on the consolidated balance sheet and consolidated statements of income and retained earnings and cash flows as at September 30, 2002.
Effective January 1, 2002 we adopted the new recommendations of CICA Handbook Section 3870,Stock-based Compensation and Other Stock-based Payments. This Section establishes standards for the recognition, measurement and disclosure of stock-based compensation and other stock-based payments made in exchange for goods and services. These new recommendations require that compensation for all awards made to non-employees and certain awards made to employees, including stock appreciation rights, direct awards of stock and awards that call for settlement in cash or other assets, be measured and recorded in the financial statements at fair value.
15
As permitted by Section 3870, we have chosen to continue our existing policy of recording no compensation cost on the grant of stock options to employees. Any consideration paid by employees on exercise of stock options is credited to capital stock. Please refer to note 2(c) for stock-based compensation.
The operations of our business are seasonal, with approximately two thirds of historical operating income recognized in the second half of the fiscal year, primarily due to the higher number of magazine pages, new product launches and back-to-school, retail and holiday catalog promotions.
Except for historical information contained herein, the statements in this document are forward-looking and made pursuant to the safe harbor provisions of the Private Securities Litigation Reform Act of 1995. Forward-looking statements involve known and unknown risks and uncertainties, which may cause our actual results in future periods to differ materially from forecasted results. Those risks include, among others, changes in customer demand for our products, changes in raw material and equipment costs and availability, seasonal changes in customer orders, pricing actions by our competitors and general changes in economic conditions.
16
CONSOLIDATED STATEMENTS OF INCOME AND RETAINED EARNINGS
Periods ended September 30
(In millions of US dollars, except for earnings per share amounts)
(Unaudited)
| | | Three months | Nine months | |||||||||||||
|---|---|---|---|---|---|---|---|---|---|---|---|---|---|---|---|---|
| | Notes | 2002 | 2001 | 2002 | 2001 | |||||||||||
| Revenues | $ | 1,617.9 | $ | 1,625.2 | $ | 4,548.6 | $ | 4,704.2 | ||||||||
| Operating expenses: | ||||||||||||||||
| Cost of sales | 1,238.7 | 1,247.9 | 3,518.8 | 3,629.1 | ||||||||||||
| Selling, general and administrative | 127.9 | 118.8 | 377.6 | 354.4 | ||||||||||||
| Depreciation and amortization | 83.4 | 85.8 | 249.7 | 252.6 | ||||||||||||
| 1,450.0 | 1,452.5 | 4,146.1 | 4,236.1 | |||||||||||||
| Operating income | 167.9 | 172.7 | 402.5 | 468.1 | ||||||||||||
| Financial expenses | 39.8 | 53.0 | 127.5 | 159.2 | ||||||||||||
| Income before income taxes | 128.1 | 119.7 | 275.0 | 308.9 | ||||||||||||
| Income taxes | 29.1 | 32.0 | 64.6 | 82.6 | ||||||||||||
| Income before minority interest | 99.0 | 87.7 | 210.4 | 226.3 | ||||||||||||
| Minority interest | 0.5 | 0.9 | 1.7 | 2.5 | ||||||||||||
| Net income before goodwill amortization | 98.5 | 86.8 | 208.7 | 223.8 | ||||||||||||
| Goodwill amortization, net of income taxes | 2(a | ) | — | 16.0 | — | 47.3 | ||||||||||
| Net income | $ | 98.5 | $ | 70.8 | $ | 208.7 | $ | 176.5 | ||||||||
| Net income available to holders of preferred shares | 7.2 | 5.6 | 21.6 | 13.4 | ||||||||||||
| Net income available to holders of equity shares | $ | 91.3 | $ | 65.2 | $ | 187.1 | $ | 163.1 | ||||||||
| Earnings per share: | 7 | |||||||||||||||
| Basic | $ | 0.65 | $ | 0.46 | $ | 1.33 | $ | 1.14 | ||||||||
| Diluted | $ | 0.64 | $ | 0.46 | $ | 1.31 | $ | 1.13 | ||||||||
| Average number of equity shares outstanding (in millions) | 7 | |||||||||||||||
| Basic | 140.9 | 140.8 | 140.6 | 142.9 | ||||||||||||
| Diluted | 145.5 | 145.7 | 145.4 | 147.5 | ||||||||||||
| Retained earnings: | ||||||||||||||||
| Balance, beginning of period | $ | 782.6 | $ | 884.9 | $ | 721.8 | $ | 870.3 | ||||||||
| Net income | 98.5 | 70.8 | 208.7 | 176.5 | ||||||||||||
| Shares repurchased | 6 | — | (27.9 | ) | (1.4 | ) | (77.4 | ) | ||||||||
| Share issue expenses | — | (1.5 | ) | — | (4.5 | ) | ||||||||||
| Dividends: | ||||||||||||||||
| Equity shares | (16.9 | ) | (16.9 | ) | (50.6 | ) | (48.4 | ) | ||||||||
| Preferred shares | (7.3 | ) | (4.6 | ) | (21.6 | ) | (11.7 | ) | ||||||||
| Balance, end of period | $ | 856.9 | $ | 904.8 | $ | 856.9 | $ | 904.8 | ||||||||
See Notes to Consolidated Financial Statements.
17
CONSOLIDATED STATEMENTS OF CASH FLOWS
Periods ended September 30
(In millions of US dollars)
(Unaudited)
| | | Three months | Nine months | ||||||||||||||
|---|---|---|---|---|---|---|---|---|---|---|---|---|---|---|---|---|---|
| | Notes | 2002 | 2001 | 2002 | 2001 | ||||||||||||
| Operating activities: | |||||||||||||||||
| Net income | $ | 98.5 | $ | 70.8 | $ | 208.7 | $ | 176.5 | |||||||||
| Non-cash items in net income: | |||||||||||||||||
| Depreciation of property, plant and equipment | 77.8 | 80.0 | 233.3 | 235.6 | |||||||||||||
| Deferred income taxes | 17.9 | 19.7 | 40.2 | 59.4 | |||||||||||||
| Amortization of goodwill and deferred charges | 5.6 | 21.8 | 16.4 | 64.3 | |||||||||||||
| Other | (1.1 | ) | 3.5 | 3.0 | 8.2 | ||||||||||||
| Changes in non-cash balances related to operations: | |||||||||||||||||
| Trade receivables | (117.8 | ) | (111.5 | ) | (167.1 | ) | (46.5 | ) | |||||||||
| Inventories | (17.7 | ) | (52.5 | ) | (51.0 | ) | (25.4 | ) | |||||||||
| Trade payables and accrued liabilities | 55.1 | 1.6 | (51.4 | ) | (242.8 | ) | |||||||||||
| Other current assets and liabilities | 27.8 | 2.7 | 8.4 | (13.7 | ) | ||||||||||||
| Other non-current assets and liabilities | (15.9 | ) | (24.0 | ) | (27.9 | ) | (79.8 | ) | |||||||||
| Cash provided from operating activities | 130.2 | 12.1 | 212.6 | 135.8 | |||||||||||||
Financing activities: | |||||||||||||||||
| Net change in bank indebtedness | — | — | — | (1.9 | ) | ||||||||||||
| Net proceeds from issuance of equity shares | 5.8 | 6.0 | 19.2 | 11.2 | |||||||||||||
| Repurchases of shares for cancellation | 6 | — | (58.5 | ) | (3.5 | ) | (173.1 | ) | |||||||||
| Net proceeds from issuance of preferred shares | — | 112.3 | — | 239.5 | |||||||||||||
| Issuance (repayments) of long-term debt | (92.8 | ) | 128.7 | (121.4 | ) | 145.2 | |||||||||||
| Dividends on equity shares | (16.9 | ) | (16.9 | ) | (50.6 | ) | (48.4 | ) | |||||||||
| Dividends on preferred shares | (7.3 | ) | (4.6 | ) | (21.6 | ) | (11.7 | ) | |||||||||
| Dividends to minority shareholders | — | — | (1.9 | ) | (1.5 | ) | |||||||||||
| Cash (used) provided from financing activities | (111.2 | ) | 167.0 | (179.8 | ) | 159.3 | |||||||||||
Investing activities: | |||||||||||||||||
| Acquisitions of businesses, net of cash and cash equivalents | 3 | (3.0 | ) | (99.3 | ) | (0.3 | ) | (129.0 | ) | ||||||||
| Additions to property, plant and equipment | (28.5 | ) | (69.0 | ) | (140.9 | ) | (227.0 | ) | |||||||||
| Net proceeds from disposal of other assets | 3.0 | 3.3 | 7.3 | 5.0 | |||||||||||||
| Other | 8.4 | (8.1 | ) | 10.0 | (15.3 | ) | |||||||||||
| Cash used by investing activities | (20.1 | ) | (173.1 | ) | (123.9 | ) | (366.3 | ) | |||||||||
| Effect of exchange rate changes on cash and cash equivalents | 1.2 | (4.5 | ) | 7.0 | 20.4 | ||||||||||||
| Net increase (decrease) in cash and cash equivalents | 0.1 | 1.5 | (84.1 | ) | (50.8 | ) | |||||||||||
| Cash and cash equivalents, beginning of period | 1.3 | 0.4 | 85.5 | 52.7 | |||||||||||||
| Cash and cash equivalents, end of period | $ | 1.4 | $ | 1.9 | $ | 1.4 | $ | 1.9 | |||||||||
| Supplemental cash flow information: | |||||||||||||||||
| Interest paid | $ | 51.5 | $ | 67.6 | $ | 140.7 | $ | 166.9 | |||||||||
| Income taxes paid (received) | (27.2 | ) | 9.3 | 5.2 | 58.3 | ||||||||||||
See Notes to Consolidated Financial Statements.
18
CONSOLIDATED BALANCE SHEETS
(In millions of US dollars)
| | Notes | September 30 2002 | December 31 2001 | September 30 2001 | |||||||||
|---|---|---|---|---|---|---|---|---|---|---|---|---|---|
| | | (Unaudited) | (Audited) | (Unaudited) | |||||||||
| Assets | |||||||||||||
| Current assets: | |||||||||||||
| Cash and cash equivalents | $ | 1.4 | $ | 85.5 | $ | 1.9 | |||||||
| Trade receivables | 533.2 | 366.6 | 632.1 | ||||||||||
| Receivables from related parties | 5.2 | 1.9 | 3.2 | ||||||||||
| Inventories | 430.4 | 377.1 | 489.5 | ||||||||||
| Deferred income taxes | 58.2 | 58.0 | 58.1 | ||||||||||
| Prepaid expenses | 28.0 | 24.1 | 37.0 | ||||||||||
| Total current assets | 1,056.4 | 913.2 | 1,221.8 | ||||||||||
| Property, plant and equipment, net | 2,635.1 | 2,634.0 | 2,725.9 | ||||||||||
| Goodwill | 2(a), 5 | 2,493.3 | 2,470.7 | 2,489.5 | |||||||||
| Other assets | 123.8 | 132.0 | 166.4 | ||||||||||
| Total assets | $ | 6,308.6 | $ | 6,149.9 | $ | 6,603.6 | |||||||
| Liabilities and Shareholders' Equity | |||||||||||||
| Current liabilities: | |||||||||||||
| Bank indebtedness | $ | 0.1 | $ | 0.1 | $ | 0.8 | |||||||
| Trade payables | 577.8 | 462.9 | 532.8 | ||||||||||
| Accrued liabilities | 426.3 | 561.2 | 394.5 | ||||||||||
| Income and other taxes payable | 48.0 | 26.5 | 1.1 | ||||||||||
| Current portion of long-term debt and convertible notes | 43.2 | 57.0 | 94.1 | ||||||||||
| Total current liabilities | 1,095.4 | 1,107.7 | 1,023.3 | ||||||||||
| Long-term debt | 1,937.0 | 1,961.9 | 2,202.2 | ||||||||||
| Other liabilities | 251.8 | 245.6 | 249.1 | ||||||||||
| Deferred income taxes | 282.8 | 234.0 | 351.4 | ||||||||||
| Convertible notes | 114.5 | 113.3 | 112.8 | ||||||||||
| Minority interest | 9.8 | 14.2 | 13.5 | ||||||||||
| Shareholders' equity: | |||||||||||||
| Capital stock | 6 | 1,810.4 | 1,793.3 | 1,790.8 | |||||||||
| Additional paid-in capital | 104.6 | 104.6 | 104.6 | ||||||||||
| Retained earnings | 856.9 | 721.8 | 904.8 | ||||||||||
| Translation adjustment | (154.6 | ) | (146.5 | ) | (148.9 | ) | |||||||
| 2,617.3 | 2,473.2 | 2,651.3 | |||||||||||
| Total liabilities and shareholders' equity | $ | 6,308.6 | $ | 6,149.9 | $ | 6,603.6 | |||||||
See Notes to Consolidated Financial Statements.
19
NOTES TO CONSOLIDATED FINANCIAL STATEMENTS
Periods ended September 30, 2002 and 2001
(Tabular amounts are expressed in millions of US dollars, except for earnings per share amounts)
(Unaudited)
1. BASIS OF PRESENTATION
The Consolidated Financial Statements included in this report are unaudited and reflect normal and recurring adjustments which are, in the opinion of the Company, considered necessary for a fair presentation. These Consolidated Financial Statements have been prepared in conformity with Canadian generally accepted accounting principles. The same accounting policies as described in the Company's latest Annual Report have been used, with the exception of the new accounting changes described in note 2. However, these Consolidated Financial Statements do not include all disclosures required under Canadian generally accepted accounting principles and accordingly should be read in conjunction with the Consolidated Financial Statements and the notes thereto included in the Company's latest Annual Report. The results of operations for the interim periods should not be considered indicative of full year results due to the seasonality of our business.
2. ACCOUNTING CHANGES
The Company has changed certain accounting policies to comply with new accounting standards.
a) Goodwill and other intangible assets
In August 2001, the Canadian Institute of Chartered Accountants ("CICA") issued Handbook Section 3062,Goodwill and Other Intangible Assets. Under Section 3062, goodwill is not amortized and is tested for impairment annually, or more frequently if events or changes in circumstances indicate that the asset might be impaired. The impairment test is carried out in two steps. In the first step, the carrying amount of the reporting unit is compared with its fair value. When the fair value of a reporting unit exceeds its carrying amount, goodwill of the reporting unit is considered not to be impaired and the second step of the impairment test is unnecessary. The second step is carried out when the carrying amount of a reporting unit exceeds its fair value, in which case the implied fair value of the reporting unit's goodwill is compared with its carrying amount to measure the amount of the impairment loss, if any. When the carrying amount of a reporting unit's goodwill exceeds the implied fair value of the goodwill, an impairment loss is recognized in an amount equal to the excess and is presented as a separate line item in the income statement before extraordinary items and discontinued operations.
Intangible assets acquired in business combinations and intangible assets acquired individually or with a group of other assets, which have indefinite lives, are not amortized, and are tested for impairment annually, or more frequently if events or changes in circumstances indicate that the asset might be impaired. The impairment test compares the carrying amount of the intangible asset with its fair value, and an impairment loss is recognized in income for the excess, if any. Intangible assets with definite useful lives are amortized over their useful life.
The Company has adopted Section 3062 effective January 1, 2002. As of the date of adoption, the Company had unamortized goodwill of $2,470.7 million. In accordance with the requirements of Section 3062, this change in accounting policy is not applied retroactively and the amounts presented for prior periods have not been restated for this change. This change in accounting policy resulted in a reduction in amortization expense related to goodwill of $15.4 million and $46.4 million respectively (net of income taxes of $1.3 million and $3.9 million respectively) for the three-month and nine-month periods ended
20
September 30, 2002. The following summarizes the effect of the accounting change if it were applied retroactively:
| | |||||||||||||
|---|---|---|---|---|---|---|---|---|---|---|---|---|---|
| | Three months | Nine months | |||||||||||
| | 2002 | 2001 | 2002 | 2001 | |||||||||
| Net income, as reported in the consolidated statements of income | $ | 98.5 | $ | 70.8 | $ | 208.7 | $ | 176.5 | |||||
| Goodwill amortization, net of income taxes | — | 16.0 | — | 47.3 | |||||||||
| Net income, adjusted | $ | 98.5 | $ | 86.8 | $ | 208.7 | $ | 223.8 | |||||
Earnings per share, adjusted: | |||||||||||||
| Basic | $ | 0.65 | $ | 0.58 | $ | 1.33 | $ | 1.47 | |||||
| Diluted | $ | 0.64 | $ | 0.57 | $ | 1.31 | $ | 1.45 | |||||
The Company conducted the first step of the transitional goodwill impairment test as of the date of adoption and, based on this test, determined that there is no impairment.
b) Foreign currency translation
In November 2001, the CICA approved the modification of Section 1650 of the CICA Handbook,Foreign Currency Translation, to eliminate the deferral and amortization of foreign currency translation gains and losses on long-lived monetary items. In the first quarter of 2002, the Company adopted the new recommendations retroactively. The effect of adopting the new recommendations did not have a significant impact on the consolidated balance sheet and consolidated statements of income and retained earnings and cash flows as at September 30, 2002.
c) Stock-based compensation
Effective January 1, 2002, the Company adopted the new recommendations of CICA Handbook Section 3870,Stock-based Compensation and Other Stock-based Payments. This Section establishes standards for the recognition, measurement and disclosure of stock-based compensation and other stock-based payments made in exchange for goods and services. These new recommendations require that compensation for all awards made to non-employees and certain awards made to employees, including stock appreciation rights, direct awards of stock and awards that call for settlement in cash or other assets, be measured and recorded in the financial statements at fair value. This Section also sets out a fair value based method of accounting for stock options issued to employees and applies to awards granted on or after January 1, 2002.
The Company, as permitted by Section 3870, has chosen to continue its existing policy of recording no compensation cost on the grant of stock options to employees. Any consideration paid by employees on exercise of stock options is credited to capital stock.
21
Had compensation cost been determined using the fair value based method at the date of grant for awards granted in 2002 under all plans, the Company's pro forma net income, earnings per share and diluted earnings per share would have been:
| | |||||||
|---|---|---|---|---|---|---|---|
| | Three months | Nine months | |||||
| | 2002 | 2002 | |||||
| Pro forma net income | $ | 98.5 | $ | 208.5 | |||
| Pro forma earnings per share: | |||||||
| Basic | $ | 0.65 | $ | 1.33 | |||
| Diluted | $ | 0.64 | $ | 1.31 | |||
These pro forma amounts include a compensation cost based on a weighted-average grant date fair value of $4.38 per stock option for the 174,321 stock options granted during 2002, as calculated using the Black-Scholes option pricing model assuming a risk-free rate of 5.07%, a dividend yield of 2%, an expected volatility of 25% and expected lives of the stock options of 7 years. The pro forma disclosure omits the effect of awards granted before January 1, 2002.
3. BUSINESS ACQUISITIONS
In March 2002, the Company purchased all of the issued and outstanding shares of European Graphic Group S.A. ("E2G"), a subsidiary of Hachette Filipacchi Medias in France, for a cash consideration of $3.3 million and a purchase price balance amounting to $19.4 million. The purchase price will be adjusted by contingent consideration based on achieving a specific performance level over the next three years. E2G owns printing and bindery facilities in France and Belgium and a 50% ownership of Bayard Hachette Routage in France. No goodwill resulted from the acquisition. Earnings are included in the consolidated statements of income since the date of acquisition. The allocation purchase price process was not completed as at September 30, 2002 and the amounts assigned to the assets and liabilities may be subsequently adjusted.
During the nine-month period ended September 30, 2002, the Company also acquired minority interests in North America and Europe for a cash consideration of $4.5 million.
4. RESTRUCTURING AND OTHER CHARGES
As at December 31, 2001, the balance of the restructuring reserve was $107.5 million; this related to workforce costs resulting from planned closures and other headcount reductions in addition to other restructuring and exit costs. The Company utilized $58.9 million of the restructuring and other charges reserve during the nine-month period ended September 30, 2002.
22
5. GOODWILL
The changes in the carrying amount of goodwill for the nine-month period ended September 30, 2002 are as follows:
| | ||||||||||||
|---|---|---|---|---|---|---|---|---|---|---|---|---|
| | North America | Europe | Latin America | Total | ||||||||
| Balance as at December 31, 2001 | $ | 2,181.5 | $ | 270.8 | $ | 18.4 | $ | 2,470.7 | ||||
| Goodwill acquired during the period | 0.3 | 1.0 | — | 1.3 | ||||||||
| Foreign currency changes | 0.4 | 32.5 | (11.6 | ) | 21.3 | |||||||
| Balance as at September 30, 2002 | $ | 2,182.2 | $ | 304.3 | $ | 6.8 | $ | 2,493.3 | ||||
6. CAPITAL STOCK
During the first quarter of 2002, the Company repurchased for cancellation under the Normal Course Issuer Bid program initiated in 2001, a total of 148,500 Subordinate Voting Shares for a net cash consideration of Cdn$5.2 million ($3.5 million).
Effective on December 1, 2002, the holders of the Series 2 Preferred Shares have the right to convert their shares on a one-for-one basis into Series 3 Preferred Shares. After that date, the Series 2 Preferred Shares will pay a monthly floating dividend based on the Canadian Prime Rate. The Series 3 Preferred Shares will be entitled to a fixed quarterly dividend which will be equal to 145% of the yield on five-year Government of Canada bonds, established on November 12, 2002. On December 1, 2007 and every 5 years thereafter, holders of both Series 2 and Series 3 Preferred Shares will have the right to convert their shares into shares of either Series 3 or Series 2 Preferred Shares. The Company sent a Notice of Conversion to holders on October 17, 2002 explaining their rights, and they have until November 18, 2002 to remit their shares for conversion.
7. EARNINGS PER SHARE
The following table sets forth the computation of basic and diluted earnings per share:
| | |||||||||||||
|---|---|---|---|---|---|---|---|---|---|---|---|---|---|
| | Three months | Nine months | |||||||||||
| | 2002 | 2001 | 2002 | 2001 | |||||||||
| Net income available to holders of equity shares | $ | 91.3 | $ | 65.2 | $ | 187.1 | $ | 163.1 | |||||
| Income impact on assumed conversion of convertible notes, net of income taxes | 1.2 | 1.3 | 3.6 | 3.5 | |||||||||
| Net income adjusted for dilution effect | $ | 92.5 | $ | 66.5 | $ | 190.7 | $ | 166.6 | |||||
(In millions) | |||||||||||||
| Weighted average number of equity shares outstanding | 140.9 | 140.8 | 140.6 | 142.9 | |||||||||
| Effect of dilutive convertible notes and stock options | 4.6 | 4.9 | 4.8 | 4.6 | |||||||||
| Weighted average number of diluted equity shares outstanding | 145.5 | 145.7 | 145.4 | 147.5 | |||||||||
| Earnings per share: | |||||||||||||
| Basic | $ | 0.65 | $ | 0.46 | $ | 1.33 | $ | 1.14 | |||||
| Diluted | $ | 0.64 | $ | 0.46 | $ | 1.31 | $ | 1.13 | |||||
23
8. SEGMENT DISCLOSURE
The Company operates in the printing industry. Its business groups are located in three main segments: North America, Europe and Latin America. The Company assesses the performance of each segment based on operating income. These segments are managed separately since they all require specific market strategies. Summarization of the segmented information is as follows:
| | ||||||||||||||||||
|---|---|---|---|---|---|---|---|---|---|---|---|---|---|---|---|---|---|---|
| | North America | Europe | Latin America | Other | Inter- Segment | Total | ||||||||||||
| Three months ended September 30, | ||||||||||||||||||
2002 | ||||||||||||||||||
| Revenues | $ | 1,324.2 | $ | 248.5 | $ | 45.2 | $ | — | $ | — | $ | 1,617.9 | ||||||
| Operating income | 157.8 | 13.3 | 5.2 | (8.4 | ) | — | 167.9 | |||||||||||
| 2001 | ||||||||||||||||||
| Revenues | $ | 1,373.4 | $ | 211.5 | $ | 40.5 | $ | — | $ | (0.2 | ) | $ | 1,625.2 | |||||
| Operating income | 163.0 | 9.7 | 1.2 | (1.2 | ) | — | 172.7 | |||||||||||
| Nine months ended September 30, | ||||||||||||||||||
2002 | ||||||||||||||||||
| Revenues | $ | 3,714.8 | $ | 699.3 | $ | 135.2 | $ | — | $ | (0.7 | ) | $ | 4,548.6 | |||||
| Operating income | 389.1 | 27.0 | 10.2 | (23.8 | ) | — | 402.5 | |||||||||||
2001 | ||||||||||||||||||
| Revenues | $ | 3,941.5 | $ | 651.9 | $ | 111.3 | $ | — | $ | (0.5 | ) | $ | 4,704.2 | |||||
| Operating income | 427.0 | 38.8 | 5.5 | (3.2 | ) | — | 468.1 | |||||||||||
24
Operating Margin
(Nine Months)
Net Income ($ Millions) — Diluted EPS ($)
(Nine Months)
25
CERTIFICATION PURSUANT TO
18 U.S.C. SECTION 1350,
AS ADOPTED PURSUANT TO
SECTION 906 OF THE SARBANES-OXLEY ACT OF 2002
In connection with the Report of Quebecor World Inc. (the "Company") on Form 6-K for the month of October 2002, which contains the Company's financial statements for the quarter and the nine-month period ended September 30, 2002, as filed with the Securities and Exchange Commission on the date hereof (the "Report"), I, Charles G. Cavell, President and Chief Executive Officer of the Company, certify, pursuant to 18 U.S.C. § 1350, as adopted pursuant to § 906 of the Sarbanes-Oxley Act of 2002, that:
(1) the Report fully complies with the requirements of section 13(a) of 15(d) of the Securities Exchange Act of 1934; and
(2) the information contained in the Report fairly presents, in all material respects, the financial condition and results of operations of the Company.
| /s/ CHARLES G. CAVELL | ||
| Charles G. Cavell President and Chief Executive Officer October 28, 2002 |
CERTIFICATION PURSUANT TO
18 U.S.C. SECTION 1350,
AS ADOPTED PURSUANT TO
SECTION 906 OF THE SARBANES-OXLEYACT OF 2002
In connection with the Report of Quebecor World Inc. (the "Company") on Form 6-K for the month of October 2002, which contains the Company's financial statements for the quarter and the nine-month period ended September 30, 2002, as filed with the Securities and Exchange Commission on the date hereof (the "Report"), I, Christian M. Paupe, Executive Vice President, Chief Administrative Officer and Chief Financial Officer of the Company, certify, pursuant to 18 U.S.C. § 1350, as adopted pursuant to § 906 of the Sarbanes-Oxley Act of 2002, that:
(1) the Report fully complies with the requirements of secition 13(a) or 15(d) of the Securities Exchange Act of 1934; and
(2) the information contained in the Report fairly presents, in all material respects, the financial condition and results of operations of the Company.
| /s/ CHRISTIAN M. PAUPE | ||
| Christian M. Paupe Executive Vice President, Chief Administrative Officer and Chief Financial Officer October 28, 2002 |
SIGNATURES
Pursuant to the requirements of the Securities Exchange Act of 1934, the registrant has duly caused this report to be signed on its behalf by the undersigned, thereunto duly authorized.
| QUEBECOR WORLD INC. | |||
By: | /s/ CHRISTIAN M. PAUPE | ||
| Name: | Christian M. Paupe | ||
| Title: | Executive Vice President, Chief Administrative Officer And Chief Financial Officer | ||
Date: October 28, 2002
Quebecor World To Webcast Investor Conference Call on October 29, 2002
1. HIGHLIGHTS
2. RECENT DEVELOPMENTS
3. 2001 RESTRUCTURING
4. LEADERSHIP APPOINTMENTS
5. SEGMENTED RESULTS OF OPERATIONS
6. BREAKDOWN OF REVENUES BY PRODUCT GROUP
7. FINANCIAL CONDITION
8. DISCUSSION OF CONSENSUS EARNINGS
Overview
Review of Third Quarter and Year-to-Date
Restructuring Initiatives
Liquidity, Capital Resources and Financial Position
Risks and Uncertainties
Accounting Policies
Seasonality
Forward Looking Statements