QuickLinks -- Click here to rapidly navigate through this document
SECURITIES AND EXCHANGE COMMISSION
Washington, D.C. 20549
FORM 6-K
Report of foreign issuer pursuant to rule 13a-16 or 15d-16 of
the Securities Exchange Act of 1934
| For | REPORT TO SHAREHOLDERS, THIRD QUARTER 2002 | |
QUEBECOR WORLD INC. (Formerly known as Quebecor Printing Inc.) | ||
| (Translation of Registrant's Name into English) | ||
612 Saint-Jacques Street, Montreal, Quebec H3C 4M8 | ||
| (Address of Principal Executive Office) | ||
(Indicate by check mark whether the registrant files or will file annual reports under cover of Form 20-F or Form 40-F)
| Form 20-F | o | Form 40-F | ý |
(Indicate by check mark whether the registrant by furnishing the information contained in this form is also thereby furnishing the information to the Commission pursuant to Rule 12g3-2(b) under the Securities Exchange Act of 1934.)
| Yes | o | No | ý |
QUEBECOR WORLD INC.
(Formerly known as Quebecor Printing Inc.)
Filed in this Form 6-K
Documents index
- 1.
- Report to Shareholders, Third Quarter 2002
| For immediate release |
QUEBECOR WORLD INC.
FINANCIAL HIGHLIGHTS
Periods ended September 30
(In millions of US dollars, except per share amounts)
(Unaudited)
| | Three months | | Nine months | | ||||||||||||||
|---|---|---|---|---|---|---|---|---|---|---|---|---|---|---|---|---|---|---|
| | 2002 | 2001 | Change | 2002 | 2001 | Change | ||||||||||||
| Consolidated Results | ||||||||||||||||||
| Revenues | $ | 1,617.9 | $ | 1,625.2 | — | % | $ | 4,548.6 | $ | 4,704.2 | (3 | )% | ||||||
| Operating income before amortization | 251.3 | 258.5 | (3 | )% | 652.2 | 720.7 | (10 | )% | ||||||||||
| Operating income | 167.9 | 172.7 | (3 | )% | 402.5 | 468.1 | (14 | )% | ||||||||||
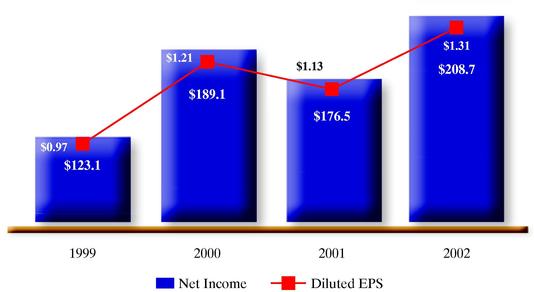
| Net income* | 98.5 | 70.8 | 39 | % | 208.7 | 176.5 | 18 | % | ||||||||||
| Cash provided from operating activities | 130.2 | 12.1 | 212.6 | 135.8 | ||||||||||||||
| Free cash flow from operations** | 97.4 | (58.2 | ) | 57.4 | (97.9 | ) | ||||||||||||
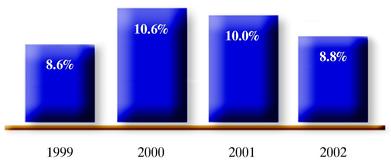
| Operating margin before amortization | 15.5 | % | 15.9 | % | 14.3 | % | 15.3 | % | ||||||||||
| Operating margin | 10.4 | % | 10.6 | % | 8.8 | % | 10.0 | % | ||||||||||
| Segmented Information | ||||||||||||||||||
| Revenues | ||||||||||||||||||
| North America | $ | 1,324.2 | $ | 1,373.4 | (4 | )% | $ | 3,714.8 | $ | 3,941.5 | (6 | )% | ||||||
| Europe | 248.5 | 211.5 | 17 | % | 699.3 | 651.9 | 7 | % | ||||||||||
| Latin America | 45.2 | 40.5 | 12 | % | 135.2 | 111.3 | 21 | % | ||||||||||
Operating income | ||||||||||||||||||
| North America | $ | 157.8 | $ | 163.0 | (3 | )% | $ | 389.1 | $ | 427.0 | (9 | )% | ||||||
| Europe | 13.3 | 9.7 | 37 | % | 27.0 | 38.8 | (30 | )% | ||||||||||
| Latin America | 5.2 | 1.2 | 333 | % | 10.2 | 5.5 | 85 | % | ||||||||||
Operating margins | ||||||||||||||||||
| North America | 11.9 | % | 11.9 | % | 10.5 | % | 10.8 | % | ||||||||||
| Europe | 5.3 | % | 4.6 | % | 3.9 | % | 6.0 | % | ||||||||||
| Latin America | 11.6 | % | 2.9 | % | 7.5 | % | 4.9 | % | ||||||||||
| Financial Position | ||||||||||||||||||
| Working capital | $ | (39.0 | ) | $ | 198.5 | |||||||||||||
| Total assets | 6,308.6 | 6,603.6 | ||||||||||||||||
| Long-term debt (including convertible notes) | 2,094.7 | 2,409.1 | ||||||||||||||||
| Shareholders' equity | 2,617.3 | 2,651.3 | ||||||||||||||||
| Debt-to-capitalization | 44:56 | 47:53 | ||||||||||||||||
| Per Share Data | ||||||||||||||||||
| Earnings* | ||||||||||||||||||
| Basic | $ | 0.65 | $ | 0.46 | 41 | % | $ | 1.33 | $ | 1.14 | 17 | % | ||||||
| Diluted | $ | 0.64 | $ | 0.46 | 39 | % | $ | 1.31 | $ | 1.13 | 16 | % | ||||||
| Dividends on equity shares | $ | 0.12 | $ | 0.12 | — | % | $ | 0.36 | $ | 0.34 | 6 | % | ||||||
| Book value | $ | 15.33 | $ | 15.66 | (2 | )% | ||||||||||||
- *
- Effective January 1, 2002, net income and earnings per share reflect the new accounting policy adopted by the Company under which goodwill is no longer amortized.
- **
- Cash provided from operating activities, less capital expenditures net of proceeds from disposals, and preferred share dividends.
In the third quarter 2002 Quebecor World made good on its commitment to grow earnings in the back half of 2002. The Company grew diluted earnings per share 12% on a comparable basis versus the same quarter in 2001. Diluted earnings per share was $0.64 compared to $0.57 for the third quarter of 2001, before the amortization of goodwill. This is just $0.04 below Q3, 2000, which was our best year ever. Net income for the quarter rose to $99 million compared to $71 million during the same peiod last year. These results were achieved despite a difficult global economic environment. In recognition of the Company's strong earnings and solid financial position the Board of Directors increased the quarterly dividend to shareholders by $0.01 per share, which represents an 8% increase on an annualized basis.
Quebecor World's third quarter results reflect three key areas of discipline, restructuring and cost containment, strong free cash flow and debt repayment. In total ten facilities were closed and nearly 3,000 employee positions were eliminated since the restructuring program was announced in October, 2001. Quebecor World generated $97 million dollars of free cash flow in the quarter, most of which was used to pay down debt.
The economy continues to present us with a significant headwind. Consolidated revenues in the third quarter were steady at $1.62 billion compared to $1.63 billion during the same period last year. In the third quarter 2002 magazine advertising pages, as measured by the Publisher Information Bureau in the U.S., were essentially flat in the quarter but are still down 7% on a year-to-date basis. Volume pressures continue and prices are materially lower compared to the same period last year. This is due in part to excess industry capacity. According to the U.S. Federal Reserve Board capacity utilization in the industry stood at 72% in September, one of the lowest rates in ten years.
Quebecor World has been able to mitigate many of these factors by constantly improving our technology-leading platform allowing us to win new work in all our geographies. By offering the most comprehensive coast-to-coast gravure and offset platform in North America, coupled with our logistics and pre-media services and our global reach we are providing a range and mix of services that local, regional and national customers can't find anywhere else. Our strategy of partnering with the largest, most successful retailers and publishers in the industry is another key ingredient because these customers tend to be less impacted by the weak economy and will bounce back faster when it recovers.
During the quarter David Boles and John Paloian were appointed as Co-Chief Operating Officers for our North American Operations. Together John and David have more than 30 years of experience in the printing industry and were instrumental in implementing the merger of Quebecor Printing and World Color Press. They will continue to manage their respective businesses as well as assume responsibility for the rest of our North American Product Groups. John Paloian is responsible for the Commercial/Direct and Logistics Groups as well as the Magazine/Catalog franchise. David continues to manage the Retail and Sunday Magazine Group and is now responsible for the Book and Directory Groups. This new structure reduces administrative duplication and allows our North American Product Groups to continue to develop new and innovative ways to leverage their size and technological advantage to provide better and more efficient services to our customers and greater value for our shareholders.
In the third quarter 2002, the benefits of restructuring and cost containment allowed us to post operating margins of 11.9% in North America, our largest market. This matches our performance in the third quarter of 2001. Operating income increased in all our product groups except for Commercial/Direct that continues to be negatively impacted by the sluggish economy and the weak market for promotional advertising.
Image covers L.L. Bean
We are winning new business and gaining market share as highlighted by the announcement of our new agreement to print 100% of all the catalogs for L.L. Bean, one of the largest catalogers in the United States. Our logistics business continues to gain new customers and is just one more reason why publishers and retailers are coming to us. Quebecor World is the largest print logistics operation in the United States delivering more than 17 billion units a year. We have been recognized by the U.S. Postal service as having the best on-time performance in their network.
These services continue to attract the biggest and the best in the industry. We do business with the top twenty magazine and catalog publishers and these relationships continue to grow because of our multi-service
offerings. Of our top ten magazine customers we produce 100% of the work for three of them and 50%-to-90% for the next seven. Our message of single source one-stop shopping is being heard and is paying off in new business as our customers are using their relationship with us to capture their own economies of scale.
Operating Income Triples in Latin America
Our business in Latin America is growing almost daily. Operating income in Latin America tripled compared to the same quarter last year. Revenues were up 12% and the operating margin increased to 11.6%, approaching our best performing market segments in North America. We continue to win global customers. We recently signed a five-year agreement with Crain Communications, one of our well-known U.S. customers, to print a magazine for them in Mexico. We are also printing for them in Austria. Bauer is an example of another customer that we are printing for in Mexico, Spain and the U.S.
During the quarter our new Mexico City facility completed delivery of the Mexico City white and yellow page telephone directories. This is one of the largest directories in the world. In all, Quebecor World printed more 3.6 million copies or 5.3 billion pages. It is through this commitment to providing world class quality and service that our Latin American team continues to gain market share and provide a Latin American solution for our North American and European customers.
In Europe our revenues increased 17% to $248 million in the third quarter 2002. Much of this increase was due to the Company's purchase of the printing assets of Hachette Filipacchi and an improvement of our business outside of France. The Company's European results are still being negatively impacted by the underperformance of our French operations. We are determined to improve these results going forward. During the fourth quarter the Company will announce additional measures to reduce costs though the reduction of employee positions and the decommissioning of certain non-competitive assets.
Senior International Management Appointment
Recently Quebecor World announced the appointment of Michel Desbiens as Chief Executive Officer, International Operations. He will be responsible for the development and performance of all of the Company's operations outside of North America. Michel has served as a director of Quebecor World since April, 2002. He is a seasoned senior executive with many years of experience in the paper industry and public company administration. Michel served as President and Chief Executive Officer of Donohue Inc. and is uniquely qualified to fulfill this responsibility. In addition to his duties as CEO, International Operations he will work with Quebecor World Inc., President and CEO Charles G. Cavell in areas such as global procurement, supply-chain initiatives for strategic resources such as paper, manufacturing operations and other projects to sustain and improve margins.
For the period ended September 30, 2002, total debt was reduced by $315 million compared to the same period last year. On a year-to-date basis financial expenses were $127 million, a 20% improvement compared with the same period last year due to reduced bank borrowings and lower rates of interest on long-term and securitization. This improvement reflects management's efforts to strengthen the Company's financial condition through tight management of working capital and capital spending requirements. This strategy has resulted in lower financial expenses that contributed to earnings per share.
For the trailing 12 months ended September 30, 2002 free cash flow from operations was $443 million. We continue to be on track to achieve our objective of $300 million in free cash flow for 2002.
In recognition of the Company's strong earnings performance and financial position the Board of Directors increased its quarterly dividend $0.01 per share to $0.13 per share or $0.52 per share on an annualized basis on Multiple Voting Shares and Subordinate Voting Shares. The Board also declared a dividend of CDN$0.3125 per share on Series 2 Preferred Shares, CDN$0.4219 per share on Series 4 Preferred Shares and CDN$0.43125 on Series 5 preferred Shares. The dividends are payable on December 1, 2002 to shareholders of record at the close of business November 15, 2002.
Quebecor World Inc. filed its quarterly report for the quarter ended September 30, 2002 with the Securities and Exchange Commission. The report contains certifications from Charles G. Cavell, President and Chief Executive Officer and Christian M. Paupe, Executive Vice President, Chief Administrative Officer and Chief Financial Officer, that the periodic report fully complies with the Securities Exchange Act of 1934 and that the information contained in the report fairly presents, in all material respects, the financial condition and results of operations of the company. These certifications are in accordance with the requirements of the Sarbanes-Oxley Act.
We believe that market conditions in our industry will remain difficult for the remainder of 2002 and into the first half of 2003. As a result of our strong customer base in our largest businesses such as retail inserts, magazine and catalogs we expect to fare better than most. Management expects to increase earnings by utilizing its more efficient platform and its significantly lower cost base, both in terms of operational costs and financial expenses. Our strategy of placing assets in larger, more specialized facilities has resulted in a permanent improvement of our manufacturing platform that will enable us to uniquely benefit when the economy improves. As well the Company expects to increase its marketing leading position in most of its product categories. Management's focus on cost reduction, free cash flow and debt reduction is resulting in improvements that will enhance our ability to capture the upside benefits when the market improves.
/s/ Brian Mulroney
The Right Honourable
Brian Mulroney
Chairman of the Board
/s/ Charles G. Cavell
Charles G. Cavell
President and Chief
Executive Officer
Montreal, Canada, November 2002
Breakdown of Revenues
Nine Months
Latin America 3%
Europe 15%
North America 82%
Latin America 3%
Retail 18%
Magazines & Catalog 27%
Other revenues 9%
Directory 8%
Commercial & Direct 11%
Book 9%
Europe 15%
MANAGEMENT'S DISCUSSION AND ANALYSIS OF
FINANCIAL CONDITION AND RESULTS OF OPERATIONS
Quebecor World is the largest commercial print media services company in the world. We are the market leader in most of our product categories and geographies. This market leading position has been built through a combination of successfully integrated acquisitions, investments in key strategic technologies and a commitment to building long-term partnerships with the world's leading print media customers.
We have facilities in the United States, Canada, France, the United Kingdom, Spain, Switzerland, Sweden, Finland, Austria, Belgium, Brazil, Chile, Argentina, Peru, Colombia, Mexico and India.
Review of Third Quarter and Year-to-Date
Despite the difficult global economic environment, Quebecor World was able to grow diluted earnings per share in the third quarter by 12% on a comparable basis to the same quarter last year. Diluted earnings per share for the quarter was $0.64 compared to $0.57, before goodwill amortization, for the same quarter last year.
Quebecor World continues to focus on cost reduction, generating free cash flow and paying down debt. In the third quarter, we made significant progress on all three fronts to the benefit of our business and our shareholders. By the end of September 2002, most of our key projects from the restructuring program announced in October 2001 had been largely completed. This combined with strict cost containment resulted in double digit operating margins for the quarter, despite lower revenues due to continuing difficult market conditions. The consolidated operating margin for the third quarter stood at 10.4% in 2002 compared to 10.6% in 2001. In the third quarter, we generated free cash flow of $97 million to reach a free cash flow year to date of $57 million compared to an outflow of $98 million for the nine-month period ended September 30, 2001. With most of this free cash flow used to reduce our debt, we ended September 2002 with a debt to capitalization ratio of 44:56 compared to 46:54 at the end of June 2002.
Revenues for the quarter were $1,618 million, $7 million lower than the same period in 2001. On a year-to-date basis, consolidated revenues decreased from $4,704 million in 2001 to $4,549 million in 2002.
Our North American operations continued to face challenging market conditions. Revenues for the third quarter were $1,324 million, down 4% compared to $1,373 million in 2001. However, as can be seen from Figure 1, there were some encouraging signs at the end of the quarter. Magazine advertising pages, as measured by the Publishers Information Bureau, increased by 2.7% in September 2002. This is only the second monthly year-over-year increase since November 2000. Also, we are clearly incurring benefits from our restructuring initiatives as we were able to match our 2001 operating margin of 11.9% on reduced revenues in a competitive pricing environment.
U.S. Magazine Advertising Pages 2000-2002 (Monthly)
Percentage Year-Over-Year Change
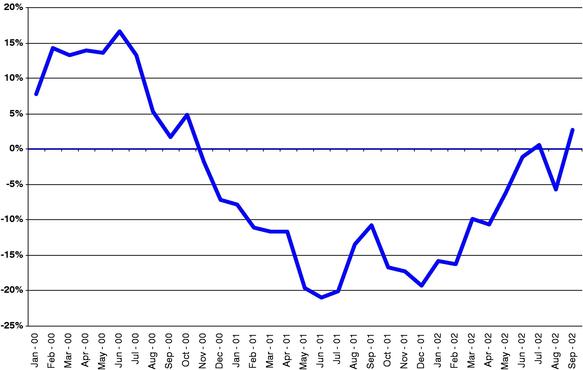
| Figure 1 | Source: Publishers Information Bureau (PIB) |
Our European operations, excluding France, improved revenues, operating income and operating margins compared to last year, for both the three-month and nine-month periods ended September 30. However, our European results were negatively impacted by the underperformance of our French operations, which represent approximately half of our European platform. During the fourth quarter, the Company is expected to announce additional measures to improve the performance of its French platform.
| | European Financial Highlights ($ millions) | |||||||||||||||||||
|---|---|---|---|---|---|---|---|---|---|---|---|---|---|---|---|---|---|---|---|---|
| | Three Months | Nine Months | ||||||||||||||||||
| | 2002 | 2001 | 2000 | 2002 | 2001 | 2000 | ||||||||||||||
| Europe excluding France | ||||||||||||||||||||
| Revenues | $ | 137.9 | $ | 113.3 | $ | 109.0 | $ | 382.3 | $ | 343.9 | $ | 337.5 | ||||||||
| Operating income | $ | 14.6 | $ | 8.2 | $ | 10.5 | $ | 34.6 | $ | 28.7 | $ | 31.0 | ||||||||
| Operating margin | 10.6 | % | 7.2 | % | 9.6 | % | 9.1 | % | 8.3 | % | 9.2 | % | ||||||||
| France | ||||||||||||||||||||
| Revenues | $ | 110.6 | $ | 98.2 | $ | 99.9 | $ | 317.0 | $ | 308.0 | $ | 316.6 | ||||||||
| Operating income | $ | (1.3 | ) | $ | 1.5 | $ | 3.4 | $ | (7.6 | ) | $ | 10.1 | $ | 11.2 | ||||||
| Operating margin | (1.2 | )% | 1.5 | % | 3.4 | % | (2.4 | )% | 3.3 | % | 3.5 | % | ||||||||
| Europe | ||||||||||||||||||||
| Revenues | $ | 248.5 | $ | 211.5 | $ | 208.9 | $ | 699.3 | $ | 651.9 | $ | 654.1 | ||||||||
| Operating income | $ | 13.3 | $ | 9.7 | $ | 13.9 | $ | 27.0 | $ | 38.8 | $ | 42.2 | ||||||||
| Operating margin | 5.3 | % | 4.6 | % | 6.7 | % | 3.9 | % | 6.0 | % | 6.5 | % | ||||||||
Figure 2
In Latin America, revenues, operating income and operating margin increased in the third quarter and the nine-month period of 2002 compared to last year. Third quarter activities have focused on leveraging the Company's relationship with key customer accounts in North America and Europe in order to enhance client service and to build sales volume even during periods of economic change. The Latin American region is also working with the QW International Sales Team to demonstrate to global book clients such as McGraw Hill how they can use our Latin American platform to improve time to market while ensuring consistent world level quality.
Concerning its pension plans, management has reviewed funding exposure, actuarial and accounting assumptions, including discount rates, expected return on plan assets and the rate of compensation increases. The assumed return on assets for the Company's plans was reduced for its appropriateness in the current environment. This resulted in an increase of the pension expense that is reflected in our operating income.
Weighted average assumptions used in the
measurement of the Company's pension benefits
| | 2002 (estimated) | 2001 | ||
|---|---|---|---|---|
| Discount rate | 7.0% | 7.0% | ||
| Expected return on plan assets | 8.2% | 9.7% | ||
| Rate of compensation increase | 3.4% | 3.4% | ||
Figure 3
Financial expenses decreased by $13.2 million to $39.8 million in the third quarter of 2002, a 25% improvement. On a year-to-date basis, financial expenses were $127.5 million, a 20% improvement when compared to $159.2 million for the same period in 2001. This reduction was a result of lower interest rates on long-term debt and the securitization program as well as management's commitment to reduce debt and strengthen the Company's balance sheet.
The effective tax rate for the quarter and year-to-date ended September 30, 2002 was 22.7% and 23.5% respectively, compared with 26.7% for the three-month and nine-month periods of 2001. The improvement, this quarter, was mostly due to lower taxable income in jurisdictions with higher tax rates. The effective tax rate, before restructuring and other special charges, was 23.4% for the full year 2001.
Net income for the third quarter was $98.5 million, $27.7 million or 39% higher than 2001. Diluted earnings per share for the third quarter was $0.64, compared to $0.46 last year. For the nine-month period, net income was $208.7 million, an increase of $32.2 million or 18% compared to the same period in 2001. Diluted earnings per share was $1.31 compared to $1.13 for the same period last year.
The restructuring initiatives announced in 2001 were largely completed, in North America, as at September 30, 2002. Nearly 3,000 employee positions have been eliminated as a result of restructuring initiatives implemented to date. Ten facilities have been closed and more than twenty pieces of equipment have been successfully relocated.
At the end of the quarter, the Company entered into a detailed review of the remaining projects to be completed as per the original restructuring plan with respect to current global market conditions. This review will be completed in the 4th quarter and decisions will be taken based on the need for the available capacity to meet customer demands. In addition, this review will take into account our French platform and will likely include a further reduction of employee positions including the streamlining of our European corporate services.
Cash costs as presented in figure 4 do not reflect the progress of the restructuring due to trailing severance payments, future lease payments and other delayed exit costs. The cash costs incurred as at September 30, 2002 were as follows:
Restructuring Initiatives — Cash Costs ($ millions)
| | Restructuring Charges | Other Special Charges | Total | |||||||
|---|---|---|---|---|---|---|---|---|---|---|
| Balance as at Dec. 31, 2001 | $ | 98.5 | $ | 9.0 | $ | 107.5 | ||||
| Utilized | (55.6 | ) | (3.3 | ) | (58.9 | ) | ||||
| Balance as at September 30, 2002 | $ | 42.9 | $ | 5.7 | $ | 48.6 | ||||
Figure 4
Liquidity, Capital Resources and Financial Position
Free cash flow for the third quarter of 2002 amounted to $97 million, a $155 million increase compared to an outflow of $58 million for the same quarter last year. On a year-to-date basis, free cash flow was $57 million, compared to an outflow of $98 million for the nine-month period ended September 30, 2001. Working Capital was $(39) million as at September 30, 2002, compared to $199 million as at September 30, 2001. This decrease of $238 million was largely due to the Company's continued focus on collecting accounts receivable and to reduced inventory.
In March 2002, we acquired European Graphic Group S.A. ("E2G"), a subsidiary of Hachette Filipacchi Medias in Europe. E2G owns printing and bindery facilities in France and Belgium and a 50% ownership of Bayard Hachette Routage in France. This investment complements our European Gravure platform, and comes with a $400 million (exclusive of paper) long-term printing contract for Hachette's magazines in Europe. The purchase price consideration for this acquisition amounted to $70.7 million.
As at December 31, 2001, we had committed to repurchase, under the Normal Course Issuer Bid announced on April 6, 2001, a total of 148,500 Subordinate Voting Shares. The settlement of this commitment took place in January 2002, for a net cash consideration of Cdn$5.2 million ($3.5 million), at an average cost per share of Cdn$35.28 ($23.89). A total of 3,692,200 Subordinate Voting Shares, at an average cost per share of Cdn$40.36 ($27.54), were repurchased under the program which expired on April 5, 2002.
As at September 30, 2002, our debt level was at $2,095 million, a $315 million decrease compared to the end of September 2001. Including accounts receivable securitization, total debt would be $2,678 million, $340 million lower than last year (see figure 5). The debt to capitalization ratio also improved to 44:56 compared to 47:53 in 2001.
Total Debt and Accounts Receivable Securitization ($ millions)
| | September 30, 2002 | September 30, 2001 | ||||
|---|---|---|---|---|---|---|
| Bank indebtedness | $ | 0.1 | $ | 0.8 | ||
| Current portion of long-term debt and convertible notes | 43.2 | 94.1 | ||||
| Long-term debt | 1,937.0 | 2,202.2 | ||||
| Convertible notes | 114.5 | 112.8 | ||||
| Total debt | $ | 2,094.8 | $ | 2,409.9 | ||
| Accounts receivable securitization | 582.9 | 608.1 | ||||
| Total debt and accounts receivable securitization | $ | 2,677.7 | $ | 3,018.0 | ||
Figure 5
The average annual cash obligations over the next three years represent approximately 10% of the 2001 EBITDA before restructuring and other charges (see figure 6).
Contractual Cash Obligations ($ millions)
| | Remaining of 2002 | 2003 | 2004 | 2005 | 2006 | 2007 and thereafter | ||||||
|---|---|---|---|---|---|---|---|---|---|---|---|---|
| Long-term debt and convertible notes | — | 4 | 29 | — | 250 | 1,701 | ||||||
| Capital leases | 17 | 35 | 15 | 11 | 10 | 23 | ||||||
| Operating leases | 21 | 79 | 64 | 67 | 49 | 115 | ||||||
| Total contractual cash obligations | 38 | 118 | 108 | 78 | 309 | 1,839 | ||||||
Figure 6
We invested $29 million in ongoing capital projects during the third quarter of 2002 compared to $69 million for the same period last year. On a year-to-date basis, $141 million has been invested in capital projects in 2002 compared to $227 million in 2001. These capital expenditures were focused on implementing the various restructuring initiatives together with customer-driven projects that will improve service and our cost position. Key expenditures included; expansion and improvements of our North American Retail platform, a new offset press at our Franklin, Kentucky facility, the expansion of our Mexico City facility and a new 48-page
commercial press to increase capacity in our Spanish platform as well as several North American projects related to our restructuring activities.
We believe that our liquidity, capital resources and cash flow from operations are sufficient to fund planned capital expenditures, working capital requirements, interest and principal payments for the foreseeable future.
In the normal course of business, we are exposed to changes in interest rates and foreign exchange rates. However, we manage the interest rate exposure by having a balanced schedule of debt maturities as well as a combination of fixed and variable rate obligations. In addition, we have entered into interest rate swap agreements to manage this exposure.
We have also entered into foreign exchange forward contracts and cross-currency interest rate swaps to hedge the settlement of raw materials and equipment purchases, to set the exchange rate for cross-border sales and to manage our foreign exchange exposure on certain liabilities.
While the counterparties of these agreements expose us to credit loss in the event of non-performance, we believe that the possibility of incurring such a loss is remote due to the creditworthiness of the counterparties. We do not hold or issue any derivative financial instruments for trading purposes.
Concentrations of credit risk with respect to trade receivables are limited due to our diverse operations and large customer base. As at September 30, 2002, we had no significant concentrations of credit risk.
The Consolidated Financial Statements have been prepared using the same accounting policies described in the Company's latest Annual Report with the exception of the following items.
In August 2001, the Canadian Institute of Chartered Accountants ("CICA") issued Handbook Section 3062,Goodwill and Other Intangible Assets. Under Section 3062, goodwill is not amortized and is tested for impairment annually, or more frequently if events or changes in circumstances indicate that the asset might be impaired. The impairment test is carried out in two steps as explained in note 2(a) of the quarterly consolidated financial statements.
We have adopted Section 3062 effective January 1, 2002. As of the date of adoption, we had unamortized goodwill of approximately $2.5 billion. In accordance with the requirements of Section 3062, this change in accounting policy is not applied retroactively and the amounts presented for prior periods have not been restated for this change. The Company conducted the first step of the transitional goodwill impairment test as of the date of adoption and, based on this test, determined that there is no impairment. The impact of that change is presented in note 2(a) of the quarterly consolidated financial statements.
In November 2001, the CICA approved the modification of Section 1650 of the CICA handbook,Foreign Currency Translation, to eliminate the deferral and amortization of foreign currency translation gains and losses on long-lived monetary items. In the first quarter of 2002, we adopted the new recommendations retroactively. The effect of adopting the new recommendations did not have a significant impact on the consolidated balance sheet and consolidated statements of income and retained earnings and cash flows as at September 30, 2002.
Effective January 1, 2002 we adopted the new recommendations of CICA Handbook Section 3870,Stock-based Compensation and Other Stock-based Payments. This Section establishes standards for the recognition, measurement and disclosure of stock-based compensation and other stock-based payments made in exchange for goods and services. These new recommendations require that compensation for all awards made to non-employees and certain awards made to employees, including stock appreciation rights, direct awards of stock and awards that call for settlement in cash or other assets, be measured and recorded in the financial statements at fair value.
As permitted by Section 3870, we have chosen to continue our existing policy of recording no compensation cost on the grant of stock options to employees. Any consideration paid by employees on exercise of stock options is credited to capital stock. Please refer to note 2(c) for stock-based compensation.
The operations of our business are seasonal, with approximately two thirds of historical operating income recognized in the second half of the fiscal year, primarily due to the higher number of magazine pages, new product launches and back-to-school, retail and holiday catalog promotions.
Except for historical information contained herein, the statements in this document are forward-looking and made pursuant to the safe harbor provisions of the Private Securities Litigation Reform Act of 1995. Forward-looking statements involve known and unknown risks and uncertainties, which may cause our actual results in future periods to differ materially from forecasted results. Those risks include, among others, changes in customer demand for our products, changes in raw material and equipment costs and availability, seasonal changes in customer orders, pricing actions by our competitors and general changes in economic conditions.
CONSOLIDATED STATEMENTS OF INCOME AND RETAINED EARNINGS
Periods ended September 30
(In millions of US dollars, except for earnings per share amounts)
(Unaudited)
| | | Three months | Nine months | |||||||||||||
|---|---|---|---|---|---|---|---|---|---|---|---|---|---|---|---|---|
| | Notes | 2002 | 2001 | 2002 | 2001 | |||||||||||
| Revenues | $ | 1,617.9 | $ | 1,625.2 | $ | 4,548.6 | $ | 4,704.2 | ||||||||
| Operating expenses: | ||||||||||||||||
| Cost of sales | 1,238.7 | 1,247.9 | 3,518.8 | 3,629.1 | ||||||||||||
| Selling, general and administrative | 127.9 | 118.8 | 377.6 | 354.4 | ||||||||||||
| Depreciation and amortization | 83.4 | 85.8 | 249.7 | 252.6 | ||||||||||||
| 1,450.0 | 1,452.5 | 4,146.1 | 4,236.1 | |||||||||||||
| Operating income | 167.9 | 172.7 | 402.5 | 468.1 | ||||||||||||
| Financial expenses | 39.8 | 53.0 | 127.5 | 159.2 | ||||||||||||
| Income before income taxes | 128.1 | 119.7 | 275.0 | 308.9 | ||||||||||||
| Income taxes | 29.1 | 32.0 | 64.6 | 82.6 | ||||||||||||
| Income before minority interest | 99.0 | 87.7 | 210.4 | 226.3 | ||||||||||||
| Minority interest | 0.5 | 0.9 | 1.7 | 2.5 | ||||||||||||
| Net income before goodwill amortization | 98.5 | 86.8 | 208.7 | 223.8 | ||||||||||||
| Goodwill amortization, net of income taxes | 2(a | ) | — | 16.0 | — | 47.3 | ||||||||||
| Net income | $ | 98.5 | $ | 70.8 | $ | 208.7 | $ | 176.5 | ||||||||
| Net income available to holders of preferred shares | 7.2 | 5.6 | 21.6 | 13.4 | ||||||||||||
| Net income available to holders of equity shares | $ | 91.3 | $ | 65.2 | $ | 187.1 | $ | 163.1 | ||||||||
| Earnings per share: | 7 | |||||||||||||||
| Basic | $ | 0.65 | $ | 0.46 | $ | 1.33 | $ | 1.14 | ||||||||
| Diluted | $ | 0.64 | $ | 0.46 | $ | 1.31 | $ | 1.13 | ||||||||
| Average number of equity shares outstanding (in millions) | 7 | |||||||||||||||
| Basic | 140.9 | 140.8 | 140.6 | 142.9 | ||||||||||||
| Diluted | 145.5 | 145.7 | 145.4 | 147.5 | ||||||||||||
| Retained earnings: | ||||||||||||||||
| Balance, beginning of period | $ | 782.6 | $ | 884.9 | $ | 721.8 | $ | 870.3 | ||||||||
| Net income | 98.5 | 70.8 | 208.7 | 176.5 | ||||||||||||
| Shares repurchased | 6 | — | (27.9 | ) | (1.4 | ) | (77.4 | ) | ||||||||
| Share issue expenses | — | (1.5 | ) | — | (4.5 | ) | ||||||||||
| Dividends: | ||||||||||||||||
| Equity shares | (16.9 | ) | (16.9 | ) | (50.6 | ) | (48.4 | ) | ||||||||
| Preferred shares | (7.3 | ) | (4.6 | ) | (21.6 | ) | (11.7 | ) | ||||||||
| Balance, end of period | $ | 856.9 | $ | 904.8 | $ | 856.9 | $ | 904.8 | ||||||||
See Notes to Consolidated Financial Statements.
CONSOLIDATED STATEMENTS OF CASH FLOWS
Periods ended September 30
(In millions of US dollars)
(Unaudited)
| | | Three months | Nine months | ||||||||||||||
|---|---|---|---|---|---|---|---|---|---|---|---|---|---|---|---|---|---|
| | Notes | 2002 | 2001 | 2002 | 2001 | ||||||||||||
| Operating activities: | |||||||||||||||||
| Net income | $ | 98.5 | $ | 70.8 | $ | 208.7 | $ | 176.5 | |||||||||
| Non-cash items in net income: | |||||||||||||||||
| Depreciation of property, plant and equipment | 77.8 | 80.0 | 233.3 | 235.6 | |||||||||||||
| Deferred income taxes | 17.9 | 19.7 | 40.2 | 59.4 | |||||||||||||
| Amortization of goodwill and deferred charges | 5.6 | 21.8 | 16.4 | 64.3 | |||||||||||||
| Other | (1.1 | ) | 3.5 | 3.0 | 8.2 | ||||||||||||
| Changes in non-cash balances related to operations: | |||||||||||||||||
| Trade receivables | (117.8 | ) | (111.5 | ) | (167.1 | ) | (46.5 | ) | |||||||||
| Inventories | (17.7 | ) | (52.5 | ) | (51.0 | ) | (25.4 | ) | |||||||||
| Trade payables and accrued liabilities | 55.1 | 1.6 | (51.4 | ) | (242.8 | ) | |||||||||||
| Other current assets and liabilities | 27.8 | 2.7 | 8.4 | (13.7 | ) | ||||||||||||
| Other non-current assets and liabilities | (15.9 | ) | (24.0 | ) | (27.9 | ) | (79.8 | ) | |||||||||
| Cash provided from operating activities | 130.2 | 12.1 | 212.6 | 135.8 | |||||||||||||
Financing activities: | |||||||||||||||||
| Net change in bank indebtedness | — | — | — | (1.9 | ) | ||||||||||||
| Net proceeds from issuance of equity shares | 5.8 | 6.0 | 19.2 | 11.2 | |||||||||||||
| Repurchases of shares for cancellation | 6 | — | (58.5 | ) | (3.5 | ) | (173.1 | ) | |||||||||
| Net proceeds from issuance of preferred shares | — | 112.3 | — | 239.5 | |||||||||||||
| Issuance (repayments) of long-term debt | (92.8 | ) | 128.7 | (121.4 | ) | 145.2 | |||||||||||
| Dividends on equity shares | (16.9 | ) | (16.9 | ) | (50.6 | ) | (48.4 | ) | |||||||||
| Dividends on preferred shares | (7.3 | ) | (4.6 | ) | (21.6 | ) | (11.7 | ) | |||||||||
| Dividends to minority shareholders | — | — | (1.9 | ) | (1.5 | ) | |||||||||||
| Cash (used) provided from financing activities | (111.2 | ) | 167.0 | (179.8 | ) | 159.3 | |||||||||||
Investing activities: | |||||||||||||||||
| Acquisitions of businesses, net of cash and cash equivalents | 3 | (3.0 | ) | (99.3 | ) | (0.3 | ) | (129.0 | ) | ||||||||
| Additions to property, plant and equipment | (28.5 | ) | (69.0 | ) | (140.9 | ) | (227.0 | ) | |||||||||
| Net proceeds from disposal of other assets | 3.0 | 3.3 | 7.3 | 5.0 | |||||||||||||
| Other | 8.4 | (8.1 | ) | 10.0 | (15.3 | ) | |||||||||||
| Cash used by investing activities | (20.1 | ) | (173.1 | ) | (123.9 | ) | (366.3 | ) | |||||||||
| Effect of exchange rate changes on cash and cash equivalents | 1.2 | (4.5 | ) | 7.0 | 20.4 | ||||||||||||
| Net increase (decrease) in cash and cash equivalents | 0.1 | 1.5 | (84.1 | ) | (50.8 | ) | |||||||||||
| Cash and cash equivalents, beginning of period | 1.3 | 0.4 | 85.5 | 52.7 | |||||||||||||
| Cash and cash equivalents, end of period | $ | 1.4 | $ | 1.9 | $ | 1.4 | $ | 1.9 | |||||||||
| Supplemental cash flow information: | |||||||||||||||||
| Interest paid | $ | 51.5 | $ | 67.6 | $ | 140.7 | $ | 166.9 | |||||||||
| Income taxes paid (received) | (27.2 | ) | 9.3 | 5.2 | 58.3 | ||||||||||||
See Notes to Consolidated Financial Statements.
CONSOLIDATED BALANCE SHEETS
(In millions of US dollars)
| | Notes | September 30 2002 | December 31 2001 | September 30 2001 | |||||||||
|---|---|---|---|---|---|---|---|---|---|---|---|---|---|
| | | (Unaudited) | (Audited) | (Unaudited) | |||||||||
| Assets | |||||||||||||
| Current assets: | |||||||||||||
| Cash and cash equivalents | $ | 1.4 | $ | 85.5 | $ | 1.9 | |||||||
| Trade receivables | 533.2 | 366.6 | 632.1 | ||||||||||
| Receivables from related parties | 5.2 | 1.9 | 3.2 | ||||||||||
| Inventories | 430.4 | 377.1 | 489.5 | ||||||||||
| Deferred income taxes | 58.2 | 58.0 | 58.1 | ||||||||||
| Prepaid expenses | 28.0 | 24.1 | 37.0 | ||||||||||
| Total current assets | 1,056.4 | 913.2 | 1,221.8 | ||||||||||
| Property, plant and equipment, net | 2,635.1 | 2,634.0 | 2,725.9 | ||||||||||
| Goodwill | 2(a), 5 | 2,493.3 | 2,470.7 | 2,489.5 | |||||||||
| Other assets | 123.8 | 132.0 | 166.4 | ||||||||||
| Total assets | $ | 6,308.6 | $ | 6,149.9 | $ | 6,603.6 | |||||||
| Liabilities and Shareholders' Equity | |||||||||||||
| Current liabilities: | |||||||||||||
| Bank indebtedness | $ | 0.1 | $ | 0.1 | $ | 0.8 | |||||||
| Trade payables | 577.8 | 462.9 | 532.8 | ||||||||||
| Accrued liabilities | 426.3 | 561.2 | 394.5 | ||||||||||
| Income and other taxes payable | 48.0 | 26.5 | 1.1 | ||||||||||
| Current portion of long-term debt and convertible notes | 43.2 | 57.0 | 94.1 | ||||||||||
| Total current liabilities | 1,095.4 | 1,107.7 | 1,023.3 | ||||||||||
| Long-term debt | 1,937.0 | 1,961.9 | 2,202.2 | ||||||||||
| Other liabilities | 251.8 | 245.6 | 249.1 | ||||||||||
| Deferred income taxes | 282.8 | 234.0 | 351.4 | ||||||||||
| Convertible notes | 114.5 | 113.3 | 112.8 | ||||||||||
| Minority interest | 9.8 | 14.2 | 13.5 | ||||||||||
| Shareholders' equity: | |||||||||||||
| Capital stock | 6 | 1,810.4 | 1,793.3 | 1,790.8 | |||||||||
| Additional paid-in capital | 104.6 | 104.6 | 104.6 | ||||||||||
| Retained earnings | 856.9 | 721.8 | 904.8 | ||||||||||
| Translation adjustment | (154.6 | ) | (146.5 | ) | (148.9 | ) | |||||||
| 2,617.3 | 2,473.2 | 2,651.3 | |||||||||||
| Total liabilities and shareholders' equity | $ | 6,308.6 | $ | 6,149.9 | $ | 6,603.6 | |||||||
See Notes to Consolidated Financial Statements.
NOTES TO CONSOLIDATED FINANCIAL STATEMENTS
Periods ended September 30, 2002 and 2001
(Tabular amounts are expressed in millions of US dollars, except for earnings per share amounts)
(Unaudited)
1. BASIS OF PRESENTATION
The Consolidated Financial Statements included in this report are unaudited and reflect normal and recurring adjustments which are, in the opinion of the Company, considered necessary for a fair presentation. These Consolidated Financial Statements have been prepared in conformity with Canadian generally accepted accounting principles. The same accounting policies as described in the Company's latest Annual Report have been used, with the exception of the new accounting changes described in note 2. However, these Consolidated Financial Statements do not include all disclosures required under Canadian generally accepted accounting principles and accordingly should be read in conjunction with the Consolidated Financial Statements and the notes thereto included in the Company's latest Annual Report. The results of operations for the interim periods should not be considered indicative of full year results due to the seasonality of our business.
2. ACCOUNTING CHANGES
The Company has changed certain accounting policies to comply with new accounting standards.
a) Goodwill and other intangible assets
In August 2001, the Canadian Institute of Chartered Accountants ("CICA") issued Handbook Section 3062,Goodwill and Other Intangible Assets. Under Section 3062, goodwill is not amortized and is tested for impairment annually, or more frequently if events or changes in circumstances indicate that the asset might be impaired. The impairment test is carried out in two steps. In the first step, the carrying amount of the reporting unit is compared with its fair value. When the fair value of a reporting unit exceeds its carrying amount, goodwill of the reporting unit is considered not to be impaired and the second step of the impairment test is unnecessary. The second step is carried out when the carrying amount of a reporting unit exceeds its fair value, in which case the implied fair value of the reporting unit's goodwill is compared with its carrying amount to measure the amount of the impairment loss, if any. When the carrying amount of a reporting unit's goodwill exceeds the implied fair value of the goodwill, an impairment loss is recognized in an amount equal to the excess and is presented as a separate line item in the income statement before extraordinary items and discontinued operations.
Intangible assets acquired in business combinations and intangible assets acquired individually or with a group of other assets, which have indefinite lives, are not amortized, and are tested for impairment annually, or more frequently if events or changes in circumstances indicate that the asset might be impaired. The impairment test compares the carrying amount of the intangible asset with its fair value, and an impairment loss is recognized in income for the excess, if any. Intangible assets with definite useful lives are amortized over their useful life.
The Company has adopted Section 3062 effective January 1, 2002. As of the date of adoption, the Company had unamortized goodwill of $2,470.7 million. In accordance with the requirements of Section 3062, this change in accounting policy is not applied retroactively and the amounts presented for prior periods have not been restated for this change. This change in accounting policy resulted in a reduction in amortization expense related to goodwill of $15.4 million and $46.4 million respectively (net of income taxes of $1.3 million and $3.9 million respectively) for the three-month and nine-month periods ended
September 30, 2002. The following summarizes the effect of the accounting change if it were applied retroactively:
| | |||||||||||||
|---|---|---|---|---|---|---|---|---|---|---|---|---|---|
| | Three months | Nine months | |||||||||||
| | 2002 | 2001 | 2002 | 2001 | |||||||||
| Net income, as reported in the consolidated statements of income | $ | 98.5 | $ | 70.8 | $ | 208.7 | $ | 176.5 | |||||
| Goodwill amortization, net of income taxes | — | 16.0 | — | 47.3 | |||||||||
| Net income, adjusted | $ | 98.5 | $ | 86.8 | $ | 208.7 | $ | 223.8 | |||||
Earnings per share, adjusted: | |||||||||||||
| Basic | $ | 0.65 | $ | 0.58 | $ | 1.33 | $ | 1.47 | |||||
| Diluted | $ | 0.64 | $ | 0.57 | $ | 1.31 | $ | 1.45 | |||||
The Company conducted the first step of the transitional goodwill impairment test as of the date of adoption and, based on this test, determined that there is no impairment.
b) Foreign currency translation
In November 2001, the CICA approved the modification of Section 1650 of the CICA Handbook,Foreign Currency Translation, to eliminate the deferral and amortization of foreign currency translation gains and losses on long-lived monetary items. In the first quarter of 2002, the Company adopted the new recommendations retroactively. The effect of adopting the new recommendations did not have a significant impact on the consolidated balance sheet and consolidated statements of income and retained earnings and cash flows as at September 30, 2002.
c) Stock-based compensation
Effective January 1, 2002, the Company adopted the new recommendations of CICA Handbook Section 3870,Stock-based Compensation and Other Stock-based Payments. This Section establishes standards for the recognition, measurement and disclosure of stock-based compensation and other stock-based payments made in exchange for goods and services. These new recommendations require that compensation for all awards made to non-employees and certain awards made to employees, including stock appreciation rights, direct awards of stock and awards that call for settlement in cash or other assets, be measured and recorded in the financial statements at fair value. This Section also sets out a fair value based method of accounting for stock options issued to employees and applies to awards granted on or after January 1, 2002.
The Company, as permitted by Section 3870, has chosen to continue its existing policy of recording no compensation cost on the grant of stock options to employees. Any consideration paid by employees on exercise of stock options is credited to capital stock.
Had compensation cost been determined using the fair value based method at the date of grant for awards granted in 2002 under all plans, the Company's pro forma net income, earnings per share and diluted earnings per share would have been:
| | |||||||
|---|---|---|---|---|---|---|---|
| | Three months | Nine months | |||||
| | 2002 | 2002 | |||||
| Pro forma net income | $ | 98.5 | $ | 208.5 | |||
| Pro forma earnings per share: | |||||||
| Basic | $ | 0.65 | $ | 1.33 | |||
| Diluted | $ | 0.64 | $ | 1.31 | |||
These pro forma amounts include a compensation cost based on a weighted-average grant date fair value of $4.38 per stock option for the 174,321 stock options granted during 2002, as calculated using the Black-Scholes option pricing model assuming a risk-free rate of 5.07%, a dividend yield of 2%, an expected volatility of 25% and expected lives of the stock options of 7 years. The pro forma disclosure omits the effect of awards granted before January 1, 2002.
3. BUSINESS ACQUISITIONS
In March 2002, the Company purchased all of the issued and outstanding shares of European Graphic Group S.A. ("E2G"), a subsidiary of Hachette Filipacchi Medias in France, for a cash consideration of $3.3 million and a purchase price balance amounting to $19.4 million. The purchase price will be adjusted by contingent consideration based on achieving a specific performance level over the next three years. E2G owns printing and bindery facilities in France and Belgium and a 50% ownership of Bayard Hachette Routage in France. No goodwill resulted from the acquisition. Earnings are included in the consolidated statements of income since the date of acquisition. The allocation purchase price process was not completed as at September 30, 2002 and the amounts assigned to the assets and liabilities may be subsequently adjusted.
During the nine-month period ended September 30, 2002, the Company also acquired minority interests in North America and Europe for a cash consideration of $4.5 million.
4. RESTRUCTURING AND OTHER CHARGES
As at December 31, 2001, the balance of the restructuring reserve was $107.5 million; this related to workforce costs resulting from planned closures and other headcount reductions in addition to other restructuring and exit costs. The Company utilized $58.9 million of the restructuring and other charges reserve during the nine-month period ended September 30, 2002.
5. GOODWILL
The changes in the carrying amount of goodwill for the nine-month period ended September 30, 2002 are as follows:
| | ||||||||||||
|---|---|---|---|---|---|---|---|---|---|---|---|---|
| | North America | Europe | Latin America | Total | ||||||||
| Balance as at December 31, 2001 | $ | 2,181.5 | $ | 270.8 | $ | 18.4 | $ | 2,470.7 | ||||
| Goodwill acquired during the period | 0.3 | 1.0 | — | 1.3 | ||||||||
| Foreign currency changes | 0.4 | 32.5 | (11.6 | ) | 21.3 | |||||||
| Balance as at September 30, 2002 | $ | 2,182.2 | $ | 304.3 | $ | 6.8 | $ | 2,493.3 | ||||
6. CAPITAL STOCK
During the first quarter of 2002, the Company repurchased for cancellation under the Normal Course Issuer Bid program initiated in 2001, a total of 148,500 Subordinate Voting Shares for a net cash consideration of Cdn$5.2 million ($3.5 million).
Effective on December 1, 2002, the holders of the Series 2 Preferred Shares have the right to convert their shares on a one-for-one basis into Series 3 Preferred Shares. After that date, the Series 2 Preferred Shares will pay a monthly floating dividend based on the Canadian Prime Rate. The Series 3 Preferred Shares will be entitled to a fixed quarterly dividend which will be equal to 145% of the yield on five-year Government of Canada bonds, established on November 12, 2002. On December 1, 2007 and every 5 years thereafter, holders of both Series 2 and Series 3 Preferred Shares will have the right to convert their shares into shares of either Series 3 or Series 2 Preferred Shares. The Company sent a Notice of Conversion to holders on October 17, 2002 explaining their rights, and they have until November 18, 2002 to remit their shares for conversion.
7. EARNINGS PER SHARE
The following table sets forth the computation of basic and diluted earnings per share:
| | |||||||||||||
|---|---|---|---|---|---|---|---|---|---|---|---|---|---|
| | Three months | Nine months | |||||||||||
| | 2002 | 2001 | 2002 | 2001 | |||||||||
| Net income available to holders of equity shares | $ | 91.3 | $ | 65.2 | $ | 187.1 | $ | 163.1 | |||||
| Income impact on assumed conversion of convertible notes, net of income taxes | 1.2 | 1.3 | 3.6 | 3.5 | |||||||||
| Net income adjusted for dilution effect | $ | 92.5 | $ | 66.5 | $ | 190.7 | $ | 166.6 | |||||
(In millions) | |||||||||||||
| Weighted average number of equity shares outstanding | 140.9 | 140.8 | 140.6 | 142.9 | |||||||||
| Effect of dilutive convertible notes and stock options | 4.6 | 4.9 | 4.8 | 4.6 | |||||||||
| Weighted average number of diluted equity shares outstanding | 145.5 | 145.7 | 145.4 | 147.5 | |||||||||
| Earnings per share: | |||||||||||||
| Basic | $ | 0.65 | $ | 0.46 | $ | 1.33 | $ | 1.14 | |||||
| Diluted | $ | 0.64 | $ | 0.46 | $ | 1.31 | $ | 1.13 | |||||
8. SEGMENT DISCLOSURE
The Company operates in the printing industry. Its business groups are located in three main segments: North America, Europe and Latin America. The Company assesses the performance of each segment based
on operating income. These segments are managed separately since they all require specific market strategies. Summarization of the segmented information is as follows:
| | ||||||||||||||||||
|---|---|---|---|---|---|---|---|---|---|---|---|---|---|---|---|---|---|---|
| | North America | Europe | Latin America | Other | Inter- Segment | Total | ||||||||||||
| Three months ended September 30, | ||||||||||||||||||
2002 | ||||||||||||||||||
| Revenues | $ | 1,324.2 | $ | 248.5 | $ | 45.2 | $ | — | $ | — | $ | 1,617.9 | ||||||
| Operating income | 157.8 | 13.3 | 5.2 | (8.4 | ) | — | 167.9 | |||||||||||
| 2001 | ||||||||||||||||||
| Revenues | $ | 1,373.4 | $ | 211.5 | $ | 40.5 | $ | — | $ | (0.2 | ) | $ | 1,625.2 | |||||
| Operating income | 163.0 | 9.7 | 1.2 | (1.2 | ) | — | 172.7 | |||||||||||
| Nine months ended September 30, | ||||||||||||||||||
2002 | ||||||||||||||||||
| Revenues | $ | 3,714.8 | $ | 699.3 | $ | 135.2 | $ | — | $ | (0.7 | ) | $ | 4,548.6 | |||||
| Operating income | 389.1 | 27.0 | 10.2 | (23.8 | ) | — | 402.5 | |||||||||||
2001 | ||||||||||||||||||
| Revenues | $ | 3,941.5 | $ | 651.9 | $ | 111.3 | $ | — | $ | (0.5 | ) | $ | 4,704.2 | |||||
| Operating income | 427.0 | 38.8 | 5.5 | (3.2 | ) | — | 468.1 | |||||||||||
Operating Margin
(Nine Months)
Net Income ($ Millions) — Diluted EPS ($)
(Nine Months)
SIGNATURES
Pursuant to the requirements of the Securities Exchange Act of 1934, the registrant has duly caused this report to be signed on its behalf by the undersigned, thereunto duly authorized.
| QUEBECOR WORLD INC. | |||
By: | /s/ CHRISTIAN M. PAUPE | ||
| Name: | Christian M. Paupe | ||
| Title: | Executive Vice President, Chief Administrative Officer and Chief Financial Officer | ||
Date: November 21, 2002
Message to Shareholders
Leadership Appointments
Operating Income Triples in Latin America
European Revenues Increase
Senior International Management Appointment
Lower Financial Expense
Dividends
Corporate Governance
Outlook
By Geographic Segment
By Business Groups
Overview
Review of Third Quarter and Year-to-Date
Restructuring Initiatives
Liquidity, Capital Resources and Financial Position
Risks and Uncertainties
Accounting Policies
Seasonality
Forward Looking Statements