QuickLinks -- Click here to rapidly navigate through this document
SECURITIES AND EXCHANGE COMMISSION
Washington, DC 20549
FORM 6-K
REPORT OF FOREIGN ISSUER
PURSUANT TO RULE 13a-16 or 15d-16 OF
THE SECURITIES EXCHANGE ACT OF 1934
For | REPORT TO SHAREHOLDERS SECOND QUARTER 2003 |
QUEBECOR WORLD INC. | |
| (Translation of Registrant's Name into English) | |
612 Saint-Jacques Street, Montreal, Quebec H3C 4M8 | |
| (Address of Principal Executive Office) | |
(Indicate by check mark whether the registrant files or will file annual reports under cover of Form 20-F or Form 40-F)
Form 20-F o Form 40-F ý
(Indicate by check mark whether the registrant by furnishing the information contained in this form is also thereby furnishing the information to the Commission pursuant to Rule 12g3-2(b) under the Securities Exchange Act of 1934.)
Yes o No ý
QUEBECOR WORLD INC.
Filed in this Form 6-K
Documents index
- 1.
- Report to Shareholders Second Quarter 2003

| REPORT TO SHAREHOLDERS SECOND QUARTER2003 |
QUEBECOR WORLD INC.
FINANCIAL HIGHLIGHTS
Periods ended June 30
(In millions of US dollars, except per share amounts)
(Unaudited)
| | Three months | | Six months | | ||||||||||||||
|---|---|---|---|---|---|---|---|---|---|---|---|---|---|---|---|---|---|---|
| | 2003 | 2002 | Change | 2003 | 2002 | Change | ||||||||||||
| Consolidated Results | ||||||||||||||||||
| Revenues | $ | 1,502.5 | $ | 1,471.5 | 2 | % | $ | 3,033.8 | $ | 2,930.7 | 4 | % | ||||||
| Operating income before depreciation and amortization* | 133.3 | 211.2 | (37) | % | 298.5 | 400.9 | (26) | % | ||||||||||
| Operating income before impairment of assets, restructuring and other charges | 42.5 | 127.8 | (67) | % | 120.3 | 234.6 | (49) | % | ||||||||||
| Impairment of assets, restructuring and other charges | 81.8 | — | — | 81.8 | — | — | ||||||||||||
| Operating income (loss) | (39.3 | ) | 127.8 | (131) | % | 38.5 | 234.6 | (84) | % | |||||||||
| Net income (loss) | (61.7 | ) | 64.2 | (196) | % | (37.2 | ) | 110.2 | (134) | % | ||||||||
| Cash provided from operating activities | 177.8 | 109.4 | 63 | % | 5.7 | 82.4 | (93) | % | ||||||||||
| Free cash flow from operations** | 72.3 | 40.1 | 80 | % | (177.8 | ) | (40.0 | ) | (345) | % | ||||||||
| Operating margin before depreciation and amortization* | 8.9 | % | 14.4 | % | 9.8 | % | 13.7 | % | ||||||||||
| Operating margin before impairment of assets, restructuring and other charges | 2.8 | % | 8.7 | % | 4.0 | % | 8.0 | % | ||||||||||
| Operating margin | (2.6) | % | 8.7 | % | 1.3 | % | 8.0 | % | ||||||||||
| Segmented Information | ||||||||||||||||||
| Revenues | ||||||||||||||||||
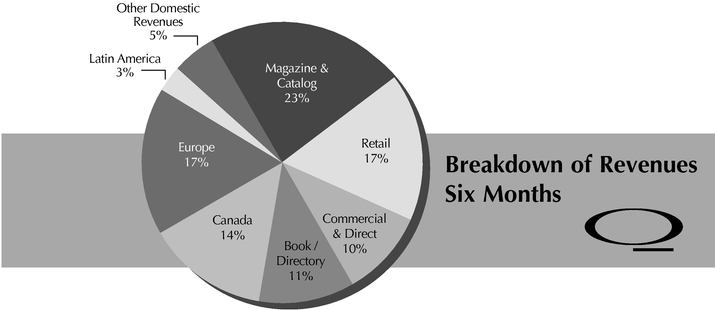
| North America | $ | 1,190.8 | $ | 1,189.6 | — | % | $ | 2,418.6 | $ | 2,390.6 | 1 | % | ||||||
| Europe | 268.1 | 239.0 | 12 | % | 526.5 | 450.8 | 17 | % | ||||||||||
| Latin America | 43.5 | 43.3 | — | % | 88.2 | 90.0 | (2) | % | ||||||||||
| Operating income (loss)* | ||||||||||||||||||
| North America | $ | 45.3 | $ | 124.0 | (63) | % | $ | 128.8 | $ | 231.5 | (44) | % | ||||||
| Europe | 3.4 | 8.2 | (59) | % | 3.2 | 13.5 | (76) | % | ||||||||||
| Latin America | (3.5 | ) | 2.7 | (230) | % | (5.4 | ) | 5.0 | (208) | % | ||||||||
| Operating margins* | ||||||||||||||||||
| North America | 3.8 | % | 10.4 | % | 5.3 | % | 9.7 | % | ||||||||||
| Europe | 1.3 | % | 3.5 | % | 0.6 | % | 3.0 | % | ||||||||||
| Latin America | (8.1) | % | 6.1 | % | (6.1) | % | 5.5 | % | ||||||||||
| Financial Position | ||||||||||||||||||
| Working capital | $ | (73.3 | ) | $ | (93.9 | ) | ||||||||||||
| Total assets | $ | 6,163.3 | $ | 6,313.4 | ||||||||||||||
| Long-term debt (including convertible notes) | $ | 2,253.5 | $ | 2,201.2 | ||||||||||||||
| Shareholders' equity | $ | 2,512.3 | $ | 2,552.5 | ||||||||||||||
| Debt-to-capitalization | 47:53 | 46:54 | ||||||||||||||||
2
Per Share Data | ||||||||||||||||||
| Earnings (loss) | ||||||||||||||||||
| Diluted | $ | (0.51 | ) | $ | 0.40 | (228) | % | $ | (0.39 | ) | $ | 0.68 | (157) | % | ||||
| Diluted before impairment of assets, restructuring and other charges | $ | (0.07 | ) | $ | 0.40 | (118) | % | $ | 0.04 | $ | 0.68 | (94) | % | |||||
| Dividends on equity shares | $ | 0.13 | $ | 0.12 | 8 | % | $ | 0.26 | $ | 0.24 | 8 | % | ||||||
| Book value | $ | 15.62 | $ | 14.90 | 5 | % | ||||||||||||
- *
- Before impairment of assets, restructuring and other charges.
- **
- Cash provided from operating activities, less capital expenditures net of proceeds from disposals, and preferred share dividends.
3
In the second quarter of 2003, market conditions continued to be challenging for Quebecor World. In light of these conditions, our new management has conducted an extensive, detailed review of the Company's global asset base. Through this review, management determined that existing restructuring initiatives were insufficient and that additional cost-reduction measures would be required in all areas. With the release of the Company's second quarter 2003 results, a new set of restructuring initiatives was announced that demonstrate management's firm resolve to deal with the current competitive environment while setting a clear course for the future.
For the second quarter 2003, the Company recorded a loss of $62 million or $0.51 per share after impairment of assets, restructuring and other charges of $82 million. This compares to earnings of $64 million or $0.40 per share in the second quarter of last year. Before this charge Quebecor World recorded a loss of $0.07 per share. Consolidated revenues for the quarter were essentially flat compared to same period last year at $1.5 billion.
Impairment of assets, restructuring and other charges include $26 million related to the new restructuring initiatives that will result in the elimination of approximately 1,000 employee positions. Once completed, these new measures will represent an annualized, pre-tax cost savings of $36 million of which more than one-half will be realized in 2003. The charge also includes an additional $8 million related to previous years' initiatives, including the non-cash portion, mostly related to lease payments and facility closures costs. The balance of the current charge, or $48 million, is largely related to the write down of idle and under-performing assets across the Company's global network.
Specific charges in the quarter of $49 million include a $15 million adjustment related to rapid growth and systems issues in our North American Logistics business, a $15 million provision for doubtful accounts and $19 million of various adjustments of less than $2.5 million such as, the write down of other assets, inventories and other items.
The Company's restructuring initiatives are only a part, albeit a major one, of a multi-faceted plan to maintain our margins in a difficult operating environment. We are also reducing discretionary spending throughout the Company and have streamlined our North American management structure. On the sales side, we are also competing very aggressively and successfully in this difficult market. Our strategy of cross-selling our various services to customers is a good example of a sales initiative that is bringing about improved margins, while also enhancing the value we bring to customers.
In North America, revenue for the quarter was stable at $1.2 billion. Operating income, before impairment of assets, restructuring and other charges, was $45 million compared to $124 million for the same quarter in 2002. These results include specific charges of $39 million as described previously. The decrease in operating income is the result of reduced advertising spending, the continuing competitive pricing environment and other charges. Ongoing cost reduction and operational consolidation will benefit margins going forward. Times may be tough, but for companies of our size and scope, there is opportunity. We continue to gain new business with leading publishers and retailers and to renew agreements with our major customers. In magazines, we are gaining a significant share of any new launches including titles from Hearst, Condé Nast, Bauer and Maxim. We were also awarded an important piece of new business with Hemmings Motor News that had been printed by a competitor for the last 30 years. During the quarter we also announced the signing of a multi-year directory contracts with Yellow Book USA and Verizon Canada.
In Europe, revenues for the quarter increased to $268 million primarily due to currency translation. Operating income, before impairment of assets, restructuring and other charges, was $3.4 million compared to $8.2 in the same quarter of 2002. These results include specific charges of $2.1 million as described previously. The European print market continues to suffer from over-capacity affecting both volume and pricing. Our businesses in the UK, Belgium and Austria performed well during the quarter but difficult market conditions in France, Spain and the Nordic countries had a negative impact on overall results. During the quarter, Yvan Lesniak was appointed Managing Director of Operations for France. Mr. Lesniak's leadership and extensive experience in the printing industry will be significant factors in restoring profitability to our French platform.
Our Latin American business is also being impacted by excess print capacity in the region and a difficult economic environment. Revenue for the quarter was stable compared to the same period last year but the operating loss, before impairment of assets, restructuring and other charges, was $3.5 million compared to operating income of $2.7 million in the second quarter of 2002. These results include specific charges of $4.4 million as described previously. This business has expanded rapidly during the last several years and we expect recent cost reductions will help to improve margins and operating income as we move forward.
4
New Investment
While the economic conditions remain difficult we continue to invest in the future. The Company recently announced an additional investment of $13 million in our Dubuque, Iowa facility that will dramatically enhance our ability to compete in the educational book market. This investment is made possible in part by a long-term enabling contract with McGraw-Hill under which Quebecor World will print one-third of all new McGraw-Hill titles, particularly in the education market.
The investment involves relocating and upgrading an exiting press and adding new, in-line binding, sewing and casing lines. The Dubuque facility will become specialized in and have the largest capacity in the industry for 107/8 hard cover educational books. Publishers in this market are demanding that printers provide facilities that are dedicated to the printing and binding of educational books and with this investment Dubuque will fit the bill. We firmly believe that demographics and product dynamics will generate real growth in this market during the next several years.
Substantial Issuer Bid
During the quarter, the Company repurchased for cancellation a total of 10,000,000 Subordinate Voting Shares pursuant to its Substantial Issuer Bid dated April 24, 2003 at a purchase price of Cdn $24.00. Management continues to consider Quebecor World stock to be significantly undervalued at current prices and believes that this re-purchase of shares is an appropriate use of cash flow that will provide additional shareholder value.
Dividend
The Board of Directors declared a dividend of $0.13 per share on Multiple Voting Shares and Subordinate Voting Shares. The Board also declared a dividend of CDN$0.3845 per share on Series 3 Preferred Shares, CDN$0.4219 per share on Series 4 Preferred Shares and CDN$0.43125 on Series 5 Preferred Shares. The dividends are payable on September 1, 2003 to shareholders of record at the close of business August 15, 2003.
 | ||
| The Right Honourable Brian Mulroney Chairman of the Board | Jean Neveu President and Chief Executive Officer | |
Breakdown of Revenues
Six Months
5
MANAGEMENT'S DISCUSSION AND ANALYSIS OF
FINANCIAL CONDITION AND RESULTS OF OPERATIONS
Overview
Quebecor World is the largest commercial print media services company in the world. Quebecor World is the market leader in most of its product categories and geographies. This market-leading position has been built through a combination of successfully integrated acquisitions, investments in key strategic technologies and a commitment to building long-term partnerships with the world's leading print media customers.
Quebecor World has facilities in the United States, Canada, France, the United Kingdom, Spain, Switzerland, Sweden, Finland, Austria, Belgium, Brazil, Chile, Argentina, Peru, Colombia, Mexico and India.
Certain measures used do not have any standardized meaning under Canadian Generally Accepted Accounting Principles (GAAP). When used, these measures were defined in such terms to allow the reconciliation to the closest GAAP measure. Numerical reconciliations were also provided, when needed. It is not likely that these measures could be compared to similar measures presented by other companies.
Review of Second Quarter and Year-to-Date
In the second quarter of 2003, Quebecor World continued to experience significant negative price pressures and difficult economic conditions accross its global platform. The challenging economic climate requires rigorous financial management at every level of the Company.
As a result of changes in management, a detailed review of the Company's operations has been undertaken to further reduce the cost base and improve efficiencies. This resulted in additional restructuring and other charges of $34.4 million, including a non-cash portion of $6.0 million.
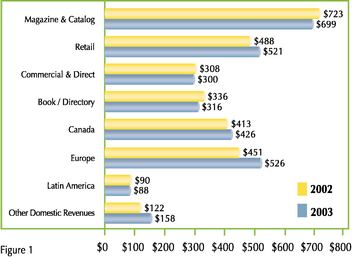
Revenue by Business Groups ($ millions)
For the six-month periods ended June 30
In addition, the Company reviewed its inventory of unused assets and decided to dispose of the majority of this equipment. This resulted in a charge for impairment of assets of $47.4 million. Details of these two items, totalling $81.8 million, are discussed later in this document.
6
Revenues were $1,502.5 million for the second quarter ended June 30, 2003, $31.0 million higher than 2002. On a year-to-date basis, consolidated revenues increased from $2,930.7 million in 2002 to $3,033.8 million in 2003. These variances were mainly explained by the favourable impact of currency translation and the acquisition of Hachette Filipacchi Medias (see figure 2). There is also an increase in Logistics revenues due to internal business growth across the world. The book market is however under significant negative pressure, with volume shifting to lower quality products and productions in shorter runs.
Impact of Foreign Currency and Business Acquisition
($ millions)
| | Three Months ended June 30, 2003 | Six Months ended June 30, 2003 | ||||||
|---|---|---|---|---|---|---|---|---|
| Revenues | ||||||||
| Foreign currency impact | $ | 64.9 | $ | 105.7 | ||||
| Business acquisition | — | 23.7 | ||||||
| Total | $ | 64.9 | $ | 129.4 | ||||
| Operating income | ||||||||
| Foreign currency impact | $ | 1.0 | $ | 1.1 | ||||
| Business acquisition | — | (0.2 | ) | |||||
| Total | $ | 1.0 | $ | 0.9 | ||||
Figure 2
Consolidated operating income before impairment of assets, restructuring and other charges for the three and the six-month periods ended June 30, 2003 were lower than in 2002. The Company assesses the performance of each segment based on operating income before impairment of assets, restructuring and other charges. A reconciliation with operating income is provided in figure 3.
The following operating analyses are before impairment of assets, restructuring and other charges.
In the quarter, the Company incurred specific charges totalling $48.9 million that reduced operating income. This included a $15 million adjustment related to rapid growth and systems issues in the North American Logistics business and a $15 million provision for doubtful accounts. It also included $19 million of various other adjustments of less than $2.5 million, such as write-downs of other assets, inventories and other items. On a year-to-date basis, specific charges amounted to $53.9 million.
In North America, revenues remained stable despite significantly lower prices on contractual work and eroding prices in the spot market, created by overcapacity mainly in the Book and Commercial segments. These reductions were partially offset by growth in the Logistics business.
Specific charges of $39.3 million, recorded in the quarter, further diluted operating margins. The largest item related to rapid growth and systems issues in the Logistics business, preventing a proper tracking of transactions. Adjustments totalling approximately $15 million were recorded following a change in the group traffic operating systems. Items of this nature did not occur in 2002. This group is now under new management. The other large item related to the recording of an additional bad debt provision of approximately $11 million, reflecting the slow economic environment.
In Europe, revenues increased due to the positive impact of the currency translation, which was partially offset by lower prices. These lower prices led to significantly lower margins. The Company's French operations, representing approximately 50% of its European operations, continued to report negative operating income and margins. This resulted from declining markets due to the weak European economy and overcapacity, as well as operating inefficiencies and a high-cost structure. The Company recently appointed new management for its French operations, which should have a positive impact on future results. Specific charges related to Europe amounted to $2.1 million in the quarter.
7
In Latin America, revenues remained nearly unchanged in both the second quarter and the first half of 2003 when compared to the same period in 2002. Margins however continued to be eroded by price pressure resulting from overcapacity in the Latin America printing market and a general economic slowdown in the region. Particularly adverse market conditions were felt in Argentina, Colombia and Mexico. Specific charges of $4.4 million, essentially related to an increase in the allowance for doubtful accounts, were also recorded in the second quarter.
Selling, general and administrative expenses increased by $15.8 million to $136.1 million in the second quarter of 2003 from $120.3 million in 2002. On a year-to-date basis, selling, general and administrative expenses were $266.5 million in 2003 compared with $249.7 million in 2002. The increase resulted from the reserve for doubtful accounts discussed above.
Financial expenses increased by $3.6 million to $45.8 million in the second quarter of 2003. On a year-to-date basis, financial expenses were $91.3 million, compared to $87.7 million for the same period in 2002. The average total indebtedness of the quarter is back to last year's level reflecting funds used for the Substantial Issuer Bid. The higher expense was mainly due to the net impact of the currency mix and the fixed to floating mix of the debt portfolio.
For the second quarter of 2003, income taxes were $(23.5) million compared to $20.8 million in 2002. On a year-to-date basis, income taxes were $(16.1) million compared to $35.5 million in 2002. Before impairment of assets, restructuring and other charges, income taxes were $(2.2) million and $5.2 million for the quarter and year-to-date ended June 30, 2003. The effective tax rate, before impairment of assets, restructuring and other charges, was 18.1% for the six-month period of 2003 compared to 24% for the full year 2002.The decrease in income taxes is due to lower profitability in countries with a higher overall tax rate.
8
Segmented Results of Operations ($ millions)
Selected Performance Indicators
| | North America | Europe | Latin America | Inter-Segment and Others | Total | ||||||||||||||||||||||||||
|---|---|---|---|---|---|---|---|---|---|---|---|---|---|---|---|---|---|---|---|---|---|---|---|---|---|---|---|---|---|---|---|
| | 2003 | 2002 | 2003 | 2002 | 2003 | 2002 | 2003 | 2002 | 2003 | 2002 | |||||||||||||||||||||
| Three months ended June 30 | |||||||||||||||||||||||||||||||
| Revenues | $ | 1,190.8 | $ | 1,189.6 | $ | 268.1 | $ | 239.0 | $ | 43.5 | $ | 43.3 | $ | 0.1 | $ | (0.4 | ) | $ | 1,502.5 | $ | 1,471.5 | ||||||||||
| Operating income (loss) before depreciation and amortization* | 116.6 | 190.0 | 19.6 | 22.8 | (0.7 | ) | 5.2 | (2.2 | ) | (6.8 | ) | 133.3 | 211.2 | ||||||||||||||||||
| Operating income (loss)* | 45.3 | 124.0 | 3.4 | 8.2 | (3.5 | ) | 2.7 | (2.7 | ) | (7.1 | ) | 42.5 | 127.8 | ||||||||||||||||||
| Impairment of assets, restructuring and other charges | 58.2 | — | 13.2 | — | 9.6 | — | 0.8 | — | 81.8 | — | |||||||||||||||||||||
| Operating income (loss) | (12.9 | ) | 124.0 | (9.8 | ) | 8.2 | (13.1 | ) | 2.7 | (3.5 | ) | (7.1 | ) | (39.3 | ) | 127.8 | |||||||||||||||
| Operating margin before depreciation and amortization* | 9.8 | % | 16.0 | % | 7.3 | % | 9.6 | % | (1.7) | % | 12.1 | % | 8.9 | % | 14.4 | % | |||||||||||||||
| Operating margin* | 3.8 | % | 10.4 | % | 1.3 | % | 3.5 | % | (8.1) | % | 6.1 | % | 2.8 | % | 8.7 | % | |||||||||||||||
| Operating margin | (1.1) | % | 10.4 | % | (3.7) | % | 3.5 | % | (30.1) | % | 6.1 | % | (2.6) | % | 8.7 | % | |||||||||||||||
| Six months ended June 30 | |||||||||||||||||||||||||||||||
| Revenues | $ | 2,418.6 | $ | 2,390.6 | $ | 526.5 | $ | 450.8 | $ | 88.2 | $ | 90.0 | $ | 0.5 | $ | (0.7 | ) | $ | 3,033.8 | $ | 2,930.7 | ||||||||||
| Operating income (loss) before depreciation and amortization* | 269.7 | 364.5 | 34.2 | 40.9 | — | 10.4 | (5.4 | ) | (14.9 | ) | 298.5 | 400.9 | |||||||||||||||||||
| Operating income (loss)* | 128.8 | 231.5 | 3.2 | 13.5 | (5.4 | ) | 5.0 | (6.3 | ) | (15.4 | ) | 120.3 | 234.6 | ||||||||||||||||||
| Impairment of assets, restructuring and other charges | 58.2 | — | 13.2 | — | 9.6 | — | 0.8 | — | 81.8 | — | |||||||||||||||||||||
| Operating income (loss) | 70.6 | 231.5 | (10.0 | ) | 13.5 | (15.0 | ) | 5.0 | (7.1 | ) | (15.4 | ) | 38.5 | 234.6 | |||||||||||||||||
| Operating margin before depreciation and amortization* | 11.2 | % | 15.2 | % | 6.5 | % | 9.1 | % | — | % | 11.6 | % | 9.8 | % | 13.7 | % | |||||||||||||||
| Operating margin* | 5.3 | % | 9.7 | % | 0.6 | % | 3.0 | % | (6.1) | % | 5.5 | % | 4.0 | % | 8.0 | % | |||||||||||||||
| Operating margin | 2.9 | % | 9.7 | % | (1.9) | % | 3.0 | % | (17.0) | % | 5.5 | % | 1.3 | % | 8.0 | % | |||||||||||||||
- *
- Before impairment of assets, restructuring and other charges.
Figure 3
Net income for the second quarter was $(61.7) million compared to $64.2 million in 2002 and earnings per share was $(0.51), compared to $0.40 last year. For the six-month period, net income was $(37.2) million compared to $110.2 million in 2002 and earnings per share was $(0.39) compared to $0.68 last year. Excluding impairment of assets, restructuring and other charges, earnings per share for the second quarter and the first half of 2003 were respectively $(0.07) and $0.04 (see figure 4).
9
Reconciliation of Net Income (loss) and Earnings (loss) per Share
($ million, except per share amounts)
| | Three months 2003 | Six months 2003 | ||||||
|---|---|---|---|---|---|---|---|---|
| Net loss available to holders of equity shares, as reported in the consolidated statements of operations | $ | (70.5 | ) | $ | (54.2 | ) | ||
| Impairment of assets, restructuring and other charges (net of income taxes of $21.3 million) | 60.5 | 60.5 | ||||||
| Net income (loss) available to holders of equity shares, before impairment of assets, restructuring and other charges | $ | (10.0 | ) | $ | 6.3 | |||
| Diluted average number of equity shares outstanding (in millions) | 139.0 | 140.2 | ||||||
| Earnings (loss) per share | ||||||||
| Diluted | $ | (0.51 | ) | $ | (0.39 | ) | ||
| Diluted, before impairment of assets, restructuring and other charges | $ | (0.07 | ) | $ | 0.04 | |||
Figure 4
Specific charges of $48.9 million ($37.7 million net of income taxes) negatively impacted the second quarter earnings per share by $0.27. On a year-to-date basis, specific charges of $53.9 million ($41.6 million net of taxes) also negatively impacted earnings per share by $0.30.
Impairment of Assets and Restructuring Initiatives
During the second quarter of 2003, the Company recorded impairment of assets, restructuring and other charges of $81.8 million. Non-cash items amounted to $53.4 million and cash items to $28.4 million. The non-cash portion includes impairment of assets of $47.4 million and other charges of $2.8 million for the 2003 initiatives and $3.2 million for previous years' initiatives.
Impairment of assets
- •
- Impairment of assets of $47.4 million for write-downs of certain under-performing assets resulting from the overcapacity in the industry and the decision not to redeploy the assets.
Restructuring and other charges
- •
- The cash portion of the restructuring and other charges was $23.4 million and related mostly to reduction in force programs and the closure of four smaller facilities in North America. These initiatives were undertaken to improve efficiencies following the detailed review of operations performed by the new management in place. The related non-cash portion was $2.8 million for a total charge of $26.2 million. In addition, an overspending of $9.6 million related to the previous years' initiatives, offset by a reversal of $4.6 million for a net amount of $5.0 million was recorded. The related non-cash portion was $3.2 million for a total charge of $8.2 million.
Liquidity, Capital Resources and Financial Position
The Company measures its liquidity performance using the calculation of free cash flow as described in figure 5. Free cash flow reflects liquidity available for business acquisitions, equity dividends and repayments of long-term debt.
Free cash flow for the second quarter of 2003 amounted to $72.3 million compared to $40.1 million for the same quarter last year, despite a use of $64.4 million to repurchase equipment under operating
10
leases of which $23.7 million was recorded as a reduction of other long-term liabilities (see figure 5). On a year-to-date basis, free cash flow showed an outflow of $177.8 million, compared to $40.0 million at the end of June 30, 2002. Working Capital was ($73.3) million at June 30, 2003, compared to $(93.9) million at June 30, 2002. This increase of $20.6 million was primarily due to lower levels of trade payables.
In June 2003, the Company repurchased for cancellation a total of 10,000,000 Subordinate Voting Shares pursuant to its Substantial Issuer Bid dated April 24, 2003 for a net cash consideration, including redemption fees, of Cdn $241.1 million ($173.4 million). The Substantial Issuer Bid expired at midnight (Montreal time) on the evening of June 2, 2003. The excess of the price paid over the book value of the shares repurchased was charged to retained earnings.
Free Cash Flow (Outflow)
($ millions)
| | Three months | Six months | |||||||||||
|---|---|---|---|---|---|---|---|---|---|---|---|---|---|
| | 2003 | 2002 | 2003 | 2002 | |||||||||
| Cash provided by operating activities | $ | 177.8 | $ | 109.4 | $ | 5.7 | $ | 82.4 | |||||
| Dividends on preferred shares | (10.2 | ) | (7.2 | ) | (14.8 | ) | (14.3 | ) | |||||
| Additions to property, plant and equipment | (95.9 | ) | (65.9 | ) | (170.0 | ) | (112.4 | ) | |||||
| Net proceeds from disposal of other assets | 0.6 | 3.8 | 1.3 | 4.3 | |||||||||
| Free cash flow (outflow) from operations | $ | 72.3 | $ | 40.1 | $ | (177.8 | ) | $ | (40.0 | ) | |||
Figure 5
During the six-month period ended June 30, 2003, the Company acquired some minority interests in Spain (Europe) and North America.
As at June 30, 2003, the Company's debt level was at $2,254.6 million, a $53.3 million increase compared to the end of June 2002. Including accounts receivable securitization, total debt would be $2,868.2 million, $83.4 million higher than last year (see figure 6). The increase reflected new borrowings to complete the recent Substantial Issuer Bid. The debt-to-capitalization ratio was 47:53 compared to 46:54 in 2002.
Total Debt and Accounts Receivable Securitization ($ millions)
| | June 30, 2003 | June 30, 2002 | ||||
|---|---|---|---|---|---|---|
| Bank indebtedness | $ | 1.1 | $ | 0.1 | ||
| Current portion of long-term debt and convertible notes | 17.5 | 49.3 | ||||
| Long-term debt | 2,120.2 | 2,037.8 | ||||
| Convertible notes | 115.8 | 114.1 | ||||
| Total debt | $ | 2,254.6 | $ | 2,201.3 | ||
| Accounts receivable securitization | 613.6 | 583.5 | ||||
| Total debt and accounts receivable securitization | $ | 2,868.2 | $ | 2,784.8 | ||
Figure 6
The average annual cash obligations over the next two years represent approximately 11% of the 2002 operating income before depreciation and amortization and before restructuring and other charges (see figure 7).
11
Contractual Cash Obligations ($ millions)
| | Remaining of 2003 | 2004 | 2005 | 2006 | 2007 | 2008 and thereafter | ||||||||||||
|---|---|---|---|---|---|---|---|---|---|---|---|---|---|---|---|---|---|---|
| Long-term debt and convertible notes | $ | 1 | $ | 7 | $ | — | $ | 338 | $ | 760 | $ | 1,076 | ||||||
| Capital leases | 10 | 20 | 11 | 8 | 6 | 17 | ||||||||||||
| Operating leases | 44 | 77 | 70 | 57 | 43 | 83 | ||||||||||||
| Purchase of equipment | 13 | 15 | — | — | — | — | ||||||||||||
| Total contractual cash obligations | $ | 68 | $ | 119 | $ | 81 | $ | 403 | $ | 809 | $ | 1,176 | ||||||
Figure 7
The minimum legal requirement for pension contributions is $23 million in 2003 but the Company anticipates making contributions of $64 million. In 2002, the Company made total contributions of $40 million, including an excess voluntary contribution of $20 million.
The Company invested $95.9 million in capital projects during the second quarter of 2003 compared to $65.9 million for the same period last year. On a year-to-date basis, $170.0 million has been invested in capital projects in 2003 compared to $112.4 million in 2002. During the quarter, the Company proceeded to purchase 19 presses that were previously under an operating lease in North America. A new Goss press was also added at the Web Press plant (Vancouver, Canada) and major capital projects announced in the first quarter were continued.
The Company believes that its liquidity, capital resources and cash flow from operations are sufficient to fund planned capital expenditures, working capital requirements, interest and principal payments for the foreseeable future.
Risks and Uncertainties
In the normal course of business, the Company is exposed to changes in interest rates and foreign exchange rates. However, the interest-rate exposure is managed by having a balanced schedule of debt maturities as well as a combination of fixed and variable rate obligations. In addition, the Company has entered into interest-rate swap agreements to manage this exposure.
The Company has also entered into foreign exchange forward contracts and cross-currency interest rate swaps to hedge the settlement of raw materials and equipment purchases, to set the exchange rate for foreign denominated sales and to manage foreign exchange exposure on net investments.
While the counterparties of these agreements expose the Company to credit loss in the event of non-performance, the possibility of incurring such a loss is remote due to the creditworthiness of the counterparties. Derivative financial instruments for trading purposes are not held or issued.
Concentrations of credit risk with respect to trade receivables are limited due to diverse operations and a large customer base. As at June 30, 2003, there are no significant concentrations of credit risk.
Accounting Policies
The Consolidated Financial Statements have been prepared using the same accounting policies described in the Company's latest Annual Report with the exception of the following items.
In February 2003, the Canadian Institute of Chartered Accountants ("CICA") issued Accounting Guideline 14,Disclosure of Guarantees (AcG-14), which clarifies disclosure requirements for certain guarantees. The Company adopted the new recommendations effective January 1, 2003. The impact of that change is presented in note 2 a) of the quarterly consolidated financial statements.
12
In March 2003, the Emerging Issues Committee releasedAbstracts EIC-134,Accounting for Severance and Termination Benefits ("EIC-134"), and EIC-135,Accounting for Costs Associated with Exit and Disposal Activities (Including Costs Incurred in a Restructuring) ("EIC-135"). EIC-134 provides interpretive guidance to the accounting requirements for the various types of severance and termination benefits covered in CICA Handbook Section 3461,Employee Future Benefits. EIC-135 provides interpretive guidance for the timing of the recognition of a liability for costs associated with an exit or disposal activity. The new guidance requires that the liability be recognized for those costs only when the liability is incurred, that is, when it meets the definition of a liability in CICA Handbook Section 1000,Financial Statement Concepts. These new EICs also establish fair value as the objective for initial measurement of liabilities related to exit or disposal activities.
Together, these two EICs are intended to harmonize Canadian GAAP with US SFAS No. 146,Accounting for Costs Associated with Exit or Disoposal Activities ("FAS 146"). The Company adopted the new recommendations effective April 1, 2003. The impact of these changes is reflected in note 3 of the quarterly consolidated financial statements.
Seasonality
The operations of the Company's business are seasonal, with approximately two-thirds of historical operating income recognized in the second-half of the fiscal year, primarily due to the higher number of magazine pages, new product launches and back-to-school, retail and holiday catalog promotions.
Forward Looking Statements
Except for historical information contained herein, the statements in this document are forward-looking and made pursuant to the safe harbor provisions of thePrivate Securities Litigation Reform Act of 1995. Forward-looking statements involve known and unknown risks and uncertainties, which may cause the actual results in future periods to differ materially from forecasted results. Those risks include, among others, changes in customer demand for the Company's products, changes in raw material and equipment costs and availability, seasonal changes in customer orders, pricing actions by competitors and general changes in economic conditions.
/s/ CARL GAUVREAU
Carl Gauvreau
Senior Vice President
Chief Accounting Officer
13
CONSOLIDATED STATEMENTS OF OPERATIONS AND RETAINED EARNINGS
Periods ended June 30
(In millions of US dollars, except for earnings per share amounts)
(Unaudited)
| | | Three months | Six months | ||||||||||||||
|---|---|---|---|---|---|---|---|---|---|---|---|---|---|---|---|---|---|
| | Notes | 2003 | 2002 | 2003 | 2002 | ||||||||||||
| Revenues | $ | 1,502.5 | $ | 1,471.5 | $ | 3,033.8 | $ | 2,930.7 | |||||||||
| Operating expenses: | |||||||||||||||||
| Cost of sales | 1,238.5 | 1,144.7 | 2,480.1 | 2,289.8 | |||||||||||||
| Selling, general and administrative | 136.1 | 120.3 | 266.5 | 249.7 | |||||||||||||
| Depreciation and amortization | 85.4 | 78.7 | 166.9 | 156.6 | |||||||||||||
| Impairment of assets, restructuring and other charges | 3 | 81.8 | — | 81.8 | — | ||||||||||||
| 1,541.8 | 1,343.7 | 2,995.3 | 2,696.1 | ||||||||||||||
| Operating income (loss) | (39.3 | ) | 127.8 | 38.5 | 234.6 | ||||||||||||
| Financial expenses | 45.8 | 42.2 | 91.3 | 87.7 | |||||||||||||
| Income (loss) before income taxes | (85.1 | ) | 85.6 | (52.8 | ) | 146.9 | |||||||||||
| Income taxes | (23.5 | ) | 20.8 | (16.1 | ) | 35.5 | |||||||||||
| Income (loss) before minority interest | (61.6 | ) | 64.8 | (36.7 | ) | 111.4 | |||||||||||
| Minority interest | 0.1 | 0.6 | 0.5 | 1.2 | |||||||||||||
| Net income (loss) | $ | (61.7 | ) | $ | 64.2 | $ | (37.2 | ) | $ | 110.2 | |||||||
| Net income available to holders of preferred shares | 8.8 | 7.3 | 17.0 | 14.4 | |||||||||||||
| Net income (loss) available to holders of equity shares | $ | (70.5 | ) | $ | 56.9 | $ | (54.2 | ) | $ | 95.8 | |||||||
| Earnings (loss) per share: | 8 | ||||||||||||||||
| Basic | $ | (0.51 | ) | $ | 0.40 | $ | (0.39 | ) | $ | 0.68 | |||||||
| Diluted | $ | (0.51 | ) | $ | 0.40 | $ | (0.39 | ) | $ | 0.68 | |||||||
| Average number of equity shares outstanding (in millions) | 8 | ||||||||||||||||
| Basic | 139.0 | 140.6 | 140.2 | 140.4 | |||||||||||||
| Diluted | 139.0 | 145.7 | 140.2 | 145.3 | |||||||||||||
Retained earnings: | |||||||||||||||||
| Balance, beginning of period | $ | 899.9 | $ | 742.5 | $ | 901.9 | $ | 721.8 | |||||||||
| Net income (loss) | (61.7 | ) | 64.2 | (37.2 | ) | 110.2 | |||||||||||
| Shares repurchased | |||||||||||||||||
| Dividends: | 7 | (39.0 | ) | — | (39.0 | ) | (1.4 | ) | |||||||||
| Equity shares | (18.4 | ) | (16.9 | ) | (36.8 | ) | (33.7 | ) | |||||||||
| Preferred shares | (9.0 | ) | (7.2 | ) | (17.1 | ) | (14.3 | ) | |||||||||
| Balance, end of period | $ | 771.8 | $ | 782.6 | $ | 771.8 | $ | 782.6 | |||||||||
See Notes to Consolidated Financial Statements.
14
CONSOLIDATED STATEMENTS OF CASH FLOWS
Periods ended June 30
(In millions of US dollars)
(Unaudited)
| | | Three months | Six months | ||||||||||||||
|---|---|---|---|---|---|---|---|---|---|---|---|---|---|---|---|---|---|
| | Notes | 2003 | 2002 | 2003 | 2002 | ||||||||||||
| Operating activities: | |||||||||||||||||
| Net income (loss) | $ | (61.7 | ) | $ | 64.2 | $ | (37.2 | ) | $ | 110.2 | |||||||
| Non-cash items in net income (loss): | |||||||||||||||||
| Depreciation of property, plant and equipment | 84.8 | 78.2 | 165.8 | 155.5 | |||||||||||||
| Impairment of assets and non-cash portion of restructuring and other charges | 3 | 53.4 | — | 53.4 | — | ||||||||||||
| Future income taxes | (36.1 | ) | 10.0 | (31.5 | ) | 22.3 | |||||||||||
| Amortization of deferred charges | 6.0 | 5.2 | 12.4 | 10.8 | |||||||||||||
| Other | 1.8 | 2.0 | 3.7 | 4.1 | |||||||||||||
| Changes in non-cash balances related to operations: | |||||||||||||||||
| Trade receivables | 166.0 | 89.1 | 132.7 | (49.3 | ) | ||||||||||||
| Inventories | 21.6 | (22.8 | ) | 35.8 | (33.3 | ) | |||||||||||
| Trade payables and accrued liabilities | (41.8 | ) | (106.5 | ) | (274.3 | ) | (106.5 | ) | |||||||||
| Other current assets and liabilities | 13.2 | (8.9 | ) | (4.9 | ) | (19.4 | ) | ||||||||||
| Other non-current assets and liabilities | (29.4 | ) | (1.1 | ) | (50.2 | ) | (12.0 | ) | |||||||||
| Cash provided from operating activities | 177.8 | 109.4 | 5.7 | 82.4 | |||||||||||||
Financing activities: | |||||||||||||||||
| Net change in bank indebtedness | 0.9 | — | 0.8 | — | |||||||||||||
| Net proceeds from issuance of equity shares | 3.7 | 7.4 | 7.4 | 13.4 | |||||||||||||
| Repurchases of shares for cancellation | 7 | (173.4 | ) | — | (173.4 | ) | (3.5 | ) | |||||||||
| Issuance (repayments) of long-term debt | 141.6 | (42.3 | ) | 414.0 | (28.6 | ) | |||||||||||
| Dividends on equity shares | (18.4 | ) | (16.9 | ) | (36.8 | ) | (33.7 | ) | |||||||||
| Dividends on preferred shares | (10.2 | ) | (7.2 | ) | (14.8 | ) | (14.3 | ) | |||||||||
| Dividends to minority shareholders | (0.1 | ) | (1.9 | ) | (0.4 | ) | (1.9 | ) | |||||||||
| Cash provided (used) from financing activities | (55.9 | ) | (60.9 | ) | 196.8 | (68.6 | ) | ||||||||||
Investing activities: | |||||||||||||||||
| Business acquisitions, net of cash and cash equivalents | 4 | (4.4 | ) | (1.2 | ) | (7.5 | ) | 2.7 | |||||||||
| Additions to property, plant and equipment | (95.9 | ) | (65.9 | ) | (170.0 | ) | (112.4 | ) | |||||||||
| Net proceeds from disposal of other assets | 0.6 | 3.8 | 1.3 | 4.3 | |||||||||||||
| Other | (0.8 | ) | 1.6 | (0.8 | ) | 1.6 | |||||||||||
| Cash used by investing activities | (100.5 | ) | (61.7 | ) | (177.0 | ) | (103.8 | ) | |||||||||
Effect of exchange rate changes on cash and cash equivalents | (20.9 | ) | 10.6 | (21.2 | ) | 5.8 | |||||||||||
| Net increase (decrease) in cash and cash equivalents | 0.5 | (2.6 | ) | 4.3 | (84.2 | ) | |||||||||||
Cash and cash equivalents, beginning of period | 6.5 | 3.9 | 2.7 | 85.5 | |||||||||||||
| Cash and cash equivalents, end of period | $ | 7.0 | $ | 1.3 | $ | 7.0 | $ | 1.3 | |||||||||
| Supplemental cash flow information: | |||||||||||||||||
| Interest paid | $ | 26.5 | $ | 28.5 | $ | 84.6 | $ | 89.2 | |||||||||
| Income taxes paid | 2.7 | 20.6 | 32.3 | 32.4 | |||||||||||||
See Notes to Consolidated Financial Statements.
15
(In millions of US dollars)
| | Notes | June 30 (Unaudited) | December 31 (Audited) | June 30 (Unaudited) | |||||||||
|---|---|---|---|---|---|---|---|---|---|---|---|---|---|
| | | 2003 | 2002 | 2002 | |||||||||
| Assets | |||||||||||||
| Current assets: | |||||||||||||
| Cash and cash equivalents | $ | 7.0 | $ | 2.7 | $ | 1.3 | |||||||
| Trade receivables | 356.7 | 466.9 | 423.7 | ||||||||||
| Receivables from related parties | 10.2 | 15.5 | 5.8 | ||||||||||
| Inventories | 387.1 | 409.4 | 417.8 | ||||||||||
| Income taxes receivable | 23.3 | 21.7 | 50.1 | ||||||||||
| Future income taxes | 27.8 | 27.8 | 58.2 | ||||||||||
| Prepaid expenses | 27.0 | 25.2 | 30.0 | ||||||||||
| Total current assets | 839.1 | 969.2 | 986.9 | ||||||||||
Property, plant and equipment, net | 2,634.8 | 2,610.6 | 2,703.0 | ||||||||||
| Goodwill | 5 | 2,557.1 | 2,514.3 | 2,500.0 | |||||||||
| Other assets | 132.3 | 113.3 | 123.5 | ||||||||||
| Total assets | $ | 6,163.3 | $ | 6,207.4 | $ | 6,313.4 | |||||||
Liabilities and Shareholders' Equity | |||||||||||||
| Current liabilities: | |||||||||||||
| Bank indebtedness | $ | 1.1 | $ | 0.3 | $ | 0.1 | |||||||
| Trade payables | 343.4 | 581.2 | 475.1 | ||||||||||
| Accrued liabilities | 483.7 | 485.8 | 485.6 | ||||||||||
| Payables to related parties | — | 1.9 | 0.5 | ||||||||||
| Income and other taxes payable | 66.7 | 70.8 | 70.2 | ||||||||||
| Current portion of long-term debt and convertible notes | 17.5 | 38.5 | 49.3 | ||||||||||
| Total current liabilities | 912.4 | 1,178.5 | 1,080.8 | ||||||||||
Long-term debt | 2,120.2 | 1,668.6 | 2,037.8 | ||||||||||
| Other liabilities | 215.1 | 228.9 | 247.1 | ||||||||||
| Future income taxes | 266.5 | 291.7 | 267.9 | ||||||||||
| Convertible notes | 115.8 | 115.0 | 114.1 | ||||||||||
| Minority interest | 21.0 | 20.9 | 13.2 | ||||||||||
Shareholders' equity: | |||||||||||||
| Capital stock | 7 | 1,686.9 | 1,813.9 | 1,804.6 | |||||||||
| Additional paid-in capital | 103.5 | 103.6 | 104.6 | ||||||||||
| Retained earnings | 771.8 | 901.9 | 782.6 | ||||||||||
| Translation adjustment | (49.9 | ) | (115.6 | ) | (139.3 | ) | |||||||
| 2,512.3 | 2,703.8 | 2,552.5 | |||||||||||
| Total liabilities and shareholders' equity | $ | 6,163.3 | $ | 6,207.4 | $ | 6,313.4 | |||||||
See Notes to Consolidated Financial Statements.
16
NOTES TO CONSOLIDATED FINANCIAL STATEMENTS
Periods ended June 30, 2003 and 2002
(Tabular amounts are expressed in millions of US dollars, except for earnings per share amounts)
(Unaudited)
1. Basis of presentation
The Consolidated Financial Statements included in this report are unaudited and reflect normal and recurring adjustments which are, in the opinion of the Company, considered necessary for a fair presentation. These Consolidated Financial Statements have been prepared in conformity with Canadian generally accepted accounting principles. The same accounting policies as described in the Company's latest Annual Report have been used, with the exception of the new accounting changes described in note 2. However, these Consolidated Financial Statements do not include all disclosures required under Canadian generally accepted accounting principles and accordingly should be read in conjunction with the Consolidated Financial Statements and the notes thereto included in the Company's latest Annual Report. The results of operations for the interim periods should not be considered indicative of full year results due to the seasonality of the business.
Reclassification
Certain reclassifications have been made to prior years' amounts in order to conform with the basis of presentation adopted in the current year.
2. New accounting standards
a) Guarantees
In February 2003, the Canadian Institute of Chartered Accountants ("CICA") issued Accounting Guideline 14,Disclosure of Guarantees (AcG-14), which clarifies disclosure requirements for certain guarantees. The Company adopted the new recommendations effective January 1, 2003.
In the normal course of business, the Company enters into numerous agreements that may contain features that meet the AcG-14 definition of a guarantee. AcG-14 defines a guarantee to be a contract (including an indemnity) that contingently requires the Company to make payments to a third party based on (i) changes in an underlying that is related to an asset, a liability or an equity of the guaranteed party, or (ii) failure of another party to perform under an obligating agreement.
Significant guarantees the Company has provided to third parties include the following:
Operating leases
The Company has guaranteed a portion of the residual values of certain of its assets under operating leases with expiry dates between 2003 and 2007, for the benefit of the lessor. If the fair value of the assets, at the end of their respective lease term, is less than the residual value garanteed, then the Company must, under certain conditions, compensate the lessor for a portion of the shortfall. The maximum exposure in respect of these guarantees is $112.2 million. As at June 30, 2003, the Company has recorded a liability of $1.5 million associated with these guarantees.
Sub-lease agreements
The Company has, for some of its assets under operating leases, entered into sub-lease agreements with expiry dates between 2003 and 2006. If the sub-lessee defaults under the agreement, the Company must, under certain conditions, compensate the lessor for the default. The maximum exposure in respect of
17
these guarantees is $2.8 million. As at June 30, 2003, the Company has not recorded a liability associated with these guarantees, since it is not probable that the sub-lessee will default under the agreement. Recourse against the sub-lessee is also available, up to the total amount due.
Business and real estate disposals
In the sale of all or a part of a business or real estate, in addition to possible indemnification relating to failure to perform covenants and breach of representations and warranties, the Company may agree to indemnify against claims from its past conduct of the business. Typically, the term and amount of such indemnification will be limited by the agreement. The nature of these indemnification agreements prevents the Company from estimating the maximum potential liability that could be required to pay to guaranteed parties. The Company has not accrued any amount in the Consolidated balance sheet in respect to this item.
b) Termination benefits and costs associated with exit and disposal activities
In March 2003, the Emerging Issues Committee releasedAbstracts EIC-134,Accounting for Severance and Termination Benefits ("EIC-134"), and EIC-135,Accounting for Costs Associated with Exit and Disposal Activities (Including Costs Incurred in a Restructuring) ("EIC-135"). EIC-134 provides interpretive guidance to the accounting requirements for the various types of severance and termination benefits covered in CICA Handbook Section 3461,Employee Future Benefits. EIC-135 provides interpretive guidance for the timing of the recognition of a liability for costs associated with an exit or disposal activity. The new guidance requires that the liability be recognized for those costs only when the liability is incurred, that is, when it meets the definition of a liability in CICA Handbook Section 1000,Financial Statement Concepts. These new EICs also establish fair value as the objective for initial measurement of liabilities related to exit or to dispose activities. Together, these two EICs are intended to harmonize Canadian GAAP with US SFAS No. 146,Accounting for Costs Associated with Exit or Disposal Activities ("FAS 146"). The Company adopted the new recommendations effective April 1, 2003.
3. Impairment of assets, restructuring and other charges
During the second quarter of 2003, the Company recorded impairment of assets, restructuring and other charges of $81.8 million. Non-cash items amounted to $53.4 million and cash items to $28.4 million. The non-cash portion includes impairment of assets of $47.4 million and other charges of $2.8 million for the 2003 initiatives and $3.2 million for previous years' initiatives.
Impairment of assets
During the second quarter of 2003, the Company reviewed the status of assets that became permanently idle following the prior years' restructuring initiatives and difficult economic conditions. The Company determined that these assets would not be redeployed as it was first considered under an economic recovery scenario, and as such, recorded impairment of assets of $47.4 million.
Restructuring initiatives
During the second quarter of 2003, the Company has also initiated new restructuring initiatives and other charges following the continued volume declines in certain business segments. A cash charge of $23.4 million was taken consisting of $17.6 million in workforce reduction costs and $5.8 million of additional closure costs of four smaller facilities. The amount of $17.6 million in workforce reduction costs included $5.8 million for Europe and $10.0 million for North America. Related to this, an asset write-down of $2.8 million was also recorded.
18
As at June 30, 2003, 792 employees had been terminated under these new restructuring initiatives and 201 will be terminated shortly.
2002 and 2001 restructuring initiatives
The execution of the 2002 and 2001 initiatives resulted in cash overspending of $9.6 million, before a reversal of $4.6 million, recorded in the 2003 restructuring and other charges. These were related to costs of closed facilities not yet disposed of, and office leases not yet subleased or cancelled. In addition, the Company also recorded an asset write-down of $3.2 million in relation with prior years' initiatives.
Continuity of the reserve for restructuring and other charges
As at January 1, 2003, the balance of the restructuring reserve was $51.2 million. This amount related mostly to the workforce reduction across the platform. The Company utilized $25.5 million (before foreign currency changes) of the restructuring and other charges reserve during the six-month period ended June 30, 2003.
The following table sets forth the Company's 2003 restructuring reserve and activities against the reserves carried forward from 2002:
| | Restructuring charges | Other charges | Total | |||||||
|---|---|---|---|---|---|---|---|---|---|---|
| Balance as at December 31, 2002 | $ | 50.0 | $ | 1.2 | $ | 51.2 | ||||
| Overspending of 2001-2002 initiatives | 7.8 | 1.8 | 9.6 | |||||||
| New initiatives in 2003 | 21.1 | 2.3 | 23.4 | |||||||
| Reversal of previous years' reserves | (4.6 | ) | — | (4.6 | ) | |||||
| 24.3 | 4.1 | 28.4 | ||||||||
Reserve utilized in 2003 | (24.1 | ) | (1.4 | ) | (25.5 | ) | ||||
| Foreign currency changes | 1.8 | — | 1.8 | |||||||
| Balance as at June 30, 2003 | $ | 52.0 | $ | 3.9 | $ | 55.9 | ||||
4. Business acquisitions
During the first quarter of 2003, the Company completed the purchase price allocation and adjusted the assets and liabilities acquired of European Graphic Group S.A. The effect of these adjustments did not have a significant impact on the consolidated financial statements.
Also, during the first quarter, the Company acquired minority interests in Spain (Europe) for a cash consideration of $3.1 million, of which $2.2 million has been recorded in goodwill.
During the second quarter, the Company acquired minority interests in North America for a cash consideration of $4.4 million, of which $3.0 million has been recorded in goodwill.
19
5. Goodwill
The changes in the carrying amount of goodwill for the six-month period ended June 30, 2003 are as follows:
| | North America | Europe | Latin America | Total | ||||||||
|---|---|---|---|---|---|---|---|---|---|---|---|---|
| Balance as at January 1, 2003 | $ | 2,182.3 | $ | 324.8 | $ | 7.2 | $ | 2,514.3 | ||||
| Goodwill acquired during the period | 3.0 | 2.2 | — | 5.2 | ||||||||
| Foreign currency changes | 5.5 | 30.8 | 1.3 | 37.6 | ||||||||
| Balance as at June 30, 2003 | $ | 2,190.8 | $ | 357.8 | $ | 8.5 | $ | 2,557.1 | ||||
6. Stock-based compensation
The Company's compensation cost does not include stock-based compensation. The Company's pro forma net loss, loss per share and diluted loss per share would have been as follows if the compensation cost had been determined using the fair value based method at the date of grant for awards granted since January 2002.
| | Three months 2003 | Six months 2003 | ||||||
|---|---|---|---|---|---|---|---|---|
| Pro forma net loss | $ | (62.4 | ) | $ | (38.6 | ) | ||
| Pro forma loss per share: | ||||||||
| Basic | $ | (0.51 | ) | $ | (0.40 | ) | ||
| Diluted | $ | (0.51 | ) | $ | (0.40 | ) | ||
The pro forma disclosure omits the effect of awards granted before January 1, 2002. These pro forma amounts include a compensation cost calculated using the Black-Scholes option pricing model with the following assumptions:
| | June 30, 2003 | |
|---|---|---|
| Weighted average grant date fair value of options | $5.76 | |
| Risk-free interest rate | 4.61% - 4.73% | |
| Dividend yield | 2% - 4% | |
| Expected volatility | 26% - 28% | |
| Expected life | 7 years |
7. Capital stock
In June 2003, the Company repurchased for cancellation a total of 10,000,000 Subordinate Voting Shares pursuant to its Substantial Issuer Bid dated April 24, 2003 for a net cash consideration, including redemption fees, of Cdn $241.1 million ($173.4 million). The Substantial Issuer Bid expired at midnight (Montreal time) on the evening of June 2, 2003. The excess of the price paid over the book value of the shares repurchased was charged to retained earnings.
20
8. Earnings (loss) per share
The following table sets forth the computation of basic and diluted earnings per share:
| | Three months | Six months | |||||||||||
|---|---|---|---|---|---|---|---|---|---|---|---|---|---|
| | 2003 | 2002 | 2003 | 2002 | |||||||||
| Net income (loss) available to holders of equity shares | $ | (70.5 | ) | $ | 56.9 | $ | (54.2 | ) | $ | 95.8 | |||
| Income impact on assumed conversion | |||||||||||||
| of convertible notes, net of income taxes | — | 1.2 | — | 2.4 | |||||||||
| Net income (loss) adjusted for dilution effect | $ | (70.5 | ) | $ | 58.1 | $ | (54.2 | ) | $ | 98.2 | |||
| (In millions) | |||||||||||||
| Weighted average number of equity shares outstanding | 139.0 | 140.6 | 140.2 | 140.4 | |||||||||
| Effect of dilutive convertible notes and stock options | — | 5.1 | — | 4.9 | |||||||||
| Weighted average number of diluted equity shares outstanding | 139.0 | 145.7 | 140.2 | 145.3 | |||||||||
| Earnings (loss) per share: | |||||||||||||
| Basic | $ | (0.51 | ) | $ | 0.40 | $ | (0.39 | ) | $ | 0.68 | |||
| Diluted | $ | (0.51 | ) | $ | 0.40 | $ | (0.39 | ) | $ | 0.68 | |||
For the three months and six months of 2003, diluted earnings per share do not include the effects of the convertible notes and the stock options outstanding, as the effect of their inclusion is anti-dilutive.
9. Segment disclosure
The Company operates in the printing industry. Its business groups are located in three main segments: North America, Europe and Latin America. The Company assesses the performance of each
21
segment based on operating income. These segments are managed separately since they all require specific market strategies. Summarization of the segmented information is as follows:
| | North America | Europe | Latin America | Other | Inter-Segment | Total | |||||||||||||
|---|---|---|---|---|---|---|---|---|---|---|---|---|---|---|---|---|---|---|---|
| Three months ended June 30, | |||||||||||||||||||
2003 | |||||||||||||||||||
| Revenues | $ | 1,190.8 | $ | 268.1 | $ | 43.5 | $ | — | $ | 0.1 | $ | 1,502.5 | |||||||
| Operating loss | (12.9 | ) | (9.8 | ) | (13.1 | ) | (3.5 | ) | — | (39.3 | ) | ||||||||
| Impairment of assets, restructuring and other charges | 58.2 | 13.2 | 9.6 | 0.8 | — | 81.8 | |||||||||||||
2002 | |||||||||||||||||||
| Revenues | $ | 1,189.6 | $ | 239.0 | $ | 43.3 | $ | — | $ | (0.4 | ) | $ | 1,471.5 | ||||||
| Operating income (loss) | 124.0 | 8.2 | 2.7 | (7.1 | ) | — | 127.8 | ||||||||||||
| Six months ended June 30, | |||||||||||||||||||
2003 | |||||||||||||||||||
| Revenues | $ | 2,418.6 | $ | 526.5 | $ | 88.2 | $ | — | $ | 0.5 | $ | 3,033.8 | |||||||
| Operating income (loss) | 70.6 | (10.0 | ) | (15.0 | ) | (7.1 | ) | — | 38.5 | ||||||||||
| Impairment of assets, restructuring and other charges | 58.2 | 13.2 | 9.6 | 0.8 | — | 81.8 | |||||||||||||
2002 | |||||||||||||||||||
| Revenues | $ | 2,390.6 | $ | 450.8 | $ | 90.0 | $ | — | $ | (0.7 | ) | $ | 2,930.7 | ||||||
| Operating income (loss) | 231.5 | 13.5 | 5.0 | (15.4 | ) | — | 234.6 | ||||||||||||
22
Quebecor World Head Office
612 St. Jacques Street, Montreal, Quebec, Canada H3C 4M8
Tel.: (514) 954-0101 (800) 567-7070 Fax: (514) 954-9624
www.quebecorworld.com
Pursuant to the requirements of the Securities Exchange Act of 1934, the registrant has duly caused this report to be signed on its behalf by the undersigned, thereunto duly authorized.
QUEBECOR WORLD INC. | |||
By: | /s/ RAYNALD LECAVALIER | ||
| Name: | Raynald Lecavalier | ||
| Title: | Vice President, Corporate General Counsel and Secretary | ||
| Date: | November 27, 2003 | ||
QUEBECOR WORLD INC. Filed in this Form 6-K
QUEBECOR WORLD INC. FINANCIAL HIGHLIGHTS
MESSAGE TO SHAREHOLDERS
MANAGEMENT'S DISCUSSION AND ANALYSIS OF FINANCIAL CONDITION AND RESULTS OF OPERATIONS
Revenue by Business Groups ($ millions) For the six-month periods ended June 30
CONSOLIDATED STATEMENTS OF OPERATIONS AND RETAINED EARNINGS
CONSOLIDATED STATEMENTS OF CASH FLOWS
CONSOLIDATED BALANCE SHEETS
NOTES TO CONSOLIDATED FINANCIAL STATEMENTS
HEAD OFFICE
SIGNATURES