QuickLinks -- Click here to rapidly navigate through this document
SECURITIES AND EXCHANGE COMMISSION
Washington, DC 20549
FORM 6-K
REPORT OF FOREIGN ISSUER
PURSUANT TO RULE 13a-16 or 15d-16 OF
THE SECURITIES EXCHANGE ACT OF 1934
For | THE FOURTH QUARTER AND YEAR ENDED DECEMBER 31, 2003 FINANCIAL RESULTS | |||
QUEBECOR WORLD INC. | ||||
| (Translation of Registrant's Name into English) | ||||
612 Saint-Jacques Street, Montreal, Quebec H3C 4M8 | ||||
| (Address of Principal Executive Office) | ||||
(Indicate by check mark whether the registrant files or will file annual reports under cover of Form 20-F or Form 40-F)
| Form 20-F | o | Form 40-F | ý |
(Indicate by check mark whether the registrant by furnishing the information contained in this form is also thereby furnishing the information to the Commission pursuant to Rule 12g3-2(b) under the Securities Exchange Act of 1934.)
| Yes | o | No | ý |
QUEBECOR WORLD INC.
Filed in this Form 6-K
Documents index
| 1. | Press Release dated February 6, 2004; Financial Highlights, Consolidated Statements of Income and Retained Earnings and Consolidated Statements of Cash Flows |
| 2. | Management's Discussion and Analysis of Financial Condition and Results of Operations |
| 3. | Consolidated Financial Statements |
| 4. | Certifications pursuant to 18 U.S.C. Section 1350, as adopted pursuant to Section 906 of the Sarbanes-Oxley Act of 2002 |
1

| February 6, 2004 | 02/04 | |||
For immediate release | Page 1 of 8 |
QUEBECOR WORLD ANNOUNCES 2003 FOURTH QUARTER
AND FULL-YEAR RESULTS
HIGHLIGHTS FOR 2003
• Consolidated revenues increase to $6.39 billion
• Global workforce reduced by 2,272 employee positions
• Annualized cost savings from restructuring estimated
to be in excess of $90 million
• Free cash flow from operations is $183 million
Montréal, Canada — Quebecor World Inc. (NYSE;TSX:IQW) announced that for the fourth quarter 2003 the Company recorded a net loss of $54 million or $0.48 per share, after impairment of assets, restructuring and other charges, certain specific charges and others relating to finance and tax. This compares to net income of $71 million or $0.44 per diluted share in the fourth quarter of 2002. Operating income, before the impairment of assets, restructuring and other charges was $90 million in the fourth quarter, compared to $160 million in the fourth quarter of 2002. Consolidated revenues for the quarter increased 2% to $1.74 billion compared to $1.70 billion the same quarter last year.
"Our decreased operating income for the quarter is the result of significant price declines in our industry. This is in spite of the fact that we increased volumes in most of our business groups. As a result, we have taken additional measures in the quarter to address the current difficult industry and market environments," said Jean Neveu, President and CEO Quebecor World Inc.
In the fourth quarter Quebecor World incurred a $22 million charge for the impairment of assets, restructuring and other charges. The bulk of this charge is applied to a new reduction-in-force initiative of 878 employee positions. In total, the 2003 restructuring initiatives will involve the elimination of 2,272 employee positions, 1,769 as of December 31, 2003 and 503 by the end of the first quarter 2004. The reductions are taking place in all regions where the Company operates. These initiatives are expected to produce annualized cost savings in excess of $90 million.
2
| For immediate release | Page 2 of 8 |
Also in the fourth quarter the Company took specific charges of $23 million of which, $13.9 million was related to North America, $3.4 million to Europe and the balance to Latin America and other provisions. Most of the charge, or $18.2 million, was included in selling, general and administrative expenses. Of the $13.9 million related to North America, there was $6.3 million for lease provisions and a $5.0 million provision for doubtful accounts.
For the full-year 2003, excluding specific charges and the effect of currency translation, SG&A decreased by $32 million or 6%. This is due to workforce reductions and other cost containment initiatives and was realized despite increases in medical and pension benefits.
To reduce interest expense going forward Quebecor World refinanced a portion of its long-term debt in the fourth quarter to take advantage of lower interest rates. This transaction is expected to lower interest expense by approximately $12 million per year. In completing the transaction the Company incurred a charge to financial expenses of $30 million.
"We firmly believe these measures are necessary to maintain and enhance our competitive position," said Mr. Neveu. "These initiatives will lower our cost base, reduce financial expense and improve efficiencies across our global platform."
In 2003 the reported income tax expense of $39 million includes the impact of two specific tax charges of $46 million in the fourth quarter and $53 million for the full-year. These charges are related to an adjustment of the average tax rate applied on cumulative temporary differences within states in the U.S. and the revised expectations of tax asset recoveries and liabilities from prior years.
For the-full year 2003, after impairment of assets restructuring and other charges, certain specific charges and others related to tax and finance Quebecor World reported a net loss of $31 million or $0.50 per share. This compares to net income of $279 million or $1.76 per diluted share for the full-year 2002. Operating income before impairment of assets, restructuring and other charges was $330 million compared to $563 million in 2002 and on the same basis, operating margin was 5.2% compared to 9.0% last year.
For the full-year 2003, Quebecor World generated $183 million of free cash flow compared to $320 million in 2002. "One of the strengths of Quebecor World is its ability to generative free cash flow. Through a disciplined management of working capital the Company produced significant free cash flow despite the tough environment and reduced operating income," added Mr. Neveu.
3
| For immediate release | Page 3 of 8 |
Before impairment of assets, restructuring and other charges, certain specific charges and others relating to finance and tax, Quebecor World earned $0.27 per share in the fourth quarter of 2003 and $1.01 per share for the full-year.
The following table is a summary of previously discussed specific items and their impact on 2003 earnings per share on a full year basis.
| Charge | Amount | EPS Impact | ||||
|---|---|---|---|---|---|---|
| IAROC* | $ | 98 million | $ | 0.53 | ||
| Specific Charges | $ | 79 million | $ | 0.42 | ||
| Tax Adjustment | $ | 53 million | $ | 0.39 | ||
| Refinancing Costs | $ | 30 million | $ | 0.13 | ||
| Currency Translation Adj. | $ | 5 million | $ | 0.04 | ||
- *
- Impairment of assets, restructuring and other charges
North America
In North America revenue for the quarter was $1.35 billion compared to $1.37 billion in the 4th quarter of 2002. For the full-year, revenue was $5.06 billion compared to $5.09 billion in 2002. In the quarter revenue was lower in all business segments with the exception of commercial/direct that registered an increase. Before impairment of assets, restructuring and other charges operating margin was 5.4% for the quarter and 6.1% for the full-year. Some business groups including retail and commercial, registered year over year increases in volume and revenue but not enough to offset lower prices. The magazine business continues to be hampered by sluggish ad spending while catalog volume increased. Our logistics business which primarily serves magazine and catalog customers, increased revenues 31% in 2003 to $245 million. Our directory business is also coping with pricing pressures and the book segment was adversely affected throughout the year by a weak market and significant price competition as publishers reduced inventories.
Europe
In Europe, revenues increased by 18% in the fourth quarter to $340 million and 15% for the full-year to $1.15 billion. The increase was due to favourable currency translation and acquisitions. Our French operations registered negative margins for the year but the trend improved in the later half of 2003. As the result of earlier cost containment initiatives and operational efficiencies, we recorded positive results in the fourth quarter. Revenue for the quarter increased 19% to $155 million and operating income increased to $7 million. All European countries are experiencing price pressure and overcapacity. In our operations outside of France, facilities in Austria, the U.K and Belgium performed well. Plants in Sweden, Finland and Spain were more adversely affected by pricing. Europe, as a whole, posted margins in the fourth quarter that were accretive to the consolidated margin.
4
| For immediate release | Page 4 of 8 |
Latin America
In Latin America fierce competition and currency devaluations adversely affected results. Volumes increased in the quarter and for the full-year but lower prices resulted in a 3% decrease in revenues to $177 million in 2003 compared to $184 million in 2002. In an effort to improve margins, management introduced cost containment and restructuring initiatives that resulted in the reduction of its workforce by 18% or 548 employee positions compared to December 2002.
Management Discussion and Analysis
Please refer to the MD&A for the reconciliation to Canadian generally accepted accounting principles of certain figures used to explain these results. The MD&A can be found on the Company's website atwww.quebecorworld.com and through the SEDAR and SEC filings.
The Board of Directors declared a dividend of $0.13 per share on Multiple Voting Shares and Subordinate Voting Shares. The Board also declared a dividend of CDN$0.3845 per share on Series 3 Preferred Shares, CDN$0.4219 per share on Series 4 Preferred Shares and CDN$0.43125 on Series 5 Preferred Shares. The dividends are payable on March 1st, 2004 to shareholders of record at the close of business February 13, 2004.
Quebecor World Inc. also announced today that it has filed its quarterly report for the quarter ended December 31, 2003 with the Securities and Exchange Commission. The report contains certifications from Jean Neveu, President and Chief Executive Officer and Claude Hélie, Executive Vice President and Chief Financial Officer, that the periodic report fully complies with the Securities. Exchange Act of 1934 and that the information contained in the report fairly presents, in all material respects, the financial condition and results of operations of the Company. These certifications are in accordance with the requirements of the Sarbanes-Oxley Act.
Financial statements are available on the Company's website and through the SEDAR and SEC filings.
Sedar web address:www.sedar.com
SEC web address:www.sec.gov
Quebecor World To Webcast Investor Conference Call on February 6, 2004
Quebecor World Inc. will broadcast its Fourth Quarter and full-year results conference call live over the Internet on February 6, 2004 at 2:00 PM (Eastern Time).
5
| For immediate release | Page 5 of 8 |
The conference call, which will last approximately one hour, will be webcast live and can be accessed on the Quebecor World web site:
http://www.quebecorworld.com/en/investors/webcasts/Q403
Prior to the call please ensure that you have the appropriate software. The Quebecor World web address listed above has instructions and a direct link to download the necessary software, free of charge.
Anyone unable to attend this conference call may listen to the replay tape by phoning (416) 695-5275 or (888) 509-0082, available from February 6th, 2004 to February 13th, 2004.
Except for historical information contained herein, the statements in this release are forward-looking and made pursuant to the safe harbor provisions of the Private Securities Litigation Reform Act of 1995. Forward-looking statements involve known and unknown risks and uncertainties that may cause the Company's actual results in future periods to differ materially from forecasted results. Those risks include, among others, changes in customers' demand for the Company's products, changes in raw material and equipment costs and availability, seasonal changes in customer orders, pricing actions by the Company's competitors, and general changes in economic conditions.
Quebecor World Inc. (NYSE; TSX: IQW) is one of the largest commercial printers in the world. It is a market leader in most of its major product categories which include Magazines, inserts and circulars, books, catalogs, specialty printing and direct mail, directories, digital pre-media, logistics, mail list technologies and other value added services. The Company has approximately 37,000 employees working in more than 160 printing and related facilities in the United States, Canada, Brazil, France, the United Kingdom, Belgium, Spain, Austria, Sweden, Switzerland, Finland, Chile, Argentina, Peru, Colombia, Mexico and India.
Web address:www.quebecorworld.com
– 30 –
For further Information contact:
| Jeremy Roberts Vice-President, Corporate Finance and Investor Relations Quebecor World Inc. (514) 877-5118 (800) 567-7070 | Tony Ross Director, Communications Quebecor World Inc. (514) 877-5317 (800) 567-7070 |
6
FINANCIAL HIGHLIGHTS
Periods ended December 31
(In millions of US dollars, except per share data)
(Unaudited)
| | Three months | Twelve months | ||||||||||||
|---|---|---|---|---|---|---|---|---|---|---|---|---|---|---|
| | 2003 | 2002 | 2003 | 2002 | ||||||||||
| Consolidated Results | ||||||||||||||
| Revenues | $ | 1,741.6 | $ | 1,701.5 | $ | 6,391.5 | $ | 6,271.7 | ||||||
| Operating income before depreciation and amortization and before IAROC | 182.8 | 246.2 | 689.8 | 898.4 | ||||||||||
| Operating income before IAROC | 90.1 | 160.3 | 330.4 | 562.8 | ||||||||||
| IAROC | 21.5 | 19.6 | 98.3 | 19.6 | ||||||||||
| Operating income | 68.6 | 140.7 | 232.1 | 543.2 | ||||||||||
| Net income (loss) | (53.9 | ) | 70.6 | (31.4 | ) | 279.3 | ||||||||
| Cash provided by operating activities | 395.8 | 300.8 | 461.3 | 513.4 | ||||||||||
| Free cash flow from operations* | 347.1 | 262.4 | 183.3 | 319.8 | ||||||||||
| Operating margin before depreciation and amortization and before IAROC** | 10.5 | % | 14.5 | % | 10.8 | % | 14.3 | % | ||||||
| Operating margin before IAROC** | 5.2 | % | 9.4 | % | 5.2 | % | 9.0 | % | ||||||
| Operating margin** | 3.9 | % | 8.3 | % | 3.6 | % | 8.7 | % | ||||||
Segmented Information | ||||||||||||||
| Revenues | ||||||||||||||
| North America | $ | 1,354.9 | $ | 1,366.3 | $ | 5,062.9 | $ | 5,087.6 | ||||||
| Europe | 340.3 | 288.5 | 1,151.4 | 1,002.5 | ||||||||||
| Latin America | 47.9 | 47.9 | 177.3 | 183.5 | ||||||||||
Operating income (loss) before IAROC | ||||||||||||||
| North America | $ | 72.7 | $ | 138.2 | $ | 311.1 | $ | 527.3 | ||||||
| Europe | 19.6 | 12.3 | 30.3 | 38.9 | ||||||||||
| Latin America | 0.9 | 4.0 | (3.7 | ) | 14.2 | |||||||||
Operating margins before IAROC ** | ||||||||||||||
| North America | 5.4 | % | 10.1 | % | 6.1 | % | 10.4 | % | ||||||
| Europe | 5.8 | % | 4.3 | % | 2.6 | % | 3.9 | % | ||||||
| Latin America | 1.9 | % | 8.4 | % | (2.1 | )% | 7.8 | % | ||||||
Financial Position | ||||||||||||||
| Working capital | $ | (193.0 | ) | $ | (213.8 | ) | ||||||||
| Total assets | 6,213.8 | 6,207.4 | ||||||||||||
| Long-term debt (including convertible notes) | 2,009.0 | 1,822.1 | ||||||||||||
| Shareholders' equity | 2,503.4 | 2,703.8 | ||||||||||||
| Debt-to-capitalization | 44:56 | 40:60 | ||||||||||||
Per Share Data | ||||||||||||||
| Earnings (losses) | ||||||||||||||
| Diluted | $ | (0.48 | ) | $ | 0.44 | $ | (0.50 | ) | $ | 1.76 | ||||
| Diluted before IAROC | $ | (0.36 | ) | $ | 0.61 | $ | 0.03 | $ | 1.92 | |||||
| Dividends on equity shares | $ | 0.13 | $ | 0.13 | $ | 0.52 | $ | 0.49 | ||||||
| Book value | $ | 15.51 | $ | 15.92 | ||||||||||
IAROC: Impairment of assets, restructuring and other charges.
- *
- Cash provided by operating activities, less capital expenditures net of proceeds from disposals, and preferred share dividends.
- **
- Margins calculated on revenues.
7
CONSOLIDATED STATEMENTS OF INCOME AND RETAINED EARNINGS
Periods ended December 31
(In millions of US dollars, except for earnings per share amounts)
| | Three months | Twelve months | |||||||||||||
|---|---|---|---|---|---|---|---|---|---|---|---|---|---|---|---|
| | 2003 | 2002 | 2003 | 2002 | |||||||||||
| | (Unaudited) | (Unaudited) | (Audited) | (Audited) | |||||||||||
| Revenues | $ | 1,741.6 | $ | 1,701.5 | $ | 6,391.5 | $ | 6,271.7 | |||||||
| Operating expenses: | |||||||||||||||
| Cost of sales | 1,413.5 | 1,334.9 | 5,188.8 | 4,885.9 | |||||||||||
| Selling, general and administrative | 151.9 | 124.9 | 536.4 | 507.0 | |||||||||||
| Depreciation and amortization | 86.1 | 81.4 | 335.9 | 316.0 | |||||||||||
| Impairment of assets, restructuring and other charges | 21.5 | 19.6 | 98.3 | 19.6 | |||||||||||
| 1,673.0 | 1,560.8 | 6,159.4 | 5,728.5 | ||||||||||||
| Operating income | 68.6 | 140.7 | 232.1 | 543.2 | |||||||||||
| Financial expenses | 84.1 | 42.7 | 221.3 | 170.2 | |||||||||||
| Income (loss) before income taxes | (15.5 | ) | 98.0 | 10.8 | 373.0 | ||||||||||
| Income taxes | 36.7 | 26.3 | 39.1 | 90.9 | |||||||||||
| Income (loss) before minority interest | (52.2 | ) | 71.7 | (28.3 | ) | 282.1 | |||||||||
| Minority interest | 1.7 | 1.1 | 3.1 | 2.8 | |||||||||||
| Net income (loss) | $ | (53.9 | ) | $ | 70.6 | $ | (31.4 | ) | $ | 279.3 | |||||
| Net income available to holders of preferred shares | 9.7 | 7.3 | 36.5 | 28.9 | |||||||||||
| Net income (loss) available to holders of equity shares | $ | (63.6 | ) | $ | 63.3 | $ | (67.9 | ) | $ | 250.4 | |||||
Earnings (loss) per share: | |||||||||||||||
| Basic | $ | (0.48 | ) | $ | 0.45 | $ | (0.50 | ) | $ | 1.78 | |||||
| Diluted | $ | (0.48 | ) | $ | 0.44 | $ | (0.50 | ) | $ | 1.76 | |||||
Average number of equity shares outstanding | |||||||||||||||
| (in millions) | |||||||||||||||
| Basic | 131.9 | 141.1 | 136.0 | 140.7 | |||||||||||
| Diluted | 131.9 | 145.4 | 136.0 | 145.4 | |||||||||||
Retained Earnings: | |||||||||||||||
| Balance, beginning of period | $ | 804.4 | $ | 856.9 | $ | 901.9 | $ | 721.8 | |||||||
| Net income (loss) | (53.9 | ) | 70.6 | (31.4 | ) | 279.3 | |||||||||
| Shares repurchased | (0.1 | ) | — | (39.3 | ) | (1.4 | ) | ||||||||
| Dividends: | |||||||||||||||
| Equity shares | (17.2 | ) | (18.4 | ) | (71.1 | ) | (69.0 | ) | |||||||
| Preferred shares | (9.6 | ) | (7.2 | ) | (36.5 | ) | (28.8 | ) | |||||||
| Balance, end of period | $ | 723.6 | $ | 901.9 | $ | 723.6 | $ | 901.9 | |||||||
8
CONSOLIDATED STATEMENTS OF CASH FLOWS
Periods ended December 31
(In millions of US dollars)
| | Three months | Twelve months | |||||||||||||
|---|---|---|---|---|---|---|---|---|---|---|---|---|---|---|---|
| | 2003 | 2002 | 2003 | 2002 | |||||||||||
| | (Unaudited) | (Unaudited) | (Audited) | (Audited) | |||||||||||
| Operating activities: | |||||||||||||||
| Net income (loss) | $ | (53.9 | ) | $ | 70.6 | $ | (31.4 | ) | $ | 279.3 | |||||
| Non-cash items in net income (loss): | |||||||||||||||
| Depreciation of property, plant and equipment | 85.3 | 79.9 | 333.2 | 313.2 | |||||||||||
| Future income taxes | 33.6 | 16.5 | 15.1 | 56.7 | |||||||||||
| Amortization of deferred charges | 7.4 | 6.0 | 26.2 | 22.4 | |||||||||||
| Impairment of assets and non-cash portion of restructuring and other charges | 7.0 | (0.5 | ) | 60.4 | (0.5 | ) | |||||||||
| Gain on sale of investments | — | (1.2 | ) | — | (3.9 | ) | |||||||||
| Loss on extinguishment of long-term debt | 30.2 | — | 30.2 | — | |||||||||||
| Other | 10.2 | 6.5 | 16.0 | 12.2 | |||||||||||
| Changes in non-cash balances related to operations: | |||||||||||||||
| Trade receivables | 206.6 | 76.1 | 157.0 | (91.0 | ) | ||||||||||
| Inventories | 34.2 | 30.0 | 30.8 | (21.0 | ) | ||||||||||
| Trade payables and accrued liabilities | 34.5 | 33.0 | (121.4 | ) | (18.4 | ) | |||||||||
| Other current assets and liabilities | (58.7 | ) | 35.3 | (56.3 | ) | 43.7 | |||||||||
| Other non-current assets and liabilities | 59.4 | (51.4 | ) | 1.5 | (79.3 | ) | |||||||||
| Cash provided by operating activities | 395.8 | 300.8 | 461.3 | 513.4 | |||||||||||
Financing activities: | |||||||||||||||
| Net change in bank indebtedness | 0.1 | 0.2 | 1.0 | 0.2 | |||||||||||
| Net proceeds from issuance of equity shares | 2.9 | 3.5 | 13.5 | 22.7 | |||||||||||
| Repurchases of shares for cancellation | — | — | (173.6 | ) | (3.5 | ) | |||||||||
| Issuance of long-term debt | 592.0 | — | 592.0 | — | |||||||||||
| Repayments of long-term debt | (562.5 | ) | (22.1 | ) | (582.4 | ) | (96.9 | ) | |||||||
| Net (repayments) borrowings under revolving bank facility and commercial paper | (339.6 | ) | (237.0 | ) | 108.9 | (283.6 | ) | ||||||||
| Dividends on equity shares | (17.2 | ) | (18.4 | ) | (71.1 | ) | (69.0 | ) | |||||||
| Dividends on preferred shares | (11.8 | ) | (14.6 | ) | (37.7 | ) | (36.2 | ) | |||||||
| Dividends to minority shareholders | — | (0.1 | ) | (0.4 | ) | (2.0 | ) | ||||||||
| Other | 5.7 | — | 5.7 | — | |||||||||||
| Cash used in financing activities | (330.4 | ) | (288.5 | ) | (144.1 | ) | (468.3 | ) | |||||||
Investing activities: | |||||||||||||||
| Business acquisitions, net of cash and cash equivalents | — | — | (7.5 | ) | (0.3 | ) | |||||||||
| Additions to property, plant and equipment | (37.5 | ) | (43.6 | ) | (243.1 | ) | (184.5 | ) | |||||||
| Net proceeds from disposal of assets | 0.6 | 19.8 | 2.8 | 27.1 | |||||||||||
| Other | — | 9.6 | (0.8 | ) | 19.6 | ||||||||||
| Cash used in investing activities | (36.9 | ) | (14.2 | ) | (248.6 | ) | (138.1 | ) | |||||||
Effect of exchange rate changes on cash and cash equivalents | (30.7 | ) | 3.2 | (56.2 | ) | 10.2 | |||||||||
| Net increase (decrease) in cash and cash equivalents | (2.2 | ) | 1.3 | 12.4 | (82.8 | ) | |||||||||
| Cash and cash equivalents, beginning of period | 17.3 | 1.4 | 2.7 | 85.5 | |||||||||||
| Cash and cash equivalents, end of period | $ | 15.1 | $ | 2.7 | $ | 15.1 | $ | 2.7 | |||||||
9
MANAGEMENT'S DISCUSSION AND ANALYSIS
OF FINANCIAL CONDITION AND RESULTS OF OPERATIONS
OVERVIEW
Quebecor World Inc. is one of the largest commercial print media services company in the world. Quebecor World is the market leader in most of its product categories and geographies. This market-leading position has been built through a combination of integrating acquisitions, investment in key strategic technologies and a commitment to build long-term partnerships with the world's leading print media customers.
Quebecor World has facilities in the United States, Canada, France, the United Kingdom, Spain, Switzerland, Sweden, Finland, Austria, Belgium, Brazil, Chile, Argentina, Peru, Colombia, Mexico and India.
Certain measures used in this discussion and analysis do not have any standardized meaning under Canadian Generally Accepted Accounting Principles (GAAP). When used, these measures are defined in such terms to allow the reconciliation to the closest GAAP measure. Numerical reconciliations are provided in figures 9 and 10. It is not likely that these measures could be compared to similar measures presented by other companies.
The Company's 2003 results were deeply affected by a very difficult economic environment in the print media industry. Weak advertising spending and global overcapacity in the industry resulted in a significant price erosion. This environment negatively impacted results in all the Company's markets.
To face these challenges, management's approach has been to secure and increase new and existing volume and to adopt an uncompromising focus on costs.
The Company competed aggressively and this is reflected in the volume increase in most markets as a result of contract extensions and new gains at market prices.
To mitigate the pricing decline, the Company continued to focus on cost reduction and cost containment. Early in 2003 and throughout the year, new management performed a detailed review of the Company's operations. Through this review, management identified additional restructuring initiatives to address the competitive environment. This involved a general workforce reduction across the platform, the closure of four smaller facilities in North America and the decommissioning of underperforming assets. In addition, progress was made in terms of streamlining the workforce and cutting overhead expenses, achieved through consolidation of corporate functions and relocation of certain sales offices into plants. To further reduce costs, the Company took advantage of lower interest rates to refinance debt with the proceeds of a new $600 million issuance of long-term debt.
Ultimately, all of these cost reduction measures will lower the cost base and allow the Company to harvest the benefits when markets recover.
Revenue by Product($ millions)
For the year ended December 31
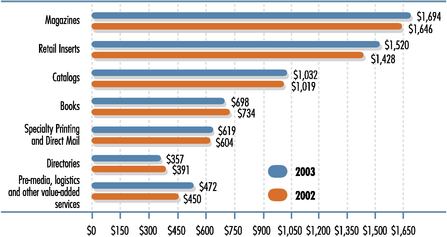
Figure 1
FOURTH QUARTER IN REVIEW
In the fourth quarter of 2003, the Company continued to face challenges in difficult markets and overcapacity in the print industry. The Company's consolidated revenues increased from $1,701 million in 2002 to $1,742 million in 2003, an increase of 2%, essentially explained by the favourable impact of currency translation of $95 million. Excluding this impact, revenues for the fourth quarter followed the same trend as in the third quarter, decreasing 3% compared to the same period last year (5% decrease in the third quarter of 2003). Despite this decrease, volume was up in virtually all of the Company's business groups. Lower prices were the main factor for the decrease in revenues.
The Company assesses performance based on operating income before impairment of assets, restructuring and other charges. The following operating analyses are before impairment of assets, restructuring and other charges.
During the fourth quarter of 2003, the Company incurred specific charges that reduced operating income totalling $22.7 million of which $13.9 million was related to North America, $3.4 million to Europe and the balance to Latin America and other provisions. Most of the charge, or $18.2 million, was included in selling, general and administrative expenses. Of the $13.9 million related to North America, there was $6.3 million for lease provisions and a $5.0 million provision for doubtful accounts.
In the fourth quarter of 2003, operating income, before impairment of assets, restructuring and other charges, fell by 44% to $90 million, from $160 million in 2002. Operating margin, on the same basis, declined to 5.2% from 9.4% in 2002. Depreciation and amortization were $86 million in the fourth quarter of 2003, compared to $81 million in 2002.
Selling, general and administrative expenses were $152 million compared with $125 million in 2002, an increase of $27 million. Excluding the specific charges of $18.2 million, of which $8.2 million was for bad debts and $6.3 million was for lease provisions, and the impact of currency translation of $8.9 million, selling, general and administrative expenses were flat with the fourth quarter of last year. The savings from the workforce reduction and other cost containment measures were offset by the increasing employee benefit expenses, such as medical, pension and accounting for stock-based compensation. However, as explained in section "Year 2003 in Review", on a full year basis, selling, general and administrative expenses were down by $32 million when compared to 2002.
10
Impact of Foreign Currency and Business Acquisition
($ millions)
| | Periods ended December 31, 2003 | |||||||
|---|---|---|---|---|---|---|---|---|
| | Three months | Twelve months | ||||||
| Revenues | ||||||||
| Foreign currency impact | $ | 95.2 | $ | 260.8 | ||||
| Business acquisition | — | 24.1 | ||||||
| Total | $ | 95.2 | $ | 284.9 | ||||
| Operating income | ||||||||
| Foreign currency impact | $ | 2.7 | $ | 5.0 | ||||
| Business acquisition | — | (0.2 | ) | |||||
| Total | $ | 2.7 | $ | 4.8 | ||||
Figure 2
During the fourth quarter, the Company continued its restructuring initiatives and recorded a net restructuring charge of $21.5 million, which reflected further work-force reduction and additional impairment of assets. These measures are described in section "Impairment of Assets and Restructuring Initiatives".
Financial expenses were $84 million in the fourth quarter of 2003, compared to $43 million in 2002. The 2003 results included a $30 million charge on extinguishment of long-term debt related to the redemption of the 8.375% senior notes and the repurchase of 89.6% of the 7.75% senior notes. The effect of this transaction is expected to lower interest expense by approximately $12 million per year. This quarter's financial expenses also included an exchange loss of $5 million from the currency translation adjustment account due to the reduction of a net investment in Latin America. Excluding these two events, financial expenses increased by $6 million from last year. The higher expenses were mainly due to a higher level of debt in the fourth quarter of 2003 combined with the net impact of the currency mix of the debt portfolio and losses on foreign exchange related to the weaker U.S. dollar.
Income taxes were $37 million in the fourth quarter of 2003 compared with $26 million in 2002. The increase in income taxes was due to two items, namely an adjustment of the average tax rate applied on cumulative temporary differences within different states in the United States for $28 million and an additional charge of $18 million reflecting a revised expectation of tax asset recovery and liabilities from prior years. When excluding these items, the income tax would be a recovery, since earnings before taxes were generated in jurisdictions with lower tax rates whereas income taxes on restructuring and other charges were recovered in jurisdictions with higher tax rates.
For the fourth quarter ended December 31, 2003, the Company reported a diluted loss per share of $0.48 compared to a diluted earnings per share of $0.44 in 2002. These results incorporated impairment of assets, restructuring and other charges of $21.5 million ($15.7 million net of taxes) or $0.12 per share compared with $19.6 million ($24.1 million net of taxes) or $0.17 per share in 2002. Excluding the effect of impairment of assets, restructuring and other charges, the fourth quarter of 2003 resulted in loss per share of $0.36 compared with earnings per share of $0.61 in the same period of 2002. The specific charges of $22.7 million ($13.7 million net of taxes) also negatively impacted earnings per share by $0.10. The refinancing of the long-term debt which generated a charge on extinguishment of long-term debt of $30 million ($18 million net of taxes) and a $5 million loss from the currency translation adjustment further lowered earnings per share by $0.18.
The combined effect of the items affecting the tax expense described above was $0.35 on earnings per share ($46 million reduction of net income) for the fourth quarter.
YEAR 2003 IN REVIEW
In 2003, the difficult economic environment and the global overcapacity in the print media industry resulted in increased competition and severe pressure on prices. In reaction to this environment, the Company's approach was to secure and increase new and existing volume and to contain and reduce costs. These measures were implemented across the platform, on the operational side as well as in the administrative functions.
Revenue increased from $6,272 million in 2002 to $6,392 million in 2003, an increase of 2%, explained by the favourable impact of currency translation and the aquisition of the printing assets of Hachette Filipacchi Medias (see figure 2). The reduction in revenues when excluding these factors, was a reflection of the pricing pressure in all business segments, despite the overall volume increase.
On a full year basis, the Company incurred specific charges that reduced operating income totalling $78.8 million of which $58.4 million related to North America, and included a $15.0 million adjustment caused by the rapid growth and systems issues in the North American Logistics business, a $16.0 million provision for doubtful accounts and $9.3 million for lease provisions. In Latin America and Europe, specific charges amounted to $8.0 million and $6.1 million, respectively. From the total specific charges, a portion of $37.9 million increased selling, general and administrative expenses.
Operating income, before impairment of assets, restructuring and other charges, fell by 41% to $330 million in 2003, from $563 million in 2002. Operating margin, on the same basis, declined to 5.2% in 2003 from 9.0% in 2002. Reduced capacity utilization and pricing pressures were largely responsible for the lower operating margin. Operating margin was also negatively affected by increases in pension, utilities and medical expenses (see figure 3)
Depreciation and amortization were $336 million in 2003, compared to $316 million in 2002. This increase was primarily due to new capital expenditures including the purchase of presses that were previously under operating leases.
Impact of Selected Expenses on Operating Income and EPS
| | Year ended December 31, 2003 | ||||||
|---|---|---|---|---|---|---|---|
| | Operating Income Increase on 2002 | Impact on EPS Net of Taxes | |||||
| | ($ millions) | | |||||
| Selected expenses(1) | |||||||
| Pension | $ | 11.2 | $ | 0.05 | |||
| Utilities | 16.2 | 0.08 | |||||
| Medical | 7.2 | 0.03 | |||||
| Total | $ | 34.6 | $ | 0.16 | |||
- (1)
- Excluding the impact of foreign currency and business acquisition.
Figure 3
11
Selling, general and administrative expenses were $536 million compared with $507 million in 2002, an increase of $29 million. Excluding specific charges totalling $37.9 million, as well as the impact of currency translation of $23 million, selling, general and administrative expenses improved by $32 million or 6%. This resulted from the work-force reduction and other cost containment measures despite increases in employee benefit expenses, such as medical, pension and accounting for stock-based compensation.
In 2003, impairment of assets, restructuring and other charges of $98.3 million were recorded following management's detailed review of the Company's operations and administrative functions.
Financial expenses were $221 million in 2003, compared to $170 million in 2002. The 2003 results included a $30 million charge on extinguishment of long-term debt related to the redemption of the 8.375% senior notes and the repurchase of 89.6% of the 7.75% senior notes in the fourth quarter of 2003. This year's financial expenses also included an exchange loss of $5 million from the currency translation adjustment account for the reduction of a net investment in Latin America. Excluding these two events, financial expenses increased by $16 million from last year. Despite the higher level of debt at year-end, the average volume for the year was similar to the previous year. The higher expenses were mainly due to the net impact of the currency mix of the debt portfolio, the higher fixed component of the debt denominated in U.S. dollars and losses on foreign exchange due to the weaker U.S. dollar.
Income tax expenses were $39 million in 2003 compared with $91 million in 2002. The income taxes in 2003 include the following two items; an adjustment of the average tax rate applied on cumulative temporary differences within different states in the United States for $28 million; and an additional charge of $25 million reflecting a revised expectation of tax asset recovery and liabilities from prior years. When excluding these items, the income tax would be a recovery, since earnings before taxes were generated in jurisdictions with lower tax rates, whereas income tax on restructuring and other charges were recovered in jurisdictions with higher tax rates.
For the year ended December 31, 2003, the Company reported a diluted loss per share of $0.50 compared to a diluted earnings per share of $1.76 in 2002. These results incorporated impairment of assets, restructuring and other charges of $98.3 million ($71.3 million net of taxes) or $0.53 per share compared with $19.6 million ($24.1 million net of taxes) or $0.16 per share in 2002. Excluding the effect of impairment of assets, restructuring and other charges, 2003 resulted in diluted earnings per share of $0.03 compared with $1.92 in 2002. The specific charges of $78.8 million ($56.9 million net of taxes) also negatively impacted earnings per share by $0.42. The refinancing of the long-term debt, which generated a charge on extinguishment of long-term debt of $30 million ($18 million net of taxes) and a $5 million loss from the currency translation adjustment further lowered earnings per share by $0.17. The impact of the special tax items as described above also reduced earnings per share by $0.39 ($53 million reduction of net income).
YEAR 2002 IN REVIEW
Year 2002 was also impacted by a difficult economic environment with declines in volumes and pressures on prices. However, restructuring activities and cost reduction initiatives mitigated the negative impact on the Company's results and resulted in increased operating margins for most of the North American and European (other than France) groups.
Revenue decreased from $6,443 million in 2001 to $6,272 million in 2002, a decrease of 3%, despite the impact of business acquisitions of $184 million. Operating income, before restructuring and other special charges, fell by 9% to $563 million in 2002, from $618 million in 2001. Operating margin, on the same basis, declined to 9.0% in 2002 from 9.6% in 2001. Reduced capacity utilization and pricing pressures were largely responsible for the lower margin.
Depreciation and amortization were $316 million in 2002, compared to $317 million in 2001. This slight decrease was primarily due to the closure of facilities and the disposal of equipment following the 2001 restructuring initiatives.
Selling, general and administrative expenses were $507 million compared with $489 million in 2001. The increase of $18 million was primarily due to business acquisitions and reduction in suppliers' cash discounts related to the cash management strategy. However, this strategy allowed us to reduce our financial expenses.
In 2002, restructuring and other charges of $20 million were recorded due to difficult market conditions in France, further integration of administrative functions in North America and the write-down of impaired or idle assets.
Segmented Results of Operations($ millions)
Selected Performance Indicators
| | North America | Europe | Latin America | Inter-Segment and Others | Total | |||||||||||||||||||||||||
|---|---|---|---|---|---|---|---|---|---|---|---|---|---|---|---|---|---|---|---|---|---|---|---|---|---|---|---|---|---|---|
| | 2003 | 2002 | 2003 | 2002 | 2003 | 2002 | 2003 | 2002 | 2003 | 2002 | ||||||||||||||||||||
| Year ended December 31 | ||||||||||||||||||||||||||||||
| Revenues | $ | 5,062.9 | $ | 5,087.6 | $ | 1,151.4 | $ | 1,002.5 | $ | 177.3 | $ | 183.5 | $ | (0.1 | ) | $ | (1.9 | ) $ | 6,391.5 | $ | 6,271.7 | |||||||||
| Operating income (loss) before depreciation and amortization and before IAROC | 595.4 | 797.0 | 93.5 | 96.3 | 6.9 | 21.7 | (6.0 | ) | (16.6 | ) | 689.8 | 898.4 | ||||||||||||||||||
| Operating income (loss) before IAROC | 311.1 | 527.3 | 30.3 | 38.9 | (3.7 | ) | 14.2 | (7.3 | ) | (17.6 | ) | 330.4 | 562.8 | |||||||||||||||||
| IAROC | 78.5 | (9.0) | 6.8 | 22.1 | 11.8 | 1.0 | 1.2 | 5.5 | 98.3 | 19.6 | ||||||||||||||||||||
| Operating income (loss) | 232.6 | 536.3 | 23.5 | 16.8 | (15.5 | ) | 13.2 | (8.5 | ) | (23.1 | ) | 232.1 | 543.2 | |||||||||||||||||
| Operating margin before depreciation and amortization and before IAROC | 11.8 | % | 15.7 | % | 8.1 | % | 9.7 | % | 3.9 | % | 11.8 | % | 10.8 | % | 14.3 | % | ||||||||||||||
| Operating margin before IAROC | 6.1 | % | 10.4 | % | 2.6 | % | 3.9 | % | (2.1 | )% | 7.7 | % | 5.2 | % | 9.0 | % | ||||||||||||||
| Operating margin | 4.6 | % | 10.5 | % | 2.0 | % | 1.7 | % | (8.7 | )% | 7.2 | % | 3.6 | % | 8.7 | % | ||||||||||||||
Figure 4
12
Revenue by Business Group($ millions)
For the year ended December 31
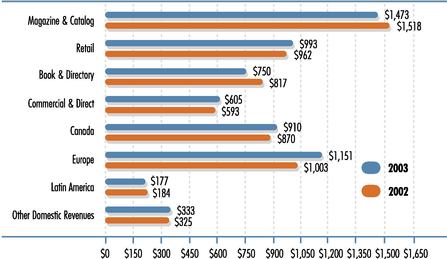
Figure 5
Financial expenses were $170 million in 2002, compared to $209 million in 2001. The significant decrease was due to lower levels of debt, together with reduced interest rates on long-term debt and on securitization programs.
Income taxes were $91 million in 2002 compared with $52 million in 2001. Before restructuring and other special charges, income taxes were $86 million or 22.0% compared to $96 million or 23.4% in 2001. The decrease in income taxes is due to lower profitability and an increase in profits generated in countries with a lower overall tax rate.
SEGMENT REVIEW
The following is a review of activity by business group and the operating analysis is before impairment of assets, restructuring and other charges.
North America
North American revenues for the fourth quarter of 2003 were $1,355 million, down 1% from $1,366 million in 2002. On a full year basis, revenues slightly decreased to $5,063 million in 2003, from $5,088 million in 2002. Excluding the effect of currency translation, revenues decreased by 4% in the fourth quarter and 2% for the year. The following is a review of the North American activities by business group.
Magazine & Catalog
Magazine & Catalog revenues for the fourth quarter of 2003 were $385 million, down 4% from $402 million in 2002. On a full year basis, revenues fell by 3% to $1,473 million in 2003, from $1,518 million in 2002. The decrease was a direct result of price erosion and lower volume due to weaknesses in the Magazine business. However, in the fourth quarter, volume was stable. Magazine advertising pages, as measured by the Publishers Information Bureau were down 1% from last year. On the other hand, the Catalog business has been experiencing year-over-year growth from renewals and new contracts.
The Magazine & Catalog Group is the Company's largest business platform and contributed in securing market share by extending current contracts and attracting new customers, such as: Viacom, Dennis Publishing, Bauer, Viking, Office Depot, Avon, Williams-Sonoma and Ethan Allen.
In an effort to contain costs, headcount was reduced by 401 employees or approximatively 4% when compared to December 2002.
Retail
Retail revenues for the fourth quarter of 2003 were $276 million, down 1% from $279 million in 2002. On a full year basis, revenues increased by 3% to $993 million in 2003, from $962 million in 2002. In the fourth quarter, volume was up 4% (3% for the year) but was offset by a significant price erosion hurting revenues and operating margins.
The Company's North American Retail network, built through strategic investments in both gravure and offset technologies, provides customers with a unique coast-to-coast platform allowing for large-run national campaigns or shorter-run multi-versioned ones. Competition is fierce but the Group reported significant wins with customers such as: Staples, Office Depot, Home Depot and JC Penny, an indication of increased market share.
Year-over-year headcount was reduced by 131 employees or approximatively 3% when compared to 2002. This improvement was reflected in selling, general and administrative costs.
Book & Directory
Book & Directory revenues for the fourth quarter of 2003 were $183 million, down 11% from $206 million in 2002. On a full year basis, revenues fell by 8% to $750 million in 2003, from $817 million in 2002. The drop in revenues was directly related to negative price pressures in both businesses. The Book group was hit hard by the price competition in a soft market combined with overcapacity in the United States and strong competition from Asia. Volume was down by 1% in the fourth quarter. The demand was weak for high-value added products such as bibles, fine-edition books, encyclopedias, and industrial catalogs. Educational publishers focused on cash management in this difficult market, reducing inventories which resulted in smaller orders and fewer new titles.
In Directories, while competition for market share for the major telecom business remained fierce, volume was higher in 2003 as the Company's orders from emerging independent publishers increased. However, this caused a negative price impact on the overall product mix.
As part of the cost reduction efforts, Book & Directory were combined to maximize efficiencies due to the similarities of their operations.
The Group's focus continued to be on cost containment. Headcount was reduced by 510 employees or approximatively 9% when compared to 2002. In addition, detailed action plans were implemented in every plant to reduce waste and improve operational efficiency. Also, a capital investment to improve the efficiency of equipment and complete the expansion for school books was made at the Dubuque facility.
Commercial & Direct
Commercial & Direct revenues for the fourth quarter of 2003 were $165 million, up 10% from $150 million in 2002. On a full year basis, revenues increased by 2% to $605 million in 2003, from $593 million in 2002. Volume increased close to 4% during the fourth quarter, following the same trend for the full year. Headcount was reduced by 197 employees which represented approximatively a 6% year-over-year decrease with a significant impact on administrative expenses.
13
Canada
Canadian revenues for the fourth quarter of 2003 were $259 million, up 11% from $235 million in 2002. On a full year basis, revenues increased by 5% to $910 million in 2003 from $870 million in 2002. Excluding the effect of currency translation, revenues decreased by 7% in both the fourth quarter and for the year. Similar to the US market, pricing was very competitive. In Eastern Canada, despite eroding prices and excluding currency translation, revenues for the year were up 3% from 2002, explained by an increase in volume. This trend was reversed in the fourth quarter with a decrease of more than 3%.
During the year, the Group reported contract renewals including, Rogers Publications, Sears Retail, Shoppers Drug Mart, Verizon, and Canada Wide Magazines.
Other Revenues
Other sources of revenues in North America included Que-Net Media™ (pre-media services) and Logistics. The Que-Net Media™ Group's revenues for the fourth quarter of 2003 were $18 million, down 8% from $19 million in 2002. On a full year basis, revenues fell by 10% to $75 million in 2003, from $84 million in 2002, despite a significant volume increase (8% for 2003 and 13% in the fourth quarter). This business offers services to the Company's main print media businesses and has suffered from the decline in volume and price pressures experienced elsewhere in the platform. The economic environment also impacted customers who continued to focus on cutting costs, many of whom are turning towards self-service and in-house production.
Logistics revenues for the fourth quarter of 2003 were $69 million, up 17% from $59 million in 2002. On a full year basis, revenues increased to $245 million in 2003, from $187 million in 2002, a 31% increase.
Europe
European revenues for the fourth quarter of 2003 were $340 million, up 18% from $288 million in 2002. On a full year basis, revenues increased by 15% to $1,151 million in 2003, from $1,003 million in 2002. The increase in revenues in the last quarter and for the year was largely due to the positive impact of currency translation. The purchase of the printing assets of Hachette Filipacchi was also a factor in the annual increase in revenues for 2003. Excluding these factors, revenues were flat for the last quarter and down $49 million for the year 2003.
The European market is still suffering from overcapacity and pressures on price. Operations excluding France performed well, particularly in the facilities in the United Kingdom, Austria and Belgium, where results were higher or comparable to last year. Volume was up 7% for the year (11% in the fourth quarter). Despite this, the book export business in Spain experienced volume declines due to the strengthening of the Euro. Sweden and Finland were also severely hit by a price erosion.
French revenues for the fourth quarter of 2003 were $155 million, up 19% from $131 million in 2002. Operating income in the fourth quarter of 2003 was $7 million, up from $1 million in 2002. On a full year basis, revenues were $529 million, an increase of 18% from $447 million in 2002. Operating loss for the year 2003 was $3 million, as compared to a loss of $2 million in 2002.
The French operations, excluding the effect of the currency translation, reported a negative operating margin and a revenue decline of 1%. However, the trend was reversed in the fourth quarter with flat revenues and positive margins. Its operations were especially hard hit by negative price pressures due to the over-capacity in the industry.
Overall, headcount in Europe was reduced by 269 employees which represented approximatively a 5% decrease, with a particular focus on France where general administrative expense reductions were effected.
Latin America
Latin America's revenues for the fourth quarter of 2003 were $48 million, stable compared to 2002. On a full year basis, revenues decreased by 3% to $177 million in 2003, from $184 million in 2002. Overcapacity coupled with economic pressure within the region and currency devaluation all had a negative impact on prices. As a result, management's plan of action was to secure volume at market prices and focus on reducing headcount in addition to significant overhead cost reductions. Volume was up in all countries except for the Recife facility in Brazil. Overall volume was up 13% (10% in the fourth quarter) and headcounts reduced by 548 employees or approximatively an 18% reduction.
PENSION AND OTHER POSTRETIREMENT BENEFITS
As at December 2003, the pension and other post-retirement benefit costs were $67 million compared with $55 million in 2002 and the funded status decreased by $93 million over last year. Calculations of pension and other postretirement benefit costs and obligations are based on various assumptions (see figure 6). Management is continuously assessing those assumptions for its funding exposure. In 2002 and 2001, difficult capital market conditions affected pension asset returns. The year 2003 returns were marked by a slight recovery. However, Generally Accepted Accounting Principles recommend an accounting treatment to reduce the volatility of the pension plan expense in order to reflect the long-term nature of these obligations and any actuarial gains or losses resulting from a turbulent capital market environment are amortized over a period of 15 years.
The Company is monitoring the funding of the pension plans very closely and made contributions above the minimum legal requirements. A total of $68 million of cash contributions were made to the pension plans in 2003 compared to $40 million in 2002.
Weighted average assumptions used in the
measurement of the Company's pension benefits
| | 2003 | 2002 | | ||||
|---|---|---|---|---|---|---|---|
| Discount rate | 6.0 | % | 6.7 | % | |||
| Expected return on plan assets | 8.2 | % | 8.2 | % | |||
| Rate of compensation increase | 3.5 | % | 3.4 | % |
Figure 6
14
Total Debt and Accounts Receivable Securitization($ millions)
| | December 31, 2003 | December 31, 2002 | ||||
|---|---|---|---|---|---|---|
| Bank indebtedness | $ | 1.3 | $ | 0.3 | ||
| Current portion of long-term debt | 23.9 | 38.5 | ||||
| Long-term debt | 1,874.4 | 1,668.6 | ||||
| Convertible notes | 110.7 | 115.0 | ||||
| Total debt | $ | 2,010.3 | $ | 1,822.4 | ||
Accounts receivable securitization | 766.6 | 649.7 | ||||
| Total debt and accounts receivable securitization | $ | 2,776.9 | $ | 2,472.1 | ||
Figure 7
STOCK OPTION PLANS
During the year, the Company issued a total of 916,911 options. Shares reserved for issuance total 7.6 million as at December 31, 2003, of which 3.7 million were outstanding.
In 2003, the Company changed its method of accounting for stock-based compensation and decided to adopt the fair value based method of accounting for all of its stock-based compensation. The Company adopted these changes using the prospective application transitional alternative. Accordingly, the fair value based method was applied to awards granted, modified or settled on or after January 1, 2003. The compensation cost charged against income for those plans was $2 million for the year 2003.
FINANCIAL CONDITION, LIQUIDITY AND CAPITAL RESOURCES
The Company measures its liquidity performance using the calculation of free cash flow as described in figure 9. Free cash flow reflects liquidity available for business acquisitions, dividends on equity shares and repayments of long-term debt. In 2003, free cash flow from operations was $183 million, compared to $320 million in 2002. The decrease in free cash flow was due to lower earnings and higher capital expenditures in 2003.
OPERATING ACTIVITIES
Cash flow from operating activities was $461 million in 2003, compared with $513 million in 2002. This reduction was mainly attributable to the lower earnings in 2003. The deficiency in working capital was $193 million in 2003, compared to $214 million in 2002. The variance was due to lower trade payables partly offset by a higher level of securitization in 2003. Favourable currency impact on Canadian and European programs and the amendment to the U.S. program allowed for greater drawings under these securitization programs. The Company has also renegotiated certain terms and conditions of the U.S. and European programs to substitute the previous credit rating termination event with a termination event which mirrors the financial covenants in the bank facility.
FINANCING ACTIVITIES
In June 2003, the Company repurchased for cancellation a total of 10,000,000 Subordinate Voting Shares pursuant to its Substantial Issuer Bid dated April 24, 2003 for a net cash consideration, including redemption fees, of Cdn $241 million ($174 million). The Substantial Issuer Bid expired at midnight (Montreal time) on the evening of June 2,2003. The excess of the price paid over the book value of the shares repurchased was charged to retained earnings.
In November 2003, the Company issued senior notes for a principal amount of $600 million, comprised of two tranches. The first tranche of $200 million matures on November 15, 2008 and the second tranche of $400 million matures on November 15, 2013. The notes were issued at a discount for a total net proceeds of $597 million. The proceeds from the sale of these notes were used to repay outstanding indebtedness.
In November 2003, following a tender offer to purchase all of the $300 million principal amount of the 7.75% senior notes due February 15, 2009, the Company repurchased 89.6% of the notes at a premium for a cash consideration of $283 million.
In December 2003, the Company exercised its option and redeemed all of the $258 million principal amount of the 8.375% senior notes at a premium for a total cash consideration of $268 million.
The Company also restructured its $1 billion bank facility in November 2003 in three tranches, the first tranche of $250 million matures in 2004, while the second tranche of $250 million and the third tranche of $500 million mature in 2006. All three tranches can be extended on a yearly basis. The financial covenants remain unchanged and the facility can be used for general corporate purposes. All of these new agreements were part of the Company's 2003 financial plan and will contribute to substantial annual savings.
Dividends paid to shareholders of Multiple Voting Shares and Subordinate Voting Shares totaled $0.52 per share, compared to $0.49 per share in 2002 and $0.46 per share in 2001, an increase of 6% over 2002 and 13% from 2001.
No dividends were paid on the First Preferred Shares, Series 2 in 2003 as all First Preferred Shares, Series 2 were converted into First Preferred Shares, Series 3 in December 2002. The Company paid dividends of Cdn $1.54 per share on the First Preferred Shares, Series 3 in 2003. Dividends of Cdn $1.25 per share were paid in 2002 and in 2001 on First Preferred Shares, Series 2. The Company paid dividends of Cdn $1.69 per share on the First Preferred Shares, Series 4 in 2003 (Cdn $1.69 per share in 2002 and Cdn $1.27 in 2001), and Cdn $1.73 per share on the First Preferred Shares, Series 5, in 2003 (Cdn $1.73 per share in 2002 and Cdn $0.51 in 2001).
Contractual Cash Obligations($ millions)
| | 2004 | 2005 | 2006 | 2007 | 2008 | 2009 and thereafter | ||||||||||||
|---|---|---|---|---|---|---|---|---|---|---|---|---|---|---|---|---|---|---|
| Long-term debt and convertible notes | $ | 8 | $ | — | $ | 530 | $ | 261 | $ | 202 | $ | 949 | ||||||
| Capital leases | 16 | 11 | 8 | 4 | 3 | 17 | ||||||||||||
| Operating leases | 101 | 84 | 68 | 52 | 36 | 108 | ||||||||||||
| Total contractual cash obligations | $ | 125 | $ | 95 | $ | 606 | $ | 317 | $ | 241 | $ | 1,074 | ||||||
Figure 8
15
INVESTING ACTIVITIES
In 2003, capital expenditures were targeted to improve the Company's cost structure and for customer-driven projects. The Company invested $243 million on capital expenditure projects, compared to $185 million in 2002. Key expenditures included the following items:
- •
- North America
The expansion and improvement of the Magazine & Catalog platform included the purchase of new gravure presses in the Augusta, Georgia, and Franklin, Kentucky facilities to service L.L. Bean and other retail customers, and the acquisition of a 48-page short cut-off offset press in the Elk Grove Village, Illinois facility for additional press capacity to service Williams-Sonoma.
In the Retail platform, the Company completed the expansion of the Riverside, California facility, including the relocation of the Ontario, California facility to a new 196,000 square foot facility nearby Riverside.
Phase 2 of the educational book market expansion has been initiated in the Dubuque, Iowa facility.
A new 4 unit Goss press was added at the Web Press facility in Vancouver to increase capacity.
In addition, the Company concluded the buyout of leased presses installed in 8 facilities for $71 million.
- •
- Europe
The addition of a 48-page commercial press was completed in the Spanish platform to increase overall capacity and to replace an older press.
Other capital investments were dedicated to normal replacement of assets as well as environmental compliance and systems development and implementation.
During 2003, the Company acquired some minority interests in Spain and North America.
FINANCIAL POSITION
For the year ended December 31, 2003, the debt-to-capitalization ratio was 44:56, compared to 40:60 in 2002. As at December 31, 2003, total debt plus accounts receivable securitization was $2,777 million, $305 million higher than last year (see figure 7).
In February 2004, the Company expects to finalize the redemption of the remaining nominal amount of $31 million of the 7.75% senior notes.
The holders of the 6.50% senior debentures have the option to tender the $150 million aggregate principal amount for redemption in August 2004. Their decision will depend on prevailing market conditions at such time.
The Company believes that the liquidity, capital resources and cash flows from operations are sufficient to fund planned capital expenditures, working capital requirements, pension contributions, interest and principal payment obligations for the foreseeable future. The total mandatory principal payments on long-term debt, convertible notes and capital leases are $24 million in 2004 and $11 million in 2005. Minimum pension contributions are estimated at $75 million for 2004.
IMPAIRMENT OF ASSETS AND RESTRUCTURING INITIATIVES
In early 2003, as a result of changes in management, a detailed review of the Company's operations and administrative functions has been undertaken to further reduce the cost base and improve efficiencies. This resulted in additional impairment of assets and restructuring initiatives.
In 2003, the Company recorded an impairment of assets, restructuring and other charges of $98.3 million. Non-cash items amounted to $60.4 million and cash items to $37.9 million. The non-cash portion included an impairment of assets of $54.4 million and other charges of $2.8 million for the 2003 initiatives and $3.2 million related to previous years' initiatives.
Impairment of Assets
During 2003, the Company recorded an impairment of assets of $54.4 million for write-downs of certain under-performing assets resulting from the over capacity in the industry and the decision not to redeploy the assets. An amount of $47.4 million has been recorded in the second quarter and $7.0 million in the fourth quarter.
Restructuring and Other Charges
During the fourth quarter of 2003, the Company continued its restructuring initiatives and recorded net restructuring charges of $21.5 million. The charges included $15.8 million, consisting of new initiatives of $16.1 million, net of a reversal of $0.3 million related to second quarter and third quarter initiatives, $7.0 million for impairment of assets and a reversal of $1.3 million related to 2001-2002 initiatives. The cash charge of $16.1 million was related to a workforce reduction of 878 employee positions, of which $12.8 million was for North America, $1.9 million for Europe and $1.4 million for Latin America. Under these initiatives, 393 employee positions have been eliminated and 485 will be eliminated in the first quarter of 2004.
In the third quarter of 2003, the Company initiated new restructuring initiatives. A net cash reversal of $0.3 million was recorded. This was composed of two items: a reversal of $2.2 million of which $1.9 million was for Europe and $0.3 million was for Latin America, and a charge of $1.9 million for work-force reduction, of which $1.4 million was for North America and $0.5 million for Latin America. Under these initiatives, 260 employee positions were eliminated. The reversal of the provision of $2.2 million was recorded after the Company completed most of its June initiatives and re-evaluated the remaining costs.
In the second quarter of 2003, the Company initiated restructuring initiatives and other charges following the continued volume declines in certain business segments. A cash charge of $23.4 million was taken consisting of $17.6 million in workforce reduction and $5.8 million of additional closure costs of four smaller facilities. The amount of $17.6 million in workforce reduction included $5.8 million for Europe and $10.0 million for North America. Related to this, an asset write-down of $2.8 million was also recorded. Under these initiatives,1,134 employee positions were eliminated.
In summary, as of December 31, 2003, 1,769 employee positions were eliminated under the 2003 restructuring initiatives and 503 will be completed in 2004. The workforce reductions affected all fixed cost areas of the Company, both at plant and corporate levels.
16
In 2003, the review and the execution of the 2002 and 2001 initiatives resulted in a net reversal of $1.0 million comprised of a cash over-spending of $12.9 million and a $13.9 million reversal of prior year restructuring and other charges. The cash overspending is related to costs of closed facilities not yet disposed of, and office leases not yet subleased and other completed initiatives. Under these initiatives, 3,961 employee positions were eliminated as at December 31, 2003 and 23 will be eliminated in 2004, of which 18 terminations in Europe are to be completed when all the legal procedures and requirements are met.
In addition, during the second quarter of 2003, the Company also recorded an asset write-down of $3.2 million in relation with 2001 and 2002 initiatives.
In 2002, following the persistant difficult situation in France and the identification of other cost reduction opportunities in North America, the Company took additonal restructuring charges which also included asset and investment write-downs and overspending on its 2001 restructuring initiatives, net of the reversal of unused reserves from 2001.
Restructuring and other charges, as at December 31, 2002, were $19.6 million. This included $13.3 million required to complete the 2001 restructuring initiatives, mostly related to employee termination costs. In addition, it also included a reversal of $40.1 million, mainly related to the Company's decision not to close a plant. This reversal consisted of $18.4 million of asset impairments and $21.7 million for related restructuring. The new initiatives in 2002 were comprised of the following three basic components:
- •
- Cash costs relating to the severance of employees and other restructuring costs of $30.0 million;
- •
- Write-down of assets of $6.5 million associated with the impairment of assets that will no longer be used;
- •
- Other special charges of $9.9 million for the write-down of investments to their expected realizable value. The larger portion was related to equity shares in Q-Media Services Corporation that went into receivership at the end of December 2002.
In 2001, due to the economic fallout that was exacerbated following September 11th events, the Company announced that it would restructure its business with the aim of removing the least efficient equipment, without materially affecting the overall capacity of its platform. The restructuring and other charges required to achieve this goal totaled $273 million. The restructuring plan involved the closure of facilities, together with the rationalization of numerous other plants. The restructuring and other charges included the following three basic components:
- •
- Cash costs relating to the severance of employees, real estate and other costs associated with exiting facilities;
- •
- Non-cash costs of $114 million associated with the impairment of assets that will no longer be used in the business on an ongoing basis;
- •
- Non-cash costs of $29 million associated with exiting investments and non-core businesses, together with cash costs of $15 million required in order to complete the World Color integration.
RISK MANAGEMENT
In the normal course of business, the Company is exposed to changes in interest rates, foreign exchange rates and commodity prices.
The Company manages interest rate exposure by having a balanced schedule of debt maturities as well as a combination of fixed and floating rate obligations. In addition, the Company has entered into interest rate swap agreements to manage this exposure. Contracts outstanding at year-end have a notional value of $33 million. These contracts expire in March 2006.
The Company has also entered into foreign-exchange forward contracts and cross-currency swaps to set the exchange rate for cross-border sales and to manage the foreign exchange exposure on net investments and foreign denominated assets. Foreign-exchange forward contracts and cross-currency swap contracts outstanding at year-end have a notional value of $673 million and $212 million respectively, and expire between January 2004 and December 2007.
The Company has also entered into natural gas swap contracts to manage the exposure on this commodity. Contracts outstanding at year-end cover a notional quantity of 271,000 gigajoules in Canada and 2,237,000 MMBTU in the U.S. These contracts expire between January and December 2004.
While the counterparties of these agreements expose the Company to credit loss in the event of non-performance, the Company believes that the possibility of incurring such a loss is remote due to the creditworthiness of the counterparties. The Company does not hold or issue any derivative financial instruments for speculative or trading purposes.
Concentrations of credit risk with respect to trade receivables are limited due to the diverse operations and large customer base.
As of December 31, 2003, the Company has no significant concentrations of credit risk and believes that the product and geographic diversity of its customer base is instrumental in reducing credit risk, as well as having a positive impact on local markets or product-line demand. The Company has long-term contracts with most of its largest customers. These contracts generally include price-adjustment clauses based on the cost of paper, ink and labor. The Company does not believe that it is exposed to an unusual level of customer credit risk.
The primary raw materials used in the manufacturing process are paper and ink. The Company uses its purchasing power as one of the major buyers in the printing industry to obtain among the best prices, terms, quality control and service. To maximize its purchasing power, the Company negotiates with a limited number of suppliers.
In 2003, the Company had 71 collective bargaining agreements in North America. Of this total, 7 agreements expired in 2003 and 6 are still under negotiation. In addition, 15 collective bargaining agreements, covering 2,248 employees, will expire in 2004. The Company has approximately 10,509 unionized employees in North America. Moreover, 87 of the plants and related facilities in North America are non-unionized.
SEASONALITY
The operations of the Company's business are seasonal, with approximately two-thirds of operating income historically recognized in the second half of the fiscal year, primarily due to the higher number of magazine pages, new product launches and back-to-school, retail and holiday catalog promotions.
ENVIRONMENTAL MATTERS
During 2003, the Company continued to strengthen its approach to environmental management. Twelve facilities have now received or are in the implementation phase of getting ISO-14001 certification, an internationally recognized environmental management system standard.
17
Reconciliation of non GAAP measures
($ millions)
| | Year ended December 31 | |||||||||||
|---|---|---|---|---|---|---|---|---|---|---|---|---|
| | 2003 | 2002 | 2001 | |||||||||
Operating Income | ||||||||||||
| Operating income | $ | 232.1 | $ | 543.2 | $ | 347.8 | ||||||
| Impairment of assets, restructuring and other charges ("IAROC") | 98.3 | 19.6 | 270.0 | |||||||||
| Operating income before IAROC | $ | 330.4 | $ | 562.8 | $ | 617.8 | ||||||
| Operating income | $ | 232.1 | $ | 543.2 | $ | 347.8 | ||||||
| Depreciation of property, plant and equipment | 333.2 | 313.2 | 314.9 | |||||||||
| Amortization of deferred charges(1) | 26.2 | 22.4 | 22.9 | |||||||||
| Operating income before depreciation and amortization | $ | 591.5 | $ | 878.8 | $ | 685.6 | ||||||
IAROC | 98.3 | 19.6 | 270.0 | |||||||||
| Operating income before depreciation and amortization and IAROC | $ | 689.8 | $ | 898.4 | $ | 955.6 | ||||||
Earnings (loss) per share | ||||||||||||
| Net income (loss) available to holders of equity shares | $ | (67.9 | ) | $ | 250.4 | $ | 0.5 | |||||
| IAROC (net of income taxes of $27.0 million in 2003, $(4.5) million in 2002 and $43.8 million in 2001) | 71.3 | 24.1 | 226.3 | |||||||||
| Net income available to holders of equity shares before IAROC | $ | 3.4 | $ | 274.5 | $ | 226.8 | ||||||
Diluted average number of equity shares outstanding (in millions) | 136.0 | 145.4 | 143.0 | |||||||||
Earnings (loss) per share | ||||||||||||
| Diluted | $ | (0.50 | ) | $ | 1.76 | $ | — | |||||
| Diluted, before IAROC | $ | 0.03 | $ | 1.92 | $ | 1.58 | ||||||
Free Cash Flow | ||||||||||||
| Cash provided by operating activities | $ | 461.3 | $ | 513.4 | $ | 576.5 | ||||||
| Dividends on preferred shares | (37.7 | ) | (36.2 | ) | (20.5 | ) | ||||||
| Additions to property, plant and equipment | (243.1 | ) | (184.5 | ) | (278.3 | ) | ||||||
| Net proceeds from disposal of other assets | 2.8 | 27.1 | 9.5 | |||||||||
| Free cash flow from operations | $ | 183.3 | $ | 319.8 | $ | 287.2 | ||||||
Debt-to-capitalization | ||||||||||||
| Bank indebtedness | $ | 1.3 | $ | 0.3 | $ | 0.1 | ||||||
| Current portion of long-term debt and convertible notes | 23.9 | 38.5 | 57.0 | |||||||||
| Long-term debt | 1,874.4 | 1,668.6 | 1,961.9 | |||||||||
| Convertible notes | 110.7 | 115.0 | 113.3 | |||||||||
| Total debt | $ | 2,010.3 | $ | 1,822.4 | $ | 2,132.3 | ||||||
Minority interest | 24.7 | 20.9 | 14.2 | |||||||||
| Shareholders' equity | 2,503.4 | 2,703.8 | 2,473.2 | |||||||||
| Capitalization | $ | 4,538.4 | $ | 4,547.1 | $ | 4,619.7 | ||||||
| Debt-to-capitalization | 44:56 | 40:60 | 46:54 | |||||||||
Book value per share | ||||||||||||
| Shareholders' equity | $ | 2,503.4 | $ | 2,703.8 | $ | 2,473.2 | ||||||
| Preferred shares | (456.6 | ) | (456.6 | ) | (456.6 | ) | ||||||
| $ | 2,046.8 | $ | 2,247.2 | $ | 2,016.6 | |||||||
Ending number of equity shares (in millions) | 132.0 | 141.1 | 140.2 | |||||||||
| Book value per share | $ | 15.51 | $ | 15.92 | $ | 14.39 | ||||||
Figure 9
- (1)
- Excluding goodwill amortization in 2001.
18
Reconciliation of non GAAP measures
($ millions)
| | Three Months ended December 31 | ||||||||
|---|---|---|---|---|---|---|---|---|---|
| | 2003 | 2002 | |||||||
Operating Income | |||||||||
| Operating income | $ | 68.6 | $ | 140.7 | |||||
| Impairment of assets, restructuring and other charges ("IAROC") | 21.5 | 19.6 | |||||||
| Operating income before IAROC | $ | 90.1 | $ | 160.3 | |||||
| Operating income | $ | 68.6 | $ | 140.7 | |||||
| Depreciation of property, plant and equipment | 85.3 | 79.9 | |||||||
| Amortization of deferred charges | 7.4 | 6.0 | |||||||
| Operating income before depreciation and amortization | $ | 161.3 | $ | 226.6 | |||||
IAROC | 21.5 | 19.6 | |||||||
| Operating income before depreciation and amortization and IAROC | $ | 182.8 | $ | 246.2 | |||||
Earnings (loss) per share | |||||||||
| Net income (loss) available to holders of equity shares | $ | (63.6 | ) | $ | 63.3 | ||||
| IAROC (net of income taxes of $5.8 million in 2003, and $(4.5) million in 2002) | 15.7 | 24.1 | |||||||
| Net income (loss) available to holders of equity shares before IAROC | $ | (47.9 | ) | $ | 87.4 | ||||
Diluted average number of equity shares outstanding (in millions) | 131.9 | 145.4 | |||||||
Earnings (loss) per share | |||||||||
| Diluted | $ | (0.48 | ) | $ | 0.45 | ||||
| Diluted, before IAROC | $ | (0.36 | ) | $ | 0.61 | ||||
Free Cash Flow | |||||||||
| Cash provided by operating activities | $ | 395.8 | $ | 300.8 | |||||
| Dividends on preferred shares | (11.8 | ) | (14.6 | ) | |||||
| Additions to property, plant and equipment | (37.5 | ) | (43.6 | ) | |||||
| Net proceeds from disposal of other assets | 0.6 | 19.8 | |||||||
| Free cash flow from operations | $ | 347.1 | $ | 262.4 | |||||
Figure 10
19
| Selected Quarterly Financial Data (In millions of dollars, except per share data) | |||||||||||||||||||||||||||||||||||||||||||||||
2003 | 2002 | 2001 | |||||||||||||||||||||||||||||||||||||||||||||
|---|---|---|---|---|---|---|---|---|---|---|---|---|---|---|---|---|---|---|---|---|---|---|---|---|---|---|---|---|---|---|---|---|---|---|---|---|---|---|---|---|---|---|---|---|---|---|---|
| | First | Second | Third | Fourth | Year | First | Second | Third | Fourth | Year | First | Second | Third | Fourth | Year | ||||||||||||||||||||||||||||||||
| Consolidated Results | |||||||||||||||||||||||||||||||||||||||||||||||
| Revenues | $ | 1,539.6 | $ | 1,513.5 | $ | 1,596.8 | $ | 1,741.6 | $ | 6,391.5 | $ | 1,475.8 | $ | 1,469.7 | $ | 1,624.7 | $ | 1,701.5 | $ | 6,271.7 | $ | 1,598.0 | $ | 1,528.5 | $ | 1,662.2 | $ | 1,654.0 | $ | 6,442.7 | |||||||||||||||||
| Operating income before depreciation and amortization and before IAROC | 165.2 | 133.3 | 208.5 | 182.8 | 689.8 | 189.7 | 211.2 | 251.3 | 246.2 | 898.4 | 219.2 | 243.0 | 258.5 | 234.9 | 955.6 | ||||||||||||||||||||||||||||||||
| Operating income before IAROC | 77.8 | 42.5 | 120.0 | 90.1 | 330.4 | 106.8 | 127.8 | 167.9 | 160.3 | 562.8 | 136.4 | 159.0 | 172.7 | 149.7 | 617.8 | ||||||||||||||||||||||||||||||||
| IAROC | — | 81.8 | (5.0 | ) | 21.5 | 98.3 | — | — | — | 19.6 | 19.6 | — | — | — | 270.0 | 270.0 | |||||||||||||||||||||||||||||||
| Operating income (loss) | 77.8 | (39.3 | ) | 125.0 | 68.6 | 232.1 | 106.8 | 127.8 | 167.9 | 140.7 | 543.2 | 136.4 | 159.0 | 172.7 | (120.3 | ) | 347.8 | ||||||||||||||||||||||||||||||
| Net income (loss)* | 24.5 | (61.7 | ) | 59.7 | (53.9 | ) | (31.4 | ) | 46.0 | 64.2 | 98.5 | 70.6 | 279.3 | 42.5 | 63.2 | 70.8 | (154.1 | ) | 22.4 | ||||||||||||||||||||||||||||
| Cash provided (used) by operating activities | (172.1 | ) | 177.8 | 59.8 | 395.8 | 461.3 | (27.0 | ) | 109.4 | 130.2 | 300.8 | 513.4 | (153.5 | ) | 277.2 | 12.1 | 440.7 | 576.5 | |||||||||||||||||||||||||||||
| Free cash flow (outflow) from operations** | (250.1 | ) | 72.3 | 14.0 | 347.1 | 183.3 | (80.1 | ) | 40.1 | 97.4 | 262.4 | 319.8 | (218.6 | ) | 178.9 | (58.2 | ) | 385.1 | 287.2 | ||||||||||||||||||||||||||||
| Operating margin before depreciation and amortization and before IAROC*** | 10.7 | % | 8.8 | % | 13.1 | % | 10.5 | % | 10.8 | % | 12.9 | % | 14.4 | % | 15.5 | % | 14.5 | % | 14.3 | % | 13.7 | % | 15.9 | % | 15.6 | % | 14.2 | % | 14.8 | % | |||||||||||||||||
| Operating margin before IAROC*** | 5.1 | % | 2.8 | % | 7.5 | % | 5.2 | % | 5.2 | % | 7.2 | % | 8.7 | % | 10.3 | % | 9.4 | % | 9.0 | % | 8.5 | % | 10.4 | % | 10.4 | % | 9.1 | % | 9.6 | % | |||||||||||||||||
| Operating margin*** | 5.1 | % | (2.6 | )% | 7.8 | % | 3.9 | % | 3.6 | % | 7.2 | % | 8.7 | % | 10.3 | % | 8.3 | % | 8.7 | % | 8.5 | % | 10.4 | % | 10.4 | % | (7.3 | )% | 5.4 | % | |||||||||||||||||
| Segmented Information | |||||||||||||||||||||||||||||||||||||||||||||||
| Revenues | |||||||||||||||||||||||||||||||||||||||||||||||
| North America | $ | 1,230.5 | $ | 1,195.2 | $ | 1,282.3 | $ | 1,354.9 | $ | 5,062.9 | $ | 1,212.9 | $ | 1,182.6 | $ | 1,325.8 | $ | 1,366.3 | $ | 5,087.6 | $ | 1,331.9 | $ | 1,273.7 | $ | 1,405.9 | $ | 1,359.2 | $ | 5,370.7 | |||||||||||||||||
| Europe | 263.6 | 274.3 | 273.2 | 340.3 | 1,151.4 | 216.3 | 244.1 | 253.6 | 288.5 | 1,002.5 | 231.9 | 218.2 | 215.9 | 244.7 | 910.7 | ||||||||||||||||||||||||||||||||
| Latin America | 45.1 | 43.7 | 40.6 | 47.9 | 177.3 | 46.9 | 43.4 | 45.3 | 47.9 | 183.5 | 34.3 | 36.8 | 40.5 | 50.2 | 161.8 | ||||||||||||||||||||||||||||||||
| Operating income (loss) before IAROC | |||||||||||||||||||||||||||||||||||||||||||||||
| North America | 83.2 | 45.3 | 109.9 | 72.7 | 311.1 | 107.5 | 123.9 | 157.7 | 138.2 | 527.3 | 125.1 | 139.0 | 163.1 | 137.3 | 564.5 | ||||||||||||||||||||||||||||||||
| Europe | (0.2 | ) | 3.4 | 7.5 | 19.6 | 30.3 | 5.2 | 8.3 | 13.1 | 12.3 | 38.9 | 12.9 | 16.0 | 9.3 | 14.9 | 53.1 | |||||||||||||||||||||||||||||||
| Latin America | (1.9 | ) | (3.5 | ) | 0.8 | 0.9 | (3.7 | ) | 2.3 | 2.7 | 5.2 | 4.0 | 14.2 | 1.9 | 2.4 | 1.2 | 4.9 | 10.4 | |||||||||||||||||||||||||||||
| Operating margins before IAROC*** | |||||||||||||||||||||||||||||||||||||||||||||||
| North America | 6.8 | % | 3.8 | % | 8.6 | % | 5.4 | % | 6.1 | % | 8.9 | % | 10.5 | % | 11.9 | % | 10.1 | % | 10.4 | % | 9.4 | % | 10.9 | % | 11.6 | % | 10.1 | % | 10.5 | % | |||||||||||||||||
| Europe | (0.1 | )% | 1.2 | % | 2.8 | % | 5.8 | % | 2.6 | % | 2.4 | % | 3.4 | % | 5.2 | % | 4.3 | % | 3.9 | % | 5.5 | % | 7.3 | % | 4.3 | % | 6.1 | % | 5.8 | % | |||||||||||||||||
| Latin America | (4.2 | )% | (8.0 | )% | 2.1 | % | 1.9 | % | (2.1 | )% | 4.9 | % | 6.1 | % | 11.6 | % | 8.4 | % | 7.8 | % | 5.6 | % | 6.6 | % | 2.9 | % | 9.8 | % | 6.4 | % | |||||||||||||||||
| Per Share Data | |||||||||||||||||||||||||||||||||||||||||||||||
| Earnings (losses)* | |||||||||||||||||||||||||||||||||||||||||||||||
| Diluted | $ | 0.12 | $ | (0.51 | ) | $ | 0.38 | $ | (0.48 | ) | $ | (0.50 | ) | $ | 0.28 | $ | 0.40 | $ | 0.64 | $ | 0.44 | $ | 1.76 | $ | 0.27 | $ | 0.41 | $ | 0.46 | $ | (1.16 | ) | $ | — | |||||||||||||
| Diluted before IAROC | $ | 0.12 | $ | (0.07 | ) | $ | 0.34 | $ | (0.36 | ) | $ | 0.03 | $ | 0.28 | $ | 0.40 | $ | 0.64 | $ | 0.61 | $ | 1.92 | $ | 0.27 | $ | 0.41 | $ | 0.46 | $ | 0.45 | $ | 1.58 | |||||||||||||||
| Dividends on equity shares | $ | 0.13 | $ | 0.13 | $ | 0.13 | $ | 0.13 | $ | 0.52 | $ | 0.12 | $ | 0.12 | $ | 0.12 | $ | 0.13 | $ | 0.49 | $ | 0.10 | $ | 0.12 | $ | 0.12 | $ | 0.12 | $ | 0.46 | |||||||||||||||||
Figure 11
IAROC: Impairment of assets, restructuring and other charges
- *
- Effective January 1, 2002, net income (loss) and earnings (loss) per share reflect the new accounting policy adopted by the Company under which goodwill is no longer amortized.
- **
- Cash provided from operating activities, less capital expenditures net of proceeds from disposals, and preferred share dividends.
- ***
- Margins calculated on revenues.
20 | 21 |
Revenue by Product($ millions)
For the fourth quarter ended December 31
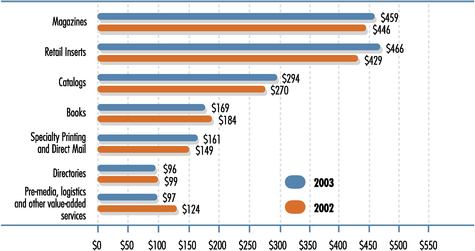
Figure 12
Revenue by Business Group($ millions)
For the fourth quarter ended December 31
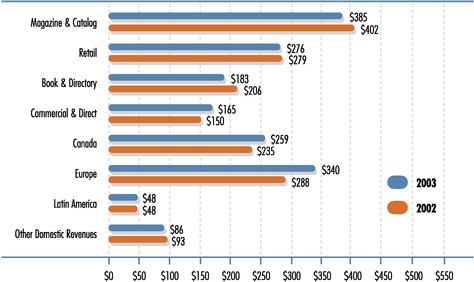
Figure 13
Segmented Results of Operations($ millions)
Selected Performance Indicators
| | North America | Europe | Latin America | Inter-Segment and Others | Total | |||||||||||||||||||||||||
|---|---|---|---|---|---|---|---|---|---|---|---|---|---|---|---|---|---|---|---|---|---|---|---|---|---|---|---|---|---|---|
| | 2003 | 2002 | 2003 | 2002 | 2003 | 2002 | 2003 | 2002 | 2003 | 2002 | ||||||||||||||||||||
| Three Months ended December 31 | ||||||||||||||||||||||||||||||
| Revenues | $ | 1,354.9 | $ | 1,366.4 | $ | 340.3 | $ | 288.5 | $ | 47.9 | $ | 47.9 | $ | (1.5 | ) | $ | (1.3 | ) $ | 1,741.6 | $ | 1,701.5 | |||||||||
| Operating income (loss) before depreciation and amortization and before IAROC | 145.7 | 208.1 | 36.4 | 26.6 | 3.4 | 5.3 | (2.7 | ) | 6.2 | 182.8 | 246.2 | |||||||||||||||||||
| Operating income (loss) before IAROC | 72.7 | 138.2 | 19.6 | 12.3 | 0.9 | 4.0 | (3.1 | ) | 5.8 | 90.1 | 160.3 | |||||||||||||||||||
| IAROC | 18.0 | (9.0 | ) | 1.3 | 22.1 | 2.1 | 1.0 | 0.1 | 5.5 | 21.5 | 19.6 | |||||||||||||||||||
| Operating income (loss) | 54.7 | 147.2 | 18.3 | (9.8 | ) | (1.2 | ) | 3.0 | (3.2 | ) | 0.3 | 68.6 | 140.7 | |||||||||||||||||
| Operating margin before depreciation and amortization and before IAROC | 10.8 | % | 15.2 | % | 10.7 | % | 9.2 | % | 7.1 | % | 11.1 | % | 10.5 | % | 14.5 | % | ||||||||||||||
| Operating margin before IAROC | 5.4 | % | 10.1 | % | 5.8 | % | 4.3 | % | 1.9 | % | 8.4 | % | 5.2 | % | 9.4 | % | ||||||||||||||
| Operating margin | 4.0 | % | 10.8 | % | 5.4 | % | (3.4 | )% | (2.5 | )% | 0.3 | % | 3.9 | % | 8.3 | % | ||||||||||||||
Figure 14
22
Energy and pollution control also continue to be the heart of the Company's commitment to the environment. In addition to the expanded installation of regenerative thermal oxidizers for the lithographic offset printing process, the Company is now in the middle of upgrading and optimizing the solvent recovery systems used to recover the solvent from the gravure printing process by means of activated carbon. The recovered solvent is then reused in the printing process. The upgrade and optimization program includes an exhaustive assessment of the solvent recovery systems and implementation of improvement measures that will allow the Company to have more reliable and efficient systems with additional operating flexibility and standardization across the plants. Furthermore, it will ensure lower energy consumption and strong compliance with regulatory air emission requirements. Since 2002 and until the end of 2004, nearly $10 million will have been invested in this program.
RECENT ACCOUNTING PRONOUNCEMENTS AND CHANGES IN ACCOUNTING POLICIES
Significant differences between Generally Accepted Accounting Principles (GAAP) in Canada and the United States are presented in Note 22 to the Consolidated Financial Statements. The Company generates more than 65% of its revenues from the United States. In an effort to expand its investor base in the United States, the Company has made efforts to follow new disclosure guidelines and to harmonize disclosure based on accounting pronouncements in both Canada and the United States.
In December 2002, the CICA's Accounting Standards Board ("AcSB") revised Handbook Section 3475, Disposal of Long-Lived Assets and Discontinued Operations. The revised Section 3475 is applicable to disposal activities initiated by an enterprise's commitment to plan on or after May 1, 2003. Under this Section, new standards are established for the recognition, measurement, presentation and disclosure of the disposal of long-lived assets. New standards are also established for the presentation and disclosure of discontinued operations. It applies to the disposal of non-monetary long-lived assets, including property, plant and equipment, intangible assets with finite useful lives and long-term prepaid assets. It requires an asset or group that will be disposed of other than by sale to continue to be classified as "held and used" until the disposal transaction occurs. Long-lived assets that meet the criteria to be considered as held for sale, cease to be amortized. The Section also provides specific guidance on balance sheet and income statement presentation for a disposal group that is a component of an entity. The effect of adopting the new recommendations did not have a significant impact on the consolidated balance sheet and consolidated statement of income and retained earnings and cash flows as at December 31, 2003 and for the period then ended.
Effective January 1, 2003, the Company changed its method of accounting for stock-based compensation and decided to adopt the fair value based method of accounting for all its stock-based compensation. The Company adopted these changes using the prospective application transitional alternative. Accordingly, the fair value based method is applied to awards granted, modified or settled on or after January 1, 2003. Prior to the adoption of the fair value based method, the Company, as permitted by Section 3870, had chosen to continue its existing policy of recording no compensation cost on the grant of stock options to employees. The effect of adopting the new recommendation is reflected in note 2 (d) of the consolidated financial statements. In February 2003, the Canadian Institute of Chartered Accountants ("CICA") issued Accounting Guideline 14, Disclosure of Guarantees (AcG-14), which clarifies disclosure requirements for certain guarantees. The Company adopted the new recommendations effective January 1, 2003. The impact of that change is presented in note 2 (a) of the consolidated financial statements.
In March 2003, the Emerging Issues Committee released Abstracts EIC-134, Accounting for Severance and Termination Benefits ("EIC-134"), and EIC-135, Accounting for Costs Associated with Exit and Disposal Activities (Including Costs Incurred in a Restructuring) ("EIC-135"). EIC-134 provides interpretive guidance to the accounting requirements for the various types of severance and termination benefits covered in CICA Handbook Section 3461, Employee Future Benefits. EIC-135 provides interpretive guidance for the timing of the recognition of a liability for costs associated with an exit or disposal activity. The new guidance requires that the liability be recognized for those costs only when the liability is incurred, that is, when it meets the definition of a liability in CICA Handbook Section 1000, Financial Statement Concepts. These new EICs also establish fair value as the objective for initial measurement of liabilities related to exit or disposal activities. Together, these two EICs are intended to harmonize Canadian GAAP with US SFAS No. 146, Accounting for Costs Associated with Exit or Disposal Activities ("FAS 146"). The Company adopted the new recommendations effective April 1,2003. The Company adopted the new recommendations for its 2003 initiatives.
FORWARD-LOOKING STATEMENTS
Except for historical information contained herein, the statements in this document are forward-looking and made pursuant to the safe harbor provisions of the Private Securities Litigation Reform Act of 1995. Forward-looking statements involve known and unknown risks and uncertainties, which may cause the Company's actual results in future periods to differ materially from forecasted results. Those risks include, among others, changes in customer demand for products, changes in raw material and equipment costs and availability, seasonal changes in customer orders, pricing actions by competitors and general changes in economic conditions.
On behalf of Management,
/s/ Claude Hélie
Executive Vice President and
Chief Financial Officer
/s/ Carl Gauvreau
Senior Vice President and
Chief Accounting Officer
Montreal, Canada
January 30, 2004
23
Management's Responsibility for Financial Statements
The accompanying consolidated financial statements of Quebecor World Inc. and its subsidiaries are the responsibility of management and are approved by the Board of Directors of Quebecor World Inc.
These financial statements have been prepared by management in conformity with Canadian generally accepted accounting principles and include amounts that are based on best estimates and judgments.
Management of the Company and of its subsidiaries, in furtherance of the integrity and objectivity of data in the financial statements, have developed and maintain systems of internal accounting controls and support a program of internal audit. Management believes that the systems of internal accounting controls provide reasonable assurance that financial records are reliable and form a proper basis for the preparation of the financial statements and that assets are properly accounted for and safeguarded.
The Board of Directors carries out its responsibility for the financial statements principally through its Audit Committee, consisting solely of outside directors. The Audit Committee reviews the Company's annual consolidated financial statements and formulates the appropriate recommendations to the Board of Directors. The auditors appointed by the shareholders have full access to the Audit Committee, with and without management being present.
These financial statements have been examined by the auditors appointed by the shareholders, KPMG LLP, chartered accountants, and their report is presented hereafter.
| /s/ The Right Honourable Brian Mulroney Chairman of the Board | /s/ Claude Hélie Executive Vice President and Chief Financial Officer | /s/ Carl Gauvreau Senior Vice President and Chief Accounting Officer |
Montreal, Canada
January 30, 2004
Auditors' Report to the Shareholders
We have audited the consolidated balance sheets of Quebecor World Inc. and its subsidiaries as at December 31, 2003 and 2002 and the consolidated statements of income, shareholders' equity and cash flows for the years ended December 31, 2003, 2002 and 2001. These financial statements are the responsibility of the Company's management. Our responsibility is to express an opinion on these financial statements based on our audits.
We conducted our audits in accordance with Canadian generally accepted auditing standards. Those standards require that we plan and perform an audit to obtain reasonable assurance whether the financial statements are free of material misstatement. An audit includes examining, on a test basis, evidence supporting the amounts and disclosures in the financial statements. An audit also includes assessing the accounting principles used and significant estimates made by management, as well as evaluating the overall financial statement presentation.
In our opinion, these consolidated financial statements present fairly, in all material respects, the financial position of the Company as at December 31, 2003 and 2002 and the results of its operations and its cash flows for the years ended December 31, 2003, 2002 and 2001 in accordance with Canadian generally accepted accounting principles.
/s/ KPMG LLP
Chartered Accountants
Montreal, Canada
January 30, 2004
24
CONSOLIDATED STATEMENTS OF INCOME
Years ended December 31
(in millions of US dollars, except per share amounts)
| | Notes | 2003 | 2002 | 2001 | ||||||||
|---|---|---|---|---|---|---|---|---|---|---|---|---|
| Revenues | $ | 6,391.5 | $ | 6,271.7 | $ | 6,442.7 | ||||||
Operating expenses: | ||||||||||||
| Cost of sales | 5,188.8 | 4,885.9 | 5,018.9 | |||||||||
| Selling, general and administrative | 536.4 | 507.0 | 488.8 | |||||||||
| Depreciation and amortization | 335.9 | 316.0 | 317.2 | |||||||||
| Impairment of assets, restructuring and other charges | 3 | 98.3 | 19.6 | 270.0 | ||||||||
| 6,159.4 | 5,728.5 | 6,094.9 | ||||||||||
| Operating income | 232.1 | 543.2 | 347.8 | |||||||||
Financial expenses | 4 | 221.3 | 170.2 | 208.8 | ||||||||
| Income before income taxes | 10.8 | 373.0 | 139.0 | |||||||||
Income taxes | 5 | 39.1 | 90.9 | 52.0 | ||||||||
| Income (loss) before minority interest | (28.3 | ) | 282.1 | 87.0 | ||||||||
Minority interest | 3.1 | 2.8 | 3.2 | |||||||||
| Net income (loss) before goodwill amortization | (31.4 | ) | 279.3 | 83.8 | ||||||||
| Goodwill amortization, net of income taxes | — | — | 61.4 | |||||||||
| Net income (loss) | $ | (31.4 | ) | $ | 279.3 | $ | 22.4 | |||||
Net income available to holders of preferred shares | 36.5 | 28.9 | 21.9 | |||||||||
| Net income (loss) available to holders of equity shares | $ | (67.9 | ) | $ | 250.4 | $ | 0.5 | |||||
| Earnings (loss) per share: | 6 | |||||||||||
| Basic | $ | (0.50 | ) | $ | 1.78 | $ | — | |||||
| Diluted | $ | (0.50 | ) | $ | 1.76 | $ | — | |||||
Earnings (loss) per share before goodwill amortization: | ||||||||||||
| Basic | $ | (0.50 | ) | $ | 1.78 | $ | 0.44 | |||||
| Diluted | $ | (0.50 | ) | $ | 1.76 | $ | 0.43 | |||||
| Weighted average number of equity shares outstanding: | 6 | |||||||||||
| (in millions) | ||||||||||||
| Basic | 136.0 | 140.7 | 142.2 | |||||||||
| Diluted | 136.0 | 145.4 | 143.0 | |||||||||
See Notes to Consolidated Financial Statements.
25
CONSOLIDATED STATEMENTS OF SHAREHOLDERS' EQUITY
Years ended December 31
(in millions of US dollars, except per share amounts and thousands of shares)
| | | Equity Multiple Voting Shares | Equity Subordinate Voting Shares | First Preferred Shares Series 2, 3, 4 and 5 | | | | | | |||||||||||||||||||||||||
|---|---|---|---|---|---|---|---|---|---|---|---|---|---|---|---|---|---|---|---|---|---|---|---|---|---|---|---|---|---|---|---|---|---|---|
| | Notes | Issued and outstanding shares | Amount | Issued and outstanding shares | Amount | Issued and outstanding shares | Amount | Total capital stock | Additional paid-in capital | Retained earnings | Translation adjustment | Total shareholders' equity | ||||||||||||||||||||||
| Balance, December 31, 2000 | 57,386 | $ | 118.6 | 88,753 | $ | 1,300.1 | 12,000 | $ | 212.5 | $ | 1,631.2 | $ | 104.6 | $ | 870.3 | $ | (132.2 | ) | $ | 2,473.9 | ||||||||||||||
Net income | — | — | — | — | — | — | — | — | 22.4 | — | 22.4 | |||||||||||||||||||||||
| Translation adjustment | 17 | — | — | — | — | — | — | — | — | — | (14.3 | ) | (14.3 | ) | ||||||||||||||||||||
| Conversion of Equity Multiple Voting Shares into Equity Subordinate Voting Shares | (2,650 | ) | (5.9 | ) | 2,650 | 5.9 | — | — | — | — | — | — | — | |||||||||||||||||||||
| Shares repurchased | 15 | — | — | (6,732 | ) | (96.7 | ) | — | — | (96.7 | ) | — | (80.7 | ) | — | (177.4 | ) | |||||||||||||||||
| Shares issued from stock plans | 16 | — | — | 777 | 14.7 | — | — | 14.7 | — | — | — | 14.7 | ||||||||||||||||||||||
| Issuance of First Preferred Shares Series 4 | 15 | — | — | — | — | 8,000 | 130.2 | 130.2 | — | — | — | 130.2 | ||||||||||||||||||||||
| Issuance of First Preferred Shares Series 5 | 15 | — | — | — | — | 7,000 | 113.9 | 113.9 | — | — | — | 113.9 | ||||||||||||||||||||||
| Share issue expenses (net of income taxes of $2.3) | 15 | — | — | — | — | — | — | — | — | (4.5 | ) | — | (4.5 | ) | ||||||||||||||||||||
| Dividends on equity shares ($0.46 per share) | — | — | — | — | — | — | — | — | (65.2 | ) | — | (65.2 | ) | |||||||||||||||||||||
| Dividends on preferred shares ($0.68 (Cdn $1.06) per share) | — | — | — | — | — | — | — | — | (20.5 | ) | — | (20.5 | ) | |||||||||||||||||||||
| Balance, December 31, 2001 | 54,736 | $ | 112.7 | 85,448 | $ | 1,224.0 | 27,000 | $ | 456.6 | $ | 1,793.3 | $ | 104.6 | $ | 721.8 | $ | (146.5 | ) | $ | 2,473.2 | ||||||||||||||
Net income | — | — | — | — | — | — | — | — | 279.3 | — | 279.3 | |||||||||||||||||||||||
| Translation adjustment | 17 | — | — | — | — | — | — | — | — | — | 30.9 | 30.9 | ||||||||||||||||||||||
| Conversion of Equity Multiple Voting Shares into Equity Subordinate Voting Shares | (7,749 | ) | (19.2 | ) | 7,749 | 19.2 | — | — | — | — | — | — | — | |||||||||||||||||||||
| Conversion of First Preferred Shares: | 15 | |||||||||||||||||||||||||||||||||
| Series 2 | — | — | — | — | (12,000 | ) | (212.5 | ) | (212.5 | ) | — | — | — | (212.5 | ) | |||||||||||||||||||
| Series 3 | — | — | — | — | 12,000 | 212.5 | 212.5 | — | — | — | 212.5 | |||||||||||||||||||||||
| Shares repurchased | 15 | — | — | (148 | ) | (2.1 | ) | — | — | (2.1 | ) | — | (1.4 | ) | — | (3.5 | ) | |||||||||||||||||
| Shares issued from stock plans | 16 | — | — | 1,109 | 22.7 | — | — | 22.7 | — | — | — | 22.7 | ||||||||||||||||||||||
| Related party transactions | 20 | — | — | — | — | — | — | — | (1.0 | ) | — | — | (1.0 | ) | ||||||||||||||||||||
| Dividends on equity shares ($0.49 per share) | — | — | — | — | — | — | — | — | (69.0 | ) | — | (69.0 | ) | |||||||||||||||||||||
| Dividends on preferred shares ($0.96(Cdn $1.50) per share) | — | — | — | — | — | — | — | — | (28.8 | ) | — | (28.8 | ) | |||||||||||||||||||||
| Balance, December 31, 2002 | 46,987 | $ | 93.5 | 94,158 | $ | 1,263.8 | 27,000 | $ | 456.6 | $ | 1,813.9 | $ | 103.6 | $ | 901.9 | $ | (115.6 | ) | $ | 2,703.8 | ||||||||||||||
Net loss | — | — | — | — | — | — | — | — | (31.4 | ) | — | (31.4 | ) | |||||||||||||||||||||
| Reduction of a net investment in a foreign operation | 4 | — | — | — | — | — | — | — | — | — | 5.3 | 5.3 | ||||||||||||||||||||||
| Translation adjustment | 17 | — | — | — | — | — | — | — | — | — | 91.1 | 91.1 | ||||||||||||||||||||||
| Shares repurchased | 15 | — | — | (10,000 | ) | (134.3 | ) | — | — | (134.3 | ) | — | (39.3 | ) | — | (173.6 | ) | |||||||||||||||||
| Shares issued from stock plans | 16 | — | — | 806 | 13.5 | — | — | 13.5 | — | — | — | 13.5 | ||||||||||||||||||||||
| Related party transactions | 20 | — | — | — | — | — | — | — | 0.4 | — | — | 0.4 | ||||||||||||||||||||||
| Stock-based compensation | 2 (d) | — | — | — | — | — | — | — | 1.9 | — | — | 1.9 | ||||||||||||||||||||||
| Dividends on equity shares ($0.52 per share) | — | — | — | — | — | — | — | — | (71.1 | ) | — | (71.1 | ) | |||||||||||||||||||||
| Dividends on preferred shares ($1.17 (Cdn $1.63) per share) | — | — | — | — | — | — | — | — | (36.5 | ) | — | (36.5 | ) | |||||||||||||||||||||
| Balance, December 31, 2003 | 46,987 | $ | 93.5 | 84,964 | $ | 1,143.0 | 27,000 | $ | 456.6 | $ | 1,693.1 | $ | 105.9 | $ | 723.6 | $ | (19.2 | ) | $ | 2,503.4 | ||||||||||||||
See Notes to Consolidated Financial Statements.
26 | 27 |
CONSOLIDATED STATEMENTS OF CASH FLOWS
Years ended December 31
(in millions of US dollars)
| | Notes | 2003 | 2002 | 2001 | ||||||||||
|---|---|---|---|---|---|---|---|---|---|---|---|---|---|---|
| Operating activities: | ||||||||||||||
| Net income (loss) | $ | (31.4 | ) | $ | 279.3 | $ | 22.4 | |||||||
Non-cash items in net income (loss): | ||||||||||||||
Depreciation of property, plant and equipment | 333.2 | 313.2 | 314.9 | |||||||||||
Future income taxes | 5 | 15.1 | 56.7 | (42.8 | ) | |||||||||
| Amortization of goodwill and deferred charges | 26.2 | 22.4 | 84.3 | |||||||||||
| Impairment of assets and non-cash portion of restructuring and other charges | 3 | 60.4 | (0.5 | ) | 142.6 | |||||||||
| Gain on sale of investments | — | (3.9 | ) | — | ||||||||||
| Loss on extinguishment of long term-debt | 4 | 30.2 | — | — | ||||||||||
Other | 16.0 | 12.2 | 10.5 | |||||||||||
| Changes in non-cash balances related to operations: | ||||||||||||||
| Trade receivables | 157.0 | (91.0 | ) | 190.0 | ||||||||||
| Inventories | 30.8 | (21.0 | ) | 77.2 | ||||||||||
| Trade payables and accrued liabilities | (121.4 | ) | (18.4 | ) | (138.9 | ) | ||||||||
| Other current assets and liabilities | (56.3 | ) | 43.7 | 20.3 | ||||||||||
| Other non-current assets and liabilities | 1.5 | (79.3 | ) | (104.0 | ) | |||||||||
| Cash provided by operating activities | 461.3 | 513.4 | 576.5 | |||||||||||
Financing activities: | ||||||||||||||
| Net change in bank indebtedness | 1.0 | 0.2 | (2.3 | ) | ||||||||||
| Net proceeds from issuance of equity shares | 15 & 16 | 13.5 | 22.7 | 14.7 | ||||||||||
| Repurchases of shares for cancellation | 15 | (173.6 | ) | (3.5 | ) | (177.4 | ) | |||||||
| Net proceeds from issuance of preferred shares | 15 | — | — | 239.6 | ||||||||||
| Issuance of long-term debt | 12 | 592.0 | — | 248.8 | ||||||||||
| Repayments of long-term debt | (582.4 | ) | (96.9 | ) | (95.3 | ) | ||||||||
| Net (repayments) borrowings under revolving bank facility and commercial paper | 108.9 | (283.6 | ) | (284.5 | ) | |||||||||
| Dividends on equity shares | (71.1 | ) | (69.0 | ) | (65.2 | ) | ||||||||
| Dividends on preferred shares | (37.7 | ) | (36.2 | ) | (20.5 | ) | ||||||||
| Dividends to minority shareholders | (0.4 | ) | (2.0 | ) | (1.5 | ) | ||||||||
| Other | 5.7 | — | — | |||||||||||
| Cash used in financing activities | (144.1 | ) | (468.3 | ) | (143.6 | ) | ||||||||
Investing activities: | ||||||||||||||
| Business acquisitions, net of cash and cash equivalents | 7 | (7.5 | ) | (0.3 | ) | (138.9 | ) | |||||||
| Additions to property, plant and equipment | (243.1 | ) | (184.5 | ) | (278.3 | ) | ||||||||
| Net proceeds from disposal of assets | 2.8 | 27.1 | 9.5 | |||||||||||
| Other | (0.8 | ) | 19.6 | (15.8 | ) | |||||||||
| Cash used in investing activities | (248.6 | ) | (138.1 | ) | (423.5 | ) | ||||||||
Effect of exchange rate changes on cash and cash equivalents | (56.2 | ) | 10.2 | 23.4 | ||||||||||
| Net increase (decrease) in cash and cash equivalents | 12.4 | (82.8 | ) | 32.8 | ||||||||||
| Cash and cash equivalents, beginning of year | 2.7 | 85.5 | 52.7 | |||||||||||
| Cash and cash equivalents, end of year | $ | 15.1 | $ | 2.7 | $ | 85.5 | ||||||||
See Notes to Consolidated Financial Statements.
28
CONSOLIDATED BALANCE SHEETS
December 31
(in millions of US dollars)
| | Notes | 2003 | 2002 | |||||||
|---|---|---|---|---|---|---|---|---|---|---|
| Assets | ||||||||||
Current assets: | ||||||||||
| Cash and cash equivalents | $ | 15.1 | $ | 2.7 | ||||||
| Trade receivables | 8 | 346.9 | 466.9 | |||||||
| Receivables from related parties | 20 | 16.5 | 15.5 | |||||||
| Inventories | 9 | 400.1 | 409.4 | |||||||
| Income taxes receivable | 6.2 | 21.7 | ||||||||
| Future income taxes | 5 | 105.8 | 27.8 | |||||||
| Prepaid expenses | 17.4 | 25.2 | ||||||||
| Total current assets | 908.0 | 969.2 | ||||||||
Property, plant and equipment, net | 10 | 2,581.0 | 2,610.6 | |||||||
| Goodwill | 11 | 2,591.0 | 2,514.3 | |||||||
| Other assets | 133.8 | 113.3 | ||||||||
| Total assets | $ | 6,213.8 | $ | 6,207.4 | ||||||
Liabilities and Shareholders' Equity | ||||||||||
Current liabilities: | ||||||||||
| Bank indebtedness | $ | 1.3 | $ | 0.3 | ||||||
| Trade payables | 455.7 | 581.2 | ||||||||
| Accrued liabilities | 552.5 | 485.8 | ||||||||
| Payables to related parties | 0.1 | 1.9 | ||||||||
| Income and other taxes payable | 61.3 | 70.8 | ||||||||
| Future income taxes | 5 | 6.2 | 4.5 | |||||||
| Current portion of long-term debt and convertible notes | 12 & 14 | 23.9 | 38.5 | |||||||
| Total current liabilities | 1,101.0 | 1,183.0 | ||||||||
Long-term debt | 12 | 1,874.4 | 1,668.6 | |||||||
| Other liabilities | 13 | 194.5 | 228.9 | |||||||
| Future income taxes | 5 | 405.1 | 287.2 | |||||||
| Convertible notes | 14 | 110.7 | 115.0 | |||||||
| Minority interest | 24.7 | 20.9 | ||||||||
Shareholders' equity: | ||||||||||
| Capital stock | 15 | 1,693.1 | 1,813.9 | |||||||
| Additional paid-in capital | 105.9 | 103.6 | ||||||||
| Retained earnings | 723.6 | 901.9 | ||||||||
| Translation adjustment | 17 | (19.2 | ) | (115.6 | ) | |||||
| 2,503.4 | 2,703.8 | |||||||||
| Total liabilities and shareholders' equity | $ | 6,213.8 | $ | 6,207.4 | ||||||
See Notes to Consolidated Financial Statements.
On behalf of the Board:
| /s/ The Right Honourable Brian Mulroney, Director | /s/ Jean Neveu, Director |
29
NOTES TO CONSOLIDATED FINANCIAL STATEMENTS
Years ended December 31, 2003, 2002 and 2001
(Tabular amounts are expressed in millions of US dollars, except for earnings per share and option amounts)
1. SUMMARY OF SIGNIFICANT ACCOUNTING POLICIES
(a) Principles of consolidation
The consolidated financial statements include the accounts of Quebecor World Inc. and all its subsidiaries (the "Company") and are prepared in conformity with Canadian generally accepted accounting principles.
(b) Use of estimates
The preparation of financial statements in conformity with Canadian generally accepted accounting principles requires management to make estimates and assumptions that affect the reported amounts of assets and liabilities and disclosure of contingent assets and liabilities at the date of the financial statements and the reported amounts of revenues and expenses during the reporting period. Financial results as determined by actual events could differ from those estimates.
Examples of significant estimates include: the key economic assumptions used in determining the allowance for doubtful accounts, the provision for obsolescence and some of the amounts accrued for restructuring and other charges; the composition of future income tax assets; the useful life of capital assets; certain actuarial and economic assumptions used in determining pension costs, accrued pension benefit obligations and pension plan assets; and the assumptions used in property, plant and equipment and goodwill impairment tests.
(c) Foreign currency translation
The Company's functional currency is the Canadian dollar and uses the US currency as its reporting currency for the presentation of its consolidated financial statements.
Financial statements of self-sustaining foreign operations are translated using the rate in effect at the balance sheet date for asset and liability items and the average exchange rates during the year for revenues and expenses. Adjustments arising from this translation are deferred and recorded in translation adjustment and are included in income only when a reduction in the investment in these foreign operations is realized.
Other foreign currency transactions are translated using the temporal method. Translation gains and losses are included in financial expenses.
(d) Revenue recognition
The Company provides a wide variety of print and print-related services and products to its customers, which usually require that the specifics be agreed upon prior to process. Sales are recognized by the Company either when the production process is completed or services are performed, or on the basis of production and service activity at the pro rata billing value of work completed.
(e) Cash and cash equivalents
Cash and cash equivalents consist of highly liquid investments purchased three months or less from maturity and are stated at cost, which approximates market value.
(f) Trade receivables
Any gains or losses on the sale of trade receivables are calculated by comparing the carrying amount of the trade receivables sold to the total of the cash proceeds on sale and the fair value of the retained interest in such receivables on the date of transfer. Fair values are determined on a discounted cash flow basis. Costs including losses on sales of trade receivables are recognized in income in the period incurred and included in financial expenses.
(g) Inventories
Raw materials and supplies are valued at the lower of cost, as determined, using the first in, first out method, or market being replacement cost. The work in process is valued at the pro rata billing value of the work completed.
(h) Property, plant and equipment
Property, plant and equipment are stated at cost. Cost represents acquisition or construction costs including preparation, installation and testing charges and interest incurred with respect to property, plant and equipment until they are ready for commercial production. Repair and maintenance are expensed as incurred.
30
Depreciation is provided using the straight-line basis over the estimated useful lives as follows:
| Assets | Estimated useful lives | |
|---|---|---|
| Buildings and leasehold improvements | 15 to 40 years | |
| Machinery and equipment | 3 to 18 years |
(i) Goodwill and intangible assets
Goodwill represents the excess of the purchase price over the fair value of net assets of acquired businesses. Goodwill is not amortized and is tested for impairment annually, or more frequently if events or changes in circumstances indicate that the asset might be impaired. When the carrying amount of a reporting unit's goodwill exceeds the implied fair value of the goodwill, an impairment loss is recognized in an amount equal to the excess and is presented as a separate line item in the income statement before extraordinary items and discontinued operations.
Intangible assets which have indefinite lives, are not amortized, and are tested for impairment annually, or more frequently if events or changes in circumstances indicate that the asset might be impaired. The impairment test compares the carrying amount of the intangible asset with its fair value, and an impairment loss is recognized in income for the excess, if any. Intangible assets with definite useful lives are amortized over their useful life.
(j) Income taxes
The Company follows the asset and liability method of accounting for income taxes. Under the asset and liability method, future income tax assets and liabilities are recognized for the estimated future tax consequences attributable to differences between the financial statement carrying amounts of existing assets and liabilities and their respective tax bases. Future income tax assets and liabilities are measured using enacted or substantively enacted tax rates in effect for the year in which those temporary differences are expected to be recovered or settled. The effect on future income tax assets and liabilities of a change in tax rates is recognized in income in the period that includes the enactment, or substantively enactment, date. Future income tax assets are recognized and if realization is not considered more likely than not, a valuation allowance is provided.
(k) Derivative financial and commodity instruments
The Company uses various derivative financial instruments to manage its exposure to fluctuations in foreign currency exchange rates, interest rates and commodity pricing. The Company does not hold or use any derivative instruments for speculative trading purposes.
The Company enters into foreign exchange forward contracts to hedge anticipated foreign denominated sales and related receivables, raw material and equipment purchases. Foreign exchange translation gains and losses are recognized as an adjustment of the revenues, of the cost of goods sold and of the fixed assets, respectively when the transaction is recorded. The portion of the forward premium or discount on the contract relating to the period prior to consummation of the transaction is also recognized as an adjustment of the revenues, of the cost of goods sold and of the fixed assets, respectively when the transaction is recorded.
The Company enters into foreign exchange forward contracts to hedge its net investments in foreign subsidiaries. Foreign exchange translation gains and losses are recorded under translation adjustment. Any realized or unrealized gain or loss on such derivative instruments is also recognized in translation adjustment.
The Company enters into foreign exchange forward contracts and cross currency swaps to hedge foreign denominated asset exposures. Foreign exchange translation gains and losses are recorded in income. Changes in the spot rates on the derivative instruments are recorded in income. The forward premium or discount on forward exchange contracts and the interest component of the cross currency swap are amortized as an adjustment of interest expense over the term of the contract.
31
The Company enters into interest rate swaps in order to manage the impact of fluctuating interest rates on its short-term and long-term debt. These swap agreements require the periodic exchange of payments without the exchange of the notional principal amount on which the payments are based. The Company designates its interest rate hedge agreements as hedges of the interest cost of the underlying debt. Interest expense on the debt is adjusted to include amounts payable or receivable under the interest rate swaps.
The Company uses Treasury Lock Agreements in order to manage the impact of fluctuating interest rates on forecasted issuance of long-term debts. The Company designates its Treasury Lock Agreements as hedges of the future interest payments resulting from the issuance of long-term debts. The single payment from the derivative instrument at its maturity date is deferred and amortized over the term of the long-term debt.
The Company also entered into commodity swaps to manage a portion of its natural gas exposure. The Company is committed to exchange, on a monthly basis, the difference between a fixed price and a floating natural gas price index. The Company designated its commodity hedge agreements as a hedge of the natural gas cost. Natural gas cost is adjusted to include amounts payable or receivable under the commodity hedge agreements.
Realized and unrealized gains or losses associated with derivative instruments, which have been terminated or cease to be effective prior to maturity, are deferred on the balance sheet and recognized in income in the period in which the underlying hedged transaction is recognized. In the event a designated hedged item is sold, extinguished or matures prior to the termination of the related derivative instrument, any realized or unrealized gain or loss on such derivative instrument is recognized in income.
(l) Employee future benefits
i) Pensions
- •
- The cost of pension benefits provided in exchange for employees' services rendered during the year;
- •
- The amortization of the initial net transition asset on a straight-line basis over the expected average remaining service life of the employee group covered by the plans;
- •
- The amortization of prior service costs and amendments on a straight-line basis over the expected average remaining service life of the employee group covered by the plans;
- •
- The interest cost of pension obligations and the expected return on plan assets. For the purpose of calculating the expected return on plan assets, those assets are valued at market-related value; and
- •
- The amortization of cumulative unrecognized net actuarial gains and losses in excess of 10% of the greater of the benefit obligation or fair value of plan assets, on a straight-line basis over the expected average remaining service life of the employee group covered by the plans.
Pension costs are determined using actuarial methods and are funded through contributions determined in accordance with the projected benefit method pro rated on service. Pension expense is charged to operations and includes:
ii) Other postretirement benefits
The Company accrues the cost of postretirement benefits other than pensions. These benefits, which are funded by the Company as they become due, include life insurance programs and medical benefits. The Company amortizes the cumulative unrecognized net actuarial gains and losses in excess of 10% of the projected benefit obligation over the expected average remaining service life of the employee group covered by the plans.
(m) Environmental expenditures
Environmental expenditures that relate to current operations are expensed or capitalized as appropriate. Expenditures that relate to an existing condition caused by past operations and which are not expected to contribute to current or future operations are expensed. Liabilities are recorded when environmental assessments and/or remedial efforts are likely, and when the costs, based on a specific plan of action in terms of the technology to be used and the extent of the corrective action required, can be reasonably estimated.
(n) Reclassifications
Certain reclassifications have been made to prior years' amounts to conform with the basis of presentation adopted in the current year.
32
2. ACCOUNTING CHANGES
The Company has made certain changes in accounting policies to conform to new accounting standards.
(a) Guarantees
In February 2003, the Canadian Institute of Chartered Accountants ("CICA") issued Accounting Guideline 14, Disclosure of Guarantees (AcG-14), which clarifies disclosure requirements for certain guarantees. The Company adopted the new recommendations effective January 1, 2003.
In the normal course of business, the Company enters into numerous agreements that may contain features that meet the AcG-14 definition of a guarantee. AcG-14 defines a guarantee to be a contract (including an indemnity) that contingently requires the Company to make payments to a third party based on (i) changes in an underlying that is related to an asset, a liability or an equity of the guaranteed party, or (ii) failure of another party to perform under an obligating agreement.
Significant guarantees the Company has provided to third parties include the following:
Operating leases
The Company has guaranteed a portion of the residual values of certain of its assets under operating leases with expiry dates between 2004 and 2007, for the benefit of the lessor. If the fair value of the assets, at the end of their respective lease term, is less than the residual value guaranteed, then the Company must, under certain conditions, compensate the lessor for a portion of the shortfall. The maximum exposure in respect of these guarantees is $112.2 million. As at December 31, 2003, the Company has recorded a liability of $5.2 million associated with these guarantees.
Sub-lease agreements
The Company has, for some of its assets under operating leases, entered into sub-lease agreements with expiry dates between 2004 and 2008. If the sub-lessee defaults under the agreement, the Company must, under certain conditions, compensate the lessor for the default. The maximum exposure in respect of these guarantees is $4.1 million. As at December 31, 2003, the Company has not recorded a liability associated with these guarantees, since it is not probable that the sub-lessee will default under the agreement. Recourse against the sub-lessee is also available, up to the total amount due.
Business and real estate disposals
In the sale of all or a part of a business or real estate, in addition to possible indemnification relating to failure to perform covenants and breach of representations and warranties, the Company may agree to indemnify against claims from its past conduct of the business. Typically, the term and amount of such indemnification will be limited by the agreement. The nature of these indemnification agreements prevents the Company from estimating the maximum potential liability that could be required to pay to guaranteed parties. The Company has not accrued any amount in the Consolidated balance sheet in respect to this item.
Debt agreements
Under the terms of certain debt agreements, the Company has guaranteed the obligation of its US subsidiaries. In that context, the Company would have to indemnify the other parties against changes in regulation relative to withholding taxes, which would occur only if the Company must perform the payments on behalf of its US subsidiaries. These indemnifications extend for the term of the related financings and do not provide any limit on the maximum potential liabilities. The nature of the indemnification agreements prevent the Company from estimating the maximum potential liability it could be required to pay. Within the current structure of the transactions, the Company is however not exposed to such liabilities. As such, the Company has not accrued any amount in the consolidated balance sheet in respect to this item.
(b) Disposal of long-lived assets and discontinued operations
In December 2002, the CICA's Accounting Standards Board ("AcSB") revised Handbook Section 3475, Disposal of Long-Lived Assets and Discontinued Operations. The revised section 3475 is applicable to disposal activities initiated by an enterprise's commitment to a plan on or after May 1, 2003.
Under this section, new standards are established for the recognition, measurement, presentation and disclosure of the disposal of long-lived assets. New standards are also established for the presentation and disclosure of discontinued operations. It applies to the disposal of non-monetary long-lived assets, including property, plant and equipment, intangible assets with definite useful lives and long-term prepaid assets. It requires an asset or group that will be disposed of other than by sale to continue to be classified as "held and used" until the disposal transaction occurs. Long-lived assets that meet the criterias to be considered as held for sale cease to be amortized. The Section also provides specific guidance on balance sheet and income statement presentation for a disposal group that is a component of an entity. The effect of adopting the new recommendations did not have a significant impact on the consolidated balance sheet and consolidated statement of income and retained earnings and cash flows as at December 31, 2003 and for the period then ended.
(c) Termination benefits and cost associated with exit and disposal activities
In March 2003, the Emerging Issues Committee released Abstracts EIC-134, Accounting for Severance and Termination Benefits ("EIC-134"), and EIC-135, Accounting for Costs Associated with Exit and Disposal Activities (Including Costs Incurred in a Restructuring) ("EIC-135"). EIC-134 provides interpretive guidance to the accounting requirements for the various types of severance and termination benefits covered in CICA Handbook Section 3461, Employee Future Benefits. EIC-135 provides interpretive guidance for the timing of the recognition of a liability for costs associated with an exit or disposal activity. The new guidance requires that the liability be recognized for those costs only when the liability is incurred, that is, when it meets the definition of a liability in CICA Handbook Section 1000, Financial Statement Concepts. These new EICs also establish fair value as the objective for initial measurement of liabilities related to exit or disposal of activities. Together, these two EICs and revised section 3475 are intended to harmonize Canadian GAAP with US SFAS No. 146, Accounting for Costs Associated with Exit or Disposal of Activities ("FAS 146"). The Company adopted the new recommendations effective April 1, 2003.
33
(d) Stock-based compensation
Effective January 1, 2003, the Company changed its method of accounting for stock-based compensation and decided to adopt the fair value based method of accounting for all its stock-based compensation. The Company adopted these changes using the prospective application transitional alternative. Accordingly, the fair value based method is applied to awards granted, modified or settled on or after January 1, 2003. Prior to the adoption of the fair value based method, the Company, as permitted by Section 3870, had chosen to continue its existing policy of recording no compensation cost on the grant of stock options to employees.
The compensation cost charged against income for those plans was $1.9 million for the year ended December 31, 2003. The counterpart has been recorded as additional paid-in capital.
The compensation cost was calculated using the Black-Scholes option pricing model with the following assumptions:
| Weighted-average grant date fair value of options | $5.74 | ||
| Assumptions: | |||
| Risk-free interest rate | 4.61% - 4.73% | ||
| Dividend yield | 2% - 4% | ||
| Expected volatility | 26% - 28% | ||
| Expected life | 7 years | ||
When employees exercise their stock options, the capital stock is credited by the sum of the consideration paid by employees together with the related portion previously credited to additional paid-in capital when compensation costs were charged against income. The prospective method omits the effects of awards granted, modified or settled before January 1, 2003.
As in prior year, for the employee share plans, the Company's contribution on the employee's behalf is recognized as a compensation expense. Any consideration paid by employees on purchase of stock is recorded as an increase to capital stock.
3. IMPAIRMENT OF ASSETS, RESTRUCTURING AND OTHER CHARGES
In 2003, the Company recorded an impairment of assets, restructuring and other charges of $98.3 million. Non-cash items amounted to $60.4 million and cash items to $37.9 million. The non-cash portion included an impairment of assets of $54.4 million and other charges of $2.8 million for the 2003 initiatives and $3.2 million related to previous years' initiatives.
Impairment of assets
During 2003, the Company reviewed the status of assets that had become permanently idle following the prior years' restructuring initiatives and difficult economic conditions. The Company determined that these assets would not be redeployed as it had originally contemplated under an economic recovery scenario or would not generate sufficient cash flow, and as such, recorded an impairment of assets of $54.4 million, of which $47.4 million in the second quarter and $7.0 million in the fourth quarter.
Restructuring initiatives
During the fourth quarter of 2003, the Company continued its restructuring initiatives and recorded net restructuring charges of $21.5 million. The charges include $15.8 million, consisting of new initiatives of $16.1 million net of a reversal of $0.3 million related to second quarter and third quarter initiatives, $7.0 million for impairment of assets and a reversal of $1.3 million related to 2001-2002 initiatives. The cash charge of $16.1 million is related to a reduction in workforce of 878 employee positions, of which $12.8 million was for North America, $1.9 million for Europe and $1.4 million for Latin America. Under these initiatives, 393 employee positions have been eliminated and 485 will be eliminated in the first quarter of 2004.
In the third quarter of 2003, the Company initiated new restructuring initiatives. A net cash reversal of $0.3 million was recorded. This was composed of two items: a reversal of $2.2 million of which $1.9 million was for Europe and $0.3 million was for Latin America and a charge of $1.9 million for workforce reduction, of which $1.4 million was for North America and $0.5 million for Latin America. Under these initiatives 260 employee positions are being eliminated. The reversal of provision of $2.2 million was recorded after the Company completed most of its June initiatives and re-evaluated the remaining costs.
In the second quarter of 2003, the Company initiated restructuring initiatives and other charges following the continued volume declines in certain business segments. A cash charge of $23.4 million was taken consisting of $17.6 million in workforce reduction and $5.8 million of additional closure costs of four smaller facilities. The amount of $17.6 million in workforce reduction included $5.8 million for Europe and $10.0 million for North America. Related to this, an asset write-down of $2.8 million was also recorded. Under these initiatives, 1,134 employee positions are being eliminated.
In summary, as of December 31, 2003, 1,769 employee positions have been eliminated under the 2003 restructuring initiatives and 503 will be completed in 2004. The workforce reductions affected both plants and corporate levels.
34
2002 and 2001 restructuring initiatives
In 2003, the review and the execution of the 2002 and 2001 initiatives resulted in a net reversal of $1.0 million comprised of a cash overspending of $12.9 million and a $13.9 million reversal of prior year restructuring and other charges. The cash overspending is related to costs of closed facilities not yet disposed of, and office leases not yet subleased and other completed initiatives. Under these initiatives, 3,961 employee positions were eliminated as at December 31, 2003 and 23 will be eliminated in 2004, of which 18 terminations in Europe to be completed when all legal procedures and requirements are met.
In addition, during the second quarter of 2003, the Company also recorded an asset write-down of $3.2 million in relation with 2001 and 2002 initiatives.
In 2002, the Company reported restructuring and other charges of $19.6 million. The charges are detailed as follows and discussed below:
—2002 initiatives amounted to $46.4 million, while overspending on 2001 initiatives stood at $13.3 million for total costs of $59.7 million.
—The reversal of unused reserves for restructuring from 2001 amounted to $40.1 million and was applied against the 2002 charges.
In 2001, the Company recorded restructuring and other charges of $270.0 million, net of a $3.2 million reversal from the 2000 initiatives.
2002 restructuring initiatives
In 2002, the Company initiated new restructuring initiatives in France due to difficult market conditions, severe price competition and a decrease in sales volume. In addition, reduction in force programs were initiated in North America and mostly completed in 2003. This initiative to reduce headcount was the result of volume declines in certain business segments and overlapping activities across the platform.
The charges of $46.4 million consisted of $6.5 million, relating to impaired property, plant and equipment, $30.0 million in workforce reduction costs and other restructuring charges, and $9.9 million mostly for the write-down of the investment in Q-Media Services Corporation, which went into receivership at the end of 2002. The $30 million in workforce reduction costs and other restructuring charges included $18.6 million for France and $8.6 million for North America.
2001 restructuring initiatives
As at December 31, 2002, the restructuring initiatives announced in 2001 were substantially completed. Nearly 3,000 employees' positions were eliminated, 10 facilities closed and more than 30 pieces of equipment were successfully relocated.
The continuation of a contract with a customer, previously expected to be terminated, provided sufficient work to utilize equipment originally targeted for shutdown. As a result, the Company decided to stop one plant shutdown which mainly explained the balance of the 2001 restructuring reserve reversed in 2002 of $40.1 million which consisted of $18.4 million of asset impairments and $21.7 million for related charges. In addition, the execution of the 2001 initiatives resulted in an overspending of $13.3 million recorded in the 2002 restructuring and other charges.
In 2001, in response to difficult market conditions, the Company had committed itself to restructuring initiatives aimed at eliminating non-competitive assets and consolidating its platform into fewer facilities. These initiatives focused the Company's efforts on reducing operating expenses and maximizing capacity utilization in larger and more specialized facilities.
Therefore, the Company recorded restructuring and other charges of $273.2 million. The restructuring plan consisted of $114.0 million relating primarily to impaired property, plant and equipment as a result of planned facility closures, together with other associated closure costs, $115.5 million in workforce reduction costs resulting from planned closures and other headcount reductions and other restructuring charges, and $43.7 million of other related restructuring and exit costs.
The other special charges of $43.7 million included an additional charge of $13.1 million relating to an increase in costs associated with implementing the 1999 restructuring plan, to the costs of exiting unfavourable contracts, and the write-down of investments to their expected realizable value.
Continuity of the reserve for restructuring and other charges
As at January 1, 2003, the balance of the restructuring reserve was $51.2 million. This amount related mostly to the workforce reduction across the platform. The Company utilized $46.3 million of the current and prior year's restructuring and other charges reserves during the twelve-month period ended December 31, 2003.
The following table sets forth the Company's 2003 restructuring reserve and activities against the reserves carried forward from 2002:
| (in millions of US dollars) | Restructuring charges | Other charges | Total | |||||||
|---|---|---|---|---|---|---|---|---|---|---|
| Balance as at December 31, 2002 | $ | 50.0 | $ | 1.2 | $ | 51.2 | ||||
| Overspending of 2001-2002 initiatives | 11.1 | 1.8 | 12.9 | |||||||
| Reversal of previous years' reserves | (13.9 | ) | — | (13.9 | ) | |||||
| New initiatives in 2003 | 37.2 | 1.7 | 38.9 | |||||||
| 34.4 | 3.5 | 37.9 | ||||||||
Reserve utilized in 2003 | (42.8 | ) | (3.5 | ) | (46.3 | ) | ||||
Foreign currency changes | 3.0 | — | 3.0 | |||||||
| Balance as at December 31, 2003 | $ | 44.6 | $ | 1.2 | $ | 45.8 | ||||
Breakdown of the 2003 restructuring and other charges by quarter
| (in millions of US dollars) | Overspending 2001 - 2002 Initiatives | Reversal Previous years' reserves | New Initiatives in 2003 | Total | |||||||||
|---|---|---|---|---|---|---|---|---|---|---|---|---|---|
| Second Quarter | $ | 9.6 | $ | (4.6 | ) | $ | 23.4 | $ | 28.4 | ||||
| Third Quarter | 1.1 | (5.8 | ) | (0.3 | ) | (5.0 | ) | ||||||
| Fourth Quarter | 2.2 | (3.5 | ) | 15.8 | 14.5 | ||||||||
| $ | 12.9 | $ | (13.9 | ) | $ | 38.9 | $ | 37.9 | |||||
The utilization of the reserve is estimated to be as follows:
| (in millions of US dollars) | Workforce reduction costs | Leases, closed facilities carrying costs and other | Total | ||||||
|---|---|---|---|---|---|---|---|---|---|
| 2004 | $ | 22.0 | $ | 10.6 | $ | 32.6 | |||
| 2005 | — | 5.3 | 5.3 | ||||||
| 2006 | — | 3.3 | 3.3 | ||||||
| 2007 | — | 2.3 | 2.3 | ||||||
| 2008 | — | 1.4 | 1.4 | ||||||
| 2009 and thereafter | — | 0.9 | 0.9 | ||||||
| $ | 22.0 | $ | 23.8 | $ | 45.8 | ||||
35
4. FINANCIAL EXPENSES
| | 2003 | 2002 | 2001 | |||||||
|---|---|---|---|---|---|---|---|---|---|---|
| Interest on long-term debt and convertible notes | $ | 151.8 | $ | 146.1 | $ | 173.2 | ||||
| Interest on short-term debt | 9.0 | 5.6 | 7.2 | |||||||
| Securitization fees of trade receivables | 14.5 | 15.6 | 28.9 | |||||||
| Amortization of deferred financing costs | 3.6 | 3.5 | 4.5 | |||||||
| Exchange losses (gains) | 9.2 | 3.4 | (2.2 | ) | ||||||
| Exchange loss from reduction of a net investment in a foreign operation | 5.3 | — | — | |||||||
| Loss on extinguishment of long-term debt | 30.2 | — | — | |||||||
| 223.6 | 174.2 | 211.6 | ||||||||
Interest capitalized to the cost of equipment | (2.3 | ) | (4.0 | ) | (2.8 | ) | ||||
| $ | 221.3 | $ | 170.2 | $ | 208.8 | |||||
| Cash interest payments | $ | 175.2 | $ | 165.1 | $ | 199.7 | ||||
In 2003, the Company has repurchased 89.6% of the $300 million aggregate principal amount of the 7.75% senior notes pursuant to a tender offer. The Company has also exercised its option to redeem all $257.6 million aggregate principal amount of the 8.375% senior notes. These extinguishments of long-term debt resulted in a loss of $30.2 million consisting of premium paid, write-off of discounts and deferred costs related to those transactions.
5. INCOME TAXES
The domestic and foreign components of income before income taxes are as follows:
| | 2003 | 2002 | 2001 | ||||||
|---|---|---|---|---|---|---|---|---|---|
| Domestic | $ | (11.8 | ) | $ | 5.1 | $ | 10.4 | ||
| Foreign | 22.6 | 367.9 | 128.6 | ||||||
| $ | 10.8 | $ | 373.0 | $ | 139.0 | ||||
Total income tax expense was allocated as follows:
| | 2003 | 2002 | 2001 | ||||||||
|---|---|---|---|---|---|---|---|---|---|---|---|
| Income taxes | $ | 39.1 | $ | 90.9 | $ | 52.0 | |||||
| Goodwill amortization | — | — | (5.2 | ) | |||||||
| Shareholders' equity: | |||||||||||
| Share issue expenses | — | — | (2.3 | ) | |||||||
| Dividends on preferred shares | 5.3 | 3.0 | 2.1 | ||||||||
| $ | 44.4 | $ | 93.9 | $ | 46.6 | ||||||
Income tax expense (recovery) attributable to income consists of:
| | 2003 | 2002 | 2001 | ||||||||
|---|---|---|---|---|---|---|---|---|---|---|---|
| Current: | |||||||||||
| Domestic | $ | 8.2 | $ | 3.1 | $ | 27.1 | |||||
| Foreign | 15.8 | 31.1 | 67.7 | ||||||||
| 24.0 | 34.2 | 94.8 | |||||||||
| Future: | |||||||||||
| Domestic | (12.6 | ) | (17.2 | ) | (7.1 | ) | |||||
| Foreign | 27.7 | 73.9 | (35.7 | ) | |||||||
| 15.1 | 56.7 | (42.8 | ) | ||||||||
| $ | 39.1 | $ | 90.9 | $ | 52.0 | ||||||
36
The following table reconciles the difference between the domestic statutory tax rate and the effective tax rate used by the Company in the determination of net income:
| | 2003 | 2002 | 2001 | ||||||||
|---|---|---|---|---|---|---|---|---|---|---|---|
| Domestic statutory tax rate | 35.1 | % | 37.2 | % | 40.4 | % | |||||
| Effect of foreign tax rate differences | (389.1 | ) | (14.0 | ) | (6.0 | ) | |||||
| International rates | (354.0 | ) | 23.2 | 34.4 | |||||||
Increase (reduction) resulting from: | |||||||||||
| Change in valuation allowance | 455.9 | 1.8 | 10.1 | ||||||||
| Permanent differences | (30.1 | ) | (4.7 | ) | (15.6 | ) | |||||
| Change in average tax rates on cumulative temporary differences | 258.8 | — | — | ||||||||
| Large corporation and American state taxes | 34.6 | 1.5 | 5.7 | ||||||||
| Other | (3.8 | ) | 2.6 | 2.8 | |||||||
| Effective tax rate | 361.4 | % | 24.4 | % | 37.4 | % | |||||
| Income taxes paid (received) | $ | 22.2 | $ | (3.6 | ) | $ | 114.7 | ||||
The tax effects of significant items comprising the Company's net future tax liability are as follows:
| | 2003 | 2002 | ||||||
|---|---|---|---|---|---|---|---|---|
| Future tax assets: | ||||||||
| Operating loss carryforwards | $ | 271.6 | $ | 92.4 | ||||
| Tax credit carryforwards | 25.4 | 10.8 | ||||||
| Trade receivables | 18.7 | 19.4 | ||||||
| Acquisition and restructuring reserves | 29.7 | 30.0 | ||||||
| Pension, postretirement and workers compensation benefits | 47.9 | 50.9 | ||||||
| Accrued compensation | 23.3 | 12.7 | ||||||
| Other | 99.3 | 85.3 | ||||||
| Gross future tax assets | 515.9 | 301.5 | ||||||
| Future tax liabilities: | ||||||||
| Property, plant and equipment | (457.2 | ) | (391.2 | ) | ||||
| Inventories | (44.3 | ) | — | |||||
| Capital leases | (37.7 | ) | (26.4 | ) | ||||
| Goodwill and other assets | (36.7 | ) | (17.3 | ) | ||||
| Other | (121.5 | ) | (74.6 | ) | ||||
| Gross future tax liabilities | (697.4 | ) | (509.5 | ) | ||||
| Valuation allowance | (124.0 | ) | (55.9 | ) | ||||
| Net future tax liability | (305.5 | ) | (263.9 | ) | ||||
| Less current portion of: | ||||||||
| Future tax assets | 105.8 | 27.8 | ||||||
| Future tax liabilities | (6.2 | ) | (4.5 | ) | ||||
| Future tax liability | $ | (405.1 | ) | $ | (287.2 | ) | ||
The 2003 and 2002 amounts above include a valuation allowance of $124.0 million and $55.9 million respectively, relating to loss carryforwards and other tax benefits available. The valuation allowance for future tax assets as of January 1, 2002 was $47.3 million. The net change in the total valuation allowance for the years ended December 31, 2003 and 2002 were explained by $49.4 million and $6.8 million respectively, allocated to income from operations.
37
Subsequent recognition of the tax benefits relating to the valuation allowance for future tax assets as of December 31, 2003 will be allocated as follows:
| Income tax benefit will be reported: | ||||
| In the consolidated statement of income | $ | 99.8 | ||
| As a reduction of goodwill | 24.2 | |||
| $ | 124.0 | |||
At December 31, 2003, the Company had net operating loss carryforwards for income tax purposes available to reduce future taxable income of $115.4 million, expiring from 2004 to 2018, and $381.5 million which can be carried forward indefinitely. The Company also has state net operating losses and tax credits of $189.9 million in the United States, which expire from 2005 to 2023 and federal alternative minimum tax credits of $14.6 million in the United States which can be carried forward indefinitely.
The Company has not recognized a future tax liability for the undistributed earnings of its subsidiaries in the current and prior years because the Company does not expect those unremitted earnings to reverse and become taxable to the Company in the foreseeable future. A future income taxes will be recognized when the Company expects that it will recover those undistributed earnings in a taxable manner, such as through receipt of dividends or sale of the investments. Such liability is not reasonably determinable at the present time.
6. EARNINGS (LOSS) PER SHARE
Basic earnings per share are calculated by dividing net income available to holders of equity shares by the weighted average number of equity shares outstanding during the year. Net income available to holders of equity shares is computed by subtracting dividends on the preferred shares from net income. Diluted earnings per share are calculated by using the weighted average number of equity shares outstanding adjusted to include potentially the dilutive effect of convertible notes and stock options.
The following table sets forth the computation of basic and diluted earnings per share:
| | 2003 | 2002 | 2001 | |||||||
|---|---|---|---|---|---|---|---|---|---|---|
| Net income (loss) available to holders of equity shares | $ | (67.9 | ) | $ | 250.4 | $ | 0.5 | |||
| Income impact on assumed conversion of convertible notes, net of applicable income taxes | — | 4.8 | — | |||||||
| Net income (loss) adjusted for dilution effect | $ | (67.9 | ) | $ | 255.2 | $ | 0.5 | |||
(In millions) | ||||||||||
| Weighted average number of equity shares outstanding | 136.0 | 140.7 | 142.2 | |||||||
Effect of dilutive convertible notes and stock options | — | 4.7 | 0.8 | |||||||
| Weighted average number of diluted equity shares outstanding | 136.0 | 145.4 | 143.0 | |||||||
| Earnings (loss) per share: | ||||||||||
| Basic | $ | (0.50 | ) | $ | 1.78 | $ | — | |||
| Diluted | $ | (0.50 | ) | $ | 1.76 | $ | — | |||
In 2003, diluted net loss available to holders of equity shares does not include the effects of the convertible notes and stock options as the effect of their inclusion was anti-dilutive. In 2001, diluted net income available to holders of equity shares does not include the effects of the convertible notes as the effect of their inclusion was anti-dilutive.
7. BUSINESS ACQUISITIONS AND DISPOSALS
Acquisitions
During the years ended December 31, 2003, 2002 and 2001, the Company acquired the following businesses, which have been accounted for by the purchase method, and earnings are included in the consolidated statements of income since the date of acquisition.
2003
In March 2003, the Company acquired minority interests in its Spanish operations for a cash consideration of $3.1 million, of which $2.2 million has been recorded in goodwill.
38
In May 2003, the Company also acquired minority interests in its North American operations for a cash consideration of $4.4 million, of which $3.0 million has been recorded in goodwill.
2002
In March 2002, the Company purchased all of the issued and outstanding shares of European Graphic Group S.A. ("E2G"), a subsidiary of Hachette Filipacchi Medias in France, for a cash consideration of $3.3 million. The purchase price will be adjusted by contingent considerations of a maximum of 6.1 million Euro ($7.6 million), based on achieving a specific performance level, and will be payable in 2004 and 2007. The contingent considerations, if any, will be recorded as an increase of the fixed assets. E2G owns printing and bindery facilities in France and Belgium and a 50% ownership of Bayard Hachette Routage in France. No goodwill resulted from this acquisition. The allocation purchase price process was completed as at March 31, 2003 and the effect of these adjustments did not have a significant impact on the consolidated financial statements.
During the year, the Company also acquired minority interests in North America and Europe for a cash consideration of $4.5 million for which $1.3 million was recorded in goodwill.
2001
In February 2001, the Company acquired a 70% controlling interest in Espacio Y Punto, in Spain, for a cash consideration of $8.2 million.
In March 2001, the Company acquired a 75% controlling interest in Grafica Melhoramentos, in Brazil, for a cash consideration of $3.3 million.
In March 2001, the Company also acquired minority interests in its Latin American operations for a cash consideration of $15.0 million, a convertible subordinated debenture of $6.0 million and a promissory note of $2.0 million.
In July 2001, the Company acquired all of the issued and outstanding shares of Retail Printing Corporation, in Massachusetts, United States, to expand its North American retail network for a cash consideration of $97.6 million.
In August 2001, the Company purchased the manufacturing assets of Grupo Serla, in Mexico, for a cash consideration of $13.0 million.
During the year, the Company also completed other business acquisitions complementary to its operations for a cash consideration of $1.8 million.
Goodwill recognized in those transactions amounted to $98.7 million and was assigned to the North America, Europe and Latin America segments in the amounts of $85.7 million, $8.4 million and $4.6 million, respectively.
Net assets acquired at fair value:
| | 2003 | 2002 | 2001 | |||||||
|---|---|---|---|---|---|---|---|---|---|---|
| Assets acquired: | ||||||||||
| Cash and cash equivalents | $ | — | $ | 7.5 | $ | 1.8 | ||||
| Non-cash operating working capital | — | 1.0 | 3.4 | |||||||
| Property, plant and equipment | — | 63.6 | 73.8 | |||||||
| Goodwill | 5.2 | 1.3 | 98.7 | |||||||
| Other assets | — | — | 0.8 | |||||||
| Minority interest | 2.3 | 3.2 | 7.2 | |||||||
Liabilities assumed: | ||||||||||
| Bank indebtedness | — | — | 2.3 | |||||||
| Long-term debt | — | 55.5 | 31.2 | |||||||
| Other liabilities | — | 4.8 | 0.4 | |||||||
| Future income taxes | — | 0.1 | 3.1 | |||||||
| Minority interest | — | 8.4 | — | |||||||
| Net assets acquired | $ | 7.5 | $ | 7.8 | $ | 148.7 | ||||
Consideration: | ||||||||||
| Cash | $ | 7.5 | $ | 7.8 | $ | 140.7 | ||||
| Issuance of convertible subordinated debenture and promissory note | — | — | 8.0 | |||||||
| $ | 7.5 | $ | 7.8 | $ | 148.7 | |||||
39
Asset securitization
In March 2003, the Company renewed its 1998 agreement to sell, with limited recourse, a portion of its Canadian trade receivables on a revolving basis (the "Canadian Program"). The Canadian Program limit has been increased to Cdn $135.0 million from Cdn $125.0 million. As at December 31, 2003, the amount outstanding under the Canadian Program was Cdn $132.0 million ($101.0 million) (Cdn $125.0 million ($79.7 million) as at December 31, 2002).
In 2003, the Company sold, with limited recourse, a portion of its US trade receivables on a revolving basis under the terms of a US securitization agreement dated December 1999 (the "US Program"). The US Program limit is $510.0 million. As at December 31, 2003, the amount outstanding under the US Program was $488.0 million ($435.0 million as at December 31, 2002).
In 2003, the Company also sold, with limited recourse, a portion of its French and Spanish trade receivables on a revolving basis under the terms of a European securitization agreement dated June 2001 (the "European Program"). The European Program limit is 153.0 million Euro ($190.7 million). As at December 31, 2003, the amount outstanding under the European Program was 142.5 million Euro ($177.6 million) (129.5 million Euro ($135.0 million) as at December 31, 2002).
The Company has retained the responsibility for servicing, administering and collecting trade receivables sold. No servicing asset or liability has been recorded, since the fees the Company receives for servicing the receivables approximate the related costs.
At December 31, 2003, an aggregate of $902.2 million ($747.2 million as at December 31, 2002) of accounts receivable have been sold under the three programs, of which $135.6 million ($97.5 million as at December 31, 2002) were kept by the Company as a retained interest, resulting in a net aggregate consideration of $766.6 million ($649.7 million as at December 31, 2002) on the sale. The retained interest is recorded in the Company's accounts receivable, and its fair market value approximates its cost, given the short nature of the collection period of the accounts receivable sold. The rights of the Company to the retained interest are subordinated to the rights of the investors under the programs. There is no recourse under the programs to the Company's other assets for failure of debtors to pay when due, other than the retained interest of the Company.
Securitization fees vary based on commercial paper rates in Canada, the United States and Europe and, generally, provide a lower effective funding cost than available under the Company's bank facilities.
Proceeds from revolving sales between the securitization trusts and the Company in 2003 totaled $4.7 billion ($4.5 billion in 2002).
9. INVENTORIES
| | 2003 | 2002 | ||||
|---|---|---|---|---|---|---|
| Raw materials and supplies | $ | 241.1 | $ | 234.0 | ||
| Work in process | 159.0 | 175.4 | ||||
| $ | 400.1 | $ | 409.4 | |||
40
10. PROPERTY, PLANT AND EQUIPMENT
| | Cost | Accumulated depreciation | Net book value | |||||||
|---|---|---|---|---|---|---|---|---|---|---|
| December 31, 2003 | ||||||||||
| Land | $ | 88.5 | $ | — | $ | 88.5 | ||||
| Buildings and leasehold improvements | 834.8 | 211.1 | 623.7 | |||||||
| Machinery and equipment | 3,766.8 | 1,933.9 | 1,832.9 | |||||||
| Projects under development | 35.9 | — | 35.9 | |||||||
| $ | 4,726.0 | $ | 2,145.0 | $ | 2,581.0 | |||||
| December 31, 2002 | ||||||||||
| Land | $ | 83.4 | $ | — | $ | 83.4 | ||||
| Buildings and leasehold improvements | 783.7 | 172.3 | 611.4 | |||||||
| Machinery and equipment | 3,433.6 | 1,605.7 | 1,827.9 | |||||||
| Projects under development | 87.9 | — | 87.9 | |||||||
| $ | 4,388.6 | $ | 1,778.0 | $ | 2,610.6 | |||||
As at December 31, 2003, the cost of property, plant and equipment and the corresponding accumulated depreciation balance included amounts of $386.6 million ($355.0 million as at December 31, 2002) and $233.3 million ($189.3 million as at December 31, 2002) respectively, for the assets held under capital leases. Depreciation expenses of property, plant and equipment held under capital leases amounted to $17.6 million in 2003 ($19.4 million in 2002 and $17.5 million in 2001).
11. GOODWILL
The changes in the carrying amount of goodwill for the year ended December 31, 2003 are as follows:
| | North America | Europe | Latin America | Total | ||||||||
|---|---|---|---|---|---|---|---|---|---|---|---|---|
| Balance as at December 31, 2002 | $ | 2,182.3 | $ | 324.8 | $ | 7.2 | $ | 2,514.3 | ||||
| Goodwill acquired | 3.0 | 2.2 | — | 5.2 | ||||||||
| Foreign currency changes | 6.9 | 64.1 | 0.5 | 71.5 | ||||||||
| Balance as at December 31, 2003 | $ | 2,192.2 | $ | 391.1 | $ | 7.7 | $ | 2,591.0 | ||||
12. LONG-TERM DEBT
| | Maturity | 2003 | 2002 | |||||
|---|---|---|---|---|---|---|---|---|
| Revolving bank facility $1.0 B (a) | 2004-2006 | $ | 279.3 | $ | 34.8 | |||
| Senior notes 4.875% and 6.125% (b) | 2008, 2013 | 596.8 | — | |||||
| Senior notes 8.42% and 8.52% (c) | 2010, 2012 | 250.0 | 250.0 | |||||
| Senior notes 7.20% (d) | 2006 | 250.0 | 250.0 | |||||
| Senior debentures 7.25% (e) | 2007 | 150.0 | 150.0 | |||||
| Senior debentures 6.50% (f) | 2027 | 150.0 | 150.0 | |||||
| Senior notes 8.54% and 8.69% (g) | 2015, 2020 | 121.0 | 121.0 | |||||
| Senior notes 7.75% (h) | 2009 | 30.7 | 292.8 | |||||
| Senior notes 8.375% (i) | 2008 | — | 258.5 | |||||
| Commercial paper (j) | 2004-2006 | 0.3 | 101.9 | |||||
| Other debts and capital leases (k) | 2004-2016 | 64.2 | 98.1 | |||||
| 1,892.3 | 1,707.1 | |||||||
| Less current portion | 17.9 | 38.5 | ||||||
| $ | 1,874.4 | $ | 1,668.6 | |||||
41
(a) In April 2003, the Company extended for an additional year its existing revolving bank facility. Subsequently, in November 2003, the Company restructured the facility. The new facility is comprised of three tranches. The first tranche of $250.0 million matures in 2004, while the second tranche of $250.0 million and the third tranche of $500.0 million mature in 2006. All three tranches can be extended on a yearly basis. The facility contains certain restrictions, including the obligation to maintain certain financial ratios. The facility can be used for general corporate purposes and as liquidity back-up for the Company's commercial paper program. The Company paid fees for the unused portion of $1.0 million in 2003 ($1.0 million in 2002).
The revolving bank facility bears interest at variable rates based on LIBOR or Bankers' Acceptances rates. At December 31, 2003, the drawings under this facility are denominated in Canadian and US dollars and bear interest at 3.53% and 1.92% respectively.
(b) In November 2003, the Company issued senior notes for a principal amount of $600.0 million comprised of two tranches. The first tranche of $200.0 million matures on November 15, 2008 and was issued at a discount, for a net proceed of $199.8 million. The second tranche of $400.0 million matures on November 15, 2013 and was issued at a discount, for a net proceed of $397.0 million. Issuance costs of $4.8 million have been paid on that transaction.
(c) In July 2000, the Company issued senior notes for a principal amount of $250.0 million comprised of two tranches. The first tranche of $175.0 million matures on July 15, 2010, while the second tranche of $75.0 million matures on July 15, 2012. These notes contain certain restrictions which are generally less restrictive than those of the revolving bank facility.
(d) In March 2001, the Company issued senior notes for a principal amount of $250.0 million maturing in March 2006. A portion of $33.0 million of the notes bears a floating interest rate, but has been swapped to fixed at the same rate as the coupon on the fixed rate portion (see Note 18 (c)). These notes contain certain restrictions which are generally less restrictive than those of the revolving bank facility.
(e) The senior debentures mature on January 15, 2007.
(f) The senior debentures mature on August 1, 2027 and are redeemable at the option of the holder at their par value on August 1, 2004.
(g) In September 2000, the Company issued senior notes for a principal amount of $121.0 million comprised of two tranches. The first tranche of $91.0 million matures on September 15, 2015 and the second tranche of $30.0 million matures on September 15, 2020. These notes contain certain restrictions which are generally less restrictive than those of the revolving bank facility.
(h) In November 2003, following a tender offer at a premium for 100% of the face value of $300.0 million, the Company repurchased 89.6% of the notes or $268.7 million. The aggregate principal amount of the notes, as at December 31, 2003, is $31.3 million ($300.0 million as at December 31, 2002). The remaining senior notes mature on February 15, 2009 and are redeemable at the option of the Company at a decreasing premium between February 2004 and February 2007, and thereafter at par value until their final maturity. The notes were issued by World Color Press ("WCP") and revalued in order to reflect their fair value at the time WCP was acquired based on the Company's borrowing rate for similar financial instruments. In August 2001, the Company obtained the consent from the noteholders to generally conform the restrictions on the notes with the Company's other senior public debentures. At the same time, the notes which were senior subordinated notes became senior notes.
(i) In December 2003, the Company exercised its option to redeem all of these senior notes at a premium. The notes were issued by WCP for an original aggregate principal of $300.0 million. They were subsequently revalued in order to reflect their fair value at the time WCP was acquired, based on the Company's borrowing rate for similar financial instruments. During 2000, the Company repurchased in the open market $42.4 million face value thereof. The aggregate principal amount of the notes, as at December 31, 2002 was $257.6 million.
(j) At December 31, 2003, Cdn $0.4 million ($0.3 million) (Cdn $156.4 million ($99.6 million) as at December 31, 2002) of notes in Canadian dollars were outstanding under the Commercial paper program bearing interest at 3.00%. No notes in dollars ($2.3 million as at December 31, 2002) were outstanding at December 31, 2003. The program limit is $350.0 million. At December 31, 2003, the Commercial paper program was classified as long-term, since the Company has the ability and the intent to maintain such debt on a long-term basis and has long-term bank facilities available (see (a) above) to replace such debt, if necessary.
(k) Other debts and capital leases are partially secured by assets. An amount of $29.6 million ($37.6 million as at December 31, 2002) is denominated in Euro, no debts or capital leases is denominated in British pounds ($18.9 million as at December 31, 2002), an amount of $4.2 million ($4.9 million as at December 31, 2002) in Swedish krona and an amount of $1.9 million ($1.0 million as at December 31, 2002) in Canadian dollars. At December 31, 2003, these debts and capital leases bear interest at rates ranging from 0.00% to 10.21%.
The Company was in compliance with all significant debt covenants at December 31, 2003.
42
Principal repayments on long-term debt are as follows:
| 2004 | $ | 17.9 | |
| 2005 | 11.2 | ||
| 2006 | 538.4 | ||
| 2007 | 153.9 | ||
| 2008 | 204.7 | ||
| 2009 and thereafter | 966.2 |
13. OTHER LIABILITIES
| | 2003 | 2002 | ||||
|---|---|---|---|---|---|---|
| Postretirement benefits | $ | 66.5 | $ | 65.8 | ||
| Pension liability | 42.5 | 58.3 | ||||
| Workers' compensation accrual | 18.1 | 18.3 | ||||
| Reserve for environmental matters | 16.2 | 16.3 | ||||
| Reserve for unfavourable leases acquired | 5.4 | 35.6 | ||||
| Other | 45.8 | 34.6 | ||||
| $ | 194.5 | $ | 228.9 | |||
14. CONVERTIBLE NOTES
| | Maturity | 2003 | 2002 | |||||
|---|---|---|---|---|---|---|---|---|
| Convertible senior subordinated notes 6.00% (a) | 2007 | $ | 110.7 | $ | 109.0 | |||
| Convertible subordinated debentures 7.00% (b) | 2004 | 6.0 | 6.0 | |||||
| 116.7 | 115.0 | |||||||
| Less current portion | 6.0 | — | ||||||
| $ | 110.7 | $ | 115.0 | |||||
(a) The convertible senior subordinated notes mature on October 1, 2007. The notes were issued by WCP and revalued in order to reflect their fair value at the time WCP was acquired based on the Company's borrowing rate for similar financial instruments. The equity component of the notes, which corresponds to the option of the holder to convert the notes into equity shares of the Company, was valued at the date of acquisition and classified as additionnal paid-in capital. Since the acquisition of WCP by the Company, each $1,000 tranche is convertible into 30.5884 Subordinate Voting Shares of the Company which corresponds to a price of $26.24 per share and $197.25 in cash. The notes are convertible at the option of the holder at any time, and redeemable at the option of the Company at a decreasing premium from October 2002 to the final maturity. Pursuant to the terms of the convertible notes, the Company repurchased $7.6 million of the notes in 1999 following a tender offer at par for 100% of the face value of $151.8 million. The Company subsequently repurchased notes in the open market in 2000 for the principal amount of $24.7 million thereof. The aggregate principal amount of the notes, as at December 31, 2003, was $119.5 million ($119.5 million as at December 31, 2002). The number of equity shares to be issued upon conversion of the convertible notes would be 3,656,201.
(b) In March 2001, a subsidiary of the Company issued convertible subordinated debentures maturing in May 2004. These debentures are convertible in subordinate voting shares of the Company at a conversion price of $25.00 per share. The debentures are not redeemable prior to maturity. The number of equity shares to be issued upon conversion of the debentures would be 240,000.
43
15. CAPITAL STOCK
(a) Authorized capital stock
| Equity shares: | ||
Multiple Voting Shares, authorized in an unlimited number, without par value, carrying ten votes per share, convertible at any time into Subordinate Voting Shares on a one-to-one basis. | ||
Subordinate Voting Shares, authorized in an unlimited number, without par value, carrying one vote per share. |
Preferred shares, authorized in an unlimited number, without par value, issuable in series; the number of preferred shares in each series and the related characteristics, rights and privileges are to be determined by the Board of Directors prior to each issue.
The Series 2 Cumulative Redeemable First Preferred Shares were entitled to a fixed cumulative preferential cash dividend of Cdn $1.25 per share per annum, payable quarterly from March 1, 1998 to November 30, 2002, if declared. Since then, the annual dividend represents a floating adjustable cumulative preferential cash dividend based on prime rate and payable on a monthly basis, if declared. These preferred shares are redeemable in whole but not in part, at the Company's option, since December 1, 2002, at Cdn $25.50 per share. On December 1, 2002, and at every 5th anniversary thereafter, these preferred shares may be converted into Series 3 Cumulative Redeemable First Preferred Shares under certain conditions.
The Series 3 Cumulative Redeemable First Preferred Shares are entitled to a fixed cumulative preferential cash dividend of Cdn $1.5380 per share per annum, payable quaterly from December 1, 2002 to November 30, 2007. Thereafter, a new fixed cumulative preferential cash dividend will be set by the Company for another five-year period. On December 1, 2007, and at every 5th anniversary thereafter, these preferred shares may be converted into Series 2 Cumulative Redeemable First Preferred Shares under certain conditions.
The Series 4 Cumulative Redeemable First Preferred Shares are entitled to a fixed cumulative preferential cash dividend of Cdn $1.6875 per share per annum, payable quarterly, if declared. On and after March 15, 2006, these preferred shares are redeemable at the option of the Company at Cdn $25.00, or with regulatory approval, the preferred shares may be converted into equity shares by the Company. On and after June 15, 2006, these preferred shares may be converted at the option of the holder into equity shares, subject to the right of the Company prior to the conversion date to redeem for cash or find substitute purchasers for such preferred shares.
The Series 5 Cumulative Redeemable First Preferred Shares are entitled to a fixed cumulative preferential cash dividend of Cdn $1.725 per share per annum, payable quarterly, if declared. On and after December 1, 2007, these preferred shares are redeemable at the option of the Company at Cdn $25.00, or with regulatory approval, the preferred shares may be converted into equity shares by the Company. On and after March 1, 2008, these preferred shares may be converted at the option of the holder into equity shares, subject to the right of the Company prior to the conversion date to redeem for cash or find substitute purchasers for such preferred shares.
Each series of Preferred Shares ranks on a parity with every other series of Preferred Shares.
(b) Issued and outstanding Redeemable First Preferred Shares
In December 2002, the holders of the Series 2 Cumulative Redeemable First Preferred Shares elected to convert more than 11,000,000 preferred shares into Series 3 Cumulative Redeemable First Preferred Shares. Consequently, in accordance with the Articles of the Company for these preferred shares, all remaining Series 2 Cumulative Redeemable First Preferred Shares were automatically converted into Series 3 Cumulative Redeemable First Preferred Shares.
In February 2001, the Company issued 8,000,000 Series 4 Cumulative Redeemable First Preferred Shares for a cash consideration of Cdn $200.0 million ($130.2 million) before share issue expenses of Cdn $4.8 million ($3.1 million) recorded as a reduction of retained earnings.
In August 2001, the Company issued 7,000,000 Series 5 Cumulative Redeemable First Preferred Shares for a cash consideration of Cdn $175.0 million ($113.9 million) before share issue expenses of Cdn $5.7 million ($3.7 million) recorded as a reduction of retained earnings.
44
(c) Share repurchase
In June 2003, the Company repurchased for cancellation a total of 10,000,000 Subordinate Voting Shares pursuant to its Substantial Issuer Bid dated April 24, 2003 for a net cash consideration, including redemption fees, of Cdn $241.1 million ($173.6 million). The Substantial Issuer Bid expired at midnight (Montreal time) on the evening of June 2, 2003. The excess of the price paid over the book value of the shares repurchased, amounting to $39.3 million, was charged to retained earnings.
In 2001, the Company initiated a normal course issuer bid for a maximum of 8,800,000 Subordinate Voting Shares over the period from April 6, 2001 to April 5, 2002. During 2002, under this normal course issuer bid program, the Company repurchased for cancellation 148,500 Subordinate Voting Shares for a net cash consideration of Cdn $5.2 million ($3.5 million). As at December 31, 2001, the Company repurchased for cancellation 3,543,700 Subordinate Voting Shares for a net cash consideration of Cdn $143.8 million ($98.2 million).
In 2000, the Company initiated a normal course issuer bid for a maximum of 8,000,000 Subordinate Voting Shares over the period from April 6, 2000 to April 5, 2001. During 2001, under this normal course issuer bid program, the Company had repurchased for cancellation 3,188,492 Subordinate Voting Shares for a net cash consideration of Cdn $114.9 million ($79.2 million). As at December 31, 2000, the Company had repurchased for cancellation 1,751,508 Subordinate Voting Shares for a net cash consideration of Cdn $59.2 million ($41.6 million).
16. STOCK-BASED COMPENSATION PLANS
(a) Employee share plans
The Employee Stock Purchase Plan gives eligible employees in the United States the opportunity to acquire shares of the Company's capital stock for up to 4% of their gross salaries and to have the Company contribute, on the employees' behalf, a further amount equal to 17.5% of the total amount invested by the employee. The number of shares that may be issued and sold under the plan is limited to 2,000,000 Subordinate Voting Shares, subject to adjustments in the event of stock dividends, stock splits and similar events. At December 31, 2003, 6,559 employees (6,199 as at December 31, 2002 and 6,372 as at December 2001) were participating in the plan. The total number of plan shares issued on behalf of employees, including the Company's contribution, was 600,310 in 2003, (468,267 in 2002 and 270,843 in 2001) which represents compensation expenses amounting to $1.9 million in 2003 ($1.6 million in 2002 and $1.0 million in 2001).
The Employee Share Investment Plan gives eligible employees in Canada the opportunity to subscribe for up to 4% of their gross salaries to purchase shares of the Company's capital stock and to have the Company invest, on the employee's behalf, a further 20% of the amount invested by the employee. The number of shares that may be issued and sold under this plan is limited to 3,000,000 Subordinate Voting Shares, subject to adjustments in the event of stock dividends, stock splits and similar events. At December 31, 2003, 2,281 employees (2,249 at December 31, 2002 and 2,072 at December 2001) were participating in the plan. The total number of shares issued on behalf of employees, including the Company's contribution, was 179,189 in 2003, (117,162 in 2002 and 120,494 in 2001), which represents compensation expenses amounting to $0.6 million in 2003 ($0.4 million in 2002 and $0.4 million in 2001).
(b) Stock option plans
Under stock option plans, a total of 7,575,159 Subordinate Voting Shares have been reserved for plan participants. As of December 31, 2003, the number of Subordinate Voting Shares related to the stock options outstanding was 3,699,061. The subscription price was usually equal to the share market price at the date the options were granted. The options vest over either four or five years. The options may be exercised during a period not exceeding ten years from the date they have been granted.
The number of stock options outstanding fluctuated as follows:
| | 2003 | 2002 | 2001 | ||||||||||||
|---|---|---|---|---|---|---|---|---|---|---|---|---|---|---|---|
| | Options | Weighted average exercise price | Options | Weighted average exercise price | Options | Weighted average exercise price | |||||||||
| Balance, beginning of year | 3,525,376 | $ | 20.42 | 4,563,330 | $ | 20.07 | 4,297,478 | $ | 19.73 | ||||||
| Issued | 916,911 | 22.54 | 474,321 | 22.51 | 651,276 | 22.01 | |||||||||
| Exercised | (27,346 | ) | 13.93 | (525,069 | ) | 16.77 | (385,424 | ) | 12.91 | ||||||
| Cancelled | (715,880 | ) | 23.01 | (987,206 | ) | 22.33 | — | — | |||||||
| Balance, end of year | 3,699,061 | $ | 22.52 | 3,525,376 | $ | 20.42 | 4,563,330 | $ | 20.07 | ||||||
| Options exercisable, end of year | 1,939,486 | $ | 22.21 | 1,271,529 | $ | 19.54 | 2,444,969 | $ | 19.05 | ||||||
45
The following table summarizes information about stock options outstanding and exercisable at December 31, 2003:
| | Options outstanding | Options exercisable | ||||||||||
|---|---|---|---|---|---|---|---|---|---|---|---|---|
| Range of exercise prices | Number outstanding | Weighted average remaining contractual life (in years) | Weighted average exercise price | Number exercisable | Weighted average exercise price | |||||||
| $11 - $15 | 72,671 | 0.71 | $ | 12.28 | 72,671 | $ | 12.28 | |||||
| $15 - $18 | 362,080 | 5.87 | 16.93 | 217,080 | 17.14 | |||||||
| $18 - $21 | 564,636 | 4.27 | 20.47 | 314,636 | 20.18 | |||||||
| $21 - $24 | 1,468,180 | 7.13 | 22.55 | 646,513 | 22.42 | |||||||
| $24 - $29 | 1,231,494 | 6.34 | 25.67 | 688,586 | 25.60 | |||||||
| 3,699,061 | 6.27 | $ | 22.52 | 1,939,486 | $ | 22.21 | ||||||
Prior to January 1, 2003, the Company used the settlement based method for its stock-based compensation plans. Had compensation cost been determined using the fair value based method at the date of grant for awards granted in 2002 under all plans, the Company's pro forma net income (loss), earnings (loss) per share and diluted earnings (loss) per share would have been as presented in the table below.
| | 2003 | 2002 | |||||
|---|---|---|---|---|---|---|---|
| Pro forma net income (loss) | $ | (31.8 | ) | $ | 278.8 | ||
| Pro forma earnings (loss) per share: | |||||||
| Basic | $ | (0.50 | ) | $ | 1.78 | ||
| Diluted | $ | (0.50 | ) | $ | 1.75 | ||
The pro forma disclosure omits the effect of awards granted before January 1, 2002. These pro forma amounts include a compensation cost calculated using the Black-Scholes option pricing model with the following assumptions.
| Weighted-average grant date fair value of options | $4.86 | ||
| Assumptions: | |||
| Risk-free interest rate | 4.48% - 5.07% | ||
| Dividend yield | 2% | ||
| Expected volatility | 25% | ||
| Expected life | 7 years | ||
(c) Deferred Stock Unit Plan
The deferred stock unit plan ("DSU plan") is for the benefit of the Company's directors. Under the DSU plan, a portion of each director's compensation package is received in the form of units. The value of a unit is based on the weighted average trading price of the Subordinate Voting Shares. Subject to certain limitations, the units will be redeemed by the Company when the director ceases to be a DSU participant. For the purpose of redeeming units, the value of a unit shall correspond to the fair market value of a Subordinate Voting Share on the date of redemption.
As of December 31, 2003, the number of units outstanding under this plan was 83,972 (31,260 in 2002), which represents compensation expenses amounting to $0.9 million in 2003 ($0.7 million in 2002).
17. TRANSLATION ADJUSTMENT
The change in the translation adjustment included in shareholders' equity is the result of the fluctuation of the exchange rates on translation of net assets of self-sustaining foreign operations, exchange gains or losses on intercompany account balances that form part of the net investments and foreign exchange gains or losses related to derivative financial instruments used to hedge the net investments.
46
18. FINANCIAL INSTRUMENTS AND CONCENTRATIONS OF CREDIT RISK
(a) Fair value of financial instruments
The carrying values of cash and cash equivalents, trade receivables, receivables from related parties, bank indebtedness, trade payables and accrued liabilities approximate their fair values because of the short-term nature of these items.
The following table summarizes the book value and fair value at December 31, 2003 and 2002 of those financial instruments having a fair value different from their book value as at December 31. The fair values of the financial liabilities are estimated based on discounted cash flows using year-end market yields of similar instruments having the same maturity. The fair values of the derivative financial instruments are estimated using year-end market rates, and reflect the amount that the Company would receive or pay if the instruments were closed out at these dates.
| | 2003 | 2002 | ||||||||||||
|---|---|---|---|---|---|---|---|---|---|---|---|---|---|---|
| | Book Value | Fair Value | Book Value | Fair Value | ||||||||||
| Financial liabilities | ||||||||||||||
| Long-term debt(1) | $ | (1,892.3 | ) | $ | (2,005.9 | ) | $ | (1,707.1 | ) | $ | (1,861.5 | ) | ||
| Convertible notes(1) | (116.7 | ) | (127.4 | ) | (115.0 | ) | (123.8 | ) | ||||||
| Derivative financial instruments (Gain (loss)) | ||||||||||||||
| Interest rate swap agreements | — | (3.2 | ) | — | (8.2 | ) | ||||||||
| Foreign exchange forward contracts | 42.6 | 73.3 | — | (8.9 | ) | |||||||||
| Cross currency interest rate swaps | (47.2 | ) | (54.2 | ) | — | (29.7 | ) | |||||||
| Commodity swaps | — | 1.0 | — | — | ||||||||||
- (1)
- Including current portion
(b) Foreign exchange risk management
The Company enters into foreign exchange forward contracts and cross-currency swaps to set the exchange rate for foreign denominated sales and related receivables and to manage its foreign exchange exposure on net investments and foreign denominated assets. The amounts of outstanding contracts at year-end, presented by currency, are included in the tables below:
- (i)
- Foreign exchange forward contracts
| | 2003 | 2002 | |||||||||
|---|---|---|---|---|---|---|---|---|---|---|---|
| Currencies (sold / bought) | Notional amounts(2) | Average rate(3) | Notional amounts(2) | Average rate(3) | |||||||
| $/ Cdn $ | |||||||||||
| Less than 1 year | $ | 129.1 | 0.6666 | $ | 116.2 | 0.6528 | |||||
| Between 1 and 3 years | 261.7 | 0.6263 | 141.9 | 0.6269 | |||||||
| Between 3 and 5 years | 133.9 | 0.6219 | 249.3 | 0.6213 | |||||||
| Euro / $ | |||||||||||
| Less than 1 year | 94.0 | 0.8084 | 30.6 | 0.9944 | |||||||
| SEK / $ | |||||||||||
| Less than 1 year | 15.7 | 7.3237 | 12.9 | 8.9188 | |||||||
| GBP / Euro | |||||||||||
| Less than 1 year | 19.4 | 0.7058 | 6.4 | 0.6370 | |||||||
| Between 1 and 3 years | 1.4 | 0.7166 | — | — | |||||||
| Other | |||||||||||
| Less than 1 year | 17.7 | — | 31.9 | — | |||||||
| Between 1 and 3 years | 0.5 | — | — | — | |||||||
| $ | 673.4 | $ | 589.2 | ||||||||
- (2)
- Transactions in foreign currencies translated into dollars using the closing exchange rate as at December 31, 2003 and 2002.
- (3)
- Rates are expressed as the number of units of the currency sold for one unit of the currency bought.
47
- (ii)
- Cross-currency swaps
| | 2003 | 2002 | |||||||||
|---|---|---|---|---|---|---|---|---|---|---|---|
| Currencies (sold / bought) | Notional amounts(1) | Average rate(2) | Notional amounts(1) | Average rate(2) | |||||||
| Euro / $ | |||||||||||
| Less than 1 year | $ | 98.3 | 1.0440 | $ | 70.5 | 1.0760 | |||||
| Between 1 and 3 years | 91.9 | 0.9521 | 119.8 | 1.0961 | |||||||
| SEK / $ | |||||||||||
| Less than 1 year | 21.5 | 8.8565 | 14.2 | 10.5606 | |||||||
| Between 1 and 2 years | — | — | 16.2 | 9.2375 | |||||||
| $ | 211.7 | $ | 220.7 | ||||||||
- (1)
- Transactions in foreign currencies translated into dollars using the closing exchange rate as at December 31, 2003 and 2002.
- (2)
- Rates are expressed as the number of units of the currency sold for one unit of the currency bought.
(c) Interest rate risk management
The Company has entered into interest rate swaps to manage its interest rate exposure. The Company is committed to exchange, at specific intervals, the difference between the fixed and floating interest rate calculated by reference to the notional amounts.
The amounts of outstanding contracts at December 31, 2003 are included in the table below:
| Maturity | Notional amount | Pay/Receive | Fixed Rate | Floating Rate | |||||
|---|---|---|---|---|---|---|---|---|---|
| March 2006 | $ | 33.0 | Company pays fixed/receives floating | 7.20% | Libor 3 months/plus 1.36% | ||||
The amounts of outstanding contracts at December 31, 2002 are included in the table below:
| Maturity | Notional amount | Pay/Receive | Fixed Rate | Floating Rate | |||||
|---|---|---|---|---|---|---|---|---|---|
| Less than 1 year | $ | 550.0 | Company pays fixed/receives floating | 1.67 - 5.30% | Libor 1 month/Libor 3 months | ||||
| March 2006 | $ | 33.0 | Company pays fixed/receives floating | 7.20% | Libor 3 months/plus 1.36% | ||||
(d) Commodity risk
The Company has entered into commodity swap agreements to manage a portion of its North American natural gas exposure. The Company is committed to exchange, on a monthly basis, the difference between a fixed price and a floating natural gas price index calculated by reference to the notional amounts.
The amounts of outstanding contracts at year-end are included in the table below:
| | 2003 | 2002 | |||||||||
|---|---|---|---|---|---|---|---|---|---|---|---|
| Countries / Unit | Notional quantity | Average price(1) | Notional quantity | Average price(1) | |||||||
| Canada / Gigajoules | |||||||||||
| Less than 1 year | 0.3 | $ | 4.42 | 0.3 | $ | 3.84 | |||||
| US / MMBTU | |||||||||||
| Less than 1 year | 2.2 | $ | 5.09 | — | $ | — | |||||
- (1)
- Transactions in foreign currencies translated into dollars using the closing exchange rate as at December 31, 2003 and 2002.
48
(e) Credit risk
The Company is exposed to credit losses resulting from defaults by counterparties when using financial instruments.
When the Company enters into derivative financial instruments, the counterparties are international and Canadian banks having a minimum credit rating of A- by Standard & Poor's or of A3 by Moody's and are subject to concentration limits. The Company does not foresee any failure by the counterparties in meeting their obligations.
The Company, in the normal course of business, continuously monitors the financial condition of its customers and reviews the credit history of each new customer. At December 31, 2003, no customer balance represents a significant portion of the Company's consolidated trade receivables. The Company establishes an allowance for doubtful accounts that corresponds to the specific credit risk of its customers, historical trends and other information on the state of the economy.
The Company believes that the product and geographic diversity of its customer base is instrumental in reducing its credit risk, as well as the impact on the Company of fluctuations in local market or product-line demand. The Company has long-term contracts with most of its largest customers. These contracts usually include price adjustment clauses based on the cost of paper, ink and labor. The Company does not believe that it is exposed to an unusual level of customer credit risk.
19. COMMITMENTS AND CONTINGENCIES
(a) Leases
The Company rents premises and machinery and equipment under operating leases which expire at various dates up to 2016 and for which minimum lease payments total $448.6 million.
Annual minimum payments under these leases are as follows:
| 2004 | $ | 100.8 | |
| 2005 | 84.1 | ||
| 2006 | 68.1 | ||
| 2007 | 51.8 | ||
| 2008 | 36.2 | ||
| 2009 and thereafter | 107.6 |
Rental expenses for operating leases were $89.1 million, $91.4 million and $83.0 million for the years 2003, 2002 and 2001.
(b) Machinery and equipment
As at December 31, 2003, the Company had commitments to purchase equipment for a total value of approximately $11 million.
(c) Environment
The Company is subject to various laws, regulations and government policies principally in North America and Europe, relating to health and safety, to the generation, storage, transportation, disposal and environmental emissions of various substances, and to environment protection in general. The Company believes it is in compliance with such laws, regulations and government policies, in all material respects. Furthermore, the Company does not anticipate that maintaining compliance with such environmental statutes will have a material adverse effect upon the Company's competitive or consolidated financial position.
(d) Business acquisitions
The Company signed a binding agreement to purchase, in September 2004, the remaining 50% of Helio Charleroi in Belgium, a subsidiary of European Graphic Group, SA. The transaction should amount to 24.9 million Euro ($31.0 million), adjusted by a contingent consideration based on achieving a specific performance level over the period ending September 2004.
49
20. RELATED PARTY TRANSACTIONS
The Company entered into the following transactions, at prices and conditions prevailing on the market, with related parties (the parent company and its other subsidiaries) and were accounted for using the amount of cash consideration:
| | 2003 | 2002 | 2001 | ||||||
|---|---|---|---|---|---|---|---|---|---|
| Revenues | $ | 42.5 | $ | 38.0 | $ | 32.0 | |||
| Purchases | 2.2 | 1.0 | 1.7 | ||||||
| Management fees billed by Quebecor Inc. | 3.9 | 3.5 | 3.8 | ||||||
During the year, the Company transferred the benefit of a deduction for Part VI.I tax to subsidiaries of its parent company for a consideration of Cdn $11.4 million ($8.7 million), (Cdn $9.9 million ($6.4 million) in 2002) recorded in receivables from related parties. This reduced the Company's available future income tax assets by Cdn $10.8 million ($8.3 million), (Cdn $11.5 million ($7.4 million) in 2002), and increased the additional paid-in capital by Cdn $0.6 million ($0.4 million) (decrease of Cdn $1.6 million ($1.0 million) in 2002). The transaction was recorded at the carrying amount.
21. PENSION AND OTHER POSTRETIREMENT BENEFITS
The Company maintains defined benefit and contribution pension plans for its employees. The Company's policy is to maintain its contribution at a level sufficient to cover benefits. Actuarial valuations of the Company's various pension plans were performed during the last three years.
The Company provides postretirement benefits to eligible employees. The costs of these benefits, which are principally health care, are accounted for during employees' active service period.
The following table is based on a September 30th measurement date. The table provides a reconciliation of the changes in the plan's benefit obligations and fair value of plan assets for the fiscal years ended December 31, 2003 and December 31, 2002 and a statement of the funded status as at December 31, 2003 and December 31, 2002:
| | Pension Benefits | Postretirement Benefits | ||||||||||||
|---|---|---|---|---|---|---|---|---|---|---|---|---|---|---|
| | 2003 | 2002 | 2003 | 2002 | ||||||||||
| Changes in benefit obligations | ||||||||||||||
| Benefit obligation, beginning of year | $ | 809.5 | $ | 731.5 | $ | 92.3 | $ | 77.0 | ||||||
| Service cost | 35.4 | 31.5 | 1.3 | 0.9 | ||||||||||
| Interest cost | 54.5 | 52.3 | 6.0 | 5.3 | ||||||||||
| Plan participants' contributions | 5.0 | 4.4 | 2.1 | 2.2 | ||||||||||
| Plan amendments | 2.4 | 6.4 | — | (0.7 | ) | |||||||||
| Curtailment gain | (0.4 | ) | — | — | — | |||||||||
| Acquisitions | — | 1.6 | — | — | ||||||||||
| Actuarial loss | 85.0 | 33.6 | 6.1 | 16.5 | ||||||||||
| Benefits paid | (59.4 | ) | (58.2 | ) | (8.4 | ) | (9.0 | ) | ||||||
| Foreign currency changes | 39.0 | 6.4 | 0.9 | 0.1 | ||||||||||
| Benefit obligation, end of year | $ | 971.0 | $ | 809.5 | $ | 100.3 | $ | 92.3 | ||||||
| Changes in plan assets | ||||||||||||||
| Fair value of plan assets, beginning of year | $ | 404.1 | $ | 481.9 | $ | — | $ | — | ||||||
| Actual return on plan assets | 64.9 | (52.8 | ) | — | — | |||||||||
| Employer contributions | 41.2 | 24.6 | 6.3 | 6.8 | ||||||||||
| Plan participants' contributions | 5.0 | 4.4 | 2.1 | 2.2 | ||||||||||
| Transfer / Adjustment | 1.4 | — | — | — | ||||||||||
| Benefits paid | (59.4 | ) | (58.2 | ) | (8.4 | ) | (9.0 | ) | ||||||
| Foreign currency changes | 23.6 | 4.2 | — | — | ||||||||||
| Fair value of plan assets, end of year | $ | 480.8 | $ | 404.1 | $ | — | $ | — | ||||||
50
| | Pension Benefits | Postretirement Benefits | ||||||||||||
|---|---|---|---|---|---|---|---|---|---|---|---|---|---|---|
| | 2003 | 2002 | 2003 | 2002 | ||||||||||
| Reconciliation of funded status | ||||||||||||||
| Funded status | $ | (490.2 | ) | $ | (405.4 | ) | $ | (100.3 | ) | $ | (92.3 | ) | ||
| Unrecognized net transition asset | (5.1 | ) | (5.1 | ) | — | — | ||||||||
| Unrecognized prior service cost (benefit) | 19.9 | 13.6 | (0.6 | ) | (0.6 | ) | ||||||||
| Unrecognized actuarial loss | 401.9 | 330.6 | 28.5 | 23.9 | ||||||||||
| Adjustment for fourth quarter contributions | 47.0 | 19.8 | 1.7 | 1.7 | ||||||||||
| Net amount recognized | $ | (26.5 | ) | $ | (46.5 | ) | $ | (70.7 | ) | $ | (67.3 | ) | ||
Included in the above benefit obligation and fair value of plan assets at year-end are the following amounts in respect of plans that are not fully funded:
| | Pension Benefits | Postretirement Benefits | |||||||||||
|---|---|---|---|---|---|---|---|---|---|---|---|---|---|
| | 2003 | 2002 | 2003 | 2002 | |||||||||
| Benefit obligation | $ | (971.0 | ) | $ | (809.5 | ) | $ | (100.3 | ) | $ | (92.3 | ) | |
| Fair value of plan assets | 480.8 | 404.1 | — | — | |||||||||
| Funded status — plan deficit | $ | (490.2 | ) | $ | (405.4 | ) | $ | (100.3 | ) | $ | (92.3 | ) | |
The following table provides the amounts recognized in the consolidated balance sheets:
| | Pension Benefits | Postretirement Benefits | |||||||||||
|---|---|---|---|---|---|---|---|---|---|---|---|---|---|
| | 2003 | 2002 | 2003 | 2002 | |||||||||
| Accrued benefit liability (1) | $ | (63.0 | ) | $ | (77.7 | ) | $ | (70.7 | ) | $ | (67.3 | ) | |
| Prepaid benefit costs (2) | 36.5 | 31.2 | — | — | |||||||||
| Net amount recognized | $ | (26.5 | ) | $ | (46.5 | ) | $ | (70.7 | ) | $ | (67.3 | ) | |
- (1)
- Current portion recorded as accrued liabilities and long-term portion recorded as other liabilities.
- (2)
- Included in other assets.
51
The following table provides the components of net periodic benefit cost:
| | Pension Benefits | Postretirement Benefits | ||||||||||||||||||
|---|---|---|---|---|---|---|---|---|---|---|---|---|---|---|---|---|---|---|---|---|
| | 2003 | 2002 | 2001 | 2003 | 2002 | 2001 | ||||||||||||||
| Defined benefit plans | ||||||||||||||||||||
| Service cost | $ | 35.4 | $ | 31.5 | $ | 25.0 | $ | 1.3 | $ | 0.9 | $ | 0.8 | ||||||||
| Interest cost | 54.5 | 52.3 | 48.5 | 6.0 | 5.3 | 5.4 | ||||||||||||||
| Expected return on plan assets | (50.1 | ) | (50.6 | ) | (58.1 | ) | — | — | — | |||||||||||
| Amortization of transitional assets | (0.7 | ) | (0.6 | ) | (0.6 | ) | — | — | — | |||||||||||
| Amortization of prior service cost (benefit) | — | — | 0.3 | (0.1 | ) | (0.6 | ) | (0.4 | ) | |||||||||||
| Amortization of actuarial loss (gain) | 5.4 | 2.5 | (0.9 | ) | 1.4 | 0.2 | — | |||||||||||||
| Curtailment loss (gain) | 2.1 | — | 0.9 | — | — | (0.4 | ) | |||||||||||||
| Valuation allowance | — | (0.1 | ) | (0.9 | ) | — | — | — | ||||||||||||
| Net periodic cost | 46.6 | 35.0 | 14.2 | 8.6 | 5.8 | 5.4 | ||||||||||||||
| Defined contribution plans | 11.8 | 13.8 | 15.7 | — | — | — | ||||||||||||||
| Total periodic benefit cost | $ | 58.4 | $ | 48.8 | $ | 29.9 | $ | 8.6 | $ | 5.8 | $ | 5.4 | ||||||||
The weighted average assumptions used in the measurement of the Company's benefit obligation are as follows:
| | Pension Benefits | Postretirement Benefits | ||||||||||
|---|---|---|---|---|---|---|---|---|---|---|---|---|
| | 2003 | �� | 2002 | 2001 | 2003 | 2002 | 2001 | |||||
| Discount rate | 6.0% | 6.7% | 7.0% | 6.0% | 6.8% | 7.2% | ||||||
| Expected return on plan assets | 8.2% | 8.2% | 9.7% | — | — | — | ||||||
| Rate of compensation increase | 3.5% | 3.4% | 3.4% | — | — | — | ||||||
The assumed health care cost trend rate used in measuring the accumulated postretirement benefit obligation was 10.2% at the end of 2003 (8.7% at the end of 2002) and is expected to decrease gradually to 5% in 2009 and remain at that level thereafter. A one percentage point change in assumed health care cost trend would have the following effects:
| | Postretirement benefits | ||||||
|---|---|---|---|---|---|---|---|
| Sensitivity analysis | |||||||
| 1% increase | 1% decrease | ||||||
| Effect on service and interest costs | $ | 0.6 | $ | (0.5 | ) | ||
| Effect on benefit obligation | 7.3 | (6.3 | ) | ||||
52
22. SIGNIFICANT DIFFERENCES BETWEEN GENERALLY ACCEPTED ACCOUNTING PRINCIPLES IN CANADA AND THE UNITED STATES
The Company's consolidated financial statements have been prepared in accordance with Canadian generally accepted accounting principles ("GAAP"), which differ in some respects from those applicable in the United States. The following are the significant differences in accounting principles as they pertain to the consolidated financial statements.
(a) Reconciliation of net income (loss) and earnings (loss) per share and presentation of financial statements
The application of GAAP in the United States would have the following effects on net income as reported:
| | 2003 | 2002 | 2001 | ||||||||
|---|---|---|---|---|---|---|---|---|---|---|---|
Net income (loss), as reported in the consolidated statements of income per GAAP in Canada | $ | (31.4 | ) | $ | 279.3 | $ | 22.4 | ||||
| Adjustments before income taxes: | |||||||||||
| Stock-based compensation (a) (i) | (1.9 | ) | 2.1 | 0.1 | |||||||
| Convertible senior subordinated notes (a) (ii) | 2.4 | 2.3 | — | ||||||||
| Hedge accounting (a) (iv) | 23.6 | — | — | ||||||||
| 24.1 | 4.4 | 0.1 | |||||||||
Income taxes (a) (i) (iv) (v) | (7.9 | ) | (0.6 | ) | (0.4 | ) | |||||
| Asset retirement obligations, net of income taxes of $0.8 (a) (v) | (1.2 | ) | — | — | |||||||
| Net adjustments | 15.0 | 3.8 | (0.3 | ) | |||||||
| Net income (loss), as adjusted per GAAP in the United States | $ | (16.4 | ) | $ | 283.1 | $ | 22.1 | ||||
| Net income available to holders of preferred shares | 36.5 | 28.9 | 21.9 | ||||||||
| Net income (loss) per GAAP in the United States available to holders of equity shares | (52.9 | ) | 254.2 | 0.2 | |||||||
Income impact on assumed conversion of convertible notes, net of applicable income taxes | — | 3.8 | — | ||||||||
| Net income (loss) per GAAP in the United States adjusted for dilution effect | $ | (52.9 | ) | $ | 258.0 | $ | 0.2 | ||||
| Weighted average number of equity shares outstanding (in millions): | |||||||||||
| Basic | 136.0 | 140.7 | 142.2 | ||||||||
| Diluted | 136.0 | 145.4 | 143.0 | ||||||||
| Earnings (loss) per share as adjusted per GAAP in the United States: | |||||||||||
| Basic | $ | (0.39 | ) | $ | 1.81 | $ | — | ||||
| Diluted | $ | (0.39 | ) | $ | 1.77 | $ | — | ||||
53
(i) Stock-based compensation
Under GAAP in the United States, prior to fiscal 2003, in accordance with the provisions of Statement of Financial Accounting Standards ("SFAS") No. 123, "Accounting for stock-based compensation", the Company applied Accounting Principles Board Opinion No. 25, "Accounting for stock issued to employees" (APB 25) and related interpretations in accounting for its employee share plans and stock option plans. Effective January 1, 2003, the Company changed its method of accounting for stock-based compensation and decided to use the fair value based method of accounting for all its stock-based compensation plans. In accordance with the provisions of SFAS No.148, "Accounting for Stock-Based Compensation — Transition and Disclosure, an amendment of SFAS No.123", the Company adopted these changes using the prospective method. This adoption of SFAS no.123 and No.148 harmonizes accounting standards with CICA Handbook Section 3870.
Employee stock purchase plan in the United States:
Under the provisions of APB 25, applied by the Company prior to fiscal 2003, an Employee Share Plan was accounted for as non-compensatory. Under GAAP in Canada, the Company's contributions were accounted for as compensation expenses.
Stock option plans:
The Company awarded in 1999 a special performance grant to certain executives. Under the provisions of APB 25, which the Company applied prior to fiscal 2003, those grants were accounted for as a variable plan. Compensation costs of this grant are still recognized over the vesting period. There were no similar requirements under GAAP in Canada.
(ii) Convertible senior subordinated notes
Under GAAP in Canada, the equity component of the convertible notes is recorded under shareholders' equity as additional paid-in capital. The difference between the carrying amount of the debt component and its face value is amortized as imputed interest to income over the life of the convertible senior subordinated note. Regarding the repurchase of convertible notes, the Company is required to allocate the consideration paid on extinguishment to the liability and equity components of the convertible notes based on their fair values at the date of the transaction. The amount of gain (loss) relating to the liability element is recorded to income and the difference between the carrying amount and the amount considered to be settled relating to the conversion option element is treated as an equity transaction. Under GAAP in the United States, the allocation to equity is not permitted, no imputed interest is needed in relation to the equity component and the gain (loss) on repurchase is recorded through income in the period of extinguishment.
(iii) Presentation of goodwill amortization
Under GAAP in Canada, prior to fiscal 2002, goodwill amortization was presented, net of related income taxes, and was excluded from the calculation of operating income. Under GAAP in the United States, goodwill amortization was included in the computation of operating income and was presented as an operating expense. For the year 2002 and onward, the Company adopted the new CICA accounting standard related to goodwill and other intangible assets (see notes 1(i) and 11). Under the new accounting standard, goodwill is not amortized. This new CICA accounting standard harmonizes with SFAS No. 142 "Goodwill and Other Intangible Assets" ("SFAS 142") effective January 1, 2002.
(iv) Accounting for derivative instruments and hedging activities
Effective since January 1, 2001, the Company adopted Statement of Financial Accounting Standards No. 133, "Accounting for Derivative Instruments and Hedging Activities", as amended (SFAS 133). SFAS 133 establishes accounting and reporting standards for derivative instruments and hedging activities and requires that all derivatives be recorded as either assets or liabilities in the balance sheet at fair value. In order to apply hedge accounting under SFAS 133, hedging relationships must be formally documented and highly effective at offsetting changes in hedged items.
The Company did not apply the hedge accounting under SFAS No.133 for some foreign exchange forward contracts and cross currency swaps that hedge anticipated foreign denominated sales and the related receivables, and foreign denominated asset exposures, under GAAP in the United States during 2003. However, the Company considers those derivative instruments to be effective foreign currency risk management tools and economic hedges of the changes attributable to the foreign currencies in which the forecasted transactions and assets are denominated. Under GAAP in Canada, hedge accounting was applied to all such transactions.
54
(v) Asset retirement obligations
Effective January 1, 2003, the Company adopted Statement of Financial Accounting Standards No. 143, "Accounting for Asset Retirement Obligations", (SFAS 143), which addresses financial accounting for legal obligations associated with the retirement of tangible long-lived assets and the associated asset retirement costs. SFAS 143 requires the recognition of the fair value of a liability for an asset retirement obligation in the period in which it is incurred. When a liability is initially recorded, the cost is capitalized by increasing the carrying amount of the related long-lived asset. Over time, the liability is increased each period to reflect an interest element considered in its initial measurement at fair value, and the capitalized cost is amortized over the useful life of the related asset. Under GAAP in Canada, such accounting for asset retirement obligations is not required.
(b) Effect on consolidated balance sheets
The application of GAAP in the United States would have the following effects on the consolidated balance sheets, as reported:
| | 2003 | 2002 | ||||||||||||
|---|---|---|---|---|---|---|---|---|---|---|---|---|---|---|
| | Canada | United States | Canada | United States | ||||||||||
| Assets | ||||||||||||||
| Future income taxes (a) (iv) (b) (i) | $ | 105.8 | $ | 106.7 | $ | 27.8 | $ | 31.0 | ||||||
| Prepaid expenses (a) (iv) (b) (i) | 17.4 | 33.0 | 25.2 | 25.7 | ||||||||||
| Property, plant and equipment, net (a) (v) | 2,581.0 | 2,582.7 | 2,610.6 | 2,610.6 | ||||||||||
| Other assets (a) (iv) (b) (i) (ii) | 133.8 | 175.2 | 113.3 | 133.6 | ||||||||||
Liabilities and Sharesholders' Equity | ||||||||||||||
| Accrued liabilities (a) (iv) (b) (i) | 552.5 | 607.5 | 485.8 | 506.5 | ||||||||||
| Other liabilities (a) (iv) (v) (b) (i) (ii) | 194.5 | 482.7 | 228.9 | 510.5 | ||||||||||
| Future income taxes (a) (i) (iv) (v) (b) (i) (ii) | 405.1 | 294.7 | 287.2 | 203.2 | ||||||||||
| Convertible Notes (a) (ii) | 110.7 | 121.8 | 115.0 | 128.5 | ||||||||||
| Capital stock (b) (iii) | 1,693.1 | 1,662.1 | 1,813.9 | 1,780.2 | ||||||||||
| Additional paid-in capital (a) (i) (ii) | 105.9 | 89.8 | 103.6 | 86.2 | ||||||||||
| Retained earnings (a) (i) (ii)(iv)(v) (b) (i) (iii) | 723.6 | 773.2 | 901.9 | 939.1 | ||||||||||
| Translation adjustment (c) | (19.2 | ) | — | (115.6 | ) | — | ||||||||
| Accumulated other comprehensive income (loss) (a) (iv) (b) (i) (ii) (c) | — | (206.0 | ) | — | (309.5 | ) | ||||||||
(i) Accounting for derivative instruments and hedging activities
Effective since January 1, 2001, the Company adopted Statement of Financial Accounting Standards No. 133, "Accounting for Derivative Instruments and Hedging Activities", as amended (SFAS 133). The Company recorded the cumulative effect of change in other comprehensive income (loss) upon the adoption of SFAS 133 in 2001.
The Company utilizes interest rate and commodity SWAP to enhance its ability to manage risk relating to cash flow exposure. On the earlier of the date into which the derivative contract is entered or the date of transaction, the Company designates the derivative as a hedge. Changes in the derivative fair values of contracts that are designated effective and qualify as cash flow hedges are deferred and recorded as a component of accumulated other comprehensive income (loss) until the underlying transaction is recorded in earnings. When the hedged item affects earnings, gains or losses are reclassified from accumulated other comprehensive income (loss) to the consolidated statement of income on the same line as the underlying transaction. The ineffective portion of a hedging derivative's change in fair value is recognized immediately in earnings.
Under GAAP in Canada, these derivative financial instruments are accounted for on an accrual basis. Realized and unrealized gains and losses are deferred and recognized in income in the same period and in the same financial statement category as the income or expense arising from the corresponding hedged positions.
55
(ii) Pension and postretirement plans
GAAP in the United States requires recognition of an additional minimum liability that is at least equal to the unfunded accumulated benefit obligation, when the accumulated benefit obligation exceeds the fair value of plan assets. If an additional minimum liability is recognized, a portion is recognized as an intangible asset up to the amount of unrecognized prior service cost and net transition obligations, and the excess is recognized in a separate component in the other comprehensive income, net of tax benefits. Under GAAP in Canada, such adjustment is not required.
(iii) Share issue costs
Under GAAP in the United States, share issue costs are deducted from the value proceeds of the capital stock issued. Under GAAP in Canada, share issue costs are included in the Retained Earnings in the year when incurred.
(c) Comprehensive income (loss)
Moreover, the application of GAAP in the United States requires the disclosure of comprehensive income (loss) in a separate financial statement, which includes the net income as well as revenues, charges, gains and losses recorded directly to equity.
| | 2003 | 2002 | 2001 | |||||||
|---|---|---|---|---|---|---|---|---|---|---|
| Net income (loss), as adjusted per GAAP in the United States | $ | (15.2 | ) | $ | 283.1 | $ | 22.1 | |||
Cumulative effect of changes in accounting principles, net of income taxes ($3.3 in 2001) (b) (i) | — | — | (6.3 | ) | ||||||
| Gain (loss) on hedging activities, net of income taxes of $(5.5) ($(3.2) in 2002 and $(6.1) in 2001) (b) (i) | 39.2 | (22.2 | ) | (12.0 | ) | |||||
| Additional minimum liability, net of income taxes of $37.3 ($53.8 in 2002 and $27.4 in 2001) (b) (ii) | (32.1 | ) | (109.2 | ) | (44.2 | ) | ||||
| Currency translation adjustment | 96.4 | 30.9 | (14.3 | ) | ||||||
| Other comprehensive income (loss) | 103.5 | (100.5 | ) | (76.8 | ) | |||||
Comprehensive income (loss) as per GAAP in the United States | $ | 88.3 | $ | 182.6 | $ | (54.7 | ) | |||
23. SEGMENT DISCLOSURES
The Company operates in the printing industry. Its business groups are located in three main segments: North America, Europe and Latin America. These segments are managed separately, since they all require specific market strategies. The Company assesses the performance of each segment based on operating income before impairment of assets, restructuring and other charges.
56
Accounting policies relating to each segment are identical to those used for the purposes of the consolidated financial statements. Intersegment sales are made at fair market values, which approximate those prevailing on the markets serviced. Management of financial expenses and income tax expense is centralized and, consequently, these expenses are not allocated among these segments.
| | North America(1) | Europe | Latin America | Other | Inter- segment | Total | |||||||||||||
|---|---|---|---|---|---|---|---|---|---|---|---|---|---|---|---|---|---|---|---|
Revenues | |||||||||||||||||||
| 2003 | $ | 5,062.9 | $ | 1,151.4 | $ | 177.3 | $ | — | $ | (0.1 | ) | $ | 6,391.5 | ||||||
| 2002 | 5,087.6 | 1,002.5 | 183.5 | — | (1.9 | ) | 6,271.7 | ||||||||||||
| 2001 | 5,370.7 | 910.7 | 161.8 | — | (0.5 | ) | 6,442.7 | ||||||||||||
Depreciation and amortization | |||||||||||||||||||
| 2003 | 261.5 | 62.7 | 10.2 | 1.5 | — | 335.9 | |||||||||||||
| 2002 | 250.7 | 57.3 | 7.0 | 1.0 | — | 316.0 | |||||||||||||
| 2001 | 258.9 | 49.6 | 7.4 | 1.3 | — | 317.2 | |||||||||||||
Impairment of assets, restructuring and other charges | |||||||||||||||||||
| 2003 | 78.5 | 6.8 | 11.8 | 1.2 | — | 98.3 | |||||||||||||
| 2002 | (9.0 | ) | 22.1 | 1.0 | 5.5 | — | 19.6 | ||||||||||||
| 2001 | 194.4 | 22.6 | 14.6 | 38.4 | — | 270.0 | |||||||||||||
Operating income (loss) | |||||||||||||||||||
| 2003 | 232.6 | 23.5 | (15.5 | ) | (8.5 | ) | — | 232.1 | |||||||||||
| 2002 | 536.3 | 16.8 | 13.2 | (23.1 | ) | — | 543.2 | ||||||||||||
| 2001 | 370.1 | 30.5 | (4.2 | ) | (48.6 | ) | — | 347.8 | |||||||||||
Goodwill amortization, net of income taxes | |||||||||||||||||||
| 2003 | — | — | — | — | — | — | |||||||||||||
| 2002 | — | — | — | — | — | — | |||||||||||||
| 2001 | 55.5 | 5.4 | 0.5 | — | — | 61.4 | |||||||||||||
Additions to property, plant and equipment | |||||||||||||||||||
| 2003 | 187.9 | 45.6 | 8.9 | 0.7 | — | 243.1 | |||||||||||||
| 2002 | 139.9 | 29.5 | 14.1 | 1.0 | — | 184.5 | |||||||||||||
| 2001 | 180.6 | 43.3 | 40.8 | 13.6 | — | 278.3 | |||||||||||||
Property, plant and equipment | |||||||||||||||||||
| 2003 | 1,952.8 | 535.2 | 90.5 | 2.5 | — | 2,581.0 | |||||||||||||
| 2002 | 2,024.1 | 489.8 | 94.4 | 2.3 | — | 2,610.6 | |||||||||||||
Goodwill | |||||||||||||||||||
| 2003 | 2,192.2 | 391.1 | 7.7 | — | — | 2,591.0 | |||||||||||||
| 2002 | 2,182.3 | 324.8 | 7.2 | — | — | 2,514.3 | |||||||||||||
Total assets | |||||||||||||||||||
| 2003 | 4,828.3 | 1,149.5 | 207.1 | 28.9 | — | 6,213.8 | |||||||||||||
| 2002 | 4,954.6 | 1,003.1 | 215.4 | 34.3 | — | 6,207.4 | |||||||||||||
- (1)
- Includes Revenues amounting to $907.8 million ($867.0 million in 2002 and $896.2 million in 2001), Property, plant and equipment amounting to $294.1 million ($253.5 million in 2002) and Goodwill amounting to $42.8 million ($33.0 million in 2002) for Canada.
57
The Company carries out international commercial printing operations, and offers to its customers a broad range of printed products and related communication services, such as magazines, retail inserts, catalogs, specialty printing and direct mail, books, directories, pre-media, logistics, and other value-added services.
Revenues per product are as follows:
| | 2003 | 2002 | 2001 | |||||||||||||
|---|---|---|---|---|---|---|---|---|---|---|---|---|---|---|---|---|
| Magazine | $ | 1,694.4 | 26.5 | % | $ | 1,645.8 | 26.3 | % | $ | 1,675.8 | 26.0 | % | ||||
| Retail inserts | 1,519.8 | 23.8 | 1,428.2 | 22.8 | 1,306.8 | 20.3 | ||||||||||
| Catalogs | 1,031.8 | 16.1 | 1,018.5 | 16.2 | 1,054.9 | 16.4 | ||||||||||
| Books | 698.1 | 10.9 | 733.7 | 11.7 | 718.0 | 11.1 | ||||||||||
| Specialty printing and direct mail | 619.0 | 9.7 | 604.0 | 9.6 | 790.5 | 12.3 | ||||||||||
| Directories | 356.6 | 5.6 | 391.4 | 6.2 | 388.4 | 6.0 | ||||||||||
| Pre-media, logistics and other value-added services | 471.8 | 7.4 | 450.1 | 7.2 | 508.3 | 7.9 | ||||||||||
| $ | 6,391.5 | 100.0 | % | $ | 6,271.7 | 100.0 | % | $ | 6,442.7 | 100.0 | % | |||||
58
FIVE YEAR FINANCIAL SUMMARY
Years ended December 31
(In millions of US dollars, except per share data & other statistics)
| | 2003 | 2002 | 2001 | 2000 | 1999 | ||||||||||||
|---|---|---|---|---|---|---|---|---|---|---|---|---|---|---|---|---|---|
Consolidated Results | |||||||||||||||||
| Revenues | $ | 6,391.5 | $ | 6,271.7 | $ | 6,442.7 | $ | 6,554.9 | $ | 4,984.1 | |||||||
| Operating income before depreciation and amortization and before IAROC | 689.8 | 898.4 | 955.6 | 1,069.9 | 758.5 | ||||||||||||
| Operating income before IAROC | 330.4 | 562.8 | 617.8 | 724.8 | 472.5 | ||||||||||||
| IAROC | 98.3 | 19.6 | 270.0 | (2.7 | ) | 180.0 | |||||||||||
| Operating income | 232.1 | 543.2 | 347.8 | 727.5 | 292.5 | ||||||||||||
| Net income (loss)* | (31.4 | ) | 279.3 | 22.4 | 295.4 | 77.5 | |||||||||||
| Cash provided by operating activities | 461.3 | 513.4 | 576.5 | 917.8 | 710.1 | ||||||||||||
| Free cash flow from operations** | 183.3 | 319.8 | 287.2 | 747.3 | 552.6 | ||||||||||||
| Operating margin before depreciation and amortization and before IAROC*** | 10.8 | % | 14.3 | % | 14.8 | % | 16.3 | % | 15.2 | % | |||||||
| Operating margin before IAROC*** | 5.2 | % | 9.0 | % | 9.6 | % | 11.1 | % | 9.5 | % | |||||||
| Operating margin*** | 3.6 | % | 8.7 | % | 5.4 | % | 11.1 | % | 5.9 | % | |||||||
Financial Position | |||||||||||||||||
| Working capital | $ | (193.0 | ) | $ | (213.8 | ) | $ | (194.5 | ) | $ | (66.5 | ) | $ | 72.5 | |||
| Property, plant and equipment | 2,581.0 | 2,610.6 | 2,634.0 | 2,683.0 | 2,895.3 | ||||||||||||
| Total assets | 6,213.8 | 6,207.4 | 6,186.5 | 6,520.8 | 6,904.3 | ||||||||||||
| Long-term debt (including convertible notes) | 2,009.0 | 1,822.1 | 2,132.2 | 2,208.7 | 2,839.9 | ||||||||||||
| First Preferred Shares | 456.6 | 456.6 | 456.6 | 212.5 | 212.5 | ||||||||||||
| Equity Multiple and Subordinate Voting Shares | 1,236.5 | 1,357.3 | 1,336.7 | 1,418.7 | 1,441.3 | ||||||||||||
| Debt-to-capitalization | 44:56 | 40:60 | 46:54 | 47:53 | 55:45 | ||||||||||||
Per Share Data | |||||||||||||||||
| Earnings (loss)* | |||||||||||||||||
| Diluted | $ | (0.50 | ) | $ | 1.76 | $ | — | $ | 1.91 | $ | 0.54 | ||||||
| Diluted before IAROC | $ | 0.03 | $ | 1.92 | $ | 1.58 | $ | 1.90 | $ | 1.55 | |||||||
| Dividends on equity shares | $ | 0.52 | $ | 0.49 | $ | 0.46 | $ | 0.33 | $ | 0.28 | |||||||
| Book value | $ | 15.51 | $ | 15.92 | $ | 14.39 | $ | 15.47 | $ | 14.26 | |||||||
| Market price — TSE close in CDN$ | $ | 26.75 | $ | 35.00 | $ | 35.88 | $ | 37.60 | $ | 32.25 | |||||||
| Market price — NYSE close | $ | 20.59 | $ | 22.32 | $ | 22.56 | $ | 25.19 | $ | 21.94 | |||||||
Other statistics | |||||||||||||||||
| Capital expenditures | $ | 243.1 | $ | 184.5 | $ | 278.3 | $ | 242.2 | $ | 194.7 | |||||||
| Return on capital employed | 12.8 | % | 17.3 | % | 17.9 | % | 19.5 | % | 19.0 | % | |||||||
IAROC: Impairment of assets, restructuring and other charges
- *
- Effective January 1, 2002, net income (loss) and earnings (loss) per share reflect the new accounting policy adopted by the Company under which goodwill is no longer amortized.
- **
- Cash provided from operating activities, less capital expenditures net of proceeds from disposals, and preferred share dividends.
- ***
- Margins calculated on revenues.
59
CERTIFICATION PURSUANT TO
18 U.S.C. SECTION 1350,
AS ADOPTED PURSUANT TO
SECTION 906 OF THE SARBANES-OXLEY ACT OF 2002
In connection with the Report of Quebecor World Inc. (the "Company") on Form 6-K for February 2004, which contains the Company's audited consolidated financial statements as at December 31, 2002 and 2003 and for the years ended December 31, 2001, 2002 and 2003 as filed with the Securities and Exchange Commission on the date hereof (the "Report"), I, Jean Neveu, President and Chief Executive Officer of the Company, certify, pursuant to 18 U.S.C. § 1350, as adopted pursuant to § 906 of the Sarbanes-Oxley Act of 2002, that:
- (1)
- The Report fully complies with the requirements of section 13(a) or 15(d) of the Securities Exchange Act of 1934; and
- (2)
- The information contained in the Report fairly presents, in all material respects, the financial condition and results of operations of the Company.
A signed original of this written statement requirement by § 906 has been provided to Quebecor World Inc. and will be retained by Quebecor World Inc. and furnished to the Securities and Exchange Commission or its staff upon request.
/s/ JEAN NEVEU Jean Neveu President and Chief Executive Officer | |||
Dated: February 6, 2004 |
60
CERTIFICATION PURSUANT TO
18 U.S.C. SECTION 1350,
AS ADOPTED PURSUANT TO
SECTION 906 OF THE SARBANES-OXLEY ACT OF 2002
In connection with the Report of Quebecor World Inc. (the "Company") on Form 6-K for February 2004, which contains the Company's audited consolidated financial statements as at December 31, 2002 and 2003 and for the years ended December 31, 2001, 2002 and 2003 as filed with the Securities and Exchange Commission on the date hereof (the "Report"), I, Claude Hélie, Executive Vice President and Chief Financial Officer of the Company, certify, pursuant to 18 U.S.C. § 1350, as adopted pursuant to § 906 of the Sarbanes-Oxley Act of 2002, that:
- (1)
- The Report fully complies with the requirements of section 13(a) or 15(d) of the Securities Exchange Act of 1934; and
- (2)
- The information contained in the Report fairly presents, in all material respects, the financial condition and results of operations of the Company.
A signed original of this written statement requirement by § 906 has been provided to Quebecor World Inc. and will be retained by Quebecor World Inc. and furnished to the Securities and Exchange Commission or its staff upon request.
/s/ CLAUDE HÉLIE Claude Hélie Executive Vice President and Chief Financial Officer | |||
Dated: February 6, 2004 |
61
Pursuant to the requirements of the Securities Exchange Act of 1934, the registrant has duly caused this report to be signed on its behalf by the undersigned, thereunto duly authorized.
| QUEBECOR WORLD INC. | |||
By: | /s/ RAYNALD LECAVALIER | ||
| Name: | Raynald Lecavalier | ||
| Title: | Vice President, Corporate General Counsel and Secretary | ||
Date: | February 6, 2004 | ||
62
QUEBECOR WORLD INC. Filed in this Form 6-K
QUEBECOR WORLD ANNOUNCES 2003 FOURTH QUARTER AND FULL-YEAR RESULTS
Financial Highlights
Consolidated Statements of Income and Retained Earnings
Consolidated Statements of Cash Flows
MANAGEMENT'S DISCUSSION AND ANALYSIS OF FINANCIAL CONDITION AND RESULTS OF OPERATIONS
Revenue by Product ($ millions) For the year ended December 31
Impact of Foreign Currency and Business Acquisition ($ millions)
Impact of Selected Expenses on Operating Income and EPS
Segmented Results of Operations ($ millions) Selected Performance Indicators
Revenue by Business Group ($ millions) For the year ended December 31
Weighted average assumptions used in the measurement of the Company's pension benefits
Total Debt and Accounts Receivable Securitization ($ millions)
Contractual Cash Obligations ($ millions)
Reconciliation of non GAAP measures ($ millions)
Reconciliation of non GAAP measures ($ millions)
Consolidated Statements of Income
Consolidated Statements of Cash Flows
Consolidated Balance Sheets
Notes to Consolidated Financial Statements
Five Year Financial Summary
CERTIFICATION PURSUANT TO 18 U.S.C. SECTION 1350, AS ADOPTED PURSUANT TO SECTION 906 OF THE SARBANES-OXLEY ACT OF 2002
CERTIFICATION PURSUANT TO 18 U.S.C. SECTION 1350, AS ADOPTED PURSUANT TO SECTION 906 OF THE SARBANES-OXLEY ACT OF 2002
SIGNATURES