QuickLinks -- Click here to rapidly navigate through this document
SECURITIES AND EXCHANGE COMMISSION
Washington, DC 20549
FORM 6-K
REPORT OF FOREIGN ISSUER
PURSUANT TO RULE 13a-16 or 15d-16 OF
THE SECURITIES EXCHANGE ACT OF 1934
For | REPORT TO SHAREHOLDERS THIRD QUARTER 2003 | |||
QUEBECOR WORLD INC. | ||||
| (Translation of Registrant's Name into English) | ||||
612 Saint-Jacques Street, Montreal, Quebec H3C 4M8 | ||||
| (Address of Principal Executive Office) | ||||
(Indicate by check mark whether the registrant files or will file annual reports under cover of Form 20-F or Form 40-F)
| Form 20-F | o | Form 40-F | ý |
(Indicate by check mark whether the registrant by furnishing the information contained in this form is also thereby furnishing the information to the Commission pursuant to Rule 12g3-2(b) under the Securities Exchange Act of 1934.)
| Yes | o | No | ý |
QUEBECOR WORLD INC.
Filed in this Form 6-K
Documents index
| 1. | Report to Shareholders Third Quarter 2003 |

| REPORT TO SHAREHOLDERS THIRD QUARTER2003 |
QUEBECOR WORLD INC.
FINANCIAL HIGHLIGHTS
Periods ended September 30
(In millions of US dollars, except per share amounts)
(Unaudited)
| | Three months | Nine months | ||||||||||||
|---|---|---|---|---|---|---|---|---|---|---|---|---|---|---|
| | 2003 | 2002 | 2003 | 2002 | ||||||||||
| Consolidated Results | ||||||||||||||
| Revenues | $ | 1,591.0 | $ | 1,617.9 | $ | 4,624.8 | $ | 4,548.6 | ||||||
| Operating income before depreciation and amortization and before IAROC | 208.5 | 251.3 | 507.0 | 652.2 | ||||||||||
| Operating income before IAROC | 120.0 | 167.9 | 240.3 | 402.5 | ||||||||||
| IAROC | (5.0 | ) | — | 76.8 | — | |||||||||
| Operating income | 125.0 | 167.9 | 163.5 | 402.5 | ||||||||||
| Net income | 59.7 | 98.5 | 22.5 | 208.7 | ||||||||||
| Cash provided from operating activities | 59.8 | 130.2 | 65.5 | 212.6 | ||||||||||
| Free cash flow (outflow) from operations* | 14.0 | 97.4 | (163.8 | ) | 57.4 | |||||||||
| Operating margin before depreciation and amortization and before IAROC ** | 13.1 | % | 15.5 | % | 11.0 | % | 14.3 | % | ||||||
| Operating margin before IAROC ** | 7.5 | % | 10.4 | % | 5.2 | % | 8.8 | % | ||||||
| Operating margin ** | 7.9 | % | 10.4 | % | 3.5 | % | 8.8 | % | ||||||
Segmented Information | ||||||||||||||
Revenues | ||||||||||||||
| North America | $ | 1,282.3 | $ | 1,324.2 | $ | 3,700.9 | $ | 3,714.8 | ||||||
| Europe | 267.7 | 248.5 | 794.2 | 699.3 | ||||||||||
| Latin America | 40.2 | 45.2 | 128.4 | 135.2 | ||||||||||
Operating income (loss) before IAROC | ||||||||||||||
| North America | $ | 109.9 | $ | 157.8 | $ | 238.7 | $ | 389.1 | ||||||
| Europe | 7.5 | 13.1 | 10.7 | 26.6 | ||||||||||
| Latin America | 0.8 | 5.2 | (4.6 | ) | 10.2 | |||||||||
Operating margins before IAROC ** | ||||||||||||||
| North America | 8.6 | % | 11.9 | % | 6.4 | % | 10.5 | % | ||||||
| Europe | 2.8 | % | 5.3 | % | 1.3 | % | 3.8 | % | ||||||
| Latin America | 2.1 | % | 11.6 | % | (3.5 | )% | 7.5 | % | ||||||
Financial Position | ||||||||||||||
| Working capital | $ | 23.6 | $ | (39.0 | ) | |||||||||
| Total assets | $ | 6,337.8 | $ | 6,351.1 | ||||||||||
| Long-term debt (including convertible notes) | $ | 2,268.4 | $ | 2,094.7 | ||||||||||
| Shareholders' equity | $ | 2,548.3 | $ | 2,617.3 | ||||||||||
| Debt-to-capitalization | 47:53 | 44:56 | ||||||||||||
Per Share Data | ||||||||||||||
| Earnings (loss) | ||||||||||||||
| Diluted | $ | 0.38 | $ | 0.64 | $ | (0.03 | ) | $ | 1.31 | |||||
| Diluted before IAROC | $ | 0.34 | $ | 0.64 | $ | 0.37 | $ | 1.31 | ||||||
| Dividends on equity shares | $ | 0.13 | $ | 0.12 | $ | 0.39 | $ | 0.36 | ||||||
| Book value | $ | 15.87 | $ | 15.33 | ||||||||||
| IAROC: | Impairment of assets, restructuring and other charges. | |
| * | Cash provided from operating activities, less capital expenditures net of proceeds from disposals, and preferred share dividends. | |
| ** | Margins calculated on revenues |
2
In the third quarter Quebecor World continued to focus on reducing costs across its global platform while renewing partnerships with existing customers and winning new ones to secure and increase volumes. These efforts, especially rigorous costs containment, are not just the appropriate course of action to deal with the continuing challenging economy but a central pillar of the Quebecor World culture.
The current economic climate combined with reduced print advertising spending and print industry overcapacity has resulted in negative price pressure leading to lower margins. We believe that striving to be the low cost provider in our industry is the most effective way to gain market share in this fiercely competitive global economy.
For the third quarter 2003, Quebecor World reported net income of $60 million or $0.38 per share and revenues of $1.59 billion. This compares to net income of $99 million or $0.64 per share and revenues of $1.62 billion during the same period last year.
These results are disappointing even in today's tough market conditions. We can and must do better for our shareholders, customers and employees. The Company is proceeding with restructuring initiatives announced in the second quarter and for the first nine months of 2003 reduced its workforce by 1,174 employee positions. Selling, general and administrative expenses decreased by $13.9 million compared to the second quarter of last year. Of that amount, $8.1 million was directly due to restructuring initiatives implemented this year. For the first nine months of 2003, SG&A expenses were reduced by $22.6 million, excluding charges for bad debt, the impact of currency translation and other specific charges.
These reductions are the result of initiatives that are taking place across our platform. Our Greenwich, Ct. office has been reduced from two buildings to one, in part because of the consolidation of corporate functions to reduce duplication. Some sales representatives have been relocated to nearby plants. We are implementing a strategy of regional management, where appropriate, allowing plants to share support services and reduce costs. In Europe our Paris office has moved to our nearby Torcy plant. In addition to SG&A and workforce reductions we are taking advantage of cost reduction opportunities in procurement, manufacturing and operational efficiency and financial expense.
In procurement we are consolidating the number of vendors in all areas of material supplies such as paper, pallets and packaging material. This effort is not limited to manufacturing. We are also consolidating suppliers for health insurance, pension fund administration, I.T. support and financial services.
Another example of process streamlining is our hub and spoke approach to some of our pre-press operations. We have been able to provide the same service at lower cost by grouping operations into a single location to serve multiple facilities. This approach eliminates duplication, cuts down on hardware and software maintenance and simplifies customer communication by reducing the number of points of contact.
Recently we took advantage of the current low interest rate environment to lower our financial expenses. Post quarter the Company, through its wholly owned subsidiary Quebecor World Capital Corporation, successfully refinanced part of its long-term debt by completing a private placement of $600 million of Senior Notes. The offering which closed November 3, 2003, consisted of $200 million aggregate principal amount of 47/8% Senior Notes due November 15, 2008 and $400 million aggregate principal amount of 61/8% Senior Notes due November 15, 2013.
The Senior Notes were sold at a discount to their face amount yielding net proceeds of approximately $596.8 million before transaction fees. The ten-year cost of financing to Quebecor World is effectively 6.05% net of a gain of a treasury hedge previously implemented. The proceeds from the sale of the Senior Notes will be used to repay outstanding indebtedness including the 83/8% Senior Notes due 2008 (callable on or after November 15, 2003) and the 73/4% Senior Notes due 2009 (callable on or after February 15, 2004) of Quebecor World's wholly-owned subsidiary Quebecor World (USA) Inc. Quebecor World will incur approximately $18.5 million of one-time after tax charges related to the financing. These one-time charges, which will be recorded in financial expenses, will result in estimated annual pre-tax savings of approximately $12 million for Quebecor World.
These cost containment initiatives are made more imperative by the ongoing challenging operating environment that prevails in all our geographies. For the third quarter the consolidated operating margin was 7.9%, which is down from last year's 10.4% but an improvement over the second quarter of this year.
3
In our largest market, North America, revenues were $1.28 billion compared to $1.32 billion during the third quarter last year. Much of that decrease is attributable to continued pressure in the book market with publishers looking to shorter runs as they continue to reduce inventory. In addition, some state and local governments are experiencing budget constraints which is affecting orders for school text books. The rest of the decrease is due to lower pricing in our magazine, catalog and retail segments, which impacted margins. For the quarter magazine ad pages were down almost 4% but some customers such as Conde Nast, Viacom, Denis Publishing and Bauer have launched new magazine titles aimed at targeted demographics such as the teen market. We are seeing some improvement in our catalog business with specific customers and in the third quarter received renewals and new work from Office Depot, Avon, William Sonoma and Ethan Allen. In the retail sector, volume increased albeit at lower prices. Our combined gravure/offset offering is attracting customers looking to take advantage of this platform's unique flexibility for regional and national advertising campaigns. Our Commercial/Direct group showed year over year improvement. This is a positive sign because this business often foreshadows changes in the economy. In Canada, revenue increased primarily as a result of currency translation. The market is facing similar price competition as in the U.S. During the quarter we were pleased to renew our agreement with Canada Wide Magazines, the country's largest independent magazine publisher.
In Europe, third quarter revenue increased 8% to $268 million helped by the strengthening Euro, Swedish Krona and Pound Sterling. Operating income was $7.5 million before impairment of assets, restructuring and other charges. In this region we are combating lower pricing brought on by weak economies, industry over capacity as well as increased competition from Eastern European countries such as the Czech Republic and Poland who are preparing to enter the EU next year. Despite these negative factors our facilities in the U.K., Belgium and Austria performed well.
In France we believe we are on the right track. We registered a loss in the quarter but this was an improvement over second quarter results and our operations made money in September. We are continuing with our cost reduction programs to improve efficiencies through workforce reductions, improved technology and supplier consolidation.
In Latin America volumes increased compared to the same period last year but this was offset by lower prices. In the third quarter revenue was $40 million and operating income was $0.8 million before impairment of assets, restructuring and other charges. Overcapacity, economic pressures in certain countries and currency devaluation all had a negative impact on prices. Operating income increased modestly in Colombia, Argentina and Chile but was down in Brazil, Peru and Mexico.
The Board of Directors declared a dividend of $0.13 per share on Multiple Voting Shares and Subordinate Voting Shares. The Board also declared a dividend of CDN$0.3845 per share on Series 3 Preferred Shares, CDN$0.4219 per share on Series 4 Preferred Shares and CDN$0.43125 on Series 5 Preferred Shares. The dividends are payable on December 1st, 2003 to shareholders of record at the close of business November 14, 2003.
Our firm attention to cost reduction and strict financial discipline at all levels of the organization will help us deal with the difficult economy. We are making progress as we have demonstrated with our workforce reductions and lower SG&A expenses. This focus will allow us to strengthen margins as we renew work with our existing customers and secure volumes with new ones across all our geographies.
 | ||
| The Right Honourable Brian Mulroney Chairman of the Board | Jean Neveu President and Chief Executive Officer | |
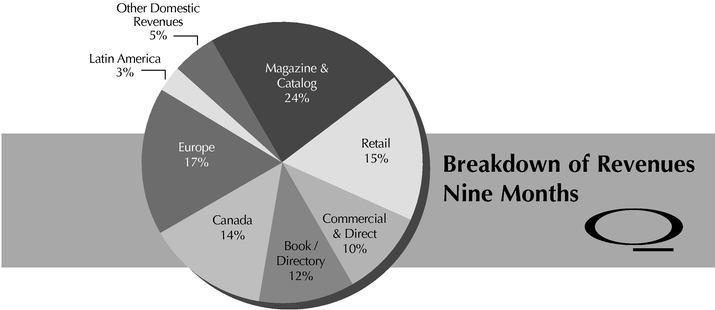
Breakdown of Revenues
Nine Months
4
Management's Discussion and Analysis of Financial Condition and Results of Operations
Overview
Quebecor World is the largest commercial print media services company in the world. Quebecor World is the market leader in most of its product categories and geographies. This market-leading position has been built through a combination of successfully integrated acquisitions, investments in key strategic technologies and a commitment to building long-term partnerships with the world's leading print media customers.
Quebecor World has facilities in the United States, Canada, France, the United Kingdom, Spain, Switzerland, Sweden, Finland, Austria, Belgium, Brazil, Chile, Argentina, Peru, Colombia, Mexico and India.
Certain measures used do not have any standardized meaning under Canadian Generally Accepted Accounting Principles (GAAP). When used, these measures were defined in such terms to allow the reconciliation to the closest GAAP measure. Numerical reconciliations are provided in figure 6. It is not likely that these measures could be compared to similar measures presented by other companies.
Review of Third Quarter and Year-to-Date
During the third quarter of 2003, Quebecor World continued to face challenges in difficult markets and overcapacity in the print industry. To meet these challenges, the Company is selling aggressively to secure volumes, reducing costs at every level and implementing previously anounced restructuring initiatives.
Actions to reduce cost structures and improve efficiency include: centralizing procurement to lower administrative costs, consolidating pre-press facilites and increasing automation to enhance manufacturing/operational efficiency and reducing selling, general and administrative expenses by further consolidating corporate functions. The objective is to permanently lower the cost base and allow the Company to harvest the benefits when markets recover.
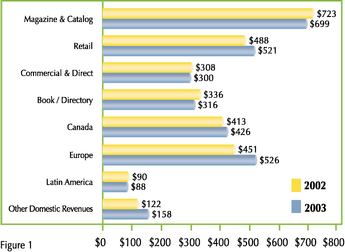
Revenue by Product ($ millions)
For the nine-month period ended September 30
Overcapacity in the printing industry is triggering pressure on prices, which is causing some account movement in the market.
Revenues were $1,591.0 million for the third quarter ended September 30, 2003, $26.9 million lower than 2002. On a year-to-date basis, consolidated revenues went from $4,548.6 million in 2002 to $4,624.8 million in 2003 due to the favourable impact of currency translation and the acquisition of Hachette Filipacchi Medias (see figure 2). The reduction in revenues, when excluding these factors, is a reflection of the pricing pressure in all business segments.
5
Impact of Foreign Currency and Business Acquisition
($ millions)
| | Three Months ended September 30, 2003 | Nine Months ended September 30, 2003 | ||||||
|---|---|---|---|---|---|---|---|---|
| Revenues | ||||||||
| Foreign currency impact | $ | 56.0 | $ | 161.7 | ||||
| Business acquisition | — | 23.7 | ||||||
| Total | $ | 56.0 | $ | 185.4 | ||||
| Operating income | ||||||||
| Foreign currency impact | $ | 1.2 | $ | 2.3 | ||||
| Business acquisition | — | (0.2 | ) | |||||
| Total | $ | 1.2 | $ | 2.1 | ||||
Figure 2
In general, volume was higher in most segments causing a greater proportional increase in cost of sales compared to total revenues. This also explains why consolidated operating income, before impairment of assets, restructuring and other charges, for the nine-month period ended September 30, 2003, was lower than in 2002. The Company assesses the performance of each segment based on operating income before impairment of assets, restructuring and other charges. A reconciliation with operating income is provided in figure 3.
The following operating analysis are before impairment of assets, restructuring and other charges.
On a year-to-date basis, the Company incurred specific charges totalling $56.1 million that reduced operating income. This included a $15 million adjustment related to rapid growth and systems issues in the North American Logistics business and a $15 million provision for doubtful accounts. It also included $26 million of various other adjustments, such as write-downs of other assets, inventories and other items. Most of these specific charges were incurred in the second quarter.
In North America, all lines of business continue to suffer from price erosion. Overall, price was mostly responsible for the decline in revenues, operating income and margins, for the quarter and year-to-date, when compared to the same periods last year. Looking at third quarter volumes, some segments improved over the same period last year led by Logistics and Retail. The Magazine & Catalog offset and the Commercial sheet-fed volume declined. This reflects the general environment and the sluggish advertising market affecting their customers, resulting in lower page counts. The Book segment is still experiencing lower volume due to publishers' continued focus on reducing inventories, and the lower proportion of higher quality books (defined by number of colors and cover types) produced compared to the previous period. All the groups are focusing their efforts on cost containment, cost reductions, plant synergies, procurement and workforce reductions to mitigate the impact of lower prices. As an example of a strategic initiative, the Gravure Process Optimization (GPO) has been implemented across the North American gravure platform. The objective of the GPO is to standardize manufacturing specifications and to allow the Company to send work to several plants, thereby increasing flexibility, reducing delivery times and improving efficiencies.
To date, North America was impacted by specific charges of $44.5 million of which $39.3 million was reported in the second quarter, further diluting operating margins. The largest item was related to the rapid growth and systems issues in the Logistics business, representing approximately $15 million. The other large item was related to the recording of an additional bad debt provision of approximately $11 million, reflecting the slow economic environment.
In Europe, revenues increased in the third quarter and year to date, due to the positive impact of the currency translation. This was partially offset by the overcapacity across the European print market which is still negatively impacting prices. These lower prices led to lower margins in all countries except for the United Kingdom where increased demand is creating additional volume. Specific charges related to Europe amounted to $2.7 million for the nine-month period ended September 30, 2003.
In Latin America, revenues decreased in both the third quarter and the first nine months of 2003 when compared to the same periods in 2002. Lower demand and overcapacity in all markets is putting pressure on prices with the most significant operating margin erosion occuring in Peru, Mexico and Brazil. Specific charges of $7.9 million, including an increase in the allowance for doubtful accounts, were also recorded in the nine-month period ended September 30, 2003.
Selling, general and administrative expenses decreased by $13.9 million to $115.5 million in the third quarter of 2003 from $129.4 million in 2002, mostly due to the consolidation of corporate functions, the moving of sales offices into plants, and a reduction in headcount. On a year-to-date basis, selling, general and administrative expenses were $385.3 million in 2003 compared with $382.1million in 2002. Excluding the specific charges of $15 million for bad debt and the impact of currency translation of $14 million, the selling, general and administrative expenses improved by $26 million. This resulted from the workforce reduction and other related cost containment.
Financial expenses increased by $6.1 million to $45.9 million in the third quarter of 2003. On a year-to-date basis, financial expenses were $137.2 million, compared to $127.5 million for the same period in 2002. Despite a negative free cashflow from operations, the average total indebtedness of the quarter is close to last year's level reflecting funds used for the Substantial Issuer Bid. The higher expense was mainly due to the net impact of the currency mix and the fixed to floating mix of the debt portfolio.
6
For the third quarter of 2003, income taxes were $18.5 million compared to $29.1 million in 2002. On a year-to-date basis, income taxes were $2.4 million compared to $64.6 million in 2002. Before impairment of assets, restructuring and other charges, income taxes were $18.4 million and $23.6 million for the quarter and year-to-date ended September 30, 2003. The effective tax rate, before impairment of assets, restructuring and other charges, was 22.9% for the nine-month period of 2003 compared to 22.0% for the full year 2002. The decrease in income taxes was due to lower profitability in countries with a higher overall tax rate.
Net income for the third quarter was $59.7 million compared to $98.5 million in 2002, and diluted earnings per share was $0.38 compared to $0.64 last year. For the nine-month period, net income was $22.5 million compared to $208.7 million in 2002 and diluted earnings per share was $(0.03) compared to $1.31 last year. Excluding impairment of assets, restructuring and other charges, earnings per share for the third quarter and the nine-month period of 2003 were respectively $0.34 and $0.37 (see figure 6).
Specific charges of $2.2 million ($1.7 million net of income taxes) negatively impacted the third quarter earnings per share by $0.01. On a year-to-date basis, specific charges of $56.1 million ($43.2 million net of taxes) also negatively impacted earnings per share by $0.31.
Segmented Results of Operations ($ millions)
Selected Performance Indicators
| | North America | Europe | Latin America | Inter-Segment and Others | Total | ||||||||||||||||||||||||||
|---|---|---|---|---|---|---|---|---|---|---|---|---|---|---|---|---|---|---|---|---|---|---|---|---|---|---|---|---|---|---|---|
| | 2003 | 2002 | 2003 | 2002 | 2003 | 2002 | 2003 | 2002 | 2003 | 2002 | |||||||||||||||||||||
| Three months ended September 30 | |||||||||||||||||||||||||||||||
| Revenues | $ | 1,282.3 | $ | 1,324.2 | $ | 267.7 | $ | 248.5 | $ | 40.2 | $ | 45.2 | $ | 0.8 | $ | — | $ | 1,591.0 | $ | 1,617.9 | |||||||||||
| Operating income (loss) before depreciation and amortization and before IAROC | 180.2 | 224.4 | 22.8 | 28.7 | 3.5 | 6.0 | 2.0 | (7.8 | ) | 208.5 | 251.3 | ||||||||||||||||||||
| Operating income (loss) before IAROC | 109.9 | 157.8 | 7.5 | 13.1 | 0.8 | 5.2 | 1.8 | (8.2 | ) | 120.0 | 167.9 | ||||||||||||||||||||
| IAROC | 2.4 | — | (7.6 | ) | — | 0.1 | — | 0.1 | — | (5.0 | ) | — | |||||||||||||||||||
| Operating income (loss) | 107.5 | 157.8 | 15.1 | 13.1 | 0.7 | 5.2 | 1.7 | (8.2 | ) | 125.0 | 167.9 | ||||||||||||||||||||
| Operating margin before depreciation and amortization and before IAROC | 14.1 | % | 16.9 | % | 8.5 | % | 11.6 | % | 8.7 | % | 13.3 | % | 13.1 | % | 15.5 | % | |||||||||||||||
| Operating margin before IAROC | 8.6 | % | 11.9 | % | 2.8 | % | 5.3 | % | 2.1 | % | 11.6 | % | 7.5 | % | 10.4 | % | |||||||||||||||
| Operating margin | 8.4 | % | 11.9 | % | 5.7 | % | 5.3 | % | 1.8 | % | 11.6 | % | 7.9 | % | 10.4 | % | |||||||||||||||
Nine months ended September 30 | |||||||||||||||||||||||||||||||
| Revenues | $ | 3,700.9 | $ | 3,714.8 | $ | 794.2 | $ | 699.3 | $ | 128.4 | $ | 135.2 | $ | 1.3 | $ | (0.7 | ) | $ | 4,624.8 | $ | 4,548.6 | ||||||||||
| Operating income (loss) before depreciation and amortization and before IAROC | 449.9 | 588.9 | 57.0 | 69.6 | 3.5 | 16.4 | (3.4 | ) | (22.7 | ) | 507.0 | 652.2 | |||||||||||||||||||
| Operating income (loss) before IAROC | 238.7 | 389.1 | 10.7 | 26.6 | (4.6 | ) | 10.2 | (4.5 | ) | (23.4 | ) | 240.3 | 402.5 | ||||||||||||||||||
| IAROC | 60.6 | — | 5.6 | — | 9.7 | — | 0.9 | — | 76.8 | — | |||||||||||||||||||||
| Operating income (loss) | 178.1 | 389.1 | 5.1 | 26.6 | (14.3 | ) | 10.2 | (5.4 | ) | (23.4 | ) | 163.5 | 402.5 | ||||||||||||||||||
| Operating margin before depreciation and amortization and before IAROC | 12.2 | % | 15.9 | % | 7.2 | % | 10.0 | % | 2.7 | % | 12.1 | % | 11.0 | % | 14.3 | % | |||||||||||||||
| Operating margin before IAROC | 6.4 | % | 10.5 | % | 1.3 | % | 3.8 | % | (3.5 | )% | 7.5 | % | 5.2 | % | 8.8 | % | |||||||||||||||
| Operating margin | 4.8 | % | 10.5 | % | 0.6 | % | 3.8 | % | (11.1 | )% | 7.5 | % | 3.5 | % | 8.8 | % | |||||||||||||||
IAROC: Impairment of assets, restructuring and other charges.
Figure 3
7
Impairment of Assets and Restructuring Initiatives
During the third quarter of 2003, the Company recorded a net reversal of restructuring and other charges of $5.0 million. This is made-up of a $1.9 million charge related to third quarter initiatives, a $2.2 million reversal related to second quarter initiatives and $4.7 million related to the net reversal of 2001-2002 initiatives as described below. For the nine-month period ended September 30, 2003, the Company recorded an impairment of assets, restructuring and other charges of $76.8 million. Non-cash items amounted to $53.4 million and cash items to $23.4 million. The non-cash portion includes an impairment of assets of $47.4 million and other charges of $2.8 million for the 2003 initiatives and $3.2 million related to previous years' initiatives.
Impairment of assets
- •
- In the second quarter of 2003, the Company recorded an impairment of assets of $47.4 million for write-downs of certain under-performing assets resulting from the overcapacity in the industry and the decision not to redeploy the assets.
Restructuring and other charges
- •
- During the third quarter of 2003, the Company continued its restructuring program. A cash charge for workforce reduction of $1.9 million was taken, of which $1.4 million is for North America and $0.5 million is for Latin America. This program affected 240 employee positions in fixed cost areas. The Company also completed and revaluated the cost of the June initiatives and reversed $2.2 million of cash restructuring and other charges. The amount of $2.2 million included $1.9 million for Europe and $0.3 million in Latin America.
- •
- In the second quarter of 2003, the Company initiated restructuring initiatives and other charges following the continued volume declines in certain business segments. A cash charge of $23.4 million was taken and related mostly to reduction in force programs and the closure of four smaller facilities in North America. These initiatives were undertaken to improve efficiencies following the detailed review of operations performed by the new management in place. The related non-cash portion was $2.8 million for a total charge of $26.2 million.
- •
- In relation to 2001 and 2002 initiatives, the Company has recorded an overspending of $10.7 million offset by a reversal of $10.4 million. The related non-cash portion was $3.2 million.
Under these initiatives, the number of employee positions reduced as follows for the past three years:
| • 2001: | 3,136 | |
| • 2002: | 791 | |
| • 2003 (9 months): | 1,174 |
The workforce reductions affected all fixed cost areas of the Company both at the plant and corporate levels. Further reductions are expected in the fourth quarter as the Company reviews the annual budgets and sets new target expectations for 2004.
Liquidity, Capital Resources and Financial Position
The Company measures its liquidity performance using the calculation of free cash flow as described in figure 6. Free cash flow reflects liquidity available for business acquisitions, equity dividends and repayments of long-term debt.
Free cash flow for the third quarter of 2003 amounted to $14.0 million compared to $97.4 million for the same quarter last year (see figure 6). On a year-to-date basis, free cash flow showed an outflow of $163.8 million, compared to $57.4 million at the end of September 30, 2002. This outflow was mainly attributable to lower net income and higher working capital and capital expenditures. Working capital was $23.6 million at September 30, 2003, compared to $(39.0) million at September 30, 2002. This increase of $62.6 millionwas primarily due to lower levels of trade payables.
In June 2003, the Company repurchased for cancellation a total of 10,000,000 Subordinate Voting Shares pursuant to its Substantial Issuer Bid dated April 24, 2003 for a net cash consideration, including redemption fees, of Cdn $241.5 million ($173.6 million). The Substantial Issuer Bid expired at midnight (Montreal time) on the evening of June 2, 2003. The excess of the price paid over the book value of the shares repurchased was charged to retained earnings.
During the nine-month period of 2003, the Company acquired some minority interests in Spain (Europe) and North America.
As at September 30, 2003, the Company's debt level was at $2,269.6 million, a $174.8 million increase compared to the end of September 2002. Including accounts receivable securitization, total debt would be $2,849.0 million, $171.3 million higher than last year (see figure 4). The increase reflected new borrowings to complete the recent Substantial Issuer Bid. The debt-to-capitalization ratio was 47:53 compared to 44:56 in 2002.
8
Total Debt and Accounts Receivable Securitization ($ millions)
| | September 30, 2003 | September 30, 2002 | ||||
|---|---|---|---|---|---|---|
| Bank indebtedness | $ | 1.2 | $ | 0.1 | ||
| Current portion of long-term debt and convertible notes | 22.4 | 43.2 | ||||
| Long-term debt | 2,135.8 | 1,937.0 | ||||
| Convertible notes | 110.2 | 114.5 | ||||
| Total debt | $ | 2,269.6 | $ | 2,094.8 | ||
| Accounts receivable securitization | 579.4 | 582.9 | ||||
| Total debt and accounts receivable securitization | $ | 2,849.0 | $ | 2,677.7 | ||
Figure 4
The average annual cash obligations over the next two years represent approximately 11% of the 2002 operating income before depreciation and amortization and before restructuring and other charges (see figure 5).
Contractual Cash Obligations ($ millions)
| | Remaining of 2003 | 2004 | 2005 | 2006 | 2007 | 2008 and thereafter | ||||||||||||
|---|---|---|---|---|---|---|---|---|---|---|---|---|---|---|---|---|---|---|
| Long-term debt and convertible notes | $ | — | $ | 6 | $ | — | $ | 358 | $ | 760 | $ | 1,076 | ||||||
| Capital leases | 5 | 21 | 11 | 8 | 6 | 17 | ||||||||||||
| Operating leases | 21 | 77 | 70 | 57 | 43 | 84 | ||||||||||||
| Purchase of equipment | 4 | 15 | — | — | — | — | ||||||||||||
| Total contractual cash obligations | $ | 30 | $ | 119 | $ | 81 | $ | 423 | $ | 809 | $ | 1,177 | ||||||
Figure 5
9
Reconciliation of non GAAP measures
($ millions)
| | Three months | Nine months | ||||||||||||
|---|---|---|---|---|---|---|---|---|---|---|---|---|---|---|
| | 2003 | 2002 | 2003 | 2002 | ||||||||||
| Operating Income | ||||||||||||||
| Operating Income | $ | 125.0 | $ | 167.9 | $ | 163.5 | $ | 402.5 | ||||||
| Impairment of assets, restructuring and other charges ("IAROC") | (5.0 | ) | — | 76.8 | — | |||||||||
| Operating income before IAROC | $ | 120.0 | $ | 167.9 | $ | 240.3 | $ | 402.5 | ||||||
| Operating income | $ | 125.0 | $ | 167.9 | $ | 163.5 | $ | 402.5 | ||||||
| Depreciation of property, plant and equipment | 82.1 | 77.8 | 247.9 | 233.3 | ||||||||||
| Amortization of deferred charges | 6.4 | 5.6 | 18.8 | 16.4 | ||||||||||
| Operating income before depreciation and amortization | $ | 213.5 | $ | 251.3 | $ | 430.2 | $ | 652.2 | ||||||
| IAROC | (5.0 | ) | — | 76.8 | — | |||||||||
Operating income before depreciation and amortization and IAROC | $ | 208.5 | $ | 251.3 | $ | 507.0 | $ | 652.2 | ||||||
Earnings (loss) per share | ||||||||||||||
| Net income (loss) available to holders of equity shares | $ | 49.9 | $ | 91.3 | $ | (4.3 | ) | $ | 187.1 | |||||
| IAROC (net of income taxes of $0.1 million for the quarter and $21.2 million year-to-date) | (4.9 | ) | — | 55.6 | — | |||||||||
| Net income available to holders of equity shares before IAROC | $ | 45.0 | $ | 91.3 | $ | 51.3 | $ | 187.1 | ||||||
| Diluted average number of equity shares outstanding (in millions)(1) | 135.7 | 145.5 | 137.5 | 145.4 | ||||||||||
| Earnings (loss) per share | ||||||||||||||
| Diluted | $ | 0.38 | $ | 0.64 | $ | (0.03 | ) | $ | 1.31 | |||||
| Diluted, before IAROC | $ | 0.34 | $ | 0.64 | $ | 0.37 | $ | 1.31 | ||||||
Free Cash Flow (Outflow) | ||||||||||||||
| Cash provided by operating activities | $ | 59.8 | $ | 130.2 | $ | 65.5 | $ | 212.6 | ||||||
| Dividends on preferred shares | (11.1 | ) | (7.3 | ) | (25.9 | ) | (21.6 | ) | ||||||
| Additions to property, plant and equipment | (35.6 | ) | (28.5 | ) | (205.6 | ) | (140.9 | ) | ||||||
| Net proceeds from disposal of other assets | 0.9 | 3.0 | 2.2 | 7.3 | ||||||||||
| Free cash flow (outflow) from operations | $ | 14.0 | $ | 97.4 | $ | (163.8 | ) | $ | 57.4 | |||||
Debt-to-capitalization | ||||||||||||||
| Bank indebtedness | $ | 1.2 | $ | 0.1 | ||||||||||
| Current portion of long-term debt and convertible notes | 22.4 | 43.2 | ||||||||||||
| Long-term debt | 2,135.8 | 1,937.0 | ||||||||||||
| Convertible notes | 110.2 | 114.5 | ||||||||||||
| Total debt | $ | 2,269.6 | $ | 2,094.8 | ||||||||||
| Minority interest | 22.0 | 9.8 | ||||||||||||
| Shareholders' equity | 2,548.3 | 2,617.3 | ||||||||||||
| Capitalization | $ | 4,839.9 | $ | 4,721.9 | ||||||||||
| Debt-to-capitalization | 47:53 | 44:56 | ||||||||||||
Book value | ||||||||||||||
| Shareholders' equity | $ | 2,548.3 | $ | 2,617.3 | ||||||||||
| Preferred shares | (456.5 | ) | (456.5 | ) | ||||||||||
| $ | 2,091.8 | $ | 2,160.8 | |||||||||||
| Ending number of equity shares | 131.8 | 141.0 | ||||||||||||
| Book value | $ | 15.87 | $ | 15.33 | ||||||||||
Figure 6
- (1)
- For the nine-month period, as the net income available to holders of equity shares, before IAROC became positive, the stock options outstanding became dilutive with a 0.1 million impact on the diluted average number of equity shares outstanding.
10
The minimum legal requirement for pension contributions is $23 million in 2003, but the Company anticipates making contributions of $64 million. In 2002, the Company made total contributions of $40 million, including an excess voluntary contribution of $20 million.
The Company invested $35.6 million in capital projects during the third quarter of 2003 compared to $28.5 million for the same period last year. On a year-to-date basis, $205.6 million have been invested in capital projects in 2003 compared to $140.9 million in 2002. These capital expenditures were incurred to improve the Company's cost structure and for customer-driven requirements. Key expenditures during the quarter included: New gravure press at the Augusta, GA plant, phase 2 of the educational book market expansion in the Company's Dubuque, IA facility and miscellaneous equipment transfers within the North American platform. Also during the second quarter, the Company proceeded to purchase 19 presses that were previously under an operating lease in North America.
The Company believes that its liquidity, capital resources and cash flow from operations are sufficient to fund planned capital expenditures, working capital requirements, interest and principal payments for the foreseeable future.
Risks and Uncertainties
In the normal course of business, the Company is exposed to changes in interest rates and foreign exchange rates. However, the interest-rate exposure is managed by having a balanced schedule of debt maturities as well as a combination of fixed and variable rate obligations. In addition, the Company has entered into interest-rate swap agreements to manage this exposure.
The Company has also entered into foreign exchange forward contracts and cross-currency interest rate swaps to hedge the settlement of raw materials and equipment purchases, to set the exchange rate for foreign denominated sales and to manage foreign exchange exposure on net investments.
While the counterparties of these agreements expose the Company to credit loss in the event of non-performance, the possibility of incurring such a loss is remote due to the creditworthiness of the counterparties. Derivative financial instruments for trading purposes are not held or issued.
Concentrations of credit risk with respect to trade receivables are limited due to diverse operations and a large customer base. As at September 30, 2003, there are no significant concentrations of credit risk.
Accounting Policies
The Consolidated Financial Statements have been prepared using the same accounting policies described in the Company's latest Annual Report with the exception of the following items.
In February 2003, the Canadian Institute of Chartered Accountants ("CICA") issued Accounting Guideline 14,Disclosure of Guarantees (AcG-14), which clarifies disclosure requirements for certain guarantees. The Company adopted the new recommendations effective January 1, 2003. The impact of that change is presented in note 2 a) of the quarterly consolidated financial statements.
In December 2002, the CICA's Accounting Standards Board ("AcSB") revised Handbook Section 3475,Disposal of Long-Lived Assets and Discontinued Operations. The revised section 3475 is applicable to disposal activities initiated by an enterprise's commitment to a plan on or after May 1, 2003. Under this section, new standards are established for the recognition, measurement, presentation and disclosure of the disposal of long-lived assets by profit-oriented enterprises. New standards are also established for the presentation and disclosure of discontinued operations for profit-oriented enterprises and not-for-profit organizations. It applies to the disposal of non-monetary long-lived assets, including property, plant and equipment, intangible assets with finite useful lives and long-term prepaid assets. It requires an asset or group that will be disposed of other than by sale to continue to be classified as "held and used" until the disposal transaction occurs. As a result, the asset continues to be depreciated until the date of disposal. The Section also provides specific guidance on income statement display for a disposal group if an entity abandons or distributes to owners in a spin-off a long-lived asset together with other assets (and liabilities) as a group and that disposal group is a component of an entity. The effect of adopting the new recommendations did not have a significant impact on the consolidated balance sheet and consolidated statement of operations and retained earnings and cash flows as at September 30, 2003.
In March 2003, the Emerging Issues Committee releasedAbstracts EIC-134,Accounting for Severance and Termination Benefits ("EIC-134"), and EIC-135,Accounting for Costs Associated with Exit and Disposal Activities (Including Costs Incurred in a Restructuring) ("EIC-135"). EIC-134 provides interpretive guidance to the accounting requirements for the various types of severance and termination benefits covered in CICA Handbook Section 3461,Employee Future Benefits. EIC-135 provides interpretive guidance for the timing of the recognition of a liability for costs associated with an exit or disposal activity. The new guidance requires that the liability be recognized for those costs only when the liability is incurred, that is, when it meets the definition of a liability in CICA Handbook Section 1000,Financial Statement Concepts. These new EICs also establish fair value as the objective for initial measurement of liabilities related to exit or disposal activities.
Together, the two EICs mentioned above are intended to harmonize Canadian GAAP with US SFAS No. 146,Accounting for Costs Associated with Exit or Disposal Activities ("FAS 146"). The Company adopted the new recommendations effective April 1, 2003. The impact of these changes is reflected in note 3 of the quarterly consolidated financial statements.
Seasonality
The operations of the Company's business are seasonal, with approximately two-thirds of historical operating income recognized in the second-half of the fiscal year, primarily due to the higher number of magazine pages, new product launches and back-to-school, retail and holiday catalog promotions.
Forward Looking Statements
Except for historical information contained herein, the statements in this document are forward-looking and made pursuant to the safe harbor provisions of thePrivate Securities Litigation Reform Act of 1995. Forward-looking statements involve known and unknown risks and uncertainties, which may cause the actual results in future periods to differ materially from forecasted results. Those risks include, among others, changes in customer demand for the Company's products, changes in raw material and equipment costs and availability, seasonal changes in customer orders, pricing actions by competitors and general changes in economic conditions.
 |  |
Executive Vice President and Chief Financial Officer | Senior Vice President Chief Accounting Officer |
11
Consolidated Statements of Operations and Retained Earnings
Periods ended September 30
(In millions of US dollars, except for earnings per share amounts)
(Unaudited)
| | | Three months | Nine months | ||||||||||||||
|---|---|---|---|---|---|---|---|---|---|---|---|---|---|---|---|---|---|
| | Notes | 2003 | 2002 | 2003 | 2002 | ||||||||||||
| Revenues | $ | 1,591.0 | $ | 1,617.9 | $ | 4,624.8 | $ | 4,548.6 | |||||||||
| Operating expenses: | |||||||||||||||||
| Cost of sales | 1,272.6 | 1,242.6 | 3,749.4 | 3,529.4 | |||||||||||||
| Selling, general and administrative | 115.5 | 129.4 | 385.3 | 382.1 | |||||||||||||
| Depreciation and amortization | 82.9 | 78.0 | 249.8 | 234.6 | |||||||||||||
| Impairment of assets, restructuring and other charges | 3 | (5.0 | ) | — | 76.8 | — | |||||||||||
| 1,466.0 | 1,450.0 | 4,461.3 | 4,146.1 | ||||||||||||||
| Operating income | 125.0 | 167.9 | 163.5 | 402.5 | |||||||||||||
| Financial expenses | 4 | 45.9 | 39.8 | 137.2 | 127.5 | ||||||||||||
| Income before income taxes | 79.1 | 128.1 | 26.3 | 275.0 | |||||||||||||
| Income taxes | 18.5 | 29.1 | 2.4 | 64.6 | |||||||||||||
| Income before minority interest | 60.6 | 99.0 | 23.9 | 210.4 | |||||||||||||
| Minority interest | 0.9 | 0.5 | 1.4 | 1.7 | |||||||||||||
| Net income | $ | 59.7 | $ | 98.5 | $ | 22.5 | $ | 208.7 | |||||||||
| Net income available to holders of preferred shares | 9.8 | 7.2 | 26.8 | 21.6 | |||||||||||||
| Net income (loss) available to holders of equity shares | $ | 49.9 | $ | 91.3 | $ | (4.3 | ) | $ | 187.1 | ||||||||
| Earnings (loss) per share: | 9 | ||||||||||||||||
| Basic | $ | 0.38 | $ | 0.65 | $ | (0.03 | ) | $ | 1.33 | ||||||||
| Diluted | $ | 0.38 | $ | 0.64 | $ | (0.03 | ) | $ | 1.31 | ||||||||
| Average number of equity shares outstanding | |||||||||||||||||
| (in millions) | 9 | ||||||||||||||||
| Basic | 131.8 | 140.9 | 137.4 | 140.6 | |||||||||||||
| Diluted | 135.7 | 145.5 | 137.4 | 145.4 | |||||||||||||
Retained earnings: | |||||||||||||||||
| Balance, beginning of period | $ | 771.8 | $ | 782.6 | $ | 901.9 | $ | 721.8 | |||||||||
| Net income | 59.7 | 98.5 | 22.5 | 208.7 | |||||||||||||
| Shares repurchased | 8 | (0.2 | ) | — | (39.2 | ) | (1.4 | ) | |||||||||
| Dividends: | |||||||||||||||||
| Equity shares | (17.1 | ) | (16.9 | ) | (53.9 | ) | (50.6 | ) | |||||||||
| Preferred shares | (9.8 | ) | (7.3 | ) | (26.9 | ) | (21.6 | ) | |||||||||
| Balance, end of period | $ | 804.4 | $ | 856.9 | $ | 804.4 | $ | 856.9 | |||||||||
See Notes to Consolidated Financial Statements.
12
Consolidated Statements of Cash Flows
Periods ended Septembre 30
(In millions of US dollars)
(Unaudited)
| | | Three months | Nine months | ||||||||||||||
|---|---|---|---|---|---|---|---|---|---|---|---|---|---|---|---|---|---|
| | Notes | 2003 | 2002 | 2003 | 2002 | ||||||||||||
| Operating activities: | |||||||||||||||||
| Net income | $ | 59.7 | $ | 98.5 | $ | 22.5 | $ | 208.7 | |||||||||
| Non-cash items in net income: | |||||||||||||||||
| Depreciation of property, plant and equipment | 82.1 | 77.8 | 247.9 | 233.3 | |||||||||||||
| Impairment of assets and non-cash portion of restructuring and other charges | 3 | — | — | 53.4 | — | ||||||||||||
| Future income taxes | 13.0 | 17.9 | (18.5 | ) | 40.2 | ||||||||||||
| Amortization of deferred charges | 6.4 | 5.6 | 18.8 | 16.4 | |||||||||||||
| Other | 2.1 | (1.1 | ) | 5.8 | 3.0 | ||||||||||||
| Changes in non-cash balances related to operations: | |||||||||||||||||
| Trade receivables | (182.3 | ) | (117.8 | ) | (49.6 | ) | (167.1 | ) | |||||||||
| Inventories | (39.2 | ) | (17.7 | ) | (3.4 | ) | (51.0 | ) | |||||||||
| Trade payables and accrued liabilities | 118.4 | 55.1 | (155.9 | ) | (51.4 | ) | |||||||||||
| Other current assets and liabilities | 7.3 | 27.8 | 2.4 | 8.4 | |||||||||||||
| Other non-current assets and liabilities | (7.7 | ) | (15.9 | ) | (57.9 | ) | (27.9 | ) | |||||||||
| Cash provided from operating activities | 59.8 | 130.2 | 65.5 | 212.6 | |||||||||||||
Financing activities: | |||||||||||||||||
| Net change in bank indebtedness | 0.1 | — | 0.9 | — | |||||||||||||
| Net proceeds from issuance of equity shares | 3.2 | 5.8 | 10.6 | 19.2 | |||||||||||||
| Repurchases of shares for cancellation | 8 | (0.2 | ) | — | (173.6 | ) | (3.5 | ) | |||||||||
| Issuance (repayments) of long-term debt | 14.6 | (92.8 | ) | 428.6 | (121.4 | ) | |||||||||||
| Dividends on equity shares | (17.1 | ) | (16.9 | ) | (53.9 | ) | (50.6 | ) | |||||||||
| Dividends on preferred shares | (11.1 | ) | (7.3 | ) | (25.9 | ) | (21.6 | ) | |||||||||
| Dividends to minority shareholders | — | — | (0.4 | ) | (1.9 | ) | |||||||||||
| Cash provided (used) from financing activities | (10.5 | ) | (111.2 | ) | 186.3 | (179.8 | ) | ||||||||||
Investing activities: | |||||||||||||||||
| Business acquisitions, net of cash and cash equivalents | 5 | — | (3.0 | ) | (7.5 | ) | (0.3 | ) | |||||||||
| Additions to property, plant and equipment | (35.6 | ) | (28.5 | ) | (205.6 | ) | (140.9 | ) | |||||||||
| Net proceeds from disposal of other assets | 0.9 | 3.0 | 2.2 | 7.3 | |||||||||||||
| Other | — | 8.4 | (0.8 | ) | 10.0 | ||||||||||||
| Cash used by investing activities | (34.7 | ) | (20.1 | ) | (211.7 | ) | (123.9 | ) | |||||||||
Effect of exchange rate changes on cash and cash equivalents | (4.3 | ) | 1.2 | (25.5 | ) | 7.0 | |||||||||||
| Net increase (decrease) in cash and cash equivalents | 10.3 | 0.1 | 14.6 | (84.1 | ) | ||||||||||||
| Cash and cash equivalents, beginning of period | 7.0 | 1.3 | 2.7 | 85.5 | |||||||||||||
| Cash and cash equivalents, end of period | $ | 17.3 | $ | 1.4 | $ | 17.3 | $ | 1.4 | |||||||||
| Supplemental cash flow information: | |||||||||||||||||
| Interest paid | $ | 58.4 | $ | 51.5 | $ | 143.0 | $ | 140.7 | |||||||||
| Income taxes paid (received) | 6.5 | (27.2 | ) | 38.8 | 5.2 | ||||||||||||
See Notes to Consolidated Financial Statements.
13
CONSOLIDATED BALANCE SHEETS
(In millions of US dollars)
| | Notes | September 30 2003 | December 31 2002 | September 30 2002 | |||||||||
|---|---|---|---|---|---|---|---|---|---|---|---|---|---|
| | | (Unaudited) | (Audited) | (Unaudited) | |||||||||
| Assets | |||||||||||||
| Current assets: | |||||||||||||
| Cash and cash equivalents | $ | 17.3 | $ | 2.7 | $ | 1.4 | |||||||
| Trade receivables | 540.0 | 466.9 | 533.2 | ||||||||||
| Receivables from related parties | 7.5 | 15.5 | 5.9 | ||||||||||
| Inventories | 426.4 | 409.4 | 430.4 | ||||||||||
| Income taxes receivable | 22.1 | 21.7 | 41.8 | ||||||||||
| Future income taxes | 27.8 | 27.8 | 58.2 | ||||||||||
| Prepaid expenses | 21.2 | 25.2 | 28.0 | ||||||||||
| Total current assets | 1,062.3 | 969.2 | 1,098.9 | ||||||||||
Property, plant and equipment, net | 2,586.1 | 2,610.6 | 2,635.1 | ||||||||||
| Goodwill | 6 | 2,562.3 | 2,514.3 | 2,493.3 | |||||||||
| Other assets | 127.1 | 113.3 | 123.8 | ||||||||||
| Total assets | $ | 6,337.8 | $ | 6,207.4 | $ | 6,351.1 | |||||||
| Liabilities and Shareholders' Equity | |||||||||||||
| Current liabilities: | |||||||||||||
| Bank indebtedness | $ | 1.2 | $ | 0.3 | $ | 0.1 | |||||||
| Trade payables | 463.9 | 581.2 | 577.8 | ||||||||||
| Accrued liabilities | 483.6 | 485.8 | 426.3 | ||||||||||
| Payables to related parties | 0.1 | 1.9 | 0.7 | ||||||||||
| Income and other taxes payable | 67.5 | 70.8 | 89.8 | ||||||||||
| Current portion of long-term debt and convertible notes | 22.4 | 38.5 | 43.2 | ||||||||||
| Total current liabilities | 1,038.7 | 1,178.5 | 1,137.9 | ||||||||||
Long-term debt | 2,135.8 | 1,668.6 | 1,937.0 | ||||||||||
| Other liabilities | 204.0 | 228.9 | 251.8 | ||||||||||
| Future income taxes | 278.8 | 291.7 | 282.8 | ||||||||||
| Convertible notes | 110.2 | 115.0 | 114.5 | ||||||||||
| Minority interest | 22.0 | 20.9 | 9.8 | ||||||||||
Shareholders' equity: | |||||||||||||
| Capital stock | 8 | 1,690.1 | 1,813.9 | 1,810.4 | |||||||||
| Additional paid-in capital | 103.5 | 103.6 | 104.6 | ||||||||||
| Retained earnings | 804.4 | 901.9 | 856.9 | ||||||||||
| Translation adjustment | (49.7 | ) | (115.6 | ) | (154.6 | ) | |||||||
| 2,548.3 | 2,703.8 | 2,617.3 | |||||||||||
| Total liabilities and shareholders' equity | $ | 6,337.8 | $ | 6,207.4 | $ | 6,351.1 | |||||||
See Notes to Consolidated Financial Statements.
14
NOTES TO CONSOLIDATED FINANCIAL STATEMENTS
Periods ended September 30, 2003 and 2002
(Tabular amounts are expressed in millions of US dollars, except for earnings per share amounts)
(Unaudited)
1. BASIS OF PRESENTATION
The Consolidated Financial Statements included in this report are unaudited and reflect normal and recurring adjustments which are, in the opinion of the Company, considered necessary for a fair presentation. These Consolidated Financial Statements have been prepared in conformity with Canadian generally accepted accounting principles. The same accounting policies as described in the Company's latest Annual Report have been used, with the exception of the new accounting changes described in note 2. However, these Consolidated Financial Statements do not include all disclosures required under Canadian generally accepted accounting principles and accordingly should be read in conjunction with the Consolidated Financial Statements and the notes thereto included in the Company's latest Annual Report. The results of operations for the interim periods should not be considered indicative of full year results due to the seasonality of the business.
Reclassification
Certain reclassifications have been made to prior years' amounts in order to conform with the basis of presentation adopted in the current year.
2. NEW ACCOUNTING STANDARDS
a) Guarantees
In February 2003, the Canadian Institute of Chartered Accountants ("CICA") issued Accounting Guideline 14,Disclosure of Guarantees (AcG-14), which clarifies disclosure requirements for certain guarantees. The Company adopted the new recommendations effective January 1, 2003.
In the normal course of business, the Company enters into numerous agreements that may contain features that meet the AcG-14 definition of a guarantee. AcG-14 defines a guarantee to be a contract (including an indemnity) that contingently requires the Company to make payments to a third party based on (i) changes in an underlying that is related to an asset, a liability or an equity of the guaranteed party, or (ii) failure of another party to perform under an obligating agreement.
Significant guarantees the Company has provided to third parties include the following:
Operating leases
The Company has guaranteed a portion of the residual values of certain of its assets under operating leases with expiry dates between 2003 and 2007, for the benefit of the lessor. If the fair value of the assets, at the end of their respective lease term, is less than the residual value garanteed, then the Company must, under certain conditions, compensate the lessor for a portion of the shortfall. The maximum exposure in respect of these guarantees is $112.2 million. As at September 30, 2003, the Company has recorded a liability of $2.4 million associated with these guarantees.
Sub-lease agreements
The Company has, for some of its assets under operating leases, entered into sub-lease agreements with expiry dates between 2003 and 2006. If the sub-lessee defaults under the agreement, the Company must, under certain conditions, compensate the lessor for the default. The maximum exposure in respect of these guarantees is $3.7 million. As at September 30, 2003, the Company has not recorded a liability associated with these guarantees, since it is not probable that the sub-lessee will default under the agreement. Recourse against the sub-lessee is also available, up to the total amount due.
Business and real estate disposals
In the sale of all or a part of a business or real estate, in addition to possible indemnification relating to failure to perform covenants and breach of representations and warranties, the Company may agree to indemnify against claims from its past conduct of the business. Typically, the term and amount of such indemnification will be limited by the agreement. The nature of these indemnification agreements prevents the Company from estimating the maximum potential liability that could be required to pay to guaranteed parties. The Company has not accrued any amount in the Consolidated balance sheet in respect to this item.
15
b) Disposal of long-lived assets and discontinued operations
In December 2002, the CICA's Accounting Standards Board ("AcSB") revised Handbook Section 3475,Disposal of Long-Lived Assets and Discontinued Operations. The revised Section 3475 is applicable to disposal activities initiated by an enterprise's commitment to a plan on or after May 1, 2003. Under this section, new standards are established for the recognition, measurement, presentation and disclosure of the disposal of long-lived assets by profit-oriented enterprises. New standards are also established for the presentation and disclosure of discontinued operations for profit-oriented enterprises and not-for-profit organizations. It applies to the disposal of non-monetary long-lived assets, including property, plant and equipment, intangible assets with finite useful lives and long-term prepaid assets. It requires an asset or group that will be disposed of other than by sale to continue to be classified as "held and used" until the disposal transaction occurs. As a result, the asset continues to be depreciated until the date of disposal. The Section also provides specific guidance on income statement display for a disposal group if an entity abandons or distributes to owners in a spin-off a long-lived asset together with other assets (and liabilities) as a group and that disposal group is a component of an entity. The effect of adopting the new recommendations did not have a significant impact on the consolidated balance sheet and consolidated statement of operations and retained earnings and cash flows as at September 30, 2003.
c) Termination benefits and costs associated with exit and disposal activities
In March 2003, the Emerging Issues Committee releasedAbstracts EIC-134,Accounting for Severance and Termination Benefits ("EIC-134"), and EIC-135,Accounting for Costs Associated with Exit and Disposal Activities (Including Costs Incurred in a Restructuring) ("EIC-135"). EIC-134 provides interpretive guidance to the accounting requirements for the various types of severance and termination benefits covered in CICA Handbook Section 3461,Employee Future Benefits. EIC-135 provides interpretive guidance for the timing of the recognition of a liability for costs associated with an exit or disposal activity. The new guidance requires that the liability be recognized for those costs only when the liability is incurred, that is, when it meets the definition of a liability in CICA Handbook Section 1000,Financial Statement Concepts. These new EICs also establish fair value as the objective for initial measurement of liabilities related to exit or disposal activities. Together, these two EICs are intended to harmonize Canadian GAAP with US SFAS No. 146,Accounting for Costs Associated with Exit or Disposal Activities ("FAS 146"). The Company adopted the new recommendations effective April 1, 2003.
3. IMPAIRMENT OF ASSETS, RESTRUCTURING AND OTHER CHARGES
During the third quarter of 2003, the Company recorded a net reversal of restructuring and other charges of $5.0 million. This is made of a $1.9 million charge related to third quarter initiatives, a $2.2 million reversal related to second quarter initiatives and $4.7 milion related to the net reversal of 2001-2002 initiatives as described below. For the nine-month period ended September 30, 2003, the Company recorded an impairment of assets, restructuring and other charges of $76.8 million. Non-cash items amounted to $53.4 million and cash items to $23.4 million. The non-cash portion includes an impairment of assets of $47.4 million and other charges of 2.8 million for the 2003 initiatives and $3.2 million related to previous years' initiatives.
Impairment of assets
During the second quarter of 2003, the Company reviewed the status of assets that became permanently idle following the prior years' restructuring initiatives and difficult economic conditions. The Company determined that these assets would not be redeployed as it was first considered under an economic recovery scenario, and as such, recorded an impairment of assets of $47.4 million.
Restructuring initiatives
2003 initiatives
During the third quarter of 2003, the Company continued its restructuring initiatives. A cash charge for workforce reduction of $1.9 million was taken for 240 employee positions, of which $1.4 million was for North America and $0.5 million for Latin America. The Company completed most of its June initiatives and re-evaluated the remaining costs, resulting in a reversal of $2.2 million of cash restructuring and other charges. The amount of $2.2 million included $1.9 million for Europe and $0.3 million in Latin America.
In the second quarter of 2003, the Company initiated new restructuring initiatives and other charges following the continued volume declines in certain business segments. A cash charge of $23.4 million was taken consisting of $17.6 million in workforce reduction costs and $5.8 million of additional closure costs of four smaller facilities. The amount of $17.6 million in workforce reduction costs included $5.8 million for Europe and $10.0 million for North America. Related to this, an asset write-down of $2.8 million was also recorded. Under these initiatives, 1,012 employee positions are being eliminated.
In summary, as of September 30, 2003, 1,174 employee positions have been eliminated under the 2003 restructuring initiatives, 69 will be terminated during the fourth quarter of 2003 and 9 terminations in Europe will be completed in 2004 when all the legal procedures and requirements are met. The workforce reductions affected all fixed cost areas of the Company both at the plant and corporate levels.
16
2002 and 2001 initiatives
During the third quarter, the execution of the 2002 and 2001 initiatives resulted in a net reversal of $4.7 million comprised of a cash overspend of $1.1 million and a $5.8 million reversal of prior year restructuring and other charges. For the nine months, cash overspending related to these initiatives amounted to $10.7 million and reversal to $10.4 million for a net charge of $0.3 million. The cash over-spending is related to costs of closed facilities not yet disposed of, and office leases not yet subleased and other completed initiatives. Under these initiatives, 3,927 employee positions were eliminated as at September 30, 2003, 105 positions will be terminated during the fourth quarter of 2003 and 15 terminations in Europe will be completed in 2004 when all the legal procedures and requirements are met.
In addition, during the second quarter of 2003, the Company also recorded an asset write-down of $3.2 million in relation with 2001and 2002 initiatives.
Continuity of reserve for restructuring and other charges
As at January 1, 2003, the balance of the restructuring reserve was $51.2 million. This amount related mostly to the workforce reduction across the platform. The Company utilized $36.3 million (before foreign currency changes) of the restructuring and other charges reserve during the nine-month period ended September 30, 2003.
The following table sets forth the Company's 2003 restructuring reserve and activities against the reserves carried forward from 2002:
| | Restructuring charges | Other charges | Total | ||||||||
|---|---|---|---|---|---|---|---|---|---|---|---|
| Balance as at December 31, 2002 | $ | 50.0 | $ | 1.2 | $ | 51.2 | |||||
Overspending of 2001-2002 initiatives | 8.9 | 1.8 | 10.7 | ||||||||
| Reversal of previous years' reserves | (10.4 | ) | — | (10.4 | ) | ||||||
| New 2003 initiatives: | |||||||||||
| June 30, 2003 | 21.1 | 2.3 | 23.4 | ||||||||
| Reversal in third quarter | (2.2 | ) | — | (2.2 | ) | ||||||
| September 30, 2003 | 1.9 | — | 1.9 | ||||||||
| 19.3 | 4.1 | 23.4 | |||||||||
Reserve utilized in 2003 | (33.0 | ) | (3.3 | ) | (36.3 | ) | |||||
Foreign currency changes | 1.7 | — | 1.7 | ||||||||
| Balance as at September 30, 2003 | $ | 38.0 | $ | 2.0 | $ | 40.0 | |||||
The utilization of the reserve is estimated to be as follows:
| | Worforce reduction costs | Leases, closed facilities carrying costs and other | Total | ||||||
|---|---|---|---|---|---|---|---|---|---|
| 2003 (fourth quarter) | $ | 8.4 | $ | 5.3 | $ | 13.7 | |||
| 2004 | 2.9 | 9.7 | 12.6 | ||||||
| 2005 | — | 4.4 | 4.4 | ||||||
| 2006 | — | 3.8 | 3.8 | ||||||
| 2007 | — | 2.7 | 2.7 | ||||||
| 2008 | — | 1.9 | 1.9 | ||||||
| 2009 and thereafter | — | 0.9 | 0.9 | ||||||
| $ | 11.3 | $ | 28.7 | $ | 40.0 | ||||
17
4. FINANCIAL EXPENSES
| | Three months | Nine months | |||||||||||
|---|---|---|---|---|---|---|---|---|---|---|---|---|---|
| | 2003 | 2002 | 2003 | 2002 | |||||||||
| Interest on long-term debt and convertible notes | $ | 38.0 | $ | 36.5 | $ | 112.8 | $ | 110.9 | |||||
| Interest on short-term debt | 2.7 | 1.2 | 7.5 | 4.9 | |||||||||
| Securitization fees | 3.4 | 3.8 | 10.7 | 11.4 | |||||||||
| Amortization of deferred financing costs | 0.8 | 0.9 | 2.6 | 2.6 | |||||||||
| Exchange losses (gains) | 1.6 | (1.1 | ) | 5.5 | 1.3 | ||||||||
| 46.5 | 41.3 | 139.1 | 131.1 | ||||||||||
Interest capitalized to the cost of equipment | (0.6 | ) | (1.5 | ) | (1.9 | ) | (3.6 | ) | |||||
| $ | 45.9 | $ | 39.8 | $ | 137.2 | $ | 127.5 | ||||||
5. BUSINESS ACQUISITIONS
During the first quarter of 2003, the Company completed the purchase price allocation and adjusted the assets and liabilities acquired of European Graphic Group S.A. The effect of these adjustments did not have a significant impact on the consolidated financial statements.
Also, during the first quarter, the Company acquired minority interests in Spain (Europe) for a cash consideration of $3.1 million, of which $2.2 million has been recorded in goodwill.
During the second quarter, the Company acquired minority interests in North America for a cash consideration of $4.4 million, of which $3.0 million has been recorded in goodwill.
6. GOODWILL
The changes in the carrying amount of goodwill for the nine-month period ended September 30, 2003 are as follows:
| | North America | Europe | Latin America | Total | ||||||||
|---|---|---|---|---|---|---|---|---|---|---|---|---|
| Balance as at January 1, 2003 | $ | 2,182.3 | $ | 324.8 | $ | 7.2 | $ | 2,514.3 | ||||
Goodwill acquired during the period | 3.0 | 2.2 | — | 5.2 | ||||||||
Foreign currency changes | 5.4 | 36.5 | 0.9 | 42.8 | ||||||||
Balance as at September 30, 2003 | $ | 2,190.7 | $ | 363.5 | $ | 8.1 | $ | 2,562.3 | ||||
18
7. STOCK-BASED COMPENSATION
The Company's compensation cost does not include stock-based compensation. The Company's pro forma net loss, loss per share and diluted loss per share would have been as follows if the compensation cost had been determined using the fair value based method at the date of grant for awards granted since January 2002.
| | Three months 2003 | Nine months 2003 | ||||||
|---|---|---|---|---|---|---|---|---|
| Pro forma net income | $ | 59.2 | $ | 20.6 | ||||
| Pro forma earnings (loss) per share: | ||||||||
| Basic | $ | 0.37 | $ | (0.04 | ) | |||
| Diluted | $ | 0.36 | $ | (0.04 | ) | |||
The pro forma disclosure omits the effect of awards granted before January 1, 2002. These pro forma amounts include a compensation cost calculated using the Black-Scholes option pricing model with the following assumptions:
| | September 30, 2003 | |
|---|---|---|
| Weighted average grant date fair value of options | $5.76 | |
| Risk-free interest rate | 4.61%-4.73% | |
| Dividend yield | 2%-4% | |
| Expected volatility | 26%-28% | |
| Expected life | 7 years |
The following table summarizes information about stock options:
| | September 30, 2003 | December 31, 2002 | |||
|---|---|---|---|---|---|
| Number of stock options at the end of the period | |||||
| Outstanding | 3,786,727 | 3,525,376 | |||
| Exercisable | 1,786,084 | 1,271,529 | |||
8. CAPITAL STOCK
| | September 30, 2003 | December 31, 2002 | | ||||||||||
|---|---|---|---|---|---|---|---|---|---|---|---|---|---|
| | Number | Amount | Number | Amount | Convertible Into | ||||||||
| Multiple voting shares | 46,987 | $ | 93.5 | 46,987 | $ | 93.5 | Subordinate shares | ||||||
| Subordinate voting shares | 84,802 | 1,140.0 | 94,158 | 1,263.8 | n/a | ||||||||
| Redeemable first preferred shares: | |||||||||||||
| Series 3 | 12,000 | 212.5 | 12,000 | 212.5 | Series 2 preferred shares | ||||||||
| Series 4 | 8,000 | 130.2 | 8,000 | 130.2 | Equity Share(1) | ||||||||
| Series 5 | 7,000 | 113.9 | 7,000 | 113.9 | Equity Share(1) | ||||||||
| 27,000 | 456.6 | 27,000 | 456.6 | ||||||||||
| Total capital stock | $ | 1,690.1 | $ | 1,813.9 | |||||||||
- (1)
- Under certain conditions
In June 2003, the Company repurchased for cancellation a total of 10,000,000 Subordinate Voting Shares pursuant to its Substantial Issuer Bid dated April 24, 2003 for a net cash consideration, including redemption fees, of Cdn $241.5 million ($173.6 million). The Substantial Issuer Bid expired at midnight (Montreal time) on the evening of June 2, 2003. The excess of the price paid over the book value of the shares repurchased was charged to retained earnings.
19
9. EARNINGS (LOSS) PER SHARE
The following table sets forth the computation of basic and diluted earnings per share:
| | Three months | Nine months | |||||||||||
|---|---|---|---|---|---|---|---|---|---|---|---|---|---|
| | 2003 | 2002 | 2003 | 2002 | |||||||||
| Net income (loss) available to holders of equity shares | $ | 49.9 | $ | 91.3 | $ | (4.3 | ) | $ | 187.1 | ||||
| Income impact on assumed conversion of convertible notes, net of income taxes | 1.1 | 1.2 | — | 3.6 | |||||||||
| Net income (loss) adjusted for dilution effect | $ | 51.0 | $ | 92.5 | $ | (4.3 | ) | $ | 190.7 | ||||
| (In millions) | |||||||||||||
| Weighted average number of equity shares outstanding | 131.8 | 140.9 | 137.4 | 140.6 | |||||||||
| Effect of dilutive convertible notes and stock options | 3.9 | 4.6 | — | 4.8 | |||||||||
| Weighted average number of diluted equity shares outstanding | 135.7 | 145.5 | 137.4 | 145.4 | |||||||||
| Earnings (loss) per share: | |||||||||||||
| Basic | $ | 0.38 | $ | 0.65 | $ | (0.03 | ) | $ | 1.33 | ||||
| Diluted | $ | 0.38 | $ | 0.64 | $ | (0.03 | ) | $ | 1.31 | ||||
For the nine months of 2003, diluted loss per share does not include the effects of the convertible notes and the stock options outstanding, as the effect of their inclusion is anti-dilutive.
10. SEGMENT DISCLOSURE
The Company operates in the printing industry. Its business groups are located in three main segments: North America, Europe and Latin America. The Company assesses the performance of each segment based on operating income. These segments are managed separately since they all require specific market strategies. Summarization of the segmented information is as follows:
| | North America | Europe | Latin America | Other | Inter- Segment | Total | |||||||||||||
|---|---|---|---|---|---|---|---|---|---|---|---|---|---|---|---|---|---|---|---|
| Three months ended September 30, | |||||||||||||||||||
2003 | |||||||||||||||||||
| Revenues | $ | 1,282.3 | $ | 267.7 | $ | 40.2 | $ | — | $ | 0.8 | $ | 1,591.0 | |||||||
| Operating income | 107.5 | 15.1 | 0.7 | 1.7 | — | 125.0 | |||||||||||||
| Impairment of assets, restructuring and other charges | 2.4 | (7.6 | ) | 0.1 | 0.1 | — | (5.0 | ) | |||||||||||
2002 | |||||||||||||||||||
| Revenues | $ | 1,324.2 | $ | 248.5 | $ | 45.2 | $ | — | $ | — | $ | 1,617.9 | |||||||
| Operating income (loss) | 157.8 | 13.1 | 5.2 | (8.2 | ) | — | 167.9 | ||||||||||||
| Nine months ended September 30, | |||||||||||||||||||
2003 | |||||||||||||||||||
| Revenues | $ | 3,700.9 | $ | 794.2 | $ | 128.4 | $ | — | $ | 1.3 | $ | 4,624.8 | |||||||
| Operating income (loss) | 178.1 | 5.1 | (14.3 | ) | (5.4 | ) | — | 163.5 | |||||||||||
Impairment of assets, restructuring and other charges | 60.6 | 5.6 | 9.7 | 0.9 | — | 76.8 | |||||||||||||
2002 | |||||||||||||||||||
| Revenues | $ | 3,714.8 | $ | 699.3 | $ | 135.2 | $ | — | $ | (0.7 | ) | $ | 4,548.6 | ||||||
| Operating income (loss) | 389.1 | 26.6 | 10.2 | (23.4 | ) | — | 402.5 | ||||||||||||
20
Quebecor World Head Office
612 St. Jacques Street, Montreal, Quebec, Canada H3C 4M8
Tel.: (514) 954-0101 (800) 567-7070 Fax: (514) 954-9624
www.quebecorworld.com
Pursuant to the requirements of the Securities Exchange Act of 1934, the registrant has duly caused this report to be signed on its behalf by the undersigned, thereunto duly authorized.
| QUEBECOR WORLD INC. | |||
By: | /s/ RAYNALD LECAVALIER | ||
| Name: | Raynald Lecavalier | ||
| Title: | Vice President, Corporate General Counsel and Secretary | ||
Date: | November 27, 2003 | ||
QUEBECOR WORLD INC. Filed in this Form 6-K
QUEBECOR WORLD[nc_NB] INC. FINANCIAL HIGHLIGHTS
Segmented Results of Operations ($ millions) Selected Performance Indicators
Total Debt and Accounts Receivable Securitization ($ millions)
Contractual Cash Obligations ($ millions)
Consolidated Statements of Operations and Retained Earnings
Consolidated Statements of Cash Flows
CONSOLIDATED BALANCE SHEETS
NOTES TO CONSOLIDATED FINANCIAL STATEMENTS Periods ended September 30, 2003 and 2002 (Tabular amounts are expressed in millions of US dollars, except for earnings per share amounts) (Unaudited)
HEAD OFFICE
SIGNATURES