I am pleased to report that assets in the Funds continue to grow on the strength of shareholder contributions and strong investment performance. I am also pleased to report that our Funds continue to gain recognition from fund rating services and investors for our performance and disciplined investment process. We are looking forward to an exciting year.
The National Hockey League is back in action after a year-long suspension of play while the owners and players resolved their differences. Ice hockey ranks at the bottom of the major sports as measured by spectators, but it enjoys especially strong support from those who have played the game. This support may be based on the appreciation by those former players of just how hard it is to play. In addition, new rule changes have brought back the “old time hockey” that many of us loved to play and watch.
Ice hockey demands that players have great athletic skills, stamina, strength, speed, and determination. The average person will readily concede that ice skating is difficult enough, but skating with a stick in your hand changes everything. Skating with a stick in your hand, at high speed, with skill and finesse, while trying to avoid opposing players trying to run you over, takes that difficulty to a whole new level. In addition, skating is so exhausting that even the most superbly conditioned athletes can only play for about two minutes per shift.
But “old time hockey” has other aspects of the game that go beyond skating, skills, and finesse. To be successful as a player and a team you had to be willing to go into the corners to dig out the puck. Some of the toughest battles occur up against the boards trying to gain control to set up a teammate for a scoring opportunity. These battles in the corners and in front of the net often leave players battered and bloody, but they are essential to win in the long run.
Investing is a lot like an ice hockey game. Investors need skill, stamina, and discipline, but they also need to be willing to “go into the corners” sometimes. Successful investing is not without risk, so investors must manage their risk exposure within a reasonable tolerance rather that avoiding it altogether. You will get battered and bloody sometimes, but in the end it is the only option if you want to be successful.
The Manor Fund
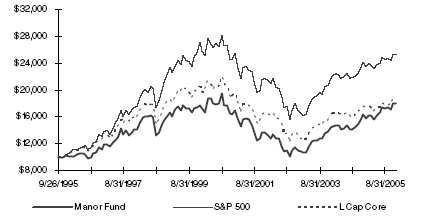
The Manor Fund rose 4.20%, net of all fees and expenses, during the quarter ending December 31, 2005, outperforming the S&P 500 index (2.08%) but less than comparable mutual funds as measured by the Lipper Large-Cap Core mutual fund index (5.32%). The Fund also outperformed the S&P 500 and the Lipper Large-Cap Core mutual fund index for the trailing 1-year, 3-year and 5-year periods ending December 31, 2005, with returns of 10.64%, 18.22%, and 1.98%, compared to the S&P 500 (4.89%, 14.37%, and 0.56%), and the Lipper mutual fund index (5.72%, 12.62%, and -0.38%). During the 4th quarter of 2005 the Fund was helped by gains in Jabil Circuit, Alcan, Endo Pharmaceuticals, Freddie Mac, and Nucor.
Jabil Circuit, a manufacturer of computer components, rose on stronger earnings and a rebound in the information technology sector. Alcan rose on strong earnings supported by rising aluminum prices. Endo Pharmaceuticals, a recent addition to the Fund, rose after reporting strong earnings. Freddie Mac rebounded as investors anticipated the end of interest rate hikes by the Fed. Nucor, a mini-mill steel producer, rose on strong demand and the strength in steel prices.
Notable laggards during the 4th quarter include Corning, Johnson & Johnson, Occidental Petroleum, and Devon Energy. Corning was a strong performer earlier in the year and pulled back towards year-end. The decline in Johnson & Johnson was due, in part, to its buyout offer for Guidant. The offer created uncertainty after Guidant announced product recalls. JNJ eventually reduced the buyout price, and will probably avoid the deal entirely after Boston Scientific submitted a higher bid. I expect that JNJ will benefit by walking away from the bidding process. Occidental Petroleum and Devon Energy both declined, in conjunction with the entire energy sector after a strong run-up earlier in the year. Many investors took profits in these stocks in anticipation of a slowdown of the rise in energy prices.
During the quarter we sold Pfizer, S&P Barra Value ishares and a portion of our holdings in Shurgard Storage and reinvested the proceeds in Colgate Palmolive, Corning, and Endo Pharmaceuticals. Pfizer seems to be struggling with generic competition, so we replaced it with Endo Pharmaceuticals, a company the we believe has better growth prospects. Colgate Palmolive provides us with a solid company in the consumer staples sector, while Corning has improved prospects in glass components for large screen TV’s.
3
The Growth Fund
The Growth Fund rose 3.30%, net of all fees and expenses, during the quarter ending December 31, 2005, outperforming the S&P 500 index (2.08%) and comparable mutual funds as measured by the Lipper Large-Cap Growth mutual fund index (2.31%). The Fund also outperformed the S&P 500 and the Lipper Large-Cap Growth mutual fund index for each of the trailing 1-year, 3-year, and 5-year periods ending December 31, 2005, with returns for the Fund of 9.21%, 16.74%, and 3.39%, compared to the S&P 500 (4.89%, 14.37%, 0.56%), and the Lipper mutual fund index (7.58%, 13.63%, and -4.29%). The Fund was helped by gains in Express Scripts, Etrade Financial, Fedex Corp., Ace Limited, and Golden West Financial.
Express Scripts, a pharmacy benefits manager, rose on strong earnings due to its ability to execute well in this very difficult industry. Etrade Financial continued its strong performance from the previous quarter. Fedex Corp. rose on investor expectations of a strong holiday online shopping season. Ace Limited rebounded on an increase in casualty insurance premiums after the recent hurricane season. Golden West Financial rebounded as investors regained confidence in the ability of this thrift to manage rising interest rates.
Weak holdings in the portfolio included Bed, Bath & Beyond, Valero Energy, TXU Corp., Dell, and Cendant. Bed, Bath & Beyond fell after reducing earnings expectations and disappointing same store sales. Valero Energy and TXU Corp., both centered in the Gulf Coast region, suffered from lost business from the severe hurricanes this season. It remains to be seen if this setback is a short-term event or long-term problem. Dell fell sharply after pre-announcing revenue growth below investor expectations, and Cendant continues to struggle with a slowdown in travel resulting from higher energy prices.
During the quarter we sold Ivax Corp. and a portion of our holdings in Express Scripts. Ivax was taken over by Teva Pharmaceuticals and we elected to liquidate the position rather than receive shares of Teva. Express Scripts had appreciated substantially during the year and we took the opportunity to realize some profits. We used the proceeds to purchase Broadcom and Schering Plough. EMC, a maker of computer storage devices, is attractively valued based on our earnings and cash flow models. Robert Half provides specialized staffing services, and is well positioned to benefit from economic growth and changing employee staffing requirements.
4
The Bond Fund
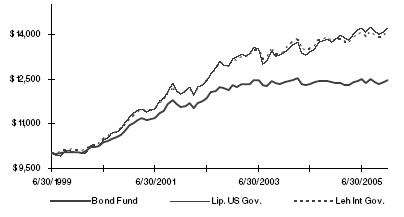
The Bond Fund generated a return of 0.47%, net of all fees and expenses, for the quarter ending December 31, 2005, slightly less than the Lehman Intermediate Treasury Index and the Lipper US Government mutual fund index (0.69% and 0.63%, respectively). For the year ending December 31, 2005, the Fund generated a return of 0.66%, less than the Lehman Intermediate Treasury Index (1.59%) and the Lipper US Government mutual fund index (2.51%). Performance over the recent quarter reflects the relatively conservative position of the Fund’s investment portfolio of US Treasury securities. The portfolio has an average yield to maturity of 4.30%, an average maturity of approximately 5.65 years, and an average duration of 3.68 years. The duration of a bond portfolio is a measure of risk, with a lower duration indicating a lower level of risk. The Fund is managed to provide a low-risk alternative for conservative investors.
Digging Out Investment Opportunities
Stocks face numerous battles as the new year begins. Continuing interest rate hikes by the Fed, high energy and commodity prices, moderating economic growth, growing federal deficits and stretched consumer debt will make it difficult for the market to gain any sustainable momentum. It won’t be easy to invest in the stock market, but with a cool down in the real estate market, and moderate fixed income yields, investors have limited alternatives. Despite the uncertainty, we remain fully invested while searching for investment opportunities where the return potential justifies the risk.
| | Sincerely,
Daniel A. Morris |
5
MANOR INVESTMENT FUNDS, INC.
Manor Fund
December 31, 2005
| Top Holdings & Sectors |
| Top Company Holdings | | | Top Industry Sectors |
|
|
| | |
|
|
|
Company | | % of
Net Assets | | | Industry | | % of
Net Assets |
| |
|
| | |
| |
|
| Wellpoint | | 4.4 | % | | | Financial | | 15.2 | % |
| Reebok Int. | | 3.7 | % | | | Information Tech. | | 14.4 | % |
| Jabil Circuit | | 3.6 | % | | | Industrial | | 13.5 | % |
| Endo Pharm. | | 3.4 | % | | | Health Care | | 13.4 | % |
| Norfolk Southern | | 3.3 | % | | | Consumer Disc. | | 12.5 | % |
| | | | | | | | | | |
| Fund Performance |
Value of $10,000 invested in the Fund
Inception (9/26/95) to present (12/31/05)
Compared to the S&P 500 and Lipper Large Cap Core Index
| Quarter and Annualized Total Return for Periods Ending December 31, 2005 |
| | | Manor Fund | |
S&P 500
Index | | Lipper LC
Core Funds |
| | |
|
| |
|
| |
|
|
| 4th Quarter | | 4.20 | % | | 2.08 | % | | 5.32 | % |
| 1-Year | | 10.64 | % | | 4.89 | % | | 5.72 | % |
| 3-Year Annualized | | 18.22 | % | | 14.37 | % | | 12.62 | % |
| 5-Year Annualized | | 1.98 | % | | 0.56 | % | | -0.38 | % |
| Annualized since inception 12/31/93 | | 5.92 | % | | 9.45 | % | | 6.24 | % |
| | | | | | | | | | |
| | | | | | | | | | |
| The S&P 500 Index is a capital-weighted index, representing the aggregate market value of the common equity of 500 stocks primarily traded on the New York Stock Exchange. The Lipper LC Core mutual fund index is an index of mutual funds managed with a similar investment style. Both are computed on a total return basis. The chart assumes an initial gross investment of $10,000 on 9/25/1995 (commencement of operations). Returns shown include the reinvestment of dividends. Past performance does not predict future performance. Investment return and principal value will fluctuate, so your shares at redemption may be worth more or less than the original cost. |
6
MANOR INVESTMENT FUNDS, INC.
Growth Fund
December 31, 2005
| Top Holdings & Sectors |
| Top Company Holdings | | | Top Industry Sectors |
|
|
| | |
|
|
|
Company | | % of
Net Assets | | | Industry | | % of
Net Assets |
| |
|
| | |
| |
|
| ETrade Financial | | 3.8 | % | | | Information Tech. | | 19.5 | % |
| Coach | | 3.8 | % | | | Financial | | 18.2 | % |
| Valero Energy | | 3.7 | % | | | Consumer Disc. | | 17.5 | % |
| Baker Hughes | | 3.7 | % | | | Health Care | | 16.3 | % |
| Qualcomm | | 3.6 | % | | | Energy | | 7.4 | % |
| | | | | | | | | | |
| Fund Performance |
Value of $10,000 invested in the Fund
Inception (6/30/99) to present (12/31/05)
Compared to the S&P 500 and Lipper Large-Cap Growth Index

| Quarter and Annualized Total Return for Periods Ending December 31, 2005 |
| | | Growth Fund | | S&P 500
Index | | Lipper LC
Growth Funds |
| | |
| |
| |
|
| 4th Quarter | | 3.30 | % | | 2.08 | % | | 2.31 | % |
| 1-Year | | 9.21 | % | | 4.89 | % | | 7.58 | % |
| 3-Year Annualized | | 16.74 | % | | 14.37 | % | | 13.63 | % |
| 5-Year Annualized | | 3.39 | % | | 0.56 | % | | -4.29 | % |
| Annualized since inception 6/30/93 | | 1.85 | % | | 0.10 | % | | -4.66 | % |
| | | | | | | | | | |
| | | | | | | | | | |
| The S&P 500 Index is a capital-weighted index, representing the aggregate market value of the common equity of 500 stocks primarily traded on the New York Stock Exchange. The Lipper LC Growth mutual fund index is an index of mutual funds managed with a similar investment style. Both are computed on a total return basis. The chart assumes an initial gross investment of $10,000 on 6/30/1999 (commencement of operations). Returns shown include the reinvestment of dividends. Past performance does not predict future performance. Investment return and principal value will fluctuate, so your shares at redemption may be worth more or less than the original cost. |
7
MANOR INVESTMENT FUNDS, INC.
Largest Holdings and Asset Allocation
December 31, 2005
Manor Fund
Largest Holdings | | | Manor Fund
Industry Sectors |
|
|
| | |
|
|
|
| Security | | % of
Net Assets | | | Industry | | % of
Net Assets |
| |
|
| | |
| |
|
| Wellpoint, Inc. | | 4.4 | % | | | Financial | | 15.3 | % |
| Reebok Int. | | 3.7 | % | | | Information Technology | | 14.5 | % |
| Jabil Circuit | | 3.6 | % | | | Industrial | | 13.5 | % |
| Endo Pharmaceuticals | | 3.4 | % | | | Health Care | | 13.4 | % |
| Norfolk Southern | | 3.3 | % | | | Consumer Discretionary | | 12.5 | % |
| Weatherford Int. | | 3.1 | % | | | Energy | | 11.2 | % |
| Exelon | | 3.1 | % | | | Consumer Staples | | 6.0 | % |
| Manor Care, Inc. | | 3.1 | % | | | Cash Equivalents | | 5.3 | % |
| Colgate Palmolive | | 3.1 | % | | | Utility | | 3.1 | % |
| Best Buy, Inc. | | 3.0 | % | | | Material | | 2.6 | % |
| | | | | | | Index Securities | | 2.6 | % |
| | | | | | | | |
| |
| | | | | | | | | 100.0 | % |
| | | | | | | | |
| |
| | | | |
Growth Fund
Largest Holdings | | | Growth Fund
Industry Sectors |
|
|
| | |
|
|
|
| Security | | % of
Net Assets | | | Industry | | % of
Net Assets |
| |
|
| | |
| |
|
| ETrade Financial | | 3.8 | % | | | Information Technology | | 19.5 | % |
| Coach Inc. | | 3.8 | % | | | Financial | | 18.2 | % |
| Valero Energy | | 3.7 | % | | | Consumer Discretionary | | 17.5 | % |
| Baker-Hughes | | 3.7 | % | | | Health Care | | 16.4 | % |
| Qualcomm | | 3.6 | % | | | Energy | | 7.4 | % |
| Ace Limited | | 3.5 | % | | | Industrial | | 7.3 | % |
| Capital One | | 3.4 | % | | | Cash Equivalent | | 4.7 | % |
| Express Scripts | | 3.3 | % | | | Consumer Staples | | 4.5 | % |
| Golden West Financial | | 3.2 | % | | | Utility | | 2.5 | % |
| Robert Half Intl. | | 3.2 | % | | | Index Securities | | 2.0 | % |
| | | | | | | | |
| |
| | | | | | | | | 100.0 | % |
| | | | | | | | |
| |
Bond Fund
Largest Holdings |
|
| Security | | % of
Net Assets | |
| |
|
|
| US Treasury 3.875% Due 07-15-10 | | 22.3 | % |
| US Treasury 3.625 % Due 07-15-09 | | 13.9 | % |
| US Treasury 3.250% Due 08-15-07 | | 11.2 | % |
| US Treasury 4.000% Due 02-15-14 | | 11.1 | % |
| US Treasury 3.500% Due 12-15-09 | | 11.0 | % |
| US Treasury 3.875% Due 02-15-13 | | 11.0 | % |
| US Treasury 3.125% Due 10-15-08 | | 11.0 | % |
| US Treasury 2.250% Due 02-15-07 | | 5.6 | % |
8
Back to Contents
MANOR INVESTMENT FUNDS, INC.
Manor Fund and Growth Fund
Expenses
December 31, 2005
As a shareholder of the Fund, you incur indirect costs, such as management fees, and other Fund operating expenses. This example is intended to help you understand your indirect costs, also referred to as “ongoing costs,” (in dollars) of investing in the Fund, and to compare these costs with the ongoing costs of investing in other mutual funds.
This example is based on an investment of $1,000 invested at the beginning of the period and held for the entire 6 month period of July 1, 2005 through December 31, 2005.
Actual Expenses
The first line of the table below provides information about actual account values and actual expenses. You may use the information in this line, together with the amount you invested at the beginning of the period, to estimate the expenses that you paid over the period. Simply divide your account value by $1,000 (for example, an $8,600 account value divided by $1,000 = 8.6), then multiply the result by the number in the first line under the heading “Expenses Paid During Period” to estimate the expenses you paid on your account during this period.
Hypothetical example for comparison purposes
The second line of the table provides information about hypothetical account values and hypothetical expense based on the Funds’ actual expense ratio and an assumed rate of return of 5% per year before expenses, which is not the Funds’ actual return. The hypothetical account values and expenses may not be used to estimate the actual ending account balance or expenses you paid for the period. You may use this information to compare ongoing costs of investing in the Fund and other funds. To do so, compare this 5% hypothetical example with the 5% hypothetical examples that appear in the shareholder reports of other funds.
Please note that the expenses shown in the table are meant to highlight your ongoing costs only and do not reflect any direst costs, such as wire fees or low balance fees. Therefore, the second line of the table is useful in comparing ongoing costs only, and will not help you determine the relative total costs of owning different funds. In addition, if these direct costs were included, your costs would be higher.
| | | Beginning
Account Value
July 1, 2005 | | Ending
Account Value
December 31, 2005 | | Expenses Paid
During Period*
July 1, 2005 -
December 31, 2005 | |
| Manor Fund | |
| |
| |
| |
| Actual Manor Fund | | $ 1,000.00 | | $ 1,087.84 | | $ 7.89 | |
Hypothetical
(5% return before expenses) | | 1,000.00 | | 1,017.64 | | 7.63 | |
| Growth Fund | | | | | | | |
| Actual Growth Fund | | 1,000.00 | | 1,086.39 | | 7.89 | |
Hypothetical
(5% return before expenses) | | 1,000.00 | | 1,017.64 | | 7.63 | |
| * | Expenses are equal to the Funds’ annualized expense ratios, capped at 1.5%, which is net of any expenses paid indirectly, multiplied by the average account value over the period. The ending account value for each Fund in the table is based on its actual total return for the 6 month period of July 1, 2005 to December 31, 2005, 8.64% for the Manor Fund, and 8.78% for the Growth Fund. |
9
MANOR INVESTMENT FUNDS, INC.
Bond Fund
December 31, 2005
| Top Holdings |
| Security | % of
Net Assets | | |
| |
| | |
| US Treasury 3.875% due 7/15/10 | | | 22.3 | % | |
| US Treasury 3.625% due 7/15/09 | | | 13.9 | % | |
| US Treasury 3.250% due 8/15/07 | | | 11.2 | % | |
| US Treasury 4.000% due 2/15/14 | | | 11.1 | % | |
| US Treasury 3.500% due 12/15/09 | | | 11.0 | % | |
| |
| Fund Performance |
Value of $10,000 invested in the Fund
Inception (6/30/99) to present (12/31/05)
Compared to the Lehman Int. Gov’t and Lipper Gov’t Index
| Quarter and Annualized Total Return for Periods Ending December 31, 2005 |
| | Bond
Fund | | Lipper
US Gov’t
Fund Index | | Lehman
Intermediate
Gov’t Index |
| |
| |
| |
|
| 4th Quarter | 0.47 | % | | 0.69 | % | | 0.63 | % |
| 1-Year | 0.66 | % | | 2.51 | % | | 1.59 | % |
| 3-Year Annualized | 0.46 | % | | 2.53 | % | | 2.21 | % |
| 5-Year Annualized | 2.62 | % | | 4.80 | % | | 4.73 | % |
| Annualized since inception 6/30/99 | 3.41 | % | | 5.52 | % | | 5.34 | % |
| | | | | | | | | |
| | | | | | | | | |
| The Lehman Intermediate Government Index is represents the aggregate market value of the US Government securities with a maximum maturity of 10 years. The Lipper US Government mutual fund index is an index of mutual funds managed using US Government securities. Both are computed on a total return basis. The chart assumes an initial gross investment of $10,000 on 6/30/1999 (commencement of operations). Returns shown include the reinvestment of dividends. Past performance does not predict future performance. Investment return and principal value will fluctuate, so your shares at redemption may be worth more or less than the original cost. |
10
MANOR INVESTMENT FUNDS, INC.
Bond Fund
Expenses
December 31, 2005
As a shareholder of the Fund, you incur indirect costs, such as management fees, and other Fund operating expenses. This example is intended to help you understand your indirect costs, also referred to as “ongoing costs,” (in dollars) of investing in the Fund, and to compare these costs with the ongoing costs of investing in other mutual funds.
This example is based on an investment of $1,000 invested at the beginning of the period and held for the entire 6 month period of July 1, 2005 through December 31, 2005.
Actual Expenses
The first line of the table below provides information about actual account values and actual expenses. You may use the information in this line, together with the amount you invested at the beginning of the period, to estimate the expenses that you paid over the period. Simply divide your account value by $1,000 (for example, an $8,600 account value divided by $1,000 = 8.6), then multiply the result by the number in the first line under the heading “Expenses Paid During Period” to estimate the expenses you paid on your account during this period.
Hypothetical example for comparison purposes
The second line of the table provides information about hypothetical account values and hypothetical expense based on the Fund’s actual expense ratio and an assumed rate of return of 5% per year before expenses, which is not the Fund’s actual return. The hypothetical account values and expenses may not be used to estimate the actual ending account balance or expenses you paid for the period. You may use this information to compare ongoing costs of investing in the Fund and other funds. To do so, compare this 5% hypothetical example with the 5% hypothetical examples that appear in the shareholder reports of other funds.
Please note that the expenses shown in the table are meant to highlight your ongoing costs only and do not reflect any direst costs, such as wire fees or low balance fees. Therefore, the second line of the table is useful in comparing ongoing costs only, and will not help you determine the relative total costs of owning different funds. In addition, if these direct costs were included, your costs would be higher.
| | | Beginning
Account Value
July 1, 2005 | | Ending
Account Value
December 31, 2005 | | Expenses Paid
During Period*
July 1, 2005 -
December 31, 2005 | |
| Bond Fund, | |
| |
| |
| |
| Actual Manor Fund | | $ 1,000.00 | | $ 996.18 | | $ 5.03 | |
Hypothetical
(5% return before expenses) | | 1,000.00 | | 1,020.16 | | 5.09 | |
| * | Expenses are equal to the Fund’s annualized expense ratio, capped at 1.0%, which is net of any expenses paid indirectly, multiplied by the average account value over the period. The ending account value for the Fund in the table is based on its actual total return for the 6 month period of July 1, 2005 to December 31, 2005, of -0.39%. |
11
Manor Investment Funds, Inc.
Financial Statements
December 31, 2005
12
REPORT OF INDEPENDENT REGISTERED
PUBLIC ACCOUNTING FIRM
To the Shareholders and Board of Directors
of the Manor Investment Funds, Inc.
We have audited the accompanying statements of assets and liabilities of Manor Fund, Growth Fund and Bond Fund (collectively the “Funds”), the funds comprising the Manor Investment Funds, Inc., including the schedules of investments, as of December 31, 2005 and the related statements of operations, for the year then ended, and the statements of changes in net assets for each of the two years in the period then ended and the financial highlights for each of the three years in the period then ended. These financial statements and financial highlights are the responsibility of the Funds’ management. Our responsibility is to express an opinion on these financial statements based on our audit. The financial highlights for each of the two years in the period ended December 31, 2002, were audited by other auditors whose report dated January 28, 2003 expressed an unqualified opinion on this information.
We conducted our audits in accordance with the standards of the Public Company Accounting Oversight Board (United States). Those standards require that we plan and perform the audit to obtain reasonable assurance about whether the financial statements and financial highlights are free of material misstatement. An audit includes examining, on a test basis, evidence supporting the amounts and disclosures in the financial statements. Our procedures included confirmation of securities owned as of December 31, 2005, by correspondence with the custodian and brokers. An audit also includes assessing the accounting principles used and significant estimates made by management, as well as evaluating the overall financial statement presentation. We believe that our audits provide a reasonable basis for our opinion.
In our opinion, the financial statements and financial highlights referred to above present fairly, in all material respects, the financial positions of the Funds as of December 31, 2005, the results of their operations for the year then ended, the changes in their net assets for each of the two years in the period then ended, and the financial highlights for each of the three years in the period then ended, in conformity with accounting principles generally accepted in the United States of America.
Abington, Pennsylvania
February 11, 2006 | /s/ Sanville & Company |
13
MANOR INVESTMENT FUNDS, INC.
MANOR FUND
Schedule of Investments
December 31, 2005
| Description | Shares | | Market
Value | |
Description | Shares | | Market
Value | |
|
|
|
|
|
|
|
|
| |
| COMMON STOCKS - 92.1% | | | | | | | | |
| | | | | | | | | |
| Consumer Discretionary - 12.5% | | | | Information Technology - 14.5% | | | |
| | | | | | Cisco Systems* | 2,350 | $ | 40,232 | |
| Best Buy Co., Inc. | 2,325 | $ | 101,091 | | Citrix Systems* | 2,570 | | 73,836 | |
| Home Depot | 2,390 | | 96,747 | | Corning, Inc.* | 4,700 | | 92,402 | |
| KB Home | 1,290 | | 93,731 | | Intel Corp. | 2,980 | | 74,381 | |
| Reebok Int., Ltd. | 2,090 | | 121,701 | | Int. Bus. Machines | 950 | | 78,090 | |
| | | |
| | Jabil Circuit* | 3,220 | | 119,430 | |
| | | | 413,270 | | | | |
| |
| Consumer Staples - 6.0% | | |
| | | | | 478,371 | |
| Colgate Palmolive | 1,870 | | 102,570 | | Material - 2.6% | | |
| |
| Pepsico, Inc. | 1,640 | | 96,891 | | Nucor Corp. | 1,290 | | 86,069 | |
| | | |
| | | | |
| |
| | | | 199,461 | | | | | 86,069 | |
| | | |
| | | | |
| |
| Energy - 11.2% | | | | | Utility - 3.1% | | | | |
| Devon Energy | 1,190 | | 74,423 | | Exelon | 1,940 | | 103,092 | |
| Nabors* | 1,310 | | 99,232 | | | | |
| |
| Occidental Pet. | 1,190 | | 95,057 | | | | | 103,092 | |
| Weatherford Int.* | 2,860 | | 103,532 | | | | |
| |
| | | |
| | | | | | |
| | | | 372,244 | | TOTAL COMMON STOCKS
(Cost $2,287,238) | | | 3,050,206 | |
| | | |
| | | | |
| |
Financial - 15.3%
| | | | | | | | | |
| Allstate Insurance | 1,830 | | 98,948 | | | | | | |
| Citigroup, Inc. | 1,969 | | 95,556 | | INDEX SECURITIES - 2.6% | | | | |
| Fannie Mae | 1,020 | | 49,786 | | SPDR Trust | 690 | | 85,912 | |
| Freddie Mac | 1,440 | | 94,104 | | | | |
| |
| MBNA Corp. | 3,070 | | 83,350 | | | | | | |
| Vornado Realty Tr. | 1,010 | | 84,305 | | | | | | |
| | | |
| | TOTAL INDEX SECURITIES
(Cost $59,756) | | | 85,912 | |
| | | | 506,049 | | | | |
| |
| | | |
| | | | | | |
Health Care - 13.4%
Endo Pharm.* | 3,730 | | 112,870 | | | | | | |
| Johnson & Johnson | 1,350 | | 81,135 | | SHORT-TERM INVESTMENTS - 5.3% | | | |
| Manor Care, Inc. | 2,590 | | 103,004 | | 1st Amer. Gov. Fund | 124,483 | | 124,483 | |
| Wellpoint, Inc.* | 1,840 | | 146,814 | | 1st National M Mkt | 51,174 | | 51,174 | |
| | | |
| | TOTAL SHORT-TERM INVESTMENTS | |
| |
| | | | 443,823 | | (Cost $175,657) | | | 175,657 | |
| | | |
| | | | |
| |
| Industrial - 13.5% | | | | | | | | | |
| Alcan (Canada) | 1,940 | | 79,443 | | | | | | |
| Deere & Co. | 980 | | 66,748 | | TOTAL INVESTMENTS - 100.0%
(Cost $2,522,651) | | 3,311,775 | |
| General Electric | 2,270 | | 79,563 | | | | | | |
| Norfolk Southern | 2,410 | | 108,040 | | | | | | |
| Paccar, Inc. | 630 | | 43,615 | | | | | | |
| Tyco, Inc. | 2,440 | | 70,418 | | Other Assets less Liabilities -
Net – less than 0.1% | | | (1,214 | ) |
| | | |
| | | | |
| |
| | | | 447,827 | | NET ASSETS – 100.0% | | $ | 3,310,561 | |
| | | |
| | | | |
| |
*Non-income producing during the year
The accompanying notes are an integral part of these financial statements.
14
MANOR INVESTMENT FUNDS, INC.
GROWTH FUND
Schedule of Investments
December 31, 2005
Description | Shares | | | Market
Value | | |
Description | Shares | | | Market
Value | |
|
|
|
|
|
|
|
|
| |
|
|
|
| COMMON STOCKS - 93.3% | | | | | | | | | | | | |
| Consumer Discretionary - 17.5% | | | | | | | Information Technology - 19.5% | | | | | |
| Bed, Bath, Beyond* | 2,080 | | $ | 75,192 | | | Broadcom Corp-A* | 2,530 | | $ | 119,290 | |
| Coach Inc.* | 4,280 | | | 142,695 | | | Dell, Inc.* | 2,630 | | | 78,768 | |
| Ebay, Inc.* | 2,160 | | | 93,355 | | | EMC Corp.* | 7,770 | | | 105,827 | |
| Fortune Brands | 1,030 | | | 80,361 | | | Intel Corp. | 3,200 | | | 79,872 | |
| Gap, Inc. | 4,680 | | | 82,555 | | | Microsoft Corp. | 3,260 | | | 85,249 | |
| Mohawk Ind.* | 920 | | | 80,022 | | | Qualcomm | 3,140 | | | 135,271 | |
| Staples | 4,335 | | | 98,448 | | | Technology SPDR | 2,400 | | | 50,160 | |
| | | |
|
| | | Xilinx, Inc. | 2,930 | | | 73,865 | |
| | | | | 652,628 | | | | | |
|
| |
| | | |
|
| | | | | | | | |
| Consumer Staples - 4.5% | | | | | | | | | | | 728,302 | |
| News Corp., Inc. | 5,030 | | | 83,548 | | | Utility - 2.5% | | |
|
| |
| Walgreen Co. | 1,900 | | | 84,094 | | | TXU Corp | 1,860 | | | 93,353 | |
| | | |
|
| | | | | |
|
| |
| | | | | 167,642 | | | | | | | 93,353 | |
| | | |
|
| | | | | |
|
| |
Energy - 7.4%
Baker-Hughes | 2,260 | | | 137,363 | | | TOTAL COMMON STOCKS
(Cost $2,887,672) | | | | 3,481,129 | |
| Valero Energy | 2,700 | | | 139,320 | | | | | |
|
| |
| | | |
|
| | | | | | | | |
| | | | | 276,683 | | | | | | | | |
| | | |
|
| | | | | | | | |
Financial - 18.2%
| | | | | | | | | | | | |
| Ace Limited | 2,440 | | | 130,394 | | | | | | | | |
| American Int. Grp. | 1,160 | | | 79,147 | | | INDEX SECURITIES - 2.0% | | | | | |
| Capital One | 1,480 | | | 127,872 | | | S&P Barra Growth Index | 1,240 | | | 73,507 | |
| Etrade Financial* | 6,860 | | | 143,099 | | | | | |
|
| |
| Golden West Fin. | 1,810 | | | 119,460 | | | | | | | | |
| Hospitality Prop. Tr. | 2,020 | | | 81,002 | | | TOTAL INDEX SECURITIES
(Cost $65,266) | | | | 73,507 | |
| | | |
|
| | | | | |
|
| |
| | | | | 680,974 | | | | | | | | |
| | | |
|
| | | | | | | | |
Health Care - 16.4%
| | | | | | | | | | | | |
| Express Scripts* | 1,490 | | | 124,862 | | | | | | | | |
| Forest Labs* | 1,320 | | | 53,698 | | | SHORT-TERM INVESTMENTS - 4.7% | | | | |
| Genentech Inc.* | 1,270 | | | 117,475 | | | 1st Amer. Gov. Fund | 38,713 | | | 38,713 | |
| Quest Diagnostics | 1,900 | | | 97,812 | | | 1st National M Mkt | 137,150 | | | 137,150 | |
| Schering Plough | 5,120 | | | 106,752 | | | | | |
|
| |
| | | | | | | | TOTAL SHORT-TERM INVESTMENTS | | | | | |
| Unitedhealth Group | 1,760 | | | 109,366 | | | (Cost $175,863) | | | | 175,863 | |
| | | |
|
| | | | | |
|
| |
| | | | | 609,965 | | | | | | | | |
| | | |
|
| | | TOTAL INVESTMENTS – 100.0%
(Cost $3,128,801) | | | | 3,730,499 | |
Industrial - 7.3%
| | | | | | | | | | | | |
| Cendant Corp. | 3,910 | | | 67,448 | | | | | | | | |
| Fedex Corp. | 820 | | | 84,780 | | | | | | | | |
| Robert Half Int. | 3,150 | | | 119,354 | | | Other Assets less Liabilities -
Net – less than 0.1% | | | | (5,623 | ) |
| | | |
|
| | | | | |
|
| |
| | | | | 271,582 | | | | | | | | |
| | | |
|
| | | NET ASSETS – 100.0% | | | $ | 3,724,876 | |
| *Non-income producing during the year | | |
|
| |
The accompanying notes are an integral part of these financial statements.
15
MANOR INVESTMENT FUNDS, INC.
BOND FUND
Schedule of Investments
December 31, 2005
| Description | Face
Amount | | | Value | |
|
|
|
|
| |
| U.S. GOVERNMENT BONDS – 97.2% | | | | | |
| U.S. Treasury 2.250% Due 02-15-07 | 100,000 | | $ | 97,594 | |
| U.S. Treasury 3.250% Due 08-15-07 | 200,000 | | | 196,313 | |
| U.S. Treasury 3.125% Due 10-15-08 | 100,000 | | | 193,438 | |
| U.S. Treasury 3.625% Due 07-15-09 | 250,000 | | | 243,828 | |
| U.S. Treasury 3.500% Due 12-15-09 | 200,000 | | | 193,750 | |
| U.S. Treasury 3.875% Due 07-15-10 | 400,000 | | | 392,000 | |
| U.S. Treasury 3.875% Due 02-15-13 | 200,000 | | | 193,687 | |
| U.S. Treasury 4.000% Due 02-15-14 | 200,000 | | | 194,562 | |
| | | | |
| |
TOTAL U.S. GOVERNMENT BONDS
(Cost $1,738,839) | | | | 1,705,172 | |
| | | | |
| |
| | | | | | |
| SHORT-TERM INVESTMENTS – 1.7% | | | | | |
| 1st American Treasury Obligation Fund | 3,887 | | | 3,887 | |
| 1st National Money Market | 26,087 | | | 26,087 | |
| | | | |
| |
TOTAL SHORT-TERM INVESTMENTS
(Cost $29,974) | | | | 29,974 | |
| | | | |
| |
TOTAL INVESTMENTS – 98.9%
(Cost $1,768,813) | | | | 1,735,146 | |
| | | | | | |
| Other Assets less Liabilities – Net – 1.1% | | | | 19,691 | |
| | | | |
| |
| NET ASSETS – 100.0% | | | $ | 1,754,837 | |
| | | | |
| |
The accompanying notes are an integral part of these financial statements.
16
MANOR INVESTMENT FUNDS, INC.
Statements of Assets and Liabilities
December 31, 2005
| | | Manor
Fund | | | Growth
Fund | | | Bond
Fund | |
| | |
| | |
| | |
| |
ASSETS
| | | | | | | | | |
Investments in Securities
(cost of $2,522,651, $3,128,801 and
$1,768,813, respectively) | $ | 3,311,775 | | $ | 3,730,499 | | $ | 1,735,146 | |
| Receivables: Dividends | | 5,382 | | | 2,243 | | | — | |
| Interest | | 158 | | | 165 | | | 22,284 | |
| | |
| | |
| | |
| |
| Total Assets | | 3,317,315 | | | 3,732,907 | | | 1,757,430 | |
| | |
| | |
| | |
| |
LIABILITIES
| | | | | | | | | |
| Payable to Advisor | | 2,847 | | | 3,236 | | | 765 | |
| Accrued expenses | | 3,907 | | | 4,795 | | | 1,828 | |
| | |
| | |
| | |
| |
| Total Liabilities | | 6,754 | | | 8,031 | | | 2,593 | |
| | |
| | |
| | |
| |
| NET ASSETS | $ | 3,310,561 | | $ | 3,724,876 | | $ | 1,754,837 | |
| | |
| | |
| | |
| |
NET ASSETS CONSIST OF:
| | | | | | | | | |
| Capital stock – par value | $ | 193 | | $ | 330 | | $ | 171 | |
| Paid in capital | | 2,519,601 | | | 3,244,306 | | | 1,789,456 | |
| Undistributed net investment income | | 1,877 | | | — | | | — | |
| Accumulated net realized (loss) gain | | (233 | ) | | (121,458 | ) | | (1,123 | ) |
| Net unrealized appreciation | | 789,123 | | | 601,698 | | | (33,667 | ) |
| | |
| | |
| | |
| |
| NET ASSETS | $ | 3,310,561 | | $ | 3,724,876 | | $ | 1,754,837 | |
| | |
| | |
| | |
| |
| | | | | | | | | | |
| CAPITAL SHARES OUTSTANDING | | 191,145 | | | 330,462 | | | 171,556 | |
(10,000,000 authorized shares; $.001 par value)
| |
| | |
| | |
| |
| | | | | | | | | | |
| NET ASSET VALUE PER SHARE | $ | 17.32 | | $ | 11.27 | | $ | 10.23 | |
| | |
| | |
| | |
| |
The accompanying notes are an integral part of these financial statements.
17
MANOR INVESTMENT FUNDS, INC.
Statements of Operations
For the Year Ended December 31, 2005
| | | Manor
Fund | | | Growth
Fund | | | Bond
Fund | |
| Investment Income | |
| | |
| | |
| |
Dividends, (net of foreign taxes withheld
of $180, $ – , and $ – , respectively) | $ | 48,875 | | $ | 24,152 | | $ | — | |
| Interest | | 2,342 | | | 3,581 | | | 52,251 | |
| | |
| | |
| | |
| |
| Total investment income | | 51,217 | | | 27,733 | | | 52,251 | |
| | |
| | |
| | |
| |
| Expenses | | | | | | | | | |
| Advisory and management fee (Note 2) | | 29,797 | | | 31,436 | | | 8,154 | |
| Professional fees | | 6,982 | | | 7,435 | | | 3,914 | |
| Custodian fee | | 4,322 | | | 3,281 | | | 3,250 | |
| IRA fees | | 934 | | | 1,168 | | | 234 | |
| Insurance | | 601 | | | 601 | | | 601 | |
| Postage and printing | | 207 | | | 740 | | | 129 | |
| Registration | | 1,142 | | | 1,823 | | | 748 | |
| Taxes | | 150 | | | 140 | | | 150 | |
| Other | | 246 | | | 497 | | | 121 | |
| | |
| | |
| | |
| |
| Total expenses | | 44,381 | | | 47,121 | | | 17,301 | |
| | |
| | |
| | |
| |
| Net Investment Income (Loss) | | 6,836 | | | (19,388 | ) | | 34,950 | |
| | |
| | |
| | |
| |
Realized &Unrealized Gain (Loss) on Investments (Note 4)
| | | | | | | | | |
| Net realized gain on investments | | 185,137 | | | 187,563 | | | — | |
Net change in unrealized appreciation/
(depreciation) on investments | | 123,643 | | | 127,196 | | | (24,601 | ) |
| | |
| | |
| | |
| |
Net realized and unrealized gain (loss)
on investments | | 308,780 | | | 314,759 | | | (24,601 | ) |
| | |
| | |
| | |
| |
| | | | | | | | | | |
| Net Increase in Net Assets Resulting from Operations | $ | 315,616 | | $ | 295,371 | | $ | 10,349 | |
| | |
| | |
| | |
| |
The accompanying notes are an integral part of these financial statements.
18
MANOR INVESTMENT FUNDS, INC.
Statements of Changes in Net Assets
| | | Manor Fund | | | Growth Fund | |
| | |
|
|
|
| | |
|
|
|
| |
| | | Year
Ended
Dec. 31, 2005 | | | Year
Ended
Dec. 31, 2004 | | | Year
Ended
Dec. 31, 2005 | | | Year
Ended
Dec. 31, 2004 | |
| | |
| | |
| | |
| | |
| |
Increase (decrease) in Net Assets from Operations
| | | | | | | | | | | | |
| Net investment income (loss) | $ | 6,836 | | $ | 7,288 | | $ | (19,388 | ) | $ | (4,328 | ) |
| Net realized gain (loss) on investments | | 185,137 | | | (61,455 | ) | | 187,563 | | | (2,469 | ) |
| Unrealized appreciation on investments | | 123,643 | | | 401,002 | | | 127,196 | | | 314,571 | |
| | |
| | |
| | |
| | |
| |
| Net increase in net assets resulting from operations | | 315,616 | | | 346,835 | | | 295,371 | | | 307,774 | |
| | |
| | |
| | |
| | |
| |
| Distributions to Shareholders | | (7,724 | ) | | (4,523 | ) | | — | | | — | |
| | |
| | |
| | |
| | |
| |
Capital Share Transactions
| | | | | | | | | | | | |
| Proceeds from shares sold | | 521,635 | | | 201,066 | | | 762,217 | | | 230,662 | |
| Reinvestment of distributions | | 7,724 | | | 4,523 | | | — | | | — | |
| Payment for shares redeemed | | (369,515 | ) | | (319,818 | ) | | (255,712 | ) | | (171,155 | ) |
| | |
| | |
| | |
| | |
| |
| Net increase (decrease) in net assets from capital share transactions | | 159,844 | | | (114,229 | ) | | 506,505 | | | 59,507 | |
| | |
| | |
| | |
| | |
| |
| Total Increase | | 467,736 | | | 228,083 | | | 801,876 | | | 367,281 | |
Net Assets
| | | | | | | | | | | | |
| Beginning of Year | | 2,842,825 | | | 2,614,742 | | | 2,923,000 | | | 2,555,719 | |
| | |
| | |
| | |
| | |
| |
| End of Year | $ | 3,310,561 | | $ | 2,842,825 | | $ | 3,724,876 | | $ | 2,923,000 | |
| | |
| | |
| | |
| | |
| |
Transactions in Shares of Fund
| | | | | | | | | | | | |
| Sold | | 32,180 | | | 14,154 | | | 71,191 | | | 23,991 | |
| Issued in reinvestment of distributions | | 441 | | | 290 | | | — | | | — | |
| Redeemed | | (22,642 | ) | | (22,197 | ) | | (23,925 | ) | | (18,042 | ) |
| | |
| | |
| | |
| | |
| |
| Net increase (decrease) in outstanding shares of the Fund | | 9,979 | | | (7,753 | ) | | 47,266 | | | 5,949 | |
| | |
| | |
| | |
| | |
| |
The accompanying notes are an integral part of these financial statements.
19
MANOR INVESTMENT FUNDS, INC.
Statements of Changes in Net Assets (con’t)
| | | Bond Fund | |
| | |
| |
| | | Year
Ended
Dec. 31, 2005 | | | Year
Ended
Dec. 31, 2004 | |
| | |
| | |
| |
| Increase (decrease) in Net Assets from Operations | | | | | | |
| Net investment income | $ | 34,950 | | $ | 24,269 | |
| Net realized gain (loss) on investments | | — | | | (1,123 | ) |
Net change in unrealized
appreciation/depreciation on investments | | (24,601 | ) | | (28,436 | ) |
| | |
| | |
| |
Net increase (decrease) in net assets
resulting from operations | | 10,349 | | | (5,290 | ) |
| | |
| | |
| |
| Distributions to Shareholders | | (35,881 | ) | | (28,867 | ) |
| | |
| | |
| |
Capital Share Transactions
Proceeds from shares sold | | 606,935 | | | 971,571 | |
| Reinvestment of distributions | | 35,881 | | | 28,867 | |
| Payment for shares redeemed | | (390,706 | ) | | (1,207,292 | ) |
| | |
| | |
| |
Net increase (decrease) in net assets from
capital share transactions | | 252,110 | | | (206,854 | ) |
| | |
| | |
| |
| Total Increase (Decrease) | | 226,578 | | | (241,011 | ) |
| | | | | | | |
Net Assets
| | | | | | |
| Beginning of Year | | 1,528,259 | | | 1,769,270 | |
| | |
| | |
| |
| End of Year | $ | 1,754,837 | | $ | 1,528,259 | |
| | |
| | |
| |
Transactions in Shares of Fund
Sold | | 58,367 | | | 91,541 | |
| Issued in reinvestment of distributions | | 3,511 | | | 2,784 | |
| Redeemed | | (37,633 | ) | | (114,136 | ) |
| | |
| | |
| |
Net increase (decrease) in outstanding
shares of the Fund | | 24,245 | | | (19,811 | ) |
| | |
| | |
| |
The accompanying notes are an integral part of these financial statements.
20
MANOR INVESTMENT FUNDS, INC.
Notes to Financial Statements
December 31, 2005
| 1. | ORGANIZATION AND SIGNIFICANT ACCOUNTING POLICIES |
| | |
| | Organization: Manor Investment Funds, Inc. (the “Company”) is a non-diversified regulated investment company and was incorporated in the Commonwealth of Pennsylvania on September 13, 1995. The primary investment objective of each of the Funds follows: Manor Fund – conservative capital appreciation and current income, investing primarily in common stocks of large corporations in the United States; Growth Fund – long-term capital appreciation, investing primarily in common stocks of U.S. corporations; Bond Fund – intermediate-term fixed income, investing primarily in U.S. Government obligations. The following is a summary of the Funds’ significant accounting policies. |
| | |
| | Security Valuations: Equity securities generally are valued by using market quotations, but may be valued on the basis of prices furnished by a pricing service when the Advisor believes such prices accurately reflect the fair market value of such securities. Securities that are traded on any stock exchange or on the NASDAQ over-the-counter market are generally valued by the pricing service at the last quoted sale price. Lacking a last sale price, an equity security is generally valued by the pricing service at its last bid price. When market quotations are not readily available, when the Advisor determines that the market quotation or the price provided by the pricing service does not accurately reflect the current market value, or when restricted or illiquid securities are being valued, such securities are valued as determined in good faith by the Board of Directors. The Board has adopted guidelines for good faith pricing, and has delegated to the Advisor the responsibility for determining fair value prices, subject to review by the Board of Directors. |
| | |
| | Fixed income securities generally are valued by using market quotations, but may be valued on the basis of prices furnished by a pricing service when the Advisor believes such prices accurately reflect the fair market value of such securities. A pricing service utilizes electronic data processing techniques based on yield spreads relating to securities with similar characteristics to determine prices for normal institutional-size trading units of debt securities without regard to sale or bid prices. If the Advisor decides that a price provided by the pricing service does not accurately reflect the fair market value of the securities, when prices are not readily available from a pricing service, or when restricted or illiquid securities are being valued, securities are valued at fair value as determined in good faith by the Advisor, subject to review by the Board of Directors. Short term investments in fixed income securities with maturities of less than 60 days when acquired, or which subsequently are within 60 days of maturity, are valued by using the amortized cost method of valuation, which the Board has determined will represent fair value. |
| | |
| | Federal Income Taxes: The Fund’s policy is to comply with the requirements of the Internal Revenue Code that are applicable to regulated investment companies and to distribute all its taxable income to its shareholders. Therefore, no federal income tax provision is required. |
| | |
| | Distributions to Shareholders: The Fund intends to distribute to its shareholders substantially all of its net realized capital gains and net investment income, if any, at year-end. Distributions will be recorded on ex-dividend date. |
| | |
| | Other: The Fund follows industry practice and records security transactions on the trade date. The specific identification method is used for determining gains or losses for financial statements and income tax purposes. Dividend income is recorded on the ex-dividend date and interest income is recorded on an accrual basis. Discounts and premiums are amortized over the useful lives of the respective securities when determined to be material. Withholding taxes on foreign dividends will be provided for in accordance with the Fund’s under-standing of the applicable country’s tax rules and rates. |
| | |
| | Reclassifications: In accordance with SOP-93-2, the Growth Fund and Bond Fund each recorded a reclassification in their capital accounts. As of December 31, 2005, the Growth Fund and Bond Fund have each recorded a permanent book/tax difference of $19,388, and $319, respectively from net investment loss to paid-in-capital. This reclassification has no impact on the net asset value of the Fund and is designed generally to present undistributed income and net realized gains on a tax basis, which is considered to be more informative to shareholders. |
| | |
| | Use of Estimates: The preparation of financial statements in conformity with generally accepted accounting principles requires management to make estimates and assumptions that affect the reported amounts of assets and liabilities and disclosure of contingent assets and liabilities at the date of the financial statements and the reported amounts of increases and decreases in net assets during the reporting period. Actual results could differ from these estimates. |
21
MANOR INVESTMENT FUNDS, INC.
Notes to Financial Statements (con’t)
December 31, 2005
| 2. | INVESTMENT ADVISORY AGREEMENT |
| | |
| | The Fund has an investment advisory agreement (the “agreement”) with Morris Capital Advisors, Inc. (the “Advisor”), with whom certain officers and directors of the Funds are affiliated, to furnish investment management services to the Funds. Under the terms of the agreement, the Funds will pay the Advisor a monthly fee based on the Funds’ average daily net assets at the annual rate of 1.00% for Manor Fund and Growth Fund and 0.5% for Bond Fund. For the fiscal year ended December 31, 2005 the Advisor earned advisory fees from the Manor, Growth and Bond Funds of $29,797, $31,436 and $8,154 respectively. |
| | |
| | Under the terms of the agreement if the aggregate expenses of the Funds are equal to or greater than 1.5% for Manor Fund and Growth Fund and 1.00% for Bond Fund of the Funds’ net assets the Advisor will reimburse the Funds for these expenses. There was no reimbursement of expenses for the year ended December 31, 2005. |
| 3. | INVESTMENT TRANSACTIONS |
| | Investment transactions, excluding short-term investments, for the year ended December 31, 2005, were as follows: |
| | | Manor Fund | | | Growth Fund | | | Bond Fund | |
| | |
| | |
| | |
| |
| Purchases | $ | 670,407 | | $ | 882,154 | | $ | 837,570 | |
| Sales | $ | 640,702 | | $ | 481,005 | | $ | 550,000 | |
| | Income and long-term capital gain distributions are determined in accordance with Federal income tax regulations, which may differ from accounting principals generally accepted in the United States. The following information is as of December 31, 2005: |
| | | Manor Fund | | | Growth Fund | | | Bond Fund | |
| | |
| | |
| | |
| |
Federal tax cost of investments,
including short-term investments | $ | 2,522,651 | | $ | 3,128,801 | | $ | 1,768,813 | |
| | |
| | |
| | |
| |
| Gross tax appreciation of investments | $ | 860,681 | | $ | 767,496 | | $ | 1,093 | |
| Gross tax depreciation of investments | | (71,557 | ) | | (165,798 | ) | | (34,760 | ) |
| | |
| | |
| | |
| |
| Net tax appreciation (depreciation) | $ | 789,124 | | $ | 601,698 | | $ | (33,667 | ) |
| | |
| | |
| | |
| |
| Undistributed ordinary income | $ | 1,877 | | $ | — | | $ | — | |
| Undistributed capital gain income | $ | — | | $ | — | | $ | — | |
| Accumulated capital losses | $ | (233 | ) | $ | (121,458 | ) | $ | (1,123 | ) |
| | The accumulated capital loss carryovers as of December 31, 2005 expire as follows: |
| | | Manor Fund | | | Growth Fund | | | Bond Fund | |
| | |
| | |
| | |
| |
| 2009 | $ | — | | $ | 12,384 | | $ | — | |
| 2010 | $ | — | | $ | 48,507 | | $ | — | |
| 2011 | $ | — | | $ | 58,098 | | $ | — | |
| 2012 | $ | 233 | | $ | 2,469 | | $ | 1,123 | |
| | The tax character of distributions paid during the years ended December 31, 2005 and 2004 were as follows: |
| | Manor Fund | | Growth Fund | | Bond Fund |
| |
| |
| |
|
| | | 2005 | | | 2004 | | | 2005 | | | | 2004 | | | 2005 | | | 2004 |
| |
|
| |
|
| |
|
| | |
|
| |
|
| |
|
|
| Ordinary Income | $ | 7,724 | | $ | 4,523 | | $ | — | | | $ | — | | $ | 38,851 | | $ | 28,867 |
| Long-term Capital Gain | $ | — | | $ | — | | $ | — | | | $ | — | | $ | — | | $ | — |
22
MANOR INVESTMENT FUNDS, INC.
MANOR FUND
Financial Highlights
For a share of capital stock outstanding throughout the period
| | | For the years ended December 31, | |
|
| | | 2005 | | | 2004 | | | 2003 | | | 2002 | | | 2001 | |
|
| PER SHARE DATA | | | | | | | | | | | | | | | |
|
| Net asset value, beginning of period | $ | 15.69 | | $ | 13.84 | | $ | 10.52 | | $ | 13.20 | | $ | 15.76 | |
|
Income from investment operations:
| | | | | | | | | | | | | | | |
| Net investment income (loss)* | | 0.02 | | | 0.035 | | | — | | | (0.01 | ) | | (0.02 | ) |
Net realized and unrealized
gain (loss) on investments | | 1.65 | | | 1.840 | | | 3.32 | | | (2.67 | ) | | (2.54 | ) |
| | |
| | |
| | |
| | |
| | |
| |
| Total from investment operations | | 1.67 | | | 1.875 | | | 3.32 | | | (2.68 | ) | | (2.56 | ) |
|
| |
| Less Distributions | | (.04 | ) | | (0.025 | ) | | — | | | — | | | — | |
| | |
| | |
| | |
| | |
| | |
| |
| Total distributions | | (.04 | ) | | (0.025 | ) | | — | | | — | | | — | |
|
| |
| Net asset value, end of period | $ | 17.32 | | $ | 15.69 | | $ | 13.84 | | $ | 10.52 | | $ | 13.20 | |
|
| | | | | | | | | | | | | | | | |
| Total Return** | | 10.64 | % | | 13.55 | % | | 31.56 | % | | -20.30 | % | | -16.24 | % |
|
| | | | | | | | | | | | | | | | |
Ratios and Supplemental Data:
| | | | | | | | | | | | | | | |
| Net assets, end of period (000) | $ | 3,311 | | $ | 2,843 | | $ | 2,615 | | $ | 1,750 | | $ | 2,087 | |
Ratio of expenses to average net assets:
| | | | | | | | | | | | | | | |
| Before reimbursements | | 1.49 | % | | 1.50 | % | | 1.52 | % | | 1.50 | % | | 1.50 | % |
| Net of reimbursements | | 1.49 | % | | 1.50 | % | | 1.50 | % | | 1.50 | % | | 1.50 | % |
Ratio of net investment
income (loss) to average net assets | | 0.23 | % | | 0.27 | % | | 0.04 | % | | -0.08 | % | | -0.11 | % |
| Portfolio Turnover Rate | | 22.24 | % | | 7.32 | % | | 4.26 | % | | 26.0 | % | | 28.0 | % |
|
* Per share net investment income (loss) has been determined on the basis of average number of shares outstanding during the period.
** Total return assumes reinvestment of dividends.
The accompanying notes are an integral part of these financial statements.
23
MANOR INVESTMENT FUNDS, INC.
GROWTH FUND
Financial Highlights
For a share of capital stock outstanding throughout the period
| | | For the years ended December 31, | |
|
| | | 2005 | | | 2004 | | | 2003 | | | 2002 | | | 2001 | |
|
| PER SHARE DATA | | | | | | | | | | | | | | | |
|
| Net asset value, beginning of period | $ | 10.32 | | $ | 9.22 | | $ | 7.08 | | $ | 8.95 | | $ | 9.54 | |
|
Income from investment operations:
| | | | | | | | | | | | | | | |
| Net investment loss* | | (0.06
| ) | | (0.02
| ) | | (0.05
| ) | | (0.06
| ) | | (0.05
| ) |
Net realized and unrealized
gain (loss) on investments | | 1.01 | | | 1.12 | | | 2.19 | | | (1.81 | ) | | (0.54 | ) |
| | |
| | |
| | |
| | |
| | |
| |
| Total from investment operations | | 0.95 | | | 1.10 | | | 2.14 | | | (1.87 | ) | | (0.59 | ) |
|
| | | | | | | | | | | | | | | | |
Less Distributions
| | — | | | — | | | — | | | — | | | — | |
| | |
| | |
| | |
| | |
| | |
| |
| Total distributions | | — | | | — | | | — | | | — | | | — | |
|
| | | | | | | | | | | | | | | | |
| Net asset value, end of period | $ | 11.27 | | $ | 10.32 | | $ | 9.22 | | $ | 7.08 | | $ | 8.95 | |
|
| | | | | | | | | | | | | | | | |
| Total Return** | | 9.21 | % | | 11.93 | % | | 30.23 | % | | -20.89 | % | | -6.18 | % |
|
| | | | | | | | | | | | | | | | |
| Ratios and Supplemental Data: | | | | | | | | | | | | | | | |
| Net assets, end of period (000) | $ | 3,725 | | $ | 2,923 | | $ | 2,556 | | $ | 1,638 | | $ | 1,522 | |
| Ratio of expenses to average net assets: | | | | | | | | | | | | | | | |
| Before reimbursements | | 1.50 | % | | 1.50 | % | | 1.52 | % | | 1.50 | % | | 1.50 | % |
| Net of reimbursements | | 1.50 | % | | 1.50 | % | | 1.50 | % | | 1.50 | % | | 1.50 | % |
Ratio of net investment
income to average net assets | | -0.62 | % | | -0.16 | % | | -0.66 | % | | -0.70 | % | | -0.53 | % |
| | | | | | | | | | | | | | | | |
| Portfolio Turnover Rate | | 16.14 | % | | 30.42 | % | | 6.53 | % | | 13.2 | % | | 33.6 | % |
|
* Per share net investment loss has been determined on the basis of average number of shares outstanding during the period.
** Total return assumes reinvestment of dividends.
The accompanying notes are an integral part of these financial statements.
24
MANOR INVESTMENT FUNDS, INC.
BOND FUND
Financial Highlights
For a share of capital stock outstanding throughout the period
| | | For the years ended December 31, | |
|
| | | 2005 | | | 2004 | | | 2003 | | | 2002 | | | 2001 | |
|
| PER SHARE DATA | | | | | | | | | | | | | | | |
|
| Net asset value, beginning of period | $ | 10.37 | | $ | 10.58 | | $ | 10.98 | | $ | 10.63 | | $ | 10.39 | |
|
Income from investment operations:
Net investment income* | | 0.20 | | | 0.17 | | | 0.26 | | | 0.32 | | | 0.43 | |
Net realized and unrealized
gain (loss) on investments | | (0.13 | ) | | (0.18 | ) | | (0.17 | ) | | 0.39 | | | 0.23 | |
| | |
| | |
| | |
| | |
| | |
| |
| Total from investment operations | | 0.07 | | | (0.01 | ) | | 0.09 | | | 0.71 | | | 0.66 | |
|
| Less Distributions | | (0.21 | ) | | (0.20 | ) | | (0.49 | ) | | (0.36 | ) | | (0.42 | ) |
| | |
| | |
| | |
| | |
| | |
| |
| Total distributions | | (0.21 | ) | | (0.20 | ) | | (0.49 | ) | | (0.36 | ) | | (0.42 | ) |
|
| Net asset value, end of period | $ | 10.23 | | $ | 10.37 | | $ | 10.58 | | $ | 10.98 | | $ | 10.63 | |
|
| Total Return** | | 0.66 | % | | -0.09 | % | | 0.82 | % | | 6.69 | % | | 6.35 | % |
|
| |
Ratios and Supplemental Data:
Net assets, end of period (000) | $ | 1,755 | | $ | 1,528 | | $ | 1,769 | | $ | 1,962 | | $ | 1,476 | |
Ratio of expenses to average net assets:
Before reimbursements | | 1.00 | % | | 1.05 | % | | 1.04 | % | | 1.00 | % | | 1.00 | % |
| Net of reimbursements | | 1.00 | % | | 1.00 | % | | 1.00 | % | | 1.00 | % | | 1.00 | % |
Ratio of net investment
income to average net assets | | 2.04 | % | | 1.37 | % | | 2.30 | % | | 2.96 | % | | 4.01 | % |
| Portfolio Turnover Rate | | 37.01 | % | | 75.57 | % | | 50.61 | % | | 26.3 | % | | 0.0 | % |
|
* Per share net investment income has been determined on the basis of average number of shares outstanding during the period.
** Total return assumes reinvestment of dividends.
The accompanying notes are an integral part of these financial statements.
25
MANOR INVESTMENT FUNDS, INC.
ADDITIONAL INFORMATION
(Unaudited)
Proxy Voting Procedures
The Company’s Board of Directors has approved proxy voting procedures for the voting of proxies relating to securities held by the Fund. Records of the Fund’s proxy voting records are maintained and are available for inspection. The Board is responsible for overseeing the implementation of the procedures. The proxy voting record of the Fund can be reviewed on the web site of the Fund at www.ManorFunds.com. The Proxy voting history is located under Fund Information, Proxy Voting.
Quarterly Portfolio Schedule
The Company now files a complete schedule of investments with the SEC for the first and third quarters of each fiscal year on Form N-Q. These forms are available on the SEC’S website at http://www.sec.gov. They may be reviewed and copied at the SEC’s Public Reference Room in Washington, D.C. Information on the operation of the Public Reference Room may be obtained by calling 1-800-723-0330.
Compensation of Board of Directors
The members of the Board of Directors serve without compensation. Daniel A. Morris, President of Manor Investment Funds, Inc. (“the Funds”), and President of Morris Capital Advisors, Inc., adviser to the Funds, and an Interested Director of the Funds, receives no compensation directly from the Funds. He is compensated through the management fee paid to the adviser by the Funds.
26
Board of Directors Information
Manor Investment Funds, Inc.
December 31, 2005
The business and affairs of the Fund are managed under the direction of the Funds’ Board of Directors. Information pertaining to the Directors of the Fund are set forth below. The Statement of Additional Information includes additional information about the Funds’ Directors, and is available without charge, by calling 1-800-787-3334. Each director may be contacted by writing to the director c/o Manor Investment Funds, Inc., 15 Chester Commons, Malvem, PA 19355.
Independent Directors
| BRUCE LAVERTY |
| | Bruce Laverty is a Director of the Fund. He serves a one-year term, and stands for re-election annually. He has been a Director since 9/25/1995. Mr. Laverty is a Partner of the law firm Valocchi, Fischer & Laverty legal counsel to the Fund. He is not a Director for any other public companies. |
| JAMES McFADDEN |
| | James McFadden is a Director of the Fund, and Chairman of the Audit Committee. He serves a one-year term, and stands for re-election annually. He has been a Director since 9/25/1995. Mr. McFadden is Card Services Privacy Officer for Bank of America, Card Services Bank. He is not a Director for any other public companies. |
| JOHN McGINN |
| | John McGinn is a Director of the Fund, and serves on the Audit Committee. He serves a one-year term, and stands for re-election annually. He has been a Director since 11/5/2002. Mr. McGinn is an independent real estate sales consultant. He is not a Director for any other public companies. |
| FRED MYERS |
| | Fred Myers is a Director of the Fund. He serves a one-year term, and stands for re-election annually. He has been a Director since 9/25/1995. Mr. Myers is founding Partner of the accounting firm of Myers & Associates, CPA’s. He is not a Director for any other public companies. |
| EDWARD SZKUDLAPSKI |
| | Edward Szkudlapski is a Director of the Fund. He serves a one-year term, and stands for re-election annually. He has been a Director since 5/15/2000. Mr. Szkudlapski is President of Eclipse Business Systems. He is not a Director for any other public companies. |
| DONALD THOMPSON |
| | Donald Thompson is a Director of the Fund. He serves a one-year term, and stands for re-election annually. He has been a Director since 4/20/1999. Mr. Thompson is a Network Administrator and Healthcare Consultant. He is not a Director for any other public companies. |
| ALAN WEINTRAUB |
| | Alan Weintraub is a Director of the Fund. He serves a one-year term, and stands for re-election annually. He has been a Director since 9/25/1995. Mr. Weintraub is a Chief Technical Officer with Qumas, Cork, Ireland. He is not a Director for any other public companies. |
| | |
Interested Directors |
| DANIEL A. MORRIS |
| | Daniel A. Morris is a Director of the Fund, and President of Morris Capital Advisors, Inc., advisor to the Fund. He serves a one-year term, and stands for re-election annually. He has been a Director since 9/25/1995. Prior to founding Morris Capital Advisors, Inc., he was Senior Vice President of Consistent Asset Management Company, an investment adviser for separate accounts and registered investment companies. As President of the Fund, he is considered an Interested Director. He is not a Director for any other public companies. |
| JOHN R. GILES |
| | John R. Giles is a Director of the Fund, and Vice-President of Morris Capital Advisors, Inc., advisor to the Fund. He serves a one-year term, and stands for re-election annually. He has been a Director since 11/18/2005. Prior to joining Morris Capital Advisors, Inc., he was Senior Vice President of the Wilmington Trust Company and Senior Vice President of Consistent Asset Management Company, an investment adviser for separate accounts and registered investment companies. As Secretary of the Fund, he is considered an Interested Director. He is not a Director for any other public companies. |
27

Fund Office:
15 Chester County Commons
Malvern, PA 19355
610-722-0900 800-787-3334
www.manorfunds.com
ITEM 2. CODE OF ETHICS.
The Registrant, as of the end of the period covered by this report, has adopted a code of ethics that applies to the Registrant’s principal executive officer, principal financial officer, principal account officer or controller, or persons performing similar functions. The registrant has not made any amendments to its code of ethics during the covered period. The registrant has not granted any waivers from any provisions of the code of ethics during the covered period.
ITEM 3. AUDIT COMMITTEE FINANCIAL REPORT.
The Registrant’s audit committee consists of two independent directors, Chaired by James McFadden. The Board of Directors has determined that the Registrant has at least three financial experts serving on its Board.
Mr. Daniel Morris, Mr. John Giles, and Mr. Fred Myers are the Board’s financial experts. Mr. Morris and Mr. Giles are “interested” directors, and Mr. Myers is an “independent” director.
ITEM 4. PRINCIPAL ACCOUNTANT FEES AND SERVICES.
The registrant has engaged its principal accountant to perform audit services. “Audit services” refer to performing an audit of the registrant’s annual financial statements or services that are normally provided by the accountant in connection with statutory and regulatory filings or engagements for those fiscal years. “Audit related services” refer to the assurance and related services by the principal accountant that are reasonably related to the performance of the audit. “Tax Services” refer to professional services rendered by the principal accountant for tax compliance, tax advice, and tax planning. The following table details the aggregate fees billed for each of the last two fiscal years for audit fees, audit-related fees, tax fees and other fees by the principal accountant.
| | 12/31/2005 | | 12/31/2004 | |
| Audit Fees | $ | 12,848 | | $ | 6,178 | |
| Audit Related Fees | $ | 0 | | $ | 0 | |
| Tax Fees | $ | 0 | | $ | 0 | |
| All Other Fees | $ | 0 | | $ | 0 | |
Each year, the registrant’s Board of Directors recommend a principal accountant to perform audit services for the registrant. At the registrant’s Annual Meeting, the shareholders vote to approve or disapprove the principal accountant recommended by the Board.
ITEM 5. AUDIT COMMITTEE OF LISTED REGISTRANTS.
Not applicable to open-end investment companies.
ITEM 6. SCHEDULE FO INVESTMENTS.
Schedule of Investments is included as part of the report to shareholders filed under Item 1 of this Form.
ITEM 7. DISCLOSURE OF PROXY VOTING POLICIES AND PROCEDURES FOR CLOSED-END MANAGEMENT INVESTMENT COMPANIES.
Not applicable to open-end investment companies.
ITEM 10. SUBMISSION OF MATTERS TO A VOTE OF SECURITY HOLDERS.
Not applicable.
ITEM 11. CONTROLS AND PROCEDURES.
| a) | The registrant’s president and chief financial officer has concluded that the registrant’s disclosure controls and procedures (as defined in Rule 30a-3(c) under the Investment Company Act of 1940, as amended (the “1940 Act”)) are effective, as of a date within 90 days of the filing date of the report that includes the disclosure required by this paragraph, based on their evaluation of these controls and procedures required by Rule 30a-3(b) under the 1940 Act and Rules 13-a-15(b) under the Securities Exchange Act of 1934. |
| b) | There were no changes in the registrant’s internal control over financial reporting (as defined in Rule 30a-3(d) under the 1940 Act that occurred during the registrant’s second fiscal half-year that has materially affected, or is reasonably likely to materially affect, the registrant’s internal control over financial reporting. |
ITEM 12. EXHIBITS.
| (a) (1) | Code of Ethics–filed with Form N-CSR is hereby incorporated by reference. |
| | |
| (a) (2) | Certifications pursuant to Section 302 of the Sarbanes-Oxley Act of 2002 are attached hereto. |
| | |
| (b) | Certifications pursuant to Section 906 of the Sarbanes-Oxley Act of 2002 are attached hereto. |
SIGNATURES
Pursuant to the requirements of the Securities Exchange Act of 1934 and the Investment Company Act of 1940, the registrant has duly caused this report to be signed on its behalf by the undersigned, thereunto duly authorized.
Manor Investment Funds, Inc.
By /s/ Daniel A. Morris
Daniel A. Morris
President
Date: 2/28/2006
Pursuant to the requirement of the Securities Exchange Act of 1934 and the Investment Company Act of 1940, this report have been signed below by the following persons of behalf of the registrant and in the capacities and on the dates indicated.
By /s/ Daniel A. Morris
Daniel A. Morris
President
Date: 2/28/2006
