UNITED STATES SECURITIES AND EXCHANGE COMMISSION
WASHINGTON, D.C. 20549
FORM N-CSR
CERTIFIED SHAREHOLDER REPORT OF REGISTERED MANAGEMENT
INVESTMENT COMPANIES
Investment Company Act file number 811-09134
Manor Investment Funds, Inc.
(Exact name of registrant as specified in charter)
15 Chester Commons, Malvern, PA 19355
(Address of principal executive offices)
Daniel A. Morris
15 Chester Commons, Malvern, PA 19355
(Name and address of agent for service)
Registrant’s telephone number, including area code: 610-722-0900
Date of fiscal year end: December 31
Date of reporting period: June 30, 2006
Form N-CSR is to be used by management investment companies to file reports with the Commission not later than 10 days after the transmission to stockholders of any report that is required to be transmitted to stockholders under Rule 30e-1 under the Investment Company Act of 1940 (17 CFR 270-30e-1). The Commission may use the information provided on Form N-CSR in its regulatory, disclosure review, inspection and policymaking roles.
A registrant is required to disclose the information specified by Form N-CSR, and the Commission will make this information public. A registrant is not required to respond to the collection of information contained in Form N-CSR unless the Form displays a currently valid Office of Management and Budget ( OMB ) control number. Please direct comments concerning the accuracy of the information collection burden estimate and any suggestions for reducing the burden to Secretary, Securities and Exchange Commission, 450 Fifth Street, NW, Washington, DC 20549-0609. The OMB has reviewed this collection if information under the clearance requirement of 44 U.S.C. 3507.
Item 1. Reports to Stockholders.
Semi-Annual Report
June 30, 2006
(Unaudited)
Fund Office:
15 Chester Commons
Malvern, PA 19355
610-722-0900 800-787-3334
www.manorfunds.com
Managed by:
Morris Capital Advisors, Inc.
15 Chester Commons
Malvern, PA 19355
June 30, 2006
Dear Fellow Shareholders:
I am pleased to report that our Funds continue to perform well compared to the markets and comparable mutual funds. This consistent performance has generated recognition from rating services and investors. It serves to reinforce the belief that our disciplined investment process performs well over the long run.
Like A Head Butt To The Chest
At the 110th minute of the world cup championship game, midway through the second and final overtime period, Zinedine Zidane, captain of the French team, turned around on his way back up the field and launched a head butt into the chest of Italian defender Marco Materazzi. We were not sure what Materazzi said to goad Zidane, but the response seemed to be an over-reaction. Zidane was given a red card and ejected from the game, forcing his teammates to play with an obvious disadvantage. Materazzi was left sprawled on the ground, but got back up to finish the game. He did it without the pleading and complaining that we have come to expect of world class soccer players, and ultimately his team prevailed.
The stock market gave us a head butt of its own this quarter, and I’m not sure what we did to deserve it either. We may have gotten a little too cavalier with the move to new highs, or too complacent about effects of higher commodity prices and interest rates, but the downturn does seem to be a bit of an over-action. The sudden turnaround is not unusual, but when it takes us by surprise we often find ourselves on our back, struggling to get up.
The important thing is not whether we got caught off-guard, but how we choose to respond. We could complain about mixed signals from interest rate policy makers, slowing earnings growth, stock-option timing investigations, or leveraged trading by hedge funds, but none of that matters now. Instead we need to focus on the next six months, rather than the past two. It may not take much to move the market back to the upside, and this recent sell-off may have created some attractive investment opportunities that we can use to our advantage.
The Manor Fund
The Manor Fund declined 0.75%, net of all fees and expenses, during the quarter ending June 30, 2006, outperforming both the S&P 500 index, and comparable mutual funds as measured by the Lipper Large-Cap Core mutual fund index (-1.44% and -1.93%, respectively). The Fund also outperformed the S&P 500 and the Lipper Large-Cap Core mutual fund index for the trailing 1-year, 3-year and 5-year periods ending June 30, 2006, with returns of 15.47%, 15.37%, and 4.23%, compared to the S&P 500 (8.63%, 11.20%, and 2.48%), and the Lipper mutual fund index (9.12%, 9.83%, and 1.66%). During the 2nd quarter of 2006 the Fund was helped by gains in Weatherford International, Occidental Petroleum, JCPenney, Exelon, and Paccar.
Weatherford International, an operator of offshore drilling rigs, and Occidental Petroleum, a oil producer, both benefit from strong energy prices. JCPenney, a recent addition to the fund, jumped after reporting better earnings and same-store sales. This diversified retailer seems to be reaping the benefits of repositioning its merchandizing and product offerings. Exelon rose steadily during the quarter, despite rising interest rates, because much of its energy production is
4
generated by nuclear power plants rather than natural gas. Paccar, a manufacturer of light, medium and heavy-duty trucks, rose after reporting strong revenue and earnings growth. Paccar is experiencing a surge in demand in anticipation of higher emission standards due to take effect next year.
Notable laggards during the 2nd quarter include Jabil Circuit, KB Home, Home Depot, Corning, and Wellpoint. Jabil Circuit fell after announcing earnings below expectations due to a combination of manufacturing problems. KB Home, a homebuilder with extensive operations on the west coast, declined in conjunction with the entire sector, on concerns about declining sales. Corning fell as concerns mounted about a slowdown in consumer demand for flat panel TV’s. Corning is one of the largest producers of the specialized glass used for these screens. Wellpoint declined, despite reporting higher revenues and earnings, as investors grew more concerned that rising costs will reduce results in the future for all health care providers.
During the quarter we sold Fannie Mae and reduced our position in Weatherford. We believe that Fannie Mae will continue to languish due to regulatory and market issues as it adjusts its huge portfolio of mortgage securities. Weatherford has been a strong performer, so we took the opportunity to take some profits. We purchased Prudential Financial and Wal-Mart with the proceeds from these sales. Prudential Financial has a more diversified product mix compared to Fannie Mae, while Wal-Mart is trading at an attractive valuation because its share price has been stable over the last few years while earnings have grown.
The Growth Fund
The Growth Fund declined 4.89%, net of all fees and expenses, during the quarter ending June 30, 2006, outperforming comparable mutual funds as measured by the Lipper Large-Cap Growth mutual fund index (-5.14%). The Fund also outperformed the S&P 500 and the Lipper Large-Cap Growth mutual fund index for the trailing 3-year and 5-year periods ending June 30, 2006, with returns for the Fund of 11.69% and 3.43%, compared to the S&P 500 (11.20% and 2.48%), and the Lipper mutual fund index (8.42% and –1.33%). The Fund returned 1.47% since inception, outperforming both the S&P 500 and the Lipper mutual fund index (0.48% and –4.74%, respectively). The Fund was helped by strong performance from TXU Corp., Baker-Hughes, Quest Diagnostics, Valero Energy, and Kohls.
Two of the top performers both operate in the energy sector. Baker-Hughes provides equipment and services for energy exploration, and Valero Energy is one of the largest domestic oil refiners. Both continue to benefit from consistently high oil prices. TXU is a major energy utility in the gulf region. Its revenues and earnings have rebounded after the problems created by the hurricanes last year. Quest Diagnostics, a provider of medical testing products and services, jumped after reporting sharply higher revenues and earnings. Kohls, a recent addition to the portfolio, rose together with many other retailers, as retail sales remain strong despite rising interest rates and energy prices.
Weak holdings in the portfolio included Broadcom, Etrade Financial, Ebay, Express Scripts, and EMC Corp. Broadcom, one of the strongest performers over the recent quarters, declined on persistent selling pressure and concerns about the rollout of more sophisticated wireless products. Etrade Financial, another strong performer recently, declined after reporting slower trading volume. Ebay continues to suffer from concerns about slowing growth and the costs of continued overseas expansion. Express Scripts declined as investors worried about lower profit margins and stock option pricing issues. EMC Corp. fell on concerns about future earnings growth
5
and the strategic direction of this company in a difficult environment for companies throughout the technology industry.
During the quarter we sold Qualcomm and reduced our position in Valero Energy. We used the proceeds to purchase Raytheon, a defense related contractor. Qualcomm was one of our strongest performers recently but we believe that its valuation became overextended. Valero has also been a strong performer so we sold a portion of this position to take profits as a risk control measure. Our purchase of Raytheon was designed to diversify the portfolio in a sector that has been underweighted relative to the market.
The Bond Fund
The Bond Fund generated a return of 0.10%, net of all fees and expenses, for the quarter ending June 30, 2006, better than the Lipper US Government mutual fund index (-0.18%) but less than the Lehman Intermediate Government index (0.23%). For the year ending June 30, 2006, the Fund generated a return of –0.98%, better than both the Lehman Intermediate Government Index (-1.16%) and the Lipper US Government mutual fund index (-1.11%). Performance over the recent quarter reflects the relatively conservative position of the Fund’s investment portfolio of US Treasury securities. The portfolio has an average yield to maturity of 5.10%, an average maturity of approximately 5.53 years, and an average duration of 3.22 years. The duration of a bond portfolio is a measure of risk, with a lower duration indicating a lower level of risk. The Fund is managed to provide a low-risk alternative for conservative investors.
Keeping Your Head In The Game
Zidane lost his head for just a brief moment when he attacked his Italian counterpart, and it affected the balance of the contest. That loss of focus squandered an opportunity and erased any memory of the shot from that same head that came so close to winning the game just minutes before. In the investment game it is important to step back from the emotion and focus on an objective valuation of the earnings and growth prospects that can drive future performance. Despite the difficult economic environment, there are always attractive opportunities that can contribute to overall performance. It is our job to maintain our focus and identify those opportunities when they present themselves.
|
| Sincerely, |
|
| Daniel A. Morris |
6
Mutual Fund Summary Information
Manor Fund
Growth Fund
Bond Fund
Performance, Sector Allocations, & Fund Expenses
June 30, 2006
MANOR INVESTMENT FUNDS, INC.
Manor Fund
June 30, 2006
Top Holdings & Sectors
Top Company Holdings |
| ||
| |||
Company |
| % of |
|
|
| ||
Nucor Corp. |
| 4.1 | % |
Best Buy Inc. |
| 3.7 | % |
Endo Pharm. |
| 3.6 | % |
Pepisco |
| 3.6 | % |
Occidental Petro. |
| 3.6 | % |
Top Industry Sectors |
| ||
| |||
Industry |
| % of |
|
|
| ||
Financial |
| 17.8 | % |
Industrial |
| 13.4 | % |
Information Tech. |
| 13.3 | % |
Health Care |
| 11.5 | % |
Consumer Disc. |
| 10.9 | % |
Fund Performance
Value of $10,000 invested in the Fund
Inception (9/26/95) to present (06/30/06)
Compared to the S&P 500 and Lipper Large Cap Core Index
Quarter and Annualized Total Return for Periods Ending June 30, 2006
|
| Manor Fund |
| S&P 500 |
| Lipper LC |
| |||
|
|
|
|
| ||||||
2nd Quarter |
| -0.75 | % |
| -1.44 | % |
| -1.93 | % |
|
1-Year |
| 15.47 | % |
| 8.63 | % |
| 9.12 | % |
|
3-Year Annualized |
| 15.37 | % |
| 11.20 | % |
| 9.83 | % |
|
5-Year Annualized |
| 4.23 | % |
| 2.48 | % |
| 1.66 | % |
|
Annualized since inception 9/26/95 |
| 6.24 | % |
| 9.27 | % |
| 6.16 | % |
|
The S&P 500 Index is a capital-weighted index, representing the aggregate market value of the common equity of 500 stocks primarily traded on the New York Stock Exchange. The Lipper LC Core mutual fund index is an index of mutual funds managed with a similar investment style. Both are computed on a total return basis. The chart assumes an initial gross investment of $10,000 on 9/26/1995 (commencement of operations). Returns shown include the reinvestment of dividends. Past performance does not predict future performance. Investment return and principal value will fluctuate, so your shares at redemption may be worth more or less than the original cost.
8
MANOR INVESTMENT FUNDS, INC.
Growth Fund
June 30, 2006
Top Holdings & Sectors
Top Company Holdings |
| ||
|
| ||
Company |
| % of |
|
|
| ||
Baker-Hughes |
| 4.8 | % |
ETrade Financial |
| 4.0 | % |
Coach |
| 3.7 | % |
Kohls Corp. |
| 3.5 | % |
Golden West Fin. |
| 3.5 | % |
Top Industry Sectors |
| ||
|
| ||
Industry |
| % of |
|
|
| ||
Consumer Disc. |
| 20.1 | % |
Health Care |
| 18.0 | % |
Financial |
| 15.8 | % |
Information Tech. |
| 13.6 | % |
Industrial |
| 10.9 | % |
Fund Performance
Value of $10,000 invested in the Fund
Inception (6/30/99) to present (06/30/06)
Compared to the S&P 500 and Lipper Large-Cap Growth
Index
Quarter and Annualized Total Return for Periods Ending June 30, 2006
|
| Growth Fund |
| S&P 500 |
| Lipper LC |
|
|
|
|
|
| |||
2nd Quarter |
| -4.89 | % | -1.44 | % | -5.14 | % |
1-Year |
| 6.95 | % | 8.63 | % | 5.78 | % |
3-Year Annualized |
| 11.69 | % | 11.20 | % | 8.42 | % |
5-Year Annualized |
| 3.43 | % | 2.48 | % | -1.33 | % |
Annualized since inception |
| 1.47 | % | 0.48 | % | -4.74 | % |
6/30/99 |
The S&P 500 Index is a capital-weighted index, representing the aggregate market value of the common equity of 500 stocks primarily traded on the New York Stock Exchange. The Lipper LC Growth mutual fund index is an index of mutual funds managed with a similar investment style. Both are computed on a total return basis. The chart assumes an initial gross investment of $10,000 on 6/30/1999 (commencement of operations). Returns shown include the reinvestment of dividends. Past performance does not predict future performance. Investment return and principal value will fluctuate, so your shares at redemption may be worth more or less than the original cost.
9
MANOR INVESTMENT FUNDS, INC.
Asset Allocation
Manor Fund and Growth Fund
June 30, 2006
Manor Fund |
| ||
|
| ||
Industry |
| % of Net Assets |
|
|
| ||
Financial |
| 17.8 | % |
Industrial |
| 13.4 | % |
Information Technology |
| 13.3 | % |
Health Care |
| 11.5 | % |
Consumer Discretionary |
| 10.9 | % |
Energy |
| 10.0 | % |
Consumer Staples |
| 10.0 | % |
Cash Equivalents |
| 5.6 | % |
Material |
| 4.1 | % |
Utility |
| 3.4 | % |
|
|
| |
|
| 100.0 | % |
|
|
|
Growth Fund |
| ||
|
| ||
Industry |
| % of Net Assets |
|
|
| ||
Consumer Discretionary |
| 20.1 | % |
Health Care |
| 18.0 | % |
Financial |
| 15.8 | % |
Information Technology |
| 13.6 | % |
Industrial |
| 10.9 | % |
Cash Equivalent |
| 7.7 | % |
Energy |
| 7.5 | % |
Utility |
| 3.3 | % |
Consumer Staples |
| 3.1 | % |
|
|
| |
|
| 100.0 | % |
|
|
|
10
MANOR INVESTMENT FUNDS, INC.
Manor Fund and Growth Fund
Expenses
June 30, 2006
As a shareholder of the Fund, you incur indirect costs, such as management fees, and other Fund operating expenses. This example is intended to help you understand your indirect costs, also referred to as “ongoing costs,” (in dollars) of investing in the Fund, and to compare these costs with the ongoing costs of investing in other mutual funds.
This example is based on an investment of $1,000 invested at the beginning of the period and held for the entire 6 month period of January 1, 2006 through June 30, 2006.
Actual Expenses
The first section of the table below provides information about actual account values and actual expenses. You may use the information in this line, together with the amount you invested at the beginning of the period, to estimate the expenses that you paid over the period. Simply divide your account value by $1,000 (for example, an $8,600 account value divided by $1,000 = 8.6), then multiply the result by the number in the first line under the heading “Expenses Paid During Period” to estimate the expenses you paid on your account during this period.
Hypothetical example for comparison purposes
The second section of the table provides information about hypothetical account values and hypothetical expense based on the Funds’ actual expense ratio and an assumed rate of return of 5% per year before expenses, which is not the Funds’ actual return. The hypothetical account values and expenses may not be used to estimate the actual ending account balance or expenses you paid for the period. You may use this information to compare ongoing costs of investing in the Fund and other funds. To do so, compare this 5% hypothetical example with the 5% hypothetical examples that appear in the shareholder reports of other funds.
Please note that the expenses shown in the table are meant to highlight your ongoing costs only and do not reflect any direct costs, such as wire fees or low balance fees. Therefore, the second line of the table is useful in comparing ongoing costs only, and will not help you determine the relative total costs of owning different funds. In addition, if these direct costs were included, your costs would be higher.
|
| Total |
| Beginning |
| Ending |
| Expenses Paid |
| |||
|
|
|
|
|
| |||||||
Based on Actual Total Return as indicated |
|
|
|
|
|
|
|
|
|
|
|
|
Manor Fund |
| 6.29 | % | $ | 1,000.00 |
| $ | 1,062.93 |
| $ | 7.67 |
|
Growth Fund |
| -1.69 | % | $ | 1,000.00 |
| $ | 983.14 |
| $ | 7.38 |
|
|
|
|
|
|
|
|
|
|
|
|
|
|
Based on Hypothetical 5.0% Annualized Return |
|
|
|
|
|
|
|
|
|
|
|
|
Manor Fund |
|
|
| $ | 1,000.00 |
| $ | 1,017.36 |
| $ | 7.50 |
|
Growth Fund |
|
|
| $ | 1,000.00 |
| $ | 1,017.36 |
| $ | 7.50 |
|
* | Expenses are equal to the Funds’ annualized expense ratios, capped at 1.5%, which is net of any expenses paid indirectly, multiplied by the average account value over the period. The ending account value for each Fund in the table is based on its actual total return for the 6 month period of January 1, 2006 to June 30, 2006, 6.29% for the Manor Fund, and –1.69% for the Growth Fund. |
11
MANOR INVESTMENT FUNDS, INC.
Bond Fund
June 30, 2006
Top Holdings
Security |
| % of Net Assets |
|
|
| ||
US Treasury 3.875% due 7/15/10 |
| 19.8 | % |
US Treasury 3.625% due 7/15/09 |
| 12.3 | % |
US Treasury 3.250% due 8/15/07 |
| 10.1 | % |
US Treasury 3.125% due 10/15/08 |
| 9.9 | % |
US Treasury 3.500% due 12/15/09 |
| 9.8 | % |
Fund Performance
Value of $10,000 invested in the Fund
Inception (6/30/99) to present (06/30/06)
Compared to the Lehman Int. Gov’t and Lipper Gov't Index
Quarter and Annualized Total Return for Periods Ending June 30, 2006
|
| Bond |
| Lipper |
| Lehman |
|
|
|
|
|
| |||
2nd Quarter |
| 0.10 | % | -0.18 | % | 0.23 | % |
1-Year |
| -0.98 | % | -1.11 | % | -1.16 | % |
3-Year Annualized |
| -0.19 | % | 1.34 | % | 1.03 | % |
5-Year Annualized |
| 2.05 | % | 4.12 | % | 3.83 | % |
Annualized since inception 6/30/99 |
| 3.08 | % | 4.97 | % | 4.78 | % |
The Lehman Intermediate Government Index is represents the aggregate market value of the US Government securities with a maximum maturity of 10 years. The Lipper US Government mutual fund index is an index of mutual funds managed using US Government securities. Both are computed on a total return basis. The chart assumes an initial gross investment of $10,000 on 6/30/1999 (commencement of operations). Returns shown include the reinvestment of dividends. Past performance does not predict future performance. Investment return and principal value will fluctuate, so your shares at redemption may be worth more or less than the original cost.
12
MANOR INVESTMENT FUNDS, INC.
Bond Fund
Expenses
June 30, 2006
As a shareholder of the Fund, you incur indirect costs, such as management fees, and other Fund operating expenses. This example is intended to help you understand your indirect costs, also referred to as “ongoing costs,” (in dollars) of investing in the Fund, and to compare these costs with the ongoing costs of investing in other mutual funds.
This example is based on an investment of $1,000 invested at the beginning of the period and held for the entire 6 month period of January 1, 2006 through June 30, 2006.
Actual Expenses
The first section of the table below provides information about actual account values and actual expenses. You may use the information in this line, together with the amount you invested at the beginning of the period, to estimate the expenses that you paid over the period. Simply divide your account value by $1,000 (for example, an $8,600 account value divided by $1,000 = 8.6), then multiply the result by the number in the first line under the heading “Expenses Paid During Period” to estimate the expenses you paid on your account during this period.
Hypothetical example for comparison purposes
The second section of the table provides information about hypothetical account values and hypothetical expense based on the Fund’s actual expense ratio and an assumed rate of return of 5% per year before expenses, which is not the Fund’s actual return. The hypothetical account values and expenses may not be used to estimate the actual ending account balance or expenses you paid for the period. You may use this information to compare ongoing costs of investing in the Fund and other funds. To do so, compare this 5% hypothetical example with the 5% hypothetical examples that appear in the shareholder reports of other funds.
Please note that the expenses shown in the table are meant to highlight your ongoing costs only and do not reflect any direct costs, such as wire fees or low balance fees. Therefore, the second line of the table is useful in comparing ongoing costs only, and will not help you determine the relative total costs of owning different funds. In addition, if these direct costs were included, your costs would be higher.
|
| Total |
| Beginning |
| Ending |
| Expenses Paid |
| |||
|
|
|
|
|
| |||||||
Based on Actual Total Return as indicated |
|
|
|
|
|
|
|
|
|
|
|
|
Bond Fund |
| –0.59 | % | $ | 1,000.00 |
| $ | 994.13 |
| $ | 4.94 |
|
|
|
|
|
|
|
|
|
|
|
|
|
|
Based on Hypothetical 5.0% Annualized Return |
|
|
|
|
|
|
|
|
|
|
|
|
Bond Fund |
|
|
| $ | 1,000.00 |
| $ | 1,019.84 |
| $ | 5.01 |
|
* | Expenses are equal to the Fund’s annualized expense ratio, capped at 1.0%, which is net of any expenses paid indirectly, multiplied by the average account value over the period. The ending account value for the Fund in the table is based on its actual total return for the 6 month period of January 1, 2006 to June 30, 2006, of –0.59%. |
13
This Page Intentionally Left Blank
14
Financial Statements
(Unaudited)
June 30, 2006
MANOR INVESTMENT FUNDS, INC.
MANOR FUND
Schedule of Investments - Unaudited
June 30, 2006
Description |
| Shares |
| Market |
| |
|
|
| ||||
COMMON STOCKS –94.4% |
|
|
|
|
|
|
|
|
|
|
|
|
|
Consumer Discretionary – 10.9% |
|
|
|
|
|
|
Best Buy Co., Inc. |
| 2,539 |
| $ | 139,239 |
|
Home Depot |
| 2,390 |
|
| 85,538 |
|
JCPenney |
| 1,791 |
|
| 120,910 |
|
KB Home |
| 1,423 |
|
| 65,245 |
|
|
|
|
|
| ||
|
|
|
|
| 410,932 |
|
|
|
|
|
| ||
Consumer Staples – 10.0% |
|
|
|
|
|
|
Colgate Palmolive |
| 2,001 |
|
| 119,860 |
|
Pepsico, Inc. |
| 2,262 |
|
| 135,811 |
|
Wal-Mart |
| 2,543 |
|
| 122,496 |
|
|
|
|
|
| ||
|
|
|
|
| 378,167 |
|
|
|
|
|
| ||
Energy – 10.0% |
|
|
|
|
|
|
Devon Energy |
| 1,190 |
|
| 71,888 |
|
Nabors* |
| 2,620 |
|
| 88,530 |
|
Occidental Pet. |
| 1,313 |
|
| 134,648 |
|
Weatherford Int. * |
| 1,689 |
|
| 83,808 |
|
|
|
|
|
| ||
|
|
|
|
| 378,874 |
|
|
|
|
|
| ||
Financial – 17.8% |
|
|
|
|
|
|
Allstate Insurance |
| 1,830 |
|
| 100,156 |
|
Bank of America |
| 1,537 |
|
| 73,930 |
|
Chubb |
| 2,192 |
|
| 109,381 |
|
Citigroup |
| 1,969 |
|
| 95,004 |
|
Freddie Mac |
| 1,440 |
|
| 82,094 |
|
Prudential Finl. |
| 1,504 |
|
| 116,861 |
|
Vornado Realty Tr. |
| 1,010 |
|
| 98,526 |
|
|
|
|
|
| ||
|
|
|
|
| 675,952 |
|
|
|
|
|
| ||
Health Care – 11.5% |
|
|
|
|
|
|
Endo Pharm. * |
| 4,130 |
|
| 136,207 |
|
Johnson & Johnson |
| 1,350 |
|
| 80,892 |
|
Manor Care, Inc. |
| 2,590 |
|
| 121,523 |
|
Wellpoint, Inc. * |
| 1,327 |
|
| 96,566 |
|
|
|
|
|
| ||
|
|
|
|
| 435,188 |
|
|
|
|
|
| ||
Industrial – 13.4% |
|
|
|
|
|
|
Alcan (Canada) |
| 2,224 |
|
| 104,395 |
|
Deere & Co. |
| 980 |
|
| 81,820 |
|
General Electric |
| 2,270 |
|
| 74,819 |
|
Norfolk Southern |
| 2,410 |
|
| 128,260 |
|
Paccar, Inc. |
| 630 |
|
| 51,899 |
|
Tyco, Inc. |
| 2,440 |
|
| 67,100 |
|
|
|
|
|
| ||
|
|
|
|
| 508,293 |
|
|
|
|
|
| ||
|
|
|
|
|
|
|
Information Technology – 13.3% |
|
|
|
|
|
|
Cisco Systems * |
| 2,350 |
|
| 45,896 |
|
Citrix Systems * |
| 2,970 |
|
| 119,097 |
|
Corning, Inc. * |
| 4,990 |
|
| 120,708 |
|
Intel Corp. |
| 2,980 |
|
| 56,620 |
|
Int. Bus. Machines |
| 950 |
|
| 72,979 |
|
Jabil Circuit * |
| 3,494 |
|
| 89,446 |
|
|
|
|
|
| ||
|
|
|
|
| 504,746 |
|
|
|
|
|
| ||
Material – 4.1% |
|
|
|
|
|
|
Nucor Corp. |
| 2,844 |
|
| 154,287 |
|
|
|
|
|
| ||
|
|
|
|
| 154,287 |
|
|
|
|
|
| ||
Utility – 3.4% |
|
|
|
|
|
|
Exelon |
| 2,248 |
|
| 127,754 |
|
|
|
|
|
| ||
|
|
|
|
| 127,754 |
|
|
|
|
|
| ||
|
|
|
|
|
|
|
TOTAL COMMON STOCKS |
|
|
|
|
|
|
(Cost $2,717,694) |
|
|
|
| 3,574,193 |
|
|
|
|
|
| ||
|
|
|
|
|
|
|
SHORT-TERM INVESTMENTS – 5.6% |
|
|
|
|
|
|
1st Amer. Gov. Fund |
| 22,922 |
|
| 22,922 |
|
1st National M Mkt |
| 186,654 |
|
| 186,654 |
|
|
|
|
|
| ||
TOTAL SHORT-TERM INVESTMENTS |
|
|
|
|
|
|
(Cost $209,576) |
|
|
|
| 209,576 |
|
|
|
|
|
| ||
|
|
|
|
|
|
|
TOTAL INVESTMENTS – 100.0% |
|
|
|
|
|
|
(Cost $2,927,270) |
|
|
|
| 3,783,769 |
|
|
|
|
|
|
|
|
Other Assets less Liabilities – |
|
|
|
|
|
|
Net – Less than 0.1% |
|
|
|
| 1,785 |
|
|
|
|
|
| ||
NET ASSETS 100.0% |
|
|
| $ | 3,785,554 |
|
|
|
|
|
|
* | Non-income producing during the period. |
The accompanying notes are an integral part of these financial statements.
16
MANOR INVESTMENT FUNDS, INC.
GROWTH FUND
Schedule of Investments - Unaudited
June 30, 2006
Description |
| Shares |
| Market |
| |
|
|
| ||||
|
|
|
|
|
|
|
COMMON STOCKS – 92.3% |
|
|
|
|
|
|
|
|
|
|
|
|
|
Consumer Discretionary – 20.1% |
|
|
|
|
|
|
Bed, Bath, Beyond * |
| 2,080 |
| $ | 68,994 |
|
Coach Inc. * |
| 4,742 |
|
| 141,786 |
|
Ebay, Inc. * |
| 2,469 |
|
| 72,317 |
|
Fortune Brands |
| 1,030 |
|
| 73,140 |
|
Gap, Inc. |
| 4,680 |
|
| 81,432 |
|
Kohls Corp |
| 2,321 |
|
| 137,217 |
|
Mohawk Ind. * |
| 1,113 |
|
| 78,300 |
|
Staples |
| 5,068 |
|
| 123,406 |
|
|
|
|
|
| ||
|
|
|
|
| 776,592 |
|
|
|
|
|
| ||
Consumer Staples – 3.1% |
|
|
|
|
|
|
News Corp. |
| 6,030 |
|
| 121,685 |
|
|
|
|
|
| ||
|
|
|
|
| 121,685 |
|
|
|
|
|
| ||
Energy – 7.5% |
|
|
|
|
|
|
Baker-Hughes |
| 2,260 |
|
| 184,981 |
|
Valero Energy |
| 1,597 |
|
| 106,232 |
|
|
|
|
|
| ||
|
|
|
|
| 291,213 |
|
|
|
|
|
| ||
Financial – 15.8% |
|
|
|
|
|
|
Ace Limited |
| 2,440 |
|
| 123,440 |
|
American Int. Grp. |
| 1,160 |
|
| 68,498 |
|
Capital One |
| 1,480 |
|
| 126,466 |
|
Etrade Financial * |
| 6,860 |
|
| 156,545 |
|
Golden West Fin. |
| 1,810 |
|
| 134,302 |
|
|
|
|
|
| ||
|
|
|
|
| 609,251 |
|
|
|
|
|
| ||
Health Care – 18.0% |
|
|
|
|
|
|
Express Scripts * |
| 1,690 |
|
| 121,241 |
|
Forest Labs * |
| 1,320 |
|
| 51,071 |
|
Genentech Inc. * |
| 1,270 |
|
| 103,886 |
|
Quest Diagnostics |
| 2,140 |
|
| 128,229 |
|
Schering Plough |
| 5,589 |
|
| 106,359 |
|
Unitedhealth Group |
| 2,010 |
|
| 90,007 |
|
Zimmer Holdings |
| 1,703 |
|
| 96,594 |
|
|
|
|
|
| ||
|
|
|
|
| 697,387 |
|
|
|
|
|
| ||
Industrial – 10.9% |
|
|
|
|
|
|
Cendant Corp. |
| 3,910 |
|
| 63,694 |
|
Fedex Corp. |
| 931 |
|
| 108,797 |
|
Raythron Co. |
| 2,628 |
|
| 117,130 |
|
Robert Half Int. |
| 3,150 |
|
| 132,300 |
|
|
|
|
|
| ||
|
|
|
| 421,921 |
| |
|
|
|
|
| ||
Information Technology – 13.6% |
|
|
|
|
|
|
Broadcom Corp-A * |
| 4,239 |
|
| 128,569 |
|
Dell, Inc. * |
| 2,630 |
|
| 64,330 |
|
EMC Corp. * |
| 8,474 |
|
| 92,959 |
|
Intel Corp. |
| 3,677 |
|
| 69,863 |
|
Microsoft Corp. |
| 3,260 |
|
| 75,958 |
|
Xilinx, Inc. |
| 4,206 |
|
| 95,266 |
|
|
|
|
|
| ||
|
|
|
|
| 526,945 |
|
|
|
|
|
| ||
Utility – 3.3% |
|
|
|
|
|
|
TXU Corp |
| 2,135 |
|
| 127,652 |
|
|
|
|
|
| ||
|
|
|
|
| 127,652 |
|
|
|
|
|
| ||
TOTAL COMMON STOCKS |
|
|
|
|
|
|
(Cost $3,185,239) |
|
|
|
| 3,572,646 |
|
|
|
|
|
| ||
|
|
|
|
|
|
|
SHORT-TERM INVESTMENTS – 7.7% |
|
|
|
|
|
|
1st Amer. Gov. Fund |
| 175,801 |
|
| 175,801 |
|
1st National M Mkt |
| 122,542 |
|
| 122,542 |
|
|
|
|
|
| ||
TOTAL SHORT-TERM INVESTMENTS |
|
|
|
|
|
|
(Cost $298,343) |
|
|
|
| 298,343 |
|
|
|
|
|
| ||
|
|
|
|
|
|
|
TOTAL INVESTMENTS – 100.0% |
|
|
|
|
|
|
(Cost $3,483,582) |
|
|
|
| 3,870,989 |
|
|
|
|
|
|
|
|
Other Assets less Liabilities – |
|
|
|
|
|
|
Net – Less than 0.1% |
|
|
|
| (2,346 | ) |
|
|
|
|
| ||
NET ASSETS – 100.0% |
|
|
| $ | 3,868,643 |
|
|
|
|
|
|
* | Non-income producing during the period. |
The accompanying notes are an integral part of these financial statements.
17
MANOR INVESTMENT FUNDS, INC.
BOND FUND
Schedule of Investments – Unaudited
June 30, 2006
Description |
| Face |
| Value | |
|
| ||||
U.S. GOVERNMENT BONDS – 86.1% |
|
|
|
|
|
U.S. Treasury 2.250% Due 02-15-07 |
| 100,000 |
| $ | 98,125 |
U.S. Treasury 3.250% Due 08-15-07 |
| 200,000 |
|
| 195,625 |
U.S. Treasury 3.125% Due 10-15-08 |
| 200,000 |
|
| 191,312 |
U.S. Treasury 3.625% Due 07-15-09 |
| 250,000 |
|
| 239,687 |
U.S. Treasury 3.500% Due 12-15-09 |
| 200,000 |
|
| 190,750 |
U.S. Treasury 3.875% Due 07-15-10 |
| 400,000 |
|
| 383,500 |
U.S. Treasury 3.875% Due 02-15-13 |
| 200,000 |
|
| 186,500 |
U.S. Treasury 4.000% Due 02-15-14 |
| 200,000 |
|
| 185,688 |
|
|
|
| ||
TOTAL U.S. GOVERNMENT BONDS (Cost $1,738,839) |
|
|
|
| 1,671,187 |
|
|
|
| ||
|
|
|
|
|
|
SHORT-TERM INVESTMENTS – 12.8% |
|
|
|
|
|
1st American Treasury Obligation Fund |
| 184,552 |
|
| 184,552 |
1st National Money Market |
| 63,240 |
|
| 63,240 |
|
|
|
| ||
TOTAL SHORT-TERM INVESTMENTS (Cost $247,792) |
|
|
|
| 247,792 |
|
|
|
| ||
TOTAL INVESTMENTS – 99.0% (Cost $1,986,631) |
|
|
|
| 1,918,979 |
Other Assets less Liabilities – Net – 1.1% |
|
|
|
| 22,280 |
|
|
|
| ||
NET ASSETS - 100.0% |
|
|
| $ | 1,941,259 |
|
|
|
|
The accompanying notes are an integral part of these financial statements.
18
MANOR INVESTMENT FUNDS, INC.
Statements of Assets and Liabilities - Unaudited
June 30, 2006
|
| Manor |
| Growth |
| Bond |
| |||
|
|
|
|
| ||||||
ASSETS |
|
|
|
|
|
|
|
|
|
|
Investments in Securities |
|
|
|
|
|
|
|
|
|
|
(cost of $2,927,270, $3,483,582 and $1,986,631, respectively) |
| $ | 3,783,769 |
| $ | 3,870,989 |
| $ | 1,918,979 |
|
Receivables: Dividends |
|
| 4,764 |
|
| 1,574 |
|
| — |
|
Interest |
|
| 175 |
|
| 258 |
|
| 22,181 |
|
Other Assets |
|
| — |
|
| — |
|
| 99 |
|
|
|
|
|
| ||||||
Total Assets |
|
| 3,788,708 |
|
| 3,872,821 |
|
| 1,941,259 |
|
|
|
|
|
| ||||||
|
|
|
|
|
|
|
|
|
|
|
LIABILITIES |
|
|
|
|
|
|
|
|
|
|
Payable to Advisor |
|
| 3,045 |
|
| 3,152 |
|
| — |
|
Accrued expenses |
|
| 109 |
|
| 1,026 |
|
| — |
|
|
|
|
|
| ||||||
Total Liabilities |
|
| 3,154 |
|
| 4,178 |
|
| — |
|
|
|
|
|
| ||||||
NET ASSETS |
| $ | 3,785,554 |
| $ | 3,868,643 |
| $ | 1,941,259 |
|
|
|
|
|
| ||||||
|
|
|
|
|
|
|
|
|
|
|
NET ASSETS CONSIST OF: |
|
|
|
|
|
|
|
|
|
|
Capital stock - par value |
| $ | 207 |
| $ | 349 |
| $ | 194 |
|
Paid in capital |
|
| 2,782,716 |
|
| 3,459,807 |
|
| 1,986,383 |
|
Undistributed net investment income |
|
| 5,365 |
|
| (13,470 | ) |
| 23,456 |
|
Accumulated net realized (loss) gain |
|
| 140,768 |
|
| 34,551 |
|
| (1,122 | ) |
Net unrealized appreciation |
|
| 856,498 |
|
| 387,406 |
|
| (67,652 | ) |
|
|
|
|
| ||||||
NET ASSETS |
| $ | 3,785,554 |
| $ | 3,868,643 |
| $ | 1,941,259 |
|
|
|
|
|
| ||||||
|
|
|
|
|
|
|
|
|
|
|
CAPITAL SHARES OUTSTANDING |
|
| 205,588 |
|
| 349,120 |
|
| 190,821 |
|
|
|
|
|
| ||||||
(10,000,000 authorized shares; $.001 par value) |
|
|
|
|
|
|
|
|
|
|
|
|
|
|
|
|
|
|
|
|
|
NET ASSET VALUE PER SHARE |
| $ | 18.41 |
| $ | 11.08 |
| $ | 10.17 |
|
The accompanying notes are an integral part of these financial statements.
19
MANOR INVESTMENT FUNDS, INC.
Statements of Operations - Unaudited
For the 6 months ending June 30, 2006
|
| Manor |
| Growth |
| Bond |
| |||
|
|
|
|
| ||||||
Investment Income |
|
|
|
|
|
|
|
|
|
|
Dividends, (net of foreign taxes withheld of $94, $ - , and $ - , respectively) |
| $ | 27,379 |
| $ | 13,129 |
| $ | — |
|
Interest |
|
| 3,115 |
|
| 2,625 |
|
| 33,197 |
|
|
|
|
|
| ||||||
Total investment income |
|
| 30,494 |
|
| 15,754 |
|
| 33,197 |
|
|
|
|
|
| ||||||
|
|
|
|
|
|
|
|
|
|
|
Expenses |
|
|
|
|
|
|
|
|
|
|
Advisory and management fee (Note 2) |
|
| 18,611 |
|
| 20,449 |
|
| 3,160 |
|
Professional fees |
|
| 5,658 |
|
| 6,072 |
|
| 4,414 |
|
Custodian fee |
|
| 1,763 |
|
| 1,077 |
|
| 1,339 |
|
Postage and printing |
|
| 174 |
|
| 656 |
|
| 161 |
|
Registration |
|
| 800 |
|
| 970 |
|
| 300 |
|
Other |
|
| — |
|
| — |
|
| 47 |
|
|
|
|
|
| ||||||
Total expenses |
|
| 27,006 |
|
| 29,224 |
|
| 9,421 |
|
|
|
|
|
| ||||||
Net Investment Income (Loss) |
|
| 3,488 |
|
| (13,470 | ) |
| 23,776 |
|
|
|
|
|
| ||||||
|
|
|
|
|
|
|
|
|
|
|
Realized & Unrealized Gain (Loss) on Investments (Note 4) |
|
|
|
|
|
|
|
|
|
|
Net realized gain on investments |
|
| 141,001 |
|
| 156,009 |
|
| — |
|
Net change in unrealized appreciation/ (depreciation) on investments |
|
| 67,375 |
|
| (214,292 | ) |
| (33,985 | ) |
|
|
|
|
| ||||||
Net realized and unrealized gain (loss) on investments |
|
| 208,376 |
|
| (58,283 | ) |
| (33,985 | ) |
|
|
|
|
| ||||||
Net Increase (Decrease) in Net Assets Resulting from Operations |
| $ | 211,864 |
| $ | (71,753 | ) | $ | (10,209 | ) |
|
|
|
|
|
The accompanying notes are an integral part of these financial statements
20
MANOR INVESTMENT FUNDS, INC.
Statements of Changes in Net Assets - Unaudited
|
| Manor Fund |
| Growth Fund |
| ||||||||
|
|
|
| ||||||||||
|
| 6 Months |
| Year |
| 6 Months |
| Year |
| ||||
|
|
|
|
|
| ||||||||
Increase (decrease) in Net Assets from Operations |
|
|
|
|
|
|
|
|
|
|
|
|
|
Net investment income (loss) |
| $ | 3,488 |
| $ | 6,836 |
| $ | (13,470 | ) | $ | (19,388 | ) |
Net realized gain (loss) on investments |
|
| 141,001 |
|
| 185,137 |
|
| 156,009 |
|
| 187,563 |
|
Unrealized appreciation (depreciation) on investments |
|
| 67,375 |
|
| 123,643 |
|
| (214,292 | ) |
| 127,196 |
|
|
|
| �� |
|
| ||||||||
Net increase (decrease) in net assets resulting from operations |
|
| 211,864 |
|
| 315,616 |
|
| (71,753 | ) |
| 295,371 |
|
|
|
|
|
|
| ||||||||
Distributions to Shareholders |
|
| — |
|
| (7,724 | ) |
| — |
|
| — |
|
|
|
|
|
|
| ||||||||
|
|
|
|
|
|
|
|
|
|
|
|
|
|
Capital Share Transactions |
|
|
|
|
|
|
|
|
|
|
|
|
|
Proceeds from shares sold |
|
| 337,161 |
|
| 521,635 |
|
| 299,123 |
|
| 762,217 |
|
Reinvestment of distributions |
|
| — |
|
| 7,724 |
|
| — |
|
| — |
|
Payment for shares redeemed |
|
| (74,032 | ) |
| (369,515 | ) |
| (83,603 | ) |
| (255,712 | ) |
|
|
|
|
|
| ||||||||
Net increase (decrease) in net assets from capital share transactions |
|
| 263,129 |
|
| 159,844 |
|
| 215,520 |
|
| 506,505 |
|
|
|
|
|
|
| ||||||||
|
|
|
|
|
|
|
|
|
|
|
|
|
|
Total Increase |
|
| 474,993 |
|
| 467,736 |
|
| 143,767 |
|
| 801,876 |
|
|
|
|
|
|
|
|
|
|
|
|
|
|
|
Net Assets |
|
|
|
|
|
|
|
|
|
|
|
|
|
Beginning of Period |
|
| 3,310,561 |
|
| 2,842,825 |
|
| 3,724,876 |
|
| 2,923,000 |
|
|
|
|
|
|
| ||||||||
End of Period |
| $ | 3,785,554 |
| $ | 3,310,561 |
| $ | 3,868,643 |
| $ | 3,724,876 |
|
|
|
|
|
|
| ||||||||
Transactions in Shares of Fund |
|
|
|
|
|
|
|
|
|
|
|
|
|
Sold |
|
| 18,475 |
|
| 32,180 |
|
| 25,872 |
|
| 71,191 |
|
Issued in reinvestment of distributions |
|
| — |
|
| 441 |
|
| — |
|
| — |
|
Redeemed |
|
| (4,032 | ) |
| (22,642 | ) |
| (7,213 | ) |
| (23,925 | ) |
|
|
|
|
|
| ||||||||
Net increase (decrease) in outstanding shares of the Fund |
|
| 14,443 |
|
| 9,979 |
|
| 18,659 |
|
| 47,266 |
|
|
|
|
|
|
|
The accompanying notes are an integral part of these financial statements.
21
MANOR INVESTMENT FUNDS, INC.
Statements of Changes in Net Assets (con’t) - Unaudited
|
| Bond Fund |
| ||||
|
|
| |||||
|
| 6 Months |
| Year |
| ||
|
|
|
| ||||
Increase (decrease) in Net Assets from Operations |
|
|
|
|
|
|
|
Net investment income |
| $ | 23,776 |
| $ | 34,950 |
|
Net realized gain (loss) on investments |
|
| — |
|
| — |
|
Net change in unrealized appreciation/depreciation on investments |
|
| (33,985 | ) |
| (24,601 | ) |
|
|
|
| ||||
Net increase (decrease) in net assets resulting from operations |
|
| (10,209 | ) |
| 10,349 |
|
|
|
|
| ||||
Distributions to Shareholders |
|
| — |
|
| (35,881 | ) |
|
|
|
| ||||
|
|
|
|
|
|
|
|
Capital Share Transactions |
|
|
|
|
|
|
|
Proceeds from shares sold |
|
| 220,913 |
|
| 606,935 |
|
Reinvestment of distributions |
|
| — |
|
| 35,881 |
|
Payment for shares redeemed |
|
| (24,282 | ) |
| (390,706 | ) |
|
|
|
| ||||
Net increase (decrease) in net assets from capital share transactions |
|
| 196,631 |
|
| 252,110 |
|
|
|
|
| ||||
|
|
|
|
|
|
|
|
Total Increase |
|
| 186,422 |
|
| 226,578 |
|
|
|
|
|
|
|
|
|
Net Assets |
|
|
|
|
|
|
|
Beginning of Period |
|
| 1,754,837 |
|
| 1,528,259 |
|
|
|
|
| ||||
End of Period |
| $ | 1,941,259 |
| $ | 1,754,837 |
|
|
|
|
| ||||
|
|
|
|
|
|
|
|
Transactions in Shares of Fund |
|
|
|
|
|
|
|
Sold |
|
| 21,653 |
|
| 58,367 |
|
Issued in reinvestment of distributions |
|
| — |
|
| 3,511 |
|
Redeemed |
|
| (2,387 | ) |
| (37,633 | ) |
|
|
|
| ||||
Net increase (decrease) in outstanding shares of the Fund |
|
| 19,266 |
|
| 24,245 |
|
|
|
|
|
The accompanying notes are an integral part of these financial statements.
22
MANOR INVESTMENT FUNDS, INC.
Notes to Financial Statements - Unaudited
June 30, 2006
1. | ORGANIZATION AND SIGNIFICANT ACCOUNTING POLICIES |
Organization: Manor Investment Funds, Inc. (the “Company”) is a non-diversified regulated investment company and was incorporated in the Commonwealth of Pennsylvania on September 13, 1995. The primary investment objective of each of the Funds follows: Manor Fund - conservative capital appreciation and current income, investing primarily in common stocks of large corporations in the United States; Growth Fund - long-term capital appreciation, investing primarily in common stocks of U.S. corporations; Bond Fund - intermediate-term fixed income, investing primarily in U.S. Government obligations. The following is a summary of the Funds’ significant accounting policies.
Security Valuations: Equity securities generally are valued by using market quotations, but may be valued on the basis of prices furnished by a pricing service when the Advisor believes such prices accurately reflect the fair market value of such securities. Securities that are traded on any stock exchange or on the NASDAQ over-the-counter market are generally valued by the pricing service at the last quoted sale price. Lacking a last sale price, an equity security is generally valued by the pricing service at its last bid price. When market quotations are not readily available, when the Advisor determines that the market quotation or the price provided by the pricing service does not accurately reflect the current market value, or when restricted or illiquid securities are being valued, such securities are valued as determined in good faith by the Board of Directors. The Board has adopted guidelines for good faith pricing, and has delegated to the Advisor the responsibility for determining fair value prices, subject to review by the Board of Directors.
Fixed income securities generally are valued by using market quotations, but may be valued on the basis of prices furnished by a pricing service when the Advisor believes such prices accurately reflect the fair market value of such securities. A pricing service utilizes electronic data processing techniques based on yield spreads relating to securities with similar characteristics to determine prices for normal institutional-size trading units of debt securities without regard to sale or bid prices. If the Advisor decides that a price provided by the pricing service does not accurately reflect the fair market value of the securities, when prices are not readily available from a pricing service, or when restricted or illiquid securities are being valued, securities are valued at fair value as determined in good faith by the Advisor, subject to review by the Board of Directors. Short term investments in fixed income securities with maturities of less than 60 days when acquired, or which subsequently are within 60 days of maturity, are valued by using the amortized cost method of valuation, which the Board has determined will represent fair value.
Federal Income Taxes: The Fund’s policy is to comply with the requirements of the Internal Revenue Code that are applicable to regulated investment companies and to distribute all its taxable income to its shareholders. Therefore, no federal income tax provision is required.
Distributions to Shareholders: The Fund intends to distribute to its shareholders substantially all of its net realized capital gains and net investment income, if any, at year-end. Distributions will be recorded on ex-dividend date.
Other: The Fund follows industry practice and records security transactions on the trade date. The specific identification method is used for determining gains or losses for financial statements and income tax purposes. Dividend income is recorded on the ex-dividend date and interest income is recorded on an accrual basis. Discounts and premiums are amortized over the useful lives of the respective securities when determined to be material. Withholding taxes on foreign dividends will be provided for in accordance with the Fund’s understanding of the applicable country’s tax rules and rates.
Reclassifications: In accordance with SOP-93-2, the Funds record a reclassification in the capital accounts of a permanent book/tax difference from net investment loss to paid-in-capital. This reclassification has no impact on the net asset value of the Fund and is designed generally to present undistributed income and net realized gains on a tax basis, which is considered to be more informative to shareholders.
Use of Estimates: The preparation of financial statements in conformity with generally accepted accounting principles requires management to make estimates and assumptions that affect the reported amounts of assets and liabilities and disclosure of contingent assets and liabilities at the date of the financial statements and the reported amounts of increases and decreases in net assets from operations during the reporting period. Actual results could differ from these estimates
23
MANOR INVESTMENT FUNDS, INC.
Notes to Financial Statements (con’t) - Unaudited
June 30, 2006
2. | INVESTMENT ADVISORY AGREEMENT |
The Fund has an investment advisory agreement (the “agreement”) with Morris Capital Advisors, Inc. (the “Advisor”), with whom certain officers and directors of the Funds are affiliated, to furnish investment management services to the Funds. Under the terms of the agreement, the Funds will pay the Advisor a monthly fee based on the Funds’ average daily net assets at the annual rate of 1.00% for Manor Fund and Growth Fund and 0.5% for Bond Fund. For the six months ended June 30, 2006 the Advisor earned advisory fees from the Manor, Growth and Bond Funds of $18,611, $20,449 and $3,160 respectively.
Under the terms of the agreement if the aggregate expenses of the Funds are equal to or greater than 1.5% for Manor Fund and Growth Fund and 1.00% for Bond Fund of the Funds’ net assets the Advisor will reimburse the Funds for these expenses.
3. | INVESTMENT TRANSACTIONS |
Investment transactions, excluding short-term investments, for the six months ended June 30, 2006, were as follows:
|
| Manor Fund |
| Growth Fund |
| Bond Fund |
| ||
|
|
|
|
| |||||
Purchases |
| $ | 616,611 |
| $ | 583,974 |
| — |
|
Sales |
| $ | 386,913 |
| $ | 507,682 |
| — |
|
4. | FEDERAL INCOME TAXES |
Income and long-term capital gain distributions are determined in accordance with Federal income tax regulations, which may differ from accounting principals generally accepted in the United States. The following information is as of June 30, 2006:
|
| Manor Fund |
| Growth Fund |
| Bond Fund |
| |||
|
|
|
|
| ||||||
Federal tax cost of investments, including short-term investments |
| $ | 2,927,270 |
| $ | 3,483,582 |
| $ | 1,986,631 |
|
|
|
| ||||||||
Gross tax appreciation of investments |
| $ | 958,183 |
| $ | 668,865 |
| $ | — |
|
Gross tax depreciation of investments |
|
| (101,684 | ) |
| (281,458 | ) |
| (67,652 | ) |
|
|
|
|
| ||||||
Net tax appreciation(depreciation) |
| $ | 856,499 |
| $ | 387,407 |
| $ | (67,652 | ) |
|
|
|
|
| ||||||
Undistributed ordinary income |
| $ | 5,365 |
| $ | (13,470 | ) | $ | 23,776 |
|
Undistributed capital gain income |
| $ | 140,768 |
| $ | 34,551 |
| $ | — |
|
Accumulated capital losses |
| $ | — |
| $ | — |
| $ | (1,122 | ) |
The tax character of distributions paid during the years ended December 31, 2005 and 2004 were as follows:
|
| Manor Fund |
| Growth Fund |
| Bond Fund |
| ||||||||||||
|
|
|
|
| |||||||||||||||
|
| 2005 |
| 2004 |
| 2005 |
| 2004 |
| 2005 |
| 2004 |
| ||||||
|
|
|
|
|
|
|
| ||||||||||||
Ordinary Income |
| $ | 7,724 |
| $ | 4,523 |
| $ | — |
| $ | — |
| $ | 38,851 |
| $ | 28,867 |
|
Long-term Capital Gain |
| $ | — |
| $ | — |
| $ | — |
| $ | — |
| $ | — |
| $ | — |
|
24
MANOR INVESTMENT FUNDS, INC.
MANOR FUND
Financial Highlights - Unaudited
For a share of capital stock outstanding throughout the period
|
| 6 Mths |
| For the years ended December 31, |
| ||||||||||||||
|
|
|
| ||||||||||||||||
|
| 2006† |
| 2005 |
| 2004 |
| 2003 |
| 2002 |
| 2001 |
| ||||||
|
|
|
|
|
|
|
| ||||||||||||
PER SHARE DATA |
|
|
|
|
|
|
|
|
|
|
|
|
|
|
|
|
|
|
|
Net asset value, beginning of period |
| $ | 17.32 |
| $ | 15.69 |
| $ | 13.84 |
| $ | 10.52 |
| $ | 13.20 |
| $ | 15.76 |
|
|
|
|
|
|
|
|
| ||||||||||||
Income from investment operations: |
|
|
|
|
|
|
|
|
|
|
|
|
|
|
|
|
|
|
|
Net investment income (loss) * |
|
| 0.02 |
|
| 0.02 |
|
| 0.035 |
|
| — |
|
| (0.01 | ) |
| (0.02 | ) |
Net realized and unrealized gain (loss) on investments |
|
| 1.07 |
|
| 1.65 |
|
| 1.840 |
|
| 3.32 |
|
| (2.67 | ) |
| (2.54 | ) |
|
|
|
|
|
|
|
| ||||||||||||
Total from investment operations |
|
| 1.09 |
|
| 1.67 |
|
| 1.875 |
|
| 3.32 |
|
| (2.68 | ) |
| (2.56 | ) |
|
|
|
|
|
|
|
| ||||||||||||
Less Distributions |
|
| — |
|
| (.04 | ) |
| (0.025 | ) |
| — |
|
| — |
|
| — |
|
|
|
|
|
|
|
|
| ||||||||||||
Total distributions |
|
| — |
|
| (.04 | ) |
| (0.025 | ) |
| — |
|
| — |
|
| — |
|
|
|
|
|
|
|
|
| ||||||||||||
Net asset value, end of period |
| $ | 18.41 |
| $ | 17.32 |
| $ | 15.69 |
| $ | 13.84 |
| $ | 10.52 |
| $ | 13.20 |
|
|
|
|
|
|
|
|
| ||||||||||||
Total Return ** |
|
| 6.29 | % |
| 10.64 | % |
| 13.55 | % |
| 31.56 | % |
| -20.30 | % |
| -16.24 | % |
|
|
|
|
|
|
|
| ||||||||||||
Ratios and Supplemental Data: |
|
|
|
|
|
|
|
|
|
|
|
|
|
|
|
|
|
|
|
Net assets, |
| $ | 3,786 |
| $ | 3,311 |
| $ | 2,843 |
| $ | 2,615 |
| $ | 1,750 |
| $ | 2,087 |
|
Ratio of expenses to average net assets: |
|
|
|
|
|
|
|
|
|
|
|
|
|
|
|
|
|
|
|
Before reimbursements |
|
| 1.49 | % |
| 1.49 | % |
| 1.50 | % |
| 1.52 | % |
| 1.50 | % |
| 1.50 | % |
Net of reimbursements |
|
| 1.49 | % |
| 1.49 | % |
| 1.50 | % |
| 1.50 | % |
| 1.50 | % |
| 1.50 | % |
Ratio of net investment income to average net assets |
|
| 0.10 | % |
| 0.23 | % |
| 0.27 | % |
| 0.04 | % |
| -0.08 | % |
| -0.11 | % |
Portfolio Turnover Rate |
|
| 21.28 | % |
| 22.24 | % |
| 7.32 | % |
| 4.26 | % |
| 26.0 | % |
| 28.0 | % |
† | Unaudited |
* | Per share net investment income (loss) has been determined on the basis of average number of shares outstanding during the period. |
** | Total return assumes reinvestment of dividends |
The accompanying notes are an integral part of these financial statements.
25
MANOR INVESTMENT FUNDS, INC.
GROWTH FUND
Financial Highlights - Unaudited
For a share of capital stock outstanding throughout the period
|
| 6 Mths. |
| For the years ended December 31, |
| ||||||||||||||
|
|
|
| ||||||||||||||||
|
| 2006† |
| 2005 |
| 2004 |
| 2003 |
| 2002 |
| 2001 |
| ||||||
|
|
|
|
|
|
|
| ||||||||||||
PER SHARE DATA |
|
|
|
|
|
|
|
|
|
|
|
|
|
|
|
|
|
|
|
Net asset value, beginning of period |
| $ | 11.27 |
| $ | 10.32 |
| $ | 9.22 |
| $ | 7.08 |
| $ | 8.95 |
| $ | 9.54 |
|
|
|
|
|
|
|
|
| ||||||||||||
Income from investment operations: |
|
|
|
|
|
|
|
|
|
|
|
|
|
|
|
|
|
|
|
Net investment (loss) * |
|
| (0.04 | ) |
| (0.06 | ) |
| (0.02 | ) |
| (0.05 | ) |
| (0.06 | ) |
| (0.05 | ) |
Net realized and unrealized |
|
|
|
|
|
|
|
|
|
|
|
|
|
|
|
|
|
|
|
Gain (loss) on investments |
|
| (0.15 | ) |
| 1.01 |
|
| 1.12 |
|
| 2.19 |
|
| (1.81 | ) |
| (0.54 | ) |
|
|
|
|
|
|
|
| ||||||||||||
Total from investment operations |
|
| (0.19 | ) |
| 0.95 |
|
| 1.10 |
|
| 2.14 |
|
| (1.87 | ) |
| (0.59 | ) |
|
|
|
|
|
|
|
| ||||||||||||
Less Distributions |
|
| — |
|
| — |
|
| — |
|
| — |
|
| — |
|
| — |
|
Total distributions |
|
| — |
|
| — |
|
| — |
|
| — |
|
| — |
|
| — |
|
|
|
|
|
|
|
|
| ||||||||||||
Net asset value, end of period |
| $ | 11.08 |
| $ | 11.27 |
| $ | 10.32 |
| $ | 9.22 |
| $ | 7.08 |
| $ | 8.95 |
|
|
|
|
|
|
|
|
| ||||||||||||
Total Return ** |
|
| -1.69 | % |
| 9.21 | % |
| 11.93 | % |
| 30.23 | % |
| -20.89 | % |
| -6.18 | % |
|
|
|
|
|
|
|
| ||||||||||||
Ratios and Supplemental Data: |
|
|
|
|
|
|
|
|
|
|
|
|
|
|
|
|
|
|
|
Net assets, |
| $ | 3,869 |
| $ | 3,725 |
| $ | 2,923 |
| $ | 2,556 |
| $ | 1,638 |
| $ | 1,522 |
|
Ratio of expenses to average net assets: |
|
|
|
|
|
|
|
|
|
|
|
|
|
|
|
|
|
|
|
Before reimbursements |
|
| 1.49 | % |
| 1.50 | % |
| 1.50 | % |
| 1.52 | % |
| 1.50 | % |
| 1.50 | % |
Net of reimbursements |
|
| 1.49 | % |
| 1.50 | % |
| 1.50 | % |
| 1.50 | % |
| 1.50 | % |
| 1.50 | % |
Ratio of net investment |
|
| -0.34 | % |
| -0.62 | % |
| -0.16 | % |
| -0.66 | % |
| -0.70 | % |
| -0.53 | % |
Portfolio Turnover Rate |
|
| 25.89 | % |
| 16.14 | % |
| 30.42 | % |
| 6.53 | % |
| 13.2 | % |
| 33.6 | % |
† | Unaudited |
* | Per share net investment loss has been determined on the basis of average number of shares outstanding during the period. |
** | Total return assumes reinvestment of dividends |
The accompanying notes are an integral part of these financial statements.
26
MANOR INVESTMENT FUNDS, INC.
BOND FUND
Financial Highlights - Unaudited
For a share of capital stock outstanding throughout the period
|
| 6 Mths. |
| For the years ended December 31, |
| ||||||||||||||
|
|
|
| ||||||||||||||||
|
| 2006† |
| 2005 |
| 2004 |
| 2003 |
| 2002 |
| 2001 |
| ||||||
|
|
|
|
|
|
|
| ||||||||||||
PER SHARE DATA |
|
|
|
|
|
|
|
|
|
|
|
|
|
|
|
|
|
|
|
Net asset value, beginning of period |
| $ | 10.23 |
| $ | 10.37 |
| $ | 10.58 |
| $ | 10.98 |
| $ | 10.63 |
| $ | 10.39 |
|
|
|
|
|
|
|
|
| ||||||||||||
Income from investment operations: |
|
|
|
|
|
|
|
|
|
|
|
|
|
|
|
|
|
|
|
Net investment income * |
|
| 0.13 |
|
| 0.20 |
|
| 0.17 |
|
| 0.26 |
|
| 0.32 |
|
| 0.43 |
|
Net realized and unrealized |
|
|
|
|
|
|
|
|
|
|
|
|
|
|
|
|
|
|
|
gain (loss) on investments |
|
| (0.19 | ) |
| (0.13 | ) |
| (0.18 | ) |
| (0.17 | ) |
| 0.39 |
|
| 0.23 |
|
|
|
|
|
|
|
|
| ||||||||||||
Total from investment operations |
|
| (0.06 | ) |
| 0.07 |
|
| (0.01 | ) |
| 0.09 |
|
| 0.71 |
|
| 0.66 |
|
|
|
|
|
|
|
|
| ||||||||||||
Less Distributions |
|
| — |
|
| (0.21 | ) |
| (0.20 | ) |
| (0.49 | ) |
| (0.36 | ) |
| (0.42 | ) |
|
|
|
|
|
|
|
| ||||||||||||
Total distributions |
|
| — |
|
| (0.21 | ) |
| (0.20 | ) |
| (0.49 | ) |
| (0.36 | ) |
| (0.42 | ) |
|
|
|
|
|
|
|
| ||||||||||||
Net asset value, end of period |
| $ | 10.17 |
| $ | 10.23 |
| $ | 10.37 |
| $ | 10.58 |
| $ | 10.98 |
| $ | 10.63 |
|
|
|
|
|
|
|
|
| ||||||||||||
Total Return ** |
|
| -0.59 | % |
| 0.66 | % |
| -0.09 | % |
| 0.82 | % |
| 6.69 | % |
| 6.35 | % |
|
|
|
|
|
|
|
| ||||||||||||
Ratios and Supplemental Data: |
|
|
|
|
|
|
|
|
|
|
|
|
|
|
|
|
|
|
|
Net assets, |
| $ | 1,941 |
| $ | 1,755 |
| $ | 1,528 |
| $ | 1,769 |
| $ | 1,962 |
| $ | 1,476 |
|
Ratio of expenses to average net |
|
|
|
|
|
|
|
|
|
|
|
|
|
|
|
|
|
|
|
Before reimbursements |
|
| 0.99 | % |
| 1.00 | % |
| 1.05 | % |
| 1.04 | % |
| 1.00 | % |
| 1.00 | % |
Net of reimbursements |
|
| 0.99 | % |
| 1.00 | % |
| 1.00 | % |
| 1.00 | % |
| 1.00 | % |
| 1.00 | % |
|
|
|
|
|
|
|
|
|
|
|
|
|
|
|
|
|
|
|
|
Ratio of net investment |
|
| 1.25 | % |
| 2.04 | % |
| 1.37 | % |
| 2.30 | % |
| 2.96 | % |
| 4.01 | % |
Portfolio Turnover Rate |
|
| 0.0 | % |
| 37.01 | % |
| 75.57 | % |
| 50.61 | % |
| 26.3 | % |
| 0.0 | % |
† | Unaudited |
* | Per share net investment income has been determined on the basis of average number of shares outstanding during the period. |
** | Total return assumes reinvestment of dividends |
The accompanying notes are an integral part of these financial statements.
27
MANOR INVESTMENT FUNDS, INC.
ADDITIONAL INFORMATION
Proxy Voting Procedures and Accord
The Company’s Board of Directors has approved proxy voting procedures setting forth guidelines and procedures for the voting of proxies relating to securities held by the Fund. Records of the Fund’s proxy voting records are maintained and are available for inspection without charge by calling 1-800-787-3334 and on the SEC’s website at http://www.sec.gov. The Board is responsible for overseeing the implementation of the procedures. The proxy voting record of the Fund can be reviewed on the web site of the Fund at www.ManorFunds.com. The Proxy voting history is located under Fund Information, Proxy Voting.
Quarterly Portfolio Schedule
The Company now files a complete schedule of investments with the SEC for the first and third quarters of each fiscal year on Form N-Q. These forms are available on the SEC’S website at http://www.sec.gov. They may be reviewed and copied at the SEC’s Public Reference Room in Washington, D.C. Information on the operation of the Public Reference Room may be obtained by calling 1-800-723-0330.
Compensation of Board of Directors
The members of the Board of Directors serve without compensation. Daniel A. Morris, President of Manor Investment Funds, Inc. (“the Funds”), and President of Morris Capital Advisors, Inc., adviser to the Funds, and an Interested Director of the Funds, receives no compensation directly from the Funds. He is compensated through the management fee paid to the adviser to the Funds.
Investment Advisor Review
At its regularly scheduled in-person meeting on April 26, 2006, the Board of Directors unanimously approved the continuance of the investment advisory contract with MCA. Prior to approving the contract, the Board discussed the services performed by MCA (as described herein), performance of the funds, fees and profits accruing to MCA, and economies of scale from which the funds could benefit as the funds grow. In conducting its review, the Board reviewed the fees and services incurred by other mutual funds.
Morris Capital Advisors, Inc. (MCA) provides ongoing investment management for the portfolio of each Fund. In the execution of these duties MCA performs securities research, trading, and accounting for Fund portfolios. MCA also reconciles each portfolio with the Fund custodian to prevent errors in purchase and sale transactions, dividends, interest, and shareholder transactions.
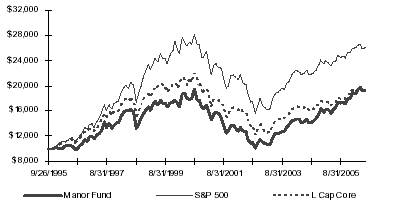
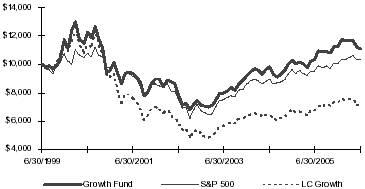
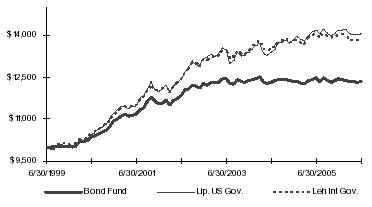
The investment performance of each Fund is compared to a broad market index and comparable mutual funds. As of December 31, 2005 the Manor Fund outperformed its benchmarks for the trailing quarter, 1-year, 3-year, and 5-year periods. The Growth Fund also outperformed its benchmarks for the trailing quarter, 1-year, 3-year, and 5-year periods ending December 31, 2005. The Bond Fund underperformed its benchmarks because the Fund is invested 100% in U.S. Treasury securities, with short maturities. This portfolio structure is designed to protect principal in periods of rising interest rates, and underperformed during the recent period of declining yields.
In addition to investment management functions, MCA provides ongoing shareholder accounting, acts as transfer agent for shares of the Fund, prepares and distributes all shareholder reports, prepares and submits all filings required by SEC rules and regulations, negotiates agreements with outside service providers, and processes all shareholder questions and requests. MCA provides these services, over and above the typical responsibilities of investment management, without compensation from the Fund. The cost of providing these services substantially reduce the net profit attributable to MCA from the sole execution of its duties under its investment advisory agreement with the Fund.
As the Funds grow economies of scale will reduce the cost of services to the Fund, for the benefit of all Fund shareholders. It is expected that these economies of scale will benefit shareholders when Fund assets exceed $25 million.
28
Board of Directors Information
Manor Investment Funds, Inc.
June 30, 2006
The business and affairs of the Fund are managed under the direction of the Funds’ Board of Directors. Information pertaining to the Directors of the Fund are set forth below. The Statement of Additional Information includes addition information about the Funds’ Directors, and is available without charge, by calling 1-800-787-3334. Each director may be contacted by writing to the director c/o Manor Investment Funds, Inc., 15 Chester Commons, Malvern, PA 19355.
Independent Directors
JAMES MCFADDEN
James McFadden is a Director of the Fund, and Chairman of the Audit Committee. He serves a one-year term, and stands for re-election annually. He has been a Director since 9/25/1995.
Mr. McFadden is Vice President of Marketing for MBNA Corporation. He is not a Director for any other public companies.
JOHN MCGINN
John McGinn is a Director of the Fund, and serves on the Audit Committee. He serves a one-year term, and stands for re-election annually. He has been a Director since 11/5/2002.
Mr. McGinn is head of Credit Review for Vertex, Inc. He is not a Director for any other public companies.
FRED MYERS
Fred Myers is a Director of the Fund. He serves a one-year term, and stands for re-election annually. He has been a Director since 9/25/1995.
Mr. Myers is founding Partner of the accounting firm of Myers & Associates, CPA’s. He is not a Director for any other public companies.
EDWARD SZKUDLAPSKI
Edward Szkudlapski is a Director of the Fund. He serves a one-year term, and stands for re-election annually. He has been a Director since 5/15/2000.
Mr. Szkudlapski is President of Eclipse Business Systems. He is not a Director for any other public companies.
DONALD THOMPSON
Donald Thompson is a Director of the Fund. He serves a one-year term, and stands for re-election annually. He has been a Director since 4/20/1999.
Mr. Thompson is a Network Administrator and Healthcare Consultant. He is not a Director for any other public companies.
ALAN WEINTRAUB
Alan Weintraub is a Director of the Fund. He serves a one-year term, and stands for re-election annually. He has been a Director since 9/25/1995.
Mr. Weintraub is a Chief Technical Officer with Qumas, Cork, Ireland. He is not a Director for any other public companies.
Interested Directors
DANIEL A. MORRIS
Daniel A. Morris is a Director of the Fund, and President of Morris Capital Advisors, Inc., advisor to the Fund. He serves a one-year term, and stands for re-election annually. He has been a Director since 9/25/1995.
Prior to founding Morris Capital Advisors, Inc., he was Senior Vice President of Consistent Asset Management Company, an investment adviser for separate accounts and registered investment companies. As President of the Fund, he is considered an Interested Director. He is not a Director for any other public companies.
BRUCE LAVERTY
Bruce Laverty is a Director of the Fund, and serves as legal counsel to the Fund. He serves a one-year term, and stands for re-election annually. He has been a Director since 9/25/1995.
Mr. Laverty is a Partner of the law firm Valocchi, Fischer & Laverty legal counsel to the Fund. He is not a Director for any other public companies.
29
Fund Office:
15 Chester County Commons
Malvern, PA 19355
610-722-0900 800-787-3334
www.manorfunds.com
ITEM 2. | CODE OF ETHICS. |
Not applicable for semi-annual reports.
ITEM 3. | AUDIT COMMITTEE FINANCIAL EXPERT. |
Not applicable for semi-annual reports.
ITEM 4. | PRINCIPAL ACCOUNTANT FEES AND SERVICES. |
Not applicable for semi-annual reports.
ITEM 5. | AUDIT COMMITTEE OF LISTED REGISTRANTAS. |
Not applicable for semi-annual reports.
ITEM 6. | [RESERVED.] |
ITEM 7. | DISCLOSURE OF PROXY VOTING POLICIES AND PROCEDURES FOR CLOSED-END MANAGEMENT INVESTMENT COMPANIES. |
Not applicable.
ITEM 8. | [RESERVED.] |
ITEM 9. | CONTROLS AND PROCEDURES. |
ITEM 10. | EXHIBITS. |
| (a) (1) | Code of Ethics - For annual reports. |
| (a) (2) | Certifications persuant to Section 302 of the Sarbanes-Oxley Act of 2002 are attached hereto. |
| (b) | Certification pursuant to Section 906 of the Sarbanes-Oxley Act of 2002 are attached hereto. |
SIGNATURES
Pursuant to the requirements of the Securities Exchange Act of 1934 and the Investment Company Act of 1940, the registrant has duly caused this report to be signed on its behalf by the undersigned, thereunto duly authorized.
Manor Investment Funds, Inc. | |
By |
|
| |
| President |
Date | 6/30/2006 |
31