Marketing Our
Products and Services
As Never Before
2004 Analyst Conference
November 11-12, 2004

Georgia Natural Gas
Mike Braswell
President, Georgia Natural Gas

Marketing Initiatives
Overall Branding Goal
Strengthen and differentiate GNG brand versus
competition, in a manner that builds awareness
and leverages brand advantages
Advertising Initiatives
Radio, billboard & magazine ads deploying Gas
Guy to enhance communication of market
leadership and superior customer satisfaction
messages
High Value Customer Prospecting
Ongoing direct mail to acquire “high value”
prospects
Targeted Channel Marketing
Programs targeted to agents/movers to influence
selection of GNG at natural decision points
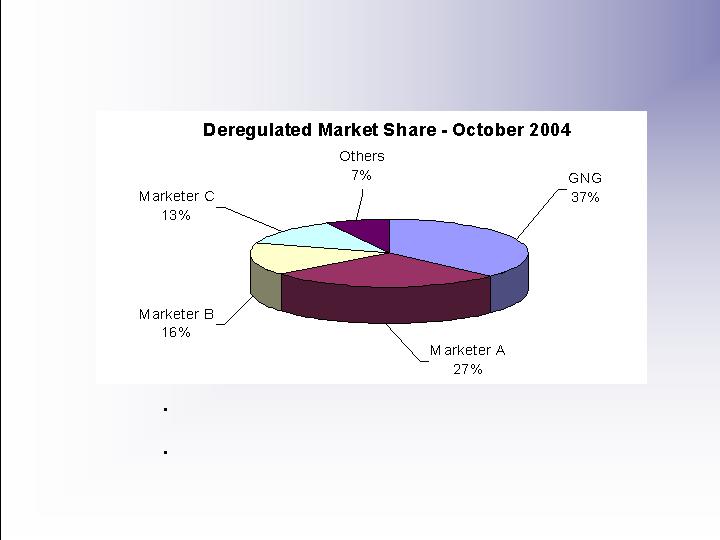
Largest Retail Marketer
in Georgia
SouthStar markets natural gas in Georgia under
the trade name Georgia Natural Gas (GNG)
SouthStar has a 10% lead over second-largest
marketer (based on deregulated customer count)
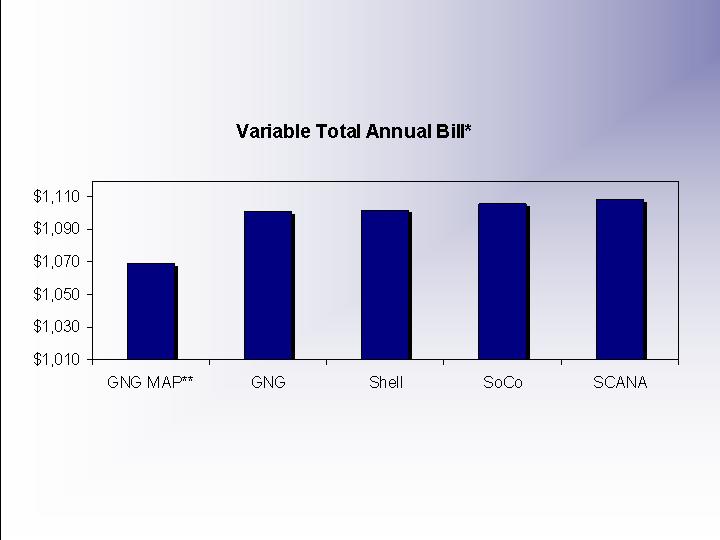
Variable Price Comparison of Top
Four Marketers
* Comparison of GNG’s variable price plans to other marketers’ standard published
prices in effect for past 12 months (November 2003 to October 2004). Assumes
typical AGLC customer using 880 therms per year with a 1.29 DDDC.
** GNG’s Market Advantage Plan (MAP) provides a guaranteed discount of at least 5
cents per therm.
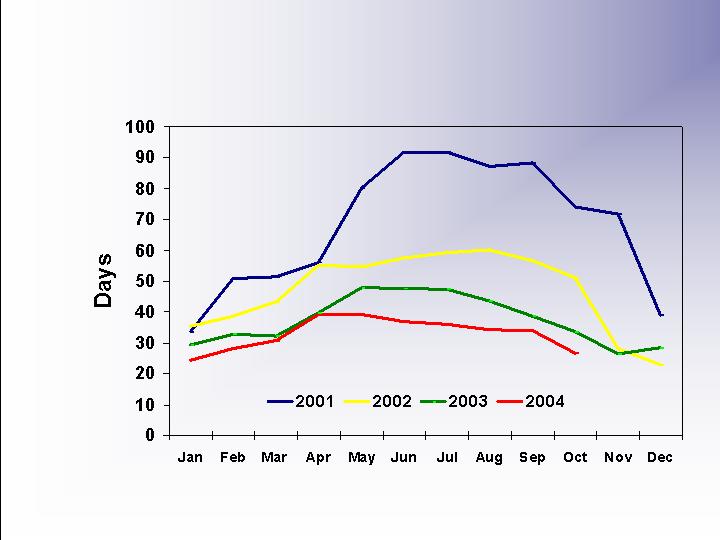
DSO (Days Sales
Outstanding) Tracking
30-Day DSO
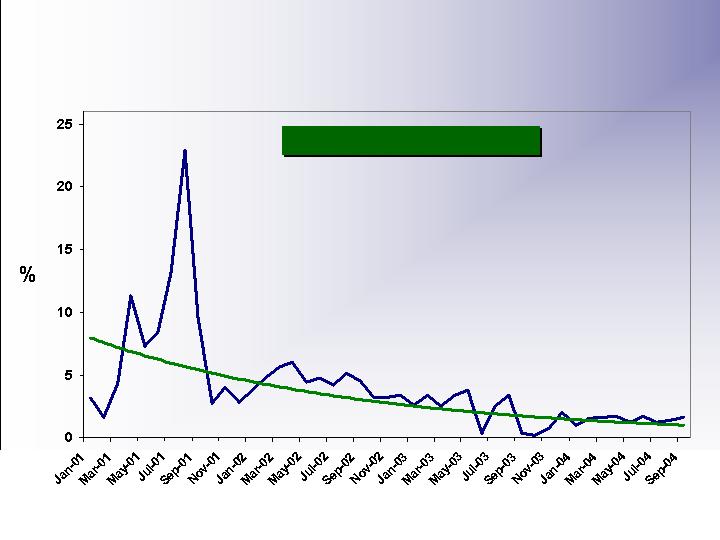
Significantly Reduced Bad Debt
Bad Debt as % of Revenue

Risk Management Philosophy
Identify and control the risk that is inherent in the retail gas marketing
business. SouthStar accomplishes this by:
identifying and isolating each exposure independently;
evaluating the entire portfolio to determine whether natural hedges exist;
and
utilizing financial derivatives to hedge residual exposures where natural
hedges do not exist
Key exposures that are inherent in the retail gas marketing business
include:
Commodity price risk (Fixed Price, Inventory, etc.)
Basis risk (Pipeline)
Throughput risk (Weather)
Credit risk (Retail Customers and Commercial Counterparties)

Sequent Energy
Management
Douglas N. Schantz
President, Sequent Energy Management

Sequent responds and caters to customers needs on an intra-day, day
ahead, monthly, and seasonal basis.
Typical progression of business activity typically follows this path:
Complex or
Structured
Low level of
complexity
Daily
Monthly
Seasonal
Peaking
Load Following
Full
Outsource
Wholesale Marketing
Key Structured Transactions
Under Contract
Final Development

Key Structured Transactions Duration
2004
2005
2006
2007
2008
2009
2010
2011
2012
Affiliate
Non-Affiliate
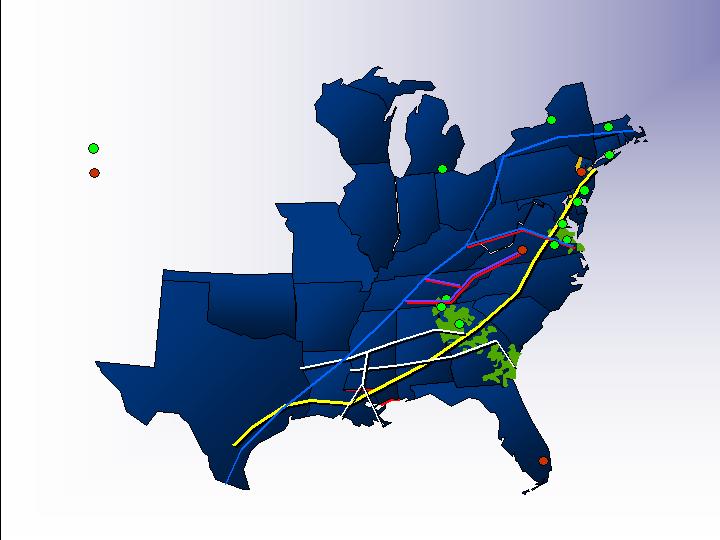
Northeast
LDC
Northeast
Power Gen
Northeast
Municipal AM
Southeast
Power Gen 1
Mid-Atlantic
LDC 2 AM
Mid-Atlantic
LDC 1 AM
Southeast
Power Gen 2
NUI City Gas of Fla.
NUI Elkton
TBD
VNG
AGLC
CGC
NUI
Elizabethtown
Mid-Atlantic LDC
Peaking
Northeast
Industrial
Mid-Atlantic
Retail
Aggregator
Florida
Power Gen
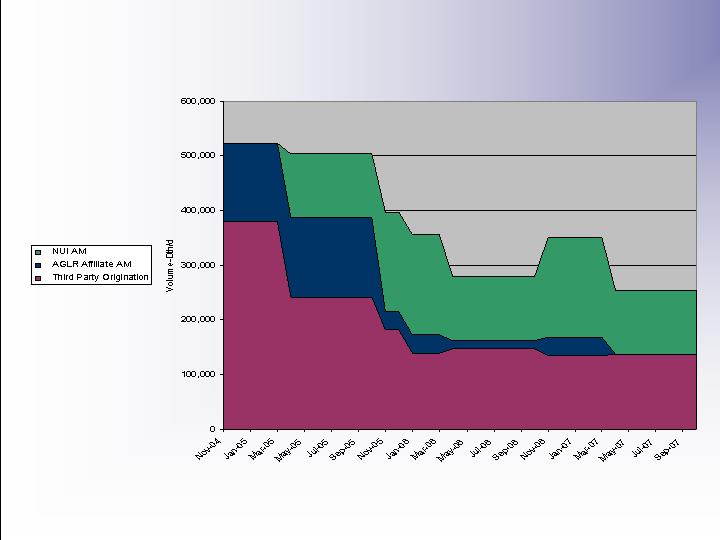
Key Structured Transaction Volumes

Sample Origination Deal
Southeast Power Generator
Term: 4 years
Transaction: Full requirements delivered fuel supply
Customer: 1200+MW combined style power generator
Benefits
Increased use of CGC and AGLC firm transportation at decent
margin levels
Potential use of Saltville and other Sequent high cycle storage
Sequent shares in the value created through using affiliates firm
transportation
Large savings to power generator by not holding firm upstream
transportation and storage


Georgia, Tennessee and
Virginia
Hank Linginfelter
President, Virginia Natural Gas
Donna Peeples
Managing Director, Sales and Marketing
Our Customer
Growth Is Not
Spectacular
New Customers
Customers Lost
Net Growth
Atlanta Gas Light
Chattanooga Gas
Virginia Natural Gas
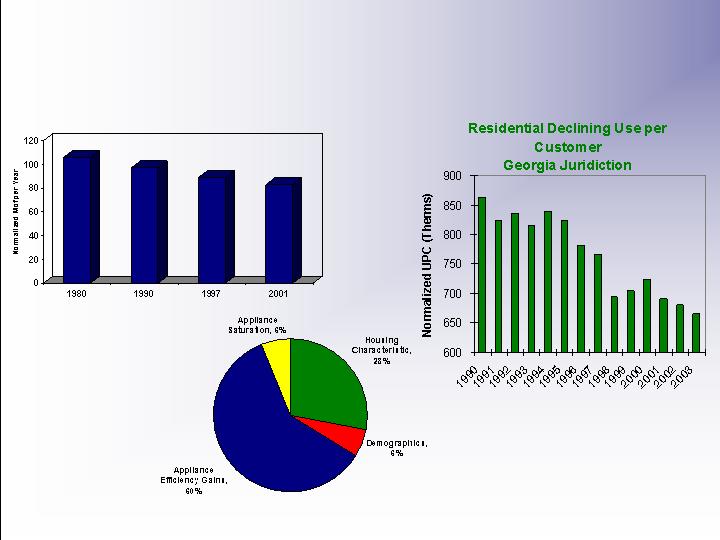
Declining Use Per Customer Is
Nothing New
Declining Use per Customer
Factors Contributing to
Declining U.S. Natural Gas
Use per Residential Customer
1997-2001
Source: AGA and internal data
Heat Pumps Remain A Problem
20
Percentage Growth of Heat Pump Sales
19.8%
9.9%
10.8%
27.9%

Growth Initiatives Fall Into Two
Major Categories
Increased billing unit growth
Increasing new additions
Reducing defections
Appliance programs
Consumer programs
Rate related programs
Marketing programs
Builder programs
Line extension policy
Legislative initiatives
Continue to explore regulatory mechanisms
to dampen impact of lost billing units

Enterprise-Wide Marketing
Initiatives
Targeted advertising
Dedicated Sales Representatives
“Gas Loyal” Dealer Network
Custom Designed Incentive Programs
Extensive Builder Relationships
Strategic Partnerships
22
We don’t sell gas – appliances do!

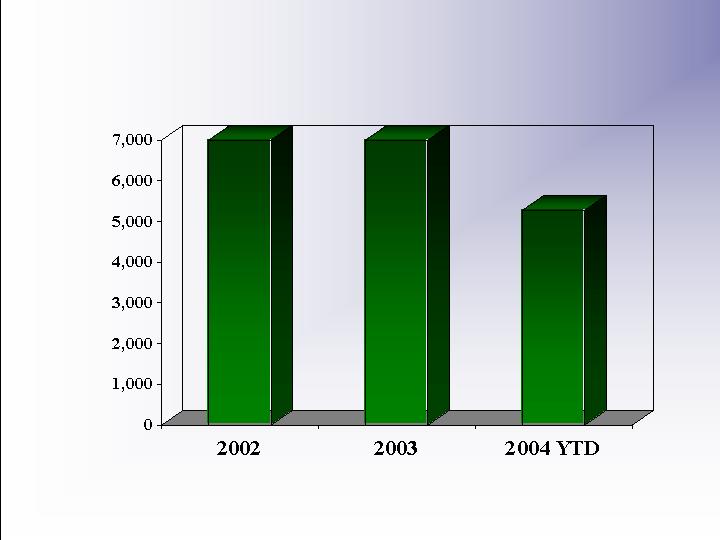
Atlanta Gas Light
Installed Meters
9 months ending September 30
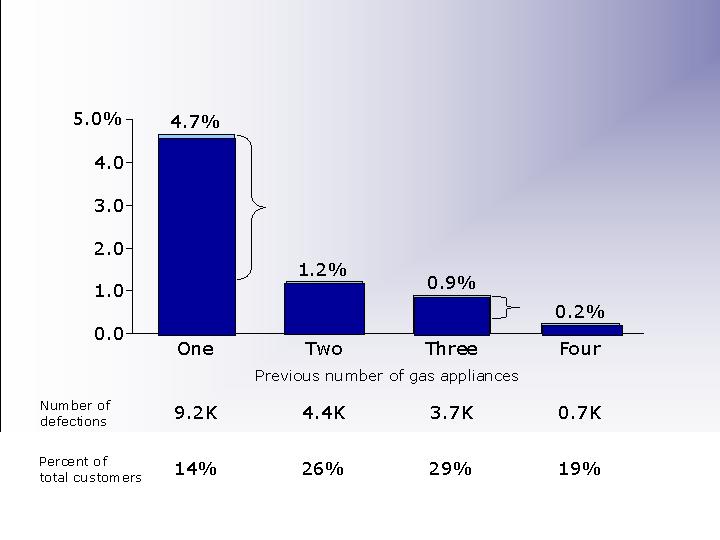
Defection Rates Decrease
Dramatically With Increased Gas Appliances
Note: There were 19,065 permanent defectors of 1.43M total residential customers in 2003
Source: AGL residential customer interviews, permanent defectors
4.8K
decrease
3.0K
decrease
Defection rate as percent of
total customer base with
same number of appliances
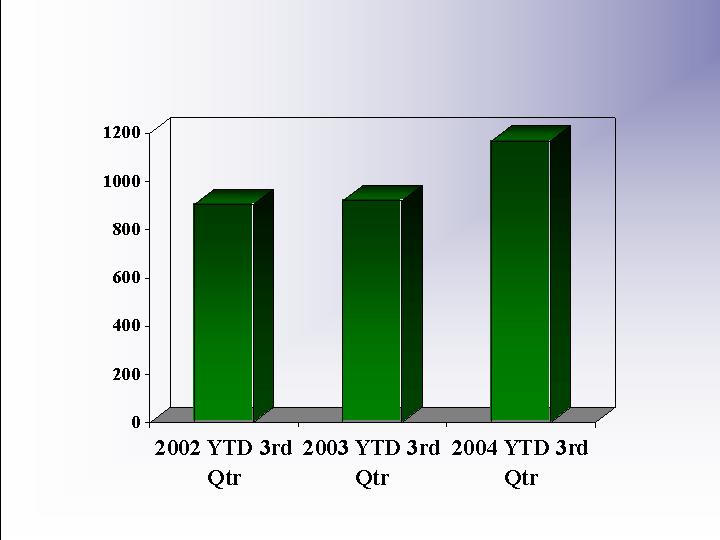
Chattanooga Gas Company
Installed Meters

Chattanooga Successes
Strategic pipeline expansion
Aggressive credit and collections program
Reengagement in community through
leadership in economic development
Virginia Natural Gas
New Customer Additions
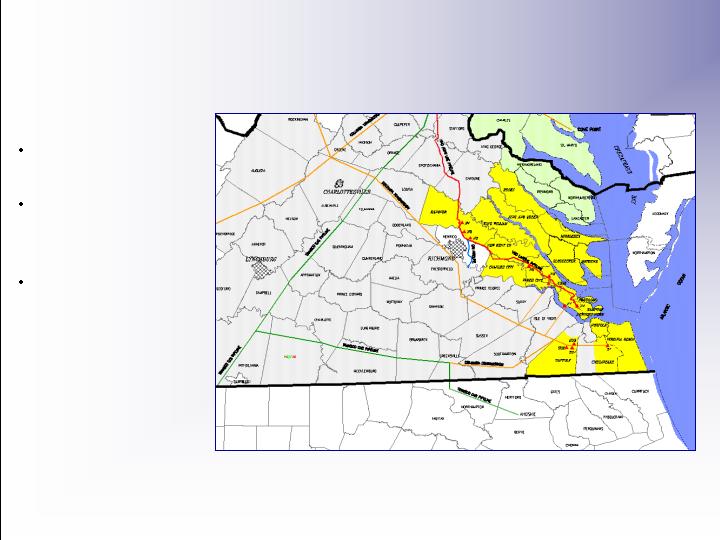
Franchise Territory Is Important
Net Population
Growth 2000-2003
Counties Adjacent
to VNG Franchise:
+56,000
VNG Franchise:
+46,500