Financial Overview
and 2005 Outlook
Richard T. O’Brien
Executive Vice President and Chief Financial Officer

Forward-Looking Statements
Statements in this presentation that are not historical facts, including statements
regarding our estimates, beliefs, expectations, intentions, strategies or
projections, may be “forward-looking statements” as defined in the Private
Securities Litigation Reform Act of 1995. All forward-looking statements involve a
number of risks and uncertainties that could cause actual results to differ
materially from the estimates, beliefs, expectations, intentions, strategies and
projections reflected in or suggested by the forward-looking statements.
Information concerning risks and uncertainties that could cause differences
between actual results and forward-looking statements is contained in our filings
with the Securities and Exchange Commission, including our Form 10-Q for the
quarter ended September 30, 2004, filed with the commission on October 27,
2004 and its Form 8-K filed with the commission on October 27, 2004. Caution
should be taken for you not to place undue reliance on our forward-looking
statements, which represent our views only as of the date of this presentation,
and which we have no current intention to update.

GAAP Reconciliation
During this presentation references to our financial measures will include
references to core earnings per share data. We provide a complete
reconciliation between GAAP basic and diluted earnings per share to core
earnings per share data in our 2003 Annual Report to Shareholders
available at www.aglresources.com under "Investor Relations - SEC
Filings."
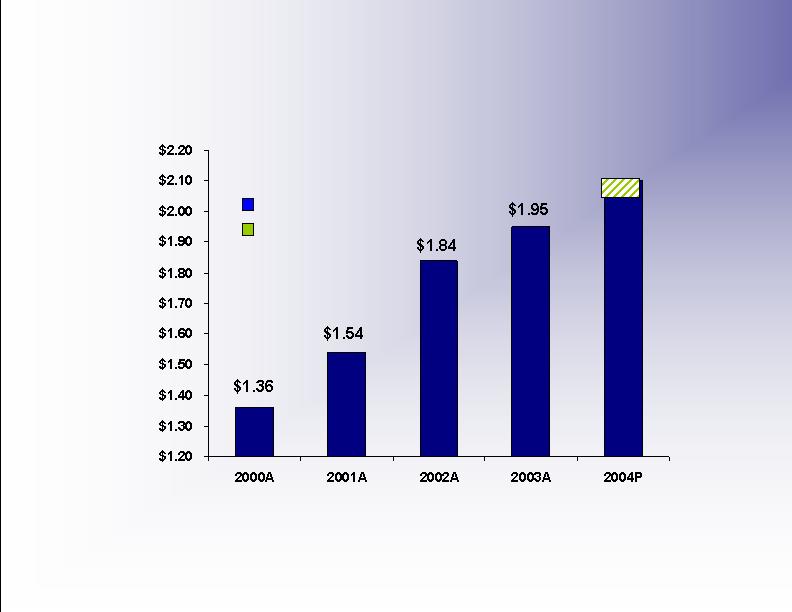
AGL Resources Core EPS*
2000-2004
EPS Actual
EPS Projected
$2.10
$2.17
*Basic earnings per share excluding an 8-cent gain on the sale of the Caroline Street campus, net of the donation
of the proceeds to a charitable organization in 2003; a 13-cent gain on the sale of Utilipro in 2001; and a 4-cent
gain on certain items in 2000. Our basic earnings per share was $2.03 in 2003, $1.67 in 2001 and $1.40 in 2000.
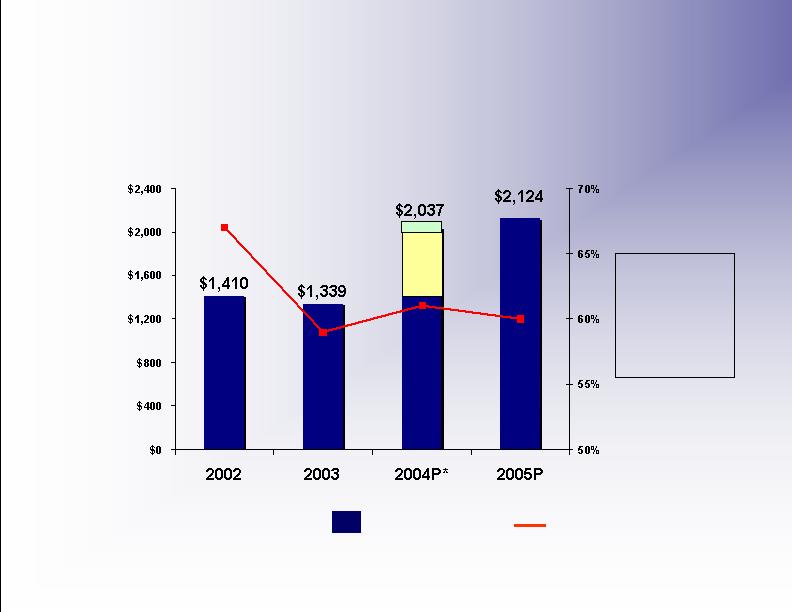
We Have Significantly Improved
The Balance Sheet in 2003 & 2004
Debt/Cap
Ratio (%)
Total Debt
($ Millions)
Debt/Cap Ratio
Total Debt
(including trust
preferred securities)
RATINGS
S&P: BBB+
Moody’s: Baa1
Fitch: A-
*Assumes $275mm equity offering
$622
NUI
$54 JISH
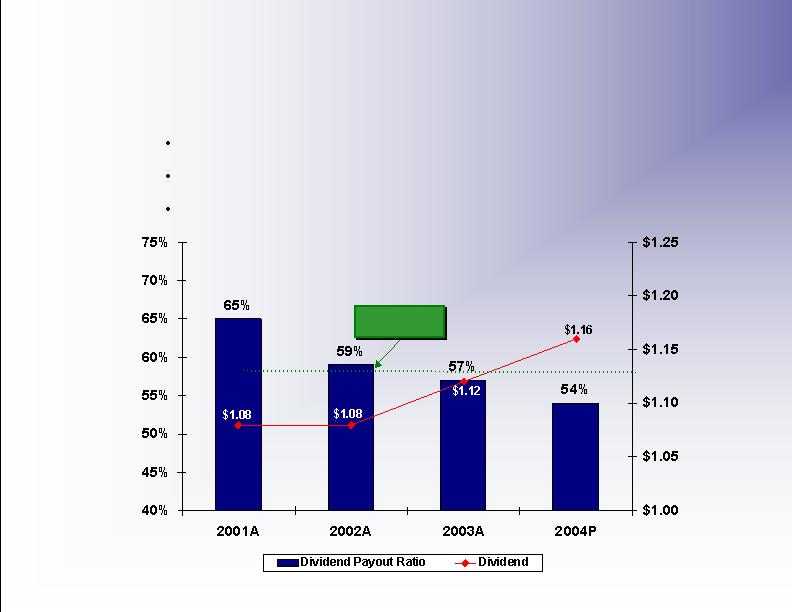
Dividend increased 3.5% to $1.16 annually in April 2004
Low dividend payout ratio relative to industry peers
Current dividend yield of 3.7%
Dividend Payout Continues to
Improve
Dividend Payout Ratio
LDC average
payout ratio

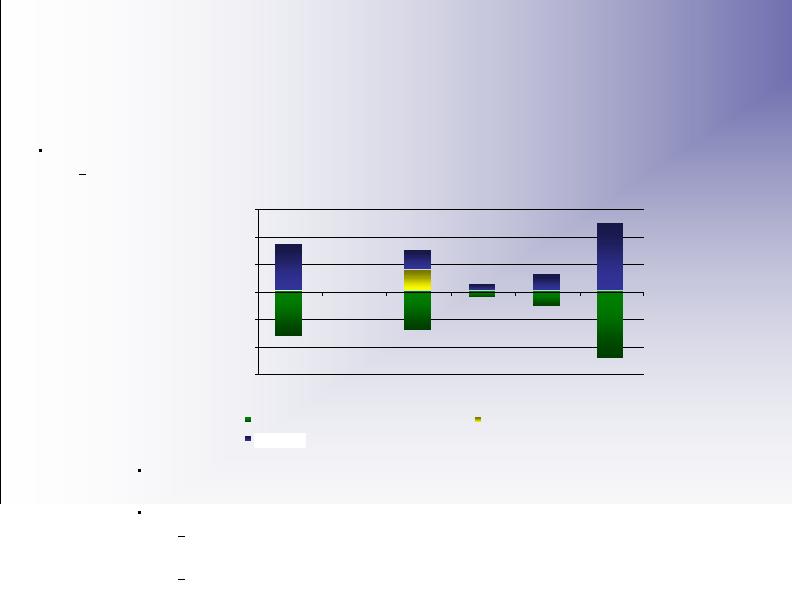
Reduced Cost of Debt
and Improved Interest Coverage
Our overall cost of debt and interest coverage ratios have
improved as a result of our debt and equity offerings
Average Debt ($MM) - $1,401$1,412 $1,255$1,290 $1,965
Significant Improvement
in Liquidity
(as of December 31)
Available Liquidity*
Liquidity = unused available Credit Facility and Cash and Cash Equivalents
*Restricted by 70% debt to cap ratio
Bank facility increased to $750mm with 5 year term in September 2004
Additional $700mm bridge facility in place for NUI financing if needed
Executed in October 2004 $250mm 30-year senior note offering at 6.00%
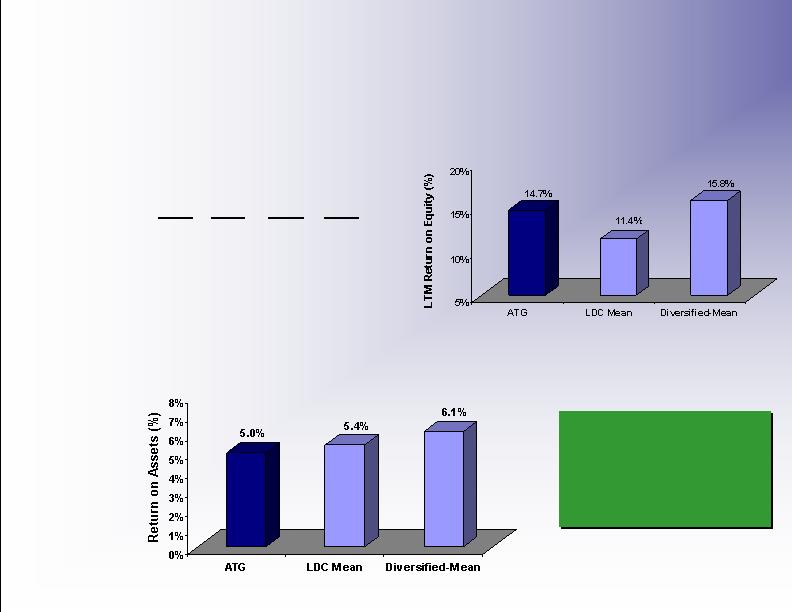
Returns Have Improved, But
We Still Have Work To Do
Must continue to
focus on capital
deployment and
maximizing return on
our asset base
Return on Equity (LTM)
Return on Assets (LTM)
ROIC - AGL Resources
2002A
2003A
2004E
2005E
Average Debt
1,453
$
1,376
$
1,350
$
1,965
$
Total Capital
2,153
$
2,204
$
2,333
$
3,346
$
ROIC
7.3%
7.9%
8.0%
7.3%
9
Return on Invested Capital
(ROIC)
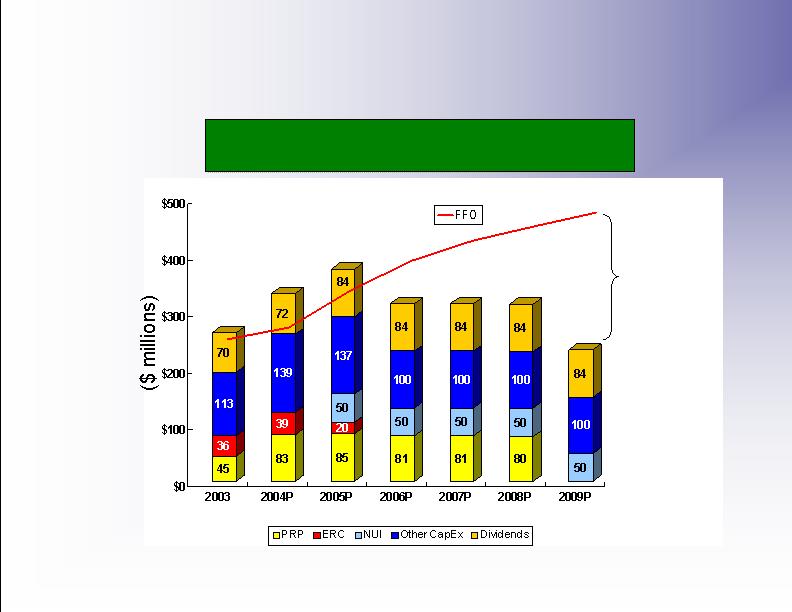
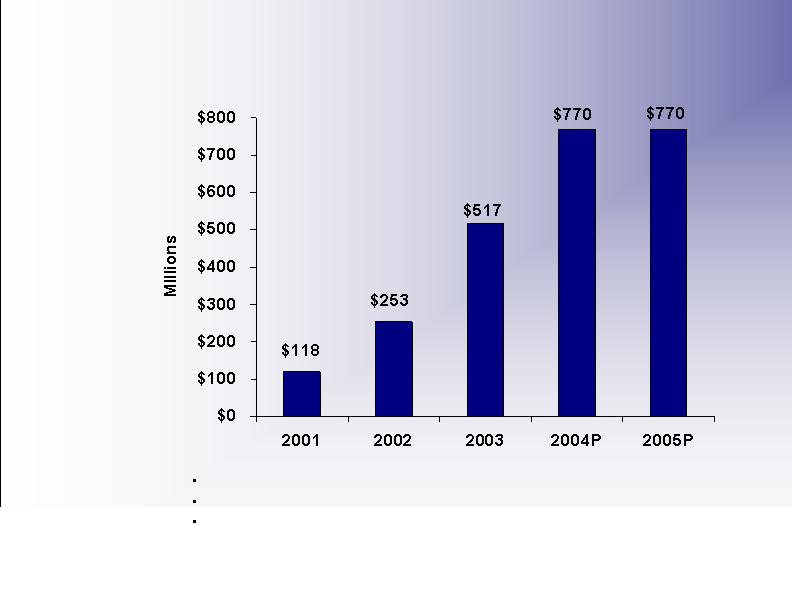
Cash Flow Projections
A Strong Long-term Outlook Due to the
Completion of PRP and ERC Rider Programs
Cash Outflows
‘05-’09 FFO
CAGR = 8%
Excess cash
available for debt
pay-down, dividend
increases or stock
repurchase
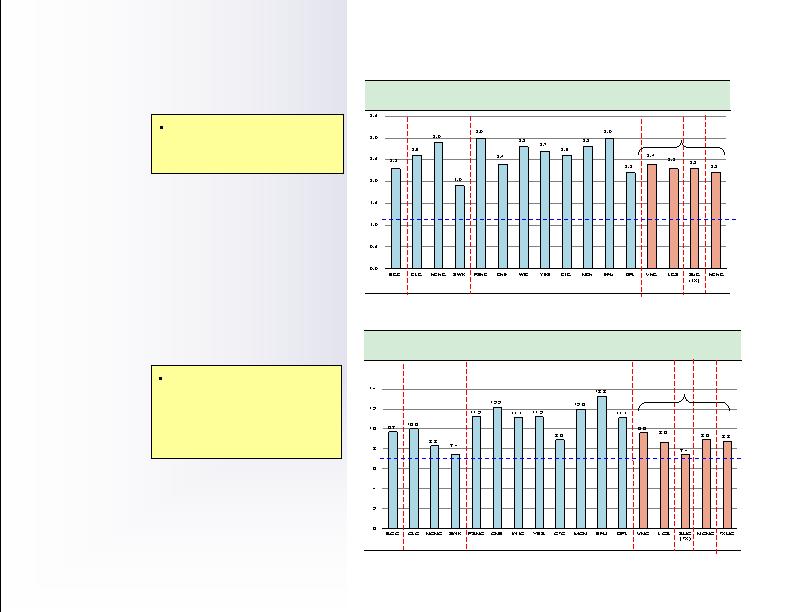
NUI - A Compelling Valuation
Equity Value / Book Value (1)
x
1997
1998
1999
2000
2002
2003
Recent
Transactions
Note
1.
BGC = Bay State Gas/NIPSCO; CLG = Colonial Gas/Eastern Enterprises; NCG = North Carolina Natural Gas/Carolina Power and Light; SWK = Southwest Gas/Oneok; PSNC = Public Service Company of North
Carolina/SCANA; CNE = Connecticut Energy/Energy East; WIC = Wicor/Wisconsin Energy; YES = Yankee Energy/Northeast Utilities; MCN = MCN Energy/DTE Energy; EFU = Eastern Enterprises/KeySpan; DPL = DPL/Indiana
Energy; VNG = VNG/AGL Resources; LGS = LGS/Atmos Energy; SUG = SUG Texas/Oneok; NCNG = NCNG (subsidiary of Progress)/Piedmont
Note
1.
BGC = Bay State Gas/NIPSCO; CLG = Colonial Gas/Eastern Enterprises; NCG = North Carolina Natural Gas/Carolina Power and Light; SWK = Southwest Gas/Oneok; PSNC = Public Service Company of North Carolina/SCANA; CNE =
Connecticut Energy/Energy East; WIC = Wicor/Wisconsin Energy; YES = Yankee Energy/Northeast Utilities; MCN = MCN Energy/DTE Energy; EFU = Eastern Enterprises/KeySpan; DPL = DPL/Indiana Energy; VNG = VNG/AGL
Resources; LGS = LGS/Atmos Energy; SUG = SUG Texas/Oneok; NCNG = NCNG/Piedmont; TXUG = TXU Gas/Atmos Energy (Atmos’ estimate of EBITDA)
Aggregate Value/EBITDA (1)
x
1997
1998
1999
00
02
03
Recent Transactions
04
No other recent LDC
purchase has been done
at or near book value
At 7x* EBITDA, we paid
the lowest Aggregate
value/ EBITDA multiple
of 17 LDC transactions
from 1997 to current
* net of assumed cash
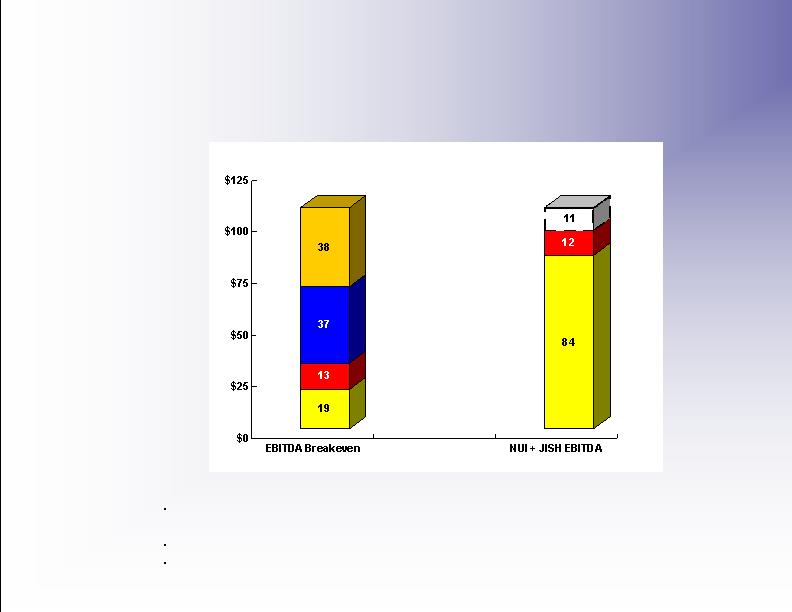
2005 Breakeven EBITDA
From Acquisitions
*EBITDA Breakeven Assumes:
$951MM combined enterprise value; includes regulatory settlement cost but no
transaction expenses
$275MM of equity issued at current market
Target of $2.20 ’05 EPS (low side of ’05 guidance)
Depreciation
Interest
Taxes
Net Income
$107*
($MM)
NUI 03
Normalized
JISH
$107
Synergies Needed
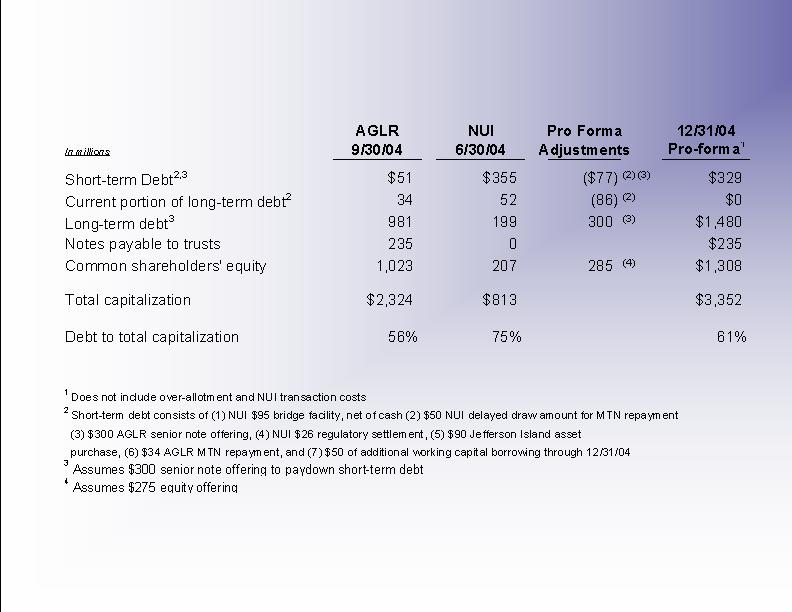
Pro-forma Capitalization

Regulatory Filings
AGLC
Filing has been made with proposed rate increase of $24.6 MM or
approximately 5% of base rates or 1.5% of total bill
Capacity supply plan has been approved for 3 years
Pipeline replacement rider amount is being decided
Chattanooga
Reconsideration sought in Rate Case on ROR
VNG
Weather normalization extended for 2 years with minor modifications
Pivotal Air Propane plant ($27 million) should earn authorized ROE in
2005 and beyond
ETG
NJBPU approval received on November 9th
3 year rate freeze with PBR similar to GA in years 4 and 5 with Rate
Case in year 5
Sequent will be asset manager for 3 years at $4MM per year
City Gas
Base rate increase of $6.7 MM effective from 2/23/04
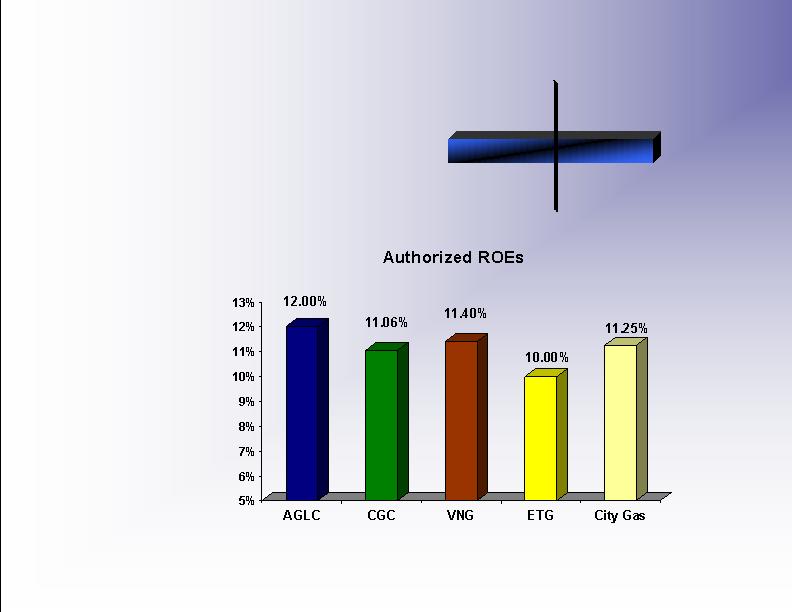
Future Regulatory Filings
1% Change in
Authorized ROE
-$10MM
+10MM

404 Compliance
Management will continue assessment process through December 31, 2004 by
completing documentation and performing testing of internal controls over
financial reporting
Currently no pervasive control deficiencies or deficiencies which can not be
remediated by December 31, 2004
NUI and Jefferson Island are exempted from SOX 404 Compliance in 2004
Sequent implemented a new Energy Trading and Risk Management System
(ETRM) in October 2004
Design and implementation began in November 2003 before finalization of SOX 404
requirements
Management believes that ETRM has enhanced internal controls
Timing of ETRM implementation may not enable management to gather sufficient
evidence to conclude our internal controls over financial reporting were designed and
operating effectively
Independent auditors (PricewaterhouseCoopers) could also have a scope limitation
with respect to Sequent due to potential lack of sufficient evidence
Projected Debt Profile
Projected As of December 31, 2004
Projected As of December 31, 2005
A 100 bps change in short-term interest
rates at 12/31/04 impacts interest
expense by $5 million annually
$543
$1,501
$1,501
$629
With NUI Financing and $275 Equity Offering
Includes $175 of interest rate swaps
December 31,
In millions
2004P
2005P
Short-term Debt
$329
$415
Medium Term Notes
208
208
Senior Notes
1,073
1,073
Revenue Bonds
199
199
Notes Payable to Trusts
235
235
Total Debt
$2,044
$2,130
Total Debt to Total Capitalization
61%
60%
Impact of Price Fluctuations on
Sequent Positions at September 30,
2004
Sequent fully hedges storage inventory with futures thereby locking in margin:
$2MM Q4 2004 and $5MM Q1 2005 at Sep. 30
Fair Value (mark-to-market) accounting for hedges versus accrual accounting for
inventory may result in volatility in reported earnings
Inventory and Related Hedge Sensitivity
Hedges: at Sep. 30, a $0.10 price move results in $650,000 pre-tax and
pre-sharing impact to earnings
Physical Inventory: Sep. 30 = 6.5Bcf
Inventory Withdrawal Schedule and NYMEX Hedges
-169
-149
-61
-249
169
74
61
249
-25
75
25
-300
-200
-100
0
100
200
300
Oct-04
Nov-04
Dec-04
Jan-05
Feb-05
Mar-05
NYMEX Open Positions
Salt Dome - Physical Withdrawals
Resovoir - Physical Withdrawals
18
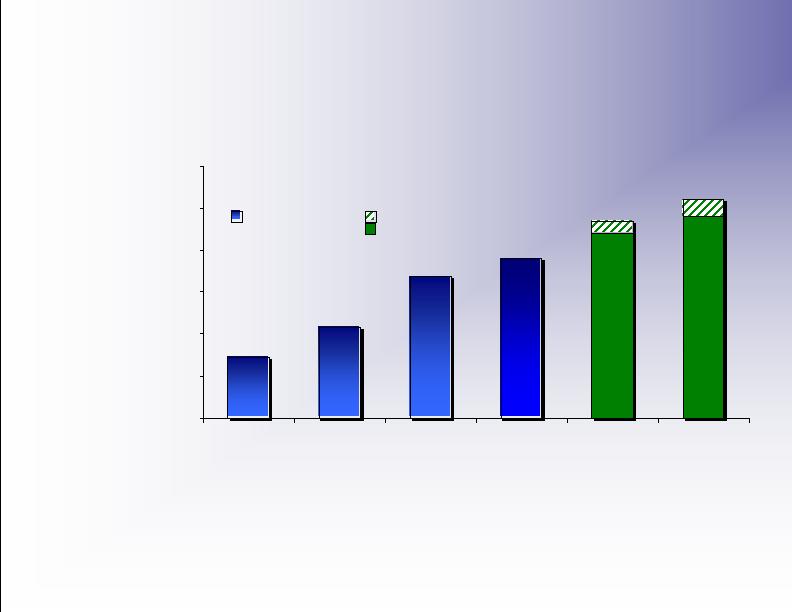
$1.95
$1.84
$1.54
$1.36
$1.00
$1.25
$1.50
$1.75
$2.00
$2.25
$2.50
2000A
2001A
2002A
2003A
2004P
2005P
EPS Actual
Projected
$2.10 - $2.17
$2.20 - $2.30
AGL Resources Core EPS*
2000-2005
*Basic earnings per share excluding an 8-cent gain on the sale of the Caroline Street campus, net of the donation
of the proceeds to a charitable organization in 2003; a 13-cent gain on the sale of Utilipro in 2001; and a 4-cent
gain on certain items in 2000. Our basic earnings per share was $2.03 in 2003, $1.67 in 2001 and $1.40 in 2000.